behaviour of masonry walls retrofitted with ferrocement …
TRANSCRIPT

BEHAVIOUR OF MASONRY WALLS RETROFITTED WITH
FERROCEMENT UNDER LATERAL CYCLIC LOADING
by
Tanmoy Das
MASTER OF SCIENCE IN CIVIL & STRUCTURAL ENGINEERING
Department of Civil Engineering
BANGLADESH UNIVERSITY OF ENGINEERING AND TECHNOLOGY
November, 2017

ii
BEHAVIOUR OF MASONRY WALLS RETROFITTED WITH
FERROCEMENT UNDER LATERAL CYCLIC LOADING
by
Tanmoy Das
Submitted to the Department of Civil Engineering,
Bangladesh University of Engineering and Technology (BUET), Dhaka
in partial fulfilment of the requirements for the degree
of
MASTER OF SCIENCE IN CIVIL & STRUCTURAL ENGINEERING
Department of Civil Engineering
BANGLADESH UNIVERSITY OF ENGINEERING AND TECHNOLOGY
November, 2017

iii

iv
DEDICATION
This thesis is dedicated to my parents

v
DECLARATION
It is hereby declared that, except where specific references are made, the work
embodied in this thesis is the result of investigation carried out by the author under
the supervision of Dr. Raquib Ahsan, Professor, Department of Civil Engineering,
BUET.
Neither the thesis nor a part of it is concurrently submitted elsewhere for the award of
any degree or diploma.
(Tanmoy Das)

vi
ACKNOWLEDGEMENTS
First and foremost, I would like to thank God with the blessings of Whom all the good
deeds are fulfilled.
I would like to take this opportunity to express my sincere gratitude to my thesis
supervisor Professor Dr. Raquib Ahsan, Department of Civil Engineering, Bangladesh
University of Engineering and Technology (BUET) for his logical guidance, quick
response and continuous moral as well as financial support throughout the course of
study. His valuable suggestions and enthusiastic supervision were of immense help
throughout my research work. Working under him was an extremely knowledgeable
experience for me.
I wish to express my gratitude and heartiest thanks to respected defence committee
members Professor and Head Dr. Ahsanul Kabir, Professor Dr. Md. Shafiul Bari, Dr.
Major Md. Soebur Rahman for their valuable advices and help in reviewing this thesis.
I would like to express my deep appreciation to Md. Rafiqul Islam for his
unconditional help, inspiration and great co-operation with data collection and
processing. It would not be possible to complete the thesis without his assistance.
Finally, thanks are extended to all laboratory members for their advice and technical
support throughout the experimental program.
I am very much thankful to my parents and younger brother for their continuous
support and encouragement throughout my life.
Last but not the least; I thank my colleagues and friends for their understanding,
patience and inspiration.

vii
ABSTRACT
This study presents the results of in-plane cyclic loading tests conducted on
unreinforced masonry walls retrofitted using ferrocement lamination. Ten half scale
wall assemblies were built, consisting of a clay masonry panel and a Reinforced
Concrete base slab. Wall assemblies had two groups, namely, five walls with aspect
ratio 0.57 belonging to Long Wall category and the rest with aspect ratio 1 belonging
to Short Wall category. Two types of parameters were considered: ferrocement
configuration and opening sizes of steel wire mesh inside ferrocement. Both the long
walls and short walls were investigated for two different retrofitting configurations,
namely full ferrocement coverage with extra base slab-wall panel joint lamination and
only wall panel lamination. Two different wire mesh steel having opening sizes 3.2 X
3.6 mm and 8.5 X 8.5 mm were considered for each type of ferrocement encasement.
One wall from each group was kept unretrofitted only to be used as a control model.
Behaviour of the strengthened walls under a combination of a vertical load and lateral
reversed cyclic loading was compared to the control models to observe improvement
of lateral load resistance capacity.
Key experimental results showed that mere encasement of Short Wall panels by
ferrocement gained no additional resistance compared to the control. On the other
hand, complete ferrocement coverage having steel wire mesh with opening size 3.2 X
3.6 mm on Short Wall panel doubled the failure load. Unlike short walls, mere
ferrocement lamination having similar wire mesh arrangement on long wall panels
showed about 33% increase in lateral load capacity. Strengthening long wall panels
by full coverage with wire mesh opening size 8.5 X 8.5 mm and 3.2 X 3.6 mm showed
about 78% and 89% increase in lateral load capacity respectively, compared to the
control. The strengthening also improved the total energy dissipation by a factor
ranging from 35.5% to 81% for the long walls. The energy dissipation is almost 1.3
and 3.9 times higher than that of control for short walls having mere wall panel
lamination and complete wall-base slab lamination, respectively.
Regarding the failure mode, all the short walls even after strengthening showed panel

viii
rocking mode at the wall-base slab interface. In contrast, the long walls, although
revealing some arbitrary first cracks at the connecting interface, ultimately exhibited
flexural compression i.e. corner crushing mode. Additionally, ferrocement retrofitted
walls having wire mesh with 3.2 X 3.6 mm opening size had about 6% and 29%
increase in lateral load capacity and displacement than the one having wire mesh with
8.5 X 8.5 mm opening size. This may be because wire mesh with smaller openings
possesses better crack arresting mechanism than that of larger openings. Finally, a
comparison with code provisions indicated that experimental lateral load capacity of
unretrofitted masonry walls were almost 4 to 5.5 times higher than allowable lateral
load of BNBC 1993.
ix
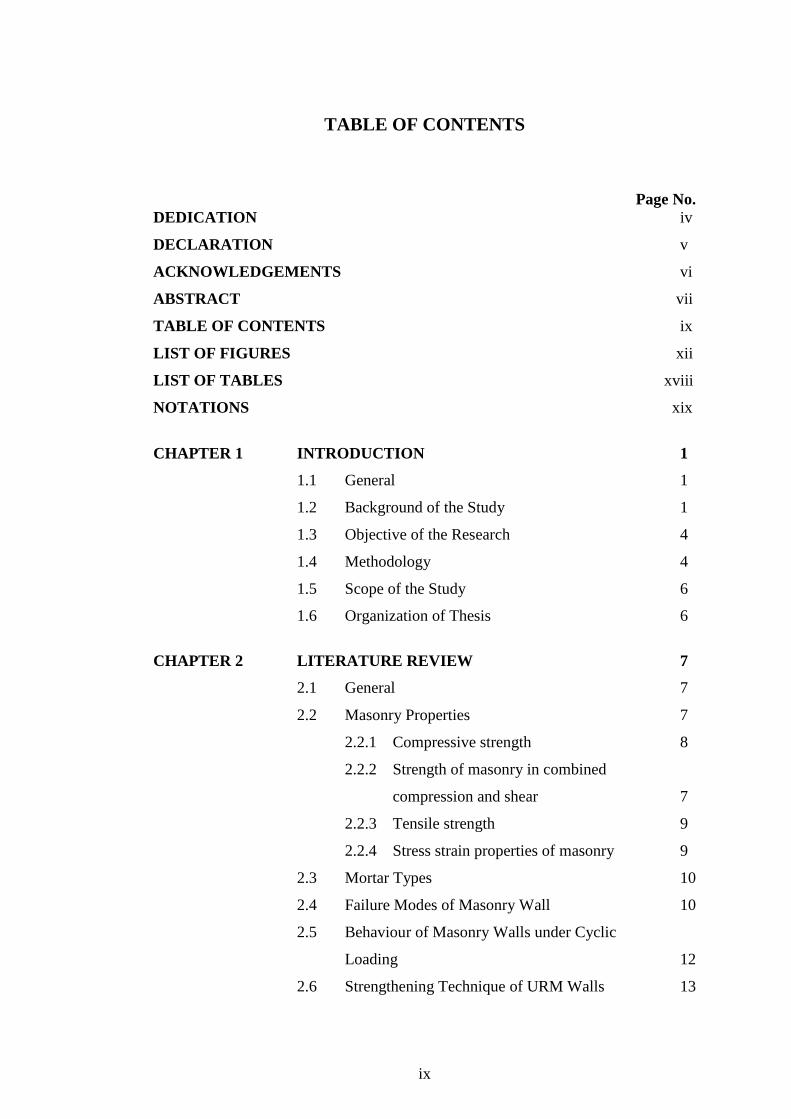
TABLE OF CONTENTS
Page No.
DEDICATION iv
DECLARATION v
ACKNOWLEDGEMENTS vi
ABSTRACT vii
TABLE OF CONTENTS ix
LIST OF FIGURES xii
LIST OF TABLES xviii
NOTATIONS xix
CHAPTER 1 INTRODUCTION 1
1.1 General 1
1.2 Background of the Study 1
1.3 Objective of the Research 4
1.4 Methodology 4
1.5 Scope of the Study 6
1.6 Organization of Thesis 6
CHAPTER 2 LITERATURE REVIEW 7
2.1 General 7
2.2 Masonry Properties 7
2.2.1 Compressive strength 8
2.2.2 Strength of masonry in combined
compression and shear 7
2.2.3 Tensile strength 9
2.2.4 Stress strain properties of masonry 9
2.3 Mortar Types 10
2.4 Failure Modes of Masonry Wall 10
2.5 Behaviour of Masonry Walls under Cyclic
Loading 12
2.6 Strengthening Technique of URM Walls 13

x
2.7 Allowable Compression and Shear Stress in
Masonry According to BNBC 15
2.8 Ferrocement Strengthening 16
2.9 Ferrocement Properties 17
2.10 Construction Materials 17
2.10.1 Reinforcing mesh 17
2.10.2 Cement 18
2.10.3 Aggregate 18
2.10.4 Water 19
2.11 Ferrocement Mix Proportions 19
2.12 Volume Fraction of Wire Mesh 19
2.13 Damping Ratio and Energy Dissipation 20
2.14 Literature Review of Earlier Research on
URM Walls Retrofitted with Ferrocement 23
2.15 Summary of Literature Review 26
CHAPTER 3 MATERIAL PROPERTIES AND EXPERIMENTAL
PROGRAM 27
3.1 Introduction 27
3.2 Specimen Properties 27
3.2.1 Selection of geometric properties of
masonry wall 27
3.2.2 Material properties 31
3.3 Formation of Specimens 37
3.3.1 Base slab construction 38
3.3.2 Brick masonry construction 40
3.3.3 Retrofitting work 41
3.4 Experimental Set up, Boundary Condition and
Loading Scheme 43
CHAPTER 4 TESTING PROCEDURE, RESULTS AND
DISCUSSION 47
4.1 Introduction 47

xi
4.2 Testing Procedure and Instrumentation 47
4.3 Failure Modes of URMs 47
4.4 Test Result of Specimen SW-C-2 (Control) 48
4.5 Test Result of Specimen SW-F-1/8 49
4.6 Test Result of Specimen SW-F-1/3 50
4.7 Test Result of Specimen SW-BWF-1/3 51
4.8 Test Result of Specimen SW-BWF-1/8 51
4.9 Test Result of Specimen LW-C-1 52
4.10 Test Result of Specimen LW-F-1/3 53
4.11 Test Result of Specimen LW-F-1/8 54
4.12 Test Result of Specimen LW-BWF-1/3 54
4.13 Test Result of Specimen LW-BWF-1/8 56
4.14 Load Deformation Response 57
4.15 Energy Dissipation 70
4.16 Hysteresis Percentage Damping 72
4.17 Stiffness Degradation 72
4.18 Comparison of Experimental and Theoretical
Load Capacity 76
4.19 Comparison of Lateral Load Capacity with Volume
Percentage of Steel 76
CHAPTER 5 CONCLUSIONS AND SUGGESTIONS 78
5.1 Introduction 78
5.2 Conclusions 78
5.3 Suggestions 80
REFERENCES 81
APPENDIX A 85

xiii
LIST OF FIGURES
Page
No.
Figure 2.1 Typical Relationship between Shear Strength of Brickwork
and Vertical Precompression from Test Results……………
8
Figure 2.2 Typical Stress-Strain Curve for Brick Masonry……………. 10
Figure 2.3
Figure 2.4
Figure 2.5
Figure 2.6
In-Plane Failure Mechanisms of Laterally Loaded URM
Wall, (a) Shear Failure, (b) Sliding Failure, (c) Rocking
Failure and (d) Flexural Compression Failure………..……..
Shear Crack Pattern for Tested Wall ………………………..
Shear Crack Pattern for Tested Wall...………..……………..
Ferrocement Retrofitting on Masonry Elements…………….
11
13
13
14
Figure 2.7 Typical Cross Section of Ferrocement………………………. 16
Figure 2.8 Types of Wire Mesh………………………………………… 18
Figure 2.9 Equivalent Viscous Damping Ratio (ξeq), and Effective
Stiffness (Keff) for Symmetric Hysteresis Loops…………….
21
Figure 2.10 Equivalent Viscous Damping Ratio (ξeq), and Effective
Stiffness (Keff) for Asymmetric Hysteresis Loops…………..
22
Figure 3.1 Typical Details of the Tested Short Wall……………………. 27
Figure 3.2 Typical Details of the Tested Long Wall…………………… 28
Figure 3.3 Grain Size Distribution of Local Sand Used as Ferrocement
Mortar with Respect to Upper and Lower Limit as per BNBC
1993 Guideline…………………….....……………………...
30
Figure 3.4 Grain Size Distribution Curve for Fine Aggregates………… 31
Figure 3.5 Grain Size Distribution Curve for Coarse Aggregates……… 31
Figure 3.6 Coarse Aggregates……….……………………………...….. 33
Figure 3.7 Fine Aggregate……………………………………..……….. 33
Figure 3.8 Concrete Mixing …………..………..……………….……... 33
Figure 3.9
Figure 3.10
Figure 3.11
Slump Test………………..…….……………….…………..
Initial State of Specimen in Prism Test……………………....
Cracked Specimen in Prism Test……………………………
33
36
36

xiv
Figure 3.12 Formwork……………………..………...……....................... 38
Figure 3.13 Reinforcement Arrangement………………….……..……… 38
Figure 3.14 Concrete Pouring into Formwork……………..…………….. 38
Figure 3.15 Mechanical Vibrator…….……………………….…………. 38
Figure 3.16 Base Slab after Casting……….…………………………….. 39
Figure 3.17 Base Slab Curing…………..……………………….……….. 39
Figure 3.18 Masonry Wall Construction….………………….………….. 39
Figure 3.19 Masonry Wall (Unretrofitted)…….……………….………... 39
Figure 3.20 Plastering and Surface Levelling……...…………………….. 40
Figure 3.21 Curing of Finished Wall…………………………………….. 40
Figure 3.22 Drilling Machine…………..……………….……………….. 40
Figure 3.23 Predrilled Brick…………………………………..………..... 40
Figure 3.24 Rawl Plugs……………….…………………………..……... 41
Figure 3.25 Arrangement of Rawl Plugs…………………………….…... 41
Figure 3.26 Application of Ferrocement Mortar……………….………… 42
Figure 3.27 Plastering and Surface Levelling…………….……………… 42
Figure 3.28 Curing of Finished Wall………………………………..…… 42
Figure 3.29 Painted Wall…………….………………………….……….. 42
Figure 3.30 Arrangement of Rawl Plug……………….…………………. 43
Figure 3.31 Wire Mesh Confinement………….………………………… 43
Figure 3.32 Base Retrofitted Wall………………………….……………. 43
Figure 3.33 Schematic Diagram of Short Wall…………….…………….. 44
Figure 3.34 Schematic Diagram of Long Wall…………………………... 45
Figure 4.1 Dial Gauge 1……………………………………….………... 47
Figure 4.2 Dial Gauge 2………………………………………….……... 47
Figure 4.3 Initial State of Short Wall Assemblies………………………. 48
Figure 4.4 Initial State of Long Wall Assemblies………..……………... 48
Figure 4.5 Crack Pattern for SW-C-2 with Enlarged Rocking at
Connection…………………………………………………..
49
Figure 4.6 Crack Pattern for SW-F-1/8 with Enlarged Rocking at
Connection…………………………………………………..
49

xv
Figure 4.7 Crack Pattern for SW-F-1/3 with Enlarged Rocking at
Connection…………………………………………….……
50
Figure 4.8 Crack Pattern for SW-BWF-1/8 with Enlarged Rocking at
Connection…………………………………………..………
51
Figure 4.9 First Crack Pattern for LW-C-1…………………………….. 52
Figure 4.10 Failure Pattern for LW-C-1………………………..………... 52
Figure 4.11 Flexural Compression Mode with Enlarged View………….. 52
Figure 4.12 First Crack Pattern for LW-F-1/3…………………………… 53
Figure 4.13 Failure Pattern for LW-C-1…………………….…………… 53
Figure 4.14 Flexural Compression Mode with Enlarged View………….. 53
Figure 4.15 Crack Pattern for LW-F-1/8 with Enlarged Rocking at
Connection..............................................................................
54
Figure 4.16 First Crack Pattern for LW-BWF-1/3……………………….. 55
Figure 4.17 Failure Pattern for LW-BWF-1/3…………………………… 55
Figure 4.18 Flexural Compression Mode with Enlarged View………….. 55
Figure 4.19 First Crack Pattern for LW-BWF-1/8……………………….. 56
Figure 4.20 Failure Pattern for LW-BWF-1/8…………………………… 56
Figure 4.21 Flexural Compression Mode with Enlarged View………….. 56
Figure 4.22 Load Vs Lateral Deformation Response of Specimen SW-C-
2 (Control)………………………………………………......
58
Figure 4.23 Load Vs Lateral Deformation Response of Specimen SW-F-
1/3…………………………………………………………...
59
Figure 4.24 Load Vs Lateral Deformation Response of Specimen SW-F-
1/8…………………………………………………………...
59
Figure 4.25 Load Vs Lateral Deformation Response of Specimen SW-
BWF-1/8…….………………………………………………
60
Figure 4.26 Load Vs Lateral Deformation Response of Specimen SW-
BWF-1/3………………………………………….…………
60
Figure 4.27 Load Vs Lateral Deformation Response of Specimen LW-C-
1 (Control)…...........................................................................
61
Figure 4.28 Load Vs Lateral Deformation Response of Specimen LW-F-
1/3…………………………………………………………..
61

xvi
Figure 4.29 Load Vs Lateral Deformation Response of Specimen LW-F-
1/8…………………………………………………………...
62
Figure 4.30 Load Vs Lateral Deformation Response of Specimen LW-
BWF-1/3……………………………………….……………
62
Figure 4.31 Load Vs Lateral Deformation Response of Specimen LW-
BWF-1/8……………………………………….……………
63
Figure 4.32 Envelope Curves for Short Walls…………………………… 63
Figure 4.33 Envelope Curves for Long Walls…………………………… 64
Figure 4.34 Summary Results of First Crack in Short Wall Assemblies… 66
Figure 4.35 Summary Results of First Crack in Long Wall Assemblies… 66
Figure 4.36 Summary Results of Specimen Failure for Short Wall
Assemblies……………..……….……….…………………..
67
Figure 4.37 Summary Results of Specimen Failure For Long Wall
Assemblies……………..………..…………………………..
67
Figure 4.38 Maximum Load with Corresponding Cycle for Short Wall
Assemblies…………………………………………………..
69
Figure 4.39 Maximum Load with Corresponding Cycle for Long Wall
Assemblies..…………………..……………………………..
69
Figure 4.40 Cumulative Energy Dissipation for Short Wall Assemblies… 70
Figure 4.41 Cumulative Energy Dissipation for Long Wall Assemblies… 71
Figure 4.42 Cumulative Energy Dissipation Per Cycle for Short Wall
Assemblies..............................................................................
71
Figure 4.43 Cumulative Energy Dissipation Per Cycle for Long Wall
Assemblies…………………………………………………..
72
Figure 4.44 Hysteresis Damping Percentage for Long Wall
Assemblies…………………………….……………………
73
Figure 4.45 Stiffness Degradation Per Cycle for Short Wall Assemblies... 74
Figure 4.46 Stiffness Degradation Per Cycle for Long Wall Assemblies... 74
Figure 4.47 Stiffness Degradation for Short Wall Assemblies…………... 75
Figure 4.48 Stiffness Degradation for Long Wall Assemblies…………… 75
Figure 4.49 Comparison of Experimental Lateral Load Capacity with
Code Provisions……..….…………………………………...
76

xvii
Figure 4.50 Comparison of Experimental Lateral Load Capacity and
Deformation with Percentage of Steel……………….….......
77

xviii
LIST OF TABLES
Page
No.
Table 2.1 Factors Affecting Masonry Strength…………………….……… 8
Table 2.2 Mix Proportion and Strength of Commonly Used Mortars……… 10
Table 2.3 Guidelines for Grading of Sand…….…………………………… 19
Table 3.1 Design Summary of Tested Walls…….………………………… 29
Table 3.2 Strength of Reinforcing Bars…………………………………… 32
Table 3.3 Compressive Strength Test Result for Cement Mortar Used in
Masonry………………………………………………………..
34
Table 3.4 Compressive Strength Test Result for Cement Mortar Used in
Ferrocement…………..…………………………………………
35
Table 3.5 Crushing Strength Test Result of Bricks………………………… 36
Table 3.6 Compressive Strength Test Result of Masonry Prism…………… 37
Table 3.7 Properties of Wire Mesh……………………………….……… 37
Table 4.1 Summary Result of Ten Specimens…………………………… 64
Table 4.2 Summary of Maximum Horizontal Displacement Corresponding
to Each Cycle………..…………..……………………….……
67
Table A1 Load Deflection Value for Specimen SW-C-2(Control)……… 86
Table A2 Load Deflection Value for Specimen SW-F-1/8…….………… 88
Table A3 Load Deflection Value for Specimen SW-BWF-1/8………….. 89
Table A4 Load Deflection Value for Specimen LW-C-1(Control)………. 92
Table A5 Load Deflection Value for Specimen LW-F-1/3………………. 99
Table A6 Load Deflection Value for Specimen LW-BWF-1/3…………… 108
Table A7 Load Deflection Value for Specimen LW-BWF-1/8…………… 118

xix
NOTATION
db
Dt
Dl
E
Ed
Es
f m
Fa
Fb
Fv
h
h’
L
Keff
N
t
wm
σç'
m
ξeq
SW-F-1/3
SW-F-1/8
= diameter of mesh wire
= centre to centre spacing of wires aligned transversely in
reinforcing mesh, mm
= centre to centre spacing of wires aligned longitudinally in
reinforcing mesh, mm
= modulus of elasticity of masonry
= energy dissipation per cycle
= elastic strain energy
= specified compressive strength of masonry at the age of 28 days
= allowable average axial compressive stress for centroidally
applied axial load
= allowable flexural compressive stress if members were carrying
bending load
= allowable shear stress in masonry
= thickness of ferrocement section, mm
= effective height of a wall or column
= actual length of wall
= effective stiffness
= number of layers of mesh reinforcement
= effective thickness of a wall
= weight of mesh per unit area, N/mm2
= crushing strength of masonry
= unit weight of steel, N/mm3
= hysteresis damping percentage
= short wall with masonry panel ferrocement lamination having
8.5 X 8.5 mm wire mesh opening size
= short wall with masonry panel ferrocement lamination having
3.2 X 3.6 mm wire mesh opening size

xx
LW-F-1/3
LW-F-1/8
SW-BWF-1/3
SW-BWF-1/8
LW-BWF-1/3
LW-BWF-1/8
= long wall with masonry panel ferrocement lamination having 8.5
X 8.5 mm wire mesh opening size
= long wall with masonry panel ferrocement lamination having 3.2
X 3.6 mm wire mesh opening size
= short wall with full ferrocement coverage having 8.5 X 8.5 mm
wire mesh opening size
= short wall with full ferrocement coverage having 3.2 X 3.6 mm
wire mesh opening size
= long wall with full ferrocement coverage having 8.5 X 8.5 mm
wire mesh opening size
= long wall with full ferrocement coverage having 3.2 X 3.6 mm
wire mesh opening size

CHAPTER 1
INTRODUCTION
1.1 General
Masonry is one of the oldest construction materials. Masonry structures have been in
existence since the earliest days of mankind. Masonry had helped built several
historically important structures like the Tower of Babylon, Pyramids of Egypt and
the Great Wall of China. These structures have become iconic in the sense that they
add to the heritage, emotion and pride to the city and even the entire nation. In the 19th
century, with the emergence of other construction materials like steel and concrete,
attention shifted from masonry. Therefore, the research on development of design
standards for reinforced concrete gained more focus and priority. As a result, masonry
now-a-days has been mostly used as a non-structural element, an infill of reinforced
concrete and steel frames. Although reinforced concrete and steel buildings hold the
centre of interest in modern times, unreinforced masonry (URM) buildings still
represent a significant portion of the building stock in our country. The primary
disadvantage of these URM buildings located in active seismic regions is the fact that
they are usually old buildings, constructed from inhomogeneous material and mainly
designed to support vertical loads only. Moreover, URM is not able to carry tensile
forces due to its low tensile strength. These buildings are particularly vulnerable to
seismic actions and therefore susceptible to extreme damage. Their vulnerability is
caused by the failure of unreinforced masonry walls due to the in-plane and/or out of
plane seismic loading. In addition, large number of existing masonry buildings does
not satisfy the latest code provisions and to improve their seismic resistance,
application of strengthening is necessary. This study presents an experimental
investigation of ferrocement overlay as a repairing material for masonry walls under
lateral loading condition.
1.2 Background of the Study
Brick masonry walls are very common in low and medium-rise masonry buildings in
Bangladesh. They are rarely reinforced and pose serious hazard to the building
inhabitants. Due to its low ductility, they are more vulnerable to the lateral forces

2
developed during an earthquake. In many cases due to severe cracks by the repeated
earthquakes, they have lost major portion of their strength and stiffness. A study
conducted by Department of Civil Engineering of Bangladesh University of
Engineering and Technology (BUET, 2002) evaluated that under an earthquake of
intensity VIII (MMI), more than 60% of the buildings would be moderately or
partially damaged and needs to be retrofitted (Amanat et al., 2007). Therefore, the
development of effective and affordable retrofitting techniques for masonry elements
is an urgent need in this region.
Several retrofitting techniques are available to increase strength and ductility of
unreinforced masonry elements. One way is to add structural elements such as steel
or reinforced concrete frame having main disadvantages of adding significant weight
and loss of valuable space. The second alternative is related to surface treatments such
as grout injection, Shotcrete (ElGawady et al., 2006), Fiber Reinforced Polymer (FRP)
(ElGawady et al., 2007) etc. Although strengthening by these materials have been
proven to be effective in actual earthquakes, it is important to investigate the
performance of other materials like Ferrocement as a low cost retrofitting solution to
the vast number of existing unreinforced masonry (URM) walls throughout the
country.
A number of numerical studies that involved FE model to simulate the behaviour of
ferrocement strengthened masonry walls under in plane loading were undertaken in
recent past by various investigators e.g. Khair (2005), Alam and Amanat (2004) etc.
Experimental studies, however, on the same have been very limited. Moreover, the
priority of the experimental studies on retrofitting of URM using ferrocement largely
focused on the effectiveness of the technique (Prawel and Reinhorn, 1985 and Islam,
2017) rather than attempting to quantify effects of different parameters. In recent
times, Amanat et al. (2007), El-Diasity et al. (2015) and Shah (2011) conducted
similar studies but only on confined masonry walls and columns. Therefore, the effect
of parameters like aspect ratio, preloading, interlocking between different composite
materials and various steel wire opening size distribution on the behaviour and
strength of Ferrocement strengthened URM walls have not been deeply explored. The
present study aims to investigate the effectiveness of applying ferrocement

3
confinement on URM walls as well as to study their behaviour in terms of strength
gain, ductility and failure modes due to variation in some parameters under cyclic
lateral load.
Masonry buildings are widely used for housing construction in many countries
including Bangladesh. A huge majority of the population in Bangladesh live in
masonry buildings, which also include several important historical and public
buildings that add to the heritage, emotion and pride of a city and even the entire
nation. There are several advantages of masonry construction over both reinforced
concrete and steel; e.g., thermal comfort, sound control, possibility of addition and
alteration after construction, less formwork, easy and inexpensive repair, use of
locally available materials, need of less skilled labour, less engineering intervention
etc. On the other hand, masonry buildings suffer a great deal of damage during
earthquakes, leading to significant loss of lives. Almost 75% of the fatalities,
attributed to earthquake in last century, is caused by collapse of buildings of which
the greatest portion (more than 70%) is due to collapse of masonry buildings (Sar and
Sarkar, 2014). A majority of the older buildings in Bangladesh were Unreinforced
Masonry (URM) buildings that were originally designed with little or no provisions
for lateral loading. They are weak and vulnerable even under moderate earthquakes.
But a cursory glance through the literature on earthquake resistant structures reveals
that a bulk of research efforts is on RC structures. Clearly there is a great need to
expend more effort in understanding masonry buildings subjected to earthquake
induced dynamic loads.
Masonry is a composite material, consisting of brick and mortar, which makes its
behaviour difficult to be predicted. This difficulty is due to the different probable
failure modes, complex material constitutive models, and non-uniformities in
construction quality. It has relatively high compressive strength but is much lower in
tensile or shearing strength unless reinforced. Naturally, the lateral load resistance
capacity of masonry construction is relatively low compared to constructions made of
steel or even Reinforced Concrete. Experimental investigations conducted by Irimies
and Crainic (1993), Jabarov et al. (1985), Kahn (1984), Alcocer et al. (1996), Mander
and Nair (1994), Oliveria (2001) showed that mortar overlays with some sort of

4
reinforcement can be a powerful rehabilitation technique to strengthen masonry in
plane behaviour. Thus a thin layer of Ferrocement (cement mortar together with wire
mesh) overlay might be considered as a promising solution to enhance the in plane
strength and ductility over any other coating procedure. Therefore, it is important to
investigate the behaviour of ferrocement laminated URM walls for different
arrangements and variations in their parameters that affect their strength and ductility.
1.3 Objectives of the Research
The main objective of this thesis is to conduct experiments on masonry walls with
two different aspect ratios retrofitted with two different ferrocement properties to
interpret experimental findings.
The objectives of the investigation are as follows:
i. To study the effect of aspect ratio and spacing of reinforcing mesh inside
ferrocement on failure modes and ultimate capacity of URM walls under
cyclic horizontal loading.
ii. To compare the load deflection curve of URM walls with and without
Ferrocement strengthening
iii. To evaluate the behaviour of ferrocement in strengthening based on stiffness,
ductility, energy dissipation and hysteretic damping
iv. To compare the experimental lateral load capacity of unretrofitted URM walls
with BNBC allowable load provision.
1.4 Methodology
To investigate the behaviour of unreinforced masonry (URM) walls, cyclic static
incremental horizontal load was applied to test the walls under sustained vertical load.
Half scale 10 (Ten) URM walls with 76 mm thick RC base were prepared. The
thickness of all walls were 150 mm including 19 mm ferrocement lamination on both
faces. Then the following parameters were considered for the study:

5
Two different lengths i.e. two different aspect ratios (1 & 0.57) of URM
walls
Wire mesh with different opening size
Two different arrangements of ferrocement lamination
Following variations were considered in the specimen for the study:
Five short walls were constructed with equal length and height of 1295 mm
(aspect ratio=1). Among them, one wall was constructed without any sort of
retrofitting simply used as control specimens.
Four of short walls were retrofitted with ferrocement. Among them, one group
contains two specimens where masonry was merely wrapped with ferrocement
overlay and other group contains another two specimens with complete
lamination including base slab-wall joint wrapping. One specimen from each
group was laminated with mesh opening size arrangement of 3.2 X 3.6 mm
and another with opening size arrangement of 8.5 X 8.5 mm.
Five long walls were constructed with length and height of 2286 mm and 1295
mm respectively (aspect ratio=.57). Among them one wall was constructed
without any sort of retrofitting simply used as control specimen.
Four of long walls were retrofitted with ferrocement. Among them, one group
contains two specimens where masonry was merely wrapped with ferrocement
overlay and other group contains another two specimens with complete
lamination including base slab-wall joint wrapping. One specimen from each
group was laminated with mesh size arrangement of 3.2 X 3.6 mm and another
with mesh size arrangement of 8.5 X 8.5 mm.
Finally, the load deflection curves of the URM walls with and without strengthening
will be compared.
1.6 Scope of the Work
The present study is limited to medium strength clay brick unreinforced masonry wall.
Fly ash brick masonry, hollow block masonry, etc. are kept outside the scope of the

6
present study. Two-dimensional wall panels are used for experimental testing to
define in-plane lateral load-deformation behaviour of the wall panel. Out-of-plane
lateral strength of the wall is ignored in the present study as it is very small compared
to in-plane lateral strength. Only rectangular wire meshes are used for ferrocement
upgrading. Effect of other retrofitting techniques and variable wire mesh shapes are
beyond the scope of this study.
1.7 Organization of the Thesis
Apart from this chapter, the remainder of the thesis has been divided into four
chapters. Chapter 2 presents literature review concerning earlier research and relevant
theoretical knowledge. It includes failure modes of URM walls under lateral load,
cyclic load and its effect on masonry structure as well. Chapter 3 presents the step by
step construction procedure of Masonry walls with ferrocement lamination and
adopted procedure for testing under cyclic loading in detail. It includes the details of
the specimen dimensions, material properties, wall construction and ferrocement
casting procedures, brick and mortar strength observation, test setups, and
instrumentation. Chapter 4 presents the testing procedures and results from the
experimental program of this research. Also, it contains the detailed discussion in the
form of comparison among the failure modes, ultimate capacity, energy dissipation,
stiffness degradation and % damping of the specimens tested. Chapter 5 presents the
final conclusions, which can be drawn out from this research and also provides
suggestions for future study.

CHAPTER 2
LITERATURE REVIEW
2.1 General
This chapter deals with the theoretical background related to this research study.
Starting with the certain basic masonry properties such as compressive strength,
tensile strength, stress-strain properties of masonry, masonry wall failure modes and
mortar type selection criteria are discussed. A review of the empirical relations used
in BNBC for the capacity evaluation of unreinforced masonry is provided. It is
followed by a detailed literature review with regard to various
retrofitting/rehabilitation techniques. In addition, ferrocement properties, construction
materials and their specifications in accordance with BNBC, Volume fraction
calculation methods are also depicted in this chapter. Next, some parameters used in
the study are also explained here in terms of their significance and calculation
procedures. Finally, summary and significant findings of previous few research works
based on ferrocement retrofitting of URM walls are also highlighted here.
2.2 Masonry Properties
Masonry is typically a nonelastic, nonhomogeneous, and anisotropic material
composed of two materials of quite different properties: stiffer bricks and relatively
softer mortar. Under lateral loads, masonry does not behave elastically even in the
range of small deformations. Current values for the design strength of masonry have
been derived on an empirical basis from tests on piers, walls and small specimens.
Whilst this has resulted in safe designs, it gives very little insight into the behaviour
of the material under stress so that more detailed discussion on masonry strength is
required.
2.2.1 Compressive strength
Masonry is very weak in tension because it is composed of two different materials
distributed at regular intervals and the bond between them is weak. Therefore,
masonry is normally provided and expected to resist only the compressive forces.
Since masonry is an assemblage of bricks and mortar, it is generally believed that the

8
strength and stiffness of masonry would lie somewhere between that of bricks and
mortar. The factors set out in Table 2.1 are of importance in determining the
compressive strength of masonry (Hendry et al., 2004).
Table 2.1 Factors Affecting Masonry Strength (Hendry et al., 2004)
Unit Characteristics Mortar Characteristics Masonry
Strength
Type and Geometry:
Solid
Perforated
Hollow
Height/Thickness Ratio
Absorption Characteristics
Strength:
mix
w/c Ratio
water retentivity
Deformation
Characteristics relative to
unit
Bond
Direction of stressing
Local stress raiser
2.2.2 Strength of masonry in combined compression and shear
The strength of masonry in combined shear and compression is of importance in
relation to the resistance of buildings to lateral forces. It is found that there is a
Coulomb type of relationship between shear strength and precompression , i.e. there
Figure 2.1 Typical Relationship between Shear Strength of Brickwork and
Vertical Precompression from Test Results (Hendry et al., 2004)
Precompression, σ
Shea
r S
tres
s, τ
N/mm2
N/m
m2

9
is an initial shear resistance dependent on adhesion between the units and mortar
augmented by a frictional component proportional to the precompression (Hendry et.
al., 2004). This may be expressed by the formula:
𝜏 = 𝜏0 + 𝜇𝜎𝑐
Where, τ0 is the shear strength at zero precompression, μ is an apparent coefficient of
friction and σc is the vertical compressive stress.
2.2.3 Tensile strength
Direct tensile stresses can arise in masonry as a result of in-plane loading effects.
These may be caused by wind, by eccentric gravity loads, by thermal or moisture
movements or by foundation movement. The tensile resistance of masonry,
particularly across bed joints, is low and variable and therefore is not generally
relied upon in structural design.
If a wall is supported only at its base and top, its lateral resistance will depend on the
flexural tensile strength developed across the bed joints. If it is supported also on its
vertical edges, lateral resistance will depend also on the flexural strength of the
brickwork in the direction at right angles to the bed joints. The strength in this
direction is typically about three times as great as across the bed joints (Hendry et. al.,
2004).
2.2.4 Stress strain properties of masonry
Masonry is generally treated as a linearly elastic material, although tests indicate that
the stress-strain relationship is approximately parabolic, as shown in Figure 2.2.
Under service conditions masonry is stressed only up to a fraction of its ultimate load,
and therefore the assumption of a linear stress-strain curve is acceptable for the
calculation of normal structural deformations. Various formulae have been suggested
for the determination of Young’s modulus. This parameter is, however, rather variable
even for nominally identical specimens, and as an approximation, it may be assumed
that
𝐸 = 700σc'
Where, 𝜎ç′ is the crushing strength of masonry. This value will apply up to about 75%
of the ultimate strength.

10
Figure 2.2 Typical Stress-Strain Curve for Brick Masonry (Hendry et al., 2004)
2.3 Mortar Types
Mortar is made by combining three basic materials: cement, lime and sand. The use
of lime is rare in Bangladesh, but produces favourable properties when used in a
mortar mix. BNBC 1993 defines six basic mortar types, categorised by compressive
strength. Table 2.2 lists mortar types along with minimum compressive strength and
approximate mix proportions required to meet the strength requirements.
Table 2.2 Mix Proportion and Strength of Commonly Used Mortars (BNBC
1993)
Grade of
Mortar
Mix Proportion by
Volume
Minimum Compressive Strength at
28 days, MPa
Cement Sand
M1
M2
M3
M4
M5
M6
1
3
4
5
6
7
8
10
7.5
5
3
2
1
2.4 Failure Modes of Masonry Wall
The main in-plane failure mechanisms of URM walls subjected to earthquake actions
are summarized as following:
Strain
Str
ess
N/mm2

11
(a) Shear failure: This takes place when the principal tensile stresses, developed in
the wall under the combination of the horizontal and vertical loads, exceed the tensile
resistance of masonry materials (Elgwady et al., 2006). Just before the attainment of
maximum lateral load, diagonal cracks are developed in the wall. These cracks as
shown in Figure 2.3(a) are stair stepped “strong bricks and weak mortars”. They pass
through the bricks in case of “weak bricks and strong mortars”. For high axial load
explosive failure may happen.
(b) Sliding mode: In the case of low vertical loads and /or low friction coefficient,
which may be due to poor quality mortar, horizontal cracks in the bed joints will form
(Elgwady et al., 2006). These cracks can form a sliding plane extending along the wall
length as shown in Figure 2.3(b).
(c) Rocking mode: In rocking failure mode, the masonry piers undergo rigid body
usually occurs in piers with large aspect ratio and low vertical stress. Final Failure is
obtained by overturning of the wall as shown in Figure 2.3(c) appear in the form of
(a)
(b)
(c)
(d)
Figure 2.3 In-plane Failure Mechanisms of Laterally Loaded URM Wall, (a)
Shear Failure, (b) Sliding Failure, (c) Rocking Failure and (d)
Flexural Compression Failure
12
toe crushing due to increased compressive stresses or walking (out-of-plane sliding)
(Elgwady et al., 2006).
(d) Flexural compression mode: Flexural compression failures are the result of
having a wall with higher shear strength than flexural strength. With the improved
shear resistance and high moment/shear ratio, crushing of compression zone at the
ends of wall usually takes place. Failure is obtained by crushing one or both top
corners as shown in Figure 2.3(d).
2.5 Behaviour of Masonry Walls under Cyclic Loading
Basic resistance mechanisms are most easily understood and developed for structureal
elements that are subjected to lateral forces that increase monotonically until failure
occurs. During an earthquake, however, buildings sway back and forth and lateral
shears and deformations follow many repeated and reversed cycles. Cyclic loading
can be grouped into two categories; low-cycle load, or a load history involving few
cycles but having very large bond stress ranges. This group of loading is very common
to seismic and high wind loadings. The second group relates to high-cycle or
otherwise known as fatigue loading. The load history in this case includes many cycles
but at a low bond stress range. Offshore structures and bridge members are repeatedly
subjected to such kind of load.
Abrams D.P. (1992) conducted a series of experiments on lateral strength and
behaviour of unreinforced masonry elements revealed that wall or piers need not be
considered brittle. The two test walls were subjected to a simple series of lateral forces
from a twin pair of hydraulic actuators. The length to height aspect ratio of the two
walls were varied so that two basically different behaviour modes such as shear and
flexural modes could be observed. In-plane behaviour of the two tested walls
suggested that of the walls showed that unreinforced masonry can be significantly
stronger than their strength at initial cracking and possess considerable capacity for
inelastic deformations, and need not be limited in strength by forces which include
flexural or diagonal tensile cracks as shown in Figure 2.4 and 2.5. It was surmised that
tested wall with flexural crack did not tend to reduce the overall shear strength which
is why diagonal tension could be reached well after flexural cracks were observed.

13
Figure 2.4 Shear Crack Pattern for
Tested Wall (Abram,
1992)
Figure 2.5 Flexure Crack Pattern for
Tested Wall (Abram,
1992)
2.6 Strengthening Techniques of URM Walls
Numerous seismic events in the recent past, clearly illustrated how poorly URM
structures perform when subjected to large ground accelerations. In order to alleviate
this dangerous situation, effective retrofit strategies aimed at increasing the seismic
performance of existing URM structures must be developed. Furthermore, reliable
methods and tools for analyzing existing URM structures are required if efficient
retrofit techniques are to be implemented in practice.
The first traditional method that has been used for retrofit or seismic strengthening of
URM walls involves the removal of one or more wythes of brick and subsequently
filling the void with pneumatically applied concrete (shotcrete). Kahn (1984),
amongst many, showed that this method is very effective in increasing both the
strength and the ductility of URM wails. However, the use of shotcrete is costly, due
both to the large amount of formwork and surface preparation it requires.
One of the most promising new methods that has been developed for the strengthening
of URM walls involves the use of fiber reinforced polymers (FRP). This technique
requires FRP overlays to be bonded to both sides of a URM wall and is typically
unobtrusive to the building occupants, requires very little surface preparation, and as
a result is very economical. Schwegler (1994) conducted full scale tests on URM walls
retrofitted with an epoxy-bonded carbon FRP. Results showed that both the in-plane
and out-of-plane strength were significantly increased as a result of the retrofit.

14
Another method that has been proposed to increase the strength of URM walls is the
use of post-tensioning. Post-tensioning or prestressing has been used extensively in
order to enhance the tensile and flexural capacity of lightly reinforced or unreinforced
concrete, which is a brittle material with similar characteristics to URM. For retrofit
of URM structures this method is applied by core drilling from the top of the masonry
walls and vertically post-tensioning the walls to the foundation. While this method is
somewhat costly, it has advantages in that it does not alter the appearance of the
structure (important for historical structures) and that the occupants of the structure
need not be disturbed during application.
The second seismic strengthening method that has been traditionally used involves
the application of thin surface coatings like ferrocement to one or both sides of a URM
walls. Ferrocement is an old technique in terms of its application but relatively young
in terms of the year devoted to its research for unreinforced masonry buildings. But
this method might be labor intensive and create a great deal of disturbance to the
occupants of the structure during retrofit. This research aims to evaluate the
performance of ferrocement retrofitted URM walls against seismic load. Figure 2.6
shows the application of ferrocement as an upgrading material on a load bearing
masonry wall.
Figure 2.6 Ferrocement Strengthening on a Load Bearing Masonry Wall

15
2.7 Allowable Compressive and Shear Stresses in Masonry According to
BNBC
The first step in the design of any engineered masonry structure is determining
anticipated service loads. Once these loads are established, the required strength of
the masonry can be determined. The designation fm′ , indicates the specified
compressive strength of masonry. It is used throughout the design and, in accordance
with BNBC, to predict thestrength and behaviour of the masonry assembly and thus
to size masonry elements. It should be stressed that the specified compressive strength
of the masonry is related to but not equal to the tested compressive strength of the
masonry.
To ensure that a safe and functional structure is being constructed that will meet or
exceed the intended service life, measures must be taken to verify that the compressive
strength of the assembled materials, including masonry units, mortar and grout if used,
meet or exceed the specified compressive strength of the masonry.
Compliance with the specified compressive strength is verified by one of two
methods: the unit strength method or the prism test method. Only Prism Test method
was referenced in masonry wall chapter of BNBC 1993 as a rational procedure for
verifying masonry compressive strength. ASTM C1314, Standard Test Method for
Compressive Strength of masonry prisms, contains provisions for determining the
compressive strength of a masonry prism: an assemblage made of representative units,
mortar and grout (for grouted masonry construction). Although constructed using
materials used in the project, the prism is not intended to be a reduced-scale version
of the wall, but rather a quality assurance instrument to demonstrate how the masonry
components work together. For this reason, prisms are typically constructed in stack
bond with a full mortar joint, regardless of the wall construction. The tested
compressive strength of the prism is corrected to account for different permissible
height to thickness ratios of the prisms. This corrected strength must equal or
exceed fm′ .
a) Compressive Stress, Axial
Unreinforced masonry walls, columns and reinforced masonry wall

16
3
ma
42t
h1
5
fF
b) Compressive Stress, Flexural
10f0.33F mb N/mm2
c) Shear Stress for Flexural Members, Fv
i) When no shear reinforcement is used
0.25m
f0.083v
F N/mm2
ii) When shear reinforcement is designed to take entire shear force
0.75f0.25F mv N/mm2
d) Shear Stress for Shear Walls, Fv
i) Unreinforced masonry
For clay units 0.40f0.025F mv N/mm2
2.8 Ferrocement Strengthening
The name “ferrocement” implies the combination of wire mesh or small diameter steel
mesh and cement. In general, ferrocement is considered as a highly versatile from of
composite material made of cement mortar and layers of wire mesh or similar small
diameter steel mesh closely bound together to create a stiff structural form. This
material, which is a special form of reinforced concrete, exhibits a behaviour so
different from conventional reinforced concrete in performance, strength and potential
application that it must be classed as a separate material.
According to ACI code, “Ferrocement is a type of thin wall reinforced concrete
construction where usually hydraulic cement is reinforced with layers of continuous
and relatively small diameter mesh. Mesh may be made of metallic or other suitable
materials.”
Figure 2.7 Typical Cross Section of Ferrocement
10-40 mm
5-25 mm

17
2.9 Properties of Ferrocement
It has better crack arresting mechanism
Has relatively better mechanical properties and durability than
ordinary reinforced concrete.
Within certain loading limits, it behaves as a homogeneous elastic
material and these limits are higher than normal concrete.
It has the distinctive advantage of being mouldable and of one-piece
construction.
Low cost, non-flammability, high corrosion resistance
2.10 Construction Materials
The material used in ferrocement consists primarily of mortar made with cement,
water and aggregate and the reinforcing mesh.
2.10.1 Reinforcing mesh
Reinforcing meshes for use in ferrocement shall be evaluated for their susceptibility
to take and hold shape as well as for their strength performance in the composite
system. Generally, it consists of thin wires, either woven or welded into a mesh, but
main requirement is that it must be easily handled and if necessary, flexible enough
to be bent around sharp corners. The wire meshes are usually 0.5 mm to 1.0 mm in
diameter and spaced at 5 mm to 25 mm apart and the volume of the mesh ranges from
1% to 8% of the total volume of the structural element (BNBC 1993).
The mechanical behaviour of ferrocement is highly dependent on the type, quantity,
orientation and strength properties of the mesh and reinforcing rod. Types of wire
used in ferrocement include:
Hexagonal wire mesh
Welded wire mesh
Square mesh
Expanded metal mesh

18
Figure 2.8 Types of Wire Mesh
2.10.2 Cement
The binding material or matrix in ferrocement is known as mortar. It is normally made
of Portland cement and ordinary silica sand. Ordinary Portland cement of Type I and
Type II is adequate for application in ferrocement where special condition does not
prevail or particular properties is not required. The cement shall be fresh, of uniform
consistency, and free of lumps and foreign matter. It shall be stored under dry
conditions for as short a duration as possible. Under special conditions, rapid
hardening Portland cement (ASTM Type II), sulphate resisting Portland cement
(ASTM Type V) are also used.
2.10.3 Aggregate
Aggregate used in ferrocement shall be normal weight fine aggregate (sand). It shall
comply with ASTM C33-86 requirements (for fine aggregate) or an equivalent
standard. It shall be clean, inert, free of organic matter and deleterious substances, and
relatively free of silt and clay.
The grading of fine aggregate shall be in accordance with the guidelines of Table 1
(BNBC 1993). However, the maximum particle size shall be controlled by
construction constraints such as mesh size and distance between layers. A maximum
particle size passing sieve No. 16 (1.18 mm) may be considered appropriate in most
applications. The sand shall be uniformly graded unless trial testing of mortar
workability permits the use of a gap graded sand.
Square Mesh Expanded Mesh Hexagonal Mesh

19
Table 2.3 Guidelines for Grading of Sand (BNBC 1993)
Sieve Size
U.S. Standard Square Mesh
Percent Passing
by Weight
No. 8 (2.36 mm)
No. 16 (1.18 mm)
No. 30 (0.60 mm)
No. 50 (0.30 mm)
No. 100 (0.15 mm)
80 - 100
50 - 85
25 - 60
10 - 30
2 - 10
2.10.4 Water
The mixing water shall be fresh, clean, and potable. The water shall be relatively free
from organic matter, silt, oil, sugar, chloride, and acidic material. It shall have a pH ≥
7 to minimize the reduction in pH of the mortar slurry. Salt water is not acceptable,
but chlorinated drinking water can be used.
2.11 Ferrocement Mix Proportions
The ranges of mix proportions for common ferrocement applications shall be sand
cement ratio by weight, 1.5 to 2.5, and water cement ratio by weight, 0.35 to 0.5
(BNBC 1993). The higher the sand content, the higher the required water content to
maintain the same workability. Fineness modulus of the sand, water cement ratio, and
sand cement ratio shall be determined from trial batches to ensure a mix that can
infiltrate (encapsulate) the mesh and develop a strong and dense matrix.
The moisture content of the aggregate shall be considered in the calculation of
required water. Quantities of materials shall preferably be determined by weight. The
mix shall be as stiff as possible, provided it does not prevent full penetration of the
mesh. Normally the slump of fresh mortar shall not exceed 50 mm. For most
applications, the 28 days’ compressive strength of 75 by 150 mm moist cured
cylinders shall not be less than 35 N/mm2.
2.12 Volume Fraction of Wire Mesh
The voulme fraction of reinforcement in a ferrocement section can be readily
calculated if the density of the mesh material and the weight of mesh per unit area are
known.

20
For ferrocement section reinforced with expanded metal mesh, the volume fraction of
mesh reinforcement may be calculated from the following relationship.
Vf = Volume of mesh
Volume of ferrocement section =
wm N
γm
h
where,
N = number of mesh layers
h = thickness of ferrocement section, mm
wm = weight of mesh per unit area, N/mm2
γm = unit weight of steel, N/mm3
For ferrocement reinforced with square or rectangular mesh, the volume fraction of
mesh reinforcement may be calculated from the following relationship:
100%D
1
D
1
4h
NππV
tl
2
bf
where,
N = number of layers of mesh reinforcement
db = diameter of mesh wire
h = thickness of ferrocement
Dt = centre to centre spacing of wires aligned transversely in reinforcing
mesh, mm
Dl = centre to centre spacing of wires aligned longitudinally in reinforcing
mesh, mm
2.13 Damping Ratio and Energy Dissipation
The equivalent viscous damping ratio and effective stiffness of an inelastic bridge
system are important design parameters in some of the recent displacement-based
bridge design methodologies and procedures. A quantitative parameter that can be
evaluated at each performance level is the Equivalent viscous damping ratio, ξeq,
which describes the equivalent viscous hysteretic damping. It is based on an equal
area approach that represents the same amount of energy loss per cycle as seen in the
real experiment (Priestley et al., 1996). The calculation of ξeq for cases with symmetric

21
hysteresis loops is shown in Figure 2.9. The area within the inelastic force-
displacement response curve, Ed in the Figure 2.9, is a measure of the hysteretic
damping or energy-dissipating capacity of the structure. The hatched region in Figure
2.9 depicts the elastic strain energy stored in an equivalent linear elastic system, Es.
The equivalent viscous damping ratio, ξeq, is represented by equation (2.1). The
effective stiffness, Keff, defines the slope of the equivalent linear elastic system
represented by Es, and is also depicted in Figure 2.9. It is the ratio of the force at a
given response level to the deformation at that level and is calculated by equation
(2.2).
ξeq
=1
4π(
Ed
Es) (2.1)
Keff=F
∆ (2.2)
Figure 2.9 Equivalent Viscous Damping Ratio (ξeq), and Effective Stiffness (Keff)
for Symmetric Hysteresis Loops (Hose and Seible, 1999)
Some components and systems may experience asymmetric response in the two
loading directions under cyclic loading. The same concept of taking the average of the
push and pull responses is applied to the determination of the equivalent viscous

22
damping ratio and the equivalent stiffness. The equivalent viscous damping ratio for
the full asymmetric cycle at a specific force level is derived in equation (2.3) and
further defined in Figure 2.10. The energy input or damping energy loss for the push
half cycle of the idealized force-displacement loop is represented by area Ed1 in Figure
2.10. Similarly, the energy loss for the pull half cycle is depicted as area Ed2. The
hatched regions in Figure 2.10 defines Es1 and Es2, which represent the elastic strain
energy stored in an equivalent linear elastic system for the push and pull half cycles
respectively (Hose and Seible, 1999).
ξeq
=1
4π(
Ed1
Es1+
Ed2
Es2) (2.3)
Figure 2.10 Equivalent Viscous Damping Ratio (ξeq), and Effective Stiffness
(Keff) for Asymmetric Hysteresis Loops (Hose and Seible, 1999)
2.14 Literature Review of Earlier Research on URM Walls Retrofitted with
Ferrocement
Jabarov et al. (1985)
Jabarov et al. (1980) presented an experimental program designed to investigate the

23
effectiveness of repairing damaged unreinforced clay unit masonry walls with a
coating of reinforced mortar. A cement mortar is parged on the surface of a cracked
brick wall. The mortar layer is approximately 25 mm thick and is reinforced with a
wire mesh or reinforcing bars placed in diagonal direction. Two parallel masonry
walls with openings were subjected to in-plane cyclic lateral forces. For the
unstrengthened wall, crack was initiated approximately at two-third of the peak lateral
force. Crack continued to propagate along the diagonals of the piers until a peak force
of 910 KN was reached. After strengthening of the exterior piers lateral force capacity
was increased to 1175 KN. The force capacity of the test walls with the interior walls
strengthened were 2.9 times the capacity of the unstrengthened walls.
Reinhorn et al. (1985)
The first systematic work on retrofitting of URM buildings with ferrocement overlay
was conducted by Reinhorn et al. (1985). They tested a series of brick masonry walls
strengthened with ferrocement layers. The 12.7 mm thick ferrocement coatings,
applied to both faces, were reinforced using different mesh arrangements. The
strength, ductility and stiffness of the coated walls were nearly double than those of
the uncoated walls. The strength enhancement, however, was little affected by mesh
spacing.
Irimies and Crainic (1993)
Irimies and Crainic presented the research to investigate the effectiveness of repairing
damaged masonry walls with cement paste injected into cracks and in-plane
strengthening by application of a reinforced mortar coating. A series of six two shear
wall test structures were constructed and subjected to in-plane lateral forces until
failure. Walls were constructed with flanges so that behaviour of webs could be
examined under high shear forces. Walls repaired by filling cracks with cement paste
cracked at the same force level as per as for virgin specimen. The resulting behaviour
was similar to that of the virgin wall. Both rehabilitation methods resulted in a
substantial increase in stiffness. The walls with mortar coating rocked about their
base. When this rotation was restrained with external devices, a concentration of
cracking in the compressed flanges developed.

24
El-Diasity et al. (2015)
El-Diasity et al. (2015) presented the results of in-plane cyclic loading tests conducted
on confined masonry walls retrofitted using low-cost ferrocement and GFRP systems.
Ten wall assemblies with a 0.80-scale were built, consisting of a clay masonry panel,
two confining columns and a tie beam. The assemblies were tested under a
combination of a vertical load and lateral reversed cyclic loading with a displacement
controlled loading protocol up to failure. Wall panels had various configurations,
namely, solid walls, perforated walls with window and door openings. Two composite
materials (ferrocement and GFRP) and three retrofitting configurations (diagonal
‘‘X’’, corner, and full coverage) were investigated. Key experimental results showed
that the proposed upgrading techniques improved the lateral resistance of the confined
walls by a factor ranging from 25% to 32%with a significant increase in the ductility
and energy absorption of the panel ranging from 33% to 85%; however, the
improvement in lateral drifts was less significant. Regarding the upgrading
configurations, the diagonal ‘‘X’’ and full coverage can help prevent diagonal shear
failure especially in tie columns and convert the failure mode to a panel-rocking mode.
Additionally, in all retrofitting cases, collapse was significantly delayed by
maintaining the wall integrity under large lateral deformations. A good agreement was
found by comparing deformed shapes, crack patterns and capacity curves of finite
element models included in this study.
Prawel and Reinhorn (1985)
Prawel and Reinhorn (1985) presented an experimental program to investigate the use
of ferrocement coatings for the in-plane rehabilitation of unreinforced masonry walls.
The test program included two uncoated brick masonry test panels, and five coated
test panels, each having a different spacing of reinforcing meshes. Each masonry
panel was tested in a diagonal split test to investigate in-plane shear forces. The wire
spacing in the mesh was varied from 3 mm to 50 mm. with the ferrocment layer being
varied to maintain a constant reinforcement volume ratio. The result shows that the
strength, secant stiffness and ductility of the coated walls were nearly twice those for
the uncoated walls. The measured strength was essentially independent of reinforcing
spacing. The surface coating improved not only ultimate deformation range but also
extended the elastic range. The coated specimens behaved in nearly an ideal plastic

25
manner whereas stiffness of the non-retrofitted test panels reduced rapidly.
Prawel and Lee (1990)
Prawel and Lee (1990) presented an experimental program designed to investigate the
inplane behaviour of masonry walls strengthened with ferrrocement coating. In
particular, the research examined ultimate strength, ductility requirement, energy
dissipation and strength/stiffness degradation of URM walls with and without coating.
Test walls consisting of two wythe reclaimed brick walls were constructed with 13
mm thick layer of ferrocement applied each side of a wall. Each ferrocement layer
consisted of two layers of 19 gage wire mesh with a one-half inch grid embedded in
mortar coating. Inelastic action of uncoated piers when tested statically was a result
of flexural cracking in addition to sliding and rocking movements. For the coated
piers, one specimen failed in flexure accompanied by a horizontal crack along the base
while the other failed due to a collapse of the loading device. In addition to the static
test, an identical pair of tested retrofitted tested walls were subjected to simulated
earthquake motion on a shaking table test. The results were almost identical to the
results from the cyclic loading taste. The ferrocement was able to prevent early
splitting of masonry and to prevent development of internal crack. The static strength
and stiffness of the plain walls were increased by 250% with retrofitting and energy
dissipation capacity increased by 300%.
Ashraf et al. (2004)
This study presents experimental results of quasi-static load test conducted on two
full-scale brick masonry walls, one unreinforced and the other confined, to investigate
their in-plane lateral load behaviour before and after retrofitting. The walls were
constructed closely following the masonry system commonly used in Pakistan and in
most South Asian countries. The walls before retrofitting were tested to their peak
resistance. The damaged walls were then retrofitted with grout injection followed by
ferrocement overlay and retested to their ultimate failure under the identical
conditions. The effectiveness of the proposed confinement and retrofitting scheme
was assessed from the damage pattern, energy dissipation, and force-deformation
behaviour of the walls tested before and after retrofitting. The test results before
retrofitting show that the capacity of confined masonry wall is almost double to that

26
of unreinforced masonry wall. The test results after retrofitting indicate that the
applied retrofitting scheme significantly enhanced the lateral load capacity of the
unreinforced masonry wall, however it was marginally beneficial in the confined
masonry walls. The test results are also compared with American Society of Civil
Engineers (ASCE) standards in terms of stiffness, strength and acceptable
deformations. It is concluded that the guidelines provide reasonable estimates of the
test observations.
2.15 Summary of Literature Review
The above discussion provides the basis for studying the behaviour of each
constituent, that is, masonry and ferrocement both as individual and as an integral part
of the structure, that is, a masonry wall strengthened with ferrocement overlays. From
the above information, it may be concluded that very little experimental work has
been reported so far on the performance of unreinforced masonry walls retrofitted
with ferrocement overlay under cyclic lateral load. The reported work has been mostly
either based on rocking-critical behaviour where the significance of ferrocement
overlays is minimal or shear-critical behaviour found mostly in confined or in-filled
masonry. This study intends to interpret the effect of few other parameters like mesh
opening size and strengthening techniques and arrangements on URM walls to check
their effectiveness in building structure during earthquake.

CHAPTER 3
MATERIAL PROPERTIES AND EXPERIMENTAL PROGRAM
3.1 Introduction
This chapter presents the experimental program to investigate the effectiveness of
composite materials; namely ferrocement using wire mesh as externally bonded
upgrading materials for the in-plane retrofitting of URM walls. The experimental
program includes testing both un-retrofitted and retrofitted wall assemblies of two
different aspect ratios up to failure under reversed incremental cyclic lateral loads.
3.2 Specimen Preparation
3.2.1 Selection of geometric properties of masonry walls
Ten unreinforced masonry walls with a 0.50-scale were built, using full scale clay
brick units. Each of the wall was supported with 76 mm RC base slab. The dimensions
of the walls were selected in a way that suits the Hydraulic Testing Machine. The
thickness and height of all the walls for all assemblies was 152 mm and 1295 mm
approximately. Only the span length was varied to create two different aspect ratios.
First group of specimens denoted as “Short Walls” consisting of six walls are
approximately 1295 mm in length, thus having an aspect ratio =1. Five remaining
x
Figure 3.1 Typical Details of the Tested Short Wall
Cross Section

28
Figure 3.2 Typical Details of the Tested Long Wall
walls having a span dimension of 2286 mm (aspect ratio = 0.57) fall into the category
of “Long Walls”. Typical details of tested walls are shown in Figure 3.1 and 3.2.
For each group, two specimens were retrofitted using one ferrocement layer consisting
of wire mesh with an opening size of 8.5 X 8.5 mm and another two were retrofitted
with mesh opening size of 3.2 X 3.6 mm. One specimen from Short Walls category
and one from Long Walls category were constructed without any sort of retrofitting
to be used simply as control section. The thickness of ferrocement lamination applied
on both sides was 19 mm.
The test matrix investigates the use of ferrocement in retrofitting these alternatives
using multiple arrangements. Coverage of the walls was done either by laminating
only the brick masonry excluding base slab or by fully covering the entire wall
including base slab with the confining elements. Table 3.1 summarizes the tested
walls.
The walls were tested under a combination of a constant vertical load and lateral cyclic
loading with force controlled loading protocol up to failure. Uniform loads in the form
of steel joist were applied on the top of each wall to get the effect of sustained gravity
load along with a horizontal incremental static repeated loading for seismic effect.
Cross Section

29
Table 3.1 Design Summary of Tested Walls
3.2.2 Material properties
(i) Cement
Cement is a binder, a substance that sets and hardens and can bind other materials
together. The most important uses of cement are as a component in the production of
mortar in masonry, and of concrete, a combination of cement and an aggregate to form
a strong building material. The experimental work of this research was conducted
using Fresh cement (CEM I, Type A).
Group Wall ID Wall State Retrofitting
Configuration
Wire Mesh
Opening
Size
Vertical
Point
Load
Short
Walls
SW-C-2 Unretrofitted --- --- 6 ton
SW-F-1/3 Retrofitted
Ferrocement
covering only
brick masonry
8.5 X 8.5
mm 3 ton
SW-F-1/8 Retrofitted
Ferrocement
covering only
brick masonry
3.2 X 3.6
mm 6 ton
SW-BWF-
1/3 Retrofitted
Ferrocement
full coverage
8.5 X 8.5
mm 6 ton
SW-BWF-
1/8 Retrofitted
Ferrocement
full coverage
3.2 X 3.6
mm 6 ton
Long
Walls
LW-C-1 Unretrofitted --- --- 8 ton
LW-F-1/3 Retrofitted
Ferrocement
covering only
brick masonry
8.5 X 8.5
mm 8 ton
LW-F-1/8 Retrofitted
Ferrocement
covering only
brick masonry
3.2 X 3.6
mm 8 ton
LW-BWF-
1/3 Retrofitted
Ferrocement
full coverage
8.5 X 8.5
mm 8 ton
LW-BWF-
1/8 Retrofitted
Ferrocement
full coverage
3.2 X 3.6
mm 8 ton

30
(ii) Fine aggregate
Two different types of fine aggregates were used. Coarse Sylhet sand (FM > 2.5) has
been used for concrete base slab construction. Important qualities of sand those
influence the quality of fresh and hardened concrete are specific gravity, absorption
capacity, moisture content, grading and chemical properties. Fine local sand (FM<2)
was used for mortar preparation.
Separate mixing ratio was selected for mortar used in masonry as well as ferrocement
lamination as per the guidelines mentioned in BNBC 1993. The grading of sand used
in ferrocement also complies with BNBC standard. Figure 3.3 and 3.4 show the
gradation curve of ferrocement sand and masonry mortar sand, respectively.
(iii) Coarse aggregate
Strength and durability of concrete depend on the type, quality and size of the
aggregates. 19 mm downgrade stone chips were used for concrete casting. All coarse
Figure 3.3 Grain Size Distribution of Local Sand Used as Ferrocement Mortar
with Respect to Upper and Lower Limit as per BNBC 1993 Guideline
0
20
40
60
80
100
120
0.1 1 10
Lower
Limit (BNBC 93)
Upper
Limit (BNBC 93)
Ferrocement
Mortar
Sieve Size, mm
% f
iner
By W
eight

31
Figure 3.4 Grain Size Distribution Curve for Fine Aggregate
Figure 3.5 Grain Size Distribution Curve for Coarse Aggregate
0
20
40
60
80
100
120
0.1 1 10 100
Sieve Size (mm)
% F
iner
by W
eight
0
20
40
60
80
100
120
0.1 1 10
Sieve Size (mm)
% F
iner
by W
eigh
t

32
aggregates were in S.S.D. condition prior to mixing. The gradation curve of 19 mm
downgrade Coarse Aggregate is shown in Figure 3.5.
(iv) Reinforcement
Reinforcing bars are used to take high tension, compression and shear forces induced
in the concrete member. Transfer of forces between concrete and the reinforcement
depends on the bond strength between them. At present, all commercial reinforcing
bars are deformed bars and have better bond performance with concrete than the plain
reinforcing bars. Φ12 mm bars were used in both longitudinal and transverse
directions for base slab. Both longitudinal and transverse bars were spaced at 100 mm
c/c to form a net over the wooden formwork. Specimens were tested for yield and
ultimate capacity. The summary of the test result is given in Table 3.2.
Table 3.2 Strength of Reinforcing Bars
Diameter
(mm)
Elongation
(%)
Cross Section
of Bar ( mm2)
Yield Strength
(MPa)
Ultimate
Strength (MPa)
12 13 113.34 545 667
(v) Concrete
For preparing concrete, Fresh Cement (CEM I, Type A) was used along with Sylhet
sand as fine aggregate and 19 mm downgrade stone chips as coarse aggregates. w/c
ratio of the mix was 0.48. Ratio of volume of F.A to C.A was 0.4. No admixture was
used in the process. The concrete was mixed in a mixer machine which was used for
casting the RC base slab. Casting took place at the concrete lab in BUET. Before using
concrete, slump test was carried out to keep the slump value in between 100 to 125
mm.
(vi) Cement mortar
Cement mortar is a building compound created by mixing sand and a selection of
aggregates with a specified amount of water. Two different types of mortar were used.
One type was used to serve as cementing material to hold together bricks in between.
Another type, relatively stronger, was used for ferrocement lamination and plastering
to confine wire mesh inside. W/C ratio was 0.5. Mixing ratio was given below.

33
Figure 3.6 Coarse Aggregate Figure 3.7 Fine Aggregate
Figure 3.8 Concrete Mixing
Figure 3.9 Slump Test
For Brickwork: C:S= 1:4 (Volume basis)[Grade: M2 as per BNBC]
For Ferrocement overlay: C:S= 1:2 (Mass Basis)[BNBC Allowable Range: 1:1.5~2.5]
Compressive strength test results for both types of mortars are presented in Table 3.3
and 3.4. The compressive strength for each mortar casting was determined on 50 mm
standard cubes in accordance with ASTM C109. The cubes remained in the moulds
for 24 hours; thereafter they were taken from their moulds and stored at 100% relative
humidity until testing. The compressive strength was tested after 28 days of their
casting for all the cubes.

34
Table 3.3 Compressive Strength Test Result for Cement Mortar Used in
Masonry
Sl. Size
(mm)
Observed
Load (KN)
Actual
Load (KN)
Area
(mm2)
Strength
(MPa)
Average
(MPa)
1-1 50.8 17.70 12.41 2580.64 4.81
4.0 1-2 50.8 14.70 9.40 2580.64 3.64
1-3 50.8 17.40 12.10 2580.64 4.69
Sl. Size
(mm)
Observed
Load (KN)
Actual
Load (KN)
Area
(mm2)
Strength
(MPa)
Average
(MPa)
2-1 50.8 19.70 14.41 2580.64 5.58
5.0 2-2 50.8 17.90 12.61 2580.64 4.88
2-3 50.8 17.06 11.76 2580.64 4.56
Sl. Size
(mm)
Observed
Load (KN)
Actual
Load (KN)
Area
(mm2)
Strength
(MPa)
Average
(MPa)
3-1 50.8 20.56 15.27 2580.64 5.92
5.5 3-2 50.8 17.65 12.36 2580.64 4.79
3-3 50.8 20.96 15.67 2580.64 6.07
Sl. Size
(mm)
Observed
Load (KN)
Actual
Load (KN)
Area
(mm2)
Strength
(MPa)
Average
(MPa)
4-1 50.8 20.48 15.19 2580.64 5.89
6.0 4-2 50.8 21.60 16.32 2580.64 6.32
4-3 50.8 20.59 15.30 2580.64 5.93
Table 3.4 Compressive Strength Test Result for Cement Mortar Used in
Ferrocement
Sl. Size
(mm)
Observed
Load (KN)
Actual
Load (KN)
Area
(mm2)
Strength
(MPa)
Average
(MPa)
1-1 50.8 32.0 26.8 2580.6 10.4
10.5 1-2 50.8 31.9 26.6 2580.6 10.3
1-3 50.8 33.1 27.8 2580.6 10.8
[Table continued to next page]

35
[Table continued from previous page]
Sl. Size
(mm)
Observed
Load (KN)
Actual
Load (KN)
Area
(mm2)
Strength
(MPa)
Average
(MPa)
2-1 50.8 38.3 33.1 2580.6 12.8
12.5 2-2 50.8 39.2 34.0 2580.6 13.2
2-3 50.8 37.6 32.4 2580.6 12.5
Sl. Size
(mm)
Observed
Load (KN)
Actual
Load (KN)
Area
(mm2)
Strength
(MPa)
Average
(MPa)
3-1 50.8 47.0 41.8 2580.6 16.2
15 3-2 50.8 41.1 35.9 2580.6 13.9
3-3 50.8 45.7 40.5 2580.6 15.7
Sl. Size
(mm)
Observed
Load (KN)
Actual
Load (KN)
Area
(mm2)
Strength
(MPa)
Average
(MPa)
4-1 50.8 43.2 38.0 2580.6 14.7
14.5 4-2 50.8 41.1 35.9 2580.6 13.9
4-3 50.8 45.7 40.5 2580.6 15.7
Sl. Size
(mm)
Observed
Load (KN)
Actual
Load (KN)
Area
(mm2)
Stress
(MPa)
Average
(MPa)
5-1 50.8 41.9 36.7 2580.6 14.2
14 5-2 50.8 43.3 38.1 2580.6 14.8
5-3 50.8 39.8 34.6 2580.6 13.4
(vii) Brick
Local bricks having frogmarks on both sides were used to construct the walls. Full
scale bricks were used. The normal size of bricks was 241 X 114 X 70 mm. All the
bricks were thoroughly soaked in water before being laid in wall.
(a) Crushing strength test of bricks
Compressive strength of a brick is determined by testing the brick under standard
conditions using a compression testing machine. Prior to testing, any unevenness
observed on the both faces were removed and each sample was swan into two pieces.
Bricks were immersed in water at room temperature for 24 hours. The depression on

36
brick surface created by frogmarks were flushed with cement mortar having mix ratio
1:1. Then the brick samples were kept under wet jute bags for 3 days. Finally, brick
samples were ready for testing. Table 3.5 shows the results crushing strength test of
bricks.
Table 3.5 Crushing Strength Test Result of Bricks
Sl. Width
(mm)
Length
(mm)
Observed
Load (KN)
Actual
Load (KN)
Area
(mm2)
Stress
(MPa)
Average
(MPa)
1 113.03 109.2 238 238.6 12345.1 19.3
19
2 115.57 109.9 206 206.7 12695.9 16.3
3 121.92 109.2 308 308.5 13316.1 23.2
4 113.03 113 208 208.7 12775.8 16.3
5 113.03 113 276 276.6 12775.8 21.6
Figure 3.10 Initial State of Specimen
in Prism Test
Figure 3.11 Cracked Specimen in
Prism Test
(b) Prism test of masonry
In this research, prisms were constructed by assembling five brick masonry units, one
on top of the other, using mortar as the bonding material representative of those being
used in the construction in the contact surface of the masonry units. Each prism was
carefully moved to a location where they were covered with wet jute hessian to
maintain the moisture level as shown in Figure 3.10 and Figure 3.11. Six prisms in
total were constructed for compressive strength testing in accordance with ASTM

37
C1314 Standard Test Methods for Compressive Strength of Masonry Prisms. The
results are shown in Table 3.6.
Table 3.6 Compressive Strength Test Result of Masonry Prism
Sl. Length
(mm)
Width
(mm)
Area
(mm2)
Ultimate
Load (KN)
Ultimate
Stress (MPa)
Average
(MPa)
1 228.6 111.76 25548.34 61 2.4
3.4
2 222.25 109.22 24274.15 54 2.2
3 233.68 109.22 25522.53 102 4.0
4 231.14 109.22 25245.11 68 2.7
5 226.06 105.41 23828.98 77 3.2
6 229.87 101.6 23354.79 136 5.8
(viii) Wire mesh
As it is mentioned earlier, two types of wire mesh were used for ferrocement
lamination. Both the meshes were of mild steel but their diameter and opening size
were different. Table 3.7 shows the properties of wire mesh. Volume fraction of steel
was calculated using BNBC provisions. American Wire Gauge (A.W.G) standard
chart was used to determine the respective diameter of wire mesh used.
Table 3.7 Properties of Wire Mesh
Mesh ID A.W.G
(B & S)
Dia
(mm) Opening per 25 mm
Volume
Fraction of
Steel
Mesh
1/3x1/3
18
gauge
1.024
Approximately three openings
per 25 mm in both horizontal and
vertical direction
1.023%
Mesh
1/8x1/7
24
gauge
0.511
Approximately eight and seven
openings per 25 mm in
horizontal and vertical direction
respectively
0.612%
3.3 Formation of Specimens
Wall specimens were formed in three different steps following the practical
construction practice. The base slab was casted at first. Subsequently, the brick
masonry was erected right after curing of base slab. Finally, the walls to be retrofitted

38
were wrapped with ferrocement lamination. The step by step pictorial descriptions of
specimen formation are given as follows:
Figure 3.12 Formwork Figure 3.13 Reinforcement
Arrangement
Figure 3.14 Concrete Pouring into
Formwork Figure 3.15 Mechanical Vibrator
3.3.1 Base slab construction
At first, ten base slabs were constructed horizontally with a similar cross section of
200 X 75 mm. but slabs were in different span length. Five of them had a span length
of 2286 mm and the rest had a span length of 1524 mm. Form works of respective

39
sizes were constructed to support the freshly placed concrete and the reinforcement,
as shown in the Figure 3.12. Basic concerns were the accuracy of pertaining to length
and shape as well as the smoothness of the top and bottom finished surface. Deformed
Figure 3.16 Base Slabs after casting Figure 3.17 Base Slab Curing
Figure 3.18 Masonry Wall
Construction
Figure 3.19 Masonry Wall
(Unretrofitted)
bars of 12 mm dia @ 100 mm c/c were placed in both longitudinal and transverse
directions to resist the flexural tension during uplifting of walls. A number of small
mortar blocks were used on the inner base and on two sides of the formwork to
maintain 20 mm clear cover and vibrator were used for proper compaction. Element

40
used in the construction of the formwork was 25 mm wood. The entire sample was
covered with wet jute hessian to maintain the moisture level. The beams were cured
with water three times in everyday up to 28 days. The construction sequences are
shown from Figure 3.12 to Figure 3.17.
Figure 3.20 Plastering and Surface
Levelling
Figure 3.21 Curing of Finished Walls
3.3.2 Brick masonry construction
After 28 days of construction of base slab, brick walls were constructed on the base
slab to the horizontal alignment. Ropes were used to maintain the horizontal alignment
Figure 3.22 Drilling Machine Figure 3.23 Pre-drilled Bricks

41
Figure 3.24 Rawl Plugs Figure 3.25 Arrangement of Rawl Plugs
of the walls. For each mixing of mortar, three cubes were made for testing purposes.
The walls were subsequently wrapped with wet jute hessian to maintain the moisture
level intact. The water was applied two times a day to maintain the wet condition of
jute hessians up to 14 days. The unretrofitted walls were plastered with mortar and the
surface was levelled with wooden Trowel as shown from Figure 3.18 to Figure 3.21.
3.3.3 Retrofitting work
The strengthening configurations consisted of rectangular wire mesh and mortar
application on both faces of the walls. Before laying out the bricks for retrofitted walls,
only one side of brick to be laid upon was drilled into two holes with the help of a
drilling machine. The plastic rawl plugs were inserted into those holes to fit 37 mm
long screws inside brick. As the screw enters the plug, the soft material of the plug
expands conforming tightly to the wall material. Such anchor enables steel screws to
fit into the holes without risking brittle materials like brick’s failure due to
hammering. The bricks were then laid out in a manner that every alternate layer of
bricks on each face of the wall consisted of pre-drilled holes filled up by rawl plugs.
A layer of Ferrocement Mortar was first placed upon the bricks. It was followed by
binding of wire mesh to the extended portion of each of the steel screws. The binding
must be strong enough to hold the wire mesh in its rightful position even against lateral
loading. Two separate wire nets were overlapped around mid-height on each face of

42
Figure 3.26 Application of Ferrocement
Mortar
Figure 3.27 Plastering & Surface
Levelling
Figure 3.28 Curing of Finished Wall Figure 3.29 Painted Walls
the walls to cover the entire wall. The minimum overlapping height was kept 150
mm.The remaining portion of the lamination was filled up by mortar in a way that
covers the entire wire mesh. 19 mm plaster thickness was ensured on both sides and
the outer surface was levelled by a wooden Trowel. The walls were left to cure for 28
days before testing and were white washed with non-latex paint to ease the
visualization of the developed cracks during tests. The construction sequences are
shown from Figure 3.22 to 3.32.
The next step was to construct base strengthened walls. For this purpose, both external

43
Figure 3.30 Arrangements of Rawl
Plugs
Figure 3.31 Wire Mesh Confinement
Figure 3.32: Base Retrofitted Wall
faces of base slab along the joint were completely wrapped with ferrocement of same
properties. The steel screws were used again to confine the wire meshes as shown in
Figure 3.31. The wrapping continued a minimum distance of 150 mm upward from
the top of RC base slab to ensure proper bonding. Finally, the samples were left to
cure for 28 days before testing as shown in Figure 3.32.
3.4 Experimental Set Up, Boundary Condition and Loading Scheme
The walls were tested up to failure under a combined constant vertical load and in-
plane cyclic lateral load, Figure 3.33 and 3.34 show the test setup of the walls. In this

44
respect, a single concentrated load was firstly distributed by a stiff steel distributor I-
beam laid on top of wall. The value of the vertical load to be applied was fixed from
the prism test result of the brick specimens. The prism test was carried out to
determine the specified compressive strength, fm′ , which in turn yields to the
allowable axial compression carrying capacity of the masonry wall according to the
formula set by BNBC 1993. Only 20% of the allowable load was used to vertically
load the specimens. This was necessary to ensure that specimens did not fail axially.
The lateral cyclic load was applied using a 112 KN Hydraulic horizontal Jack.
Loading and unloading was applied in 0.5 ton increments in the positive (rightward)
and negative (leftward) direction. A constant loading rate per cycle was maintained
until the specimens experienced significant loss of capacity. The base slab was fixed
to the reaction floor by strong plate and pre-tensile bolt (Ø25 mm) system to prevent
overturning of the base slab during test. In addition, few thickened steel plates were
placed horizontally at base level and reacting against two vertical steel reaction
columns on both ends to restrain the sliding of base slab during the test as shown in
Figure 3.33 and Figure 3.34
Figure 3.33 Schematic Diagram of Short Walls

45
Figure 3.34 Schematic Diagram of Long Walls
.

CHAPTER 4
TESTING PROCEDURE, RESULTS AND
DISCUSSION
4.1 Introduction
This chapter summarizes the qualitative and quantitative experimental results from
test specimen-1 to 10. The qualitative results include photographs of each specimen
through the course of testing and displaying the crack patterns. Load corresponding
to displacements were recorded for producing the quantitative results. They are
plotted in a graphical form to have a clear understanding of the scenario. Also, certain
parameters like energy dissipation, stiffness degradation, ductility and hysteretic
percentage of damping are also compared here on the basis of load deformation
response.
4.2 Testing Procedure and Instrumentation
After curing, the specimen was carried away to set into the Hydraulic Testing Machine
cautiously to elude any significant damages. The crane and the trolley were used to
carry with appropriate workman. When the specimen was set up then the loading
hydraulic jacks were anchored into position. A stiff steel distributor joist was laid in
the wall to distribute the vertical loads as uniformly as possible. One vertical jack was
used in case of ‘Short Walls’ and placed at middle of the wall over the steel joist. On
the other hand, two vertical Jacks were used for ‘Long Walls’ and set each at one
fourth of the length of the walls. Before applying the uniform dead load, two dial
gauges were set at each corner of the wall and readings were taken as reference points
to determine the horizontal top deflection throughout the loading regime. The dial
gauges were engaged with ‘L’ shaped thin steel plate attached to the out of plane
surface of the wall with super glue as shown in Figure 4.1 and 4.2. No Dial gauge was
set to measure the amount of compressive shortening after imposing uniform vertical
load on steel joist as vertical deflections were insignificant. To commence each test,
the vertical hydraulic jacks set at their fixed position over steel joist were first loaded
to a combined force of 6 tons (for Short Walls except SW-F-1/3) or 8 tons (for Long
walls). The test was loading controlled so that the horizontal hydraulic jacks were

47
responsible for imposing the cyclic loading to the specimen through complete cycles
of 2, 4, 6, 8, 10, 12 and 14 tons. All cycle consisted of first loading and unloading the
specimens toward the positive (rightward) direction hereafter referred to as the
negative (leftward) direction.
The allowable axial capacity of URM short and long wall was calculated as 14.9 ton
and 26.3 ton respectively according to BNBC provisions. The short and long walls
were imposed with only 40% and 30% of allowable axial capacity respectively
ensuring no axial compression failure. One limitation of the test was that the load was
directly applied to the brick rather than the steel joist as the joist slipped towards the
direction of loading when applied.
Figure 4.1 Dial Gauge-1 Figure 4.2 Dial Gauge-2
4.3 Failure Modes of URMs
Two groups of specimens tested exhibited two different failure modes throughout the
course of testing. Figure 4.3 and Figure 4.4 are the photographs of specimens
belonging to each group just prior to testing. All the short walls of both retrofitted and
unretrofitted specimens failed in rocking mode with first crack being observed at the
toothed interface between masonry panel and base slab. Although first crack appeared
in column joint with the base slab for almost all specimens, the long walls including
control exhibited different crack pattern in the end. All the specimens except one

48
(LW-F-1/8) failed in flexural compression mode by crushing of top corners at one of
the loaded sides.
4.4 Test Result of Specimen SW-C-2 (Control)
Figure 4.5 shows the failure and crack pattern for the un-retrofitted walls (SW-C-2).
The mode of failure may be characterized by rocking i.e. separation was observed at
the toothed interface between the base slab and the masonry panel. The test of
specimen SW-C-2 was associated with its first crack at negative first cycle loading
Figure 4.3 Initial State of Short Walls
Figure 4.4 Initial State of Long Walls

49
with 0.5 ton loads and corresponded to a horizontal displacement of 0.62 mm. The
wall failed at negative third cycle loading at right side with 4 ton loads to a
corresponding horizontal displacement of 5.95 mm.
Figure 4.5 Crack Pattern for SW-C-2 with Enlarged Rocking at Connection
4.5 Test Result of Specimen SW-F-1/8
Figure 4.6 shows the failure and crack pattern for the retrofitted wall (SW-F-1/8), the
failure was again due to rocking for the overturning of undamaged masonry panel
from its base slab. The test of specimen SW-F-1/8 was associated with its first crack
Figure 4.6 Crack Pattern for SW-F-1/8 with Enlarged Rocking at Connection

50
at negative 1st cycle loading at base slab-wall interface with 3 ton loads and
corresponded to a horizontal displacement of 1.6 mm. The wall failed at negative 3rd
cycle loading at right side with 4 ton loads to a corresponding horizontal displacement
of 8.78 mm. It can be clearly seen that the presence of the ferrocement layers (with
0.621% steel) wrapped in masonry panel had no effect in terms of capacity or failure
pattern. The failure occurred at same capacity and slightly increased ductility.
4.6 Test Result of Specimen SW-F-1/3
Figure 4.7 shows the failure and crack pattern for the retrofitted wall (SW-F-1/3), the
failure was again because of overturning of undamaged masonry panel from its base
slab. The test of specimen SW-F-1/3 was associated with its first crack at negative 1st
Figure 4.7 Crack Pattern for SW-F-1/3 with Enlarged Rocking at Connection
cycle loading at base slab-wall interface with 2 ton loads and corresponded to a
horizontal displacement of 1.17 mm. The wall failed at positive 2nd cycle loading at
right side with 3 ton loads to a corresponding horizontal displacement of 9.8 mm. It
can be clearly seen that the capacity of the wall is found less than that of SW-F-1/8.
This is because the specimen was subjected to only 3 ton vertical loads, whereas all
the other specimens of short wall group was tested with 6 ton loads, resulting in lower
lateral resistance corresponding to control. This specimen is discarded from the final
conclusions made in the later chapters.

51
Figure 4.8 Crack Pattern for SW-BWF-1/8 with Enlarged Rocking at
Connection
4.7 Test Result of Specimen SW-BWF-1/3
SW-BWF-1/3 specimen has additional ferrocement overlay wrapping the base slab
and wall joint interface of an already laminated masonry wall panel. The specimen
SW-BWF-1/3 showed no visual crack up to 10 ton loads but had a huge deformation
(4.93 mm) even before the start of 2nd cycle. That suggests the base slab-wall joint
interface wrapping was not bonded well enough with previously laminated
ferrocement layer. Thus the specimen behaved in a way similar to specimens with
mere lamination on wall panel and failed long before the visual crack appeared. This
specimen is also discarded from the final conclusions made in the later chapters.
4.8 Test Result of Specimen SW-BWF-1/8
Figure 4.8 shows the failure and crack pattern for the retrofitted wall (SW-BWF-1/8).
It is worth noting that despite the wall slab interface being strengthened with
additional ferrocement layer, the specimen tested exhibited similar failure pattern, of
course with increased capacity and ductility. First crack generated at positive 2nd cycle
loading at the top left corner with 4 ton loads corresponding to a horizontal
displacement of 2.11 mm. The wall failed at positive 4th cycle loading at left side with
8 ton loads to a corresponding horizontal displacement of 15.37 mm.

52
Figure 4.9 First Crack Pattern of
LW- C-1 (Control)
Figure 4.10 Failure Pattern of LW-C-
1 (Control)
Figure 4.11 Flexural Compression Mode with Enlarged View
4.9 Test Result of Specimen LW-C-1 (Control)
Figures from 4.9 to 4.11 show the crack and failure pattern for the un-retrofitted Long
Wall (LW-C-1). The mode of failure may be characterized by flexural compression
mode for the top corner crushing of one of the loaded sides of the wall due to
compression. First crack generated at base slab wall interface at negative 2nd cycle
loading with 3 ton loads and corresponded to a horizontal displacement of 0.38 mm.
It was found that first crack in the wall appeared at the wall-base slab connection. The
wall followed a different failure path in which it failed at positive 8th cycle loading at
right side with 7.5 ton loads corresponding to a horizontal displacement of 4.35 mm.

53
It is worth mentioning that the wall before failure took 9 ton loads in its 7th cycle
which is an indicator of its ultimate condition.
Figure 4.12 First Crack Pattern of
LW-F-1/3
Figure 4.13 Failure Pattern of LW-F-
1/3
Figure 4.14 Flexural Compression Mode with Enlarged View
4.10 Test Result of Specimen LW-F-1/3
The failure pattern of ferrrocement strengthened wall with 8.5 mm X 8.5 mm wire
mesh opening size may be characterized by flexural compression mode similar to that
of control, as shown in Figure 4.12-4.14. The presence of ferrocement layer prevented
the diagonal shear cracks in walls, later at higher levels of lateral loads the failure was
due to sudden crushing of corners. First crack generated at the wall-base slab

54
connection at positive 3rd cycle loading with 6 ton loads corresponding to a horizontal
displacement of 0.76 mm. The wall, however, followed a different failure mode in the
end in which it failed by corner crushing at positive 7th cycle loading with 12 ton
loads corresponding to a horizontal displacement of 3.35 mm.
Figure 4.15 Crack Pattern for LW-F-1/8 with Enlarged Rocking at
Connection
4.11 Test Result of Specimen LW-F-1/8
The failure pattern of ferrocement retrofitted wall with a smaller opening size of steel
wire mesh may be characterized by rocking mode as the undamaged masonry panel
was separated by overturning from the weakened mortar connection at the base, as
shown in Figure 4.15. First crack generated in the form of minor flexural cracks at
positive 2nd cycle loading with 9 ton loads and corresponded to a horizontal
displacement of 7.53 mm. The wall failed at positive 8th cycle loading at left side with
16 ton load corresponding to a horizontal displacement of 17.49 mm. It is worth noting
that the unusually large deformation compared to other walls of similar kind was due
to the fact that the base slab was not properly fixed in that case resulting in uplifting
of the base from the steel reaction platform underneath. The behaviour of this wall
was also excluded from the final result and conclusions made in the later chapter.
4.12 Test Result of Specimen LW-BWF-1/3
The complete coverage of ferrocement including base slab having 8.5 mm X 8.5 mm

55
Figure 4.16 First Crack Pattern of
LW-BWF-1/3
Figure 4.17 Failure Pattern of LW-
BWF-1/3
Figure 4.18 Flexural Compression Mode with Enlarged View
opening size of wire mesh inside resulted in an increased capacity as well as ductility,
compared to walls discussed so far. First crack in the form of a minor flexural crack
was observed at positive side (leftward) 5th cycle loading with 12 ton loads
corresponding to a horizontal displacement of 2.86 mm. The wall failed at 6th cycle
loading from rightward direction with 14.5 ton loads corresponding to a horizontal
displacement of 5 mm at right. The failure mode of the retrofitted wall (LW-BWF-
1/8) was similar to specimen (LW-F-1/3) characterized by the flexural compression
mode. It is worth mentioning that no crack appeared on the wall base slab interface

56
which seemed to be the weakest plane for the most of the walls. Figures from 4.16 to
4.18 show the formation of crack and failure pattern of LW-BWF-1/3 specimen.
4.13 Test Result of Specimen LW-BWF-1/8
The complete coverage of ferrocement including base slab having 8.5 X 8.5 mm
opening size of wire mesh resulted in an increased lateral load capacity and ductility.
It is worth noting that despite strengthening of base the first crack appeared to form
in the base slab–wall connecting interface as shown in Figure 4.19. First crack was
Figure 4.19 First Crack Pattern of
LW-BWF-1/8
Figure 4.20 Failure Pattern of LW-
BWF-1/8
Figure 4.21 Flexural Compression Mode with Enlarged View

57
observed at positive side (leftward) 5th cycle loading with 12 ton loads corresponding
to a horizontal displacement of 1.85 mm. The wall failed at 6th cycle loading from in
the base slab–wall connecting interface as shown in Figure 4.19. First crack was
observed at positive side (leftward) 5th cycle loading with 12 ton loads corresponding
to a horizontal displacement of 1.85 mm. The wall failed at 6th cycle loading from
leftward direction with 17 ton loads corresponding to a horizontal diaplacement of
4.39 mm. The failure mode of the retrofitted wall (LW-BWF-1/8) was similar to
specimen (LW-F-1/3) as shown in figures from 4.19 to 4.21. It can be pointed out that
the failure occurred at slightly increased capacity and ductility in case of LW-BWF-
1/8.
4.14 Load Deformation Response
Short Walls SW-F-1/8 were retrofitted using one layers of ferrocement on both sides
ofas opposed to 4 tons for the reference un-retrofitted wall (SW-C-2). It can be clearly
seen that mere lamination on wall panel had no effect in improving wall’s lateral load
capacity. On the other hand, SW-BWF-1/8 was retrofitted using ferrocement
lamination on both sides with full coverage including base slab-wall connection. The
wall’s ultimate load was 8 tons as opposed to 4 tons for the reference unretrofitted
wall (SW-C-2) corresponding to about 100% increase in the lateral load resistance of
the wall. SW-BWF-1/3, although retrofitted, failing at a lower load than expected may
be accountable to the improper bonding during construction between two successive
layers of ferrocement. Figures from 4.22 to 4.26 show the hysteretic curves for all the
specimens belonging to “Short Wall” category.
Long Walls LW-F-1/3 were retrofitted using one layers of ferrocement on both sides
of the wall excluding the wall-base slab connection. The wall’s ultimate load was 12
tons respectively as opposed to 9 tons for the reference un-retrofitted wall (LW-C-1).
This is corresponding to about 33% increase in the lateral load resistance of the wall.
On the other hand, long walls LW-BWF-1/8 and LW-BWF-1/3 were retrofitted using
Ferrocement lamination on both sides with full coverage including base slab-wall
connection for two different arrangements of wire mesh. The walls’ ultimate loads
were 17 tons and 16 tons as opposed to 9 tons for the reference un-retrofitted wall

58
(SW-C-2) corresponding to about 89% and 78% increases respectively in the lateral
load resistance of the wall. It can be seen from Figure 4.27 to 4.31 that the hysteretic
curves for all the specimens belonging to “Long Wall” category. Envelope curve for
Short and Long Walls are shown in Figure 4.32 and 4.33.
It can be seen from Figure 4.22 to 4.31 that specimen failure in almost all cases was
accompanied by quick horizontal displacements. A summary of the results in terms
of first crack and specimen failure crack at every specimen are given in Table 4.1. The
information in the table is alternatively represented by bar charts shown in Figure 4.35
to 4.38 for better understanding of the scenario. It is clear from the figures that the
first crack in walls was revealed at non-retrofitted specimen with minimum horizontal
displacement and horizontal force than retrofitted specimens of both aspect ratios. The
base slab-wall interface strengthened wall performed better than the others in terms
of first crack appearance and specimen failure.
Figure 4.24, 4.27 and 4.30 show the load deformation responses of SW-F-1/3, SW-
BWF-1/3 and LW-BWF-1/8 respectively. The responses of this specimen, as it is
explained earlier, was erroneous and hence will be discarded for all future analysis.
Figure 4.22 Load Vs Lateral Deformation Response of Specimen SW-C-2
(Control)
-5
-4
-3
-2
-1
0
1
2
3
4
5
-8 -6 -4 -2 0 2 4 6 8
Top Displacement (mm)
Cycl
ic L
oad
(T
on)

59
Figure 4.23 Load Vs Lateral Deformation Response of Specimen SW-F-1/3
Figure 4.24 Load Vs Lateral Deformation Response of Specimen SW-F-1/8
-5
-4
-3
-2
-1
0
1
2
3
4
5
-10 -8 -6 -4 -2 0 2 4 6
Cycl
ic L
oad
(T
on)
Top Displacement (mm)
-3
-2
-1
0
1
2
3
4
-2 0 2 4 6 8 10 12
Cycl
ic L
oad
(T
on)
Top Displacement (mm)

60
Figure 4.25 Load Vs Lateral Deformation Response of Specimen SW-BWF-1/8
Figure 4.26 Load Vs Lateral Deformation Response of Specimen SW-BWF-1/3
-8
-6
-4
-2
0
2
4
6
8
10
-10 -5 0 5 10 15 20
Top Displacement (mm)
Cycl
ic L
oad
(T
on)
-3
-2
-1
0
1
2
3
4
5
-4 -2 0 2 4 6
Top Displacement (mm)
Cycl
ic L
oad
(T
on)

61
Figure 4.27 Load Vs Lateral Deformation Response of Specimen LW-C-1
(Control)
Figure 4.28 Load Vs Lateral Deformation Response of Specimen LW-F-1/3
-10
-8
-6
-4
-2
0
2
4
6
8
10
-5 -4 -3 -2 -1 0 1 2 3
Cycl
icL
oad
(T
on)
-15
-10
-5
0
5
10
15
-4 -3 -2 -1 0 1 2 3 4
Top Displacement (mm)
Cycl
icL
oad
(Ton)
Top Displacement (mm)

62
Figure 4.29 Load Vs Lateral Deformation Response of Specimen LW-F-1/8
Figure 4.30 Load Vs Lateral Deformation Response of Specimen LW-BWF-1/3
-15
-10
-5
0
5
10
15
20
-5 0 5 10 15 20
Top Displacement (mm)
Cycl
ic L
oad
(T
on)
-20
-15
-10
-5
0
5
10
15
20
-6 -4 -2 0 2 4
Cycl
ic L
oad
(T
on)
Top Displacement (mm)

63
Figure 4.31 Load Vs Lateral Deformation Response of Specimen LW-BWF-1/8
Figure 4.32 Envelope Curves for Short Walls
-15
-10
-5
0
5
10
15
20
-3 -2 -1 0 1 2 3 4 5
Cycl
ic L
oad
(T
on)
Top Displacement (mm)
-8
-6
-4
-2
0
2
4
6
8
10
-10 -5 0 5 10 15 20
SW-C-2 (Control)
SW-F-1/8
SW-BWF-1/8
Top Displacement (mm)
Cycl
ic L
oad
(T
on)

64
Figure 4.33 Envelope Curves for Long Walls
In analysing failure pattern of wall specimen, URM of control specimen failed with
minimum horizontal and vertical displacement than retrofitted specimen. The results
showed similar pattern in which base slab-wall strengthened specimen failed with
maximum horizontal deformation and lateral resistance than control and merely wall
panel strengthened specimens. Mere lamination on short wall panels proved to be
ineffective as no additional resistance was achieved. The same is not true for Long
Walls as the wire meshes were activated enough to add to the lateral resistance.
Table 4.1 Summary Results of Ten Specimens
-15
-10
-5
0
5
10
15
20
-6 -4 -2 0 2 4 6
LW-C-1
LW-F-1/3
LW-BWF-1/3
LW-BWF-1/8
Top Displacement (mm)
Cycl
ic L
oad
(T
on)
Pheno
mena
Wall ID Cycle
Vertical
Force
(Ton)
Horizontal
Displace
ment
(mm)
Horizont
al Force
(Ton)
Com
ment
First
Crack
SW-C-2
(Control)
Rightward 1st
Cycle
(Unloading)
6 0.62 0.5
SW-F-
1/8
Rightward 1st
Cycle
(Loading)
6 1.6 3
[Table continued to next page]

65
[Table continued from previous page]
Pheno
mena
Wall ID Cycle
Vertical
Force
(Ton)
Horizontal
Displace
ment
(mm)
Horizont
al Force
(Ton)
Com
ment
First
Crack
SW-
BWF-1/8
Leftward 2nd
Cycle
(Loading)
6 2.11 4
SW-F-
1/3
Rightward 1st
Cycle
(Loading)
3 1.17 2
Error
SW-
BWF-1/3 - 6 - -
Error
LW-C-1
(Control)
Rightward 2nd
Cycle
(Loading)
8 0.38 3
LW-F-
1/3
Leftward 3rd
Cycle
(Loading)
8 0.76 6
LW-F-
1/8
Leftward 8th
Cycle
(Loading)
8 7.53 9
LW-
BWF-1/8
Leftward 5th
Cycle
(Loading)
8 1.85 12 Error
LW-
BWF-1/3
Leftward 5th
Cycle
(Loading)
8 2.86 12
Failure
Crack
SW-C-2
(Control)
Rightward 3rd
Cycle
(Loading)
6 5.95 4
SW-F-
1/8
Rightward 3rd
Cycle
(Loading)
6 8.78 4
SW-
BWF-1/8
Leftward 4th
Cycle
(Loading)
6 15.37 8
SW-F-
1/3
Leftward 2nd
Cycle
(Loading)
3 9.8 3
Error
SW-
BWF-1/3 - 6 - - Error
LW-C-1
(Control)
Rightward 7th
Cycle
(Loading)
8 4.35 7.5
[Table continued to next page]

66
Figure 4.34 Summary Results of First Crack in Short Wall Assemblies
Figure 4.35 Summary Results of First Crack in Long Wall Assemblies
0
0.5
1
1.5
2
2.5
3
3.5
4
4.5
Horizontal Displacement
(mm)
Horizontal Force (Ton)
SW-C-2 (Control)
SW-F-1/8
SW-BWF-1/8
0
2
4
6
8
10
12
14
Horizontal Displacement
(mm)
Horizontal Force (Ton)
LW-C-1 (Control)
LW-F-1/3
LW-BWF-1/8
LW-BWF-1/3
[Table continued from previous page]
Pheno
mena
Wall ID Cycle
Vertical
Force
(Ton)
Horizontal
Displace
ment
(mm)
Horizont
al Force
(Ton)
Com
ment
Failure
Crack
LW-F-
1/3
Leftward 7th
Cycle
(Loading)
8 3.35 12
LW-F-
1/8
Leftward 8th
Cycle
(Loading)
8 17.49 16
Error
LW-
BWF-1/8
Leftward 6th
Cycle
(Loading)
8 4.39 17
LW-
BWF-1/3
Rightward 6th
Cycle
(Loading)
8 5 14.5

67
Figure 4.36 Summary Results of Specimen Failure for Short Wall Assemblies
Figure 4.37 Summary Results of Specimen Failure for Long Wall Assemblies
Table 4.2 Summary of Maximum Horizontal Displacement Corresponding to
Each Cycle
Specimen
Name
Cycle
No.
Positive
Maximum
Horizontal
Displacement
(mm)
Correspo
nding
Load
(Ton)
Negative
Maximum
Horizontal
Displacement
(mm)
Correspond
ing Load
(Ton)
SW-C-2
(Control)
I 1.34 2 -1.47 -2
II 3.46 3 -2.62 -3
III 6.24 4 -5.95 -4
SW-F-1/8
I 0.85 2 -0.48 -2
II 1.6 3 -1.85 -3
III 4.76 4 -8.78 -4
SW-F-1/3 I 2.47 2 -1.17 -2
[Table continued to next page]
0
2
4
6
8
10
12
14
16
18
Horizontal Displacement
(mm)
Horizontal Force (Ton)
SW-C-2 (Control)
SW-F-1/8
SW-BWF-1/8
0
2
4
6
8
10
12
14
16
18
Horizontal Displacement
(mm)
Horizontal Force (Ton)
LW-C-1
LW-BWF-1/8
LW-F-1/3
LW-BWF-1/3

68
[Table continued from previous page]
Specimen
Name
Cycle
No.
Positive
Maximum
Horizontal
Displacement
(mm)
Correspo
nding
Load
(Ton)
Negative
Maximum
Horizontal
Displacement
(mm)
Correspond
ing Load
(Ton)
SW-F-1/3 II 9.8 3 - -
SW-BWF-
1/8
I 0.57 2 -0.5 -2
II 2.11 4 -2.2 -4
III 3.28 6 -4.56 -6
IV 15.37 8 - -
LW-C-1
(Control)
I 0.2 2 -0.11 -2
II 0.38 3 -0.24 -3
III 0.54 4 -0.77 -4
IV 0.66 5 -1.19 -5
V 1.3 7 -1.78 -7
VI 2.2 9 -3.28 -9
VII - - -4.35 -7.5
LW-F-1/3
I 0.09 2 -0.1 -2
II 0.47 4 -0.3 -4
LW-F-1/3
III 0.76 6 -0.5 -6
IV 1.11 8 -0.9 -8
V 1.5 10 -1.4 -10
VI 2.19 12 -2.92 -12
VII 3.35 12 - -
LW-
BWF-1/3
I 0.58 4 -0.5 -4
II 1.05 6 -0.98 -6
III 1.52 8 -1.79 -8
IV 2.42 10 -2.38 -10
V 2.86 12 -3.86 -12
VI 3.4 16 -5 -14.5
LW-
BWF-1/8
I 0.4 4 -0.28 -4
II 0.64 6 -0.41 -6
III 0.93 8 -0.63 -8
IV 1.42 10 -0.81 -10
V 1.85 12 -1.95 -12
VI 4.39 17 - -

69
Figure 4.38 Maximum Load with Corresponding Cycle for Short Wall
Assemblies
Figure 4.39 Maximum Load with Corresponding Cycle for Long Wall
Assemblies
0
2
4
6
8
10
12
14
16
18
20
Cycle I
Cycle II
Cycle III
Cycle IV
Cycle V
Cycle VI
Cycle VII
LW-C-1(Control) LW-F-1/3 LW-BWF-1/3 LW-BWF-1/8
Load
, T
on
0
1
2
3
4
5
6
7
8
9
Cycle I
Cycle II
Cycle III
Cycle IV
SW-C-2(Control) SW-BWF-1/8SW-F-1/8
Load
, T
on

70
4.15 Energy Dissipation
Energy dissipation, Ed, through hysteresis damping is an important aspect in seismic
design response, Ed, has been represented, as suggested by Hose and Seible (1999),
by area enclosed within the force vs displacement curve at each displacement level.
This is the horizontally-hatched area shown in Figure 2.7. The vertically-hatched
region in the same figure represents the elastic strain energy, Es, stored in an
equivalent linear elastic system.
The average cumulative energy dissipation at different displacement levels of short
wall assemblies were presented in Figure 4.40. The figure showed that, the wall- base
slab connection retrofitted assembly SW-BWF-1/8 achieved maximum improvement
in total energy dissipation (about 3.9 times corresponding to the control SW-C-2). The
cumulative energy per cycle was also shown in Figure 4.42 and as expected SW-
BWF-1/8 showed maximum cumulative energy dissipation among three specimens
tested. It is worth mentioning that the walls without base slab wrapping (SW-F-1/8)
performed very poorly against lateral load by showing only a slight improvement
(34%) in energy dissipation with respect to control.
Figure 4.40 Cumulative Energy Dissipation for Short Wall Assemblies
0
10
20
30
40
50
60
70
0 5 10 15 20
SW-C-2
SW-F-1/8
SW-BWF-1/8
Top Displacement (mm)
Cum
ula
tive
Ener
gy D
issi
pat
ion (
Ton
-mm
)

71
Figure 4.41 Cumulative Energy Dissipation for Long Wall Assemblies
Figure 4.42 Cumulative Energy Dissipation per Cycle for Short Walls
0
10
20
30
40
50
60
70
80
90
Cycle
1
Cycle
2
Cycle
3
Cycle
1
Cycle
2
Cycle
3
Cycle
1
Cycle
2
Cycle
3
Cycle
4 (1/2)
SW-C-2
(control)
SW-F-1/8 SW-BWF-1/8
Load
, T
on
0
10
20
30
40
50
60
0 1 2 3 4 5
LW-C-1
LW-F-1/3
LW-BWF-1/3
LW-BWF-1/8
Top Displacement (mm)
Cum
ula
tive
Ener
gy D
issi
pat
ion (
Ton
-mm
)

72
Figure 4.43 Cumulative Energy Dissipation per Cycle for Long Walls
The cumulative energy dissipation at different displacement levels of long wall
assemblies were presented in Figure 4.41. The figure showed that, an improvement in
total energy dissipation of about 81% and 68% have been achieved for the wall-base
slab connection retrofitted assembly LW-BWF-1/3 and LW-BWF-1/8 respectively,
corresponding to the control assembly LW-C-1. On the other hand, wall panel
retrofitted assembly LW-F-1/3 shows an improvement of total energy dissipation of
about 35.5%. Figure 4.43 shows the cumulative energy dissipation per cycle of long
wall specimens.
4.16 Hysteresis Percentage Damping The hysteretic damping plotted against lateral top displacement for Long Walls are
shown in Figure 4.44. For the long walls, the hysteretic damping ranges from 7% to
16% and the largest percentage belonged to the wall assembly LW-F-1/3 ranging from
7% to 16%. On the other hand, hysteretic damping for short walls ranges from 7% to
22%.
4.17 Stiffness Degradation To assess the variation in wall stiffness with increased loading and top displacement,
0
20
40
60
80
100
120
Cycl
e 1
Cycl
e 2
Cycl
e 3
Cycl
e 4
Cycl
e 5
Cycl
e 6
Cycl
e 7
(1/2
)
Cycl
e 1
Cycl
e 2
Cycl
e 3
Cycl
e 4
Cycl
e 5
Cycl
e 6
Cycl
e 7
(1/2
)
Cycl
e 1
Cycl
e 2
Cycl
e 3
Cycl
e 4
Cycl
e 5
Cycl
e 6
(1/2
)
Cycl
e 1
Cycl
e 2
Cycl
e 3
Cycl
e 4
Cycl
e 5
Cycl
e 6
LW-C-1
(Control)
LW-F-1/3 LW-BWF-1/8 LW-BWF-1/3
Cum
ula
tive
Ener
gy (
Ton
-mm
)

73
Figure 4.44 Hysteresis Damping Percentages for Long Wall Assemblies
the secant stiffness, defined as the ratio between the lateral resistance and the
corresponding top lateral wall displacement, was used. The cycle stiffness of the
specimen at a certain displacement level was considered as the average of stiffness in
the positive and negative loading directions (El-Diasity et al., 2015). Figure 4.47 and
4.48 show the stiffness per cycle in the form of bar charts for Short and Long Walls,
respectively. The maximum lateral load for each cycle is shown in parentheses. It can
be seen that walls were subjected to loading cycles with varying maximum load.
Therefore, stiffness of the walls cannot be compared with this chart. These charts were
plotted only to show the degrading stiffness of the wall samples with each passing
cycle.
Figure 4.45 and 4.46 illustrate the stiffness degradation curves with respect to
displacement for both short wall and long wall assemblies respectively. The trends of
secant stiffness degradation for all walls were approximately similar and showed
significant decreases with increased top displacement. The specimen SW-BWF-1/8
among the short walls and LW-BWF-1/8 among the long walls maintained higher
stiffness throughout the course of the test up to failure. Moreover, LW-F-1/3 had
higher stiffness initially than LW-BWF-1/3 although the later had the higher capacity.
0
2
4
6
8
10
12
14
16
18
0 1 2 3 4 5
LW-C-1
LW-F-1/3
LW-BWF-1/3
LW-BWF-1/8
Top Displacement (mm)
Hyst
eres
is D
ampin
g %

74
The envelope curve for long walls in Figure 4.42 also showed the same trend.
Figure 4.45 Stiffness Degradation per Cycle for Short Wall Assemblies
Figure 4.46 Stiffness Degradation per Cycle for Long Wall Assemblies
0
0.5
1
1.5
2
2.5
3
3.5
4
Cycle 1
(2 Ton)
Cycle 2
(3 Ton)
Cycle 3
(4 Ton)
Cycle 1
(2 Ton)
Cycle 2
(3 Ton)
Cycle 3
(4 Ton)
Cycle 1
(2 Ton)
Cycle 2
(4 Ton)
Cycle 3
(6 Ton)
SW-C-2
(Control)
SW-F-1/8 SW-BWF-1/8
Sti
ffnes
s(T
on/m
m)
0
5
10
15
20
25
Cycl
e 1
(2 T
on)
Cycl
e 2
(3 T
on)
Cycl
e 3
(4 T
on)
Cycl
e 4
(5 T
on)
Cycl
e 5
(7 T
on)
Cycl
e 6
(9 T
on)
Cycl
e 1
(2 T
on)
Cycl
e 2
(4 T
on)
Cycl
e 3
(6 T
on)
Cycl
e 4
(8 T
on)
Cycl
e 5
(10
Ton
)
Cycl
e 6
(12
Ton
)
Cycl
e 1
(4 T
on)
Cycl
e 2
(6 T
on)
Cycl
e 3
(8 T
on)
Cycl
e 4
(10
Ton
)
Cycl
e 5
(12
Ton
)
Cycl
e 1
(4 T
on)
Cycl
e 2
(6 T
on)
Cycl
e 3
(8 T
on)
Cycl
e 4
(10
Ton
)
Cycl
e 5
(12
Ton
)
Cycl
e 6
(16
Ton
)
LW-C-1
(Control)
LW-F-1/3 LW-BWF-1/8 LW-BWF-1/3
Sti
ffnes
s (T
on/m
m)

75
Figure 4.47 Stiffness Degradation for Short Wall Assemblies
Figure 4.48 Stiffness Degradation for Long Wall Assemblies
0
0.5
1
1.5
2
2.5
3
3.5
4
0 5 10 15 20
SW-C-2
SW-F-1/8
SW-BWF-1/8
Top Displacement
Sti
ffnes
s (T
on/m
m)
0
5
10
15
20
25
0 1 2 3 4 5
LW-C-1(Control)
LW-F-1/3
LW-BWF-1/3
LW-BWF-1/8
Top Displacement (mm)
Sti
ffnes
s(T
on/m
m)

76
4.18 Comparison of Experimental and Theoretical Lateral Load Capacity
Bangladesh National Building Code 1993 (BNBC 93) suggested allowable lateral
load capacity of the URM walls. The experimental ultimate loads were compared with
these allowable load capacities of URM walls as per BNBC shown in Figure 4.49. It
can be clearly seen that the experimental ultimate loads are about 4 and 5.5 times
higher than code provisions for unretrofitted short and long walls, respectively. Figure
4.49 also depicts the change in behaviour of masonry walls with varying aspect ratio.
Additionally, experimental lateral resistance of unreinforced walls increased
approximately 2.25 times as the aspect ratio changed from 1 to 0.57.
Figure 4.49 Comparison of Experimental Lateral Load Capacity with Code
Provision
4.19 Comparison of Lateral Load Capacity with Percentage of Steel
The ultimate load for two different opening sizes of wire meshes inside ferrocement
section is compared along with their relative deformations. The result is represented
by means of bar chart as shown in Figure 4.50. The result shows that ferrocement
retrofitted wall having wire mesh with 3.2 X 3.2 mm opening size i.e. LW-BWF-1/8
had about 6% and 29% increase in lateral load capacity and displacement with respect
to the one with 8.5 X 8.5 mm opening size i.e. LW-BWF-1/3. In other words,
specimen with 0.612% of steel inside ferrocement overlay showed increased lateral
0.945
1.67
4
9
0
1
2
3
4
5
6
7
8
9
10
Short Wall
(Aspect Ratio=1)
Long Wall
(Aspect Ratio=0.57)
BNBC Allowable
Load (Ton)
Experimental
Ultimate
Load (Ton)
Load
(T
on)

77
load capacity and displacement than the one with 1.023% of steel. This may be
because specimen with lower percentage of steel by volume contained wire mesh with
relatively smaller spacing and thus, when activated, they arrested crack propagation
inside the mortar more often than the other specimen and behaved in a more ductile
manner.
Figure 4.50 Comparison of Lateral Load Capacity and Deformation with % of
Steel
17
4.39
16
3.4
0
2
4
6
8
10
12
14
16
18
Ultimate Load
(Ton)
Displacement
(mm)
LW-BWF-1/8
0.612 % of Steel
LW-BWF-1/3
1.023% of steel

78
CHAPTER 5
CONCLUSIONS AND SUGGESTIONS
5.1 Introduction
The study conducted herein focuses on strengthening unreinforced masonry walls
using ferrocement laminates for safety reasons. Ten walls with scale of 0.5 were built,
using full scale brick clay units, consisting of a clay masonry panel and a base slab,
were tested against lateral cyclic loading with loading control protocol up to failure.
A constant vertical load was maintained throughout the course of the test. Wall panels
had two groups, namely, five walls with aspect ratio 0.57 belonging to Long Wall
category and the rest with aspect ratio 1 belonging to Short Wall category. Two types
of parameter were considered: ferrocement configuration and wire mesh opening size
inside ferrocement overlay. Both the long walls and short walls were investigated for
two different retrofitting configurations, namely full coverage with base slab-wall
panel joint lamination and only wall panel lamination. Two different wire mesh steel
having opening sizes 3.2 X 3.6 mm and 8.5 X 8.5 mm were considered for each type
of ferrocement encasement. During testing two dial gauges were used to determine
the lateral deflections of URM walls. They were installed at the left and right side of
the top of the wall panel. From these tests the displacement corresponding to each
cyclic load was recorded. With this recorded data, load displacement response curves
were prepared to compare the results of test specimens of different groups.
5.2 Conclusions
This paper presents results of cyclic loading tests investigating the in-plane behaviour
of unreinforced masonry walls retrofitted by ferrocement. Key research findings may
be summarized as follows:
i. All short walls showed rocking mode of failure pattern. It is worth mentioning that
short walls with mere ferrocement lamination with 3.2 X 3.2 mm opening of wire
mesh inside gained no additional lateral load resistance than the control. On the
other hand, complete ferrocement encasement including base slab-wall
connection with similar wire mesh arrangement doubled the lateral resistance of

79
short wall with respect to the control. Also, ferrocement overlay helped the
retrofitted URM short walls to fail in a ductile manner.
ii. Test results indicated that mere lamination on long wall panels having 3.2 X 3.6
mm wire mesh opening showed about 33% increase in lateral load capacity.
Strengthening long wall panels by complete ferrocement coverage having wire
mesh with opening size 8.5 X 8.5 mm and 3.2 X 3.6 mm showed about 78% and
89% increase in lateral load capacity respectively, compared to the control.
iii. Unlike Short Wall, none of the long walls exhibited rocking failure pattern. The
fully wrapped ferrocement laminated long wall specimens exhibited no crack
generation at the base and failure mode converted to flexural compression mode
(i.e. corner crushing). Mere ferrocement lamination on masonry panels, however,
revealed some arbitrary first crack at the base slab-wall connection but ultimately
failed in a similar way (i.e. corner crushing).
iv. The strengthening also improves the total energy dissipation by a factor ranging
from 35.5 % to 81% for long walls. The energy dissipation is almost 1.3 and 3.9
times higher than that of control for short walls having mere wall panel lamination
and complete wall-base slab lamination, respectively.
v. Fully ferrocement encased walls having wire mesh with 3.2 X 3.2 mm opening
size showed the highest increase in terms of stiffness for both long and short walls.
vi. The hysteretic damping ranges from 7% to 16% for long walls and 7% to 22% for
short walls.
vii. Fully ferrocement covered retrofitted wall having wire mesh with 3.2 X 3.2 mm
opening size had about 6% and 29% increase in lateral load capacity and
displacement with respect to the one having wire mesh with 8.5 X 8.5 mm opening
size. This may be because wire mesh containing smaller openings had better crack
arresting mechanism.
viii. The experimental lateral load capacity of unretrofitted URM walls are almost 4 to
5.5 times higher than allowable lateral load provisions of BNBC 1993.

80
5.3 Suggestions
This research suggests many recommendations for further investigation.
i. Further studies could be carried out with finite element modelling that simulates
the behaviour of in-plane strengthened masonry walls. This can give impetus to
the practical use of the strengthening systems.
ii. More variables (ferrocement thickness, precompression load, strength of mortar
etc.) and more specimens should be considered to investigate the effect on
improving lateral load capacity.
iii. A full scale model may be investigated to get effects of ferrocement retrofitting
on lateral load capacity against seismic loading more precisely.
iv. Various wire meshes with different volume fraction of steel may be considered to
investigate the effect on lateral resistance and ductility.
v. The scope of the study is limited to the investigation of solid URM wall itself.
Further studies should be extended to walls with opening to assess more practical
application of ferrocement lamination.

REFERENCES
Abrams, D. P. (1992). “Strength and Behaviour of Un-reinforced Masonry Elements,”
10th World Conference on Earthquake Engineering, Balkema, Rotterdam, pp. 3475-
3480.
Alam, M.S., and Amanat, K.M. (2004) “FE Modeling Scheme to Simulate the
Retrofitting Effect of Masonry Infill with Ferrocement Overlay,” Proceedings of the
2nd International Conference on Protection of Structures against Hazards, Singapore,
pp. 297-301.
Alcocer, S. M., Ruiz, J., Pineda, J. A. and Zepeda, J. A. (1996). “Retrofitting of
Confined Masonry Walls with Welded Wire Mesh,” Proceedings of the Eleventh
World Conference on Earthquake Engineering, Acapulco, Mexico, Paper no. 1471.
Amanat, K.M., Alam, M.M.M. and Alam, M.S. (2007). “Experimental Investigation
of the Use of Ferrocement Laminates for Repairing Masonry In-filled RC Frames,”
Journal of Civil Engineering (IEB), Issue 2, Vol. 35, pp. 71-80.
Ashraf, M., Khan, A.N., Naseer, A., Ali Q. and Alam, B. (2011) “Seismic Behavior
of Unreinforced and Confined Brick Masonry Walls before and after Ferrocement
Overlay Retrofitting,” International Journal of Architectural Heritage Conservation,
Analysis, and Restoration, Issue 6, Vol. 6, pp. 665-688.
American Society for Testing and Materials, ASTM C109. “Standard Test Method
for Compressive Strength of Hydraulic Cement Mortars,” Annual Book of ASTM
Standards, Vol. 04.01, West Conshohocken, Pennsylvania.
American Society for Testing and Materials, ASTM E447-92b. “Standard Test
Methods for Compressive Strength of Masonry Prisms,” Annual Book of ASTM
Standards, Vol. 04.05, West Conshohocken, Pennsylvania.
Bangladesh National Building Code, BNBC 1993. Part 6 Chapter 4, “Masonry
Structures,” Housing and Building Research Institute and Bangladesh Standard and

82
Testing Institute, Bangladesh.
ElGawady, M.A., Lestuzzi, P. and Badoux, M. (2007) “Static Cyclic Response of
Masonry Walls Retrofitted with Fiber-Reinforced Polymers,” Journal of Composites
for Construction, Vol. 11, pp. 50-61.
ElGawady, M.A., Lestuzzi, P. and Badoux, M. (2006) “Retrofitting of Masonry Walls
Using Shotcrete,” Proceedings of NZSEE Conference available at
www.nzsee.org.nz/db/2006/Paper45.pdf
ElGawady, M.A., Lestuzzi, P. and Badoux, M. (2002) “Dynamic In-Plane Behaviour
of URM Wall Upgraded with Composites,” retrieved on November 18, 2017 from
http://citeseerx.ist.psu.edu/viewdoc/download?doi=10.1.1.514.7916&rep=rep1&typ
e=pdf
Ehsani, M.R., Saadatmanesh, H. and Velazquez-Dimas, J.I. (1999) “Behaviour of
Retrofitted URM Walls under Simulated Earthquake Loading,” Journal of
Composites for Construction, pp 134-142.
El-Diasity, M., Okail, H., Kamal, O. and Said, M. (2015) “Structural Performance of
Confined Masonry Walls Retrofitted Using Ferrocement and GFRP under In-plane
Cyclic Loading,” Journal of Engineering Structures, Vol. 94, pp. 54-69.
Hendry, A.W., Sinha, B.P., and Davies, S.R. (1997) “Design of masonry structures,”
E & FN Spon, London.
Hose Y. and Seible F. (1999) “Performance Evaluation Database for Concrete Bridge
Components, and Systems under Simulated Seismic loads,” PEER Report 1999/11,
Pacific Earthquake Engineering Research Center College of Engineering, University
of California, Berkley, U.S.A.
Irimies, M. and Crainic, L. (1999) “Behavior of Repair/Strengthened Unreinforced
Masonry Shear Walls,” Proceedings of the Sixth North American Masonry
Conference, Drexel University, pp. 555-563.

83
Islam, M.R. (2017) “Strength Comparison of Masonry Wall Made of Clay Burnt Brick
with Frog Mark and Machine Made Brick without Frog Mark,” M.Sc. Engg. Thesis,
Department of Civil Engineering, Bangladesh University of Engineering and
Technology, Dhaka.
Jabarov, M., Kozharinov, S.V. and Lunyov, A.A. (1983). “Strengthening of Damaged
Masonry by Reinforced Mortar Layers,” Proceedings of the Seventh World
Conference on Earthquake Engineering, Vol. 15, No. 3, pp. 73-80.
Khair, M.A. (2005) “Finite Element Analysis of Unreinforced Masonry Walls
subjected to In-plane Loads,” M.Sc. Engg. Thesis, Department of Civil Engineering,
Bangladesh University of Engineering and Technology, Dhaka.
Kahn, L. F. (1984) “Shotcrete Retrofit for Unreinforced Brick Masonry,” Proceedings
of the Eighth World Conference on Earthquake Engineering, San Francisco, pp. 583-
590.
Lee, H.H. and Prawel, S.P. (1990) “The Performance of Upgraded Brick Masonry
Piers Subjected to In-Plane Motion,” Proceedings of the Fourth U.S. National
Conference on Earthquake Engineering, Palm Springs Vol. 3, pp. 273-282.
Mander, J.B., and Nair, B. (1994) “Seismic Resistance of Brick-infilled Steel Frames
with and without Retrofit,” TMS journal, pp. 24-37, 1994.
Oliveira, F. L. (2001) “Rehabilitation of Masonry Walls by Application of
Ferrocement Coatings,” Doctoral dissertation, University of Sao Paulo. Sao Carlos,
SP. Portuguese.
Prawel, S.P. and Reinhorn, A.M. (1985) “Seismic Retrofit of Structural Masonry
using a Ferrocement overlay,” Proceedings of the Third North American Masonry
Conference, Arlington, Texas.
Priestley, M. J. N., Seible, F. and Calvi. G. M. (1996) “Seismic Design and Retrofit
of Bridges,” New York: John Wiley & Sons, Inc.

84
Reinhorn, A. M., Prawel, S. P. and Jia, Z. H. (1985) “Experimental Study on External
Ferrocement Coating for Masonry Walls,” Journal of Ferrocement, Vol. 15.
Shah, A.A. (2011) “Applications of Ferrocement in Strengthening of Unreinforced
Masonry Columns,” International Journal of Geology, Issue 1, Vol. 5, pp. 21-27.
Sar, D., and Sarkar. P. (2013) “Seismic Evaluation of Existing Unreinforced Masonry
Buildings,” Proceedings of the International Symposium on Engineering under
Uncertainty: Safety Assessment and Management (ISEUSAM - 2012), pp.1267-1276.

APPENDIX-A

86
Table A.1: Load-Deflection Value for Specimen SW-C-2 (Control)
Cycle Load (ton) Dial
Gauge Reading
Top
Displacement (mm)
1st Cycle
0 0 0
0.5 5 0.05
1 45 0.45
1.5 75 0.75
2 134 1.34
1.5 130 1.3
1 112 1.12
0.5 80 0.8
0 54 0.54
-0.5 2 0.02
-1 -62 -0.62
-1.5 -87 -0.87
-2 -147 -1.47
-1.5 -132 -1.32
-1 -97 -0.97
-0.5 -62 -0.62
0 23 0.23
2nd Cycle
0.5 33 0.33
1 71 0.71
1.5 109 1.09
2 161 1.61
2.5 226 2.26
3 346 3.46
2.5 256 2.56
2 241 2.41
1.5 221 2.21
1 186 1.86
0.5 151 1.51
0 119 1.19
-0.5 83 0.83
-1 18 0.18
-1.5 -30 -0.3
-2 -117 -1.17
-2.5 -127 -1.27
-3 -262 -2.62
-2.5 -247 -2.47
-2 -170 -1.7
-1.5 -100 -1
-1 -12 -0.12
[Table continued to next page]

87
[Table continued from previous page]
-0.5 8 0.08
0 82 0.82
3rd Cycle
0.5 84 0.84
1 129 1.29
1.5 243 2.43
2 279 2.79
2.5 356 3.56
3 422 4.22
3.5 514 5.14
4 624 6.24
3.5 557 5.57
3 552 5.52
2.5 532 5.32
2 506 5.06
1.5 464 4.64
1 436 4.36
0.5 406 4.06
0 362 3.62
-0.5 262 2.62
-1 225 2.25
-1.5 165 1.65
-2 100 1
-2.5 35 0.35
-3 10 0.1
-3.5 -70 -0.7
-4 -595 -5.95
-3.5 -590 -5.9
-3 -490 -4.9
-2 -370 -3.7
-1.5 -340 -3.4
-1 -300 -3
-0.5 -240 -2.4
0 -190 -1.9

88
Table A.2: Load-Deflection Value for Specimen SW-F-1/8
Cycle Load (ton) Dial gauge
Reading
Top
Displacement (mm)
1st Cycle
0 0 0
1 20 0.2
1.5 46 0.46
2 85 0.85
1.5 75 0.75
1 60 0.6
0 33 0.33
-1 -5 -0.05
-1.5 -31 -0.31
-2 -48 -0.48
-1.5 -42 -0.42
-1 -33 -0.33
0 8 0.08
2nd Cycle
1 34 0.34
1.5 52 0.52
2 78 0.78
2.5 109 1.09
3 160 1.6
2.5 155 1.55
2 130 1.3
1.5 115 1.15
1 90 0.9
0 58 0.58
-1 14 0.14
-1.5 -23 -0.23
-2 -46 -0.46
-2.5 -101 -1.01
-3 -185 -1.85
-2.5 -169 -1.69
-2 -126 -1.26
-1.5 -87 -0.87
-1 -69 -0.69
0 -29 -0.29
3rd Cycle
1 -5 -0.05
1.5 16 0.16
2 36 0.36
2.5 70 0.7
3 101 1.01
[Table continued to next page]

89
[Table continued from previous page]
3rd Cycle
3.5 176 1.76
4 476 4.76
3.5 471 4.71
3 450 4.5
2.5 375 3.75
2 324 3.24
1.5 300 3
1 275 2.75
0 217 2.17
-1 189 1.89
-1.5 151 1.51
-2 81 0.81
-2.5 29 0.29
-3 -251 -2.51
-3.5 -521 -5.21
-4 -878 -8.78
-3.5 -870 -8.7
-3 -850 -8.5
-2.5 -824 -8.24
-2 -780 -7.8
-1.5 -750 -7.5
-1 -700 -7
0 -620 -6.2
Table A.3: Load-Deflection Value for Specimen SW-BWF-1/8
Cycle Load (ton) Dial gauge
Reading
Top
Displacement (mm)
1st Cycle
0 0 0
0.5 12 0.12
1 23 0.23
1.5 41 0.41
2 57 0.57
1.5 56 0.56
1 50 0.5
0.5 38 0.38
0 20 0.2
-0.5 4 0.04
-1 -15 -0.15
-1.5 -37 -0.37
-2 -50 -0.5
[Table continued to next page]

90
[Table continued from previous page]
-1.5 -49 -0.49
-1 -38 -0.38
-0.5 -18 -0.18
0 17 0.17
2nd Cycle
0.5 51 0.51
1 70 0.7
1.5 91 0.91
2 119 1.19
2.5 141 1.41
3 165 1.65
3.5 183 1.83
4 211 2.11
3.5 210 2.1
3 199 1.99
2.5 184 1.84
2 168 1.68
1.5 150 1.5
1 129 1.29
0.5 109 1.09
0 74 0.74
-0.5 32 0.32
-1 2 0.02
-1.5 -16 -0.16
-2 -42 -0.42
-2.5 -66 -0.66
-3 -103 -1.03
-3.5 -161 -1.61
-4 -220 -2.2
-3.5 -219 -2.19
-3 -199 -1.99
-2.5 -187 -1.87
-2 -172 -1.72
-1.5 -154 -1.54
-1 -137 -1.37
-0.5 -112 -1.12
0 -71 -0.71
3rd Cycle
1 -12 -0.12
1.5 55 0.55
2 95 0.95
2.5 120 1.2
3 150 1.5
[Table continued to next page]

91
[Table continued from previous page]
3rd Cycle
3.5 172 1.72
4 200 2
4.5 226 2.26
5 257 2.57
5.5 300 3
6 328 3.28
5.5 358 3.58
5 352 3.52
4.5 322 3.22
4 297 2.97
3.5 277 2.77
3 249 2.49
2.5 220 2.2
2 205 2.05
1.5 182 1.82
1 165 1.65
0 130 1.3
-0.5 61 0.61
-1 40 0.4
-1.5 17 0.17
-2 -5 -0.05
-2.5 -30 -0.3
-3 -120 -1.2
-3.5 -150 -1.5
-4 -180 -1.8
-4.5 -220 -2.2
-5 -245 -2.45
-5.5 -310 -3.1
-6 -456 -4.56
-5.5 -449 -4.49
-5 -364 -3.64
-4.5 -322 -3.22
-4 -292 -2.92
-3.5 -252 -2.52
-3 -219 -2.19
-2.5 -177 -1.77
-2 -132 -1.32
-1.5 -84 -0.84
-1 -44 -0.44
0 54 0.54
4th Cycle 0.5 86 0.86
[Table continued to next page]

92
[Table continued from previous page]
4th Cycle
1 203 2.03
1.5 293 2.93
2 328 3.28
2.5 368 3.68
3 408 4.08
3.5 438 4.38
4 473 4.73
4.5 583 5.83
5 623 6.23
5.5 693 6.93
6 718 7.18
6.5 968 9.68
7 1143 11.43
7.5 1388 13.88
8 1537 15.37
7.5 1536 15.36
7 1524 15.24
6.5 1484 14.84
6 1466 14.66
5.5 1434 14.34
5 1384 13.84
4.5 1352 13.52
4 1312 13.12
3.5 1269 12.69
3 1219 12.19
2.5 1179 11.79
2 1169 11.69
1.5 1124 11.24
1 1079 10.79
0.5 1074 10.74
0 1049 10.49
Table A.4: Load-Deflection Value for Specimen LW-C-1(Control)
Cycle Load (ton) Left
Dial Gauge Top Displacement (mm)
1st Cycle
0 0 0
1 2 0.02
1.5 7 0.07
2 20 0.2
1.5 20 0.2
[Table continued to next page]

93
[Table continued from previous page]
1 18 0.18
0.5 7 0.07
0 4 0.04
-0.5 2 0.02
-1 -1 -0.01
-1.5 -7 -0.07
-2 -11 -0.11
-1.5 -11 -0.11
-1 -9 -0.09
0 3 0.03
2nd Cycle
1 11 0.11
1.5 18 0.18
2 28 0.28
2.5 34 0.34
3 38 0.38
2.5 37 0.37
2 33 0.33
1.5 27 0.27
1 21 0.21
0 10 0.1
-1 -2 -0.02
-1.5 -5 -0.05
-2 -12 -0.12
-2.5 -17 -0.17
-3 -24 -0.24
-2.5 -23 -0.23
-2 -20 -0.2
-1.5 -13 -0.13
-1 -10 -0.1
0 5 0.05
3rd Cycle
1.5 18 0.18
2 22 0.22
2.5 30 0.3
3 37 0.37
3.5 46 0.46
4 54 0.54
3.5 53 0.53
3 49 0.49
2.5 47 0.47
2 39 0.39
[Table continued to next page]

94
[Table continued from previous page]
3rd Cycle
1.5 28 0.28
1 25 0.25
0 16 0.16
-1 5 0.05
-1.5 0 0
-2 -3 -0.03
-2.5 -9 -0.09
-3 -17 -0.17
-3.5 -28 -0.28
-4 -77 -0.77
-3.5 -72 -0.72
-3 -57 -0.57
-2.5 -46 -0.46
-2 -34 -0.34
-1.5 -28 -0.28
-1 -22 -0.22
0 -4 -0.04
4th Cycle
1 7 0.07
1.5 12 0.12
2 20 0.2
2.5 26 0.26
3 31 0.31
3.5 38 0.38
4 46 0.46
4.5 56 0.56
5 66 0.66
4.5 62 0.62
4 58 0.58
3.5 55 0.55
3 48 0.48
2.5 42 0.42
2 37 0.37
1.5 30 0.3
1 25 0.25
0 12 0.12
-1 2 0.02
-1.5 -6 -0.06
-2 -13 -0.13
-2.5 -21 -0.21
-3 -30 -0.3
[Table continued to next page]

95
[Table continued from previous page]
4th Cycle
-3.5 -48 -0.48
-4 -68 -0.68
-4.5 -92 -0.92
-5 -119 -1.19
-4.5 -117 -1.17
-4 -108 -1.08
-3.5 -92 -0.92
-3 -71 -0.71
-2.5 -57 -0.57
-2 -41 -0.41
-1.5 -28 -0.28
-1 -21 -0.21
0 0 0
5th Cycle
1 11 0.11
1.5 16 0.16
2 20 0.2
2.5 26 0.26
3 35 0.35
3.5 41 0.41
4 50 0.5
4.5 60 0.6
5 67 0.67
5.5 78 0.78
6 90 0.9
6.5 110 1.1
7 130 1.3
6.5 130 1.3
6 129 1.29
5.5 127 1.27
5 120 1.2
4.5 110 1.1
4 107 1.07
3.5 102 1.02
3 98 0.98
2.5 90 0.9
2 84 0.84
1.5 78 0.78
1 70 0.7
0 50 0.5
-1 35 0.35
-1.5 28 0.28
[Table continued to next page]

96
[Table continued from previous page]
5th Cycle
-2 19 0.19
-2.5 10 0.1
-3 -2 -0.02
-3.5 -22 -0.22
-4 -46 -0.46
-4.5 -66 -0.66
-5 -90 -0.9
-5.5 -113 -1.13
-6 -140 -1.4
-6.5 -160 -1.6
-7 -178 -1.78
-6.5 -174 -1.74
-6 -172 -1.72
-5.5 -160 -1.6
-5 -145 -1.45
-4.5 -136 -1.36
-4 -120 -1.2
-3.5 -100 -1
-3 -82 -0.82
-2.5 -58 -0.58
-2 -33 -0.33
-1.5 -17 -0.17
-1 -4 -0.04
0 22 0.22
6th Cycle
1 40 0.4
1.5 55 0.55
2 60 0.6
2.5 65 0.65
3 70 0.7
3.5 75 0.75
4 85 0.85
4.5 95 0.95
5 100 1
5.5 105 1.05
6 110 1.1
6.5 125 1.25
7 135 1.35
7.5 165 1.65
8 180 1.8
8.5 195 1.95
9 220 2.2
[Table continued to next page]

97
[Table continued from previous page]
6th Cycle
8.5 220 2.2
8 219 2.19
7.5 215 2.15
7 205 2.05
6.5 193 1.93
6 181 1.81
5.5 169 1.69
5 163 1.63
4.5 159 1.59
4 155 1.55
3.5 150 1.5
3 142 1.42
2.5 135 1.35
2 125 1.25
1.5 115 1.15
1 107 1.07
0 89 0.89
-1 75 0.75
-1.5 65 0.65
-2 54 0.54
-2.5 45 0.45
-3 25 0.25
-3.5 0 0
-4 -25 -0.25
-4.5 -55 -0.55
-5 -85 -0.85
-5.5 -105 -1.05
-6 -120 -1.2
-6.5 -137 -1.37
-7 -158 -1.58
-7.5 -235 -2.35
-8 -250 -2.5
-8.5 -265 -2.65
-9 -328 -3.28
-8.5 -327 -3.27
-8 -327 -3.27
-7.5 -325 -3.25
-7 -305 -3.05
-6.5 -293 -2.93
-6 -283 -2.83
-5.5 -275 -2.75
[Table continued to next page]

98
[Table continued from previous page]
6th Cycle
-5 -261 -2.61
-4.5 -235 -2.35
-4 -215 -2.15
-3.5 -193 -1.93
-3 -173 -1.73
-2.5 -137 -1.37
-2 -120 -1.2
-1.5 -87 -0.87
-1 -65 -0.65
0 -5 -0.05
7th Cycle
-1 -14 -0.14
-1.5 -16 -0.16
-2 -26 -0.26
-2.5 -38 -0.38
-3 -50 -0.5
-3.5 -55 -0.55
-4 -80 -0.8
-4.5 -118 -1.18
-5 -132 -1.32
-5.5 -170 -1.7
-6 -191 -1.91
-6.5 -385 -3.85
-7 -414 -4.14
-7.5 -435 -4.35
-7 -434 -4.34
-6.5 -433 -4.33
-6 -427 -4.27
-5.5 -380 -3.8
-5 -376 -3.76
-4.5 -372 -3.72
-4 -356 -3.56
-3.5 -345 -3.45
-3 -325 -3.25
-2.5 -320 -3.2
-2 -310 -3.1
-1.5 -300 -3
-1 -280 -2.8
0 -175 -1.75

99
Table A.5: Load-Deflection Value for Specimen LW-F-1/3
Cycle Load (Ton) Dial Gauge Top
Displacement (mm)
1st Cycle
0 0 0
1 3 0.03
1.5 6 0.06
2 9 0.09
1.5 8 0.08
1 7 0.07
0.5 6 0.06
0 5 0.05
-1 -3 -0.03
-1.5 -8 -0.08
-2 -10 -0.1
-1.5 -9 -0.09
-1 -8 -0.08
-0.5 -2 -0.02
0 3 0.03
2nd Cycle
1 11 0.11
1.5 13 0.13
2 20 0.2
2.5 25 0.25
3 33 0.33
3.5 40 0.4
4 47 0.47
3.5 45 0.45
3 43 0.43
2.5 38 0.38
2 33 0.33
1.5 29 0.29
1 20 0.2
0 11 0.11
-1 0 0
-1.5 -6 -0.06
-2 -10 -0.1
-2.5 -14 -0.14
-3 -19 -0.19
-3.5 -23 -0.23
-4 -30 -0.3
-3.5 -29 -0.29
-3 -28 -0.28
[Table continued to next page]

100
[Table continued from previous page]
2nd Cycle
-2.5 -26 -0.26
-2 -20 -0.2
-1.5 -18 -0.18
-1 -12 -0.12
0 0 0
3rd Cycle
1 9 0.09
1.5 16 0.16
2 22 0.22
2.5 28 0.28
3 38 0.38
3.5 41 0.41
4 45 0.45
4.5 52 0.52
5 60 0.6
5.5 70 0.7
6 76 0.76
5.5 74 0.74
5 72 0.72
4.5 69 0.69
4 64 0.64
3.5 60 0.6
3 57 0.57
2.5 50 0.5
2 44 0.44
1.5 37 0.37
1 31 0.31
0 20 0.2
-1 9 0.09
-1.5 2 0.02
-2 -2 -0.02
-2.5 -8 -0.08
-3 -12 -0.12
-3.5 -18 -0.18
-4 -22 -0.22
-4.5 -30 -0.3
-5 -35 -0.35
-5.5 -40 -0.4
-6 -50 -0.5
-5.5 -49 -0.49
-5 -49 -0.49
[Table continued to next page]

101
[Table continued from previous page]
3rd Cycle
-4.5 -47 -0.47
-4 -42 -0.42
-3.5 -38 -0.38
-3 -33 -0.33
-2.5 -29 -0.29
-2 -24 -0.24
-1.5 -19 -0.19
-1 -12 -0.12
0 2 0.02
4th Cycle
1 14 0.14
1.5 20 0.2
2 28 0.28
2.5 33 0.33
3 40 0.4
3.5 46 0.46
4 50 0.5
4.5 58 0.58
5 65 0.65
5.5 72 0.72
6 80 0.8
6.5 84 0.84
7 91 0.91
7.5 100 1
8 111 1.11
7.5 110 1.1
7 108 1.08
6.5 104 1.04
6 100 1
5.5 97 0.97
5 92 0.92
4.5 88 0.88
4 83 0.83
3.5 79 0.79
3 72 0.72
2.5 68 0.68
2 60 0.6
1.5 55 0.55
1 50 0.5
0 35 0.35
-1 19 0.19
[Table continued to next page]

102
[Table continued from previous page]
4th Cycle
-1.5 10 0.1
-2 7 0.07
-2.5 0 0
-3 -5 -0.05
-3.5 -11 -0.11
-4 -16 -0.16
-4.5 -21 -0.21
-5 -29 -0.29
-5.5 -35 -0.35
-6 -45 -0.45
-6.5 -54 -0.54
-7 -62 -0.62
-7.5 -73 -0.73
-8 -90 -0.9
-7.5 -89 -0.89
-7 -74 -0.74
-6.5 -70 -0.7
-6 -68 -0.68
-5.5 -63 -0.63
-5 -60 -0.6
-4.5 -51 -0.51
-4 -48 -0.48
-3.5 -41 -0.41
-3 -37 -0.37
-2.5 -30 -0.3
-2 -25 -0.25
-1.5 -19 -0.19
-1 -15 -0.15
0 -8 -0.08
5th Cycle
1 3 0.03
1.5 10 0.1
2 17 0.17
2.5 23 0.23
3 32 0.32
3.5 40 0.4
4 46 0.46
4.5 52 0.52
5 60 0.6
5.5 70 0.7
6 78 0.78
6.5 82 0.82
[Table continued to next page]

103
[Table continued from previous page]
5th Cycle
7 90 0.9
7.5 100 1
8 107 1.07
8.5 115 1.15
9 126 1.26
9.5 137 1.37
10 150 1.5
9.5 148 1.48
9 147 1.47
8.5 144 1.44
8 140 1.4
7.5 134 1.34
7 130 1.3
6.5 127 1.27
6 120 1.2
5.5 115 1.15
5 110 1.1
4.5 106 1.06
4 100 1
3.5 93 0.93
3 88 0.88
2.5 81 0.81
2 77 0.77
1.5 69 0.69
1 60 0.6
0 48 0.48
-1 30 0.3
-1.5 23 0.23
-2 16 0.16
-2.5 10 0.1
-3 5 0.05
-3.5 -1 -0.01
-4 -9 -0.09
-4.5 -17 -0.17
-5 -22 -0.22
-5.5 -30 -0.3
-6 -38 -0.38
-6.5 -48 -0.48
-7 -52 -0.52
-7.5 -63 -0.63
-8 -71 -0.71
[Table continued to next page]
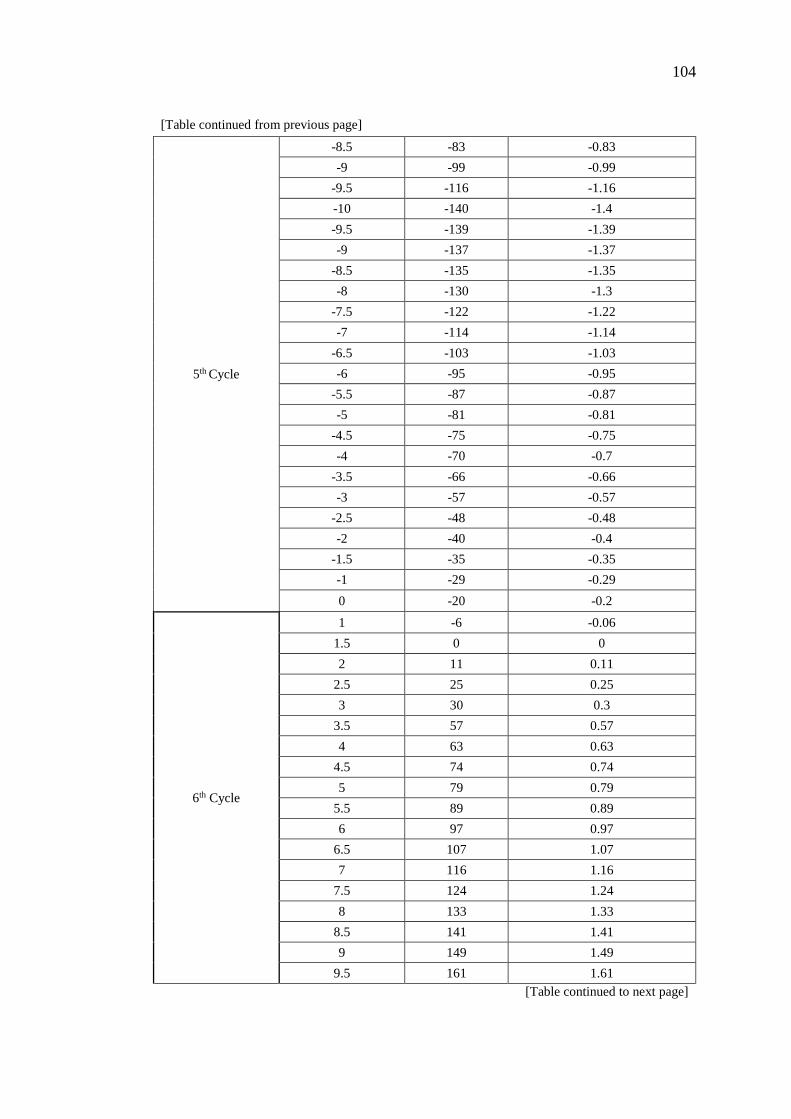
104
[Table continued from previous page]
5th Cycle
-8.5 -83 -0.83
-9 -99 -0.99
-9.5 -116 -1.16
-10 -140 -1.4
-9.5 -139 -1.39
-9 -137 -1.37
-8.5 -135 -1.35
-8 -130 -1.3
-7.5 -122 -1.22
-7 -114 -1.14
-6.5 -103 -1.03
-6 -95 -0.95
-5.5 -87 -0.87
-5 -81 -0.81
-4.5 -75 -0.75
-4 -70 -0.7
-3.5 -66 -0.66
-3 -57 -0.57
-2.5 -48 -0.48
-2 -40 -0.4
-1.5 -35 -0.35
-1 -29 -0.29
0 -20 -0.2
6th Cycle
1 -6 -0.06
1.5 0 0
2 11 0.11
2.5 25 0.25
3 30 0.3
3.5 57 0.57
4 63 0.63
4.5 74 0.74
5 79 0.79
5.5 89 0.89
6 97 0.97
6.5 107 1.07
7 116 1.16
7.5 124 1.24
8 133 1.33
8.5 141 1.41
9 149 1.49
9.5 161 1.61
[Table continued to next page]

105
[Table continued from previous page]
6th Cycle
10 173 1.73
10.5 187 1.87
11 204 2.04
11.5 209 2.09
12 219 2.19
11.5 219 2.19
11 218 2.18
10.5 212 2.12
10 208 2.08
9.5 204 2.04
9 198 1.98
8.5 196 1.96
8 187 1.87
7.5 181 1.81
7 175 1.75
6.5 171 1.71
6 166 1.66
5.5 161 1.61
5 157 1.57
4.5 154 1.54
4 147 1.47
3.5 142 1.42
3 136 1.36
2.5 128 1.28
2 120 1.2
1.5 114 1.14
1 107 1.07
0 88 0.88
-1 72 0.72
-1.5 63 0.63
-2 58 0.58
-2.5 52 0.52
-3 45 0.45
-3.5 37 0.37
-4 28 0.28
-4.5 18 0.18
-5 8 0.08
-5.5 -2 -0.02
-6 -11 -0.11
-6.5 -22 -0.22
-7 -34 -0.34
[Table continued from previous page]

106
[Table continued to next page]
-7.5 -47 -0.47
-8 -72 -0.72
-8.5 -82 -0.82
-9 -95 -0.95
-9.5 -113 -1.13
-10 -141 -1.41
-10.5 -182 -1.82
-11 -232 -2.32
-11.5 -282 -2.82
-12 -292 -2.92
-11.5 -291 -2.91
6th Cycle
-11 -291 -2.91
-10.5 -291 -2.91
-10 -284 -2.84
-9.5 -282 -2.82
-9 -279 -2.79
-8.5 -272 -2.72
-8 -268 -2.68
-7.5 -263 -2.63
-7 -259 -2.59
-6.5 -252 -2.52
-6 -247 -2.47
-5.5 -240 -2.4
-5 -232 -2.32
-4.5 -225 -2.25
-4 -220 -2.2
-3.5 -212 -2.12
-3 -202 -2.02
-2.5 -192 -1.92
-2 -187 -1.87
-1.5 -180 -1.8
-1 -173 -1.73
0 -132 -1.32
7th Cycle
1 -112 -1.12
1.5 -102 -1.02
2 -82 -0.82
2.5 -71 -0.71
3 -52 -0.52
3.5 -34 -0.34
4 -18 -0.18
4.5 3 0.03
[Table continued to next page]

107
[Table continued from previous page]
7th Cycle
5 20 0.2
5.5 48 0.48
6 75 0.75
6.5 118 1.18
7 163 1.63
7.5 198 1.98
8 218 2.18
8.5 238 2.38
9 253 2.53
9.5 268 2.68
10 280 2.8
10.5 296 2.96
11 308 3.08
11.5 318 3.18
12 335 3.35
11.5 334 3.34
11 323 3.23
10.5 316 3.16
10 306 3.06
9.5 296 2.96
9 289 2.89
8.5 279 2.79
8 269 2.69
7.5 264 2.64
7 258 2.58
6.5 248 2.48
6 238 2.38
5.5 233 2.33
5 227 2.27
4.5 220 2.2
4 212 2.12
3.5 207 2.07
3 199 1.99
2.5 194 1.94
2 189 1.89
1.5 184 1.84
1 175 1.75
0 160 1.6

108
Table A.6: Load-Deflection Value for Specimen LW-BWF-1/3
Cycle Load (ton) Dial Gauge Top
Displacement (mm)
1st Cycle
0 0 0
1 8 0.08
1.5 15 0.15
2 18 0.18
2.5 21 0.21
3 30 0.3
3.5 42 0.42
4 58 0.58
3.5 57 0.57
3 51 0.51
2.5 42 0.42
2 36 0.36
1.5 31 0.31
1 24 0.24
0 12 0.12
-1 -2 -0.02
-1.5 -8 -0.08
-2 -15 -0.15
-2.5 -23 -0.23
-3 -30 -0.3
-3.5 -38 -0.38
-4 -50 -0.5
-3.5 -48 -0.48
-3 -46 -0.46
-2.5 -38 -0.38
-2 -33 -0.33
-1.5 -27 -0.27
-1 -19 -0.19
0 -4 -0.04
2nd Cycle
1 6 0.06
1.5 11 0.11
2 18 0.18
2.5 21 0.21
3 29 0.29
3.5 33 0.33
4 43 0.43
4.5 58 0.58
5 75 0.75
5.5 96 0.96
[Table continued to next page]

109
[Table continued from previous page]
2nd Cycle
6 105 1.05
5.5 103 1.03
5 98 0.98
4.5 90 0.9
4 78 0.78
3.5 70 0.7
3 55 0.55
2.5 43 0.43
2 31 0.31
1.5 26 0.26
1 19 0.19
0 13 0.13
-1 -1 -0.01
-1.5 -7 -0.07
-2 -11 -0.11
-2.5 -19 -0.19
-3 -27 -0.27
-3.5 -36 -0.36
-4 -46 -0.46
-4.5 -58 -0.58
-5 -69 -0.69
-5.5 -80 -0.8
-6 -98 -0.98
-5.5 -97 -0.97
-5 -96 -0.96
-4.5 -88 -0.88
-4 -79 -0.79
-3.5 -69 -0.69
-3 -60 -0.6
-2.5 -51 -0.51
-2 -43 -0.43
-1.5 -38 -0.38
-1 -28 -0.28
0 -11 -0.11
3rd Cycle
1 0 0
1.5 4 0.04
2 11 0.11
2.5 14 0.14
3 19 0.19
3.5 22 0.22
[Table continued to next page]

110
[Table continued from previous page]
3rd Cycle
4 30 0.3
4.5 42 0.42
5 54 0.54
5.5 70 0.7
6 82 0.82
6.5 94 0.94
7 112 1.12
7.5 130 1.3
8 152 1.52
7.5 151 1.51
7 146 1.46
6.5 140 1.4
6 132 1.32
5.5 124 1.24
5 111 1.11
4.5 98 0.98
4 86 0.86
3.5 66 0.66
3 52 0.52
2.5 44 0.44
2 37 0.37
1.5 30 0.3
1 22 0.22
0 4 0.04
-1 -8 -0.08
-1.5 -18 -0.18
-2 -22 -0.22
-2.5 -28 -0.28
-3 -36 -0.36
-3.5 -44 -0.44
-4 -56 -0.56
-4.5 -65 -0.65
-5 -78 -0.78
-5.5 -94 -0.94
-6 -108 -1.08
-6.5 -121 -1.21
-7 -138 -1.38
-7.5 -156 -1.56
-8 -179 -1.79
-7.5 -178 -1.78
-7 -177 -1.77
[Table continued to next page]

111
[Table continued from previous page]
3rd Cycle
-6.5 -173 -1.73
-6 -168 -1.68
-5.5 -163 -1.63
-5 -156 -1.56
-4.5 -148 -1.48
-4 -138 -1.38
-3.5 -126 -1.26
-3 -113 -1.13
-2.5 -106 -1.06
-2 -97 -0.97
-1.5 -87 -0.87
-1 -74 -0.74
0 -58 -0.58
4th Cycle
1 -48 -0.48
1.5 -43 -0.43
2 -38 -0.38
2.5 -31 -0.31
3 -25 -0.25
3.5 -18 -0.18
4 -9 -0.09
4.5 10 0.1
5 32 0.32
5.5 52 0.52
6 70 0.7
6.5 86 0.86
7 102 1.02
7.5 121 1.21
8 152 1.52
8.5 182 1.82
9 192 1.92
9.5 207 2.07
10 242 2.42
9.5 241 2.41
9 238 2.38
8.5 231 2.31
8 222 2.22
7.5 214 2.14
7 203 2.03
6.5 192 1.92
6 179 1.79
5.5 167 1.67
[Table continued to next page]

112
[Table continued from previous page]
4th Cycle
5 154 1.54
4.5 139 1.39
4 122 1.22
3.5 104 1.04
3 85 0.85
2.5 66 0.66
2 51 0.51
1.5 32 0.32
1 23 0.23
0 9 0.09
-1 -7 -0.07
-1.5 -13 -0.13
-2 -19 -0.19
-2.5 -27 -0.27
-3 -35 -0.35
-3.5 -42 -0.42
-4 -52 -0.52
-4.5 -63 -0.63
-5 -85 -0.85
-5.5 -95 -0.95
-6 -109 -1.09
-6.5 -135 -1.35
-7 -147 -1.47
-7.5 -164 -1.64
-8 -179 -1.79
-8.5 -199 -1.99
-9 -215 -2.15
-9.5 -226 -2.26
-10 -238 -2.38
-9.5 -236 -2.36
-9 -235 -2.35
-8.5 -231 -2.31
-8 -227 -2.27
-7.5 -222 -2.22
-7 -217 -2.17
-6.5 -210 -2.1
-6 -205 -2.05
-5.5 -197 -1.97
-5 -190 -1.9
-4.5 -184 -1.84
-4 -165 -1.65
[Table continued to next page]

113
[Table continued from previous page]
4th Cycle
-3.5 -154 -1.54
-3 -146 -1.46
-2.5 -137 -1.37
-2 -129 -1.29
-1.5 -119 -1.19
-1 -107 -1.07
0 -93 -0.93
5th Cycle
1 -82 -0.82
1.5 -80 -0.8
2 -75 -0.75
2.5 -67 -0.67
3 -60 -0.6
3.5 -47 -0.47
4 -37 -0.37
4.5 -31 -0.31
5 -1 -0.01
5.5 21 0.21
6 43 0.43
6.5 65 0.65
7 83 0.83
7.5 105 1.05
8 125 1.25
8.5 143 1.43
9 163 1.63
9.5 181 1.81
10 198 1.98
10.5 233 2.33
11 248 2.48
11.5 263 2.63
12 286 2.86
11.5 285 2.85
11 283 2.83
10.5 276 2.76
10 270 2.7
9.5 261 2.61
9 248 2.48
8.5 240 2.4
8 231 2.31
7.5 215 2.15
7 203 2.03
[Table continued to next page]

114
[Table continued from previous page]
5th Cycle
6.5 193 1.93
6 181 1.81
5.5 163 1.63
5 153 1.53
4.5 133 1.33
4 117 1.17
3.5 103 1.03
3 83 0.83
2.5 69 0.69
2 54 0.54
1.5 42 0.42
1 27 0.27
0 -19 -0.19
-1 -36 -0.36
-1.5 -47 -0.47
-2 -54 -0.54
-2.5 -64 -0.64
-3 -75 -0.75
-3.5 -92 -0.92
-4 -109 -1.09
-4.5 -130 -1.3
-5 -147 -1.47
-5.5 -171 -1.71
-6 -192 -1.92
-6.5 -210 -2.1
-7 -234 -2.34
-7.5 -249 -2.49
-8 -270 -2.7
-8.5 -282 -2.82
-9 -293 -2.93
-9.5 -305 -3.05
-10 -317 -3.17
-10.5 -329 -3.29
-11 -342 -3.42
-11.5 -354 -3.54
-12 -376 -3.76
-11.5 -375 -3.75
-11 -374 -3.74
-10.5 -372 -3.72
-10 -364 -3.64
-9.5 -354 -3.54
[Table continued to next page]

115
[Table continued from previous page]
5th Cycle
-9 -344 -3.44
-8.5 -340 -3.4
-8 -334 -3.34
-7.5 -326 -3.26
-7 -320 -3.2
-6.5 -314 -3.14
-6 -306 -3.06
-5.5 -301 -3.01
-5 -294 -2.94
-4.5 -284 -2.84
-4 -274 -2.74
-3.5 -262 -2.62
-3 -250 -2.5
-2.5 -242 -2.42
-2 -230 -2.3
-1.5 -224 -2.24
-1 -210 -2.1
0 -192 -1.92
6th Cycle
1.5 -170 -1.7
2 -162 -1.62
2.5 -155 -1.55
3 -142 -1.42
3.5 -132 -1.32
4 -123 -1.23
4.5 -107 -1.07
5 -92 -0.92
5.5 -73 -0.73
6 -55 -0.55
6.5 -33 -0.33
7 28 0.28
7.5 45 0.45
8 64 0.64
8.5 88 0.88
9 102 1.02
9.5 128 1.28
10 152 1.52
10.5 176 1.76
11 188 1.88
11.5 203 2.03
12 215 2.15
12.5 228 2.28
[Table continued to next page]

116
[Table continued to next page]
6th Cycle
13 238 2.38
13.5 258 2.58
14 288 2.88
14.5 308 3.08
15 318 3.18
15.5 328 3.28
16 340 3.4
15.5 340 3.4
15 339 3.39
14.5 338 3.38
14 333 3.33
13.5 328 3.28
13 318 3.18
12.5 308 3.08
12 300 3
11.5 289 2.89
11 280 2.8
10.5 271 2.71
10 262 2.62
9.5 251 2.51
9 236 2.36
8.5 225 2.25
8 208 2.08
7.5 198 1.98
7 186 1.86
6.5 170 1.7
6 158 1.58
5.5 145 1.45
5 132 1.32
4.5 116 1.16
4 98 0.98
3.5 84 0.84
3 52 0.52
2.5 38 0.38
2 28 0.28
1.5 16 0.16
1 9 0.09
0 -12 -0.12
7th Cycle -1 -30 -0.3
-1.5 -38 -0.38
[Table continued to next page]

117
[Table continued from previous page]
7th Cycle
-2 -44 -0.44
-2.5 -56 -0.56
-3 -67 -0.67
-3.5 -80 -0.8
-4 -100 -1
-4.5 -146 -1.46
-5 -190 -1.9
-5.5 -230 -2.3
-6 -270 -2.7
-6.5 -295 -2.95
-7 -312 -3.12
-7.5 -332 -3.32
-8 -343 -3.43
-8.5 -353 -3.53
-9 -368 -3.68
-9.5 -377 -3.77
-10 -390 -3.9
-10.5 -399 -3.99
-11 -406 -4.06
-11.5 -420 -4.2
-12 -429 -4.29
-12.5 -440 -4.4
-13 -453 -4.53
-13.5 -470 -4.7
-14 -486 -4.86
-14.5 -500 -5
-14 -499 -4.99
-13 -495 -4.95
-12 -485 -4.85
-11 -470 -4.7
-10 -460 -4.6
-9 -450 -4.5
-8 -420 -4.2
-7 -400 -4
-6 -390 -3.9
-5 -380 -3.8
-4 -360 -3.6
-3 -355 -3.55
-2 -350 -3.5
-1 -320 -3.2
0 -290 -2.9

118
Table A.7: Load-Deflection Value for Specimen LW-BWF-1/8
Cycle Load (ton) Dial Gauge Top
Displacement (mm)
1st Cycle
0 0 0
1 8 0.08
1.5 10 0.1
2 15 0.15
2.5 21 0.21
3 27 0.27
3.5 32 0.32
4 40 0.4
3.5 39 0.39
3 38 0.38
2.5 36 0.36
2 31 0.31
1.5 27 0.27
1 22 0.22
0 11 0.11
-1 1 0.01
-1.5 -2 -0.02
-2 -6 -0.06
-2.5 -11 -0.11
-3 -18 -0.18
-3.5 -21 -0.21
-4 -28 -0.28
-3.5 -27 -0.27
-3 -25 -0.25
-2.5 -22 -0.22
-2 -19 -0.19
-1.5 -12 -0.12
-1 -10 -0.1
0 2 0.02
2nd Cycle
1 11 0.11
1.5 15 0.15
2 19 0.19
2.5 23 0.23
3 29 0.29
3.5 33 0.33
4 39 0.39
4.5 44 0.44
5 49 0.49
[Table continued to next page]

119
[Table continued from previous page]
2nd Cycle
5.5 56 0.56
6 64 0.64
5.5 63 0.63
5 61 0.61
4.5 59 0.59
4 54 0.54
3.5 49 0.49
3 47 0.47
2.5 41 0.41
2 39 0.39
1.5 34 0.34
1 29 0.29
0 19 0.19
-1 8 0.08
-1.5 3 0.03
-2 -1 -0.01
-2.5 -3 -0.03
-3 -9 -0.09
-3.5 -13 -0.13
-4 -19 -0.19
-4.5 -22 -0.22
-5 -29 -0.29
-5.5 -33 -0.33
-6 -41 -0.41
-5.5 -40 -0.4
-5 -39 -0.39
-4.5 -38 -0.38
-4 -33 -0.33
-3.5 -29 -0.29
-3 -24 -0.24
-2.5 -21 -0.21
-2 -17 -0.17
-1.5 -12 -0.12
-1 -5 -0.05
0 8 0.08
3rd Cycle
1 16 0.16
1.5 18 0.18
2 22 0.22
2.5 28 0.28
3 31 0.31
[Table continued to next page]

120
[Table continued from previous page]
3rd Cycle
3.5 36 0.36
4 38 0.38
4.5 42 0.42
5 48 0.48
5.5 52 0.52
6 58 0.58
6.5 66 0.66
7 71 0.71
7.5 78 0.78
8 93 0.93
7.5 91 0.91
7 89 0.89
6.5 88 0.88
6 85 0.85
5.5 80 0.8
5 78 0.78
4.5 70 0.7
4 68 0.68
3.5 65 0.65
3 60 0.6
2.5 54 0.54
2 49 0.49
1.5 45 0.45
1 40 0.4
0 33 0.33
-1 22 0.22
-1.5 19 0.19
-2 14 0.14
-2.5 9 0.09
-3 6 0.06
-3.5 0 0
-4 -6 -0.06
-4.5 -13 -0.13
-5 -18 -0.18
-5.5 -25 -0.25
-6 -32 -0.32
-6.5 -40 -0.4
-7 -45 -0.45
-7.5 -52 -0.52
-8 -63 -0.63
[Table continued to next page]

121
[Table continued from previous page]
3rd Cycle
-7.5 -62 -0.62
-7 -61 -0.61
-6.5 -59 -0.59
-6 -53 -0.53
-5.5 -50 -0.5
-5 -45 -0.45
-4.5 -41 -0.41
-4 -34 -0.34
-3.5 -29 -0.29
-3 -23 -0.23
-2.5 -19 -0.19
-2 -14 -0.14
-1.5 -10 -0.1
-1 -3 -0.03
0 11 0.11
1 20 0.2
1.5 24 0.24
2 29 0.29
2.5 32 0.32
3 43 0.43
3.5 46 0.46
4 52 0.52
4.5 55 0.55
5 62 0.62
5.5 66 0.66
6 71 0.71
6.5 77 0.77
7 84 0.84
4th Cycle 7.5 90 0.9
8 97 0.97
8.5 105 1.05
9 115 1.15
9.5 126 1.26
10 142 1.42
9.5 141 1.41
9 140 1.4
8.5 135 1.35
8 133 1.33
7.5 127 1.27
7 125 1.25
[Table continued to next page]

122
[Table continued from previous page]
6.5 120 1.2
6 116 1.16
5.5 113 1.13
5 108 1.08
4.5 103 1.03
4 100 1
3.5 96 0.96
3 90 0.9
2.5 85 0.85
2 83 0.83
1.5 79 0.79
1 75 0.75
0 65 0.65
-1 54 0.54
4th Cycle -1.5 49 0.49
-2 47 0.47
-2.5 42 0.42
-3 37 0.37
-3.5 32 0.32
-4 29 0.29
-4.5 21 0.21
-5 15 0.15
-5.5 9 0.09
-6 0 0
-6.5 -7 -0.07
-7 -15 -0.15
-7.5 -23 -0.23
-8 -34 -0.34
-8.5 -41 -0.41
-9 -52 -0.52
-9.5 -65 -0.65
-10 -81 -0.81
-9.5 -80 -0.8
-9 -79 -0.79
-8.5 -73 -0.73
-8 -68 -0.68
-7.5 -60 -0.6
-7 -56 -0.56
-6.5 -51 -0.51
-6 -47 -0.47
[Table continued to next page]

123
[Table continued from previous page]
-5.5 -42 -0.42
-5 -39 -0.39
-4.5 -33 -0.33
-4 -29 -0.29
-3.5 -20 -0.2
4th Cycle -3 -17 -0.17
-2.5 -12 -0.12
-2 -8 -0.08
-1.5 -1 -0.01
-1 6 0.06
0 20 0.2
5th Cycle
1 29 0.29
1.5 30 0.3
2 34 0.34
2.5 39 0.39
3 43 0.43
3.5 49 0.49
4 52 0.52
4.5 59 0.59
5 64 0.64
5.5 70 0.7
6 75 0.75
6.5 80 0.8
7 88 0.88
7.5 92 0.92
8 101 1.01
8.5 108 1.08
9 117 1.17
9.5 129 1.29
10 139 1.39
10.5 148 1.48
11 167 1.67
12 185 1.85
11.5 204 2.04
11 203 2.03
10.5 203 2.03
10 201 2.01
9.5 196 1.96
9 194 1.94
8.5 192 1.92
[Table continued to next page]

124
[Table continued from previous page]
5th Cycle
8 186 1.86
7.5 184 1.84
7 180 1.8
6.5 174 1.74
6 171 1.71
5.5 166 1.66
5 164 1.64
4.5 154 1.54
4 153 1.53
3.5 147 1.47
3 143 1.43
2.5 137 1.37
2 133 1.33
1.5 126 1.26
1 123 1.23
0 112 1.12
-1 99 0.99
-1.5 97 0.97
-2 92 0.92
-2.5 87 0.87
-3 78 0.78
-3.5 73 0.73
-4 67 0.67
-4.5 28 0.28
-5 17 0.17
-5.5 -3 -0.03
-6 -15 -0.15
-6.5 -26 -0.26
-7 -43 -0.43
-7.5 -56 -0.56
-8 -73 -0.73
-8.5 -89 -0.89
-9 -101 -1.01
-9.5 -114 -1.14
-10 -126 -1.26
-10.5 -167 -1.67
-11 -174 -1.74
-11.5 -182 -1.82
-12 -195 -1.95
-11.5 -193 -1.93
[Table continued to next page]

125
[Table continued from previous page]
-11 -192 -1.92
5th Cycle
-10.5 -186 -1.86
-10 -178 -1.78
-9.5 -171 -1.71
-9 -163 -1.63
-8.5 -153 -1.53
-8 -141 -1.41
-7.5 -131 -1.31
-7 -121 -1.21
-6.5 -110 -1.1
-6 -99 -0.99
-5.5 -88 -0.88
-5 -80 -0.8
-4.5 -73 -0.73
-4 -67 -0.67
-3.5 -58 -0.58
-3 -45 -0.45
-2.5 -40 -0.4
-2 -33 -0.33
-1.5 -31 -0.31
-1 -23 -0.23
0 -11 -0.11
6th Cycle
1 -3 -0.03
2 9 0.09
3 19 0.19
4 29 0.29
5 39 0.39
6 79 0.79
7 104 1.04
8 145 1.45
9 176 1.76
10 199 1.99
11 229 2.29
12 284 2.84
13 308 3.08
14 329 3.29
15 359 3.59
16 399 3.99
17 439 4.39
16 439 4.39
[Table continued to next page]

126
[Table continued from previous page]
6th Cycle
15 437 4.37
14 436 4.36
13 434 4.34
12 425 4.25
11 420 4.2
10 408 4.08
9 397 3.97
8 393 3.93
7 389 3.89
6 376 3.76
5 365 3.65
4 345 3.45
3 340 3.4
2 335 3.35
1 325 3.25
0 318 3.18

127