behavioural biometric identification based on human
TRANSCRIPT

Behavioural Biometric Identification Based on Human-Computer
Interaction
Zaher Hinbarji
A Dissertation submitted in fulfilment of the
requirements for the award of
Doctor of Philosophy (Ph.D.)
to the
Dublin City University
Faculty of Engineering and Computing, School of Computing
Supervisor: Dr. Rami Albatal and Dr. Cathal Gurrin
January 5, 2018

DeclarationI hereby certify that this material, which I now submit for assessment on the programme
of study leading to the award of Doctor of Philosophy is entirely my own work, and that I
have exercised reasonable care to ensure that the work is original, and does not to the best
of my knowledge breach any law of copyright, and has not been taken from the work of
others save and to the extent that such work has been cited and acknowledged within the
text of my work.
ID No.: 14210004.
January 5, 2018

Contents
List of Tables 8
List of Figures 9
Abstract 11
1 Introduction 12
1.1 Problem Statement and Hypothesis . . . . . . . . . . . . . . . . . . . . . . 12
1.2 Identification . . . . . . . . . . . . . . . . . . . . . . . . . . . . . . . . . 14
1.2.1 Identity VS Profile . . . . . . . . . . . . . . . . . . . . . . . . . . 14
1.2.2 Identification Methods . . . . . . . . . . . . . . . . . . . . . . . . 16
1.2.3 Identification-based on HCI Biometrics . . . . . . . . . . . . . . . 17
1.2.4 Applications and Opportunities of HCI biometrics . . . . . . . . . 18
1.3 Thesis Plan . . . . . . . . . . . . . . . . . . . . . . . . . . . . . . . . . . 20
2 Related Work 23
2.1 Definitions . . . . . . . . . . . . . . . . . . . . . . . . . . . . . . . . . . . 24
2.2 Input Devices Based Biometrics . . . . . . . . . . . . . . . . . . . . . . . 25
2.2.1 Mouse Dynamics . . . . . . . . . . . . . . . . . . . . . . . . . . . 25
2.2.2 Keystrokes Dynamics . . . . . . . . . . . . . . . . . . . . . . . . 26
2.2.3 Haptic . . . . . . . . . . . . . . . . . . . . . . . . . . . . . . . . . 27
2.3 Software Interaction Based Biometrics . . . . . . . . . . . . . . . . . . . . 28
2.3.1 Email Behaviour . . . . . . . . . . . . . . . . . . . . . . . . . . . 28
3

2.3.2 Software Forensics (Programming Style) . . . . . . . . . . . . . . 29
2.3.3 Gaming Strategy . . . . . . . . . . . . . . . . . . . . . . . . . . . 29
2.3.4 Sketching Style . . . . . . . . . . . . . . . . . . . . . . . . . . . . 30
2.3.5 GUI Interaction . . . . . . . . . . . . . . . . . . . . . . . . . . . . 31
2.4 Indirect Interaction Based Biometrics . . . . . . . . . . . . . . . . . . . . 31
2.4.1 Audit Log . . . . . . . . . . . . . . . . . . . . . . . . . . . . . . . 32
2.4.2 System Calls . . . . . . . . . . . . . . . . . . . . . . . . . . . . . 33
2.4.3 Network Traffic . . . . . . . . . . . . . . . . . . . . . . . . . . . . 34
2.4.4 Registry Access . . . . . . . . . . . . . . . . . . . . . . . . . . . . 34
2.5 Properties of Suitable Biometrics . . . . . . . . . . . . . . . . . . . . . . . 35
2.6 Logging Software for HCI Experiments . . . . . . . . . . . . . . . . . . . 37
3 Methodology 40
3.1 System Architecture . . . . . . . . . . . . . . . . . . . . . . . . . . . . . . 40
3.2 Data Collection . . . . . . . . . . . . . . . . . . . . . . . . . . . . . . . . 41
3.2.1 Data Collection Principles . . . . . . . . . . . . . . . . . . . . . . 42
3.2.2 Ethical and Privacy Considerations . . . . . . . . . . . . . . . . . 43
3.2.3 LoggerMan - A Computer Usage Logging Tool . . . . . . . . . . . 43
3.3 Behaviour Modelling . . . . . . . . . . . . . . . . . . . . . . . . . . . . . 49
3.4 Behaviour Comparison . . . . . . . . . . . . . . . . . . . . . . . . . . . . 50
3.5 Proposed Approach: Neural Networks based Comparison . . . . . . . . . . 53
3.6 Evaluation . . . . . . . . . . . . . . . . . . . . . . . . . . . . . . . . . . . 57
3.6.1 Practicality . . . . . . . . . . . . . . . . . . . . . . . . . . . . . . 57
3.6.2 Reliability . . . . . . . . . . . . . . . . . . . . . . . . . . . . . . . 57
3.7 Summary . . . . . . . . . . . . . . . . . . . . . . . . . . . . . . . . . . . 59
4 Mouse Dynamics 60
4.1 Overview . . . . . . . . . . . . . . . . . . . . . . . . . . . . . . . . . . . 60
4.2 Related Work . . . . . . . . . . . . . . . . . . . . . . . . . . . . . . . . . 60
4.3 Hypotheses and Research Questions . . . . . . . . . . . . . . . . . . . . . 62
4
4.4 Behaviour Modelling . . . . . . . . . . . . . . . . . . . . . . . . . . . . . 64
4.5 Mouse Curve Features . . . . . . . . . . . . . . . . . . . . . . . . . . . . 64
4.5.1 Efficiency . . . . . . . . . . . . . . . . . . . . . . . . . . . . . . . 65
4.5.2 Straightness . . . . . . . . . . . . . . . . . . . . . . . . . . . . . . 65
4.5.3 Regularity . . . . . . . . . . . . . . . . . . . . . . . . . . . . . . . 67
4.5.4 Self-Intersection . . . . . . . . . . . . . . . . . . . . . . . . . . . 68
4.5.5 Curvature-based Features . . . . . . . . . . . . . . . . . . . . . . . 69
4.6 Behaviour Comparison . . . . . . . . . . . . . . . . . . . . . . . . . . . . 73
4.7 Evaluation . . . . . . . . . . . . . . . . . . . . . . . . . . . . . . . . . . . 75
4.8 Conclusion . . . . . . . . . . . . . . . . . . . . . . . . . . . . . . . . . . 77
5 Keystrokes Dynamics 79
5.1 Overview . . . . . . . . . . . . . . . . . . . . . . . . . . . . . . . . . . . 79
5.2 Background . . . . . . . . . . . . . . . . . . . . . . . . . . . . . . . . . . 81
5.3 Hypotheses and Research Questions . . . . . . . . . . . . . . . . . . . . . 86
5.4 Data Description . . . . . . . . . . . . . . . . . . . . . . . . . . . . . . . 88
5.5 Behaviour Modelling . . . . . . . . . . . . . . . . . . . . . . . . . . . . . 89
5.6 Features Extraction . . . . . . . . . . . . . . . . . . . . . . . . . . . . . . 90
5.7 Evaluation . . . . . . . . . . . . . . . . . . . . . . . . . . . . . . . . . . . 92
5.7.1 Effect of Features Vector Length . . . . . . . . . . . . . . . . . . . 95
5.8 Conclusion . . . . . . . . . . . . . . . . . . . . . . . . . . . . . . . . . . 96
6 GUI based User Behaviour Modelling 98
6.1 Overview . . . . . . . . . . . . . . . . . . . . . . . . . . . . . . . . . . . 98
6.2 Related Work . . . . . . . . . . . . . . . . . . . . . . . . . . . . . . . . . 100
6.3 Hypotheses and Research Questions . . . . . . . . . . . . . . . . . . . . . 102
6.4 Behaviour Modelling . . . . . . . . . . . . . . . . . . . . . . . . . . . . . 103
6.4.1 Keyboard Features . . . . . . . . . . . . . . . . . . . . . . . . . . 104
6.4.2 Mouse Features . . . . . . . . . . . . . . . . . . . . . . . . . . . . 105
6.4.3 Application Features . . . . . . . . . . . . . . . . . . . . . . . . . 106
5

6.5 Approach and Evaluation . . . . . . . . . . . . . . . . . . . . . . . . . . . 106
6.5.1 Experiment 1: Identifying The Individual . . . . . . . . . . . . . . 108
6.5.2 Experiment 2: Environment Dependency Analysis . . . . . . . . . 110
6.6 Conclusion . . . . . . . . . . . . . . . . . . . . . . . . . . . . . . . . . . 112
7 Comparison, Discussion and Fusion 114
7.1 Biometric Properties: Discussion and Comparison . . . . . . . . . . . . . . 114
7.1.1 Universality . . . . . . . . . . . . . . . . . . . . . . . . . . . . . . 114
7.1.2 Performance . . . . . . . . . . . . . . . . . . . . . . . . . . . . . 115
7.1.3 Collectability . . . . . . . . . . . . . . . . . . . . . . . . . . . . . 117
7.1.4 Acceptability . . . . . . . . . . . . . . . . . . . . . . . . . . . . . 118
7.1.5 Circumvention . . . . . . . . . . . . . . . . . . . . . . . . . . . . 119
7.1.6 Permanence . . . . . . . . . . . . . . . . . . . . . . . . . . . . . . 120
7.2 Fusion and Multibiometrics . . . . . . . . . . . . . . . . . . . . . . . . . . 121
7.2.1 Overview . . . . . . . . . . . . . . . . . . . . . . . . . . . . . . . 121
7.2.2 Fusion Strategies . . . . . . . . . . . . . . . . . . . . . . . . . . . 123
7.2.3 Overall Evaluation . . . . . . . . . . . . . . . . . . . . . . . . . . 127
8 Application Considerations 130
8.1 Ethical and Privacy Issues . . . . . . . . . . . . . . . . . . . . . . . . . . 130
8.1.1 Examples . . . . . . . . . . . . . . . . . . . . . . . . . . . . . . . 130
8.1.2 Privacy Concerns . . . . . . . . . . . . . . . . . . . . . . . . . . . 132
8.2 Real World Deployment Considerations . . . . . . . . . . . . . . . . . . . 135
8.2.1 Security . . . . . . . . . . . . . . . . . . . . . . . . . . . . . . . . 136
8.2.2 Compression . . . . . . . . . . . . . . . . . . . . . . . . . . . . . 136
8.2.3 Quality Assessment . . . . . . . . . . . . . . . . . . . . . . . . . . 138
8.2.4 Interoperability and Scalability . . . . . . . . . . . . . . . . . . . . 139
9 Conclusion and Future Work 140
9.1 Summary and Contribution . . . . . . . . . . . . . . . . . . . . . . . . . . 140
6

9.2 Limitations and Future Work . . . . . . . . . . . . . . . . . . . . . . . . . 143
Bibliography 145
7

List of Tables
1.1 The research questions explored in this thesis . . . . . . . . . . . . . . . . 22
3.1 Number of neurons in each layer of the neural networks utilised in this thesis. 55
4.1 EER values and the corresponding session length . . . . . . . . . . . . . . 77
4.2 Mouse Dynamics Approach Summary . . . . . . . . . . . . . . . . . . . . 78
5.1 FAR and FRR identification values reported by Gunetti [33] using different
distance measures . . . . . . . . . . . . . . . . . . . . . . . . . . . . . . . 95
5.2 Keystrokes Dynamics Approach Summary . . . . . . . . . . . . . . . . . . 97
6.1 Different sources of interaction events . . . . . . . . . . . . . . . . . . . . 104
6.2 Number of computer events collected for each user . . . . . . . . . . . . . 108
6.3 Approach Summary . . . . . . . . . . . . . . . . . . . . . . . . . . . . . . 113
7.1 Performance overview of our models . . . . . . . . . . . . . . . . . . . . . 117
7.2 Local machine vs. over web collectability comparison. . . . . . . . . . . . 118
7.3 Sensitivity of data collected in our components . . . . . . . . . . . . . . . 119
7.4 Summary of fusion techniques . . . . . . . . . . . . . . . . . . . . . . . . 128
8.1 Average number of events generated by one of our subjects in one weekday
and the corresponding space required for storage using LoggerMan . . . . . 137
8

List of Figures
1.1 Identity vs. Profile vs. Persona . . . . . . . . . . . . . . . . . . . . . . . . 15
1.2 The main HCI components studied in this work. . . . . . . . . . . . . . . . 21
3.1 Biometric System Architecture . . . . . . . . . . . . . . . . . . . . . . . . 42
3.2 LoggerMan Menu . . . . . . . . . . . . . . . . . . . . . . . . . . . . . . . 46
3.3 Apps Cloud . . . . . . . . . . . . . . . . . . . . . . . . . . . . . . . . . . 47
3.4 Mouse/Keyboard Usage . . . . . . . . . . . . . . . . . . . . . . . . . . . . 48
3.5 Windows Titles Cloud . . . . . . . . . . . . . . . . . . . . . . . . . . . . 48
3.6 Apps & Screenshots Timeline . . . . . . . . . . . . . . . . . . . . . . . . 49
3.7 Two main approaches for behaviour modelling and comparison . . . . . . . 51
3.8 Comparison based on distance measuring techniques between features vectors 52
3.9 Comparison based on Machine Learning techniques . . . . . . . . . . . . . 52
3.10 An example of a three-layer neural network with 3, 4 and 2 nodes in the
input, hidden and output layers accordingly . . . . . . . . . . . . . . . . . 54
3.11 Work flow of our proposed approach . . . . . . . . . . . . . . . . . . . . . 56
4.1 Different mouse curves with their efficiency values. . . . . . . . . . . . . . 66
4.2 Different sets of points with their straightness values. . . . . . . . . . . . . 67
4.3 The corners of a regular polygon lie at equal distances from its center. This
implies that the variance of the distances is zero and thus regularity is one. . 68
4.4 Curvature of a smooth curve. . . . . . . . . . . . . . . . . . . . . . . . . . 70
4.5 Curvature and total curvature of a mouse curve (piecewise linear curve). . . 70
9

4.6 Curvature can be smoothed by replacing delta functions with Gaussian
functions of the same weight and at the same position. . . . . . . . . . . . 72
4.7 FAR and FRR values according to different authentication thresholds for
sessions of length 100 curves and the corresponding ROC curve. . . . . . . 76
5.1 Scan codes of a PC keybaord: showing a unique number for each key in
hexadecimal . . . . . . . . . . . . . . . . . . . . . . . . . . . . . . . . . 82
5.2 different possible definitions of digraph used in literature . . . . . . . . . . 83
5.3 Digraph features values for two different samples of the same user from his
own point of view (same digraph features representation) . . . . . . . . . . 92
5.4 Digraph values for the same sample from the point of view of two different
users (different digraph features representation) . . . . . . . . . . . . . . . 93
5.5 FAR and FRR values according to different authentication thresholds and
the corresponding ROC curve. . . . . . . . . . . . . . . . . . . . . . . . . 94
5.6 Error rates according to different values of features vector length . . . . . . 95
6.1 FAR and FRR values according to different authentication thresholds for
sessions of 30-minute long and the corresponding ROC curve. . . . . . . . 109
6.2 Identification equal-error rates comparison according to experiment 1 . . . 110
6.3 Error rates of experiment 2 by using all features combined . . . . . . . . . 111
7.1 Comparison of Google search queries volume for mouse and keyboard terms 116
7.2 Fusion at features level. . . . . . . . . . . . . . . . . . . . . . . . . . . . . 124
7.3 Fusion at matching level. . . . . . . . . . . . . . . . . . . . . . . . . . . . 125
7.4 Fusion at decision level. . . . . . . . . . . . . . . . . . . . . . . . . . . . . 126
10

AbstractZaher Hinbarji
Behavioural Biometric Identification Based onHuman-Computer Interaction
As we become increasingly dependent on information systems, personal identification
and profiling systems have received an increasing interest, either for reasons of personali-
sation or security. Biometric profiling is one means of identification which can be achieved
by analysing something the user is or does (e.g., a fingerprint, signature, face, voice). This
Ph.D. research focuses on behavioural biometrics, a subset of biometrics that is concerned
with the patterns of conscious or unconscious behaviour of a person, involving their style,
preference, skills, knowledge, motor-skills in any domain. In this work I explore the cre-
ation of user profiles to be applied in dynamic user identification based on the biometric pat-
terns observed during normal Human-Computer Interaction (HCI) by continuously logging
and tracking the corresponding computer events. Unlike most of the biometrics systems
that need special hardware devices (e.g. finger print reader), HCI-based identification sys-
tems can be implemented using regular input devices (mouse or keyboard) and they do not
require the user to perform specific tasks to train the system. Specifically, three components
are studied in-depth: mouse dynamics, keystrokes dynamics and GUI based user behaviour.
In this work I will describe my research on HCI-based behavioural biometrics, discuss the
features and models I proposed for each component along with the result of experiments.
In addition, I will describe the methodology and datasets I gathered using my LoggerMan
application that has been developed specifically to passively gather behavioural biometric
data for evaluation. Results show that normal Human-Computer Interaction reveals be-
havioural information with discriminative power sufficient to be used for user modelling
for identification purposes.

Chapter 1
Introduction
1.1 Problem Statement and Hypothesis
Nowadays we are continuously using and fully surrounded with devices and systems that
are generating and/or capturing various forms of personal data. Many commercial wear-
able devices are providing us with insights about our health by tracking our physical ac-
tivities. Lifelogging cameras are capturing our daily social interactions, food consumption
and many aspects of our life style and habits. Both of our interests and intents are inferred
by social media and e-commerce platforms through the gathering of our likes, posts and
browsing history. Through their ever-improving sensors, smart phones are now able to au-
tomatically localise our home and work places, in addition to various real-time contextual
information and predictions (weather, traffic,..). Our houses are now more secure and com-
fortable thanks to IoT technologies and sensors. All of these systems can be mining our
digital traits to build personal profiles to provide adaptive and customised services.
One of the important applications of profiling and activity tracking is the protection and
detection of suspicious and fraudulent actions. Face recognition is utilised to prevent known
cheaters from entering casinos. Unauthorised access to our emails is prevented by mod-
elling our access patterns including locations, devices, time and other personal information.
Profiling systems are also leveraged in banks to block suspicious financial transactions. On-
12

line learning platforms are analysing users’ typing patterns for identity verification. All the
above examples are a small fraction of systems that are in place to identify the identity of
the user, and to make sure that the monitored actions are conformed to his/her profile built
on historical actions and data.
In the special domain of computer security, FBI reported that ’insiders commit as much
as 75 percent of all cyber crime’ [63]. In this case, the attackers managed to pretend to
be the legitimate user of the system, which clearly shows that the current typical security
and identification systems based on passwords and similar technologies are not sufficient
to fully protect our digital assets. This problem has led to increasing interest in continuous
identity check to make sure the current user is the actual authorised one who initially started
the session. The most convenient way to do this is by observing and profiling the normal
human computer interaction (HCI) via typical input devices.
In this research work, we address the challenge of user profiling and identification based
on behavioural traits observed during regular computer usage. Our general hypothesis is
that normal human computer interaction reveals behavioural information with discrimina-
tive power sufficient to be used for user modelling for identification purposes.
In the following sections of this chapter, we will start by defining the concept of identi-
fication, clarifying its differences with the profiling, and summarising the methods used for
identification. Then we will focus on HCI biometrics as mean of identification, by providing
the motivations behind it, and highlighting the applications and opportunities of HCI-based
identification technologies. And finally we will provide the thesis structure.
13

1.2 Identification
1.2.1 Identity VS Profile
In the beginning of the Internet era, people were enjoying much more anonymity as iden-
tification and profiling technologies were not deployed and utilised as they are now. Since
then, many on-line businesses have adopted systems that build profiles of users, offer rec-
ommendations and maintain histories of user actions. While some people worry about their
privacy including the amount and the purpose of capturing personal information, others ig-
nore that and they just appreciate the services they get in return.
Identity can be defined in many ways, but to make it simpler we present it as ”who
you are and what you do”. It’s the combination of the individuals characteristics, including
birth date, birth place, parents, attended schools, height, weight and so on. Some of them
can never change, like birth information, and some change over time, such as height and
weight. In a similar manner, when we use Internet and computer systems, our identity is the
collection of our characteristics and interactions. Because we interact differently with each
system or website, each of these systems have a different view of who we are and what we
do. The different views these systems have about us, can be called: partial identity as none
of them have the full and complete picture of us. Every computer system we interact with
has its own idea about us based on our interaction and the purpose behind this. For instance,
Amazon has a partial identity of us based on our purchase history and the products we look
at. Google, on the other hand, can establish their own partial identity for us on the ground
of our search queries. Apple can do the same based on our usage of their devices (iPhone,
iPad, Mac, etc.).
We might be able to control some of the information linked to our partial identity.
However, some other information is out of our control or even completely transparent to us.
In all cases, all of this information contributes to ”who you are and what you do”. When
our partial identity is created by us to present our self to a service provider, it is called then
14

Figure 1.1: Identity vs. Profile vs. Persona
”Persona”. In contrast, the term ”Profile” can be used to refer to our partial identity that
has been formed by the service provider after collecting our personal characteristics and/or
our actions traits in a process called ”Profiling” (see Figure 1.1). The representation of
the profiles differs from one system to another based on the purpose of the profiling and
the targeted use-case. An online E-commerce website may have user profiles represented
as a list of interest and purchasing attributes that can be even readable and processable by
humans (marketing team) as well as the profiling system in place. Other systems can have a
completely black-box like of profile representations that can be processed only by machines,
such as an anti fraud profiling system. Our main focus in this work is on building user
profiles based on the personal characteristics of the human-computer interactions revealed
during normal computer usage to be used later for user identification. In other words, we
capture the personal interaction traits of each user during normal computer usage and utilise
that to form their profiles. Later, the captured behaviour traits of a user can be compared
15

against these profiles to allow the system to establish the real identity of the user.
1.2.2 Identification Methods
Personal identification is the process of associating an identity with an individual. Re-
solving the identity of a person can be divided into two different problems with different
complexities: (1) verification (authentication) and (2) recognition (commonly known as
identification). During verification, the system tries to answer the question ”is this per-
son who they claim they are?”. It is a one-to-one matching process as the system tries to
match the provided identity with the one the system already knows. Identification, on the
other hand, refers to the problem of finding the correct identity from a set of already known
identities (closed world) or otherwise (open world). ”Who is this person?” is the question
identification systems have to answer by a one-to-many matching process against all other
individuals already in the database. And as such, verification systems can usually gener-
ate results more quickly and more accurately than identification systems because they only
need to compare the presented identity to a reference one.
Personal identification can be done by something the user knows (e.g., password, PIN
code, pattern), something the user has (e.g., card, access token, wrist band, passport) or
something the user is or does (e.g., a fingerprint, signature, face, voice, which are known
as biometrics) [73]. The term biometrics refers to the technological measurement of either
physiological or behavioural human characteristics[101]. Biometrics technology is contin-
uously developing to improve accuracy, robustness and security by combining efforts of
several scientific and technological domains, such as computer science, engineering, psy-
chology and medicine. While physical biometrics are related to the shape or the physical
attributes of the body such as: fingerprint, palm print, hand geometry, DNA, iris recognition,
face recognition. Behavioural biometrics, on the other hand, is interested in the patterns of
conscious or unconscious behaviour of a person, involving their style, preference, skills,
knowledge, motor-skills or strategy in any domain [99]. In addition to person identification
and verification, behavioural biometrics can provide useful profiling information such as a
16

measure of a persons preferences, mood or stress, and they can also link the individual to
non-biometric information [101].
1.2.3 Identification-based on HCI Biometrics
Human-computer interaction (HCI) researchers are interested in studying the way we in-
teract with computing systems in attempt to design novel and better interfaces. HCI-based
biometrics is a sub-domain of HCI research focusing on studying the users’ computer usage
patterns for identification purposes. As users normally show different skills, knowledge and
strategy while achieving their everyday activities on computers, we expect a good poten-
tial for building reliable identification systems based on modelling these behavioural traits.
This is done by observing how each user interacts with the machine and use that to build
profiles based on the extracted usage patterns.
Direct VS Indirect : HCI-based biometrics can be divided into two categories: direct and
indirect HCI-based biometrics [99]. The first category consists of biometrics that are based
on direct user interaction with the machine through input devices (mouse, keyboard or hap-
tics), including these that are focusing on the kind of tasks or applications that involve ad-
vanced human behaviour (strategy, planning, knowledge) such as emailing behaviour [85]
[21] or gaming strategy [48] [20] for example. On the other hand, the indirect HCI-based
biometrics are those that are concerned about the indirect low-level computer events that the
system generates according to different user’s actions such as audit logs [102] [64], system
calls [40] or network traffic [50].
The need for special hardware devices for data capture is a big limitation of most bio-
metric systems. The advantage of HCI-based identification system is that it can be imple-
mented using regular input devices (mouse or keyboard) and it does not require the user to
perform specific tasks to train the system [73], [1], [67], [80]. Thus, it can be completely
transparent to the end users who won’t have to change their routines or even know the tech-
17

nology is in place.
Static VS Dynamic : User identification can be achieved statically or dynamically. In the
static approach, the system checks the identity of the user once, usually at the beginning of
the session so any change of user after that will be unnoticeable to the system. In contrast,
dynamic identification checks the user continuously over the session which can effectively
prevent session hijacking, however that should be done passively without interrupting the
user [22]. One could easily imagine the computer immediately locking out a user who
accesses the private data of the data owner. In some dramatic cases, an individual might
be forced to give initial access by typing a password or providing a fingerprint, but then
that individual could be replaced by someone else at the computer to take control. In real
life scenarios, business policy might be violated by employees who share their passwords
with others or leave their computers logged-in to someone else to use the system. HCI-
based identification can be applied to detect such problems sufficiently reliably to be worth
investigating, because even a low detection accuracy would give a warning to the system
admin to investigate and double check that behaviour.
In this thesis, we explore dynamic user identification through direct HCI-based biomet-
rics.
1.2.4 Applications and Opportunities of HCI biometrics
The development of reliable and non-intrusive identification technology can have a big im-
pact on building more secured and user-friendly systems and environments. HCI-based be-
havioural biometrics, in particular, represent good commercial opportunities as they are less
intrusive and have lower cost of implementation compared to other identification methods
as long as their privacy issues have been addressed correctly. In 2015, biometrics market
was estimated to be worth 13.8 billion [94].
HCI-based biometrics can provide a significant direct value for many applications and
18

services, and can add to their credibility especially in the cases where reliable identification
and fraud detection are crucial to the operation, such as:
• Remote learning: as many institutes and organisations are providing more online and
remote courses and examinations, the need for identification systems is increasingly
required in order to check the identity of the student and make sure it’s consistent
throughout the whole examination session [27]. The success and credibility of such
degrees can be really affected by the quality of their identity verification system.
• Online banking: HCI-based identification systems represent a great potential for on-
line banking systems that need to be sure about the current user identity before and
while providing their financial services. A reliable security system in place can have
a big positive impact on banks losses due to fraud and identity theft.
• Policy enforcement: sharing passwords or keys (such as software licences) can be a
real problem in some workplaces. Dynamic HCI-based biometrics can be employed
to make sure that the non-sharing policy of the organisation is followed by individuals
as such the real beneficiary of the resources is only the one who is supposed to be.
In addition to the above direct applications, behavioural biometrics research can con-
tribute to many related domains that rely on behaviour modelling and profiling such as:
• User modelling: where the system builds an understanding of the user including their
skills, knowledge, needs or other attributes that of interest depending on main purpose
of the system. The user model can be used to provide customised and personalised
services. For example, the system can adapt to the user’s specific needs and offer a
better interfaces or services focusing and targeting the user’s interest or preferences.
• Consumer behaviour analysis: in order to understand the individuals or groups se-
lection and purchasing habits, a detailed tracking and examination of behavioural
traits are necessary. These traits identify the elements that contribute to the purchase,
loyalty, retention, and any other relevant actions such as providing positive refer-
19

rals. Such understanding of consumption and purchasing behaviour can help both
marketer and producer to have better insight into the market.
• Opponent modelling: the process in which we build a profile of the opponent in
attempt to predict their actions and their strategy which could give us an edge over
them in a game or a competition. This term is widely used in the game theory domain.
Unlike in some games, such as Checkers, where playing the best strategy is enough
to win the game regardless of the other player’s strategy, predicting the other player’s
behaviour and acting on that is necessary to win some kind of games (playing cards
games for instance).
• Offender profiling: is an investigative method to profile and build an understanding
about the type of person who committed a crime by automatic mining and linking
of the available evidences. Along with predicting the likelihood of future crimes to
happen and the potential suspects based on previous patterns.
1.3 Thesis Plan
This research is inspired from the lifelogging domain, where lifelogging is defined as ”a
phenomenon whereby individuals can digitally record their own daily lives in varying
amounts of detail and for a variety of purposes” [34]. In this research, we explore user
identification based on the patterns observed during normal Human-Computer Interaction
by continuously logging the corresponding computer events. Specifically, we focus here on
three components: mouse dynamics, keystrokes dynamics and GUI based user behaviour
(see Figure 1.2), where the three components form the main interaction methods currently
employed during everyday computer usage. In all of the three components, we will follow
strict conditions we believe are necessary to produce a reliable identification system. In
particular, we will focus on the dynamic mode of identification (throughout the session) to
consider real life working environment and making sure that the model will work passively
throughout the session during normal daily activities with no enforced tasks or limitations.
20

Figure 1.2: The main HCI components studied in this work.
A discussion about the relevant works to each component of our research will be pre-
sented in the beginning of its own chapter (chapters 4, 5, 6) including the drawbacks and
limitations of these works. But before that and in the next chapter (chapter 2), we will brief
an overview about the different works in literature that focus on modelling HCI behavioural
traits. After that, our research methodology is presented in chapter 3 along with a descrip-
tion of our data collection software that we built specifically for our experiments. Chapter 7
will bring the three studied components together for an overall discussions and comparisons
along with presenting the different fusion strategies that can be used to combine the three
components into one identification system. Finally, in chapter 8, we discuss and propose
several aspects we think they are necessary for reliable deployment of biometric systems
in real life scenario. That includes the privacy issues and concerns people have about such
systems, as well as operational and other technical challenges.
Table 1.1 provides the research questions we are trying to address in this thesis. The
details of these questions are discussed later in their relevant chapters, where we present
more contextual details that help to justify our motivations and reasons behind each one of
them. Our research questions of each component focus on studying its own usage character-
21

istics and patterns, in addition to addressing the different drawbacks and limitations of the
state-of-the-art approaches that affect their ability to work in real environment settings and
scenarios. Thus, the different questions explored across the three main interaction meth-
ods contribute to prove our general hypothesis about how discriminative is the information
revealed during typical Human-Computer interaction using regular input devices.
Component Chapter Research Questions OverviewMouseDynamics
4
• What are the set of features that are transla-tional, scale and rotational invariant, and de-scribe the characteristics of the mouse curves?
• Represented by the previous features, domouse curves have discrimination power toidentify the user?
KeystrokesDynamics
5
• What can we do to handle the sparsity andhigh dimensionality problems of free-textkeystroke dynamics features vector (featuresvector design)?
• Can we achieve comparable accuracy to thestate-of-the-art with less computational powerrequired during identification time?
GUI basedBehaviourModelling
6
• What global features can we extract to modelusers’ behaviour in a GUI based system foridentification purposes?
• How much discriminative is each subset offeatures (mouse, keyboard, app)?
• Is the model environment independent (envi-ronment agnostic)?
Table 1.1: The research questions explored in this thesis
22

Chapter 2
Related Work
During normal everyday computer usage, people show different abilities, expertise, skills
or knowledge while completing tasks, entertaining themselves or surfing the web...etc. This
can range from their own personal way of using the input devices (e.g. mouse or keyboard)
to employing their own knowledge and expertise to use some software more efficiently than
others. In this chapter we provide an overview of some of the related studies in literature
categorised in three main sections. First, we will talk about the subset of HCI biometrics
that are based on input devices (mouse, keyboard and haptic) as they are derived from
direct human-computer interaction. Then, we will brief some interesting works in literature
that have focused on analysing the usage of specific software by users and their observed
behaviour and patterns. The third category is dedicated to survey the set of identification
methods that built on the top of events and logs that are indirectly generated as a result
of the interaction with the computer such as system calls, audit logs or network packets.
We are not in a position to compare our work directly with many of these works as they
are applied in different use cases. However, where appropriate we will in the following
chapters directly compare our work with others. Specifically, the focus of this thesis is
on mouse dynamics (chapter 4) and keystrokes dynamics (chapter 5) as input devices based
biometrics and on GUI based behaviour modelling (chapter 6) as software interaction based
biometrics. Before we start, we define in the next section the elementary concepts used to
describe both the details of the related work as well as our research methodology that is
23

presented in the next chapter.
2.1 Definitions
The following concepts are used across this document. While they might have different
meanings in other research works or domains, we adopt the following definitions.
Definition 1. Biometic System
The biometric system that we refer to in our work is a software installed on personal com-
puters that is able to distinguish between individual users by dynamically (while using the
system) analysing their behavioural data (also called biometirc traits). The actual analysis
does not have to be done on the user’s machine, but rather it could be done on a server that
receives the collected behavioural data from a thin client running on the user’s computer.
Definition 2. Biometric Trait
In general, biometric trait refers to any physiological (fingerprint, palm print, hand geom-
etry, etc.) or behavioural (voice, gait, typing rhythm, etc.) human characteristic used to
describe individuals. In our work, we focus on only behavioural characteristics of individ-
uals observed while interacting with personal computers. In this thesis, the terms: trait and
characteristic are used interchangeably.
Definition 3. Legitimate User
This refers to each individual that is already enrolled and known to the biometric system.
Definition 4. Intruder/Attacker
An intruder or attacker is the individual who tries to mislead the biometric system by pre-
tending to be a legitimate one.
Definition 5. Session
In the context of this thesis, a session is defined as the consecutive biometric traits observed
during a time range or after a number of user actions (e.g. after 100 mouse actions) while
users are normally interacting with their computers. The specific session definition for each
of our studied components is presented later in each corresponding chapter.
24

Definition 6. Feature Extraction
Feature extraction in our work refers to the step in which the collected biometric traits are
processed to extract derived values that are designed to represent the important personal
attributes in the original data (also known as behaviour signature).
Now we can move forward by providing an overview of some of the related works
in literature categorised in three main sections: input devices based biometrics, software
interaction based biometrics and indirect interaction based biometrics.
2.2 Input Devices Based Biometrics
These are the biometrics that are based on direct Human-Computer Interaction via input
devices which involve different types of muscle actions and skills.
2.2.1 Mouse Dynamics
Mouse dynamics is the field that studies the usage characteristics and patterns users show
while interacting with the machine using a pointing device such as a mouse or a trackpad.
As we currently accept handwriting signature as an authorisation and identification method
in our society, researchers attempt to form a signature-like profile for each user in the system
that can be used for identification. Several mouse dynamics approaches for authentication
have been proposed in the literature, using different types of features. Hayashi et al. [36]
presented one of the earliest research in this domain; users were requested to use the mouse
for drawing circles or other figures, and then analytics algorithms were applied on features
based on the distances between the mouse coordinates and the centre of the shapes. In [73],
Pusara and Brodley used the distance, angle and speed between pairs of data points as raw
features which then used to produce their mean, standard deviation and the third moment
values (distance, angle and speed) over a window of N data points. In Ahmed and Traore’s
work [1], raw mouse events are aggregated and then classified by action type. Consecutive
actions are grouped into sessions, from which features related to movement speed, move-
ment direction, traveled distance are computed producing user signature. Schulz in [80]
25

presented a model in which raw data are broken into mouse curves; length, curvature and
inflection points of the curve are used as main features, and a reference signature is built by
generating histograms from the curve characteristics of multiple curves. The verification
is implemented then by computing the Euclidean distance between the reference signature
and the mouse activity observed during authentication time. More details will be presented
in chapter 4, where our mouse dynamics work is discussed.
2.2.2 Keystrokes Dynamics
In the literature, keystrokes dynamics approaches are divided into methods that verify the
user behaviour during the beginning of the session and methods that continuously check
the user throughout the session. The first typically depends on features extracted while the
user type a predefined short text. The model built from that features is then compared to
the new stream of measurements captured later on during the enrolment phase when the
user is asked to type the same predefined text [14], [6], [60], [9]. Bergadano et al [6],
used the duration of typing two (di-graph) and three (tri-graph) consecutive characters of a
text to construct the user profile. After ordering that graphs based on their durations, their
relative ordering was compared to the relative order of other durations generated from other
users. Keystrokes methods for continuous identification of users monitor typing features
continuously while the user types free text. Gunetti et al. [33] extended the approach of
[6] to work on free text. In addition, they presented another distance measure based on
absolute values of durations and they finally utilised the two distance methods together to
do the classification. Instead of considering all the characters, Curtin et al [19] used only
the common characters and special keys. The duration of common characters, transition
periods of common pairs and the occurrence frequency of special keys are used to train a
nearest neighbour classifier. A comprehensive discussion about the literature of keystrokes
dynamics will be presented in chapter 5, along with our keystrokes dynamics approach.
26
2.2.3 Haptic
Haptic devices are considered both input and output devices as they allow users to feed in-
formation to the system as well as to get feedback in term of vibrations, motions or forces.
This is in attempt to introduce the tactile sensation to Human-Computer Interaction by pro-
viding information about position, speed, acceleration, direction, pressure, force and angle
of the interaction. To utilise such information in modelling user’s behaviour, Orozco [69]
asked 22 volunteers to navigate the stylus through a virtual maze that he had created on an
elastic membrane and which had sticky walls. The experiment was to model the user ability
to navigate the model including their reaction time to release from sticky walls, moving
velocity and applied pressure. Each user has performed the maze 10 times. Several features
have been calculated to from the user behaviour profiles such as average velocity, rounded
turns, angular turns and navigation style. The work concluded that the results showed pos-
sibility to recognise user’s identity in a haptic system. In a different work, Orozco et al.
[70] designed an experiment in which users have been asked to simulate making a phone
call via a touch pad controlled through a haptic pen. This was to analyse how people react
to using daily tools or devices and how this can be exploited to detect identity. Applied
force, pen’s position and keystroke duration were used as features. Such approaches can be
applied to control access in haptic or virtual reality system such as continuous identification
in tele-operation. Haptic devices are out of scope of our thesis as they are still not widely
used nor available for everyone during normal computer usage, which is the main focus of
our research.
After this overview of some of the input devices (hardware) based identification tech-
niques, we proceed by presenting a number of key research works that are based on mod-
elling the users’ behaviour observed while using computer software. This would give us
an idea about how much information our computer usage traits can tell about us in term of
identification.
27

2.3 Software Interaction Based Biometrics
We will now examine a number of HCI-based biometrics that are concerned with the ad-
vanced behavioural characteristics such as skill, knowledge or style revealed while using
computer software.
2.3.1 Email Behaviour
Email usage behaviour can differ significantly from one to another based on many factors.
Some people check and send their emails mainly in the early morning, others tend to get this
done after finishing main work activities. Checking frequency, number of daily emails and
different addresses each person deals with, length of emails, emails organising and archiv-
ing can all be attributes that form our email behaviour profile. In [85] authors proposed
mining techniques to build profiles for normal and abnormal user email behaviour. They
illustrated this by detecting viral email propagation without content-based analysis used in
common virus scanners. Emails from 15 users were used for evaluation with injected viral
emails. A 99% detection rate were reported with 0.38% of false positive. Authors started
by identifying the group of people that participate in common email connections and then
use that to detect suspicious emails that violate normal behaviour of established groups.
According to the authors, this was effective because a virus attacking a user’s contact list
won’t have information about the user’s social network and won’t conform to his/her typical
behaviour.
Researchers in [21] studied structural characteristics and linguistic features of emails
content to achieve author identification, i.e to recognise the likely author of an email. They
applied support vector machine learning algorithm to discriminate between authors across
different email topics as well as for aggregated topics. Many features were extracted from
emails content such as functions words and their frequency distribution, word length dis-
tribution. In addition to, features related to the structural attributes of the email body such
as containing a greeting, usage of a farewell acknowledgement, containing a signature text,
number of attachments and even HTML tag frequency distribution. Anderson et al [17] have
28
also extracted a large set of stylometric features for author identification for both emails and
text documents. N-graphs features resulted in good accuracy according to their evaluation.
2.3.2 Software Forensics (Programming Style)
Software forensics is the field concerned with analysing software binary or source code to
identify and describe the characteristics of software author and intention for either intellec-
tual property infringement, plagiarism of code, malware attack (virus, worm, trojan) or any
computer fraud. This also can be used in lawsuits and settlements when companies are in
disputes for code-ownership related issues to guide the investigation or even simply to know
the original programmer of a piece of text for debugging and code maintenance purposes.
The used techniques to analyse a source code differ significantly from those used for a bi-
nary file examination. In [32] authors discussed several features that can be used for source
code authorship analysis such as used data structure, complexity of the control flow, quality
and quantity of the comments, variables naming style (capitalisation, short/long names),
special macros or layout conventions (indentation and borders). Similarly, histogram-based
statistical analysis of source codes have been done by [54] using both text-based and coding
style metrics.
The problem becomes more challenging in case of a binary file (compiled code) as much
evidence is lost after compilation including comments, variable names and layout as well as
the optimisations performed by compilers that result in a significantly different executable
code compared to the original source code. Nevertheless, researchers in [83] pointed out
several features that remain in the binary and that can lead to the original author, algorithms
and data structure can be profiled along with any remaining signs that indicate the compiler
and system used, the use of library and system calls, any detected error or bugs or even the
symbol table content if the executable is produced in a debug mode.
2.3.3 Gaming Strategy
Making the computer plays a game is often achieved based on the assumption that the
opponent has a similar goal (but opposite) and employs a similar strategy. This assumption
29

was the base that the famous mini-max algorithm was built on in 1928 by Neumann. Since
then, several enhanced algorithms and procedures have been developed that take advantage
of the increasing computing power of computers, resulting in computers challenging (and
defeating) chess world champions. However, there are cases where the traditional gaming
algorithm (such as mini-max, a-b search) does not produce the best possible move as it
does not take into consideration information about the actual opponent. Researchers in
[48] discussed the main challenges in building a opponent’s plan recogniser in real-time
strategy games, such as StarCraft, and introduced a new approach for this. In such strategy
games, players need to predict how and where the opponents will attack to take proper
defencive actions as well as analysing the vulnerabilities in the opponent’s likely defence
plan to be considered in the attack strategy. The advantage of predicting and modelling
the opponent’s behaviour can be seen clearly in poker. Davidson et al [20] revisited the
problem of predicting the opponent’s next action in a poker game based on a large set of
contextual information that has been investigated with artificial neural networks. Previous
actions (such as call amount) are used as additional features and have been added to the
earlier model to create new contextual information.
2.3.4 Sketching Style
To identify users based on their sketching styles, authors of [26] have utilised several fea-
tures such as pen tilt and pressure, obtained from a special drawing application that has been
designed to record pen location (x,y), pressure, time, and tilt information for each stroke.
The goal was to identify the user behind each stroke on a stroke-by-stroke basis so the re-
sulted identification system can be deployed even in a collaborative drawing application
where several users can participate in drawing one document. The paper concluded that
with only pen pressure and tilt, a strokes creator can be identified accurately even though
strokes in the sample were quite small, having only a few pixels in length.
By using both shape recognition and user’s personal information about the content of
the sketch, an authentication system have been proposed in [12]. The scale, connectiv-
ity and orientation relations between primitive shapes a sketch is made up along with the
30
characteristic way users draw these primitives shapes are all taken as statistical features.
Similarly, the passdoodle framework introduced in [92] is trained on the movement and
shape of a distinct doodle drawn by each user during enrolment phase as an identification
mechanism. Later, the system can recognise users based on the doodle they draw on a touch
screen during authentication phase.
2.3.5 GUI Interaction
Since the early days of computing systems, researchers have been proposing solutions to
track and analyse the behaviour of computer users. This can be seen in the work of Boies
in 1974 [10] and the work of Anderson in 1980 [3] [71]. In literature, command-line based
systems have been the main target of most of the studies related to user behaviour analysis.
This is built on the assumption that users vary in their familiarity with the command line
interfaces including the awareness of their parameters and features such as the works of
[53] [91] [79] [62].
The shift toward graphic user interfaces (GUI) that are now supported by most mod-
ern operating systems, has not been matched with an equivalent increase of GUI based
behaviour profiling research. Nevertheless, a few studies have been reported. Several win-
dows based features (windows switch duration, new windows duration, number of windows
open at once) were used in [31] and then extended in [47] using symbolic learning. In the
work of [30], authors reported that the addition of features based on the running processes
and keyboard usage statistics did not improve the results they were getting using several
mouse based features only on three users. More details about the related work in this area
will be presented in chapter 6.
2.4 Indirect Interaction Based Biometrics
During our normal everyday computer usage, a huge stream of events, system calls, network
packets, registry access and many other different low-level logs are generated with regard
31

to, and as a result of, our interaction and computer activities. By looking into these events
that are generated unintentionally by the user, researchers attempt to observe and model
the user’s behaviour indirectly. As security is one of the main applications of behaviour
biometrics, there is an interdependency between these biometrics and Intrusion Detection
Systems (IDS) where the development and advance in one field could improve the other.
IDS can be divided into two types depending on how they work: anomaly detection
and misuse detection. Anomaly detection systems work based on the assumption that an
attack differs from a normal behaviour. Thus, they model normal usage behaviour and use
that as a baseline to consider any different behaviour as suspicious. The advantage of this
is the ability to detect new attacks that have not been known before as they look for any
violations of the normal behaviour they already know, but this comes with the price of a
high false-positive rate. Misuse detection systems, on the other hand, define and look for
only what should be considered as a problem (signature-based). They basically go through
the logs looking for patterns that match with their database of known attacks. They are
more practical in real life scenario as they produce fewer false positives but their main
disadvantage that they can not detect new attacks which actually need to be modeled and
added to the database once discovered.
2.4.1 Audit Log
Many systems and devices around us produce and keep a set of records that provide evi-
dence of the sequence of activities that related to their operation. This can contain records of
user activity and software interaction and they can range from only security-related events
(such as unsuccessful login attempt) to a huge log of every system call for every process in-
cluding, resources (input/output, memory and CPU) usage, file system changes and network
traffic. These logs have important information about the system usage/operation and can
be used for many purposes such as accountability, problem detection or intrusion detection
where they are mined to find patterns that could point to security breach.
In [102] a Markov model is constructed to represent a temporal template of normal be-
32
haviour in a computer system based on historic records of the systems normal behaviour.
Audit log of a Sun Solaris system is used to test the model where they considered a low sup-
port probability indicates an abnormal behaviour as a result of intrusive activities. Similar
data obtained from NT security logs were explored in [64] in attempt to build a system that
can learn specific application’s behaviour. A technique to build an automatically-learned
finite automaton to identify malicious activities is presented.
2.4.2 System Calls
The work in [40] proposed an intrusion detection approach based on system calls. They
illustrate that system calls sequences invoked by privileged processes can be used to de-
tect abnormal running behaviour of many UNIX commands. They deal with the targeted
program as a black-box and observe its behaviour through system calls that are usually
used to access system resources. As such, knowledge about the internal functionality of
the code is not required. Parameters passed to the system calls were ignored and only their
temporal orderings are taken into account. Profiling the normal behaviour is done through
looking at the system calls invoked by the targeted process, and then building a database
of all unique sequences of a given length. After that, to check a new captured behaviour,
the same method above is used to generate sequences of system calls which are checked
against the previously built database of normal behaviour. The number of mismatches are
used as an indicator of how strong the anomalous signal is.
Sekar et al. [81] extended the previous work by proposing the use of a compact finite-
state automaton (FSA) to learn sequences. They described many advantage of their tech-
nique including a constant-time learning process per system call as well as during detection
phase. Several other works have considered system calls for abnormal behaviour detec-
tion such as [66] where they proposed an approach that has the advantage of taking call
arguments into account using multiple detection models.
33

2.4.3 Network Traffic
The current advance in networking technology and the huge dependency we have now on
networked and online services, make the physical access to our system is not the only
threat we should deal with. Network traffic based anomaly detection techniques can help
to detect suspicious behaviour and attacks that might target the system from the outside
or from another machine connected to the same network. One way to achieve this is by
constructing a baseline profile the represents the normal traffic behaviour of the network
during normal operation to detect later any deviations from that profile.
Researchers in [50] studied modelling traffic profiles for networks focusing on the sta-
bility factor of the profile. They analysed traffic traces from two internet traffic archives and
suggested the need of multiple constructed profiles to cover the differences during times of
the day and even days of the week for one website. Packet size, server ports, time-to-live
values, header lengths of TCP/IP and source/destination IP prefixes are all potential features
to consider for such application. A similar approach to build a robust base-line of traffic
trace has been presented in [5].
2.4.4 Registry Access
Windows registry contains information, settings, configuration and other attributes about
the windows operating system, hardware and the installed software. Programs usually ac-
cess the registry during their normal run to access needed information or configurations.
These access patterns can have the potential to discriminate normal computer usage from
suspicious one. Anomalous accesses to the registry have been analysed in the work of [84].
Two different learning algorithms have been evaluated and compared. The first depends
on a probability density estimation algorithm and the other uses a support vector machine
(SVM) classifier. After training the model for normal registry access, real-time registry ac-
cesses are checked against the model to detect abnormal and suspicious behaviour. Results
show that the probabilistic model achieved better accuracy and required less computational
power than the SVM-based one. Similar approach have been proposed to detect malicious
software based on their registry access behaviour [88]. A self organizing map model (type
34

of artificial neural network), is used for detection. Their results show that the proposed ap-
proach is effective in detecting malicious software and has a low false alarm rate compared
to other approaches.
We have just discussed different HCI-based biometrics techniques proposed in the lit-
erature. In our work, we want to explore employing the traits generated during normal
computer usage for identification purposes. But before doing so, we need to understand
the different properties that should be taken into consideration when choosing a physical or
behavioural attribute as means of identification.
2.5 Properties of Suitable Biometrics
Our body has many physical attributes and characteristics that differ from one to another
and has the potential to be used for identification. In a similar manner and due to different
levels of skills, knowledge, expertise, preferences or even physical abilities, people reveal
different approaches and behaviour to deal with everyday tasks, which could be unique
enough to be attached to their identify as behavioural characteristics. The selection of a
human factor as a biometric is very application dependent and needs balancing between
security and convenience according to the requirements. Jain et al [44] has described sev-
eral features that should be taken into consideration before relying on a physiological or
behavioural measurement as a biometric in a system:
• Universality: the characteristic should exist and be available in each person. Be-
havioural biometrics in general have a low universality in an open population as it
depends on the ability of doing something (not every person on earth can work on
a computer). However, some behavioural biometrics applied in a particular domain,
HCI based biometrics in our case, have 100% universality, as all the computer users
already know how to interact with the machine to some extent although they differ
in their usage skills and expertise. All of them generate digital traits while using the
computer.
35

• Uniqueness: the potential of the characteristic to discriminate between any two per-
sons in a given population (known as generality in the Information Retrieval domain).
The uniqueness of behavioural biometrics can be considered low if we are talking in
general and targeting a big population. Especially, if the set of different ways to ap-
proach the targeted task is limited. Still, there are cases where the actual size of the
population and the variety in the ways to achieve the task are suitable enough to allow
behavioural biometrics to work practically [1].
• Permanence: the characteristic should exhibit sufficient time invariance (from match-
ing point of view) over a period of time depending on the application. People’s be-
haviour change over time for different reasons, this can be a result of learning and
developing special techniques to achieve tasks or due to changes in personal or envi-
ronmental circumstances. To address this, researchers have developed techniques to
adjust the built models to handle such changes and keep the user’s profile up to date
[29].
• Collectability (Measurability): which relates to the practical ability to capture and
measure that characteristic. This is the advantage of HCI-based biometrics which
do not require special hardware for data acquisition but rather rely on regular input
devices. It can be implemented in unobstructive way and even completely transparent
to the user [67].
• Performance: which refers to the recognition accuracy, speed and stability (reliabil-
ity and practicality) of the system. In addition to the resources and environmental
settings required to achieve acceptable results according to the targeted application.
Behavioural biometrics have low accuracy in general, specifically when the set of
candidates is too large [99]. However, some studies presented results that are not far
from what physiological biometrics usually offer [33].
• Acceptability: which indicates to what extent individuals are going to accept the use
of technology and what comes with it of having their personal biometrics captured,
processed and saved. This is also one of the advantage of HCI-based biometrics
36

where they are less intrusive (personal mouse curves, typing speed, ..) than other
biometrics, but still ethical and privacy issues should be always considered.
• Circumvention: which covers how resistant the system is to impersonation attacks
and how difficult it is to fabricate that biometric. This is also one of the advantage of
behavioural biometrics where it is fairly difficult to fool such system without personal
knowledge of the victim’s behaviour. That’s why it is important in a deployed system
to keep user’s behaviour profiles highly secured [68].
Any biometric system has advantages and disadvantages, and in order to identify the
best biometric for an application, we need to know system’s properties and the applica-
tion’s requirements. We believe that being universal, easily collectable and fairly accept-
able are key properties to consider in order to develop a practical and reliable (both terms
will be defined in section 3.6) identification system. Mouse dynamics, keystrokes dynam-
ics and GUI based behaviour modelling have these properties, especially because of their
wide availability and frequent usage. They are non-intrusive (mouse curves, typing speed,
etc.), transparent (can be automatically captured without affecting the normal interaction
experience), passive (no additional tasks or restrictions are enforced), generally deployable
(across different software and computer use cases) and difficult to circumvent (difficult to
impersonate someone else computer usage). In addition, they do not require special hard-
ware devices for traits capturing and as such they can be deployed inexpensively on almost
any computer. Finally, the user’s interaction traits are always available throughout the whole
session, starting from the log-in moment (typing credentials) and continue to appear as the
user uses the computer, which can help to achieve continuous identity recognition. Thus,
we are interested in exploring these three components in this thesis.
2.6 Logging Software for HCI Experiments
Data capturing is the first step in all biometric systems where the biometric traits are ob-
tained for later processing during both enrolment and verification phases. Although one can
easily find a commercial spyware/surveillance software providing the ability to monitor and
37

record the computer activities, it is not easy to find dedicated and comprehensive tools for
logging computer usage for analysis purposes. In [59], using surveillance software for con-
ducting HCI experiments has been discussed. They described several issues related to time
stamps, mouse clicks, web usage and some other missing functionality in such software.
Other currently available software is designed to track interaction with one application, for
example, WOSIT[18] can be used to observe user actions on one application’s UI in UNIX
systems. OWL[61] is another application-specific logging utility that captures the usage of
Microsoft Word.
Several works have utilised HCI logging for various applications. For example, the use
of keystroke logging tools in the domain of cognitive writing research has created new pos-
sibilities by providing detailed information about the writing process that was not accessible
previously. Particularly, key-loggers are utilised in studies on writing processes, description
of writing strategies, children writing development, writing and spelling difficulties analy-
sis [87] [58] [86]. Inputlog is an example of such logging tool [57]. Keyboard logging also
can be integrated in educational fields for programming and typing skills [74]. In addition
to the previously discussed security applications, detailed timing of keystrokes can be em-
ployed for both stress [95] and emotion detection [51]. Screenshots are another example of
possible logging technique that can be used to capture and analyse the content consumed or
produced by the user. Screenshots were applied for search [39] and task automation [103],
and for building user friendly help manuals and demonstrations [104].
Motivated by the beneficial potential and applications of HCI logging, and by the lack
of generic and comprehensive HCI tracking and visualisation tools, we developed Logger-
Man, a generic, passive and application-independent logging solution for researchers and
lifeloggers. LoggerMan provides a robust tool to assist data gathering, visualisation and an-
alytics for research community. It has been used to build datasets for our own experiments.
LoggerMan will be described in detail in the next chapter.
As we have seen in this chapter, several works have been done in the domain of Human-
38

Computer Interaction based biometrics, that range from input-device based biometrics to
those that are based on the interaction with specific software. In addition to the set of
methods that are focusing on analysing the log and event records as an indirect way to
model the user’s behaviour based on the traits generated by his/her actions. We discussed
also the different properties that should be considered before choosing a human factor as
means of identification, which is strongly dependent on the application requirements. In
the next chapter, we will describe our research methodology followed in this thesis by
highlighting the main processes/steps we took starting from data collection (describing our
logging software) till the end of the chapter where we discuss our evaluation metrics used
in experiments.
39

Chapter 3
Methodology
As we introduced earlier in the first chapter, our work focuses on three components: mouse
dynamics, keystrokes dynamics and GUI based user behaviour modelling. This is because
they are the main interaction methods currently employed during everyday computer usage.
In addition to their wide availability and integration with most present computer systems.
This chapter describes the research methodology we followed across our targeted HCI com-
ponents, starting by providing an overview on the system architecture we considered for real
life scenario, and then moving to describe each step of the process separately.
3.1 System Architecture
In general, biometric systems operate in two different modes:
• Enrolment Mode: when the system captures the biometric traits generated by the
user, and analyses it to build reference behaviour signatures (templates). In our case,
the first few sessions can be used to build the user profile during enrolment phase.
• Identification Mode: in this phase, the system captures biometric traits from the user
in question and tries to figure out to whom this provided biometric belongs to. The
system needs to answer the question: ”Do I know this user? if yes, who is she/he?”.
40

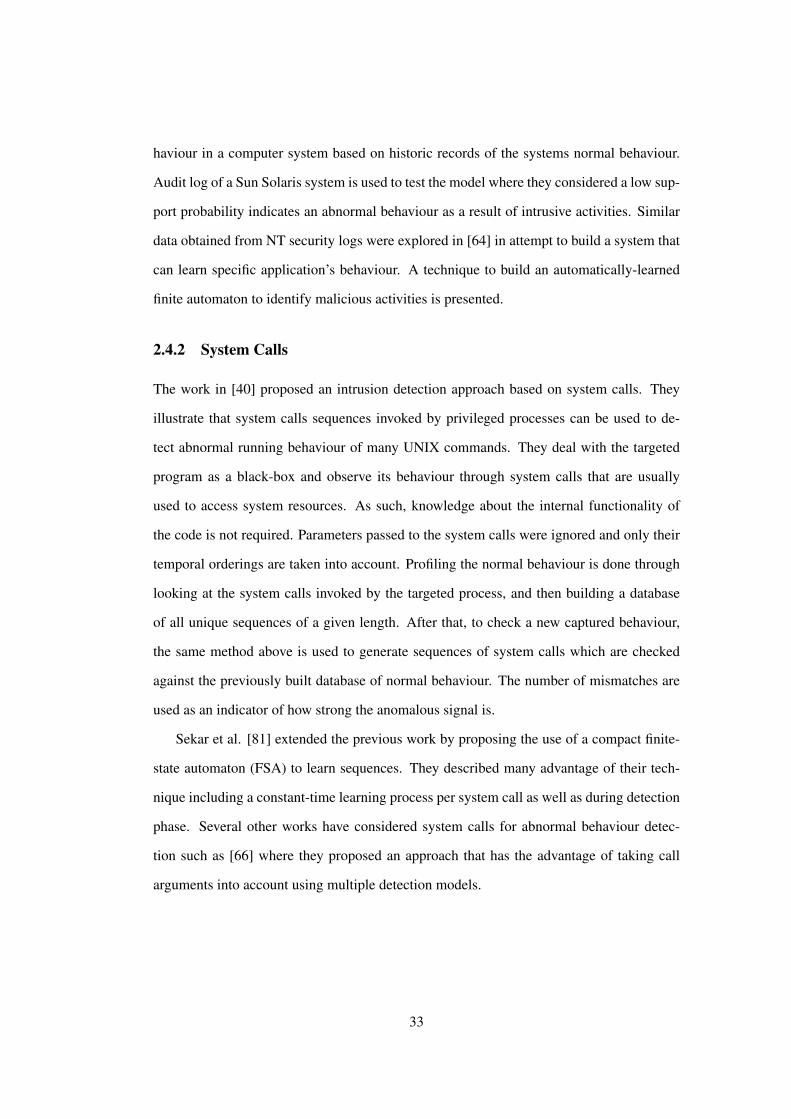
The previous description of operating modes suggests that the process of user identifi-
cation can go into several sequential steps (illustrated in Figure 3.1):
1. Data collection: in this step the system captures the biometric traits of the user during
normal human-computer interaction to pass it to the next step.
2. Behaviour modelling: in this step the biometric traits of an individual are aggregated
into a representation (we call it model), allowing for comparison and distinctions
from other individuals. The model can be preserved and represented either in terms of
features (reference features vector) or as the output of a Machine Learning algorithm
(the trained classifier). In our research, we utilise the Machine Learning approach as
means of modelling.
3. Behaviour comparison: this is the final stage, where the judgement is made about
the identity of the user in question, by comparing his/her behaviour model with the
models of the legitimate users known to the system.
Storing the behaviour signature in a database allows the system to tune the comparison
algorithm (re-train the system) to adjust to any new changes in the users’ behaviours, maybe
by discarding the old samples in the database and running the learning algorithm over the
most recent samples only. Re-training the system does not have to be done completely from
scratch thanks to online machine learning techniques [29]. This part of re-adjustment is out
of the research boundaries of this thesis and it is part of our future work.
Now, we will proceed by explaining each step in the identification work flow in the next
sections.
3.2 Data Collection
Data collection is the first step in both enrolment and identification phases. In our methodol-
ogy we have followed a strict data collection principles in order to 1) guarantee the ordinary
interaction experience of the user is not affected by the data collection process, and 2) to
41
Figure 3.1: Biometric System Architecture
ensure the behavioural traits are captured in real and normal computer usage scenario. This
is can be seen as a practicality-by-design approach to ensure the system is evaluated and
tested in real world settings (not theoretical or simulated data). More details about data
collection related to each component of our research are described later in its own separate
chapter. In the following, we will present the data collection principles and we will follow
that by detailing LoggerMan, our logging software built for collecting the behavioural data
while respecting the collection principles.
3.2.1 Data Collection Principles
As we mentioned previously in the first chapter, being transparent and passive are important
advantages of HCI-based biometrics. Thus, our methodology adopt these following two
principles:
1. Transparency: The data should be collected automatically by a software without af-
fecting the normal interaction experience or interrupting the user. This also includes
that the capturing software should be lightweight and does not consume too much
computer resources that might result in a change in the user’s behaviour due to com-
puter becomes slower than normal or unresponsive. This is to ensure that the data
42

collection process does not affect the normal user’s behaviour.
2. Passivity: The data collection should be done in real-environment scenario where
users are working normally on their computers without any kind of pre-defined tasks
or restrictions. This to ensure that the collected data actually reflect the normal user’s
behaviour (not a simulated data such as in the case of pre-defined tasks).
These principles have been considered in the requirements of the logging tool needed
for our data collection. We will show that later, when we talk about LoggerMan, a compre-
hensive logging software that we developed in response to several requirements discussed
in section 3.2.3.2. LoggerMan is used to build the needed datasets for our evaluations, and
is released online to be available to other researchers as a contribution.
3.2.2 Ethical and Privacy Considerations
In addition to the above data collection principles, privacy and ethics are important aspects
to consider during the collection and processing of personal information. In our experi-
ments, we made several arrangements to ensure the proper and ethical collection and usage
of the data. In summary, besides the explicit user consent, our data collection methodology
relies on avoiding to collect any sensitive data and to limit our models to work with only
low-level data (such as mouse coordinates, digraph duration, number of windows, etc.) that
does not raise too many concerns for most users. More details are going to be discussed
in section 8.1.2, in the context of the several privacy concerns people usually raise about
such systems to provide a richer contextual information about how we responded to these
concerns.
3.2.3 LoggerMan - A Computer Usage Logging Tool
3.2.3.1 Overview
LoggerMan helps researchers and lifeloggers to collect interaction data produced during
normal computer usage. The main goal of LoggerMan is to work passively in the back-
43

ground, intercept usage events and store them for later analysis. It gathers wide range
of keyboard, mouse and UI actions. LoggerMan is available online1 for interested re-
searchers/lifeloggers. In the next sections, we will describe the main components and func-
tionality.
3.2.3.2 Requirements and Technical Specification
In this section, we discuss the requirements that we were looking for in the logging tool
required for our data collection and then we describe how LoggerMan is designed to meet
them:
1. Background working mode: the software should work in the background without
interrupting the user or affecting his/her normal usage experience. This is to comply
with our data collection principles presented in section 3.2.1.
2. Light operation: this refers to the processing power consumed by the software. This
is important as we do not want the computer to become slow or unresponsive to an
extent that affects the normal usage behaviour of the user.
3. Local storage only: to address ethical and privacy concerns, the software must store
the data locally on the machine only, with no remote data transfer capabilities.
4. Easy data control: this is to help the user to see what is actually captured by the
software, with the ability to edit/delete part/all of the data.
5. Structured data storage: this refers to storing and organising the data in a manner that
can be easily loaded and processed. The software should consider the fact that data is
collected for later processing and provide description about the format used to store
the data.
6. Detailed and accurate information: this reflects the need for high precision time-
stamped information (in milliseconds) to ensure proper detection of the low-level
usage patterns.1LoggerMan.org
44

7. Ability to control what to capture: this is to allow the user to be in control of the kind
of data he/she is comfortable to provide.
As discussed in section 2.6, there’s a lack of available tools that has been designed
for research and experiments purposes. Most of the alternatives are commercial surveil-
lance/spyware applications that do not match with our requirements (especially 3,5,6 in
the above requirements) that we believe are general and also required for most experi-
ments/researchers in the domain of HCI.
LoggerMan works under Mac OSX 10.7 or later. It runs passively in the background,
intercepting usage events and storing them for later analysis (Req. 1). It can be configured
to run automatically after a system restart. Buffering techniques are used to store the stream
of events efficiently to the hard disk (Req. 2). To avoid any privacy concerns among users,
all captured data is stored locally on the computer (Req. 3). This provides the user with
a full control of the data (Req. 4). All data are stored in CSV format for easier parsing
and processing (Req. 5) and all of them are time-stamped (Req. 6). Our tool is designed
to be modular, with the ability to enable/disable each module independently (Req. 7). All
modules are designed to be Unicode compatible. Thus, the tool can log texts of different
languages properly. To maintain user privacy, LoggerMan does not log data typed in se-
cured fields. This is ensured by the Mac operating system the prevents observing data in
passwords fields.
3.2.3.3 Modules
LoggerMan has been designed to be flexible and modular. Our tool consists of multiple log-
ging modules which can be switched on/off independently. Figure 3.2 shows LoggerMan’s
main menu illustrating the different supported modules and how the user can control them.
Each logging module captures a different type of data and every log-entry is timestamped
to the current time.
Keyboard-related Modules. These modules are responsible for capturing keystrokes events
45

Figure 3.2: LoggerMan Menu
and storing them in local files. They provide two levels of detail: word based and key
based. Word-based mode (visible as ”Keyboard” menu item on Fig. 3.2) segments and con-
catenates the events stream into words. Whereas, key-based mode (visible as ”Keystrokes”
menu item on Fig. 3.2) tracks each key separately and stores it associated with its time
stamp. This particularly important for the domain of keystrokes dynamics [33].
Mouse Module. All mouse actions are traced by this module: move, right/left up/down
mouse buttons events, scroll and drag-and-drop actions. We previously utilised the data
stored by this module to build an authentication system based on mouse curves [37].
Screenshots Module. This will capture a screenshot of the current active window. The
user can select one of the shooting intervals (every 5, 10, 30 sec) or a smart-shooting op-
tion, which takes a screenshot: after every window transition (from app to app or even
different windows in the same app) and at fixed one minute intervals also. This helps to
ensure a reasonable trade-off between capture frequency and storage usage. The screenshot
can then provide valuable information about the content that the user is consuming or non-
textual content that the user is creating. For instance, optical character recognition (OCR)
techniques can be easily applied over the captured screenshots to get an idea about the type
of content the user interacts with.
Apps Module. This module is designed to track apps transitions. It only logs the currently
used app regardless of how it is being used, and as such it offers a simple overview of app
usage, without any potential privacy issues of actually capturing the screens.
Clipboard Module. Clipboard module is responsible for tracking copy-paste operations.
46

Any text the user copies to the clipboard is captured and logged.
3.2.3.4 Reporting and Insights
The current version of LoggerMan comes with a local reporting tool to visualise and give
insights to the data owner about his/her computer usage. Specifically, the reporting tool
presents three tag clouds: used apps, typed words and windows titles. These clouds are
constructed by computing the normalised frequencies of items occurrence during the se-
lected date range by the user (Fig. 3.3 and Fig. 3.5). These figures help to give preliminary
insights about the user’s computer usage and for what they are using the computer mainly.
Information about mouse clicks and typed keystrokes during a time frame is also presented
as a graph (Fig. 3.4). In addition, LoggerMan organises the screenshots and the app usage
data in a zoom-able timeline to provide a dyanmic and up-to-date view of computer usage
(Fig. 3.6).
Figure 3.3: Apps Cloud
Now we have presented the first step in our methodology, i.e. the data collection step, in
the next section, we will proceed by detailing the second one which builds the behaviour’s
47

Figure 3.4: Mouse/Keyboard Usage
Figure 3.5: Windows Titles Cloud
48

Figure 3.6: Apps & Screenshots Timeline
model of the user. The process of gathering user data for each experiment will be discussed
later in the following chapters.
3.3 Behaviour Modelling
Since our goal is to achieve dynamic user identification while the user is using the computer,
an important factor to consider is the time the model needs before identifying the current
user. This depends on the amount of collected biometric data that is enough to make a
decision, which in turn depends on how intense the individual uses the computer during
that time to generate the needed biometric traits. To consider this, captured biometric data
is grouped into sessions before analysis. As we mentioned earlier in the beginning of this
chapter, a session is defined as the consecutive biometric characteristics observed during a
time range or after a number of user actions (e.g. after 100 mouse actions). The specific
session definition for each of our studied components is presented later in each correspond-
ing chapter with evaluations presented in term of different values of session’s length.
After capturing enough biometric traits (session data), the next step in the process is
feature extraction. During this phase, a set of salient and discriminatory features that repre-
sent the important personal attributes of the biometric trait are extracted from the biometric
sample. This set is commonly named as features vector (or behaviour signature) and is
49

used as input for a subsequent comparison step. Ideally, the extracted features are distinct
between different individuals and are consistent for the same individual. Feature extraction
can be seen as a dimensionality reduction problem, where the high-dimension raw input
signal is transformed into a lower dimension space by preserving the most discriminatory
information and removing any irrelevant and redundant information. PCA algorithm [42] is
an example of automatic feature selection method commonly used in similar problems (e.g.,
face recognition). Feature extraction has a significant effect on the overall system perfor-
mance. If it results in a good separation of subjects in the feature space, almost any simple
comparison approach can perform well. Otherwise, the comparison quality may still poor
even with the use of most complicated comparison algorithm. The main concern here is to
select features that tend to describe the user’s behaviour characteristics only without regard
to both the environmental variables and the performed computer tasks. Special attention
has been taken to ignore features that have no direct relationship with the studied user’s
behaviour in each of the research components (mouse, keyboard and GUI) as described in
next chapters (e.g. designing features that are transition invariant; independent of screen
position for instance).
The features are the basic element that behaviour models are built on, where the model
can be represented either directly by the features vectors or as an output of a machine
learning algorithm. Thus, we can categorise two different types of approaches to achieve
behaviour comparison as illustrated in figure 3.7 and explained in the next section.
3.4 Behaviour Comparison
As explained at the end of the previous section, the two types of modelling approaches, lead
to two different comparison approaches:
1. The first approach considers the features vector (behaviour signature) as the represen-
tation of the behaviour model of the user, therefore, being used as the user’s reference
point in the behaviour space. Thus, during the identification phase, the comparison
50
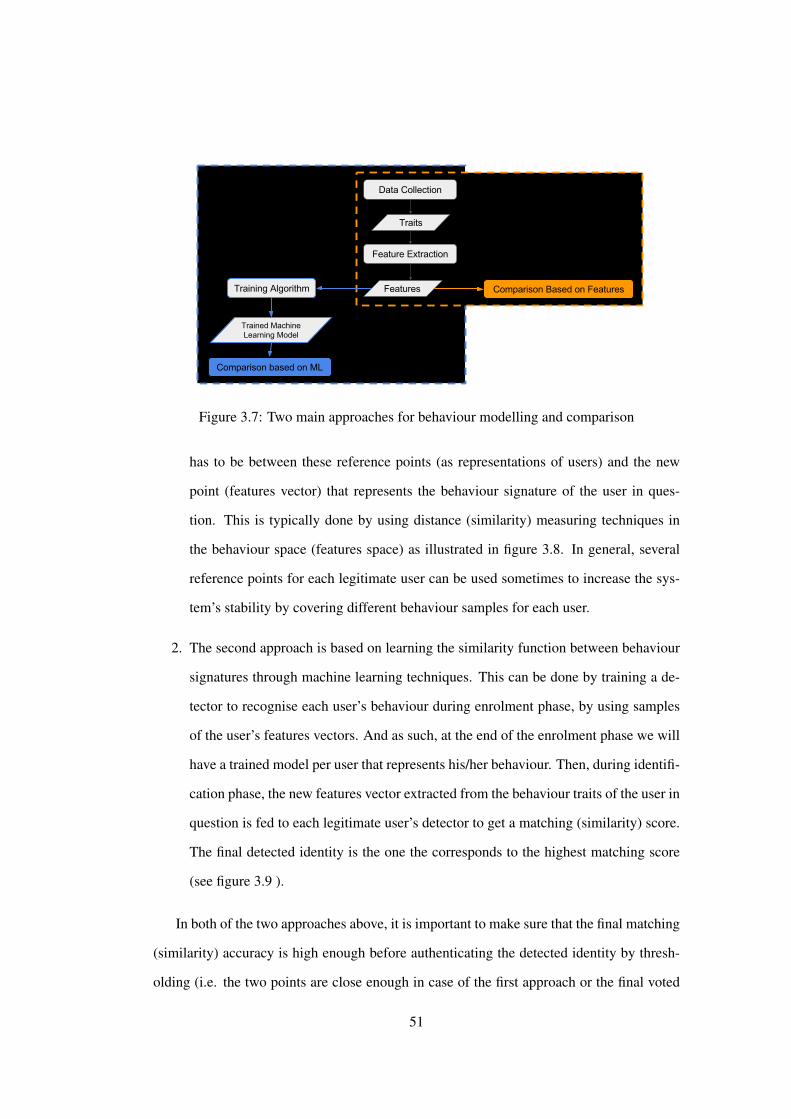
Figure 3.7: Two main approaches for behaviour modelling and comparison
has to be between these reference points (as representations of users) and the new
point (features vector) that represents the behaviour signature of the user in ques-
tion. This is typically done by using distance (similarity) measuring techniques in
the behaviour space (features space) as illustrated in figure 3.8. In general, several
reference points for each legitimate user can be used sometimes to increase the sys-
tem’s stability by covering different behaviour samples for each user.
2. The second approach is based on learning the similarity function between behaviour
signatures through machine learning techniques. This can be done by training a de-
tector to recognise each user’s behaviour during enrolment phase, by using samples
of the user’s features vectors. And as such, at the end of the enrolment phase we will
have a trained model per user that represents his/her behaviour. Then, during identifi-
cation phase, the new features vector extracted from the behaviour traits of the user in
question is fed to each legitimate user’s detector to get a matching (similarity) score.
The final detected identity is the one the corresponds to the highest matching score
(see figure 3.9 ).
In both of the two approaches above, it is important to make sure that the final matching
(similarity) accuracy is high enough before authenticating the detected identity by thresh-
olding (i.e. the two points are close enough in case of the first approach or the final voted
51

detector is confident enough in case of the second one).
Figure 3.8: Comparison based on distance measuring techniques between features vectors
Figure 3.9: Comparison based on Machine Learning techniques
52

3.5 Proposed Approach: Neural Networks based Comparison
In our work, we adopt the second approach of utilising the power of machine learning to
achieve behaviour comparison. This is mainly to shift the heavy computational cost that is
typically associated with distance measures (between the new sample and all the reference
samples of all legitimate users) from identification time (operation time, where running
time is important) to enrolment time (or training time, where time is not that critical). This
allows the system to do its job of identifying users in a realtime manner.
There are several machine learning techniques that might be considered such as K-
Nearest Neighbours (KNN), Support Vector Machines (SVM) or Neural Networks (NN).
Both KNN and SVM are non-parametric models, which rely mainly on a selected number
of input vectors (called support vectors in the case of SVM) to make decisions. Thus, in
these models, there is no actual feature structuring or combining toward finding new or hid-
den features or relationships.
On the other hand, neural networks are parametric models that have a fixed size accord-
ing to the number of neurons and layers. This fixed size of parameters allows us to tune the
model to implicitly detect non-linear relationships between dependent and independent fea-
tures and variables [89], where the outputs of the hidden layers can be seen as new higher-
level features that have not been known before. In addition, one of the important properties
of neural networks over other learning techniques is their simple online-training ability that
allows them to dynamically adapt to new patterns that become available sequentially in the
future without the need to retrain the network from scratch [11]. This particularly important
in the area of user behaviour modelling, where user’s behaviour can continuously change
over time due to several reasons such as accumulated experience, new skills/knowledge, in-
jury or any other factors. Although studying this re-adjustment/adaption is out of the scope
of our research, it was necessary to select a modelling approach that offers efficient online
learning algorithms for future work.
53

Multilayer feedforward artificial neural networks are utilised, where we present the
network with positive and negative examples to allow it to find boundaries between the dif-
ferent users’ behaviours.
Figure 3.10: An example of a three-layer neural network with 3, 4 and 2 nodes in the input,hidden and output layers accordingly
A neural network is a computational model formed from a number of connected smaller
units called artificial neurons (nodes), which corresponds to the biological neurons in a hu-
man brain. It is designed to simulate how the human brain process and analyse information.
An activation signal passes through the connections between neurons from one to another
by activating them if the signal is strong enough. Typically, neurons are connected in lay-
ers, and signals travel from the input (first) layer, through number of hidden layers to the
output (last) layer. Figure 3.10 shows a sample of a neural network illustrating how neurons
(nodes) connect to each other. Backpropagation is used for training the network [76].
54

All the networks utilised in this research consist of three layers (input, hidden and output
layer). Networks with more hidden layers have been explored with no significant perfor-
mance improvements despite of the additional computational power. The actual number of
neurons in the input layer differs according to the length of the features vector extracted in
each of our studied components. On the other hand, the number of neurons in the hidden
layer is related to the complexity of the classification problem and to the number of vari-
ables that are needed to be modelled. All the used networks in this research have one neuron
in their output layers. Table 3.1 summarises the neural networks topology used across our
components, by listing the number of neurons in each layer eventually employed during our
evaluations.
Component Input Layer Hidden Layer Output LayerMouse 152 50 1
Keyboard 100 50 1GUI 22 25 1
Table 3.1: Number of neurons in each layer of the neural networks utilised in this thesis.
In our work, user behaviour models (profiles) are represented in term of a neural net-
work per user, which is trained to detect his/her own behaviour alone. This is done by
providing the network with the user’s behaviour samples as positive (assigned value of one)
examples and the other users’ behaviour samples as negative examples (assigned value of
zero) during training. Then, in the testing phase, the final recognised identity of a tested
(unknown) behaviour sample is the one corresponds to the neural network with highest out-
put confidence (due to the interpolating nature of the neural network, output values will
be between zero and one). This is known as one-vs-rest strategy [7] and has been used
previously by [1] in the domain of mouse dynamics. In our work, we do not just take the
most likely identity the network outputs as our final result, but rather we make sure that the
55

network is confident enough about the detected identify by comparing its confidence value
with what we call an authentication threshold. Figure 3.11 illustrates the discussed pro-
posed approach above, where it shows (from left to right) all the sequential steps the system
follows to reach the final decision about the recognised identity as described earlier. It’s
important to note that that above neural-net-per-user approach has a scalability advantage
comparing to a single multi-class classifier (one neural network for all users for instance).
This is because, when we need to add a new user to the system, there’s no need to re-train
the whole system from scratch, but rather we can add a new separate neural network to the
system as a representative of this user. However, this needs to be implemented carefully
by capturing enough number of training samples from the new user that matches the other
users’ numbers of training samples to avoid creating unbalanced/biased classification deci-
sion in the system [8].
Figure 3.11: Work flow of our proposed approach
After modelling the behaviour of the users and building a mechanism for comparing
these behaviours, we need to be able to judge to what extent the comparison mechanism is
56

leading to accurate identification. Which lead us to the next section where we explain how
we evaluate the quality of our identification approaches.
3.6 Evaluation
As mentioned in section 2.5, being practical and reliable are important aspects we are tar-
geting in our studied HCI components. To measure that, we need first to define what these
terms refer to in the context of our research, and then to provide measurable metrics to
evaluate them.
3.6.1 Practicality
In our work, practicality refers to the system’s ability to operate in actual real-world en-
vironment including the challenges of identifying the user as soon as possible, taking into
consideration the nature of biometric traits the system is processing as well as the targeted
application requirements. This means that the system should be designed for actual use in
real settings. In the design of our evaluation, practicality is reflected in two aspects:
• Firstly, during data gathering phase, where our data collection principles (as dis-
cussed in section 3.2) were followed in what we call a practicality-by-design ap-
proach to build a proper datasets from real environmental settings.
• Secondly, by taking into account the time the system takes to produce a decision. This
is done by proposing the session concept, that has its own implementation in each of
our studied HCI components as mentioned earlier in section 3.3. The session’s length
is used as a measurable metric that reflects practicality in our evaluation. The effect
of the session length on the overall evaluation will be presented later in each HCI
component’s chapter.
3.6.2 Reliability
Reliability refers to what extent we can rely on the system to perform its job accurately.
This allows us to judge the performance of the identification system and its ability to detect
57

the user identity. In order to evaluate the performance of our approaches presented in the
next three chapters, unified evaluation metrics are needed to compare them against each
other. These evaluation metrics are also required to be the same used in the the state-of-the-
art reference approaches so we can compare our performance to their too. Our reliability
evaluation is done using three measures that are widely used to evaluate biometrics systems
performance:
• False Acceptance Rate (FAR): measures the likelihood that the system incorrectly
identifies either an intruder (imposter) as legal user or a legal user as someone else.
The ratio of the number of false acceptances divided by the number of identification
attempts is typically used to calculate FAR.
• False Rejection Rate (FRR): measures the likelihood that the system incorrectly re-
jects an identification attempt by an authorised user (falsely considering a legal user
as intruder). The ratio of the number of false rejections divided by the number of
identification attempts is used typically to calculate FRR.
• Equal Error Rate (EER): is the value at which both acceptance and rejection errors
are equal due to tuning the parameters of the system (authentication threshold). It
provides an easy way to compare the accuracy of different biometric systems. The
lower EER, the higher the accuracy of the model. It is also known as a crossover
error rate (CER).
To ensure the stability of the reported error rates, all of them are calculated based on
several repetitions, where in each round, samples are divided between training and testing
sets randomly. The description of the actual evaluation process for each component is
discussed later in its corresponding chapter. We will see how the values of FAR decrease
and the FRR increases as the authentication threshold increases in our research. The higher
the threshold, the lower the probability the system incorrectly identify an intruder as a legal
user and the higher the probability the system fails to recognise a legal user.
58

3.7 Summary
In this chapter, we presented an overview of the methodology we used to model the user’s
behaviour across our targeted interaction components (mouse, keyboard and GUI). Specif-
ically, we started with the proposed system architecture. Then moved to describe the main
processes followed in our approach: data collection using our designed logging tool, be-
haviour modelling and comparison through feature extraction and classification, and finally
the evaluation metrics we used. In the following three chapters, we will see how this general
methodology is translated into our actual work in mouse dynamics, keystrokes dynamics
and GUI based behaviour modelling.
59

Chapter 4
Mouse Dynamics
4.1 Overview
Mouse dynamics is our first focus in this research. It is defined as the patterns a user
follows during his/her interaction with the computer by a pointing device. It is the usage
characteristics observed via analysing the way the user uses the mouse/trackpad. These
characteristics are modelled over time to build a user profile. By continuously comparing
the current input stream of mouse actions with that previously stored profile, the system can
verify the identity of the user.
4.2 Related Work
As we presented earlier in chapter 2, several mouse dynamics have been proposed previ-
ously. Pusara and Brodley in [73] started by calculating distance, angle and speed between
every two consecutive mouse coordinates and then they computed their mean, standard de-
viation and the third moment values (distance, angle and speed) over a window of N length.
In contrast, Ahmed and Traore classified raw mouse events according to their action type.
Consecutive actions are grouped into sessions, from which features related to movement
speed, movement direction, traveled distance are computed producing user signature [1].
Schulz in [80] presented a model in which raw data are broken into mouse curves; length,
60

curvature and inflection points of the curve are used as main features, and a reference sig-
nature is built by generating histograms from the curve characteristics of multiple curves.
The verification is implemented then by computing the Euclidean distance between the ref-
erence signature and the mouse activity observed during authentication time. Jorgensen and
Yu [46] evaluated the approaches done by [73] and [1] and discussed some of the limitations
in their works. According to [46] it is not clear whether the system detects the differences in
mouse behaviour or differences among the working environment including the performed
task.
To overcome the above mentioned drawback of the state-of-the-art methods, our main
challenge is to extract features that can reflect the user behaviour patterns regardless of both
the task that she/he is performing and the environment she/he is working in. We think mouse
curves have such user-specific information that can be used to model users behaviour. One
can look at the mouse curves generated while normal computer usage as the digital equiva-
lent to handwritten characters or signatures in traditional paper documents in term of their
linkage to the individual’s own handwriting style [78]. Our approach is similar to the one
followed by Schulz [80] in using histograms of features extracted from the mouse curves.
However, the two approaches differ in two major aspects. Firstly, we designed different
features and emphasise on using ones that satisfy certain mathematical properties related
to task-independence, which will be discussed later in this chapter. Secondly, [80] uses a
single ‘reference’ signature per user, and the Euclidean distance between the evaluated and
the reference signatures is then used to identify the user. Our method, on the other hand,
uses instead a neural network per user which is trained using multiple signatures. The neu-
ral network has the potential of better recognition by generalising from different signature
training samples.
61

4.3 Hypotheses and Research Questions
In order to make our approach practical enough to be used in typical environment, our
model uses raw mouse coordinates collected from users during their normal computer ac-
tivities without restrictions. The consecutive mouse coordinates are grouped into curves
that correspond to the typical performed mouse actions (point-and-click, move, drag-drop).
In this work, our underlying hypothesis is that mouse curves have user-specific information
that can be used for user identification regardless both the performed task and the working
environment. This hypothesis will be addressed by two research questions and proved by
an experiment, as described in the rest of this chapter.
A mouse curve (C) is defined as a tuple (ordered list) of two or more 2D points (p):
C = (p1, p2, ..., pn) : n ≥ 2, pi = (xi, yi) ∈ R2 , (4.1)
where n is the number of points and x,y are the mouse coordinates.
A feature of this curve is simply a function of the coordinates of its points:
F (C) : R2n → S ⊆ R , (4.2)
where S is a subset of the real numbers. The range of the values differ according to the
actual implementation of each feature and will be mentioned later within the description of
each feature in section 4.5.
Since the features of these curves will be used to characterise a user, they should be task-
and-environment independent, which implies that any feature should be independent of the
position, size and orientation of the curve. That’s because we are interested in the properties
of the curves that are not related to where the curve is on the screen, how big/small it is
or in what rotation, but rather in the properties that better define what kind of curves the
62

user generates in term of curvature, style and shape. That is why we propose that feature
functions should satisfy the following mathematical properties:
• Translational invariance (position independent)
F (p1 + q, p2 + q, ..., pn + q) = F (p1, p2, ..., pn) , (4.3)
where q ∈ R2 is a 2D translation vector.
• Scale invariance (size independent)
F (αp1, αp2, ..., αpn) = F (p1, p2, ..., pn) , (4.4)
where α ∈ R is a scaling factor.
• Rotational invariance (rotation independent)
F (M p1,M p2, ...,M pn) = F (p1, p2, ..., pn) , (4.5)
where M =
cos θ − sin θ
sin θ cos θ
is a 2D rotation matrix that rotates points counter-
clockwise through an angle θ about the origin.
Thus, our main research questions for this component are:
• What are the set of features that follow the previous mathematical conditions and
describe the characteristics of the mouse curves?
• Represented by the previous features, do mouse curves have discrimination power to
identify the user?
In the next sub sections, we will present our published work to show how we answered
these questions.
63

4.4 Behaviour Modelling
A single curve may not have enough information by itself to refer to its user [80], that is why
we group the curves into sessions in order to study the statistical behaviour characteristics
observed during each session. A session is a number of consecutive curves belonging to
the same user. To show how results are affected by the length of the session we present the
accuracy of the system in terms of four different values of session length: 100, 120, 200 and
300 curves. These values have been selected in order to compare our results with Schulz’s,
who used similar values in his work (specifically: 120 and 300). To from the curves from
the consecutive mouse coordinates, mouse events (click, move, scroll and drag-drop) are
used as indicators to separate between different consecutive curves where available, other-
wise a 0.5 second threshold is used to distinguish between two consecutive curves.
The objective of our method is to identify the user based on features of the curves fol-
lowed when moving the mouse from one point to another. The exact values of those features
may vary considerably even for curves belonging to the same user. However, we assume
that each feature follows a probability distribution that is unique to each user and can serve
as a signature of his/her mouse movements. The probability distribution of each feature is
approximated by a normalised histogram computed using a large number of curves belong-
ing to a certain user (session). The histograms of different features belonging to a certain
user form the signature of that user, which is the input of the neural network that is respon-
sible for representing the model of this particular user. In the next sections, we will describe
our designed features and then will show how we achieve behaviour comparison to separate
between users.
4.5 Mouse Curve Features
In the this section, we describe the nine different features used to characterise a single
mouse curve. We designed these features to capture the different properties of the curves
in away that satisfies the previous mathematical conditions related to task-and-environment
64

independency mentioned in section 4.3. The purpose of these features is to reveal as much
information as possible about the mouse curves in order to be exploited and used to dis-
criminate between the different users. Each feature gives a single value as a descriptor of
the curve, except for inflection profile, sharpness profile and central moments that generate
five, five and three values respectively. As a result, we have in total 19 values describing
each curve. To the best of our knowledge we are the first who introduced these features in
this domain, except for straightness and inflection profile which are previously used before
by [80]. We introduce here our own implementation for these features.
4.5.1 Efficiency
The goal of a single mouse movement is to go from the first point p1 to the last one pn.
The shortest path between those two points is a straight line while any other curve will be
longer. Efficiency is defined as the ratio of the length of the shortest path over the length of
the curve
E =
√(xn − x1)2 + (yn − y1)2∑n−1
i=1
√(xi+1 − xi)2 + (yi+1 − yi)2
∈ [0, 1] . (4.6)
This feature measures how efficient a curve is, in reaching its final point. The value of
efficiency rages between 0 and 1. A curve with value 1 is the shortest path and the most
efficient, while a curve with value near 0 moves a lot without ending too far from its start
(see Fig. 4.1). A user whose curves have a high efficiency value tends to move the mouse
directly between target positions without making many unnecessary movements.
4.5.2 Straightness
This feature measure how much a curve resembles a straight line. This is done by studying
the correlation between the curve points. First, we compute the covariance matrix of the
points coordinates:
65

p1
p2
p3
p4
p5
p1p2
p3p4
p1
p2
p3
E = 1
E = 0.06E=0.78
p4
p3
p2
p1p5
p6
E = 0.31
Figure 4.1: Different mouse curves with their efficiency values.
Σ =
σ2x σxy
σy,x σ2y
where:
σxy = σyx =1
n
n∑i=1
(xi − x)(yi − y)
σ2x =1
n
n∑i=1
(xi − x)2, σ2y =1
n
n∑i=1
(yi − y)2,
x =1
n
n∑i=1
xi, y =1
n
n∑i=1
yi
σ2x and σ2y are the variances along the x and y axes, respectively. σxy is the covariance
of x and y.
Then we compute the eigenvalue decomposition of the covariance matrix. The largest
eigenvalue (let it be λ1) represents the largest variance of the points along any direction
while the second eigenvalue (let it be λ2) represents the variance along the direction or-
thogonal to the previous one. As a straightness measure, we use the following relation:
S =λ1 − λ2λ1
∈ [0, 1] . (4.7)
66

Straightness value range between 0 and 1. When the relation between x and y is almost
linear, λ1 is much larger than λ2 and the straightness is near 1. When the relation is non-
linear, λ1 and λ2 are close and the straightness is near 0 (see Fig. 4.2). Our measure of
straightness is meant to replace the one given by [80]. Their measure is a yes/no measure
that does not account for that fact that some curves appear more straight than others while
our measure gives a one value when the curve is exactly a straight line and a positive value
proportional to how well the curve resembles a straight line.
1 1
0 ≈ 0 ≈ 0
≈ 0.8
Figure 4.2: Different sets of points with their straightness values.
4.5.3 Regularity
This feature measures how regular a curve is by looking at the distances (di) of its points to
its geometrical centre (x, y).
x =1
n
n∑i=1
xi, y =1
n
n∑i=1
yi
di =√
(xi − x)2 + (yi − y)2
67

Regularity is then defined in terms of the mean (µd) and standard deviation (σd) of those
distances as:
R =µd
µd + σd∈ [0, 1] , (4.8)
where µd =1
n
n∑i=1
di, σ2d =1
n
n∑i=1
(di − µd)2 .
Note that curves forming regular polygons, like equilateral triangle or squares, have all
their corners at the same distance from their center. This implies that the variance of the
distances is zero and thus regularity is one (see Fig. 4.3 for an example).
Figure 4.3: The corners of a regular polygon lie at equal distances from its center. Thisimplies that the variance of the distances is zero and thus regularity is one.
The above three features of efficiency, straightness and regularity are defined as ratios
of distances. The distances between the curve points are translation and rotation invariant
and their ratios are scale invariant.
4.5.4 Self-Intersection
This feature counts the number of times a curve intersects with itself. To find this number,
we test all pairs of line segments for intersection. This approach takes O(n2) which is still
acceptable in our case as n is small.
Two line segments p1p2 and p3p4 intersect, if and only if both:
• p1 and p2 are on different sides of p3p4,
68

• p3 and p4 are on different sides of p1p2.
These are respectively true, if and only if :
• Angles ∠p1p3p4 and ∠p2p3p4 are of opposite signs.
• Angles ∠p3p1p2 and ∠p4p1p2 are of opposite signs.
These are respectively true, if and only if :
• Cross products −−→p3p1 ×−−→p3p4 and −−→p3p2 ×−−→p3p4 are of opposite signs.
• Cross products −−→p1p3 ×−−→p1p1 and−−→p1p4×−−→p1p2 are of opposite signs.
As a result, it is sufficient to check the fulfillment of the last two conditions to test
whether two line segments intersect. Note that we do not consider touching line segments
as intersecting. The number of self intersections is a topological property that is translation,
rotation and scale invariant.
4.5.5 Curvature-based Features
Mathematically, the curvature of a continuously differentiable curve is defined as the rate
of change of the tangential angle with respect to the arc length [13], these angles are inde-
pendent of the position, orientation and scale of the curve (see Fig. 4.4).
κ =dφ
ds. (4.9)
Handling curvature of mouse curves is problematic because they are piecewise linear, so
the curvature is zero inside the line segments and ill-defined on the corners. One approach
to solve this problem is approximating the rough mouse curve by another smooth curve like
B-spline (as done in [80]) or Bezier curves and then studying the curvature of the resulting
smooth curves. We follow here a different approach.
First let us look at the the line integral of the curvature between two points of the curve
Φ(a, b) =
∫ b
aκ ds =
∫ b
adφ = φ(b)− φ(a) . (4.10)
69

dφκ = dφ/dss+ds
s
T(s+ds)T(s)
Figure 4.4: Curvature of a smooth curve.
It is called the total curvature and it is the total change in the tangential angle.
P0
Pn
Curvature
Arc Length
Total Curvature
Arc Length
- π
π
0
Figure 4.5: Curvature and total curvature of a mouse curve (piecewise linear curve).
For mouse curves, the total curvature is well-defined and it is a step function that is
constant along the line segments and jumps at the corners; The value of the jump at a
corner equals to the change in the angle (see Fig. 4.5).
Since the curvature is the derivative of the total curvature, it is ill-defined at the jumps
because of the discontinuity. However, it can still be defined in a distributional sense as a
Dirac delta function [49]. The behaviour of delta function is well-defined inside integrals
and most curvature-based features are defined using integrals. The only feature that goes
beyond integration, is the inflection profile but the problem is resolved then by replacing
70

delta functions with Gaussian function.
Formally, the curvature of a mouse curve is then defined as a linear combination of delta
functions positioned at the corners and weighted by the angles
κ(s) =n−2∑i=1
θi δ
(s− si
sn−1
)where: (4.11)
si =
j=i∑j=1
√(xj − xj+1)2 + (yj − yj+1)2
θi = sign(vi × vi+1) arccos
(vi.vi+1
‖vi‖‖vi+1‖
)vi = −−−→pipi+1 .
Where s is the arc length parameterising the mouse curve, and κ(s) is its curvature at
the point defined by this arc length. Notice that in Eq. 4.11 the positions are rescaled by the
length of the curve (sn−1) in order to make the curvature scale-invariant.
Total Angle
This feature measures the total change in angle between the first and last points of the curve.
It equals to the integral of the curvature
TA =
∫ds κ(s) =
∫ds
n−2∑i=1
θi δ(s− si) =n−2∑i=1
θi
∫ds δ(s− si) =
n−2∑i=1
θi . (4.12)
The last equality holds because the integral of a Dirac delta function is unity.
Bending Energy
This feature measures the total change of angles regardless of the sign. It equals to the
L1-norm of the curvature
BE =
∫ds |κ(s)| =
∫ds|
n−2∑i=1
θi δ(s− si)| =n−2∑i=1
|θi|∫ds δ(s− si) =
n−2∑i=1
|θi| .
(4.13)
71

Inflection Profile
Inflection point is where the curve changes the sign of its curvatures. Computing the number
of inflection points naively, by counting the number of sign changes of θi, results many
spurious inflection points because of the noise on the curvature. Therefore, we need to
smooth the curvature by replacing the delta functions with Gaussian functions of the same
weight and certain width (see Fig. 4.6). The number of sign inflection points is the number
of sign changes in the smoothed curvature. In order to avoid biasing the result to a certain
smoothing level (certain width of the Gaussian), we use the different number of inflection
points at five different smoothing levels as features. Taken together, we call these features
inflection profile.
Delta Functions Curvature
Arc Length
Smoothed Curvature
Arc Length
Figure 4.6: Curvature can be smoothed by replacing delta functions with Gaussian functionsof the same weight and at the same position.
Sharpness Profile
We define a sharp bend as an absolute change in the angle by more than π/2. A sharp bend
may happen on a single corner or may take several corners. To find the number of sharp
bends requiring m corners, we sum each m consecutive angles θi and then count the values
that are greater than π/2 in absolute value.
We compute the number of sharp bends requiring five different number of corners.
Taken together, these features are called sharpness profile.
72

Center and Central Moments
The n-th moment of a normalised positive function around point c is defined as
µ′n(c) =
∫ds (s− c)n f(s) . (4.14)
The first moment around 0 is called the mean µ := µ′1(0) and the moments around the
mean µn := µ′n(µ) are called central moments. Knowing the mean and the first few central
moments of a function gives a rough idea about its shape.
We use the moments of the normalised absolute value of the curvature f(s) = |κ(s)|/∫ds |κ(s)|
as features. They are computed using the following relations which are obtained by substi-
tuting f(s) in Eq. 4.14:
µ =
∑n−2i=1 si |θi|∑n−2i=1 |θi|
(4.15)
µn =
∑n−2i=1 (si − µ)n |θi|∑n−2
i=1 |θi|(4.16)
We used the values of the first 3 moments in our feature vectors.
In this section, we presented the features we designed to describe the different properties
of the curves taking into consideration that all of these feature functions have to satisfy the
mathematical conditions of being transnational, scale and rotational invariant that we think
are necessary to avoid as possible capturing information about the performed computer task
or the working environment of the user. Next, we will describe how we use these features
to discriminate between users.
4.6 Behaviour Comparison
As described earlier in section 4.4, we do not use the features themselves for classification
but rather their probability distribution. This probability distribution can be approximated
using a normalised histogram of the feature values. We determine the binning of the his-
73

togram using the equal-frequency discretisation algorithm [52]. Regarding the number of
bins, we use eight bins per feature; this has experimentally given good results in approxi-
mating the underlying distributions of the features (other values of bins number have been
explored: between 4 and 16 with no significant improvement). As a result, our final signa-
ture vector has 152 values, which is an 8-value histogram for each one of our 19 features
concatenated together.
Identifying users using a signature is done via artificial neural networks as mentioned in
section 3.4. Each user has his/her own neural network which is trained to recognise his/her
signature alone. The input layer consists of 152 neurons, corresponding to the length of our
features vector. The hidden layer consists of 50 neurons (no significant gain reached with
more neurons) whereas the network has only one neuron in the output layer. The output
of the network is in the range [0,1]. During training, positive examples are assigned value
1 and negative examples are assigned value 0. However, due to the interpolating nature of
the neural network, the output for new examples will lie in between. Therefore, a threshold
limit is used to authorise the claimed identity.
To train a neural network to recognise sessions for a targeted user, we consider all
the sessions that belong to that user in the training set as positive examples and all other
sessions as negative examples. This was carried out in a similar manner for all users. In
real life scenario, the first sessions of the user are used passively to build his/her signature.
User authentication is the final step in the process; in order to verify the claimed identity
of a session we first extract the features vector of that session and use it as an input for the
network specifically trained to recognise that identity. Then, the output of the network is
compared to an authentication threshold to ensure that it is sufficient enough to authenticate
that captured behaviour.
74

4.7 Evaluation
In order to test our model in normal working environment, our dataset is collected from
users during their regular daily activities without any kind of pre-defined tasks or restric-
tions. We used here our logging software, LoggerMan (section 3.2.3), to intercept raw
mouse events passively and save them for later analysis. Ten users participated in this ex-
periment. All of them were computer researchers, with varying levels of mouse dependency
during their normal computer interaction (some of them prefer to use the keyboard shortcuts
as long as possible over the mouse). All of them were right-handed users. The collected
data is only mouse coordinates with an indicator of the current performed action (point-and-
click, move, drag-drop). Around 16,500 mouse actions are collected for each user during
about 24 total hours of interaction.
Our evaluation is done using three performance metrics: false acceptance rate (FAR),
false rejection rate (FRR) and equal error rate (EER) as mentioned previously in chapter 3.
FAR measures the likelihood that the system incorrectly identifies either an intruder (im-
poster) as legal user or a legal user as someone else. Whereas, FRR measures the likelihood
that the system incorrectly rejects an identification attempt by an authorised user (falsely
considering a legal user as intruder). EER is the value at which both acceptance and rejec-
tion errors are equal due to tuning the authentication threshold of the system. The lower the
EER, the higher the accuracy of the model. The sessions of each user are divided into two
equal subsets: training set and testing set. After training the system on the training set only,
we test the system by counting the number of misclassifications against all the sessions in
the testing set. To make sure that FAR also covers the case of an attacker who has not
been seen before by the system, the previous process is repeated ten times (according to the
number of users). In each time, one of the users is considered as an intruder (imposter); his
sessions are excluded during the training phase and are added to the testing set. The total
number of misclassifications over the ten times is used to calculate FAR and FRR. To find
the value of EER, we conduct the testing by varying the authentication thresh-old between
75
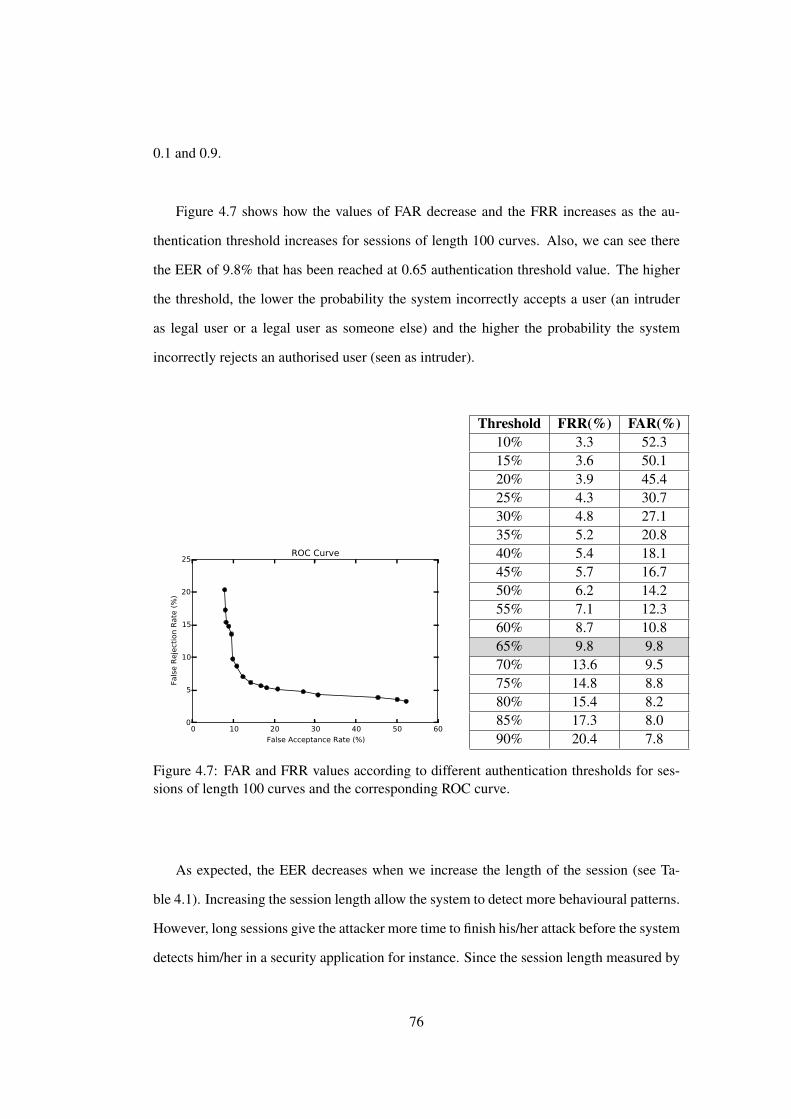
0.1 and 0.9.
Figure 4.7 shows how the values of FAR decrease and the FRR increases as the au-
thentication threshold increases for sessions of length 100 curves. Also, we can see there
the EER of 9.8% that has been reached at 0.65 authentication threshold value. The higher
the threshold, the lower the probability the system incorrectly accepts a user (an intruder
as legal user or a legal user as someone else) and the higher the probability the system
incorrectly rejects an authorised user (seen as intruder).
0 10 20 30 40 50 60
False Acceptance Rate (%)
0
5
10
15
20
25
Fals
e R
eje
ctio
n R
ate
(%
)
ROC Curve
Threshold FRR(%) FAR(%)10% 3.3 52.315% 3.6 50.120% 3.9 45.425% 4.3 30.730% 4.8 27.135% 5.2 20.840% 5.4 18.145% 5.7 16.750% 6.2 14.255% 7.1 12.360% 8.7 10.865% 9.8 9.870% 13.6 9.575% 14.8 8.880% 15.4 8.285% 17.3 8.090% 20.4 7.8
Figure 4.7: FAR and FRR values according to different authentication thresholds for ses-sions of length 100 curves and the corresponding ROC curve.
As expected, the EER decreases when we increase the length of the session (see Ta-
ble 4.1). Increasing the session length allow the system to detect more behavioural patterns.
However, long sessions give the attacker more time to finish his/her attack before the system
detects him/her in a security application for instance. Since the session length measured by
76

Session Length (#Curves) Session Length (Time) EER Threshold100 5.6 min 9.8% 65%120 7.5 min 9.5% 65%200 14.3 min 7.2% 50%300 18.7 min 5.3% 55%
Table 4.1: EER values and the corresponding session length
the number of actions (curves), the actual needed time to identify a user may vary consid-
erably even for sessions of the same user depending on how much time the user needs to
generate the sufficient mouse actions. Table 4.1 shows the EER and the corresponding total
average time our subjects took to generate the needed curves. Table 4.1 shows the EER and
the corresponding total average time our subjects took to generate the needed curves.
As we introduced before, Schulz presented a similar model based on mouse curves too.
EER values reported in his work are 20.6%, 16.6% and 11.1% for sessions of 120, 300
and 3600 curves respectively [80]. By comparing the previous values to our reported error
rates (Table 4.1) we can see that our model achieves better results and an enhancement
on the mouse-curve based state-of-the-art approach toward a reliable task-independence
identification system.
4.8 Conclusion
In this work we have proposed an approach to model the normal human-computer interac-
tion via mouse device that can be used to dynamically identify users based on their mouse
usage patterns. We presented the current state-of-the-art models and their limitations related
to task and environment dependency. A new model is proposed that analyses properties of
the mouse curves generated by the users. We think mouse curves have user-specific in-
formation that can be used to model users behaviour. Mouse-curve based features were
designed carefully to satisfy certain mathematical properties related to task and environ-
ment independence. To the best of our knowledge we are the first who introduced most
of these features in this domain. A neural network per user is used to learn his/her mouse
77

ApproachMouse-curve based features that are designed to satisfy certain mathematical
properties related to task and environment independence.
Features152 values, which is an 8-value histogram for each one of our 19 features
concatenated together.
PracticalityData Gathering
Ten right-handed users during their regular daily workwithout any kind of pre-defined tasks or restrictions.16,500 mouse actions per user during about 24 total
hours of interaction.
Operation Time
The number of consecutive curves belonging to thesame user is used to define session.
Studied session’s length: 100, 120, 200 and 300 curves,that correspond to 5.6, 7.5, 14.3 and 18.7 minutes
of computer interaction.
ReliabilityEvaluation
Ten repetitions of the evaluation process, each timeone of the user is considered as an intruder.
PerformanceFrom EER of 9.8% for session length of 100 curves
(5.6 minute) down to 5.3% of EER for 300-curvesessions (18.7 minute).
Table 4.2: Mouse Dynamics Approach Summary
usage behaviour. This is summarised in Table 4.2, where we link back our results to the
practicality and reliability aspects of our evaluation discussed in section 3.6. Practicality is
covered here by both of the real environment data gathering and by taking the session length
into consideration. Where as, error rates reported from a several-repetition evaluation pro-
cess refer to the evaluation reliability. More details and comparisons will be presented in
Chapter 7. Future research should extend the subjects involved in the evaluation process
and test consistency and invariance of the model over time. Besides, a statistical analysis
will be useful to show the contribution of each feature in the final decision.
In the next chapter, as a natural move, our focus will shift to analyse typing behaviour
on keyboards, presenting and discussing our work in that area.
78

Chapter 5
Keystrokes Dynamics
5.1 Overview
The behavioural biometric of keystroke dynamics is based on the way and the rhythm in
which a user types on a keyboard. The keystroke rhythms and patterns of a user are mod-
elled and used to build a biometric profile of that user for future identification. The basic
assumption here is that every user types on the keyboard in a specific way, resulting in
unique patterns that can be linked with that particular individual. It is not a totally new
concept as ”The Fist of the Sender” method was used during the second world war to iden-
tify whether the transmitted Morse message was sent by ally or enemy based on the keying
rhythm [56]. The typing rhythm of some sequence of characters on a keyboard can be very
person specific. For instance, typing specific sequences such as ”ing” by a native English
user will be quicker than someone else used to write in a different language. Another ex-
ample is that users tend to write the sub sequences of their names faster than other random
characters. Even more, recent studies showed that typed text can be reconstruct (recog-
nised) from the sound of key stroking [106].
Using keystroke dynamics as an identification method is attractive exactly as the mouse
for several reasons. First, it does not need special hardware devices for data collection and
as such it can be deployed inexpensively on almost any computer. Second, it is transparent,
79

not intrusive and does not require the user to do any additional tasks as users are using the
keyboard anyway. Third, the user’s typing traits are always available throughout the whole
session, starting from the log-in moment (typing credentials) and continues to appear as the
user uses the computer. which can help to achieve continuous identity recognition.
On the other hand, the previous mentioned advantages and the good potential of keystroke
dynamics systems are challenged with some difficulties. The amount of personal informa-
tion that are revealed while typing on the keyboard is very limited and unstructured com-
pared to other biometric approaches. For instance, from two consecutive keys we only
might get the duration the user took to move from the first key to the second along with the
duration each key is held down. This is very limited amount of data to explore. In addition,
typing patterns may change not only because of the typing skill of the user improving over
time, but also it might be affected by environmental changes such as using different key-
boards.
Most published research in this domain have focused only on analysing the typing pat-
terns of structured predefined text samples, typically at the beginning of the session. This is
to avoid the difficulties that arise when dealing with unstructured free text (discussed later
in section 5.3), and to limit the possibility that typing patterns might vary in a less con-
trolled environment. Furthermore, as it is obvious that typing long fixed texts during both
enrolment and identification phases is intrusive and unreasonable, researchers have forced
themselves to work on short text samples that were either too short to produce good identi-
fication results, or too restricted to be applied in real applications [6].
In this research, we needed to approach the problem differently. We believe that very
short texts (such as passwords or similar short phrases) do not have enough typing traits
to discriminate between users in real settings. On the other side, typing predefined long
texts repeatedly is not user friendly and would negatively affect the computer interaction
experience. Thus, we think that analysing the typing patterns of the users passively while
80

using the computer freely with no imposed texts is the best way to approach the problem,
which is called free text mode. In the rest of this chapter, we will start by discussing the
background of keystrokes dynamics including the most relevant works in literature. After
that, our research questions are introduced and discussed. Finally, our proposed approach
is discussed including a description of the dataset we used, the feature extraction step, and
the evaluation results.
5.2 Background
To model user’s behaviour we need to look into what features can be extracted from mon-
itoring how a user types. The goal of feature extraction is to select characteristics that are
discriminative in term of how users interact with the keyboard. Three basic features are
introduced in the literature and used by the majority of researchers: scan code, dwell time
and n-graph time [25] [33] [65]. The scan code is a unique identifying number that is cor-
responding to each physical key on a keyboard. This is used to distinguish between keys
and to tell exactly what key is pressed (see figure 5.1). It can be used for instance to de-
termine which shift key (right or left) the user holds down when typing a capital character.
Such individual preference may reveal typing style or may be affected by which side of the
keyboard the capitalised key is. Similarly, which digit keys does the user tend to press when
typing some numeral text? does he/she use the number over the letters on the keyboard or
use the numeric keypad? This can be captured as the scan code of the keypad digits are
different than those in the upper side of the keyboard located over the letters. The same
goes for the arithmetic operation and the enter keys in the side keypad which have their
own distinct codes.
The dwell time (hold time) indicates the amount of time a key is held down by the user
while typing. It is typically on the order of 10 milliseconds and it varies from user to user
and from key to key. Computer events such as key-down and key-up are generated by the
operating system whenever a key is pressed. These events are utilised not only to calculate
81

Figure 5.1: Scan codes of a PC keybaord: showing a unique number for each key in hex-adecimal
the previous dwell time but also to measure a widely used feature, n-graph time. An n-graph
is the duration a user took to press n consecutive keys, commonly n = 2 (digraph) or n = 3
(trigraph) are the values used by researchers. Both dwell time and n-graph times reveal in-
direct information about the typing speed of the user. The values of n-graphs are usually in
the range on order of 50-500 milliseconds for digraphs and scale linearly as n goes larger.
We can also note that there are several different ways to define an n-graph based on the
previous mentioned key-down and key-up events. For example, there are 4 different com-
binations of events could be used to obtain the digraph when a user types ”OK” as figure
5.2 illustrates. There is no significant difference between choosing one of these different
definitions as long as they are used consistently. However, choosing the value of n can be
important, as the longer the n-graph, the fewer samples are likely to be found in the entered
text. Thus, it can affect the model performance and must be taken into consideration during
model design.
The literature of keystroke dynamics approaches are divided into 2 types: static and dy-
namics. Static mode means performing typing analysis based on static predefined texts that
are fixed and introduced for all users. Most previous published work fall into this type such
as [15] [105] [6] that are intended to be used as an additional security layer at the beginning
of the session along with current authentication methods (two-factor authentication) or even
as a complete alternative.
82

Figure 5.2: different possible definitions of digraph used in literature
Dynamic mode of keystrokes refers to continuous checking of identity based on the
typed keystrokes on and after passing the authentication phase. This term (dynamic) is used
inconsistently across the state of the art, as some previous works implemented this using
periodic session interruption to ask the user to re-type predefined texts. Others used the
keyword dynamic to describe their algorithm that still works only in the beginning of the
session but it establishes the user identity as early as possible even before the text is typed
completely (the first 200 keystrokes for instance) [28]. Still, there are few studies that pro-
pose true dynamic identification systems that are built on the top of the free text the user
may type while using the computer normally without any kind of interruption or imposing
of predefined sample texts to be entered. This is exactly, what we are targeting in our re-
search. The techniques of free text dynamics face several challenges, which could explain
the limited amount of previous research available in this domain (will be discussed next).
83

The work of Monrose and Rubin [65] was one of the earliest studies related to free
text dynamics. Typing samples of 42 users were collected over 7 weeks while they are
working on several tasks involve typing both structured and unstructured texts in differ-
ent environmental settings. The typing speed was used to partition the collected data into
several clusters to reduce the search time and the computational cost of the identification
process. In this way, users in the same cluster are similar in typing speed and whose cross-
class members are dissimilar. An obvious limitation here is the need to do a re-clustering
whenever new samples are added to the system or to reflect the changes in users’ typing
speeds over time. To compare between two samples, several distance metrics were used
including Euclidean distance, weighted and non-weighted maximum probability measures.
Profiles were built based on the mean and standard deviation of the typing samples after
pre-processing the data to ignore durations that are seen as outliers. Authors reported a
90% correct classification accuracy for fixed text analysis. However, that drops to only
23% for free text mode [65].
In [25], keystrokes typed by four users on Windows NT were continuously captured for
few weeks during their normal day with no constraints (free text). The digraphs database
were filtered in a manner that only keeps the digraphs that appeared a minimum number of
times in different samples. This is to ensure the stability of their statistical values. Users’
typing profiles were constructed from the mean and standard deviation of the duration of
the selected digraphs. When a new sample to be classified, the mean duration of each di-
graph in that sample is compared against users’ profiles. A digraph is considered accepted
for a specific user profile if its value is in the range M ± wD , where M and D are the
mean and standard deviation of the corresponding digraph in that user’s profile and w is
weighting value. The new sample is then classified to the user whose profile resulted in the
largest number of accepted digraphs. A classification accuracy of 50% were reported with
this method. Later on and in a separate work, the result is enhanced to reach around 60%
for 5 users [24].
84

In [93], authors utilised typing analysis techniques to target the applications of identi-
fying the perpetrator of online fraud activities or inappropriate email author. 118 subjects
participated in their evaluations which consisted of two input modes (copy and free-text)
and two different types of keyboards (laptop and desktop keyboards). Different results were
reported according to the experimental settings. An accuracy of 44.2% was obtained when
free-text testing was done on a desktop after fixed-text enrolment on a laptop on 40-user
experiment. 99.2% correct accuracy was reported for laptop keyboards experiment on 47
users using fixed text. This shows that their free-text methodology did not perform as well
as their fixed-text one.
Gunetti and Picardi in [33] used what called the degree of disorder of an array as a dis-
tance measure between two typing samples in free text. The disorder measure of an array is
defined as the sum of the distances between the current positions of the array elements and
the positions of the same elements in the ordered version of the array. In addition, another
distance measure based on absolute values of digraph durations were also proposed. The
two distance methods were utilised together to do the classification. Users’ profiles consist
of several reference samples from each legal user. When classifying a new sample, the dis-
tances of this new sample from all the reference samples of all users are calculated. Then
to estimate how this sample is far from each user’s profile, the average of the distances to
all users’ samples is calculated. The new sample is then classified to belong to the user who
has the closest mean distance to that sample. 40 users participated in their evaluation as
legal users who provided 15 samples each along with other 165 users who provided only
one sample and were considered as imposters to attack the system. Users are asked to use
a designed web interface to provide the evaluation data. They had to enter their login iden-
tifiers and then freely type some text. The length of each sample was between 700 to 900
characters. Several experimental results were reported such as 0.114% of FAR and 2.5% of
FRR for the user identification experiment.
The above summary shows that except the work of Gunetti [33], most of the free text
85

based identification approaches suffer from high error rate [25] [65] [93]. Still, a key lim-
itation of Gunetti’s work is their system efficiency and scalability. The limitation in their
approach is the need to compare the new sample to each reference sample of the legal
users in the training set. This is a serious performance issue that could affect the system
scalability. In their evaluation, the comparison of a new typing sample against 40 profiles
consisting of 14 samples each took around 140 seconds on a 2.5 GHz Pentium IV. Our work
is based on the same dataset collected by Gunetti (this would help us to compare results and
to confirm their findings) but approaches the problem differently. Instead of using distance
measures to compare between samples as done by Gunetti, our model utilises a neural net-
work for each user responsible to detect and identify his/her typing patterns only. Each
neural network looks at the sample differently from the point of view of the targeted user.
This allows the network to focus on the important and discriminative information available
in each sample that are relevant to the user in question. The final recognised identity is the
one corresponding to the neural network of the most confident output. Our approach’s goal
is to achieve comparable good results as Gunetti’s work while solving their scalability and
performance issue. However, before even considering using machine learning techniques
for this domain, the sparsity and high dimensionality of the typical digraph features vector
has to be considered and addressed. In the next section we will explain the details of our
approach.
5.3 Hypotheses and Research Questions
As we discussed earlier in section 2 of this chapter, there are several timing features can
be extracted from a typing sample and used to model the user’s typing patterns (dwell
time, different definitions of ngraph). In our work, a typing sample is basically a stream of
keystrokes (key codes) along with corresponding timing information about when each key
is pressed. This allows us to compute ngraph durations which is the time passed between
pressing the first and the nth (last) key of the typing sequence. Thus, a typing sample can
be represented by its ngraphs and their corresponding durations. For long enough samples,
86

the same ngraph might appears more than once and as such it is reported only once to-
gether with the average value of its durations. To give an idea about how our raw data looks
like, let’s see the following example of the word ”Biometric” if it happens to appear in our
dataset:
0 B 125 I 390 O 660 M 842 E 1110 T 1295 R 1490 I 1700 C
In our model, we decided to go with n = 2 only for ngraphs, which is called digraph in
this case. That is due to the fact that the longer the ngraph, the fewer samples are likely to
be found in the entered text. The fewer samples we have for a ngraph, the less trustworthy
the duration values from statistical point of view (two values needed at least to compute the
mean) which then can affect the model performance. Similarly, having too many missing
values (when n > 2) would contribute to the problem of having a sparse features vector.
Furthermore, although Gunetti has explored n values of 3 and 4 in their work, their intense
evaluation clearly show that digraphs have the dominant contribution to their results [33].
In contrast to fixed-text based keystroke dynamics where both enrolment and verifica-
tion samples are the same and pre-selected carefully, the free-text based version faces big
challenges related to the fact that the user is free to type both the enrolment and verifica-
tion samples, which would cause two direct problems: 1) curse of dimensionality and 2)
sparsity of the feature vector. A standard keyboard contains 104 keys which means there
are 104 * 104 = 10,816 potential digraphs although many of them are not actually used by
users and may vary according to the current task, application or even the typed language.
This dimensionality challenge would require more training samples to be obtained in or-
der to achieve reasonable learning for a classifier [45]. The sparsity problem appears here
when the typical feature representation is used i.e. each digraph feature has its own specific
place in the features vector, causing a high dimensional features vector. Thus, the vector
will be sparse due to the fact that many of the digraphs will not appear in the provided
sample and as a result there will be no value for them in the final vector. That would affect
87

significantly the classifier accuracy. Therefore, a careful selection of features vector repre-
sentation is needed before applying machine learning techniques to the domain of free-text
based keystroke dynamics.
Moreover, in addition to how effective and accurate the system is in identifying users,
efficiency is another important factor to be considered here. Efficiency refers to the perfor-
mance of the system in term of computational cost and the time needed before an identity is
recognised. Free-text based keystroke dynamics identification is relatively new area of re-
search where a small number of research has been published before [25] [65] [93]. Despite
the encouraging published results of [33], the lack of efficiency of their proposed model is
a big limitation; the heavy computational cost of identification during run time could affect
the system ability to do its job in a real-time manner (numbers will be presented in section
5.5). Such computational cost would not be a big issue if it was required for the training
phase only (offline data processing), when time is not that critical compared to the phase
of identification (operational time) in which the system is required to identify the user as
soon as possible. The underlying hypothesis of this work is that: machine learning tech-
niques can address the inefficiency issue (long identification time) of the state-of-the-art of
free-text based keystroke dynamics, which would allow the system to identify users in a
real-time manner. Thus, our research questions here are:
• What can we do to handle the sparsity and high dimensionality problems of free-text
keystroke dynamics features vector (features vector design)?
• Can we achieve comparable accuracy to the state-of-the-art with less computational
power required during identification time?
5.4 Data Description
As we mentioned earlier, our evaluation is conducted using the dataset collected by Gunetti[33]
which can be considered the state-of-the-art of free-text based keystroke dynamics. This
would help us to compare the results and to confirm their findings. As mentioned in their
88

paper, the data collected using a web based interface consists of 2 fields: login field for
users to enter their identifiers and a text area field where the actual text samples are typed.
Subjects were free to write whatever they want in the text field. Timing information were
monitored using a javascript code that records the time in milliseconds whenever a key is
depressed. Thus, the data consisted of the ascii code of the key along with the correspond-
ing time stamp. This was uploaded to the server where it is stored.
Forty volunteers participated in the original data collection task providing 15 typing
samples each, who were considered as legal users of the system. However, we are provided
with access to only 31 users’ data among the original 40 due to lack of users’ permissions to
share the data. An additional 165 individuals were asked to provide only one typing sample
under the same described conditions. These individuals were considered as imposters who
try to attack the system by pretending to be one of the legal users. All the subjects were
native Italian speakers and as a result all the typing samples were written in Italian. Most
of the volunteers are university students with varying computer skills. All of them were
very used to type on normal computer keyboards. The text area field where samples to be
typed was 12 lines height with 65 characters wide, suggesting 780 characters to be typed.
However, subjects were not forced to fill exactly that number of characters but rather just
to stop when they feel the form has been almost filled. Thus, the collected samples were
between 700 to 900 characters in length.
5.5 Behaviour Modelling
As discussed earlier, the main issue with the state-of-the-art approach of Gunetti [33] is the
heavy computational cost during run time (identification phase), which affects the system
ability to perform in a real time manner as each new sample has to be compared with all
reference samples of all users (around 140 seconds on a 2.5 GHz Pentium IV to classify
a new sample). To overcome this, our model, on the other hand, is designed to shift the
89

computational cost from the running phase to the enrolment phase of operation when time
is not that critical for the system’s task. In our model and as described earlier in section
3.4, a neural network per user is trained to recognise his/her own typing patterns only by
providing the network with the user’s samples as positive examples (target value of one)
and other users’ typing samples as negative examples (target value of zero). As a result,
we will get a trained neural network for each user that would output ideally a value close
to one when it is provided with a sample coming from that targeted user (can be seen as
a probability). The response of the trained neural network for an identity query is very
quick which helps us to achieve real time identification (we will provide a comparison
of the running time later in section 5.7). The final detected identity by our model is the
user corresponding to the neural network with the highest confidence score (closer to one).
However, the maximum score has to be higher than an authentication threshold before it’s
considered. That is to make sure the system is confident enough of the detected identity.
Otherwise, the system’s response would be ’unknown’, which means that sample does not
belong to any of the users already known to the system (the sample belongs to an imposter
then). The neural network that has been utilised in this work consists of 100 neurons in
the input layer (will be discussed in the next section), 50 neurons in the hidden layer (no
significant gain seen by going over this number) and one neuron in the output layer.
5.6 Features Extraction
Before we train a neural network, we need to design our features vector that is going to be
the input to the network. As discussed earlier, the free-text mode of keystroke dynamics
raises the issue of a sparse, high dimensional features vector if we are going to use the typ-
ical features representation of digraphs i.e.104 ∗ 104 = 10816 elements to represent each
possible digraph the user can freely generate. Therefore, we have to design a compressed
version of the features vector that can carry as much discriminative information as possible
and at the same time is not very sparse and high dimensional.
90

As we have a separate neural network for each user, we have the advantage to use a cus-
tom representation of the features vector that are more relevant to the targeted user. In other
words, users’ neural networks do not have to look similarly at the same sample. Instead, we
extract different set of digraphs for each separate network. This is useful as the digraphs
that are more informative and discriminative for one user may not be the same for others.
In our approach, we selected the hundred digraphs with the shortest durations (those that
the user types quickly) as the representative features for each user. The rational behind this
is that we believe that the quickest sequences the user can type are those the user is used to
type frequently and as a result they are linked to him/her such as digraphs of special words
they frequently use, their most used vocabularies, games’ keys combination they master or
even their name, password or email. This means that each neural network is only interested
in the set of the quickest digraphs of the corresponding user and will ignore other digraphs
during both training and identification phases.
The above is done by calculating the digraphs statistics from the set of reference samples
that are going to be used to build users’ profiles. The value of hundred has been selected
experimentally (details will be provided in the next section) in the range of similar values
reported in literature. As not all the hundred digraphs are always available in the typing
samples, we use the value of ’-1’ as representative of each missing digraph in the features
vector (a value of zero can not be used here in this case, as it might be seen as an actual
very short duration of that missing digraph). We can see in figure 5.3 how closely similar
the values of the features vectors of samples coming from the same user. On the other
hand, Figure 5.4 shows the features vectors of the same sample from the point of view of
two different users. This is just to illustrate how different the same sample would look to
each user due to the different features selection. In both of these figures and for illustration
purposes, we presented only the shared digraphs that are available in both of the compared
typing samples (the intersection), that’s why we see less than a hundred indices in the
figures. For comparison purposes, an index is used to refer to each unique digraph.
91
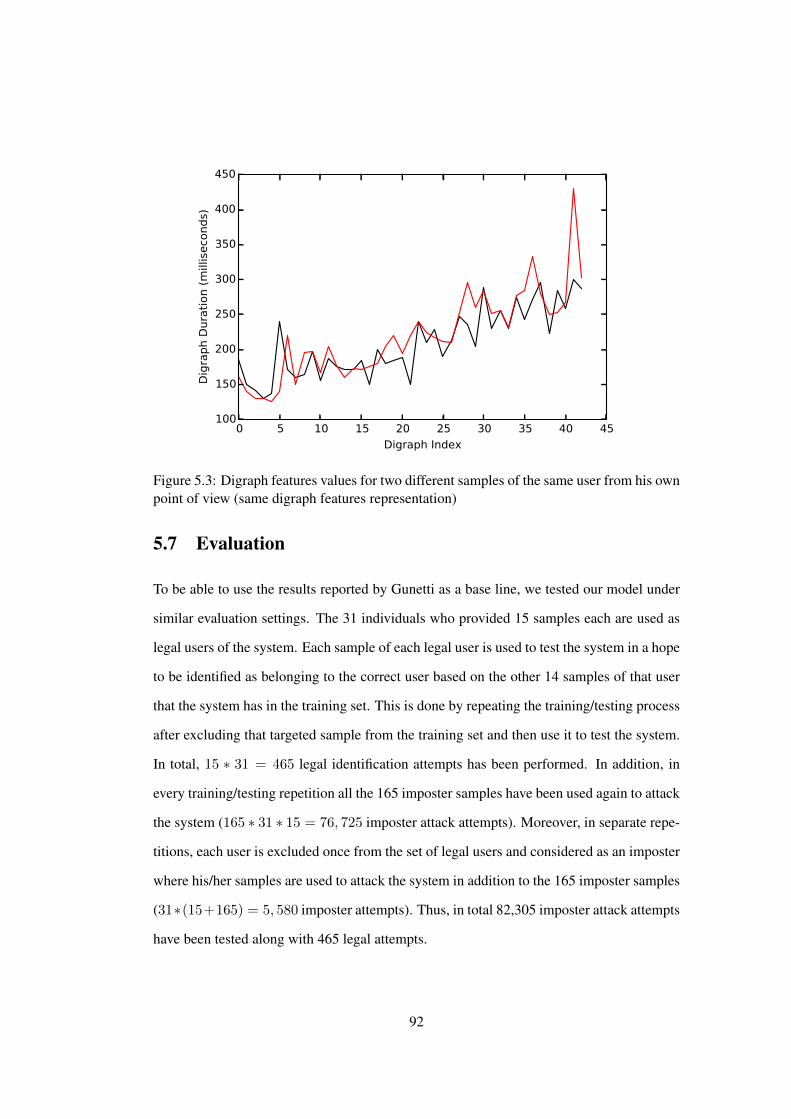
0 5 10 15 20 25 30 35 40 45
Digraph Index
100
150
200
250
300
350
400
450
Dig
raph D
ura
tion (
mill
iseco
nds)
Figure 5.3: Digraph features values for two different samples of the same user from his ownpoint of view (same digraph features representation)
5.7 Evaluation
To be able to use the results reported by Gunetti as a base line, we tested our model under
similar evaluation settings. The 31 individuals who provided 15 samples each are used as
legal users of the system. Each sample of each legal user is used to test the system in a hope
to be identified as belonging to the correct user based on the other 14 samples of that user
that the system has in the training set. This is done by repeating the training/testing process
after excluding that targeted sample from the training set and then use it to test the system.
In total, 15 ∗ 31 = 465 legal identification attempts has been performed. In addition, in
every training/testing repetition all the 165 imposter samples have been used again to attack
the system (165 ∗ 31 ∗ 15 = 76, 725 imposter attack attempts). Moreover, in separate repe-
titions, each user is excluded once from the set of legal users and considered as an imposter
where his/her samples are used to attack the system in addition to the 165 imposter samples
(31∗(15+165) = 5, 580 imposter attempts). Thus, in total 82,305 imposter attack attempts
have been tested along with 465 legal attempts.
92

0 10 20 30 40 50 60
Digraph Index
100
150
200
250
300
350
400
450
500
Dig
raph D
ura
tion (
mill
iseco
nds)
Figure 5.4: Digraph values for the same sample from the point of view of two differentusers (different digraph features representation)
The metrics that have been reported are FAR (false acceptance rate), FRR (false rejec-
tion rate). FAR is critical for security applications, where the main use case of the system
is to completely avoid (or at least minimise) incorrect identifications of either an imposter
being identified as legal user or a legal user is recognised as someone else. FRR refers to
the likelihood the system incorrectly identifies the legal user as being imposter. The val-
ues of both FAR and FRR are dependent on the authentication threshold, which we can be
tuned to meet the application’s requirements. Figure 5.5 shows how the values of FAR
decrease and the FRR increases as the authentication threshold increases. This makes sense
as the higher the authentication threshold is, the much strict the system is in accepting users.
When we compare the results we obtained with the state-of-the-art in Gunetti’s work
shown in Table 5.1, we can see that we have comparable results. However, the advantage of
our approach that it does not wait till identification time to do all the calculations. Instead, it
utilises machine learning techniques to pre-construct users’ profiles during enrolment phase
so they can be used later to identify new samples efficiently during identification time to
93

0.12 0.13 0.14 0.15 0.16 0.17 0.18 0.19
False Acceptance Rate (%)
1.5
2.0
2.5
3.0
3.5
4.0
4.5
5.0
5.5
Fals
e R
eje
ctio
n R
ate
(%
)
ROC Curve
Threshold FRR(%) FAR(%)10% 1.720 0.18215% 1.935 0.17920% 2.150 0.17625% 2.365 0.17430% 2.580 0.17235% 2.795 0.16740% 3.010 0.15945% 3.221 0.14250% 3.440 0.13955% 3.655 0.13760% 3.870 0.13665% 4.086 0.13470% 4.301 0.13375% 4.516 0.13180% 4.731 0.13085% 4.946 0.12590% 5.161 0.122
Figure 5.5: FAR and FRR values according to different authentication thresholds and thecorresponding ROC curve.
provide real-time responses. On a 2.4 GHz Intel Core i3, training each network took around
5 seconds each so in total 155 seconds for 31 users. But again, this is done only once and
during enrolment phase where there is no pressure for real-time decisions. In real life sce-
nario, there’s no need to re-train users’ neural networks very often, only when we have new
reference samples added to the system (newly added user or updating old user’s profile).
It’s obvious that training the networks can be distributed on a parallel architecture to reduce
that time even more. However, in our approach identifying a new sample takes only 2.7
seconds during running time. This is a good improvement considering the time reported in
Gunetti’s work was 140 seconds to identify a new sample on a 2.5 GHz Pentium IV.
All the presented results above are based on the value of hundred for the features vector
length. In the next section, we will briefly show the effect of different values of features
vector length.
94

FRR(%) FAR(%)0.833 0.3761.666 0.2521.333 0.1922.5 0.114
Table 5.1: FAR and FRR identification values reported by Gunetti [33] using differentdistance measures
40 60 80 100 120 140 160
Features Vector Length
0
2
4
6
8
10
12
Err
or
Rate
(%
)
(100, 3.44)
(100, 0.139)
FAR
FRR
Figure 5.6: Error rates according to different values of features vector length
5.7.1 Effect of Features Vector Length
As we mentioned earlier, we decided to use the shortest one hundred digraphs in term of
duration as features. The value of one hundred has been selected experimentally from the
range of similar values in the literature between 50 and 150 (with a step of 10). Figure 5.6
shows how the values of FAR and FRR errors change according to different values of the
length of the features vector. A 50% authentication threshold is used in this experiment to
calculate the error rates. We can see that the error values tend to drop when increasing the
number of features until a certain level. This is due to the additional typing information
available to the model about the users. However after that, increasing the number of fea-
tures would not necessarily improve the results, as that could lead to sparse features vectors
95

(many digraphs could be missing in the typing sample), which would affect the classifier’s
accuracy as a result. We selected the value of hundred for our features vector length as
it corresponds to the lowest error rates of both FAR and FRR. The marked values (3.44,
0.139) on Figure 5.6 are the same values reported in Figure 5.5 (corresponds to 50% au-
thentication threshold) shown in the previous section.
It is interesting to note that the features vector can be even optimised further on individ-
ual level, i.e the number of features can be selected differently for each user (which is part
of our future work).
5.8 Conclusion
Keystroke dynamics is defined as the automatic analysis of people’s typing patterns on input
devices to build a behavioural profile for each individual that can be used for identification
purposes. The good potential of such passively collected biometric data has attracted an
increasing research interest recently to apply this technology in a wide range of online and
offline systems such as in banking, remote learning and digital assets access control. In
this chapter, we have presented our work in the domain of keystroke dynamics, specifically,
the free-text mode, where the user is free to type and use the keyboard regularly with no
enforced tasks to do or imposed texts to type. We discussed the scalability and performance
limitations of the state-of-the-art work and proposed our approach accordingly. Experimen-
tal results showed that our model is both practical and reliable (See Table 5.2). Reliability is
illustrated through our evaluation process that involves multiple repetitions of training and
testing of the model to ensure unbiased results, which produced our error rates that are very
comparable to the state-of-the-art approach. Similarly, practicality is presented in term of
quick identification response with limited computational cost during operation time on data
collected freely by the user with no imposed texts or tasks.
Future work can include several aspects and optimisations such as: exploring different
96

Approach
Utilising a neural-network-per-user approach to minimise thecomputational cost needed during operation time in SOA approach.
A custom representation of the features vector that is more relevant tothe targeted user.
FeaturesThe hundred digraphs with the shortest durations as the representative
features for each user.
PracticalityData Gathering
Subjects were free to write whatever they want.31 native Italian typers as legal users, providing 15 typingsamples each. An additional 165 individuals as imposters,
provided only one sample each. Samples were between700 to 900 characters in length.
Operation Time
The effect of features vector length is studied in the rangebetween 50 to 105 with a step of 10.
2.7 seconds of identification time, compared to 140 secondsreported in Gunetti’s work to identify a new sample on a
2.5 GHz Pentium IV.
ReliabilityEvaluation
Multiple repetitions to avoid bias, different samples areexcluded from the training set in several repetition and
used to attack the system as imposters.In total 82,305 imposter attack attempts have been tested
along with 465 legal attempts.
PerformanceFrom (1.72%, 0.18%) to (5.16%, 0.12%) of (FRR, FAR)
that are almost the same values of the SOA but with muchfaster identification time.
Table 5.2: Keystrokes Dynamics Approach Summary
sets of features and the use of automatic features selection methods. This can be applied
even on an individual level (per user), thanks to our separate classifiers approach, which has
the potential to further enhance the results.
This chapter, along with the previous one, shows that our normal interaction with com-
puters via typical input devices reveals behavioural characteristics that can be modelled
to identify users. This has been done by utilising local low-level features in both mouse
dynamics (mouse curves) and keystrokes dynamics (digraph durations). According to our
experimental results, these local features were able to discriminate between users but we
think they are too low level to provide descriptive insights about the differences between
users’ behaviour profiles that can be interpreted by humans. In the next chapter, we will look
into using global features to model human-computer interaction in GUI based systems.
97

Chapter 6
GUI based User Behaviour
Modelling
6.1 Overview
In both of our previous work on mouse and keystrokes, we were analysing the temporal and
local features of each component separately and regardless of the context of that patterns.
On the other hand, in this chapter we are exploring the events from a higher level point
of view and by combining the several events coming from other sources together. We are
looking at how the user uses the machine in general and how he/she is achieving his/her
daily tasks through the interaction with the interfaces.
The distinction between local and global features is mainly derived from computer vi-
sion and image processing domains, where researchers use these two kinds of features to
capture different characteristics about the image and its content. Global features are typi-
cally used to describe the image as a whole, whereas local features are interested in a limited
portion of the image (key points). Both types of features are also utilised in biometric sys-
tems that are based on image processing such as face, fingerprint and signature recognition.
For instance, global features can be used to describe and identify an individual’s signature
as a whole, height and width of the signatures, height to width ratio, horizontal and vertical
98

projections of signature images are examples of global features typically used to identify
a signature [43]. On the other hand, local features are used to describe specific regions
of the image such as describing left eye, right eye, nose and mouth in a face recognition
system [4]. In this work, we are trying to explore to what extent global features can be used
to describe and identify the user based on his/her way, skill or style of interaction with a
graphical user interface environment. Although we are mainly interested here in identifi-
cation, our features are engineered to be extensible and applicable to other domains. This
is to conform to our future research plans of automatically building enhanced user profiles
based on the interaction data, which has potential to extract new insights about a user’s
preferences, skills or even stress level or mood. Profiling the user behaviour could also be
utilised to enhance his/her usage experience by providing customisation and personalisation
services. It could be used also to better optimise the computer resources (CPU, memory,
caching, loading, etc) by predicting what the user is going to do next and preparing/fetching
the needed computer resources in advance.
Instead of modelling what the user usually does on the computer, our main focus is
to model how the user interacts with the computing resource. Compared to command-line
interface (CLI) based systems, those based on graphical user interface (GUI) give the user
more freedom and provide alternative methods to complete tasks [30]. Even very simple
operations such as copy-paste, writing short words and switching between application win-
dows can be done in significantly different ways among users in GUI based systems. For
instance, to copy a piece of text, a user could first use the mouse to select the text, press the
copy command and then move the mouse to the destination and paste the text eventually.
Whereas, another user could perform all the operations through keyboard shortcuts. Others
could use both keyboard and mouse together to achieve this simple task. Many questions
can be asked here in this context: Does the user tend to do her/his work in a multi-tasking
fashion? How many windows at once the user opens? How frequently does the user switch
between windows? What the percentage of the user interaction is done via mouse com-
pared to keyboard? Does the user depend on keyboard shortcuts or use the mouse more in
99

general? What is the average typing speed of the user? As we see, there are many choices
available to the users to achieve their tasks in such systems and therefore there is potential
to model this behaviour and use it as an identification mean of users. This also helps us to
see clearly the benefit of a comprehensive identification model that takes advantage of the
different forms of interaction data coming from all the available sources to increase identi-
fication accuracy and to reduce identification time.
To detect the real identity of the current user of a computer, our approach depends
on the manner the user interacts with the GUI of the system. It captures the statistical
characteristics of the usage patterns and compares them to the previously built profiles.
The advantage of our approach is that it doesn’t depend on the observed usage patterns of
mouse or keyboard separately, but rather it utilises all the available modalities to identify
the user. This is done continuously during the entire usage session. Our research shows
that computer usage patterns have enough discriminative power to reveal the user identity.
The contribution of this research is a new model for dynamic user identification that utilises
global multimodal GUI-based features. In addition, two experiments have been conducted
based on two databases collected by our logging tool, LoggerMan (described in section
3.2.3), that has been developed specifically for this purpose and released for public use.
6.2 Related Work
The user study on the use of interactive computing systems [10] from 1974 can be consid-
ered as the first user behaviour tracking experiment, even though the data was not used for
identification but rather for investigating how users were using mainframe computers. The
work of Anderson in 1980 formed the first step toward automatic behaviour modelling for
intrusion detection [71], in which he automatically collected log files, resource and com-
mand usage information to profile users behaviour and make sure they are not engaged in
harmful actions [3]. Most of the previous work in this area was based on the set of com-
mands used by the users in command-line based systems. A typical target of this approach
100
is UNIX operating system. The familiarity with the command line interfaces varies a lot
among users, including the awareness and usage of their features. According to studies,
users tend to be consistent with their choice of commands during their everyday tasks.
The patterns of commands sequences generated by users are studied in [53] and proven
to be useful for abnormal user behaviour detection. The login host, the login time, the com-
mand set, and the command execution time were used to profile and identify users with a
low error rate [91]. In [79], 15,000 commands from about 70 users were captured. Statis-
tical methods were applied to capture the intrusion such as Hybrid multistep Markov and
Bayes one-step Markov [82]. This was extended by [62] with Naive Bayes classifier, a 56%
enhancement in intrusion detection was reached with a corresponding false-alarm rate of
1.3%. Other researchers have also focused on the area of command line profiling such as in
[77] and [100].
Nowadays, most modern operating systems and software are deploying graphical user
interfaces instead of the legacy command line interface. This shift has not been followed
by an equivalent increase of research work in the area of behaviour profiling based on GUI
interaction. Still, some work has been done here. In [31], time between windows switch-
ing, time between new windows, number of windows open at once and number of words in
window title were employed as features. The same dataset of the previous work has been
utilised in [47] using symbolic learning. The mean and the standard deviation of 8 raw
features of mouse interaction were used in [30]. These raw features were the number of
right/left mouse clicks, mouse distance, mouse speed and mouse angle (four directions).
This work was based on 3 users, and adding more features based on the running processes
and keyboard usage statistics did not improve the results significantly.
As we discussed earlier in previous chapters, many techniques can be found in litera-
ture for analysing either mouse usage patterns of the user or their typing patterns on the
keyboard. The disadvantage of such single-input-device identification systems, is the poor
101
performance when the user is not using that input device long enough to generate the needed
interaction data, which may affect both accuracy and identification time. On the other hand,
a comprehensive identification system that takes advantage of all kinds of multimodal in-
teraction data (mouse, keyboard and any other available sources) has a better potential to
detect the user identity in shorter session length and regardless of what input device the user
is using. These are the advantages of our approach here.
Another domain that could be close to our work is program profiling, which typically
employs system calls to model the normal behaviour of the program, and then try to de-
tect suspicious behaviours based on the difference between the current captured behaviour
and the previous modelled one. In [41], short sequences of system calls were used along
with Hamming distance as a measure to detect intrusion. Data mining techniques such as
association rules and frequent episodes are used for similar detection [55]. We believe that
program profiling is somehow easier problem, since programs are designed to do specific
tasks with limited freedom, unlike humans whose behaviour is unpredictable.
In this work, we present our approach for user identification and profiling based on
a multitude of multimodal GUI interaction data. Our approach provides richer user be-
havioural model, and our experiments show that it achieves accurate and reliable user iden-
tification.
6.3 Hypotheses and Research Questions
In our previous work on mouse and keystroke dynamics, we have utilised temporal and
local features to model the user’s behaviour while using the normal input devices. All the
used features were local, low-level and designed to capture the temporal features of the
user’s patterns (such as curvature properties of the mouse curves and the digraph durations
of keystrokes sequences). These features were sufficient to capture the user behaviour’s
patterns but they were too low level to have direct interpretable descriptions that can give
102
us meaningful insights about that individual usage profile. We decided here to explore
the use of global features to model the user’s behaviour in a GUI based system. Features
were selected to be as human-readable as possible so it can be used in future as part of
user’s profile visualisations that can give direct insights and information about the user such
as their own skills, preferences or styles of computer interaction. Our hypothesis is that:
behavioural information with discriminating power is revealed during normal GUI based
computer usage, which can be employed for user identification, with many other potential
user modelling applications. Thus, our main research questions for this work are:
• What global features can we extract to model users’ behaviour in a GUI based system
for identification purposes?
• How much discriminative is each subset of features (mouse, keyboard, app)?
• Is the model environment independent (environment agnostic)?
6.4 Behaviour Modelling
In order to test our approach in a real life scenario, our model uses low-level computer
events collected from users during their normal computer work. To make this possible and
to overcome the lack of a comprehensive data sets, we used, LoggerMan [38], which is
described previously in section 3.2.3. Table 6.1 shows the different channels of computer
events that our logging tool can capture: mouse, keyboard, application, window and clip-
board. However we discarded the data coming from window and clipboard modules as we
believe that such data is more related to what the user is doing (e.g., window’s title and
clipboard’s content) not how the user is using the machine. The two datasets that have been
collected for this work will be described later in section 6.5.
As in the previous two chapters, our goal is to recognise the user currently interacting
with the machine based on interaction behaviour characteristics. To achieve this, we cal-
culate statistical features of the computer events we intercept. We then concatenate these
103
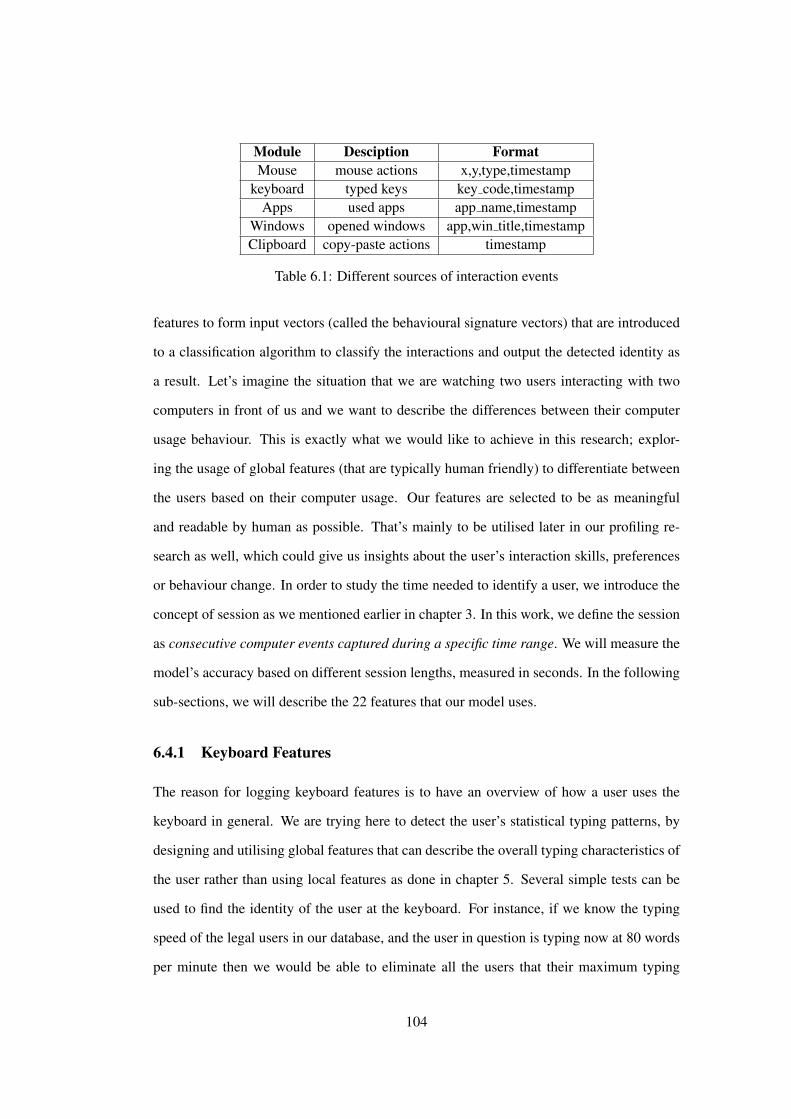
Module Desciption FormatMouse mouse actions x,y,type,timestamp
keyboard typed keys key code,timestampApps used apps app name,timestamp
Windows opened windows app,win title,timestampClipboard copy-paste actions timestamp
Table 6.1: Different sources of interaction events
features to form input vectors (called the behavioural signature vectors) that are introduced
to a classification algorithm to classify the interactions and output the detected identity as
a result. Let’s imagine the situation that we are watching two users interacting with two
computers in front of us and we want to describe the differences between their computer
usage behaviour. This is exactly what we would like to achieve in this research; explor-
ing the usage of global features (that are typically human friendly) to differentiate between
the users based on their computer usage. Our features are selected to be as meaningful
and readable by human as possible. That’s mainly to be utilised later in our profiling re-
search as well, which could give us insights about the user’s interaction skills, preferences
or behaviour change. In order to study the time needed to identify a user, we introduce the
concept of session as we mentioned earlier in chapter 3. In this work, we define the session
as consecutive computer events captured during a specific time range. We will measure the
model’s accuracy based on different session lengths, measured in seconds. In the following
sub-sections, we will describe the 22 features that our model uses.
6.4.1 Keyboard Features
The reason for logging keyboard features is to have an overview of how a user uses the
keyboard in general. We are trying here to detect the user’s statistical typing patterns, by
designing and utilising global features that can describe the overall typing characteristics of
the user rather than using local features as done in chapter 5. Several simple tests can be
used to find the identity of the user at the keyboard. For instance, if we know the typing
speed of the legal users in our database, and the user in question is typing now at 80 words
per minute then we would be able to eliminate all the users that their maximum typing
104

speed is significantly lower than 80 WPM from the list of candidates. This is because,
people could type slower than normal but it is unlikely or impossible for them to type twice
their maximum speed. In addition, some keys on the keyboards could be more accessible
than others for a specific user. For instance, numbers and control keys may take more time
for a user to find them. Handedness (right-handed/left-handed) and the way of typing (one
hand or both hands are used) are both important attributes to be considered here. To handle
this, our model uses 4 different features related to the average typing speed of 2 consecutive
keys depending on their location on the keyboard. In other words, how fast can the user
type two keys both located to the right side of the keyboard? how that can be compared if
they both located to the left or each one in a different side? The complete set of keyboard
features our model utilises (ten features in total) are as follows:
• percentage of delete keys usage
• percentage of control keys usage
• minimum typing speed
• average typing speed
• maximum typing speed
• average typing speed of numbers keys
• typing speed of 2 consecutive right-side keys
• typing speed of 2 consecutive left-side keys
• typing speed of 2 consecutive right-to-left keys
• typing speed of 2 consecutive left-to-right keys
6.4.2 Mouse Features
The purpose of the mouse features is to capture the patterns a user follows during his/her
interaction with the computer using a pointing device and they represent the mouse usage
characteristics of the user. The following are the ten mouse features our model uses:
105

• Average and standard deviation of the clicking delay (the time the user takes between
pressing down the mouse’s button and releasing it).
• Normalised histogram of the count of different mouse actions performed (move,
click, scroll and drag-drop) by the user.
• Average and standard deviation of the mouse actions distances in pixel (does the user
tend to perform long or short actions?)
• Average and standard deviation of the mouse actions speeds (how fast does the user
move the mouse?).
6.4.3 Application Features
The applications the user normally uses can differ from day to day and from task to task.
Thus, we can’t rely on them for identification purposes. However, the duration the user
spends on a single application can be considered as a behavioural attribute of the user pro-
file. It can be seen as a measurement of how multitasking the user is. In our approach,
we take the average and the standard deviation of applications usage time in the targeted
session as features.
6.5 Approach and Evaluation
As described earlier, the objective of our approach is to detect the identity of the user based
on statistical features of the observed computer events. To do that, we use the behavioural
signature vector as an input to a machine learning classifier. Similar to our work in the previ-
ous chapters and as described in section 3.4, we used a neural network per user responsible
for recognising him/her own GUI interaction behaviour only by providing the network with
the samples of the corresponding user as positive examples (one as a label) and other users’
samples as negative examples (zero as a label). Then, the final recognised user would be the
one that corresponds to the neural network with the highest output. However, the highest
output has to be higher than an authentication threshold before it’s considered. This is to
106

make sure the system is confident enough of the recognised identity. Otherwise, the final
response would be ’unknown’, which indicates that tested behavioural vector does not be-
long to any of the users the system already knows (the behaviour belongs to an imposter).
The feed-forward neural network that has been utilised in this work consists of 25 neurons
in the hidden layer (no significant gain achieved by increasing this number) and one neuron
in the output layer. During evaluation, we will present first the results of combining all the
features of all components in a single signature vector. Then, to show the discrimination
power of each component (mouse, keyboard, application) separately, we will follow that
with a comparison of the equal-error rates obtained after considering only the sub features
related to each single component alone. As a result, our final network takes 22-feature-long
(all features) vectors as input (22 neurons in the input layer) and outputs a single value rep-
resenting the likelihood that signature vector belongs to the user this network represents.
To see how the identification error rates change according to session’s length (the dura-
tion of interaction), we employed different values of sessions duration: 2, 5, 10, 15, 20, 25
and 30 minutes. Two datasets have been collected to evaluate our approach:
• The first dataset consists of the interaction data of seven subjects (professional com-
puter users) collected during their work hours.
• The second dataset contains the interaction data of only two subjects (from the same
seven above) collected while they were using their personal computers (different ma-
chines) out of work hours.
Both of the datasets are three consecutive weeks long (for each user) and gathered
during normal computer use. For the best of our knowledge these are the first datasets that
provide mouse, keyboard and app events together. Table 6.2 shows the number of computer
events collected by each user for each dataset. The description and format for each event are
presented in Table 6.1. Two experiments have been conducted based on the above datasets,
and will be detailed in the next two sections.
107

User Mouse Keyboard App
Dataset 1
1 275456 165354 35372 136495 87180 54203 61972 90661 10524 92675 144620 14175 55843 48068 10766 467710 69013 126847 170178 50454 2515
Dataset 21 90518 13152 7002 35901 11975 412
Table 6.2: Number of computer events collected for each user
6.5.1 Experiment 1: Identifying The Individual
In this experiment, we use the first dataset mentioned in the previous section, i.e.the interac-
tion data of the seven users while using their work computers. The sessions of each user are
randomly divided into two equal subsets: training and testing. After training the system on
the training set only, we test the system by counting the number of misclassifications against
all the sessions in the testing set. However, to simulate the case of imposters (users that the
model has not seen training examples related to them) the previous process is repeated seven
times. In each time, one of the users is considered as an imposter (outsider) and as such
his/her sessions are excluded during the training phase and are added to the testing set. The
total number of misclassifications over the seven times is used to calculate false acceptance
rate (FAR) and false rejection rate (FRR). To find the value of equal-error rate EER (where
FAR = FRR), we conduct the testing by varying the authentication threshold between 0.1
and 0.9 (more details about FAR, FRR and EER are provided in section 3.6). Figure 6.1
shows the results obtained when using all 22 features for 30-minute-long sessions. We can
see how FAR decreases and FRR increases when we increase the authentication threshold.
This conforms to our intention behind using this threshold as a mechanism to control the
error rates. By selecting a specific value for the authentication threshold, we can balance
the values of FAR and FRR according to our targeted application’s needs.
The equal-error rate is usually used to compare the performance of different identifi-
108

7 8 9 10 11 12 13 14 15 16
False Acceptance Rate (%)
4
5
6
7
8
9
10
11
12
13
Fals
e R
eje
ctio
n R
ate
(%
)
ROC Curve
Threshold FRR(%) FAR(%)10% 4.13 15.2315% 4.95 14.7520% 5.62 13.1125% 5.98 12.2730% 6.31 11.5635% 7.01 11.0340% 7.89 10.2145% 8.45 9.8250% 9.42 9.4355% 9.88 9.0360% 10.34 8.8965% 10.78 8.5670% 11.05 8.475% 11.35 7.8980% 11.80 7.4685% 11.97 7.2490% 12.43 7.24
Figure 6.1: FAR and FRR values according to different authentication thresholds for ses-sions of 30-minute long and the corresponding ROC curve.
cation models as it implicitly carries information about both FAR and FRR. Thus, we are
going to use EER to compare the performance of our model under the different values of
session’s length and according to our different studied components.
Figure 6.2 compares the EER rate of mouse, keyboard and application features each
separately and also shows the results after combining all the components together in one
input vector. A random guessing (selecting one of the seven user randomly from the equally
distributed classes) error rate is also presented in the figure as a baseline. As we can see, the
model’s error rate (’all’ curve in the figure) is around 18% after only 2 minutes of interaction
and it gets lower as the session’s length increases, down to almost 9.42% after 30 minutes.
That’s because a long session means more behavioural patterns observed and as a result
more accurate statistical features and less errors. However, the longer the session is, the
more time the imposter has to manipulate the system before being identified as an intruder.
Also we can see how the error decreases when the final features vector (all the features)
is used, especially when compared to a random guessing error rate. This experiment was
109

conducted to answer the first and second research questions of this work by evaluating
the different global features we designed and by showing the discriminative power of each
subset of features (mouse, keyboard and application) separately and combined. In the last
chapter, we will explain briefly how these global-feature results are compared to our results
achieved in the previous chapters using local features.
0 5 10 15 20 25 30
Session Length (Minutes)
0
10
20
30
40
50
60
70
80
90
Equal Err
or
Rate
random guess
app
mouse
keyboard
all
Figure 6.2: Identification equal-error rates comparison according to experiment 1
6.5.2 Experiment 2: Environment Dependency Analysis
The goal of this experiment is to explore whether the model is able to identify the user even
if the data was collected on a different machine than the one used for training the model.
This helps to ensure that the model has learned the usage patterns of the user independently
from the environment used for data collection, i.e., that the process is environment inde-
pendent. We utilise both the first and the second datasets for this experiment. The second
dataset contains data from two users (two from the same seven users of dataset 1) who have
been logging data on different computing devices. The same multi-neural-network archi-
tecture described in the previous experiment is used here, but the training and testing sets
110

are different. After training the model on the whole first dataset which contains the inter-
action data of all the seven users, we then use the second dataset to test the accuracy of the
model. Thus, all the seven users are in competition in this experiment although the test set
contains data of two of them only. The mouse, keyboard and application features all have
been fused into one input vector here (as was the case with the ‘all’ line in Figure 6.2). For
comparison, the same authentication threshold values used in the previous experiment to
get the curve ’all’ in Figure 6.2 are used in this experiment. Figure 6.3 illustrates FRR of
the second experiment. The results show that the model’s error rate has not dropped even
though the test data was collected from a totally different machines than the ones the model
has been trained on, as well as the user using the computer in a different environment. This
answers our third research question of this work by showing that the model is environment
independent. The marginally lower error rates of this experiment’s curve is because the
model has seen more training samples while training on the whole first dataset, unlike the
previous experiment where available data was divided for training and testing.
0 5 10 15 20 25 30
Session Length (Minutes)
8
10
12
14
16
18
20
Err
or
Rate
all - expt 2
all - expt 1
Figure 6.3: Error rates of experiment 2 by using all features combined
111

6.6 Conclusion
In this chapter we have proposed an approach to model the user interaction with the com-
puter in GUI based system. Two experiments have been conducted to evaluate our approach
based on two datasets gathered specifically for evaluation. Our model exploits several mul-
timodal interaction data coming from mouse, keyboard and the app usage to recognise user
identity. Several global features have been extracted to model user’s behaviour. Our ap-
proach has focused on ensuring the practicality and reliability aspects of the model. As
Table 6.3 summarises, practicality is addressed by building the model on data collected
from real work and home environmental settings and by studying the effect of different du-
rations of the session. Reliability, on the other hand, is ensured through the results of our
two experiments that are based on multiple repetitions of training/testing of the model on
different variations of the dataset. Special attention has been made to select features that
can have meaningful description to human, which can contribute to our future research of
automatic building of users’ profiles that provide insight about different aspects of user’s
skills, preferences and styles of human-computer interaction.
Future research would extend the dataset to a larger number of users to check the model
scalability and consistency over time. In addition, an online machine learning model could
be important here to continuously update the learned usage profiles of the users to keep
them consistent with any future change to the user’s style or skills of computer usage.
In the next chapter, we are going to bring our three components together for summarisa-
tion and comparison including discussions of fusion techniques that can be used to combine
our components into one identification system.
112

ApproachUtilising global features only to identify the user based on his way,
skill or style of interaction with graphical user interface environment.
Features22 global features (10 keyboard, 10 mouse and 2 apps) that are selected
to be as meaningful and readable by human as possible.
PracticalityData Gathering
Two datasets, both are three consecutive weeks longand gathered during normal computer usage.
The first dataset consists of 7 subjects collected duringtheir work hours.
The second dataset consists of 2 subjects collected fromtheir personal computers out of work hours.
Operation Time
Session is defined as consecutive computer eventscaptured during a specific time range.
Model’s accuracy is evaluated based on different sessionlengths: 2, 5, 10, 15, 20, 25 and 30 minutes.
ReliabilityEvaluation
Multiple repetitions to ensure consistency, differentsamples are excluded from the training set in several
repetitions and used to attack the system as imposters.Two experiments have been conducted: one to evaluatethe identification accuracy of the model and the otherto prove that the model is environment independent.
PerformanceFrom EER of 18% for session length of 2 minutesdown to 9.42% of EER for 30 minutes sessions.
Table 6.3: Approach Summary
113
Chapter 7
Comparison, Discussion and Fusion
Three different components have been presented and discussed separately in this thesis so
far. The purpose of this chapter is to provide an overall discussion and comparison about
the different properties of our components. In addition, we present here different strategies
that can be used to combine our separate components into a comprehensive identification
system.
7.1 Biometric Properties: Discussion and Comparison
As mentioned earlier in section 2.5, there are several properties that can be looked at when
one is considering a biometric system. In this section, we go through our studied compo-
nents to compare their different properties where applicable and/or discuss what they have
in common to provide an overall view of HCI based biometrics including their advantages
and disadvantages.
7.1.1 Universality
Universality is about the availability of the studied characteristic between people. This is to
ensure that the majority of the population have that characteristic and as such can be used
as means of identity recognition. When we are targeting computer users population, we can
realise that the universality of HCI based biometrics is high as typical computer users have
114

to use the mouse or/and keyboard to interact with the machine although they may differ
in their skills and preferences. As a result, they would leave usage footprints that can be
leveraged for identification purposes. However, users differ in the usage intensity of each
input method. Some people depends on mouse mainly to achieve their tasks while others
prefer keyboards or a combination of the two input devices to get things done.
In [98], researchers looked at the input devices used in computing. They reported that
the mouse was the most commonly used input method as 90% of subjects used a mouse
on a daily basis. The use of keyboard shortcuts was very dependent on the task performed.
The most common task for keyboard shortcuts was copy-pasting with 36% of users utilis-
ing this method. Similarly, sixty-three computer users were surveyed in another study [90],
they concluded that only three people mentioned shortcuts. Although this may suggest that
the mouse is the main preferred device for people to do tasks, we need to remember that
keyboards are still the primary input device we use everyday for data entry.
Many promising input techniques have been developed in the last decade: Wii, Kinect,
voice search and iOS touchscreens for instance. As a result of this new competition, one
may predict the end of mouse and keyboard. But, when we look at the numbers, it does not
seem that is really happening. Figure 7.1 compares the relative volume of Google search
queries for the terms “keyboard” (the upper blue curve) and “mouse” (the red lower curve)
during the last ten years (since 2007). We can not see a significant drop of interest in these
terms during the last decade (numbers represent search interest relative to the highest point
on the chart. A value of 100 is the peak popularity for the term). This illustrates that both
input devices have high universality in term of exploiting their usage characteristics for
identification.
7.1.2 Performance
Here we are interested in looking at the system’s reliability and practicality as that reflects
the performance and stability of the system as discussed previously in section 3.6). Com-
115

Figure 7.1: Comparison of Google search queries volume for mouse and keyboard terms
paring different behavioural biometric systems is not very straightforward as that depends
on several factors. The number of subjects in the experiments is one of them, as that in-
creases/decreases the difficulty of the identification problem. The time each subject needs to
generate the required amount of traits also differs between the studied components, which
by its turn affects the accuracy rates. However, our experiments can still provide some in-
teresting comparison. We can clearly see that the local temporal features used in the first
mouse and keystrokes components outperform the global features used in the GUI work.
For instance, the equal-error rate obtained using the mouse curve features is 9.8% for ses-
sion length of 5.6 minutes on average, which is almost the same of 9.42% equal-error rate
reported in the last component using the global GUI based features but for a much longer
session length (30 minutes). Keystrokes results also confirm this by showing even much
lower error rates. But, as we can see the local features used in both mouse and keystrokes
models are too low level to have meaningful descriptions to be used as part of insightful
or informative user profiles that form the future direction of our research. To ensure reli-
ability of the results across the three studied components, all the experiments were based
on multiple repetitions, where different permutations of the training and testing datasets
were explored during evaluation. In addition, in each repetition, some of the samples were
excluded from the training set and used to attack the system as imposters.
Practicality of the models of our studied components is also considered. This is done by
building models that rely on data collected from real-environment scenario, where people
are working normally on their computers. In addition, practicality is covered by linking and
116

presenting the accuracy of the system along with the amount of traits needed for decision
(session). This section is summarised in Table 7.1, where we can see a summary of the
performance of our models with the other relevant information of the number of users and
the selected features. As we can see the keyboard dynamics approach is providing the
lowest error rates although it is been evaluated using a larger dataset. Followed by the
mouse and then the GUI based modelling using global features.
Component Population Features Performance
Mouse 10 subjects.19 local features:
152 values(8-bin * 19)
From EER of 9.8% for 100-curve sessions (5.6 min)down to 5.3% of EER for 300-curve
sessions (18.7 min).
Keyboard31 typers.
165 imposters.
100 local features:100 shortest
digraphs.
From (1.72%, 0.18%) to (5.16%, 0.12%)of (FRR, FAR).
GUI 7 subjects.
22 global features:10 keyboard
10 mouse2 apps.
From EER of 18% for 2-min sessionsdown to 9.42% of EER for 30 minutes.
Table 7.1: Performance overview of our models
7.1.3 Collectability
This property is related to the ease of trait collection of the studied characteristic. This
is to reflect how difficult it is to capture the traits, as that can affect the cost and quality
of the whole identification system. The advantage of our approaches is that they do not
require special hardware devices for data collection. They use the typical input devices
available with almost every computer. However, the level of details that can be collected
differs according to the implementation of the traits collection unit in the biometric system.
This totally depends on the actual application requirements. For instance, data can be either
collected from the user’s local machine directly (using a thin client) or from a web page
designed for this purpose. Using a client installed on the user’s machine to directly collect
the traits makes our three components are exactly the same in term of collectability as the
client can easily use the operating system APIs to intercept the needed information. On
117

the other hand, the collectability of our studied components differ when the traits are to
be collected over the web. Table 7.2 illustrates the level of details that can be collected
in each scenario. It’s also important to note that mouse and keyboard dynamics methods
have advantage over other identification techniques such as voice, face or fingerprint when
running over the web inside the browser, as they do not ask for special privileges to record
camera or mac. They can be passively implemented inside the web application with no
negative impact on the website friendliness/trustworthiness.
Component Locally On The Machine Over Web
MouseAll cursor coordinates and
mouse events are collectable.
Coordinates and mouse events are limitedto the webpage portion.
No mouse data can be collectedoutside the browser.
KeyboardAll keys events are collectable,
including special and functional keys.
Only keys pressed inside the webpagecomponents can be collected.
Functional keys are not collectable.
GUIUsage of mouse and keyboard is collectable.Apps and windows data are also available.
No information about the windowsor apps used by the user.
Table 7.2: Local machine vs. over web collectability comparison.
7.1.4 Acceptability
Acceptability is related to what extent people would accept the use of technologies includ-
ing capturing, processing and storing their personal traits by the system. This depends on
what kind of data is being collected. Thus, in our design, we made sure not to use any data
that can be considered sensitive by most users. Both mouse events and the global features
of GUI interaction data do not reveal sensitive information about the users, and as such the
subjects in our experiments did not actually mind collecting this data. However, keystrokes
data can carry personal information about the user if not handled properly during data col-
lection phase. The stream of the used keys can be segmented into words, which can reveal
private information about the user. As our model of keystrokes dynamics depends on di-
graphs (pairs of keys) regardless of its context in the typed words and regardless of its actual
118

character, we are only interested in the durations of the digraphs after using a hash identifier
instead of the actual character representing that key (using numerical identifiers to refer to
keys). So a sentence typed by the user will be intercepted by our system as a list of key pairs
with their durations. This list is ordered independently from the actual stream of keys, i.e.
it can not be used to regenerate the actual content of the sentence. We used this technique
to ensure a higher acceptability of our keystrokes dynamics approach among users. Table
7.3 summarises the data we use in each of our components and their sensitivity nature.
Component Collected Data Sensitivity
MouseMouse cursor coordinates, mouse actions(click, move, scroll and drag-and-drop).
No sensitive data is collected here.Mouse data does not reveal sensitive information.
Keyboard Key down, key up events.
Collection of pressed keys can besensitive if not handled correctly.
It is important to handle the digraphs bythemselves not by their context in the typed word.
GUI
Overall keyboard statistics(typing speed, error rate, control keys usage).Overall mouse usage statistics (clicking delay,mouse action distance, mouse action speed).
App usage statistics(app usage duration, app switching).
No sensitive data is collected here.General computer usage information.
Table 7.3: Sensitivity of data collected in our components
7.1.5 Circumvention
Circumvention refers to the system resistance to impersonation/fabrication attacks, which
can be considered as one of the advantage of HCI based biometrics. This is due to the diffi-
culty of simulating a user’s behaviour continuously throughout the attacking session, which
also involves obtaining a previous knowledge about to the victim’s personal behaviour. To
justify this, let’s have a look at the traditional attacks that are usually used to get access to
people private information (such as passwords): Shoulder Surfing, Spyware, Social Engi-
neering, Guessing, Brute Force and Dictionary Attack [72]:
• Shoulder Surfing: one way to observe one’s behaviour is to simply watch them using
the computer. In contrast to passwords (“something the user knows”) which can be
119

easily compromised, all of our HCI based approaches are much more difficult to get
around by simply watching one using the computer. This is due to the temporal and
low-level nature of the patterns that form our behaviour signature, which cannot be
observed by simply monitoring someone interacting with the computer.
• Spyware: this is maybe the most challenging attack that attacker can do to fool the
system. It depends on using a software to record the victim’s typing or pointing
behaviour in order to get an idea about the user’s behaviour. Then, the attacker can
use the obtained information to simulate the user’s actions in attempt to pass the
security system. The point here is the attacker, with help of software, might be able to
simulate the exact same actions the user did previously, but it would be very difficult
to use the compromised data to generalise and generate different actions that would
both look like legitimate to the system and be useful to the attacker as well.
• Social Engineering: which refers to using social skills by the attacker to manipulate
the victim in order to get sensitive information that can be utilised later to pass the
system. Our approaches are well secured against such attacks as that even the le-
gitimate user does not know how their behaviour signature looks like, let alone to
describe that to the attacker.
• Guessing, Brute Force and Dictionary Attack: these techniques used to be utilised
to attack password-protected systems by trying to guess the password either by using
common words, dictionary based passwords or even by trying all the different combi-
nations of the possible candidates. There are just too many varieties of ways of using
the mouse or typing on the keyboard, that would make these techniques unfeasible.
7.1.6 Permanence
Permanence is concerned about the consistency of the studied characteristic over time. In
general, people’s behaviour changes over time for several reasons, this can be due to ac-
quiring new skills, changes in personal or environmental conditions or for any other factor.
A persons hands can also get sweaty or tired after using the mouse or typing for long du-
120

rations. This might results in pattern inconsistency over the course of a day. Other reasons
for pattern inconsistency might be related to the type of the keyboard/mouse being used,
the keyboard layout (i.e. dvorak or qwerty), mouse size or shape, whether the individual is
standing or sitting, the users posture etc.
Thus, techniques for automatic model update is necessary to keep the user’s profile up-
to-date and to handle such continuous changes [29]. Further more, application-specific or
task-specific profiles can be developed to handle the cases where a user might have dif-
ferent behaviour profiles based on the application or the task performed. Moreover, how
about different profiles for weekdays versus weekends? or even morning versus evening?
Studying the changes over time is actually out of the boundary of our research. It obvi-
ously requires data gathering over long periods (maybe for months) and for large number
of subjects, which should be definitely part of the future work.
7.2 Fusion and Multibiometrics
7.2.1 Overview
Fusion refers to combining multiple biometric subsystems/modalities in one identification
process that is usually referred to as a multibiometric system. Multibiometric biometric sys-
tems are usually designed to take advantage of several sources of traits in order to provide
a better recognition performance compared to a single/unimodal biometric system. This
is mainly to overcome some of the challenges that single/unimodal biometric systems face
[75]. In the following, we discuss five main challenges, we think multibiometrics systems
can help to address in the Human-Computer Interaction context:
1. Noise in the collected traits: which may happen due to changes in the environmental
settings such as using a new input device (a new mouse or keyboard), changes in
the working space or maybe due to user interruption which could result in delay or
inconsistency in their typical interaction behaviour.
121

2. Intra-Class variations: due to changes in the user’s behaviour over time such as varia-
tions in the typing speed or mouse usage patterns. These changes might be the result
of the experience and skills the user might develop over time or as a result of in-
jury, intoxication, fatigue or any other reasons that affect the user’s computer usage
behaviour.
3. Inter-Class similarities: this may particularly happen in the cases where we have a
large number of users, that could result in a collision of features of multiple different
users.
4. Low-Availability: of the traits of one of the components/modalities. For instance,
some users depend on the mouse more than the keyboard in their daily computer
usage. Others do the opposite, and as such, a single component (unimodal) identifi-
cation system might not have sufficient biometric samples of that particular charac-
teristics to produce reliable decision. On the other hand, a multibiometrics system
can utilise all the available traits from all the sources to make its decision.
5. Replay attack: where a single component/modal system is more vulnerable to trained
or recorded forgeries (recorded mouse actions or recorded keystrokes) compared to a
multibiometrics one that depends on multiple factors to identify the user.
In general, a multibiometric system consists of several biometric subsystems working
together. The actual architecture differs according to the fusion strategy utilised in the
multibiometric system. This is exactly what we are going to discuss in the next section. We
are not going to experimentally evaluate the discussed strategies as this requires having a
one comprehensive dataset gathered from the different data sources (mouse, keyboard, app)
for the same exact users, which is not available in this research. However, we are going to
discuss the advantages and disadvantages of each strategy in the context of our work before
we select what we think the most suitable one for our case and presenting our rationale
behind this.
122
7.2.2 Fusion Strategies
As mentioned earlier, combining information within multibiometric systems is referred to
as the process of information fusion. In this section, we will discuss three different fusion
strategies that can be used to combine our previously studied components (mouse, keyboard
and GUI) into one identification system. These strategies are based on the level at which
the fusion is applied. Thus, we can distinguish between: feature extraction level, matching
level or decision level fusion strategies.
7.2.2.1 Feature Extraction Level
Fusion at the feature extraction level refers to early data combination at the beginning of
the identification process. After extracting the features of each separate component, a joint
feature vector is built by combining the feature vectors of all the separate components to-
gether (e.g. by vector concatenation), which forms the input to the subsequent steps in the
identification process. Obviously in feature level fusion, the biometric subsystems are not
required to implement separate matching and classification modules (no need for separate
neural networks for each component) as Figure 7.2 illustrates. Furthermore, feature vectors
contain the richest information about the biometric traits compared to the subsequent steps
in the process. Thus, fusion at this level can make the best use of the available information.
On the other hand, there are several disadvantages for this fusion strategy. One of the
potential drawbacks is that it might result in a very high dimensional feature vector that
can lead to the curse of dimensionality problem. Another limitation is that feature sets of
different subsystems are usually not compatible as each has their own representation and
normalisation of the features. This fusion approach can be utilised only when the feature
sets are compatible [23]. In addition, concatenation of the individual feature vectors can
also lead to the individual noise from the subsystems to be added up as well in the final
vector, which reduces the overall accuracy of the identification system.
123
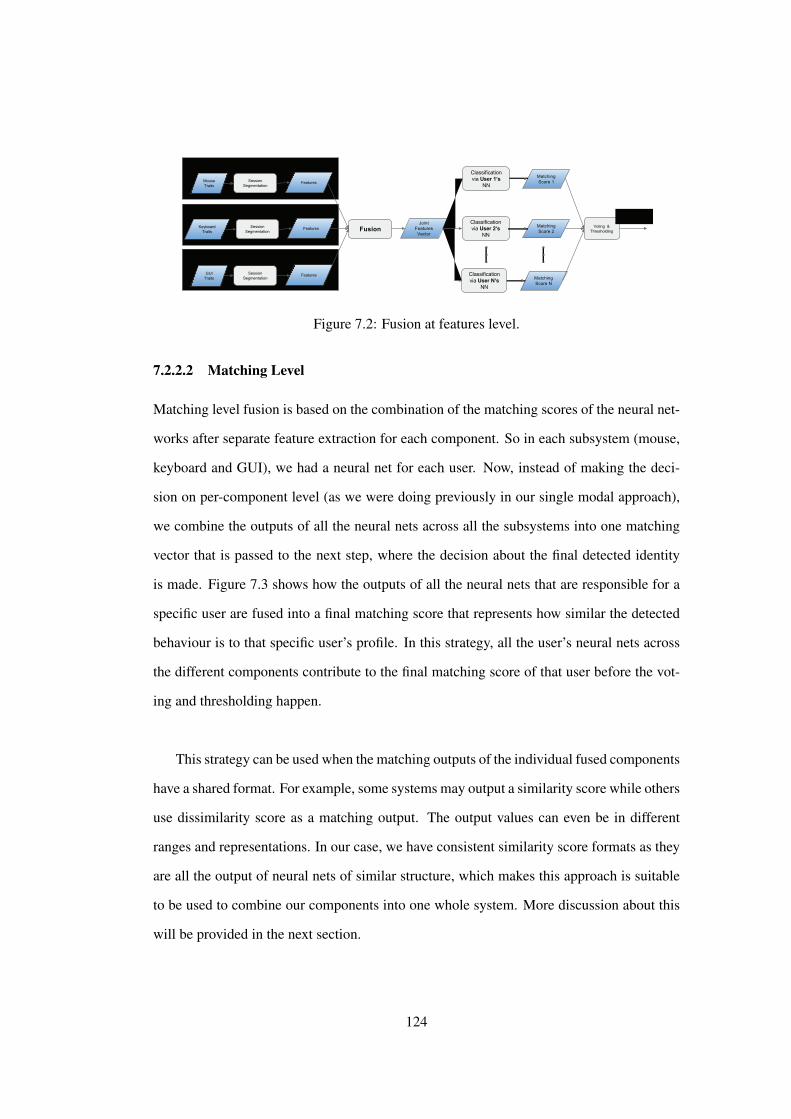
Figure 7.2: Fusion at features level.
7.2.2.2 Matching Level
Matching level fusion is based on the combination of the matching scores of the neural net-
works after separate feature extraction for each component. So in each subsystem (mouse,
keyboard and GUI), we had a neural net for each user. Now, instead of making the deci-
sion on per-component level (as we were doing previously in our single modal approach),
we combine the outputs of all the neural nets across all the subsystems into one matching
vector that is passed to the next step, where the decision about the final detected identity
is made. Figure 7.3 shows how the outputs of all the neural nets that are responsible for a
specific user are fused into a final matching score that represents how similar the detected
behaviour is to that specific user’s profile. In this strategy, all the user’s neural nets across
the different components contribute to the final matching score of that user before the vot-
ing and thresholding happen.
This strategy can be used when the matching outputs of the individual fused components
have a shared format. For example, some systems may output a similarity score while others
use dissimilarity score as a matching output. The output values can even be in different
ranges and representations. In our case, we have consistent similarity score formats as they
are all the output of neural nets of similar structure, which makes this approach is suitable
to be used to combine our components into one whole system. More discussion about this
will be provided in the next section.
124

Figure 7.3: Fusion at matching level.
7.2.2.3 Decision Level
In this fusion level, each biometric subsystem completely ends the processes of feature
extraction, behaviour comparison (matching) and classification independently. After each
subsystem produces its own local decision about the detected identity, the individual de-
cisions are combined into a final decision of the system as whole. A majority voting can
be used here, for instance, as one mechanism to produce the final decision of the system
based on the individual decisions of the modalities. Figure 7.4 illustrates the diagram of
this strategy.
The advantage of this strategy is that it allows for the use of independent unimodal bio-
metric systems off the shelf. Even if they are from different vendors and that even without
the need to look at their compatibility. However, the relative performance of individual
biometric subsystems must be taken into consideration when combined to produce the final
decision. A weighted fusion mechanism that gives different contribution weights for the
fused systems based on their accuracy is important here. This is to make sure that the most
accurate subsystem plays an important role in the final decision.
125

Figure 7.4: Fusion at decision level.
7.2.2.4 Suitable Fusion Strategy
As we see there are several advantages and disadvantages for each fusion strategy. We
suggest that the fusion at the matching level is the most suitable in our case to combine our
three studied components for the following reasons:
• The features sets of our 3 components have different representations and different
normalisation approaches (histograms for mouse dynamics, digraphs for keystrokes
dynamics and numerical values for GUI component). This makes fusion at the fea-
tures level is not suitable in our case due to this incompatibility.
• The matching level strategy does not heavily affect the current architecture of the
subsystems, allowing for a common middle layer for fusion with a small amount
of shared information. It provides an easy way to combine the subsystems into a
multimodal biometric system using a minimum amount of information about each
one.
• In the fusion at the matching level, the subsystem’s trained neural networks and eval-
uation data can all be re-used during the evaluation of the system at whole. This
avoids re-training and re-running individual evaluating algorithms and help to focus
on other aspects of the fusion.
126

• The neural network’s matching scores contain the second richest information about
the biometric traits after the features vectors. Nevertheless, it’s easier to access and
combine the matching scores at the end of the process compared to fusion at the
features vector level. Thus, fusion at the matching scores level provides a balanced
approach between the two others fusion levels.
• Compatibility of the neural networks’ output format. As we use networks with sim-
ilar structures for behaviour modelling, their outputs are compatible (same range of
values that reflect the likelihood of similarity). This makes the fusion of the matching
scores viable.
• Fusion at the matching level can allow the user’s different neural networks across
the three components to co-operate together to produce an overall matching score
for that user they are responsible for. For instance, for a specific user, the mouse
behaviour matching score can be fused with the keyboard behaviour score and the
GUI interacting score to produce a final matching score. This final score is compared
later with other users’ final matching scores. This provides an advantage over the
fusion at the decision level, where an individual decision by each component would
have been already made (regardless the other components) before getting fused with
other individual decisions of other components.
7.2.3 Overall Evaluation
Our previous discussion concludes that we believe fusion at the matching level is the most
suitable strategy in our case to combine our three targeted components. However, before
we can use the same traditional evaluation measures (FAR, FRR, EER mentioned in 3.6)
we have been using throughout our thesis, we need to go through the different score fusion
techniques that can be utilised to fuse the separate individual matching scores into a final
overall matching score. This is important as the output of each subsystem will be a vector
of matching scores (value for each user) that need to be combined with the other outputs
from the other components.
127

Table 7.4 summaries some of these different fusion techniques. Let Si be the matching
score of a particular user from the ith-component, assuming n components for generalisa-
tion purposes (n = 3 in our case). As we see in the table, the sum technique simply adds
the individual scores to compute the final matching score for each user. The minimum rule
chooses the least matching score among the different components as the final fused score.
Similarly, the maximum method selects the greatest value as the output. The mean tech-
nique calculates the average of the individual scores and returns the result as the final output.
The genuine posterior probability, P (genuine | Si), represents the probability of a subject
being genuine given a matching score for a particular component (Si). Thus, the sum of
probabilities and product of probabilities fusion methods compute the final fused scores by
respectively adding or multiplying these probabilities for all the three components.
Sum∑n
i=1 SiMinimum Score Min(S1, S2, .., Sn)
Maximum Score Max(S1, S2, .., Sn)
Mean Score Mean(S1, S2, .., Sn)
Sum of Probabilities∑n
i=1 P (genuine | Si)Product of Probabilities
∏ni=1 P (genuine | Si)
Table 7.4: Summary of fusion techniques
By using one of these techniques, the individual scores of the different components for
each user are combined into one value that represents the final matching score of that user.
After that, we can simply continue the final step of voting and thresholding as we have been
doing in our single component approach.
In conclusion, our consistent matching methodology across our studied components
(multiple neural networks) allows us to get advantage of the previously discussed benefits
of the fusion at matching level with no extra overhead. Different score fusion techniques
128

can be used for evaluation. Selecting the best score fusion technique is dependent on the
application and needs further future investigation, which requires having datasets for the
exact same users across the three components (which are unavailable in our case now).
In this chapter, we have compared and discussed the biometric properties of our studied
HCI components to provide an overall view of the HCI based biometrics. In addition,
we presented and discussed the different fusion strategy that can be used to combine our
separate components into a multibiometric system. Thus far, in the last four chapters, our
modelling approaches have been studied regardless of the privacy concerns. However, in
order to allow the deployment of identification systems in real life scenario, several privacy
and operational aspects need to be considered. These aspect are presented and discussed in
the next chapter.
129

Chapter 8
Application Considerations
In this chapter, we shed some lights on ethical issues and privacy concerns we think they
should be considered when dealing with biometric systems. In addition, we discuss several
aspects we think they are necessary for reliable deployment of biometric technology in real
life scenario including operational and technical challenges.
8.1 Ethical and Privacy Issues
8.1.1 Examples
Similar to all personal systems, HCI-based biometrics must give serious attention to several
privacy and ethical concerns that would raise as a result of deploying such technologies.
As personal traits and information are captured during the process of building user profiles,
such system should be well secured against third parties that might be interested in getting
access to such personal data, who could unethically take advantage of them by applying
unfair or unethical discrimination against individuals. Following are examples of personal
information can be inferred from such traits:
• Input Devices Interaction: mouse, keystrokes and haptic dynamics are mainly estab-
lished on motor control skills of individuals. Thus, they may reveal motor control
problems, typing inefficiency or even medical conditions that could unethically tag
an individual as inefficient employee.
130

• Programming Style: programmers might face discrimination or disadvantages due to
their different programming styles if an employer decided to analyse source codes
for the purpose of targeting less-skilled programmers.
• Email Behaviour: companies might be interested to know if employees send per-
sonal emails during working hours or even using employee’s sending/replying rate to
measure their productivity and acting accordingly.
• Gaming Strategy: obtaining information about the player’s strategy can be used by
the opponent to plan an opposite strategy that would put the player in a disadvantaged
position and might cost them to lose the game and what comes with that in term of
financial and emotional loses.
• GUI/CLI Interaction: analysing an employee’s interaction with the graphical or com-
mand line interfaces of the computer can be used to assess their computer skills and
expertise including their knowledge about the different options of the commands they
use. This might affect their chances to keep their jobs or get promotions.
• Network Traffic: analysing the network packets and their contents can reveal a lot
of information about the user’s online activities including the different contents they
engage with. The used protocols and ports can also be utilised to detect the usage of
specific software/app by the user during office time.
• Social Media Interaction: analysing the user’s behaviour (likes, follow, posts, friends,
etc.) exhibited on social media networks can reveal important information about
the social relationships between individuals, which could cause embarrassment to
people who do not want to such relations to be discovered such as the case of adult
entertainment, a love affair or a business relationship.
• Emotion, Stress and Health: webcam images, screenshots, voice records, typing
rhythms, search queries and other personal traits can contain personal information
that reflect emotion, stress or even health issues of individuals which should not be
accessed by third parties with the intention to use against individuals.
131
All the above are examples of what kind of personal information can be inferred or
revealed by capturing and profiling the traits users generate while simply using a computer.
This also helps to understand the different serious privacy concerns people usually raise
about biometric and profiling systems, which we are going to present in the next section.
8.1.2 Privacy Concerns
In summary, privacy concerns related to biometric deployment can be categorised into seven
categories [97], that we are going to list next. In our research, to address these concerns, we
followed a privacy-by-design approach [35], where the system is designed to take privacy
into account throughout the whole process. We will discuss our own privacy considerations
in the context of the following general concerns related to the use of biometrics:
1. Building a complete profile of individual: any personal information system that es-
tablishes an individual profile consists of a unique identifier (biometric) along with
other personal information will raise several privacy concerns. The linkage between
the personal information and that unique identifier is the main issue here. The prob-
lem is with the potential to build a complete profile of the individual by connect-
ing different personal information from multiple sources using that unique identifier.
Such database can be hacked or accessed unlawfully by an administrator.
In our work, we addressed this by avoiding to collect any unnecessary information
and by designing features that do not rely on sensitive personal information such as
name, age, gender or interest. For instance, we do not collect windows’ titles, screen-
shots or clipboard information during our experiments although it can be collected
through LoggerMan. So we do not actually have other personal information about
the user to link his/her usage identifier with that information.
2. Unconsented personal information access: the concern here is the potential that a
third-party can access biometric data without the individual permission, which can be
seen as a violation to users rights to control their personal information. Individuals
should be able to have the option to provide their biometric or not and to be able to
132

choose and specify the recipients.
To address this, our data collection process is only carried after getting an explicit
consent from the user. LoggerMan also utilises an additional protection layer offered
by the Mac OSX, that helps to protect the data typed in password fields from being
preserved. This also requires the user to explicitly agree to allow the application to
run on their computer by accepting a security alert message as an extra informed
consent. In addition to the consent required when installing the software, the user has
a total control over the data as they are stored locally on the user’s machine. During
data collection, all the users have been asked to check their collected data and remove
any sensitive personal information they do not want to be there.
3. Unintended or unauthorised usage of personal information: this concern is about
the extended usage of biometric data for applications other than the one individuals
accepted to participate in. This can be in form of a government or an organisation
that tracks people based on their identifiers beyond the initial claimed purpose. Such
as using biometric data captured for passports to limit access for some other services
that has nothing to do with passports.
In our case, all our collected data is low-level (mouse coordinates, keystrokes, app
identifier) and used for identification purposes only. All data is only used for the
purpose of the experiments described in this thesis. We are continuously adding new
enhanced privacy features to our LoggerMan, such as a list of words/apps to exclude
from logging, automatic face blurring from screenshots/videos and smart contextual
filtering.
4. Biometrics are over kill for some applications: this refers to people’s concerns about
the use of biometrics in situations that do not justify the collection of such personal
information. This is because people still think that biometrics and similar technolo-
gies are designed only for high security military access, risky (criminals) or even VIP
individuals (a president). For instance, people do not expect to be asked to provide
their fingerprints so their age can be verified when they buy some alcoholic drinks.
133

This is why our models is designed with user acceptability in mind, where only low-
level un-intrusive data is considered for modelling.
5. Use of biometrics for surveillance and profiling: the use of biometric technologies,
whether it’s physiological or behavioural, for surveillance raises understandable pri-
vacy concerns. The lack of individuals control over their recorded personal data and
the ability to leverage that to track people and/or to perform real-time profiling are
the main issues here.
This is why LoggerMan is designed to be modular so the user can turn on/off the
recording of specific modules if needed. This helps the user to be in control of what
and when to allow the data to be collected. In addition, as data is stored locally on
the user machine and only collected later for analysis that also helps to address the
concern of real-time monitoring or surveillance.
6. Biometrics cannot be easily changed if they become compromised: the strong con-
nection between individuals and their biometrics make these identifiers perfect for
identity establishment. However, that also means it would be difficult for individu-
als to change their biometrics if they becomes compromised and even to establish a
proof of misuse. Thus, the idea of captured biometric templates could be stolen or
compromised is a valid concern. That is why, modern biometric systems try to make
sure that the data is coming from a live sample not from a static or recorded one.
To further protect our subjects, features and processed data is only generated during
evaluation and never actually stored on hard drives. Where as, raw data is stored on
encrypted hard disk with no names or identifiable information that can point to the
actual data owner.
7. Opposite to anonymity: most people think that the individual has the authority over
the collection and distribution of their biometric data. That does not correlate well
with the wide spread of biometric usage nowadays, which can put an individual in a
uncomfortable situation when he/she is asked unexpectedly to provide their biometric
or when he/she arrives to an area where biometric surveillance is in operation. That
134

could affect the sense of freedom and the choice to stay anonymous for some people.
LoggerMan informs the user about the status of the logging process by using a special
icon for that. And as described earlier, the user always has the option to pause the
logging application in any moment he/she might not be comfortable to capture.
In top of the efforts that have to be done by individual app developers to address peo-
ple’s concerns about the possible abuse of biometrics data and what could be derived from
capturing and retaining such personal information, efforts from different parties are needed:
• Legalisation and enforcements by governments such as the EU Data Protection Di-
rective which limits and places additional restrictions on the collection of special
types of sensitive information including data related to political opinions, religious
beliefs, ethnic origin and/or sexual orientations [16].
• Industry self-regulation assurance: where an association of biometric vendors and
laboratories, for example, decides to comply with a list of ethical rules and guidelines
in their system design and operation. This can also include a set of security standards
and policies that have to be implemented in their products.
• Autonomous regulatory bodies: who can apply independent enforcement and audits
to ensure fair usage and protection of biometric data and to protect the public interest
and rights. Such as a central biometric council.
8.2 Real World Deployment Considerations
There are several challenges to be considered when we need to deploy a biometric system
in a real life scenario. We are going to discuss and address these challenges through the
following complementary requirements that should be met and be in place to ensure smooth
and reliable operation of the system:
135

8.2.1 Security
Several security requirements should be designed to ensure the trustworthiness of a biomet-
ric system, and to address some of the privacy concerns most people have about biometric
systems, especially the concerns related to unethical access to their data by third parties and
attackers:
• Spoof Prevention: the system should be resistant and able to detect fake biometric
samples like wearing a face mask to pass a face recognition system, using a gummy
fake finger to fool a fingerprint sensor or even using a robot hand to simulate mouse
movements in order to confuse a mouse dynamics authentication system.
• Tamper Resistance: which means protecting the system from types of attacks that try
to gain access to the internal operation of the system to change its output to be in the
attacker’s favor or to take advantage of any inside information that could be used to
fool the system.
• Device/Component Substitution Resistance: the requirement here is the ability of the
system as a whole to detect any alteration or substitution of system’s components.
This is to ensure the system integrity and to prevent types of attacks that seek to
replace system’s components to fool the system or, which is more common, to get
copies of the biometric data from the acquisition unit directly by replacing it with the
attacker’s own acquisition unit.
• Secure Communications: the system needs to be resistant to communication attacks
(such as man-in-the-middle) and be able to deliver information from one component
to the next securely, by either using cryptography or by relying on physically inac-
cessible channels.
8.2.2 Compression
Storing raw personal traits or even the final profiles both require enough amount of storage
to be available to the system. In addition, transmitting this data for server-based processing
136

maybe also required according to the application’s requirements. Table 8.1 shows the aver-
age amount of storage required to store the different types of data that can be captured by
LoggerMan in a single weekday by one of our subjects (we use only mouse, keystrokes and
app events in our modelling). Thus, it is usually necessary to consider the right compression
algorithm to be provided as part of the system package.
Module Number of Events Storage SizeScreenshots 413 197 MB
Mouse 11358 6.7 MBKeystrokes 3987 310 KB
App 71 18KBClipboard 31 6.7 KB
Table 8.1: Average number of events generated by one of our subjects in one weekday andthe corresponding space required for storage using LoggerMan
Compression algorithms can be either lossy or lossless. While the lossless compression
can preserve the original data as it is after decompression, lossy compression, on the other
hand, change the original behavioural signal by removing unnecessary data in exchange
for higher compression rates. This alteration caused by lossy compression can affect the
output quality of the feature extraction process and as a result decreases the overall identi-
fication accuracy. Nevertheless, biometric frameworks still usually use lossy compression
algorithms that are designed/selected in a way that reduces the amount of critical infor-
mation lost according to the type of biometric data. That would help to balance between
data quality and storage size. There are currently some compression standards for the most
common used biometrics such as WSQ for 500PPI fingerprints, CELP for voice records
and JPEG-2000 for face images [96].
Considering the dynamic nature of HCI-based biometrics, where the digital traits are
captured continuously resulting in a huge amount of data (e.g., millisecond-rate mouse
coordinates), compression algorithms can play an important role here to ensure the deploy-
137

ment and operation of such system smooth and reliable. Especially in the case, where the
captured raw traits are stored by the system for future improvements, re-training or model
adaption to new behavioural patterns.
8.2.3 Quality Assessment
Performance of biometric systems can be significantly affected by the quality of the cap-
tured biometric samples. In general, a better performance can be achieved if the samples
quality is improved by any means such as:
• Better Accusation Policy: such as ignoring the first few mouse curves at the start of
a session as the user might still has not reached his/her normal interaction position.
• Advanced Sensor Technology: such as using standard keyboards or high sensitivity
mouse devices.
Automatic quality analysis of a live sample is needed, not only for asking for a reacqui-
sition of the sample from the user if needed, but it can also help the system to select the best
sample in real-time manner and to do further selective signal enhancement. In addition,
sample quality can support feature extraction process by assigning confidence to features.
Biometric sample quality refers to how useful it is for identity recognition according to
the discriminatory information it carries. In quality assessment process, an algorithm com-
putes and assigns a score to a biometric sample according to its: character (discriminating
capability), fidelity (noise ratio) and utility (impact of the sample on the overall accuracy)
according to ISO/IEC 29794-1 standard [2].
Having a quality assessment process as part of HCI-based biometric can improve the
overall stability of the system. For example, in a mouse dynamics system, quality measure-
ments based on the length of mouse curves (too long or too short mouse curves can be seen
as noise) can be proposed. Similarly, too long durations of 2-graph or 3-graph can be con-
sidered signals of low quality samples. In our keystrokes dynamics work we have ignored
any digraph that has a duration bigger than 0.5 seconds following what Gunetti has done
138

in his work [33]. Similarly, we have ignored too short mouse curves (less than 5 points in
length) in our mouse dynamics work, which can be seen as noise.
8.2.4 Interoperability and Scalability
In some cases, especially when multiple systems need to work together, some parts of the
biometric system have to be interoperable. Which means the extracted features/signature
must be encoded in a standard way that can be understood by other matching systems the
follow the same standard. This can be seen in large scale scenario such as in a countrywide
biometric identity system. In addition, and when dealing with such large scale biometric
use cases, where identification needs to be done online in real time (e.g., in an airport),
the design of the matching/comparison algorithm has to be very efficient. To achieve that
a parallel architecture can be used to distribute the matching processing load over many
processing units. Filtering techniques can also be used to enhance the matching algorithm
performance by reducing the number of potential candidates with whom the one-to-one
comparison is performed. A multi-level classification process can be done to partition the
database into discrete set of classes which in turn can be further divided into sub-classes if
necessary. Different classification algorithms can be employed for each level such as rule-
based, statistical-based or neural net-based approaches. This can help to reduce the final
number of comparisons significantly.
139

Chapter 9
Conclusion and Future Work
9.1 Summary and Contribution
Behavioural biometrics is the field interested in the analysis of identifying and measurable
patterns as means of identification. HCI-based biometrics are sub category of behavioural
biometrics that are focusing on studying the computer usage patterns revealed during nor-
mal user interaction with the computer. This is based on the idea that people exhibit differ-
ent skills, styles, expertise, knowledge or/and preferences while doing their everyday tasks
on computers. In our research, we explored user identification based on the patterns ob-
served during normal Human-Computer Interaction by continuously logging and tracking
the corresponding computer events. Specifically, we focused on three components: mouse
dynamics, keystrokes dynamics and GUI based user behaviour. In particular, the dynamic
mode of identification (continuously throughout the session) was our main target that is to
consider real life working environment and to make sure that the model will work passively
throughout the session during normal workday activities with no enforced tasks or limita-
tions.
To do our experiments and due to the lack of comprehensive logging tool for human-
computer interaction experiments, we have developed LoggerMan, an application that works
passively in the background and intercepts computer usage events and store them for later
140

analysis. A wide range of keybaord, mouse and UI actions can be gathered by LoggerMan.
It comes with a local reporting module that provides insight, statistics and visualisations
to the data owner about their computer usage. It is released online for other interested re-
searchers/lifeloggers as a contribution.1.
In the mouse dynamics domain, we have introduced a new approach to model users’
mouse usage characteristics for identification purposes. Unlike other approaches in liter-
ature, our model is built on the features and properties of the mouse curves generated by
users while working normally on their machines. We proposed mathematical conditions
that the extracted features must satisfy to achieve both a task and environment independent
identification system. This was the main drawback of the state-of-the-art approach as it
was not clear whether the system detects the differences in mouse behaviour or differences
among the working environment including the performed task according to an independent
study [46]. In our work, nine different features were used to describe and capture the curves
properties. To the best of our knowledge, we are the first who proposed these features in
this domain. A dataset of ten users has been gathered for evaluation. The collected data is
only mouse coordinates with an indicator of the current performed action (point-and-click,
move, drag-drop). On average, 16,500 mouse actions has been gathered for each user. Ex-
perimental results show that mouse curves have enough discrimination power to identify
users. Our model achieved error rates that were lower than similar works in literature with
even shorter sessions length.
Keystroke dynamics were the second component in our research on HCI-based be-
havioural biometrics. Specifically, we targeted the free-text mode, where the user is free
to type and use the keyboard regularly with no enforced tasks to do or imposed texts to
type. To overcome the performance and scalability limitations of the state-of-the-art, we
proposed a model that uses machine learning techniques to shift the computational power
needed for identification from the operation time (where the bottle neck was in the state-of-1LoggerMan.org
141

the-art model) to the enrolment time when time in not that critical. That allows the model
to work in real-time. Experimental results showed that our model is both effective and effi-
cient. Effectiveness is illustrated in our error rates that are comparable to the state-of-the-art
approach while model’s efficiency is presented in term of quick identification response with
limited computational cost during operation time.
In the third component of our research, we explored identifying the user based on
his/her way, skill or style of interaction with a graphical user interface environment. In-
stead of analysing the temporal and local features of mouse and keyboard usage separately,
we utilise here several modalities together to identify the user. All the used features in our
previous work on mouse and keyboard were local, low-level and designed to capture the
temporal features of the user’s patterns (such as curvature properties of the mouse curves
and the digraph durations of keystrokes sequences). Such local features were sufficient to
capture the user behaviour’s patterns but they were too low level to have direct interpretable
descriptions that can give us meaningful insights about that individual usage profile. The
use of global features to model the user’s behaviour in a GUI based system were explored.
Features were selected to be as human-readable as possible in order to be used in future as
part of user’s profile visualisations that could give direct insight and information about the
user such as their own skills, preferences or styles of computer interaction. Two datasets
have been gathered from seven users using their computers normally over 3 weeks. To the
best of our knowledge, these are the first datasets that provide mouse, keyboard and app
events together for analysis. Two experiments have been conducted. Results show that the
manner the user interacts with the GUI of the system can be used to identify him/her, even
if the training and testing data were collected from totally different devices of the user (en-
vironment independent).
In chapter 7, we started with comparing the different biometric properties of our studied
components by discussing their advantages and disadvantages. Then, we moved to explore
the different fusion strategy that can be used to combine the three components into a multi-
142

biometric identification system including some score fusion techniques to produce the final
score. This goal of this chapter was to bring the three components together for richer com-
parison and summarisation.
Finally, we finished with discussions about the challenges and considerations that have
to be taken into account for smooth and reliable deployment of biometric systems including
privacy concerns, operational and technical challenges.
To link back to our initial general hypothesis, we believe that our experiments show
that our normal human computer interaction does really reveal enough information that can
be exploited for identification purposes. The reliability and practicality requirements have
been illustrated in this thesis through several aspects; datasets gathered in actual real-life
scenarios, models evaluated by several repetitions and attacked by outsiders, state-of-the-
art error rates (reaching less than 1% of EER in keystroke dynamics) and by studying and
considering the operation time of the identification system. In conclusion, we summarise
our main contributions in this work as the following:
• Mouse dynamics model based on mouse curves.
• Free-text keystroke dynamics model.
• GUI based behaviour model using global features only.
• LoggerMan, logging and visualisation tool for HCI experiments.
• Mouse dynamics dataset based on raw mouse coordinates.
• Two GUI usage datasets (mouse, keyboard and app data together).
9.2 Limitations and Future Work
As discussed earlier in section 7.1.2, our experiments show that the local temporal features
used in the first mouse and keystrokes components perform better in term of accuracy com-
143
pared to the global features used in the GUI work. However, as we can see these local fea-
tures (curves properties, digraph duration) are too low level to have meaningful descriptions
to be used as part of insightful or informative user profiles that form the future direction of
our research. For instance, in our future work, we are planning to use such global features
with decision tree classifiers or association rules mining techniques that give a higher level
of human-readable models instead of the current black-box-like modelling techniques we
have currently used (neural networks). This can help to visualise users behaviour profiles
by using terminology that are easier to interpret by human (such as: fast typer, left-handed
user, multi-tasking user, etc.).
In addition to our previously mentioned future plan of automatic insightful profile build-
ing, several other points can be explored and enhanced. First of all, larger datasets need to
be gathered with larger number of participants over longer periods to study models stability,
accuracy and consistency over time. This is one of the challenging limitations of most HCI
experiments, where it requires accessibility to a large number of people who are willing
to voluntarily provide data collected from their computers and for a long period of time,
which might not even allowed in their work policy. The fact that our logging tool works
only on Mac devices also limits the number of potential subjects that can participate in our
experiments. That is why, we have developed recently a windows version of LoggerMan to
target a wider audience in any future data collection task.
Utilising online machine learning techniques in this domain is also one of the important
future directions one can take. This helps in building models that dynamically adapt to
new patterns appear in the user’s behaviour over time as users’ experience, skills or prefer-
ences could change from time to time. Such adaptions in the user’s model should be done
efficiently using dynamic algorithms that do not re-train the model from scratch, which re-
quires further resources and investigations. To achieve that we also need data collected over
long period of time to properly detect any behaviour changes before adjusting the models
accordingly. Studying these changes is challenging as that involves the ability to distinguish
144

between the actual change of user behaviour and any other noise that simply can appear due
to different environmental settings over the long period of the experiment.
Exploring different types of features for each model should also be considered or even
using feature learning techniques to automatically transform the raw data into efficient rep-
resentations that can be better exploited by classifiers. Specifically, exploring deep networks
architectures to learn new features and compare that with our handcrafted features. There is
a fair potential that such deep networks might find a latent or hidden features that can result
in a better accuracy. However, this comes with a huge cost in term of computational power
required for deep models that might affect the ability of the system to work in real-time
manner, which is a critical requirement for identification systems. That is why, we tried to
stick with models that can be brought to the market with no special hardware requirements.
Still, the current advances reported in different domains related to the successful use of deep
nets, makes this direction worth investigation.
Finally, as discussed in chapter 7 and after separately studying the three different com-
ponents of HCI based biometrics (mouse, keyboard and GUI) including the use of both
local and global features, we think the optimal identification system should be based on
analysing all the behavioural traits that can be observed from all the available sources to-
gether and by utilising both local and global features (multibiometric identification system).
This would allow the system to take advantage of whatever information available about the
user regardless if the user is using only single input device, using one input device more in-
tensively than the other or utilising both mouse and keyboard together. While several fusion
strategy have been discussed previously in chapter 7 with the advantage and disadvantage
of each one, the actual implementation of such comprehensive mutlibiometric identification
system is still challenging and it is worth exploring in future. However, that requires having
datasets of mouse, keyboard and other sources together for the exact same users gathered
simultaneously for comparison and evaluation.
145
Bibliography
[1] Ahmed Awad E. Ahmed and Issa Traore. A new biometric technology based
on mouse dynamics. Dependable and Secure Computing, IEEE Transactions on,
4(3):165–179, 2007.
[2] F. Alonso-Fernandez, J. Fierrez, and J. Ortega-Garcia. Quality measures in biometric
systems. IEEE Security Privacy, 10(6):52–62, Nov 2012.
[3] James P. Anderson. Computer Security Threat Monitoring and Surveillance. James
P. Anderson Co., 2002.
[4] S Anila and N Devarajan. Global and local classifiers for face recognition. European
Journal of Scientific Research, 57(4):556–566, 2011.
[5] Vidarshana W. Bandara and Anura P. Jayasumana. Extracting baseline patterns in
internet traffic using robust principal components. In Proceedings of the 2011 IEEE
36th Conference on Local Computer Networks, LCN ’11, pages 407–415, Washing-
ton, DC, USA, 2011. IEEE Computer Society.
[6] Francesco Bergadano, Daniele Gunetti, and Claudia Picardi. User authentication
through keystroke dynamics. ACM Transactions on Information and System Security,
5(4):367–397, November 2002.
[7] Christopher M Bishop. Pattern recognition. Machine Learning, 128:1–58, 2006.
[8] Christopher M Bishop. Pattern recognition and machine learning. springer, 2006.
146

[9] S. Bleha, Charles Slivinsky, and B. Hussien. Computer-access security systems using
keystroke dynamics. Pattern Analysis and Machine Intelligence, IEEE Transactions
on, 12(12):1217–1222, 1990.
[10] S. J. Boies. User behaviour on an interactive computer system. IBM Systems Journal,
13:2–18, 1974.
[11] Leon Bottou. Online algorithms and stochastic approximations. In David Saad, edi-
tor, Online Learning and Neural Networks. Cambridge University Press, Cambridge,
UK, 1998. revised, oct 2012.
[12] Arslan Bromme and Stephan Al-Zubi. Multifactor biometric sketch authentication.
In Proceedings of the 1st Conference on Biometrics and Electronic Signatures of the
GI Working Group BIOSIG, 2003.
[13] James Casey. Exploring curvature. Springer Science & Business Media, 2012.
[14] Sungzoon Cho, Chigeun Han, Dae Hee Han, and Hyung il Kim. Web based keystroke
dynamics identity verification using neural network. Journal of Organizational Com-
puting and Electronic Commerce, 10:295–307, 2000.
[15] Nathan L Clarke, SM Furnell, Benn M. Lines, and Paul L Reynolds. Using keystroke
analysis as a mechanism for subscriber authentication on mobile handsets. In Secu-
rity and Privacy in the Age of Uncertainty, pages 97–108. Springer, 2003.
[16] European Commission. Protection of personal data. http://ec.europa.eu/
justice/data-protection/. Accessed: 2017-02-20.
[17] Malcolm W. Corney, Alison M. Anderson, George M. Mohay, and Olivier de Vel.
Identifying the authors of suspect email. 2001.
[18] The MITRE corporation. Widget observation simulation inspection tool. http://
www.openchannelfoundation.org/projects/WOSIT. Accessed: 2015-
08-07.
147

[19] M. Curtin, M. Villani, G. Ngo, J. Simone, H. St. Fort, and S. h. Cha. Keystroke bio-
metric recognition on long-text input: A feasibility study. In International Workshop
on Scientific Computing and Computational Statistics, 2006.
[20] Aaron Davidson, Darse Billings, Jonathan Schaeffer, and Duane Szafron. Improved
opponent modeling in poker. pages 493–499. AAAI Press, 2000.
[21] Olivier de Vel, Alison Anderson, Malcolm Corney, and George Mohay. Mining
e-mail content for author identification forensics. SIGMOD RECORD, 30:55–64,
2001.
[22] Dorothy E. Denning. An intrusion-detection model. Software Engineering, IEEE
Transactions on, 13(2):222–232, February 1987.
[23] S. Dey and D. Samanta. Unimodal and Multimodal Biometric Data Indexing. De
Gruyter, 2014.
[24] PS Dowland, SM Furnell, and Maria Papadaki. Keystroke analysis as a method of
advanced user authentication and response. In Security in the Information Society,
pages 215–226. Springer, 2002.
[25] PS Dowland, H SINGH, and SM Furnell. A preliminary investigation of user au-
thentication using continuous keystroke analysis. In Proceedings of the 8th IFIP
Annual Working Conference on Information Security Management and Small System
Security, Las Vegas, Nevada, 2001.
[26] Brian Eoff and Tracy Hammond. User identification by means of sketched stroke
features. In AAAI, volume 8, pages 1794–1795, 2008.
[27] Eric Flior and Kazimierz Kowalski. Continuous biometric user authentication in
online examinations. In Information Technology: New Generations (ITNG), 2010
Seventh International Conference on, pages 488–492. IEEE, 2010.
148

[28] Steven M Furnell, Joseph P Morrissey, Peter W Sanders, and Colin T Stockel. Ap-
plications of keystroke analysis for improved login security and continuous user au-
thentication. In Information systems security, pages 283–294. Springer, 1996.
[29] Joao Gama, Indre Zliobaite, Albert Bifet, Mykola Pechenizkiy, and Abdelhamid
Bouchachia. A survey on concept drift adaptation. ACM Comput. Surv., 46(4):44:1–
44:37, March 2014.
[30] A. Garg, R. Rahalkar, S. Upadhyaya, and K. Kwiaty. Profiling users in gui based
systems for masquerade detection. In Information Assurance Workshop, 2006 IEEE,
pages 48–54, 2006.
[31] T. Goldring. User profiling for intrusion detection in windows nt. Computing Science
and Statistics, 35, 2003.
[32] Andrew Gray, Philip Sallis, and Stephen Macdonell. Software forensics: Extending
authorship analysis techniques to computer programs. In in Proc. 3rd Biannual Conf.
Int. Assoc. of Forensic Linguists (IAFL’97, pages 1–8, 1997.
[33] Daniele Gunetti and Claudia Picardi. Keystroke analysis of free text. ACM Transac-
tions on Information and System Security (TISSEC), 8(3):312–347, 2005.
[34] Cathal Gurrin, Rami Albatal, Hideo Joho, and Kaori Ishii. A privacy by design
approach to lifelogging. In O Hara, K. and Nguyen, C. and Haynes, P., (eds.) Digital
Enlightenment Yearbook 2014, pages 49–73. IOS Press, The Netherlands, 2014.
[35] Cathal Gurrin, Rami Albatal, Hideo Joho, and Kaori Ishii. A privacy by design
approach to lifelogging. 2014.
[36] Kenichi Hayashi, Eiji Okamoto, and Masahiro Mambo. Proposal of user identifica-
tion scheme using mouse. In Proceedings of the First International Conference on
Information and Communication Security, ICICS ’97, pages 144–148, London, UK,
UK, 1997. Springer-Verlag.
149

[37] Zaher Hinbarji, Rami Albatal, and Cathal Gurrin. Dynamic user authentication based
on mouse movements curves. In 21st International Conference on MultiMedia Mod-
elling (MMM 2015), Sydney, Australia, 2015. Springer.
[38] Zaher Hinbarji, Rami Albatal, Noel E. O’Connor, and Cathal Gurrin. Loggerman,
a comprehensive logging and visualisation tool to capture computer usage. In 22st
International Conference on MultiMedia Modelling (MMM 2016), pages 342–347,
2016.
[39] Zaher Hinbarji, Moohamad Hinbarji, Rami Albatal, and Cathal Gurrin. Personal
information manager to capture and re-access what we see on computers. In Pro-
ceedings of the first Workshop on Lifelogging Tools and Applications, pages 13–17.
ACM, 2016.
[40] Steven A. Hofmeyr, Stephanie Forrest, and Anil Somayaji. Intrusion detection using
sequences of system calls. J. Comput. Secur., 6(3):151–180, August 1998.
[41] Steven A. Hofmeyr, Stephanie Forrest, and Anil Somayaji. Intrusion detection using
sequences of system calls. J. Comput. Secur., 6(3):151–180, 1998.
[42] Harold Hotelling. Analysis of a complex of statistical variables into principal com-
ponents. Journal of educational psychology, 24(6):417, 1933.
[43] MA Ismail and Samia Gad. Off-line arabic signature recognition and verification.
Pattern Recognition, 33(10):1727–1740, 2000.
[44] Anil K. Jain, Ruud Bolle, and Sharath Pankanti. Biometrics, Personal Identifica-
tion in Networked Society: Personal Identification in Networked Society. Kluwer
Academic Publishers, Norwell, MA, USA, 1998.
[45] L. O. Jimenez and D. A. Landgrebe. Supervised classification in high-dimensional
space: geometrical, statistical, and asymptotical properties of multivariate data. IEEE
Transactions on Systems, Man, and Cybernetics, Part C (Applications and Reviews),
28(1):39–54, Feb 1998.
150

[46] Zach Jorgensen and Ting Yu. On mouse dynamics as a behavioral biometric for
authentication. In Proceedings of the 6th ACM Symposium on Information, Computer
and Communications Security, ASIACCS ’11, pages 476–482, New York, NY, USA,
2011. ACM.
[47] G. Cervone K. Kaufman and R. S. Michalski. An application of symbolic learning
to intrusion detection: Preliminary results from the lus methodology. Reports of the
Machine Learning and Inference Laboratory, MLI 03-2, George Mason University,
Fairfax, VA, 2003.
[48] Froduald Kabanza, Philipe Bellefeuille, Francis Bisson, Abder Rezak Benaskeur,
and Hengameh Irandoust. Opponent behaviour recognition for real-time strategy
games. In Proceedings of the 5th AAAI Conference on Plan, Activity, and Intent
Recognition, AAAIWS’10-05, pages 29–36. AAAI Press, 2010.
[49] Ram P Kanwal. Generalized functions: Theory and technique. APPLICATIONS OF
MATHEMATICS-PRAHA-, 45(4):320–320, 2000.
[50] Yoohwan Kim, Ju-Yeon Jo, and Kyunghee Kim Suh. Baseline profile stability for
network anomaly detection. In Third International Conference on Information Tech-
nology: New Generations (ITNG’06), pages 720–725, April 2006.
[51] A. Kolakowska. A review of emotion recognition methods based on keystroke dy-
namics and mouse movements. In Human System Interaction (HSI), 2013 The 6th
International Conference on, pages 548–555, 2013.
[52] Sotiris Kotsiantis and Dimitris Kanellopoulos. Discretization techniques: A recent
survey, 2006.
[53] T. Lane and C.E. Brodley. An application of machine learning to anomaly detection.
In Proceedings of the 20th National Information Systems Security Conference, pages
366–377, 1997.
151

[54] Robert Charles Lange and Spiros Mancoridis. Using code metric histograms and
genetic algorithms to perform author identification for software forensics. In Pro-
ceedings of the 9th Annual Conference on Genetic and Evolutionary Computation,
GECCO ’07, pages 2082–2089, New York, NY, USA, 2007. ACM.
[55] Wenke Lee, S.J. Stolfo, and K.W. Mok. A data mining framework for building
intrusion detection models. In Security and Privacy, 1999. Proceedings of the 1999
IEEE Symposium on, pages 120–132, 1999.
[56] John Leggett and Glen Williams. Verifying identity via keystroke characterstics.
International Journal of Man-Machine Studies, 28(1):67–76, 1988.
[57] Marille LEIJTEN and Luuk VAN WAES. Inputlog: A logging tool for the research
of writing processes. Working Papers 2005011, University of Antwerp, Faculty of
Applied Economics, 2005.
[58] Marille Leijten and Luuk Van Waes. Keystroke logging in writing research: Us-
ing inputlog to analyze and visualize writing processes. Written Communication,
30(3):358–392, 2013.
[59] Blaise W. Liffick and Laura K. Yohe. Using surveillance software as an hci tool. In
Information Systems Education Conference, 2001.
[60] Daw-Tung Lin. Computer-access authentication with neural network based
keystroke identity verification. In Neural Networks,1997., International Conference
on, volume 1, pages 174–178 vol.1, 1997.
[61] Frank Linton. Owl: A recommender system for it skills.
[62] R.A. Maxion and T.N. Townsend. Masquerade detection using truncated command
lines. In Dependable Systems and Networks, 2002. DSN 2002. Proceedings. Inter-
national Conference on, pages 219–228, 2002.
[63] M. McConnell. Information assurance in the twenty-first century. Computer,
35(4):16–19, Apr 2002.
152
[64] Christoph C. Michael and Anup K. Ghosh. Using finite automata to mine execution
data for intrusion detection: A preliminary report. In Recent Advances in Intrusion
Detection, Third International Workshop, pages 66–79, 2000.
[65] Fabian Monrose and Aviel Rubin. Authentication via keystroke dynamics. In Pro-
ceedings of the 4th ACM conference on Computer and communications security,
pages 48–56. ACM, 1997.
[66] Darren Mutz, Fredrik Valeur, Giovanni Vigna, and Christopher Kruegel. Anoma-
lous system call detection. ACM Transactions on Information and System Security
(TISSEC), 9(1):61–93, 2006.
[67] Y. Nakkabi, I. Traore, and A.A.E. Ahmed. Improving mouse dynamics biometric
performance using variance reduction via extractors with separate features. Sys-
tems, Man and Cybernetics, Part A: Systems and Humans, IEEE Transactions on,
40(6):1345–1353, 11 2010.
[68] Kristin Adair Nixon, Valerio Aimale, and Robert K. Rowe. Spoof Detection Schemes,
pages 403–423. Springer US, Boston, MA, 2008.
[69] M. Orozco, Y. Asfaw, A. Adler, S. Shirmohammadi, and A. E. Saddik. Automatic
identification of participants in haptic systems. In 2005 IEEE Instrumentationand
Measurement Technology Conference Proceedings, volume 2, pages 888–892, May
2005.
[70] Mauricio Orozco, Trujillo Ismail, Shakra Abdulmotaleb, and El Saddik. Haptic: the
new biometrics-embedded media to recognizing and quantifying human patterns. In
MULTIMEDIA ’05: Proceedings of the 13th annual ACM international conference
on Multimedia, 2005.
[71] Grant Pannell, Helen Ashman, Grant Pannell, and Helen Ashman. Anomaly detec-
tion over user profiles for intrusion detection, 2010.
153

[72] Benny Pinkas and Tomas Sander. Securing passwords against dictionary attacks. In
Proceedings of the 9th ACM conference on Computer and communications security,
pages 161–170. ACM, 2002.
[73] Maja Pusara and Carla E. Brodley. User re-authentication via mouse movements.
In Proceedings of the 2004 ACM Workshop on Visualization and Data Mining for
Computer Security, pages 1–8. ACM, 2004.
[74] Manuel Rodrigues, Srgio Gonalves, Davide Carneiro, Paulo Novais, and Florentino
Fdez-Riverola. Keystrokes and clicks: Measuring stress on e-learning students. In
Jorge Casillas, Francisco J. Martnez-Lpez, Rosa Vicari, and Fernando De la Prieta,
editors, Management Intelligent Systems, volume 220 of Advances in Intelligent Sys-
tems and Computing, pages 119–126. Springer International Publishing, 2013.
[75] Arun Ross and Anil K Jain. Multimodal biometrics: An overview. In Signal Pro-
cessing Conference, 2004 12th European, pages 1221–1224. IEEE, 2004.
[76] David E Rumelhart, Geoffrey E Hinton, and Ronald J Williams. Learning represen-
tations by back-propagating errors. Cognitive modeling, 5(3):1, 1988.
[77] Jake Ryan, Meng jang Lin, and Risto Miikkulainen. Intrusion detection with neural
networks. In Advances in Neural Information Processing Systems, pages 943–949.
MIT Press, 1998.
[78] A. Schlapbach and H. Bunke. Off-line handwriting identification using hmm based
recognizers. In Proceedings of the 17th International Conference on Pattern Recog-
nition, 2004. ICPR 2004., volume 2, pages 654–658 Vol.2, Aug 2004.
[79] Matthias Schonlau, William DuMouchel, Wen-Hua Ju, Alan F. Karr, Martin Theu-
san, and Yehuda Vardi. Computer intrusion: Detecting masquerades. Statist. Sci.,
16(1):58–74, 02 2001.
[80] D.A. Schulz. Mouse curve biometrics. In Biometric Consortium Conference, 2006
Biometrics Symposium: Special Session on Research at the, pages 1–6, 9 2006.
154
[81] R. Sekar, M. Bendre, D. Dhurjati, and P. Bollineni. A fast automaton-based method
for detecting anomalous program behaviors. In Proceedings of the 2001 IEEE Sym-
posium on Security and Privacy, SP ’01, pages 144–, Washington, DC, USA, 2001.
IEEE Computer Society.
[82] Richard Serfozo. Basics of applied stochastic processes. Springer Science & Busi-
ness Media, 2009.
[83] Eugene H. Spafford and Stephen A. Weeber. Software forensics: Can we track code
to its authors? Comput. Secur., 12(6):585–595, October 1993.
[84] Salvatore Stolfo, Frank Apap, Eleazar Eskin, Katherine Heller, Shlomo Hershkop,
Andrew Honig, and Krysta M. Svore. A comparative evaluation of two algorithms
for windows registry anomaly detection. Journal of Computer Security, 13:659–693,
October 2005.
[85] Salvatore J Stolfo, Shlomo Hershkop, Chia-Wei Hu, Wei-Jen Li, Olivier Nimeskern,
and Ke Wang. Behavior-based modeling and its application to email analysis. ACM
Transactions on Internet Technology (TOIT), 6(2):187–221, 2006.
[86] Sven Stromqvist, Kenneth Holmqvist, Victoria Johansson, Henrik Karlsson, and Asa
Wengelin. What keystroke-logging can reveal about writing, volume 18 of Computer
key-stroke logging and writing: methods and applications (Studies in Writing), pages
45–72. Elsevier, 2006.
[87] K.P.H. Sullivan and E. Lindgren. Studies in Writing: Vol. 18. Computer Key-Stroke
Logging and Writing: Methods and Applications. Elsevier, 2006.
[88] M. Topallar, M. O. Depren, E. Anarim, and K. Ciliz. Host-based intrusion detection
by monitoring windows registry accesses. In Proceedings of the IEEE 12th Signal
Processing and Communications Applications Conference, 2004., pages 728–731,
April 2004.
155
[89] Jack V. Tu. Advantages and disadvantages of using artificial neural networks versus
logistic regression for predicting medical outcomes. Journal of Clinical Epidemiol-
ogy, 49(11):1225 – 1231, 1996.
[90] Lorna Uden, Albert Alderson, and Stephen Tearne. A conceptual model for learning
internet searching on the internet. In System Sciences, 2001. Proceedings of the 34th
Annual Hawaii International Conference on, pages 9–pp. IEEE, 2001.
[91] V.R. Vemuri V. Dao and S.J. Templeton. Profiling users in the unix os environment.
In International ICSC Conference on Intelligent Systems and Applications, 2000.
[92] Christopher Varenhorst, MV Kleek, and Larry Rudolph. Passdoodles: A lightweight
authentication method. Research Science Institute, 2004.
[93] M. Villani, C. Tappert, Giang Ngo, J. Simone, H. S. Fort, and Sung-Hyuk
Cha. Keystroke biometric recognition studies on long-text input under ideal and
application-oriented conditions. In 2006 Conference on Computer Vision and Pat-
tern Recognition Workshop (CVPRW’06), pages 39–39, June 2006.
[94] Bob Violino. Biometric security is on the rise. http://www.
csoonline.com/article/2891475/identity-access/
biometric-security-is-on-the-rise.html.
[95] Lisa M. Vizer. Detecting cognitive and physical stress through typing behavior. In
CHI ’09 Extended Abstracts on Human Factors in Computing Systems, CHI EA ’09,
pages 3113–3116. ACM, 2009.
[96] G. Weinhandel, H. Stogner, and A. Uhl. Experimental study on lossless compression
of biometric sample data. In 2009 Proceedings of 6th International Symposium on
Image and Signal Processing and Analysis, pages 517–522, Sept 2009.
[97] Chuck Wilson. Vein pattern recognition. A Privacy-Enhancing Biometric. Boca
Raton: CRC, 2010.
156

[98] Victoria Woods, Sarah Hastings, Peter Buckle, and Roger Haslam. Ergonomics of
using a mouse or other non-keyboard input device. c© Health and Safety Executive,
2002.
[99] Roman V. Yampolskiy and Venu Govindaraju. Behavioural biometrics; a survey and
classification. International Journal of Biometrics, 1(1), June 2008.
[100] Dit yan Yeung and Yuxin Ding. Host-based intrusion detection using dynamic and
static behavioral models. Pattern Recognition, 36:229–243, 2003.
[101] Varvarigou T. Yannopoulos A, Andronikou V. Behavioural biometric profiling and
ambient intelligence. Profiling the European Citizen. CrossDisciplinary Perspec-
tives, pages 109–131, 2008.
[102] Nong Ye. A markov chain model of temporal behavior for anomaly detection. In
Proceedings of the 2000 IEEE Workshop on Information Assurance and Security,
pages 171–174, 2000.
[103] Tom Yeh, Tsung-Hsiang Chang, and Robert C. Miller. Sikuli: Using gui screenshots
for search and automation. In Proceedings of the 22Nd Annual ACM Symposium on
User Interface Software and Technology, UIST ’09, pages 183–192. ACM, 2009.
[104] Tom Yeh, Tsung-Hsiang Chang, Bo Xie, Greg Walsh, Ivan Watkins, Krist Wong-
suphasawat, Man Huang, Larry S. Davis, and Benjamin B. Bederson. Creating con-
textual help for guis using screenshots. In Proceedings of the 24th Annual ACM
Symposium on User Interface Software and Technology, UIST ’11, pages 145–154,
2011.
[105] James R Young and Robert W Hammon. Method and apparatus for verifying an
individual’s identity, February 14 1989. US Patent 4,805,222.
[106] Li Zhuang, Feng Zhou, and J Doug Tygar. Keyboard acoustic emanations revisited.
ACM Transactions on Information and System Security (TISSEC), 13(1):3, 2009.
157