behavioural characteristics and financial distress - · pdf file ·...
TRANSCRIPT
CONFERENCE ON HOUSEHOLD FINANCE AND CONSUMPTION
WORK ING PAPER SER I E SNO 1303 / F EBRUARY 2011
by Yvonne McCarthy
BEHAVIOURAL CHARACTERISTICS AND FINANCIAL DISTRESS
CONFERENCE ON HOUSEHOLD
FINANCE AND CONSUMPTION
1 The views expressed in this paper are those of the author and do not necessarily reflect those of the Central Bank of Ireland.
The author would like to thank Karl Whelan, Liam Delaney, Ron Davies and Denis Conniffe of University College Dublin,
as well as participants at a Central Bank of Ireland seminar and an anonymous referee, for helpful comments.
The author is responsible for any remaining errors.
2 Central Bank of Ireland; e-mail: [email protected]
This paper can be downloaded without charge from http://www.ecb.europa.eu or from the Social Science Research Network electronic library at http://ssrn.com/abstract_id=1761570.
NOTE: This Working Paper should not be reported as representing the views of the European Central Bank (ECB).
The views expressed are those of the author and do not necessarily reflect those of the ECB.
WORKING PAPER SER IESNO 1303 / FEBRUARY 2011
BEHAVIOURAL CHARACTERISTICS
AND FINANCIAL DISTRESS 1
by Yvonne McCarthy 2
In 2011 all ECBpublications
feature a motiftaken from
the €100 banknote.
CONFERENCE ON “HOUSEHOLD FINANCE AND CONSUMPTION”
This paper was presented at the conference on “Household Finance and Consumption”, which was co-organised by the Banque centrale du Luxembourg and the ECB, and was held on 25-26 October 2010 in Luxembourg. The organising committee consisted of Michael Ehrmann (ECB), Michalis Haliassos (CFS and Goethe University), Thomas Mathä (Banque centrale du Luxembourg), Peter Tufano (Harvard Business School), and Caroline Willeke (ECB). The conference programme, including papers, can be found at http://www.ecb.europa.eu/events/conferences/html/joint_ecb_lux.en.html. The views expressed in this paper are those of the authors and do not necessarily reflect those of the Banque centrale du Luxembourg, the ECB or the Eurosystem.
© European Central Bank, 2011
AddressKaiserstrasse 2960311 Frankfurt am Main, Germany
Postal addressPostfach 16 03 1960066 Frankfurt am Main, Germany
Telephone+49 69 1344 0
Internethttp://www.ecb.europa.eu
Fax+49 69 1344 6000
All rights reserved.
Any reproduction, publication and reprint in the form of a different publication, whether printed or produced electronically, in whole or in part, is permitted only with the explicit written authorisation of the ECB or the author.
Information on all of the papers published in the ECB Working Paper Series can be found on the ECB’s website, http://www.ecb.europa.eu/pub/scientific/wps/date/html/index.en.html
ISSN 1725-2806 (online)

3ECB
Working Paper Series No 1303February 2011
Abstract 4
Non-technical summary 5
1 Introduction 6
2 Literature review 7
3 Data and descriptive statistics 9
3.1 The fi nancial capability surveys 9
3.2 Descriptive statistics 17
4 Empirical approach and results 20
4.1 Struggling to keep up 20
4.2 Do the effects differ by degree of struggle? 26
4.3 More extreme fi nancial distress 29
5 Reverse causality? 32
6 Conclusions 33
References 34
CONTENTS
4ECBWorking Paper Series No 1303February 2011
Abstract
Using a new nationally representative survey of financial capability and experiencein the UK and Ireland, I investigate the key factors that cause individuals to experiencefinancial distress. In this context, a key area that I focus on is whether individuals’behavioural traits, such as their capacities for self-control, planning, and patience, af-fect their ability to stay out of financial trouble. I find that the variables that proxyfor these behavioural characteristics are both statistically significant and economicallyimportant for predicting both mild and extreme forms of financial distress, in a regres-sion controlling for demographic and socio-economic factors. Furthermore, behaviouraltraits emerge as having a stronger impact on the incidence of financial distress thaneducation or financial literacy. The results raise questions about whether policy can beoriented towards improving financial habits and mitigating the impact of behaviouralcharacteristics on personal finances.
JEL classification: C25, D14.
Keywords: Personal Finance, Financial Strain, Debt, Behaviour, Financial Literacy.
5ECB
Working Paper Series No 1303February 2011
Non Technical Summary
Financial distress at an individual and household level can have serious consequences which
go far beyond those experienced by the individual or household involved. The current
financial crisis, which stemmed in large part from poor financial decisions and heightened
financial distress among households around the world, and its enormous fiscal cost, is a
clear reminder of this fact. In this context, understanding why people get into financial
difficulties is key to devising policies to prevent future episodes of heightened financial
distress. Using data from a new survey of financial capability and experience in the UK
and Ireland, this study addresses this issue.
In examining the issue of what the key drivers of financial distress are, this study goes
beyond the results already available in the existing literature, by incorporating information
on behavioural characteristics in addition to financial literacy, socio-economic and demo-
graphic factors. Specifically, a key area that this study focuses on is whether an individual’s
capacity for self-control, planning and patience affects their ability to manage their finances
and stay out of financial trouble. The results show that behavioural factors are important
determinants of financial difficulties; people who are impulsive are more likely to get into
financial difficulties than people who are not impulsive, and this result applies even if a
person is well educated and financially literate. Similarly impatient or disorganised people
are also more likely to experience financial distress.
The results show that policy efforts to prevent financial difficulties must go beyond
solely trying to improve financial literacy and education levels, which also matter. Instead,
these efforts should be combined with tools to improve individuals’ organisation skills and
devices to, as much as is possible, minimise the impact of behavioural and psychological
traits on financial outcomes.

6ECBWorking Paper Series No 1303February 2011
1 Introduction
The financial crisis stemmed, in large part, from poor financial decisions and heightened
financial distress among households around the world. The years prior to the crisis saw
many people making bad financial choices from taking on levels of debt that they were not
able to manage, to spending beyond their means. The US sub-prime mortgage market, in
which people with poor credit history and income prospects took on debt which they could
not afford, is the best known example of this phenomenon but, closer to home, there are
numerous examples of European households facing financial woes because of poor financial
behaviour. In many cases these financial difficulties lead to serious problems for the people
involved. However, the enormous fiscal costs associated with a financial crisis are a reminder
that heightened financial distress and poor financial behaviour on the part of a relatively
small number of people can have serious negative externality effects on the rest of the
economy. In this context, understanding why people get into financial difficulties is key to
devising policies to minimise future episodes of financial distress. It is with this in mind
that the current study is undertaken.
Specifically, my goal in this paper is to identify the main factors that cause people to
experience financial distress. A key area that I focus on is whether people’s behavioural
traits, such as their capacities for self-control, planning, and patience, affect their ability
to manage their finances and stay out of financial trouble. I find that the variables that
proxy for behavioural traits are both statistically significant and economically important
for predicting both mild and extreme forms of financial distress, in a regression controlling
for demographic and socio-economic factors. Furthermore, behavioural traits emerge as
having a stronger impact on the incidence of financial distress than education or financial
literacy. For example, while having either a college education or being financially literate
reduces the likelihood of getting into financial trouble, being impulsive can undo all of this
benefit. These results suggest that policies to prevent people from getting into financial
difficulties must take behaviour into account.
I use data from Financial Capability Surveys carried out in the UK and Ireland in re-
cent years to undertake my analysis. These surveys were specially designed to shed light on
financial decision making and outcomes and they have not yet been utilised in the existing
international literature. They provide large nationally representative samples, collected
detailed data on demographics, income and wealth and also asked questions about people’s
daily financial lives, from how they manage their money to how they choose financial prod-

7ECB
Working Paper Series No 1303February 2011
ucts and how much financial planning they engage in. The surveys also asked respondents
various questions that can be used to assess behavioural and psychological traits and the
UK survey contained questions that assessed basic financial literacy. While some previ-
ous work on financial distress has employed samples that have some of these features, the
Financial Capability Surveys are unique in having all of them.
Relative to the existing literature, therefore, this paper is the first to use a large repre-
sentative sample to examine the effects of behavioural characteristics on financial distress
rather than on asset accumulation, which is the focus of a number of other papers (Ameriks
et al (2003) or Lusardi and Mitchell (2007), for example).1 To the author’s knowledge, the
paper is also the first to focus on both mild and extreme forms of financial distress. A num-
ber of previous papers have studied extreme forms of financial distress such as mortgage
arrears, default and repossessions. This sort of analysis is no doubt important, but it only
presents part of the picture as to why people get into financial trouble. It neglects the fact
that people may experience ‘milder’ forms of financial distress long before they default on
large debt obligations such as mortgages, and of course, people who do not have large debt
obligations might still get into financial difficulties.
The rest of this paper is structured as follows: In the next section I examine the existing
literature on the causes of financial distress. In Section 3 I introduce the data used in the
current study and present a socio-demographic and behavioural overview of the sample
according to individuals’ degree of financial distress. Section 4 covers the econometric tech-
niques used and presents the model results. In Section 5 I examine the issue of endogeneity
and reverse causality. Finally, Section 6 summarises and concludes.
2 Literature Review
In examining the literature on behaviour and financial distress, a number of points emerge.
Firstly, while certain recent studies examine the effect of behavioural traits such as plan-
ning on financial outcomes, these studies have tended to be based on data for the United
States and focussed on the impact of planning on net worth, rather than financial distress.
Ameriks et al (2003), for example, examine the role of planning in explaining why differ-
ent households end up with different levels of wealth. Using survey data for individuals1While a relatively small literature does examine the effect of behaviour on financial distress, the sample
sizes used in these studies tend to be small and are not nationally representative - see Livingstone and Lunt
(1992) for example.

8ECBWorking Paper Series No 1303February 2011
in the U.S., they examine the proposition that attitudes and skills influence a household’s
propensity to plan, while differences in propensities to plan influence wealth accumulation.
They find evidence that individuals with a high propensity to plan spend more time devel-
oping financial plans and save and accumulate more wealth than those with a lower such
propensity. The authors argue that their findings are consistent with broad psychological
evidence concerning the beneficial impacts of planning on goal pursuit.
On a similar theme, Lusardi and Mitchell (2007) examine the effect of planning and
financial literacy on wealth holdings of individuals in the U.S. who are nearing retirement.
They compare the wealth holdings of two cohorts of the same age (51-56 years) at different
points in time (1992 and 2004) and find that in both cohorts, planners tend to have higher
levels of financial literacy and end up with higher wealth levels at retirement than non-
planners. The authors find that the relationship between planning and wealth remains
strong in a regression controlling for several socio-demographic factors. They also explore
the possibility that reverse causality may be a problem in their regression of wealth on
planning, but conclude that this is not the case.
Secondly, while a number of papers specifically examine the role of behavioural factors in
financial distress, these papers tend to be based on very small sample sizes that pre-date the
economic boom and rapid debt expansion period of the late 1990s and early 2000s. Among
these, Walker (1996) uses a sample of only one hundred respondents to study the key factors
affecting individuals’ perceptions of their financial situation following a significant life event
with financial implications - the birth of a new baby. She interviews new mothers in the UK
and constructs a measure of ‘financial coping’ using responses to a question about whether
or not respondents believed they had enough money to cope with life (before and after
the birth of the new baby). She finds that time-preferences, financial management and
attitudes towards debt tend to be important predictors of a household’s financial distress
level, after controlling for demographics and income.
Another paper in this field comes from Livingstone and Lunt (1992), who examine the
social, economic and psychological factors related to debt in the UK, using a sample of
just 279 respondents. These authors explore the factors distinguishing debtors from non-
debtors, the amount of debt individuals take on and the amount of debt that gets repaid.
The authors use data collected from a custom designed survey of the debt experiences of
individuals based in and around Oxford, England during September 1989, to undertake their
analysis. They find that socio-demographic factors play only a minor role in personal debt

9ECB
Working Paper Series No 1303February 2011
and debt repayment, while attitudinal factors (such as whether an individual is pro-credit
or anti-debt, or whether they see credit as useful but problematic or not) are important
and significant predictors.
Finally, while there is a growing literature which examines the causes of extreme forms
of financial distress such as mortgage default and repossessions, this literature does not take
account of behavioural or psychological factors. For example, Boheim and Taylor (2000)
use the British Household Panel Survey to examine evictions, repossessions and household
finance problems in the UK over the period 1991-1997. They find that previous experience of
financial distress is significantly and positively associated with the current financial position
of the household and the probability of eviction and that employment and higher income
and asset values decrease the probability of experiencing financial difficulties.
Burrows (1997) also examines the determinants of mortgage arrears in the UK, using
a sample of 8,000 households from the 1994/95 Survey of English Housing. He finds that
households are more likely to be in arrears if they are out of employment (or employed part-
time), if they work in the private sector (relative to the public sector) or if they bought
their property between 1987 and 1989. He also finds evidence to suggest that households
in which members have previously faced mortgage repayment difficulties are more likely to
be in arrears than other households.
In summary, while several papers examine different aspects of financial distress and the
impact of behaviour and financial literacy on financial outcomes, no one paper takes the
effect of economic and demographic factors, financial literacy and behaviour into account
in looking specifically at financial distress - be it mild or extreme. Relative to the existing
literature, therefore, this paper, which uses a large nationally representative dataset and
takes all of these factors into account, offers new insights on the key causes of financial
distress.
3 Data and Descriptive Statistics
3.1 The Financial Capability Surveys
The nature of financial decision-making has changed a lot in recent years, as individuals
are faced with a wider range of products, many of which are more complex than products
available in the past. In addition, people are increasingly being asked to take more respon-
sibility for their financial well-being, in particular with regards to providing for their future
10ECBWorking Paper Series No 1303February 2011
pension needs. Against this background, the UK’s Financial Services Authority (FSA) has,
since 2003, lead a National Strategy for Financial Capability with the “aim to improve the
nation’s knowledge and understanding of personal finance.”
To facilitate its goals, the FSA commissioned a Financial Capability Survey. The pri-
mary purpose of this survey was to measure the level of financial capability prevailing in
the UK at the time that the survey was conducted. For the same reason, the Irish Fi-
nancial Regulator later undertook a Financial Capability Survey, using the UK survey as
its blueprint. The Irish survey therefore included the majority of the same questions as
the UK survey, with some minor exceptions. Both Financial Capability Surveys covered a
broad array of topics on financial knowledge and experience, but crucially, for the purposes
of this study, asked respondents about their ability to make ends meet and keep track of
their finances. When combined with demographic, socio-economic and behavioural infor-
mation that is also available from the surveys, this allows an examination of the incidence
of financial distress among respondents and the key factors relating to this distress.
The UK Financial Capability Survey was undertaken in the summer of 2005 while the
Irish survey was undertaken in late 2007 / early 2008. Full details of the sampling method-
ologies used are available in FSA (2006) for the UK survey and Keeney and O’Donnell
(2009) for the Irish survey, but here I set out some of the main features. Both surveys were
conducted to be nationally representative, with the UK survey achieving a sample size of
approximately 5,300 respondents and the Irish survey achieving 1,529 respondents.2 The
surveys were conducted using a random location sampling approach and quota sampling,
where quotas were selected on the basis of age and working status within gender profiles
taken from the 2001 British Census (in the case of the UK) and from the 2006 Irish Census
(in the case of Ireland). On the basis of the census population totals, simple frequency
weights were subsequently designed.
Both the UK and Irish versions of the survey group their questions into four sections.
The first section, “Managing Money”, asks people about their ability to make ends meet
and keep track of their finances. The second group of questions falls under the “Planning
Ahead” heading, where people are asked about the extent to which they have prepared for
substantial future commitments. They are also asked about their provisions for unexpected
financial events. In the “Choosing Products” section, respondents are asked about their2The primary sampling unit was a geographical unit, which was, for example, an electoral division (ED),
or combination of EDs, with at least 200 households in the Irish case.

11ECB
Working Paper Series No 1303February 2011
knowledge of financial products, and the key factors influencing their choice and purchase
of particular products. Finally, the “Staying Informed” section considers whether and how
often respondents monitor financial topics. This section also asks people about how they
have dealt with complaints to shops, suppliers and financial firms.
3.1.1 Questions on Financial Distress
The Financial Capability Survey asked respondents several questions about their financial
situation, and I use this information to derive measures of financial distress in the sample.
I begin by defining financial distress as a situation where individuals report that they are
having some degree of difficulty keeping up with their bills and credit commitments. Later,
I assess more extreme forms of financial distress such as how often people run out of money
and whether or not they have fallen into arrears on loans and credit commitments for a
period of three months or more. At this stage, the question from the Financial Capability
Survey that I use to identify people in financial distress is as follows:
Which of these statements best describes how well you and your partner are keeping
up with your bills and credit commitments at the moment?
1. Keeping up with all bills and credit commitments without any difficulties.
2. Keeping up with all bills and credit commitments, but it is a struggle from time-to-
time.
3. Keeping up with all bills and credit commitments, but it is a constant struggle.
4. Falling behind with some bills and credit commitments.
5. Having real financial problems and have fallen behind with many bills and credit
commitments.
6. Don’t have any bills or credit commitments.
7. Don’t know / Refused.
Table 1 shows the distribution of the responses to this question among the sample. In
both Ireland and the UK, just over 60 per cent of the sample report that they are having
no difficulties keeping up with all their bills and credit commitments. Just over a quarter
of the sample in both countries report that they are keeping up with all their bills and
credit commitments but that they struggle to do so from time-to-time. About 7 per cent
of both samples report that they find keeping up with their bills and credit commitments

12ECBWorking Paper Series No 1303February 2011
Table 1: Distribution of samples by Degree of Struggle (%)
UK Ireland Total
No difficulties 63.2 60.1 62.5
Struggle Time to Time 26.4 27.4 26.6
Constant Struggle 7.1 7.6 7.2
Falling Behind Some 2.2 1.6 2.1
Falling Behind Many 1.1 0.5 0.9
Don’t have any - 2.2 0.5
Don’t Know/Refused - 0.6 0.2
N 5,328 1,529 6,857
a constant struggle, while 1.6 per cent in the Irish sample and 2.2 per cent of the British
sample report that they are falling behind with some of their bills and credit commitments.
Only 1 per cent of the British sample report that they have fallen behind with many of
their bills and credit commitments, while the corresponding figure for Ireland is less than
1 per cent.
3.1.2 Questions on Behavioural Characteristics
The Financial Capability Survey differs from a number of other household surveys that
collect financial information in asking questions about behavioural characteristics, such as
respondents’ level of self control, time preference and whether or not they are well organised
with their money.
Self-Control and Time Preference
Time preference in financial decision-making is generally thought to capture an individual’s
choice of whether to spend their money now, or delay gratification for later, for example by
saving, (Walker, 1996). Similarly, self-control is thought to be an important influence on a
person’s financial decisions. Several studies have found that a preference for the future and
self-control have a positive impact on saving and financial ‘coping’ (Groenland and Nyhus,
1994; Lea et al., 1995). In the Financial Capability Survey, respondents were asked their
degree of agreement or disagreement with the following statements:

13ECB
Working Paper Series No 1303February 2011
“I tend to live for today and let tomorrow take care of itself.”
“I am impulsive and tend to buy things even when I can’t really afford them.”
Potential responses are “Agree Strongly”, “Tend to Agree”, “Tend to Disagree” and
“Disagree Strongly”. I use the responses to the first statement to proxy an individual’s
time preference, and responses to the second statement to proxy an individual’s degree of
self-control. In particular, I create dummy variables “Live Today” and “Impulsive” which
are equal to one if an individual responds that they either agree strongly or tend to agree
with the statements, and zero otherwise. As shown in Table 2, over 40 per cent of the
sample has a time preference of today relative to tomorrow, while close to a quarter of the
sample agrees that they are impulsive, i.e. that they lack self-control.
Financial Management and Organisation
Several papers show that different styles and degrees of financial management and planning
have an important effect on the debt status or degree of financial coping of a household
(Lea et al. (1995), Gunnarsson and Wahlund (1993), Livingstone and Lunt (1992) for
example). Specifically those households that plan or manage their money better tend
to have less debt and cope financially better than those households that do not plan or
manage their money as well. In this study, I proxy for respondents’ financial management
or organisation behaviours using responses to several questions/statements available in the
Financial Capability Survey. Firstly, respondents are asked about their degree of agreement
or disagreement with the following statement:
“I am very organised when it comes to managing my money day-to-day.”
Furthermore, respondents are asked how accurately they know how much money they
have/owe in their various savings, current, and loan accounts. Answers range from “I
know within a pound/euro or two” to “I have no idea at all”. Respondents are also asked
if they ever check statements for their various accounts and investments. Based on this
information, I create a dummy variable “Organised” which is equal to one for organised
individuals and zero for disorganised individuals. Specifically, I classify those individuals
who disagree with the statement on money organisation or who agree with it but claim to
have no idea at all as to how much money they have available to them or that they never
monitor their investments or check statements for any of their accounts, as disorganised with
their money. Organised individuals agree with the statement and do not display evidence

14ECBWorking Paper Series No 1303February 2011
to the contrary. As shown in Table 2, roughly 60 per cent of the sample are classified as
being organised with their money.
Table 2: Distribution of samples by Behavioural and Time Preference Traits (%)
UK Ireland Total
Live for Today 40.7 44.0 41.5
Impulsive 22.1 25.6 22.8
Organised 61.8 60.7 61.6
3.1.3 Questions on Financial Literacy
Financial literacy has been shown to affect many different financial outcomes such as sav-
ings, wealth, debt and retirement funds (see Stango and Zinman (2010), Lusardi and Tufano
(2008), Lusardi and Mitchell (2007), for example). Unfortunately, information on financial
literacy is not available in the Irish Financial Capability Survey. However, in the UK version
(which accounts for almost 80 per cent of the total sample), respondents were presented
with several questions that I use to assess basic financial literacy. In particular, respondents
were shown a copy of a bank statement (see Table 3) and asked:
(1) Looking at this example of a bank statement, please can you tell me how
much money was in the account at the end of February?
(2) And still looking at this statement, if a direct debit of £179 comes in on
28th February and there is an agreed overdraft limit of £100 on the account,
would there be enough money in the account including the overdraft limit, to
cover the direct debit?

15ECB
Working Paper Series No 1303February 2011
Table 3: Quiz Material 1
Bristol Bank
Green Street
Ms. J Bloggs Forest Glade
RR9 5AT
Sheet Account 02-82-03
008 Number 47493555
DATE DETAILS PAID OUT PAID IN BALANCE
01-Feb-05 Balance Brought Forward 25.00
01-Feb-05 Bacs Transfer Salary 1000
01-Feb-05 DD Electricity Board 30.00 995.00
02-Feb-05 DD Car Insurance 50.00
XXX Bank Forest Glade High
02-Feb-05 ATM Street 150.00 795.00
04-Feb-05 CHQ 100009 35.00 760.00
06-Feb-05 DD XXX Mobile Phone Company 30.00 730.00
10-Feb-05 DD XXX Mortgage Bank 200.00 530.00
XXX Bank Forest Glade High
12-Feb-05 ATM Street 120.00 410.00
15-Feb-05 SO New Building Society 50.00 360.00
20-Feb-05 CHQ 100010 300.00 60.00
28-Feb-05 CR Net Interest 1.00 61.00
28-Feb-05 Balance Carried Forward 61.00
Key to Abbreviations
DD Direct Debit
ATM ATM Cash Withdrawal
CHQ Cheque
SO Standing Order
CR Automated Credit
Respondents were also presented with a line graph (Figure 1), which shows how four
different investment funds performed over time. The following questions were posed in
relation to this graph:
(3) This chart shows how a £10,000 investment would have performed in differ-
ent types of investment funds over the last seven years. Assuming that fees and
charges are the same for all funds, which fund gave the best return after seven
years?
(4) And which would have been the best fund to have chosen if you had to
withdraw your money after four years?

16ECBWorking Paper Series No 1303February 2011
Figure 1: Quiz Material 2
Two additional questions were also asked, which assessed respondents knowledge of the
real value of money and their ability to calculate percentages:
(5) If the inflation rate is 5% and the interest rate you get on your savings is
3%, will your savings have at least as much buying power in a years time?
(6) Suppose you saw the same television on sale at a discount in two different
shops. The original purchase price of the television was £250. One shop is
offering a discount of £30 off the original price, the other is offering a discount
of 10% off the original price. Which is the better deal - £30 off or 10% off?
Table 4 summarizes how the UK respondents performed on these questions. At first
glance, the sample appear to score well on the financial literacy questions, with over 90
per cent getting the first question about the closing balance on the bank account correct.
However, just over 70 per cent of the sample was able to answer either question on the
graph correctly. More worrying still is the fact that only 46 per cent of the UK sample is
able to answer all the questions correctly. I create four dummy variables reflecting how well
respondents performed on the financial literacy questions: “Literate: 3 and less” which is
equal to one if a respondent answered three or less questions correctly, and zero for all other

17ECB
Working Paper Series No 1303February 2011
respondents. Similarly “Literate: 4”, “Literate: 5” and “Literate: 6” respectively are equal
to one if a respondent answered four, five or six questions correctly and zero otherwise.
Table 4: Financial Literacy Among UK Sample
Question Correct (%) Incorrect (%) Don’t Know/Refused (%) N
(1) Closing Balance 91.0 4.8 4.2 5,328
(2) Direct Debit 84.7 10.7 4.5 5,328
(3) Chart 7Yr 73.4 20.8 5.8 5,328
(4) Chart 4Yr 72.0 21.7 6.3 5,328
(5) Real Value 77.2 9.0 13.8 5,328
(6) Percentage Calculation 89.8 7.2 3.0 5,328
3.2 Descriptive Statistics
From this point onwards, I combine the UK and Irish samples and undertake all analyses
on the total sample of over 6,000 respondents, including, where necessary, a dummy vari-
able indicating which survey respondents come from. I do this for two reasons. Firstly,
combining the datasets from both countries results in a larger sample that allows for a more
detailed examination of financial distress. Secondly, the descriptive statistics in both the
British and Irish samples reveal little difference between the two countries in terms of who
experiences financial distress.
As a robustness check I repeat all the empirical exercises contained in this paper sep-
arately for the UK and Ireland and find no quantitative differences in the results for both
countries.3 Furthermore, I believe I am justified in combining both datasets since the UK
and Ireland share many features such as a common language, similar cultural and insti-
tutional backgrounds and the Anglo-Saxon banking culture, while there has also always
been a high degree of labour mobility between Ireland and the UK. In addition, while
both surveys were undertaken at different points in time, the macroeconomic conditions
prevailing in both countries in the lead-up to the surveys were broadly similar. Specifically,3One example of such an exercise is available in Table 7 where separate results are available based on
the Irish dataset alone and on the British data alone. The remaining results are available on request from
the author.

18ECBWorking Paper Series No 1303February 2011
both countries enjoyed strong economic growth and low unemployment rates during the
period.4 Finally, O’Donnell (2009) compares the overall results for financial capability be-
tween Ireland and the UK and finds a high degree of correlation between the results in both
countries for the managing money and keeping track of one’s personal finances sections of
the surveys.
Table 5 examines the demographic and economic characteristics of respondents accord-
ing to their distress level in the total sample. The age distribution of persons reporting
financial distress is shown in the first panel, and shows that younger people tend to report
some degree of financial distress more often than older people. For example, 30.4 per cent
of 18-24 year olds in the sample report that they struggle from time-to-time to keep up with
bills and credit commitments, relative to 12.8 per cent of the 65+ year olds. I also find that
a slightly higher proportion of females report financial distress relative to males (Panel 2).
In Panel 3 I show that married people report financial distress less often than non-married
people, while Panel 4 shows that less educated respondents tend to report financial distress
more often than more educated individuals.
Financial distress responses also vary by income, as shown in Panel 5, where I divide
respondents into quintiles based on their income level. The lowest income quintile captures
the poorest 20 per cent of respondents in the sample, where for example, 10.2 per cent
of this group report that it is a constant struggle to keep up with their bills and credit
commitments. The highest income quintile captures the richest 20 per cent of the sample,
where for example 3.1 per cent of this group report a constant struggle with bills and credit
commitments. The table also shows that respondents with outstanding debt more often
report being in financial difficulties relative to those with no outstanding debt. Finally, in
Panel 7 I show the work status of the sample, and find that unemployed respondents more
often report that they are financially distressed relative to individuals with another work
status.
4The unemployment rate in both countries was in the range of 4-5 per cent at the time that the surveys
were conducted, while real GDP grew, on average, by close to 1 per cent per quarter in the year leading up
to the surveys in both countries.

19ECB
Working Paper Series No 1303February 2011
Table 5: Distribution of Financial Distress by Demographic Characteristics (%, unless
otherwise stated)
Panel Variable No Struggle Constant Falling NProblem TTT Struggle Behind
1 Age (years)18-24 56.2 30.4 8.8 4.6 87125-44 53.7 33.5 8.6 4.2 2,64645-64 65.4 24.9 7.1 2.6 2,07965+ 83.7 12.8 3.2 0.3 1,217
2 GenderMale 66.4 24.6 6.3 2.8 3,404Female 59.5 29.0 8.2 3.4 3,409
3 Marital StatusSingle 55.5 29.4 10.1 5.0 2,117Married 67.8 25.9 4.8 1.5 3,450Widowed/Divorced/Separated 62.1 24.6 9.2 4.1 1,246
4 EducationLower 2nd Level 58.6 27.8 9.7 4.0 1,779Upper 2nd Level 62.3 28.6 6.7 2.4 2,3403rd Level + 70.5 24.3 3.4 1.8 1,303Other1 62.3 24.7 8.6 4.4 1,369
5 Income Quintile1 (Poorest) 59.9 26.0 10.2 4.0 1,3092 59.0 27.3 9.0 4.7 1.2943 59.8 28.5 7.9 3.8 1,3124 62.6 29.0 6.1 2.4 1,3115 (Richest) 71.7 24.8 3.1 0.5 1,312
6 Debt OutstandingNo Debt 69.8 22.2 6.1 2.0 3,962Debt 53.4 33.1 8.8 5.0 2,851
7 Work StatusEmployed 63.8 28.1 5.9 2.2 3,552Unemployed 39.8 34.6 16.1 9.5 497Inactive 49.4 33.6 11.3 5.7 1,370Retired 82.8 13.7 3.1 0.4 1,394Total2 62.9 26.8 7.2 3.1 6,813
1 The ’Other’ education category only applies to the UK sample, and includes individualswith overseas education or some other education that they could not match to the Britishsystem. 2 Total percentages differ from Table 2 since we have excluded respondents with no bills/credit commitments or those who refused to answer or reported that they did not know the answer.N=6,791 for panel 4 and 6,538 for panel 5.

20ECBWorking Paper Series No 1303February 2011
4 Empirical Approach and Results
4.1 Struggling to Keep Up
As discussed in Section 3, the financial distress measure is constructed using responses to the
question on how well respondents are keeping up with their bills and credit commitments.
In particular, I create a dummy variable “Struggle to Keep Up” which is equal to one
for all respondents reporting some degree of struggle in keeping up with their bills and
credit commitments, and equal to zero for those who report no difficulties at all in keeping
up with bills and credit commitments. I exclude respondents who have no bills / credit
commitments or who either refused to answer the question or reported that they did not
know the answer, though as shown in Table 1, these categories represent less than 1 per
cent of the total sample.
Since the dependent variable “Struggle to Keep Up” is a binary variable, I use discrete
dependent variable techniques to examine the impact of the various demographic, socio-
economic and behavioural variables on the probability of experiencing financial distress.
Specifically, I specify the following probit model:
Prob (yi = 1) = F (βxi) + εi i = 1, 2, ...n
where y is the dependent variable “Financial Distress”, x comprises a set of characteris-
tics posited to influence the presence of financial distress (including demographic, socio-
economic and behavioural variables), β is a set of parameters to be estimated, ε is the error
term and i is the observation number.
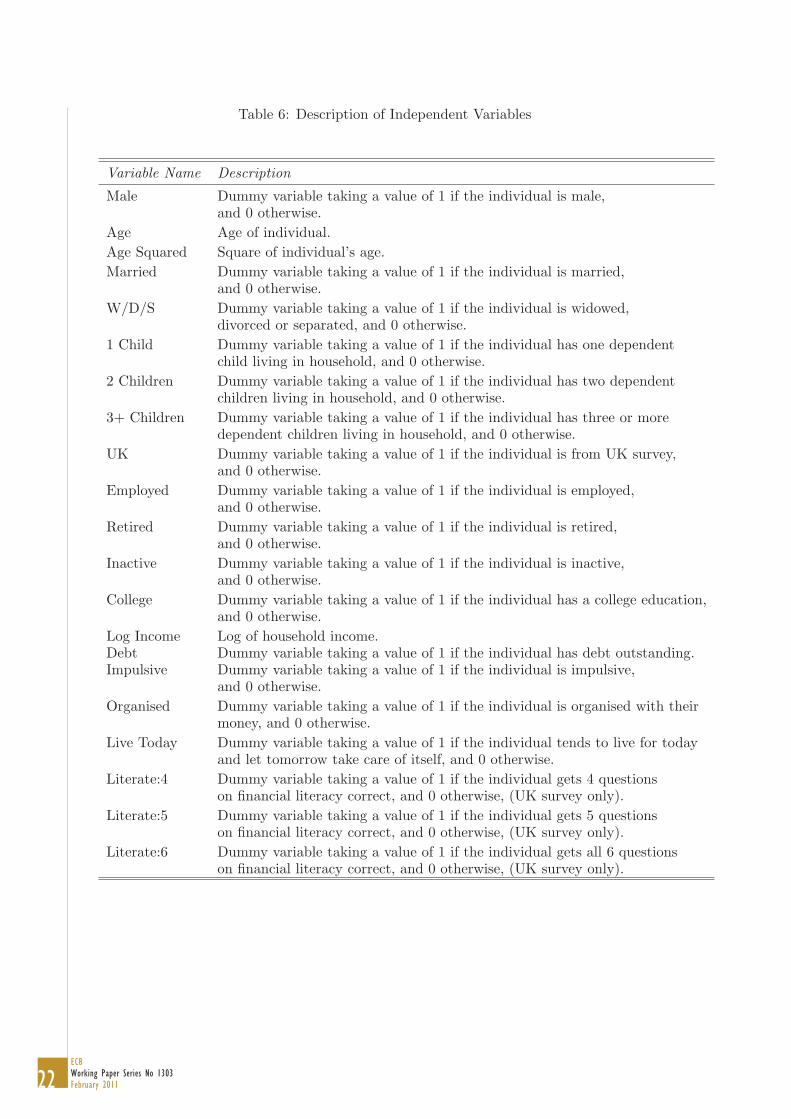
In Table 6, I describe the various independent variables that are used in the analysis.
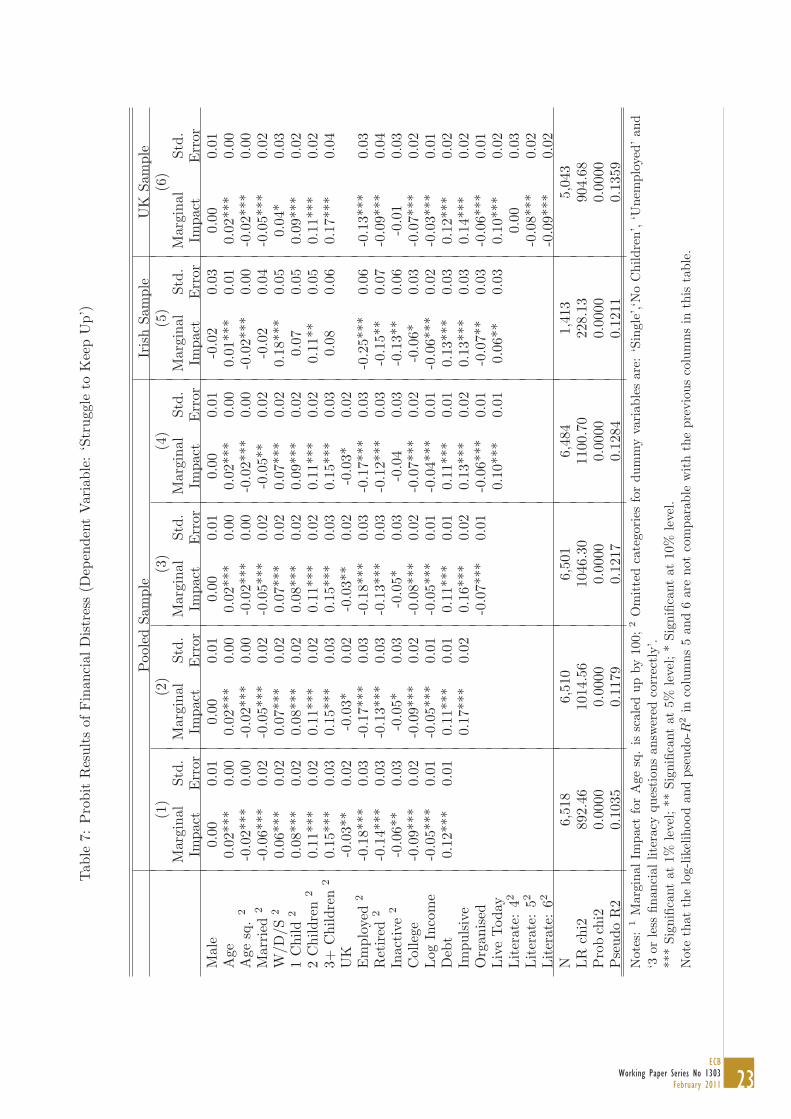
The probit results are presented in Table 7, where the estimated marginal effects and
standard errors of the parameters for the probit regressions are reported. These marginal
effects are calculated at the means of the independent variables. The likelihood ratio (LR)
test results and the McFadden R2 are also shown.
Demographics and Income: I begin by examining the role of demographics and income
in the ability of respondents to keep up with their bills and credit commitments. These
results are shown in the first column of Table 7. I find, as expected, that marital status,
the number of dependent children, age, unemployment, education and income all matter
for financial distress.

21ECB
Working Paper Series No 1303February 2011
The results show that the probability of being in financial distress increases with age,
though only up to a certain point (late 30s) after which the age effect falls rapidly. The
results also show that married people are 6 per cent less likely than single people to expe-
rience financial distress, while people who have suffered relationship breakdown or the loss
of a partner are 6 per cent more likely. Respondents with dependent children are also more
likely to experience financial troubles than respondents with no dependent children, and
this effect increases the more children a person is responsible for. For example, respondents
with one dependent child are 8 per cent more likely to experience financial distress than
respondents with no dependent children while those with 3 or more dependent children
are 15 per cent more likely. British respondents are about 3 per cent less likely than Irish
respondents to report financial distress.
Work status also matters for financial distress; employed people are 18 per cent less
likely than unemployed people to experience financial distress; retired people are 14 per
cent less likely and inactive people are 6 per cent less likely. Having a college education
reduces the probability of financial troubles by 9 per cent while people with higher income
are also less likely to report that they are in financial distress.5 Finally, having outstanding
debt increases the probability of financial distress by 12 per cent relative to individuals
with no outstanding debt.
Behavioural Characteristics: Next I examine the effects of behavioural traits on finan-
cial distress, as measured by the survey questions on impulsiveness, organisation and time
preference. I begin by including the measure of impulsiveness in the regression, the results
of which are reported in column 2 of Table 7. The coefficient on the impulsiveness vari-
able shows that impulsive people are 17 per cent more likely than non-impulsive people to
experience financial distress, and this result is statistically significant. The interpretation
and significance of the remaining variables is in line with those shown in the first column.
5I repeat the regression replacing log income with dummy variables representing income quintiles to assess
if the effect of income on financial distress varies across quintiles. The effect is only statistically significant
for the top two income quintiles (relative to the bottom income quintile), and in particular suggests that
the 4th income quintile is 6 per cent less likely than the poorest 20 per cent of the sample to experience
financial distress while the richest 20 per cent of the sample are 15 per cent less likely than the poorest 20
per cent of the sample to experience financial distress.
22ECBWorking Paper Series No 1303February 2011
Table 6: Description of Independent Variables
Variable Name Description
Male Dummy variable taking a value of 1 if the individual is male,and 0 otherwise.
Age Age of individual.Age Squared Square of individual’s age.Married Dummy variable taking a value of 1 if the individual is married,
and 0 otherwise.W/D/S Dummy variable taking a value of 1 if the individual is widowed,
divorced or separated, and 0 otherwise.1 Child Dummy variable taking a value of 1 if the individual has one dependent
child living in household, and 0 otherwise.2 Children Dummy variable taking a value of 1 if the individual has two dependent
children living in household, and 0 otherwise.3+ Children Dummy variable taking a value of 1 if the individual has three or more
dependent children living in household, and 0 otherwise.UK Dummy variable taking a value of 1 if the individual is from UK survey,
and 0 otherwise.Employed Dummy variable taking a value of 1 if the individual is employed,
and 0 otherwise.Retired Dummy variable taking a value of 1 if the individual is retired,
and 0 otherwise.Inactive Dummy variable taking a value of 1 if the individual is inactive,
and 0 otherwise.College Dummy variable taking a value of 1 if the individual has a college education,
and 0 otherwise.Log Income Log of household income.Debt Dummy variable taking a value of 1 if the individual has debt outstanding.Impulsive Dummy variable taking a value of 1 if the individual is impulsive,
and 0 otherwise.Organised Dummy variable taking a value of 1 if the individual is organised with their
money, and 0 otherwise.Live Today Dummy variable taking a value of 1 if the individual tends to live for today
and let tomorrow take care of itself, and 0 otherwise.Literate:4 Dummy variable taking a value of 1 if the individual gets 4 questions
on financial literacy correct, and 0 otherwise, (UK survey only).Literate:5 Dummy variable taking a value of 1 if the individual gets 5 questions
on financial literacy correct, and 0 otherwise, (UK survey only).Literate:6 Dummy variable taking a value of 1 if the individual gets all 6 questions
on financial literacy correct, and 0 otherwise, (UK survey only).
23ECB
Working Paper Series No 1303February 2011
Tab
le7:
Pro
bit
Res
ults
ofFin
anci
alD
istr
ess
(Dep
ende
ntV
aria
ble:
‘Str
uggl
eto
Kee
pU
p’)
Poo
led
Sam
ple
Iris
hSa
mpl
eU
KSa
mpl
e(1
)(2
)(3
)(4
)(5
)(6
)M
argi
nal
Std.
Mar
gina
lSt
d.M
argi
nal
Std.
Mar
gina
lSt
d.M
argi
nal
Std.
Mar
gina
lSt
d.Im
pact
Err
orIm
pact
Err
orIm
pact
Err
orIm
pact
Err
orIm
pact
Err
orIm
pact
Err
orM
ale
0.00
0.01
0.00
0.01
0.00
0.01
0.00
0.01
-0.0
20.
030.
000.
01A
ge0.
02**
*0.
000.
02**
*0.
000.
02**
*0.
000.
02**
*0.
000.
01**
*0.
010.
02**
*0.
00A
gesq
.2
-0.0
2***
0.00
-0.0
2***
0.00
-0.0
2***
0.00
-0.0
2***
0.00
-0.0
2***
0.00
-0.0
2***
0.00
Mar
ried
2-0
.06*
**0.
02-0
.05*
**0.
02-0
.05*
**0.
02-0
.05*
*0.
02-0
.02
0.04
-0.0
5***
0.02
W/D
/S2
0.06
***
0.02
0.07
***
0.02
0.07
***
0.02
0.07
***
0.02
0.18
***
0.05
0.04
*0.
031
Chi
ld2
0.08
***
0.02
0.08
***
0.02
0.08
***
0.02
0.09
***
0.02
0.07
0.05
0.09
***
0.02
2C
hild
ren
20.
11**
*0.
020.
11**
*0.
020.
11**
*0.
020.
11**
*0.
020.
11**
0.05
0.11
***
0.02
3+C
hild
ren
20.
15**
*0.
030.
15**
*0.
030.
15**
*0.
030.
15**
*0.
030.
080.
060.
17**
*0.
04U
K-0
.03*
*0.
02-0
.03*
0.02
-0.0
3**
0.02
-0.0
3*0.
02E
mpl
oyed
2-0
.18*
**0.
03-0
.17*
**0.
03-0
.18*
**0.
03-0
.17*
**0.
03-0
.25*
**0.
06-0
.13*
**0.
03R
etir
ed2
-0.1
4***
0.03
-0.1
3***
0.03
-0.1
3***
0.03
-0.1
2***
0.03
-0.1
5**
0.07
-0.0
9***
0.04
Inac
tive
2-0
.06*
*0.
03-0
.05*
0.03
-0.0
5*0.
03-0
.04
0.03
-0.1
3**
0.06
-0.0
10.
03C
olle
ge-0
.09*
**0.
02-0
.09*
**0.
02-0
.08*
**0.
02-0
.07*
**0.
02-0
.06*
0.03
-0.0
7***
0.02
Log
Inco
me
-0.0
5***
0.01
-0.0
5***
0.01
-0.0
5***
0.01
-0.0
4***
0.01
-0.0
6***
0.02
-0.0
3***
0.01
Deb
t0.
12**
*0.
010.
11**
*0.
010.
11**
*0.
010.
11**
*0.
010.
13**
*0.
030.
12**
*0.
02Im
puls
ive
0.17
***
0.02
0.16
***
0.02
0.13
***
0.02
0.13
***
0.03
0.14
***
0.02
Org
anis
ed-0
.07*
**0.
01-0
.06*
**0.
01-0
.07*
*0.
03-0
.06*
**0.
01Liv
eTod
ay0.
10**
*0.
010.
06**
0.03
0.10
***
0.02
Lit
erat
e:42
0.00
0.03
Lit
erat
e:52
-0.0
8***
0.02
Lit
erat
e:62
-0.0
9***
0.02
N6,
518
6,51
06,
501
6,48
41,
413
5,04
3LR
chi2
892.
4610
14.5
610
46.3
011
00.7
022
8.13
904.
68P
rob
chi2
0.00
000.
0000
0.00
000.
0000
0.00
000.
0000
Pse
udo
R2
0.10
350.
1179
0.12
170.
1284
0.12
110.
1359
Not
es:
1M
argi
nalIm
pact
for
Age
sq.
issc
aled
upby
100;
2O
mit
ted
cate
gori
esfo
rdu
mm
yva
riab
les
are:
‘Sin
gle’
,‘No
Chi
ldre
n’,‘U
nem
ploy
ed’an
d‘3
orle
ssfin
anci
allit
erac
yqu
esti
ons
answ
ered
corr
ectl
y’.
***
Sign
ifica
ntat
1%le
vel;
**Si
gnifi
cant
at5%
leve
l;*
Sign
ifica
ntat
10%
leve
l.N
ote
that
the
log-
likel
ihoo
dan
dps
eudo
-R2
inco
lum
ns5
and
6ar
eno
tco
mpa
rabl
ew
ith
the
prev
ious
colu
mns
inth
ista
ble.

24ECBWorking Paper Series No 1303February 2011
The third column shows the results after inclusion of the second behavioural variable
capturing people who are organised with their money. These people are 7 per cent less
likely than disorganised individuals to experience financial distress. Again, the significance
and interpretation of the remaining variables in the regression does not change from the
results reported in the first and second columns.6
Column 4 shows the results when a measure of time preference is included in the regres-
sion. People who claim that they tend to live for today and let tomorrow take care of itself
are 10 per cent more likely to experience financial distress than those who have a preference
for the future. Impulsive people are still more likely than non-impulsive people to get into
financial trouble, while organised individuals are less likely than disorganised individuals
to experience financial distress. The inclusion of all three behavioural dummy variables
raises the pseudo-R2 from 0.104 to 0.128, suggesting that behavioural characteristics play
an important role in predicting financial problems.
One interesting pattern that emerges from Columns 2 to 4 (and which emerges from
other regressions not reported here) is the relative stability of the coefficients on the indi-
vidual behavioural variables. One might have expected that these variables could be highly
correlated, perhaps all proxying for some common behavioural trait such as “common
sense.” In that case, one might have expected the coefficients on the individual behavioural
characteristics to move around a lot and for there to have been limited additional explana-
tory power when new behavioural variables were added. In fact, each of these variables
adds to the fit of the model and the relative sizes of the individual coefficients are relatively
stable.
Irish Results: The results in Columns 1 to 4 are based on the pooled Irish and UK
samples. However, since the UK sample accounts for almost 80 per cent of the entire
sample, I also report the results based on the Irish sample only. The results, which are
reported in column 5 of Table 7, are broadly similar to those for the entire sample. In6The variable capturing people who are organised with their money is a triple interaction variable incor-
porating information on whether or not respondents agree with the statement on money organisation, if they
know how much money is available to them or how much money they owe and if they ever check account
statements or monitor their investments. The regression in re-run several times replacing the organisation
variable with each of its individual elements. The results suggest that the two most important elements are
whether or not the respondent agrees with the statement on money organisation and whether or not they
check statements and monitor their investments.

25ECB
Working Paper Series No 1303February 2011
particular, the results support the proposition that behavioural factors are important and
significant determinants of whether or not an individual experiences financial distress.
Financial Literacy: Finally, in the sixth column, I focus only on UK respondents and
assess the impact of being financially literate on the incidence of financial distress. Con-
trolling for all the demographic, income and behavioural factors already discussed, I find
that financially literate individuals in the sample are less likely than financially illiterate
individuals to experience financial distress. The results suggest that the greater the number
of questions answered correctly by respondents, the lower the probability that respondents
will have experienced financial distress. For example, the probability of getting into fi-
nancial difficulties is about 8 per cent lower for people who get five of the six questions
on financial literacy correct, relative to people answering three or less questions correct,
and this result is statistically significant.7 It is worth noting that the behavioural factors
remain significant in this regression while the size of the coefficients on two of the variables,
impulsiveness and time preference, are larger than those on the financial literacy variables.8
Summary: The analysis so far points to a number of key results:
1. Firstly, demographic and economic factors matter for financial distress. The effects
are as expected, and in line with the studies surveyed in Section 2. In particular,
relationship breakdown, having dependent children, being unemployed and having
outstanding debt all increase a person’s probability of getting into financial difficulties,
while a college education and higher income reduce the probability. The probability
of financial distress also increases with age, but only up until the late-30s, after which
point the probability falls.7I also run a regression where financial literacy is instead captured by dummy variables for each of the
six questions (where the dummy variable equals one if the respondent gets the question correct and zero
otherwise). The results, which are available from the author, show that an ability to distil information
from investment related graphs is most important (in terms of statistical significance) for whether or not a
respondent gets into financial difficulties.8Furthermore, I run a probit regression of financial distress on the financial literacy variables and the
remaining demographic and socio-economic variables (excluding the behavioural variables). The absolute
size of the marginal effects on the financial literacy variables are higher by about 2 percentage points. This
shows that a failure to account for behavioural factors over-estimates the importance of financial literacy
on the probability of getting into financial trouble.

26ECBWorking Paper Series No 1303February 2011
2. Secondly, the results show that behavioural characteristics matter. The behavioural
effects are economically large and add quite a bit to the fit of the model.
3. Finally, behaviour seems to be more important than financial literacy; being finan-
cially literate can reduce the probability of financial distress by up to 9 per cent,
while being patient can reduce it by 10 per cent. The effect of not being impulsive
is even larger. This is an important finding because it suggests that the recent drive
to improve financial literacy levels in the population may not be sufficient to prevent
financial difficulties. These efforts should be combined with tools to improve individ-
uals’ organisational skills and devices to, as much as is possible, minimise the impact
of behavioural and psychological traits on financial outcomes.
4.2 Do the Effects Differ by Degree of Struggle?
As discussed earlier, the dependent variable “Struggle to Keep Up” is constructed from
several responses to the question on how well people are keeping up with their bills and
credit commitments. These responses are mutually exclusive, suggesting that in addition
to examining the factors that cause people to get into financial difficulties, it is also possible
to examine if the effect of these factors differs by the degree of financial difficulty reported.
I therefore create a dependent variable “Degree of Struggle to Keep Up” (Y) which has four
outcomes, as follows:
Yi = 1, if “Falling behind with some/many.”
Yi = 2, if “Constant struggle.”
Yi = 3, if “Struggle from time-to-time.”
Yi = 4, if “No difficulties keeping up.”
I use a generalized ordered logit model to examine if the various effects of the demo-
graphic, economic and behavioural factors differ across these outcomes. This model, which
nests a number of more restrictive models such as the ordered logit model, is described in
detail in Williams (2006). 9,10 In the current context, the generalized ordered logit model9The ordered logit model is more restrictive because it imposes the parallel lines assumption, whereby
slope coefficients are deemed constant across the various outcomes of the ordered categorical dependent
variable. The generalized ordered logit model is able to nest this assumption for all or a subset of variables.10The model is implemented in Stata using the gologit2 command. The results reported here are based
on the final specification chosen by the ‘autofit’ option.
27ECB
Working Paper Series No 1303February 2011
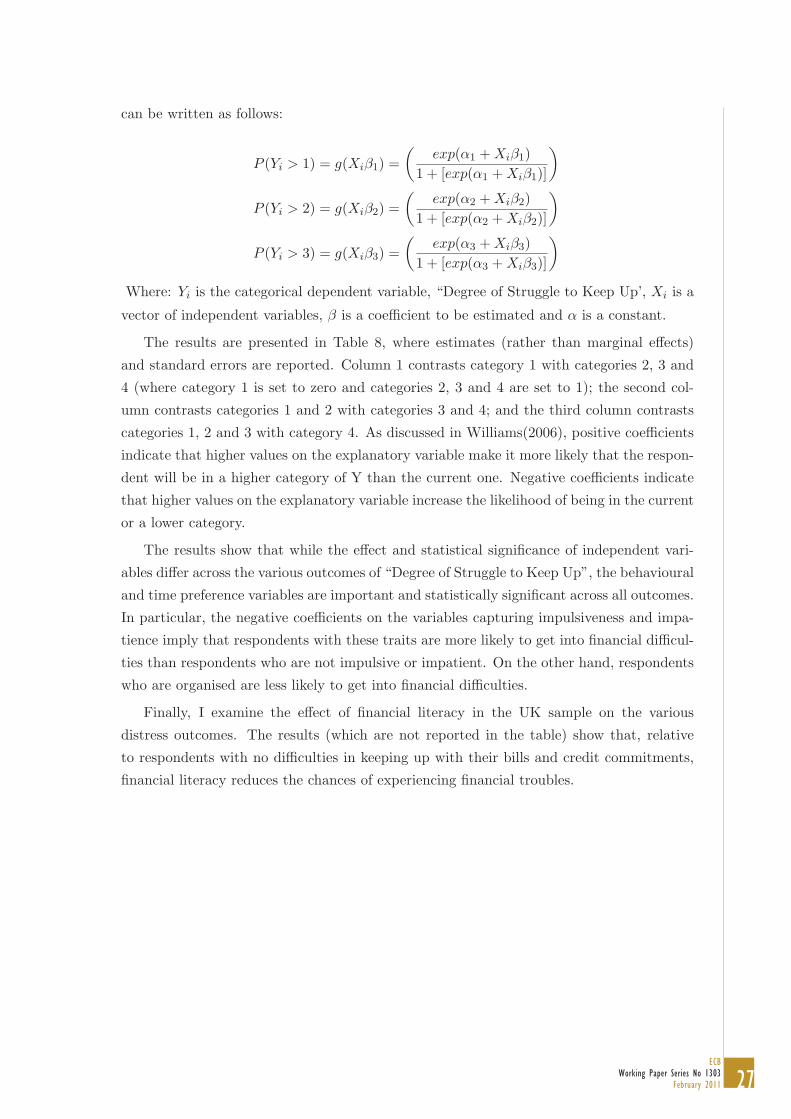
can be written as follows:
P (Yi > 1) = g(Xiβ1) =(
exp(α1 + Xiβ1)1 + [exp(α1 + Xiβ1)]
)
P (Yi > 2) = g(Xiβ2) =(
exp(α2 + Xiβ2)1 + [exp(α2 + Xiβ2)]
)
P (Yi > 3) = g(Xiβ3) =(
exp(α3 + Xiβ3)1 + [exp(α3 + Xiβ3)]
)
Where: Yi is the categorical dependent variable, “Degree of Struggle to Keep Up’, Xi is a
vector of independent variables, β is a coefficient to be estimated and α is a constant.
The results are presented in Table 8, where estimates (rather than marginal effects)
and standard errors are reported. Column 1 contrasts category 1 with categories 2, 3 and
4 (where category 1 is set to zero and categories 2, 3 and 4 are set to 1); the second col-
umn contrasts categories 1 and 2 with categories 3 and 4; and the third column contrasts
categories 1, 2 and 3 with category 4. As discussed in Williams(2006), positive coefficients
indicate that higher values on the explanatory variable make it more likely that the respon-
dent will be in a higher category of Y than the current one. Negative coefficients indicate
that higher values on the explanatory variable increase the likelihood of being in the current
or a lower category.
The results show that while the effect and statistical significance of independent vari-
ables differ across the various outcomes of “Degree of Struggle to Keep Up”, the behavioural
and time preference variables are important and statistically significant across all outcomes.
In particular, the negative coefficients on the variables capturing impulsiveness and impa-
tience imply that respondents with these traits are more likely to get into financial difficul-
ties than respondents who are not impulsive or impatient. On the other hand, respondents
who are organised are less likely to get into financial difficulties.
Finally, I examine the effect of financial literacy in the UK sample on the various
distress outcomes. The results (which are not reported in the table) show that, relative
to respondents with no difficulties in keeping up with their bills and credit commitments,
financial literacy reduces the chances of experiencing financial troubles.

28ECBWorking Paper Series No 1303February 2011
Table 8: Generalized Order Logit Results (Dependent Variable: ‘Degree of Struggle to
Keep Up’)
(1) (2) (3)
Degree of Falling Constant Struggle
Struggle Behind Struggle Time-to-Time
Estimate Std. Estimate Std. Estimate Std.
Error Error Error
Constant 4.18*** -0.42 1.95*** -0.36 0.16 -0.35
Male 0.01 -0.06 0.01 -0.06 0.01 -0.06
Age -0.09*** -0.01 -0.09*** -0.01 -0.09*** -0.01
Age sq. 0.00*** 0.00 0.00*** 0.00 0.00*** 0.00
Married 0.70*** -0.18 0.61*** -0.11 0.24*** -0.08
W/D/S -0.30*** -0.09 -0.30*** -0.09 -0.30*** -0.09
1 Child -0.34*** -0.08 -0.34*** -0.08 -0.34*** -0.08
2 Children -0.13 -0.22 -0.10 -0.13 -0.49*** -0.09
3+ Children -0.63*** -0.12 -0.63*** -0.12 -0.63*** -0.12
UK -0.49** -0.21 0.05 -0.11 0.13* -0.07
Employed 0.80*** -0.11 0.80*** -0.11 0.80*** -0.11
Retired 0.62*** -0.15 0.62*** -0.15 0.62*** -0.15
Inactive 0.24** -0.11 0.24** -0.11 0.24** -0.11
College 0.35 -0.24 0.64*** -0.14 0.34*** -0.08
Log Income 0.19*** -0.04 0.19*** -0.04 0.19*** -0.04
Debt -0.50*** -0.06 -0.50*** -0.06 -0.50*** -0.06
Impulsive -0.87*** -0.15 -0.50*** -0.09 -0.57*** -0.07
Organised 0.34*** -0.06 0.34*** -0.06 0.34*** -0.06
Live Today -0.90*** -0.17 -0.60*** -0.09 -0.41*** -0.06
N 6,484 6,484 6,484
LR chi2 1337 1337 1337
D.F. 30 30 30
Note: Omitted categories for dummy variables are: ‘Single’,‘No Children’ and‘Unemployed’.*** Significant at 1% level; ** Significant at 5% level; * Significant at 10% level.

29ECB
Working Paper Series No 1303February 2011
4.3 More Extreme Financial Distress
The results so far suggest that while demographic and economic factors are important
determinants of financial distress, behaviour and financial literacy also matter. However, I
now want to assess whether these results hold for people experiencing more extreme forms
of financial distress such as running out of money and going into arrears for 3 months or
more. To do this, I use two additional questions in the Financial Capability Survey as
follows:
(1) In the past 12 months, how often have you and your partner run out of
money before the end of the week or month? Would you say it was ...?
(2) Within the last five years, have you found yourself in financial difficulties?
By that I mean being three months or more behind with payments on your
regular commitments.
Based on the first of these questions, I create a dummy variable “Run out of money”
which is equal to one for those respondents who report that they run out of money always,
most of the time or sometimes, and equal to zero if respondents report that they hardly
ever or never run out of money. 30 per cent of the sample report that they run out of
money at least some of the time. I use the second question to create a dummy variable
“Arrears” that captures people who have gone into arrears on regular commitments for a
period of 3 months or more. 15 per cent of the sample falls into this category. I repeat the
empirical analysis using these two more extreme forms of financial distress as dependent
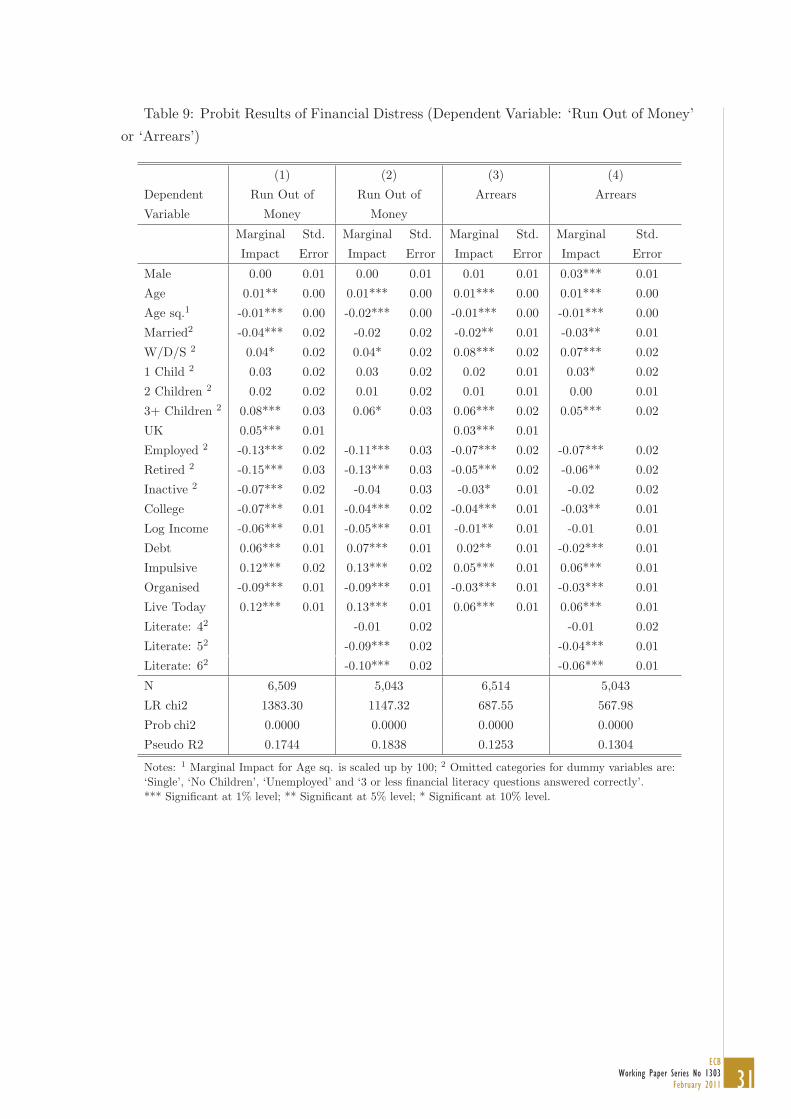
variables. The results are shown in Table 9.
In the first column of Table 9, I examine the impact of the various demographic, eco-
nomic and behavioural variables on the incidence of running out of money. While the
results are similar to the earlier findings, there are some differences. Firstly, having depen-
dent children increases the probability of running out of money, as before, but this time the
effect is marked and significant only for respondents with three or more children. Secondly,
the British respondents are now 5 per cent more likely than the Irish respondents to run
out of money, whereas they were less likely than the Irish respondents to struggle on a
day-to-day basis. Finally, an examination of the coefficients on the behavioural and time
preference variables suggests that these are again important and significant determinants
of financial distress. However, the results now point to a greater role for being organised
in preventing people from running out of money. Organised individuals are 9 per cent less

30ECBWorking Paper Series No 1303February 2011
likely than disorganised individuals to run out of money.
In the second column of Table 9, the results for the UK sample only are shown, where
the effect of financial literacy on financial distress is assessed. There are no major differences
in these results relative to the earlier findings; again being financially literate reduces the
probability of financial distress.
Next I re-run the regressions using “Arrears” as the dependent variable. In terms of
the significance of the various coefficients, the results are broadly similar to those shown
in the first column, though the coefficient sizes vary slightly. In particular, having three or
more dependent children increases the probability of falling into arrears while there is also
again a significant difference between the British and Irish respondents. The behavioural
and time preference traits again show up as having an important impact on the incidence
of financial distress, though the size of the coefficients on these variables is smaller than
with ‘milder’ forms of financial difficulties.
Finally, in column 4 the results for the UK sample are reported. Being financially
literate again reduces the probability of experiencing financial distress, in this case falling
into arrears, by up to 6 per cent.
31ECB
Working Paper Series No 1303February 2011
Table 9: Probit Results of Financial Distress (Dependent Variable: ‘Run Out of Money’
or ‘Arrears’)
(1) (2) (3) (4)
Dependent Run Out of Run Out of Arrears Arrears
Variable Money Money
Marginal Std. Marginal Std. Marginal Std. Marginal Std.
Impact Error Impact Error Impact Error Impact Error
Male 0.00 0.01 0.00 0.01 0.01 0.01 0.03*** 0.01
Age 0.01** 0.00 0.01*** 0.00 0.01*** 0.00 0.01*** 0.00
Age sq.1 -0.01*** 0.00 -0.02*** 0.00 -0.01*** 0.00 -0.01*** 0.00
Married2 -0.04*** 0.02 -0.02 0.02 -0.02** 0.01 -0.03** 0.01
W/D/S 2 0.04* 0.02 0.04* 0.02 0.08*** 0.02 0.07*** 0.02
1 Child 2 0.03 0.02 0.03 0.02 0.02 0.01 0.03* 0.02
2 Children 2 0.02 0.02 0.01 0.02 0.01 0.01 0.00 0.01
3+ Children 2 0.08*** 0.03 0.06* 0.03 0.06*** 0.02 0.05*** 0.02
UK 0.05*** 0.01 0.03*** 0.01
Employed 2 -0.13*** 0.02 -0.11*** 0.03 -0.07*** 0.02 -0.07*** 0.02
Retired 2 -0.15*** 0.03 -0.13*** 0.03 -0.05*** 0.02 -0.06** 0.02
Inactive 2 -0.07*** 0.02 -0.04 0.03 -0.03* 0.01 -0.02 0.02
College -0.07*** 0.01 -0.04*** 0.02 -0.04*** 0.01 -0.03** 0.01
Log Income -0.06*** 0.01 -0.05*** 0.01 -0.01** 0.01 -0.01 0.01
Debt 0.06*** 0.01 0.07*** 0.01 0.02** 0.01 -0.02*** 0.01
Impulsive 0.12*** 0.02 0.13*** 0.02 0.05*** 0.01 0.06*** 0.01
Organised -0.09*** 0.01 -0.09*** 0.01 -0.03*** 0.01 -0.03*** 0.01
Live Today 0.12*** 0.01 0.13*** 0.01 0.06*** 0.01 0.06*** 0.01
Literate: 42 -0.01 0.02 -0.01 0.02
Literate: 52 -0.09*** 0.02 -0.04*** 0.01
Literate: 62 -0.10*** 0.02 -0.06*** 0.01
N 6,509 5,043 6,514 5,043
LR chi2 1383.30 1147.32 687.55 567.98
Prob chi2 0.0000 0.0000 0.0000 0.0000
Pseudo R2 0.1744 0.1838 0.1253 0.1304
Notes: 1 Marginal Impact for Age sq. is scaled up by 100; 2 Omitted categories for dummy variables are:‘Single’, ‘No Children’, ‘Unemployed’ and ‘3 or less financial literacy questions answered correctly’.*** Significant at 1% level; ** Significant at 5% level; * Significant at 10% level.

32ECBWorking Paper Series No 1303February 2011
5 Reverse Causality?
The results above show that behavioural traits are an important determinant of who experi-
ences financial distress. However, if the behavioural traits are correlated with unobservables
that cannot be controlled for in the model, the measured effects might not be capturing the
true causal relationship between behavioural traits and financial distress. I consider this
issue for impulsiveness, which is the variable that has the largest effect in the probit re-
gressions. In this case, it might be argued that while impulsiveness increases the likelihood
of getting into financial difficulties, being in financial distress might cause respondents to
report that they’re impulsive. In order to assess this issue further, I employ instrumental
variable analysis.
The instrumental variable approach used here is motivated by Lusardi and Mitchell
(2007) who assess the effect of planning on net worth. In order to examine this issue, the
authors run a regression where net worth is the dependent variable and planning is one
of the independent variables in their model. In testing if reverse causality is a problem,
they run a ‘reverse’ regression where planning is the dependent variable and net worth is
one of the independent variables, and they instrument for net worth. Their results show
an insignificant coefficient on the instrumented net worth measure in their IV regression,
suggesting that reverse causality is not a problem and that their original results hold.
Following Lusardi and Mitchell’s methodology, I run a ‘reverse’ probit regression, where
impulsiveness is the dependent variable and independent variables include the same demo-
graphic and economic variables included in the previous models, plus the instrument for
financial distress - “Struggle to Keep Up”. I instrument for financial distress using infor-
mation on whether or not respondents have a long-standing illness. Twenty per cent of the
sample claim to have a long-standing illness.
The results are shown in Table 10. The IV regression shows no significant coefficient
on the financial distress variable, which would suggest that reverse causality in relation to
impulsiveness is not a problem in my regressions.11
11The first stage fit in the regression is good with the illness variable being statistically significant at the
1 per cent level.

33ECB
Working Paper Series No 1303February 2011
Table 10: IV Probit Results - Marginal Impact
Dependent Variable Impulsive
Instrumenting for:
Struggle to Keep Up 0.18
(Std. Error) (0.1989)
6 Conclusions
The number of people in financial difficulties is increasing and looks set to rise further in the
future. This is worrying, not only because of the implications for the individuals involved,
but also because these difficulties can result in enormous costs for the entire financial system.
In this context it is vital that we understand exactly why people get into financial trouble,
so that appropriate means of preventing people from getting into difficulties in the future
can be devised.
Using new nationally representative data from the Financial Capability Survey for the
UK and Ireland, I have shown that while demographic and economic variables are im-
portant determinants of who gets into financial difficulties, behavioural factors such as an
individual’s capacity for self-control, planning, and patience, also matter. This is an im-
portant result that has in general been neglected in most of the recent literature on the
causes of financial distress. It is important because it shows that policies to prevent people
getting into financial difficulties should not focus solely on improving financial literacy and
education levels, which also matter. Instead, these efforts should be combined with tools to
improve individuals’ organisational skills and devices to, as much as is possible, minimise
the impact of behavioural and psychological traits on financial outcomes.
There is a broad literature on measures that can be used to attempt to change or
overcome behaviour. Much of this literature suggests that de-biasing techniques which
encourage critical thinking, and commitment devices can be used for this purpose, (Shefrin
and Thaler (1988), Thaler and Benartzi (2004), Choi el at (2005), for example). However,
the evidence on the effect of such efforts in changing the impact of behaviour on financial
outcomes is thin. Examining this latter topic will be the next task for research in this area.
34ECBWorking Paper Series No 1303February 2011
References
[1] Ameriks, J., A. Caplin and J. Leahy (2003), “Wealth accumulation and the propensity
to plan”, The Quarterly Journal of Economics, Vol.118 (3), pp.1007-1047.
[2] Boheim, R. and M. Taylor (2000), “My home was my castle: evictions and repossessions
in Britain”, Journal of Housing Economics, Vol. 9, pp. 287-320.
[3] Burrows, R. (1997), “Who needs a safety-net? The social distribution of mortgage
arrears in England”, Housing Finance, Vol. 34, pp.17-24.
[4] Choi, J., D. Laibson and B. Madrian (2005), “Are empowerment and education
enough? Under-diversification in 401(k) Plans” Brookings Papers on Economic Ac-
tivity 2, pp.151-213.
[5] FSA (2006), “Financial capability baseline survey: methodological report”, Consumer
Research Report No. 47a, Financial Services Authority: UK.
[6] Groenland, E. and E.Nyhus, (1994), “Determinants of time preference, saving, and
economic behaviour. A comparison between Norway and The Netherlands”, Paper
prepared for IAREP/SABE conference. Erasmus University Rotterdam, July 10-13,
pp. 357-378.
[7] Groenland, E. and R. Wahlund (1996), “Household saving behaviour and financial
management”, Journal of Economic Psychology, Vol. 17, pp.669-675.
[8] Gunnarsson, J. and R. Wahlund (1993), “Household financial strategies: do they exist?
A report from an ongoing study in Sweden”, Paper prepared for the 18th Colloquium
of the IAREP, Moscow, 4-7 July.
[9] Keeney, M. and N. O’Donnell (2009), “Financial capability: new evidence for Ireland”,
Research Technical Paper, 1/RT/09, Central Bank and Financial Services Authority
of Ireland.
[10] Lea, S., P. Webley and C. Walker (1995), “Psychological factors in consumer debt:
money management, economic socialisation and credit use”, Journal of Economic Psy-
chology, Vol. 16, pp. 681-701.

35ECB
Working Paper Series No 1303February 2011
[11] Livingstone, S. and P. Lunt (1992), “Predicting personal debt and debt repayment:
psychological, social and economic determinants”, Journal of Economic Psychology,
Vol. 13, pp.111-134.
[12] Lusardi, A. and O. Mitchell (2007), “Baby boomer retirement security: the roles of
planning, financial literacy and housing wealth”, Journal of Monetary Economics, Vol.
54, pp.205-224.
[13] Lusardi, A. and P. Tufano (2009), “Debt literacy, financial experiences and overindebt-
edness”, NBER working paper, no.14808.
[14] O’Donnell, N. (2009), “Consumer financial capability: a comparison of the UK and
Ireland”, Research Technical Paper, 4/RT/09, Central Bank and Financial Services
Authority of Ireland.
[15] Pechmann, C., L. Levine, S. Loughlin and F. Leslie (2005), “Impulsive and Self-
Conscious: Adolescents’ Vulnerability to Advertising and Promotion”, Journal of Pub-
lic Policy and Marketing, Vol.24(2), pp.202-221.
[16] Shefrin, H. and R. Thaler (1988), “The behavioural life-cycle hypothesis”, Economic
Inquiry, Vol.26, pp.609-643.
[17] Stango, V. and J. Zinman (2010), “Exponential Growth Bias and Household Finance”,
forthcoming, Journal of Finance.
[18] Thaler, R. and S. Benartzi (2004), “Save more tomorrow: Using behavioural economics
to increase employee savings”, Journal of Political Economy, Vol.112(1), pp.164-187.
[19] Walker, C. (1996), “Financial management, coping and debt in households under fi-
nancial strain”, Journal of Economic Psychology, Vol. 17, pp.789-807.
[20] Williams, R. (2006), “Generalized Ordered Logit/ Partial Proportional Odds Models
for Ordinal Dependent Variables”, The Stata Journal, 6(1):58-82.

Work ing PaPer Ser i e Sno 1118 / november 2009
DiScretionary FiScal PolicieS over the cycle
neW eviDence baSeD on the eScb DiSaggregateD aPProach
by Luca Agnello and Jacopo Cimadomo