behavioural study on - european commission
TRANSCRIPT

LE Europe VVA Europe Ipsos ConPolicy Trinomics
October 2018
Justice
and Consumers
Behavioural Study on Consumersrsquo Engagement in
the Circular Economy
Final Report
October 2018
Specific contract ndash No 2016 85 06
Implementing Framework Contract ndash
CHAFEA2015CP01LE
Behavioural Study on Consumersrsquo Engagement in the Circular Economy
EUROPEAN COMMISSION
Directorate-General for Justice and Consumers
Directorate E - Consumers
Unit E1 - Consumer Policy
Contact Jeroen Van Laer
E-mail JeroenVAN-LAEReceuropaeu
European Commission B-1049 Brussels
EUROPEAN COMMISSION
Directorate-General for Justice and Consumers
2018
Behavioural Study on Consumersrsquo Engagement in
the Circular Economy Final Report
Prepared by LE Europe VVA Europe Ipsos ConPolicy
and Trinomics
October 2018
EUROPEAN COMMISSION
Directorate-General for Justice and Consumers
2018
Authors
Dr Annette Cerulli-Harms (LE Europe)
James Suter (LE Europe)
Wouter Landzaat (LE Europe)
Dr Charlotte Duke (LE Europe)
Adriana Rodriguez Diaz (VVA Europe)
Lucas Porsch (VVA Europe)
Timotheacute Peroz (VVA Europe)
Dr Sara Kettner (ConPolicy)
Prof Dr Christian Thorun (ConPolicy)
Katarina Svatikova (Trinomics)
Jurgen Vermeulen (Trinomics)
Tycho Smit (Trinomics)
Femke Dekeulenaer (Ipsos)
Elena Lucica (Ipsos)
We would like to acknowledge the useful guidance and input provided during this
research by Prof Lucia Reisch (Copenhagen Business School) Prof Bodo Sturm (Leipzig
University of Applied Sciences) and Marta Ballesteros (Milieu Law amp Policy Consulting)
We furthermore acknowledge the helpful guidance received from the European
Commission departments involved such as Justice and Consumers Environment and the
Joint Research Centre (especially unit JRC I2 Foresight Behavioural Insights and Design
for Policy) We would also like to thank all the interviewed stakeholders for their
informative responses
Behavioural Study on Consumersrsquo Engagement in the Circular Economy
5
ldquoThis report was produced under the Consumer Programme (2014-2020) in the frame of a contract with CHAFEA acting on behalf of the European Commission The content of this report represents the views of LE Europe VVA Europe Ipsos ConPolicy Trinomics and is its sole responsibility it can in no way be taken to reflect the views of the European Commission andor CHAFEA do not guarantee the accuracy of the data included in this report nor do they accept responsibility for any use made by third parties thereofrdquo
More information on the European Union is available on the Internet (httpeuropaeu)
Luxembourg Publications Office of the European Union 2018
copy European Union 2018
Reproduction is authorised provided the source is acknowledged
PRINTED IN
PRINTED ON ELEMENTAL CHLORINE-FREE BLEACHED PAPER (ECF)
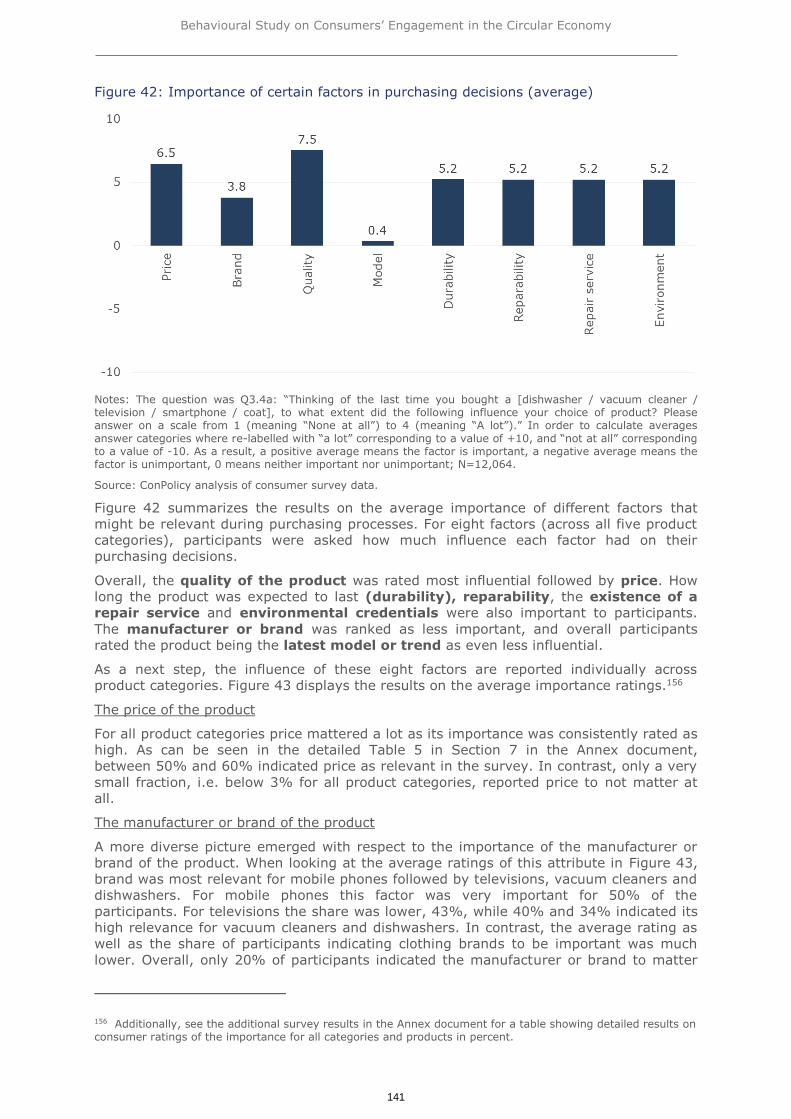
PRINTED ON TOTALLY CHLORINE-FREE BLEACHED PAPER (TCF)
PRINTED ON RECYCLED PAPER
PRINTED ON PROCESS CHLORINE-FREE RECYCLED PAPER (PCF)
Europe Direct is a service to help you find answers
to your questions about the European Union
Freephone number ()
00 800 6 7 8 9 10 11
() The information given is free as are most calls (though some operators phone boxes or hotels may charge you)
Project Number 20183140
Title Behavioural Study on Consumers Engagement in the Circular Economy - Final report
Linguistic version
MediaVolume Catalogue number ISBN DOI
EN PDF PDFVolume_01 EB-04-18-498-EN-N 978-92-9200-885-7 102818956512
Behavioural Study on Consumersrsquo Engagement in the Circular Economy
6
TABLE OF CONTENTS
EXECUTIVE SUMMARY 9
1 INTRODUCTION AND BACKGROUND 14
11 Policy context 14
12 Objectives of the study 16
METHODOLOGY 18
2 METHODOLOGY 19
21 Country selection 19
22 Product selection 21
23 Methodology for the literature review and desk research 22
24 Methodology for the stakeholder interviews 23
25 Methodology for the focus groups 26
26 Methodology for the consumer survey 27
27 Methodology for the behavioural experiment 30
EVIDENCE AND FINDINGS 46
3 CONSUMERSrsquo WILLINGNESS TO ENGAGE IN THE CIRCULAR ECONOMY 47
31 Evidence from the literature and data collection 48
32 Evidence from the stakeholder interviews 51
33 Evidence from the focus groups 53
34 Evidence from the consumer survey 55
4 DRIVERS BARRIERS AND TRADE-OFFS FACED BY CONSUMERS 65
41 Evidence from the literature and data collection 68
42 Evidence from the stakeholder interviews 74
43 Evidence from the focus groups 78
44 Evidence from the consumer survey 81
45 Evidence from the behavioural experiment 95
5 CONSUMERSrsquo AWARENESS UNDERSTANDING AND EXPECTATIONS ON DURABILITY AND REPARABILITY 110
51 Evidence from the literature and data collection 112
52 Evidence from the stakeholder interviews 114
53 Evidence from the focus groups 116
54 Evidence from the consumer survey 118
6 DURABILITY AND REPARABILITY INFORMATION AND ITS POTENTIAL ROLE IN CONSUMERSrsquo DECISION-MAKING 128
61 Evidence from the literature and data collection 130
62 Evidence from the stakeholder interviews 136
63 Evidence from the focus groups 138
64 Evidence from the consumer survey 140
65 Evidence from the behavioural experiment 155
CONCLUSIONS AND SUGGESTIONS FOR FUTURE POLICY ACTION 173
7 OVERALL CONCLUSIONS 174
71 Understanding consumer engagement in the Circular Economy 175
72 Factors influencing consumer decision-making in the Circular Economy 177
8 SUGGESTIONS FOR FUTURE POLICY ACTION 183
81 Boosting CE engagement by strengthening pro-environmental attitudes and awareness 184
82 The importance of price quality and convenience in purchasing and repair decisions 186
Behavioural Study on Consumersrsquo Engagement in the Circular Economy
7
83 Enhancing product information on durability and reparability 188
84 Suggestions for further research 189
GLOSSARY AND DEFINITIONS 192
BIBLIOGRAPHY 194
Behavioural Study on Consumersrsquo Engagement in the Circular Economy
9
Executive summary
Objectives
In 2017 LE Europe VVA Ipsos ConPolicy and Trinomics were commissioned by the
European Commission to conduct a behavioural study on consumersrsquo engagement in the
Circular Economy (CE) The objective was to provide policy-relevant insights to assist
with the implementation of the EU Circular Economy Action Plan
The study sought to
1 Identify barriers and trade-offs faced by consumers when deciding whether to
engage in the CE in particular whether to purchase a more or a less durable
good whether to have a good repaired or to discard it and buy a replacement
2 Establish the relative importance of economic social and psychological factors
that govern the extent to which consumers engage in the CE especially
purchasing durable products and seeking to repair products instead of disposing of
them and
3 Propose policy tools to enable and encourage consumers to engage in CE practices
related to durability and reparability
Methodology
The study mainly focussed on the following five products vacuum cleaners
televisions dishwashers smartphones and clothes
A systematic literature review was carried out across all 28 EU Member States
Norway Iceland Switzerland Japan Canada and the USA1 This review was
complemented by insights collected through 50 interviews with stakeholders from
eg business and consumer associations NGOs public authorities and academia and
consumer focus groups with the general public and potentially vulnerable consumer
groups in 4 countries2 These activities contributed towards the results of the study and
informed the design of an online consumer survey and behavioural experiment
conducted in respectively 12 and 6 countries with 12064 and 6042 respondents who
were representative of the general population for each country in terms of age gender
and geographic region3
The survey collected information on consumersrsquo experiences with CE practices such as
repairing renting leasing and purchasing second hand products their reasons behind
engaging in the CE (or not) as well as general socio-demographic characteristics and
self-declared attitudes towards the CE
The behavioural experiment contained two tasks a purchasing and a repair experiment
Both experiment tasks were financially incentivised for enhanced realism and external
validity
The purchasing experiment tested different forms of durability and reparability
information and their effects on consumersrsquo product choices The following treatments
were tested lsquomanufacturer warrantiesrsquo and lsquoexpected lifetimersquo claims durability
commitments and reparability ratings included in the EU Energy and Ecolabels using
novel icons4 Additionally the effects of behaviourally motivated lsquonudgesrsquo via claims such
1 Literature was reviewed in English German (AT DE) Czech French (FR LU BE) Hungarian Dutch (NL BE) Romanian and Spanish
2 Two groups were conducted in each of CZ DE IE and SE One group was held with participants from the general public the other with potentially vulnerable consumers (people who struggle or are in arrears with bills and are unemployed retired long-term sick or disabled or single parents)
3 The online consumer survey was conducted in AT CZ FR DE HU IE LV NL PT RO ES and SE The behavioural experiment was embedded in the survey in CZ DE IE RO ES and SE
4 lsquoManufacturer warrantyrsquo and lsquoExpected lifetimersquo were not explained or defined further in the experiment
Behavioural Study on Consumersrsquo Engagement in the Circular Economy
10
as lsquoProducts that last longer may save you money over timersquo and lsquoA majority of people
choose products that last longer and are easier to repairrsquo were tested
The repair experiment confronted respondents with a broken product for which they
could decide whether to have it repaired or to replace it with either a brand new or
second hand product The experimental conditions tested how the trade-offs between
repairing and replacing were affected by a real effort task which increased the effort
required to respectively repair or replace and framing effects of the repair option
Behavioural experiments allow the isolation of the drivers of consumer choice and are
widely used by policy makers internationally to test information provision on consumer
decision-making Experiments are necessarily simplifications of the real world as such
the findings of the experiment should be viewed in conjunction with the experimental
set-up which consisted of a simplified process with streamlined and standardised product
information
Findings and conclusions
In brief all strands of research found that consumers were generally willing to engage
in CE practices But actual engagement was rather low While a majority of
consumers repair products (64) a substantial share have not repaired products in
the past (36) andor have no experience rentingleasing or buying second hand
products (~90) A reason for this low engagement in CE practices could be that
consumers lack information regarding product durability and reparability as well as
the lack of sufficiently developed markets (eg for second hand products renting
leasing or sharing services etc) In the behavioural experiment the provision of such
information was found to be highly effective at shifting purchasing decisions
towards products with greater durability and reparability The survey and experiment
also found that repair decisions are easily disrupted if arranging repair requires
effort These findings indicate that there is a large potential to close the gap between
consumersrsquo willingness to engage and their actual engagement
Understanding consumer engagement in the Circular Economy
Survey respondents reported that they keep things they own for a long time (93)
recycle unwanted possessions (78) and repair possessions if they break (64) A
minority yet still sizable share (10-25) of survey respondents were interested in
engaging with novel CE practices such as leasing products instead of purchasing them
The study uncovered a high level of consistency between self-reported pro-CE
attitudes in the survey and actual behaviour in the monetarily incentivised
behavioural experiment Consumers who self-claimed having pro-CE attitudes were
also more likely to repair products in the experiment or to buy second hand rather than
brand new products
The different research methods showed that interest in product durability and
reparability was generally higher for large and expensive products (eg white
goods) and slightly lower for fashion items (eg clothes smartphones) For fashion
products there was however a higher willingness to buy second hand (clothes
smartphones) or to rent or lease such products (smartphones)
Consumer expectations and experiences with durability and reparability
All research methods found that consumers most associate durability with product
quality and reparability was most associated with availability of spare parts
Reparability was throughout the study found to be less important to consumers than
durability According to the survey this is because consumers trust manufacturer
warranties and would not expect durable products to break
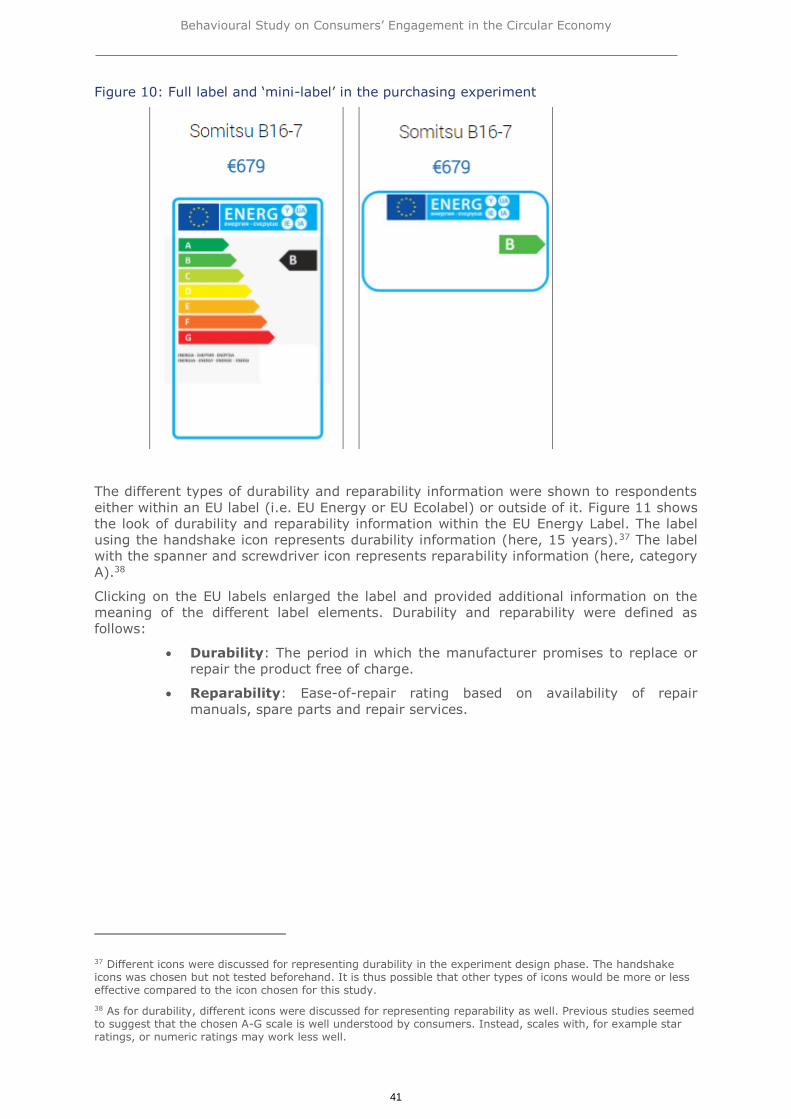
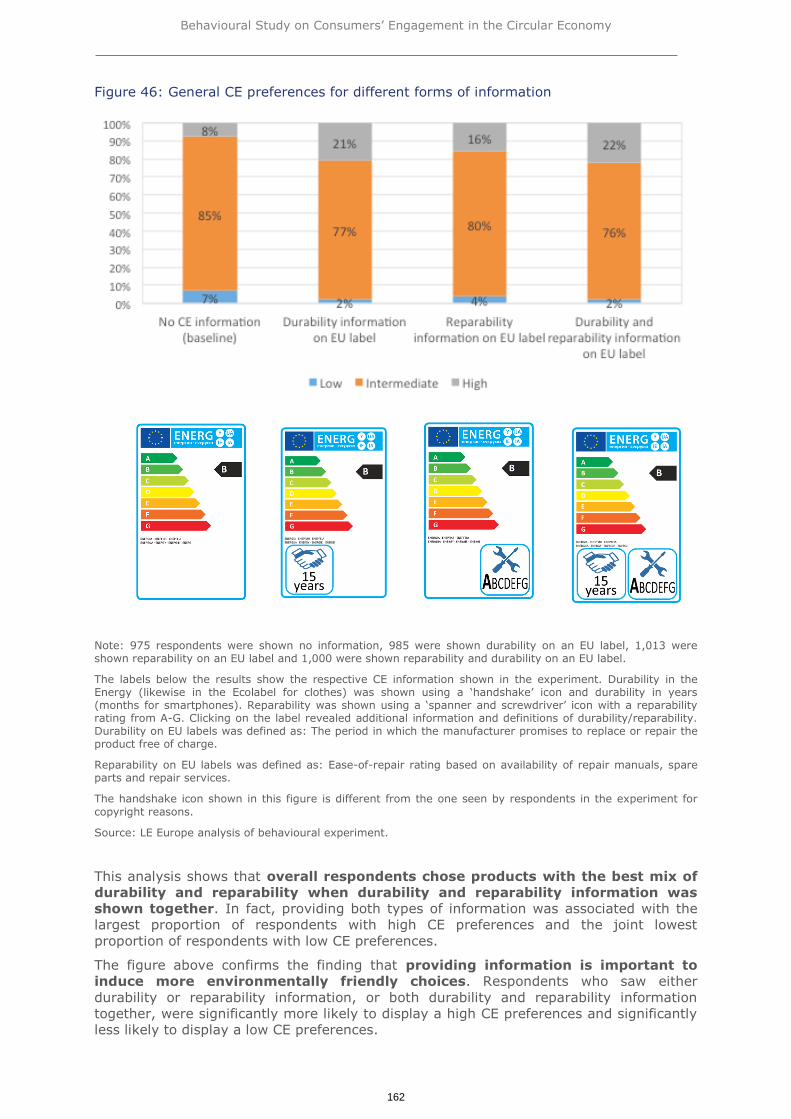
Durability on EU labels was defined as The period in which the manufacturer promises to replace or repair the product free of charge
Reparability on EU labels was defined as Ease-of-repair rating based on availability of repair manuals spare parts and repair services
Behavioural Study on Consumersrsquo Engagement in the Circular Economy
11
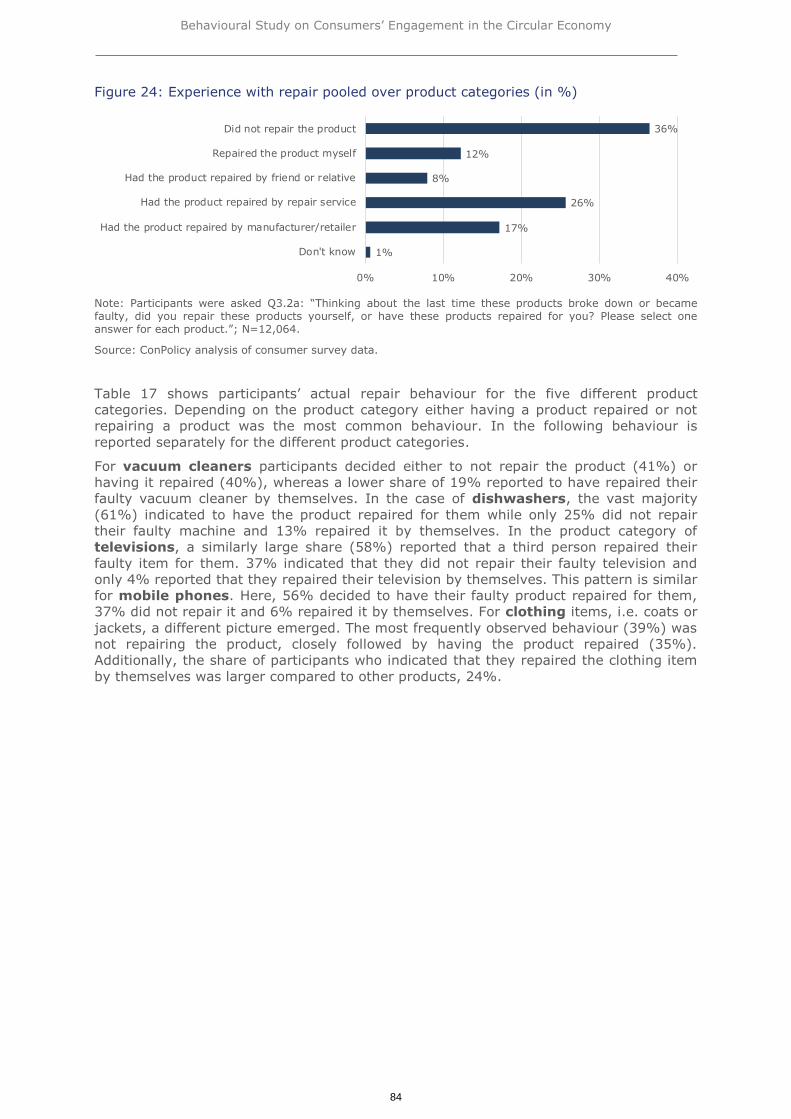
The study did not find overwhelming evidence of a lsquothrowaway economyrsquo Across all
products a majority of survey respondents (~60) reported having repaired
products in the past Repairs were mostly done by professionals (26 repair services
17 manufacturers) but to some extent also by friendsfamily (8)) Self-repair was
less frequent but still substantial especially for clothes (12) Overall people were
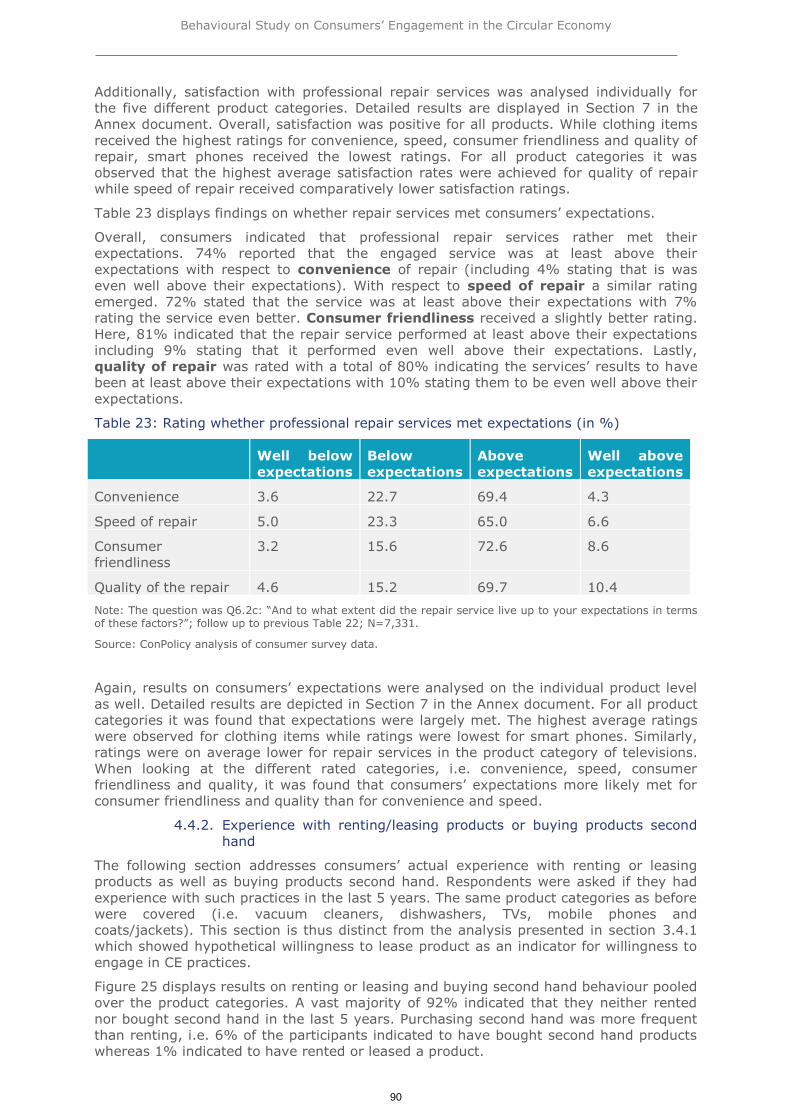
happy with professional repair services Over 70 had their expectations in terms of
convenience speed quality and friendliness of the repair met or even exceeded
These findings seem to dispel perceptions that consumers are marked by negative
experiences with repair services which were reported by several stakeholders
A joint analysis of the behavioural experiment and survey revealed that consumers who
have received durability information via manufacturer warranties or durability
promises at the point of sale in a purchasing exercise were significantly more likely
to expect free replacement or free repairs of faulty products Instead those who
had not seen such information were significantly less likely to expect free repairs or
replacements and instead expected to pay for these services
Drivers barriers and trade-offs faced by consumers
It emerged clearly from the different strands of research that the price-quality ratio is
the most important driver and simultaneously barrier for consumer engagement in
the CE followed by convenience Many consumers were willing to pay more for
products with better durability and reparability but can be persuaded by low prices to
disregard CE credentials Similarly when replacement is more convenient than repairing
consumers are easily led to purchase new products This was especially pronounced for
consumers with a preference for new trends and technology However only about one in
ten consumers in the survey reported having strong preferences for new trends and
technology
The study found that repairing is popular but not ubiquitous Most consumers who did not
repair expected repairs to be too expensive (25-50 across products) preferred getting
a new product (17-25) or felt the old product was obsolete or out of fashion (20-
30) Some (5-10) however felt they did not know howwhere to repair products or
that it would be too much effort to repair (8-14)
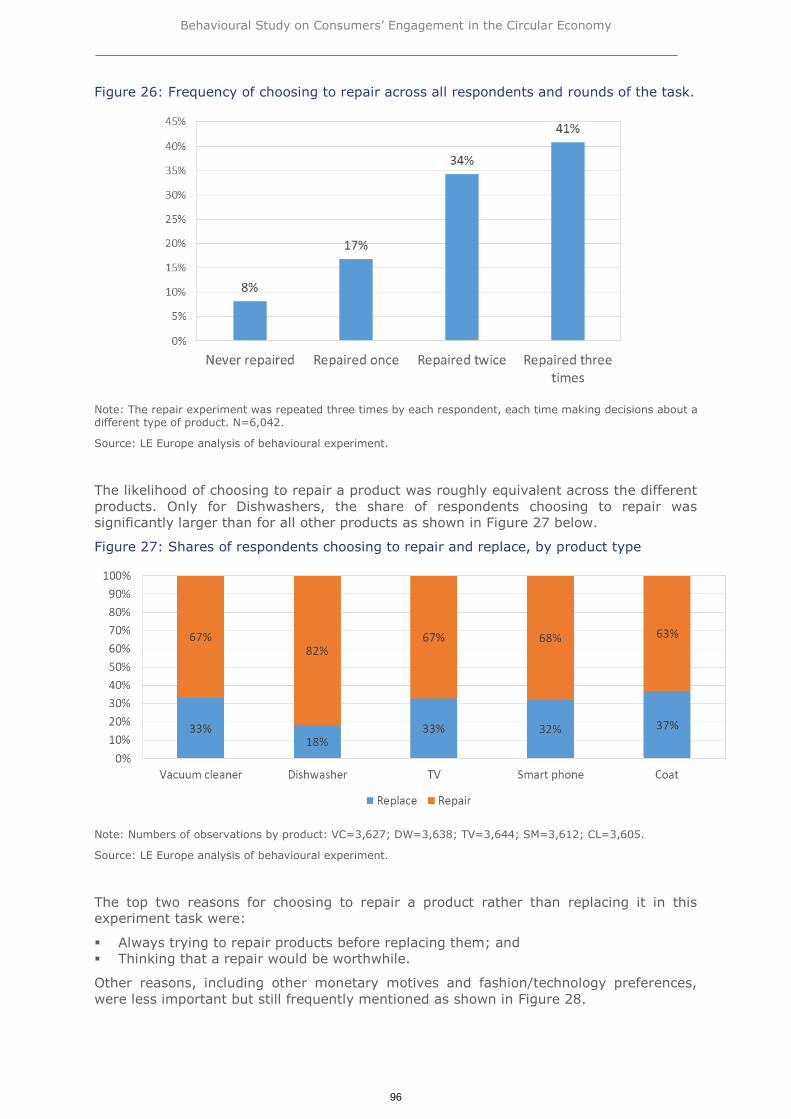
In the online behavioural experiment 62-83 (depending on the product type) of
respondents chose to repair rather than replace products But repairs became less
frequent when additional effort was required to arrange the repair while an identical
level of effort left motivations to replace products unaffected Beyond convenience
marketing practices which increase the salience of repair had only a limited effect on
consumer decisions in the experiment Moreover consumers in the experiment were
indifferent to use repair services offered by manufacturers or independent repair shops
Effects of product information on purchasing decisions
Many consumers claimed they were aware of the durability and reparability of
products they had purchased yet the study uncovered that CE product information
(ie information on durability and reparability of products) was in fact difficult to find
and consumers wanted to receive better information
Evidence from the literature review stakeholder interviews focus groups and
experiment showed that improved information provision at the point of purchase (eg on
EU labels or provided by manufacturers) was effective at promoting CE behaviours
amongst consumers When respectively durability or reparability information was
provided in the experiment consumers were almost three times more likely to
choose products with the highest durability on offer and more than two times
more likely to choose products with the highest reparability ratings General CE
preferences were strongest when durability and reparability information was presented
together That is when durability and reparability information was shown together on the
product label individuals were most likely to purchase products which rated highly in
both dimensions ndash durability and reparability Durability was again clearly the more
influential factor These shifts in product choice resulted from consumers turning away
from low durabilityreparability products in favour of those with better CE credentials
Behavioural Study on Consumersrsquo Engagement in the Circular Economy
12
These findings are corroborated by consumersrsquo significant willingness-to-pay for
better durabilityreparability for all product categories Depending on how
durabilityreparability information was presented willingness-to-pay for an additional
year of durability ranged between euro20-36 for vacuum cleaners and dishwashers euro92-148
for TVs euro148-217 for smartphones5 and euro14-27 for coats Willingness-to-pay for an
improved reparability6 rating was around euro29-54 for vacuum cleaners euro83-105 for
dishwashers euro77-171 for TVs euro48-98 for smartphones and euro10-30 for coats
lsquoNudgesrsquo informing consumers of the benefits and social norms of buying
durablerepairable products increased the saliency of CE characteristics and triggered
shifts in preferences towards more durablerepairable products
Suggestions for future policy action
The study makes recommendations as outlined below to further enhance consumer
engagement in the CE
Recommendation 1 ndash Boosting CE engagement by strengthening pro-environmental
attitudes and awareness Environmental awareness and positive attitudes towards
environmentally favourable practices like buying second hand products and repairing
products were found to be key determinants for sustainable consumer choices From
the study follow at least three specific areas of action which could be taken by policy
makers and industry
o Boosting pro-environmental attitudes One way this could be done is by
focussing on educating young people by for example including
environmental awareness education within school curricula
o Increasing consumer awareness of second hand rentingleasing and repair
markets Recently there has been an increase in the number of CE
initiatives such as repair cafeacutes Similar initiatives could be promoted for
second hand products renting leasing of products
o Promoting benefits of durability and reparability According to the study
findings it would be beneficial to link durable and easily repairable products
with lsquohigh-qualityrsquo and lsquocost-savingsrsquo in the long-term Instilling such
associations with durability and reparability could alter social norms
towards the purchase of more durable and more easily repairable products
Recommendation 2 ndash Making repair easier Consumers are generally willing to
repair broken products yet their intentions can easily be tainted if repair is viewed as
too much effort compared to simply replacing the product Repair could be made
easier for example by
o Making essential product components replaceable by consumers
o Including repair instructions for minor defects in user manuals o Ensuring the availability of spare parts in the longer run For example by
requiring manufacturers to provide spare parts for a defined time period
(and also after a product has been discontinued)
o Encouraging manufacturers to offer a commitment to repair Commitments
could function in a similar way to manufacturer guarantees The study
found consumers have high trust in these guarantees and they are more
likely to seek repair of a product if it is covered by guarantee
Recommendation 3 ndash Create financial incentives for reparability and durability
Building on the importance of price in consumer decision-making fiscal instruments
providing economic incentives to producers and consumers to produce and
5 Willingness-to-pay for additional durability of smartphones was measured in months and subsequently extrapolated to years A linear relationship between time and willingness-to-pay was assumed (ie each extra month has the same value)
6 The willingness-to-pay was measured per year for durability and per two-step increase on the A-G scale for reparability(eg from G to E C to A)
Behavioural Study on Consumersrsquo Engagement in the Circular Economy
13
purchaserentlease durable products or to repair could enhance CE engagement
However further consumer research would be required to determine if there is
sufficient price sensitivity in consumers for such stimuli to be effective
Recommendation 4 - Making durability and reparability information available at the
point of sale The study showed that consumers lack durability and reparability
information and that the provision of such information is potentially very influential on
purchasing decisions Therefore the following options should be explored
o Integrate durability and reparability information into existing (EU) labels
o Develop new EU rules for this purpose
o Examine the development of a scoring system for reparability of products7
o Provide information to consumers on the availability of spare parts and
repair services
Recommendation 5 ndash Strengthened enforcement of legislation requiring the
provision of accurate information to consumers The provision of information not
only needs to be presented in a way that consumers can understand and effectively
use in their decision-making but it also needs to be accurate In order to ensure the
accurate provision of information to consumers at the point of sale continued and
strengthened enforcement of national consumer laws (such as on unfair commercial
practices) is of great importance to support consumers in their choices surrounding
engagement in the Circular Economy
7 For more information see httpsusprocjrceceuropaeuScoringSystemOnReparabilityindexhtml
Behavioural Study on Consumersrsquo Engagement in the Circular Economy
14
1 Introduction and background
The purpose of this behavioural study on consumersrsquo engagement in the Circular
Economy was to provide policy-relevant insights to assist with the implementation of the
EU Circular Economy Action Plan especially an analysis of options and actions for a more
coherent policy framework for the different work elements in the area of EU product
policy in their contribution to the Circular Economy In particular the study informed the
durability and reparability aspects of the Ecodesign and Energy Labelling framework (as
set out in the Ecodesign Working Plan 2016-2019)
11 Policy context
Action on the circular economy ties in closely with key EU priorities including jobs and
growth the investment agenda climate and energy the social agenda and industrial
innovation and with global efforts on sustainable development8 Although the European
commitment to a transition to the Circular Economy is relatively recent it is now
regarded as an essential contribution to the EUrsquos efforts to develop a sustainable low
carbon resource efficient and competitive economy9 Transition to a Circular Economy in
the EU was first promoted in a European Commission Communication ldquoTowards a
Circular Economyrdquo (COM2014398) in 2014
This was followed by the adoption of an ambitious Circular Economy Package in
December 2015 containing various elements to stimulate Europes transition towards a
Circular Economy with resources used in a more sustainable way including revised
legislative proposals on waste and a comprehensive action plan ldquoClosing the loop - An EU
action plan for the Circular Economyrdquo (COM20150614 Final) The proposed plans and
actions are expected to contribute to ldquoclosing the looprdquo of product lifecycles through
greater recycling and re-use while also fostering energy saving and reducing greenhouse
gas emissions
The Circular Economy Package established a clear long-term vision to increase recycling
and reduce landfilling while proposing concrete measures to address obstacles on the
ground to improve waste management and taking into account the different situations
across Member States The following are relevant in this regard10
Directive of The European Parliament and of The Council amending Directive
200898EC on Waste11
Proposed Directive on the landfill of waste (amending Directive 199931EC)12
Proposed Directive on packaging and packaging waste (amending Directive
9462EC)13
Directive on end-of-life vehicles on batteries and accumulators and waste batteries
and accumulators and on waste electrical and electronic equipment (amending
Directives 200053EC 200666 and 201219EU)14
The EU Action Plan for the Circular Economy15 establishes a concrete and ambitious
programme of action with measures covering the whole cycle from production and
8 COM20150614
9 European Commission Communication Towards a Circular Economy (COM2014398) in 2014
10 httpwwweuroparleuropaeuEPRSEPRS-Briefing-573936-Circular-economy-package-FINALpdf
11 httpseur-lexeuropaeulegal-contentENTXTPDFuri=CONSILPE_11_2018_REV_2ampfrom=EN
12 httpseur-lexeuropaeulegal-contentENTXTPDFuri=CELEX52015PC0594ampfrom=EN
13 httpseur-lexeuropaeuresourcehtmluri=cellarb68494d2-999f-11e5-b3b7 01aa75ed71a1001902DOC_1ampformat=PDF
14 httpwwweuroparleuropaeusidesgetDocdopubRef=-EPTEXT+TA+P8-TA-2018-
0113+0+DOC+XML+V0ENamplanguage=ENBKMD-9
15 European Commission Communication Closing the loop - An EU action plan for the Circular Economy (COM20150614 Final)
httpeur-lexeuropaeulegal-contentENTXTuri=CELEX52015DC0614
Behavioural Study on Consumersrsquo Engagement in the Circular Economy
15
consumption to waste management and the market for secondary raw materials An
annex to the Action Plan sets out the timeline of when the actions will be completed By
stimulating sustainable activity in key sectors and new business opportunities the Action
Plan is believed to help to unlock the growth and jobs potential of the Circular Economy
The transition to a Circular Economy will be supported financially by ESIF funding euro650
million from Horizon 2020 (the EU funding programme for research and innovation) euro55
billion from structural funds for waste management and investments in the circular
economy at national level16
One relevant initiative in the Action Plan timetable17 in the context of this study is to
ldquoexamine options and actions for a more coherent policy framework of the different
strands of work of EU product policy in their contribution to the circular economyrdquo
scheduled for 2018 According to the Action Plan EU product policy includes ldquoEcodesign
Energy Labelling Ecolabel Green Public Procurement and other relevant product
legislationrdquo Therefore some relevant legislation pertinent to the present study
includes18
Energy Labelling Regulation (repealing Directive 201030EU)19
Regulation on the EU Ecolabel (Regulation (EC) No 662010)20
Ecodesign Directive (Directive 2009125EC)21
Energy Efficiency Directive (Directive 201227EU)22
Further legislation relating to Green Public Procurement23
Legislation on waste from consumer goods24 including the proposed directives
mentioned above
Of particular relevance is the Energy Labelling Regulation which in addition to revising
the energy efficiency scale to a scale of A to G also includes for the majority of product
groups the absolute energy consumption in order to assist consumers to understand the
impact on energy bills The regulation also states
ldquoThe Commission should provide a long-term working plan for the revision of labels for
particular energy-related products including an indicative list of further energy-related
products for which an energy label could be established The working plan should be
implemented starting with a technical environmental and economic analysis of the
product groups concerned That analysis should also look at supplementary information
including the possibility and cost of providing consumers with information on the
performance of an energy-related product such as its energy consumption durability or
environmental performance in coherence with the objective to promote a circular
economy Such supplementary information should improve the intelligibility and
effectiveness of the label towards consumers and should not lead to any negative impact
on consumersrdquo (Clause 39)
Most recently the Commission published in early 2018 its report on the implementation
of the Circular Economy Action Plan25 which presents an overview of actions already
16 European Commission press release of 2 December 2015 httpeuropaeurapidpress-release_IP-15-
6203_enhtm
17 httpeur-lexeuropaeuresourcehtmluri=cellar8a8ef5e8-99a0-11e5-b3b7-
01aa75ed71a1001202DOC_2ampformat=PDF
18 Further relevant legislation might include Directive 200933EC on the promotion of clean and energy-
efficient road transport vehicles and Regulation (EC) No 1062008 on energy-efficiency labelling of office equipment
19 httpseur-lexeuropaeulegal-contentENTXTPDFuri=CELEX32017R1369ampfrom=EN
20 httpeur-lexeuropaeulegal-contentENTXTuri=CELEX32010R0066
21 httpeur-lexeuropaeulegal-contentENTXTuri=CELEX02009L0125-20121204
22 httpeur-lexeuropaeulegal-contentENTXTuri=CELEX32012L0027
23 httpeceuropaeuenvironmentgppeu_related_enhtm
24 httpeur-lexeuropaeusummarychapterenvironment200403htmlroot=200403
Behavioural Study on Consumersrsquo Engagement in the Circular Economy
16
delivered and introduces key deliverables for 2018 Some actions key in initiatives set
out in the report that were especially relevant in the context of the present study
include
Adoption of the Ecodesign Working Plan 2016-2019 which outlines the priorities for
the coming years in terms of new product groups for investigation and reviews of
existing Ecodesign and Energy Labelling regulations
Moves by European standardisation organisations on the Commissionrsquos request to
develop generic standards on the durability reusability and recyclability of products
(with the submission of a working plan and establishment of a working group)
Updated Guidance on the Unfair Commercial Practices Directive26 which includes
specific elements to make green claims more trustworthy and transparent
The Commissionrsquos publication of the Fitness Check on EU Ecolabel in 201727
12 Objectives of the study
The project addressed three objectives
Identify barriers and trade-offs faced by consumers when deciding whether to engage
in the circular economy in particular whether to purchase a more or a less durable
good whether to have a good repaired or to discard it and buy a replacement
Establish the relative importance of economic social and psychological factors that
govern the extent to which consumers engage in the circular economy especially
purchasing durable products and seeking to repair products instead of disposing of
them and
Propose policy tools to enable and encourage consumers to engage in circular
economy practices related to durability and reparability
The study did not use a precise definition of what constitutes a lsquodurablersquo or lsquorepairablersquo
product Instead it was one of the main aims of the study to uncover what consumers
associate with the concepts of lsquodurabilityrsquo and lsquoreparabilityrsquo The study thus potentially
takes a different point of view on these CE concepts compared to studies that are
focussed on industry standards Naturally industry standards require clear definitions of
what can be considered a lsquodurablersquo or lsquorepairablersquo product to be enforceable This study
instead covers the views and perceptions around durability and reparability of the general
population across different EU Member States
To meet the objectives of the study three main areas of work have been undertaken
A preparatory phase involving a literature review desk research collection of market
data collection of information on business practices assessment of repair service
business models and focus groups with consumers This early phase formulated
hypotheses for testing in the behavioural experiment (see below) In addition the
evidence collected in this phase contributed to answering the research questions set
out in the Tender Specifications and to the development of analytical conclusions and
policy recommendations
Behavioural experiment and surveys This task tested the hypotheses formulated in
the preparatory phase through a behavioural experiment and consumer survey in
Sweden Germany Ireland Spain Czech Republic and Romania The behavioural
experiment firstly tested situations in which consumers take durability andor
reparability information on products into account in purchasing decisions and
secondly situations in which respondents choose to repair rather than replace
products for five productsproduct categories
A consumer survey was conducted in Austria the Czech Republic Germany Spain
France Hungary Ireland Latvia the Netherlands Portugal Romania and Sweden
The survey explored consumersrsquo understanding of lsquodurabilityrsquo and lsquoreparabilityrsquo their
25 httpeceuropaeuenvironmentcircular-economyindex_enhtm
26 httpeceuropaeujusticeconsumer-marketingfilesucp_guidance_enpdf
27 httpeceuropaeuenvironmentemasemas_publicationspolicyfitness_check_enhtm
Behavioural Study on Consumersrsquo Engagement in the Circular Economy
17
engagement in the Circular Economy and drivers and barriers to this
(non-)engagement and their expectations understanding and awareness with
respect to durability and reparability
Analysis of results conclusions and policy recommendations which involved
quantitative and qualitative analysis in order to develop analytical conclusions and
recommendations for EU level policy tools
Behavioural Study on Consumersrsquo Engagement in the Circular Economy
18
METHODOLOGY
Behavioural Study on Consumersrsquo Engagement in the Circular Economy
19
2 Methodology
This section presents brief overviews of the methods applied for each of the strands of
research Some parts refer the interested reader to the annex document which contains
further details
The section is organised as follows
Section 21 presents the country selection
Section 22 presents the product selection
Section 23 presents the approach to the literature review and desk research
Section 24 presents the approach to the stakeholder interviews
Section 25 presents the methodology for the focus groups
Section 26 presents a short description of the consumer survey including brief details
on the sampling and questionnaire content
Section 27 presents how the behavioural experiments for this study were conducted
including a brief description of the tasks experimental treatments outcome
measures and incentives
21 Country selection
The sample of Member States covered in the study needed to reflect different levels of
CE engagement and aim for the broadest geographical coverage possible To create a
robust indicator of CE engagement across the EU Member States two types of measures
were used in the country selection namely consumersrsquo self-declared attitudes towards
different aspects of the Circular Economy and their actual behaviour with respect to the
Circular Economy
To capture consumersrsquo attitudes published data from Eurobarometers 388 and 397 was
used as follows
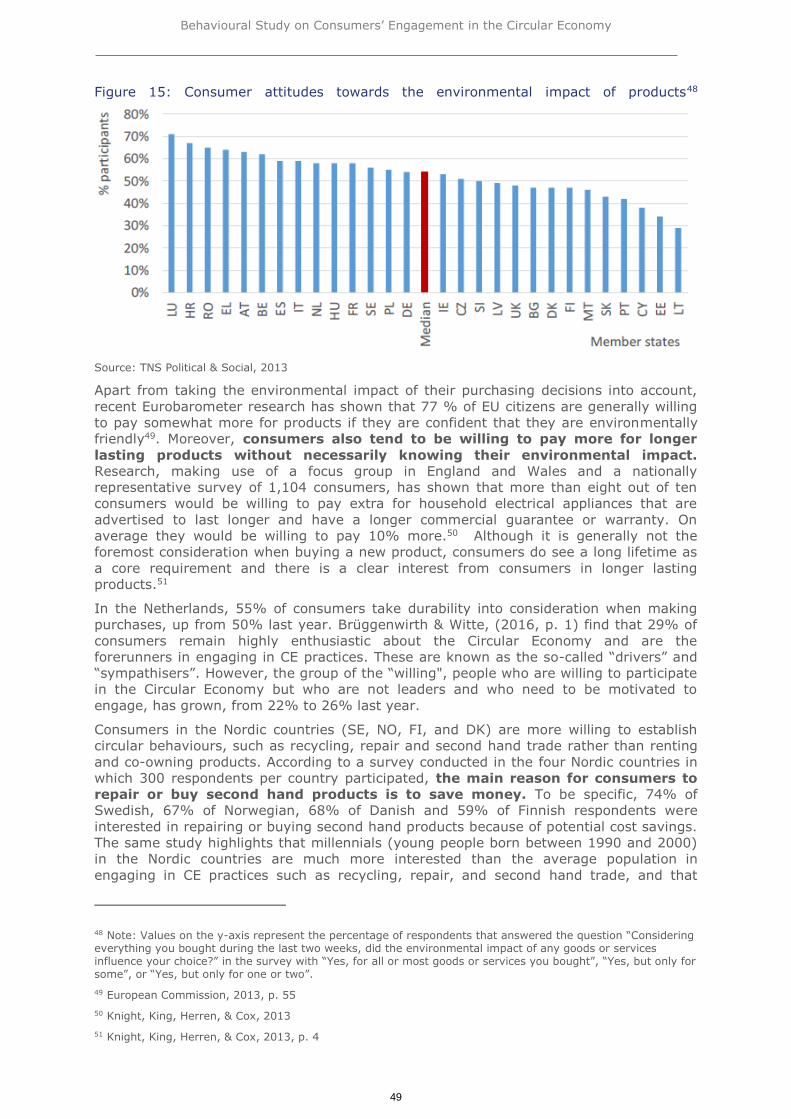
General environmental impact This dimension described how much the
environmental impact of goods or services influences consumersrsquo choices of goods or
services based on question 5 of Flash Eurobarometer 397 survey (ldquoConsidering
everything you bought during the last two weeks did the environmental impact of
any goods or services influence your choicerdquo)
Durability of products This dimension captured the importance of the longevity of
products to consumers in their purchasing decisions based on question 11 of Flash
Barometer 388 survey (ldquoWhich of the following aspects do you consider most
important when buying a durable product like a washing machine or a fridgerdquo
where respondents could select ldquoYou can use the product for a long timerdquo as an
answer option)
Recycling This dimension captured the relevance of the recyclability of products in
consumersrsquo purchasing decisions based on question 11 of Flash Barometer 388
survey (ldquoWhich of the following aspects do you consider most important when buying
a durable product like a washing machine or a fridgerdquo where respondents could
select ldquoThe product can be recycled after you use itrdquo as an answer option)
Reuse of products This dimension captured the importance to consumers of being
able to resell products based on question 11 in Flash Barometer 388 survey (ldquoWhich
of the following aspects do you consider most important when buying a durable
product like a washing machine or a fridgerdquo where respondents could select ldquoYou
can easily sell the product when you no longer want to use itrdquo as an answer option)
To capture consumersrsquo behaviour (ie the extent that their attitudes materialise)
Eurostat statistics were used to describe Member States on two variables
Recycling rate This dimension represented the actual recycling rate across
countries based on Eurostat statistics (dataset Municipal waste by waste operations
code env_wasmun)
Waste production This dimension captured how much waste each country
generates per capita (again using Eurostat data)
Behavioural Study on Consumersrsquo Engagement in the Circular Economy
20
The country selection was based on these six dimensions The selection captured
different parts of the distribution for these six measures (ie countries with relatively
high levels and those with relatively low levels) while paying attention to the
geographical coverage (ie the selection covered all the different regions of the EU
North South East and West) such that the findings may be extrapolated to all the
Member States Iceland and Norway
For the online survey and experiment the country selection comprised of
Survey (12 countries) Austria Netherlands Sweden Czech Republic Germany
France Ireland Hungary Latvia Spain Portugal and Romania
Behavioural experiment (6 countries) Sweden Germany Ireland Spain Czech
Republic and Romania
The literature review covered literature published in English from all 28 Member States
and further literature in seven additional European languages (French German Czech
Hungarian Dutch Portuguese and Romanian)
Additional online desk research and semi-structured interviews were conducted in
10 countries Austria Netherlands Sweden Czech Republic Germany France Ireland
Hungary and Romania This selection thus covered all experiment countries and ten of
the twelve survey countries (except Latvia and Portugal)
A subset of four of the six experiment countries were selected for the focus groups
these were Germany Ireland Sweden and the Czech Republic
The country selection is presented in the table below
Behavioural Study on Consumersrsquo Engagement in the Circular Economy
21
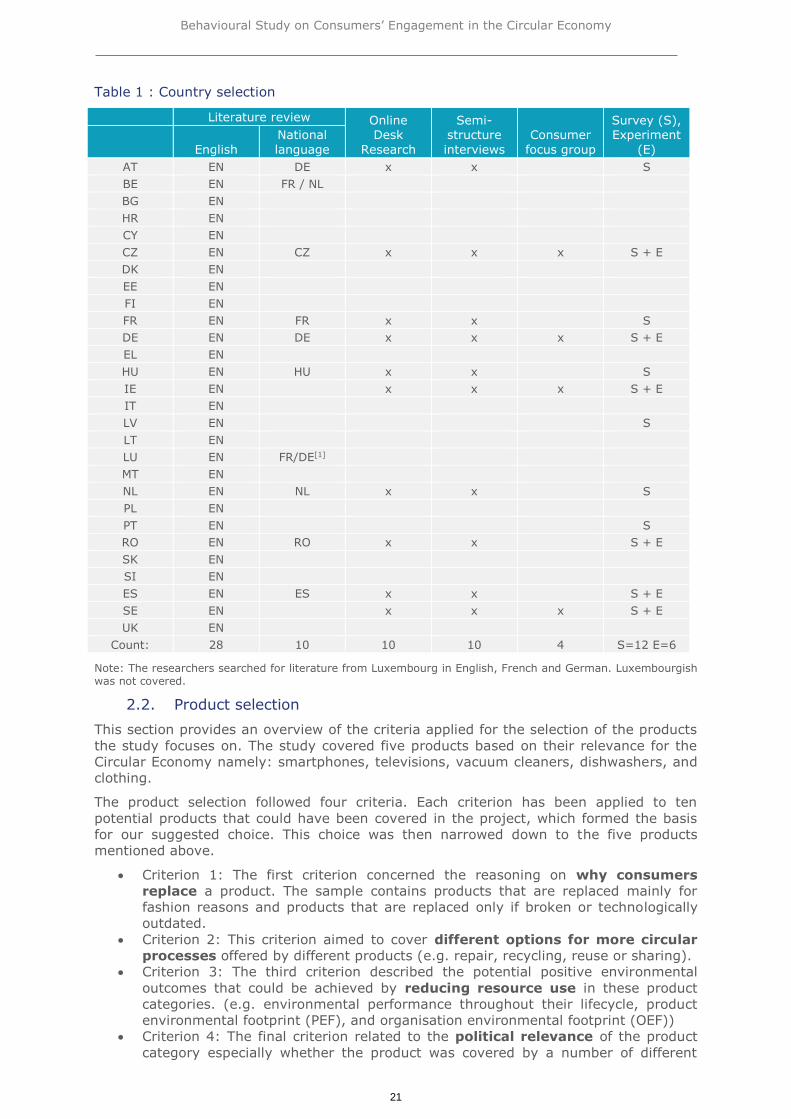
Table 1 Country selection
Literature review Online Desk
Research
Semi-structure
interviews
Consumer
focus group
Survey (S) Experiment
(E)
English
National
language
AT EN DE x x S
BE EN FR NL
BG EN
HR EN
CY EN
CZ EN CZ x x x S + E
DK EN
EE EN
FI EN
FR EN FR x x S
DE EN DE x x x S + E
EL EN
HU EN HU x x S
IE EN x x x S + E
IT EN
LV EN S
LT EN
LU EN FRDE[1]
MT EN
NL EN NL x x S
PL EN
PT EN S
RO EN RO x x S + E
SK EN
SI EN
ES EN ES x x S + E
SE EN x x x S + E
UK EN
Count 28 10 10 10 4 S=12 E=6
Note The researchers searched for literature from Luxembourg in English French and German Luxembourgish was not covered
22 Product selection
This section provides an overview of the criteria applied for the selection of the products
the study focuses on The study covered five products based on their relevance for the
Circular Economy namely smartphones televisions vacuum cleaners dishwashers and
clothing
The product selection followed four criteria Each criterion has been applied to ten
potential products that could have been covered in the project which formed the basis
for our suggested choice This choice was then narrowed down to the five products
mentioned above
bull Criterion 1 The first criterion concerned the reasoning on why consumers
replace a product The sample contains products that are replaced mainly for
fashion reasons and products that are replaced only if broken or technologically
outdated
bull Criterion 2 This criterion aimed to cover different options for more circular
processes offered by different products (eg repair recycling reuse or sharing)
bull Criterion 3 The third criterion described the potential positive environmental
outcomes that could be achieved by reducing resource use in these product
categories (eg environmental performance throughout their lifecycle product
environmental footprint (PEF) and organisation environmental footprint (OEF))
bull Criterion 4 The final criterion related to the political relevance of the product
category especially whether the product was covered by a number of different
Behavioural Study on Consumersrsquo Engagement in the Circular Economy
22
relevant Directives like the Ecodesign Directive andor Energy Labelling Regulation
or in other EU studies on similar subjects Additionally a product type was
favoured if existing industry initiatives show that the industry sees some potential
for Circular Economy changes
Using these criteria on an initial set of products the Consortium finally selected the
following five products mentioned
1 Smart phones purchases are innovation and fashion driven as innovation cycles
are swift and smart phones are important status symbols There is a big potential
for recycling and repair use of critical raw materials many on-going initiatives
and lastly they fall within the scope of the Ecodesign Directive were a focus of a
REFIT (Regulatory Fitness and Performance) study on consumer rules (EC DG
Justice and Consumer 2016) and were also covered in an EU study on lifespan
labelling (European Economic and Social Committee 2016)
2 Televisions innovation cycles have been also very quick in recent years but
compared to smart phones TV are less of a status symbol so it should be
expected that innovation is important in the purchasing decision and fashion less
so There is a large potential for repairing and recycling use of critical raw
materials and high GHG emissions there are many on-going initiatives and lastly
TVs are covered by the Ecodesign Directive and the Energy Labelling Directive
and were studied in the REFIT study recent studies on energy labelling (London
Economics amp Ipsos 2014) and lifespan labelling (European Economic and Social
Committee 2016) and the study on EU environmental and carbon footprint label
options conducted in 2012 (London Economics Ipsos amp AEA 2012)
3 Vacuum cleaners as innovation cycles are slower than in TV and smart phones
and vacuum cleaners are less of a status symbol purchasing decisions are
probably more driven by durability and less by technology or fashion There is a
large potential for recycling and repairing and some potential for sharing Vacuum
cleaners are covered by the Ecodesign Directive and the Energy Labelling
Regulation and were studied in the lifespan labelling study (European Economic
and Social Committee 2016)
4 Dishwashers as innovation cycles are slower than in TV and smart phones and
dishwashers are less of a status symbol purchasing decisions are again probably
more driven by the longevity (ie durability) of products there is some potential
for repair recycling and reuse high GHG emissions and lastly dishwashers are
covered by the Ecodesign Directive and the Energy Labelling Regulation
5 Clothing purchasing decisions are largely driven by fashion There is some
potential for repair and reuse and although they are not covered by the Energy
Labelling Regulation or Ecodesign Directive clothing items are covered by the
lifespan labelling study which studied trousers and sport shoes (European
Economic and Social Committee 2016)
Furthermore including clothing in the sample had an added value since technological
innovation is not such an important factor for clothing compared to the other product
categories For the other four product categories fashion plays a smaller role when
replacing a product
23 Methodology for the literature review and desk research
A literature review of existing English-language studies and documents in all EU Member
States Norway Iceland and four other non-European countries (Canada Switzerland
Japan and the United States) was carried out Additionally literature in six other
languages namely French German Czech Dutch Spanish and Romanian were
reviewed The literature review and desk research were conducted in parallel The aim of
the literature review was to provide an overview on the existing published knowledge
relevant to the research questions In order to answer the studiesrsquo research questions
(see Section 1 in the Annex document) the researchers focused on the following
aspects
Behavioural Study on Consumersrsquo Engagement in the Circular Economy
23
Characteristics of the Circular Economy such as durability and reparability of
products and the difference between durability and reparability characteristics
across the five product categories (televisions smartphones vacuum cleaners
dishwashers and clothes) types of information on durability and reparability of
products as well as key features of other circular practices such as product
leasing services and the sharing economy
Aspects of consumer purchasing decisions in the Circular Economy such as
consumer willingness to engage drivers barriers and trade-offs faced by
consumers consumer awareness understanding of and expectations about
durability and reparability and the role of durability and reparability information in
the purchasing decision
Market data on manufacturing complete recycling andor reuse consumption and
usage patterns and disposal trends) for the five products categories
Existing European and national policy measures in the area of the Circular
Economy and eco-innovation and their impacts at European and national level
Business models that can be found today in the Circular Economy with a focus on
product reparability and recyclability
During the literature review and desk research the study team pre-screened 224
documents including national and European consumer studies regulatory reports and
academic articles From those the study team fully analysed 105 documents Based on
the executive summaries or abstracts the documents were analysed if any of the
research questions seemed to be covered by the report The research questions were
structured and summarised into the following 10 themes to allow an easier overview
Theme 1 - Drivers barriers and trade-offs
Theme 2 - Willingness to engage
Theme 3 - Consumers expectations regarding durability
Theme 4 - Consumer expectations regarding reparability
Theme 5 - Importance of CE characteristics
Theme 6 - Durability information
Theme 7 - Reparability information
Theme 8 - After-sales expectations
Theme 9 - Policy tools
Theme 10 - Business models and market data
The collected information of the fully reviewed documents was organised in an excel file
to allow the analysis of all collected information by question
24 Methodology for the stakeholder interviews
241 List of stakeholders
During the inception phase a preliminary list of relevant stakeholders was developed
Relevant stakeholders were identified via desk research by searching for knowledgeable
individuals in 11 categories of organisations
European trade and businessindustry associations
European consumer associations
European NGOs in particular focusing on CEsustainable consumption
National public authorities
National consumer associations
National trade associations
National NGOs in particular focusing on CEsustainable consumption
Independent repair servicesassociations
Standardisationcertificationverification bodies
Eco-labelling bodiesinstitutions
Academics specialising in consumer-related policy and behavioural economics
The preliminary list of interviewees was further developed using suggestions of the
Commission and results of the desk research at Member State level The study team
identified additional organisations that hold up-to-date data and information about the
Circular Economy and contacted these organisations as well
Behavioural Study on Consumersrsquo Engagement in the Circular Economy
24
242 Preparation ahead of the interviewing process
To ensure that the study team had a full understanding of the questions and objectives of
both the study and the interviewing process the core team provided internal guidelines
to be used by the researchers The internal guidelines included
an introduction and the objectives of the study
research questions
descriptions of the research activities
The final interview guide is presented in Section 5 in the Annex document
243 Interviews at European and Member State level
The researchers contacted stakeholders at the European level in Switzerland and across
13 Member States Austria Belgium France the Czech Republic Germany Spain
Ireland the Netherlands Hungary Romania Sweden Portugal and the United Kingdom
Interviews aimed at obtaining up-to-date and first-hand information on the relevant
issues exploring in depth the study objectives with the help of the stakeholdersrsquo
expertise and lastly ensuring that no critical studies or data were missed
The interview questionnaire was shared with the interviewees allowing them to prepare
beforehand and gather necessary data before the interview
Most of the interviews were undertaken in the national languages In some specific
cases upon request from the stakeholders the interview guide was translated (ie
German Czech and Romanian)
Overall the study team completed 50 interviews Table 2 shows their distribution
between different types of stakeholders and between the 14 countries covered in this
study plus the European level
Behavioural Study on Consumersrsquo Engagement in the Circular Economy
25
Table 2 Distribution of interviews (in number of interviews)
Trad
e a
nd
bu
sin
ess
ind
ustr
y
asso
cia
tio
ns
Co
nsu
mer
asso
cia
tio
ns
NG
Os
focu
sin
g
on
CE
su
sta
inab
le
co
nsu
mp
tio
n
Pu
bli
c
au
tho
rit
ies
Acad
em
ics
exp
erts
Oth
er
To
tal
EU 6 3 1 10
AT 1 1
BE 1 2 1 4
CH 1 1
CZ 3 1 1 5
DE 1 1 2 1 5
ES 1 1 2
FR 1 1 2
HU 1 1 2
IE 1 1
NL 2 2 4
PT 1 1
RO 1 2 1 4
SE 1 2 3
UK 1 1 2 1 5
Total 50
The study team used a similar approach to conduct interviews to the approach used for
the literature review and desk research dividing the interview questions into the
following sections to allow a better overview and to help the interviewer structure the
interview
Section 1 - Drivers barriers and trade-offs
Section 2 - Willingness to engage
Section 3 - Consumers expectations on durability
Section 4 - Consumer expectations on reparability
Section 5 - Importance of CE characteristics
Section 6 - Durability information
Section 7 - Reparability information
Section 8 - After-sales expectations
Section 9 - Policy tools
Section 10 - Business models and market data
Behavioural Study on Consumersrsquo Engagement in the Circular Economy
26
Under each section there was a minimum set of three questions While the questions
under sections 1 5 6 7 and 9 were asked in all interviews the more detailed question in
the other sections were only asked if the interviewee had some expertise or interest in
the topics
The gathered information for the literature reviews and interviews was recorded in two
excel files The data in both files are structured by research question
25 Methodology for the focus groups
Eight consumer focus groups were carried out aiming to explore consumersrsquo awareness
understanding attitudes and expectations with regard to circular economy practices
Two focus groups were conducted in each of Ireland Germany Sweden and the Czech
Republic In each country groups were moderated in the local language Each group
session was designed to last 90 minutes
251 Sampling and recruitment
It was aimed to recruit on average eight participants per group In each country one
group was carried out with vulnerable consumers ndash defined as people who are in arrears
with household bills or who struggle from time to time with household bills and are in
any of the following situations unemployed retired long-term sick or disabled or single
parents28 The second group included a ldquomixrdquo of participants in terms of circular economy
engagement ndash people who tend to engage in circular economy practices people who tend
not to and people who tend to do this but only to a certain extent
In each group it was aimed to include a balanced mix of men and women aged 25 to 60
years old This age range was set in order to ensure that the age gap between
participants was not too wide bearing in mind the need to maximise communication and
participation and create an efficient group dynamic
In summary all participants had to meet the following eligibility requirements
Had not participated in another focus group in the past six months and
Had completed the screener questionnaire in order to assess their group membership
(circular economy engagement and vulnerability)
Respondents were recruited using the screener questionnaire In each country recruiters
were thoroughly trained by the project managers from the local fieldwork agencies The
recruitment process was strictly monitored
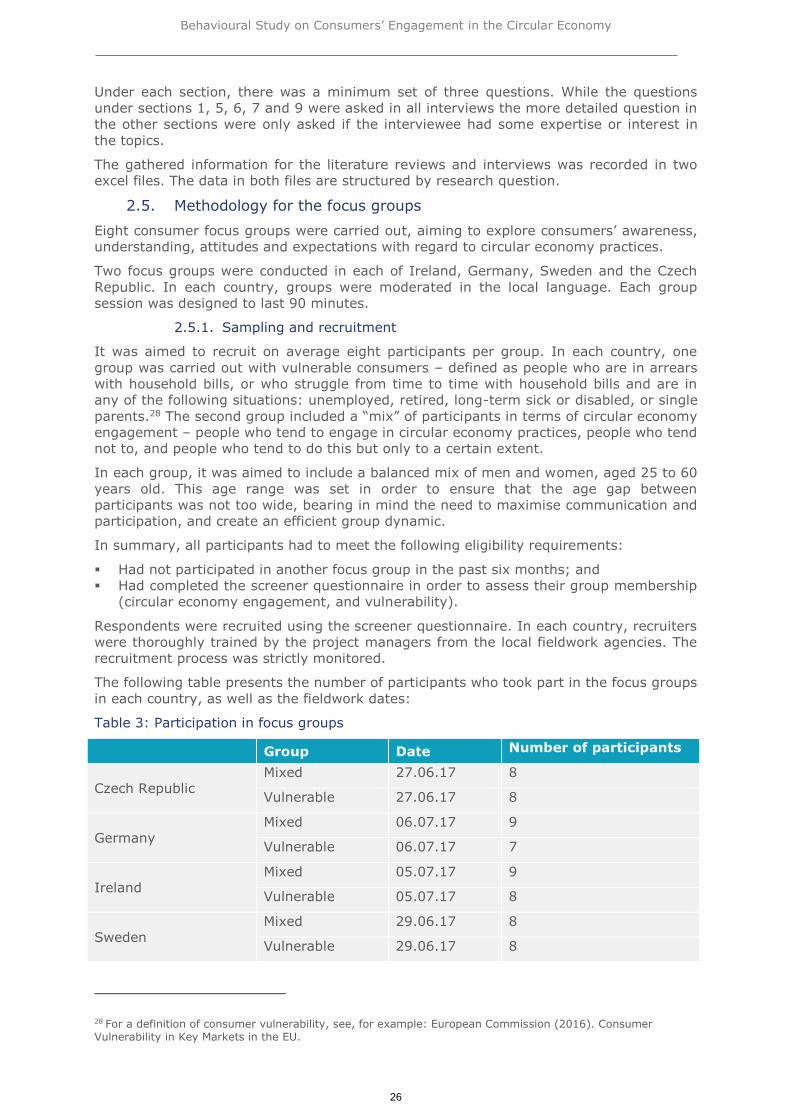
The following table presents the number of participants who took part in the focus groups
in each country as well as the fieldwork dates
Table 3 Participation in focus groups
Group Date Number of participants
Czech Republic Mixed 270617 8
Vulnerable 270617 8
Germany Mixed 060717 9
Vulnerable 060717 7
Ireland Mixed 050717 9
Vulnerable 050717 8
Sweden Mixed 290617 8
Vulnerable 290617 8
28 For a definition of consumer vulnerability see for example European Commission (2016) Consumer Vulnerability in Key Markets in the EU
Behavioural Study on Consumersrsquo Engagement in the Circular Economy
27
In each country participants received an incentive for attending the groups as a ldquothank
yourdquo for their participation The following table provides information with regards to the
incentives provided29
Table 4 Incentives for participation in focus groups
Country Incentive (per participant)
Czech Republic 700 CZK
Germany 50 EUR
Ireland 50 EUR
Sweden 600 SEK
252 Discussion guide
The discussion guide aimed to include questions that focused on three aspects of the
circular economy (durability reparability and recyclability) and referred to various types
of products (washing machinesdishwashers vacuum cleaners televisions smartphones
and clothing) The document was structured as follows
Introduction presentations introduction and brief definition of the three key concepts
(durability reparability and recyclability)
Awareness understanding attitudes and expectations regarding circular economy
practices
Barriers and drivers factors that encourage consumers from undertaking circular
economy practices as well as those that prevent them from it
Expectations with regard to information provision about durability reparability and
recyclability and how it should be presented
26 Methodology for the consumer survey
An online consumer survey was conducted in Austria the Czech Republic Germany
Spain France Hungary Ireland Latvia the Netherlands Portugal Romania and Sweden
with approx 1000 respondents each The obtained sample was representative in terms
of age gender and geographic region (see weighting strategy further below)
All survey participants received a monetary incentive for their participation in the survey
As outlined in the following section respondents who also conducted the experimental
task as part of the survey could earn additional incentives through their choices in the
experiment30
The survey contained questions in the following areas
Consumersrsquo understanding of lsquodurabilityrsquo and lsquoreparabilityrsquo
Consumersrsquo CE engagement and drivers and barriers of this (non-)engagement This
section included questions in the following sub-areas
o Experience with owning different types of products
o Experience with broken products
o Experience with repair and self-repair
o Experience with rentingleasing products and purchasing second hand
products
o The importance of durability and reparability information on purchasing
decisions
o General CE-related behaviours
Durability and reparability information
29 In each country incentives were established by the local agencies who conducted the groups according to their standard practice for compensating respondents for taking part in focus group research
30 The participation fee paid in Ipsos points converted into roughly euro1-euro2 depending on the country and the additional incentive paid for choices in the experiment amounted to an additional euro050 - euro1
Behavioural Study on Consumersrsquo Engagement in the Circular Economy
28
Expectations understanding and awareness with respect to durability and reparability
Buying versus leasing products
After-sales expectations
Socio-demographics and respondent attitudes and behavioural traits relevant to the
CE
This study did not address whether consumersrsquo attitudes were different for situations in
which products were still covered by the 2-year legal guarantee covering all goods sold in
the EU by additional Member State rules which are stricter than the 2-year legal
guarantee (eg in SE) or covered by additional (extended or commercial) warranties As
a result when asking respondents for example about their repair behaviour or after-
sales expectations the survey questions commonly referred to both guarantees and
warranties The survey did not give specific explanations about the difference of legal and
commercial guarantees
Sampling and weighting of the obtained data
Respondents in each country were randomly drawn from the online panels based on
available profile data (age gender and geographic region) and pre-defined sub-sample
sizes (ie quota) based on official population statistics published by Eurostat (2017)
ldquoFlexiblerdquo quota were used meaning that some leeway was granted to achieve the target
number of interviews in each sub-sample group In Romania the target number of
interviews for the oldest age group was not reached at the end of the fieldwork period
Any imbalance in the representativeness of the data due to the use of flexible quota is
managed using post-stratification weights Two types of weights are produced for this
study country weights and cross-national weights
Country weights adjust for gender and age distributions in each country such that the
weighted data matches the Eurostat statistics (2017) population data These weights are
applied when analysing the data at individual country level31
Cross-national weights adjust for country population size These weights are applied
when analysing the data across multiple countries Two weighting variables are included
in the dataset (1) a cross-national weighting variable to be applied when analysing all
12 countries (2) a cross-national weighting variable to be applied when only analysing
the six countries where respondents completed the experiment
31 These weights are generated using the iterative proportional fitting command ipfweight in Stata software package ipfweight is based on the iterative proportional fitting algorithm (also known as raking) first proposed by Deming and Stephan in 1940 It performs a stepwise adjustment of weights to achieve known population margins (gender and age) the adjustment process is repeated until the difference between the known population margins and the weighted margins of the variables gender and age is minimised
Behavioural Study on Consumersrsquo Engagement in the Circular Economy
29
Table 5 Sample composition Unweighted gender and age distribution
Country Number
of
completed
interviews
Gender
distribution (
unweighted)
Age distribution ( unweighted)
Men Women 18-
29y
30-
39y
40-
49y
50-
59y 60+y
AT 1005 518 482 154 176 193 198 279
CZ 1004 507 493 174 180 188 155 302
DE 1009 507 493 135 163 194 194 314
ES 1020 519 481 160 196 195 172 278
FR 1002 526 474 164 189 178 153 317
HU 1003 532 468 172 179 195 183 272
IE 1003 506 495 177 236 195 177 215
LV 1005 551 449 190 158 189 167 296
NL 1002 510 490 169 172 180 178 302
PT 1005 531 469 201 144 209 165 281
RO 1005 531 469 201 260 203 206 130
SE 1001 509 492 170 153 150 188 340
Source Ipsos analysis of fieldwork data
261 Random allocations of respondents to survey items product
categories and experimental treatments
As explained above the survey and experiment covered five different product categories
ndash dishwashers vacuum cleaners televisions mobile phones and clothing items ndash and
tested a large number of experimental treatments (see components of the purchasing
and repair experiments below) To keep the tasks manageable for respondents in terms
of time and complexity and to avoid respondent fatigue not all respondents answered
strictly all questions for all products Instead a system of random allocations was set up
to obtain a balanced data set across the various products and scenarios tested
To this end at the start of the consumer survey each respondent was asked about their
experience with purchasingowning any of the five products under examination and
whether they had purchased these products themselves (rather than having received
these as gifts or alike) and whether any of these products had broken down in the past
This information was then used to form three sets of respondents as shown below to
ensure respondents were routed to relevant questions throughout the survey
Set 1 Respondents in Set 1 answered in-depth survey questions for up to two
randomly selected products which they currently or previously owned and which
have broken down in the past Products which respondents purchased themselves
were prioritised
Sets 2 and 3 slightly relaxed some requirements of Set 1 in the following way
Set 2 Respondents in Set 2 answered questions for up to two randomly selected
products which they currently or previously owned and which they purchased
themselves Products which respondents have broken down were prioritised
Set 3 This set finally covered two randomly selected products where it was sufficient
for respondents to have simply owned the products Products which were bought
by the respondent and products which have broken down were prioritised but it was
not necessary to have such experiences to be included in Set 3
Behavioural Study on Consumersrsquo Engagement in the Circular Economy
30
The final allocation across sets and products was as follows
Table 6 Number of respondents allocated to different sets and products
Set Vacuum
cleaners
Dishwashers TVs Mobile
phones
Coat or
jacket
Set 1 2350 2008 2045 3053 1503
Set 2 4848 4096 4855 4893 4883
Set 3 4907 4463 4908 4914 4917
Allocations to the various treatments in the experimental tasks were done independently
and randomly across the different allocations This resulted in a full factorial design
between products and treatments This means that group sizes for different variants
within each treatment category were roughly equal and each respondent had the same
likelihood of being assigned to any specific treatment This also ensures that on average
there should not be any interactions between different types of experimental treatments
(see Section 9 in the Annex document for the full argument) In the analyses in the
following sections sample sizes for the various groups are mentioned in table notes
27 Methodology for the behavioural experiment
The behavioural experiment was embedded as an additional module within the general
consumer survey All respondents answered questions regarding their socio-demographic
background and general survey questions (see above) Respondents from countries in
which the behavioural experiment was conducted ie in the Czech Republic Germany
Spain Ireland Romania and Sweden additionally completed two additional tasks
namely a repair experiment and a purchasing experiment
The sequence of these different components is shown in Figure 1 below each component
is described in further detail in turn in the following sub-sections
Figure 1 Components and sequence of the consumer survey and behavioural experiment
Source LE Europe
Behavioural Study on Consumersrsquo Engagement in the Circular Economy
31
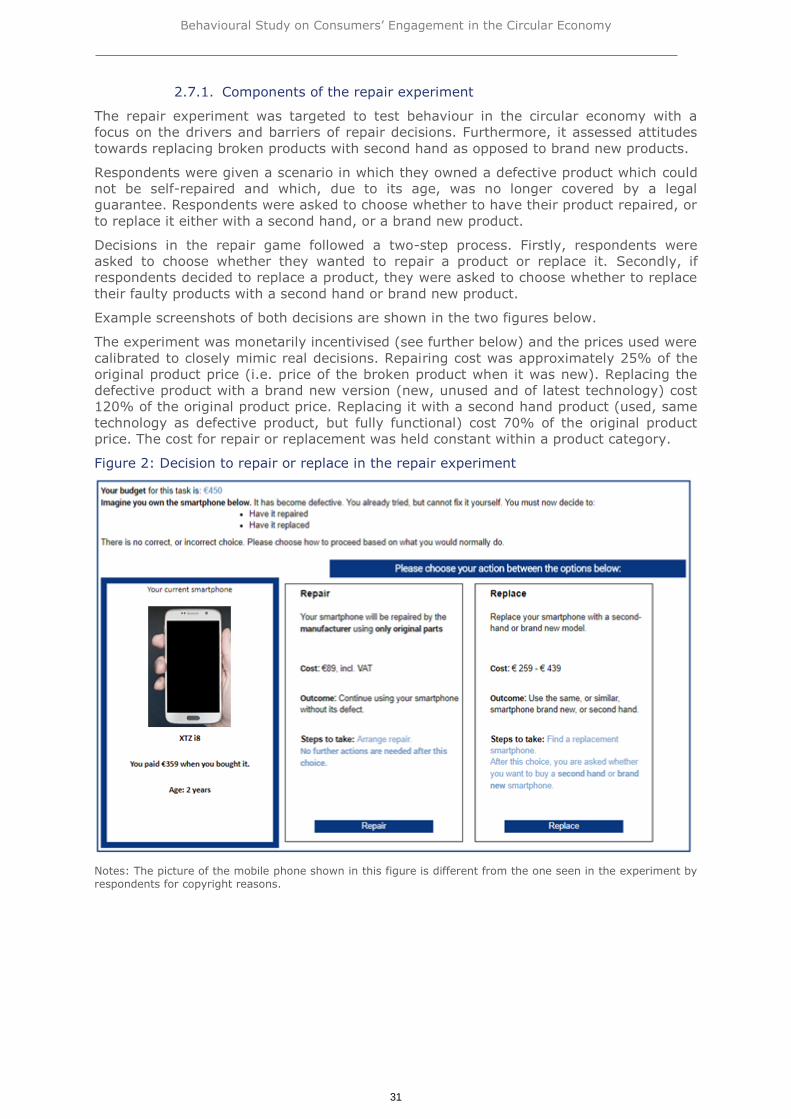
271 Components of the repair experiment
The repair experiment was targeted to test behaviour in the circular economy with a
focus on the drivers and barriers of repair decisions Furthermore it assessed attitudes
towards replacing broken products with second hand as opposed to brand new products
Respondents were given a scenario in which they owned a defective product which could
not be self-repaired and which due to its age was no longer covered by a legal
guarantee Respondents were asked to choose whether to have their product repaired or
to replace it either with a second hand or a brand new product
Decisions in the repair game followed a two-step process Firstly respondents were
asked to choose whether they wanted to repair a product or replace it Secondly if
respondents decided to replace a product they were asked to choose whether to replace
their faulty products with a second hand or brand new product
Example screenshots of both decisions are shown in the two figures below
The experiment was monetarily incentivised (see further below) and the prices used were
calibrated to closely mimic real decisions Repairing cost was approximately 25 of the
original product price (ie price of the broken product when it was new) Replacing the
defective product with a brand new version (new unused and of latest technology) cost
120 of the original product price Replacing it with a second hand product (used same
technology as defective product but fully functional) cost 70 of the original product
price The cost for repair or replacement was held constant within a product category
Figure 2 Decision to repair or replace in the repair experiment
Notes The picture of the mobile phone shown in this figure is different from the one seen in the experiment by
respondents for copyright reasons
Behavioural Study on Consumersrsquo Engagement in the Circular Economy
32
Figure 3 Decision to buy second hand or brand new in the repair experiment
Product coverage in the repair experiment
The experiment was conducted for TVs dishwashers vacuum cleaners smartphones and
coats Each respondent repeated the task for three different products Which products
were covered and the order in which respondents saw the different products were
randomised
Outcome measures of the repair experiment
There were two main outcome measures in this experimental task
Likelihood of choosing to repair
Likelihood of choosing a second hand product This choice was evidently only relevant
for respondents who chose to replace the product in the first stage
Experimental treatments in the repair experiment
The experimental treatments systematically varied the look and feel of the experimental
task for different respondents Allocations to the various treatments in the experimental
tasks were done independently and randomly across the different allocations This
resulted in a full factorial design between products and treatments This means that
group sizes for different variants within each treatment category were roughly equal and
each respondent had the same likelihood of being assigned to any specific treatment
This also ensures that on average there should not be any interactions between
different types of experimental treatments (see Section 9 in the Annex document for the
full argument)32
Effort treatment This treatment changed the relative cost of either repairing or
replacing the product by introducing a real effort task This treatment aimed to test
whether non-price related frictions such as search costs time investment etc
represent barriers for engagement in the CE There were three variants
32 Since the same percentage of participants were exposed to a specific treatment variant in all other treatments (eg the same number of respondents saw the no effort effort after repair effort after replace conditions in all other treatments) the effect of the treatment on other treatment is cancelled out on average In the analysis each treatment is analysed in isolation ie averaging across all variants of any other treatment This setup should safeguard that there is no lsquocontaminationrsquo between different types of treatments and is common practices in large-scale controlled behavioural experiments like this one (see for example the setup of the behavioural experiment (experiment 3) in the lsquoConsumer Market Study to support the Fitness Check of EU consumer and marketing lawrsquo European Commission 2017 available at httpeceuropaeunewsroomjustitem-detailcfmitem_id=59332
Behavioural Study on Consumersrsquo Engagement in the Circular Economy
33
o No effort Both repairing and replacing were lsquoeffortlessrsquo
o Repairing was associated with effort The repair decision was followed-up
by an effort task replacing an item (with a brand new version or a second
hand version) instead was effortless
o Replacing was associated with effort This was the flipside of the
above Effort was required for buying a second hand or a brand new
product while repairing was effortless
Figure 4 provides an example of the effort task associated with repairing The
effort task associated with replacing was the same except for the framing of the
reason for repair The fact that effort was required was announced in previous
stages of the repair experiment That is on the first decision screen see Figure 2
in the effort treatment it was indicated under lsquoSteps to takersquo that respondents
needed to complete an additional task
Figure 4 Effort in the repair experiment
Notes the picture of the mobile phone shown in the figure is different from the one seen in the experiment by respondents for copyright reasons
Framing of the source of repair This treatment varied who would repair the
product ndash the manufacturer or an independent repair shop Moreover it varied
whether the repair was done using original parts only or a mix of original and
non-original parts This setup resulted in the following 2 x 2 factorial design with 4
variants
Table 7 Design for the framing of the source of repair
Original parts only Original and non-
original parts
Manufacturer repair A B
Independent repair C D
The variants A amp C varied whether the manufacturer or an independent repair
shop would perform the repair Variants B amp D varied the type of spare parts to be
used for repair The treatment aimed to test whether certain characteristic of a
repair service make the option to repair more or less attractive
Behavioural Study on Consumersrsquo Engagement in the Circular Economy
34
The source of repair was shown to respondents with information on repair in the
first stage of the experiment (see Figure 2) Figure 5 provides an example of the
way that different sources of repair were shown
Figure 5 Framing of the source of repair in the repair experiment
Framing repair prices as VAT exempt This treatment had two variants and varied
whether prices were shown as including VAT or as VAT exempt This treatment aimed
to test whether framing repair prices as VAT exempt made the option to repair a
product more attractive This can be considered purely as an advertising practice
Prices were not varied ie VAT exempt prices were not actually cheaper compared to
VAT incl prices The treatment only tested the way prices were presented not the
actual price elasticity In the behavioural economics literature framing of choices is
often found to be very influential on how individuals perceive and choose between
options33
VAT exemption for repair was shown to respondents in two ways (see Figure 6)
Firstly the price for repair included explicit reference vat exemption or inclusion
Secondly a red-bordered label was shown if repair was VAT exempt
33 See for example UK Office for Fair Trading (2010) lsquoThe impact of price frames on consumer decision makingrsquo a report prepared by London Economics Tversky and Kahneman (1981) lsquoThe framing of decisions and the psychology of choicersquo Science Levin et al (1998) lsquoAll frames are not created equal A typology and critical analysis of framing effectsrsquo Organizational Behavior and Human Decision Processes
As a result this study aimed to test such framing effects only Standard economy theory tells us that demand for repair prices would increase if prices were lowered by the amount of VAT This study did not aim to measure the precise price elasticity of demand for repair services and thus omitted testing price changes in this treatment
Behavioural Study on Consumersrsquo Engagement in the Circular Economy
35
Figure 6 Framing of VAT exemption in the repair experiment
Each respondent was randomly allocated to one variant within each of the treatment
categories resulting in a full factorial experiment design (see Section 9 in the Annex
document for the full argument)
Incentives in the repair experiment
The repair experiment was incentivised Respondents could earn additional Ipsos survey
points through their choices More specifically respondents were given a budget for each
of the three rounds of the experiment task which they could use to pay for
replacingrepairing their products
The cost of repairingreplacing was deducted from the budget to reflect real-life
budgetary constraints Respondents then lsquoearnedrsquo points for the longevity of their
repaired (or replacement) product This latter mechanism reflected real-life monetary
advantage of durable products
The setup of the tasks and incentive structure were clearly explained before starting the
task (see box below) Additionally respondents answered comprehension questions on
the functioning of the task and incentives to ensure they indeed understood A more
detailed description of the experiment incentives is provided in Section 11 in the Annex
document
The following instructions34 were shown to respondents
TASK DESCRIPTION
You will play 3 rounds of this game
In every round you will be given a budget You can use this budget to repair or replace a
product Whatever you donrsquot spend you keep You will receive 1 point for every euro100
you have at the end of this survey
Like in reality you will get some lsquobenefitsrsquo from using a well-functioning product like the
pleasure of clean plates from your dishwasher or using technology on a smartphone
These benefits in form of additional survey points accrue over time You will get some
indication on the benefits of your choice but like in reality this information might not be
accurate The more benefits you get from your choice the more points you earn
Each choice is designed to be an attractive option so you must choose what you
think is the best choice for yourself
272 Components of the purchasing experiment
The purchasing experiment was targeted to test what drives CE considerations in
purchasing decisions In particular the experiment tested how the presentation of
product information regarding durability and reparability of products at the point of sale
impacts product choice and willingness-to-pay for better durability andor reparability of
products
34 Prices were converted into local currencies in non-Euro countries
Behavioural Study on Consumersrsquo Engagement in the Circular Economy
36
To this end respondents were given a scenario in which they needed to shop for a
product on a simulated e-commerce website showing them six products to choose from
(eg six different models of vacuum cleaners were shown and one needed to be
chosen) Figure 7 and Figure 8 show the basic components of this simulated website For
each product respondents saw the following picture name and price of the product and
a label The EU Ecolabel was employed when respondents needed to make decisions on
coats (see Figure 8) For all other products the EU Energy Label was used (see Figure 7)
Additionally durability andor reparability information was inserted as described further
below
Pictures and product names were varied across the 6 products The energy rating was
held constant at class lsquoBrsquo for all products (no rating applied to coats) This was done to
simplify the setup such that the impact of durability and reparability information could
clearly be measured
Figure 7 Purchasing experiment using EU Energy Labels
Notes The pictures of vacuum cleaners shown in this figure are different from the ones seen in the experiment by respondents for copyright reasons
Behavioural Study on Consumersrsquo Engagement in the Circular Economy
37
Figure 8 Purchasing experiment using EU Ecolabels
Notes The pictures of coats shown in this figure are different from the ones seen in the experiment by respondents for copyright reasons The experiment used gender-neutral images of coats
Product coverage in the purchasing experiment
Analogous to the setup of the repair experiment the purchasing experiment was also
repeated three times each time for a different product Each respondent thus was
randomly assigned to making purchasing decisions for 3 out of 5 products among TVs
dishwashers vacuum cleaners smartphones and coats
Outcome measures of the purchasing experiment
There were three main outcome measures in this experimental task
Preferences for durability Preferences for durability were measured as the
likelihood of choosing a product with a specific level of durability Moreover the
average durability per product category was measured across the different
experimental conditions as well as for different groups of respondents
Each product was assigned one of four levels of durability For each product category
a given durability level mapped to a specific number of yearsmonths of durability as
shown in the table below
Behavioural Study on Consumersrsquo Engagement in the Circular Economy
38
Table 8 Levels of durability and reparability in the purchasing experiment
Durability level Reparability
level
Vacuum
cleaners
Dish-
washers
TVs Smart-
phones
Coats All products
Level 1 10 years 15 years 7 years 42 months 10 years A
Level 2 7 years 10 years 5 years 36 months 7 years C
Level 3 4 years 5 years 4 years 30 months 4 years E
Level 4 2 years 2 years 2 years 24 months 2 years G
In the analyses further below we refer to respondents having either
o Preferences for high durability respondents who chose
the highest level of durability three times or
the highest level of durability twice and never the lowest level or
the highest level of durability once and the second highest level of
durability twice
o Preferences for low durability respondents who chose
the lowest level of durability three times or
the lowest level of durability twice and never the highest level or
the lowest level of durability once and the second lowest level of
durability twice and
o Intermediate preferences respondents who were neither had a preference
for high or low durability
o Preferences for reparability In analogy to the setup for durability there
were also 4 levels of reparability More specifically reparability was rated on
an A-G scale as a potential addition to the EU Energy Label Also analogously
respondents are referred to as having a high intermediate or low preference
for reparability These preferences were defined similarly as the definitions
used for durability preferences
o Willingness-to-pay Willingness-to-pay for additional durability or
reparability was measured via a choice modelling approach (see Section 8 in
the Annex document for a detailed methodology) In brief the products
presented to different respondents were systematically varied in terms of their
attributes price name picture durability and reparability35 For example
some respondents saw during the experiment a more expensive price for a
very durable product others saw a lower price for the same level of durability
Some saw products with higher others with lower durability and similarly for
reparability etc
WTP was then estimated using statistical methods by pooling responses across
respondents This approach avoids that respondents would be primed by any specific
product attributes or by any price relationships with durabilityreparability
Experimental treatments in the purchasing experiment
As for the repair experiment the experimental treatments systematically varied the look
and feel of the experimental task for different respondents Once again allocations to the
various treatments in the experimental tasks were done independently and randomly
across the different allocations This resulted in a full factorial design between products
35 Product attributes were varied in addition to varying the way this information was presented via experimental treatments (see next subsection)
Behavioural Study on Consumersrsquo Engagement in the Circular Economy
39
and treatments This means that group sizes for different variants within each treatment
category were roughly equal and each respondent had the same likelihood of being
assigned to any specific treatment This also ensures that on average there should not
be any interactions between different types of experimental treatments (see Section 9 in
the Annex document for the full argument)36
Framing of durability and reparability information All respondents were always
shown the EU Energy Label or Ecolabel (for coats) as shown in Figure 7 and Figure 8
This information treatment varied how and whether information on durability andor
reparability was available in addition to the EU EnergyEcolabel The setup was a full
factorial design with 2x6 variants as shown in Table 9 below (see Section 9 in the
Annex document for the full argument)
An example of how the experiment screen looked with durability information is shown
below in Figure 9 Table 9 then shows the different information variants and examples
of these are shown thereafter
Figure 9 Purchasing experiment using the EU Energy Label and durability information
treatment displayed as lsquoExpected lifetimersquo
Notes The pictures of mobile phones shown in this figure are different from the ones seen in the experiment by respondents for copyright reasons
36 Since the same percentage of participants were exposed to a specific treatment variant in all other treatments (eg the same number of respondents saw the no claim social claim savings claim conditions in all other treatments) the effect of the treatment on other treatment is cancelled out on average In the analysis each treatment is analysed in isolation ie averaging across all variants of any other treatment This setup should safeguard that there is no lsquocontaminationrsquo between different types of treatments and is common practices in large-scale controlled behavioural experiments like this one (see for example the setup of the behavioural experiment in the Lot 3 study to support the lsquoStudy for the Fitness Check of EU consumer and marketing lawrsquo European Commission 2017
Behavioural Study on Consumersrsquo Engagement in the Circular Economy
40
Table 9 Treatment variants of the framing of durability and reparability treatment
Notes [1] lsquoManufacturer warrantyrsquo and lsquoExpected lifetimersquo were not explained or defined further in the experiment It is a common market practice for manufacturers and retailers to display durability claims beyond the legal guarantee of 2 years in this way Manufacturer warranties and expected lifetimes may be seen as a service to consumers or a possible signal for quality but the experiment remained silent about the precise meaning
[2] Durability on EU labels was defined as The period in which the manufacturer promises to replace or repair the product free of charge
[3] Reparability on EU labels was defined as Ease-of-repair rating based on availability of repair manuals spare parts and repair services
The lsquomini labelrsquo refers to a reduced version of the EU Energy Label which was shown as
part of the product description Such lsquomini labelsrsquo are commonly found in product
descriptions of online retailers Full labels instead are usually shown on products in brick-
and-mortar shops Like in reality clicking on the label expanded it to the lsquofull labelrsquo
version and showed additional information on the label elements (eg descriptions of the
meaning of its elements) In the lsquofull labelrsquo variants the full EU Energy Label was
featured on the product descriptions right away Clicking on the label expanded its size
and showed additional information as in the mini version The two label versions as they
appeared in the purchasing experiment are shown in the figure below
Durability information Reparability
information
Label type Variant
number
Not shown Not shown Mini label 1a
Full label 1b
Shown on EU label[2]
(handshake icon amp years
months)
Not shown Mini label 2a
Full label 2b
Not shown Shown on EU label
(spanner amp screwdriver
icon with A-G rating)[3]
Mini label 3a
Full label 3b
Shown on EU label[2]
(handshake icon amp years
months)
Shown on EU label
(spanner amp screwdriver
icon with A-G rating)[3]
Mini label 4a
Full label 4b
Shown as lsquoManufacturer
warrantyrsquo[1] not on EU
label
Not shown Mini label 5a
Full label 5b
Shown as lsquoExpected
lifetimersquo[1]
not on EU label
Not shown Mini label 6a
Full label 6b
Behavioural Study on Consumersrsquo Engagement in the Circular Economy
41
Figure 10 Full label and lsquomini-labelrsquo in the purchasing experiment
The different types of durability and reparability information were shown to respondents
either within an EU label (ie EU Energy or EU Ecolabel) or outside of it Figure 11 shows
the look of durability and reparability information within the EU Energy Label The label
using the handshake icon represents durability information (here 15 years)37 The label
with the spanner and screwdriver icon represents reparability information (here category
A)38
Clicking on the EU labels enlarged the label and provided additional information on the
meaning of the different label elements Durability and reparability were defined as
follows
bull Durability The period in which the manufacturer promises to replace or
repair the product free of charge
bull Reparability Ease-of-repair rating based on availability of repair
manuals spare parts and repair services
37 Different icons were discussed for representing durability in the experiment design phase The handshake icons was chosen but not tested beforehand It is thus possible that other types of icons would be more or less effective compared to the icon chosen for this study
38 As for durability different icons were discussed for representing reparability as well Previous studies seemed to suggest that the chosen A-G scale is well understood by consumers Instead scales with for example star ratings or numeric ratings may work less well
Behavioural Study on Consumersrsquo Engagement in the Circular Economy
42
Figure 11 Durability and reparability information within EU labels
Notes the handshake icon shown in the figure is different from the one seen by respondents in the experiment for copyright reasons
Label variants as numbered in Table 9 above From left to right 1b 2b 3b 4b Durability ranged from 2-10y for VC 2-15y for DW 2-7y for TVs 2-10y for coats and 24-42 months for smartphones Reparability took values A C E or G (see Table 8)
Figure 12 shows durability information shown outside of an EU label as it would appear
in the experiment for smartphones As the figure shows the EU label was always shown
to respondents
Figure 12 Durability information outside of EU labels
Note Label variants as numbered in Table 9 above From left to right 1b 5b 6b Durability ranged from 2-10y for VC 2-15y for DW 2-7y for TVs 2-10y for coats and 24-42 months for smartphones (see Table 8)
Behavioural Study on Consumersrsquo Engagement in the Circular Economy
43
The way durability and reparability information were shown was carefully designed in line
with existing evidence on the types of labels which can be expected to be most impactful
and best understood by consumers A European Commission study39 on environmental
labelling tested star ratings lsquowater droprsquo ratings and letter (A-G) ratings and found that
the letter rating was universally best understood The study revealed that star ratings
were appealing to consumers which was also found in focus group discussions in this
study (see section 63) however this appeal did not translate into better understanding
Similar conclusions were also drawn by an EESC study40
Another European Commission study in 201741 tested the presentation of durability
information in terms of years and functional lifetime The study showed that providing
durability information had an impact on behaviour but there was no difference between
the different presentations of durability information Other evidence instead seems to
suggest that consumers find it difficult to understand functional lifetime information
because they have difficulty estimating the meaning of different unit or their use of
products42
Nudges and claims about durability This treatment varied whether respondents
would see a claim highlighting potential positive impacts of durability Similar claims
have been shown to have significant effects on subsequent behaviour43 The following
variants were used
o No claim Respondents did not see any claim about durability
o Claim about long-term savings Respondents in this variant saw the claim
that more durable products may generate long-term savings Figure 13 shows
a screenshot of this claim in the experiment
o Claim about other people Respondents in this variant saw a different claim
which stated that the majority of people choose more durable and more easily
repairable products Figure 14 provides an example of the claim as used in the
purchasing experiment
Figure 13 Savings claim in purchasing experiment
Notes The claim was shown to respondents in the respective treatment as a pop-up on screen at the beginning of each purchasing stage
39 European Commission (2012) lsquoResearch on EU product label options - Study delivered by Ipsos MORI London Economics and AEArsquo available at httpseceuropaeuenergysitesenerfilesdocuments2012-12-research-eu-product-label-optionspdf
40 European Economic and Social Committee (2016) lsquoThe Influence of Lifespan Labelling on Consumersrsquo available at httpswwweesceuropaeuresourcesdocs16_123_duree-dutilisation-des-produits_complet_enpdf
41 European Commission (2017) lsquoConsumer Market Study to Support the Fitness Check of EU Consumer and Marketing Lawrsquo a study by GfK Belgium available at httpeceuropaeunewsroomjustitem-detailcfmitem_id=59332
42 Larrick Soll (2008) lsquoThe MPG Illusionrsquo Science Schwarz (1999) lsquoSelf-reports How the questions shape the answersrsquo American psychologist
43 See The Behavioural Insights Team (2015) EAST Four simple ways to apply behavioural insights available at httpwwwbehaviouralinsightscoukwp-contentuploads201507BIT-Publication-EAST_FA_WEBpdf Allcott (2011) lsquoSocial norms and energy conservationrsquo Journal of Public Economics Coffmann et al (2017) lsquoCan Social Information Affect What Job You Choose and Keeprsquo American Economic Journal Applied Economics
Behavioural Study on Consumersrsquo Engagement in the Circular Economy
44
Figure 14 Social claim in purchasing experiment
Notes The claim was shown to respondents in the respective treatment as a pop-up on screen at the beginning of each purchasing stage
This lsquoclaimsrsquo treatment was tested in addition to the treatment above which varied
whether and how durabilityreparability information was disclosed It could be expected
that the claims treatment would have increased the attention respondents paid to the
durabilityreparability information in the other treatment ie there could have been a
positive interaction between these two treatment conditions Due to the way the
experiment was set up such potential lsquocontaminationrsquo effects have been controlled for
because there was an equal number of respondents who saw lsquono claimrsquo the lsquosavings
claimrsquo and the lsquosocial claimrsquo and who would have seen respectively lsquono CE informationrsquo
lsquodurability information on an EU labelrsquo etc When analysing the results of the information
treatment an average of all respondents in the claims treatment is taken (ie including
those who saw a claim and those who did not) such that one would expect the effect of
the lsquoclaimsrsquo treatment to average out and not contaminate the lsquoinformationrsquo treatment
This approach is common practice in similar controlled behavioural experimental studies
(see for example the design of the Lot 3 study supporting the lsquoStudy for the Fitness
Check of EU consumer and marketing lawrsquo European Commission 2017 and the Annex
for a theoretical development of the validity of this approach)
Incentives in the purchasing experiment
Similar to the setup of the repair experiment the purchasing experiment also had
additional monetary incentives
The following instructions44 were shown to respondents
TASK DESCRIPTION
You will play 3 rounds of this game
In every round you will be given a budget You can use this budget to purchase
products in this game Whatever you donrsquot spend you keep You will receive 1 point
for every euro100 you have at the end of this survey
Like in reality you will get some lsquobenefitsrsquo from using a product like the pleasure of
watching a film on a nice TV or looking good in a new coat These benefits in form of
additional survey points accrue over time You might get some indication on how
long the product will work well but like in reality this information might not be accurate
The more benefits you get from a product the more points you earn
Each product is designed to be an attractive option so you must choose what you
think is the best product for yourself
As for the repair experiment respondents were given a budget for each of the three
rounds of the experiment task which they could use to pay for purchasing the products
44 Prices were converted into local currencies in non-Euro countries
Behavioural Study on Consumersrsquo Engagement in the Circular Economy
45
The cost of the purchased product was deducted from the budget to reflect real-life
budgetary constraints Respondents then lsquoearnedrsquo points for the longevity of their
products This latter mechanism reflected real-life monetary advantages of durable
products
As before respondents completed a comprehension stage with a detailed description of
the task and incentives as well as comprehension questions
Behavioural Study on Consumersrsquo Engagement in the Circular Economy
46
EVIDENCE AND FINDINGS
Behavioural Study on Consumersrsquo Engagement in the Circular Economy
47
3 Consumersrsquo willingness to engage in the Circular Economy
This section of the report provides information gathered from the literature stakeholder
interviews focus groups and consumer survey on consumersrsquo willingness to consider the
durability andor reparability of products in other words consumersrsquo willingness to
engage in the Circular Economy This section highlights if why and how consumers take
the durability and reparability of products into account in general for example when
purchasing new products and when using products
Later sections dive deeper into many of the topics which were touched upon in this
section
Key findings
All strands of research demonstrated that consumers were generally willing
to consider the durability and reparability of products when purchasing new
products
All strands of research found indications that consumers are motivated to engage
in the CE because they care for the environment The focus groups furthermore
highlighted that being able to save money was another key motivator for
purchasing more durable products
A majority of survey respondents claimed to be aware of the durability of the
products they purchased (64) as well as of repair services (58)
Respondents also indicated that they frequently searched for durability and
reparability information of products (62 for durability and 55 for
reparability) Yet as found in the further analysis presented in section 4
respondents often felt durability and reparability information was difficult to find
and would like to receive better information regarding these types of product
characteristics
A majority of respondents (93) reported that they kept things they owned for a
long time recycled unwanted possessions (78) and repaired possessions if they
broke (64) Respondents furthermore felt that their peers (close friends and
family) displayed similar levels of engagement in CE practices
These stated attitudes in the survey were widely supported by the literature
stakeholder interviews and focus groups
Some previously conducted surveys assessed as part of the literature review
found that consumers are at least to some extent willing to change their
lifestyle to address sustainability issues In particular some previous studies
as well as interviews with stakeholders have documented that consumer are
willing to pay for products with better environmental credentials Yet the French
CREDOC for example reported that consumers could be reluctant to adopt more
sustainable purchasing choices Other experts have highlighted that survey
research needs to be interpreted with caution as there might be a discrepancy
between what people say about their CE behaviours and what they
actually do
Generally there was agreement across the different strands of research that
many CE decisions depend on a trade-off between price and other considerations
(such as eg quality convenience caring for the environment being good at
repairing) The literature stakeholder interviews and focus groups reported a
certain level of caution towards CE product characteristics Consumers may find it
difficult to assess whether repairing a product would be worthwhile whether
refurbished or second hand products presented good value for money Such
uncertainty can lead consumers to purchase brand new products instead
especially when the price difference between new and second hand or
refurbished products is not substantial
Regarding product-specific willingness to engage in the CE according to the
literature stakeholders and focus groups durability and reparability were seen as
most important for large more expensive and less fashion-dependent products
such as white goods Instead these CE credentials were seen as less important
for fashion and technology items which are replaced more frequently At the same
time consumers can become attached to fashion items especially clothing which
then makes them reluctant to replace items and opt for repair instead
Behavioural Study on Consumersrsquo Engagement in the Circular Economy
48
Furthermore for fashion products there was a higher willingness to buy second
hand (clothes smartphones) or to rent or lease such products (smartphones)
It emerged from the focus group discussions that some consumers especially
those in potentially vulnerable situations were interested in purchasing
smartphones second hand to save money compared to brand new phones
A minority yet still sizable share of survey respondents were interested in
engaging with novel CE practices such as leasing products instead of
purchasing them The share of respondents who would be willing to lease a
product rather than purchase it was lowest for vacuum cleaners (10) and
highest for smartphones (25) These relatively low levels of interest may have
been partly driven by general unfamiliarity with such practices Yet taking into
consideration that leasing practices are novel there seems to be a sizable
market potential currently untapped by leasing providers Leasing and renting
practices are further discussed in section 442
31 Evidence from the literature and data collection
311 General willingness to engage in CE practices
The literature shows that consumers are to a certain extent willing to engage in CE
practices and are willing to pay for more durable products Consumersrsquo willingness to
engage in sustainable purchasing practices derives primarily from their concern about the
environmental impact of the linear economy and to a lesser extent from their desire to
save money for example by repairing or buying a second hand product
As several surveys show consumers take the environmental impact of their
purchasing decisions into account In a survey carried out by the French Agency for
Environment and the Management of Energy ADEME in 2013 65 out of a panel of
1000 French respondents reported environmental issues as being the most important of
their concerns while 53 chose better material and a better life standard as one of their
considerations when purchasing new products (ADEME 2014 p 10) Recent research
has found that German consumers also prioritise global environmental challenges like
climate change deforestation and over-fishing over more local and personal problems
such as the health advantages of bio-products45 In Romania consumers are also aware
of the benefits of recyclability (32) energy waste (34) and water waste (29)46 At
EU level Flash Eurobarometer 397 conducted in 2015 shows that on average more than
half of consumers (median of country-level results = 54) reported that they take the
environmental impact of goods and services into account when making a purchasing
choice47 Figure 15 illustrates consumer attitudes towards the environmental impact of
products by country
45 Benthin amp Gellrich 2016
46 Bejan Crisan Lakatos amp Lakatos 2012
47 European Commission 2013
Behavioural Study on Consumersrsquo Engagement in the Circular Economy
49
Figure 15 Consumer attitudes towards the environmental impact of products48
Source TNS Political amp Social 2013
Apart from taking the environmental impact of their purchasing decisions into account
recent Eurobarometer research has shown that 77 of EU citizens are generally willing
to pay somewhat more for products if they are confident that they are environmentally
friendly49 Moreover consumers also tend to be willing to pay more for longer
lasting products without necessarily knowing their environmental impact
Research making use of a focus group in England and Wales and a nationally
representative survey of 1104 consumers has shown that more than eight out of ten
consumers would be willing to pay extra for household electrical appliances that are
advertised to last longer and have a longer commercial guarantee or warranty On
average they would be willing to pay 10 more50 Although it is generally not the
foremost consideration when buying a new product consumers do see a long lifetime as
a core requirement and there is a clear interest from consumers in longer lasting
products51
In the Netherlands 55 of consumers take durability into consideration when making
purchases up from 50 last year Bruumlggenwirth amp Witte (2016 p 1) find that 29 of
consumers remain highly enthusiastic about the Circular Economy and are the
forerunners in engaging in CE practices These are known as the so-called ldquodriversrdquo and
ldquosympathisersrdquo However the group of the ldquowilling people who are willing to participate
in the Circular Economy but who are not leaders and who need to be motivated to
engage has grown from 22 to 26 last year
Consumers in the Nordic countries (SE NO FI and DK) are more willing to establish
circular behaviours such as recycling repair and second hand trade rather than renting
and co-owning products According to a survey conducted in the four Nordic countries in
which 300 respondents per country participated the main reason for consumers to
repair or buy second hand products is to save money To be specific 74 of
Swedish 67 of Norwegian 68 of Danish and 59 of Finnish respondents were
interested in repairing or buying second hand products because of potential cost savings
The same study highlights that millennials (young people born between 1990 and 2000)
in the Nordic countries are much more interested than the average population in
engaging in CE practices such as recycling repair and second hand trade and that
48 Note Values on the y-axis represent the percentage of respondents that answered the question ldquoConsidering everything you bought during the last two weeks did the environmental impact of any goods or services influence your choicerdquo in the survey with ldquoYes for all or most goods or services you boughtrdquo ldquoYes but only for somerdquo or ldquoYes but only for one or twordquo
49 European Commission 2013 p 55
50 Knight King Herren amp Cox 2013
51 Knight King Herren amp Cox 2013 p 4
Behavioural Study on Consumersrsquo Engagement in the Circular Economy
50
women age between 30 and 44 years with children living in urban areas are more open
to participate in circular activity of any description in the near future They are
characterised as ldquochange makersrdquo Nordic citizens are the most circular today and open
to do even more tomorrow and therefore they are the ones that companies and
governments should target52 In a 2014 Eurobarometer 77 of citizens in the EU claim
to prefer making an effort to repair their products to buying new ones and 37 are
willing to buy second hand household appliances because of the expected economic
savings
Moreover the decision to repair a product or buy a more durable product may be
influenced by the behaviour of others As mentioned above in the Netherlands the
group of people who are willing to participate in the Circular Economy but who are not
leaders and who need to be motivated to engage was the fastest growing from 22 in
2014 to 26 last year53 This role as ldquolaunching customerrdquo could be played by national
governments or the European Union54
Several factors play a role in accounting for the growing consumer interest in
participating in CE practices For instance consumers can frequently change their
behaviour patterns because of their growing concern about environmental preservation
85 out of the 1000 French respondents indicated that they believed that a change of
lifestyle was needed because of environmental concerns resulting in a bigger
commitment to reuse products55 Moreover social factors may also account for the
willingness of consumers to engage in the Circular Economy As in Spain this
commitment can also be explained by a renewed interest for the feeling of belonging to a
community and the wish to participate in social networks56 Culturally consumers will
need to abandon their conception of ownership of the product for more sustainable
usage57 Lastly the rise of collaborative consumption tends to indicate an increasing
consumer preference for having access to a product rather than owning it (European
Environment Agency 2017) A survey of 8670 respondents carried out in Belgium Italy
Portugal and Spain indicated that 72 of the respondents participate in collaborative
economy activities 58 For an in-depth discussion of the drivers that play a role to
encourage consumers to engage in CE practices see Sections 411 421 and 421
However despite this willingness to preserve the environment as mentioned above it
appears that consumers can be quite reluctant to adopt more sustainable
purchasing choices CREDOC a French observatory specialising in making analyses of
the living conditions in French households researches yearly consumption behaviours In
2013 only 14 out of all the households surveyed indicated that they would adopt by
themselves consumption behaviour in line with the Circular Economy59 (A total change of
mind-set may be required to shift from linear economic consumption to a circular)
312 Willingness to engage in CE practices across products
The reviewed literature did not provide much information on consumer willingness to
engage in Circular Economy practices across products Only the WRAP study on the
product life time of electrical and electronic products stated consumersrsquo willingness to
purchase more durable product for a specific product category The study illustrates
consumersrsquo willingness to engage into certain CE practices for specific product types
ldquoworkhorserdquo products which include washing machines fridges and vacuum cleaners
52 SB Insight 2017
53 Bruumlggenwirth amp Witte 2016 p 1
54 Pijnenburg 2014
55 ADEME 2014 p 10
56 Cerdaacute amp Khalilova 2015
57 SPF Santeacute publique Seacutecuriteacute de la chaicircne alimentaire et Environnement 2014
58 Split of respondents per country BE (2132) IT (2336) PT (1698) amp ES (2313) OCU et al 2016
59 French Ministry of Ecology Sustainable Development and Energy 2014 p 38)
Behavioural Study on Consumersrsquo Engagement in the Circular Economy
51
The study suggests that consumers are willing to pay over 30 more for such products
that are backed by a longer standard warranty60 also discussed in section 411
32 Evidence from the stakeholder interviews
321 General willingness to engage in CE practices
The interviewees tended to confirm the findings from the literature review consumers
are generally willing to engage in Circular Economy practices The main difference
between the literature reviewed and stakeholder interviews is that only one interviewee
mentioned consumersrsquo increasing environmental concern as a primary factor for
consumersrsquo engagement in more sustainable purchasing practices Also a representative
of a European e-commerce trade association highlighted that online purchasing
consumers do not pay much attention to durable or repairable products Thus according
to interviewees consumers are less concerned than they claim to be about the
environmental impact when engaging in circular purchasing practices Furthermore
interviewees highlighted differences in attitudes towards Circular Economy practices
across EU Member States
Representatives of European and national consumer associations highlighted that
consumers are willing to engage in CE practices such as buying more durable
products even if that means that they need to pay more for these products One
European consumer association mentioned that consumers with lower incomes are
normally more impacted if a product breaks therefore they tend to have a greater
interest in the durability of products A good way of measuring consumersrsquo engagement
with product durability and reparability is to examine whether at the moment of purchase
consumers buy an extended guarantee service plan or insurance If a consumer has
purchased one of these things it is very likely they have considered durability and ease
of repair to some degree according to a representative of an NGO based in the UK
However it is important to note that consumers may take longer warrantiesextended
commercial guarantees61 as a proxy for durability The European trade association
representative highlighted that even though longer warrantiesextended commercial
guarantees are used as proxies it does not mean that products with longer
warrantiesextended commercial guarantees are easier to repair or more durable
Regarding reparability the situation is a bit different according to a representative of a
European consumer association as consumers are interested in repair but the
process is often too difficult long or expensive A Dutch Circular Economy expert
also emphasised that people are very interested in repair and self-repair and he
mentioned that repair is still a very niche practice among consumers but that it has a lot
of potential However an NGO representative from the Czech Republic indicated that lsquothe
Czech Republic is a nation that is used to repairing if something breaksrsquo
Most of the national and European trade associations also believe consumers are
willing to engage in more suitable purchasing practices In addition national and
European trade association representatives highlighted that consumers are starting to
shift their need from product ownership to product accessibility According to a
representative of a European trade association in Austria consumers are starting to rent
washing machines from an organisation that repairs used electronic appliances The
organisation offers repair services and replacement services in case the rental machine
stops working When available leasing and repair services are being considered more
often than before by consumers Only a representative of a European e-commerce trade
association highlighted that consumers are less willing to engage in more suitable
60 WRAP 2013
61 According to Article 2 (14) of the Directive 201183EU a commercial guarantee is defined as ldquoany undertaking by the trader or a producer (the guarantor) to the consumer in addition to his legal obligation relating to the guarantee of conformity to reimburse the price paid or to replace repair or service goods in any way if they do not meet the specifications or any other requirements not related to conformity set out in the guarantee statement or in the relevant advertising available at the time of or before the conclusion of the contractrdquo See httpeur-lexeuropaeulegal-contentENTXTPDFuri=CELEX32011L0083amprid=1
Behavioural Study on Consumersrsquo Engagement in the Circular Economy
52
purchasing practices meaning buying longer lasting goods and products that could be
repaired when buying online The interviewee highlighted that this is due to the
decreasing prices of technology consumers tend to change their products more
regularly
Representatives from two Dutch public authorities said that there are important
differences between what consumers say in surveys and what their actual considerations
are when purchasing products This is because price differences between durable
and less durable products still play an important role However as mentioned by
the same interviewees it is important to take into account the type of consumers
Many consumers do not care about the Circular Economy at all but some consumers are
intrinsically motivated to live sustainably and are usually willing to consider the durability
or reparability of products
322 Willingness to engage in CE practices across products
From the interviews conducted it has become clear that there are some variations across
products for certain products consumers are more willing to engage in CE practices
than for other products
Consumers are willing to invest more in durable products that are less dependent
on fashion trends like washing machines and other white goods as highlighted by a
Dutch public authority representative On the other hand according to an expert in the
field of Ecodesign product durability is a concern for consumers only for those products
that break down often (eg smartphones) Both interviewees agreed that for large
domestic appliances durability is a concern when purchasing a new product and
consumers would be willing to pay more if these products lasted longer Interviewees
confirmed this statement from the literature review in Section 312 consumers are
willing to pay more for more durable washing machines An interviewee from a
Hungarian NGO also highlighted that consumers take durability characteristics of large
domestic appliances more into account in comparison to smartphones when purchasing
because there is more durability information available for this product category
According to a Circular Economy expert from the clothes industry if consumers perceive
pieces of clothing to be more fancy or special they take better care of them and they
are more willing to bring it to a repair service or repair it themselves It is
important to note that the degree to which consumers are willing to pay for the repair of
their products is dependent on the consumerrsquos perception of how special the piece of
clothing is and not how expensive the piece of clothing actually was On the other hand
an NGO representative mentioned that young consumers are not used to self-repair they
do not know how to sew anymore and are not interested in acquiring the skill The
willingness to repair or replace a product is influenced by the degree of product
attachment People feel an emotional attachment to certain products (clothes and
phones for instance) and consequently they want these to last longer as highlighted by
a representative of a UK NGO
Furthermore two Czech interviewees one representing a consumer association and the
other an NGO highlighted that consumers expect more durability and reparability
from electronic products than from clothes even though they have observed that
consumers are getting more and more used to products not being repairable However
the interviewees reported that consumer willingness to engage more in CE practices
depends on how convenient a repair would be for them For the two product categories
mentioned electronic products and clothes there are established repair services and
therefore these are easier to repair For other products this is less so therefore
consumers are also less willing to let these products be repaired The interviewees noted
that consumers are also more willing to engage in CE practices for product groups such
as white goods which are traditionally more consumer-oriented and which have more
developed systems for customer care services including repair
Behavioural Study on Consumersrsquo Engagement in the Circular Economy
53
33 Evidence from the focus groups
331 Willingness to engage in CE practices across products
Durability
Focus group participants considered durability - the time period during which a product
can be used before it breaks down ndash to be highly important (see also section 431)
Therefore participants across the four countries were very interested in purchasing
products that lasted longer This was particularly the case for products that participants
considered to be ldquoimportant investmentsrdquo such as dishwashers and washing machines
When talking about white goods (washing machinesdishwashers) views with regard to
the importance of durability were nearly unanimous Opinions with regard to the
importance of durability varied more when talking about other types of products Some
participants felt that durability was just as important for products such as televisions
and smartphones while for others technological progress was a factor influencing them
to purchase this type of products more frequently and therefore their expectations with
regard to these productsrsquo lifetime were lower
ldquoI like having products a long time I do not need the newest device I still have
my TV that I bought 30 years ago It still works so why should I buy a new onerdquo
(Man vulnerable group Berlin)
ldquoWell you know there are so many new developments and sure I like to have a
new TV or a new Smartphone from time to time I have old smartphones in my
drawers and I think they still workrdquo (Man mixed group Berlin)
Similarly for clothing participants expected durability to vary according to price and
brand Fashion was also brought up because people tend to purchase certain clothing
items more often due to changing fashion trends
Reparability
Opinions varied with regard to having products repaired Participants were generally
willing to have products repaired (particularly white goods such as washing machines
and dishwashers) as long as they were still under warranty Once products were no
longer under warranty preferences towards having them repaired or replaced with new
ones varied according to various factors such as
Price of repair vs price of the new product ldquoIf the difference in cost between
repair and a new one is too little I prefer the new one Maybe I also get some
improvementsrdquo (Male vulnerable group Stockholm)
The price of the product itself (the lower the price the more likely participants
were to prefer a replacement) ldquoMy hoover for 19 euros I wouldnrsquot think about fixing
itrdquo (Man mixed group Dublin)
The time it would take to have a product repaired
Technological progress
Trust towards the quality of the repair ldquoWhen they repair a product you never
know if it will really work again properly and you do not know how long it will work
again I would rather decide on a new one also because there are new technologies
out there yet againrdquo (Man mixed group Berlin)
Views also varied in the case of smartphones Some would prefer buying a new one
because technology for smartphones progresses fast Others flagged the fact that
smartphones carry a lot of personal data (such as pictures) This factor adds emotional
value to them moreover transferring this type of information from one device to
another was perceived as difficult As such having a smartphone repaired was
sometimes seen as preferable
ldquoMy smartphone has all my pictures and memories on it I would even say I have
an emotional connection to it That is why I do prefer to repair it Also because it
is always a hassle to transfer everything on a new phonerdquo (Woman vulnerable
group Berlin)
Behavioural Study on Consumersrsquo Engagement in the Circular Economy
54
In Germany and Ireland willingness to have products repaired was somewhat stronger
among some of the participants from the vulnerable groups However the above-
mentioned factors were also taken into account by these participants
For clothing Irish participants (particularly from the vulnerable group) flagged the fact
that they would be willing to have them repaired This applied however mainly to more
expensive purchases such as shoes or coats and to a lesser extent to other clothing
items
ldquoI had a jacket for ages and the buttons started to come off so I asked my dad
to sew them back on Thatrsquos reparabilityrdquo (Man mixed group Dublin)
When discussing reparability participants mainly took into account aspects such as
saving money or being able to keep their products Reparability being linked to
environmental aspects was also brought up although to a much lesser extent For
example some participants in Sweden brought up the possibility of saving resources
ldquoI really do want to think about these things We have to take care of the planetrdquo
(Male mixed group Stockholm)
Recyclability
Participants in Sweden Germany and Ireland were generally willing to recycle products ndash
whether it was electronics or clothing Willingness to recycle was somewhat lower in the
Czech Republic In this country recycling was seen as time consuming as well as too
much of an effort Participants felt that recycling should be motivated by a financial
bonus for example a discount on the next purchase
Purchasing refurbished goods and second hand products
Views with regard to purchasing refurbished electronics (whether large white goods or
smartphones) were mixed In Ireland some participants (particularly from the vulnerable
group) were more willing to do this as long as they felt that the price-quality ratio was
good or that there was a large price difference between refurbished (or second hand)
products and new ones Others were concerned with the fact that products bought
refurbished or second hand would break down more easily
ldquoAnything if itrsquos quality for a bargain If the price is right also a washing
machinerdquo (Man vulnerable group Dublin)
ldquoSmartphone - I would be tempted because they are cheaper Smartphones are
so expensive The price is great then and they give the details and mention itrsquos
refurbished My current smartphone is really old and it got my moneyrsquos worth out
of it I would love to get a new one In the refurbished shop it will be 34th of the
price to buy a new onerdquo (Woman vulnerable group Dublin)
ldquoThe last time I went to buy a new phone I actually went in and looked at the
second hand phones but then still bought a new one For the same money I can
buy a new phone The other one second hand was about 2-3 years You know
what you get What you get is an old phone and for a bit more money you get a
new onerdquo (Man mixed group Dublin)
In the Czech Republic purchasing refurbished electronics was not very common and
some participants even had bad experiences with such purchases
We wanted to buy a Rainbow vacuum cleaner that cannot be bought in shops
just from dealers I heard only good things about them how wonderful they were
but they are very expensive Because we have allergic kids I wanted to buy it so
because of the price I got some refurbished one It was terrible it did not vacuum
much Moreover it was from Germany I kept writing to them that it did not work
but at the end it stayed with us so I threw it away and bought a normal bag-less
onerdquo (Woman mixed group Prague)
On the contrary across the four countries purchasing second hand clothing was a lot
more common (especially among the more vulnerable groups) Reasons for this were
related to cost but also to quality Many participants felt that second hand (or ldquovintagerdquo)
clothing was of higher quality and more durable than new clothing
Behavioural Study on Consumersrsquo Engagement in the Circular Economy
55
ldquoIn the past clothing was of much better quality than today and often you find
clothes that have hardly been wornrdquo (Woman vulnerable group Prague)
ldquoI really like to buy second hand clothing and I also repair my clothes when I
really like them I feel it is a good thing to dordquo (Woman vulnerable group Berlin)
ldquoI went to second hand shop because I was looking for a costume for a party but
then I got good pair of jeans Levirsquos and they were very cheap (20 euros) and very
good quality and now Irsquom going to go back And you see stuff that yoursquove never
seen before but if you go into another shop you look at stuff that is currentrdquo
(Man vulnerable group Dublin)
Participants also felt positive about purchasing second hand furniture or furniture
made from recycled materials Participants were not only motivated to purchase second
hand furniture by economic reasons but also aesthetics
ldquoI buy furniture second hand and polish them again It depends I shop in second
hand shops I would buy glasses and different thingsrdquo (Woman vulnerable group
Dublin)
ldquoThere are some shops that only sell products made from recycled material but
that is clothes or small stuff not machines Even Ikea has a small department of
stuff like that It is a good ideardquo (Man mixed group Stockholm)
Generally participantsrsquo willingness to engage in circular economy practices was
mainly driven by financial factors and by the need of having products taken away once
they break down or are no longer in use (recyclability) Environmental reasons were also
brought up but to a slightly lesser extent Participants in the Czech Republic were
somewhat less inclined to mention environmental reasons than those in other countries
34 Evidence from the consumer survey
Participants were asked to assess several statements regarding general CE related
behaviours Results are depicted in Table 10
With respect to keeping things for a long time agreement rates were high Overall
93 agreed to this statement with 42 even stating strong agreement In addition
78 of the participants agreed that they always recycle their unwanted
possessions including 26 even strongly agreeing Agreement with the statement of
always repairing possessions if they break was lower 64 including 11 stating
strong agreement with the statement Buying products second hand received the
lowest agreement rates with respect to CE related behaviours (28 including 5
strongly agreeing)
In addition participants were asked for their preference for fashion and new gadgets
Only 34 agreed with always buying the latest fashion for clothes including 5
strongly agreeing New electronic goods and gadgets seemed to be more important
to participants Overall 45 agreed to always buy new gadgets including 8 who even
strongly agreed
Behavioural Study on Consumersrsquo Engagement in the Circular Economy
56
Table 10 Agreement to statements on general CE-related behaviours (in )
Strongly
disagree
Tend to
disagree
Tend to
agree
Strongly
agree
I always keep things I
own for a long time
08 58 517 417
I always recycle my
unwanted possessions
34 188 520 258
I always repair my
possessions if they break
74 291 527 108
I buy second hand
products
311 405 238 46
I always buy the latest
fashion for clothes
217 450 289 45
I always buy new the
newest electronic goods
and gadgets
152 396 371 82
Note Participants had to rate six different statements regarding the question Q35 ldquoTo what extent do you agree or disagree with the following statements about yourselfrdquo N=12064
Source ConPolicy analysis of consumer survey data
These results are supported by results displayed in Figure 16 When calculating average
agreement to these statements and ranking them it was found that consumers in the
survey showed the strongest agreement to the statement lsquoI always keep things I own for
a long timersquo followed by lsquoI recycle my unwanted possessionrsquo In contrast average
agreement rates were below 0 ie (rather) disagreeing for buying second hand
products Similarly buying new gadgets or fashion resulted in negative average
agreement ie consumers in the survey indicated that they (on average) disagreed with
the corresponding statements
Figure 16 Agreement to statements on general CE-related behaviours (average)
Note Participants had to rate six different statements regarding the question Q35 ldquoTo what extent do you agree or disagree with the following statements about yourselfrdquo Answer categories were labelled with ldquoStrongly agreerdquo corresponding to a value of +10 ldquoTend to agreerdquo corresponding to a value of +3 13 ldquoTend to disagreerdquo corresponding to a value of ndash 3 13 and ldquoStrongly disagreerdquo corresponding to a value of -10 Average values above 0 correspond to (rather) agreeing to the statement while values below 0 correspond to (rather) disagreeing Hence an average value of 0 corresponds to neither agreeing nor disagreeing N=12064
Source ConPolicy analysis of consumer survey data
Behavioural Study on Consumersrsquo Engagement in the Circular Economy
57
Next these answers where analysed by country and socio-demographic factors The
results are displayed in detailed tables in Section 7 in the Annex document and
summarised here below
For the statement I always keep things for a long time respondents in all countries
on average revealed high agreement rates The three countries with the highest average
agreement rates were Germany Austria and Portugal The lowest agreement rates were
found in the Czech Republic Hungary and Latvia With respect to participantsrsquo age a
positive trend was found The higher the age category the higher average agreement
With respect to education and income no systematic differences between average
agreements were observed
Respondents agreed less to the statement of always recycling their possessions
compared to keeping things for a long time The highest agreement rates were found in
Sweden but Ireland and Spain similarly revealed high agreement rates The lowest
agreement rates were observed in Hungary and Latvia Again a positive trend was
observed for the different age groups while education and income seemed to not follow
systematic patterns
As stated above respondents less often said they always repaired their possessions
This was true for all the different Member States The Czech Republic and Romania on
average even rather disagreed with the repair statement While all other Member States
at least tended to agree With respect to the other socio-demographic factors ie age
education and income no systematic patterns were found
Agreement with buying second hand products was on average even lower The
country averages indicated disagreement with the statement especially in Austria Spain
and the Czech Republic When looking at the different age categories a negative trend
was found The higher the age category was the lower was the self-reported agreement
rate With respect to the other socio-demographic factors no systematic patterns were
observed
In the fashion-category there were interesting country differences as well In all
countries but Romania survey participants on average tended to disagree with lsquoalways
buying the latest fashion for clothingrsquo Agreement rates were lower among older age
groups With respect to education and financial status differences were not as
pronounced
Lastly agreement rates on buying new electronic gadgets were on average also low
Romania was again an exception in this category On average Romanian consumers
indicated to tend to agree to buy new electronic items The same was true for the
Netherlands and France With respect to age and education no specific patterns were
observed while consumers indicating their financial situation to be very difficult indicated
less agreement to buying new gadgets compared to wealthier income groups
In parallel participants were asked the same question but this time not with respect to
their own behaviour but with respect to the behaviour of their close friends and relatives
Results are displayed in Table 11
It appears that a majority of respondents think that their peers reveal similar CE-related
behaviours to themselves A majority (80) agreed that their friends and relatives keep
things they own for a long time including 12 who strongly agreed They also believe
that their friends and relatives recycle their unwanted possessions (70 tended to
agree and 12 strongly agreed) and the majority of participants also stated agreement
to the statement that friends and relatives always repair their possessions if they
break (61 including 6 strong agreement) Similar to their own behaviour agreement
to friends and relatives buying second hand products was lower with 34 (including
2 strongly agreeing)
Friendsrsquo and relativesrsquo preferences for fashion or gadget trends were similarly aligned
with own behaviour 43 agreed with the statement that their friends and relatives
always follow the latest trend or fashion including 4 stating their strong
agreement In addition 46 indicated their agreement to the statement that their
friends and relatives always buy the newest electronic goods and gadgets (including
5 strongly agreeing)
Behavioural Study on Consumersrsquo Engagement in the Circular Economy
58
Table 11 Agreement to statements on general CE-related behaviours of friends and
relatives (in )
Strongly
disagree
Tend to
disagree
Tend to
agree
Strongly
agree
Keep things they own for a
long time
10 190 678 121
Recycle their unwanted
possessions
26 274 580 120
Always repair their
possessions if they break
43 352 550 55
Buy second hand goods 160 499 319 22
Always follow the latest
trend or fashion
100 468 394 38
Always buy the newest
electronic goods and
gadgets
87 450 413 51
Note Participants had to rate six different statements regarding the question Q91 ldquoTo what extent do you agree or disagree with the following statements about your close friends and relatives Most of my close friends and relativeshelliprdquo N=12064
Source ConPolicy analysis of consumer survey data
These results are supported by Figure 17 wherein average agreement to the
corresponding statements is displayed The ranking of agreement rates for friends and
relatives is in parallel to those for survey participants themselves (compare Figure 16
from above)
Figure 17 Agreement to statements on general CE-related behaviours of friends and
relatives (average)
Note Participants had to rate six different statements regarding the question Q91 ldquoTo what extent do you agree or disagree with the following statements about your close friends and relatives Most of my close friends and relativeshelliprdquo Answer categories were labelled with ldquoStrongly agreerdquo corresponding to a value of +10 ldquoTend to agreerdquo corresponding to a value of +3 13 ldquoTend to disagreerdquo corresponding to a value of ndash 3 13 and ldquoStrongly disagreerdquo corresponding to a value of -10 Average values above 0 correspond to (rather) agreeing to the statement while values below 0 correspond to (rather) disagreeing Hence an average value of 0 corresponds to neither agreeing nor disagreeing N=12064
Source ConPolicy analysis of consumer survey data
Next participants were asked to rate their agreement with further statements regarding
environmental attitudes and general CE-behaviours Results can be found in Table 12
Behavioural Study on Consumersrsquo Engagement in the Circular Economy
59
With respect to environmental attitudes high agreement rates can be found Overall
91 of the participants agreed with the statement that it is important to be
environmentally friendly including 40 agreeing strongly Another 62 agreed with
the statement that they want their friends to know that they care for the
environment including 14 agreeing strongly
Generally respondents displayed attitudes in favour of CE practices A majority of
participants (64) stated that they know the expected lifespan of a product when
they buy things (with 7 agreeing strongly) Agreement with being aware of repair
services for the products they own was 58 with 9 indicating strong agreement
With respect to the statement that second hand products are usually good quality
49 of participants indicated their agreement including 3 agreeing strongly
At the same time a majority of respondents 77 also indicated preferences for
brand new possessions Yet only 18 of participants stated that they agreed to the
statement that they wanted their friends to know that they own the latest trend or
fashion (including 3 strong agreement)
Table 12 Agreement to further statements on general CE-related behaviours and
environmental attitudes (in )
Strongly
disagree
Tend to
disagree
Tend to
agree
Strongly
agree
It is important to be
environmentally friendly
15 74 516 395
I want my friends to know
that I care for the
environment
85 290 486 139
When I buy things I know
the expected lifespan of the
product
44 319 569 67
I am aware of repair
services for the products I
own
67 349 495 89
Second hand products are
usually good quality
50 457 460 32
I much prefer possessions
that are brand new
34 191 552 222
I want my friends to know I
own the latest trends or
fashion
381 439 154 27
I trust claims made by
companies about their
products
72 454 446 28
I am usually very busy and
lack free time
103 395 420 81
If something is good
enough I donrsquot need it to
be perfect
17 145 686 152
Note Participants answered the question Q41 ldquoTo what extent do you agree or disagree with the following statementsrdquo N=12064
Source ConPolicy analysis of consumer survey data
Figure 18 presents further insights on the question Here average agreement was
calculated for each item and results were ranked by average agreement The highest
Behavioural Study on Consumersrsquo Engagement in the Circular Economy
60
average agreement was reported for the importance of being environmentally friendly
On the lower end survey participants on average disagreed with the statement lsquoI want
my friend to know I own the latest trends or fashionrsquo
Figure 18 Agreement to further statements on general CE-related behaviours and
environmental attitudes (average)
Note Participants answered the question Q41 ldquoTo what extent do you agree or disagree with the following statementsrdquo Answer categories were labelled with ldquoStrongly agreerdquo corresponding to a value of +10 ldquoTend to agreerdquo corresponding to a value of +3 13 ldquoTend to disagreerdquo corresponding to a value of ndash 3 13 and ldquoStrongly disagreerdquo corresponding to a value of -10 Average values above 0 correspond to (rather) agreeing to the statement while values below 0 correspond to (rather) disagreeing Hence an average value of 0 corresponds to neither agreeing nor disagreeing N=12064
Source ConPolicy analysis of consumer survey data
Finally participants were asked to indicate whether they search for durability and
reparability information when purchasing a product Table 13 shows the results
62 indicated that they always search for information on how long a product will
last (including 10 strong agreement) Similarly a majority also indicated searching
for reparability information (55 including 8 strongly agreeing with the statement)
Behavioural Study on Consumersrsquo Engagement in the Circular Economy
61
Table 13 Agreement to searching for durability and reparability information (in )
Strongly
disagree
Tend to
disagree
Tend to
agree
Strongly
agree
I always search for
information on how long a
product will last
54 329 516 102
I always search for
information on how easy it
is to repair a product
73 378 464 84
Note Participants answered the question Q51 ldquoTo what extent do you agree or disagree with the following statementsrdquo N=12064
Source ConPolicy analysis of consumer survey data
Figure 19 displays results when transferring answer categories and calculating average
agreement It can be found that average agreement rates for both statements resulted in
a positive but rather low average agreement ie survey participants indicated that they
rather agreed on searching for durability and reparability information
Figure 19 Agreement to searching for durability and reparability information (average)
Note Participants answered the question Q51 ldquoTo what extent do you agree or disagree with the following
statementsrdquo Answer categories were labelled with ldquoStrongly agreerdquo corresponding to a value of +10 ldquoTend to agreerdquo corresponding to a value of +3 13 ldquoTend to disagreerdquo corresponding to a value of ndash 3 13 and ldquoStrongly disagreerdquo corresponding to a value of -10 Average values above 0 correspond to (rather) agreeing to the statement while values below 0 correspond to (rather) disagreeing Hence an average value of 0 corresponds to neither agreeing nor disagreeing N=12064
Source ConPolicy analysis of consumer survey data
In addition results on searching for durability as well as reparability information were
analysed by country and socio-demographic factors which are summarised here below
and displayed in detail in Section 7 in the Annex document
With respect to searching for durability information the highest agreement rates
were found for Romania In contrast the lowest agreement rates were observed in
Sweden the Netherlands and Germany where participants on average indicated that they
neither agreed nor disagreed to the statement With respect to age a small positive
trend was observed and similarly participants with higher education also revealed higher
average agreement rates Respondentsrsquo financial situation on the other hand did not
influence agreement rates
Searching for reparability information was country dependent as well While
countries such as Portugal Romania and Hungary tended to agree that they searched for
reparability information Germany Sweden and in particular the Netherlands revealed
agreement rates below 0 ie on average they disagreed with the statement of searching
for reparability information There were also small age trends While agreement rates
among the youngest age group were below 0 indicating that on average participants did
not tend to search for reparability information it was above 0 among older age groups
Education again did not seem to play an important role while respondentsrsquo financial
situation did in the sense that poorer individuals were more likely to search for
reparability information
Behavioural Study on Consumersrsquo Engagement in the Circular Economy
62
341 Willingness to engage with leasing products
As a next step participantsrsquo willingness to engage with leasing products was analysed A
few companies across the EU have recently launched leasing models for baby clothing
consumer electronics or jeans62 The leasing business model is based on circular
practices as the products are not owned by the individual but instead the leasing price
includes maintenance and repair as well as exchange of the products when it has gone
out of fashion or when the consumer wishes an upgrade This way the same product
may be used by more than one consumer and materials from old products may be
recycled into new ones
The consumer survey tried to elicit consumer preferences for such leasing models via a
hypothetical choice exercise Each respondent was asked to indicate their preference
between a lsquostandardrsquo full ownership of a product or a leasing contract for a varying
number of months Respondents were told that repairs and replacement services in case
of a defect were included in the monthly price
Respondents were given the following choices
bull Purchase the product for full price
bull Lease product for 612244860 months
To ensure realism of the task monthly lease prices were calibrated using examples from
actual leasing business models Since actual business models tend not to exceed a
maximum lease of 24 months longer leases in this exercise were calibrated assuming
that beyond 24 months a product would become more likely defective or require
replacement pushing costs beyond the initial full purchasing price
The total cost of leasing for different lease durations amounted roughly to63
Table 14 Duration and cost of leasing
Lease duration Total cost of lease contract
6 months approx 40 of full purchasing price
12 months approx 60-70 of full purchasing price
24 months approx 100-110 of full purchasing price
36 months approx 130-135 of full purchasing price
48 months approx 150-165 of full purchasing price
60 months approx 165-190 of full purchasing price
Visible from Figure 20 across all product types a vast majority of participants preferred
purchasing the product instead of leasing it Around 10-15 of respondents indicated an
interest in the various leasing propositions for TVs dishwashers vacuum cleaners and
jeans Only for smartphones interest in leasing was higher around 25 and another
18 of respondent indicating lsquoDonrsquot knowrsquo which may be an indicator for indecision
62 See for example httpsviggaus (baby clothing) httpswwwottonowde (consumer electronics and durables) and httpwwwmudjeanseu (jeans)
63 Price levels were adapted for each type of product between smartphones TVs dishwashers vacuum cleaners and jeans
Behavioural Study on Consumersrsquo Engagement in the Circular Economy
63
Over all products longer lease durations were less preferred that shorter ones While
between 2-8 of the participants indicated to be willing to lease between 6 and 24
months only 0-3 stated to be willing to lease between 36 and 60 months64
The Annex displays results for the individual lease duration categories and by product in
more detail
Figure 20 Willingness to lease products for different time periods (in )
Note Participants answered the question Q71 ldquoSuppose you wish to get a new smartphone TV dishwasher vacuum cleaner jeans You have the option to either buy the phone outright for euro34999 euro71999 euro35999 euro15999 euro5999 or lease it for a certain number of months Leasing the product means that you will not own the product instead you will return it at the end of the lease for example to start a new lease for a new product or continue to use your product at a lower price Included in the monthly lease are repairs and replacement services in case of a defect Which option would you preferrdquo Smartphone N=2412 TV N=2416 Dishwasher N=2409 Vacuum cleaner N=2412 Jeans N=2415
See the Section 7 in the Annex document for a breakdown of different lease durations between 6 and 60 months
Source ConPolicy analysis of consumer survey data
When further splitting preferences for different lease durations and products 6-7 of the
participants were willing to lease televisions dishwashers and vacuum cleaners for a year
or less at a cost-equivalent of less than 70 of the actual total purchasing price Longer
leases tended to be less popular Thus it seems that there was little willingness to pay a
mark-up on original purchasing prices for maintenance and replacement services which
would be offered by leasing companies For smartphones 5-7 of respondents indicated
interest in leasing the product for each length of 6 12 and 24 months It is quite likely
that the willingness to lease smartphones is grounded in the fact that phone providers
across the EU have for a long time offered phone contracts which included
communication and a handset with typical contract durations between 12 and 24 months
The results here are corroborated also by findings presented in section 442 which report
respondentsrsquo actual experience with renting or leasing products Indeed only a small
minority of respondents (1-3) have rented or leased any of the products under
examination in the past 5 years It is thus likely that the relatively low willingness to
lease products in this hypothetical exercise was at least partly driven by substantial
unfamiliarity65 with the novel type of business model Indeed it could be conjectured
64 Within the two duration categories ie shorter with 6 to 24 months and longer with 36 to 60 months no sizable differences were found with respect to respondentsrsquo willingness to lease
65 In situations of uncertainty individuals have been shown to use the decision heuristic of choosing what is familiar to them instead of considering their true preferences See for example Della Vigna (2009) lsquoPsychology and Economics Evidence from the Fieldrsquo Journal of Economic Literature
56
27
18
72
15
14
74
13
13
79
11
10
74
16
11
0 10 20 30 40 50 60 70 80 90 100
Purchase for full price
Lease for 6 to 60 months
Donrsquot know
Smartphone TV Dishwasher Vacuum Cleaner Jeans
Behavioural Study on Consumersrsquo Engagement in the Circular Economy
64
that the willingness to engage with leasing contracts is actually sizable given the
unfamiliarity with this type of business model With growing familiarity it is well possible
that the market size for renting and leasing products could further grow thus enhancing
consumer engagement in with the Circular Economy
Findings presented in this study see for example section 44 show that respondents
desired fully owning their products and wished to use new unused products These
preferences clearly limit the attractiveness of leasing models and the study does not
deliver evidence as to whether these preferences might change if leasing models become
more widely available and better known
Behavioural Study on Consumersrsquo Engagement in the Circular Economy
65
4 Drivers barriers and trade-offs faced by consumers
This section provides information gathered on factors which motivate and discourage
consumers to engage in the CE for example via buying more durable products
repairing products when they are broken rather than replacing them buying second
hand products or leasing products rather than buying them In other words it
provides evidence gathered on the drivers (ie motivators) and barriers (ie obstacles)
to consumer engagement in the Circular Economy
This section reports findings from all methods (ie literature stakeholder interviews
focus groups consumer survey and behavioural experiment) The literature stakeholder
consultations and focus groups covered a broad scope to capture a wide range of drivers
and barriers The consumer survey built upon the findings of this qualitative research by
asking about consumersrsquo past experiences with CE practices and their reasons for taking
Circular Economy decisions (or not) Finally the behavioural experiment looked more
closely into what drives consumersrsquo decisions to repair or replace a broken product The
relative importance of economic social and psychological aspects that determine
consumersrsquo engagement in Circular Economy practices is also highlighted in this section
Key findings
It emerged clearly from the different strands of research that price is the most
important driver and simultaneously a barrier for consumer engagement
in the CE followed by convenience
More specifically in the literature three main drivers have been named for
consumers to participate in the Circular Economy which were also confirmed by
the interviewed stakeholders
o Providing consumers more and better information about the durability
of products
o Designing products with better CE credentials and
o Widening the offer of repair services from manufacturers and retailers
Four main barriers were distinguished in the literature review and corroborated
by stakeholders as well namely
o consumersrsquo lack of knowledge
o the absence of reliable information about durabilityreparability
features of a product
o high cost of repair services and
o consumersrsquo lack of trust in repair services
It seems to emerge from the findings in the literature stakeholder interviews and
focus groups that consumers are to some extent willing to trade-off price
and CE product characteristics For example consumers in a previously
conducted behavioural study were found to be willing to pay more for products
with higher durability However as highlighted by stakeholders such willingness
to pay for more durable products hinges on information provision about product
durability
Individual stakeholders have named various other factors which could act as
drivers of more engagement with the CE such as social norms about (resource)
efficiency extended warranties and better education about the topic On the
other hand they named as potential barriers to more CE engagement practical
problems with repair the availability of low-quality but cheap products fashion
and style social pressure marketing and advertising conspicuous consumption
and the cultural problem where society does not reward consumers who do
engage in CE practices
A key barrier identified by the focus groups was that consumers found it
difficult to pinpoint the durability of products Furthermore there was a
sense that newer generations of products were less durable than products that
were produced some years ago This discussion around lower durability of newer
products sometime led participants to mention the concept of planned
obsolescence
The consumer survey has instead revealed that survey respondents generally
indicated being aware of product durability and reparability (section also
34) Yet when asked specifically about the provision of such information many
Behavioural Study on Consumersrsquo Engagement in the Circular Economy
66
indicated a desire for receiving better information because they felt that it
was often difficult to find information regarding how long products would last and
how easy it was to repair products
Some interesting country differences emerged from the survey Dutch and
German survey respondents were less likely to search for durability information
compared to respondents from other Member States Dutch respondents also did
not seem to lack better information while German respondents felt strongly that
durability and reparability information was difficult to find Respondents from
Romania on the other hand were more likely to search for durability information
found this information relatively easy to find but still desired further improvement
of information provision
With respect to other socio-demographic factors age played a role for drivers and
barriers While older participants indicated to search more frequently for
durability and reparability information (section 34) they also expressed a
stronger preference for better information and indicated more frequently that
it was difficult to find the appropriate information
This indicates that the current state of information provision regarding product
durability and reparability might be a potential barrier for engaging in the CE
Providing information consistently and in straightforward format might thus be
seen as a driver for further CE engagement Findings from the behavioural
experiment shown in section 65 confirmed these findings from the consumer
survey
The study did not find overwhelming evidence of a lsquothrowaway economyrsquo This
means that the study results were mixed Though large shares of respondents
have not repaired broken products (36) a majority of consumers instead
did repair broken products across all product categories (63) Results by
product are presented in section 441
Among those with repair experience a majority had products repaired for them by
friends family or professional services
Self-repair was generally less frequent (12) compared to having products
repaired (51) The incidence of self-repair furthermore varied by product
category Self-repair was most prominent for clothing items (244) There
were some significant incidences of self-repair reported also for vacuum cleaners
and dishwashers whereas self-repair very rarely occurred for mobile phones and
TVs
The highest non-repair rate was observed among Dutch survey participants (on
average 56) while the lowest was observed among Romanian participants (on
average 25) Age and other socio-demographic factors did not play an important
role with respect to repair behaviour
Those who have self-repaired products in the past indicated lower costs being
good at repairing convenience and environmental reasons as the main
reasons for having self-repaired
The top reasons for not repairing products were price of repair the preference
to get a new product fashiontechnology or products being beyond repair
Depending on the product category consumers had meaningful experience with
third party repair services Overall experiences with such services were positive
and frequently even exceeded expectations in terms of convenience speed of
repair consumer friendliness and quality of repair
The behavioural experiment corroborated many of the findings from the consumer
survey In line with reported behaviour in the survey a majority of
respondents also decided to repair defective products in a task which
simulated the decision to repair or replace a faulty product with realistic monetary
incentives (see section 271 for the methodology section 45 for results)
The experiment has clearly confirmed the finding from the qualitative research
that convenience and ease of accessibility of repair are important drivers
of repair decisions When repairing involved slightly more effort compared to
replacing an item many respondents refrained from repairing and bought
replacement products instead The same level of effort instead did not prevent
individuals from replacing products
Behavioural Study on Consumersrsquo Engagement in the Circular Economy
67
Other behaviourally motivated mechanisms which did not change the cost of
repairing or replacing remained largely without effects Merely framing repair
prices as VAT exempt (while keeping prices constant) or providing details about
the characteristics of the repair services (eg whether repair was done by the
manufacturer or an independent shop again at constant prices) did not have
meaningful effects on repair decisions Such practices seemed to only strengthen
the decisions of certain groups of respondents For example those with pro-
environmental attitudes were even more likely to repair products when repair
services were framed as VAT exempt Instead those who attributed highest
importance to trends and fashion were further deterred from repairing by the
same treatment
Personal self-declared attitudes towards the CE were largely consistent
with actual engagement in the CE in the monetarily incentivised
experimental repair vs replace task For example respondents who
categorised themselves as attaching high importance to fashion and technology
were significantly less likely to repair products while individuals with more self-
rated pro-CE attitudes were indeed significantly more likely to repair their
products This is an important finding because it is often argued including by
some stakeholders in this study that self-reported attitudes are a result of
wanting to please the survey administrators and would not translate into actual
behaviour The behavioural experiment provided strong evidence against such
predicaments and instead reinforced that attitudes can translate into actual
behaviour especially when certain conditions are met (eg provision of CE
information)
Experience with renting leasing (1) and buying second hand (6) was
rather low in the surveyed population The main reasons for not having engaged
with such practices were that respondents wished to own their products and
generally that they preferred new unused products Among the few
respondents who have rented or leased products in the past their motivations to
do so were mixed Convenience the possibility to test the product the chance of
reusing the product after use or budget considerations all seemed to play a role
When comparing respondentsrsquo actual experience with leasing and their willingness
to lease as presented in section 3 there seems to exist a sizable market potential
for business models offering leasing products
Market data from Scandinavian countries instead showed that consumers would
in general be willing to make some sacrifices unless it required sharing goods
and letting their own goods being used by other consumers
According to the survey a limited share of consumers had purchased
second hand vacuum cleaners dishwashers TVs smartphones and
clothes Main motivators for buying second hand were price items being better
value for money and environmental reasons The main barriers to buying
second hand products seemed again to be the preferences for using new unused
products a lack of trust in second hand products as well as the perception that
new products were better value for money
Romania stood out with highest rates of buying second hand (15) while
for Portuguese consumers much lower incidences (3) were found Participants
from Ireland and Hungary also revealed comparatively larger shares of buying
second hand (10) Older respondents were generally less likely to purchase
second hand Instead consumers in a very difficult economic situation indicated a
higher frequency of buying second hand (11)
In line with findings from the survey in the behavioural experiment as well there
was relatively little engagement with second hand products In the
experiment second hand products were presented with the same prominence and
availability as new products nevertheless only about one to two respondents in
ten decided to purchase a second hand product to replace a defective product
As in the survey the likelihood of purchasing second hand in the experiment was
slightly higher for smartphones and clothes (20 chose a second hand phone or
coat) compared to the other products (13-14 chose second hand) For coats it
appeared to be the least fashion driven consumers who most often decided to buy
second hand Second hand products might be attractive if they help balance the
Behavioural Study on Consumersrsquo Engagement in the Circular Economy
68
desire to change a product with budgetary pressures (see also further findings
from the consumer survey reported in section 64)
41 Evidence from the literature and data collection
411 Drivers
From the literature review three main drivers for the participation of consumers in more
Circular Economy practices emerged
The first driver is to provide more and better information about the durability
potential of the product which mirrors the lack of knowledge For an in-depth
discussion of which information should be included exactly see sections 612 and
614
The second driver pertains to the design of the product itself
The third driver is a greater offer of repair services from manufacturers
Academic reports regulatory reports and other sources reviewed stress that better
information for consumers on product features may drive their participation in
more Circular Economy (CE) practices66
In that sense labels are useful tools for the information they provide In March
2016 a study was carried out by the SIRCOME agency the University of South Brittany
and the University of South Bohemia commissioned by the European Economic and Social
Committee on the influence of lifespan labelling on consumers67 Some 2917 participants
were asked to choose between different goods with or without labels The products
displaying lifespan information were on average chosen 46 more often than the ones
without such information In addition in the same category of products the ones with a
lifespan information label were sold 138 more often than the ones without The label
displaying lifespan in years or months had the greatest impact on consumers however
consumers had difficulty mentally picturing large numbers68 According to S Maurer and
U Pachl providing information on a productrsquos lifespan could also encourage less wealthy
households to pay more for a product that is expected to last longer69
The literature also suggests that a label providing information on the energy
performance of the good would have a positive impact on consumersrsquo
behaviours70 The lack of information about the environmental footprint of specific
goods may again be a barrier to consumers participating in the Circular Economy For
instance BHaze A Jones-Farmer and R Overstreet pointed out that consumers lack
awareness about the environmental impact of refrigerators71 However a report carried
out for the French Ministry of Environment stressed the risk of potential confusion for
consumers by the possible duplication of information with the existing Ecolabels A
clearer hierarchy would be in that sense useful72 Underlying further the influence of a
label as developed above the White Book for a Circular Economy in Greater Paris
suggests the creation of a label for second hand goods73
In addition some brands have also developed their own label For instance in 2016
the French brand SEB - one of the leaders of household appliances manufacture-
launched a logo (Figure 21) stating that the product will be repairable for ten years74
66 Westblom 2015 BEUC 2015 European Commission Joint Research Centre 2017a
67 European Economic and Social Committee 2016)
68 European Economic and Social Committee 2016
69 BEUC 2015
70 French Ministry of Ecology Sustainable Development and Energy 2014
71 Haze Overstreet amp Jones-Farmer 2011
72 French Ministry of Environment 2014
73 ADEME 2016
74 Leboucq 2016
Behavioural Study on Consumersrsquo Engagement in the Circular Economy
69
This logo will be added to every product sold by the brand According to a survey carried
out by SEB consumers would be positively influenced by this label in their purchasing
decisions75
Figure 21 SEB logo
Source Leboucq 201676
Consumers also need more guidance on how to choose more durable products and
how to take care of these products Regarding clothes for instance consumers could
be made aware of the importance of evaluating seams and the density of stitches or the
fact that fibre content plays a big role in clothing durability77 The department store John
Lewis provides shop floor staff with a guide (the Selling Partner Learning Guide78)
containing information that they can communicate to customers This includes messages
from WRAPrsquos Love Your Clothes Campaign and shares key messages on clothing
durability by making the connection between durability and higher quality the lower
environmental impact of those garments in comparison to disposable fashion and by
explaining how washing habits can affect the life expectancy of clothes and reduce their
environmental impact If labels can positively enhance consumer behaviour the design
of the products itself can incentivise a change
BHaze A Jones-Farmer and R Overstreet (2011) define consumption not only as an
act of purchasing but also as lsquodeveloping routines and rituals of use and modifying the
product concretely or symbolicallyrsquo Therefore designers and design can impact
consumers use of products in a more durable way For instance equipping refrigerators
with a transparent door can have an energy saving effect79 The user would directly take
the product he needs instead of opening the door and then start looking for it
Companies and manufacturers are the intermediaries between goods and consumers
Some of their strategies can drive more consumers to participate in the Circular
Economy For instance according to a report from Digital Europe on the Circular
Economy there is a growing trend towards establishing more repair services Besides
do-it-yourself shops where people who tend to perform self-repair can buy the necessary
75 Leboucq 2016
76 Leboucq 2016
77 WRAP 2017
78 WRAP June 2017 Sustainable Clothing a practical guide to enhancing durability and quality of clothes
79 Haze Overstreet amp Jones-Farmer 2011
Behavioural Study on Consumersrsquo Engagement in the Circular Economy
70
tools in order to do so companies have invested in establishing in-house repair
services and sub-contracting repair operators80 Some market leaders have also
been committed to providing more remanufacturingrefurbishment facilities Digital
Europe gives the example of Nokia which has been remanufacturing telecommunications
equipment since 1991 Considering as mentioned above the importance of the
consumersrsquo trust in the quality of the repair services this involvement in the repair
service market from manufacturers may enhance consumersrsquo participation in more CE
practices The fact that companies have established more repair services comes from the
growing interest of consumers in these services and in turn the new repair services may
attract more consumers to let their products be repaired rather than replace them when
they break down Besides SEB -one of the world leaders for household appliances-
supports consumers in their choice to repair instead of buying new product though
economic incentives They commit themselves to offer replacement parts which will not
exceed a threshold of 50 of the price of a new product In addition the cost of repair
will not exceed 13 of the price of the new item SEB also encourages the consumers to
rent certain products as well as to repair damaged goods by themselves Parts and
accessories will be available on a website and the brand will provide tutorials on how to
repair products81
412 Barriers
The literature review identified three main barriers faced by consumers when taking
durabilityreparability of products into consideration They relate to cognitive economic
and psychological factors and can be summarised as follows
The lack of knowledge about durabilityreparability features of a good and the
lack of reliable information about it
The cost of repair services
The lack of trust from the consumer in repair services
As economic agents consumers tend to be rational when making purchasing decisions
Wang and Hazen note that consumers assess the value and risk of the goods they are
buying82 (Two important variables were identified by the authors while lsquoquality
knowledgersquo exerts the strongest effect on perceptions the cost awareness is the second
most important factor influencing a purchasersquo83
The lack of knowledge of durability and reparability may hinder the purchase of
more durable appliances For instance S Maurer and U Pachl highlight that
consumers do not feel knowledgeable about how long fridges washing machines and
vacuum cleaners last nor do they know where to find reliable information on these
features In addition to the lack of awareness about the expected lifetime of a product
consumers also lack crucial information on the reparability of goods as well as on the
availability and costs of spare parts84 Without such information consumers are not able
to reward manufacturers who produce long lasting and easy repairable goods For a more
detailed discussion of consumersrsquo expectations understanding and awareness of the
durability and reparability of the products they buy see section 5
The other main barrier to consumer participation in repair services is the cost of
such services as identified in an article dated from 2008 in which M Watson reviewed
literature on consumersrsquo perceptions and behaviour relating to remanufactured repaired
and reused products85 It clearly appears that a lower price is the main reason people
would buy repaired goods rather than new ones Moreover the author quoted a survey
80 Digital Europe 2017
81 Leboucq 2016
82 Wang amp Hazen 2016
83 Wang amp Hazen 2016 p 466
84 BEUC 2015
85 Watson 2008
Behavioural Study on Consumersrsquo Engagement in the Circular Economy
71
which found that 68 of respondents mention high cost as the main reason they did not
get items repaired86 Similarly households with higher incomes are associated with a
higher probability of replacement87 As mentioned above consumers assess value and
risk when making a purchasing decision88 Once informed about the cost advantages of
remanufactured products compared to new ones the value of the product tends to
increase while the risk perception decreases89
When households need to repair an appliance they balance between the cost of repair
and the price of replacing it with an equivalent new product According to the literature
reviewed the ratio between the cost of repair and the price of replacement is the
main variable accounting for the replacement of product Where the cost of repair
or upgrading is higher than that of replacement consumers will logically go for a
replacement purchase90 The cost of repair can be relatively high compared to the price
of a new good particularly bearing in mind that a repair usually is labour-intensive work
As a result nearly half of the EU citizens (47) did not repair any faulty product during
the last 12 months As a national example French consumers are generally not willing to
pay more than 30 of the price of a new product for repair91 J McCullough (2009) in
an article written in 2009 provided a historical perspective of this relation between the
cost of repair and that of replacement92 Appliances are made in countries where labour
is cheaper than the country in which they will be repaired Therefore buying new
products tends to be cheaper than repairing old ones In a consumer report from 2001
34 of the respondents revealed that they did not repair a product because of the
decreasing replacement prices93 J McCullough (2010) provides another example of this
balance between repair and replacement prices for consumers through the impact of
discount rates Consumers with a high discount rate have a tendency toward instant
gratification and will replace an old appliance by a new one despite the fact that the older
appliance could still be repaired Once again this illustrates that a replacement price
lower than the repair cost will tend to hinder consumer use of repair services
The final barrier identified in the literature reviewed is the lack of trust with
consumers in repair services Consumer trust acts as an important psychological
factor when making purchase decisions JMcCollough (2009) reviewed a substantial part
of the scientific literature on the factors impacting the demand for repair services It
seems that considering the information asymmetry between technicians and consumers
consumersrsquo trust in the quality of the repair service has a great influence on their
decision to use it Indeed according to J McCullough lsquothe more trust a consumer has in
a mechanic (either because the mechanic is certified or has an excellent word of mouthrdquo
reputation or has been endorsed by a rating agency) the higher the expectation that a
repair will be correctly madersquo94 According to the information provided in an expert
workshop about repairs of household products a significant share of EU citizens (39)
think that repairing a broken product is often difficult or economically disadvantageous
This is mainly due to incomplete information (eg low transparency on the repair price)
but it is also due to general perception of high repair costs95
86 Watson 2008
87 Fernandez 2001
88 Wang amp Hazen 2016
89 Wang amp Hazen 2016
90 European Environment Agency 2017
91 Deloitte 2017
92 McCullough 2009
93 McCullough 2009
94 McCullough 2009 p 622
95 Deloitte 2017
Behavioural Study on Consumersrsquo Engagement in the Circular Economy
72
413 Trade-offs
The literature provides even less evidence about trade-offs and whether consumers are
willing to give up something in order to benefit from something else
A first finding comes from a European Commission Market Study mentioned in section 3
Consumers were willing to pay more (ie give up on a lower price) when
durabilityreparability information were present96 Durability information
presented in terms of years or usage units increases consumer willingness to pay more
for a more durable product Providing information on reparability also encourages
consumers to purchase more repairable products However the type of reparability
information matters Presenting the availability of spare parts substantially increases
consumer willingness to pay On the contrary providing information on the cost of spare
parts has a negative effect97
Another trade-off mentioned in a 2011 article by Ceacuteline Michaud and Daniel Llerena
involves giving up low price for more quality and environmental friendliness This article
quotes a 2009 Eurobarometer that states only a minority of consumersrsquo rate
environmental impact as more important than a productrsquos quality or price (7
and 19 respectively) So only a minority of consumers is willing to make the trade-off
where they give up on products with a lower price or products with a higher quality in
order to buy products that are more environmentally friendly As far as remanufacturing
is concerned consumers seem to face important trade-offs between the various
attributes of the product Based on the participantsrsquo written feedback during the
debriefing the authors concluded that consumers show concern for the lower quality of
remanufactured products A potential solution for this would be for companies to provide
consumers with better quality warranties98
What is more recycling and reuse are sometimes perceived as methods to lessen
guilt associated with excess consumption In other words consumers sometimes choose
the recycling and reuse for certain products because they have in their eyes given into
excess consumption when buying other goods earlier99
Another argument regarding consumer trade-offs comes from classic game theory
consumers can choose between lsquodefaultingrsquo behaviour that minimises personal
costs (inappropriate sorting burning waste littering etc) and cooperative behaviour
that will maximise the social pay-off but they will only do the latter if the majority of
the population cooperates as well Mere consideration of self-interest would always
dictate the lsquodefaultingrsquo choice The social marketing task of promoting cooperation in the
recycling dilemma is made even more difficult as the social pay-off (a cleaner
environment a better world etc) typically does not accrue to the recycling individuals
but to subsequent generations Two strategic routes to encourage cooperation are
available to social marketers an ldquoattitudinal routerdquo which induces individuals to
cooperate for the sake of cooperation and a ldquostructural routerdquo which seeks to change
the properties of the decision situation such that it is no longer a social dilemma
Structural solutions change the payoff structure such that cooperation is the alternative
with the lowest personal cost100
Regarding the situation in the Scandinavian countries research finds that many Swedes
are positive to very positive about making sacrifices in order to buy more durable
products As mentioned in section 3 in Norway the willingness to make sacrifices is fairly
96 European Commission 2017 European Commission DG JUSTGfK (2017) lsquoConsumer Market Study to support the Fitness Check of Consumer Rulesrsquo
97 Knight King Herren amp Cox 2013
98 Michaud 2011
99 Armstrong 2014 p 32
100 Smeesters 2003 p 452
Behavioural Study on Consumersrsquo Engagement in the Circular Economy
73
high when talking about more traditional circular behaviours like buying or selling
second hand products and recycling However this willingness drops significantly
when talking about engaging in the collaborative economy and sharing things
and therefore interacting with other people Especially if it entails letting other
people use onersquos own things Danes are generally more willing to make sacrifices to be
circular when it concerns the areas that they are more familiar with Examples of this are
particularly recycling and buying goods on the second hand market (73 of the
respondents were positive about recycling) When it comes to sharing and renting Danes
are not very interested in making major sacrifices to change their current behaviour
(31 of the respondents were positive about renting and borrowing and 15 about co-
ownership) Especially if sharing entails letting other people use their own belongings
The willingness to make more sacrifices to increase circular behaviour is fairly high
among Finns when it comes to the areas they are used to such as recycling and buying
second hand goods However only a small percentage of Finns are willing to make
sacrifices to co-own or rent outlend more goods to others especially when it entails
more personal commitment (only 22 of the respondents were positive about renting
out and 14 positive about co-ownership) (SB Insight 2017) For more information on
consumersrsquo willingness to engage in more sustainable purchasing and collaborative
practices see section 3
There is also a potential trade-off that could be made between durability and
energy savings if we consider that more durable products may delay sales of newer
more energy-efficient products Such a trade-off can be avoided by introducing durability
requirements together with stringent energy efficiency requirements This would also
give the industry time to redesign their products to comply with these requirements101
414 Variations across productsproduct categories
It seems however that the impact of all the drivers barriers and trade-offs mentioned
in this section do not affect all products in the same way
According to a study on lifespan labelling suitcases and printers were more impacted by
such labels while smartphones were the least affected by this102 When a label was
present 24 more suitcases were sold than without labels printers 20 and 11 for
smartphones As suitcases are mainly for travel their robustness is a crucial factor
accounting for their purchase especially if they are used on an occasional basis As for
printers they are technological objects that are perceived to have a short lifespan This
perception may have contributed to the degree of influence awarded to the label103 The
weakest impact of lifespan labelling concerned smartphones which may be attributed to
the fast development of smartphone technology
Clothes and smartphones were reported as the product category for which consumers
face the most difficulties to assess the durabilityreparability potential104
Due to the fast-moving technology of smartphones consumers may have trouble
using them in a sustainable way One of the issues relates to the gap between the
pace of software updates and the upgradable potential of the smartphones For instance
the Dutch Consumentenbond reported that 84 of all Android-smartphones that the
consumer organisation had tested within the last two years could already not rely on the
latest software anymore Moreover consumers experience frequent problems related to
failures of devices and components105 In addition the way smartphones are engineered
101 European Commission 2013 p 36
102 European Economic and Social Committee 2016
103 European Economic and Social Committee 2016 p 84
104 European Economic and Social Committee 2016
105 BEUC 2015
Behavioural Study on Consumersrsquo Engagement in the Circular Economy
74
may limit the possibility to physically access some components such as the battery and
therefore hinders the ease with which to dismantle and repair them106
Also consumers are reported to lack knowledge about the durability potential of
clothes There is large room for improvement in driving consumers towards more
durable practices in the clothes sector A WRAP (2012) research has reported that lsquonearly
four in ten consumers think there is currently too little environmental information
available about the clothes they buyrsquo A slight increase in the lifespan of clothes would
have a significant impact on the environmental footprint The WRAP report indicates that
rsquoextending the life of clothing by an extra nine-month period of active use would reduce
carbon waste and water footprints by around 20-30 each and cut resource costs by
20 (euro55 billion)rsquo Besides the ecological impact it seems that even by providing basic
information to consumers on how to treat their clothes could have a profound influence
on their expected durability Simply informing people on the way they should wash their
clothes how they can preserve the characteristics of its fibres and fabric and as a result
increase its durability could already be enough in this regard Most often clothes are
unused because they no longer fit107 Therefore one option with a high potential
regarding durability would be to provide more information on how to remake and repair
clothes (WRAP 2012)
42 Evidence from the stakeholder interviews
421 Drivers
The results from the stakeholder interviews are largely compatible with those from the
literature review and data collection The three main drivers were distinguished during
the literature review to provide more and better information about the durability
potential of the product the design of the product itself and a greater offer of repair
services from manufacturers These results were mirrored during the stage of the
stakeholder interviews
First of all a representative from a Czech consumer association stated that many
consumers in the Czech Republic are willing to pay more for more durable products
as long as they have objective information on which they can rely At present they
have little faith in producers and manufacturers and according to them this information
should be provided for free to consumers This underlines what has been found in the
literature consumers are willing to pay extra for more durable products but they need
better and more reliable information in order to actually do so in practice For an in-depth
discussion of which information should be provided to consumers see section 5
Next the design of the product itself attracted less focus from the interviewees as a
driver for consumer participation in CE practices A representative from a social
enterprise active in the area of the Circular Economy in the Netherlands pointed to the
lack of knowledge of clothing materials and construction among consumers
Difficulties exist when it comes to establishing norms for clothes and what to measure for
clothes labelling The design of clothes and consumer knowledge about this could thus
enhance their knowledge and could facilitate their choice for more durable products
Lastly some interviewees discussed the poor quality and low availability of repair
services as a reason for consumers not using repair services A German academic talked
about a series of consumer studies performed by Stiftung Warentest a German
consumer organisation where they tested repair services on the costs that are involved
with repairing spare part availability the quality of the service how fast the repair
service is whether consumers get a replacement product during the period of the repair
and how good this is They found that there were many problems with the repair services
of most big companies consumers were especially bothered by the high price of repair
and the rather low availability of these repair services The same interviewee
stated that consumers do want to consider using repair services but that it is not really a
106 SPF Santeacute publique 2014
107 WRAP 2017
Behavioural Study on Consumersrsquo Engagement in the Circular Economy
75
realistic option for them right now because of the above reasons More and better repair
services could thus act as an important driver for consumers to engage in CE practices
An additional driver was named by a representative from a company active in the
German repair market who stated that the key to more use of repair services would be
to force producers to guarantee the affordable availability of exchange parts for a
longer period This would enable an infrastructure of repair services to stay alive and to
develop According to a technical expert in repair initiatives availability of spare parts is
the key driver for enhancing the consumersrsquo use of repair services as right now the
producers have little interest in spare parts as the added value of repair is not with them
The literature paid less attention to price which interviewees named as the most
important driver A representative from a UK-based NGO focusing on the Circular
Economy and sustainable consumption mentioned that consumers are more likely to say
that product lifetime was a key factor when they bought higher priced products
than when they bought lower priced products of the same type Especially in
Romania this is the case where all interviewees representing the non-profit and
consumers interests have pointed to the fact that durability concerns are more visible
with the richer middle-classes than with other groups such as elderly and young people
Other drivers that were mentioned briefly but not explained in detail are extended
warranties mentioned by a Romanian NGO representative social pressure marketing
and advertising cultural and generational drivers social norms about (resource)
efficiency and the underlying psychological driver where people feel emotionally
attached to their products and want to engage with them according to a representative
of an Austrian consumer association as well as better education about the topic as
highlighted by representatives from NGOs and national consumer associationsrsquo
representatives With respect to marketing and advertising practices a representative
from a famous electronic appliances manufacturer added further details For instance
offering a label about the length of reparability for their products is clearly part of a
strategy which aims to influence consumers in their purchasing decisions
422 Barriers
The results from the stakeholder interviews are largely compatible with those from the
literature review and data collection To recall here three main barriers were
distinguished during the literature review the lack of knowledge about
durabilityreparability features of a good and the lack of reliable information the cost of
repair services and the lack of trust from the consumer in repair services
Several interviewees confirmed the first barrier as the most important A representative
from a German public authority stated that a lack of reliable information regarding
durability and reparability plays an important role as there are no standards for
durability information and there is a lack of good measurement procedures for durability
Notwithstanding it is not easy to design tests for all products in such a way that
durability information is available before the products are being sold as was highlighted
by the interviewee representing a German public authority A representative from a
Czech association of consumers underlined this by pointing to the fact that there is a lack
of information about the quality of products as many producers present their products as
flawless but the reality is often very different Lastly a representative from a social
enterprise active in the area of the Circular Economy in the Netherlands pointed to the
lack of knowledge of consumers regarding the materials and fabrics of clothes as an
important barrier for them to become more active in CE practices If consumers cannot
distinguish between good and durable fabrics do not know how to treat the clothes they
buy to make them last longer and do not know how to self-repair them if they become
damaged it is impossible for them to make the right choices even if they would
normally be willing to do so
Interviewees also discussed the high costs of repair services A representative from a
Czech association for social responsibility discussed the price of recyclable products as
these are usually more expensive than products that are not recyclable Also the
availability of recyclable products is relatively scarce as other not-recyclable products
are still being produced A representative from a company active in the German repair
market talked about the prices of spare parts specifically He used the example of Miele
Behavioural Study on Consumersrsquo Engagement in the Circular Economy
76
who provides electronics for their washing machines for EUR 400 while the real costs are
only about EUR 20 making the repair of washing machines uneconomic
The interviews also complemented what has been found in the literature by adding that
there are also many practical problems with repair A representative from a Dutch
public authority discussed that products nowadays are designed in such a way that the
whole product stops functioning when one small component breaks down A
representative from a German consumer organisation stated that manufacturers and
producers have most of the know-how about products and that there is not much
knowledge otherwise which makes for an unbalanced relationship with consumers
Moreover there is a trend of producing bigger and more complex machines which are
highly integrated and hard to repair
Additionally interviewees mentioned some other barriers that have been treated less in
the literature The first and foremost of these is the availability of low-quality but
cheap products tempting consumers to replace goods rather than self-repair them A
representative from a European trade association discussed the availability of cheap
clothing The main conclusion from a 2006 clothing study was that the durability of cloths
is decreasing because of a decrease in the quality of garment causing in turn a drop-in
the donation of clothes A representative from a European industry association concluded
from this that fast fashion stores therefore put pressure on the second hand industry
This was confirmed by a representative from a European trade association who pointed
to the availability of very cheap fashion particularly in the United Kingdom as an
important barrier to consumer interest in durability
Another barrier mentioned in the interviews is the fashion aspect for example in the
interview with a representative from an Austrian consumer association This is especially
the case for young people and especially for products like clothes and smartphones
Style plays an important role here and this refers to the emotional durability of
products rather than the physical durability for more information on this see section
511
Other barriers that were mentioned briefly but not explained in detail are social
pressure marketing and advertising mentioned by the same Austrian consumer
associationrsquo representative conspicuous consumption where consumers do not
consider the impacts of their user profile both regarding time and money as discussed
by a German academic and the cultural problem where society does not reward
consumers who do engage in CE practices as highlighted by a representative of a
Belgian NGO
423 Trade-offs
As with the literature review most interviewees had less to say about trade-offs and
whether consumers are willing to give up something in order to benefit from something
else For instance it is less clear whether consumers would be willing to pay more (ie
forego on a lower price) as long as they know the products are more durable
Some things were however still mentioned First of all most interviewees pointed at the
fact that price is still a very important if not the most important factor accounting
for consumer decisions An ever-growing fraction of consumers are willing to consider CE
characteristics and the reparability and durability of products but they are only willing to
pay more to a certain extent Price-sensitivity still plays a huge role There is also a
certain difference visible across products but this is discussed in detail in the next
section 424 A representative from a German consumer organisation stated that
consumers are willing to pay a bit more for durable products and that price-sensitivity
plays a role in accounting for differences in willingness across products For vacuum
cleaners for example consumers are very price-sensitive The general rule is the
higher the investment the more people are willing to pay extra for repair The
price of the durable product and the price difference with less durable products therefore
forms the most important driver for consumers in whether they are prepared to trade off
something in return for more durable products
A representative from a charity and independent think tank from the United Kingdom
highlighted that the rational choice of model based on costs and benefits alone
does not explain Circular Economy behaviour because in reality there is a more
Behavioural Study on Consumersrsquo Engagement in the Circular Economy
77
complex set of factors This confirms the finding from the literature that referred to
classic game theory even though consumers might be inclined to buy more durable
products and to self-repair rather than to replace it only makes sense for them to
actually do so when they know other consumers are doing the same This is a classic
example of the prisonerrsquos dilemma in practice and the government could play an
important role in making sure the prerequisites are such that it makes more sense for
consumers to engage in CE practices
424 Variations across productsproduct categories
From the literature review it has already become clear that the impact of all the
drivers barriers and trade-offs mentioned in this section do not affect all
products in the same way This was largely confirmed by what interviewees discussed
First of all every product requires its own approach CE practices that work well for
one product are less appropriate for others For instance a representative from a Dutch
public authority discussed that while car-sharing services are working well already
sharing platforms for other household items (such as power drills or tents) are far less
popular as sharing platforms for cars provide much more comfort and ease than sharing
platforms for household items For smartphones the same is true but here durability
and the speed of technological development play a role as well Dishwashers are
especially well suited for lease systems with repair contracts built in and there are some
experiments with contracts where you pay per wash For clothes buying new clothes is
often cheaper than having them repaired There is a growing second hand market for
clothes but this is not yet common place in all layers of society
A German academic highlighted that for each price category there are different
drivers deciding which products consumers will buy and durability plays a different role
for each category of consumers For more expensive products consumers are willing to
spend more time to make sure they buy a product that will last long enough for their
investment to be worth it In a way thus a higher price can form a driver to
consider buying more durable products Other products on the other hand are so
cheap that it doesnrsquot make sense for consumers to spend too much time or money on
avoiding buying non-durable products This was complemented by what a representative
of a Hungarian NGO stated when she said that for televisions and washing machines
consumers do consider durability but not so much for smartphones or clothes
Furthermore she stated that the guarantee and its terms and whether it can be
extended are important to consumers as well A representative from a German
consumer organisation stated that with vacuum cleaners people tend to buy rather
cheap and less durable machines while with washing machines consumers take
durability much more into account during the purchase process
A representative from a Portuguese NGO mentioned that for mobile telephones
televisions and tablets technological advancement acts as a barrier as it is quite
common to replace these products because consumers want to have the latest model
with the most up-to-date technology Clothes are rather fashion dependent products as
well and this forces many consumers to buy new clothes regularly acting as a barrier to
CE practices The low prices of certain pieces of clothing act as an additional barrier
making consumers more prone to buy new clothes For childrenrsquos clothing there is a
network of second hand stores and platforms ensuring that buying second hand clothes
is becoming more and more common The economic crisis certainly helped clothes
exchanges but it is still a very niche market Repairing clothes was much more common
twenty years ago than it is today but the younger generation seems more interested in
learning to repair their own clothes again
Regarding repairing a representative from a company active in the German repair
market stated that white goods have a lively repair service system already as
people do not change big and expensive goods like these without serious consideration
and many consumers would consider repair before replacement What is more many
producers see an excellent repair service as part of their brand message and as part
of having a well-working customer service In the television sector there is hardly
any repair being done due to a broad range of models and technologies but for
smartphones there is a substantial repair sector due to independent companies
performing the easy fixes like cracks in the display
Behavioural Study on Consumersrsquo Engagement in the Circular Economy
78
Lastly a German academic pointed to another distinction that needs to be taken into
account The interviewee stated that the classical categorisation of products is not
enough In her eyes an additional distinction needs to be made between
ldquoworkhorserdquo products and investment products which would be a more useful
category in the analysis For workhorse products durability and reparability is more
important as consumers want them to work most of the time Functioning is more
important here and consumers are willing to pay a little more for durable and repairable
products in this category The need to have a constantly functioning product is an
important driver here to buy more durable products For investment products on the
other hand reparability is more important as they tend to be expensive and consumers
tend to prefer to have them repaired rather than replaced once they buy them and they
reserve money for that during the purchase process already (write-off)
43 Evidence from the focus groups
431 Durability
According to the focus group participants factors that can encourage people to
purchase products that are more durable were
Saving money
Saving time and effort (for example by not having to go through the entire
selection and purchasing process for a new product)
Protecting the environment
Being able to purchase durable goods for lower prices and
Having a way of knowing how durable a product is
Some of the main indicators of a productrsquos durability were considered to be the brand
(certain brands being known for manufacturing more durable products) online consumer
reviews as well as word-of-mouth
When it comes to barriers (factors discouraging people from purchasing durable
products) participants across the different countries brought up the following factors
Difficulty of knowing how durable products are and which ones are more durable
The trustworthiness of costumer reviews as well as brandsrsquo reputation were
questioned Many participants flagged the fact that there were no sources of
information with regard to productsrsquo durability and made various suggestions with
regard to what type of information they would find useful and how this should be
presented (further details about this topic are provided in section 631)
ldquoVery difficult You google it before you buy it and you look at reviews Even then
itrsquos difficult to know Do I trust that You donrsquot know who writes that eg lsquothis
product is fantasticrdquo (Man mixed group Dublin)
Some participants brought up price as a barrier feeling that brands that have the
reputation of designing durable products are more expensive
[brand name] appliances ndash I say to myself they might last longer if I had the
money It is twice the price and I cannot afford itrdquo (Man vulnerable group
Prague)
Others however felt that even brands that have a strong reputation do not produce
durable products anymore The concept of planned obsolesce was brought up
during most group sessions
ldquoYou already envisage that something breaks down after a while It is sad We live
in a disposable society and it is intended by the industry that things do not lastrdquo
(Man mixed group Berlin)
Technological progress was cited as another factor discouraging people from
seeking more durable products (especially in the case of electronics)
When it comes to televisions the progress is so fast they (the televisions) are
computers now really after five years the technology can be oldrdquo (Man mixed
group Prague)
Behavioural Study on Consumersrsquo Engagement in the Circular Economy
79
ldquoIt is not only with the hardware of products that is not compatible It is also the
software When your phone is too old a certain software is not supported and you
are forced to buy a new device even though it still works That is the power of the
industry You depend on themrdquo (Man mixed group Berlin)
Fashion trends are another barrier not only for clothing but also for other types of
products
ldquoThere is a hysteria in Sweden today people love to renovate their homes and
exchange everything ndash they throw away well-functioning machines That is crazyrdquo
(Man vulnerable group Stockholm)
432 Reparability
The main factors encouraging people to have products repaired (instead of buying
new ones) can be summarised as follows
Having the possibility to repair products (ie the product itself being repairable)
Being able to repair products at a lower price than purchasing new ones
Knowing that manufacturers can produce and sell spare parts
In the case of electronics being able to receive and use a courtesy replacement
product (smartphone computer) while having onersquos own product repaired and
Being able to have products repaired in a short time (particularly for products such
as dishwashers and washing machines)
I needed my washing machine to be repaired you cannot be without it really
First they said they would do diagnostics and then they would call me And then
they have 30 days to repair it so you worry about how to wash clothes
ldquo(Woman mixed group Prague)
In terms of barriers the main factors brought up were
Belief that certain types of products (smartphones) are not made to be repairable
ldquoI think to encourage people to repair products they need to make the production
process more transparent and should not put obstacles in your way which
prevent repairing a smartphone for examplerdquo (Woman vulnerable group Berlin)
ldquoIt is possible to think more about the circular economy ndash if you are interested
you can do some things yourself change batteries on the smartphone But for
[smartphone brand] you canrsquotrdquo (Man Vulnerable group Stockholm)
Difficulties in finding spare parts
Having products repaired requires time and effort
High repair costs
Today appliances have such electronics that they change whole big parts and
the repair costs 50 and more of the cost of a new one So it is not worth itrdquo
(Man vulnerable group Prague)
Previous negative experiences when trying to have products repaired
My daughter chose [smartphone brand] and we have already claimed it four
times during the warranty period In the Prague shop where we bought it they
told us they had to send it to Germany it took 3 months it worked for 2 months
and then a claim again Then it happened for the third time and it was the same
thing They donrsquot want to give us money back because they claim to have
replaced the motherboard and therefore they see it as a new phone and the
warranty extends I donrsquot know what to do with it (Woman 37 vulnerable
group Prague)
Lack of services (for example for products purchased from foreign shops or from
foreign brands or from brands that no longer exist)
ldquoI bought kitchen appliances from one British brand ndash cooktop microwave and
dishwasher they used to have a store in the centre of Prague then They finished
after a year and a half and they disappeared from the CR even though they are
still in Britain but that is too bad for me The display stopped working on the
Behavioural Study on Consumersrsquo Engagement in the Circular Economy
80
microwave and I donrsquot know what to do the company does not even have any
representation here So I will keep using it without a display while it still works
(Woman mixed group Prague)
The fact that stores or manufacturers sometimes automatically replace
products rather than have them repaired without giving customers a choice
I bought a wood grinder and the key screw was made of plastic so they counted
on it breaking I went into the shop with it within the warranty period and they
replaced it with a new piece automatically instead of repairing it It is such waste
then (Man vulnerable group Prague)
433 Recyclability
The main reasons behind recycling can be summarised as follows
Concerns for the environment
ldquoI think it is really a good thing for the environment We have so many things
nowadays I really do not want to think about what happens to the planet It
scares merdquo (Woman vulnerable group Berlin)
The need to dispose of products that are no longer used
The possibility of saving or earning money when returning products to a
manufacturer (eg when purchasing a new washing machine or dishwasher)
The possibility of helping others (eg by recycling clothes and bringing them to
humanitarian associations or second hand shops)
Saving money (for example by purchasing second hand products)
Fashion trends (purchasing vintage furniture or clothing)
ldquoIt is trendy with vintage Young people realise how much they get for their
money when buying second hand Even jeans they probably have a better quality
than new jeansrdquo (Woman vulnerable group Stockholm)
Concerns for the environment were of high importance especially in Sweden In this
country willingness to recycle was high especially for products with components that are
dangerous for the environment In the Czech Republic on the other hand concerns for
the environment were mentioned by some participants but other factors were perceived
as equally important such as the need to dispose of products and the possibility of
saving money
In some countries participants brought up several factors that could encourage
recycling
Having transparent information about how the recycling process works and being
able to trust that products are actually being recycled (Germany Sweden)
The recycling process being more straightforward taking less time and effort
(Germany Czech Republic)
Strict laws influencing companies to be transparent with regard to the materials
they use as part of the production process and whether these are recyclable or
whether they come from recycling (Germany)
Having more information about recycling through labels similar to energy
efficiency labels (Czech Republic)
When asked about possible barriers or factors that can discourage people from
recycling participants brought up the following main aspects
Complexity along with a lack of awareness (not knowing where to recycle
products or who to contact)
ldquoI feel it is complicated I do not know where to bring old devices I also do not
find it credible as I do not know if things really get recycled or if companies just
say that It is all a hasslerdquo (Woman mixed group Berlin)
Lack of time
You have to devote time to it take it somewhere for example to recycling
centre (Man mixed group Prague)
Behavioural Study on Consumersrsquo Engagement in the Circular Economy
81
Lack of trust and lack of transparency (not knowing what is done with the
products and whether they are actually being recycled)
ldquoIt is so hard with recycling So much to think about Who is collecting it Where
does it end uprdquo (Male vulnerable group Stockholm)
For smartphones lack of awareness with regard to what happens to the data stored
on the phone Smartphones include a lot of personal data and photos making some
participants sceptical about recycling possibilities
ldquoBut for my phone I donrsquot do that for data protection issuesrdquo (Man vulnerable
group Dublin)
44 Evidence from the consumer survey
Drivers
As indicated previously in Table 13 in section 34 a majority of participants indicated
that they search for durability and reparability information on products Subsequently
the survey asked whether respondents felt that the information provided on
durabilityreparability was sufficient Table 15 shows the results
In total 86 of participants agreed that they would like to receive better
information on how long a product will last (including 25 even strongly agreeing to
the statement) Similarly strong was agreement on wishing to receive better information
on how easy it is to repair a product (83 including 23 strongly agreeing)
Table 15 Agreement to preferring better durability and reparability information (in )
Strongly
disagree
Tend to
disagree
Tend to
agree
Strongly
agree
I would like to receive
better information on how
long a product will last
20 118 613 249
I would like to receive
better information on how
easy it is to repair a
product
23 139 607 230
Note The question was Q51 ldquoTo what extent do you agree or disagree with the following statementsrdquo N=12064
Source ConPolicy analysis of consumer survey data
Figure 22 displays the results when calculating average agreement rates for the above
statements It can be found that survey participants on average agreed to prefer better
durability and reparability information
Figure 22 Agreement to preferring better durability and reparability information
(average)
Note The question was Q51 ldquoTo what extent do you agree or disagree with the following statementsrdquo Answer categories were labelled with ldquoStrongly agreerdquo corresponding to a value of +10 ldquoTend to agreerdquo corresponding to a value of +3 13 ldquoTend to disagreerdquo corresponding to a value of ndash 3 13 and ldquoStrongly disagreerdquo corresponding to a value of -10 Average values above 0 correspond to (rather) agreeing to the statement while values below 0 correspond to (rather) disagreeing Hence an average value of 0 corresponds to neither agreeing nor disagreeing N=12064
Source ConPolicy analysis of consumer survey data
Behavioural Study on Consumersrsquo Engagement in the Circular Economy
82
In addition the results were analysed by country as well as socio-demographic factors
Detailed results are displayed in detail in Section 7 in the Annex document and
summarised here below
On average participants in all twelve Member States indicated preferring better
durability information Highest agreement rates were observed in Romania Sweden
and Portugal Participants from Austria Latvia and especially the Netherlands showed the
lowest rates of agreement Averages for the different age and education groups were
slightly increasing ie older and more educated participants had a higher preference for
receiving better durability information With respect to respondentsrsquo financial situation no
systematic differences emerged
A very similar pattern was observed for preferences by country with respect to better
reparability information The individual averages were positive indicating that in all
countries participants said they preferred receiving better reparability information The
highest averages were observed in Spain Portugal and Romania and the lowest in
Austria Latvia and the Netherlands Again a small positive trend was observed with
respect to age and education Respondentsrsquo financial situation was again less influential
Barriers
The consumer survey also contained two questions regarding potential barriers to finding
information on durability and reparability Overall 82 of the participants agreed that it
is difficult to find information on how long a product will last with 27 even
indicating strong agreement with the statement Again 82 also stated the same for
reparability information with 25 indicating strong agreement
Table 16 summarizes the results for these two questions
Overall 82 of the participants agreed that it is difficult to find information on how
long a product will last with 27 even indicating strong agreement with the
statement Again 82 also stated the same for reparability information with 25
indicating strong agreement
Table 16 Agreement to having difficulties in finding durability and reparability
information (in )
Strongly
disagree
Tend to
disagree
Tend to
agree
Strongly
agree
It is difficult to find
information on how long a
product will last
14 169 549 268
It is difficult to find
information on how easy it
is to repair a product
13 168 566 253
Note The survey question was Q51 ldquoTo what extent do you agree or disagree with the following statementsrdquo N=12064
Source ConPolicy analysis of consumer survey data
Results on average agreement for the above statements were calculated as well and are
depicted in Figure 23 Again the averages being above 0 reveal that survey participants
indicated that they on average agree on having difficulties to find both durability as well
as reparability information
Behavioural Study on Consumersrsquo Engagement in the Circular Economy
83
Figure 23 Agreement to having difficulties in finding durability and reparability
information (average)
Note The survey question was Q51 ldquoTo what extent do you agree or disagree with the following statementsrdquo Answer categories were labelled with ldquoStrongly agreerdquo corresponding to a value of +10 ldquoTend to agreerdquo corresponding to a value of +3 13 ldquoTend to disagreerdquo corresponding to a value of ndash 3 13 and ldquoStrongly disagreerdquo corresponding to a value of -10 Average values above 0 correspond to (rather) agreeing to the statement while values below 0 correspond to (rather) disagreeing Hence an average value of 0 corresponds to neither agreeing nor disagreeing N=12064
Source ConPolicy analysis of consumer survey data
Section 7 in the Annex document displays the detailed results on difficulties in finding
durability and reparability information by country age education and financial situation
are displayed A summary is provided here below
Across all Member States a majority agreed that finding both durability and
reparability information was difficult The top three countries with respect to
average agreement rates were Sweden Germany and Austria Agreement rates were
lowest for the Netherlands Latvia and Romania Again a slight positive trend for the
different age groups was found ie older participants found it more difficult to find
durability information With respect to education and respondentsrsquo financial situation no
clear pattern emerged
Taking the findings from this section together with the fact that consumers seem to be
looking for durability andor reparability information it appears that the current (poor
state of information provision regarding durabilityreparability is a potential barrier to
consumer engagement in the CE It seems to emerge from the survey that better
information provision could drive further CE engagement The behavioural experiment in
section 65 looks at information provision and its effect on purchasing decisions in further
detail
441 Experience with repairing products
As a next step actual CE behaviours are analysed in more detail To this end consumersrsquo
experience with repairing products as well as reasons for repairing are discussed The
first section describes actual behaviour followed by reasons for not repairing a product
Subsequently reasons for self-repair are presented As a last step the reasons for
having a product repaired by another person are discussed including the use of
professional repair services as well as consumersrsquo satisfaction with repair services
Figure 24 displays participantsrsquo actual repair behaviour pooled over the different product
categories with corresponding shares indicating that they (i) did not repair a product
(ii) repaired a product themselves or (iii) had a product repaired for them ie by
a friend or relative a professional repair service or the manufacturer
36 indicated that they did not repair followed by having the product repaired by a
repair service (26) Another 17 had the product repaired by the manufacturer
retailer and another 12 indicated that they chose self-repair The lowest share pooled
over all product categories was revealed with respect to having a product repaired by a
friend or relative (8)
Behavioural Study on Consumersrsquo Engagement in the Circular Economy
84
Figure 24 Experience with repair pooled over product categories (in )
Note Participants were asked Q32a ldquoThinking about the last time these products broke down or became faulty did you repair these products yourself or have these products repaired for you Please select one answer for each productrdquo N=12064
Source ConPolicy analysis of consumer survey data
Table 17 shows participantsrsquo actual repair behaviour for the five different product
categories Depending on the product category either having a product repaired or not
repairing a product was the most common behaviour In the following behaviour is
reported separately for the different product categories
For vacuum cleaners participants decided either to not repair the product (41) or
having it repaired (40) whereas a lower share of 19 reported to have repaired their
faulty vacuum cleaner by themselves In the case of dishwashers the vast majority
(61) indicated to have the product repaired for them while only 25 did not repair
their faulty machine and 13 repaired it by themselves In the product category of
televisions a similarly large share (58) reported that a third person repaired their
faulty item for them 37 indicated that they did not repair their faulty television and
only 4 reported that they repaired their television by themselves This pattern is similar
for mobile phones Here 56 decided to have their faulty product repaired for them
37 did not repair it and 6 repaired it by themselves For clothing items ie coats or
jackets a different picture emerged The most frequently observed behaviour (39) was
not repairing the product closely followed by having the product repaired (35)
Additionally the share of participants who indicated that they repaired the clothing item
by themselves was larger compared to other products 24
1
17
26
8
12
36
0 10 20 30 40
Dont know
Had the product repaired by manufacturerretailer
Had the product repaired by repair service
Had the product repaired by friend or relative
Repaired the product myself
Did not repair the product
Behavioural Study on Consumersrsquo Engagement in the Circular Economy
85
Table 17 Experience with repair by product category (in )
Vacuum
cleaner
Dish-
washer
TV Mobile
phone
Coat or
jacket
No I did not repair
it or have it repaired
410 252 374 369 389
Repaired the
product myself
188 134 38 63 244
Had the product
repaired for me by a
friend or relative
98 91 63 43 145
Had the product
repaired for me by a
professional repair
service
170 394 361 259 168
Had the product
repaired for me by
the manufacturer
(including via a
retailer)
127 121 158 259 40
Donrsquot know 06 07 06 06 15
No of observations 2350 2008 2045 3053 1503
Note Participants were asked Q32a ldquoThinking about the last time these products broke down or became faulty did you repair these products yourself or have these products repaired for you Please select one answer for each productrdquo
Source ConPolicy analysis of consumer survey data
Furthermore repair behaviour was analysed for the different countries and by socio-
demographic factors A summary is written here below detailed results are shown in
Section 7 in the Annex document
Repair behaviour by country revealed some interesting patterns In the Netherlands the
majority of participants (56) indicated that they did not repair For other countries the
non-repair-rates were at least above 30 while in Romania not repairing a product was
only an option for 25 of the participants Together with this low non-repair rate
emerged high rates of having the product repaired by a repair service (40) among
Romanian participants Further individual country differences can be found in the Annex
When analysing repair behaviour by age education and income no specific patterns were
observed
Reasons for not repairing
The above presented results on repair behaviour showed that participants chose quite
frequently not to repair a product The percentage for individual product categories
ranged from 25 to 41 In the following the reasons for this behaviour are analysed
more closely
On average the most important reason for not repairing a product was the price of
repair Between 50 (dishwashers) and 25 (clothing) of participants reported that
repair would have been too expensive The second most important reason for not
repairing or having a product repaired is not as clear-cut In some cases participants
indicated that they simply preferred to get a new product while others indicated that
the item was obsolete or out of fashion In addition approximately 20 of
participants reported that the product could not be repaired
The following patterns by product category emerged For vacuum cleaners both costs
(36) and preferring to get a new vacuum cleaner (33) were indicated to be
important Additionally 21 of participants indicated that the product could not have
Behavioural Study on Consumersrsquo Engagement in the Circular Economy
86
been repaired Obsolescence or fashion (20) played a role as well For dishwashers
the difference between the most and second most important reason was larger 50 of
participants indicated that it was too expensive to repair their dishwasher or having it
repaired A lower share approximately 20 each indicated they preferred a new
product inability to repair obsolescence or fashion In the case of faulty televisions
reasons for not repairing were mixed 34 of participants reported high costs as the
main factor followed by 31 indicating to prefer a new television to a repaired one
Similarly important (30) were obsolescence or fashion and another 25 indicated
that their faulty television could not have been repaired For mobile phones 40 of
participants reported that repair would have been too expensive followed by 33
indicating that the reason for not repairing or having their faulty mobile phone repaired
was obsolescence or fashion Lastly for clothing items ie coats or jackets 47 of
participants said they preferred to get a new item instead of repairing it Compared to
the other product categories fewer participants named price (25) and obsolescence or
fashion (25) as reasons for not repairing or having a clothing item repaired
Table 18 Reasons not to repair by product category (in )
Vacuum
cleaner
Dish-
washer
TV Mobile
phone
Coat or
jacket
I preferred to get a
new one
332 204 308 334 465
It would have been
too expensive
360 496 343 398 247
The product could not
be repaired
213 192 251 168 167
The product was
obsolete or out of
fashion
197 199 295 279 245
I did not know how to
repair itwhere to get
it repaired
69 103 48 60 88
It would have been
too much effort
104 130 74 99 139
The partsmaterials
required werenrsquot
available
71 39 54 28 09
Other 45 70 52 55 38
Donrsquot know 08 08 04 05 15
No of observations 964 507 765 1128 584
Note The question was Q32d ldquoYou said that when the following product(s) broke down or became faulty you did not repair them yourself or have them repaired for you Why was this For each product please select the two most important reasonsrdquo
Source ConPolicy analysis of consumer survey data
Reasons for self-repair
As shown above self-repair was a rather uncommon practice compared to not repairing
an item or having it repaired by a third party To understand what motivates self-repair
participants were asked to indicate the two most important reasons for repairing a
product themselves The results are presented in Table 19
The most frequently cited reason for self-repairing a product was that it was cheaper to
repair than buying a new product The percentage of participants indicating this aspect
among the most important ranged from 61 for dishwashers to 33 for televisions In
Behavioural Study on Consumersrsquo Engagement in the Circular Economy
87
addition participants reported that being good at repairing things by themselves was
an important reason for self-repair 41 indicated this reason for dishwashers and 31
for televisions Another important reason for self-repair was that repairing a product was
easier than buying a new product Between 31 and 16 indicated this to be one of
the most important aspects The fourth most important reason participants indicated was
that self-repair is better for the environment
When looking at individual product categories there exist differences in the motives for
self-repair The above reported ranking of reasons seems to hold for vacuum cleaners
dishwashers and coats or jackets For these products price was the most important
driver The reported motives for televisions and mobile phones were less clear-cut price
(33) convenience (31) and repair skills (31) were ranked equally important for
televisions In contrast environmental reasons were reported with a lower frequency
(17) For mobile phones a different picture emerged While the most important reason
was price (53) self-repair skills were ranked second (40) and environmental
reasons occupied a more important position (21) than convenience (16)
Table 19 Reasons for self-repair by product category (in )
Vacuum
cleaner
Dish-
washer
TV Mobile
phone
Coat or
jacket
It was cheaper than
buying a new one
479 611 331 529 506
I am good at repairing
things myself
335 409 306 395 402
It was easier than
buying a new one
264 232 313 162 201
It is better for the
environment than
buying a new one
236 216 171 210 180
I was particularly fond
of my current product
95 32 111 137 298
My preferred product
was no longer in
production
23 21 96 95 22
Other 38 37 66 59 36
Donrsquot know 01 0 0 0 0
No of observations 422 269 78 191 366
Note The question was Q32b ldquoYou said you repaired the following product(s) yourself when these broke down or became faulty Why did you decide to do this For each product please select the two most important reasonsrdquo
Source ConPolicy analysis of consumer survey data
Reasons for having a product repaired
Another way to cope with faulty products was to have a third party repair the product
Compared to self-repair this behaviour was indicated more frequently Between 35 and
61 of participants had previous experience with having different products repaired for
them As before the survey asked respondents to indicate the most important reasons
for having products repaired
On average the most important reason was again price ie having a product repaired
was cheaper than buying a new product The share of respondents indicating this reason
Behavioural Study on Consumersrsquo Engagement in the Circular Economy
88
ranged from 55 for dishwashers to 35 for mobile phones The second most important
reason was that the product was still under guarantee108 ranging from 45 for
mobile phones to 11 for clothing
The wide ranges reported above show that there exist important differences between
product categories While for vacuum cleaners dishwashers and televisions price
and guarantees were most important this was not the case for mobile phones Instead
an existing guarantee (45) was ranked more important than price (35) For clothing
items another aspect namely being particularly fond of their current possession was
relevant (39) in addition to price (51) Guarantees on the other hand did not play
an important role (11) for clothing
Table 20 Reasons for having a product repaired by product category (in )
Vacuum
cleaner
Dish-
washer
TV Mobile
phone
Coat or
jacket
It was cheaper than
buying a new one
490 552 420 351 509
The product was still
under guarantee
262 242 342 450 107
It was easier than
buying a new one
181 170 163 142 189
I am not good at
repairing things
myself
161 154 142 122 227
I was particularly fond
of my current product
133 73 134 176 387
My preferred product
was no longer in
production
43 21 29 43 32
It is better for the
environment than
buying a new one
171 201 146 134 116
Other 21 46 35 30 41
Donrsquot know 04 04 07 02 11
No of observations 929 1217 1190 1715 531
Note The question was Q32c ldquoYou said you had the following product(s) repaired for you when these broke down or became faulty Why did you decide to do this For each product please select the two most important reasonsrdquo
Source ConPolicy analysis of consumer survey data
Experience with repair services
The previous section reported experiences with having a person repair the product
including repair by friends relatives manufacturers as well as professional repair
services Table 21 displays the shares of participants who have used a repair service for
each of the different product categories
108 This study did not address whether consumersrsquo attitudes were different for situations in which products were still covered by the 2 year legal guarantee covering all goods sold in the EU or covered by additional (extended or commercial) warranties See Glossary at the end of the report for definitions of (legal) guarantees and warranties
Behavioural Study on Consumersrsquo Engagement in the Circular Economy
89
Overall 20-24 of participants indicated that they had used a professional repair service
for a faulty mobile phone television or dishwasher Much fewer participants had used
such services for vacuum cleaners (9) and clothing items (7)
Table 21 Experience with repair services by product category (in )
Vacuum
cleaner
Dish-
washer
TV Mobile
phone
Coat or
jacket
Share of respondents
with experience with
repair services
92 195 223 244 73
Note The question was Q62a ldquoHave you used a professional repair service to repair any of the following products in the past Please select all that applyrdquo N=12064
Source ConPolicy analysis of consumer survey data
Next to these product categories it was also asked whether participants had additional
experience with a repair service ie for other products Overall 46 of the participants
reported that they had experience with repair services for products except the five pre-
defined categories
Satisfaction with professional repair services
Participants who indicated having used a professional repair service for their faulty
product were asked to indicate their satisfaction with convenience speed consumer
friendliness and quality of the repair service109 Table 22 displays aggregate results for
all product categories
Overall consumers appeared to be rather satisfied with repair services On average 83
rated convenience of using a repair service at least fairly good including 20 that rated
it even very good Speed of repair was rated similarly satisfactory with a total of 81
rating the received service at least as fairly good including 20 indicating to have used a
very good service Consumer friendliness received an even higher rating with 88
stating the service as at least fairly good with 27 agreeing on it being very good
Lastly quality of repair was also rated as satisfactory Here 88 indicated having
received at least a fairly good service with 34 stating the service to have been very
good
Table 22 Satisfaction with professional repair services (in )
Very poor Fairly poor Fairly good Very good
Convenience 24 141 633 201
Speed of repair 35 157 610 198
Consumer friendliness 21 103 611 265
Quality of the repair 31 94 540 335
Note The question was Q62b ldquoThinking about the time you used a repair service for a [vacuum cleaner dishwasher mobile phone coat or jacket] how would you rate this service in terms of the following factors Please answer on a scale from 1 (ldquoVery poorrdquo) to 4 (ldquoVery goodrdquo) The respective product was chosen randomly for each participant given that he or she reported to have used a repair service for this product in the past
N=7331
Source ConPolicy analysis of consumer survey data
109 The focus of the following survey questions was to assess consumersrsquo expectations with regard to characteristics of repair service rather than price The preceding sections of the survey asked about the importance of prices in repair vs replace decisions and highlighted that consumers judge prices as a main driver of their decisions
Behavioural Study on Consumersrsquo Engagement in the Circular Economy
90
Additionally satisfaction with professional repair services was analysed individually for
the five different product categories Detailed results are displayed in Section 7 in the
Annex document Overall satisfaction was positive for all products While clothing items
received the highest ratings for convenience speed consumer friendliness and quality of
repair smart phones received the lowest ratings For all product categories it was
observed that the highest average satisfaction rates were achieved for quality of repair
while speed of repair received comparatively lower satisfaction ratings
Table 23 displays findings on whether repair services met consumersrsquo expectations
Overall consumers indicated that professional repair services rather met their
expectations 74 reported that the engaged service was at least above their
expectations with respect to convenience of repair (including 4 stating that is was
even well above their expectations) With respect to speed of repair a similar rating
emerged 72 stated that the service was at least above their expectations with 7
rating the service even better Consumer friendliness received a slightly better rating
Here 81 indicated that the repair service performed at least above their expectations
including 9 stating that it performed even well above their expectations Lastly
quality of repair was rated with a total of 80 indicating the servicesrsquo results to have
been at least above their expectations with 10 stating them to be even well above their
expectations
Table 23 Rating whether professional repair services met expectations (in )
Well below
expectations
Below
expectations
Above
expectations
Well above
expectations
Convenience 36 227 694 43
Speed of repair 50 233 650 66
Consumer
friendliness
32 156 726 86
Quality of the repair 46 152 697 104
Note The question was Q62c ldquoAnd to what extent did the repair service live up to your expectations in terms of these factorsrdquo follow up to previous Table 22 N=7331
Source ConPolicy analysis of consumer survey data
Again results on consumersrsquo expectations were analysed on the individual product level
as well Detailed results are depicted in Section 7 in the Annex document For all product
categories it was found that expectations were largely met The highest average ratings
were observed for clothing items while ratings were lowest for smart phones Similarly
ratings were on average lower for repair services in the product category of televisions
When looking at the different rated categories ie convenience speed consumer
friendliness and quality it was found that consumersrsquo expectations more likely met for
consumer friendliness and quality than for convenience and speed
442 Experience with rentingleasing products or buying products second
hand
The following section addresses consumersrsquo actual experience with renting or leasing
products as well as buying products second hand Respondents were asked if they had
experience with such practices in the last 5 years The same product categories as before
were covered (ie vacuum cleaners dishwashers TVs mobile phones and
coatsjackets) This section is thus distinct from the analysis presented in section 341
which showed hypothetical willingness to lease product as an indicator for willingness to
engage in CE practices
Figure 25 displays results on renting or leasing and buying second hand behaviour pooled
over the product categories A vast majority of 92 indicated that they neither rented
nor bought second hand in the last 5 years Purchasing second hand was more frequent
than renting ie 6 of the participants indicated to have bought second hand products
whereas 1 indicated to have rented or leased a product
Behavioural Study on Consumersrsquo Engagement in the Circular Economy
91
Figure 25 Experience with renting leasing or buying second hand pooled over product
categories (in )
Note The question was Q33a ldquoFor each of the products below have you rented or leased such a product or purchased a product second hand in the last 5 yearsrdquo N=12064
Source ConPolicy analysis of consumer survey data
Table 24 shows behaviour for the individual product categories Clothing items and
mobile phones were bought almost twice as often second hand compared to other
products Apart from that there were no substantial differences between product
categories
Table 24 Experience with renting leasing or buying second hand by product category
(in )
Vacuum
cleaner
Dish-
washer
TV Mobile
phone
Coat or
jacket
Rented or leased a
product
08 11 11 26 08
Purchased a second
hand product
46 54 48 83 89
Neither of the above 937 928 934 882 894
Donrsquot know 11 07 08 10 09
No of observations 4907 4463 4908 4914 4917
Note The question was Q33a ldquoFor each of the products below have you rented or leased such a product or
purchased a product second hand in the last 5 yearsrdquo
Source ConPolicy analysis of consumer survey data
Behaviour was also analysed with respect to country and socio-demographic factors The
detailed results can be found in Section 7 in the Annex document with a summary here
below
The share of participants not renting or buying second hand ranged from 81 (Romania)
to 93 (Portugal and Spain) 15 of the Romanian participants indicated to have bought
second hand while this share was much lower among Portuguese participants (3)
Participants from Ireland and Hungary also revealed comparatively larger shares of
buying second hand (10) A small age trend was observed for buying second hand
While 10 of the youngest participants indicated to have bought second hand only 4
indicated this behaviour in the oldest age group Education did not seem to play a role
while there was again a trend with respect to income Participants indicating their
financial situation to be very difficult revealed in 11 of the cases to have bought second
hand while participants indicating their financial situation to be very easy bought second
hand in only 5 of the cases
1
6
1
91
0 10 20 30 40 50 60 70 80 90 100
Dont know
Purchased second hand
Rented or leased a product
Neither rented nor second hand
Behavioural Study on Consumersrsquo Engagement in the Circular Economy
92
Reasons for renting or leasing a product
As seen before only few participants have rented or leased any of the products in the
past Table 25 depicts the reasons for renting or leasing specific products for this (small)
group of participants The importance of the reasons seemed to be product specific and
no clear general patterns emerged
The most popular reason for renting or leasing vacuum cleaners was that it was easier
to rent a vacuum cleaner than to buy one (24) The same was true for renting and
leasing coats or jackets (31) Televisions were rented or leased most frequently
because people wanted to test the product before buying it (22) The most
important reason for renting a dishwasher was that people liked that the product was
also reused afterwards (31) The price was the most important reason for
participants that rented or leased a mobile phone 32 indicated that they rented or
leased a mobile phone product because they could not afford to buy it
Table 25 Reasons for renting or leasing a product by product category (in )
Vacuum
cleaner
Dish-
washer
TV Mobile
phone
Coat or
jacket
It was easier than
buying one
237 110 181 256 311
I wanted to test the
product before
buying it
187 256 219 129 226
I liked that the
product would be re-
used afterwards
93 312 159 159 97
I could not afford to
buy the product
151 228 112 316 79
Maintenance was
included
185 105 134 167 170
I only needed the
product for a short
time
172 176 105 115 141
I could get rid of the
product more easily
148 80 121 57 133
Other 52 38 68 79 38
Donrsquot know 23 05 93 36 137
No of observations 55 71 69 130 52
Note the question was Q33b ldquoYou said that you have rented or leased the following product(s) in the last 5 years Why did you decide to do this For each product please select the two most important reasonsrdquo Since participants indicated the two most appropriate reasons the totals do not sum up to 100
Source ConPolicy analysis of consumer survey data
Reasons for not renting or leasing a product
As indicated before the vast majority of the participants had no experience with renting
or leasing products Table 26 illustrates the reasons why participants had not engaged
with such practices in the past
The two most important reasons for all product categories were that participants wanted
to own the products they use (ranging from 44 to 49) as well as wanting a new
unused product (ranging from 41 to 51) Preferring not to be bound by
contracts not knowing that renting a product was possible or higher costs of
renting were all of moderate importance Negligible reasons were the inability to find a
product for rent (below 4 for all products) and lack of trust in rentalleasing firms
(below 7 for all products)
Behavioural Study on Consumersrsquo Engagement in the Circular Economy
93
Having a look at the differences between product groups it becomes obvious that there
were almost no noteworthy differences Being bound by a contract was a less important
reason not to rent a clothing item (10) compared to other product categories (about
20)
Table 26 Reasons for not renting or leasing a product by product category (in )
Vacuum
cleaner
Dishwasher Television Mobile
phone
Coat or
jacket
I like to own the
products I use
476 440 465 448 494
I wanted a new
unused product
410 415 428 429 505
I prefer not to be
bound by contracts
195 198 210 213 100
I did not know it was
possible
159 147 132 109 124
It was more
expensive than
buying the product
133 134 123 130 76
I could not find a
product for rent
24 30 18 25 25
I do not trust
rentalleasing firms
49 59 61 61 36
Other 20 28 17 23 15
Donrsquot know 10 16 11 13 24
No of observations 4796 4351 4799 4726 4809
Note The question was Q33c ldquoYou said that you have not rented or leased the following product(s) in the last 5 years Why is this For each product please select the two most important reasonsrdquo Since participants indicated the two most appropriate reasons the totals do not sum up to 100
Source ConPolicy analysis of consumer survey data
Reasons for buying a product second hand
Buying products second hand was overall more popular than renting or leasing Table 27
depicts the reasons for buying products second hand Price played an important role for
all product categories (ranging from 41 to 65) followed by the reason that
participants thought second hand products to be better value for money (ranging from
31 to 39) Moreover between 13 and 31 of participants bought second hand due
to environmental reasons Simplicity of the buying process as well as availability were
only important to a small fraction of participants that bought second hand
Furthermore a notable difference between the product categories exists regarding
environmental motives for purchasing second hand Only 13 to 20 of participants
indicated that they bought a vacuum cleaner dishwasher television or mobile phone
second hand for environmental reasons while this was true for 31 of participants
buying second hand clothing items
Behavioural Study on Consumersrsquo Engagement in the Circular Economy
94
Table 27 Reasons for buying a product second hand by product category (in )
Vacuum
cleaner
Dishwasher Television Mobile
phone
Coat or
jacket
It was cheaper than
buying a new one
414 555 509 646 579
Second hand
products are better
value for money
309 313 350 332 393
Buying goods second
hand is better for the
environment
177 164 131 196 311
It was easier than
buying a new one
151 179 167 161 66
The product I wanted
is no longer in
production
78 72 85 93 104
Second hand
products are better
quality
108 81 33 30 74
Other 38 39 52 16 15
Donrsquot know 18 07 41 22 46
No of observations 245 287 297 458 545
Note The question was Q33d ldquoYou said that you have purchased the following product(s) second hand in the last 5 years Why did you decide to do this For each product please select the two most important reasonsrdquo Since participants indicated the two most appropriate reasons the totals do not sum up to 100
Source ConPolicy analysis of consumer survey data
Reasons for not buying a product second hand
According to Table 28 the most important reason for not buying second hand was that
participants wanted to have new products instead of old ones The shares of
participants choosing this answer category ranged between 55 and 68 Lack of trust
in second hand products was on average the second most important reason followed
by agreeing to new products being better value for money Possible inferior quality of
second hand products and difficulties in buying second hand were only important to a
small share of the participants
Furthermore there exists an interesting difference regarding the trust in second hand
products between different product categories While trust in the products seemed to be
an important driver for dishwashers (30) televisions (31) mobile phones (36) and
even clothing items (20) it was a very negligible reason for vacuum cleaners (3)
Behavioural Study on Consumersrsquo Engagement in the Circular Economy
95
Table 28 Reasons for not buying a product second hand by product category (in )
Vacuum
cleaner
Dishwasher Television Mobile
phone
Coat or
jacket
I prefer having brand
new products
549 569 585 580 684
New products are
better value for
money
206 210 210 182 138
I do not trust second
hand products
29 303 309 356 203
It is more difficult
than buying a new
one
110 108 92 68 85
Second hand
products are of
inferior quality
82 66 77 103 88
I donrsquot know where
to buy a second hand
product
76 60 52 48 55
Second hand
products cost more
to maintain
53 73 64 46 22
Other 52 51 40 40 43
Donrsquot know 29 26 30 29 50
No of observations 4606 4135 4571 4398 4316
Note The question was Q33e ldquoYou said that you have not purchased the following product(s) second hand in the last 5 years Why is this For each product please select the two most important reasonsrdquo Since participants indicated the two most appropriate reasons the totals do not sum up to 100
Source ConPolicy analysis of consumer survey data
45 Evidence from the behavioural experiment
This section reports findings from the repair experiment which was part of the
behavioural experiment A short description of the experimental tasks outcome
measures treatments and monetary incentives can be found in section 271
The repair experiment had two stages First respondents needed to decide whether they
wished to repair or replace a defective product which was beyond the 2-year legal
guarantee110 In case they decided to replace their product they were given a choice to
replace it with either a brand new product or a second hand product We report findings
for each of these stages in turn below
451 Likelihood to repair
Experiment respondents had generally positive attitudes towards repairing defective
products A vast majority (92) decided to repair at least one product over the course of
the three rounds of the repair experiment task
110 To avoid confusion by respondents with regards to whether the defect was covered by a legal guarantee the product age was indicated as being 2 years for coats and smartphone and 5 years for TVs vacuum cleaners and dishwashers
Behavioural Study on Consumersrsquo Engagement in the Circular Economy
96
Figure 26 Frequency of choosing to repair across all respondents and rounds of the task
Note The repair experiment was repeated three times by each respondent each time making decisions about a different type of product N=6042
Source LE Europe analysis of behavioural experiment
The likelihood of choosing to repair a product was roughly equivalent across the different
products Only for Dishwashers the share of respondents choosing to repair was
significantly larger than for all other products as shown in Figure 27 below
Figure 27 Shares of respondents choosing to repair and replace by product type
Note Numbers of observations by product VC=3627 DW=3638 TV=3644 SM=3612 CL=3605
Source LE Europe analysis of behavioural experiment
The top two reasons for choosing to repair a product rather than replacing it in this
experiment task were
Always trying to repair products before replacing them and
Thinking that a repair would be worthwhile
Other reasons including other monetary motives and fashiontechnology preferences
were less important but still frequently mentioned as shown in Figure 28
Behavioural Study on Consumersrsquo Engagement in the Circular Economy
97
Figure 28 Reason for choosing to repair
Note Answers to follow-up question FR2 Why did you choose to repair the product instead of replacing it Select all that apply N=3769
Source LE Europe analysis of behavioural experiment
Impact of socio-psychological attitudes on repair decisions
Socio-psychological attitudes seemed to play an important role in repair or replace
decisions The consumer survey elicited several self-declared personal attitudes towards
different aspects of the CE These survey questions were used to derive indicators for the
following attitudes
Preferences for trends and fashion
Pro-environmental attitudes in general
Positive attitudes towards second hand products
Pro-CE attitudes of peers (eg family and friends)
Self-rated awareness of durability and reparability and
Positive attitudes towards durability and reparability
Shown in Figure 29 the different attitudes appear to be systematically related to the
likelihood of choosing to repair rather than to replace in the experimental task
Individuals with strong preferences for trends and fashion chose less often to repair
compared to those who had medium or weak preferences for trends and fashion In
particular the share of respondents who repaired once or twice over the course of the
three repetitions of the experiment seems to be fairly constant across different attitudes
(47-52) At the same time those with weak preferences for fashion and trends were
much less likely to never repair (5) compared to those with strong preferences for
trends and fashion (13) and much more likely to choose to repair in every round (48
compared to 35)
Similar patterns were observed for the other personal attitudes as well as for attitudes of
peers
Interestingly also individuals with positive attitudes towards second hand products were
more likely to repair rather than replace This was despite the fact that individuals could
have chosen to purchase a second hand product as a replacement product
Behavioural Study on Consumersrsquo Engagement in the Circular Economy
98
Figure 29 Likelihood to repair for respondents with different socio-psychological
attitudes relative to the CE
Preferences for trends and fashion Pro-environmental attitudes
Positive attitudes towards second hand products
Pro-CE attitudes of peers
Awareness of durability and reparability Positive attitudes towards durability and reparability
Never repaired Repaired once Repaired twice Repaired three times
Source LE Europe analysis of behavioural experiment
The reported findings were verified using regression analyses (see the Annex for further
detail) These analyses confirmed that socio-psychological factors and particularly
attitudes towards trends and fashion and attitudes towards durability and reparability
were strong drivers of the decision to repair or replace
Behavioural Study on Consumersrsquo Engagement in the Circular Economy
99
The effects of effort frictions in repair or replace decisions
The experiment systematically varied how the choice to repair was presented via
experimental treatments111 In a first step it was varied whether individuals needed to
exert more effort in order to repair or replace This treatment thus simulated the fact
that in reality it can be difficult to arrange for repair similarly it can be time consuming
to search for a replacement product either new or second hand Figure 30 below shows
how the likelihood to repair across the different experimental rounds varied under
different treatment conditions
Behaviour in the baseline condition where both repairing and replacing were effortless112
resembled behaviour in the condition in which replacement required effort 6-7 of
respondents in these conditions never repaired while 76-80 decided to repair twice
or three times
When instead repairing required effort the share of respondents deciding to never repair
doubled from 6 to 12 At the same time the share of respondents who chose to
always (three times) repair dropped from 42 to 35 Both movements are highly
statistically significant
Regression analysis reported in Table 29 similarly finds that effort in the experiment
discouraged repair but it did not discourage replacement of a broken product with either
a new or second hand product This finding was robust to the inclusion of socio-
psychological characteristics and demographics
It thus seems that frictions in the accessibility of repair services significantly
lowered the attractiveness of repairing while the same type of frictions had
virtually no effect on the decision to replace a product Overall repairing was the
most popular choice in this experiment However it seems that respondents at some
occasions had a clear motivation behind their decision to replace rather than repair For
example many respondents who replaced did not think a repair would have been
worthwhile or were interested in owning the latest fashiontechnology (see next
subsection for further details) It seems that when this was the case respondents were
not put off replacing even when it required them to go through an additional tedious
task
A possible reason for this can be seen in the behavioural economics literature which finds
that when the intrinsic motivation for a certain behaviour is strong it can outweigh
nudges and other environmental factors which could otherwise influence behaviour113
This means that in the experiment although the effort associated with repairing and
replacing was identical respondents may have still perceived that repairing would be
more tedious by taking their real-world expectations about repair into the experiment
environment Indeed it is regularly found in well-known economic experiments that
respondent behaviour can differ due to framing or labelling effects114
111 Allocations to the various treatments in the experimental tasks were done independently and randomly across the different allocations This resulted in a full factorial design between products and treatments This means that group sizes for different variants within each treatment category were roughly equal and each respondent had the same likelihood of being assigned to any specific treatment This also ensures that on average there should not be any interactions between different types of experimental treatments
112 Repairing required only clicking on a lsquoRepairrsquo button replacing required clicking on a lsquoReplacersquo button and then selecting a replacement product between a brand new or second hand product
113 Sunstein (2017) lsquoNudges that failrsquo Behavioural Public Policy
114 For example behaviour in a prisonersrsquo dilemma game differs widely depending on whether it is labelled as a ldquoCommunity Gamerdquo or a ldquoWall Street Gamerdquo similarly contributions in public goods game are different depending on whether the experiment is labelled as a ldquoCommunity Gamerdquo or simply as an ldquoExperimentrdquo See respectively Ross Ward (1996) lsquoNaive realism in everyday life Implications for social conflict and misunderstandingrsquo In Reed et al (Eds) Values and Knowledge Liberman Samuels Ross (2004) lsquoThe name of the game predictive power of reputations vs situational labels in determining Prisonerrsquos Dilemma game movesrsquo Personality and Social Psychology Bulletin 30 Dufwenberg Gaumlchter Henning-Schmidt (2011) lsquoThe framing of games and the psychology of playrsquo Games and Economic Behavior
Behavioural Study on Consumersrsquo Engagement in the Circular Economy
100
Overall however it should not be disregarded that a more than one in three experiment
participants decided to repair in each of the three rounds and were never dissuaded from
doing so because of the additional effort required
Figure 30 Frequency of repair choices in different effort conditions
Note Number of observations in different treatment conditions No effort N=2020 Effort after repair N=1991 Effort after replace N=2022
Source LE Europe analysis of behavioural experiment
Behavioural Study on Consumersrsquo Engagement in the Circular Economy
101
Table 29 Results from ordered logit regression on number of repairs chosen and logit regression on proportion of second hand products chosen
Outcome variable Number of times repair was chosen across three rounds
Proportion of second hand products chosen if respondent replaced
(1) (2) (3) (4)
Effort treatment ndash Baseline no effort
Effort after repair 0710 0699 1130 1114
(-421) (-434) (086) (073)
Effort after replace 1143 1138 0942 0930
(168) (159) (-039) (-045)
VAT treatment ndash Baseline Repair is not VAT exempt
VAT exempt 0995 0960 0999 1033
(-007) (-061) (-001) (026)
Source of repair treatment ndash Baseline Manufacturer repair with original parts only
Manufacturer repair with non-original parts 0853 0860 1306 1211
(-174) (-162) (159) (108)
Independent repair with original parts only 0974 0961 1131 1066
(-029) (-042) (072) (035)
Independent repair with non-original parts 0847 0843 1060 1058
(-176) (-177) (034) (031)
Country controls
Socio-demographics (age gender etc)
Personal attitudes (pro-CE pro-trends etc)
Model Ordered logit Ordered logit Logit Logit
N 6042 6042 3711 3711
Note Odds ratios (exponent coefficients) reported t statistics in parentheses p lt 005 plt 001 p lt 0001
Behavioural Study on Consumersrsquo Engagement in the Circular Economy
103
The effects of framing repair prices as VAT exempt
Another experimental condition varied the display of the repair prices by labelling
repair prices as including VAT or as VAT exempt It is important to note that this
experimental treatment did not vary the prices for repair as such (eg prices which were
labelled as VAT exempt were not cheaper than VAT inclusive prices)115 This is because it
was not the objective of this study to assess the price elasticity in demand for repair
services but rather to assess whether non-price related measures might make the option
to repair product more or less attractive Indeed the behavioural economics literature
often finds that the way in which prices are presented (ie framed) has important effects
on choice behaviour116 This experimental condition alluded that repair may have been a
lsquogood dealrsquo (since it was labelled as VAT exempt) and at the same time it made the
decision to repair more salient (via a red label ldquoVAT EXEMPTrdquo see section 271 for
screenshots of the experiment environment) Both these characteristics of the
experiment had been hypothesized to make repairing more attractive In the present
experiment however choices were virtually unaffected by the framing see Figure 31
and Table 29
Figure 31 Frequency of repair choices in VAT framing treatment
Note Number of observations in different treatment conditions VAT not exempt N=2997 VAT exempt N=3045 The treatment tested framing only This means that prices were identical in both experimental conditions
Source LE Europe analysis of behavioural experiment
The finding is in line with what classical economic theory would predict Classical
economic theory would not expect a shift in the demand for repair unless prices were
different Thus further efforts to expand VAT exemption of repair services should take
into account consumersrsquo price sensitivity for repair services It would need to be verified
whether demand for repair services is elastic such that price reductions due to VAT
exemption would actually increase the use of repair services According to the
behavioural experiment preferential VAT treatment purely in a marketing sense might
remain without an effect
115 For example the price to repair a dishwasher would have been euro79 incl VAT in one condition and euro79 excl VAT in another Prices were calibrated in this way to disentangle price effects from VAT framing effects
116 See for example UK Office for Fair Trading (2010) lsquoThe impact of price frames on consumer decision makingrsquo a report prepared by London Economics Tversky and Kahneman (1981) lsquoThe framing of decisions and the psychology of choicersquo Science Levin et al (1998) lsquoAll frames are not creaed equal A typology and critical analysis of framing effectsrsquo Organizational Behavior and Human Decision Processes
Behavioural Study on Consumersrsquo Engagement in the Circular Economy
104
At the same time it is important to consider that other assessments of the effects of
preferential VAT taxation (or VAT exemption) of specific goods and services are
inconclusive Most theoretical studies and pre-assessments argue that demand for the
concerned goods and services would increase due to the price reductions which would in
turn increase supply and employment in the affected sectors However these effects are
not (consistently) confirmed by post-implementation evaluations One problem in the
chain of the above arguments is that VAT reductions are often not passed on to the
consumers thus resulting in stable prices and demand117
The importance of characteristics of the repair service
Lastly the experiment tested whether repair decisions were driven by certain (non-price)
characteristics of the repair services It was varied whether repair services were more
attractive when offered by the manufacturer compared to by an independent repair
service And secondly it was varied whether the repair was done using original parts
only or original as well as non-original parts Prices across these different conditions
were held constant So this treatment can again be seen as a lsquoframingrsquo treatment
Shown in Figure 32 this experimental condition also left choices mostly unaffected
Yet further regression analysis suggested that the impact of labelling might have been
different for certain groups of consumers For example the VAT exempt label seems to
have attracted individuals who give low importance to fashion and trends towards repair
while those who attribute high importance to trends and fashion and those who had
negative attitudes towards second hand products were significantly less likely to choose
repair when it was labelled as VAT exempt The framing of repair prices as VAT exempt
has also led some respondents in more difficult financial situations to repair more
Figure 32 Frequency of repair choices by (non-price) repair characteristics
Note Number of observations in different treatment conditions Manufacturer with original parts N=1475 Manufacturer with non-original parts N=1544 Independent repair with original parts N=1524 Independent with non-original parts N=1499 The treatment tested framing only This means that prices were identical in all four experimental conditions
Source LE Europe analysis of behavioural experiment
117 For some overviews of the effects of VAT and VAT changes see for example European Commission (2013) Reduced rates of VAT frequently asked questions MEMO03149 European Commission COM(2003) 397 final Abramovski et al(2017) lsquoRedistribution efficiency and the design of VAT a review of the theory and literaturersquo Institute for Fiscal Studies Experian (2014) An estimate of the effects of a reduction in the rate of VAT on housing renovation and repair work 2015 to 2020
Behavioural Study on Consumersrsquo Engagement in the Circular Economy
105
It appears that if at all repair decisions were affected by the use of non-original parts
When aggregating data from the table above it seems that repair was slightly less
attractive when the repair service used original and non-original parts compared
to the conditions in which original parts were used exclusively At the same time
whether the repair service was offered by the manufacturer or an independent
repair shop was indifferent for respondents
Regression analysis suggested that the repair characteristics mattered to some extent to
different age groups However no clear patterns arose For example younger
respondents (aged 18-34) were less likely to repair when repair would have been done
using original parts only Instead older respondents (55+) were more likely to choose to
repair when an independent repair shop provided the service rather than the
manufacturer
These findings thus suggest that there are no strong inherent differences in consumer
attitudes towards manufacturer or independent repairs Such differences could arise for
example due to differences in trust
The present experiment however did not test whether preferences would shift for
example if repairs by the manufacturer were more expensive than repairs offered by an
independent repair shop It is likely that a difference in price would also shift consumer
preferences
As mentioned above a majority of respondents in this experiment felt a repair would be
worthwhile Interestingly more respondents indicated this reason for repairing when
repair was offered by the manufacturer with original parts only or when offered by an
independent repair shop using both original and non-original parts Instead when the
manufacturer would have used also non-original parts or an independent shop only
original parts respondents seemed to have the impression that this made repair less
worthwhile
452 Likelihood to purchase second hand
As mentioned above following the decision to repair or replace a product respondents
who chose to replace were asked whether they wished to purchase a brand new or
second hand replacement product All results presented in this section thus only show
choices for respondents who initially chose to replace and not repair their products in
the first stage
Second hand products were calibrated to be equivalent to the state of technologyfashion
of the already owned defective product whereas brand new products would have
represented an upgrade Second hand products were roughly 40 cheaper compared to
brand new replacement products
Visible from Figure 33 respondents who wished to replace their products rather than
repair them had an overwhelming preference for brand new products Only 20 of
respondents had a tendency to choose the second hand option over the option of
purchasing brand new at this decision stage
Behavioural Study on Consumersrsquo Engagement in the Circular Economy
106
Figure 33 Choices between brand new and second hand products results pooled across
all respondents repetitions of the task and experimental treatments
Note This figure presents data aggregated across the three repetitions of the experiment The left-hand bar indicates respondents who have chosen the second hand product at least once when they reached the replace stage once or twice and respondents who chose the second hand product at least twice if they reached the replace stage three times The right-hand bar shows the residual individuals who were thus more likely overall to have chosen the brand new over the second hand product
Number of respondents included in the chart N=3711 Total number of respondents in the experiment was
6042 of which 3711 (61) have chosen to replace at least once
Source LE Europe analysis of behavioural experiment
The strong preferences for brand new products were equivalent for vacuum cleaners
dishwashers and televisions with 86-87 of respondents choosing brand new over 13-
14 choosing second hand products (Figure 34) Yet for smartphones and clothes
(coats) respondents were more likely to purchase the second hand product 20
compared to the other product categories At least for coats this was likely due to the
fact that it was less fashion-driven respondents who were most likely to purchase second
hand For smartphones instead no particular respondent group drove the result
The other strands of research (literature review focus groups and stakeholder
consultations) suggested that different attitudes could drive behaviour differently for
different product categories in the sense that fashion and technology might influence
some product decisions more than others
Behavioural Study on Consumersrsquo Engagement in the Circular Economy
107
Figure 34 Choices between brand new and second hand products results pooled across
all respondents repetitions of the task and experimental treatments
Note VC=1324 DW=782 TV=1283 SM=1260 CL=1345
Source LE Europe analysis of behavioural experiment
Reasons for replacing rather than repairing were quite mixed The most important
reasons seemed to relate to scepticism around the quality of repair 47 of respondents
indicated that they did not think that repair would be worthwhile that it would be too
expensive (27) and that it would be too much hassle (18) These reasons prevailed
although only a minority of respondents thought that the product could not be repaired
(9)
At the same time a considerable proportion of respondents 35 indicated being
interested in owning the latest fashion andor technology which naturally made the
options to repair or purchase a second hand product less attractive
Figure 35 Reasons for replacing rather than repairing products
Note Answers to follow-up question FR3 Why did you choose to replace the product instead of repairing it
Select all that apply N=2273
Source LE Europe analysis of behavioural experiment
Behavioural Study on Consumersrsquo Engagement in the Circular Economy
108
Impact of socio-psychological attitudes on replacement decisions
Compared to the importance of socio-psychological attitudes on repair decisions these
factors seemed to play a less important role in replacement decisions Visible from Figure
36 the decision to purchase a second hand product was again slightly increased by more
pro-CE attitudes but the patterns were less distinct than in the preceding stage
The most notable difference in behaviour was observed for respondents with positive
attitudes for second hand products These individuals were more than four times more
likely to purchase a second hand product compared to individuals with negative attitudes
towards used products 41 compared to 9 Similarly the regression analyses
confirmed that the attitude towards second hand products was the main driver of the
decision to purchase second hand
Figure 36 Likelihood to repair for respondents with different socio-psychological
attitudes relative to the CE
Preferences for fashion and trends Pro-environmental attitudes
Positive attitudes towards second hand products
Pro-CE attitudes of peers
Awareness of durability and reparability Positive attitudes towards durability and reparability
Behavioural Study on Consumersrsquo Engagement in the Circular Economy
109
Mostly chose second hand product Mostly chose brand new product
Source LE Europe analysis of behavioural experiment
Impact of experimental treatments on the replacement decisions
The experiment did not introduce systematic changes at this decision stage None of the
experimental treatments that were applied at the first repair vs replace stage had
knock-on effects on the decision whether to replace the product with a brand new or
second hand product
Behavioural Study on Consumersrsquo Engagement in the Circular Economy
110
5 Consumersrsquo awareness understanding and expectations on
durability and reparability
The present study did not use a precise definition of what constitutes a lsquodurablersquo or
lsquorepairablersquo product Instead it was one of the main scopes of the study to uncover
what consumers associate with the concepts of lsquodurabilityrsquo and lsquoreparabilityrsquo
The study thus potentially takes a different point of view on these CE concepts compared
to studies that are focussed on industry standards Naturally industry standards require
clear definitions of what can be considered a lsquodurablersquo or lsquorepairablersquo product to be
enforceable This study instead covers the views and perceptions around durability
and reparability of the general population across different EU Member States
Based on findings from the literature stakeholder interviews focus group discussions
and the consumer survey this section presents findings on consumersrsquo awareness of
durability and reparability characteristics and what they understand by durability and
reparability as well as their expectations about such product characteristics Differences
by product category and differences in behaviour of different consumer groups in terms
of CE attitudes or socio-demographics are highlighted throughout Secondly a focus is
put on consumersrsquo after-sales expectations For example when do consumers expect a
free repair or replacement of a broken product and how do such expectations vary
depending on the product information received at the point of sale
Key findings
According to stakeholders focus group participants and survey respondents
consumers most associate products lasting for a long time with lsquodurabilityrsquo
Secondly consumers tend to collapse the concepts of durability quality and
price in the sense that they expect longer life spans for more expensive products
More specifically in the consumer survey properties most associated with a ldquodurablerdquo
product were being able to use a product for a long time and the product
staying in perfect working order for a long time
As highlighted in previous sections these consumer associations are heavily
influenced by a substantial lack of awareness and missing product information
regarding CE product characteristics
Stakeholders reported that consumer expectations about durability decreased with
time after purchase and that consumersrsquo after-sales expectations about reparability
were low
Various strands of research pointed out that older consumers expected products to
last longer
A stakeholder mentioned that consumers from former communist countries of Eastern
Europe tend to exhibit higher durability expectations At the same time as reported
already in section 4 consumers from Eastern Europe also display a higher willingness
to repair
Focus group participants felt that products produced in the past were more durable
compared to modern products
In the consumer survey the properties most associated with a ldquorepairablerdquo
product were spare parts being available for the product and the possibility to
have the product repaired by a repair firm
Several stakeholders for example from trade associations and industry highlighted
how reparability and durability should be seen in conjunction in the sense that easy
reparability can enhance durability Instead it appears that consumersrsquo mostly
view durability as a substitute for reparability because a long-lasting product would
not require repairs (see also findings from the behavioural experiment reported in
section 6 which highlight that durability plays a more important role for consumers
compared to reparability)
What consumers associate with lsquodurabilityrsquo and lsquoreparabilityrsquo seems to be consistent
across different types of products At the same time consumers have different
expectations regarding how long different products should last Focus group
participants and survey respondents have reported wide ranges of life-time
expectations for the different products of the study such as
Behavioural Study on Consumersrsquo Engagement in the Circular Economy
111
o For vacuum cleaners 27 of survey participants expected a lifespan between
4 and 7 years with another 27 that indicated an expectation of 7 to 10
years
o For dishwashers the lifespan expectations were higher with 29 indicating
that they expected a lifespan between 7 and 10 years and another 29 with
an expectation of 10 to 15 years
o Similarly 31 indicated they expected a television to last for 7 to 10 years
and another 28 stated their expectation to lie within the range of 10 to 15
years
o For mobile phones and clothing items lifespan expectations were lower 38
expected a lifespan between 2 and 4 years for mobile phones and 35
indicated a lifespan of 4 to 7 years
o For clothing items lifespan expectations were indicated to lie within 2 to 4
years by 25 and within 4 to 7 years by 26 of the participants
For all five product categories a substantial majority of survey respondents ndash ranging
from 77 for coatsjackets to 90 for dishwashers ndash thought it would be possible
for these products to be repaired either by themselves or by someone else on
their behalf This high overall percentage was largely due to an expectation that it
would be possible to have the products repaired by a third party (ie friends and
family professional repair services)
Most survey respondents who said they would be able to repair the products
themselves believed it would be ldquoratherrdquo or ldquoveryrdquo easy to repair a vacuum
cleaner (55) or coatjacket (58) whereas the shares who gave this answer
were much lower for dishwashers televisions and mobile phones (35 23 and
29 respectively)
Across all product categories most consumers expected it would be ldquoratherrdquo or ldquoveryrdquo
easy to have a product repaired for them (ranging from 51 to 69)
In terms of after-sales expectations there were contrasting views uncovered
by the different strands of research Stakeholders reported low after-sales
expectations of consumers for the reparability of products These low expectations
were grounded in negative experiences in terms of support from the retailers
These reported negative experiences seem however to contrast with findings from the
consumer survey Across the representative samples across 12 Member States most
consumers would expect a good service from repair services a substantial
majority would expect the service to be ldquofairlyrdquo or ldquoveryrdquo good in terms of
convenience (85) speed (82) friendliness (89) and quality of the repair
(92) And as reported in the previous section experiences with repair services were
mostly positive and repair services regularly exceeded expectations There thus
seems to be a mismatch between consumersrsquo expectations and actual
experiences that might be driven by exemplary negative experiences of a
minority of consumers
Generally guarantees seem to affect consumersrsquo expectations according to
stakeholder and consumer views from the survey and focus groups The longer a
product is under guarantee the longer consumers expect the product to last and the
higher are their expectations also regarding the reparability of a product Moreover if
a product breaks down during the guarantee period consumers are more likely to
return it to the retailer or manufacturer to receive a replacement or free repair
The survey revealed mixed views regarding what should happen if a product were to
become faulty For example 34 of consumers would expect to have to repair the
product at their own expense while 32 would expect repair free of charge
Repair free of charge was often expected when consumers held extended
commercial guarantees or insurance from retailers (41) the retailer claimed
that the product would ldquolast at least 10 yearsrdquo (32) or the product carried an EU
label indicating that it has a high durability rating (22)
A joint analysis of the behavioural experiment and the consumer survey has revealed
that consumers who have received durability information via manufacturer
warranties or durability promises at the point of sale in a purchasing exercise in the
experiment were significantly more likely to expect free replacement or free
repairs of faulty products Instead those who had not seen any information on CE
product characteristics or only information on the reparability of a product were
Behavioural Study on Consumersrsquo Engagement in the Circular Economy
112
significantly less likely to expect free rectification of the fault in any way and instead
more likely to expect needing to pay for either repair or replacement
51 Evidence from the literature and data collection
511 Consumersrsquo awareness understanding and expectations about
durability
Consumers understanding of durability
Braithwaite et al (2015) have studied the impact of durability information on consumersrsquo
purchasing decisions They have reviewed the part of the literature on consumersrsquo
durability understanding They have found that the meaning of durability varies among
consumers It can be linked to products that have lifetime guarantees or that have parts
that can be updated or modifiedrsquo Durability is also linked to the productrsquos performance
over time
The other sections of this report have indicated that consumers mainly link durability
to a longer lifespan (see especially section 611) The importance of lifespan
information on labels in consumersrsquo purchasing decisions confirms this statement
Moreover according to a WRAP study for a consumer the durability of a product is
measured by how long the product provides a useful service to them118
Consumersrsquo awareness of durability
Sections 612 and 614 present the importance of information about durability on
consumersrsquo purchasing decisions The reviewed literature showed that this positive
impact is explained by the consumersrsquo initial lack of knowledge on durability
characteristics The study carried out on behalf of the European Economic and Social
Committee indicated that on average a product was chosen 46 more often when the
lifespan of the product was indicated119 From this it can be concluded that consumers
are not aware of the durability of products unless they are informed about it
As an example of a white good and according to a European Commission report about
household dishwashers consumers do not feel knowledgeable about how long washing
machines last and are not aware of the information available120 Some consumers also
have doubts about whether the lifetime of products can be accurately measured
As the degree of consumersrsquo awareness varies according to the information provided it
may be assumed that having a legally required indication may enhance consumersrsquo
awareness of a productrsquos durability The Annex illustrates some specific cases where such
durability information is mandatory (see Section 3 lsquoOverview of existing policy initiatives
and potential improvements suggested by stakeholdersrsquo in the Annex document) For
instance under the European Ecodesign Directive traders shall indicate a minimum
information about the expected lifespan of vacuum cleaners and light bulbs121
Consumersrsquo expectations about durability
The reviewed literature has indicated that consumersrsquo expectation about durability
varies across products
In 2013 a WRAP study on consumersrsquo purchasing behaviour towards electronic
appliances stated that the expected durability for washing machines vacuum
cleaners and laptops were lower than for TVs and fridges However no detailed
figures or explanation were provided in this study
118 WRAP 2017
119 European Economic and Social Committee 2016
120 European Commission (2017) European Commission DG JUSTGfK (2017) lsquoConsumer Market Study to support the Fitness Check of Consumer Rulesrsquo
121 BEUC 2015
Behavioural Study on Consumersrsquo Engagement in the Circular Economy
113
Figure 37 below illustrates the desired lifespan of consumer goods according to an online
study carried out on behalf of the Chamber of Labour in Vienna in 2017 with 1009
respondents It seems that expectations regarding lifespan are higher for major
household appliances and furniture than for clothes and electronic items
Figure 37 Desired lifespan of consumer goods (in years)
Source AK Wien 2017 p 8
512 Consumersrsquo awareness understanding and expectations about
reparability
Consumersrsquo understanding of reparability
The reviewed literature provided information about the positive impact of the information
on reparability and the best way to frame this information (see section 614) However
no relevant information about consumersrsquo understanding of reparability were retrieved
Consumersrsquo awareness of reparability
As for consumersrsquo understanding of reparability no information was found in the
literature
Consumersrsquo expectations about reparability
Two main points emerged from the literature review consumersrsquo preference to use
either a professional or an independent repair service and the question of what
consumers expect when using a repair service
The first category of products for which we retrieved information is clothes According to
a WRAP study carried out in 2012 50 of survey respondents declared that they
repaired their clothes by themselves while 25 said they gave them to a friend or to a
family member to have them repaired Only 25 of the remaining respondents reported
using a professional repair service This willingness to use non-professional repair
services may be partly explained by the fact that 40 of the consumers surveyed
expressed their confidence in repairing their clothes by themselves while 15 of the
other respondents were eager to learn how to do it122
122 WRAP 2012 pp 63 65
Behavioural Study on Consumersrsquo Engagement in the Circular Economy
114
Preliminary findings of a study being conducted by a German consumer association
illustrate that 34 of consumers get their products repaired by the seller from which
they purchased it123
The next important findings deal with consumersrsquo general expectations about repair
services and the variation of those expectations across different product
(categories)
In 1978 L Adler and J Hlavcek conducted a field study on the importance of certain
repair services characteristics for consumers Following their study the five most
important repair service characteristics mentioned by consumers were cost speed
reputation quality and location
The importance of those characteristics varies across products Quality of the repair work
is the most important consideration for automobiles televisions refrigerators stoves
and stereos For electric can openers toasters and pocket calculators cost is the most
critical repair consideration In the case of typewriters and vacuum cleaners cost is
somewhat more important than quality All categories have in common that location is
the least impactful characteristic124
Finally HWieser and NTroumlger (2012) also pointed out that consumers have higher
expectations of repair services for more expensive and bigger household products
513 After-sales expectations
The literature review did not find evidence on after-sales expectations because most
studies were focussed on the purchasing process
52 Evidence from the stakeholder interviews
521 Consumersrsquo awareness understanding and expectations about
durability
Consumersrsquo understanding of durability
Interviewees underlined the conclusions from the literature review regarding consumersrsquo
understanding of durability Indeed the main input from interviewees is that durability
is interlinked with quality According to a representative from a European consumer
association the first consideration from consumers in their purchasing decision is about
quality According to him for consumers durability is the principal component of a
quality assessment A Romanian academic confirmed this association between durability
and quality
Another finding of our interview with a representative from a European trade association
the definition of the durability should be broader than the expected lifespan It
should also integrate the possibility to repair the product Indeed the easier it is to
repair the product the longer the lifespan will be Furthermore the durability definition
should also better integrate the concrete usage of the product Indeed there may be
some gaps between the metrics of a legal definition and the concrete use by the
consumer This need to broaden the definition of durability was confirmed by the
interviewee from a renowned manufacturer of household appliances The definition of
durability should also encompass the notion of reparability as the latter extends the
lifetime of a product
Consumersrsquo awareness of durability
Overall all interviews showed consistently the fact that consumersrsquo lack of information
negatively impacts their awareness of durability
The representative from a European trade association highlighted that consumers are
not aware of the durability of products because they lack crucial information
123 Verbraucherzentrale Bundesverband 2017
124 Adler amp Hlavcek 1978
Behavioural Study on Consumersrsquo Engagement in the Circular Economy
115
However as mentioned in the literature review part legal requirements of EU regulations
could fill this gap by making the information about durability mandatory
Consumersrsquo expectations of durability
A representative from a Dutch public authority mentioned that more expensive products
have better durability in general Another circular economy expert interviewed for this
study stated that consumers expect a longer life span for more expensive pieces
of clothing for example suits and coats We have found that both literature reviews and
interviews conducted agree on this
Moreover according to a European consumer association representative gender and
age also play a key role in consumer expectations For instance older people
expect products to last longer
There are also differences visible among countries Two representatives from NGOs
highlighted that in former communist countries of Eastern Europe consumer
expectations regarding durability are higher because during the communist era
products were produced in a more durable way
According to an Austrian consumer association another important point to highlight is
that consumers have rather low expectations because of past problems A representative
from a European trade association who was mentioned in the two previous sections
confirmed this point It was underlined that past negative experiences impacted
consumersrsquo expectations
522 Consumersrsquo awareness understanding and expectations about
reparability
Consumersrsquo understanding of reparability
Similar to the literature review we could not gather information on what consumers
understand by reparability
Consumersrsquo awareness of reparability
A representative from a Hungarian NGO indicated that consumer associations are well
informed and that they understand product durability and reparability However
consumers do not understand those characteristics neither are they aware of them A
representative from a European trade association highlighted that this low degree of
awareness is consistent across all product categories
Consumersrsquo expectations about reparability
Some of our interviewees agreed with the fact that expectations about reparability
vary across products and have changed over time It used to be more common to
get items like televisions and vacuum cleaners repaired Nowadays most consumers
replace them because it is easier and faster and somewhat cheaper Clothes will only be
repaired if the item has sentimental value was very expensive or is a unique item
According to other interviewees when dealing with expensive household goods
consumers expect that they will not break down at all during the minimum
lifespan They also expect that small defects will be easily repairable Thus consumers
have higher expectations about the reparability of these products This statement was
confirmed by a representative of a well-known electric appliances manufacturer who also
added that these expectations were the same for products manufactured by reputable
brands
With regards to the use of independent or professional repair services representatives of
different national consumer associations and NGOs have pointed out the fact that for
cheaper products consumers prefer independent repairers while for more
expensive products consumers prefer official repair centres from the retailers
For the latter independent centres will only be used if they have certification from
manufacturers An interviewee from an important company producing electric appliances
stressed that in general consumersrsquo preferences go towards official repair centres or at
least repair points directly working with the manufacturer
Behavioural Study on Consumersrsquo Engagement in the Circular Economy
116
523 After-sales expectations
More information about after-sales expectations were retrieved from the interviews than
in the literature review
After-sales expectations about durability
A German academic stated that consumersrsquo expectations about durability decrease
after purchase At the time of the purchase consumers have high expectations about
product lifespan As time passes consumers are more willing to change that product for
a new one
After-sales expectations about reparability
According to a representative from a European consumer association consumersrsquo
after-sales expectations about reparability are low The main reason is that a lot of
consumers have negative experience in terms of support from the retailers For instance
according to the same stakeholder several retailers have refused to repairreplace
certain components that failed (eg batteries in cell phones) while the product was still
under guarantee
Moreover a representative from a Hungarian NGO mentioned that consumers tend to
often choose replacement and refund over repair When the guarantee period is still
effective replacement is the most frequent remedy chosen This also gives an indication
about the low level of expectations about reparability from consumers
Lastly an English NGO highlighted that after-sales expectations from consumers
also depends on the kind of additional guarantee they get with a product The
longer the guarantee is the higher the expectations consumers have about reparability
53 Evidence from the focus groups
531 Consumersrsquo awareness understanding and expectations about
durability
Across the different countries durability was considered to be an important aspect
Participantsrsquo main sources of information with regard to productsrsquo durability were
Questions asked to the sales staff
Product labels
Online costumer reviews
Price (more expensive products are sometimes considered to be more durable)
Productsrsquo appearance and materials used (eg for white goods and electronics
stability metal vs plastic etc)
Brand reputation
Previous experience with certain brands
Word-of-mouth and
Duration of the guarantee (the longer the guarantee the longer the expectation
regarding the productsrsquo lifetime)
As explained in more detail in section 421 many participants pointed out that
nowadays it is very difficult to estimate a productrsquos durability Criteria such as
brand reputation price and costumer reviews are not always seen as accurate indicators
There was a large variation with regard to participantsrsquo expectations on how long
products should actually last Views varied by product category but also according to
participantsrsquo personal opinions and experiences Some participants pointed out that
products made in the past were a lot more durable than those manufactured nowadays
rdquoI have a mixer made in the GDR And it still works So more than 27 years A
friend bought a new one and it broke down after 2 years Crazyrdquo (Woman mixed
group Berlin)
Participants generally had higher expectations with regard to the durability of white
goods (washing machines dishwashers vacuum cleaners) These types of products
were generally expected to last between five and ten years
Behavioural Study on Consumersrsquo Engagement in the Circular Economy
117
Views varied more when talking about the durability of other products For televisions
some estimated durability should be between two and five years while for others a
television should be made to last between 10 and 20 years For smartphones durability
was generally expected to be between three and five years Views also varied when
discussing the durability of clothing items Some estimated durability at three years
while for others clothing should last between five and fifteen years
Views on this topic also varied by type of participants In Germany participants from the
vulnerable group had higher expectations with regard to productsrsquo durability than those
from the ldquomixedrdquo group For white goods (dishwashers washing machines vacuum
cleaners) as well as televisions participants from the vulnerable group expected these
to last twice as long as those from the ldquomixedrdquo group
When talking about productsrsquo durability participants also showed a certain level of
distrust towards manufacturers Many suggested that products made nowadays are
deliberately not ldquobuilt to lastrdquo while products made years ago were designed to be more
resistant Some participants felt that this applied to most types of products (whether
electronics or clothing) and stated that regardless of price or brand products are
designed to last only for as long as their warranty is valid
ldquoWashing machine I would have always bought the biggest and top brands for
washing machines but I have discovered that they didnrsquot last as long as I was
counting on them to last If itrsquos cheap and it works and when itrsquos gone itrsquos gone I
bought one and spend out 550 euros on it and it didnrsquot last and then the
warranty was out after a year so the next one I got was 250 euro in [store name]
and it did last as long as the other onerdquo (Woman vulnerable group Dublin)
532 Consumersrsquo awareness understanding and expectations about
reparability
Experiences attitudes and awareness with regard to reparability varied by country by
participantsrsquo situation (ldquomixedrdquo vs vulnerable group) as well as by type of product
Participants in Sweden were generally less aware of the possibility of having products
repaired than those in other countries Participants in Sweden had little knowledge with
regard to how to go about having products repaired and how to find a repair centre
ldquoI would like to find the classic old man across the street repairing all sorts of
things and if I have used mine for fifteen years he can fix it and it works for
fifteen more yearsrdquo (Female 58 mixed group Stockholm)
In Germany and Ireland awareness was higher particularly among participants from the
vulnerable groups When having to repair products that were out of warranty
participants had a preference towards small independent local repair centres
In the Czech Republic participants mentioned looking up information online about where
they can have a product repaired that is out of warranty
For products that break down while still covered by the warranty participants usually
brought these back to the manufacturer or shop where they were purchased
Some participants were mainly willing to repair products that were more expensive such
as white goods (dishwashers and washing machines) as well as smartphones and
televisions They explained that having them repaired was more advantageous than
purchasing new ones
ldquoWashing machines because (they are) very expensive so we try to fix it before
we get another one Mine could be fixed it was positive but because it was old
and really good Our TV as well it was expensive so we fixed itrdquo (Woman
vulnerable group Dublin)
Others felt that it was easier to have smaller items repaired such as small electronics
(eg vacuum cleaner) or clothing items (shoes or coats)
When talking about productsrsquo reparability one of the things participants pointed out was
that todayrsquos technology was so complex that people can no longer envisage repairing
products themselves
Behavioural Study on Consumersrsquo Engagement in the Circular Economy
118
ldquoYou know nowadays it just is not possible anymore to repair something In the
past it was easy but now with all the technology it all got too complicated and
even the mechanics find it hardrdquo (Man 56 vulnerable group Berlin)
When talking about repairing products that are no longer under warranty participantsrsquo
expectations can be summarised as follows
The price of repairing is ldquosignificantly lowerrdquo than the price of purchasing a new
product
The availability of services (being able to easily find a repair centre)
Not having to wait for too long for a product to be repaired and
Being able to find spare parts
For products still under warranty people expect to be able to have these repaired for
free
533 Consumersrsquo awareness understanding and expectations about
recyclability
Awareness with regard to how to recycle products was highest in Ireland Germany and
Sweden Participants in these countries mentioned having already recycled products by
bringing them to shops or manufacturers waste collection centres or charity
associations
In the Czech Republic participants mentioned the financial benefits of recycling In this
country some of the participants were motivated by the financial reward they got from
selling products that they no longer used on eBay
Awareness with regard to productsrsquo recyclability was however low Participants knew
little about aspects such as whether or not products they purchase are made of recycled
materials which parts of the products can be recycled and more generally what
happens to products once they are brought in for recycling (whether or not these are
actually being recycled which components are recycled and for which purposes etc) The
fact of not having this type of information was sometimes felt as discouraging for
participants
ldquoRecycling here Recycling there What does that even mean I feel that term is
used far too much and one cannot trust it anymore In Germany we recycle the
waste and then it gets burned That is annoyingrdquo (Man 46 mixed group Berlin)
Participantsrsquo expectations with regard to recyclability can be summarised as follows
Having more information with regard to productsrsquo recyclability (how products are
recycled which parts are recycled whether products they purchase are made from
recycled materials) ndash more information on this can be found in section 633
Having more information with regard to how to recycle products (where to bring
these or who to contact)
Being able to recycle easily Some participants mentioned that recycling can be
complex and time-consuming particularly in the case of having to dispose of large
electronics which requires effort as well as having a car They felt that
manufacturers and shops should be the ones in charge of undertaking some of
these tasks making it easier for consumers
ldquoIt is very hard to recycle You need a car or ask someone for help Why canacutet the
producersretailers have this service So that I can leave it with themrdquo (Female 35
vulnerable group Stockholm)
54 Evidence from the consumer survey
541 General associations with durabilityreparability
The following section analyses consumersrsquo general associations with durability and
reparability
Table 30 shows that the participants mostly associated two properties with a lsquodurable
productrsquo namely 57 indicated that they associate the term with being able to use
the product for a long time while 56 reported that they associate the term with
products staying in perfect working order for a long time Around one out of four
Behavioural Study on Consumersrsquo Engagement in the Circular Economy
119
participants also stated that durable means that a user is able to use the product very
frequently or that the product will not break under severe stresses
Table 30 Properties most associated with a ldquodurablerdquo product (in )
Answer Percentage
Being able to use the product for a long time 567
The product will stay in perfect working order for a long time 564
The product will not break under severe stresses 276
Being able to use the product very frequently 256
Other 16
None of the above 06
Donrsquot know 11
Note Participants were asked (Q21) ldquoPlease select the two properties you most associate with a ldquodurablerdquo productrdquo Since participants indicated the two most appropriate reasons the totals do not sum up to 100 There were no correct or incorrect answers the question purely asked about respondentsrsquo associations N=12064
Source ConPolicy analysis of consumer survey data
There is a more heterogeneous pattern with respect to respondentsrsquo associations with
lsquorepairable productsrsquo Table 31 present the results
46 of the participants reported that they associated repairable products with spare
parts being available for the products followed by 44 that indicated that a repairable
product could be repaired by a repair firm 33 of the participants stated that they
associate reparability with the manufacturerretailer repairing the products if it
breaks For around one out of four participants reparability refers to the possibility to
repair a product by themselves The last two associations ie that all components of
the product (eg battery) are easily accessible to the end-user and instructions manuals
are available to help with repair received lower agreement from participants (18 and
7)
Behavioural Study on Consumersrsquo Engagement in the Circular Economy
120
Table 31 Properties most associated with a ldquorepairablerdquo product (in )
Answer Percentage
Spare parts are available for the product 462
I could have the product repaired by a repair firm 443
The manufacturerretailer will repair the product for me 327
I could repair the product myself 257
All components of the product (eg battery) are easily accessible to
the end-user
184
Instruction manuals are available to help with repair 70
Other 03
None of the above 04
Donrsquot know 16
Note The corresponding question (Q22) was ldquoPlease select the two properties you most associate with a ldquorepairablerdquo productrdquo Since participants indicated the two most appropriate reasons the totals do not sum up to 100 There were no correct or incorrect answers the question purely asked about respondentsrsquo associations N=12064
Source ConPolicy analysis of consumer survey data
As seen in Table 30 the top two associations with the term durable both include a time
dimension ie using and working for a long time Hence participants were asked to
indicate their expectations regarding how long a specific product would last
For vacuum cleaners the largest share of participants (27) indicated an expected
lifespan of 4 to 7 years followed by another 27 that indicated that they expected their
vacuum cleaner to last between 7 to 10 years For dishwashers 29 of the survey
participants indicated an expected lifespan of 7 to 10 years with another 29 that
indicated an expected lifespan of 10 to 15 years The expectations for televisions were
very similar The largest share of participants (31) indicated a lifespan expectation of 7
to 10 years and 28 indicated a lifespan expectation of 10 to 15 years For mobile
phones and clothing items expectations were lower In the case of mobile phones 38
of the participants indicated an expected lifespan of 2 to 4 years and another 35
indicated an expected lifespan of 4 to 7 years Lastly for clothing items the largest share
of participants (26) indicated an expected lifespan of 4 to 7 years while another 25
indicated their expectation to lie within the range of 2 to 4 years
Figure 38 displays differences for the individual product categories The individual values
for the different product types and answer categories can be found in the Annex
For vacuum cleaners the largest share of participants (27) indicated an expected
lifespan of 4 to 7 years followed by another 27 that indicated that they expect their
vacuum cleaner to last between 7 to 10 years For dishwashers 29 of the survey
participants indicated an expected lifespan of 7 to 10 years with another 29 that
indicated an expected lifespan of 10 to 15 years The expectations for televisions were
very similar The largest share of participants (31) indicated a lifespan expectation of 7
to 10 years and 28 indicated a lifespan expectation of 10 to 15 years For mobile
phones and clothing items expectations were lower In the case of mobile phones 38
of the participants indicated an expected lifespan of 2 to 4 years and another 35
indicated an expected lifespan of 4 to 7 years Lastly for clothing items the largest share
of participants (26) indicated an expected lifespan of 4 to years while another 25
indicated their expectation to lie within the range of 2 to 4 years
Behavioural Study on Consumersrsquo Engagement in the Circular Economy
121
Figure 38 Expectations on durability by product category (in )
Note The question was Q63 ldquoFor how long would you expect the following products to last on average under normal use conditions in terms of the number of years before they need to be replaced By lsquonormal use conditionsrsquo we mean normal frequency of use and taking into account usual maintenance servicing and small repairs of the product Donrsquot worry if you do not know exactly ndash please provide your best estimate for each productrdquo N=12064
Source ConPolicy analysis of consumer survey data
Furthermore the results from the consumer survey can be compared with existing data
on product lifetimes With respect to televisions the average lifecycle is 7 years125
When comparing this value to the results from the consumer survey it can be found that
27 of the participants had a lower expectation than the average lifecycle while the
majority of 70 indicated to have a higher expectation
Additionally there exists data on the average lifecycle of smartphones which is
estimated to be approximately 2 years126 When comparing this lifecyclelifetime with the
expectations of participants in the consumer survey it can be found that 7 indicated
their expectation to be lower than the average lifecycle time while the majority of 89
reported a higher expectation
Furthermore country differences were analysed with respect to lifespan expectations
Results for all product categories and the twelve countries are displayed in the Annex
Exemplary specific results for two product categories are described in the following
namely for mobile phones and dishwashers127
125 European Commission Joint Research Centre (2018)a Assessment of the reparability and upgradability of TVs (Draft) retrieved from httpsusprocjrceceuropaeuE4CdocsJRC_report_TV_repair_v2-2_CLEANpdf It has to be kept in mind that the reported data on the average lifecycle ie the replacement cycle does not refer to the actual technical lifetime of the product While the actual technical lifetime refers to products being replaced due to breakage or malfunctioning the replacement lifecycle also includes products that are replaced due to a preference for a newer version ie still functioning Hence the actual technical lifetime of televisions can differ from the reported average lifecycle replacement cycle
126 European Commission Joint Research Centre (2018)b Guide for the Assessment of Material Efficiency application to smartphones (Draft) retrieved from httpsusprocjrceceuropaeuE4CdocsJRC_report_smartph_v23_CLEANpdf Similarly to the data on televisions it has to be kept in mind that the data on average lifecycle includes both cases where a product is replaced due to breakage or malfunctioning (technical lifetime) as well as due to a preference for a newer version ie still functioning Hence the actual technical lifetime of smartphones can differ from the reported average lifecycle replacement cycle
127 The reason for selecting those two product categories are the following Mobile phones can be characterised by shorter innovation cycles and are considered to be an electronic gadget ie consumers replace their phone
1
1
1
1
2
2
2
1
6
6
11
5
5
38
25
27
18
20
35
26
27
29
31
10
15
21
29
28
4
11
5
7
7
1
4
2
3
3
1
5
3
7
3
3
6
0 10 20 30 40 50 60 70 80 90 100
VC
DW
TV
SM
CL
Less than 1 year More than 1 but less than 2 years More than 2 but less than 4 years
More than 4 but less than 7 years More than 7 but less than 10 years More than 10 but less than 15 years
More than 15 but less than 20 years More than 20 years Donrsquot know
Behavioural Study on Consumersrsquo Engagement in the Circular Economy
122
For mobile phones around 45 - 47 of the respondents in Romania Ireland Sweden
the Netherlands and Latvia indicated an expected lifespan between 2 and 4 years In
contrast 43 of German participants indicated a higher lifespan expectancy of 4 to 7
years
When looking at dishwashers further interesting country differences were found German
and Swedish participants had a rather strong expectation for their dishwasher to last
between 7 and 15 years (ie 65 and 69) In contrast 59 of the Irish 55 of the
French and 50 of the Romanian participants indicated a shorter expected lifespan
between 4 and 10 years Furthermore a comparatively large share of 29 among the
Latvian participants indicated not to know the expected lifespan128
542 Expectations regarding repair services
The following section considers consumer expectations regarding repair services Firstly
general expectations on repair are presented Secondly results of consumersrsquo
expectations regarding the ease of self-repair are shown followed by expectations on
ease of repair by a repair service Lastly consumersrsquo expectations about the likelihood
that they would be satisfied with a repair service are presented
Table 32 shows the participantsrsquo expectations regarding the repair possibilities of the five
product categories The most common answer across all five categories was that the
participants would expect to be able to have the product repaired for them eg by
the manufacturer a professional service provider or friends and family The percentage
of participants indicating this expectation ranged from 64 to 32
Also important was the answer that they both expect to be able to repair the
product themselves and have it repaired for them (ranging from 23 to 15)
followed by the expectancy to be able to repair the product themselves (ranging from
21 to 6) A smaller share of participants indicated that they expected neither of the
above (ranging from 18 to 6)
The following differences in expectations between the individual product categories can
be seen from the results
For mobile phones and televisions the majority (59 and 64) expected to be able
to have the product repaired for them compared to a smaller share of participants
expecting to both be able to repair the products themselves and have it repaired (17
and 15) Interestingly a larger fraction of participants indicated that they expect to not
have their product repaired at all (11 and 11) compared to being able to repair the
product by themselves (7 and 6)
Similar to mobile phones and televisions for vacuum cleaners and dishwashers the
majority of participants expected to be able to have the product repaired for them (50
and 56) Less participants expected to both be able to repair it themselves and have it
repaired (23 and 22) and to be able to repair the product themselves (16 and
13) The smallest share of participants indicated that they do not expect the product to
be repaired at all (8 and 6)
For clothing items ie coats and jackets a different picture emerges 32 of the
participants expected to be able to have their product repaired for them 23 expected
to both be able to repair their item themselves and have it repaired and 21 expected to
be able to repair it themselves With 18 the share of participants indicating to not
expect to have their product repaired at all is considerably higher in the clothing category
compared to the other categories
more frequently as newer models also contain improved technical features In contrast dishwashers are characterised by longer innovation cycles and not replaced because of trends
128 As mentioned before results on the other product categories are displayed in Section 7 the Annex document In general it was found that expectations regarding vacuum cleaners and television were between those of dishwashers and mobile phones With respect to clothing expectations regarding durability were on average also rather low but also country dependent
Behavioural Study on Consumersrsquo Engagement in the Circular Economy
123
Table 32 Expectations regarding repair services by product category (in )
Vacuum
Cleaner
Dishwas
her
Televisi
on
Mobile
Phone
Coat or
Jacket
I would expect to be able to
have this repaired for me
498 557 641 592 319
I would expect to be able to
repair this myself and have
it repaired for me
225 217 146 168 233
I would expect to be able to
repair this myself
159 125 63 73 213
None of the above 79 64 105 114 175
Donrsquot know 39 37 45 53 61
No of observations 4907 4463 4908 4914 4917
Note The question (Q61a) was as follows ldquoThinking about the following types of products do you expect that it would be possible for you to repair these products yourself or to have these products repaired for you (eg by a repair firm)rdquo
Source ConPolicy analysis of consumer survey data
Ease of self-repair
Participants that indicated that they expected to be able to repair a certain product by
themselves were then asked to rate the ease of self-repair ie how much time and effort
it would be for them Table 33 summarises the results for the different product
categories
The expected ease of self-repair varies substantially between categories For vacuum
cleaners (55) and coats or jackets (68) the majority of participants reported that
self-repair would be rather or very easy whereas for other products most
participants indicated that repairing their product themselves would be rather or very
difficult (65 for dishwashers 77 for televisions and 71 for mobile phones) The
proportion of participants who found self-repair very easy was largest in the clothing
category (9) The share of participants who found self-repair very difficult was largest
in the category of televisions (20) and mobile phones (18)
Table 33 Ease of self-repair by product category (in )
Vacuum
Cleaner
Dishwash
er
Televisio
n
Mobile
Phone
Coat or
Jacket
Very easy 34 21 11 28 89
Rather easy 511 331 222 263 590
Rather difficult 413 548 568 525 289
Very difficult 42 101 199 184 33
No of observations 1738 1386 929 1031 2141
Note Depending on participantsrsquo reply to the previous question they were asked (Q61b) ldquoYou said you would expect to be able to repair the following products yourself How difficult do you think this would be (ie how much time and effort for you) Please answer on a scale from 1 (ldquoVery easyrdquo) to 4 (ldquoVery difficultrdquo)rdquo
Source ConPolicy analysis of consumer survey data
Behavioural Study on Consumersrsquo Engagement in the Circular Economy
124
Ease of repair service
Table 34 shows the results of a question that asked participants to rate the ease with
which they could have a product repaired by a repair service The rating referred to the
personal costs ie time and effort for the participants themselves
Across all product categories the majority of participants expected it to be rather or
very easy to have a product repaired for them (69 to 51) Having a product repaired
was perceived to be easiest for coats or jackets (69) followed by mobile phones
(60) vacuum cleaners (57) televisions (53) and dishwashers (51)
Table 34 Ease of repair service by product category (in )
Vacuum
Cleaner
Dishwash
er
Televisio
n
Mobile
Phone
Coat or
Jacket
Very easy 53 57 55 80 106
Rather easy 518 457 477 515 588
Rather difficult 377 387 356 313 261
Very difficult 52 99 112 93 45
No of observations 2558 2619 3255 3075 1735
Note If participants indicated that they would expect to be able to have a product repaired they were asked the following question (Q61c) ldquoYou said you would expect to be able to have the following products repaired for you How difficult do you think this would be (ie how much time and effort for you) Please answer on a scale from 1 (ldquoVery easyrdquo) to 4 (ldquoVery difficultrdquo)rdquo
Source ConPolicy analysis of consumer survey data
Expectations regarding the satisfaction with repair services
As a next step participants were asked to indicate their expectations regarding how
satisfied they think they would be if they used a repair service Table 35 presents the
results
Overall expectations were positive With respect to convenience 85 indicated that
they expect a repair service to be at least fairly good including 21 indicating expecting
a very good performance Similarly expectations on the speed of repair were high
with 82 reporting they would expect at least a fairly good service in this respect
(including 25 expecting a very good service) Consumer friendliness was expected to
be at least fairly good by 89 of participants including 31 who expected a very good
service in this regard
Expectations with respect to the quality of repair were even higher A total of 92 of
the participants stated that they expected at least a fairly good quality of repair with a
high share of 42 even stating that they expected the quality of repair to be very good
Behavioural Study on Consumersrsquo Engagement in the Circular Economy
125
Table 35 Expectations regarding the satisfaction with repair services (in )
Very Poor Fairly Poor Fairly Good Very Good
Convenience 14 139 640 207
Speed of repair 14 163 576 247
Consumer friendliness 06 103 586 305
Quality of the repair 07 74 497 422
Note The question (Q62d) was ldquoSupposing you wished to have a product repaired by a repair service how good do you expect such a service would be in terms of the following factors Please answer on a scale from 1 (ldquoVery poorrdquo) to 4 (ldquoVery goodrdquo)rdquo N=4733
Source ConPolicy analysis of consumer survey data
543 After-sales expectations
The following section addresses consumersrsquo after-sales expectations The survey
questions regarded consumersrsquo expectations in general and were not linked to specific
past experiences with products they owned Survey participants were asked to indicate
what they would expect to happen in case a product became faulty
The question scenario varied the product in question as well as the productrsquos age when it
became faulty in the following way
Suppose you purchased a new [INSERT dishwasher vacuum cleaner television
smartphone coat] and it developed a fault that made it unusable after
[INSERT period] Which of the following remedies would you expect to be
available to you if any Please select all that apply
The periods were varied to capture whether expectations vary depending on whether
products have been shortly or for a long time been beyond the legal guarantee of 2
years
Vacuum cleaners 2 or 4 years
Dishwasher 4 or 6 years
Television 4 or 5 years
Smartphone 12 or 24 months
Coat 2 or 5 years
Results are presented in the table below
While 32 would expect their broken product to be repaired for free 34 said that they
would have to pay for the repair One quarter stated that they would be entitled to a free
replacement while 24 indicated they would have to purchase a replacement on own
expense Moreover 11 said that they would be entitled to a refund
Behavioural Study on Consumersrsquo Engagement in the Circular Economy
126
Table 36 After-sales expectations for faulty products (in )
Answer Category Percentage agreement
over all variants
I would need to pay to have the product repaired 340
I would be entitled have the product repaired for free 323
I would be entitled to a free replacement 245
I would need to purchase a replacement 237
I would be entitled to a refund 106
Other 13
Donrsquot know 68
Note The question (Q81) was ldquoSuppose you purchased a new dishwasher a new vacuum cleaner a new television a new smartphone a new coat and it developed a fault that made it unusable after [period] Which of the following remedies would you expect to be available to you if any Please select all that applyrdquo Overall the following ten variants were used 1 vacuum cleaner2 years 2 vacuum cleaner4 years 3 dishwasher4 years 4 dishwasher6 years 5 television4 years 6 television5 years 7 smartphone12 months 8 smartphone24 months 9 coat2 years 10 coat5 years Results are aggregated for the ten variants N=12064
Source ConPolicy analysis of consumer survey data
Interestingly the experimental conditions of the behavioural experiment had some
knock-on effects on responses to this survey question Respondents who were shown
manufacturer warranties or durability promises as part of an EU label were
significantly more likely to expect free replacement or free repairs of faulty
products Instead those who had not seen any information on CE product
characteristics or only information on the reparability of a product were significantly less
likely to expect free rectification of the fault in any way and instead more likely to expect
needing to pay for either repair or replacement
Subsequently consumersrsquo after-sales expectations regarding entitlement to a repair free
of charge were explored in more detail Participants were asked to indicate whether they
expected repair free of charge for different scenarios
Overall 41 of the participants expect repair free of charge in case the product breaks if
they purchased an extended commercial guarantee or insurance from the retailer
Free repair in case of defects are also expected by 32 of the respondents if the retailer
claimed that the product should last at least 10 years In case the product carried
an EU label indicating that it has a high durability rating 22 of the participants
indicated that they expected a repair free of charge One fifth stated this expectation in a
scenario where the fault developed during everyday use of the product
Respondents were less likely to expect free repair in other scenarios such as the product
carrying an EU label indicating that it is repairable the retailer claiming that ldquoThis
product can be easily repairedrdquo purchasing the product directly from the manufacturer or
a large retail chain the product being more expensive than other products of the same
type and purchasing the product from a small independent retailer
Behavioural Study on Consumersrsquo Engagement in the Circular Economy
127
Table 37 After-sales expectations regarding entitlement to a repair free of charge (in )
Answer Category Percentage Agreement
over all variants
I purchased an extended commercial guarantee or
insurance from the retailer
408
The retailer claimed that ldquoThis product should last at least
10 yearsrdquo
316
The product carried an EU label indicating that it has a high
durability rating
220
The fault developed during everyday use of the product 201
The product carried an EU label indicating that it is
repairable
144
The retailer claimed that ldquoThis product can be easily
repairedrdquo
104
I had purchased the product directly from the
manufacturer
103
I had purchased the product from a large retail chain 96
The product was more expensive than other products of
the same type
90
I had purchased the product from a small independent
retailer
57
None of the above 100
Donrsquot know 100
Note The question was (Q82 following on from the question presented in Table 36 ldquoAnd in this scenario where your new dishwasher your new vacuum cleaner your new television your new smartphone your new coat developed a fault after [period] would you expect repair free of charge in the following circumstancesrdquo N=12064
Source ConPolicy analysis of consumer survey data
Behavioural Study on Consumersrsquo Engagement in the Circular Economy
128
6 Durability and reparability information and its potential role
in consumersrsquo decision-making
Previous chapters have reported repeatedly that consumers seem to lack information
about the durability and reparability when purchasing products This chapter therefore
dives deeper into the effects of providing such information and how it could be delivered
most effectively
Key findings
As reported before (see especially sections 3 and 4) consumers value Circular
Economy product credentials The literature and stakeholders support the views that
providing information about product durability and reparability would encourage
consumers to purchase products with higher Circular Economy credentials At the
same time price remains of key importance
Consequently according to the literature stakeholder views and the consumer survey
durability was more important for large and expensive products (including expensive
clothing) and less so for fashion items
In fact in the consumer survey clothing was often an outlier category in the
sense that respondents most often ranked durability and reparability as not
important for this product category The reasons behind this finding seemed to
relate to the fact that respondents would not expect to use clothing items for a long
time and that they would not expect to repair clothes if they broke
In terms of other socio-demographic differences survey respondents from Romania
and Hungary attributed a higher relevance to durability and reparability in the
purchasing process Respondents from the Netherlands Germany Austria and
France on the other hand indicated lower rates for durability and reparability
relevance
Previous studies (including experimental evidence) focus group discussants and
stakeholder views pointed out that labels and brand reputation could carry
effective durability information More specifically presenting lifetime information
through the number of usage years was slightly more efficient than showing the
number of usage units (eg per wash) Following the findings from the literature
review for white goods brand name was very important while consumers would
highly value an indicator on durability for clothes
The consumer survey supported these findings but revealed also that the most
important self-declared factors influencing purchasing decisions were
quality price and how long products would last
A majority of survey respondents attached high importance to product durability
Among these respondents the top reason was that durable products would save
them money in the long run Yet difficulty of knowing how long a product would
last could be seen as a main barrier for giving durability high importance This was
found among survey respondents who did not rate product durability as important
Across all strands of research reparability was relatively less important for
purchasing decisions compared to durability
A previous experimental study found that presenting information about the
availability of spare parts was more influential on consumersrsquo decisions than
cost-related information The interviewed stakeholders stated that most
consumers looked for the availability of repair points
Guarantees were also considered as a potential source of information on reparability
Moreover as for durability brand names seem to be important as well Consumers
seem to take brand reputation as a promise to repair according to stakeholders
Focus group discussants found different types of reparability information useful such
as how difficult it would be to repair a product and how much time would be
required to repair
In the survey the possibility to save money with easily repairable products seemed to
motivate individuals to engage with reparability The desire to keep products for a
long time had the same effect Reparability was often not given high importance in
purchasing decisions because respondents trusted manufacturersrsquo warranties or
would not expect a product to break Finally feelings that repair would be expensive
also let reparability rank low in importance
Behavioural Study on Consumersrsquo Engagement in the Circular Economy
129
All strands of research suggest that durability and reparability information
would be best provided at the point of sale
Survey respondents mostly expected to receive information via product
descriptions or by virtue of including durability information in guarantees or
warranties129
Labels were generally found to be effective at providing CE product information
Indeed focus group participants reacted positively to the possibility of having
information provided on labels such as an augmented EU Energy Label
These views are supported by strong evidence from the behavioural experiment In
the behavioural experiment durability information was best provided via
manufacturer warranties or as an expected lifetime Showing durability
information via EU labels such as for example an augmented Energy or Ecolabel
was similarly effective
The effect sizes in the experiment were large When respectively durability or
reparability information was provided in the experiment consumers were almost
three times more likely to choose products with the highest durability on
offer and more than two times more likely to choose products with the
highest reparability ratings These shifts resulted from consumers turning away
from low durabilityreparability products in favour of those with better CE credentials
As usual with experimental findings these effects need to be seen in conjunction with
the experimental setup which consisted of a simplified purchasing process with
streamlined and standardised product information compared to real-world shopping
experiences It is thus possible that the effectiveness of durabilityreparability in
reality might be increased or dampened
General CE preferences were strongest when durability and reparability
information was presented together That is when durability and reparability
information was shown together individuals were most likely to purchase products
which rated high in both dimensions ndash durability and reparability Durability was
clearly the more influential factor of these preferences In the experiment durability
information provoked the strongest shifts in preferences while reparability only
marginally led participants to choose products with overall better CE credentials
These trends in purchasing decisions were confirmed also by analyses of willingness
to pay for durability and reparability Showing information on these CE
characteristics on product descriptions at the point of sale resulted in meaningful
willingness to pay Depending on how durabilityreparability information was
presented willingness-to-pay for an additional year of durability ranged
between euro20-36 for vacuum cleaners and dishwashers euro92-148 for TVs euro148-217
for smartphones and euro14-27 for coats Willingness-to-pay for an improved
reparability rating was around euro29-54 for vacuum cleaners euro83-105 for
dishwashers euro77-171 for TVs euro48-98 for smartphones and euro10-30 for coats130
Showing expected lifetimes or manufacturer warranties produced highest
willingness to pay closely followed by the information provided on EU labels via
icons As before the differences between the effectiveness of the EU label and
manufacturer-provided information were small and it is likely that the effectiveness of
the EU label would increase over time as the icons used to indicate
durabilityreparability become better known among consumers Further consumer
testing of different icons could be further explored
Lastly behaviourally informed lsquonudgesrsquo in the form of claims popping up on
respondentsrsquo screens prior to making purchasing decisions significantly increased
respondentsrsquo preferences for more durable products Two claims were tested i)
telling people that they could save money by purchasing products which last longer
129 This study did not address whether consumersrsquo attitudes were different for situations in which products were still covered by the 2 year legal guarantee covering all goods sold in the EU or covered by additional (extended or commercial) warranties See Glossary at the end of the report for definitions of (legal) guarantees and warranties
130 The willingness-to-pay was measured per year for durability and per two-step increase on the A-G scale for reparability See Section 272 and Section 8 in the Annex document for a detailed methodology
Behavioural Study on Consumersrsquo Engagement in the Circular Economy
130
and which are easy to repair ii) telling people that a majority of people chose
products which last longer and which are easy to repair Both claims were similarly
effective
61 Evidence from the literature and data collection
611 Relevance of durability characteristics in purchasing decisions
The perception of the durability of goods may vary from one consumer to another as was
seen in section 5 From literature dealing with durability considerations during the
purchasing process it seems that most consumers relate durability to longer
timespans without a fault (ie time until it breaks and not time until it cannot be
repaired anymore)
Overall the reviewed literature has provided little concrete quantitative data on how
much consumersrsquo value durability when purchasing a good However according to a
WRAP study carried out in 2013 consumers consider product lifetimes to be important
when they acquire a new good131 In 2016 a study was commissioned by the European
Economic and Social Committee aiming to analyse whether lifespan labelling on products
might influence consumers purchasing decisions This study also provides information on
the importance for consumers of a longer lifetime Indeed out of 2917 respondents
90 stated that they would be willing to pay an additional euro102 for a similar product
with a two year longer lifespan132 This point was confirmed by a study from the
European Commission (2017) more than eight out of 10 consumers would be willing to
pay extra for products that are advertised to last longer Therefore the future uptake of
longer life products can be maximised if these are accompanied by longer commercial
guarantee or warranties
For instance the above-mentioned WRAP (2013) study reports that older consumers and
lower income groups as well as consumers with a less consumption-driven mind-set
appear to place particular importance on product lifetimes during the purchasing process
regardless of the products (goods tested in the study were washing machines fridges
vacuum cleaners) An empirical study conducted on 1009 Austrian on behalf of the
Chamber of Labour in Vienna confirms that older people use products longer than
younger consumers133 No detailed figures were provided and the qualitative analysis
carried out by the project does not answer whether it is more a matter of age or
generation In addition this result may be driven by a number of factors such as
household income and educational level
Consideration of durability characteristics per specific products
Based on the literature review the importance of durability in consumer purchasing
decisions varies depending on the product category
According to Cox et al (2013) it seems that overall consumers attach less importance
to the lifetimes of products that are governed by fashion However even for clothes
traditionally the most fashion-influenced product consumers tend to attach importance
to durability to some extent
A WRAP (2012) study on the use and disposal of clothes in the UK provides an overview
of durability considerations in the clothing industry The report was based on a
survey with 7950 UK consumers It appears that when buying clothes consumers rank
value for money as their top purchase criterion Extending the lifetime of clothing is also
something that consumers want According to the survey consumers said that one of the
top criteria they use when buying clothes is finding items that are lsquomade to last and look
good for longerrsquo Different factors account for consumersrsquo decision to purchase more
durable clothes higher income associating particular brands with longer-lasting
131 WRAP 2013
132 European Economic and Social Committee 2016
133 AK Wien 2017
Behavioural Study on Consumersrsquo Engagement in the Circular Economy
131
products a lengthy guarantee against faults or a ldquodurability indexrdquo on the garment
label134
Another study provided information about the importance of durability in
purchasing decisions for electronic items A technical report by the Joint Research
Centre of the European Commission dated from 2017 revealed the importance of
durability during the purchase of electrical or electronic appliances135 This report
presents the outcomes of a survey with 1050 German consumers136 Respondents were
asked to rank the importance of a number of factors (including energy efficiency
durability price etc) in their last purchase or next planned purchase
The results are provided in Figure 39 Although the most important criteria for consumers
when choosing electrical or electronic appliances are the electricity consumption and
energy efficiency (49) durability is ranked second (43) before the price-
performance ratio (36)
Figure 39 Consumers consideration when purchasing electrical and electronic appliances
Source Verbraucherzentrale Bundesverband 2014
However consumersrsquo durability considerations when purchasing new electronic
appliances might differ depending on the type of electronic appliance According to a
WRAP survey with 1104 UK respondents some participants indicated that they might
give greater thought to product lifetimes when buying goods depending on how likely
they thought the product was to break down To illustrate washing machines vacuum
cleaners and laptops were thought to be more likely to break down than televisions and
fridges
612 Information on durability and its role in the purchasing decision
This section analyses in which way the type and quality of information on durability can
influence purchasing decisions
At the moment of purchase consumers do not feel knowledgeable enough
about how long their products will last Some of them also have doubts about
134 Although each factor was cited by around one-third of respondents they were not ranked in terms of preference by the UK respondents
135 European Commission Joint Research Centre 2017b
136 Verbraucherzentrale Bundesverband 2014
Behavioural Study on Consumersrsquo Engagement in the Circular Economy
132
whether the lifetime of products can be accurately measured137 Consumers use a
combination of general knowledge and proxies138 to make assessments about lifetimes of
comparable products139 Different factors are used by consumers to estimate product
durability including design technological change the cost of repair the availability of
spare parts household affluence aesthetics functional quality and fashion
Recent research has also found that in absence of reliable information on durability
consumers use intrinsic and extrinsic cues to judge the lifespan of products For
consumers expectations of lifespans can be subjective and influenced by brand name
perceived quality past experience age and income of the consumer as well as their
current needs140 Cox et al (2013) confirm this statement when the lifetime of products
is not included on the product label it is inferred by consumers through other indicators
such as the perceived reliability based on the general knowledge of consumers
Overall the studies reviewed agree on the fact that providing consumers with
information on a productrsquos lifespan would have a positive impact on their decision to
purchase more durable goods141 According to R Tansey with more information
consumers would make more rational decisions while also considering social and
environmental impact in their purchases which would in the end redirect demand to
more environmentally or socially respectful products142 The consumer market study
carried out in 2017 by GFK to support the European Commission Fitness Check of
Consumer and Marketing Law provides details about the effectiveness of information on
durability143 An experiment was realised to test whether consumers take durability and
reparability information into consideration when they purchase goods A sample of 7234
consumers coming from eight European countries had to choose between different
washing machines televisions and smartphones with different degrees of information
about durability and reparability provided One of the main outcomes of this study is the
positive impact of the presence of durability information on consumersrsquo
purchasing decisions When no information was provided the items in question were
selected by 27 of the respondents while 47 of the respondents chose the same
products when such information was present144 As shown in Figure 40 when durability
information is present respondents are on average willing to pay 5 (EUR 16) more
relative to the baseline for products with high durability In a Eurobarometer survey
from December 2012 92 out of the 25568 respondents across the EU27 indicated that
the lifespan of products should be indicated (92)145
To date there are no requirements at European level for manufacturers to inform
consumers about for example the averageexpectedminimal lifetime of goods except
the Ecodesign set of regulations on light bulbs In practice this kind of information about
the durability of goods is rarely present146
137 European Commission 2017
138 As defined by the authors general knowledge refers to the participants experience in using those products or to the experience of their relatives The proxies used by the consumers are brands prices or guarantees
139 Cox Herren King amp Knight 2013 European Commission 2017
140 Braithwaite Densley-Tingley amp Moreno 2015 pp 11-17
141 See for instance Tansey R 2015 ldquoReduccioacuten de residuos el reciclaje no es suficiente para alcanzar una economiacutea circularrdquo European Commission 2017 ldquoConsumer market study to support the fitness check of Consumer Rulesrdquo European Economic and Social Committee 2016 ldquoThe influence of lifespan labelling on consumerrdquo
142 Tansey 2015
143 European Commission 2017
144 European Commission 2017 p 429
145 European Commission 2017 p 416
146 European Commission 2017
Behavioural Study on Consumersrsquo Engagement in the Circular Economy
133
Figure 40 Impact of durability information on the consumersrsquo purchasing decision
Source (European Commission 2017 Consumer Market Study to support the Fitness Check of Consumer Rulesrsquo p 437)
How durability information is provided
People use a range of online andor in-store information sources during the purchasing
process147 Consumers believe that the main source of information they can access
during the decision-making process to compare the expected lifetime of different
products is to be found on online reviews from other consumers148
The presentation of durability information through labels would allow more
informed purchasing decisions from consumers The study commissioned by the
European Economic and Social Committee (EESC) in 2016 mentioned in section 611
revealed that on average a product is chosen 46 more often when lifespan is
indicated on the product label149 In a report from 2015 about the influence of energy
labels for washing machines Braithwaite et al (2015) confirmed the importance of
durability information on the product label for consumers According to this study a
specific lifespan label would increase the consumption of more durable products even
more
The Consumer Market Study realised by GFK found that presenting durability-related
information in terms of years has a slightly more powerful impact (485) than
in units (461)150In this instance units were presented as specific usage units For
example the number of wash cycles for a washing machine
Manufacturer guarantees or warranties act as another source of information for
consumers in their purchasing decisions According to a study carried out by Cox
Herren King amp Knight (2013) they are perceived as a show of faith by manufacturers in
the lifespan of their products The provision of longer warranties can prompt consumersrsquo
purchases towards products with longer lifetimes Indeed as evidenced in the same
study consumers value highly the reassurance provided by longer guarantees or
warranties and are even willing to pay a higher price when warrantees or guarantees are
147 Cox Herren King amp Knight 2013
148 Cox Herren King amp Knight 2013
149 European Economic and Social Committee 2016
150 European Commission 2017 p 437
Behavioural Study on Consumersrsquo Engagement in the Circular Economy
134
provided151 They tend to believe that products covered will be quickly repaired or
replaced if they break down Therefore the future uptake of longer life products can be
maximised if these are accompanied by longer warranties
The role of the durability information per specific product
The importance of durability-related information as well as the way it should be provided
when consumers purchase goods varies across product categories
For example preliminary findings of a study being conducted by a German consumer
association illustrate that for 81 of consumers durability information of electrical
equipment is (rather) important152
With regards to white goods the brand name is very important Often the implicit
assumption is that traditional white goodsrsquo manufacturers produce longer-lasting
products accompanied with consumer-oriented repair services Consumers tend to buy
white goods from traditional and popular brands so they have access to good repair
services153 As consumer expectations about lifetimes are often implicit providing a clear
indication of durability through a labelling system would substantiate those expectations
According to Braithwaite et al (2015) for washing machines labels presenting the
lifespan in terms of expected years of life have a bigger impact on consumersrsquo purchasing
decisions than the ones presenting lifespan in terms of units
When purchasing clothes consumers look for information about durability and
quality Indeed one-third of customers covered by the WRAP (2012) survey mentioned
in section 611 would value a durability indicator of some sort during the purchase
process WRAP (2017) has also developed a sustainable clothing guide aiming partly to
provide information on how to make clothes last longer According to WRAP given a little
direction consumers would be able to gauge the quality and potential durability of
garments before they buy them Information could include advice on evaluating seams
looking for loose threads and broken stitches and making consumers aware of the fact
that a higher density of stitches per inch is generally better Simply improving care
information on labels and packaging at the point of purchase would promote more
durable behaviour Moreover consumers attach less importance to the lifetime of
products that are subject to fashion154
613 Relevance of reparability characteristics in purchasing decisions
Section 3 has provided factual information about the growing consumer willingness to
engage with repair services In comparison with the durability characteristics the
literature review has found little information about the importance of reparability in
consumersrsquo purchasing decisions
614 Information on reparability and its role in the purchasing decision
This section offers an analysis on the way available information on reparability can
influence purchasing decisions
Preliminary findings of a study being conducted by a German consumer association
illustrate that for 82 of consumers information about the reparability of products is
(rather) important155
The main information retrieved about the role of reparability information on consumersrsquo
purchasing decisions comes from the Consumer Market Study (2017) undertaken by
GFK According to the experiment mentioned in section 612 on Information on
durability and its role in the purchasing decision it appears that providing information
151 European Commission 2017
152 Verbraucherzentrale Bundesverband 2017 p 6
153 Vangerow 2017
154 Cox Herren King amp Knight 2013
155 Verbraucherzentrale Bundesverband 2017 p 6
Behavioural Study on Consumersrsquo Engagement in the Circular Economy
135
on reparability (on the costavailability of spare parts) has a positive effect on
consumersrsquo purchasing decisions On average when reparability information was
present on the products tested (televisions washing machines and smartphones) those
products were selected by 43 of the consumers regardless of the type of reparability
information In comparison when there was no information provided on reparability the
same products were chosen by only 30 of the respondents
How reparability information is provided
Important findings about the most influential ways to present reparability-related
information were retrieved from the European Commission Consumer Market Study
(2017) mentioned above Information about reparability was framed in two different
ways a first option provided an indication of the cost of spare parts and the second
of the availability of those spare parts
Information presented in terms of the availability of spare parts was more
efficient than the financial information Indeed 7234 respondents were on average
willing to pay an extra euro14 for products with a longer availability of spare parts while
they were on average willing to pay euro7 less for products where the costs of repair were
indicated This variation of willingness can be explained by the fact that cost is the main
variable taken into account by consumers during their purchasing decisions Thus the
indication of the costs of repair is considered by the consumers as potential additional
costs
Figure 41 Role of reparability-related information on the consumersrsquo purchasing decision
Source European Commission 2017 p 437
Information about reparability does not affect all consumers in the same way The impact
of reparability information among consumers with a pro-environmental position was
greater than for consumers who are better financially positioned The effect of
reparability information also differs according to the consumerrsquos nationality Overall all
eight countries studied reported a positive impact for the presence of reparability
information However the effect of reparability information was greater in Portugal and
the Netherlands while the weakest impact was found in France and Poland No
explanatory factors for this variation were provided by this study
As seen in section 612 on Information on durability and its role in the purchasing
decision labels have a key role in informing consumers about the durability
characteristics of products No similar influence of labels for reparability characteristics
was indicated in the literature However an indicator rating the reparability
potential of an item can play a key role in consumersrsquo purchasing decision The
iFixit index is an example of such an indicator The reparability index ranks electronic
devices by ease of repair A reparability score between zero and 10 is calculated for each
new model of tablet laptop and smartphone of the main brands on the market A device
with a perfect score will be relatively inexpensive to repair and easy to disassemble The
difficulty of opening the device the types of fasteners found inside and the complexity
involved in replacing major components are also considered This makes this indicator
useful for policymakers product designers and users looking to buy devices with a
better reparability potential (European Environment Agency 2017)
Behavioural Study on Consumersrsquo Engagement in the Circular Economy
136
Role of the reparability information per specific product
Information about reparability could play a key role in consumersrsquo decision to
purchase clothes According to the WRAP study dated from 2012 mentioned in section
611 a quarter of the UK respondents would wear unworn clothes if they had the ability
to repair them The WRAP study further indicates that businesses could play a key role
by raising consumer awareness about how and where to use repair services
The European Commission Consumer Market Study completed by GFK in 2017 indicates
that the positive impact of reparability information on consumersrsquo purchasing decision
was slightly weaker for smartphones than for TVs and washing machines We
have not found explanatory factors for such phenomenon in the literature review
However the focus groups suggested that some consumers may not prioritise
reparability for smartphones because technological progress (ie software updates)
would make their smartphones obsolete and they may wish to purchase newer models
(see section 33)
According to a study conducted by Cox Herren King amp Knight (2013) for WRAP if
products were more durable reparability would become less important as a
consideration In the case of household appliances (in this study fridges washing
machines vacuum cleaners) the importance of lifetime is underpinned by a desire to
avoid the expense and inconvenience of repair or replacement if they break down
62 Evidence from the stakeholder interviews
621 Relevance of durability characteristics in purchasing decision
Overall interviewees indicated that durability characteristics matter for consumersrsquo
purchases but that it is not the main factor of decision-making
According to a representative of a European consumer association the first factor for
consumers when deciding to buy a new product is the quality As part of this quality
assessment durability is the principal component followed by the cost factor and usually
an association between quality and durability can be found According to a Romanian
academic quality represents the extent to which a product can satisfy consumer needs
so durability is part of quality as a factor
However the interviewed Romanian academic is the only one ranking durability and
quality as the first criteria of consumersrsquo purchasing decision Other interviewees either
mentioned the quality aspect in its relation to the price of the product or indicated that
the price is the main consideration in consumersrsquo purchasing decisions
According to a representative from a Spanish consumer organisation the most important
criterion when purchasing a new product is the ratio between quality and price Usually
consumers tend to consider that the higher is the price the longer the lifespan will be as
underlined by a representative of a UK NGO
The consideration for durability in purchasing decisions varies by age and
income Overall people with a higher income are more aware of CE practices and so pay
greater attention to durability In comparison findings from the reviewed literature
indicated that consumers with a lower income pay less attention to durability (see section
611)
In general the older the consumer is the more important durability is Young people
tend to buy less durable products However as highlighted by the Romanian academic
there is also a category of young people who are aware of the durability of products This
is comprised of young people working in corporations and who have higher income and
greater concerns regarding the Circular Economy Interviewees confirmed the findings of
the reviewed literature ndash young consumers tend to place less importance on durability
than older consumers (see section 611)
Consideration of durability characteristics in purchasing decisions per specific product
Consideration of durability in purchasing decisions varies depending on the product
category
Behavioural Study on Consumersrsquo Engagement in the Circular Economy
137
For large purchases such as large appliances and cars durability and
reparability characteristics are considered more in purchasing decisions
According to a representative of a Dutch public authority the smaller the purchase the
less important durability and reparability become
A Belgian national trade association representative indicated that the durability
consideration from consumers varies according to the expected use of the
product Consumers will consider the durability of goods depending on how often they
will use the product as highlighted by representatives from a European trade association
and a national consumer association If the product will be used less often consumers
may buy products of a lesser quality and so less durable products
Regarding smartphones consumers pay less attention to durability The first factor
explaining this is linked to technological progress According to the already mentioned
representative of a Belgian national trade association if new functionalities appear
consumers will be interested in the newest smartphones with these latest functionalities
A parallel can be drawn with the findings from the literature review which states that
consumers attach less importance to durability when purchasing products more related to
fashion The second factor deals with obsolescence As highlighted by an expert in the
field of Ecodesign smartphones may be victims of what could be labelled as technical
obsolescence because of software updates as products become slower and impossible to
maintain
622 Information on reparability and its role in purchasing decision
The following section analyses the way available information on durability influences
purchasing decisions
An interviewee from a Romanian consumer organisation highlighted that overall
consumers lack the information needed to assess durability and reparability of a
product They have to find that information by themselves The main sources for this
are formed by shops online forums or friends as mentioned by an interviewee from a
Romanian consumer association This tends to confirm the lack of information for
consumers identified from the literature
Moreover an interviewee from a European consumers association mentioned that
consumers would prefer to find this information in a standardised way In that
sense a label indicating the average lifespan would be welcomed This confirms findings
from the literature review which stated that a standardised lifespan label would be a key
tool to inform consumers about durability (see section 612)
Other sources of information for consumers were mentioned by interviewees from
a Romanian consumer organisation For washing machines and televisions the durability
characteristics of an item are highly related to the brand This was confirmed by an
interviewee from a household appliances manufacturer the reputation of a renowned
brand acts as a guarantee of a greater quality and so of a longer expected lifetime for the
product Another common measure of expected durability used by consumers is often
expressed in the guarantee period offered by the manufacturer as highlighted by a
representative of a UK trade association
623 Relevance of reparability characteristics in purchasing decision
Overall interviewees provided more information about durability characteristics than
about reparability characteristics
It appears that reparability is not a major consideration for consumers
According to a representative from a UK consumer organisation reparability is not taken
into account by consumers Another interviewee from a European trade association
confirmed this statement Consumers do not consider reparability when purchasing a new
product because in their mind-set products should be more durable but not necessarily
more repairable as highlighted by a representative from a Belgian trade association
This lack of information coming from interviews echoes the little information gathered
from the literature review
Behavioural Study on Consumersrsquo Engagement in the Circular Economy
138
Consideration of reparability characteristics in purchasing decision per specific products
According to a representative of a Dutch public authority for large purchases such as
large appliances (eg washing machines refrigerators and cars) reparability
definitely plays a role This input was confirmed by a consumer law expert from a
Romanian consumer organisation For washing machines reparability characteristics are
important
When purchasing clothes consumers pay less attention to the durability and reparability
characteristics However reparability is more important than durability in the
fashion sector as highlighted by the above-mentioned representative of a Dutch public
authority This greater consideration for reparability in clothes purchases confirms
findings from the literature review
624 Information on reparability and its role in the purchasing decision
This section describes the findings from the interviews on how available information on
reparability can influence purchasing decisions
It seems again that consumers suffered from a lack of information to motivate
their purchasing decisions According to an interviewee from a German public
authority with no durability and reparability information consumers always choose the
cheapest product
During an interview with a representative from a UK consumer organisation it was
stressed that retailers and manufacturers do not provide and sometimes may even hide
the available information about reparability The interviewee did not mention how or why
manufacturers might hide reparability information
According to a representative of a Hungarian NGO when consumers need information on
the degree of reparability of a product they look for it in the guarantee letter This
interviewee also indicated that the information that consumers look mostly is the
availability of repair points This partly mirrors the findings of the Consumer Market
Study conducted by GFK These state that the most impactful reparability-related
information on consumersrsquo purchasing decisions are about the availability of spare parts
rather than the information on costs of those spare parts According to an interview with
a German expert another implicit source of reparability information for consumers is the
brand of the products They expect that the manufacturer of certain brands will repair the
product The same stakeholder added that as reparability has many dimensions it would
be hard to imagine a simple indicator which could be put on a durability label
Guarantees could play an informative key role as they are easier to compare (eg one
company offers a longer period of repairing services under the guarantee conditions
compared to another company)
63 Evidence from the focus groups
631 Durability information
Participants welcomed the idea of being provided with information about the
durability of products and agreed that this should be presented on product labels or in
the shop at the time of purchase (or on the website if a product is purchased online)
Some suggested that sales staff should also be able to inform customers about a
productrsquos durability
Attitudes towards the suggestion of having the information presented on the EU Energy
Efficiency Label (or as a similar label) were very positive Participants felt that this
would enable displaying productsrsquo durability in a simple straightforward manner and
would enable consumers to easily compare products
Participants also made suggestions on how durability should be defined for each of the
different products
Washing machinedishwasher ndash estimated number of washes (rather than
number of years) participants across the different countries agreed that for these
products expressing durability in number of years would not be accurate because
some households use these more often than others
Behavioural Study on Consumersrsquo Engagement in the Circular Economy
139
Television ndash estimated number of years (Germany) or estimated number of hours
of use (Ireland) once again because the frequency of use for this type of product
varies by household Another suggestion was to combine information on number of
years with the average number of hours of use per day
ldquoAverage hours of use per year So if it says lsquothis TV will last 3 years for 6 hours
use per dayrsquo for example A vacuum cleaner is expected to be on for half an hour
a day So we would need a list on what they consider the average usage a day per
product type so for example a TV 6 hours a day laptop 6 hours vacuum 030h
etc You know that if you put your TV on 12h a day itrsquos not going to last that long
as indicated (Man mixed group Dublin)
Vacuum cleaners ndash estimated number of hours of use (Germany Ireland)
Smartphones ndash some participants suggested number of years others also
suggested number of battery charges (Ireland) In Germany some mentioned that
it would be helpful to have an indication of the batteryrsquos durability in number hours
(and the equivalent in number of years) because this is often the part that breaks
down first
Clothing ndash number of years or as some German participants suggested through
an indication of the quality of the fabrics used (low medium or high) Displaying
durability for clothing was seen as somewhat less important than for electrical
appliances although some participants welcomed the idea
632 Reparability information
Participants were generally favourable to the idea of being provided with information on
reparability Discussions on this topic were however more complex in Sweden ndash where
participants although positive to the idea of having products repaired had less
experience with reparability
ldquoI must spend a lot of time and there is almost no information to be found about
where to repair things What rights do I have Where can I fix it These are my
questions Why should I have to spend so much time and look look look for
information while the producers just send me advertising and promotions ndash that
must cost them muchrdquo Female 35 vulnerable group Stockholm)
Some participants in Ireland and Sweden flagged the fact that presenting information on
a productrsquos reparability might discourage people from buying it because it may suggest
that the product is likely to break down
Some of the types of information participants considered useful to have with regard to
productsrsquo reparability were
Whether repair would be possible
Whether the product is repairable through DIY (and instructions on how to repair it)
Availability of spare parts
Availability of repair services and possibly a list of repair services
An indication of the timeframe during which spare parts would be available
An indication of the timeframe during which a manufacturer can ensure the
productrsquos repair
An indication of the level of difficulty of the repair (low medium high) ndash
participants in Germany suggested indicating this with small icons ndash eg hammers
one for easy two for medium three for difficult)
As with durability participants felt that information on productsrsquo reparability should be
provided at the moment of purchaseat the point of sale (on the product or on
the productrsquos label) They were generally favourable towards the idea of having an
indication included on the EU Energy Efficiency label or on a similar label Many
also felt that information should be included in the productsrsquo instructions manual as
well as should be available online Some of the German participants suggested that it
would be useful to have tutorials on how to repair products for example on a YouTube
channel
Information on reparability was mainly considered useful for electronic goods and to a
slightly lesser extent for clothing Information provision for clothing was considered less
Behavioural Study on Consumersrsquo Engagement in the Circular Economy
140
necessary because some participants already have repaired clothing themselves or had
them repaired at a tailor shop or repair centre (mainly in the case of shoes)
633 Recyclability information
Some participants (particularly in Germany) found it useful to have information on
productsrsquo recyclability on the EU Energy Efficiency Label (or on a similar label) They
would also welcome more information on how to recycle products Other participants
particularly in Ireland and Sweden were a lot more informed about how to recycle
products (clothes and electrical appliances)
ldquoItrsquos common sense these days itrsquos everywhere Batteries phones clothing
collection etc so easy to recycle itrsquos everywhere Itrsquos in the supermarket So why
would you throw them away if they can make something out of it Itrsquos easy and
cheap and accessiblerdquo (Woman vulnerable group Dublin)
The main types of information participants thought would be useful with regard to
recycling and productsrsquo recyclability are as follows
Percentage of recycled material used when producing the product
Percentage of material that can be recycled and that will be recycled at the end of
the productrsquos lifecycle
An indication on which parts of the product will be recycled and what they will be
used for
More information on the recycling process (what happens to a product once it is
brought for recycling)
ldquoI want to be a responsible consumer But I also would like to know ndash what do you do
with my smartphone I would like a guarantee for the recycling so I know where
things end uprdquo (Woman vulnerable group Stockholm)
Information on recycling centres and on how these recycle large appliances
German participants suggested that it would be useful to have a QR-code on the label
giving further information about the recycling process
634 Views on displaying information on reparability durability and
recycling on a label
Participants generally welcomed the idea of displaying information on product durability
reparability and recyclability on the EU Energy Label or on a similar label The idea was
seen as most useful in the case of durability although many participants felt the same
way about reparability and recyclability
German participants were the most enthusiastic towards this and felt that all three
aspects (durability reparability and recyclability) should be displayed on the EU Energy
Label (with categories for each aspect underneath)
64 Evidence from the consumer survey
641 Importance of durability and reparability in purchasing decisions
Results from the consumer survey on the importance of durability and reparability in
purchasing decisions are presented To understand the relative importance of these
factors in purchasing decisions further dimensions such as costs quality or fashion were
evaluated in addition to looking at durability and reparability Hence these other factors
can be compared to durability as well as reparability Additionally the reasons for why
survey respondents rated durability reparability and the availability of repair services as
important were analysed in more detail
Behavioural Study on Consumersrsquo Engagement in the Circular Economy
141
Figure 42 Importance of certain factors in purchasing decisions (average)
Notes The question was Q34a ldquoThinking of the last time you bought a [dishwasher vacuum cleaner television smartphone coat] to what extent did the following influence your choice of product Please answer on a scale from 1 (meaning ldquoNone at allrdquo) to 4 (meaning ldquoA lotrdquo)rdquo In order to calculate averages
answer categories where re-labelled with ldquoa lotrdquo corresponding to a value of +10 and ldquonot at allrdquo corresponding to a value of -10 As a result a positive average means the factor is important a negative average means the factor is unimportant 0 means neither important nor unimportant N=12064
Source ConPolicy analysis of consumer survey data
Figure 42 summarizes the results on the average importance of different factors that
might be relevant during purchasing processes For eight factors (across all five product
categories) participants were asked how much influence each factor had on their
purchasing decisions
Overall the quality of the product was rated most influential followed by price How
long the product was expected to last (durability) reparability the existence of a
repair service and environmental credentials were also important to participants
The manufacturer or brand was ranked as less important and overall participants
rated the product being the latest model or trend as even less influential
As a next step the influence of these eight factors are reported individually across
product categories Figure 43 displays the results on the average importance ratings156
The price of the product
For all product categories price mattered a lot as its importance was consistently rated as
high As can be seen in the detailed Table 5 in Section 7 in the Annex document
between 50 and 60 indicated price as relevant in the survey In contrast only a very
small fraction ie below 3 for all product categories reported price to not matter at
all
The manufacturer or brand of the product
A more diverse picture emerged with respect to the importance of the manufacturer or
brand of the product When looking at the average ratings of this attribute in Figure 43
brand was most relevant for mobile phones followed by televisions vacuum cleaners and
dishwashers For mobile phones this factor was very important for 50 of the
participants For televisions the share was lower 43 while 40 and 34 indicated its
high relevance for vacuum cleaners and dishwashers In contrast the average rating as
well as the share of participants indicating clothing brands to be important was much
lower Overall only 20 of participants indicated the manufacturer or brand to matter
156 Additionally see the additional survey results in the Annex document for a table showing detailed results on consumer ratings of the importance for all categories and products in percent
Behavioural Study on Consumersrsquo Engagement in the Circular Economy
142
very much Interestingly the share of participants reporting the manufacturer or brand
to not matter at all was also 20 for clothing while these shares were below 6 for the
other product categories (See additional survey results in Table 5 in Section 7 of the
Annex document for detailed importance ratings by product)
The general quality of the product
Across all five product categories the majority of participants indicated that the general
quality of the product had a lot of influence on their purchasing decisions Overall there
exists no sizable difference between the individual product categories Quality was most
important for participants in the category of vacuum cleaners (70) followed by
televisions and mobile phones (69) dishwashers (63) and coats or jackets (63)
Again the shares of participants attributing no importance to this factor were low ie
less than 3 for all products See again the Annex for further detail
Whether the product was the latest model or trend
As indicated before trends were less relevant for purchasing decisions compared to for
example price Nevertheless there exist product categories for which trends were more
important compared to others As displayed in Figure 43 for televisions smartphones
and clothing items the average importance rating was positive implying that participants
thought trends to be influential When looking at the shares of respondents rating trends
to be of highest importance the following results emerged The largest share was found
among mobile phones (23) followed by televisions (22) and clothing items (19)
(see Table 5 in Section 7 in the Annex document) For vacuum cleaners and dishwashers
the average importance rating was lower and even below 0 indicating that respondents
rated that trends rather did not matter The shares of participants attributing a high
importance to trends were fairly sizable with 13 to 15 When looking at the other
extreme ie shares of respondents attributing no importance to trends at all no sizable
difference between product categories was found For vacuum cleaners dishwashers and
clothing items shares were around 20 while for electronic items ie mobile phones
(16) and televisions (14) they were slightly lower
How long the product could be expected to last
The expected lifespan of a product had a lot of influence on consumersrsquo purchasing
decisions Overall the average rating as shown in Figure 43 was high across all products
Though for dishwashers vacuum cleaners televisions and mobile phones the average
importance rating was higher than for clothing items As can be seen in the Annex the
share of participants indicating that the expected lifespan of a product had a lot of
influence on their purchasing decision was similar for dishwashers vacuum cleaners
televisions and mobile phones (46 to 53) and smaller but still sizable for coats or
jackets (33) Again looking at the shares of participants indicating no importance at
all for most product categories the shares amounted to below 4 Interestingly for
clothing items this share was much higher 10 which may capture a group of
consumers with a particular interest in the latest trends and lsquofast fashionrsquo
Whether the product could be repaired if broken
The reparability was on average rated as less important compared to durability but it was
still rated as important for most product categories As displayed in Figure 43 the
average rating of importance was positive for dishwashers vacuum cleaners televisions
and smartphones indicating that on average respondents stated that reparability was
important In more detail (see Table 5 in Section 7 in the Annex document) the share of
respondents attributing a lot of influence to reparability was 30-34 in the mentioned
product categories Clothing items again represented an outlier The average rating was
below 0 indicating that respondents rated reparability rather as unimportant Only about
11 indicated reparability as important for coats and jackets The same pattern emerged
for participants indicating that reparability played no role at all Less than 10 reported
this rating for most product categories Only for clothing items this share was larger with
36
Whether repair services exist for the product
A similar picture emerged for the existence of repair services On average the rating of
importance was above 0 for dishwashers vacuum cleaners televisions and smartphones
Behavioural Study on Consumersrsquo Engagement in the Circular Economy
143
showing that respondents found repair services to be rather influential in their purchasing
decision The share of respondents rating the availability of repair services as having a lot
of influence were around 30 Again clothing items were an outlier The average rating
of importance in this category was below 0 indicating no importance of this attribute
Accordingly the share of respondents attributing a lot of influence to this factor was only
7 When looking at the other extreme where participants indicated repair services to
have no importance at all a similar difference between product categories was detected
Between 8 and 13 of participants reported no importance of the factor at all for most
categories while 48 reported this for clothing
The environmental credentials of the product
Finally the share of participants who indicated that environmental credentials had a lot
of influence on their purchasing decisions was rather heterogeneous across the five
product categories The average rating as displayed in Figure 43 was positive for
dishwashers vacuum cleaners and televisions indicating that on average environmental
credentials played a role for respondents For smartphones it was close to 0 whereas it
was below 0 for clothing items When looking at the shares of respondents either
attributing a lot or no relevance for this factor (see Table 5 in Section 7 of the Annex) the
following results emerged For dishwashers 37 found environmental credentials to be
important followed by vacuum cleaners (28) and televisions (25) The importance of
environmental credentials was smaller for mobile phones (18) and coats or jackets
(14) Again these results were mirrored at the other extreme For vacuum cleaners
dishwashers and televisions the shares of participants stating that environmental
credentials had no importance at all were between 5 and 11 For mobile phones the
fraction was higher with 17 and even higher with 24 for coats and jackets
Figure 43 Importance of certain factors in purchasing decisions by product category
(average)
Behavioural Study on Consumersrsquo Engagement in the Circular Economy
144
Behavioural Study on Consumersrsquo Engagement in the Circular Economy
145
Notes The question was Q34a ldquoThinking of the last time you bought a [dishwasher vacuum cleaner television smartphone coat] to what extent did the following influence your choice of product Please answer on a scale from 1 (meaning ldquoNone at allrdquo) to 4 (meaning ldquoA lotrdquo)rdquo In order to calculate averages answer categories where re-labelled with ldquoa lotrdquo corresponding to a value of +10 and ldquonot at allrdquo corresponding to a value of -10 As a result a positive average means the factor is important a negative average means the factor is unimportant 0 means neither important nor unimportant Dishwasher N=4848 Vacuum Cleaner N=4096 Television N=4855 Smartphone Mobile Phone N=4893 Clothing (Coat or Jacket) N=4883
Source ConPolicy analysis of consumer survey data
Furthermore the importance of different factors influencing the purchasing decision were
analysed by country and socio-demographic factors These results are summarised here
below and displayed in detail in Section 7 in the Annex document
The average importance of price was high among all 12 examined countries In
particular Spain stuck out indicating a very large relevance of price followed by Romania
and Portugal The lowest importance ratings were observed in Austria the Netherland
and France When looking at age and education no noteworthy patterns emerged Not
surprisingly it was found that respondents who found it more difficult to make ends meet
at the end of the month gave more importance to price compared to those financially
better off
With respect to the importance of the manufacturer or brand two countries
Romania and Spain stuck out In these two Member States participants on average
revealed a larger relevance compared to the other countries Age did not seem to play a
role while the highest educational category rated the influence of brand more important
than the lower educational categories Furthermore participants indicating a very difficult
financial situation also revealed lower influence of brand compared to wealthier income
categories
As indicated above the quality of the product was overall the most important factor
and this was also true for the individual country ratings Compared to other countries
the French participants on average attributed a lower importance to quality With respect
to other socio-demographics no striking differences were observed
With respect to the product being the latest model or trend interesting country
differences emerged On the positive side ie countries attributing importance to trends
in particular Romania and Spain stuck out with relatively higher rates In contrast
Austria France and the Netherlands revealed negative average importance ratings
indicating that being the latest model or trend was not important Participants indicating
their financial situation to be very difficult attributed less importance to trends With
respect to other socio-demographic factors no particular patterns were visible
Behavioural Study on Consumersrsquo Engagement in the Circular Economy
146
Durability overall was on overage also influential While Romanian and Hungarian
participants were among the top two with respect to durability ratings lower rates were
observed for the Netherlands Germany Austria and France With respect to other socio-
demographics factors no striking differences were found
These results on country effects as well as age education and income differences were
mirrored for the importance of reparability and availability of repair services
Lastly a very similar pattern on country level and for the other socio-demographics
factors was observed for the importance of the environmental credentials of a product
Reasons for high importance of durability
Participants that indicated that durability had at least a little importance for their
purchasing decision were asked about the reasons for this rating as depicted in Table 38
The most prominent reason across all product categories was the perception that long-
lasting products would save money in the long run (45 to 55) Other important
reasons were the perceived higher quality of long lasting products (36 to 43) the
perception that durable products would be better for the environment (23 to 30)
the convenience of not having to shop for a replacement soon (23 to 28) and
that long lasting products typically are better value for money (22 to 26) Among
the different product categories no distinctive patterns emerged
Table 38 Reasons for high importance of durability by product category (in )
Vacuum
Cleaner
Dish-
washer
TV Mobile
Phone
Coat or
Jacket
Long lasting products will save
me money in the long run
547 548 509 507 453
Long lasting products are
typically better quality
360 365 360 345 430
Buying a long-lasting product
is better for the environment
300 291 272 274 226
To avoid the effort of shopping
for a replacement soon
227 229 269 278 256
Long lasting products are
typically better value for
money
226 258 245 220 252
Other 01 03 02 04 02
Donrsquot know 15 07 18 21 24
No of observations 3554 3556 4144 4085 3742
Note Following up on answers presented in Figure 42 and Figure 43 participants were asked (Q34b) ldquoYou said that when you last bought the following product(s) ldquohow long the product could be expected to lastrdquo had a lot of influence on your choice of product Why was this For each product please select the two most important reasonsrdquo Since participants indicated the two most appropriate reasons the totals do not sum up to 100
Source ConPolicy analysis of consumer survey data
Behavioural Study on Consumersrsquo Engagement in the Circular Economy
147
Reasons for low importance of durability
The reasons for participants indicating that durability had no or only very little
importance for their purchasing decisions are presented in Table 39
For all product categories the most prominent reason was that participants found it hard
to tell how long a product will last (62 to 70) For vacuum cleaners dishwashers
televisions as well as mobile phones the second most important reason was that longer
lasting products were hard to find (20 to 26) For clothing items another aspect was
ranked second though within this category 19 of participants indicated that durability
did not play a role for purchasing decisions because they did not expect to use the
product for a long time Overall fashion value and maintenance effort were relatively
less important
Table 39 Reasons for low importance of durability by product category (in )
Vacuum
Cleaner
Dish-
washer
TV Mobile
Phone
Coat or
Jacket
Itrsquos hard to tell how long a
product will last
603 702 683 641 618
Long lasting products are
harder to find
230 258 197 214 132
I am interested in owning
the latest
fashiontechnology
130 87 148 152 142
I did not expect to use the
product for a long time
120 124 95 160 191
How long a product will
last is not important to me
104 51 67 93 126
Long lasting products are
worse value for money
76 48 71 60 54
Long lasting products need
a lot of maintenance
41 35 26 41 47
Other 67 45 75 67 49
Donrsquot know 54 75 55 39 60
No of observations 346 396 541 611 1001
Note Following up on answers presented in Figure 42 and Figure 43 participants were asked (Q34c) ldquoYou said that when you last bought the following product(s) ldquohow long the product could be expected to lastrdquo had little influence on your choice of product Why was this For each product please select the two most important reasonsrdquo Since participants indicated the two most appropriate reasons the totals do not sum up to 100
Source ConPolicy analysis of consumer survey data
Behavioural Study on Consumersrsquo Engagement in the Circular Economy
148
Reasons for high importance of reparability
Table 40 presents the reasons for which participants rated reparability as important for
their purchasing decisions
Overall the top reason was once again saving money (31 to 37) followed by the
preference of keeping a product for as long as possible (28 to 35) Environmental
factors (22 to 26) using reparability as a signal for high quality (22 to 26)
the convenience of not having to shop for a replacement (21 to 25) as well as
using reparability as a signal of the manufacturer caring for the customer (17 to
24) were all of equivalent importance Compared to these aspects it is quite
interesting to see that the joy of repairing items was seen as much less important for
reparability (below 7 in all product categories)
Table 40 Reasons for high importance of reparability by product category (in )
Vacuum
Cleaner
Dish-
washer
TV Mobile
Phone
Coat or
Jacket
Repairing the product will
save me money
344 367 314 325 305
I wanted to keep the
product for as long as
possible
303 280 303 341 346
Repairing the product is
better for the environment
252 257 230 240 215
Itrsquos a sign that the product
is of high quality
230 253 241 223 261
Repairing avoids the effort
of shopping for a new one
250 240 243 236 206
It shows the manufacturer
cares about its customers
213 235 243 221 167
I enjoy repairing things 72 53 43 47 66
Other 02 03 03 03 002
Donrsquot know 14 11 25 22 44
No of observations 3127 2822 3438 3360 1909
Note Following up on answers presented in Figure 42 and Figure 43 participants were asked (Q34d) ldquoYou said that when you last bought the following product(s) ldquowhether the product could be repaired if it brokerdquo had a lot of influence on your choice of product Why was this For each product please select the two most important reasonsrdquo Since participants indicated the two most appropriate reasons the totals do not sum up to 100
Source ConPolicy analysis of consumer survey data
Behavioural Study on Consumersrsquo Engagement in the Circular Economy
149
Reasons for low importance of reparability
Table 41 displays the reasons for why participants attributed a low importance to
reparability in the purchasing process
On average four answer categories were rated more important than others namely
Trusting the manufacturerrsquos warranty (14 to 45) followed by the expectation
that the product will not break (26 to 35) the cost of repair (18 to 34) and
the reason that participants will replace it if it breaks (15 to 24) Not considering
repair the difficulty of repair the lower quality after repair and the reason that if a
product can be repaired easily it must be of low quality were less important
There were some interesting differences in ratings across product categories especially
for clothing For this category 23 of participants stated that they simply do not
consider repairing a clothing item whereas trust in the manufacturerrsquos warranty was
ranked comparatively low (14)
Table 41 Reasons for low importance of reparability by product category (in )
Vacuum
Cleaner
Dish-
washer
TV Mobile
Phone
Coat or
Jacket
I trust the manufacturerrsquos
warranty
326 446 340 329 138
I donrsquot expect this product
to break
289 339 292 259 351
Repairing the product
would be too expensive
296 244 329 342 181
If something breaks I
replace it
223 175 170 148 238
Repairing this product just
isnrsquot something Irsquod
consider
129 80 98 145 229
Repairing the product
would be too difficult
110 109 167 168 126
Products are not as good
after theyrsquove been repaired
44 66 50 89 100
If it can be repaired easily
it must be of low quality
37 25 37 14 26
Other 23 29 16 35 42
Donrsquot know 51 52 52 46 68
No of observations 775 1111 1208 1311 2752
Note Following up on answers presented in Figure 42 and Figure 43 participants were asked (Q34e) ldquoYou said that when you last bought the following product(s) ldquowhether the product could be repaired if it brokerdquo had little influence on your choice of product Why was this For each product please select the two most important reasonsrdquo Since participants indicated the two most appropriate reasons the totals do not sum up to 100
Source ConPolicy analysis of consumer survey data
Behavioural Study on Consumersrsquo Engagement in the Circular Economy
150
Reasons for high importance of availability of repair services
The reasons for participants attributing importance to the availability of repair services
are displayed in Table 42
As for reparability in general none of the presented answer categories stuck out as a top
reason for attaching high importance to the availability of repair services either Many
participants indicated that repairing the product could save money (33 to 40)
and that they wanted to keep the product for as long as possible (28 to 34)
Similarly other important reasons were that repairing avoids the effort of shopping
for a new onerdquo (24 to 28) repairing the product is better for the environment
(23 to 28) not being able to self-repair the product (18 to 25) and the
belief that repair services will do a good job (15 to 20) There were no striking
patterns across the different products categories
Table 42 Reasons for high importance of availability of repair services by product
category (in )
Vacuum
Cleaner
Dish-
washer
TV Mobile
Phone
Coat or
Jacket
Repairing the product
could save me money
393 399 371 352 329
I wanted to keep the
product for as long as
possible
293 280 290 326 341
Repairing avoids the effort
of shopping for a new one
279 267 269 243 238
Repairing the product is
better for the environment
268 284 247 252 229
I donrsquot think I could repair
this product myself
190 198 224 251 178
I believe repair services
will do a good job
197 213 185 182 151
Other 03 03 05 03 04
Donrsquot know 19 20 30 21 56
No of observations 3034 2767 3331 3201 1415
Note Following up on answers presented in Figure 42 and Figure 43 participants were asked (Q34f) ldquoYou said that when you last bought the following product(s) ldquowhether repair services exist for the productrdquo had a lot of influence on your choice of product Why was this For each product please select the two most important reasonsrdquo Since participants indicated the two most appropriate reasons the totals do not sum up to 100
Source ConPolicy analysis of consumer survey data
Behavioural Study on Consumersrsquo Engagement in the Circular Economy
151
Reasons for low importance of availability of repair services
Participants attributing little or no importance to repair services on average indicated
several reasons for their statements (Table 43) Overall trust in manufacturerrsquos
warranty costs the expectation that the product will not break as well as the
statement that faulty items would be simply replaced were reported
There were interesting differences between product categories Trust in manufacturersrsquo
warranties and expected high costs of repair services were named rather frequently for
vacuum cleaners dishwashers televisions and mobile phones However this was not
true for clothing items where only about 16 (warranty) and 17 (costs) stated this to
be a reason for attributing little importance to repair services Not considering repairing a
faulty product was stated more frequently for clothing items (26) compared to other
product categories (ranging from 7 to 13)
Table 43 Reasons for low importance of availability of repair services by product
category (in )
Vacuum
Cleaner
Dish-
washer
TV Mobile
Phone
Coat or
Jacket
I trust the manufacturerrsquos
warranty
364 445 371 346 161
Repair services are too
expensive
283 317 317 327 166
I donrsquot expect this product
to break
281 322 275 271 362
If something breaks I just
replace it
183 162 150 165 221
Repairing this product just
isnrsquot something Irsquod
consider
128 71 122 134 261
I wouldnrsquot know how to
find a repair service
105 75 76 81 94
Products are not as good
after theyrsquove been repaired
50 53 74 103 86
If repair services exist the
product must be low
quality
23 17 31 19 34
Other 39 54 28 41 59
Donrsquot know 69 47 69 61 73
No of observations 850 1164 1342 1461 3209
Note Following up on answers presented in Figure 42 and Figure 43 participants were asked (Q34g) You said that when you last bought the following product(s) ldquowhether repair services exist for the productrdquo had little influence on your choice of product Why was this For each product please select the two most important reasonsrdquo Since participants indicated the two most appropriate reasons the totals do not sum up to 100
Source ConPolicy analysis of consumer survey data
Behavioural Study on Consumersrsquo Engagement in the Circular Economy
152
642 Expectations on durability and reparability information
In the following section consumersrsquo expectations regarding durability and reparability
information are presented Firstly it is presented when respondents would like to
receive durability information during the purchasing process followed by ways how they
would like to receive this information Similar steps are followed also for reparability
information
When respondents would like to receive durability information
Visible from Table 44 across all product categories the majority of participants reported
that they expected durability information to be displayed at the point of purchase
Similarly a large percentage indicated that they expected this information when
comparing alternative products (between 38 and 50) Presenting this information
when products are advertised on the other hand was ranked less important and only a
very small share of participants reported that they expected durability information after
their purchase The overall rankings were fairly homogenous across the different product
categories
Table 44 Expectations regarding when to receive durability information (in )
Vacuu
m
Cleaner
Dish-
washer
TV Mobile
Phone
Coat or
Jacket
When products are
advertised (eg on TV in
store online)
195 189 200 221 125
When comparing alternative
products (in store online)
486 496 474 499 379
At the point of purchase (at
the online check-out or shop
counter)
520 544 525 528 518
After a purchase has been
made
52 46 61 68 78
Other 13 14 13 07 15
Donrsquot know 57 52 63 56 134
No of observations 4848 4096 4855 4893 4883
Note The question was Q52 ldquoFor each of the following products when would you expect to obtain information on how long the product will last that you are considering buyingrdquo
Source ConPolicy analysis of consumer survey data
How respondents would like to receive durability information
In addition to the timing of durability information participants were also asked to
indicate how they preferred to receive information on productsrsquo durability
Table 45 displays the results by product category
Overall participants reported most frequently that they expected durability information
via product descriptions (40 to 45) as well as via guarantees or warranties
(23 to 44) About 30 of respondents each expected to receive information via
retailers operating manuals or instructions or the manufacturerrsquos website These were
followed by the expectation of receiving information via an EU official label (18 - 23)
and an official label from a national authority (14 - 19) Websites of third parties as
well as social media sites were ranked as less important
For the individual product categories a difference in importance of guarantees and
warranties was found for clothing items Considerably fewer respondents wished to
receive information via guarantees for this product A similar difference was found for the
Behavioural Study on Consumersrsquo Engagement in the Circular Economy
153
relevance of operating manuals and instructions Again clothing items received a lower
rating (16) compared to the other products (above 30)
Table 45 Expectations regarding how to receive durability information (in )
Vacuum
Cleaner
Dish-
washer
TV Mobile
Phone
Coat or
Jacket
Via product descriptions 445 445 428 446 399
Via guarantees or
warranties
431 439 413 431 227
Via the retailer 334 346 352 345 360
Via operating manuals or
instructions
333 318 309 313 162
Via a manufacturerrsquos
website
291 293 295 318 185
Via an EU official label 216 232 212 208 182
Via an official label from
your national authority
176 186 160 171 135
Via the website of a third
party (eg consumer
association)
150 156 152 174 95
Via social media 107 110 113 148 85
Other 03 03 03 02 08
Donrsquot know 41 36 45 39 112
No of observations 4848 4096 4855 4893 4883
Note The question was Q53 ldquoAnd for each of the following products how would you expect to obtain information on how long the product will last that you are considering to purchase Select all that applyrdquo
Source ConPolicy analysis of consumer survey data
When respondents would like to receive reparability information
Table 46 presents participantsrsquo expectations on receiving reparability information
Respondent preferences for the timing of reparability information followed a similar
pattern to those for durability information discussed above Again the majority of
participants reported that they would expect to obtain reparability information at the
point of purchase for all product categories Here approval rates ranged from 56 to
59 Many respondents would also expect to receive reparability information when
comparing the product to others (ranging from 32 to 45) During advertisement
of products between 13 and 20 of the respondents would expect to be informed
Finally between 8 and 11 would expect to receive information after they bought the
product
Table 46 Expectations regarding when to receive reparability information (in )
Vacuum
Cleaner
Dish-
washer
TV Mobile
Phone
Coat or
Jacket
When products are
advertised (eg on TV in
store online)
186 180 180 202 126
When comparing
alternative products (in
store online)
445 440 413 440 319
Behavioural Study on Consumersrsquo Engagement in the Circular Economy
154
At the point of purchase
(at the online check-out or
shop counter)
567 591 572 582 555
After a purchase has been
made
83 78 96 96 111
Other 10 13 12 09 13
Donrsquot know 67 56 71 71 136
No of observations 4848 4096 4855 4893 4883
Notes The question was as follows Q54 ldquoStill thinking about the same products when would you expect to obtain information on how easy it is to repair the products that you are considering buyingrdquo
Source ConPolicy analysis of consumer survey data
How to receive reparability information
Table 47 presents the results on participantsrsquo preferences on how to receive reparability
information
Overall the responses were similar to the one regarding durability information
Most participants reported that they would expect to receive reparability information via
product descriptions (ranging from 34 to 40) and via guarantees or warranties
(ranging from 21 to 38) Similarly large shares reported their preference for
receiving information via the retailer (34 to 37) and manuals or instructions
(18 to 37) Expectations to receive information via the manufacturersquos website and an
EU official label were lower Even fewer respondents expected to receive information via
a label from a national authority the website of a third party andor social media
For most product categories answers were rather homogenous Although in the case of
coats or jackets participants indicated a lower expectation for receiving information via
guarantees or warranties (21) as well as operating manuals or instructions (18)
compared to the other product categories
Behavioural Study on Consumersrsquo Engagement in the Circular Economy
155
Table 47 Expectations regarding how to receive reparability information (in )
Vacuum
Cleaner
Dish-
washer
TV Mobile
Phone
Coat or
Jacket
Via product descriptions 394 397 360 390 336
Via guarantees or
warranties
365 367 360 380 209
Via the retailer 353 353 370 344 356
Via operating manuals or
instructions
372 359 336 345 182
Via a manufacturerrsquos
website
275 283 274 307 183
Via an EU official label 176 180 166 171 141
Via an official label from
your national authority
137 145 126 133 103
Via the website of a third
party (eg consumer
association)
121 131 132 159 91
Via social media 90 91 95 115 76
Other 02 02 01 03 08
Donrsquot know 49 42 60 54 136
No of observations 4848 4096 4855 4893 4883
Notes Participants were asked Q55 ldquoAnd how would you expect to obtain information on how easy it is to repair the products that you are considering to purchaserdquo
Source ConPolicy analysis of consumer survey data
65 Evidence from the behavioural experiment
This section reports findings from the purchasing experiment This experiment was
conducted to understand the drivers of CE behaviour in purchasing decisions
As described in further detail in Section 272 respondents were asked to purchase a
product on a simulated e-commerce website Six different product options were shown to
respondents These product options varied systematically in their price level of
durability157 and level of reparability158 in addition to also varying fictitious product
pictures brand and model names The experimental task was repeated by each
respondent for three different products
The sections below analyse the impact of durability by looking at the durability
preferences of respondents the average durability of products chosen in the experiment
and their willingness to pay for longer lasting products
Reparability is analysed by looking at the reparability preferences of respondents and
their willingness to pay for more easily repairable products
157 Defined in the experiment as lsquothe period in which a manufacturer promises to replace or repair the product for free in case of repairrsquo
158 Defined in the experiment as an lsquoease-of-repair rating based on availability of repair manuals spare parts and repair servicesrsquo The rating ran on a scale from A to G
Behavioural Study on Consumersrsquo Engagement in the Circular Economy
156
651 Effectiveness of providing durability or reparability information
One of the experimental conditions159 systematically varied whether and how durability
andor reparability information was shown in the product descriptions As explained in
more detail in section 272 (incl screenshots of the information used) durability andor
reparability information were either shown via icons within the EU EnergyEcolabel shown
as a manufacturer warranty or shown as an expected lifetime
The following definitions of durability and reparability were used on the EU labels
Respondents could reveal these definitions by clicking on the labels
Durability The period in which the manufacturer promises to replace or repair the
product free of charge
Reparability Ease-of-repair rating based on availability of repair manuals spare
parts and repair services
The lsquoManufacturer warrantyrsquo and lsquoExpected lifetimesrsquo were not explained further as it is
common market practice for manufacturers and retailers to display such promises in this
way at the point of sale
Durability information
Figure 44 shows the distribution of lsquodurability preferencesrsquo for different ways of disclosing
durability information to respondents The definition of durability preferences used in the
analysis is explained in detail in section 272 but in summary
Respondents who mostly chose products with high durability in the experiment were
classed as having lsquoHighrsquo durability preferences
Those who mostly chose products with low durability lsquoLowrsquo durability preferences
All others were classed as having lsquoIntermediatersquo durability preferences
Visible from the very left-hand bar in the figure as would be expected respondents that
did not see any durability information were unable to make durability a meaningful
criterion for their product choice For this group the distribution of durability preferences
was close to a random allocation (around 20 of respondents having chosen each low
and high durability products and almost 60 choosing intermediate durability levels) as
would be expected in this case This group of respondents forms the group of comparison
(baseline) for further analysis
159 Allocations to the various treatments in the experimental tasks were done independently and randomly across the different allocations This resulted in a full factorial design between products and treatments This means that group sizes for different variants within each treatment category were roughly equal and each respondent had the same likelihood of being assigned to any specific treatment This also ensures that on average there should not be any interactions between different types of experimental treatments
Behavioural Study on Consumersrsquo Engagement in the Circular Economy
157
Figure 44 Durability preferences for different forms of durability information
Notes 1988 respondents were shown no durability information 985 respondents were shown durability information on an EU label 1000 respondents were shown both durability and reparability information on an EU label 1027 respondents were shown a manufacturer warranty and 1042 respondents were shown an expected lifetime indication
The labels below the results show the respective durability information shown in the experiment Durability in the Energy (likewise in the Ecolabel for clothes) was shown using a lsquohandshakersquo icon and durability in years (months for smartphones) Reparability was shown using a lsquospanner and screwdriverrsquo icon with a reparability rating from A-G Clicking on the label (used by 31 of respondents) revealed additional information and definitions of durabilityreparability Durability on EU labels was defined as The period in which the manufacturer promises to replace or repair the product free of charge
Reparability on EU labels was defined as Ease-of-repair rating based on availability of repair manuals spare parts and repair services
The handshake icon shown in this figure is different from the one seen by respondents in the experiment for copyright reasons
Source LE Europe analysis of behavioural experiment
When durability information was shown respondents were significantly more likely to
choose more durable products On average across the four information remedies (see the
four right-hand bars in the figure above) the proportion of respondents with a
preference for high durability nearly tripled by virtue of providing durability
Behavioural Study on Consumersrsquo Engagement in the Circular Economy
158
information a change which was highly statistically significant160 Respondent
preferences shifted from both intermediate and low durability preferences towards high
durability preferences And at the same time the share of respondents with intermediate
and low durability preferences also decreased significantly
Looking in detail at how durability information in the experiment was best provided it
emerges that on this measure of durability preferences durability information either as a
manufacturer warranty or expected lifetime was most effective in the experiment
Showing durability information as part of an EU label161 was slightly less effective
This finding can be seen from the figure above The shares of respondents with high
durability preferences were highest in the conditions showing a manufacturer warranty or
expected lifetime indication and the shares of respondents with low durability
preferences were lowest in these conditions
However the difference in effectiveness of showing durability information (alone) on an
EU label compared to the information outside of the label was minor and not always
statistically significant More specifically the distribution of respondent preferences for
high and intermediate durability were equivalent across the three conditions But the
share of respondents choosing low durability products was significantly larger when
durability was shown on the EU label
It can be conjectured that the EU label was marginally less effective because it used only
icons while the manufacturer information contained descriptive language The icon used
on the EU labels (ie a handshake symbol) was novel and may not have been
immediately understood Respondents needed to click on the label to get additional
explanation about the meaning of the icon Overall 31 clicked on at least one label
throughout the three rounds of the experiment to enlarge it and see the definitions for
icons At the same time expected lifetimes and manufacturer warranties can already be
found in the market and are more self-explanatory compared to the icon Thus the
effectiveness of the durability information on the EU labels can be interpreted as a lower
bound and is likely to further increase as time passes after it was introduced as
consumers learn about the meaning of the icon and become more familiar with it
This finding is further underlined by the table below which shows the average durability
chosen by respondents for the different product categories For each product category
the average durability chosen was highest when durability information was shown either
using a manufacturer warranty or expected lifetime (see the last two rows) Providing
durability information on an EU label was similarly effective when it was shown on its
own (see third row)
When durability information on an EU label was shown in conjunction with reparability
information it was however significantly less effective compared to the other ways of
providing durability information (see fourth row) The group of respondents who saw
durability information together with reparability information chose on average ndash
statistically significantly ndash less durable products compared to respondents who saw
durability information on its own But respondents who saw durability and reparability
information together still chose product with higher average durability than the
respondents who did not see any durability information
160 Statistical significance verified using two-sided pairwise z-test of proportions
161 Mock EU Energy Labels which reproduced key features of the actual EU Energy Label were used for vacuum cleaners dishwashers TVs and smartphones The EU Ecolabel was adapted for clothes In both types of labels durability and reparability information was presented using the same format and icons See section 272 for further detail and screenshots of the labels
Behavioural Study on Consumersrsquo Engagement in the Circular Economy
159
Table 48 Average durability chosen by respondents in purchasing experiment in
months (smartphone) or years (all other products)
Type of information Vacuum
cleaners
Dish-
washers
TVs Smart-
phones
Coats
No durability information 56 77 44 329 57
Durability information on EU
label
82 122 58 365 72
Durability and reparability on
EU label
73 111 53 355 69
Manufacturer warranty 83 123 59 371 75
Expected lifetime 85 127 61 378 75
Source LE Europe analysis of behavioural experiment
Reparability information
Figure 45 shows the distribution of reparability preferences for different experimental
conditions which varied whether and how reparability information was disclosed
Reparability preferences are defined analogously to durability preferences Section 272
provides a more detailed explanation but in summary the preferences are defined as
follows
Respondents who mostly chose products with high reparability in the experiment
were classed as having lsquoHighrsquo reparability preferences
Those who mostly chose products with low reparability were classed as having lsquoLowrsquo
reparability preferences
All others were classed as having lsquoIntermediatersquo reparability preferences
Behavioural Study on Consumersrsquo Engagement in the Circular Economy
160
Figure 45 Reparability preferences for different forms of reparability information
Note 4029 respondents were shown no reparability information 1013 were shown reparability on an EU label and 1000 were shown reparability and durability on an EU label
The labels below the results show the respective reparability information shown in the experiment Reparability in the Energy (likewise in the Ecolabel for clothes) was shown using a lsquospanner and screwdriverrsquo icon with a reparability rating from A-G Reparability was shown using a lsquohandshakersquo icon and durability in years (months for smartphones) Clicking on the label revealed additional information and definitions of durabilityreparability
Reparability on EU labels was defined as Ease-of-repair rating based on availability of repair manuals spare parts and repair services
Durability on EU labels was defined as The period in which the manufacturer promises to replace or repair the product free of charge
The handshake icon shown in this figure is different from the one seen by respondents in the experiment for copyright reasons
Source LE Europe analysis of behavioural experiment
Similar to the effectiveness of durability information providing reparability
information induced respondents to choose more repairable products A higher
proportion of respondents had high reparability preferences and a lower proportion had
low or intermediate reparability preferences when reparability information was shown
The differences in these proportions were highly statistically significant in tests of
proportions
Behavioural Study on Consumersrsquo Engagement in the Circular Economy
161
The effects are however smaller in magnitude compared to the findings for
durability The proportion of respondents with a high reparability preference lsquoonlyrsquo
doubled when reparability information was shown while high durability preferences
tripled for a similar intervention The proportion of respondents with a low or
intermediate reparability preference decreased by respectively 11 and 5 percentage
points
Results for reparability might have been less strong because it appears that the
information on reparability as provided in the experiment was less attention grabbing
for respondents Around 42 of respondents who saw information on reparability
correctly recalled this after the experiment162 In contrast 71 of respondents who saw
durability information recalled this correctly Furthermore it seems that reparability
information (as provided in the experiment) was more difficult to understand and use
than information on durability163
Interaction between durability and reparability information
Combining the information provided in Figure 44 Table 49 and Figure 45 above sheds
light on the interaction between durability and reparability information Comparing
product choices when durability and reparability were provided as stand-alone
information to when they were provided together is telling for how respondents dealt
with the different amount of information
In the previous analyses providing durability and reparability information at the same
time seemed to decrease the importance of each of these individual pieces of
information The proportion of respondents who chose high durability products was
significantly higher when durability information was shown on its own rather than with
reparability information Similarly the average chosen durability was higher ndash often
statistically significantly so ndash when durability information was shown on its own (instead
of with reparability)
Similarly the proportion of respondents who selected products with high reparability was
larger when reparability information was shown without additional durability information
This suggested that showing both durability and reparability information on EU labels
might create a dilemma for CE behaviours of competing interest When only a single
piece of information was given respondents could adjust their behaviour with respect to
that piece of information However this was not possible or at least more difficult when
information about durability and reparability were given concurrently
It must be noted that the above analyses did not consider the effect of information
on durability and reparability jointly This was because a joint analysis required a
measure that combines preferences for durability and reparability The figure below
presents such a measure for general CE preferences These general CE preferences were
calculated by combining the previously presented measures for durability preferences
and reparability preferences Both durability and reparability received equal weighting in
this measure The figure below presents only the information treatments that were
presented as part of EU labels because only the EU labels presented both durability and
reparability information
162 Following the purchasing experiment respondents were asked the following question ldquoThinking about the last purchasing decision you just made what information did you get about the selection of products you saw Please select all that applyrdquo Answer options included ldquoAn indication of how long the products will lastrdquo and ldquoHow easy it is to repair the products or get them repairedrdquo
The answers to this question were compared with the information shown in the experiment to respondents This allows for an assessment whether participants who saw information on durability andor reparability recalled seeing this information correctly
163 This was found by comparing answers to follow up questions which asked respondents how easy they found respectively the durability and reparability information shown to them
Behavioural Study on Consumersrsquo Engagement in the Circular Economy
162
Figure 46 General CE preferences for different forms of information
Note 975 respondents were shown no information 985 were shown durability on an EU label 1013 were shown reparability on an EU label and 1000 were shown reparability and durability on an EU label
The labels below the results show the respective CE information shown in the experiment Durability in the Energy (likewise in the Ecolabel for clothes) was shown using a lsquohandshakersquo icon and durability in years (months for smartphones) Reparability was shown using a lsquospanner and screwdriverrsquo icon with a reparability rating from A-G Clicking on the label revealed additional information and definitions of durabilityreparability Durability on EU labels was defined as The period in which the manufacturer promises to replace or repair the product free of charge
Reparability on EU labels was defined as Ease-of-repair rating based on availability of repair manuals spare parts and repair services
The handshake icon shown in this figure is different from the one seen by respondents in the experiment for
copyright reasons
Source LE Europe analysis of behavioural experiment
This analysis shows that overall respondents chose products with the best mix of
durability and reparability when durability and reparability information was
shown together In fact providing both types of information was associated with the
largest proportion of respondents with high CE preferences and the joint lowest
proportion of respondents with low CE preferences
The figure above confirms the finding that providing information is important to
induce more environmentally friendly choices Respondents who saw either
durability or reparability information or both durability and reparability information
together were significantly more likely to display a high CE preferences and significantly
less likely to display a low CE preferences
Behavioural Study on Consumersrsquo Engagement in the Circular Economy
163
Durability information seemed to be the main driver of CE decisions The impact
of durability information on its own was statistically significantly larger than the impact of
reparability information alone Furthermore durability information provided some
additional impact beyond the impact of reparability information The reverse however
was not the case The proportions of high and low preferences were not statistically
different when durability was provided by itself or together with reparability information
Taking these findings together with findings from the literature stakeholder consultations
and focus groups seems to suggest that durability is perceived as a substitute for
reparability This is because a durable product could be seen as a high-quality product
which would not require repair thus making the ease of repair of the product irrelevant
Instead reparability on its own does not substitute for the need of product durability
Results from regression analysis
As a robustness check of the above results regression analyses were used to analyse the
preferences for durability and reparability and the general CE preferences further
including controlling for socio-demographics country specific effects and personal
attitudes See below for results
Behavioural Study on Consumersrsquo Engagement in the Circular Economy
164
Table 49 Results from ordered logit regression on durability reparability and general CE preferences
Outcome variable Durability preferences Reparability preferences General CE preferences
(1) (2) (3) (4) (5) (6)
Information treatment - Baseline No information given
Durability info only in EU label 5047 5282
0770 0780
3345 3521
(1200) (1232)
(-211) (-199)
(705) (731)
Reparability info only in EU label 0677 0671
2883 2975
2255 2308
(-297) (-303)
(871) (891)
(456) (467)
Durability and reparability info in EU label 2983 3014
1433 1422
3501 3501
(831) (836)
(302) (294)
(735) (733)
Manufacturers guarantee 5637 5986
0847 0857
3541 3721
(1327) (1360)
(-136) (-125)
(759) (780)
Expected Lifetime 6714 6882
0780 0775
3525 3530
(1446) (1470)
(-201) (-205)
(742) (745)
Label type treatment - Baseline Mini label
Full label 0976 0970
0915 0912
0907 0907
(-033) (-042)
(-124) (-129)
(-110) (-109)
Behavioural nudges treatment ndash Baseline No claim
Savings claim 1223 1215
0954 0942
1120 1105
(229) (219)
(-054) (-069)
(105) (092)
Social claim 1105 1096
1144 1132
1216 1208
(112) (101) (157) (143) (180) (171)
Country controls
Socio-demographics (age gender etc)
Personal attitudes (pro-CE pro trends etc)
Notes Odds ratio (exponentiated coefficients) reported t statistics in parentheses p lt 005 p lt 001 p lt 0001 N = 6042 for all regressions
Source LE Europe analysis of behavioural experiment
Behavioural Study on Consumersrsquo Engagement in the Circular Economy
165
The regression analyses confirmed the results reported above When looking at the
information treatment clearly respondents reacted to the treatment Providing
information about durability increased the likelihood that a respondent showed a high
durability or general CE preference Similarly showing reparability information increased
the likelihood that a respondent showed a high reparability or CE preference
Furthermore these results were robust to including other control variables namely
country effects socio-demographics and personal attitudes
Additional analyses of interaction terms between different treatment types and between
treatments and personal characteristics (socio-demographics and personal attitudes) did
not show any systematic patterns Thus it can be concluded that the treatments were
entirely responsible for the shifts in CE preferences and that the effectiveness of the
different treatments was equivalent across the Member States analysed here as well as
for different types of consumers (ie the treatments worked equally well for richer and
poorer respondents as well as for respondents with more or less pronounced pro-CE
attitudes) This is an important finding for policy interventions since EU-wide activities
would be expected to be effective across the different cultural and socio-economic
contexts of the various Member States
Summary of findings
In summary it can be concluded from the behavioural experiment that the provision of
durability and reparability information is vital for encouraging decision-making which
takes into account CE product characteristics The consumer survey indicated (see
section 34) that individuals look for information regarding how long their products are
likely to last as well as how easy they are to repair However often individuals find this
information difficult to find The behavioural experiment has delivered powerful evidence
that actual purchasing decisions might be strongly driven towards more CE-friendly
products when information especially on durability but also on reparability information is
provided in concise and comparable ways
Showing information on CE characteristics was effective for different types of
respondents as well as for different Member States regardless of differences in
demographic profiles personal CE attitudes and economic situations This indicates that
policy interventions would likely be similarly effective across various EU Member States
652 Willingness to pay for durability and reparability
An alternative way of looking at respondentsrsquo decision-making is to consider willingness
to pay (WTP) Willingness to pay shows the monetary amount that respondents were
willing to spend on additional durability or reparability The WTP amounts were derived
through a choice modelling approach (see the Annex for further methodological detail)
This approach takes advantage of choice data collected across all participants who saw
different choice sets
Table 50 shows the willingness to pay for an additional year or month of durability The
first row shows overall willingness to pay whereas the subsequent rows show willingness
to pay depending on the type of durability information It should be noted that the yearly
WTP figure for smartphones is derived from the monthly figure which was the estimate
derived directly from the data (since for smartphones durability was presented in months
rather than years in the choice task) While this is a reasonable extrapolation it does
imply an assumption namely that the relationship between WTP and length of durability
is linear (ie each extra month has the same value) which may or may not be a
reasonable assumption
Behavioural Study on Consumersrsquo Engagement in the Circular Economy
166
Table 50 Willingness to pay for durability (in euro per yearmonth of additional durability)
Vacuum
cleaners
Dish-
washers
TVs Smartphones Coats
Year Year Year Month Year Year
Overall
willingness to pay
(WTP) in the
experiment
1911 2053 7288 1033 12394 1354
Willingness to pay in different information treatment conditions
WTP when no
CE information
was shown[1]
Not statistically significant[2]
WTP when
durability
information
was shown on
EU label
3315 3005 12628 1478 17731 1778
WTP when
durability and
reparability
information
were shown
on EU label
2028 3112 9179 1232 14788 1396
WTP when
manufacturer
warranty was
shown
3288 3271 12783 1750 21004 2379
WTP when
expected
lifetime was
shown
3576 3591 14830 1812 21739 2727
Notes Willingness to pay for an additional month or year of product durability Respondents making decisions on smartphones originally saw durability in months Willingness to pay was multiplied by 12 to arrive at a willingness to pay for an additional year of durability this assumes linearity in willingness to pay
3612 respondents made decisions on vacuum cleaners 3605 on dishwashers 3627 on TVs 3638 on smartphones and 3644 on coats
[1] No CE information shown means no durability and no reparability information shown
[2] Respondents had no significant willingness to pay for durability when they were not shown any durability information This result might seem trivial yet it is an important sense check of the overall setup of the experiment which thus seems valid
Source LE Europe analysis of behavioural experiment
Overall willingness to pay across all respondents ranged from euro1354 for an
additional year of durability for coats to euro7288 for an additional year of
durability for TVs and euro1478 per month or euro12394 per year (derived from the
monthly figure) for smartphones
This comparison across products however should not be given too much importance
This is because the estimates of willingness to pay are not only determined by the
Behavioural Study on Consumersrsquo Engagement in the Circular Economy
167
importance of durability in decision-making but also by other factors especially the price
ranges presented in the choice experiment These were calibrated based on actual
market prices and varied significantly across the products Willingness to pay is inflated
by a larger variation in prices or a smaller variation in durability This explains why the
willingness to pay for smartphones is relatively large (large variation in price small
variation in durability) whereas the willingness to pay for vacuum cleaners is relatively
small (small variation in price large variation in durability) Even if consumers attached
the same importance to durability in decision-making across products the willingness to
pay is expected to be different across products if market conditions differ
Comparing willingness to pay across different ways of presenting CE information
but within each product category is more informative This comparison corroborates
many of the previous findings Firstly respondents required information on product
durability to be willing to pay for it164 Durability information provided via
manufacturer warranties or as an expected lifetime was most effective
Willingness to pay for additional durability was highest for all products when expected
lifetime was shown (respectively euro3576 (vacuum cleaner) euro3591 (dishwasher)
euro14830 (TV) euro21739 (smartphone) and euro2727 (coat) for an additional year of
durability) For all products except vacuum cleaners the manufacturer warranty was
associated with the second highest willingness to pay For vacuum cleaners showing
durability information on its own on an EU label proved second most effective with a
willingness to pay equal to euro3315
As before it must be noted that the differences between the manufacturer warranty and
expected lifetime on the one hand and durability information on its own on an EU label
on the other were minor For example the willingness to pay for durability for
dishwashers was euro3005 when durability information was shown on an EU label It was
only euro266 higher when information was shown as a manufacturer warranty
The effectiveness of information provided on an EU label was again similar to providing
information outside the EU labels In general WTP for additional durability was often
lower in the EU label conditions compared to showing durability outside of the EU label
For all products except dishwashers the willingness to pay for durability was lowest when
reparability was shown in addition to showing durability information This again suggests
that showing both pieces of information triggers difficulty for respondents when they
need to consider and trade-off information on different CE characteristics
Willingness to pay was also estimated for reparability Section 272 shows how
reparability was ranked on an A to G scale with lsquoArsquo being the most easily repaired
product More precisely products could be assigned the following rankings A C E or G
Therefore willingness to pay shows the monetary amount that respondents were willing
to pay for increasing the reparability of a product by two levels eg increasing
reparability from C to A or from G to E Table 51 provides the results
164 It is important to note that respondents had no significant willingness to pay for durability when they were not shown any durability information This result might seem trivial yet it is an important sense check of the overall setup of the experiment which thus seems valid
Behavioural Study on Consumersrsquo Engagement in the Circular Economy
168
Table 51 Willingness to pay for reparability (in euro per two-level improvement on A-G
scale)
Vacuum
cleaners
Dish-
washers
TVs Smart-
phones
Coats
Overall willingness to pay
(WTP)
1061 2075 3360 2033 673
Willingness to pay in different information treatment conditions
WTP when no information
was shown[1] Not statistically significant[2]
WTP when reparability
information was shown on
EU label
5424 10494 17058 9770 2987
WTP when reparability and
durability information were
shown on EU label
2856 8256 7648 4739 1042
Notes Willingness to pay for an increase of the productsrsquo reparability score (A-G) by two levels eg an increase from C to A
3612 respondents made decisions on vacuum cleaners 3605 on dishwashers 3627 on TVs 3638 on smartphones and 3644 on coats
[1] No information shown means no durability and no reparability information shown
2] Respondents had no significant willingness to pay for reparability when they were not shown any reparability information This result might seem trivial yet it is an important sense check of the overall setup of the experiment which thus seems valid
Source LE Europe analysis of behavioural experiment
The first row in Table 51 shows the overall willingness to pay for reparability It presents
an average of the willingness to pay presented in the last three rows and thus willingness
to pay pooled across all information designs According to these figures respondents
were willing to pay between euro673 and euro3360 for an increase in reparability
score by two levels This figure however is influenced by the fact that most
respondents did not see any type of reparability information in the experiment As
argued in more detail below respondents who did not see reparability information were
(logically) not willing to pay for it This lowered the overall willingness to pay
Looking at specific ways of presenting relevant information again it appears to be most
important to provide information on product reparability at all165 When relevant
information was provided respondents were willing to pay for ease of repair
Furthermore the willingness to pay for reparability was highest when reparability
information was provided on its own (respectively euro5424 (vacuum cleaner) euro10494
(dishwasher) euro17058 (TV) euro9770 (smartphone) and euro2987 (coat) for an increase of
two levels in reparability score) and not together with durability information
Willingness to pay also provides an opportunity to look at the relative importance of
durability and reparability in respondentsrsquo decisions Table 52 shows the willingness to
pay for durability and reparability for respondents that were shown both types of
165 The experiment did not test different ways of presenting reparability information It only tested whether the inclusion of reparability information using a screwdriver and spanner icon combined with an A-G scale had an impact on respondentsrsquo decision-making behaviour
Behavioural Study on Consumersrsquo Engagement in the Circular Economy
169
information on an EU label These were the only respondents that were given both types
of information
Table 52 Willingness to pay for durability (in euro per yearmonth additional durability) and
reparability (euro per two-level improvement on A-G scale) when both types of information
are shown
Vacuum
cleaners
Dish-
washers
TVs Smartphones Coats
Year Year Year Month Year Year
Willingness to pay for
more durability
2028 3112 9179 1232 14788 1396
Willingness to pay for
better reparability
2856 8256 7648 4739 1042
Notes Willingness to pay for additional month or year of product durability and willingness to pay for an increase of reparability score of two levels Respondents making decisions on smartphones originally saw durability in months Willingness to pay was multiplied by 12 to arrive at a willingness to pay for an additional year of durability
Willingness to pay for respondents that were shown durability and reparability concurrently on an EU label
595 respondents made decisions on vacuum cleaners 607 on dishwashers 605 on TVs 600 on smartphones and 593 on coats Results have been weighted to be EU-wide representative
The table shows that the relative importance of durability and reparability varies between
products For vacuum cleaners and coats the willingness to pay for both CE
characteristics (ie one year or month of durability and a two-level improvement on the
A-G reparability scale) was the same order of magnitude For dishwashers and
smartphones166 reparability was the more important characteristic in terms of
willingness to pay For TVs willingness to pay was higher for durability than for
reparability
653 Effectiveness of behavioural nudges
The experiment also tested the effectiveness of small behavioural lsquonudgesrsquo These were
introduced as claims shown on pop-up screens prior to each experimental round for
participants in the respective treatments See section 272 for further details and
screenshots of the experimental environment Some respondents were shown the claim
that longer lasting products might save money in the long-run (Savings claim)167 Other
respondents were shown the claim that a majority of people chose longer lasting and
more easily repairable products (Social claim)168 These two groups are compared with
the group of respondents that did not see any claim
Claims can be seen as an extension of information provided to respondents Information
in the previous section dealt with product characteristics The claims analysed in this
section relate more to information about the context in which a decision was made
Social nudges have been shown to work as small and cost-effective interventions which
in similar interventions increased for example timely tax collection rates energy
conservation or even high-stakes enrolment into job training169 For the savings claim
166 For smartphones the comparison between willingness to pay for durability and reparability is most appropriate using willingness to pay for an additional month of durability This is the framing that respondents saw in the experiment
167 The exact claim was ldquoProducts that last longer may save you money over timerdquo
168 The exact claim was ldquoA majority of people choose products that last longer and are easier to repairrdquo
169 See The Behavioural Insights Team (2015) EAST Four simple ways to apply behavioural insights available at httpwwwbehaviouralinsightscoukwp-contentuploads201507BIT-Publication-EAST_FA_WEBpdf
Behavioural Study on Consumersrsquo Engagement in the Circular Economy
170
the qualitative work for this study found that the decision to purchase products was to a
large extent driven by money-saving motives and the following tests verified whether
this could be used to enhance CE purchasing decisions
Figure 47 shows the distribution of durability preferences for the different groups of
respondents who saw different claims Note that only respondents who saw some form of
durability information are included Respondents who did not see durability information
would not be able to adjust behaviour based on the claim they saw
Figure 47 Durability preferences for different claims shown to respondents
Notes includes only respondents that saw some form of durability information
1376 respondents saw no claims 1325 respondents saw claims about long-term savings and 1353 saw social claims
Both types of claims led respondents to purchase more durable products
compared to when the respondents saw no claims There was a statistically
significant decrease in the proportion of respondents with a low durability preference
when either a savings or social claim was shown Furthermore the proportion of
respondents with a high durability preference was statistically significantly higher for
respondents having seen a savings claim compared to respondents having seen no claim
The proportions of respondents with intermediate preferences were not statistically
different for different claims Regression analysis showed however that these results
were not robust once other factors were taken into account (see regression results in
previous sub-section) Therefore the effectiveness of claims was rather limited compared
to other treatments
In general the claim about savings was ndash slightly ndash more effective than the social claim
However the distribution of durability preferences did not differ significantly between the
two types of claims
Claims seemed to only have negligible effects on the preferences for
reparability and general CE preferences There were no statistically significant
Allcott (2011) lsquoSocial norms and energy conservationrsquo Journal of Public Economics Coffmann et al (2017) lsquoCan Social Information Affect What Job You Choose and Keeprsquo American Economic Journal Applied Economics
Behavioural Study on Consumersrsquo Engagement in the Circular Economy
171
effects detected on reparability or general CE preferences in the conditions with claims
compared to the baseline without a claim
Overall these experimental tests seem to suggest that communication which underlines
the importance of CE characteristics in the purchasing process may increase consumersrsquo
interest in the CE In particular considering the shift in purchases of products with low to
those with high durability it seems that once individuals become interested in durability
they seek to purchase the most durable products instead of products with very low
durability At the same time looking at the large and stable share of respondents who
purchased products with intermediate durability it appears that there are parts of the
population who do not engage as much with the CE and do not change their purchasing
decisions in meaningful way
Although the experiment shows that nudges have an immediate if small effect on
durability it is silent on long-term effects If claims were shown to consumers eg only
for specific project which consumers purchase infrequently we would expect the effects
in real markets to align with the effects in our experiment If on the other hand claims
would be shown more frequently (eg on product descriptions for many types of
products) it is likely that the effect of claims decreases over time as people become used
to the claims made Alternatively repeated exposure might also reinforce the message
and its effectiveness The experiment cannot provide an answer to this question because
it was only set within a 15-minute timeframe
654 Other factors that influenced CE behaviours in purchasing decisions
Besides information on CE characteristics and claims the experiment also tested whether
the look and feel of the tested EU labels made a difference in respondentsrsquo CE behaviour
As noted before (screenshots of this treatment are shown in section 272) some
respondents saw a lsquomini labelrsquo of the EU Energy Label170 This was a reduced version of
the standard EU Energy Label but still included the most relevant information Others
saw a lsquofull labelrsquo which showed all the relevant information in the common EU Energy
Label format Both the lsquofullrsquo and the lsquominirsquo label were simplified versions of the real EU
Energy Label The lsquofullrsquo label did not display information which is currently displayed on
the Energy Label such as energy consumption in kilowatt hour or noise levels in decibel
Choices for durability and reparability did not differ171 between respondents
being shown a full or mini label One potential explanation for this might be that the
mini label contained all the information that was relevant for decision-making At the
same time it appears that additional information presented in the full label did not deter
respondents from acting on relevant information This is an encouraging finding since the
EU Energy Label for example carries a wealth of other non-CE related information The
experiment seems to suggest that individuals can to some extent abstract from other
information and still act on the CE characteristics
Another reason why the different ways of presenting the label had no impact might relate
to the fact that very few participants engaged with the labels further by clicking on them
Unless the labels were clicked on respondents would not have seen further explanation
about the label content Similar shares of respondents clicked on either the lsquofullrsquo or the
lsquominirsquo label For any given product only around 13 of respondents clicked a label172
Across all products this resulted in 31 of respondents clicking on at least one label
Therefore 69 of respondents did not show interest in obtaining more information about
170 Note that this is not relevant for decisions made on coats As noted in Section 272 the EU Ecolabel was used for coats and no distinction between lsquofullrsquo labels and lsquominirsquo labels was made
171 Two-sided pairwise z-tests of proportions showed no statistically significant differences between proportions for high intermediate or low preferences for durability reparability or overall CE This result was shown to be robust in ordered logit regression analysis
172 The exception is coats 17 of respondents making decisions on coats clicked a label Coats where the only product employing the EU Ecolabel rather than the EU Energy Label Arguably the former label is not as well-known explaining why respondents searched for additional information more often when making decisions on coats
Behavioural Study on Consumersrsquo Engagement in the Circular Economy
172
the labels These engagement rates with additional information are in line with previous
behavioural studies in other markets173 and further underline that information
presented must be relevant intuitive and salient at all stages to be impactful
The fact that different types of labels did not generate different CE behaviour is
comforting since the mini label and full label tend to be employed in different contexts
Mini labels are often used in online environments whereas full labels tend to be adopted
in brick-and-mortar shops The results of the experiment show that these different
market practices should not create different outcomes
Lastly a number of personal characteristics were tested for their effect on CE behaviour
in purchasing decisions These included standard demographic characteristics ndash such as
gender age and educational attainment ndash but also characteristics directly relevant to the
CE ndash such as attitudes towards recycling second hand products and durability and
reparability These personal characteristics did not play a major rule in driving
purchasing decisions For most personal characteristics no robust links to preferences
for CE-friendly products were found
An exception were attitudes towards fashion and trends in relation to the preference for
durability Respondents with a low preference for fashion and trends were significantly
and robustly more likely to have a higher durability preference
173 European Commission (2017) lsquoStudy on consumersrsquo decision-making in insurance services A behavioural economics perspectiversquo a report prepared by LE Europe VVA Europe and Ipsos
Behavioural Study on Consumersrsquo Engagement in the Circular Economy
173
CONCLUSIONS AND SUGGESTIONS FOR FUTURE POLICY ACTION
Behavioural Study on Consumersrsquo Engagement in the Circular Economy
174
7 Overall conclusions
The transition to a more Circular Economy in the European Union is picking up pace The
number of initiatives to stimulate this transition are increasing both top-down from
public authorities through policy actions as well as bottom-up led by industry initiatives
at company or cross-sectoral level At EU level the EU Action Plan for the Circular
Economy adopted in December 2015 has led to concerted policy and regulatory efforts
in various sectors and areas in order to stimulate a more Circular Economy Due to key
principles in (EU) environmental policy such as the polluter pays and producer
responsibility as well as the premise that the Circular Economy can save businesses
money many of the Circular Economy actions (to date) have had a production or supply
side focus Yet for Circular Economy activities to be successful the consumption
demand side needs to be equally well understood To date the consumer perspective on
the Circular Economy has not received as much research attention
This study aimed to fill this gap in the Circular Economy literature by investigating to
what extent consumers currently already engage in Circular Economy practices and what
determines their engagement with a focus on product durability and reparability Making
products more durable and easier to repair can extend their useful lives and increase
their utilisation As a result fewer products are needed to satisfy a similar level of
demand which results in lower use of resources and less waste generation
From a consumer perspective actions that extend the lifetime of products include
purchasing more durable products repairing products when broken and giving products a
second life by selling them in the second hand market Increasing the utilisation rate of
products can also be achieved through rentingleasing models Renting or leasing is
especially useful for products that people only use occasionally These options are
presented in Figure 48 for two types of consumer demand
Type 1 Demand for a functional replacement or equivalent for a product the
consumer already owns (but is defective) and
Type 2 Demand for a new product that they do not yet possess
The options for the first type are repair or replacement with a new or second hand
product The second type can only be satisfied by a new or used product (in ownership)
or through rentalleasing
Figure 48 Consumer choices in the Circular Economy and factors that influence their
decision-making process
To understand what influences consumer behaviour the study explored self-declared
attitudes towards the Circular Economy Additionally the study tested the
effectiveness of providing information on product reparability and durability and
what drives the decision to repair a defective product Furthermore it assessed the
Behavioural Study on Consumersrsquo Engagement in the Circular Economy
175
effects of nudging and the framing of information on purchasing and repair
decisions The study focused mainly on five products - vacuum cleaners dishwashers
televisions smartphones and clothing
The study used a comprehensive set of research methods (see section 2 for more
details)
A systematic literature review was undertaken spanning academic policy and
grey literature across the EU 28 Norway Iceland and four other non-European
countries (ie Canada Switzerland Japan and the United States)
Consumer focus groups were conducted in Ireland Germany Sweden and the
Czech Republic to explore consumersrsquo awareness understanding and expectations
with regard to Circular Economy practices including views from potentially vulnerable
consumers174
Stakeholder consultations with 50 experts from eg business and consumer
associations NGOs public authorities and academia were used to close gaps in the
literature and collect additional evidence
An online consumer survey was undertaken in 12 Member States namely in
Austria the Czech Republic France Germany Hungary Ireland Latvia the
Netherlands Portugal Romania Spain and Sweden with approximately 1000
respondents in each country who were representative of the general population in
terms of age gender and geographic region The survey collected information on
consumersrsquo experiences with CE practices such as repairing renting leasing and
purchasing second hand products their reasons behind engaging in the CE (or not)
as well as general socio-demographic characteristics and self-declared attitudes
towards the CE
The survey was complemented with two behavioural experiments in 6 of the 12
Member States (ie the Czech Republic Germany Ireland Romania and Sweden)
The respondents conducted exercises relating to their purchasing behaviour of new
products and their decisions whether to repair or replace a defective product
they already owned
The study conclusions are set out in the following way
Section 71 concludes on understanding consumer engagement in the Circular
Economy and
Section 72 on factors influencing consumer decision-making in the Circular Economy
71 Understanding consumer engagement in the Circular Economy
One objective of the study was to collect information on what consumers across the EU
most associate with lsquodurablersquo and lsquorepairablersquo products The study therefore addresses an
important gap in the Circular Economy literature This is because durability and
reparability are terms that can easily be given multiple interpretations if not defined
accurately
Most respondents reported being able to lsquouse a product for a long timersquo (57) and lsquothe
product staying in perfect working order for a long timersquo (56) as the most relevant
durability attributes This was in line with the limited existing literature which states that
consumers mainly link durability to a productrsquos performance over time Survey
respondentsrsquo understanding of reparability was instead best described by lsquospare parts
being available for the productrsquo (46) and the lsquopossibility to have the product repaired
by a repair firmrsquo (44)
Beyond these associations the study uncovered that the current state of consumer
engagement in the Circular Economy is characterised by a high willingness to act in line
with the Circular Economy but actual engagement is still rather low
174 Vulnerable consumers were defined as people who are in arrears with household bills or who struggle from time to time with household bills and are in any of the following situations unemployed retired long-term sick or disabled or single parents
Behavioural Study on Consumersrsquo Engagement in the Circular Economy
176
Consumers claim to be willing to engage in Circular Economy activities
The consumer survey found that most EU consumers claim to frequently engage
with the Circular Economy The majority of survey respondents reported that they
keep things they own for a long time (93) recycle unwanted possessions (78) and
repair possessions if they break (64) (see section 34) Respondents also reported that
their peers display similar levels of engagement in the Circular Economy
A lower yet substantial proportion of respondents reported being willing to
engage with novel Circular Economy practices such as leasing products or
buying second hand products The share of consumers who reported they were
interested in leasing varied across product groups between10 for vacuum cleaners
compared to 25 for mobile phones Overall around one in three consumers claim to
buy second hand products (see Section 34)
Previous research has found that consumersrsquo willingness to engage in Circular Economy
activities differs with the nature of the product That is consumers are more likely to buy
a durable product repair or lease a product for more expensive and less lsquofashion-
dependentrsquo items The focus groups and interviews confirmed these findings with
participants reporting that they would be particularly willing to buy durable or to
lease white goods (eg dishwashers) For more fashion-dependent items (smart
phones and clothing) respondents reported they would however be more willing to
purchase second hand compared to other products
A majority of respondents also claimed to be aware of the durability of products they
purchased (64) as well as repair services (58) Respondents reported that they
frequently looked for durabilityreparability information on products (62 for durability
and 55 for reparability) Respondents however often felt that this information was
difficult to find and that they would like better information on these features
These findings are in line with previous research which finds that consumers are
generally willing to engage in sustainable consumption and that this is particularly driven
by their concerns about the environment
However consumersrsquo actual engagement with repairing renting or leasing was found to
be low
Contrasting the high levels of self-claimed willingness to engage in the Circular Economy
there are still many consumers who have in the past not behaved accordingly The
consumer survey and experiment both showed that most consumers repair products
when they break (around 63) Yet the share of consumers who have not
repaired products after they broke was still substantial 36 on average across
the analysed products The highest non-repair rate was observed among Dutch survey
participants (on average 56) while the lowest was observed among Romanian
participants (on average 25) Age and other socio-demographic factors did not play an
important role with respect to repair behaviour
Those who had repaired a product had generally used a professional repair service (eg
26 used a repair service 17 had the product repaired by the manufacturer) Some
respondents especially for clothing items reported that they had decided to self-repair
24 for clothing 18 for vacuum cleaners 13 for dishwasher 6 for mobile phones
and 2 for televisions
Similarly despite a relatively high level of interest in novel Circular Economy practices
(see section 3) the consumer survey found that only a limited proportion of respondents
had ever leased products or purchased second hand And only between 5 and 9 of
respondents had bought a second hand vacuum cleaner dishwasher TV smartphone or
clothing Both the survey and experiment found that buying second hand is more likely
for smart phones and clothes (20) compared to the other products tested (13-14)
Even fewer 1 to 3 had rented or leased a product Observations from the
behavioural experiment support the self-reported survey findings Only 10 to 20 of
experiment participants decided to purchase a second hand product to replace a
defective product within the experiment all others preferred buying brand new
replacements These findings indicate that there is a large potential in closing the gap
between willingness to engage and actual engagement
Behavioural Study on Consumersrsquo Engagement in the Circular Economy
177
Many consumers expect products especially expensive products to last a long time
What consumers associate most with lsquodurabilityrsquo and lsquoreparabilityrsquo was roughly consistent
across different types of products At the same time consumers have different
expectations regarding how long different products should last Focus group
participants and survey respondents reported a wide range of life-time expectations for
the different products of the study such as
For vacuum cleaners 27 of survey participants expected a lifespan of between 4
and 7 years with another 27 who indicated an expectation of 7 to 10 years
For dishwashers the lifespan expectations were higher with 29 indicating that they
expected a lifespan between 7 and 10 years and another 29 with an expectation of
10 to 15 years
Similarly 31 indicated they expected a television to last for 7 to 10 years and
another 28 stated their expectation lay within the range of 10 to 15 years
For mobile phones and clothing items lifespan expectations were lower 38
expected a lifespan between 2 and 4 years for mobile phones and 35 indicated an
expected lifespan of 4 to 7 years For clothing 25 expected a lifespan between 2 to
4 years and a similar share between 4 to 7 years
Most consumers expect that repairing products is possible and easy to arrange
The survey found that there were two large groups of consumers One group who has
experience with repairing goods (63) and one who does not (36) The experienced
group was also more likely to expect that repairing would be possible and easy to
arrange The latter group who lacked experience with repairs seemed to have low
expectations regarding whether repairing goods would be worthwhile or even possible
Specifically for all five product categories a substantial majority of survey respondents ndash
ranging from 77 for coatsjackets to 90 for dishwashers ndash thought it would be
possible for these products to be repaired either by themselves or by someone else
on their behalf Most consumers expected it to be possible to have the products repaired
by a third party (ie friends and family professional repair services) However a non-
negligible minority between 10-23 either did not feel or know whether
repairing a product would be possible
Such inexperience coupled with low awareness of repair options likely obstructs the
potential for further engagement with Circular Economy practices Indeed some
interviewed stakeholders felt that consumersrsquo negative experiences with or expectations
regarding repair services acted as a barrier to the use of such services
However survey respondents typically expected a good level of service from
repair providers175 a majority would expect the service to be ldquofairlyrdquo or ldquoveryrdquo good in
terms of convenience (85) speed (82) friendliness (89) and quality of the repair
(92) Moreover the survey also suggests that actual experiences with repair services
were largely positive In most cases respondents reported their expectations were met
when having a product repaired (over 70) and in some cases even exceeded
Therefore it is likely that some especially inexperienced consumers might wrongly
expect repair services to perform poorly which prevents them from using such services
more often
72 Factors influencing consumer decision-making in the Circular Economy
The previous section established what current consumer engagement in the Circular
Economy is regarding how willing and likely they are to buy durable repair lease or
purchase second hand products Building upon this information this section draws
conclusions on what can enhance or inhibit such Circular Economy practices The figure
below provides an overview
175 No distinction was made here between independent repair services and manufacturer provided repairs
Behavioural Study on Consumersrsquo Engagement in the Circular Economy
178
Figure 49 Factors that influence consumersrsquo choice to replace repair or lease products
Price quality and convenience are most important for consumer decisions
A range of behavioural factors influence consumer decisions Survey respondents ranked
product quality and price as the two most important factors influencing their product
choice followed by product durability and reparability whether repair services exist and
environmental aspects Brands and trends (fashion or technological) were rated as less
important by survey respondents though the literature and focus groups frequently
pointed to these factors as being important While the survey often found that there were
differences between product categories price and quality were very important for all
products
The provision of durability information at the point of sale on for example a product
label and the use of behaviourally informed nudges have the potential to encourage the
selection of more durable products For example better information on the durability of a
product could increase the valuerelative weight of the productsrsquo environmental
characteristics on the purchasing decision (see Figure 50)
Figure 50 Providing durability information can influence the relative importance of price
in purchasing decisions
Overall all strands of research found that consumers lack information on product
durability and reparability Although survey respondents generally reported searching
for information on productsrsquo durability and reparability many including consumers in the
focus groups indicated that such information was difficult to find and that they had a
Behavioural Study on Consumersrsquo Engagement in the Circular Economy
179
desire for receiving better information This pattern of searching for information but
finding it difficult to find or understand was especially pronounced for older respondents
Consumers in the survey and focus groups reported that they were interested in seeing
durability information on product labels or via extended product warranties Some also
reported using brand reputation as an indicator of product durability Regarding
reparability information consumers would like to receive information on the availability
of spare parts repair services and the applicability of extended product warranties
The provision of durability and reparability information was found to be
effective in encouraging the purchase of more durable and repairable products
These findings indicate that the current state of information provision regarding product
durability and reparability might be a potential barrier for engaging in the Circular
Economy Provision of information in a consistent and straightforward format could help
in reducing this barrier
Providing information on product durability and reparability shifts purchasing decisions
towards products with better Circular Economy credentials
The behavioural experiment showed that giving respondents information on product
durability can have a substantial impact on purchasing decisions In a simulated
purchasing task with streamlined product information provision of durability
information increased the participantsrsquo preference for high durability products
almost threefold Provision of reparability information more than doubled the
preference for products with a high level of reparability Both these effects were
highly statistically significant Durability information was most effective when provided as
lsquomanufacturer warrantiesrsquo or lsquoexpected lifetimesrsquo176 EU labels (ie an augmented EU
Energy or Ecolabel with an added durability commitment icon or reparability icon and
rating A-G) were similarly effective177
General Circular Economy preferences were strongest when durability and reparability
information was presented together That is when durability and reparability
information was shown together individuals were most likely to purchase
products which rated high in both dimensions ndash durability and reparability
Durability was however the more influential factor on consumer decisions In the
experiment durability information provoked the strongest shifts in preferences while
reparability only marginally led participants to choose products with overall better CE
credentials
The findings were corroborated by showing significant willingness-to-pay for better
durabilityreparability for all product categories Depending on how
durabilityreparability information was presented willingness-to-pay for an additional
year of durability ranged between euro20-36 for vacuum cleaners and dishwashers euro92-148
for TVs euro148-217 for smartphones178 and euro14-27 for coats Willingness-to-pay for an
improved reparability179 rating was around euro29-54 for vacuum cleaners euro83-105 for
dishwashers euro77-171 for TVs euro48-98 for smartphones and euro10-30 for coats
176 lsquoManufacturer warrantyrsquo and lsquoExpected lifetimersquo were not explained or defined further in the experiment It is a common market practice for manufacturers and retailers to display durability claims beyond the legal guarantee of 2 years in this way Manufacturer warranties and expected lifetimes may be seen as a service to consumers or a possible signal for quality but the experiment remained silent about the precise meaning
177 Durability on EU labels was defined as The period in which the manufacturer promises to replace or repair the product free of charge
Reparability on EU labels was defined as Ease-of-repair rating based on availability of repair manuals spare parts and repair services
Around 31 of participants have clicked on the labels to enlarge these to include these additional definitions
178 Willingness-to-pay for additional durability of smartphones was measured in months and subsequently extrapolated to years A linear relationship between time and willingness-to-pay was assumed (ie each extra month has the same value)
179 The willingness-to-pay was measured per year for durability and per two-step increase on the A-G scale for reparability(eg from G to E C to A)
Behavioural Study on Consumersrsquo Engagement in the Circular Economy
180
The finding that durability information had a larger impact on respondentsrsquo choices in the
experiment than reparability information is in line with the findings from the survey
focus groups and literature Based on the survey findings this may be because
consumers said they trusted manufacturersrsquo warranties did not expect (durable)
products to break or felt that repair would be expensive As such durability is seen by
consumers as a substitute for reparability while the reverse is not the case In this
regard there seems to be divergence between consumer expectations and industry
perceptions because stakeholders representing the industry mentioned that reparability
was seen as a building block of durability by extending useful lifetimes via repairs or
upgrades Thus it might be beneficial to sensitise consumers further regarding the
benefits of easily repairable products to achieve further consumer engagement in the
Circular Economy Informing consumers about the durability benefits of easily repairable
products may help to achieve further consumer engagement in the Circular Economy
Importantly information provision was equally effective in encouraging more CE
behaviour across different types of consumers Its effectiveness was not restricted
to consumers belonging to certain socio-demographic groups or to those having pro-
environmental preferences This is interesting as the likelihood of choosing to repair a
product rather than replacing it did differ across consumer types (see further below and
in section 45)
The shifts in behaviour in the experiment resulted from consumers turning away from
low durabilityreparability products in favour of those with better CE
credentials As usual with experimental findings these effects need to be seen in
conjunction with the experimental setup which consisted of a simplified purchasing
process with streamlined and standardised product information compared to real-world
shopping experiences It is therefore possible that the effectiveness of
durabilityreparability information in reality might be increased or dampened
Information provision at the point of sale likely affects after-sales expectations
In terms of after-sales expectations there were contrasting views uncovered by
the different strands of research Stakeholders reported that consumers have low
expectations regarding product reparability Some focus group participants had the
impression that newer generations of products were less durable than products that were
produced some years ago This discussion around lower durability of newer products
sometimes led participants to mention the concept of planned obsolescence of
products
A joint analysis of the behavioural experiment and the consumer survey revealed that
consumers who have received durability information via manufacturer warranties
or durability promises at the point of sale in the purchasing exercise in the experiment
were significantly more likely to expect free replacement or free repairs of
faulty products Alternatively those who had not seen any information on CE product
characteristics or only information on the reparability of a product were significantly less
likely to expect free rectification of the fault in any way and instead were more likely to
expect to pay for either repair or replacement
These findings further underline the important role product information regarding product
durability and reparability could play in fostering consumer engagement in the Circular
Economy
Many customers try repairing before replacing products but repair decisions are easily
disrupted if arranging repair requires effort
As seen in the previous section a majority of consumers (63) have experience with
repairing products
Those who did not repair products in the past did not do so mainly because they
expected repair to be too expensive (between eg 25 for clothes and 50 for
dishwashers) and preferred getting a new product (17-25 across products) or felt
the old product was obsolete or out of fashion (20 for vacuum cleaners and
dishwashers 25-30 for clothes phones and TVs) Fewer (5-10 across products) said
they did not know howwhere to repair products or felt it would be too much effort to
repair (8-14 across products)
Behavioural Study on Consumersrsquo Engagement in the Circular Economy
181
The behavioural experiment furthermore tested what enhances or inhibits the decision to
repair It revealed that repairs must be easy to arrange as any additional effort could
discourage consumers from attempting repairs In the behavioural experiment the
number of respondents who never chose to repair180 in a repair versus replace choice
increased from 6 to 12 when the repair required minor additional effort compared to
purchasing a replacement product Similarly additional effort led to a decrease in the
proportion of participants choosing to repair from 42 to 35 Even when the effort for
repairing and replacing was identical many respondents still chose to replace the
defective products in the experiment It therefore seems that frictions in the
accessibility of repair services significantly lowered the attractiveness of
repairing while the same type of frictions had virtually no effect on the decision
to replace a product
This illustrates that effort is seen as an important inconvenience or lsquocostrsquo by the
consumer The balance between (perceived) cost and effort of repair can easily tip
consumers to favour replacement This was especially the case for consumers who placed
high importance on trends or fashion
Repairs which were framed as using lsquooriginal parts onlyrsquo compared to lsquooriginal and non-
original partsrsquo were slightly more attractive while consumers were indifferent
between whether the repair was provided by the manufacturer or an
independent repair service Other behaviourally motivated mechanisms which did not
change the cost or difficulty of repairing or replacing largely had no effect on choice
Merely framing repair prices as VAT exempt (while keeping prices constant) did not have
meaningful effects on repair decisions overall Such practices seemed to only strengthen
the decisions of certain groups of respondents For example those with pro-
environmental attitudes were even more likely to repair products when repair services
were framed as VAT exempt while those who attributed highest importance to trends
and fashion were further deterred from repairing
Drivers and barriers to renting leasing products and buying second hand
As mentioned before experience with rentingleasing (1) and buying second
hand (6) was rather low in the surveyed population The main reasons for not
having engaged with such practices were that respondents wished to own their
products and generally that they preferred new unused products Similarly
market data from Scandinavian countries showed that consumers would in general be
willing to make some sacrifices to improve Circular Economy outcomes unless it required
sharing goods or letting their own goods be used by other consumers
Among the few respondents who have rented or leased products in the past their
motivations for doing so were mixed Convenience the possibility to test the product the
chance of reusing the product after use or budget considerations all seemed to play a
role
Uncertainty about the quality of second hand products may act as an important barrier to
Circular Economy engagement by consumers Lack of trust in quality of used products
was seen as a barrier by survey respondents and focus group participants to purchasing
second hand products Respondents were more inclined to purchase second hand
clothing and furniture than electronic goods because of concern that used electronics
may break down faster than a new product 14-21 of respondents (across products)
viewed purchasing a new product as better value for money despite second hand
products being available at a lower price
Product durability and reparability are important for consumers as these can save them
money in the long run
180 Respondents repeated the ldquorepair experimentrdquo in which they were given the choice to repair vs replace defective products three times for different products Respondents could thus decide to repair products between 0 (ie never) and 3 times
Behavioural Study on Consumersrsquo Engagement in the Circular Economy
182
While quality and price were given the highest average importance in purchasing
decisions durability and reparability were also important Respondents who ranked
durability as an important factor reported that the top reason for this ranking was that
durable products would save them money in the long run This finding motivated the
experiment to test behavioural lsquonudgesrsquo introduced via pop-up messages during the
purchasing task These nudges had a positive impact on respondentsrsquo purchasing
decisions Informing respondents that they could save money by purchasing products
that last longer was effective in encouraging them to choose more durable products
Telling respondents that a majority of people chose products which last longer and which
are easy to repair was equally effective Nudges however did not influence respondentsrsquo
preferences for choosing products with higher levels of reparability
Even though reparability was relatively less important for purchasing decisions compared
to durability the possibility to save money with easily repairable products again
motivated individuals to engage with reparability so did the desire to keep products for a
long time
Personal attitudes towards the environment influences consumersrsquo engagement in the
Circular Economy
In the present study personal self-declared attitudes towards the Circular
Economy were largely consistent with actual engagement in the sense that
consumers who self-rated themselves as having pro-environmental attitudes were also
more likely to repair or purchase second hand products Similarly respondents who
categorised themselves as attaching high importance to fashion and technology were
significantly less likely to repair products These findings might seem trivial but they are
not It is often claimed including by some stakeholders in this study that self-declared
pro-environmental attitudes not necessarily translate into pro-environmental behaviours
Behavioural Study on Consumersrsquo Engagement in the Circular Economy
183
8 Suggestions for future policy action
There are a number of overarching findings that arose from this study
1 EU consumers are willing to engage in the Circular Economy but their actual
engagement is relatively limited This implies there is room to boost Circular
Economy practices further Consumers in the survey and experiment with
positive self-declared attitudes towards the environment acted in line with these
preferences in their actual behaviour Therefore by changing consumer
attitudes and their awareness surrounding sustainable and environmental
behaviours further engagement with Circular Economy practices could be
achieved
2 Key drivers influencing consumersrsquo purchase and replacement decisions were
found to be price quality and convenience Reducing the effort required to
repair products lowering prices and increasing quality of durable products could
therefore lead to more pro-Circular Economy purchasing and repair decisions
3 EU consumers lack information on durability and reparability when making
purchasereplacement decisions and would like to take these aspects into account
Providing this information has proven effective in increasing purchases of
products with higher durability andor reparability in the incentivised behavioural
experiment
These findings lead to a number of policy suggestions for EU and national local policy
makers in order to accelerate the transition towards a Circular Economy The policy
implications guide the structure of this chapter and serve as a taxonomy for classifying
subsequent policy recommendations Each policy implication is followed by a number of
policy recommendations (Figure 51) These recommendations include better
implementation or adaptation of existing instruments as well as suggestions for new
policy instruments
Behavioural Study on Consumersrsquo Engagement in the Circular Economy
184
Figure 51 Overview of key policy implications and recommendations
It needs to be stressed that the recommendations for (future) policy action made in
this section are directly derived from the findings and have not been subject to a
rigorous impact assessment that analyses their impacts effectiveness and efficiency in
reaching overall policy goals181 Before proceeding with concrete policy actions in these
areas it is clear that impact assessments would need to be conducted in line with the
European Commissions Better Regulation Agenda182 Suggestions for topics that should
be subject to additional research are included in section 84
81 Boosting CE engagement by strengthening pro-environmental
attitudes and awareness
To reiterate the conclusion from the previous chapter this study found that most EU
consumers try to keep products for a long time and to repair possessions when they
break Most survey respondents also agreed that it was important to be environmentally
friendly and wanted their friends to know that they cared about the environment At the
same time a substantial share of consumers still does not engage in CE practices 36
had not repaired products in the past and only a limited share of respondents had
actually purchased second hand products (5-9) or rentedleased (1-3) a product
181 Effectiveness = To what extent do the suggested recommendations contribute to reaching an overall policy objective Efficiency = At what costs are the (projected) results (being) achieved
182 httpseceuropaeuinfolawlaw-making-processplanning-and-proposing-lawbetter-regulation-why-and-how_en
bullRecommendation 1
bullBoosting pro-environmental attitudes
bullIncreasing consumer awareness of second hand rentingleasing and repair markets
bullPromoting benefits of durability and reparability
Boosting CE engagement by strengthening
pro-environmental attitudes and
awareness
bullRecommendation 2 ndash Making repair easier
bullMaking essential components in a product replaceable
Including repair instructions for minor defects in user manuals
Ensure the availability of spare parts in the longer run
bullEncourage manufacturers to offer a commitment to repair
bullRecommendation 3 - Create financial incentives for reparability and durability
The importance of price quality
and convenience to
support a Circular
Economy
bullRecommendation 4 - Making durability and reparability information available
bullIntegrate durability and reparability information into labels
bullDevelop a scoring system for reparability of products
bullProvide information on spare parts and repair services
bullRecommendation 5 - Strengthened enforcement of legislation requiring provision of accurate information
Enhancing product
information on durability and
reparability
Behavioural Study on Consumersrsquo Engagement in the Circular Economy
185
The study found that many consumers have a preference for new and fashionable
products or generally a preference for owning new unused products Such preferences
can act as a barrier to second hand purchases and product leasing
As consumers are willing to engage in pro-CE behaviours but their perceptions about
repaired or second hand products are not very favourable improving consumer
awareness and providing information about the advantages of durable products and
product repair may be effective in addressing this lsquopreference for the new and unusedrsquo
Recommendation 1 ndash Boosting CE engagement by strengthening pro-
environmental attitudes and awareness
Environmental awareness and consumer attitudes towards environmental practices are
among the key determinants of sustainable consumer choices
From the study follow at least three specific areas of action which could be taken by
policy makers and industry
1 Boosting pro-environmental attitudes The survey and experiment have
shown that pro-environmental attitudes can translate into pro-environmental
behaviours Consumers with stronger self-rated pro-environmental attitudes were
also more likely to make pro-environmental choices in the incentivised
behavioural experiment as well as in reality Thus strengthening such attitudes
via awareness campaigns could boost further consumer engagement in the
Circular Economy Furthermore strengthening pro-environmental attitudes could
also enhance the effectiveness of information campaigns and point-of-sale
information on product durability and reparability (see Recommendation 4)
The stakeholder interviews pointed out that consumer education is indeed
important and should be more widely employed For example when discussing
clothing a representative of a Dutch consultancy firm considered that educating
consumers on the quality of garments would help them distinguish between more
and less durable products
One way Member States could promote awareness is by focussing on educating
young people by for example including environmental awareness
education within school curricula
2 Increasing consumer awareness of second hand rentingleasing and
repair markets The study identified that consumers are generally willing to
engage in Circular Economy practices but that their actual engagement might fall
short because of an unawareness of how to purchase second hand rent lease or
repair products
Recently there has been an increase in the number of Circular Economy initiatives
and information awareness campaigns platforms at EU and Member State level
An example of this is the European Circular Economy Stakeholder Platform and
several Circular Economy initiatives at national level Similar initiatives could
target more consumer engagement in second hand products renting leasing of
products and repair markets
Repair cafes have been set-up in various cities Self-repair by using for example
modular phones such as the lsquoFairphonersquo have come to consumersrsquo attention
However these types of initiatives are still niche rather than mainstream
Awareness raising about the benefits of second hand products renting leasing
and repair should continue to be promoted to reach wider consumer audiences
In addition to awareness raising programmes additional information on product
durability and reparability could be provided at the point of sale (see
Recommendation 4) Product information could also be provided on how repair
can be arranged and on the availability of spare parts (see Recommendation 2)
3 Promoting benefits of durability and reparability Quality and price were
found to be key factors for consumers when choosing to purchase a product In
the experiment when consumers were informed that durable and more easily
repairable products can save them money in the long-term this information was
effective in steering them towards products of higher durability and reparability
Behavioural Study on Consumersrsquo Engagement in the Circular Economy
186
Policy makers could consider using marketing and behavioural science
strategies (nudging) to improve consumer awareness about the benefits
of durable and easily repairable products This could be done for example
by linking durable and easily repairable products with lsquohigh-qualityrsquo and lsquocost-
savingsrsquo in the long-term Instilling such associations with durability and
reparability could alter social norms towards the purchase of more durable and
more easily repairable products However to make such claims robust evidence
supporting the truthfulness of the claims is required Provision of this evidence
may require additional research
Another option would be to encourage other stakeholders including
manufacturers to conduct these marketing and communication strategies Also
the Circular Economy could be incorporated into the list of funding instrument
priority topics for example within the LIFE Programme183
82 The importance of price quality and convenience in purchasing and
repair decisions
Although consumers attach significant value to the durability and reparability of a
product the productrsquos price and quality often remain key factors determining final
consumer choices From a consumer perspective the total cost of a product also includes
the effort needed to acquire a product repair buy or to rentlease it As a result
anything that changes the price-quality ratio via eg price or ease of accessing the
options in favour of product repairs second hand purchases and rentingleasing
products could be effective in increasing the uptake of these sustainable choices
The following two recommendations could be explored
Recommendation 2 - Making repair easier
The behavioural experiment has robustly shown how easily consumers shy away from
repairs when repairing requires more effort compared to replacing products Beyond
promoting the awareness of repair services (recommendation 1) there are also several
additional ways in which repairs could be stimulated across Europe The following options
could be explored
1 Making essential components in a product replaceable by consumers by
adapting existing legislation Often a product needs to be replaced or sent for
professional repair if an essential component such as for example the battery a
LED light or a motor becomes defective However the study found that there is
a substantial interest in self-repairs 12 of survey respondents have experience
with self-repair 37 consider themselves to be good at repairing and 26 of
respondents associate lsquoreparabilityrsquo with being able to self-repair the product
As such the possibility of making essential product components
replaceable by consumers could be explored For example Directive
200666EC on Batteries and Accumulators already contains requirements on the
removal of batteries for certain electrical and electronic equipment184 A similar
requirement for batteries as well as other components could be applied to
products more widely This could potentially be done in the context of
implementing existing legislation (for example the implementing regulations under
the Ecodesign Directive)
This would give consumers the option to replace for example a battery or
another lsquoeasy-to-replacersquo component and create more incentives for consumers
to repair Moreover it would likely also stimulate the demand for repairs by
professionals (manufacturers and independent repair services) This is because
183 The LIFE programme is the EUrsquos funding instrument for the environment and climate action For more information see httpeceuropaeuenvironmentlifeabout
184 Batteries should be readily removable by end-users or have the possibility to have them removed by ldquoqualified professionalsrdquo
Behavioural Study on Consumersrsquo Engagement in the Circular Economy
187
consumers already have a high willingness to have products repaired by third
parties but some struggle to determine whether products can be repaired at all
Such uncertainty could be reduced by designing products such that they are more
evidently built to be repaired
2 Regulation to include repair instructions for minor defects in user
manuals Still regarding self-repairs Manufacturers could include instructions on
how to self-repair minor product breakdowns in user manuals or on the
internet Industry-led guidance and best practice could encourage manufacturers
to provide this information to consumers
The possibility to self-repair would have to take into account the safety of such an
activity for a regular consumer which implies restrictions on what products and
issues can be repaired Repair instructions should be considered only for minor
repairs that do not require specific skills or qualifications
An alternative that could be considered is the provision of such a requirement
within existing regulations and legislation This option would make it mandatory
for manufacturers to provide self-repair guidance for certain products and
breakdown issues Existing legislation could be used such as the Ecodesign
Directive
3 Ensure the availability of spare parts in the longer run The availability of
spare parts is essential for products to be repaired Spare parts for older products
are often difficult to find in particular when production of that product has ended
One option policy makers could investigate is the possibility of requiring
companies to provide spare parts for a certain period of time (and also
even after the product has been discontinued) For example a similar legal
obligation has been introduced in France Decree No 2014-1482 requires
producers to provide information about the time period for which spare parts will
be available185
Findings from all strands of research of this study support this recommendation
The availability of spare parts was for example the strongest association
consumers had with a ldquorepairable productrdquo Moreover the literature review and
stakeholder consultations identified that manufacturers should be required to
guarantee cheaply available spare parts for longer periods of time
4 Encouraging manufacturers to offer a commitment to repair throughout
technical product lifetimes The study found that consumers are willing to pay
significantly more for durable products and that the provision of information on
product durability can encourage consumers to purchase more durable products
The study also highlighted that consumers have high levels of trust in
manufacturer guarantees and are more likely to attempt a repair if a product is
still under guarantee Policy makers could explore the idea of encouraging
manufacturers to offer a repair service to consumers throughout the
technical lifetime of a product Offering such services might increase product
sales prices If this were the case manufacturers who offer this extended repair
service may find it useful to point this out prominently This way and in line with
the experiment findings manufacturers who offer extended repair services might
see consumersrsquo willingness to pay for their products increase Manufacturers who
do not offer such services might benefit from offering lower prices and could be
attractive for consumers who do not value reparability Such transparency could
contribute to having a level playing field among manufacturers
The provision of easier access to repair across a productrsquos technical lifespan may
reduce consumersrsquo effort when it comes to product repair as well as their
uncertainty regarding whether repairing would be possible at all thereby
encouraging more repairs
185 BEUC 2015
Behavioural Study on Consumersrsquo Engagement in the Circular Economy
188
Recommendation 3 ndash Create financial incentives for reparability and durability
Potential cost savings were found to be a key determinant of consumer engagement in
the Circular Economy Therefore financial incentives that encourage the production and
consumption of durable products product repair and the leasing or renting of products
have the potential to promote the uptake of these behaviours by both manufacturers and
consumers However further research would be required to confirm that there is
sufficient price sensitivity in consumers for such stimuli to be effective
Possible financial incentives include (but are not limited to) tax reductions or
exemptions for durable goods leasingrenting services and repair services
This could also include incentives for companies to provide spare parts for products for a
set period time after production has been discontinued (recommendation 2) An example
of a tax scheme was introduced in Sweden in 2017 This scheme introduced a lower VAT
rate for repair services and is known as the ldquorepair bonusrdquo
83 Enhancing product information on durability and reparability
Another main conclusion from this study was that EU consumers currently lack
information on durability and reparability and would appreciate receiving better
information Indeed when this information was provided participants in the behavioural
experiment were significantly more likely to select durable products or products that
could be more easily repaired This implies that providing more information to
consumers about the durability and reparability of products is effective in
shifting demand towards products with better environmental credentials Policy
makers could consider exploring the following two recommendations
Recommendation 4 - Making durability and reparability information available at
the point of sale
Based on the study findings it is suggested that policy makers and manufacturers explore
possibilities on how to make durability and reparability information available at
the point of sale
There are several points to consider
bull Explore the possibility of integrating durability and reparability
information into existing product labels The European Commission could
explore integrating durability and reparability information into the EU Energy
Label or the EU Ecolabel For example icons indicating expected lifetimes or
durability commitments as tested in the experiment could be embedded into the
existing EU Energy Label The EU Energy Label may be more appropriate than the
EU Ecolabel This is because the Ecolabel has only a PASS FAIL scale The Energy
Label instead shows an A to G scale and allows a number of other relevant pieces
of informationicons to be included
bull Explore the possibility to develop new EU consumer rules that would
include the display of durability and reparability information on products
Since the existing EU Energy Label and EU Ecolabel may have their limitations in
terms of scope or effectiveness to introduce durability and reparability information
for a wider range of products there may be a need to develop new EU rules
Including durability and reparability information into existing or new product
information would possibly also alleviate consumer concerns regarding
planned or premature obsolescence practices
bull Examine the development of a scoring system for reparability of
products In 2018 the European Commission launched a study to analyse and
develop a potential scoring system to rate the ability to repair and - where
relevant - upgrade products The technical background resulting from the study
Behavioural Study on Consumersrsquo Engagement in the Circular Economy
189
may be used to set the framework and grounds for the development of a
graphical label for inclusion in product information as mentioned above186
bull Provide product information to consumers on the availability of spare
parts and repair services The study found that consumers were interested in
repair information at the point of sale Providing information on where spare parts
can be obtained and where potential repair services can be found could make
repair easier (see also Recommendation 2) Where feasible the information
should also provide the costs of parts and repair services
Industry guidance and best practice may be most appropriate for encouraging
manufacturers and retailers to provide this information Alternatively policy
makers industry and consumer organisations (at EU and national level) could
investigate if producers and retailers need to be required to inform consumers
about reparability by integrating such provisions into existing EU legislation (eg
within the implementing regulations under the Ecodesign Directive) The
importance of producers informing consumers about the availability of spare parts
was also highlighted by stakeholders in the interviews
Recommendation 5 ndash Strengthened enforcement of consumer legislation
requiring the provision of accurate information to consumers
The provision of product information at the point of sale was found to be effective at
changing purchasing choices The provision of information not only needs to be presented
in a way that consumers can understand and effectively use it in their decision-making
but information also needs to be correct For example the Unfair Commercial Practices
Directive (200529EC) aims to boost consumer confidence and enable national enforcers
to curb a broad range of unfair commercial practices Examples of unfair commercial
practices include providing untruthful information to consumers aggressive marketing
techniques as well as specific issues such as misleading environmental claims and unfair
planned obsolescence practices To ensure the accurate provision of information to
consumers at the point of sale continued and strengthened enforcement of national
consumer laws is of great importance to support consumers in their choices surrounding
engagement in the Circular Economy
84 Suggestions for further research
In this section proposed areas for further research to fill remaining evidence and
information gaps are provided
841 Remaining knowledge gaps on consumer behaviour in relation to
Circular Economy engagement
This study has revealed many meaningful insights on consumer engagement within the
Circular Economy Product quality and price tend to drive consumer decisions over and
above product durability and reparability Therefore in order to further investigate
consumer engagement in the Circular Economy the following could be explored
bull Test with consumers how quality- and price-related characteristics can promote or
hinder the purchase of more durable products
bull Study whether other important factors besides price and quality (eg the brand)
can act as a driver for consumers to buy products with higher
durabilityreparability
bull Investigate further to what extent expected innovations and product
improvements play a role in the importance that consumers attach to the
durability and reparability of their products
bull Examine further the drivers of consumersrsquo desire for new products This study
revealed that for a similar level of effort many consumers prefer a buying new
186 For more information see httpsusprocjrceceuropaeuScoringSystemOnReparabilityindexhtml
Behavioural Study on Consumersrsquo Engagement in the Circular Economy
190
products over second hand leased or repaired products even when the price of
second hand products or a repair were considerably lower than that of a new
product A question for further research is how to identify the reasons behind this
preference and investigate whether there are ways to influence this preference
842 Research gaps relevant to the development of policy instruments to
stimulate engagement of the consumer in the Circular Economy
There are a range of ways that policy makers can promote the engagement of consumers
in the Circular Economy Several policy recommendations have been made above based
on the findings of this study To ensure the effective implementation of these
recommendations further research is advised
How to best provide durability and reparability information at the point of sale
The provision of durability and reparability information can improve consumer
engagement in the Circular Economy However how information is presented is
extremely important in terms of consumersrsquo understanding and use of the information in
their decisions Therefore further research on how to best present durability and
reparability information would ideally be undertaken For example
bull Which iconssymbols are best understood and used by consumers
bull How does consumer understanding of durability and reparability change with
increasing complexity of the remaining product information In other words when
do information overload and cognitive limitations come into play leading to a
decline in consumer understanding and engagement
Consumer price sensitivity for repairs
This study has identified important drivers and barriers of consumersrsquo decisions to repair
products Consumers are less likely to repair when repairing requires more or even a
similar amount of effort compared to replacing And consumers seem to be more inclined
to repair when repairing is substantially cheaper than buying a replacement However
there is limited information on consumersrsquo price responsiveness to changes in the cost of
repairing products If price-based mechanisms were to be considered by policy makers to
further incentivise repairs this information would be important
Reducing other barriers to repair
Beyond assessing how sensitive consumers are to the price of repair generally making it
easier to repair products may go some way towards boosting repairs According to this
study some options to pursue could be to increase the availability of spare parts and to
provide consumers with the ability to self-repair more easily However these may not be
the only barriers to repair Other factors such as lack of trust in repaired products or the
desire for new products may continue to prevent people from choosing to repair
Further investigation into what drives consumer choice in this area and whether
improving ease of access to repair will increase the number of consumers who choose to
repair could be undertaken For example policy makers could consider running small-
scale pilot projects to test the effect of increased ease of repair on the frequency at
which consumers choose to repair products
Impact assessments of new policy toolsamendments of existing policy instruments
As mentioned before most of the recommendations developed in this study relate to
policy initiatives that are new which means experience with the impact of such policies is
limited or non-existent Also some of the suggested interventions can have far-reaching
effects on consumers manufacturers and retailers and it is therefore important to assess
whether the intended policy instruments are proportional effective and efficient An ex-
ante impact assessment should be conducted for all policy recommendations requiring a
legislative change Below we highlight some aspects to which particular attention should
be paid
To stimulate product repair Recommendation 2 suggests increased availability of spare
parts and repair services This recommendation also suggests encouraging
manufacturers to commit to repair during the entire technical lifetime of the product
However such measures could have repercussions for the costs of manufacturers and
Behavioural Study on Consumersrsquo Engagement in the Circular Economy
191
retailers and may have an impact on the final price for consumers Therefore it is
important to carefully assess the financial implications of such measures against
the potential benefits achieved
Another essential element that needs to be assessed is the environmental impact of
promoting product repair or the purchasing of more durable products It is
important that Circular Economy actions are a means to achieving lower environmental
impacts and do not become a goal in itself For some products it might be very beneficial
to use them for as long as possible as the environmental impact of the production phase
is large and the materials used in the product are hardly recycled For other products
especially products that consume a lot of energy during their use phase it might be more
beneficial to replace them earlier in their lifetime This is because the use phase has a
larger effect on the overall environmental impact than the production phase and new
products might be more energy efficient In such cases replacement could be preferable
over repair It is important that this kind of information is considered when designing
policy instruments that promote durability and reparability Therefore the environmental
impacts of promoting the durability and reparability of products should be tested for
different product categories (for example using a life-cycle assessment) so that policies
promoting durability and reparability are only applied to the cases where this leads to a
reduction in the overall product environmental footprint
Behavioural Study on Consumersrsquo Engagement in the Circular Economy
192
Glossary and definitions
Country codes
AT Austria
BE Belgium
BG Bulgaria
HR Croatia
CY Cyprus
CZ Czech Republic
DK Denmark
EE Estonia
FI Finland
FR France
DE Germany
EL Greece
HU Hungary
IE Ireland
IT Italy
LV Latvia
LT Lithuania
LU Luxembourg
MT Malta
NL Netherlands
PL Poland
PT Portugal
RO Romania
SK Slovakia
SI Slovenia
ES Spain
SE Sweden
UK United Kingdom
IS Iceland
NO Norway
Abbreviations used
Chafea Consumers Health Agriculture and Food Executive Agency
B2C Business-to-consumer
CE Circular Economy
DGs Directorate Generals
EC European Commission
IoT Internet of Things
NGO Non-governmental organization
OEF Organisation Environmental Footprint
P2P Peer-to-peer
PET Product Environmental Footprint
PSS Product-service-systems
Definitions
Circular Economy In a Circular Economy the value of products and materials is
maintained for as long as possible waste and resource use are
minimised and resources are kept within the economy when a
product has reached the end of its life to be used again and
again to create further value (see
httpseceuropaeugrowthindustrysustainabilitycircular-
economy_en)
Durability It was one of the study objectives to find out what consumers
Behavioural Study on Consumersrsquo Engagement in the Circular Economy
193
associate with the concept of lsquodurabilityrsquo
In the behavioural experiment the following definition was
attached to the durability icon used on mock-EU Energy and EU
Ecolabels
The period in which the manufacturer promises to
replace or repair the product free of charge
For the stakeholder consultations the following working
definition for ldquoDurability informationrdquo was used
Information about the averageexpected or minimum
lifespan of products before they defect or break
Reparability
It was one of the study objectives to find out what consumers
associate with the concept of lsquoreparabilityrsquo In the behavioural
experiment the following definition was attached to the
durability icon used on mock-EU Energy and EU Ecolabels
Ease-of-repair rating based on availability of repair
manuals spare parts and repair services
For the stakeholder consultations the following working
definition for ldquoReparability informationrdquo was used
All types of information that could be relevant to repair
products in case of a defect
Legal guarantee EU law (Directive 199944EC) stipulates that sellers are liable
to consumers for any lack of conformity (defect) that existed at
the time of delivery and becomes apparent with a 2-year period
(legal guarantee) In some countries national law provide for
longer periods for sellerrsquos liability
Commercial guarantee
(warranty)
Manufacturers retailers (or insurers) can offer consumers
commercial guarantees (warranties) in addition to the legal
guarantee of the seller of the goods These can either be
included in the price of the product or at an extra cost Such
warranties are without prejudice to the legal guarantee
Behavioural Study on Consumersrsquo Engagement in the Circular Economy
194
Bibliography
Abramovski et al(2017) lsquoRedistribution efficiency and the design of VAT a review of
the theory and literaturersquo Institute for Fiscal Studies Available at
httpswwwifsorgukuploadspublicationsbnsBN212pdf
ADEME (2014)a lsquoEvolutions du comportement des Franccedilais face au deacuteveloppement
de leacuteconomie circulaire Paris ADEMErsquo Available at
httpwwwademefrsitesdefaultfilesassetsdocumentsadm00013585_evolutions
_comportement_des_francais_face_au_developpement_economie_circulaire_juin_201
4pdf
ADEME (2014)b lsquoPerceptions et pratiques des franccedilais en matiegravere de reacuteemploi des
produitsrsquo Available at
httpswwwademefrsitesdefaultfilesassetsdocumentsetude-socio-reemploi-
2014-rapport-finalpdf
Adler L amp Hlavcek J D (1978) lsquoKey Repair Service Factors for Consumer Durable
Goods Journal of Marketing Researchrsquo 634-638 Available at
httpswwwjstororgstable3150636seq=1page_scan_tab_contents
AK Wien (2017) lsquoSmartphones are replaced more frequently than T-shirtsrsquo Available
at httpwwwakeuropaeu_includesmodsakeudocsmain_report_en_457pdf
Allcott (2011) lsquoSocial norms and energy conservationrsquo Journal of Public Economics
Available at
httpswwwsciencedirectcomsciencearticleabspiiS0047272711000478
Armstrong C M (2014) lsquoSustainable product-service systems for clothing exploring
consumer perceptions of consumption alternatives in Finlandrsquo Available at
httpswwwsciencedirectcomsciencearticlepiiS0959652614000596
Benthin R et al (2017) lsquoEnvironmental awareness in Germany 2016 ndash Results of a
representative population surveyrsquo Available at httpswwwconpolicydeennews-
detailenvironmental-awareness-in-germany-2016-results-of-a-representative-
population-survey
BEUC (2015) lsquoDurable goods More sustainable products better consumer rights -
Consumer expectations from the EUrsquos resource efficiency and Circular Economy
agendarsquo Available at httpwwwbeuceupublicationsbeuc-x-2015-
069_sma_upa_beuc_position_paper_durable_goods_and_better_legal_guaranteespd
f
Braitwate N Densley-Tingley D amp Moreno M (2015) lsquoShould energy labels for
washing machines be expanded to include a durability ratingrsquo Available at
httpirepntuacukideprint85461220134_PubSub2377_Morenopdf
Bruumlggenwirth B amp Witte E (2016) lsquoPersbericht Dossier Duurzaam Duurzaamheid
bij consument in de lift Maarssen b-openrsquo Available at
httpwwwdossierduurzaamnlCms_DataContentsDossierDuurzaamDBMediapdfs
Persbericht-Dossier-Duurzaam-2016_defpdf
Cerdaacute E amp Khalilova A (2015) lsquoEconomiacutea Circularrsquo Available at
httpwwwminetadgobesPublicacionesPublicacionesperiodicasEconomiaIndustrial
RevistaEconomiaIndustrial401CERDC38120y20KHALILOVApdf
Coffmann et al (2017) lsquoCan Social Information Affect What Job You Choose and
Keeprsquo American Economic Journal Applied Economics Available at
httpswwwaeaweborgarticlesid=101257app20140468
Cox J Herren S King G amp Knight T (2013) lsquoElectrical and electronic product
design product lifetimersquo Available at httpwwwbrooklyndhurstcoukelectrical-
and-electronic-product-design-product-lifetime-_271html
Della Vigna (2009) lsquoPsychology and Economics Evidence from the Fieldrsquo Journal of
Economic Literature Available at
httpswwwaeaweborgarticlesid=101257jel472315
Digital Europe (2017) lsquoThe contribution of the Digital Industry to repair
remanufacturing and refurbishment in a Circular Economyrsquo Available at
httpwwwdigitaleuropeorgDesktopModulesBring2mindDMXDownloadaspxCom
mand=Core_DownloadampEntryId=2397amplanguage=en-USampPortalId=0ampTabId=353
Deloitte (2017) lsquoExpert workshop towards increased repair of household EEErsquo
Dufwenberg Gaumlchter Henning-Schmitdt (2011) lsquoThe framing of games and the
psychology of playrsquo Games and Economic Behavior Available at
httpswwwsciencedirectcomsciencearticlepiiS0899825611000376
Behavioural Study on Consumersrsquo Engagement in the Circular Economy
195
Duvall L McIntyre K amp Opsomer T (2016) lsquoEmpowering Repairrsquo Available at
httpswwwellenmacarthurfoundationorgassetsdownloadsce100Empowering-
Repair-Final-Public1pdf
Economische en Sociale Raad (2015) lsquoAdvies Overgang van het Brussels
Hoofdstedelijk Gewest naar de kringloopeconomiersquo
European Economic and Social Committee (2016) lsquoThe Influence of Lifespan Labelling
on Consumersrsquo Brussels European Economic and Social Committee Available at
httpwwweesceuropaeuresourcesdocsqe-04-16-076-en-npdf
European Commission (2012) lsquoResearch on EU product label options - Study delivered
by Ipsos MORI London Economics and AEArsquo available at
httpseceuropaeuenergysitesenerfilesdocuments2012-12-research-eu-
product-label-optionspdf
European Commission (2013) lsquoCommission staff working document Impact
Assessment Accompanying the Commission Regulation implementing Directive
2009125EC and the Commission Delegated Regulation supplementing Directive
201030EUrsquo Brussels European Commission
European Commission (2013) lsquoReduced rates of VAT frequently asked questions
MEMO03149rsquo Available at httpeuropaeurapidpress-release_MEMO-03-
149_enhtmlocale=en
European Commission (2017) lsquoStudy on consumersrsquo decision-making in insurance
services A behavioural economics perspectiversquo Available at
httpspublicationseuropaeuenpublication-detail-publicationb86d7f2d-9e77-
11e7-b92d-01aa75ed71a1language-enformat-PDFsource-search
European Commission (2003) lsquoProposal for a Council Directive amending Directive
77388EEC as regards reduced rates of value added taxrsquo COM(2003) 397 final
Available at httpeceuropaeutransparencyregdocrep12003EN1-2003-397-
EN-F1-1Pdf
European Commission DG Environment (2014) lsquoScoping study to identify potential
Circular Economy actions priority sectors material flows and value chainsrsquo Available
at httpswwweesceuropaeuresourcesdocsscoping-studypdf
European Commission DG JUSTCivic Consulting (2017) lsquoStudy for the Fitness Check
of EU consumer and marketing lawrsquo Available at
httpspublicationseuropaeuenpublication-detail-publicationf7b3958b-772b-
11e7-b2f2-01aa75ed71a1language-en
European Commission DG JUSTGfK (2017) lsquoConsumer Market Study to support the
Fitness Check of Consumer Rulesrsquo Available at
httpeceuropaeunewsroomjustitem-detailcfmitem_id=59332
European Commission Joint Research Centre (2018) lsquoGuide for the Assessment of
Material Efficiency application to smartphonesrsquo Available at
httpsusprocjrceceuropaeuE4CdocsJRC_report_smartph_v23_CLEANpdf
European Commission Joint Research Centre (2017)a lsquoAnalysis of the Future
Direction and Policy Needs of European Industryrsquo Available at
httpseceuropaeujrccommunitiescommunity248about
European Commission Joint Research Centre (2017)b lsquoEcodesign and Energy Label
for Household Dishwashers Luxembourg Publications Office of the European Unionrsquo
Available at httppublicationsjrceceuropaeurepositoryhandleJRC106993
European Commission Joint Research Centre (2018)a Assessment of the reparability
and upgradability of TVs (Draft) retrieved from
httpsusprocjrceceuropaeuE4CdocsJRC_report_TV_repair_v2-2_CLEANpdf
European Commission Joint Research Centre (2018)b Guide for the Assessment of
Material Efficiency application to smartphones (Draft) retrieved from
httpsusprocjrceceuropaeuE4CdocsJRC_report_smartph_v23_CLEANpdf
European Environment Agency (2017) lsquoCircular by design Products in the Circular
Economyrsquo Available at
httpscirculareconomyeuropaeuplatformsitesdefaultfilescircular_by_design_-
_products_in_the_circular_economypdf
European Parliament (2016) lsquoCircular Economy package four legislative proposals on
wastersquo Available at httpwwweuroparleuropaeuEPRSEPRS-Briefing-573936-
Circular-economy-package-FINALpdf
Behavioural Study on Consumersrsquo Engagement in the Circular Economy
196
Experian (2014) lsquoAn estimate of the effects of a reduction in the rate of VAT on
housing renovation and repair work 2015 to 2020rsquo
Federal Environment Agency (2017) lsquoObsolescence - Political strategies for improved
durability of productsrsquo Available at
httpswwwumweltbundesamtdesitesdefaultfilesmedien376dokumente2017-
06-01_obsolescence_scientific_opinion_paper_german_environment_agencypdf
French Packaging Council (2014) lsquoPackaging amp Circular Economyrsquo Available at
httpscirculareconomyeuropaeuplatformsitesdefaultfilespackaging-and-
circular-economy-final-report-en-september-2014pdf
Fernandez V (2001) lsquoObservable and unobservable determinants of replacement of
home appliancesrsquo Available at
httpswwwsciencedirectcomsciencearticlepiiS0140988300000669
French Ministry of Ecology Sustainable Development and Energy (2014) lsquoLeacuteconomie
circulaire eacutetat des lieux et perspectivesrsquo Available at
httpwwwladocumentationfrancaisefrvarstoragerapports-publics154000005pdf
Haze B Overstreet R amp Jones-Farmer A (2011) lsquoThe role of ambiguity tolerance
in consumer perception of remanufactured productsrsquo Available at
httpwwwtandfonlinecomezproxyulbacbedoipdf102752175630611X1309168
8930453
ICF (2017) lsquoStudy on the costs and benefits of extending certain rights under the
Consumer Sales and Guarantees Directive 199994ECrsquo Available at
httpeceuropaeunewsroomdocumentcfmdoc_id=44803
Lakatos E-S Crisan O-A LakatosS D-G Bejan M (2017) lsquoParadigma economiei
circulare O provocare pentru orasul inteligent Available at
httpwwwagirrobuletine2847pdf
Larrick Soll (2008) lsquoThe MPG Illusionrsquo Science Available at
httpsciencesciencemagorgcontent32058831593
Leboucq V (2016) lsquoSEB promet de reacuteparer ses produits pendant dix ans Les Echosrsquo
Levin et al (1998) lsquoAll frames are not created equal A typology and critical analysis
of framing effectsrsquo Organizational Behavior and Human Decision Processes Available
at httpswwwsciencedirectcomsciencearticlepiiS0749597898928047
Liberman Samuels Ross (2004) lsquoThe name of the game predictive power of
reputations vs situational labels in determining Prisonerrsquos Dilemma game movesrsquo
Personality and Social Psychology Bulletin 30 Available at
httpjournalssagepubcomdoiabs1011770146167204264004
London Economics Ipsos amp AEA (2012) lsquoResearch on EU product label optionsrsquo
Available at httpseceuropaeuenergysitesenerfilesdocuments2012-12-
research-eu-product-label-optionspdf
London Economics amp Ipsos (2014) lsquoStudy on the impact of the Energy Label ndash and
potential changes to it ndash on consumer understanding and on purchase decisionsrsquo
Available at
httpseceuropaeuinfositesinfofilesimpact_of_energy_labels_on_consumer_beh
aviour_enpdf
London Waste and Recycling Board (2017) lsquoLondons Circular Economy Roadmap
London LWARBrsquo Available at httpwwwlwarbgovukwp-
contentuploads201504LWARB-LondonE28099s-CE-route-
map_16617a_singlepages_smlpdf
McCullough J (2009) lsquoFactors impacting the demand for repair services of household
products the disappearing repair trades and the throwaway societyrsquo Available at
httpsonlinelibrarywileycomdoiabs101111j1470-6431200900793x
McCullough J (2010) lsquoConsumer Discount Rates and the Decision to Repair or
Replace a Durable Product A Sustainable Consumption Issuersquo Available at
httpswwwjstororgstable40647716
Michaud C a (2011) lsquoGreen Consumer Behaviour an Experimental Analysis of
Willingness to Pay for Remanufactured Productsrsquo Available at
httpsonlinelibrarywileycomdoiabs101002bse703
OCU et al (2016) lsquoiquestCollaboration or business From value for users to a society with
valuesrsquo
Pijnenburg R (2014) lsquoInkoper als aanjager van circulaire economiersquo Available at
httpsmvonederlandnlsystemfilesmediawfg_wk7_p14-15pdf
Behavioural Study on Consumersrsquo Engagement in the Circular Economy
197
Ross Ward (1996) lsquoNaive realism in everyday life Implications for social conflict
and misunderstandingrsquo In Reed et al (Eds) Values and Knowledge
Salvia G Cooper T Fisher T Harmer L and Barr C (2015) lsquoWhat is broken
Expected lifetime perception of brokenness and attitude towards maintenance and
repairrsquo Available at httpirepntuacukideprint12817
SB Insight (2017) lsquoThe Nordic Market for Circular Economy a Report about Business
Leader and Consumer Views on Circular Economyrsquo Available at httpwwwsb-
insightcomcircular-economy
Schwarz (1999) lsquoSelf-reports How the questions shape the answersrsquo American
psychologist Available at
httppsycnetapaorgdoiLandingdoi=1010372F0003-066X54293
Smeesters D L (2003) lsquoConsumer Motivation to Recycle When Recycling is
Mandatory Two Exploratory Studies Tijdschrift voor Economie en Managementrsquo
Available at httpnsmn1uhedudgraurnivtheMPGIllusionpdf
SPF Santeacute publique Seacutecuriteacute de la chaicircne alimentaire et Environnement (2014) lsquoVers
une Belgique prionniegravere de leacuteconomie circulairersquo Available at
httpeconomiefgovbefrbinariesVers_une_Belgique_Pionniere_de_l_economie_cir
culaire_tcm326-259697pdf
Sunstein (2017) lsquoNudges that failrsquo Behavioural Public Policy Available at
httpswwwcambridgeorgcorejournalsbehavioural-public-policyarticlenudges-
that-fail8DE5FFFFB7DA5BE14F8DC1E3D2C0C0AA
Tansey R (2015) lsquoReduccioacuten de residuos el reciclaje no es suficiente para alcanzar
una economiacutea circular Madrid Amigos de la tierrarsquo Available at
httpswwwtierraorgwp-
contentuploads201507reduccion_residuos_economia_circularpdf
The Behavioural Insights Team (2015) lsquoEAST Four simple ways to apply behavioural
insightsrsquo available at httpwwwbehaviouralinsightscoukwp-
contentuploads201507BIT-Publication-EAST_FA_WEBpdf
The Scottisch Government (2016) lsquoMaking things last A Circular Economy strategy
for Scotland Edinburgh The Scottish Governmentrsquo Available at
httpwwwgovscotPublications2016021761downloadsres-1
TNS Political amp Social (2013) lsquoFlash Eurobarometer 367 Attitudes of Europeans
towards Building the Single Market for Green Productrsquo Brussels European
Commission Directorate-General for Communication Available at
httpeceuropaeucommfrontofficepublicopinionflashfl_367_enpdf
Tversky and Kahneman (1981) lsquoThe framing of decisions and the psychology of
choicersquo Science Available at httpsciencesciencemagorgcontent2114481453
UK Office for Fair Trading (2010) lsquoThe impact of price frames on consumer decision
makingrsquo Available at
httpwebarchivenationalarchivesgovuk20140402165040httpoftgovukshare
d_ofteconomic_researchOFT1226pdf
Umwelt Bundesamt (2017) lsquoDas Ecodesign-Kit als Lehrmaterial fuumlr Hochschulenrsquo
Available at
httpswwwumweltbundesamtdesitesdefaultfilesmedien1968dokumente07_k
ossolobow_das_ecodesign-kit_al_s_lehrmaterial_fur_hochschulenpdf
Verbraucherzentrale Bundesverband (2014) lsquoComprehensibility of the EU Energy
Label ndash Results of two focus groups and a representative consumer surveyrsquo Available
at httpswwwverbraucherzentrale-rlpdemedia231718A
Verbraucherzentrale Bundesverband (2017) lsquoVerbraucherbefragung Haltbarkeit und
Reparierbarkeitrsquo Berlin KANTAR EMNID Available at
httpwwwvzbvdesitesdefaultfilesdownloads20170601umfrage_-
_haltbarkeit_und_reparierbarkeit_von_produkten_o_gewaehrleistungpdf
Wang Y amp Hazen B (2016) lsquoConsumer product knowledge and intention to
purchase remanufactured productsrsquo Available at
httpwwwvzbvdesitesdefaultfilesdownloads20170601umfrage_-
_haltbarkeit_und_reparierbarkeit_von_produkten_o_gewaehrleistungpdf
Watson M (2008) lsquoA Review of literature and research on public attitudes
perceptions and behaviour relating to remanufactured repaired and reused productsrsquo
Available at httpwwwremanufacturingorgukpdfstory1p143pdf
Behavioural Study on Consumersrsquo Engagement in the Circular Economy
198
Westblom C (2015) lsquoTowards a Circular Economy in Sweden - Barriers for new
business models and the need for policy interventionrsquo Available at
httpluplubluseluurdownloadfunc=downloadFileamprecordOId=8170322ampfileOId=
8170379
Wieser H amp Troumlger N (2012) lsquoDie Nutzungsdauer und Obsolenz von
Gebrauchsguumltern im Zeitalter der Beschleunigung Vienna Arbeiterkammer Wienrsquo
Available at
httpsmediaarbeiterkammeratwienPDFstudienBericht_Produktnutzungsdauerp
df
Wilhelm W B (2012) lsquoEncouraging Sustainable Consumption through Product
Lifetime Extension The Case of Mobile Phonesrsquo Available at
httpijbssnetcomjournalsVol_3_No_3_February_20122pdf
WRAP (2012) lsquoValuing our clothes The true cost of how we design use and dispose
of clothing in the UKrsquo Available at
httpwwwwraporguksitesfileswrapVoC20FINAL20online2020122007
2011pdf-CEIP-report-Designing-for-a-Circular-Economypdf
WRAP (2013) lsquoElectrical and electronic product design product lifetimersquo Available at
httpwwwbrooklyndhurstcoukelectrical-and-electronic-product-design-product-
lifetime-_271html
WRAP (2017) lsquoSustainable clothing A practical guide to enhancing clothing durability
and qualityrsquo Available at httpwwwwraporguksustainable-textilesscapextending-
clothing-lifeguidessustainable-clothing-guide
Behavioural Study on Consumersrsquo Engagement in the Circular Economy
199
Behavioural Study on Consumersrsquo Engagement in the Circular Economy
200
Behavioural Study on Consumersrsquo Engagement in the Circular Economy
HOW TO OBTAIN EU PUBLICATIONS
Free publications
bull one copy
via EU Bookshop (httpbookshopeuropaeu)
bull more than one copy or postersmaps
from the European Unionrsquos representations (httpeceuropaeurepresent_enhtm)
from the delegations in non-EU countries
(httpeeaseuropaeudelegationsindex_enhtm)
by contacting the Europe Direct service (httpeuropaeueuropedirectindex_enhtm)
or calling 00 800 6 7 8 9 10 11 (freephone number from anywhere in the EU) () () The information given is free as are most calls (though some operators phone boxes or hotels may charge you)
Priced publications
bull via EU Bookshop (httpbookshopeuropaeu)
doi102818956512
EB-0
4-1
8-4
98-E
N-N

Behavioural Study on Consumersrsquo Engagement in the Circular Economy
EUROPEAN COMMISSION
Directorate-General for Justice and Consumers
Directorate E - Consumers
Unit E1 - Consumer Policy
Contact Jeroen Van Laer
E-mail JeroenVAN-LAEReceuropaeu
European Commission B-1049 Brussels
EUROPEAN COMMISSION
Directorate-General for Justice and Consumers
2018
Behavioural Study on Consumersrsquo Engagement in
the Circular Economy Final Report
Prepared by LE Europe VVA Europe Ipsos ConPolicy
and Trinomics
October 2018
EUROPEAN COMMISSION
Directorate-General for Justice and Consumers
2018
Authors
Dr Annette Cerulli-Harms (LE Europe)
James Suter (LE Europe)
Wouter Landzaat (LE Europe)
Dr Charlotte Duke (LE Europe)
Adriana Rodriguez Diaz (VVA Europe)
Lucas Porsch (VVA Europe)
Timotheacute Peroz (VVA Europe)
Dr Sara Kettner (ConPolicy)
Prof Dr Christian Thorun (ConPolicy)
Katarina Svatikova (Trinomics)
Jurgen Vermeulen (Trinomics)
Tycho Smit (Trinomics)
Femke Dekeulenaer (Ipsos)
Elena Lucica (Ipsos)
We would like to acknowledge the useful guidance and input provided during this
research by Prof Lucia Reisch (Copenhagen Business School) Prof Bodo Sturm (Leipzig
University of Applied Sciences) and Marta Ballesteros (Milieu Law amp Policy Consulting)
We furthermore acknowledge the helpful guidance received from the European
Commission departments involved such as Justice and Consumers Environment and the
Joint Research Centre (especially unit JRC I2 Foresight Behavioural Insights and Design
for Policy) We would also like to thank all the interviewed stakeholders for their
informative responses
Behavioural Study on Consumersrsquo Engagement in the Circular Economy
5
ldquoThis report was produced under the Consumer Programme (2014-2020) in the frame of a contract with CHAFEA acting on behalf of the European Commission The content of this report represents the views of LE Europe VVA Europe Ipsos ConPolicy Trinomics and is its sole responsibility it can in no way be taken to reflect the views of the European Commission andor CHAFEA do not guarantee the accuracy of the data included in this report nor do they accept responsibility for any use made by third parties thereofrdquo
More information on the European Union is available on the Internet (httpeuropaeu)
Luxembourg Publications Office of the European Union 2018
copy European Union 2018
Reproduction is authorised provided the source is acknowledged
PRINTED IN
PRINTED ON ELEMENTAL CHLORINE-FREE BLEACHED PAPER (ECF)
PRINTED ON TOTALLY CHLORINE-FREE BLEACHED PAPER (TCF)
PRINTED ON RECYCLED PAPER
PRINTED ON PROCESS CHLORINE-FREE RECYCLED PAPER (PCF)
Europe Direct is a service to help you find answers
to your questions about the European Union
Freephone number ()
00 800 6 7 8 9 10 11
() The information given is free as are most calls (though some operators phone boxes or hotels may charge you)
Project Number 20183140
Title Behavioural Study on Consumers Engagement in the Circular Economy - Final report
Linguistic version
MediaVolume Catalogue number ISBN DOI
EN PDF PDFVolume_01 EB-04-18-498-EN-N 978-92-9200-885-7 102818956512
Behavioural Study on Consumersrsquo Engagement in the Circular Economy
6
TABLE OF CONTENTS
EXECUTIVE SUMMARY 9
1 INTRODUCTION AND BACKGROUND 14
11 Policy context 14
12 Objectives of the study 16
METHODOLOGY 18
2 METHODOLOGY 19
21 Country selection 19
22 Product selection 21
23 Methodology for the literature review and desk research 22
24 Methodology for the stakeholder interviews 23
25 Methodology for the focus groups 26
26 Methodology for the consumer survey 27
27 Methodology for the behavioural experiment 30
EVIDENCE AND FINDINGS 46
3 CONSUMERSrsquo WILLINGNESS TO ENGAGE IN THE CIRCULAR ECONOMY 47
31 Evidence from the literature and data collection 48
32 Evidence from the stakeholder interviews 51
33 Evidence from the focus groups 53
34 Evidence from the consumer survey 55
4 DRIVERS BARRIERS AND TRADE-OFFS FACED BY CONSUMERS 65
41 Evidence from the literature and data collection 68
42 Evidence from the stakeholder interviews 74
43 Evidence from the focus groups 78
44 Evidence from the consumer survey 81
45 Evidence from the behavioural experiment 95
5 CONSUMERSrsquo AWARENESS UNDERSTANDING AND EXPECTATIONS ON DURABILITY AND REPARABILITY 110
51 Evidence from the literature and data collection 112
52 Evidence from the stakeholder interviews 114
53 Evidence from the focus groups 116
54 Evidence from the consumer survey 118
6 DURABILITY AND REPARABILITY INFORMATION AND ITS POTENTIAL ROLE IN CONSUMERSrsquo DECISION-MAKING 128
61 Evidence from the literature and data collection 130
62 Evidence from the stakeholder interviews 136
63 Evidence from the focus groups 138
64 Evidence from the consumer survey 140
65 Evidence from the behavioural experiment 155
CONCLUSIONS AND SUGGESTIONS FOR FUTURE POLICY ACTION 173
7 OVERALL CONCLUSIONS 174
71 Understanding consumer engagement in the Circular Economy 175
72 Factors influencing consumer decision-making in the Circular Economy 177
8 SUGGESTIONS FOR FUTURE POLICY ACTION 183
81 Boosting CE engagement by strengthening pro-environmental attitudes and awareness 184
82 The importance of price quality and convenience in purchasing and repair decisions 186
Behavioural Study on Consumersrsquo Engagement in the Circular Economy
7
83 Enhancing product information on durability and reparability 188
84 Suggestions for further research 189
GLOSSARY AND DEFINITIONS 192
BIBLIOGRAPHY 194
Behavioural Study on Consumersrsquo Engagement in the Circular Economy
9
Executive summary
Objectives
In 2017 LE Europe VVA Ipsos ConPolicy and Trinomics were commissioned by the
European Commission to conduct a behavioural study on consumersrsquo engagement in the
Circular Economy (CE) The objective was to provide policy-relevant insights to assist
with the implementation of the EU Circular Economy Action Plan
The study sought to
1 Identify barriers and trade-offs faced by consumers when deciding whether to
engage in the CE in particular whether to purchase a more or a less durable
good whether to have a good repaired or to discard it and buy a replacement
2 Establish the relative importance of economic social and psychological factors
that govern the extent to which consumers engage in the CE especially
purchasing durable products and seeking to repair products instead of disposing of
them and
3 Propose policy tools to enable and encourage consumers to engage in CE practices
related to durability and reparability
Methodology
The study mainly focussed on the following five products vacuum cleaners
televisions dishwashers smartphones and clothes
A systematic literature review was carried out across all 28 EU Member States
Norway Iceland Switzerland Japan Canada and the USA1 This review was
complemented by insights collected through 50 interviews with stakeholders from
eg business and consumer associations NGOs public authorities and academia and
consumer focus groups with the general public and potentially vulnerable consumer
groups in 4 countries2 These activities contributed towards the results of the study and
informed the design of an online consumer survey and behavioural experiment
conducted in respectively 12 and 6 countries with 12064 and 6042 respondents who
were representative of the general population for each country in terms of age gender
and geographic region3
The survey collected information on consumersrsquo experiences with CE practices such as
repairing renting leasing and purchasing second hand products their reasons behind
engaging in the CE (or not) as well as general socio-demographic characteristics and
self-declared attitudes towards the CE
The behavioural experiment contained two tasks a purchasing and a repair experiment
Both experiment tasks were financially incentivised for enhanced realism and external
validity
The purchasing experiment tested different forms of durability and reparability
information and their effects on consumersrsquo product choices The following treatments
were tested lsquomanufacturer warrantiesrsquo and lsquoexpected lifetimersquo claims durability
commitments and reparability ratings included in the EU Energy and Ecolabels using
novel icons4 Additionally the effects of behaviourally motivated lsquonudgesrsquo via claims such
1 Literature was reviewed in English German (AT DE) Czech French (FR LU BE) Hungarian Dutch (NL BE) Romanian and Spanish
2 Two groups were conducted in each of CZ DE IE and SE One group was held with participants from the general public the other with potentially vulnerable consumers (people who struggle or are in arrears with bills and are unemployed retired long-term sick or disabled or single parents)
3 The online consumer survey was conducted in AT CZ FR DE HU IE LV NL PT RO ES and SE The behavioural experiment was embedded in the survey in CZ DE IE RO ES and SE
4 lsquoManufacturer warrantyrsquo and lsquoExpected lifetimersquo were not explained or defined further in the experiment
Behavioural Study on Consumersrsquo Engagement in the Circular Economy
10
as lsquoProducts that last longer may save you money over timersquo and lsquoA majority of people
choose products that last longer and are easier to repairrsquo were tested
The repair experiment confronted respondents with a broken product for which they
could decide whether to have it repaired or to replace it with either a brand new or
second hand product The experimental conditions tested how the trade-offs between
repairing and replacing were affected by a real effort task which increased the effort
required to respectively repair or replace and framing effects of the repair option
Behavioural experiments allow the isolation of the drivers of consumer choice and are
widely used by policy makers internationally to test information provision on consumer
decision-making Experiments are necessarily simplifications of the real world as such
the findings of the experiment should be viewed in conjunction with the experimental
set-up which consisted of a simplified process with streamlined and standardised product
information
Findings and conclusions
In brief all strands of research found that consumers were generally willing to engage
in CE practices But actual engagement was rather low While a majority of
consumers repair products (64) a substantial share have not repaired products in
the past (36) andor have no experience rentingleasing or buying second hand
products (~90) A reason for this low engagement in CE practices could be that
consumers lack information regarding product durability and reparability as well as
the lack of sufficiently developed markets (eg for second hand products renting
leasing or sharing services etc) In the behavioural experiment the provision of such
information was found to be highly effective at shifting purchasing decisions
towards products with greater durability and reparability The survey and experiment
also found that repair decisions are easily disrupted if arranging repair requires
effort These findings indicate that there is a large potential to close the gap between
consumersrsquo willingness to engage and their actual engagement
Understanding consumer engagement in the Circular Economy
Survey respondents reported that they keep things they own for a long time (93)
recycle unwanted possessions (78) and repair possessions if they break (64) A
minority yet still sizable share (10-25) of survey respondents were interested in
engaging with novel CE practices such as leasing products instead of purchasing them
The study uncovered a high level of consistency between self-reported pro-CE
attitudes in the survey and actual behaviour in the monetarily incentivised
behavioural experiment Consumers who self-claimed having pro-CE attitudes were
also more likely to repair products in the experiment or to buy second hand rather than
brand new products
The different research methods showed that interest in product durability and
reparability was generally higher for large and expensive products (eg white
goods) and slightly lower for fashion items (eg clothes smartphones) For fashion
products there was however a higher willingness to buy second hand (clothes
smartphones) or to rent or lease such products (smartphones)
Consumer expectations and experiences with durability and reparability
All research methods found that consumers most associate durability with product
quality and reparability was most associated with availability of spare parts
Reparability was throughout the study found to be less important to consumers than
durability According to the survey this is because consumers trust manufacturer
warranties and would not expect durable products to break
Durability on EU labels was defined as The period in which the manufacturer promises to replace or repair the product free of charge
Reparability on EU labels was defined as Ease-of-repair rating based on availability of repair manuals spare parts and repair services
Behavioural Study on Consumersrsquo Engagement in the Circular Economy
11
The study did not find overwhelming evidence of a lsquothrowaway economyrsquo Across all
products a majority of survey respondents (~60) reported having repaired
products in the past Repairs were mostly done by professionals (26 repair services
17 manufacturers) but to some extent also by friendsfamily (8)) Self-repair was
less frequent but still substantial especially for clothes (12) Overall people were
happy with professional repair services Over 70 had their expectations in terms of
convenience speed quality and friendliness of the repair met or even exceeded
These findings seem to dispel perceptions that consumers are marked by negative
experiences with repair services which were reported by several stakeholders
A joint analysis of the behavioural experiment and survey revealed that consumers who
have received durability information via manufacturer warranties or durability
promises at the point of sale in a purchasing exercise were significantly more likely
to expect free replacement or free repairs of faulty products Instead those who
had not seen such information were significantly less likely to expect free repairs or
replacements and instead expected to pay for these services
Drivers barriers and trade-offs faced by consumers
It emerged clearly from the different strands of research that the price-quality ratio is
the most important driver and simultaneously barrier for consumer engagement in
the CE followed by convenience Many consumers were willing to pay more for
products with better durability and reparability but can be persuaded by low prices to
disregard CE credentials Similarly when replacement is more convenient than repairing
consumers are easily led to purchase new products This was especially pronounced for
consumers with a preference for new trends and technology However only about one in
ten consumers in the survey reported having strong preferences for new trends and
technology
The study found that repairing is popular but not ubiquitous Most consumers who did not
repair expected repairs to be too expensive (25-50 across products) preferred getting
a new product (17-25) or felt the old product was obsolete or out of fashion (20-
30) Some (5-10) however felt they did not know howwhere to repair products or
that it would be too much effort to repair (8-14)
In the online behavioural experiment 62-83 (depending on the product type) of
respondents chose to repair rather than replace products But repairs became less
frequent when additional effort was required to arrange the repair while an identical
level of effort left motivations to replace products unaffected Beyond convenience
marketing practices which increase the salience of repair had only a limited effect on
consumer decisions in the experiment Moreover consumers in the experiment were
indifferent to use repair services offered by manufacturers or independent repair shops
Effects of product information on purchasing decisions
Many consumers claimed they were aware of the durability and reparability of
products they had purchased yet the study uncovered that CE product information
(ie information on durability and reparability of products) was in fact difficult to find
and consumers wanted to receive better information
Evidence from the literature review stakeholder interviews focus groups and
experiment showed that improved information provision at the point of purchase (eg on
EU labels or provided by manufacturers) was effective at promoting CE behaviours
amongst consumers When respectively durability or reparability information was
provided in the experiment consumers were almost three times more likely to
choose products with the highest durability on offer and more than two times
more likely to choose products with the highest reparability ratings General CE
preferences were strongest when durability and reparability information was presented
together That is when durability and reparability information was shown together on the
product label individuals were most likely to purchase products which rated highly in
both dimensions ndash durability and reparability Durability was again clearly the more
influential factor These shifts in product choice resulted from consumers turning away
from low durabilityreparability products in favour of those with better CE credentials
Behavioural Study on Consumersrsquo Engagement in the Circular Economy
12
These findings are corroborated by consumersrsquo significant willingness-to-pay for
better durabilityreparability for all product categories Depending on how
durabilityreparability information was presented willingness-to-pay for an additional
year of durability ranged between euro20-36 for vacuum cleaners and dishwashers euro92-148
for TVs euro148-217 for smartphones5 and euro14-27 for coats Willingness-to-pay for an
improved reparability6 rating was around euro29-54 for vacuum cleaners euro83-105 for
dishwashers euro77-171 for TVs euro48-98 for smartphones and euro10-30 for coats
lsquoNudgesrsquo informing consumers of the benefits and social norms of buying
durablerepairable products increased the saliency of CE characteristics and triggered
shifts in preferences towards more durablerepairable products
Suggestions for future policy action
The study makes recommendations as outlined below to further enhance consumer
engagement in the CE
Recommendation 1 ndash Boosting CE engagement by strengthening pro-environmental
attitudes and awareness Environmental awareness and positive attitudes towards
environmentally favourable practices like buying second hand products and repairing
products were found to be key determinants for sustainable consumer choices From
the study follow at least three specific areas of action which could be taken by policy
makers and industry
o Boosting pro-environmental attitudes One way this could be done is by
focussing on educating young people by for example including
environmental awareness education within school curricula
o Increasing consumer awareness of second hand rentingleasing and repair
markets Recently there has been an increase in the number of CE
initiatives such as repair cafeacutes Similar initiatives could be promoted for
second hand products renting leasing of products
o Promoting benefits of durability and reparability According to the study
findings it would be beneficial to link durable and easily repairable products
with lsquohigh-qualityrsquo and lsquocost-savingsrsquo in the long-term Instilling such
associations with durability and reparability could alter social norms
towards the purchase of more durable and more easily repairable products
Recommendation 2 ndash Making repair easier Consumers are generally willing to
repair broken products yet their intentions can easily be tainted if repair is viewed as
too much effort compared to simply replacing the product Repair could be made
easier for example by
o Making essential product components replaceable by consumers
o Including repair instructions for minor defects in user manuals o Ensuring the availability of spare parts in the longer run For example by
requiring manufacturers to provide spare parts for a defined time period
(and also after a product has been discontinued)
o Encouraging manufacturers to offer a commitment to repair Commitments
could function in a similar way to manufacturer guarantees The study
found consumers have high trust in these guarantees and they are more
likely to seek repair of a product if it is covered by guarantee
Recommendation 3 ndash Create financial incentives for reparability and durability
Building on the importance of price in consumer decision-making fiscal instruments
providing economic incentives to producers and consumers to produce and
5 Willingness-to-pay for additional durability of smartphones was measured in months and subsequently extrapolated to years A linear relationship between time and willingness-to-pay was assumed (ie each extra month has the same value)
6 The willingness-to-pay was measured per year for durability and per two-step increase on the A-G scale for reparability(eg from G to E C to A)
Behavioural Study on Consumersrsquo Engagement in the Circular Economy
13
purchaserentlease durable products or to repair could enhance CE engagement
However further consumer research would be required to determine if there is
sufficient price sensitivity in consumers for such stimuli to be effective
Recommendation 4 - Making durability and reparability information available at the
point of sale The study showed that consumers lack durability and reparability
information and that the provision of such information is potentially very influential on
purchasing decisions Therefore the following options should be explored
o Integrate durability and reparability information into existing (EU) labels
o Develop new EU rules for this purpose
o Examine the development of a scoring system for reparability of products7
o Provide information to consumers on the availability of spare parts and
repair services
Recommendation 5 ndash Strengthened enforcement of legislation requiring the
provision of accurate information to consumers The provision of information not
only needs to be presented in a way that consumers can understand and effectively
use in their decision-making but it also needs to be accurate In order to ensure the
accurate provision of information to consumers at the point of sale continued and
strengthened enforcement of national consumer laws (such as on unfair commercial
practices) is of great importance to support consumers in their choices surrounding
engagement in the Circular Economy
7 For more information see httpsusprocjrceceuropaeuScoringSystemOnReparabilityindexhtml
Behavioural Study on Consumersrsquo Engagement in the Circular Economy
14
1 Introduction and background
The purpose of this behavioural study on consumersrsquo engagement in the Circular
Economy was to provide policy-relevant insights to assist with the implementation of the
EU Circular Economy Action Plan especially an analysis of options and actions for a more
coherent policy framework for the different work elements in the area of EU product
policy in their contribution to the Circular Economy In particular the study informed the
durability and reparability aspects of the Ecodesign and Energy Labelling framework (as
set out in the Ecodesign Working Plan 2016-2019)
11 Policy context
Action on the circular economy ties in closely with key EU priorities including jobs and
growth the investment agenda climate and energy the social agenda and industrial
innovation and with global efforts on sustainable development8 Although the European
commitment to a transition to the Circular Economy is relatively recent it is now
regarded as an essential contribution to the EUrsquos efforts to develop a sustainable low
carbon resource efficient and competitive economy9 Transition to a Circular Economy in
the EU was first promoted in a European Commission Communication ldquoTowards a
Circular Economyrdquo (COM2014398) in 2014
This was followed by the adoption of an ambitious Circular Economy Package in
December 2015 containing various elements to stimulate Europes transition towards a
Circular Economy with resources used in a more sustainable way including revised
legislative proposals on waste and a comprehensive action plan ldquoClosing the loop - An EU
action plan for the Circular Economyrdquo (COM20150614 Final) The proposed plans and
actions are expected to contribute to ldquoclosing the looprdquo of product lifecycles through
greater recycling and re-use while also fostering energy saving and reducing greenhouse
gas emissions
The Circular Economy Package established a clear long-term vision to increase recycling
and reduce landfilling while proposing concrete measures to address obstacles on the
ground to improve waste management and taking into account the different situations
across Member States The following are relevant in this regard10
Directive of The European Parliament and of The Council amending Directive
200898EC on Waste11
Proposed Directive on the landfill of waste (amending Directive 199931EC)12
Proposed Directive on packaging and packaging waste (amending Directive
9462EC)13
Directive on end-of-life vehicles on batteries and accumulators and waste batteries
and accumulators and on waste electrical and electronic equipment (amending
Directives 200053EC 200666 and 201219EU)14
The EU Action Plan for the Circular Economy15 establishes a concrete and ambitious
programme of action with measures covering the whole cycle from production and
8 COM20150614
9 European Commission Communication Towards a Circular Economy (COM2014398) in 2014
10 httpwwweuroparleuropaeuEPRSEPRS-Briefing-573936-Circular-economy-package-FINALpdf
11 httpseur-lexeuropaeulegal-contentENTXTPDFuri=CONSILPE_11_2018_REV_2ampfrom=EN
12 httpseur-lexeuropaeulegal-contentENTXTPDFuri=CELEX52015PC0594ampfrom=EN
13 httpseur-lexeuropaeuresourcehtmluri=cellarb68494d2-999f-11e5-b3b7 01aa75ed71a1001902DOC_1ampformat=PDF
14 httpwwweuroparleuropaeusidesgetDocdopubRef=-EPTEXT+TA+P8-TA-2018-
0113+0+DOC+XML+V0ENamplanguage=ENBKMD-9
15 European Commission Communication Closing the loop - An EU action plan for the Circular Economy (COM20150614 Final)
httpeur-lexeuropaeulegal-contentENTXTuri=CELEX52015DC0614
Behavioural Study on Consumersrsquo Engagement in the Circular Economy
15
consumption to waste management and the market for secondary raw materials An
annex to the Action Plan sets out the timeline of when the actions will be completed By
stimulating sustainable activity in key sectors and new business opportunities the Action
Plan is believed to help to unlock the growth and jobs potential of the Circular Economy
The transition to a Circular Economy will be supported financially by ESIF funding euro650
million from Horizon 2020 (the EU funding programme for research and innovation) euro55
billion from structural funds for waste management and investments in the circular
economy at national level16
One relevant initiative in the Action Plan timetable17 in the context of this study is to
ldquoexamine options and actions for a more coherent policy framework of the different
strands of work of EU product policy in their contribution to the circular economyrdquo
scheduled for 2018 According to the Action Plan EU product policy includes ldquoEcodesign
Energy Labelling Ecolabel Green Public Procurement and other relevant product
legislationrdquo Therefore some relevant legislation pertinent to the present study
includes18
Energy Labelling Regulation (repealing Directive 201030EU)19
Regulation on the EU Ecolabel (Regulation (EC) No 662010)20
Ecodesign Directive (Directive 2009125EC)21
Energy Efficiency Directive (Directive 201227EU)22
Further legislation relating to Green Public Procurement23
Legislation on waste from consumer goods24 including the proposed directives
mentioned above
Of particular relevance is the Energy Labelling Regulation which in addition to revising
the energy efficiency scale to a scale of A to G also includes for the majority of product
groups the absolute energy consumption in order to assist consumers to understand the
impact on energy bills The regulation also states
ldquoThe Commission should provide a long-term working plan for the revision of labels for
particular energy-related products including an indicative list of further energy-related
products for which an energy label could be established The working plan should be
implemented starting with a technical environmental and economic analysis of the
product groups concerned That analysis should also look at supplementary information
including the possibility and cost of providing consumers with information on the
performance of an energy-related product such as its energy consumption durability or
environmental performance in coherence with the objective to promote a circular
economy Such supplementary information should improve the intelligibility and
effectiveness of the label towards consumers and should not lead to any negative impact
on consumersrdquo (Clause 39)
Most recently the Commission published in early 2018 its report on the implementation
of the Circular Economy Action Plan25 which presents an overview of actions already
16 European Commission press release of 2 December 2015 httpeuropaeurapidpress-release_IP-15-
6203_enhtm
17 httpeur-lexeuropaeuresourcehtmluri=cellar8a8ef5e8-99a0-11e5-b3b7-
01aa75ed71a1001202DOC_2ampformat=PDF
18 Further relevant legislation might include Directive 200933EC on the promotion of clean and energy-
efficient road transport vehicles and Regulation (EC) No 1062008 on energy-efficiency labelling of office equipment
19 httpseur-lexeuropaeulegal-contentENTXTPDFuri=CELEX32017R1369ampfrom=EN
20 httpeur-lexeuropaeulegal-contentENTXTuri=CELEX32010R0066
21 httpeur-lexeuropaeulegal-contentENTXTuri=CELEX02009L0125-20121204
22 httpeur-lexeuropaeulegal-contentENTXTuri=CELEX32012L0027
23 httpeceuropaeuenvironmentgppeu_related_enhtm
24 httpeur-lexeuropaeusummarychapterenvironment200403htmlroot=200403
Behavioural Study on Consumersrsquo Engagement in the Circular Economy
16
delivered and introduces key deliverables for 2018 Some actions key in initiatives set
out in the report that were especially relevant in the context of the present study
include
Adoption of the Ecodesign Working Plan 2016-2019 which outlines the priorities for
the coming years in terms of new product groups for investigation and reviews of
existing Ecodesign and Energy Labelling regulations
Moves by European standardisation organisations on the Commissionrsquos request to
develop generic standards on the durability reusability and recyclability of products
(with the submission of a working plan and establishment of a working group)
Updated Guidance on the Unfair Commercial Practices Directive26 which includes
specific elements to make green claims more trustworthy and transparent
The Commissionrsquos publication of the Fitness Check on EU Ecolabel in 201727
12 Objectives of the study
The project addressed three objectives
Identify barriers and trade-offs faced by consumers when deciding whether to engage
in the circular economy in particular whether to purchase a more or a less durable
good whether to have a good repaired or to discard it and buy a replacement
Establish the relative importance of economic social and psychological factors that
govern the extent to which consumers engage in the circular economy especially
purchasing durable products and seeking to repair products instead of disposing of
them and
Propose policy tools to enable and encourage consumers to engage in circular
economy practices related to durability and reparability
The study did not use a precise definition of what constitutes a lsquodurablersquo or lsquorepairablersquo
product Instead it was one of the main aims of the study to uncover what consumers
associate with the concepts of lsquodurabilityrsquo and lsquoreparabilityrsquo The study thus potentially
takes a different point of view on these CE concepts compared to studies that are
focussed on industry standards Naturally industry standards require clear definitions of
what can be considered a lsquodurablersquo or lsquorepairablersquo product to be enforceable This study
instead covers the views and perceptions around durability and reparability of the general
population across different EU Member States
To meet the objectives of the study three main areas of work have been undertaken
A preparatory phase involving a literature review desk research collection of market
data collection of information on business practices assessment of repair service
business models and focus groups with consumers This early phase formulated
hypotheses for testing in the behavioural experiment (see below) In addition the
evidence collected in this phase contributed to answering the research questions set
out in the Tender Specifications and to the development of analytical conclusions and
policy recommendations
Behavioural experiment and surveys This task tested the hypotheses formulated in
the preparatory phase through a behavioural experiment and consumer survey in
Sweden Germany Ireland Spain Czech Republic and Romania The behavioural
experiment firstly tested situations in which consumers take durability andor
reparability information on products into account in purchasing decisions and
secondly situations in which respondents choose to repair rather than replace
products for five productsproduct categories
A consumer survey was conducted in Austria the Czech Republic Germany Spain
France Hungary Ireland Latvia the Netherlands Portugal Romania and Sweden
The survey explored consumersrsquo understanding of lsquodurabilityrsquo and lsquoreparabilityrsquo their
25 httpeceuropaeuenvironmentcircular-economyindex_enhtm
26 httpeceuropaeujusticeconsumer-marketingfilesucp_guidance_enpdf
27 httpeceuropaeuenvironmentemasemas_publicationspolicyfitness_check_enhtm
Behavioural Study on Consumersrsquo Engagement in the Circular Economy
17
engagement in the Circular Economy and drivers and barriers to this
(non-)engagement and their expectations understanding and awareness with
respect to durability and reparability
Analysis of results conclusions and policy recommendations which involved
quantitative and qualitative analysis in order to develop analytical conclusions and
recommendations for EU level policy tools
Behavioural Study on Consumersrsquo Engagement in the Circular Economy
18
METHODOLOGY
Behavioural Study on Consumersrsquo Engagement in the Circular Economy
19
2 Methodology
This section presents brief overviews of the methods applied for each of the strands of
research Some parts refer the interested reader to the annex document which contains
further details
The section is organised as follows
Section 21 presents the country selection
Section 22 presents the product selection
Section 23 presents the approach to the literature review and desk research
Section 24 presents the approach to the stakeholder interviews
Section 25 presents the methodology for the focus groups
Section 26 presents a short description of the consumer survey including brief details
on the sampling and questionnaire content
Section 27 presents how the behavioural experiments for this study were conducted
including a brief description of the tasks experimental treatments outcome
measures and incentives
21 Country selection
The sample of Member States covered in the study needed to reflect different levels of
CE engagement and aim for the broadest geographical coverage possible To create a
robust indicator of CE engagement across the EU Member States two types of measures
were used in the country selection namely consumersrsquo self-declared attitudes towards
different aspects of the Circular Economy and their actual behaviour with respect to the
Circular Economy
To capture consumersrsquo attitudes published data from Eurobarometers 388 and 397 was
used as follows
General environmental impact This dimension described how much the
environmental impact of goods or services influences consumersrsquo choices of goods or
services based on question 5 of Flash Eurobarometer 397 survey (ldquoConsidering
everything you bought during the last two weeks did the environmental impact of
any goods or services influence your choicerdquo)
Durability of products This dimension captured the importance of the longevity of
products to consumers in their purchasing decisions based on question 11 of Flash
Barometer 388 survey (ldquoWhich of the following aspects do you consider most
important when buying a durable product like a washing machine or a fridgerdquo
where respondents could select ldquoYou can use the product for a long timerdquo as an
answer option)
Recycling This dimension captured the relevance of the recyclability of products in
consumersrsquo purchasing decisions based on question 11 of Flash Barometer 388
survey (ldquoWhich of the following aspects do you consider most important when buying
a durable product like a washing machine or a fridgerdquo where respondents could
select ldquoThe product can be recycled after you use itrdquo as an answer option)
Reuse of products This dimension captured the importance to consumers of being
able to resell products based on question 11 in Flash Barometer 388 survey (ldquoWhich
of the following aspects do you consider most important when buying a durable
product like a washing machine or a fridgerdquo where respondents could select ldquoYou
can easily sell the product when you no longer want to use itrdquo as an answer option)
To capture consumersrsquo behaviour (ie the extent that their attitudes materialise)
Eurostat statistics were used to describe Member States on two variables
Recycling rate This dimension represented the actual recycling rate across
countries based on Eurostat statistics (dataset Municipal waste by waste operations
code env_wasmun)
Waste production This dimension captured how much waste each country
generates per capita (again using Eurostat data)
Behavioural Study on Consumersrsquo Engagement in the Circular Economy
20
The country selection was based on these six dimensions The selection captured
different parts of the distribution for these six measures (ie countries with relatively
high levels and those with relatively low levels) while paying attention to the
geographical coverage (ie the selection covered all the different regions of the EU
North South East and West) such that the findings may be extrapolated to all the
Member States Iceland and Norway
For the online survey and experiment the country selection comprised of
Survey (12 countries) Austria Netherlands Sweden Czech Republic Germany
France Ireland Hungary Latvia Spain Portugal and Romania
Behavioural experiment (6 countries) Sweden Germany Ireland Spain Czech
Republic and Romania
The literature review covered literature published in English from all 28 Member States
and further literature in seven additional European languages (French German Czech
Hungarian Dutch Portuguese and Romanian)
Additional online desk research and semi-structured interviews were conducted in
10 countries Austria Netherlands Sweden Czech Republic Germany France Ireland
Hungary and Romania This selection thus covered all experiment countries and ten of
the twelve survey countries (except Latvia and Portugal)
A subset of four of the six experiment countries were selected for the focus groups
these were Germany Ireland Sweden and the Czech Republic
The country selection is presented in the table below
Behavioural Study on Consumersrsquo Engagement in the Circular Economy
21
Table 1 Country selection
Literature review Online Desk
Research
Semi-structure
interviews
Consumer
focus group
Survey (S) Experiment
(E)
English
National
language
AT EN DE x x S
BE EN FR NL
BG EN
HR EN
CY EN
CZ EN CZ x x x S + E
DK EN
EE EN
FI EN
FR EN FR x x S
DE EN DE x x x S + E
EL EN
HU EN HU x x S
IE EN x x x S + E
IT EN
LV EN S
LT EN
LU EN FRDE[1]
MT EN
NL EN NL x x S
PL EN
PT EN S
RO EN RO x x S + E
SK EN
SI EN
ES EN ES x x S + E
SE EN x x x S + E
UK EN
Count 28 10 10 10 4 S=12 E=6
Note The researchers searched for literature from Luxembourg in English French and German Luxembourgish was not covered
22 Product selection
This section provides an overview of the criteria applied for the selection of the products
the study focuses on The study covered five products based on their relevance for the
Circular Economy namely smartphones televisions vacuum cleaners dishwashers and
clothing
The product selection followed four criteria Each criterion has been applied to ten
potential products that could have been covered in the project which formed the basis
for our suggested choice This choice was then narrowed down to the five products
mentioned above
bull Criterion 1 The first criterion concerned the reasoning on why consumers
replace a product The sample contains products that are replaced mainly for
fashion reasons and products that are replaced only if broken or technologically
outdated
bull Criterion 2 This criterion aimed to cover different options for more circular
processes offered by different products (eg repair recycling reuse or sharing)
bull Criterion 3 The third criterion described the potential positive environmental
outcomes that could be achieved by reducing resource use in these product
categories (eg environmental performance throughout their lifecycle product
environmental footprint (PEF) and organisation environmental footprint (OEF))
bull Criterion 4 The final criterion related to the political relevance of the product
category especially whether the product was covered by a number of different
Behavioural Study on Consumersrsquo Engagement in the Circular Economy
22
relevant Directives like the Ecodesign Directive andor Energy Labelling Regulation
or in other EU studies on similar subjects Additionally a product type was
favoured if existing industry initiatives show that the industry sees some potential
for Circular Economy changes
Using these criteria on an initial set of products the Consortium finally selected the
following five products mentioned
1 Smart phones purchases are innovation and fashion driven as innovation cycles
are swift and smart phones are important status symbols There is a big potential
for recycling and repair use of critical raw materials many on-going initiatives
and lastly they fall within the scope of the Ecodesign Directive were a focus of a
REFIT (Regulatory Fitness and Performance) study on consumer rules (EC DG
Justice and Consumer 2016) and were also covered in an EU study on lifespan
labelling (European Economic and Social Committee 2016)
2 Televisions innovation cycles have been also very quick in recent years but
compared to smart phones TV are less of a status symbol so it should be
expected that innovation is important in the purchasing decision and fashion less
so There is a large potential for repairing and recycling use of critical raw
materials and high GHG emissions there are many on-going initiatives and lastly
TVs are covered by the Ecodesign Directive and the Energy Labelling Directive
and were studied in the REFIT study recent studies on energy labelling (London
Economics amp Ipsos 2014) and lifespan labelling (European Economic and Social
Committee 2016) and the study on EU environmental and carbon footprint label
options conducted in 2012 (London Economics Ipsos amp AEA 2012)
3 Vacuum cleaners as innovation cycles are slower than in TV and smart phones
and vacuum cleaners are less of a status symbol purchasing decisions are
probably more driven by durability and less by technology or fashion There is a
large potential for recycling and repairing and some potential for sharing Vacuum
cleaners are covered by the Ecodesign Directive and the Energy Labelling
Regulation and were studied in the lifespan labelling study (European Economic
and Social Committee 2016)
4 Dishwashers as innovation cycles are slower than in TV and smart phones and
dishwashers are less of a status symbol purchasing decisions are again probably
more driven by the longevity (ie durability) of products there is some potential
for repair recycling and reuse high GHG emissions and lastly dishwashers are
covered by the Ecodesign Directive and the Energy Labelling Regulation
5 Clothing purchasing decisions are largely driven by fashion There is some
potential for repair and reuse and although they are not covered by the Energy
Labelling Regulation or Ecodesign Directive clothing items are covered by the
lifespan labelling study which studied trousers and sport shoes (European
Economic and Social Committee 2016)
Furthermore including clothing in the sample had an added value since technological
innovation is not such an important factor for clothing compared to the other product
categories For the other four product categories fashion plays a smaller role when
replacing a product
23 Methodology for the literature review and desk research
A literature review of existing English-language studies and documents in all EU Member
States Norway Iceland and four other non-European countries (Canada Switzerland
Japan and the United States) was carried out Additionally literature in six other
languages namely French German Czech Dutch Spanish and Romanian were
reviewed The literature review and desk research were conducted in parallel The aim of
the literature review was to provide an overview on the existing published knowledge
relevant to the research questions In order to answer the studiesrsquo research questions
(see Section 1 in the Annex document) the researchers focused on the following
aspects
Behavioural Study on Consumersrsquo Engagement in the Circular Economy
23
Characteristics of the Circular Economy such as durability and reparability of
products and the difference between durability and reparability characteristics
across the five product categories (televisions smartphones vacuum cleaners
dishwashers and clothes) types of information on durability and reparability of
products as well as key features of other circular practices such as product
leasing services and the sharing economy
Aspects of consumer purchasing decisions in the Circular Economy such as
consumer willingness to engage drivers barriers and trade-offs faced by
consumers consumer awareness understanding of and expectations about
durability and reparability and the role of durability and reparability information in
the purchasing decision
Market data on manufacturing complete recycling andor reuse consumption and
usage patterns and disposal trends) for the five products categories
Existing European and national policy measures in the area of the Circular
Economy and eco-innovation and their impacts at European and national level
Business models that can be found today in the Circular Economy with a focus on
product reparability and recyclability
During the literature review and desk research the study team pre-screened 224
documents including national and European consumer studies regulatory reports and
academic articles From those the study team fully analysed 105 documents Based on
the executive summaries or abstracts the documents were analysed if any of the
research questions seemed to be covered by the report The research questions were
structured and summarised into the following 10 themes to allow an easier overview
Theme 1 - Drivers barriers and trade-offs
Theme 2 - Willingness to engage
Theme 3 - Consumers expectations regarding durability
Theme 4 - Consumer expectations regarding reparability
Theme 5 - Importance of CE characteristics
Theme 6 - Durability information
Theme 7 - Reparability information
Theme 8 - After-sales expectations
Theme 9 - Policy tools
Theme 10 - Business models and market data
The collected information of the fully reviewed documents was organised in an excel file
to allow the analysis of all collected information by question
24 Methodology for the stakeholder interviews
241 List of stakeholders
During the inception phase a preliminary list of relevant stakeholders was developed
Relevant stakeholders were identified via desk research by searching for knowledgeable
individuals in 11 categories of organisations
European trade and businessindustry associations
European consumer associations
European NGOs in particular focusing on CEsustainable consumption
National public authorities
National consumer associations
National trade associations
National NGOs in particular focusing on CEsustainable consumption
Independent repair servicesassociations
Standardisationcertificationverification bodies
Eco-labelling bodiesinstitutions
Academics specialising in consumer-related policy and behavioural economics
The preliminary list of interviewees was further developed using suggestions of the
Commission and results of the desk research at Member State level The study team
identified additional organisations that hold up-to-date data and information about the
Circular Economy and contacted these organisations as well
Behavioural Study on Consumersrsquo Engagement in the Circular Economy
24
242 Preparation ahead of the interviewing process
To ensure that the study team had a full understanding of the questions and objectives of
both the study and the interviewing process the core team provided internal guidelines
to be used by the researchers The internal guidelines included
an introduction and the objectives of the study
research questions
descriptions of the research activities
The final interview guide is presented in Section 5 in the Annex document
243 Interviews at European and Member State level
The researchers contacted stakeholders at the European level in Switzerland and across
13 Member States Austria Belgium France the Czech Republic Germany Spain
Ireland the Netherlands Hungary Romania Sweden Portugal and the United Kingdom
Interviews aimed at obtaining up-to-date and first-hand information on the relevant
issues exploring in depth the study objectives with the help of the stakeholdersrsquo
expertise and lastly ensuring that no critical studies or data were missed
The interview questionnaire was shared with the interviewees allowing them to prepare
beforehand and gather necessary data before the interview
Most of the interviews were undertaken in the national languages In some specific
cases upon request from the stakeholders the interview guide was translated (ie
German Czech and Romanian)
Overall the study team completed 50 interviews Table 2 shows their distribution
between different types of stakeholders and between the 14 countries covered in this
study plus the European level
Behavioural Study on Consumersrsquo Engagement in the Circular Economy
25
Table 2 Distribution of interviews (in number of interviews)
Trad
e a
nd
bu
sin
ess
ind
ustr
y
asso
cia
tio
ns
Co
nsu
mer
asso
cia
tio
ns
NG
Os
focu
sin
g
on
CE
su
sta
inab
le
co
nsu
mp
tio
n
Pu
bli
c
au
tho
rit
ies
Acad
em
ics
exp
erts
Oth
er
To
tal
EU 6 3 1 10
AT 1 1
BE 1 2 1 4
CH 1 1
CZ 3 1 1 5
DE 1 1 2 1 5
ES 1 1 2
FR 1 1 2
HU 1 1 2
IE 1 1
NL 2 2 4
PT 1 1
RO 1 2 1 4
SE 1 2 3
UK 1 1 2 1 5
Total 50
The study team used a similar approach to conduct interviews to the approach used for
the literature review and desk research dividing the interview questions into the
following sections to allow a better overview and to help the interviewer structure the
interview
Section 1 - Drivers barriers and trade-offs
Section 2 - Willingness to engage
Section 3 - Consumers expectations on durability
Section 4 - Consumer expectations on reparability
Section 5 - Importance of CE characteristics
Section 6 - Durability information
Section 7 - Reparability information
Section 8 - After-sales expectations
Section 9 - Policy tools
Section 10 - Business models and market data
Behavioural Study on Consumersrsquo Engagement in the Circular Economy
26
Under each section there was a minimum set of three questions While the questions
under sections 1 5 6 7 and 9 were asked in all interviews the more detailed question in
the other sections were only asked if the interviewee had some expertise or interest in
the topics
The gathered information for the literature reviews and interviews was recorded in two
excel files The data in both files are structured by research question
25 Methodology for the focus groups
Eight consumer focus groups were carried out aiming to explore consumersrsquo awareness
understanding attitudes and expectations with regard to circular economy practices
Two focus groups were conducted in each of Ireland Germany Sweden and the Czech
Republic In each country groups were moderated in the local language Each group
session was designed to last 90 minutes
251 Sampling and recruitment
It was aimed to recruit on average eight participants per group In each country one
group was carried out with vulnerable consumers ndash defined as people who are in arrears
with household bills or who struggle from time to time with household bills and are in
any of the following situations unemployed retired long-term sick or disabled or single
parents28 The second group included a ldquomixrdquo of participants in terms of circular economy
engagement ndash people who tend to engage in circular economy practices people who tend
not to and people who tend to do this but only to a certain extent
In each group it was aimed to include a balanced mix of men and women aged 25 to 60
years old This age range was set in order to ensure that the age gap between
participants was not too wide bearing in mind the need to maximise communication and
participation and create an efficient group dynamic
In summary all participants had to meet the following eligibility requirements
Had not participated in another focus group in the past six months and
Had completed the screener questionnaire in order to assess their group membership
(circular economy engagement and vulnerability)
Respondents were recruited using the screener questionnaire In each country recruiters
were thoroughly trained by the project managers from the local fieldwork agencies The
recruitment process was strictly monitored
The following table presents the number of participants who took part in the focus groups
in each country as well as the fieldwork dates
Table 3 Participation in focus groups
Group Date Number of participants
Czech Republic Mixed 270617 8
Vulnerable 270617 8
Germany Mixed 060717 9
Vulnerable 060717 7
Ireland Mixed 050717 9
Vulnerable 050717 8
Sweden Mixed 290617 8
Vulnerable 290617 8
28 For a definition of consumer vulnerability see for example European Commission (2016) Consumer Vulnerability in Key Markets in the EU
Behavioural Study on Consumersrsquo Engagement in the Circular Economy
27
In each country participants received an incentive for attending the groups as a ldquothank
yourdquo for their participation The following table provides information with regards to the
incentives provided29
Table 4 Incentives for participation in focus groups
Country Incentive (per participant)
Czech Republic 700 CZK
Germany 50 EUR
Ireland 50 EUR
Sweden 600 SEK
252 Discussion guide
The discussion guide aimed to include questions that focused on three aspects of the
circular economy (durability reparability and recyclability) and referred to various types
of products (washing machinesdishwashers vacuum cleaners televisions smartphones
and clothing) The document was structured as follows
Introduction presentations introduction and brief definition of the three key concepts
(durability reparability and recyclability)
Awareness understanding attitudes and expectations regarding circular economy
practices
Barriers and drivers factors that encourage consumers from undertaking circular
economy practices as well as those that prevent them from it
Expectations with regard to information provision about durability reparability and
recyclability and how it should be presented
26 Methodology for the consumer survey
An online consumer survey was conducted in Austria the Czech Republic Germany
Spain France Hungary Ireland Latvia the Netherlands Portugal Romania and Sweden
with approx 1000 respondents each The obtained sample was representative in terms
of age gender and geographic region (see weighting strategy further below)
All survey participants received a monetary incentive for their participation in the survey
As outlined in the following section respondents who also conducted the experimental
task as part of the survey could earn additional incentives through their choices in the
experiment30
The survey contained questions in the following areas
Consumersrsquo understanding of lsquodurabilityrsquo and lsquoreparabilityrsquo
Consumersrsquo CE engagement and drivers and barriers of this (non-)engagement This
section included questions in the following sub-areas
o Experience with owning different types of products
o Experience with broken products
o Experience with repair and self-repair
o Experience with rentingleasing products and purchasing second hand
products
o The importance of durability and reparability information on purchasing
decisions
o General CE-related behaviours
Durability and reparability information
29 In each country incentives were established by the local agencies who conducted the groups according to their standard practice for compensating respondents for taking part in focus group research
30 The participation fee paid in Ipsos points converted into roughly euro1-euro2 depending on the country and the additional incentive paid for choices in the experiment amounted to an additional euro050 - euro1
Behavioural Study on Consumersrsquo Engagement in the Circular Economy
28
Expectations understanding and awareness with respect to durability and reparability
Buying versus leasing products
After-sales expectations
Socio-demographics and respondent attitudes and behavioural traits relevant to the
CE
This study did not address whether consumersrsquo attitudes were different for situations in
which products were still covered by the 2-year legal guarantee covering all goods sold in
the EU by additional Member State rules which are stricter than the 2-year legal
guarantee (eg in SE) or covered by additional (extended or commercial) warranties As
a result when asking respondents for example about their repair behaviour or after-
sales expectations the survey questions commonly referred to both guarantees and
warranties The survey did not give specific explanations about the difference of legal and
commercial guarantees
Sampling and weighting of the obtained data
Respondents in each country were randomly drawn from the online panels based on
available profile data (age gender and geographic region) and pre-defined sub-sample
sizes (ie quota) based on official population statistics published by Eurostat (2017)
ldquoFlexiblerdquo quota were used meaning that some leeway was granted to achieve the target
number of interviews in each sub-sample group In Romania the target number of
interviews for the oldest age group was not reached at the end of the fieldwork period
Any imbalance in the representativeness of the data due to the use of flexible quota is
managed using post-stratification weights Two types of weights are produced for this
study country weights and cross-national weights
Country weights adjust for gender and age distributions in each country such that the
weighted data matches the Eurostat statistics (2017) population data These weights are
applied when analysing the data at individual country level31
Cross-national weights adjust for country population size These weights are applied
when analysing the data across multiple countries Two weighting variables are included
in the dataset (1) a cross-national weighting variable to be applied when analysing all
12 countries (2) a cross-national weighting variable to be applied when only analysing
the six countries where respondents completed the experiment
31 These weights are generated using the iterative proportional fitting command ipfweight in Stata software package ipfweight is based on the iterative proportional fitting algorithm (also known as raking) first proposed by Deming and Stephan in 1940 It performs a stepwise adjustment of weights to achieve known population margins (gender and age) the adjustment process is repeated until the difference between the known population margins and the weighted margins of the variables gender and age is minimised
Behavioural Study on Consumersrsquo Engagement in the Circular Economy
29
Table 5 Sample composition Unweighted gender and age distribution
Country Number
of
completed
interviews
Gender
distribution (
unweighted)
Age distribution ( unweighted)
Men Women 18-
29y
30-
39y
40-
49y
50-
59y 60+y
AT 1005 518 482 154 176 193 198 279
CZ 1004 507 493 174 180 188 155 302
DE 1009 507 493 135 163 194 194 314
ES 1020 519 481 160 196 195 172 278
FR 1002 526 474 164 189 178 153 317
HU 1003 532 468 172 179 195 183 272
IE 1003 506 495 177 236 195 177 215
LV 1005 551 449 190 158 189 167 296
NL 1002 510 490 169 172 180 178 302
PT 1005 531 469 201 144 209 165 281
RO 1005 531 469 201 260 203 206 130
SE 1001 509 492 170 153 150 188 340
Source Ipsos analysis of fieldwork data
261 Random allocations of respondents to survey items product
categories and experimental treatments
As explained above the survey and experiment covered five different product categories
ndash dishwashers vacuum cleaners televisions mobile phones and clothing items ndash and
tested a large number of experimental treatments (see components of the purchasing
and repair experiments below) To keep the tasks manageable for respondents in terms
of time and complexity and to avoid respondent fatigue not all respondents answered
strictly all questions for all products Instead a system of random allocations was set up
to obtain a balanced data set across the various products and scenarios tested
To this end at the start of the consumer survey each respondent was asked about their
experience with purchasingowning any of the five products under examination and
whether they had purchased these products themselves (rather than having received
these as gifts or alike) and whether any of these products had broken down in the past
This information was then used to form three sets of respondents as shown below to
ensure respondents were routed to relevant questions throughout the survey
Set 1 Respondents in Set 1 answered in-depth survey questions for up to two
randomly selected products which they currently or previously owned and which
have broken down in the past Products which respondents purchased themselves
were prioritised
Sets 2 and 3 slightly relaxed some requirements of Set 1 in the following way
Set 2 Respondents in Set 2 answered questions for up to two randomly selected
products which they currently or previously owned and which they purchased
themselves Products which respondents have broken down were prioritised
Set 3 This set finally covered two randomly selected products where it was sufficient
for respondents to have simply owned the products Products which were bought
by the respondent and products which have broken down were prioritised but it was
not necessary to have such experiences to be included in Set 3
Behavioural Study on Consumersrsquo Engagement in the Circular Economy
30
The final allocation across sets and products was as follows
Table 6 Number of respondents allocated to different sets and products
Set Vacuum
cleaners
Dishwashers TVs Mobile
phones
Coat or
jacket
Set 1 2350 2008 2045 3053 1503
Set 2 4848 4096 4855 4893 4883
Set 3 4907 4463 4908 4914 4917
Allocations to the various treatments in the experimental tasks were done independently
and randomly across the different allocations This resulted in a full factorial design
between products and treatments This means that group sizes for different variants
within each treatment category were roughly equal and each respondent had the same
likelihood of being assigned to any specific treatment This also ensures that on average
there should not be any interactions between different types of experimental treatments
(see Section 9 in the Annex document for the full argument) In the analyses in the
following sections sample sizes for the various groups are mentioned in table notes
27 Methodology for the behavioural experiment
The behavioural experiment was embedded as an additional module within the general
consumer survey All respondents answered questions regarding their socio-demographic
background and general survey questions (see above) Respondents from countries in
which the behavioural experiment was conducted ie in the Czech Republic Germany
Spain Ireland Romania and Sweden additionally completed two additional tasks
namely a repair experiment and a purchasing experiment
The sequence of these different components is shown in Figure 1 below each component
is described in further detail in turn in the following sub-sections
Figure 1 Components and sequence of the consumer survey and behavioural experiment
Source LE Europe
Behavioural Study on Consumersrsquo Engagement in the Circular Economy
31
271 Components of the repair experiment
The repair experiment was targeted to test behaviour in the circular economy with a
focus on the drivers and barriers of repair decisions Furthermore it assessed attitudes
towards replacing broken products with second hand as opposed to brand new products
Respondents were given a scenario in which they owned a defective product which could
not be self-repaired and which due to its age was no longer covered by a legal
guarantee Respondents were asked to choose whether to have their product repaired or
to replace it either with a second hand or a brand new product
Decisions in the repair game followed a two-step process Firstly respondents were
asked to choose whether they wanted to repair a product or replace it Secondly if
respondents decided to replace a product they were asked to choose whether to replace
their faulty products with a second hand or brand new product
Example screenshots of both decisions are shown in the two figures below
The experiment was monetarily incentivised (see further below) and the prices used were
calibrated to closely mimic real decisions Repairing cost was approximately 25 of the
original product price (ie price of the broken product when it was new) Replacing the
defective product with a brand new version (new unused and of latest technology) cost
120 of the original product price Replacing it with a second hand product (used same
technology as defective product but fully functional) cost 70 of the original product
price The cost for repair or replacement was held constant within a product category
Figure 2 Decision to repair or replace in the repair experiment
Notes The picture of the mobile phone shown in this figure is different from the one seen in the experiment by
respondents for copyright reasons
Behavioural Study on Consumersrsquo Engagement in the Circular Economy
32
Figure 3 Decision to buy second hand or brand new in the repair experiment
Product coverage in the repair experiment
The experiment was conducted for TVs dishwashers vacuum cleaners smartphones and
coats Each respondent repeated the task for three different products Which products
were covered and the order in which respondents saw the different products were
randomised
Outcome measures of the repair experiment
There were two main outcome measures in this experimental task
Likelihood of choosing to repair
Likelihood of choosing a second hand product This choice was evidently only relevant
for respondents who chose to replace the product in the first stage
Experimental treatments in the repair experiment
The experimental treatments systematically varied the look and feel of the experimental
task for different respondents Allocations to the various treatments in the experimental
tasks were done independently and randomly across the different allocations This
resulted in a full factorial design between products and treatments This means that
group sizes for different variants within each treatment category were roughly equal and
each respondent had the same likelihood of being assigned to any specific treatment
This also ensures that on average there should not be any interactions between
different types of experimental treatments (see Section 9 in the Annex document for the
full argument)32
Effort treatment This treatment changed the relative cost of either repairing or
replacing the product by introducing a real effort task This treatment aimed to test
whether non-price related frictions such as search costs time investment etc
represent barriers for engagement in the CE There were three variants
32 Since the same percentage of participants were exposed to a specific treatment variant in all other treatments (eg the same number of respondents saw the no effort effort after repair effort after replace conditions in all other treatments) the effect of the treatment on other treatment is cancelled out on average In the analysis each treatment is analysed in isolation ie averaging across all variants of any other treatment This setup should safeguard that there is no lsquocontaminationrsquo between different types of treatments and is common practices in large-scale controlled behavioural experiments like this one (see for example the setup of the behavioural experiment (experiment 3) in the lsquoConsumer Market Study to support the Fitness Check of EU consumer and marketing lawrsquo European Commission 2017 available at httpeceuropaeunewsroomjustitem-detailcfmitem_id=59332
Behavioural Study on Consumersrsquo Engagement in the Circular Economy
33
o No effort Both repairing and replacing were lsquoeffortlessrsquo
o Repairing was associated with effort The repair decision was followed-up
by an effort task replacing an item (with a brand new version or a second
hand version) instead was effortless
o Replacing was associated with effort This was the flipside of the
above Effort was required for buying a second hand or a brand new
product while repairing was effortless
Figure 4 provides an example of the effort task associated with repairing The
effort task associated with replacing was the same except for the framing of the
reason for repair The fact that effort was required was announced in previous
stages of the repair experiment That is on the first decision screen see Figure 2
in the effort treatment it was indicated under lsquoSteps to takersquo that respondents
needed to complete an additional task
Figure 4 Effort in the repair experiment
Notes the picture of the mobile phone shown in the figure is different from the one seen in the experiment by respondents for copyright reasons
Framing of the source of repair This treatment varied who would repair the
product ndash the manufacturer or an independent repair shop Moreover it varied
whether the repair was done using original parts only or a mix of original and
non-original parts This setup resulted in the following 2 x 2 factorial design with 4
variants
Table 7 Design for the framing of the source of repair
Original parts only Original and non-
original parts
Manufacturer repair A B
Independent repair C D
The variants A amp C varied whether the manufacturer or an independent repair
shop would perform the repair Variants B amp D varied the type of spare parts to be
used for repair The treatment aimed to test whether certain characteristic of a
repair service make the option to repair more or less attractive
Behavioural Study on Consumersrsquo Engagement in the Circular Economy
34
The source of repair was shown to respondents with information on repair in the
first stage of the experiment (see Figure 2) Figure 5 provides an example of the
way that different sources of repair were shown
Figure 5 Framing of the source of repair in the repair experiment
Framing repair prices as VAT exempt This treatment had two variants and varied
whether prices were shown as including VAT or as VAT exempt This treatment aimed
to test whether framing repair prices as VAT exempt made the option to repair a
product more attractive This can be considered purely as an advertising practice
Prices were not varied ie VAT exempt prices were not actually cheaper compared to
VAT incl prices The treatment only tested the way prices were presented not the
actual price elasticity In the behavioural economics literature framing of choices is
often found to be very influential on how individuals perceive and choose between
options33
VAT exemption for repair was shown to respondents in two ways (see Figure 6)
Firstly the price for repair included explicit reference vat exemption or inclusion
Secondly a red-bordered label was shown if repair was VAT exempt
33 See for example UK Office for Fair Trading (2010) lsquoThe impact of price frames on consumer decision makingrsquo a report prepared by London Economics Tversky and Kahneman (1981) lsquoThe framing of decisions and the psychology of choicersquo Science Levin et al (1998) lsquoAll frames are not created equal A typology and critical analysis of framing effectsrsquo Organizational Behavior and Human Decision Processes
As a result this study aimed to test such framing effects only Standard economy theory tells us that demand for repair prices would increase if prices were lowered by the amount of VAT This study did not aim to measure the precise price elasticity of demand for repair services and thus omitted testing price changes in this treatment
Behavioural Study on Consumersrsquo Engagement in the Circular Economy
35
Figure 6 Framing of VAT exemption in the repair experiment
Each respondent was randomly allocated to one variant within each of the treatment
categories resulting in a full factorial experiment design (see Section 9 in the Annex
document for the full argument)
Incentives in the repair experiment
The repair experiment was incentivised Respondents could earn additional Ipsos survey
points through their choices More specifically respondents were given a budget for each
of the three rounds of the experiment task which they could use to pay for
replacingrepairing their products
The cost of repairingreplacing was deducted from the budget to reflect real-life
budgetary constraints Respondents then lsquoearnedrsquo points for the longevity of their
repaired (or replacement) product This latter mechanism reflected real-life monetary
advantage of durable products
The setup of the tasks and incentive structure were clearly explained before starting the
task (see box below) Additionally respondents answered comprehension questions on
the functioning of the task and incentives to ensure they indeed understood A more
detailed description of the experiment incentives is provided in Section 11 in the Annex
document
The following instructions34 were shown to respondents
TASK DESCRIPTION
You will play 3 rounds of this game
In every round you will be given a budget You can use this budget to repair or replace a
product Whatever you donrsquot spend you keep You will receive 1 point for every euro100
you have at the end of this survey
Like in reality you will get some lsquobenefitsrsquo from using a well-functioning product like the
pleasure of clean plates from your dishwasher or using technology on a smartphone
These benefits in form of additional survey points accrue over time You will get some
indication on the benefits of your choice but like in reality this information might not be
accurate The more benefits you get from your choice the more points you earn
Each choice is designed to be an attractive option so you must choose what you
think is the best choice for yourself
272 Components of the purchasing experiment
The purchasing experiment was targeted to test what drives CE considerations in
purchasing decisions In particular the experiment tested how the presentation of
product information regarding durability and reparability of products at the point of sale
impacts product choice and willingness-to-pay for better durability andor reparability of
products
34 Prices were converted into local currencies in non-Euro countries
Behavioural Study on Consumersrsquo Engagement in the Circular Economy
36
To this end respondents were given a scenario in which they needed to shop for a
product on a simulated e-commerce website showing them six products to choose from
(eg six different models of vacuum cleaners were shown and one needed to be
chosen) Figure 7 and Figure 8 show the basic components of this simulated website For
each product respondents saw the following picture name and price of the product and
a label The EU Ecolabel was employed when respondents needed to make decisions on
coats (see Figure 8) For all other products the EU Energy Label was used (see Figure 7)
Additionally durability andor reparability information was inserted as described further
below
Pictures and product names were varied across the 6 products The energy rating was
held constant at class lsquoBrsquo for all products (no rating applied to coats) This was done to
simplify the setup such that the impact of durability and reparability information could
clearly be measured
Figure 7 Purchasing experiment using EU Energy Labels
Notes The pictures of vacuum cleaners shown in this figure are different from the ones seen in the experiment by respondents for copyright reasons
Behavioural Study on Consumersrsquo Engagement in the Circular Economy
37
Figure 8 Purchasing experiment using EU Ecolabels
Notes The pictures of coats shown in this figure are different from the ones seen in the experiment by respondents for copyright reasons The experiment used gender-neutral images of coats
Product coverage in the purchasing experiment
Analogous to the setup of the repair experiment the purchasing experiment was also
repeated three times each time for a different product Each respondent thus was
randomly assigned to making purchasing decisions for 3 out of 5 products among TVs
dishwashers vacuum cleaners smartphones and coats
Outcome measures of the purchasing experiment
There were three main outcome measures in this experimental task
Preferences for durability Preferences for durability were measured as the
likelihood of choosing a product with a specific level of durability Moreover the
average durability per product category was measured across the different
experimental conditions as well as for different groups of respondents
Each product was assigned one of four levels of durability For each product category
a given durability level mapped to a specific number of yearsmonths of durability as
shown in the table below
Behavioural Study on Consumersrsquo Engagement in the Circular Economy
38
Table 8 Levels of durability and reparability in the purchasing experiment
Durability level Reparability
level
Vacuum
cleaners
Dish-
washers
TVs Smart-
phones
Coats All products
Level 1 10 years 15 years 7 years 42 months 10 years A
Level 2 7 years 10 years 5 years 36 months 7 years C
Level 3 4 years 5 years 4 years 30 months 4 years E
Level 4 2 years 2 years 2 years 24 months 2 years G
In the analyses further below we refer to respondents having either
o Preferences for high durability respondents who chose
the highest level of durability three times or
the highest level of durability twice and never the lowest level or
the highest level of durability once and the second highest level of
durability twice
o Preferences for low durability respondents who chose
the lowest level of durability three times or
the lowest level of durability twice and never the highest level or
the lowest level of durability once and the second lowest level of
durability twice and
o Intermediate preferences respondents who were neither had a preference
for high or low durability
o Preferences for reparability In analogy to the setup for durability there
were also 4 levels of reparability More specifically reparability was rated on
an A-G scale as a potential addition to the EU Energy Label Also analogously
respondents are referred to as having a high intermediate or low preference
for reparability These preferences were defined similarly as the definitions
used for durability preferences
o Willingness-to-pay Willingness-to-pay for additional durability or
reparability was measured via a choice modelling approach (see Section 8 in
the Annex document for a detailed methodology) In brief the products
presented to different respondents were systematically varied in terms of their
attributes price name picture durability and reparability35 For example
some respondents saw during the experiment a more expensive price for a
very durable product others saw a lower price for the same level of durability
Some saw products with higher others with lower durability and similarly for
reparability etc
WTP was then estimated using statistical methods by pooling responses across
respondents This approach avoids that respondents would be primed by any specific
product attributes or by any price relationships with durabilityreparability
Experimental treatments in the purchasing experiment
As for the repair experiment the experimental treatments systematically varied the look
and feel of the experimental task for different respondents Once again allocations to the
various treatments in the experimental tasks were done independently and randomly
across the different allocations This resulted in a full factorial design between products
35 Product attributes were varied in addition to varying the way this information was presented via experimental treatments (see next subsection)
Behavioural Study on Consumersrsquo Engagement in the Circular Economy
39
and treatments This means that group sizes for different variants within each treatment
category were roughly equal and each respondent had the same likelihood of being
assigned to any specific treatment This also ensures that on average there should not
be any interactions between different types of experimental treatments (see Section 9 in
the Annex document for the full argument)36
Framing of durability and reparability information All respondents were always
shown the EU Energy Label or Ecolabel (for coats) as shown in Figure 7 and Figure 8
This information treatment varied how and whether information on durability andor
reparability was available in addition to the EU EnergyEcolabel The setup was a full
factorial design with 2x6 variants as shown in Table 9 below (see Section 9 in the
Annex document for the full argument)
An example of how the experiment screen looked with durability information is shown
below in Figure 9 Table 9 then shows the different information variants and examples
of these are shown thereafter
Figure 9 Purchasing experiment using the EU Energy Label and durability information
treatment displayed as lsquoExpected lifetimersquo
Notes The pictures of mobile phones shown in this figure are different from the ones seen in the experiment by respondents for copyright reasons
36 Since the same percentage of participants were exposed to a specific treatment variant in all other treatments (eg the same number of respondents saw the no claim social claim savings claim conditions in all other treatments) the effect of the treatment on other treatment is cancelled out on average In the analysis each treatment is analysed in isolation ie averaging across all variants of any other treatment This setup should safeguard that there is no lsquocontaminationrsquo between different types of treatments and is common practices in large-scale controlled behavioural experiments like this one (see for example the setup of the behavioural experiment in the Lot 3 study to support the lsquoStudy for the Fitness Check of EU consumer and marketing lawrsquo European Commission 2017
Behavioural Study on Consumersrsquo Engagement in the Circular Economy
40
Table 9 Treatment variants of the framing of durability and reparability treatment
Notes [1] lsquoManufacturer warrantyrsquo and lsquoExpected lifetimersquo were not explained or defined further in the experiment It is a common market practice for manufacturers and retailers to display durability claims beyond the legal guarantee of 2 years in this way Manufacturer warranties and expected lifetimes may be seen as a service to consumers or a possible signal for quality but the experiment remained silent about the precise meaning
[2] Durability on EU labels was defined as The period in which the manufacturer promises to replace or repair the product free of charge
[3] Reparability on EU labels was defined as Ease-of-repair rating based on availability of repair manuals spare parts and repair services
The lsquomini labelrsquo refers to a reduced version of the EU Energy Label which was shown as
part of the product description Such lsquomini labelsrsquo are commonly found in product
descriptions of online retailers Full labels instead are usually shown on products in brick-
and-mortar shops Like in reality clicking on the label expanded it to the lsquofull labelrsquo
version and showed additional information on the label elements (eg descriptions of the
meaning of its elements) In the lsquofull labelrsquo variants the full EU Energy Label was
featured on the product descriptions right away Clicking on the label expanded its size
and showed additional information as in the mini version The two label versions as they
appeared in the purchasing experiment are shown in the figure below
Durability information Reparability
information
Label type Variant
number
Not shown Not shown Mini label 1a
Full label 1b
Shown on EU label[2]
(handshake icon amp years
months)
Not shown Mini label 2a
Full label 2b
Not shown Shown on EU label
(spanner amp screwdriver
icon with A-G rating)[3]
Mini label 3a
Full label 3b
Shown on EU label[2]
(handshake icon amp years
months)
Shown on EU label
(spanner amp screwdriver
icon with A-G rating)[3]
Mini label 4a
Full label 4b
Shown as lsquoManufacturer
warrantyrsquo[1] not on EU
label
Not shown Mini label 5a
Full label 5b
Shown as lsquoExpected
lifetimersquo[1]
not on EU label
Not shown Mini label 6a
Full label 6b
Behavioural Study on Consumersrsquo Engagement in the Circular Economy
41
Figure 10 Full label and lsquomini-labelrsquo in the purchasing experiment
The different types of durability and reparability information were shown to respondents
either within an EU label (ie EU Energy or EU Ecolabel) or outside of it Figure 11 shows
the look of durability and reparability information within the EU Energy Label The label
using the handshake icon represents durability information (here 15 years)37 The label
with the spanner and screwdriver icon represents reparability information (here category
A)38
Clicking on the EU labels enlarged the label and provided additional information on the
meaning of the different label elements Durability and reparability were defined as
follows
bull Durability The period in which the manufacturer promises to replace or
repair the product free of charge
bull Reparability Ease-of-repair rating based on availability of repair
manuals spare parts and repair services
37 Different icons were discussed for representing durability in the experiment design phase The handshake icons was chosen but not tested beforehand It is thus possible that other types of icons would be more or less effective compared to the icon chosen for this study
38 As for durability different icons were discussed for representing reparability as well Previous studies seemed to suggest that the chosen A-G scale is well understood by consumers Instead scales with for example star ratings or numeric ratings may work less well
Behavioural Study on Consumersrsquo Engagement in the Circular Economy
42
Figure 11 Durability and reparability information within EU labels
Notes the handshake icon shown in the figure is different from the one seen by respondents in the experiment for copyright reasons
Label variants as numbered in Table 9 above From left to right 1b 2b 3b 4b Durability ranged from 2-10y for VC 2-15y for DW 2-7y for TVs 2-10y for coats and 24-42 months for smartphones Reparability took values A C E or G (see Table 8)
Figure 12 shows durability information shown outside of an EU label as it would appear
in the experiment for smartphones As the figure shows the EU label was always shown
to respondents
Figure 12 Durability information outside of EU labels
Note Label variants as numbered in Table 9 above From left to right 1b 5b 6b Durability ranged from 2-10y for VC 2-15y for DW 2-7y for TVs 2-10y for coats and 24-42 months for smartphones (see Table 8)
Behavioural Study on Consumersrsquo Engagement in the Circular Economy
43
The way durability and reparability information were shown was carefully designed in line
with existing evidence on the types of labels which can be expected to be most impactful
and best understood by consumers A European Commission study39 on environmental
labelling tested star ratings lsquowater droprsquo ratings and letter (A-G) ratings and found that
the letter rating was universally best understood The study revealed that star ratings
were appealing to consumers which was also found in focus group discussions in this
study (see section 63) however this appeal did not translate into better understanding
Similar conclusions were also drawn by an EESC study40
Another European Commission study in 201741 tested the presentation of durability
information in terms of years and functional lifetime The study showed that providing
durability information had an impact on behaviour but there was no difference between
the different presentations of durability information Other evidence instead seems to
suggest that consumers find it difficult to understand functional lifetime information
because they have difficulty estimating the meaning of different unit or their use of
products42
Nudges and claims about durability This treatment varied whether respondents
would see a claim highlighting potential positive impacts of durability Similar claims
have been shown to have significant effects on subsequent behaviour43 The following
variants were used
o No claim Respondents did not see any claim about durability
o Claim about long-term savings Respondents in this variant saw the claim
that more durable products may generate long-term savings Figure 13 shows
a screenshot of this claim in the experiment
o Claim about other people Respondents in this variant saw a different claim
which stated that the majority of people choose more durable and more easily
repairable products Figure 14 provides an example of the claim as used in the
purchasing experiment
Figure 13 Savings claim in purchasing experiment
Notes The claim was shown to respondents in the respective treatment as a pop-up on screen at the beginning of each purchasing stage
39 European Commission (2012) lsquoResearch on EU product label options - Study delivered by Ipsos MORI London Economics and AEArsquo available at httpseceuropaeuenergysitesenerfilesdocuments2012-12-research-eu-product-label-optionspdf
40 European Economic and Social Committee (2016) lsquoThe Influence of Lifespan Labelling on Consumersrsquo available at httpswwweesceuropaeuresourcesdocs16_123_duree-dutilisation-des-produits_complet_enpdf
41 European Commission (2017) lsquoConsumer Market Study to Support the Fitness Check of EU Consumer and Marketing Lawrsquo a study by GfK Belgium available at httpeceuropaeunewsroomjustitem-detailcfmitem_id=59332
42 Larrick Soll (2008) lsquoThe MPG Illusionrsquo Science Schwarz (1999) lsquoSelf-reports How the questions shape the answersrsquo American psychologist
43 See The Behavioural Insights Team (2015) EAST Four simple ways to apply behavioural insights available at httpwwwbehaviouralinsightscoukwp-contentuploads201507BIT-Publication-EAST_FA_WEBpdf Allcott (2011) lsquoSocial norms and energy conservationrsquo Journal of Public Economics Coffmann et al (2017) lsquoCan Social Information Affect What Job You Choose and Keeprsquo American Economic Journal Applied Economics
Behavioural Study on Consumersrsquo Engagement in the Circular Economy
44
Figure 14 Social claim in purchasing experiment
Notes The claim was shown to respondents in the respective treatment as a pop-up on screen at the beginning of each purchasing stage
This lsquoclaimsrsquo treatment was tested in addition to the treatment above which varied
whether and how durabilityreparability information was disclosed It could be expected
that the claims treatment would have increased the attention respondents paid to the
durabilityreparability information in the other treatment ie there could have been a
positive interaction between these two treatment conditions Due to the way the
experiment was set up such potential lsquocontaminationrsquo effects have been controlled for
because there was an equal number of respondents who saw lsquono claimrsquo the lsquosavings
claimrsquo and the lsquosocial claimrsquo and who would have seen respectively lsquono CE informationrsquo
lsquodurability information on an EU labelrsquo etc When analysing the results of the information
treatment an average of all respondents in the claims treatment is taken (ie including
those who saw a claim and those who did not) such that one would expect the effect of
the lsquoclaimsrsquo treatment to average out and not contaminate the lsquoinformationrsquo treatment
This approach is common practice in similar controlled behavioural experimental studies
(see for example the design of the Lot 3 study supporting the lsquoStudy for the Fitness
Check of EU consumer and marketing lawrsquo European Commission 2017 and the Annex
for a theoretical development of the validity of this approach)
Incentives in the purchasing experiment
Similar to the setup of the repair experiment the purchasing experiment also had
additional monetary incentives
The following instructions44 were shown to respondents
TASK DESCRIPTION
You will play 3 rounds of this game
In every round you will be given a budget You can use this budget to purchase
products in this game Whatever you donrsquot spend you keep You will receive 1 point
for every euro100 you have at the end of this survey
Like in reality you will get some lsquobenefitsrsquo from using a product like the pleasure of
watching a film on a nice TV or looking good in a new coat These benefits in form of
additional survey points accrue over time You might get some indication on how
long the product will work well but like in reality this information might not be accurate
The more benefits you get from a product the more points you earn
Each product is designed to be an attractive option so you must choose what you
think is the best product for yourself
As for the repair experiment respondents were given a budget for each of the three
rounds of the experiment task which they could use to pay for purchasing the products
44 Prices were converted into local currencies in non-Euro countries
Behavioural Study on Consumersrsquo Engagement in the Circular Economy
45
The cost of the purchased product was deducted from the budget to reflect real-life
budgetary constraints Respondents then lsquoearnedrsquo points for the longevity of their
products This latter mechanism reflected real-life monetary advantages of durable
products
As before respondents completed a comprehension stage with a detailed description of
the task and incentives as well as comprehension questions
Behavioural Study on Consumersrsquo Engagement in the Circular Economy
46
EVIDENCE AND FINDINGS
Behavioural Study on Consumersrsquo Engagement in the Circular Economy
47
3 Consumersrsquo willingness to engage in the Circular Economy
This section of the report provides information gathered from the literature stakeholder
interviews focus groups and consumer survey on consumersrsquo willingness to consider the
durability andor reparability of products in other words consumersrsquo willingness to
engage in the Circular Economy This section highlights if why and how consumers take
the durability and reparability of products into account in general for example when
purchasing new products and when using products
Later sections dive deeper into many of the topics which were touched upon in this
section
Key findings
All strands of research demonstrated that consumers were generally willing
to consider the durability and reparability of products when purchasing new
products
All strands of research found indications that consumers are motivated to engage
in the CE because they care for the environment The focus groups furthermore
highlighted that being able to save money was another key motivator for
purchasing more durable products
A majority of survey respondents claimed to be aware of the durability of the
products they purchased (64) as well as of repair services (58)
Respondents also indicated that they frequently searched for durability and
reparability information of products (62 for durability and 55 for
reparability) Yet as found in the further analysis presented in section 4
respondents often felt durability and reparability information was difficult to find
and would like to receive better information regarding these types of product
characteristics
A majority of respondents (93) reported that they kept things they owned for a
long time recycled unwanted possessions (78) and repaired possessions if they
broke (64) Respondents furthermore felt that their peers (close friends and
family) displayed similar levels of engagement in CE practices
These stated attitudes in the survey were widely supported by the literature
stakeholder interviews and focus groups
Some previously conducted surveys assessed as part of the literature review
found that consumers are at least to some extent willing to change their
lifestyle to address sustainability issues In particular some previous studies
as well as interviews with stakeholders have documented that consumer are
willing to pay for products with better environmental credentials Yet the French
CREDOC for example reported that consumers could be reluctant to adopt more
sustainable purchasing choices Other experts have highlighted that survey
research needs to be interpreted with caution as there might be a discrepancy
between what people say about their CE behaviours and what they
actually do
Generally there was agreement across the different strands of research that
many CE decisions depend on a trade-off between price and other considerations
(such as eg quality convenience caring for the environment being good at
repairing) The literature stakeholder interviews and focus groups reported a
certain level of caution towards CE product characteristics Consumers may find it
difficult to assess whether repairing a product would be worthwhile whether
refurbished or second hand products presented good value for money Such
uncertainty can lead consumers to purchase brand new products instead
especially when the price difference between new and second hand or
refurbished products is not substantial
Regarding product-specific willingness to engage in the CE according to the
literature stakeholders and focus groups durability and reparability were seen as
most important for large more expensive and less fashion-dependent products
such as white goods Instead these CE credentials were seen as less important
for fashion and technology items which are replaced more frequently At the same
time consumers can become attached to fashion items especially clothing which
then makes them reluctant to replace items and opt for repair instead
Behavioural Study on Consumersrsquo Engagement in the Circular Economy
48
Furthermore for fashion products there was a higher willingness to buy second
hand (clothes smartphones) or to rent or lease such products (smartphones)
It emerged from the focus group discussions that some consumers especially
those in potentially vulnerable situations were interested in purchasing
smartphones second hand to save money compared to brand new phones
A minority yet still sizable share of survey respondents were interested in
engaging with novel CE practices such as leasing products instead of
purchasing them The share of respondents who would be willing to lease a
product rather than purchase it was lowest for vacuum cleaners (10) and
highest for smartphones (25) These relatively low levels of interest may have
been partly driven by general unfamiliarity with such practices Yet taking into
consideration that leasing practices are novel there seems to be a sizable
market potential currently untapped by leasing providers Leasing and renting
practices are further discussed in section 442
31 Evidence from the literature and data collection
311 General willingness to engage in CE practices
The literature shows that consumers are to a certain extent willing to engage in CE
practices and are willing to pay for more durable products Consumersrsquo willingness to
engage in sustainable purchasing practices derives primarily from their concern about the
environmental impact of the linear economy and to a lesser extent from their desire to
save money for example by repairing or buying a second hand product
As several surveys show consumers take the environmental impact of their
purchasing decisions into account In a survey carried out by the French Agency for
Environment and the Management of Energy ADEME in 2013 65 out of a panel of
1000 French respondents reported environmental issues as being the most important of
their concerns while 53 chose better material and a better life standard as one of their
considerations when purchasing new products (ADEME 2014 p 10) Recent research
has found that German consumers also prioritise global environmental challenges like
climate change deforestation and over-fishing over more local and personal problems
such as the health advantages of bio-products45 In Romania consumers are also aware
of the benefits of recyclability (32) energy waste (34) and water waste (29)46 At
EU level Flash Eurobarometer 397 conducted in 2015 shows that on average more than
half of consumers (median of country-level results = 54) reported that they take the
environmental impact of goods and services into account when making a purchasing
choice47 Figure 15 illustrates consumer attitudes towards the environmental impact of
products by country
45 Benthin amp Gellrich 2016
46 Bejan Crisan Lakatos amp Lakatos 2012
47 European Commission 2013
Behavioural Study on Consumersrsquo Engagement in the Circular Economy
49
Figure 15 Consumer attitudes towards the environmental impact of products48
Source TNS Political amp Social 2013
Apart from taking the environmental impact of their purchasing decisions into account
recent Eurobarometer research has shown that 77 of EU citizens are generally willing
to pay somewhat more for products if they are confident that they are environmentally
friendly49 Moreover consumers also tend to be willing to pay more for longer
lasting products without necessarily knowing their environmental impact
Research making use of a focus group in England and Wales and a nationally
representative survey of 1104 consumers has shown that more than eight out of ten
consumers would be willing to pay extra for household electrical appliances that are
advertised to last longer and have a longer commercial guarantee or warranty On
average they would be willing to pay 10 more50 Although it is generally not the
foremost consideration when buying a new product consumers do see a long lifetime as
a core requirement and there is a clear interest from consumers in longer lasting
products51
In the Netherlands 55 of consumers take durability into consideration when making
purchases up from 50 last year Bruumlggenwirth amp Witte (2016 p 1) find that 29 of
consumers remain highly enthusiastic about the Circular Economy and are the
forerunners in engaging in CE practices These are known as the so-called ldquodriversrdquo and
ldquosympathisersrdquo However the group of the ldquowilling people who are willing to participate
in the Circular Economy but who are not leaders and who need to be motivated to
engage has grown from 22 to 26 last year
Consumers in the Nordic countries (SE NO FI and DK) are more willing to establish
circular behaviours such as recycling repair and second hand trade rather than renting
and co-owning products According to a survey conducted in the four Nordic countries in
which 300 respondents per country participated the main reason for consumers to
repair or buy second hand products is to save money To be specific 74 of
Swedish 67 of Norwegian 68 of Danish and 59 of Finnish respondents were
interested in repairing or buying second hand products because of potential cost savings
The same study highlights that millennials (young people born between 1990 and 2000)
in the Nordic countries are much more interested than the average population in
engaging in CE practices such as recycling repair and second hand trade and that
48 Note Values on the y-axis represent the percentage of respondents that answered the question ldquoConsidering everything you bought during the last two weeks did the environmental impact of any goods or services influence your choicerdquo in the survey with ldquoYes for all or most goods or services you boughtrdquo ldquoYes but only for somerdquo or ldquoYes but only for one or twordquo
49 European Commission 2013 p 55
50 Knight King Herren amp Cox 2013
51 Knight King Herren amp Cox 2013 p 4
Behavioural Study on Consumersrsquo Engagement in the Circular Economy
50
women age between 30 and 44 years with children living in urban areas are more open
to participate in circular activity of any description in the near future They are
characterised as ldquochange makersrdquo Nordic citizens are the most circular today and open
to do even more tomorrow and therefore they are the ones that companies and
governments should target52 In a 2014 Eurobarometer 77 of citizens in the EU claim
to prefer making an effort to repair their products to buying new ones and 37 are
willing to buy second hand household appliances because of the expected economic
savings
Moreover the decision to repair a product or buy a more durable product may be
influenced by the behaviour of others As mentioned above in the Netherlands the
group of people who are willing to participate in the Circular Economy but who are not
leaders and who need to be motivated to engage was the fastest growing from 22 in
2014 to 26 last year53 This role as ldquolaunching customerrdquo could be played by national
governments or the European Union54
Several factors play a role in accounting for the growing consumer interest in
participating in CE practices For instance consumers can frequently change their
behaviour patterns because of their growing concern about environmental preservation
85 out of the 1000 French respondents indicated that they believed that a change of
lifestyle was needed because of environmental concerns resulting in a bigger
commitment to reuse products55 Moreover social factors may also account for the
willingness of consumers to engage in the Circular Economy As in Spain this
commitment can also be explained by a renewed interest for the feeling of belonging to a
community and the wish to participate in social networks56 Culturally consumers will
need to abandon their conception of ownership of the product for more sustainable
usage57 Lastly the rise of collaborative consumption tends to indicate an increasing
consumer preference for having access to a product rather than owning it (European
Environment Agency 2017) A survey of 8670 respondents carried out in Belgium Italy
Portugal and Spain indicated that 72 of the respondents participate in collaborative
economy activities 58 For an in-depth discussion of the drivers that play a role to
encourage consumers to engage in CE practices see Sections 411 421 and 421
However despite this willingness to preserve the environment as mentioned above it
appears that consumers can be quite reluctant to adopt more sustainable
purchasing choices CREDOC a French observatory specialising in making analyses of
the living conditions in French households researches yearly consumption behaviours In
2013 only 14 out of all the households surveyed indicated that they would adopt by
themselves consumption behaviour in line with the Circular Economy59 (A total change of
mind-set may be required to shift from linear economic consumption to a circular)
312 Willingness to engage in CE practices across products
The reviewed literature did not provide much information on consumer willingness to
engage in Circular Economy practices across products Only the WRAP study on the
product life time of electrical and electronic products stated consumersrsquo willingness to
purchase more durable product for a specific product category The study illustrates
consumersrsquo willingness to engage into certain CE practices for specific product types
ldquoworkhorserdquo products which include washing machines fridges and vacuum cleaners
52 SB Insight 2017
53 Bruumlggenwirth amp Witte 2016 p 1
54 Pijnenburg 2014
55 ADEME 2014 p 10
56 Cerdaacute amp Khalilova 2015
57 SPF Santeacute publique Seacutecuriteacute de la chaicircne alimentaire et Environnement 2014
58 Split of respondents per country BE (2132) IT (2336) PT (1698) amp ES (2313) OCU et al 2016
59 French Ministry of Ecology Sustainable Development and Energy 2014 p 38)
Behavioural Study on Consumersrsquo Engagement in the Circular Economy
51
The study suggests that consumers are willing to pay over 30 more for such products
that are backed by a longer standard warranty60 also discussed in section 411
32 Evidence from the stakeholder interviews
321 General willingness to engage in CE practices
The interviewees tended to confirm the findings from the literature review consumers
are generally willing to engage in Circular Economy practices The main difference
between the literature reviewed and stakeholder interviews is that only one interviewee
mentioned consumersrsquo increasing environmental concern as a primary factor for
consumersrsquo engagement in more sustainable purchasing practices Also a representative
of a European e-commerce trade association highlighted that online purchasing
consumers do not pay much attention to durable or repairable products Thus according
to interviewees consumers are less concerned than they claim to be about the
environmental impact when engaging in circular purchasing practices Furthermore
interviewees highlighted differences in attitudes towards Circular Economy practices
across EU Member States
Representatives of European and national consumer associations highlighted that
consumers are willing to engage in CE practices such as buying more durable
products even if that means that they need to pay more for these products One
European consumer association mentioned that consumers with lower incomes are
normally more impacted if a product breaks therefore they tend to have a greater
interest in the durability of products A good way of measuring consumersrsquo engagement
with product durability and reparability is to examine whether at the moment of purchase
consumers buy an extended guarantee service plan or insurance If a consumer has
purchased one of these things it is very likely they have considered durability and ease
of repair to some degree according to a representative of an NGO based in the UK
However it is important to note that consumers may take longer warrantiesextended
commercial guarantees61 as a proxy for durability The European trade association
representative highlighted that even though longer warrantiesextended commercial
guarantees are used as proxies it does not mean that products with longer
warrantiesextended commercial guarantees are easier to repair or more durable
Regarding reparability the situation is a bit different according to a representative of a
European consumer association as consumers are interested in repair but the
process is often too difficult long or expensive A Dutch Circular Economy expert
also emphasised that people are very interested in repair and self-repair and he
mentioned that repair is still a very niche practice among consumers but that it has a lot
of potential However an NGO representative from the Czech Republic indicated that lsquothe
Czech Republic is a nation that is used to repairing if something breaksrsquo
Most of the national and European trade associations also believe consumers are
willing to engage in more suitable purchasing practices In addition national and
European trade association representatives highlighted that consumers are starting to
shift their need from product ownership to product accessibility According to a
representative of a European trade association in Austria consumers are starting to rent
washing machines from an organisation that repairs used electronic appliances The
organisation offers repair services and replacement services in case the rental machine
stops working When available leasing and repair services are being considered more
often than before by consumers Only a representative of a European e-commerce trade
association highlighted that consumers are less willing to engage in more suitable
60 WRAP 2013
61 According to Article 2 (14) of the Directive 201183EU a commercial guarantee is defined as ldquoany undertaking by the trader or a producer (the guarantor) to the consumer in addition to his legal obligation relating to the guarantee of conformity to reimburse the price paid or to replace repair or service goods in any way if they do not meet the specifications or any other requirements not related to conformity set out in the guarantee statement or in the relevant advertising available at the time of or before the conclusion of the contractrdquo See httpeur-lexeuropaeulegal-contentENTXTPDFuri=CELEX32011L0083amprid=1
Behavioural Study on Consumersrsquo Engagement in the Circular Economy
52
purchasing practices meaning buying longer lasting goods and products that could be
repaired when buying online The interviewee highlighted that this is due to the
decreasing prices of technology consumers tend to change their products more
regularly
Representatives from two Dutch public authorities said that there are important
differences between what consumers say in surveys and what their actual considerations
are when purchasing products This is because price differences between durable
and less durable products still play an important role However as mentioned by
the same interviewees it is important to take into account the type of consumers
Many consumers do not care about the Circular Economy at all but some consumers are
intrinsically motivated to live sustainably and are usually willing to consider the durability
or reparability of products
322 Willingness to engage in CE practices across products
From the interviews conducted it has become clear that there are some variations across
products for certain products consumers are more willing to engage in CE practices
than for other products
Consumers are willing to invest more in durable products that are less dependent
on fashion trends like washing machines and other white goods as highlighted by a
Dutch public authority representative On the other hand according to an expert in the
field of Ecodesign product durability is a concern for consumers only for those products
that break down often (eg smartphones) Both interviewees agreed that for large
domestic appliances durability is a concern when purchasing a new product and
consumers would be willing to pay more if these products lasted longer Interviewees
confirmed this statement from the literature review in Section 312 consumers are
willing to pay more for more durable washing machines An interviewee from a
Hungarian NGO also highlighted that consumers take durability characteristics of large
domestic appliances more into account in comparison to smartphones when purchasing
because there is more durability information available for this product category
According to a Circular Economy expert from the clothes industry if consumers perceive
pieces of clothing to be more fancy or special they take better care of them and they
are more willing to bring it to a repair service or repair it themselves It is
important to note that the degree to which consumers are willing to pay for the repair of
their products is dependent on the consumerrsquos perception of how special the piece of
clothing is and not how expensive the piece of clothing actually was On the other hand
an NGO representative mentioned that young consumers are not used to self-repair they
do not know how to sew anymore and are not interested in acquiring the skill The
willingness to repair or replace a product is influenced by the degree of product
attachment People feel an emotional attachment to certain products (clothes and
phones for instance) and consequently they want these to last longer as highlighted by
a representative of a UK NGO
Furthermore two Czech interviewees one representing a consumer association and the
other an NGO highlighted that consumers expect more durability and reparability
from electronic products than from clothes even though they have observed that
consumers are getting more and more used to products not being repairable However
the interviewees reported that consumer willingness to engage more in CE practices
depends on how convenient a repair would be for them For the two product categories
mentioned electronic products and clothes there are established repair services and
therefore these are easier to repair For other products this is less so therefore
consumers are also less willing to let these products be repaired The interviewees noted
that consumers are also more willing to engage in CE practices for product groups such
as white goods which are traditionally more consumer-oriented and which have more
developed systems for customer care services including repair
Behavioural Study on Consumersrsquo Engagement in the Circular Economy
53
33 Evidence from the focus groups
331 Willingness to engage in CE practices across products
Durability
Focus group participants considered durability - the time period during which a product
can be used before it breaks down ndash to be highly important (see also section 431)
Therefore participants across the four countries were very interested in purchasing
products that lasted longer This was particularly the case for products that participants
considered to be ldquoimportant investmentsrdquo such as dishwashers and washing machines
When talking about white goods (washing machinesdishwashers) views with regard to
the importance of durability were nearly unanimous Opinions with regard to the
importance of durability varied more when talking about other types of products Some
participants felt that durability was just as important for products such as televisions
and smartphones while for others technological progress was a factor influencing them
to purchase this type of products more frequently and therefore their expectations with
regard to these productsrsquo lifetime were lower
ldquoI like having products a long time I do not need the newest device I still have
my TV that I bought 30 years ago It still works so why should I buy a new onerdquo
(Man vulnerable group Berlin)
ldquoWell you know there are so many new developments and sure I like to have a
new TV or a new Smartphone from time to time I have old smartphones in my
drawers and I think they still workrdquo (Man mixed group Berlin)
Similarly for clothing participants expected durability to vary according to price and
brand Fashion was also brought up because people tend to purchase certain clothing
items more often due to changing fashion trends
Reparability
Opinions varied with regard to having products repaired Participants were generally
willing to have products repaired (particularly white goods such as washing machines
and dishwashers) as long as they were still under warranty Once products were no
longer under warranty preferences towards having them repaired or replaced with new
ones varied according to various factors such as
Price of repair vs price of the new product ldquoIf the difference in cost between
repair and a new one is too little I prefer the new one Maybe I also get some
improvementsrdquo (Male vulnerable group Stockholm)
The price of the product itself (the lower the price the more likely participants
were to prefer a replacement) ldquoMy hoover for 19 euros I wouldnrsquot think about fixing
itrdquo (Man mixed group Dublin)
The time it would take to have a product repaired
Technological progress
Trust towards the quality of the repair ldquoWhen they repair a product you never
know if it will really work again properly and you do not know how long it will work
again I would rather decide on a new one also because there are new technologies
out there yet againrdquo (Man mixed group Berlin)
Views also varied in the case of smartphones Some would prefer buying a new one
because technology for smartphones progresses fast Others flagged the fact that
smartphones carry a lot of personal data (such as pictures) This factor adds emotional
value to them moreover transferring this type of information from one device to
another was perceived as difficult As such having a smartphone repaired was
sometimes seen as preferable
ldquoMy smartphone has all my pictures and memories on it I would even say I have
an emotional connection to it That is why I do prefer to repair it Also because it
is always a hassle to transfer everything on a new phonerdquo (Woman vulnerable
group Berlin)
Behavioural Study on Consumersrsquo Engagement in the Circular Economy
54
In Germany and Ireland willingness to have products repaired was somewhat stronger
among some of the participants from the vulnerable groups However the above-
mentioned factors were also taken into account by these participants
For clothing Irish participants (particularly from the vulnerable group) flagged the fact
that they would be willing to have them repaired This applied however mainly to more
expensive purchases such as shoes or coats and to a lesser extent to other clothing
items
ldquoI had a jacket for ages and the buttons started to come off so I asked my dad
to sew them back on Thatrsquos reparabilityrdquo (Man mixed group Dublin)
When discussing reparability participants mainly took into account aspects such as
saving money or being able to keep their products Reparability being linked to
environmental aspects was also brought up although to a much lesser extent For
example some participants in Sweden brought up the possibility of saving resources
ldquoI really do want to think about these things We have to take care of the planetrdquo
(Male mixed group Stockholm)
Recyclability
Participants in Sweden Germany and Ireland were generally willing to recycle products ndash
whether it was electronics or clothing Willingness to recycle was somewhat lower in the
Czech Republic In this country recycling was seen as time consuming as well as too
much of an effort Participants felt that recycling should be motivated by a financial
bonus for example a discount on the next purchase
Purchasing refurbished goods and second hand products
Views with regard to purchasing refurbished electronics (whether large white goods or
smartphones) were mixed In Ireland some participants (particularly from the vulnerable
group) were more willing to do this as long as they felt that the price-quality ratio was
good or that there was a large price difference between refurbished (or second hand)
products and new ones Others were concerned with the fact that products bought
refurbished or second hand would break down more easily
ldquoAnything if itrsquos quality for a bargain If the price is right also a washing
machinerdquo (Man vulnerable group Dublin)
ldquoSmartphone - I would be tempted because they are cheaper Smartphones are
so expensive The price is great then and they give the details and mention itrsquos
refurbished My current smartphone is really old and it got my moneyrsquos worth out
of it I would love to get a new one In the refurbished shop it will be 34th of the
price to buy a new onerdquo (Woman vulnerable group Dublin)
ldquoThe last time I went to buy a new phone I actually went in and looked at the
second hand phones but then still bought a new one For the same money I can
buy a new phone The other one second hand was about 2-3 years You know
what you get What you get is an old phone and for a bit more money you get a
new onerdquo (Man mixed group Dublin)
In the Czech Republic purchasing refurbished electronics was not very common and
some participants even had bad experiences with such purchases
We wanted to buy a Rainbow vacuum cleaner that cannot be bought in shops
just from dealers I heard only good things about them how wonderful they were
but they are very expensive Because we have allergic kids I wanted to buy it so
because of the price I got some refurbished one It was terrible it did not vacuum
much Moreover it was from Germany I kept writing to them that it did not work
but at the end it stayed with us so I threw it away and bought a normal bag-less
onerdquo (Woman mixed group Prague)
On the contrary across the four countries purchasing second hand clothing was a lot
more common (especially among the more vulnerable groups) Reasons for this were
related to cost but also to quality Many participants felt that second hand (or ldquovintagerdquo)
clothing was of higher quality and more durable than new clothing
Behavioural Study on Consumersrsquo Engagement in the Circular Economy
55
ldquoIn the past clothing was of much better quality than today and often you find
clothes that have hardly been wornrdquo (Woman vulnerable group Prague)
ldquoI really like to buy second hand clothing and I also repair my clothes when I
really like them I feel it is a good thing to dordquo (Woman vulnerable group Berlin)
ldquoI went to second hand shop because I was looking for a costume for a party but
then I got good pair of jeans Levirsquos and they were very cheap (20 euros) and very
good quality and now Irsquom going to go back And you see stuff that yoursquove never
seen before but if you go into another shop you look at stuff that is currentrdquo
(Man vulnerable group Dublin)
Participants also felt positive about purchasing second hand furniture or furniture
made from recycled materials Participants were not only motivated to purchase second
hand furniture by economic reasons but also aesthetics
ldquoI buy furniture second hand and polish them again It depends I shop in second
hand shops I would buy glasses and different thingsrdquo (Woman vulnerable group
Dublin)
ldquoThere are some shops that only sell products made from recycled material but
that is clothes or small stuff not machines Even Ikea has a small department of
stuff like that It is a good ideardquo (Man mixed group Stockholm)
Generally participantsrsquo willingness to engage in circular economy practices was
mainly driven by financial factors and by the need of having products taken away once
they break down or are no longer in use (recyclability) Environmental reasons were also
brought up but to a slightly lesser extent Participants in the Czech Republic were
somewhat less inclined to mention environmental reasons than those in other countries
34 Evidence from the consumer survey
Participants were asked to assess several statements regarding general CE related
behaviours Results are depicted in Table 10
With respect to keeping things for a long time agreement rates were high Overall
93 agreed to this statement with 42 even stating strong agreement In addition
78 of the participants agreed that they always recycle their unwanted
possessions including 26 even strongly agreeing Agreement with the statement of
always repairing possessions if they break was lower 64 including 11 stating
strong agreement with the statement Buying products second hand received the
lowest agreement rates with respect to CE related behaviours (28 including 5
strongly agreeing)
In addition participants were asked for their preference for fashion and new gadgets
Only 34 agreed with always buying the latest fashion for clothes including 5
strongly agreeing New electronic goods and gadgets seemed to be more important
to participants Overall 45 agreed to always buy new gadgets including 8 who even
strongly agreed
Behavioural Study on Consumersrsquo Engagement in the Circular Economy
56
Table 10 Agreement to statements on general CE-related behaviours (in )
Strongly
disagree
Tend to
disagree
Tend to
agree
Strongly
agree
I always keep things I
own for a long time
08 58 517 417
I always recycle my
unwanted possessions
34 188 520 258
I always repair my
possessions if they break
74 291 527 108
I buy second hand
products
311 405 238 46
I always buy the latest
fashion for clothes
217 450 289 45
I always buy new the
newest electronic goods
and gadgets
152 396 371 82
Note Participants had to rate six different statements regarding the question Q35 ldquoTo what extent do you agree or disagree with the following statements about yourselfrdquo N=12064
Source ConPolicy analysis of consumer survey data
These results are supported by results displayed in Figure 16 When calculating average
agreement to these statements and ranking them it was found that consumers in the
survey showed the strongest agreement to the statement lsquoI always keep things I own for
a long timersquo followed by lsquoI recycle my unwanted possessionrsquo In contrast average
agreement rates were below 0 ie (rather) disagreeing for buying second hand
products Similarly buying new gadgets or fashion resulted in negative average
agreement ie consumers in the survey indicated that they (on average) disagreed with
the corresponding statements
Figure 16 Agreement to statements on general CE-related behaviours (average)
Note Participants had to rate six different statements regarding the question Q35 ldquoTo what extent do you agree or disagree with the following statements about yourselfrdquo Answer categories were labelled with ldquoStrongly agreerdquo corresponding to a value of +10 ldquoTend to agreerdquo corresponding to a value of +3 13 ldquoTend to disagreerdquo corresponding to a value of ndash 3 13 and ldquoStrongly disagreerdquo corresponding to a value of -10 Average values above 0 correspond to (rather) agreeing to the statement while values below 0 correspond to (rather) disagreeing Hence an average value of 0 corresponds to neither agreeing nor disagreeing N=12064
Source ConPolicy analysis of consumer survey data
Behavioural Study on Consumersrsquo Engagement in the Circular Economy
57
Next these answers where analysed by country and socio-demographic factors The
results are displayed in detailed tables in Section 7 in the Annex document and
summarised here below
For the statement I always keep things for a long time respondents in all countries
on average revealed high agreement rates The three countries with the highest average
agreement rates were Germany Austria and Portugal The lowest agreement rates were
found in the Czech Republic Hungary and Latvia With respect to participantsrsquo age a
positive trend was found The higher the age category the higher average agreement
With respect to education and income no systematic differences between average
agreements were observed
Respondents agreed less to the statement of always recycling their possessions
compared to keeping things for a long time The highest agreement rates were found in
Sweden but Ireland and Spain similarly revealed high agreement rates The lowest
agreement rates were observed in Hungary and Latvia Again a positive trend was
observed for the different age groups while education and income seemed to not follow
systematic patterns
As stated above respondents less often said they always repaired their possessions
This was true for all the different Member States The Czech Republic and Romania on
average even rather disagreed with the repair statement While all other Member States
at least tended to agree With respect to the other socio-demographic factors ie age
education and income no systematic patterns were found
Agreement with buying second hand products was on average even lower The
country averages indicated disagreement with the statement especially in Austria Spain
and the Czech Republic When looking at the different age categories a negative trend
was found The higher the age category was the lower was the self-reported agreement
rate With respect to the other socio-demographic factors no systematic patterns were
observed
In the fashion-category there were interesting country differences as well In all
countries but Romania survey participants on average tended to disagree with lsquoalways
buying the latest fashion for clothingrsquo Agreement rates were lower among older age
groups With respect to education and financial status differences were not as
pronounced
Lastly agreement rates on buying new electronic gadgets were on average also low
Romania was again an exception in this category On average Romanian consumers
indicated to tend to agree to buy new electronic items The same was true for the
Netherlands and France With respect to age and education no specific patterns were
observed while consumers indicating their financial situation to be very difficult indicated
less agreement to buying new gadgets compared to wealthier income groups
In parallel participants were asked the same question but this time not with respect to
their own behaviour but with respect to the behaviour of their close friends and relatives
Results are displayed in Table 11
It appears that a majority of respondents think that their peers reveal similar CE-related
behaviours to themselves A majority (80) agreed that their friends and relatives keep
things they own for a long time including 12 who strongly agreed They also believe
that their friends and relatives recycle their unwanted possessions (70 tended to
agree and 12 strongly agreed) and the majority of participants also stated agreement
to the statement that friends and relatives always repair their possessions if they
break (61 including 6 strong agreement) Similar to their own behaviour agreement
to friends and relatives buying second hand products was lower with 34 (including
2 strongly agreeing)
Friendsrsquo and relativesrsquo preferences for fashion or gadget trends were similarly aligned
with own behaviour 43 agreed with the statement that their friends and relatives
always follow the latest trend or fashion including 4 stating their strong
agreement In addition 46 indicated their agreement to the statement that their
friends and relatives always buy the newest electronic goods and gadgets (including
5 strongly agreeing)
Behavioural Study on Consumersrsquo Engagement in the Circular Economy
58
Table 11 Agreement to statements on general CE-related behaviours of friends and
relatives (in )
Strongly
disagree
Tend to
disagree
Tend to
agree
Strongly
agree
Keep things they own for a
long time
10 190 678 121
Recycle their unwanted
possessions
26 274 580 120
Always repair their
possessions if they break
43 352 550 55
Buy second hand goods 160 499 319 22
Always follow the latest
trend or fashion
100 468 394 38
Always buy the newest
electronic goods and
gadgets
87 450 413 51
Note Participants had to rate six different statements regarding the question Q91 ldquoTo what extent do you agree or disagree with the following statements about your close friends and relatives Most of my close friends and relativeshelliprdquo N=12064
Source ConPolicy analysis of consumer survey data
These results are supported by Figure 17 wherein average agreement to the
corresponding statements is displayed The ranking of agreement rates for friends and
relatives is in parallel to those for survey participants themselves (compare Figure 16
from above)
Figure 17 Agreement to statements on general CE-related behaviours of friends and
relatives (average)
Note Participants had to rate six different statements regarding the question Q91 ldquoTo what extent do you agree or disagree with the following statements about your close friends and relatives Most of my close friends and relativeshelliprdquo Answer categories were labelled with ldquoStrongly agreerdquo corresponding to a value of +10 ldquoTend to agreerdquo corresponding to a value of +3 13 ldquoTend to disagreerdquo corresponding to a value of ndash 3 13 and ldquoStrongly disagreerdquo corresponding to a value of -10 Average values above 0 correspond to (rather) agreeing to the statement while values below 0 correspond to (rather) disagreeing Hence an average value of 0 corresponds to neither agreeing nor disagreeing N=12064
Source ConPolicy analysis of consumer survey data
Next participants were asked to rate their agreement with further statements regarding
environmental attitudes and general CE-behaviours Results can be found in Table 12
Behavioural Study on Consumersrsquo Engagement in the Circular Economy
59
With respect to environmental attitudes high agreement rates can be found Overall
91 of the participants agreed with the statement that it is important to be
environmentally friendly including 40 agreeing strongly Another 62 agreed with
the statement that they want their friends to know that they care for the
environment including 14 agreeing strongly
Generally respondents displayed attitudes in favour of CE practices A majority of
participants (64) stated that they know the expected lifespan of a product when
they buy things (with 7 agreeing strongly) Agreement with being aware of repair
services for the products they own was 58 with 9 indicating strong agreement
With respect to the statement that second hand products are usually good quality
49 of participants indicated their agreement including 3 agreeing strongly
At the same time a majority of respondents 77 also indicated preferences for
brand new possessions Yet only 18 of participants stated that they agreed to the
statement that they wanted their friends to know that they own the latest trend or
fashion (including 3 strong agreement)
Table 12 Agreement to further statements on general CE-related behaviours and
environmental attitudes (in )
Strongly
disagree
Tend to
disagree
Tend to
agree
Strongly
agree
It is important to be
environmentally friendly
15 74 516 395
I want my friends to know
that I care for the
environment
85 290 486 139
When I buy things I know
the expected lifespan of the
product
44 319 569 67
I am aware of repair
services for the products I
own
67 349 495 89
Second hand products are
usually good quality
50 457 460 32
I much prefer possessions
that are brand new
34 191 552 222
I want my friends to know I
own the latest trends or
fashion
381 439 154 27
I trust claims made by
companies about their
products
72 454 446 28
I am usually very busy and
lack free time
103 395 420 81
If something is good
enough I donrsquot need it to
be perfect
17 145 686 152
Note Participants answered the question Q41 ldquoTo what extent do you agree or disagree with the following statementsrdquo N=12064
Source ConPolicy analysis of consumer survey data
Figure 18 presents further insights on the question Here average agreement was
calculated for each item and results were ranked by average agreement The highest
Behavioural Study on Consumersrsquo Engagement in the Circular Economy
60
average agreement was reported for the importance of being environmentally friendly
On the lower end survey participants on average disagreed with the statement lsquoI want
my friend to know I own the latest trends or fashionrsquo
Figure 18 Agreement to further statements on general CE-related behaviours and
environmental attitudes (average)
Note Participants answered the question Q41 ldquoTo what extent do you agree or disagree with the following statementsrdquo Answer categories were labelled with ldquoStrongly agreerdquo corresponding to a value of +10 ldquoTend to agreerdquo corresponding to a value of +3 13 ldquoTend to disagreerdquo corresponding to a value of ndash 3 13 and ldquoStrongly disagreerdquo corresponding to a value of -10 Average values above 0 correspond to (rather) agreeing to the statement while values below 0 correspond to (rather) disagreeing Hence an average value of 0 corresponds to neither agreeing nor disagreeing N=12064
Source ConPolicy analysis of consumer survey data
Finally participants were asked to indicate whether they search for durability and
reparability information when purchasing a product Table 13 shows the results
62 indicated that they always search for information on how long a product will
last (including 10 strong agreement) Similarly a majority also indicated searching
for reparability information (55 including 8 strongly agreeing with the statement)
Behavioural Study on Consumersrsquo Engagement in the Circular Economy
61
Table 13 Agreement to searching for durability and reparability information (in )
Strongly
disagree
Tend to
disagree
Tend to
agree
Strongly
agree
I always search for
information on how long a
product will last
54 329 516 102
I always search for
information on how easy it
is to repair a product
73 378 464 84
Note Participants answered the question Q51 ldquoTo what extent do you agree or disagree with the following statementsrdquo N=12064
Source ConPolicy analysis of consumer survey data
Figure 19 displays results when transferring answer categories and calculating average
agreement It can be found that average agreement rates for both statements resulted in
a positive but rather low average agreement ie survey participants indicated that they
rather agreed on searching for durability and reparability information
Figure 19 Agreement to searching for durability and reparability information (average)
Note Participants answered the question Q51 ldquoTo what extent do you agree or disagree with the following
statementsrdquo Answer categories were labelled with ldquoStrongly agreerdquo corresponding to a value of +10 ldquoTend to agreerdquo corresponding to a value of +3 13 ldquoTend to disagreerdquo corresponding to a value of ndash 3 13 and ldquoStrongly disagreerdquo corresponding to a value of -10 Average values above 0 correspond to (rather) agreeing to the statement while values below 0 correspond to (rather) disagreeing Hence an average value of 0 corresponds to neither agreeing nor disagreeing N=12064
Source ConPolicy analysis of consumer survey data
In addition results on searching for durability as well as reparability information were
analysed by country and socio-demographic factors which are summarised here below
and displayed in detail in Section 7 in the Annex document
With respect to searching for durability information the highest agreement rates
were found for Romania In contrast the lowest agreement rates were observed in
Sweden the Netherlands and Germany where participants on average indicated that they
neither agreed nor disagreed to the statement With respect to age a small positive
trend was observed and similarly participants with higher education also revealed higher
average agreement rates Respondentsrsquo financial situation on the other hand did not
influence agreement rates
Searching for reparability information was country dependent as well While
countries such as Portugal Romania and Hungary tended to agree that they searched for
reparability information Germany Sweden and in particular the Netherlands revealed
agreement rates below 0 ie on average they disagreed with the statement of searching
for reparability information There were also small age trends While agreement rates
among the youngest age group were below 0 indicating that on average participants did
not tend to search for reparability information it was above 0 among older age groups
Education again did not seem to play an important role while respondentsrsquo financial
situation did in the sense that poorer individuals were more likely to search for
reparability information
Behavioural Study on Consumersrsquo Engagement in the Circular Economy
62
341 Willingness to engage with leasing products
As a next step participantsrsquo willingness to engage with leasing products was analysed A
few companies across the EU have recently launched leasing models for baby clothing
consumer electronics or jeans62 The leasing business model is based on circular
practices as the products are not owned by the individual but instead the leasing price
includes maintenance and repair as well as exchange of the products when it has gone
out of fashion or when the consumer wishes an upgrade This way the same product
may be used by more than one consumer and materials from old products may be
recycled into new ones
The consumer survey tried to elicit consumer preferences for such leasing models via a
hypothetical choice exercise Each respondent was asked to indicate their preference
between a lsquostandardrsquo full ownership of a product or a leasing contract for a varying
number of months Respondents were told that repairs and replacement services in case
of a defect were included in the monthly price
Respondents were given the following choices
bull Purchase the product for full price
bull Lease product for 612244860 months
To ensure realism of the task monthly lease prices were calibrated using examples from
actual leasing business models Since actual business models tend not to exceed a
maximum lease of 24 months longer leases in this exercise were calibrated assuming
that beyond 24 months a product would become more likely defective or require
replacement pushing costs beyond the initial full purchasing price
The total cost of leasing for different lease durations amounted roughly to63
Table 14 Duration and cost of leasing
Lease duration Total cost of lease contract
6 months approx 40 of full purchasing price
12 months approx 60-70 of full purchasing price
24 months approx 100-110 of full purchasing price
36 months approx 130-135 of full purchasing price
48 months approx 150-165 of full purchasing price
60 months approx 165-190 of full purchasing price
Visible from Figure 20 across all product types a vast majority of participants preferred
purchasing the product instead of leasing it Around 10-15 of respondents indicated an
interest in the various leasing propositions for TVs dishwashers vacuum cleaners and
jeans Only for smartphones interest in leasing was higher around 25 and another
18 of respondent indicating lsquoDonrsquot knowrsquo which may be an indicator for indecision
62 See for example httpsviggaus (baby clothing) httpswwwottonowde (consumer electronics and durables) and httpwwwmudjeanseu (jeans)
63 Price levels were adapted for each type of product between smartphones TVs dishwashers vacuum cleaners and jeans
Behavioural Study on Consumersrsquo Engagement in the Circular Economy
63
Over all products longer lease durations were less preferred that shorter ones While
between 2-8 of the participants indicated to be willing to lease between 6 and 24
months only 0-3 stated to be willing to lease between 36 and 60 months64
The Annex displays results for the individual lease duration categories and by product in
more detail
Figure 20 Willingness to lease products for different time periods (in )
Note Participants answered the question Q71 ldquoSuppose you wish to get a new smartphone TV dishwasher vacuum cleaner jeans You have the option to either buy the phone outright for euro34999 euro71999 euro35999 euro15999 euro5999 or lease it for a certain number of months Leasing the product means that you will not own the product instead you will return it at the end of the lease for example to start a new lease for a new product or continue to use your product at a lower price Included in the monthly lease are repairs and replacement services in case of a defect Which option would you preferrdquo Smartphone N=2412 TV N=2416 Dishwasher N=2409 Vacuum cleaner N=2412 Jeans N=2415
See the Section 7 in the Annex document for a breakdown of different lease durations between 6 and 60 months
Source ConPolicy analysis of consumer survey data
When further splitting preferences for different lease durations and products 6-7 of the
participants were willing to lease televisions dishwashers and vacuum cleaners for a year
or less at a cost-equivalent of less than 70 of the actual total purchasing price Longer
leases tended to be less popular Thus it seems that there was little willingness to pay a
mark-up on original purchasing prices for maintenance and replacement services which
would be offered by leasing companies For smartphones 5-7 of respondents indicated
interest in leasing the product for each length of 6 12 and 24 months It is quite likely
that the willingness to lease smartphones is grounded in the fact that phone providers
across the EU have for a long time offered phone contracts which included
communication and a handset with typical contract durations between 12 and 24 months
The results here are corroborated also by findings presented in section 442 which report
respondentsrsquo actual experience with renting or leasing products Indeed only a small
minority of respondents (1-3) have rented or leased any of the products under
examination in the past 5 years It is thus likely that the relatively low willingness to
lease products in this hypothetical exercise was at least partly driven by substantial
unfamiliarity65 with the novel type of business model Indeed it could be conjectured
64 Within the two duration categories ie shorter with 6 to 24 months and longer with 36 to 60 months no sizable differences were found with respect to respondentsrsquo willingness to lease
65 In situations of uncertainty individuals have been shown to use the decision heuristic of choosing what is familiar to them instead of considering their true preferences See for example Della Vigna (2009) lsquoPsychology and Economics Evidence from the Fieldrsquo Journal of Economic Literature
56
27
18
72
15
14
74
13
13
79
11
10
74
16
11
0 10 20 30 40 50 60 70 80 90 100
Purchase for full price
Lease for 6 to 60 months
Donrsquot know
Smartphone TV Dishwasher Vacuum Cleaner Jeans
Behavioural Study on Consumersrsquo Engagement in the Circular Economy
64
that the willingness to engage with leasing contracts is actually sizable given the
unfamiliarity with this type of business model With growing familiarity it is well possible
that the market size for renting and leasing products could further grow thus enhancing
consumer engagement in with the Circular Economy
Findings presented in this study see for example section 44 show that respondents
desired fully owning their products and wished to use new unused products These
preferences clearly limit the attractiveness of leasing models and the study does not
deliver evidence as to whether these preferences might change if leasing models become
more widely available and better known
Behavioural Study on Consumersrsquo Engagement in the Circular Economy
65
4 Drivers barriers and trade-offs faced by consumers
This section provides information gathered on factors which motivate and discourage
consumers to engage in the CE for example via buying more durable products
repairing products when they are broken rather than replacing them buying second
hand products or leasing products rather than buying them In other words it
provides evidence gathered on the drivers (ie motivators) and barriers (ie obstacles)
to consumer engagement in the Circular Economy
This section reports findings from all methods (ie literature stakeholder interviews
focus groups consumer survey and behavioural experiment) The literature stakeholder
consultations and focus groups covered a broad scope to capture a wide range of drivers
and barriers The consumer survey built upon the findings of this qualitative research by
asking about consumersrsquo past experiences with CE practices and their reasons for taking
Circular Economy decisions (or not) Finally the behavioural experiment looked more
closely into what drives consumersrsquo decisions to repair or replace a broken product The
relative importance of economic social and psychological aspects that determine
consumersrsquo engagement in Circular Economy practices is also highlighted in this section
Key findings
It emerged clearly from the different strands of research that price is the most
important driver and simultaneously a barrier for consumer engagement
in the CE followed by convenience
More specifically in the literature three main drivers have been named for
consumers to participate in the Circular Economy which were also confirmed by
the interviewed stakeholders
o Providing consumers more and better information about the durability
of products
o Designing products with better CE credentials and
o Widening the offer of repair services from manufacturers and retailers
Four main barriers were distinguished in the literature review and corroborated
by stakeholders as well namely
o consumersrsquo lack of knowledge
o the absence of reliable information about durabilityreparability
features of a product
o high cost of repair services and
o consumersrsquo lack of trust in repair services
It seems to emerge from the findings in the literature stakeholder interviews and
focus groups that consumers are to some extent willing to trade-off price
and CE product characteristics For example consumers in a previously
conducted behavioural study were found to be willing to pay more for products
with higher durability However as highlighted by stakeholders such willingness
to pay for more durable products hinges on information provision about product
durability
Individual stakeholders have named various other factors which could act as
drivers of more engagement with the CE such as social norms about (resource)
efficiency extended warranties and better education about the topic On the
other hand they named as potential barriers to more CE engagement practical
problems with repair the availability of low-quality but cheap products fashion
and style social pressure marketing and advertising conspicuous consumption
and the cultural problem where society does not reward consumers who do
engage in CE practices
A key barrier identified by the focus groups was that consumers found it
difficult to pinpoint the durability of products Furthermore there was a
sense that newer generations of products were less durable than products that
were produced some years ago This discussion around lower durability of newer
products sometime led participants to mention the concept of planned
obsolescence
The consumer survey has instead revealed that survey respondents generally
indicated being aware of product durability and reparability (section also
34) Yet when asked specifically about the provision of such information many
Behavioural Study on Consumersrsquo Engagement in the Circular Economy
66
indicated a desire for receiving better information because they felt that it
was often difficult to find information regarding how long products would last and
how easy it was to repair products
Some interesting country differences emerged from the survey Dutch and
German survey respondents were less likely to search for durability information
compared to respondents from other Member States Dutch respondents also did
not seem to lack better information while German respondents felt strongly that
durability and reparability information was difficult to find Respondents from
Romania on the other hand were more likely to search for durability information
found this information relatively easy to find but still desired further improvement
of information provision
With respect to other socio-demographic factors age played a role for drivers and
barriers While older participants indicated to search more frequently for
durability and reparability information (section 34) they also expressed a
stronger preference for better information and indicated more frequently that
it was difficult to find the appropriate information
This indicates that the current state of information provision regarding product
durability and reparability might be a potential barrier for engaging in the CE
Providing information consistently and in straightforward format might thus be
seen as a driver for further CE engagement Findings from the behavioural
experiment shown in section 65 confirmed these findings from the consumer
survey
The study did not find overwhelming evidence of a lsquothrowaway economyrsquo This
means that the study results were mixed Though large shares of respondents
have not repaired broken products (36) a majority of consumers instead
did repair broken products across all product categories (63) Results by
product are presented in section 441
Among those with repair experience a majority had products repaired for them by
friends family or professional services
Self-repair was generally less frequent (12) compared to having products
repaired (51) The incidence of self-repair furthermore varied by product
category Self-repair was most prominent for clothing items (244) There
were some significant incidences of self-repair reported also for vacuum cleaners
and dishwashers whereas self-repair very rarely occurred for mobile phones and
TVs
The highest non-repair rate was observed among Dutch survey participants (on
average 56) while the lowest was observed among Romanian participants (on
average 25) Age and other socio-demographic factors did not play an important
role with respect to repair behaviour
Those who have self-repaired products in the past indicated lower costs being
good at repairing convenience and environmental reasons as the main
reasons for having self-repaired
The top reasons for not repairing products were price of repair the preference
to get a new product fashiontechnology or products being beyond repair
Depending on the product category consumers had meaningful experience with
third party repair services Overall experiences with such services were positive
and frequently even exceeded expectations in terms of convenience speed of
repair consumer friendliness and quality of repair
The behavioural experiment corroborated many of the findings from the consumer
survey In line with reported behaviour in the survey a majority of
respondents also decided to repair defective products in a task which
simulated the decision to repair or replace a faulty product with realistic monetary
incentives (see section 271 for the methodology section 45 for results)
The experiment has clearly confirmed the finding from the qualitative research
that convenience and ease of accessibility of repair are important drivers
of repair decisions When repairing involved slightly more effort compared to
replacing an item many respondents refrained from repairing and bought
replacement products instead The same level of effort instead did not prevent
individuals from replacing products
Behavioural Study on Consumersrsquo Engagement in the Circular Economy
67
Other behaviourally motivated mechanisms which did not change the cost of
repairing or replacing remained largely without effects Merely framing repair
prices as VAT exempt (while keeping prices constant) or providing details about
the characteristics of the repair services (eg whether repair was done by the
manufacturer or an independent shop again at constant prices) did not have
meaningful effects on repair decisions Such practices seemed to only strengthen
the decisions of certain groups of respondents For example those with pro-
environmental attitudes were even more likely to repair products when repair
services were framed as VAT exempt Instead those who attributed highest
importance to trends and fashion were further deterred from repairing by the
same treatment
Personal self-declared attitudes towards the CE were largely consistent
with actual engagement in the CE in the monetarily incentivised
experimental repair vs replace task For example respondents who
categorised themselves as attaching high importance to fashion and technology
were significantly less likely to repair products while individuals with more self-
rated pro-CE attitudes were indeed significantly more likely to repair their
products This is an important finding because it is often argued including by
some stakeholders in this study that self-reported attitudes are a result of
wanting to please the survey administrators and would not translate into actual
behaviour The behavioural experiment provided strong evidence against such
predicaments and instead reinforced that attitudes can translate into actual
behaviour especially when certain conditions are met (eg provision of CE
information)
Experience with renting leasing (1) and buying second hand (6) was
rather low in the surveyed population The main reasons for not having engaged
with such practices were that respondents wished to own their products and
generally that they preferred new unused products Among the few
respondents who have rented or leased products in the past their motivations to
do so were mixed Convenience the possibility to test the product the chance of
reusing the product after use or budget considerations all seemed to play a role
When comparing respondentsrsquo actual experience with leasing and their willingness
to lease as presented in section 3 there seems to exist a sizable market potential
for business models offering leasing products
Market data from Scandinavian countries instead showed that consumers would
in general be willing to make some sacrifices unless it required sharing goods
and letting their own goods being used by other consumers
According to the survey a limited share of consumers had purchased
second hand vacuum cleaners dishwashers TVs smartphones and
clothes Main motivators for buying second hand were price items being better
value for money and environmental reasons The main barriers to buying
second hand products seemed again to be the preferences for using new unused
products a lack of trust in second hand products as well as the perception that
new products were better value for money
Romania stood out with highest rates of buying second hand (15) while
for Portuguese consumers much lower incidences (3) were found Participants
from Ireland and Hungary also revealed comparatively larger shares of buying
second hand (10) Older respondents were generally less likely to purchase
second hand Instead consumers in a very difficult economic situation indicated a
higher frequency of buying second hand (11)
In line with findings from the survey in the behavioural experiment as well there
was relatively little engagement with second hand products In the
experiment second hand products were presented with the same prominence and
availability as new products nevertheless only about one to two respondents in
ten decided to purchase a second hand product to replace a defective product
As in the survey the likelihood of purchasing second hand in the experiment was
slightly higher for smartphones and clothes (20 chose a second hand phone or
coat) compared to the other products (13-14 chose second hand) For coats it
appeared to be the least fashion driven consumers who most often decided to buy
second hand Second hand products might be attractive if they help balance the
Behavioural Study on Consumersrsquo Engagement in the Circular Economy
68
desire to change a product with budgetary pressures (see also further findings
from the consumer survey reported in section 64)
41 Evidence from the literature and data collection
411 Drivers
From the literature review three main drivers for the participation of consumers in more
Circular Economy practices emerged
The first driver is to provide more and better information about the durability
potential of the product which mirrors the lack of knowledge For an in-depth
discussion of which information should be included exactly see sections 612 and
614
The second driver pertains to the design of the product itself
The third driver is a greater offer of repair services from manufacturers
Academic reports regulatory reports and other sources reviewed stress that better
information for consumers on product features may drive their participation in
more Circular Economy (CE) practices66
In that sense labels are useful tools for the information they provide In March
2016 a study was carried out by the SIRCOME agency the University of South Brittany
and the University of South Bohemia commissioned by the European Economic and Social
Committee on the influence of lifespan labelling on consumers67 Some 2917 participants
were asked to choose between different goods with or without labels The products
displaying lifespan information were on average chosen 46 more often than the ones
without such information In addition in the same category of products the ones with a
lifespan information label were sold 138 more often than the ones without The label
displaying lifespan in years or months had the greatest impact on consumers however
consumers had difficulty mentally picturing large numbers68 According to S Maurer and
U Pachl providing information on a productrsquos lifespan could also encourage less wealthy
households to pay more for a product that is expected to last longer69
The literature also suggests that a label providing information on the energy
performance of the good would have a positive impact on consumersrsquo
behaviours70 The lack of information about the environmental footprint of specific
goods may again be a barrier to consumers participating in the Circular Economy For
instance BHaze A Jones-Farmer and R Overstreet pointed out that consumers lack
awareness about the environmental impact of refrigerators71 However a report carried
out for the French Ministry of Environment stressed the risk of potential confusion for
consumers by the possible duplication of information with the existing Ecolabels A
clearer hierarchy would be in that sense useful72 Underlying further the influence of a
label as developed above the White Book for a Circular Economy in Greater Paris
suggests the creation of a label for second hand goods73
In addition some brands have also developed their own label For instance in 2016
the French brand SEB - one of the leaders of household appliances manufacture-
launched a logo (Figure 21) stating that the product will be repairable for ten years74
66 Westblom 2015 BEUC 2015 European Commission Joint Research Centre 2017a
67 European Economic and Social Committee 2016)
68 European Economic and Social Committee 2016
69 BEUC 2015
70 French Ministry of Ecology Sustainable Development and Energy 2014
71 Haze Overstreet amp Jones-Farmer 2011
72 French Ministry of Environment 2014
73 ADEME 2016
74 Leboucq 2016
Behavioural Study on Consumersrsquo Engagement in the Circular Economy
69
This logo will be added to every product sold by the brand According to a survey carried
out by SEB consumers would be positively influenced by this label in their purchasing
decisions75
Figure 21 SEB logo
Source Leboucq 201676
Consumers also need more guidance on how to choose more durable products and
how to take care of these products Regarding clothes for instance consumers could
be made aware of the importance of evaluating seams and the density of stitches or the
fact that fibre content plays a big role in clothing durability77 The department store John
Lewis provides shop floor staff with a guide (the Selling Partner Learning Guide78)
containing information that they can communicate to customers This includes messages
from WRAPrsquos Love Your Clothes Campaign and shares key messages on clothing
durability by making the connection between durability and higher quality the lower
environmental impact of those garments in comparison to disposable fashion and by
explaining how washing habits can affect the life expectancy of clothes and reduce their
environmental impact If labels can positively enhance consumer behaviour the design
of the products itself can incentivise a change
BHaze A Jones-Farmer and R Overstreet (2011) define consumption not only as an
act of purchasing but also as lsquodeveloping routines and rituals of use and modifying the
product concretely or symbolicallyrsquo Therefore designers and design can impact
consumers use of products in a more durable way For instance equipping refrigerators
with a transparent door can have an energy saving effect79 The user would directly take
the product he needs instead of opening the door and then start looking for it
Companies and manufacturers are the intermediaries between goods and consumers
Some of their strategies can drive more consumers to participate in the Circular
Economy For instance according to a report from Digital Europe on the Circular
Economy there is a growing trend towards establishing more repair services Besides
do-it-yourself shops where people who tend to perform self-repair can buy the necessary
75 Leboucq 2016
76 Leboucq 2016
77 WRAP 2017
78 WRAP June 2017 Sustainable Clothing a practical guide to enhancing durability and quality of clothes
79 Haze Overstreet amp Jones-Farmer 2011
Behavioural Study on Consumersrsquo Engagement in the Circular Economy
70
tools in order to do so companies have invested in establishing in-house repair
services and sub-contracting repair operators80 Some market leaders have also
been committed to providing more remanufacturingrefurbishment facilities Digital
Europe gives the example of Nokia which has been remanufacturing telecommunications
equipment since 1991 Considering as mentioned above the importance of the
consumersrsquo trust in the quality of the repair services this involvement in the repair
service market from manufacturers may enhance consumersrsquo participation in more CE
practices The fact that companies have established more repair services comes from the
growing interest of consumers in these services and in turn the new repair services may
attract more consumers to let their products be repaired rather than replace them when
they break down Besides SEB -one of the world leaders for household appliances-
supports consumers in their choice to repair instead of buying new product though
economic incentives They commit themselves to offer replacement parts which will not
exceed a threshold of 50 of the price of a new product In addition the cost of repair
will not exceed 13 of the price of the new item SEB also encourages the consumers to
rent certain products as well as to repair damaged goods by themselves Parts and
accessories will be available on a website and the brand will provide tutorials on how to
repair products81
412 Barriers
The literature review identified three main barriers faced by consumers when taking
durabilityreparability of products into consideration They relate to cognitive economic
and psychological factors and can be summarised as follows
The lack of knowledge about durabilityreparability features of a good and the
lack of reliable information about it
The cost of repair services
The lack of trust from the consumer in repair services
As economic agents consumers tend to be rational when making purchasing decisions
Wang and Hazen note that consumers assess the value and risk of the goods they are
buying82 (Two important variables were identified by the authors while lsquoquality
knowledgersquo exerts the strongest effect on perceptions the cost awareness is the second
most important factor influencing a purchasersquo83
The lack of knowledge of durability and reparability may hinder the purchase of
more durable appliances For instance S Maurer and U Pachl highlight that
consumers do not feel knowledgeable about how long fridges washing machines and
vacuum cleaners last nor do they know where to find reliable information on these
features In addition to the lack of awareness about the expected lifetime of a product
consumers also lack crucial information on the reparability of goods as well as on the
availability and costs of spare parts84 Without such information consumers are not able
to reward manufacturers who produce long lasting and easy repairable goods For a more
detailed discussion of consumersrsquo expectations understanding and awareness of the
durability and reparability of the products they buy see section 5
The other main barrier to consumer participation in repair services is the cost of
such services as identified in an article dated from 2008 in which M Watson reviewed
literature on consumersrsquo perceptions and behaviour relating to remanufactured repaired
and reused products85 It clearly appears that a lower price is the main reason people
would buy repaired goods rather than new ones Moreover the author quoted a survey
80 Digital Europe 2017
81 Leboucq 2016
82 Wang amp Hazen 2016
83 Wang amp Hazen 2016 p 466
84 BEUC 2015
85 Watson 2008
Behavioural Study on Consumersrsquo Engagement in the Circular Economy
71
which found that 68 of respondents mention high cost as the main reason they did not
get items repaired86 Similarly households with higher incomes are associated with a
higher probability of replacement87 As mentioned above consumers assess value and
risk when making a purchasing decision88 Once informed about the cost advantages of
remanufactured products compared to new ones the value of the product tends to
increase while the risk perception decreases89
When households need to repair an appliance they balance between the cost of repair
and the price of replacing it with an equivalent new product According to the literature
reviewed the ratio between the cost of repair and the price of replacement is the
main variable accounting for the replacement of product Where the cost of repair
or upgrading is higher than that of replacement consumers will logically go for a
replacement purchase90 The cost of repair can be relatively high compared to the price
of a new good particularly bearing in mind that a repair usually is labour-intensive work
As a result nearly half of the EU citizens (47) did not repair any faulty product during
the last 12 months As a national example French consumers are generally not willing to
pay more than 30 of the price of a new product for repair91 J McCullough (2009) in
an article written in 2009 provided a historical perspective of this relation between the
cost of repair and that of replacement92 Appliances are made in countries where labour
is cheaper than the country in which they will be repaired Therefore buying new
products tends to be cheaper than repairing old ones In a consumer report from 2001
34 of the respondents revealed that they did not repair a product because of the
decreasing replacement prices93 J McCullough (2010) provides another example of this
balance between repair and replacement prices for consumers through the impact of
discount rates Consumers with a high discount rate have a tendency toward instant
gratification and will replace an old appliance by a new one despite the fact that the older
appliance could still be repaired Once again this illustrates that a replacement price
lower than the repair cost will tend to hinder consumer use of repair services
The final barrier identified in the literature reviewed is the lack of trust with
consumers in repair services Consumer trust acts as an important psychological
factor when making purchase decisions JMcCollough (2009) reviewed a substantial part
of the scientific literature on the factors impacting the demand for repair services It
seems that considering the information asymmetry between technicians and consumers
consumersrsquo trust in the quality of the repair service has a great influence on their
decision to use it Indeed according to J McCullough lsquothe more trust a consumer has in
a mechanic (either because the mechanic is certified or has an excellent word of mouthrdquo
reputation or has been endorsed by a rating agency) the higher the expectation that a
repair will be correctly madersquo94 According to the information provided in an expert
workshop about repairs of household products a significant share of EU citizens (39)
think that repairing a broken product is often difficult or economically disadvantageous
This is mainly due to incomplete information (eg low transparency on the repair price)
but it is also due to general perception of high repair costs95
86 Watson 2008
87 Fernandez 2001
88 Wang amp Hazen 2016
89 Wang amp Hazen 2016
90 European Environment Agency 2017
91 Deloitte 2017
92 McCullough 2009
93 McCullough 2009
94 McCullough 2009 p 622
95 Deloitte 2017
Behavioural Study on Consumersrsquo Engagement in the Circular Economy
72
413 Trade-offs
The literature provides even less evidence about trade-offs and whether consumers are
willing to give up something in order to benefit from something else
A first finding comes from a European Commission Market Study mentioned in section 3
Consumers were willing to pay more (ie give up on a lower price) when
durabilityreparability information were present96 Durability information
presented in terms of years or usage units increases consumer willingness to pay more
for a more durable product Providing information on reparability also encourages
consumers to purchase more repairable products However the type of reparability
information matters Presenting the availability of spare parts substantially increases
consumer willingness to pay On the contrary providing information on the cost of spare
parts has a negative effect97
Another trade-off mentioned in a 2011 article by Ceacuteline Michaud and Daniel Llerena
involves giving up low price for more quality and environmental friendliness This article
quotes a 2009 Eurobarometer that states only a minority of consumersrsquo rate
environmental impact as more important than a productrsquos quality or price (7
and 19 respectively) So only a minority of consumers is willing to make the trade-off
where they give up on products with a lower price or products with a higher quality in
order to buy products that are more environmentally friendly As far as remanufacturing
is concerned consumers seem to face important trade-offs between the various
attributes of the product Based on the participantsrsquo written feedback during the
debriefing the authors concluded that consumers show concern for the lower quality of
remanufactured products A potential solution for this would be for companies to provide
consumers with better quality warranties98
What is more recycling and reuse are sometimes perceived as methods to lessen
guilt associated with excess consumption In other words consumers sometimes choose
the recycling and reuse for certain products because they have in their eyes given into
excess consumption when buying other goods earlier99
Another argument regarding consumer trade-offs comes from classic game theory
consumers can choose between lsquodefaultingrsquo behaviour that minimises personal
costs (inappropriate sorting burning waste littering etc) and cooperative behaviour
that will maximise the social pay-off but they will only do the latter if the majority of
the population cooperates as well Mere consideration of self-interest would always
dictate the lsquodefaultingrsquo choice The social marketing task of promoting cooperation in the
recycling dilemma is made even more difficult as the social pay-off (a cleaner
environment a better world etc) typically does not accrue to the recycling individuals
but to subsequent generations Two strategic routes to encourage cooperation are
available to social marketers an ldquoattitudinal routerdquo which induces individuals to
cooperate for the sake of cooperation and a ldquostructural routerdquo which seeks to change
the properties of the decision situation such that it is no longer a social dilemma
Structural solutions change the payoff structure such that cooperation is the alternative
with the lowest personal cost100
Regarding the situation in the Scandinavian countries research finds that many Swedes
are positive to very positive about making sacrifices in order to buy more durable
products As mentioned in section 3 in Norway the willingness to make sacrifices is fairly
96 European Commission 2017 European Commission DG JUSTGfK (2017) lsquoConsumer Market Study to support the Fitness Check of Consumer Rulesrsquo
97 Knight King Herren amp Cox 2013
98 Michaud 2011
99 Armstrong 2014 p 32
100 Smeesters 2003 p 452
Behavioural Study on Consumersrsquo Engagement in the Circular Economy
73
high when talking about more traditional circular behaviours like buying or selling
second hand products and recycling However this willingness drops significantly
when talking about engaging in the collaborative economy and sharing things
and therefore interacting with other people Especially if it entails letting other
people use onersquos own things Danes are generally more willing to make sacrifices to be
circular when it concerns the areas that they are more familiar with Examples of this are
particularly recycling and buying goods on the second hand market (73 of the
respondents were positive about recycling) When it comes to sharing and renting Danes
are not very interested in making major sacrifices to change their current behaviour
(31 of the respondents were positive about renting and borrowing and 15 about co-
ownership) Especially if sharing entails letting other people use their own belongings
The willingness to make more sacrifices to increase circular behaviour is fairly high
among Finns when it comes to the areas they are used to such as recycling and buying
second hand goods However only a small percentage of Finns are willing to make
sacrifices to co-own or rent outlend more goods to others especially when it entails
more personal commitment (only 22 of the respondents were positive about renting
out and 14 positive about co-ownership) (SB Insight 2017) For more information on
consumersrsquo willingness to engage in more sustainable purchasing and collaborative
practices see section 3
There is also a potential trade-off that could be made between durability and
energy savings if we consider that more durable products may delay sales of newer
more energy-efficient products Such a trade-off can be avoided by introducing durability
requirements together with stringent energy efficiency requirements This would also
give the industry time to redesign their products to comply with these requirements101
414 Variations across productsproduct categories
It seems however that the impact of all the drivers barriers and trade-offs mentioned
in this section do not affect all products in the same way
According to a study on lifespan labelling suitcases and printers were more impacted by
such labels while smartphones were the least affected by this102 When a label was
present 24 more suitcases were sold than without labels printers 20 and 11 for
smartphones As suitcases are mainly for travel their robustness is a crucial factor
accounting for their purchase especially if they are used on an occasional basis As for
printers they are technological objects that are perceived to have a short lifespan This
perception may have contributed to the degree of influence awarded to the label103 The
weakest impact of lifespan labelling concerned smartphones which may be attributed to
the fast development of smartphone technology
Clothes and smartphones were reported as the product category for which consumers
face the most difficulties to assess the durabilityreparability potential104
Due to the fast-moving technology of smartphones consumers may have trouble
using them in a sustainable way One of the issues relates to the gap between the
pace of software updates and the upgradable potential of the smartphones For instance
the Dutch Consumentenbond reported that 84 of all Android-smartphones that the
consumer organisation had tested within the last two years could already not rely on the
latest software anymore Moreover consumers experience frequent problems related to
failures of devices and components105 In addition the way smartphones are engineered
101 European Commission 2013 p 36
102 European Economic and Social Committee 2016
103 European Economic and Social Committee 2016 p 84
104 European Economic and Social Committee 2016
105 BEUC 2015
Behavioural Study on Consumersrsquo Engagement in the Circular Economy
74
may limit the possibility to physically access some components such as the battery and
therefore hinders the ease with which to dismantle and repair them106
Also consumers are reported to lack knowledge about the durability potential of
clothes There is large room for improvement in driving consumers towards more
durable practices in the clothes sector A WRAP (2012) research has reported that lsquonearly
four in ten consumers think there is currently too little environmental information
available about the clothes they buyrsquo A slight increase in the lifespan of clothes would
have a significant impact on the environmental footprint The WRAP report indicates that
rsquoextending the life of clothing by an extra nine-month period of active use would reduce
carbon waste and water footprints by around 20-30 each and cut resource costs by
20 (euro55 billion)rsquo Besides the ecological impact it seems that even by providing basic
information to consumers on how to treat their clothes could have a profound influence
on their expected durability Simply informing people on the way they should wash their
clothes how they can preserve the characteristics of its fibres and fabric and as a result
increase its durability could already be enough in this regard Most often clothes are
unused because they no longer fit107 Therefore one option with a high potential
regarding durability would be to provide more information on how to remake and repair
clothes (WRAP 2012)
42 Evidence from the stakeholder interviews
421 Drivers
The results from the stakeholder interviews are largely compatible with those from the
literature review and data collection The three main drivers were distinguished during
the literature review to provide more and better information about the durability
potential of the product the design of the product itself and a greater offer of repair
services from manufacturers These results were mirrored during the stage of the
stakeholder interviews
First of all a representative from a Czech consumer association stated that many
consumers in the Czech Republic are willing to pay more for more durable products
as long as they have objective information on which they can rely At present they
have little faith in producers and manufacturers and according to them this information
should be provided for free to consumers This underlines what has been found in the
literature consumers are willing to pay extra for more durable products but they need
better and more reliable information in order to actually do so in practice For an in-depth
discussion of which information should be provided to consumers see section 5
Next the design of the product itself attracted less focus from the interviewees as a
driver for consumer participation in CE practices A representative from a social
enterprise active in the area of the Circular Economy in the Netherlands pointed to the
lack of knowledge of clothing materials and construction among consumers
Difficulties exist when it comes to establishing norms for clothes and what to measure for
clothes labelling The design of clothes and consumer knowledge about this could thus
enhance their knowledge and could facilitate their choice for more durable products
Lastly some interviewees discussed the poor quality and low availability of repair
services as a reason for consumers not using repair services A German academic talked
about a series of consumer studies performed by Stiftung Warentest a German
consumer organisation where they tested repair services on the costs that are involved
with repairing spare part availability the quality of the service how fast the repair
service is whether consumers get a replacement product during the period of the repair
and how good this is They found that there were many problems with the repair services
of most big companies consumers were especially bothered by the high price of repair
and the rather low availability of these repair services The same interviewee
stated that consumers do want to consider using repair services but that it is not really a
106 SPF Santeacute publique 2014
107 WRAP 2017
Behavioural Study on Consumersrsquo Engagement in the Circular Economy
75
realistic option for them right now because of the above reasons More and better repair
services could thus act as an important driver for consumers to engage in CE practices
An additional driver was named by a representative from a company active in the
German repair market who stated that the key to more use of repair services would be
to force producers to guarantee the affordable availability of exchange parts for a
longer period This would enable an infrastructure of repair services to stay alive and to
develop According to a technical expert in repair initiatives availability of spare parts is
the key driver for enhancing the consumersrsquo use of repair services as right now the
producers have little interest in spare parts as the added value of repair is not with them
The literature paid less attention to price which interviewees named as the most
important driver A representative from a UK-based NGO focusing on the Circular
Economy and sustainable consumption mentioned that consumers are more likely to say
that product lifetime was a key factor when they bought higher priced products
than when they bought lower priced products of the same type Especially in
Romania this is the case where all interviewees representing the non-profit and
consumers interests have pointed to the fact that durability concerns are more visible
with the richer middle-classes than with other groups such as elderly and young people
Other drivers that were mentioned briefly but not explained in detail are extended
warranties mentioned by a Romanian NGO representative social pressure marketing
and advertising cultural and generational drivers social norms about (resource)
efficiency and the underlying psychological driver where people feel emotionally
attached to their products and want to engage with them according to a representative
of an Austrian consumer association as well as better education about the topic as
highlighted by representatives from NGOs and national consumer associationsrsquo
representatives With respect to marketing and advertising practices a representative
from a famous electronic appliances manufacturer added further details For instance
offering a label about the length of reparability for their products is clearly part of a
strategy which aims to influence consumers in their purchasing decisions
422 Barriers
The results from the stakeholder interviews are largely compatible with those from the
literature review and data collection To recall here three main barriers were
distinguished during the literature review the lack of knowledge about
durabilityreparability features of a good and the lack of reliable information the cost of
repair services and the lack of trust from the consumer in repair services
Several interviewees confirmed the first barrier as the most important A representative
from a German public authority stated that a lack of reliable information regarding
durability and reparability plays an important role as there are no standards for
durability information and there is a lack of good measurement procedures for durability
Notwithstanding it is not easy to design tests for all products in such a way that
durability information is available before the products are being sold as was highlighted
by the interviewee representing a German public authority A representative from a
Czech association of consumers underlined this by pointing to the fact that there is a lack
of information about the quality of products as many producers present their products as
flawless but the reality is often very different Lastly a representative from a social
enterprise active in the area of the Circular Economy in the Netherlands pointed to the
lack of knowledge of consumers regarding the materials and fabrics of clothes as an
important barrier for them to become more active in CE practices If consumers cannot
distinguish between good and durable fabrics do not know how to treat the clothes they
buy to make them last longer and do not know how to self-repair them if they become
damaged it is impossible for them to make the right choices even if they would
normally be willing to do so
Interviewees also discussed the high costs of repair services A representative from a
Czech association for social responsibility discussed the price of recyclable products as
these are usually more expensive than products that are not recyclable Also the
availability of recyclable products is relatively scarce as other not-recyclable products
are still being produced A representative from a company active in the German repair
market talked about the prices of spare parts specifically He used the example of Miele
Behavioural Study on Consumersrsquo Engagement in the Circular Economy
76
who provides electronics for their washing machines for EUR 400 while the real costs are
only about EUR 20 making the repair of washing machines uneconomic
The interviews also complemented what has been found in the literature by adding that
there are also many practical problems with repair A representative from a Dutch
public authority discussed that products nowadays are designed in such a way that the
whole product stops functioning when one small component breaks down A
representative from a German consumer organisation stated that manufacturers and
producers have most of the know-how about products and that there is not much
knowledge otherwise which makes for an unbalanced relationship with consumers
Moreover there is a trend of producing bigger and more complex machines which are
highly integrated and hard to repair
Additionally interviewees mentioned some other barriers that have been treated less in
the literature The first and foremost of these is the availability of low-quality but
cheap products tempting consumers to replace goods rather than self-repair them A
representative from a European trade association discussed the availability of cheap
clothing The main conclusion from a 2006 clothing study was that the durability of cloths
is decreasing because of a decrease in the quality of garment causing in turn a drop-in
the donation of clothes A representative from a European industry association concluded
from this that fast fashion stores therefore put pressure on the second hand industry
This was confirmed by a representative from a European trade association who pointed
to the availability of very cheap fashion particularly in the United Kingdom as an
important barrier to consumer interest in durability
Another barrier mentioned in the interviews is the fashion aspect for example in the
interview with a representative from an Austrian consumer association This is especially
the case for young people and especially for products like clothes and smartphones
Style plays an important role here and this refers to the emotional durability of
products rather than the physical durability for more information on this see section
511
Other barriers that were mentioned briefly but not explained in detail are social
pressure marketing and advertising mentioned by the same Austrian consumer
associationrsquo representative conspicuous consumption where consumers do not
consider the impacts of their user profile both regarding time and money as discussed
by a German academic and the cultural problem where society does not reward
consumers who do engage in CE practices as highlighted by a representative of a
Belgian NGO
423 Trade-offs
As with the literature review most interviewees had less to say about trade-offs and
whether consumers are willing to give up something in order to benefit from something
else For instance it is less clear whether consumers would be willing to pay more (ie
forego on a lower price) as long as they know the products are more durable
Some things were however still mentioned First of all most interviewees pointed at the
fact that price is still a very important if not the most important factor accounting
for consumer decisions An ever-growing fraction of consumers are willing to consider CE
characteristics and the reparability and durability of products but they are only willing to
pay more to a certain extent Price-sensitivity still plays a huge role There is also a
certain difference visible across products but this is discussed in detail in the next
section 424 A representative from a German consumer organisation stated that
consumers are willing to pay a bit more for durable products and that price-sensitivity
plays a role in accounting for differences in willingness across products For vacuum
cleaners for example consumers are very price-sensitive The general rule is the
higher the investment the more people are willing to pay extra for repair The
price of the durable product and the price difference with less durable products therefore
forms the most important driver for consumers in whether they are prepared to trade off
something in return for more durable products
A representative from a charity and independent think tank from the United Kingdom
highlighted that the rational choice of model based on costs and benefits alone
does not explain Circular Economy behaviour because in reality there is a more
Behavioural Study on Consumersrsquo Engagement in the Circular Economy
77
complex set of factors This confirms the finding from the literature that referred to
classic game theory even though consumers might be inclined to buy more durable
products and to self-repair rather than to replace it only makes sense for them to
actually do so when they know other consumers are doing the same This is a classic
example of the prisonerrsquos dilemma in practice and the government could play an
important role in making sure the prerequisites are such that it makes more sense for
consumers to engage in CE practices
424 Variations across productsproduct categories
From the literature review it has already become clear that the impact of all the
drivers barriers and trade-offs mentioned in this section do not affect all
products in the same way This was largely confirmed by what interviewees discussed
First of all every product requires its own approach CE practices that work well for
one product are less appropriate for others For instance a representative from a Dutch
public authority discussed that while car-sharing services are working well already
sharing platforms for other household items (such as power drills or tents) are far less
popular as sharing platforms for cars provide much more comfort and ease than sharing
platforms for household items For smartphones the same is true but here durability
and the speed of technological development play a role as well Dishwashers are
especially well suited for lease systems with repair contracts built in and there are some
experiments with contracts where you pay per wash For clothes buying new clothes is
often cheaper than having them repaired There is a growing second hand market for
clothes but this is not yet common place in all layers of society
A German academic highlighted that for each price category there are different
drivers deciding which products consumers will buy and durability plays a different role
for each category of consumers For more expensive products consumers are willing to
spend more time to make sure they buy a product that will last long enough for their
investment to be worth it In a way thus a higher price can form a driver to
consider buying more durable products Other products on the other hand are so
cheap that it doesnrsquot make sense for consumers to spend too much time or money on
avoiding buying non-durable products This was complemented by what a representative
of a Hungarian NGO stated when she said that for televisions and washing machines
consumers do consider durability but not so much for smartphones or clothes
Furthermore she stated that the guarantee and its terms and whether it can be
extended are important to consumers as well A representative from a German
consumer organisation stated that with vacuum cleaners people tend to buy rather
cheap and less durable machines while with washing machines consumers take
durability much more into account during the purchase process
A representative from a Portuguese NGO mentioned that for mobile telephones
televisions and tablets technological advancement acts as a barrier as it is quite
common to replace these products because consumers want to have the latest model
with the most up-to-date technology Clothes are rather fashion dependent products as
well and this forces many consumers to buy new clothes regularly acting as a barrier to
CE practices The low prices of certain pieces of clothing act as an additional barrier
making consumers more prone to buy new clothes For childrenrsquos clothing there is a
network of second hand stores and platforms ensuring that buying second hand clothes
is becoming more and more common The economic crisis certainly helped clothes
exchanges but it is still a very niche market Repairing clothes was much more common
twenty years ago than it is today but the younger generation seems more interested in
learning to repair their own clothes again
Regarding repairing a representative from a company active in the German repair
market stated that white goods have a lively repair service system already as
people do not change big and expensive goods like these without serious consideration
and many consumers would consider repair before replacement What is more many
producers see an excellent repair service as part of their brand message and as part
of having a well-working customer service In the television sector there is hardly
any repair being done due to a broad range of models and technologies but for
smartphones there is a substantial repair sector due to independent companies
performing the easy fixes like cracks in the display
Behavioural Study on Consumersrsquo Engagement in the Circular Economy
78
Lastly a German academic pointed to another distinction that needs to be taken into
account The interviewee stated that the classical categorisation of products is not
enough In her eyes an additional distinction needs to be made between
ldquoworkhorserdquo products and investment products which would be a more useful
category in the analysis For workhorse products durability and reparability is more
important as consumers want them to work most of the time Functioning is more
important here and consumers are willing to pay a little more for durable and repairable
products in this category The need to have a constantly functioning product is an
important driver here to buy more durable products For investment products on the
other hand reparability is more important as they tend to be expensive and consumers
tend to prefer to have them repaired rather than replaced once they buy them and they
reserve money for that during the purchase process already (write-off)
43 Evidence from the focus groups
431 Durability
According to the focus group participants factors that can encourage people to
purchase products that are more durable were
Saving money
Saving time and effort (for example by not having to go through the entire
selection and purchasing process for a new product)
Protecting the environment
Being able to purchase durable goods for lower prices and
Having a way of knowing how durable a product is
Some of the main indicators of a productrsquos durability were considered to be the brand
(certain brands being known for manufacturing more durable products) online consumer
reviews as well as word-of-mouth
When it comes to barriers (factors discouraging people from purchasing durable
products) participants across the different countries brought up the following factors
Difficulty of knowing how durable products are and which ones are more durable
The trustworthiness of costumer reviews as well as brandsrsquo reputation were
questioned Many participants flagged the fact that there were no sources of
information with regard to productsrsquo durability and made various suggestions with
regard to what type of information they would find useful and how this should be
presented (further details about this topic are provided in section 631)
ldquoVery difficult You google it before you buy it and you look at reviews Even then
itrsquos difficult to know Do I trust that You donrsquot know who writes that eg lsquothis
product is fantasticrdquo (Man mixed group Dublin)
Some participants brought up price as a barrier feeling that brands that have the
reputation of designing durable products are more expensive
[brand name] appliances ndash I say to myself they might last longer if I had the
money It is twice the price and I cannot afford itrdquo (Man vulnerable group
Prague)
Others however felt that even brands that have a strong reputation do not produce
durable products anymore The concept of planned obsolesce was brought up
during most group sessions
ldquoYou already envisage that something breaks down after a while It is sad We live
in a disposable society and it is intended by the industry that things do not lastrdquo
(Man mixed group Berlin)
Technological progress was cited as another factor discouraging people from
seeking more durable products (especially in the case of electronics)
When it comes to televisions the progress is so fast they (the televisions) are
computers now really after five years the technology can be oldrdquo (Man mixed
group Prague)
Behavioural Study on Consumersrsquo Engagement in the Circular Economy
79
ldquoIt is not only with the hardware of products that is not compatible It is also the
software When your phone is too old a certain software is not supported and you
are forced to buy a new device even though it still works That is the power of the
industry You depend on themrdquo (Man mixed group Berlin)
Fashion trends are another barrier not only for clothing but also for other types of
products
ldquoThere is a hysteria in Sweden today people love to renovate their homes and
exchange everything ndash they throw away well-functioning machines That is crazyrdquo
(Man vulnerable group Stockholm)
432 Reparability
The main factors encouraging people to have products repaired (instead of buying
new ones) can be summarised as follows
Having the possibility to repair products (ie the product itself being repairable)
Being able to repair products at a lower price than purchasing new ones
Knowing that manufacturers can produce and sell spare parts
In the case of electronics being able to receive and use a courtesy replacement
product (smartphone computer) while having onersquos own product repaired and
Being able to have products repaired in a short time (particularly for products such
as dishwashers and washing machines)
I needed my washing machine to be repaired you cannot be without it really
First they said they would do diagnostics and then they would call me And then
they have 30 days to repair it so you worry about how to wash clothes
ldquo(Woman mixed group Prague)
In terms of barriers the main factors brought up were
Belief that certain types of products (smartphones) are not made to be repairable
ldquoI think to encourage people to repair products they need to make the production
process more transparent and should not put obstacles in your way which
prevent repairing a smartphone for examplerdquo (Woman vulnerable group Berlin)
ldquoIt is possible to think more about the circular economy ndash if you are interested
you can do some things yourself change batteries on the smartphone But for
[smartphone brand] you canrsquotrdquo (Man Vulnerable group Stockholm)
Difficulties in finding spare parts
Having products repaired requires time and effort
High repair costs
Today appliances have such electronics that they change whole big parts and
the repair costs 50 and more of the cost of a new one So it is not worth itrdquo
(Man vulnerable group Prague)
Previous negative experiences when trying to have products repaired
My daughter chose [smartphone brand] and we have already claimed it four
times during the warranty period In the Prague shop where we bought it they
told us they had to send it to Germany it took 3 months it worked for 2 months
and then a claim again Then it happened for the third time and it was the same
thing They donrsquot want to give us money back because they claim to have
replaced the motherboard and therefore they see it as a new phone and the
warranty extends I donrsquot know what to do with it (Woman 37 vulnerable
group Prague)
Lack of services (for example for products purchased from foreign shops or from
foreign brands or from brands that no longer exist)
ldquoI bought kitchen appliances from one British brand ndash cooktop microwave and
dishwasher they used to have a store in the centre of Prague then They finished
after a year and a half and they disappeared from the CR even though they are
still in Britain but that is too bad for me The display stopped working on the
Behavioural Study on Consumersrsquo Engagement in the Circular Economy
80
microwave and I donrsquot know what to do the company does not even have any
representation here So I will keep using it without a display while it still works
(Woman mixed group Prague)
The fact that stores or manufacturers sometimes automatically replace
products rather than have them repaired without giving customers a choice
I bought a wood grinder and the key screw was made of plastic so they counted
on it breaking I went into the shop with it within the warranty period and they
replaced it with a new piece automatically instead of repairing it It is such waste
then (Man vulnerable group Prague)
433 Recyclability
The main reasons behind recycling can be summarised as follows
Concerns for the environment
ldquoI think it is really a good thing for the environment We have so many things
nowadays I really do not want to think about what happens to the planet It
scares merdquo (Woman vulnerable group Berlin)
The need to dispose of products that are no longer used
The possibility of saving or earning money when returning products to a
manufacturer (eg when purchasing a new washing machine or dishwasher)
The possibility of helping others (eg by recycling clothes and bringing them to
humanitarian associations or second hand shops)
Saving money (for example by purchasing second hand products)
Fashion trends (purchasing vintage furniture or clothing)
ldquoIt is trendy with vintage Young people realise how much they get for their
money when buying second hand Even jeans they probably have a better quality
than new jeansrdquo (Woman vulnerable group Stockholm)
Concerns for the environment were of high importance especially in Sweden In this
country willingness to recycle was high especially for products with components that are
dangerous for the environment In the Czech Republic on the other hand concerns for
the environment were mentioned by some participants but other factors were perceived
as equally important such as the need to dispose of products and the possibility of
saving money
In some countries participants brought up several factors that could encourage
recycling
Having transparent information about how the recycling process works and being
able to trust that products are actually being recycled (Germany Sweden)
The recycling process being more straightforward taking less time and effort
(Germany Czech Republic)
Strict laws influencing companies to be transparent with regard to the materials
they use as part of the production process and whether these are recyclable or
whether they come from recycling (Germany)
Having more information about recycling through labels similar to energy
efficiency labels (Czech Republic)
When asked about possible barriers or factors that can discourage people from
recycling participants brought up the following main aspects
Complexity along with a lack of awareness (not knowing where to recycle
products or who to contact)
ldquoI feel it is complicated I do not know where to bring old devices I also do not
find it credible as I do not know if things really get recycled or if companies just
say that It is all a hasslerdquo (Woman mixed group Berlin)
Lack of time
You have to devote time to it take it somewhere for example to recycling
centre (Man mixed group Prague)
Behavioural Study on Consumersrsquo Engagement in the Circular Economy
81
Lack of trust and lack of transparency (not knowing what is done with the
products and whether they are actually being recycled)
ldquoIt is so hard with recycling So much to think about Who is collecting it Where
does it end uprdquo (Male vulnerable group Stockholm)
For smartphones lack of awareness with regard to what happens to the data stored
on the phone Smartphones include a lot of personal data and photos making some
participants sceptical about recycling possibilities
ldquoBut for my phone I donrsquot do that for data protection issuesrdquo (Man vulnerable
group Dublin)
44 Evidence from the consumer survey
Drivers
As indicated previously in Table 13 in section 34 a majority of participants indicated
that they search for durability and reparability information on products Subsequently
the survey asked whether respondents felt that the information provided on
durabilityreparability was sufficient Table 15 shows the results
In total 86 of participants agreed that they would like to receive better
information on how long a product will last (including 25 even strongly agreeing to
the statement) Similarly strong was agreement on wishing to receive better information
on how easy it is to repair a product (83 including 23 strongly agreeing)
Table 15 Agreement to preferring better durability and reparability information (in )
Strongly
disagree
Tend to
disagree
Tend to
agree
Strongly
agree
I would like to receive
better information on how
long a product will last
20 118 613 249
I would like to receive
better information on how
easy it is to repair a
product
23 139 607 230
Note The question was Q51 ldquoTo what extent do you agree or disagree with the following statementsrdquo N=12064
Source ConPolicy analysis of consumer survey data
Figure 22 displays the results when calculating average agreement rates for the above
statements It can be found that survey participants on average agreed to prefer better
durability and reparability information
Figure 22 Agreement to preferring better durability and reparability information
(average)
Note The question was Q51 ldquoTo what extent do you agree or disagree with the following statementsrdquo Answer categories were labelled with ldquoStrongly agreerdquo corresponding to a value of +10 ldquoTend to agreerdquo corresponding to a value of +3 13 ldquoTend to disagreerdquo corresponding to a value of ndash 3 13 and ldquoStrongly disagreerdquo corresponding to a value of -10 Average values above 0 correspond to (rather) agreeing to the statement while values below 0 correspond to (rather) disagreeing Hence an average value of 0 corresponds to neither agreeing nor disagreeing N=12064
Source ConPolicy analysis of consumer survey data
Behavioural Study on Consumersrsquo Engagement in the Circular Economy
82
In addition the results were analysed by country as well as socio-demographic factors
Detailed results are displayed in detail in Section 7 in the Annex document and
summarised here below
On average participants in all twelve Member States indicated preferring better
durability information Highest agreement rates were observed in Romania Sweden
and Portugal Participants from Austria Latvia and especially the Netherlands showed the
lowest rates of agreement Averages for the different age and education groups were
slightly increasing ie older and more educated participants had a higher preference for
receiving better durability information With respect to respondentsrsquo financial situation no
systematic differences emerged
A very similar pattern was observed for preferences by country with respect to better
reparability information The individual averages were positive indicating that in all
countries participants said they preferred receiving better reparability information The
highest averages were observed in Spain Portugal and Romania and the lowest in
Austria Latvia and the Netherlands Again a small positive trend was observed with
respect to age and education Respondentsrsquo financial situation was again less influential
Barriers
The consumer survey also contained two questions regarding potential barriers to finding
information on durability and reparability Overall 82 of the participants agreed that it
is difficult to find information on how long a product will last with 27 even
indicating strong agreement with the statement Again 82 also stated the same for
reparability information with 25 indicating strong agreement
Table 16 summarizes the results for these two questions
Overall 82 of the participants agreed that it is difficult to find information on how
long a product will last with 27 even indicating strong agreement with the
statement Again 82 also stated the same for reparability information with 25
indicating strong agreement
Table 16 Agreement to having difficulties in finding durability and reparability
information (in )
Strongly
disagree
Tend to
disagree
Tend to
agree
Strongly
agree
It is difficult to find
information on how long a
product will last
14 169 549 268
It is difficult to find
information on how easy it
is to repair a product
13 168 566 253
Note The survey question was Q51 ldquoTo what extent do you agree or disagree with the following statementsrdquo N=12064
Source ConPolicy analysis of consumer survey data
Results on average agreement for the above statements were calculated as well and are
depicted in Figure 23 Again the averages being above 0 reveal that survey participants
indicated that they on average agree on having difficulties to find both durability as well
as reparability information
Behavioural Study on Consumersrsquo Engagement in the Circular Economy
83
Figure 23 Agreement to having difficulties in finding durability and reparability
information (average)
Note The survey question was Q51 ldquoTo what extent do you agree or disagree with the following statementsrdquo Answer categories were labelled with ldquoStrongly agreerdquo corresponding to a value of +10 ldquoTend to agreerdquo corresponding to a value of +3 13 ldquoTend to disagreerdquo corresponding to a value of ndash 3 13 and ldquoStrongly disagreerdquo corresponding to a value of -10 Average values above 0 correspond to (rather) agreeing to the statement while values below 0 correspond to (rather) disagreeing Hence an average value of 0 corresponds to neither agreeing nor disagreeing N=12064
Source ConPolicy analysis of consumer survey data
Section 7 in the Annex document displays the detailed results on difficulties in finding
durability and reparability information by country age education and financial situation
are displayed A summary is provided here below
Across all Member States a majority agreed that finding both durability and
reparability information was difficult The top three countries with respect to
average agreement rates were Sweden Germany and Austria Agreement rates were
lowest for the Netherlands Latvia and Romania Again a slight positive trend for the
different age groups was found ie older participants found it more difficult to find
durability information With respect to education and respondentsrsquo financial situation no
clear pattern emerged
Taking the findings from this section together with the fact that consumers seem to be
looking for durability andor reparability information it appears that the current (poor
state of information provision regarding durabilityreparability is a potential barrier to
consumer engagement in the CE It seems to emerge from the survey that better
information provision could drive further CE engagement The behavioural experiment in
section 65 looks at information provision and its effect on purchasing decisions in further
detail
441 Experience with repairing products
As a next step actual CE behaviours are analysed in more detail To this end consumersrsquo
experience with repairing products as well as reasons for repairing are discussed The
first section describes actual behaviour followed by reasons for not repairing a product
Subsequently reasons for self-repair are presented As a last step the reasons for
having a product repaired by another person are discussed including the use of
professional repair services as well as consumersrsquo satisfaction with repair services
Figure 24 displays participantsrsquo actual repair behaviour pooled over the different product
categories with corresponding shares indicating that they (i) did not repair a product
(ii) repaired a product themselves or (iii) had a product repaired for them ie by
a friend or relative a professional repair service or the manufacturer
36 indicated that they did not repair followed by having the product repaired by a
repair service (26) Another 17 had the product repaired by the manufacturer
retailer and another 12 indicated that they chose self-repair The lowest share pooled
over all product categories was revealed with respect to having a product repaired by a
friend or relative (8)
Behavioural Study on Consumersrsquo Engagement in the Circular Economy
84
Figure 24 Experience with repair pooled over product categories (in )
Note Participants were asked Q32a ldquoThinking about the last time these products broke down or became faulty did you repair these products yourself or have these products repaired for you Please select one answer for each productrdquo N=12064
Source ConPolicy analysis of consumer survey data
Table 17 shows participantsrsquo actual repair behaviour for the five different product
categories Depending on the product category either having a product repaired or not
repairing a product was the most common behaviour In the following behaviour is
reported separately for the different product categories
For vacuum cleaners participants decided either to not repair the product (41) or
having it repaired (40) whereas a lower share of 19 reported to have repaired their
faulty vacuum cleaner by themselves In the case of dishwashers the vast majority
(61) indicated to have the product repaired for them while only 25 did not repair
their faulty machine and 13 repaired it by themselves In the product category of
televisions a similarly large share (58) reported that a third person repaired their
faulty item for them 37 indicated that they did not repair their faulty television and
only 4 reported that they repaired their television by themselves This pattern is similar
for mobile phones Here 56 decided to have their faulty product repaired for them
37 did not repair it and 6 repaired it by themselves For clothing items ie coats or
jackets a different picture emerged The most frequently observed behaviour (39) was
not repairing the product closely followed by having the product repaired (35)
Additionally the share of participants who indicated that they repaired the clothing item
by themselves was larger compared to other products 24
1
17
26
8
12
36
0 10 20 30 40
Dont know
Had the product repaired by manufacturerretailer
Had the product repaired by repair service
Had the product repaired by friend or relative
Repaired the product myself
Did not repair the product
Behavioural Study on Consumersrsquo Engagement in the Circular Economy
85
Table 17 Experience with repair by product category (in )
Vacuum
cleaner
Dish-
washer
TV Mobile
phone
Coat or
jacket
No I did not repair
it or have it repaired
410 252 374 369 389
Repaired the
product myself
188 134 38 63 244
Had the product
repaired for me by a
friend or relative
98 91 63 43 145
Had the product
repaired for me by a
professional repair
service
170 394 361 259 168
Had the product
repaired for me by
the manufacturer
(including via a
retailer)
127 121 158 259 40
Donrsquot know 06 07 06 06 15
No of observations 2350 2008 2045 3053 1503
Note Participants were asked Q32a ldquoThinking about the last time these products broke down or became faulty did you repair these products yourself or have these products repaired for you Please select one answer for each productrdquo
Source ConPolicy analysis of consumer survey data
Furthermore repair behaviour was analysed for the different countries and by socio-
demographic factors A summary is written here below detailed results are shown in
Section 7 in the Annex document
Repair behaviour by country revealed some interesting patterns In the Netherlands the
majority of participants (56) indicated that they did not repair For other countries the
non-repair-rates were at least above 30 while in Romania not repairing a product was
only an option for 25 of the participants Together with this low non-repair rate
emerged high rates of having the product repaired by a repair service (40) among
Romanian participants Further individual country differences can be found in the Annex
When analysing repair behaviour by age education and income no specific patterns were
observed
Reasons for not repairing
The above presented results on repair behaviour showed that participants chose quite
frequently not to repair a product The percentage for individual product categories
ranged from 25 to 41 In the following the reasons for this behaviour are analysed
more closely
On average the most important reason for not repairing a product was the price of
repair Between 50 (dishwashers) and 25 (clothing) of participants reported that
repair would have been too expensive The second most important reason for not
repairing or having a product repaired is not as clear-cut In some cases participants
indicated that they simply preferred to get a new product while others indicated that
the item was obsolete or out of fashion In addition approximately 20 of
participants reported that the product could not be repaired
The following patterns by product category emerged For vacuum cleaners both costs
(36) and preferring to get a new vacuum cleaner (33) were indicated to be
important Additionally 21 of participants indicated that the product could not have
Behavioural Study on Consumersrsquo Engagement in the Circular Economy
86
been repaired Obsolescence or fashion (20) played a role as well For dishwashers
the difference between the most and second most important reason was larger 50 of
participants indicated that it was too expensive to repair their dishwasher or having it
repaired A lower share approximately 20 each indicated they preferred a new
product inability to repair obsolescence or fashion In the case of faulty televisions
reasons for not repairing were mixed 34 of participants reported high costs as the
main factor followed by 31 indicating to prefer a new television to a repaired one
Similarly important (30) were obsolescence or fashion and another 25 indicated
that their faulty television could not have been repaired For mobile phones 40 of
participants reported that repair would have been too expensive followed by 33
indicating that the reason for not repairing or having their faulty mobile phone repaired
was obsolescence or fashion Lastly for clothing items ie coats or jackets 47 of
participants said they preferred to get a new item instead of repairing it Compared to
the other product categories fewer participants named price (25) and obsolescence or
fashion (25) as reasons for not repairing or having a clothing item repaired
Table 18 Reasons not to repair by product category (in )
Vacuum
cleaner
Dish-
washer
TV Mobile
phone
Coat or
jacket
I preferred to get a
new one
332 204 308 334 465
It would have been
too expensive
360 496 343 398 247
The product could not
be repaired
213 192 251 168 167
The product was
obsolete or out of
fashion
197 199 295 279 245
I did not know how to
repair itwhere to get
it repaired
69 103 48 60 88
It would have been
too much effort
104 130 74 99 139
The partsmaterials
required werenrsquot
available
71 39 54 28 09
Other 45 70 52 55 38
Donrsquot know 08 08 04 05 15
No of observations 964 507 765 1128 584
Note The question was Q32d ldquoYou said that when the following product(s) broke down or became faulty you did not repair them yourself or have them repaired for you Why was this For each product please select the two most important reasonsrdquo
Source ConPolicy analysis of consumer survey data
Reasons for self-repair
As shown above self-repair was a rather uncommon practice compared to not repairing
an item or having it repaired by a third party To understand what motivates self-repair
participants were asked to indicate the two most important reasons for repairing a
product themselves The results are presented in Table 19
The most frequently cited reason for self-repairing a product was that it was cheaper to
repair than buying a new product The percentage of participants indicating this aspect
among the most important ranged from 61 for dishwashers to 33 for televisions In
Behavioural Study on Consumersrsquo Engagement in the Circular Economy
87
addition participants reported that being good at repairing things by themselves was
an important reason for self-repair 41 indicated this reason for dishwashers and 31
for televisions Another important reason for self-repair was that repairing a product was
easier than buying a new product Between 31 and 16 indicated this to be one of
the most important aspects The fourth most important reason participants indicated was
that self-repair is better for the environment
When looking at individual product categories there exist differences in the motives for
self-repair The above reported ranking of reasons seems to hold for vacuum cleaners
dishwashers and coats or jackets For these products price was the most important
driver The reported motives for televisions and mobile phones were less clear-cut price
(33) convenience (31) and repair skills (31) were ranked equally important for
televisions In contrast environmental reasons were reported with a lower frequency
(17) For mobile phones a different picture emerged While the most important reason
was price (53) self-repair skills were ranked second (40) and environmental
reasons occupied a more important position (21) than convenience (16)
Table 19 Reasons for self-repair by product category (in )
Vacuum
cleaner
Dish-
washer
TV Mobile
phone
Coat or
jacket
It was cheaper than
buying a new one
479 611 331 529 506
I am good at repairing
things myself
335 409 306 395 402
It was easier than
buying a new one
264 232 313 162 201
It is better for the
environment than
buying a new one
236 216 171 210 180
I was particularly fond
of my current product
95 32 111 137 298
My preferred product
was no longer in
production
23 21 96 95 22
Other 38 37 66 59 36
Donrsquot know 01 0 0 0 0
No of observations 422 269 78 191 366
Note The question was Q32b ldquoYou said you repaired the following product(s) yourself when these broke down or became faulty Why did you decide to do this For each product please select the two most important reasonsrdquo
Source ConPolicy analysis of consumer survey data
Reasons for having a product repaired
Another way to cope with faulty products was to have a third party repair the product
Compared to self-repair this behaviour was indicated more frequently Between 35 and
61 of participants had previous experience with having different products repaired for
them As before the survey asked respondents to indicate the most important reasons
for having products repaired
On average the most important reason was again price ie having a product repaired
was cheaper than buying a new product The share of respondents indicating this reason
Behavioural Study on Consumersrsquo Engagement in the Circular Economy
88
ranged from 55 for dishwashers to 35 for mobile phones The second most important
reason was that the product was still under guarantee108 ranging from 45 for
mobile phones to 11 for clothing
The wide ranges reported above show that there exist important differences between
product categories While for vacuum cleaners dishwashers and televisions price
and guarantees were most important this was not the case for mobile phones Instead
an existing guarantee (45) was ranked more important than price (35) For clothing
items another aspect namely being particularly fond of their current possession was
relevant (39) in addition to price (51) Guarantees on the other hand did not play
an important role (11) for clothing
Table 20 Reasons for having a product repaired by product category (in )
Vacuum
cleaner
Dish-
washer
TV Mobile
phone
Coat or
jacket
It was cheaper than
buying a new one
490 552 420 351 509
The product was still
under guarantee
262 242 342 450 107
It was easier than
buying a new one
181 170 163 142 189
I am not good at
repairing things
myself
161 154 142 122 227
I was particularly fond
of my current product
133 73 134 176 387
My preferred product
was no longer in
production
43 21 29 43 32
It is better for the
environment than
buying a new one
171 201 146 134 116
Other 21 46 35 30 41
Donrsquot know 04 04 07 02 11
No of observations 929 1217 1190 1715 531
Note The question was Q32c ldquoYou said you had the following product(s) repaired for you when these broke down or became faulty Why did you decide to do this For each product please select the two most important reasonsrdquo
Source ConPolicy analysis of consumer survey data
Experience with repair services
The previous section reported experiences with having a person repair the product
including repair by friends relatives manufacturers as well as professional repair
services Table 21 displays the shares of participants who have used a repair service for
each of the different product categories
108 This study did not address whether consumersrsquo attitudes were different for situations in which products were still covered by the 2 year legal guarantee covering all goods sold in the EU or covered by additional (extended or commercial) warranties See Glossary at the end of the report for definitions of (legal) guarantees and warranties
Behavioural Study on Consumersrsquo Engagement in the Circular Economy
89
Overall 20-24 of participants indicated that they had used a professional repair service
for a faulty mobile phone television or dishwasher Much fewer participants had used
such services for vacuum cleaners (9) and clothing items (7)
Table 21 Experience with repair services by product category (in )
Vacuum
cleaner
Dish-
washer
TV Mobile
phone
Coat or
jacket
Share of respondents
with experience with
repair services
92 195 223 244 73
Note The question was Q62a ldquoHave you used a professional repair service to repair any of the following products in the past Please select all that applyrdquo N=12064
Source ConPolicy analysis of consumer survey data
Next to these product categories it was also asked whether participants had additional
experience with a repair service ie for other products Overall 46 of the participants
reported that they had experience with repair services for products except the five pre-
defined categories
Satisfaction with professional repair services
Participants who indicated having used a professional repair service for their faulty
product were asked to indicate their satisfaction with convenience speed consumer
friendliness and quality of the repair service109 Table 22 displays aggregate results for
all product categories
Overall consumers appeared to be rather satisfied with repair services On average 83
rated convenience of using a repair service at least fairly good including 20 that rated
it even very good Speed of repair was rated similarly satisfactory with a total of 81
rating the received service at least as fairly good including 20 indicating to have used a
very good service Consumer friendliness received an even higher rating with 88
stating the service as at least fairly good with 27 agreeing on it being very good
Lastly quality of repair was also rated as satisfactory Here 88 indicated having
received at least a fairly good service with 34 stating the service to have been very
good
Table 22 Satisfaction with professional repair services (in )
Very poor Fairly poor Fairly good Very good
Convenience 24 141 633 201
Speed of repair 35 157 610 198
Consumer friendliness 21 103 611 265
Quality of the repair 31 94 540 335
Note The question was Q62b ldquoThinking about the time you used a repair service for a [vacuum cleaner dishwasher mobile phone coat or jacket] how would you rate this service in terms of the following factors Please answer on a scale from 1 (ldquoVery poorrdquo) to 4 (ldquoVery goodrdquo) The respective product was chosen randomly for each participant given that he or she reported to have used a repair service for this product in the past
N=7331
Source ConPolicy analysis of consumer survey data
109 The focus of the following survey questions was to assess consumersrsquo expectations with regard to characteristics of repair service rather than price The preceding sections of the survey asked about the importance of prices in repair vs replace decisions and highlighted that consumers judge prices as a main driver of their decisions
Behavioural Study on Consumersrsquo Engagement in the Circular Economy
90
Additionally satisfaction with professional repair services was analysed individually for
the five different product categories Detailed results are displayed in Section 7 in the
Annex document Overall satisfaction was positive for all products While clothing items
received the highest ratings for convenience speed consumer friendliness and quality of
repair smart phones received the lowest ratings For all product categories it was
observed that the highest average satisfaction rates were achieved for quality of repair
while speed of repair received comparatively lower satisfaction ratings
Table 23 displays findings on whether repair services met consumersrsquo expectations
Overall consumers indicated that professional repair services rather met their
expectations 74 reported that the engaged service was at least above their
expectations with respect to convenience of repair (including 4 stating that is was
even well above their expectations) With respect to speed of repair a similar rating
emerged 72 stated that the service was at least above their expectations with 7
rating the service even better Consumer friendliness received a slightly better rating
Here 81 indicated that the repair service performed at least above their expectations
including 9 stating that it performed even well above their expectations Lastly
quality of repair was rated with a total of 80 indicating the servicesrsquo results to have
been at least above their expectations with 10 stating them to be even well above their
expectations
Table 23 Rating whether professional repair services met expectations (in )
Well below
expectations
Below
expectations
Above
expectations
Well above
expectations
Convenience 36 227 694 43
Speed of repair 50 233 650 66
Consumer
friendliness
32 156 726 86
Quality of the repair 46 152 697 104
Note The question was Q62c ldquoAnd to what extent did the repair service live up to your expectations in terms of these factorsrdquo follow up to previous Table 22 N=7331
Source ConPolicy analysis of consumer survey data
Again results on consumersrsquo expectations were analysed on the individual product level
as well Detailed results are depicted in Section 7 in the Annex document For all product
categories it was found that expectations were largely met The highest average ratings
were observed for clothing items while ratings were lowest for smart phones Similarly
ratings were on average lower for repair services in the product category of televisions
When looking at the different rated categories ie convenience speed consumer
friendliness and quality it was found that consumersrsquo expectations more likely met for
consumer friendliness and quality than for convenience and speed
442 Experience with rentingleasing products or buying products second
hand
The following section addresses consumersrsquo actual experience with renting or leasing
products as well as buying products second hand Respondents were asked if they had
experience with such practices in the last 5 years The same product categories as before
were covered (ie vacuum cleaners dishwashers TVs mobile phones and
coatsjackets) This section is thus distinct from the analysis presented in section 341
which showed hypothetical willingness to lease product as an indicator for willingness to
engage in CE practices
Figure 25 displays results on renting or leasing and buying second hand behaviour pooled
over the product categories A vast majority of 92 indicated that they neither rented
nor bought second hand in the last 5 years Purchasing second hand was more frequent
than renting ie 6 of the participants indicated to have bought second hand products
whereas 1 indicated to have rented or leased a product
Behavioural Study on Consumersrsquo Engagement in the Circular Economy
91
Figure 25 Experience with renting leasing or buying second hand pooled over product
categories (in )
Note The question was Q33a ldquoFor each of the products below have you rented or leased such a product or purchased a product second hand in the last 5 yearsrdquo N=12064
Source ConPolicy analysis of consumer survey data
Table 24 shows behaviour for the individual product categories Clothing items and
mobile phones were bought almost twice as often second hand compared to other
products Apart from that there were no substantial differences between product
categories
Table 24 Experience with renting leasing or buying second hand by product category
(in )
Vacuum
cleaner
Dish-
washer
TV Mobile
phone
Coat or
jacket
Rented or leased a
product
08 11 11 26 08
Purchased a second
hand product
46 54 48 83 89
Neither of the above 937 928 934 882 894
Donrsquot know 11 07 08 10 09
No of observations 4907 4463 4908 4914 4917
Note The question was Q33a ldquoFor each of the products below have you rented or leased such a product or
purchased a product second hand in the last 5 yearsrdquo
Source ConPolicy analysis of consumer survey data
Behaviour was also analysed with respect to country and socio-demographic factors The
detailed results can be found in Section 7 in the Annex document with a summary here
below
The share of participants not renting or buying second hand ranged from 81 (Romania)
to 93 (Portugal and Spain) 15 of the Romanian participants indicated to have bought
second hand while this share was much lower among Portuguese participants (3)
Participants from Ireland and Hungary also revealed comparatively larger shares of
buying second hand (10) A small age trend was observed for buying second hand
While 10 of the youngest participants indicated to have bought second hand only 4
indicated this behaviour in the oldest age group Education did not seem to play a role
while there was again a trend with respect to income Participants indicating their
financial situation to be very difficult revealed in 11 of the cases to have bought second
hand while participants indicating their financial situation to be very easy bought second
hand in only 5 of the cases
1
6
1
91
0 10 20 30 40 50 60 70 80 90 100
Dont know
Purchased second hand
Rented or leased a product
Neither rented nor second hand
Behavioural Study on Consumersrsquo Engagement in the Circular Economy
92
Reasons for renting or leasing a product
As seen before only few participants have rented or leased any of the products in the
past Table 25 depicts the reasons for renting or leasing specific products for this (small)
group of participants The importance of the reasons seemed to be product specific and
no clear general patterns emerged
The most popular reason for renting or leasing vacuum cleaners was that it was easier
to rent a vacuum cleaner than to buy one (24) The same was true for renting and
leasing coats or jackets (31) Televisions were rented or leased most frequently
because people wanted to test the product before buying it (22) The most
important reason for renting a dishwasher was that people liked that the product was
also reused afterwards (31) The price was the most important reason for
participants that rented or leased a mobile phone 32 indicated that they rented or
leased a mobile phone product because they could not afford to buy it
Table 25 Reasons for renting or leasing a product by product category (in )
Vacuum
cleaner
Dish-
washer
TV Mobile
phone
Coat or
jacket
It was easier than
buying one
237 110 181 256 311
I wanted to test the
product before
buying it
187 256 219 129 226
I liked that the
product would be re-
used afterwards
93 312 159 159 97
I could not afford to
buy the product
151 228 112 316 79
Maintenance was
included
185 105 134 167 170
I only needed the
product for a short
time
172 176 105 115 141
I could get rid of the
product more easily
148 80 121 57 133
Other 52 38 68 79 38
Donrsquot know 23 05 93 36 137
No of observations 55 71 69 130 52
Note the question was Q33b ldquoYou said that you have rented or leased the following product(s) in the last 5 years Why did you decide to do this For each product please select the two most important reasonsrdquo Since participants indicated the two most appropriate reasons the totals do not sum up to 100
Source ConPolicy analysis of consumer survey data
Reasons for not renting or leasing a product
As indicated before the vast majority of the participants had no experience with renting
or leasing products Table 26 illustrates the reasons why participants had not engaged
with such practices in the past
The two most important reasons for all product categories were that participants wanted
to own the products they use (ranging from 44 to 49) as well as wanting a new
unused product (ranging from 41 to 51) Preferring not to be bound by
contracts not knowing that renting a product was possible or higher costs of
renting were all of moderate importance Negligible reasons were the inability to find a
product for rent (below 4 for all products) and lack of trust in rentalleasing firms
(below 7 for all products)
Behavioural Study on Consumersrsquo Engagement in the Circular Economy
93
Having a look at the differences between product groups it becomes obvious that there
were almost no noteworthy differences Being bound by a contract was a less important
reason not to rent a clothing item (10) compared to other product categories (about
20)
Table 26 Reasons for not renting or leasing a product by product category (in )
Vacuum
cleaner
Dishwasher Television Mobile
phone
Coat or
jacket
I like to own the
products I use
476 440 465 448 494
I wanted a new
unused product
410 415 428 429 505
I prefer not to be
bound by contracts
195 198 210 213 100
I did not know it was
possible
159 147 132 109 124
It was more
expensive than
buying the product
133 134 123 130 76
I could not find a
product for rent
24 30 18 25 25
I do not trust
rentalleasing firms
49 59 61 61 36
Other 20 28 17 23 15
Donrsquot know 10 16 11 13 24
No of observations 4796 4351 4799 4726 4809
Note The question was Q33c ldquoYou said that you have not rented or leased the following product(s) in the last 5 years Why is this For each product please select the two most important reasonsrdquo Since participants indicated the two most appropriate reasons the totals do not sum up to 100
Source ConPolicy analysis of consumer survey data
Reasons for buying a product second hand
Buying products second hand was overall more popular than renting or leasing Table 27
depicts the reasons for buying products second hand Price played an important role for
all product categories (ranging from 41 to 65) followed by the reason that
participants thought second hand products to be better value for money (ranging from
31 to 39) Moreover between 13 and 31 of participants bought second hand due
to environmental reasons Simplicity of the buying process as well as availability were
only important to a small fraction of participants that bought second hand
Furthermore a notable difference between the product categories exists regarding
environmental motives for purchasing second hand Only 13 to 20 of participants
indicated that they bought a vacuum cleaner dishwasher television or mobile phone
second hand for environmental reasons while this was true for 31 of participants
buying second hand clothing items
Behavioural Study on Consumersrsquo Engagement in the Circular Economy
94
Table 27 Reasons for buying a product second hand by product category (in )
Vacuum
cleaner
Dishwasher Television Mobile
phone
Coat or
jacket
It was cheaper than
buying a new one
414 555 509 646 579
Second hand
products are better
value for money
309 313 350 332 393
Buying goods second
hand is better for the
environment
177 164 131 196 311
It was easier than
buying a new one
151 179 167 161 66
The product I wanted
is no longer in
production
78 72 85 93 104
Second hand
products are better
quality
108 81 33 30 74
Other 38 39 52 16 15
Donrsquot know 18 07 41 22 46
No of observations 245 287 297 458 545
Note The question was Q33d ldquoYou said that you have purchased the following product(s) second hand in the last 5 years Why did you decide to do this For each product please select the two most important reasonsrdquo Since participants indicated the two most appropriate reasons the totals do not sum up to 100
Source ConPolicy analysis of consumer survey data
Reasons for not buying a product second hand
According to Table 28 the most important reason for not buying second hand was that
participants wanted to have new products instead of old ones The shares of
participants choosing this answer category ranged between 55 and 68 Lack of trust
in second hand products was on average the second most important reason followed
by agreeing to new products being better value for money Possible inferior quality of
second hand products and difficulties in buying second hand were only important to a
small share of the participants
Furthermore there exists an interesting difference regarding the trust in second hand
products between different product categories While trust in the products seemed to be
an important driver for dishwashers (30) televisions (31) mobile phones (36) and
even clothing items (20) it was a very negligible reason for vacuum cleaners (3)
Behavioural Study on Consumersrsquo Engagement in the Circular Economy
95
Table 28 Reasons for not buying a product second hand by product category (in )
Vacuum
cleaner
Dishwasher Television Mobile
phone
Coat or
jacket
I prefer having brand
new products
549 569 585 580 684
New products are
better value for
money
206 210 210 182 138
I do not trust second
hand products
29 303 309 356 203
It is more difficult
than buying a new
one
110 108 92 68 85
Second hand
products are of
inferior quality
82 66 77 103 88
I donrsquot know where
to buy a second hand
product
76 60 52 48 55
Second hand
products cost more
to maintain
53 73 64 46 22
Other 52 51 40 40 43
Donrsquot know 29 26 30 29 50
No of observations 4606 4135 4571 4398 4316
Note The question was Q33e ldquoYou said that you have not purchased the following product(s) second hand in the last 5 years Why is this For each product please select the two most important reasonsrdquo Since participants indicated the two most appropriate reasons the totals do not sum up to 100
Source ConPolicy analysis of consumer survey data
45 Evidence from the behavioural experiment
This section reports findings from the repair experiment which was part of the
behavioural experiment A short description of the experimental tasks outcome
measures treatments and monetary incentives can be found in section 271
The repair experiment had two stages First respondents needed to decide whether they
wished to repair or replace a defective product which was beyond the 2-year legal
guarantee110 In case they decided to replace their product they were given a choice to
replace it with either a brand new product or a second hand product We report findings
for each of these stages in turn below
451 Likelihood to repair
Experiment respondents had generally positive attitudes towards repairing defective
products A vast majority (92) decided to repair at least one product over the course of
the three rounds of the repair experiment task
110 To avoid confusion by respondents with regards to whether the defect was covered by a legal guarantee the product age was indicated as being 2 years for coats and smartphone and 5 years for TVs vacuum cleaners and dishwashers
Behavioural Study on Consumersrsquo Engagement in the Circular Economy
96
Figure 26 Frequency of choosing to repair across all respondents and rounds of the task
Note The repair experiment was repeated three times by each respondent each time making decisions about a different type of product N=6042
Source LE Europe analysis of behavioural experiment
The likelihood of choosing to repair a product was roughly equivalent across the different
products Only for Dishwashers the share of respondents choosing to repair was
significantly larger than for all other products as shown in Figure 27 below
Figure 27 Shares of respondents choosing to repair and replace by product type
Note Numbers of observations by product VC=3627 DW=3638 TV=3644 SM=3612 CL=3605
Source LE Europe analysis of behavioural experiment
The top two reasons for choosing to repair a product rather than replacing it in this
experiment task were
Always trying to repair products before replacing them and
Thinking that a repair would be worthwhile
Other reasons including other monetary motives and fashiontechnology preferences
were less important but still frequently mentioned as shown in Figure 28
Behavioural Study on Consumersrsquo Engagement in the Circular Economy
97
Figure 28 Reason for choosing to repair
Note Answers to follow-up question FR2 Why did you choose to repair the product instead of replacing it Select all that apply N=3769
Source LE Europe analysis of behavioural experiment
Impact of socio-psychological attitudes on repair decisions
Socio-psychological attitudes seemed to play an important role in repair or replace
decisions The consumer survey elicited several self-declared personal attitudes towards
different aspects of the CE These survey questions were used to derive indicators for the
following attitudes
Preferences for trends and fashion
Pro-environmental attitudes in general
Positive attitudes towards second hand products
Pro-CE attitudes of peers (eg family and friends)
Self-rated awareness of durability and reparability and
Positive attitudes towards durability and reparability
Shown in Figure 29 the different attitudes appear to be systematically related to the
likelihood of choosing to repair rather than to replace in the experimental task
Individuals with strong preferences for trends and fashion chose less often to repair
compared to those who had medium or weak preferences for trends and fashion In
particular the share of respondents who repaired once or twice over the course of the
three repetitions of the experiment seems to be fairly constant across different attitudes
(47-52) At the same time those with weak preferences for fashion and trends were
much less likely to never repair (5) compared to those with strong preferences for
trends and fashion (13) and much more likely to choose to repair in every round (48
compared to 35)
Similar patterns were observed for the other personal attitudes as well as for attitudes of
peers
Interestingly also individuals with positive attitudes towards second hand products were
more likely to repair rather than replace This was despite the fact that individuals could
have chosen to purchase a second hand product as a replacement product
Behavioural Study on Consumersrsquo Engagement in the Circular Economy
98
Figure 29 Likelihood to repair for respondents with different socio-psychological
attitudes relative to the CE
Preferences for trends and fashion Pro-environmental attitudes
Positive attitudes towards second hand products
Pro-CE attitudes of peers
Awareness of durability and reparability Positive attitudes towards durability and reparability
Never repaired Repaired once Repaired twice Repaired three times
Source LE Europe analysis of behavioural experiment
The reported findings were verified using regression analyses (see the Annex for further
detail) These analyses confirmed that socio-psychological factors and particularly
attitudes towards trends and fashion and attitudes towards durability and reparability
were strong drivers of the decision to repair or replace
Behavioural Study on Consumersrsquo Engagement in the Circular Economy
99
The effects of effort frictions in repair or replace decisions
The experiment systematically varied how the choice to repair was presented via
experimental treatments111 In a first step it was varied whether individuals needed to
exert more effort in order to repair or replace This treatment thus simulated the fact
that in reality it can be difficult to arrange for repair similarly it can be time consuming
to search for a replacement product either new or second hand Figure 30 below shows
how the likelihood to repair across the different experimental rounds varied under
different treatment conditions
Behaviour in the baseline condition where both repairing and replacing were effortless112
resembled behaviour in the condition in which replacement required effort 6-7 of
respondents in these conditions never repaired while 76-80 decided to repair twice
or three times
When instead repairing required effort the share of respondents deciding to never repair
doubled from 6 to 12 At the same time the share of respondents who chose to
always (three times) repair dropped from 42 to 35 Both movements are highly
statistically significant
Regression analysis reported in Table 29 similarly finds that effort in the experiment
discouraged repair but it did not discourage replacement of a broken product with either
a new or second hand product This finding was robust to the inclusion of socio-
psychological characteristics and demographics
It thus seems that frictions in the accessibility of repair services significantly
lowered the attractiveness of repairing while the same type of frictions had
virtually no effect on the decision to replace a product Overall repairing was the
most popular choice in this experiment However it seems that respondents at some
occasions had a clear motivation behind their decision to replace rather than repair For
example many respondents who replaced did not think a repair would have been
worthwhile or were interested in owning the latest fashiontechnology (see next
subsection for further details) It seems that when this was the case respondents were
not put off replacing even when it required them to go through an additional tedious
task
A possible reason for this can be seen in the behavioural economics literature which finds
that when the intrinsic motivation for a certain behaviour is strong it can outweigh
nudges and other environmental factors which could otherwise influence behaviour113
This means that in the experiment although the effort associated with repairing and
replacing was identical respondents may have still perceived that repairing would be
more tedious by taking their real-world expectations about repair into the experiment
environment Indeed it is regularly found in well-known economic experiments that
respondent behaviour can differ due to framing or labelling effects114
111 Allocations to the various treatments in the experimental tasks were done independently and randomly across the different allocations This resulted in a full factorial design between products and treatments This means that group sizes for different variants within each treatment category were roughly equal and each respondent had the same likelihood of being assigned to any specific treatment This also ensures that on average there should not be any interactions between different types of experimental treatments
112 Repairing required only clicking on a lsquoRepairrsquo button replacing required clicking on a lsquoReplacersquo button and then selecting a replacement product between a brand new or second hand product
113 Sunstein (2017) lsquoNudges that failrsquo Behavioural Public Policy
114 For example behaviour in a prisonersrsquo dilemma game differs widely depending on whether it is labelled as a ldquoCommunity Gamerdquo or a ldquoWall Street Gamerdquo similarly contributions in public goods game are different depending on whether the experiment is labelled as a ldquoCommunity Gamerdquo or simply as an ldquoExperimentrdquo See respectively Ross Ward (1996) lsquoNaive realism in everyday life Implications for social conflict and misunderstandingrsquo In Reed et al (Eds) Values and Knowledge Liberman Samuels Ross (2004) lsquoThe name of the game predictive power of reputations vs situational labels in determining Prisonerrsquos Dilemma game movesrsquo Personality and Social Psychology Bulletin 30 Dufwenberg Gaumlchter Henning-Schmidt (2011) lsquoThe framing of games and the psychology of playrsquo Games and Economic Behavior
Behavioural Study on Consumersrsquo Engagement in the Circular Economy
100
Overall however it should not be disregarded that a more than one in three experiment
participants decided to repair in each of the three rounds and were never dissuaded from
doing so because of the additional effort required
Figure 30 Frequency of repair choices in different effort conditions
Note Number of observations in different treatment conditions No effort N=2020 Effort after repair N=1991 Effort after replace N=2022
Source LE Europe analysis of behavioural experiment
Behavioural Study on Consumersrsquo Engagement in the Circular Economy
101
Table 29 Results from ordered logit regression on number of repairs chosen and logit regression on proportion of second hand products chosen
Outcome variable Number of times repair was chosen across three rounds
Proportion of second hand products chosen if respondent replaced
(1) (2) (3) (4)
Effort treatment ndash Baseline no effort
Effort after repair 0710 0699 1130 1114
(-421) (-434) (086) (073)
Effort after replace 1143 1138 0942 0930
(168) (159) (-039) (-045)
VAT treatment ndash Baseline Repair is not VAT exempt
VAT exempt 0995 0960 0999 1033
(-007) (-061) (-001) (026)
Source of repair treatment ndash Baseline Manufacturer repair with original parts only
Manufacturer repair with non-original parts 0853 0860 1306 1211
(-174) (-162) (159) (108)
Independent repair with original parts only 0974 0961 1131 1066
(-029) (-042) (072) (035)
Independent repair with non-original parts 0847 0843 1060 1058
(-176) (-177) (034) (031)
Country controls
Socio-demographics (age gender etc)
Personal attitudes (pro-CE pro-trends etc)
Model Ordered logit Ordered logit Logit Logit
N 6042 6042 3711 3711
Note Odds ratios (exponent coefficients) reported t statistics in parentheses p lt 005 plt 001 p lt 0001
Behavioural Study on Consumersrsquo Engagement in the Circular Economy
103
The effects of framing repair prices as VAT exempt
Another experimental condition varied the display of the repair prices by labelling
repair prices as including VAT or as VAT exempt It is important to note that this
experimental treatment did not vary the prices for repair as such (eg prices which were
labelled as VAT exempt were not cheaper than VAT inclusive prices)115 This is because it
was not the objective of this study to assess the price elasticity in demand for repair
services but rather to assess whether non-price related measures might make the option
to repair product more or less attractive Indeed the behavioural economics literature
often finds that the way in which prices are presented (ie framed) has important effects
on choice behaviour116 This experimental condition alluded that repair may have been a
lsquogood dealrsquo (since it was labelled as VAT exempt) and at the same time it made the
decision to repair more salient (via a red label ldquoVAT EXEMPTrdquo see section 271 for
screenshots of the experiment environment) Both these characteristics of the
experiment had been hypothesized to make repairing more attractive In the present
experiment however choices were virtually unaffected by the framing see Figure 31
and Table 29
Figure 31 Frequency of repair choices in VAT framing treatment
Note Number of observations in different treatment conditions VAT not exempt N=2997 VAT exempt N=3045 The treatment tested framing only This means that prices were identical in both experimental conditions
Source LE Europe analysis of behavioural experiment
The finding is in line with what classical economic theory would predict Classical
economic theory would not expect a shift in the demand for repair unless prices were
different Thus further efforts to expand VAT exemption of repair services should take
into account consumersrsquo price sensitivity for repair services It would need to be verified
whether demand for repair services is elastic such that price reductions due to VAT
exemption would actually increase the use of repair services According to the
behavioural experiment preferential VAT treatment purely in a marketing sense might
remain without an effect
115 For example the price to repair a dishwasher would have been euro79 incl VAT in one condition and euro79 excl VAT in another Prices were calibrated in this way to disentangle price effects from VAT framing effects
116 See for example UK Office for Fair Trading (2010) lsquoThe impact of price frames on consumer decision makingrsquo a report prepared by London Economics Tversky and Kahneman (1981) lsquoThe framing of decisions and the psychology of choicersquo Science Levin et al (1998) lsquoAll frames are not creaed equal A typology and critical analysis of framing effectsrsquo Organizational Behavior and Human Decision Processes
Behavioural Study on Consumersrsquo Engagement in the Circular Economy
104
At the same time it is important to consider that other assessments of the effects of
preferential VAT taxation (or VAT exemption) of specific goods and services are
inconclusive Most theoretical studies and pre-assessments argue that demand for the
concerned goods and services would increase due to the price reductions which would in
turn increase supply and employment in the affected sectors However these effects are
not (consistently) confirmed by post-implementation evaluations One problem in the
chain of the above arguments is that VAT reductions are often not passed on to the
consumers thus resulting in stable prices and demand117
The importance of characteristics of the repair service
Lastly the experiment tested whether repair decisions were driven by certain (non-price)
characteristics of the repair services It was varied whether repair services were more
attractive when offered by the manufacturer compared to by an independent repair
service And secondly it was varied whether the repair was done using original parts
only or original as well as non-original parts Prices across these different conditions
were held constant So this treatment can again be seen as a lsquoframingrsquo treatment
Shown in Figure 32 this experimental condition also left choices mostly unaffected
Yet further regression analysis suggested that the impact of labelling might have been
different for certain groups of consumers For example the VAT exempt label seems to
have attracted individuals who give low importance to fashion and trends towards repair
while those who attribute high importance to trends and fashion and those who had
negative attitudes towards second hand products were significantly less likely to choose
repair when it was labelled as VAT exempt The framing of repair prices as VAT exempt
has also led some respondents in more difficult financial situations to repair more
Figure 32 Frequency of repair choices by (non-price) repair characteristics
Note Number of observations in different treatment conditions Manufacturer with original parts N=1475 Manufacturer with non-original parts N=1544 Independent repair with original parts N=1524 Independent with non-original parts N=1499 The treatment tested framing only This means that prices were identical in all four experimental conditions
Source LE Europe analysis of behavioural experiment
117 For some overviews of the effects of VAT and VAT changes see for example European Commission (2013) Reduced rates of VAT frequently asked questions MEMO03149 European Commission COM(2003) 397 final Abramovski et al(2017) lsquoRedistribution efficiency and the design of VAT a review of the theory and literaturersquo Institute for Fiscal Studies Experian (2014) An estimate of the effects of a reduction in the rate of VAT on housing renovation and repair work 2015 to 2020
Behavioural Study on Consumersrsquo Engagement in the Circular Economy
105
It appears that if at all repair decisions were affected by the use of non-original parts
When aggregating data from the table above it seems that repair was slightly less
attractive when the repair service used original and non-original parts compared
to the conditions in which original parts were used exclusively At the same time
whether the repair service was offered by the manufacturer or an independent
repair shop was indifferent for respondents
Regression analysis suggested that the repair characteristics mattered to some extent to
different age groups However no clear patterns arose For example younger
respondents (aged 18-34) were less likely to repair when repair would have been done
using original parts only Instead older respondents (55+) were more likely to choose to
repair when an independent repair shop provided the service rather than the
manufacturer
These findings thus suggest that there are no strong inherent differences in consumer
attitudes towards manufacturer or independent repairs Such differences could arise for
example due to differences in trust
The present experiment however did not test whether preferences would shift for
example if repairs by the manufacturer were more expensive than repairs offered by an
independent repair shop It is likely that a difference in price would also shift consumer
preferences
As mentioned above a majority of respondents in this experiment felt a repair would be
worthwhile Interestingly more respondents indicated this reason for repairing when
repair was offered by the manufacturer with original parts only or when offered by an
independent repair shop using both original and non-original parts Instead when the
manufacturer would have used also non-original parts or an independent shop only
original parts respondents seemed to have the impression that this made repair less
worthwhile
452 Likelihood to purchase second hand
As mentioned above following the decision to repair or replace a product respondents
who chose to replace were asked whether they wished to purchase a brand new or
second hand replacement product All results presented in this section thus only show
choices for respondents who initially chose to replace and not repair their products in
the first stage
Second hand products were calibrated to be equivalent to the state of technologyfashion
of the already owned defective product whereas brand new products would have
represented an upgrade Second hand products were roughly 40 cheaper compared to
brand new replacement products
Visible from Figure 33 respondents who wished to replace their products rather than
repair them had an overwhelming preference for brand new products Only 20 of
respondents had a tendency to choose the second hand option over the option of
purchasing brand new at this decision stage
Behavioural Study on Consumersrsquo Engagement in the Circular Economy
106
Figure 33 Choices between brand new and second hand products results pooled across
all respondents repetitions of the task and experimental treatments
Note This figure presents data aggregated across the three repetitions of the experiment The left-hand bar indicates respondents who have chosen the second hand product at least once when they reached the replace stage once or twice and respondents who chose the second hand product at least twice if they reached the replace stage three times The right-hand bar shows the residual individuals who were thus more likely overall to have chosen the brand new over the second hand product
Number of respondents included in the chart N=3711 Total number of respondents in the experiment was
6042 of which 3711 (61) have chosen to replace at least once
Source LE Europe analysis of behavioural experiment
The strong preferences for brand new products were equivalent for vacuum cleaners
dishwashers and televisions with 86-87 of respondents choosing brand new over 13-
14 choosing second hand products (Figure 34) Yet for smartphones and clothes
(coats) respondents were more likely to purchase the second hand product 20
compared to the other product categories At least for coats this was likely due to the
fact that it was less fashion-driven respondents who were most likely to purchase second
hand For smartphones instead no particular respondent group drove the result
The other strands of research (literature review focus groups and stakeholder
consultations) suggested that different attitudes could drive behaviour differently for
different product categories in the sense that fashion and technology might influence
some product decisions more than others
Behavioural Study on Consumersrsquo Engagement in the Circular Economy
107
Figure 34 Choices between brand new and second hand products results pooled across
all respondents repetitions of the task and experimental treatments
Note VC=1324 DW=782 TV=1283 SM=1260 CL=1345
Source LE Europe analysis of behavioural experiment
Reasons for replacing rather than repairing were quite mixed The most important
reasons seemed to relate to scepticism around the quality of repair 47 of respondents
indicated that they did not think that repair would be worthwhile that it would be too
expensive (27) and that it would be too much hassle (18) These reasons prevailed
although only a minority of respondents thought that the product could not be repaired
(9)
At the same time a considerable proportion of respondents 35 indicated being
interested in owning the latest fashion andor technology which naturally made the
options to repair or purchase a second hand product less attractive
Figure 35 Reasons for replacing rather than repairing products
Note Answers to follow-up question FR3 Why did you choose to replace the product instead of repairing it
Select all that apply N=2273
Source LE Europe analysis of behavioural experiment
Behavioural Study on Consumersrsquo Engagement in the Circular Economy
108
Impact of socio-psychological attitudes on replacement decisions
Compared to the importance of socio-psychological attitudes on repair decisions these
factors seemed to play a less important role in replacement decisions Visible from Figure
36 the decision to purchase a second hand product was again slightly increased by more
pro-CE attitudes but the patterns were less distinct than in the preceding stage
The most notable difference in behaviour was observed for respondents with positive
attitudes for second hand products These individuals were more than four times more
likely to purchase a second hand product compared to individuals with negative attitudes
towards used products 41 compared to 9 Similarly the regression analyses
confirmed that the attitude towards second hand products was the main driver of the
decision to purchase second hand
Figure 36 Likelihood to repair for respondents with different socio-psychological
attitudes relative to the CE
Preferences for fashion and trends Pro-environmental attitudes
Positive attitudes towards second hand products
Pro-CE attitudes of peers
Awareness of durability and reparability Positive attitudes towards durability and reparability
Behavioural Study on Consumersrsquo Engagement in the Circular Economy
109
Mostly chose second hand product Mostly chose brand new product
Source LE Europe analysis of behavioural experiment
Impact of experimental treatments on the replacement decisions
The experiment did not introduce systematic changes at this decision stage None of the
experimental treatments that were applied at the first repair vs replace stage had
knock-on effects on the decision whether to replace the product with a brand new or
second hand product
Behavioural Study on Consumersrsquo Engagement in the Circular Economy
110
5 Consumersrsquo awareness understanding and expectations on
durability and reparability
The present study did not use a precise definition of what constitutes a lsquodurablersquo or
lsquorepairablersquo product Instead it was one of the main scopes of the study to uncover
what consumers associate with the concepts of lsquodurabilityrsquo and lsquoreparabilityrsquo
The study thus potentially takes a different point of view on these CE concepts compared
to studies that are focussed on industry standards Naturally industry standards require
clear definitions of what can be considered a lsquodurablersquo or lsquorepairablersquo product to be
enforceable This study instead covers the views and perceptions around durability
and reparability of the general population across different EU Member States
Based on findings from the literature stakeholder interviews focus group discussions
and the consumer survey this section presents findings on consumersrsquo awareness of
durability and reparability characteristics and what they understand by durability and
reparability as well as their expectations about such product characteristics Differences
by product category and differences in behaviour of different consumer groups in terms
of CE attitudes or socio-demographics are highlighted throughout Secondly a focus is
put on consumersrsquo after-sales expectations For example when do consumers expect a
free repair or replacement of a broken product and how do such expectations vary
depending on the product information received at the point of sale
Key findings
According to stakeholders focus group participants and survey respondents
consumers most associate products lasting for a long time with lsquodurabilityrsquo
Secondly consumers tend to collapse the concepts of durability quality and
price in the sense that they expect longer life spans for more expensive products
More specifically in the consumer survey properties most associated with a ldquodurablerdquo
product were being able to use a product for a long time and the product
staying in perfect working order for a long time
As highlighted in previous sections these consumer associations are heavily
influenced by a substantial lack of awareness and missing product information
regarding CE product characteristics
Stakeholders reported that consumer expectations about durability decreased with
time after purchase and that consumersrsquo after-sales expectations about reparability
were low
Various strands of research pointed out that older consumers expected products to
last longer
A stakeholder mentioned that consumers from former communist countries of Eastern
Europe tend to exhibit higher durability expectations At the same time as reported
already in section 4 consumers from Eastern Europe also display a higher willingness
to repair
Focus group participants felt that products produced in the past were more durable
compared to modern products
In the consumer survey the properties most associated with a ldquorepairablerdquo
product were spare parts being available for the product and the possibility to
have the product repaired by a repair firm
Several stakeholders for example from trade associations and industry highlighted
how reparability and durability should be seen in conjunction in the sense that easy
reparability can enhance durability Instead it appears that consumersrsquo mostly
view durability as a substitute for reparability because a long-lasting product would
not require repairs (see also findings from the behavioural experiment reported in
section 6 which highlight that durability plays a more important role for consumers
compared to reparability)
What consumers associate with lsquodurabilityrsquo and lsquoreparabilityrsquo seems to be consistent
across different types of products At the same time consumers have different
expectations regarding how long different products should last Focus group
participants and survey respondents have reported wide ranges of life-time
expectations for the different products of the study such as
Behavioural Study on Consumersrsquo Engagement in the Circular Economy
111
o For vacuum cleaners 27 of survey participants expected a lifespan between
4 and 7 years with another 27 that indicated an expectation of 7 to 10
years
o For dishwashers the lifespan expectations were higher with 29 indicating
that they expected a lifespan between 7 and 10 years and another 29 with
an expectation of 10 to 15 years
o Similarly 31 indicated they expected a television to last for 7 to 10 years
and another 28 stated their expectation to lie within the range of 10 to 15
years
o For mobile phones and clothing items lifespan expectations were lower 38
expected a lifespan between 2 and 4 years for mobile phones and 35
indicated a lifespan of 4 to 7 years
o For clothing items lifespan expectations were indicated to lie within 2 to 4
years by 25 and within 4 to 7 years by 26 of the participants
For all five product categories a substantial majority of survey respondents ndash ranging
from 77 for coatsjackets to 90 for dishwashers ndash thought it would be possible
for these products to be repaired either by themselves or by someone else on
their behalf This high overall percentage was largely due to an expectation that it
would be possible to have the products repaired by a third party (ie friends and
family professional repair services)
Most survey respondents who said they would be able to repair the products
themselves believed it would be ldquoratherrdquo or ldquoveryrdquo easy to repair a vacuum
cleaner (55) or coatjacket (58) whereas the shares who gave this answer
were much lower for dishwashers televisions and mobile phones (35 23 and
29 respectively)
Across all product categories most consumers expected it would be ldquoratherrdquo or ldquoveryrdquo
easy to have a product repaired for them (ranging from 51 to 69)
In terms of after-sales expectations there were contrasting views uncovered
by the different strands of research Stakeholders reported low after-sales
expectations of consumers for the reparability of products These low expectations
were grounded in negative experiences in terms of support from the retailers
These reported negative experiences seem however to contrast with findings from the
consumer survey Across the representative samples across 12 Member States most
consumers would expect a good service from repair services a substantial
majority would expect the service to be ldquofairlyrdquo or ldquoveryrdquo good in terms of
convenience (85) speed (82) friendliness (89) and quality of the repair
(92) And as reported in the previous section experiences with repair services were
mostly positive and repair services regularly exceeded expectations There thus
seems to be a mismatch between consumersrsquo expectations and actual
experiences that might be driven by exemplary negative experiences of a
minority of consumers
Generally guarantees seem to affect consumersrsquo expectations according to
stakeholder and consumer views from the survey and focus groups The longer a
product is under guarantee the longer consumers expect the product to last and the
higher are their expectations also regarding the reparability of a product Moreover if
a product breaks down during the guarantee period consumers are more likely to
return it to the retailer or manufacturer to receive a replacement or free repair
The survey revealed mixed views regarding what should happen if a product were to
become faulty For example 34 of consumers would expect to have to repair the
product at their own expense while 32 would expect repair free of charge
Repair free of charge was often expected when consumers held extended
commercial guarantees or insurance from retailers (41) the retailer claimed
that the product would ldquolast at least 10 yearsrdquo (32) or the product carried an EU
label indicating that it has a high durability rating (22)
A joint analysis of the behavioural experiment and the consumer survey has revealed
that consumers who have received durability information via manufacturer
warranties or durability promises at the point of sale in a purchasing exercise in the
experiment were significantly more likely to expect free replacement or free
repairs of faulty products Instead those who had not seen any information on CE
product characteristics or only information on the reparability of a product were
Behavioural Study on Consumersrsquo Engagement in the Circular Economy
112
significantly less likely to expect free rectification of the fault in any way and instead
more likely to expect needing to pay for either repair or replacement
51 Evidence from the literature and data collection
511 Consumersrsquo awareness understanding and expectations about
durability
Consumers understanding of durability
Braithwaite et al (2015) have studied the impact of durability information on consumersrsquo
purchasing decisions They have reviewed the part of the literature on consumersrsquo
durability understanding They have found that the meaning of durability varies among
consumers It can be linked to products that have lifetime guarantees or that have parts
that can be updated or modifiedrsquo Durability is also linked to the productrsquos performance
over time
The other sections of this report have indicated that consumers mainly link durability
to a longer lifespan (see especially section 611) The importance of lifespan
information on labels in consumersrsquo purchasing decisions confirms this statement
Moreover according to a WRAP study for a consumer the durability of a product is
measured by how long the product provides a useful service to them118
Consumersrsquo awareness of durability
Sections 612 and 614 present the importance of information about durability on
consumersrsquo purchasing decisions The reviewed literature showed that this positive
impact is explained by the consumersrsquo initial lack of knowledge on durability
characteristics The study carried out on behalf of the European Economic and Social
Committee indicated that on average a product was chosen 46 more often when the
lifespan of the product was indicated119 From this it can be concluded that consumers
are not aware of the durability of products unless they are informed about it
As an example of a white good and according to a European Commission report about
household dishwashers consumers do not feel knowledgeable about how long washing
machines last and are not aware of the information available120 Some consumers also
have doubts about whether the lifetime of products can be accurately measured
As the degree of consumersrsquo awareness varies according to the information provided it
may be assumed that having a legally required indication may enhance consumersrsquo
awareness of a productrsquos durability The Annex illustrates some specific cases where such
durability information is mandatory (see Section 3 lsquoOverview of existing policy initiatives
and potential improvements suggested by stakeholdersrsquo in the Annex document) For
instance under the European Ecodesign Directive traders shall indicate a minimum
information about the expected lifespan of vacuum cleaners and light bulbs121
Consumersrsquo expectations about durability
The reviewed literature has indicated that consumersrsquo expectation about durability
varies across products
In 2013 a WRAP study on consumersrsquo purchasing behaviour towards electronic
appliances stated that the expected durability for washing machines vacuum
cleaners and laptops were lower than for TVs and fridges However no detailed
figures or explanation were provided in this study
118 WRAP 2017
119 European Economic and Social Committee 2016
120 European Commission (2017) European Commission DG JUSTGfK (2017) lsquoConsumer Market Study to support the Fitness Check of Consumer Rulesrsquo
121 BEUC 2015
Behavioural Study on Consumersrsquo Engagement in the Circular Economy
113
Figure 37 below illustrates the desired lifespan of consumer goods according to an online
study carried out on behalf of the Chamber of Labour in Vienna in 2017 with 1009
respondents It seems that expectations regarding lifespan are higher for major
household appliances and furniture than for clothes and electronic items
Figure 37 Desired lifespan of consumer goods (in years)
Source AK Wien 2017 p 8
512 Consumersrsquo awareness understanding and expectations about
reparability
Consumersrsquo understanding of reparability
The reviewed literature provided information about the positive impact of the information
on reparability and the best way to frame this information (see section 614) However
no relevant information about consumersrsquo understanding of reparability were retrieved
Consumersrsquo awareness of reparability
As for consumersrsquo understanding of reparability no information was found in the
literature
Consumersrsquo expectations about reparability
Two main points emerged from the literature review consumersrsquo preference to use
either a professional or an independent repair service and the question of what
consumers expect when using a repair service
The first category of products for which we retrieved information is clothes According to
a WRAP study carried out in 2012 50 of survey respondents declared that they
repaired their clothes by themselves while 25 said they gave them to a friend or to a
family member to have them repaired Only 25 of the remaining respondents reported
using a professional repair service This willingness to use non-professional repair
services may be partly explained by the fact that 40 of the consumers surveyed
expressed their confidence in repairing their clothes by themselves while 15 of the
other respondents were eager to learn how to do it122
122 WRAP 2012 pp 63 65
Behavioural Study on Consumersrsquo Engagement in the Circular Economy
114
Preliminary findings of a study being conducted by a German consumer association
illustrate that 34 of consumers get their products repaired by the seller from which
they purchased it123
The next important findings deal with consumersrsquo general expectations about repair
services and the variation of those expectations across different product
(categories)
In 1978 L Adler and J Hlavcek conducted a field study on the importance of certain
repair services characteristics for consumers Following their study the five most
important repair service characteristics mentioned by consumers were cost speed
reputation quality and location
The importance of those characteristics varies across products Quality of the repair work
is the most important consideration for automobiles televisions refrigerators stoves
and stereos For electric can openers toasters and pocket calculators cost is the most
critical repair consideration In the case of typewriters and vacuum cleaners cost is
somewhat more important than quality All categories have in common that location is
the least impactful characteristic124
Finally HWieser and NTroumlger (2012) also pointed out that consumers have higher
expectations of repair services for more expensive and bigger household products
513 After-sales expectations
The literature review did not find evidence on after-sales expectations because most
studies were focussed on the purchasing process
52 Evidence from the stakeholder interviews
521 Consumersrsquo awareness understanding and expectations about
durability
Consumersrsquo understanding of durability
Interviewees underlined the conclusions from the literature review regarding consumersrsquo
understanding of durability Indeed the main input from interviewees is that durability
is interlinked with quality According to a representative from a European consumer
association the first consideration from consumers in their purchasing decision is about
quality According to him for consumers durability is the principal component of a
quality assessment A Romanian academic confirmed this association between durability
and quality
Another finding of our interview with a representative from a European trade association
the definition of the durability should be broader than the expected lifespan It
should also integrate the possibility to repair the product Indeed the easier it is to
repair the product the longer the lifespan will be Furthermore the durability definition
should also better integrate the concrete usage of the product Indeed there may be
some gaps between the metrics of a legal definition and the concrete use by the
consumer This need to broaden the definition of durability was confirmed by the
interviewee from a renowned manufacturer of household appliances The definition of
durability should also encompass the notion of reparability as the latter extends the
lifetime of a product
Consumersrsquo awareness of durability
Overall all interviews showed consistently the fact that consumersrsquo lack of information
negatively impacts their awareness of durability
The representative from a European trade association highlighted that consumers are
not aware of the durability of products because they lack crucial information
123 Verbraucherzentrale Bundesverband 2017
124 Adler amp Hlavcek 1978
Behavioural Study on Consumersrsquo Engagement in the Circular Economy
115
However as mentioned in the literature review part legal requirements of EU regulations
could fill this gap by making the information about durability mandatory
Consumersrsquo expectations of durability
A representative from a Dutch public authority mentioned that more expensive products
have better durability in general Another circular economy expert interviewed for this
study stated that consumers expect a longer life span for more expensive pieces
of clothing for example suits and coats We have found that both literature reviews and
interviews conducted agree on this
Moreover according to a European consumer association representative gender and
age also play a key role in consumer expectations For instance older people
expect products to last longer
There are also differences visible among countries Two representatives from NGOs
highlighted that in former communist countries of Eastern Europe consumer
expectations regarding durability are higher because during the communist era
products were produced in a more durable way
According to an Austrian consumer association another important point to highlight is
that consumers have rather low expectations because of past problems A representative
from a European trade association who was mentioned in the two previous sections
confirmed this point It was underlined that past negative experiences impacted
consumersrsquo expectations
522 Consumersrsquo awareness understanding and expectations about
reparability
Consumersrsquo understanding of reparability
Similar to the literature review we could not gather information on what consumers
understand by reparability
Consumersrsquo awareness of reparability
A representative from a Hungarian NGO indicated that consumer associations are well
informed and that they understand product durability and reparability However
consumers do not understand those characteristics neither are they aware of them A
representative from a European trade association highlighted that this low degree of
awareness is consistent across all product categories
Consumersrsquo expectations about reparability
Some of our interviewees agreed with the fact that expectations about reparability
vary across products and have changed over time It used to be more common to
get items like televisions and vacuum cleaners repaired Nowadays most consumers
replace them because it is easier and faster and somewhat cheaper Clothes will only be
repaired if the item has sentimental value was very expensive or is a unique item
According to other interviewees when dealing with expensive household goods
consumers expect that they will not break down at all during the minimum
lifespan They also expect that small defects will be easily repairable Thus consumers
have higher expectations about the reparability of these products This statement was
confirmed by a representative of a well-known electric appliances manufacturer who also
added that these expectations were the same for products manufactured by reputable
brands
With regards to the use of independent or professional repair services representatives of
different national consumer associations and NGOs have pointed out the fact that for
cheaper products consumers prefer independent repairers while for more
expensive products consumers prefer official repair centres from the retailers
For the latter independent centres will only be used if they have certification from
manufacturers An interviewee from an important company producing electric appliances
stressed that in general consumersrsquo preferences go towards official repair centres or at
least repair points directly working with the manufacturer
Behavioural Study on Consumersrsquo Engagement in the Circular Economy
116
523 After-sales expectations
More information about after-sales expectations were retrieved from the interviews than
in the literature review
After-sales expectations about durability
A German academic stated that consumersrsquo expectations about durability decrease
after purchase At the time of the purchase consumers have high expectations about
product lifespan As time passes consumers are more willing to change that product for
a new one
After-sales expectations about reparability
According to a representative from a European consumer association consumersrsquo
after-sales expectations about reparability are low The main reason is that a lot of
consumers have negative experience in terms of support from the retailers For instance
according to the same stakeholder several retailers have refused to repairreplace
certain components that failed (eg batteries in cell phones) while the product was still
under guarantee
Moreover a representative from a Hungarian NGO mentioned that consumers tend to
often choose replacement and refund over repair When the guarantee period is still
effective replacement is the most frequent remedy chosen This also gives an indication
about the low level of expectations about reparability from consumers
Lastly an English NGO highlighted that after-sales expectations from consumers
also depends on the kind of additional guarantee they get with a product The
longer the guarantee is the higher the expectations consumers have about reparability
53 Evidence from the focus groups
531 Consumersrsquo awareness understanding and expectations about
durability
Across the different countries durability was considered to be an important aspect
Participantsrsquo main sources of information with regard to productsrsquo durability were
Questions asked to the sales staff
Product labels
Online costumer reviews
Price (more expensive products are sometimes considered to be more durable)
Productsrsquo appearance and materials used (eg for white goods and electronics
stability metal vs plastic etc)
Brand reputation
Previous experience with certain brands
Word-of-mouth and
Duration of the guarantee (the longer the guarantee the longer the expectation
regarding the productsrsquo lifetime)
As explained in more detail in section 421 many participants pointed out that
nowadays it is very difficult to estimate a productrsquos durability Criteria such as
brand reputation price and costumer reviews are not always seen as accurate indicators
There was a large variation with regard to participantsrsquo expectations on how long
products should actually last Views varied by product category but also according to
participantsrsquo personal opinions and experiences Some participants pointed out that
products made in the past were a lot more durable than those manufactured nowadays
rdquoI have a mixer made in the GDR And it still works So more than 27 years A
friend bought a new one and it broke down after 2 years Crazyrdquo (Woman mixed
group Berlin)
Participants generally had higher expectations with regard to the durability of white
goods (washing machines dishwashers vacuum cleaners) These types of products
were generally expected to last between five and ten years
Behavioural Study on Consumersrsquo Engagement in the Circular Economy
117
Views varied more when talking about the durability of other products For televisions
some estimated durability should be between two and five years while for others a
television should be made to last between 10 and 20 years For smartphones durability
was generally expected to be between three and five years Views also varied when
discussing the durability of clothing items Some estimated durability at three years
while for others clothing should last between five and fifteen years
Views on this topic also varied by type of participants In Germany participants from the
vulnerable group had higher expectations with regard to productsrsquo durability than those
from the ldquomixedrdquo group For white goods (dishwashers washing machines vacuum
cleaners) as well as televisions participants from the vulnerable group expected these
to last twice as long as those from the ldquomixedrdquo group
When talking about productsrsquo durability participants also showed a certain level of
distrust towards manufacturers Many suggested that products made nowadays are
deliberately not ldquobuilt to lastrdquo while products made years ago were designed to be more
resistant Some participants felt that this applied to most types of products (whether
electronics or clothing) and stated that regardless of price or brand products are
designed to last only for as long as their warranty is valid
ldquoWashing machine I would have always bought the biggest and top brands for
washing machines but I have discovered that they didnrsquot last as long as I was
counting on them to last If itrsquos cheap and it works and when itrsquos gone itrsquos gone I
bought one and spend out 550 euros on it and it didnrsquot last and then the
warranty was out after a year so the next one I got was 250 euro in [store name]
and it did last as long as the other onerdquo (Woman vulnerable group Dublin)
532 Consumersrsquo awareness understanding and expectations about
reparability
Experiences attitudes and awareness with regard to reparability varied by country by
participantsrsquo situation (ldquomixedrdquo vs vulnerable group) as well as by type of product
Participants in Sweden were generally less aware of the possibility of having products
repaired than those in other countries Participants in Sweden had little knowledge with
regard to how to go about having products repaired and how to find a repair centre
ldquoI would like to find the classic old man across the street repairing all sorts of
things and if I have used mine for fifteen years he can fix it and it works for
fifteen more yearsrdquo (Female 58 mixed group Stockholm)
In Germany and Ireland awareness was higher particularly among participants from the
vulnerable groups When having to repair products that were out of warranty
participants had a preference towards small independent local repair centres
In the Czech Republic participants mentioned looking up information online about where
they can have a product repaired that is out of warranty
For products that break down while still covered by the warranty participants usually
brought these back to the manufacturer or shop where they were purchased
Some participants were mainly willing to repair products that were more expensive such
as white goods (dishwashers and washing machines) as well as smartphones and
televisions They explained that having them repaired was more advantageous than
purchasing new ones
ldquoWashing machines because (they are) very expensive so we try to fix it before
we get another one Mine could be fixed it was positive but because it was old
and really good Our TV as well it was expensive so we fixed itrdquo (Woman
vulnerable group Dublin)
Others felt that it was easier to have smaller items repaired such as small electronics
(eg vacuum cleaner) or clothing items (shoes or coats)
When talking about productsrsquo reparability one of the things participants pointed out was
that todayrsquos technology was so complex that people can no longer envisage repairing
products themselves
Behavioural Study on Consumersrsquo Engagement in the Circular Economy
118
ldquoYou know nowadays it just is not possible anymore to repair something In the
past it was easy but now with all the technology it all got too complicated and
even the mechanics find it hardrdquo (Man 56 vulnerable group Berlin)
When talking about repairing products that are no longer under warranty participantsrsquo
expectations can be summarised as follows
The price of repairing is ldquosignificantly lowerrdquo than the price of purchasing a new
product
The availability of services (being able to easily find a repair centre)
Not having to wait for too long for a product to be repaired and
Being able to find spare parts
For products still under warranty people expect to be able to have these repaired for
free
533 Consumersrsquo awareness understanding and expectations about
recyclability
Awareness with regard to how to recycle products was highest in Ireland Germany and
Sweden Participants in these countries mentioned having already recycled products by
bringing them to shops or manufacturers waste collection centres or charity
associations
In the Czech Republic participants mentioned the financial benefits of recycling In this
country some of the participants were motivated by the financial reward they got from
selling products that they no longer used on eBay
Awareness with regard to productsrsquo recyclability was however low Participants knew
little about aspects such as whether or not products they purchase are made of recycled
materials which parts of the products can be recycled and more generally what
happens to products once they are brought in for recycling (whether or not these are
actually being recycled which components are recycled and for which purposes etc) The
fact of not having this type of information was sometimes felt as discouraging for
participants
ldquoRecycling here Recycling there What does that even mean I feel that term is
used far too much and one cannot trust it anymore In Germany we recycle the
waste and then it gets burned That is annoyingrdquo (Man 46 mixed group Berlin)
Participantsrsquo expectations with regard to recyclability can be summarised as follows
Having more information with regard to productsrsquo recyclability (how products are
recycled which parts are recycled whether products they purchase are made from
recycled materials) ndash more information on this can be found in section 633
Having more information with regard to how to recycle products (where to bring
these or who to contact)
Being able to recycle easily Some participants mentioned that recycling can be
complex and time-consuming particularly in the case of having to dispose of large
electronics which requires effort as well as having a car They felt that
manufacturers and shops should be the ones in charge of undertaking some of
these tasks making it easier for consumers
ldquoIt is very hard to recycle You need a car or ask someone for help Why canacutet the
producersretailers have this service So that I can leave it with themrdquo (Female 35
vulnerable group Stockholm)
54 Evidence from the consumer survey
541 General associations with durabilityreparability
The following section analyses consumersrsquo general associations with durability and
reparability
Table 30 shows that the participants mostly associated two properties with a lsquodurable
productrsquo namely 57 indicated that they associate the term with being able to use
the product for a long time while 56 reported that they associate the term with
products staying in perfect working order for a long time Around one out of four
Behavioural Study on Consumersrsquo Engagement in the Circular Economy
119
participants also stated that durable means that a user is able to use the product very
frequently or that the product will not break under severe stresses
Table 30 Properties most associated with a ldquodurablerdquo product (in )
Answer Percentage
Being able to use the product for a long time 567
The product will stay in perfect working order for a long time 564
The product will not break under severe stresses 276
Being able to use the product very frequently 256
Other 16
None of the above 06
Donrsquot know 11
Note Participants were asked (Q21) ldquoPlease select the two properties you most associate with a ldquodurablerdquo productrdquo Since participants indicated the two most appropriate reasons the totals do not sum up to 100 There were no correct or incorrect answers the question purely asked about respondentsrsquo associations N=12064
Source ConPolicy analysis of consumer survey data
There is a more heterogeneous pattern with respect to respondentsrsquo associations with
lsquorepairable productsrsquo Table 31 present the results
46 of the participants reported that they associated repairable products with spare
parts being available for the products followed by 44 that indicated that a repairable
product could be repaired by a repair firm 33 of the participants stated that they
associate reparability with the manufacturerretailer repairing the products if it
breaks For around one out of four participants reparability refers to the possibility to
repair a product by themselves The last two associations ie that all components of
the product (eg battery) are easily accessible to the end-user and instructions manuals
are available to help with repair received lower agreement from participants (18 and
7)
Behavioural Study on Consumersrsquo Engagement in the Circular Economy
120
Table 31 Properties most associated with a ldquorepairablerdquo product (in )
Answer Percentage
Spare parts are available for the product 462
I could have the product repaired by a repair firm 443
The manufacturerretailer will repair the product for me 327
I could repair the product myself 257
All components of the product (eg battery) are easily accessible to
the end-user
184
Instruction manuals are available to help with repair 70
Other 03
None of the above 04
Donrsquot know 16
Note The corresponding question (Q22) was ldquoPlease select the two properties you most associate with a ldquorepairablerdquo productrdquo Since participants indicated the two most appropriate reasons the totals do not sum up to 100 There were no correct or incorrect answers the question purely asked about respondentsrsquo associations N=12064
Source ConPolicy analysis of consumer survey data
As seen in Table 30 the top two associations with the term durable both include a time
dimension ie using and working for a long time Hence participants were asked to
indicate their expectations regarding how long a specific product would last
For vacuum cleaners the largest share of participants (27) indicated an expected
lifespan of 4 to 7 years followed by another 27 that indicated that they expected their
vacuum cleaner to last between 7 to 10 years For dishwashers 29 of the survey
participants indicated an expected lifespan of 7 to 10 years with another 29 that
indicated an expected lifespan of 10 to 15 years The expectations for televisions were
very similar The largest share of participants (31) indicated a lifespan expectation of 7
to 10 years and 28 indicated a lifespan expectation of 10 to 15 years For mobile
phones and clothing items expectations were lower In the case of mobile phones 38
of the participants indicated an expected lifespan of 2 to 4 years and another 35
indicated an expected lifespan of 4 to 7 years Lastly for clothing items the largest share
of participants (26) indicated an expected lifespan of 4 to 7 years while another 25
indicated their expectation to lie within the range of 2 to 4 years
Figure 38 displays differences for the individual product categories The individual values
for the different product types and answer categories can be found in the Annex
For vacuum cleaners the largest share of participants (27) indicated an expected
lifespan of 4 to 7 years followed by another 27 that indicated that they expect their
vacuum cleaner to last between 7 to 10 years For dishwashers 29 of the survey
participants indicated an expected lifespan of 7 to 10 years with another 29 that
indicated an expected lifespan of 10 to 15 years The expectations for televisions were
very similar The largest share of participants (31) indicated a lifespan expectation of 7
to 10 years and 28 indicated a lifespan expectation of 10 to 15 years For mobile
phones and clothing items expectations were lower In the case of mobile phones 38
of the participants indicated an expected lifespan of 2 to 4 years and another 35
indicated an expected lifespan of 4 to 7 years Lastly for clothing items the largest share
of participants (26) indicated an expected lifespan of 4 to years while another 25
indicated their expectation to lie within the range of 2 to 4 years
Behavioural Study on Consumersrsquo Engagement in the Circular Economy
121
Figure 38 Expectations on durability by product category (in )
Note The question was Q63 ldquoFor how long would you expect the following products to last on average under normal use conditions in terms of the number of years before they need to be replaced By lsquonormal use conditionsrsquo we mean normal frequency of use and taking into account usual maintenance servicing and small repairs of the product Donrsquot worry if you do not know exactly ndash please provide your best estimate for each productrdquo N=12064
Source ConPolicy analysis of consumer survey data
Furthermore the results from the consumer survey can be compared with existing data
on product lifetimes With respect to televisions the average lifecycle is 7 years125
When comparing this value to the results from the consumer survey it can be found that
27 of the participants had a lower expectation than the average lifecycle while the
majority of 70 indicated to have a higher expectation
Additionally there exists data on the average lifecycle of smartphones which is
estimated to be approximately 2 years126 When comparing this lifecyclelifetime with the
expectations of participants in the consumer survey it can be found that 7 indicated
their expectation to be lower than the average lifecycle time while the majority of 89
reported a higher expectation
Furthermore country differences were analysed with respect to lifespan expectations
Results for all product categories and the twelve countries are displayed in the Annex
Exemplary specific results for two product categories are described in the following
namely for mobile phones and dishwashers127
125 European Commission Joint Research Centre (2018)a Assessment of the reparability and upgradability of TVs (Draft) retrieved from httpsusprocjrceceuropaeuE4CdocsJRC_report_TV_repair_v2-2_CLEANpdf It has to be kept in mind that the reported data on the average lifecycle ie the replacement cycle does not refer to the actual technical lifetime of the product While the actual technical lifetime refers to products being replaced due to breakage or malfunctioning the replacement lifecycle also includes products that are replaced due to a preference for a newer version ie still functioning Hence the actual technical lifetime of televisions can differ from the reported average lifecycle replacement cycle
126 European Commission Joint Research Centre (2018)b Guide for the Assessment of Material Efficiency application to smartphones (Draft) retrieved from httpsusprocjrceceuropaeuE4CdocsJRC_report_smartph_v23_CLEANpdf Similarly to the data on televisions it has to be kept in mind that the data on average lifecycle includes both cases where a product is replaced due to breakage or malfunctioning (technical lifetime) as well as due to a preference for a newer version ie still functioning Hence the actual technical lifetime of smartphones can differ from the reported average lifecycle replacement cycle
127 The reason for selecting those two product categories are the following Mobile phones can be characterised by shorter innovation cycles and are considered to be an electronic gadget ie consumers replace their phone
1
1
1
1
2
2
2
1
6
6
11
5
5
38
25
27
18
20
35
26
27
29
31
10
15
21
29
28
4
11
5
7
7
1
4
2
3
3
1
5
3
7
3
3
6
0 10 20 30 40 50 60 70 80 90 100
VC
DW
TV
SM
CL
Less than 1 year More than 1 but less than 2 years More than 2 but less than 4 years
More than 4 but less than 7 years More than 7 but less than 10 years More than 10 but less than 15 years
More than 15 but less than 20 years More than 20 years Donrsquot know
Behavioural Study on Consumersrsquo Engagement in the Circular Economy
122
For mobile phones around 45 - 47 of the respondents in Romania Ireland Sweden
the Netherlands and Latvia indicated an expected lifespan between 2 and 4 years In
contrast 43 of German participants indicated a higher lifespan expectancy of 4 to 7
years
When looking at dishwashers further interesting country differences were found German
and Swedish participants had a rather strong expectation for their dishwasher to last
between 7 and 15 years (ie 65 and 69) In contrast 59 of the Irish 55 of the
French and 50 of the Romanian participants indicated a shorter expected lifespan
between 4 and 10 years Furthermore a comparatively large share of 29 among the
Latvian participants indicated not to know the expected lifespan128
542 Expectations regarding repair services
The following section considers consumer expectations regarding repair services Firstly
general expectations on repair are presented Secondly results of consumersrsquo
expectations regarding the ease of self-repair are shown followed by expectations on
ease of repair by a repair service Lastly consumersrsquo expectations about the likelihood
that they would be satisfied with a repair service are presented
Table 32 shows the participantsrsquo expectations regarding the repair possibilities of the five
product categories The most common answer across all five categories was that the
participants would expect to be able to have the product repaired for them eg by
the manufacturer a professional service provider or friends and family The percentage
of participants indicating this expectation ranged from 64 to 32
Also important was the answer that they both expect to be able to repair the
product themselves and have it repaired for them (ranging from 23 to 15)
followed by the expectancy to be able to repair the product themselves (ranging from
21 to 6) A smaller share of participants indicated that they expected neither of the
above (ranging from 18 to 6)
The following differences in expectations between the individual product categories can
be seen from the results
For mobile phones and televisions the majority (59 and 64) expected to be able
to have the product repaired for them compared to a smaller share of participants
expecting to both be able to repair the products themselves and have it repaired (17
and 15) Interestingly a larger fraction of participants indicated that they expect to not
have their product repaired at all (11 and 11) compared to being able to repair the
product by themselves (7 and 6)
Similar to mobile phones and televisions for vacuum cleaners and dishwashers the
majority of participants expected to be able to have the product repaired for them (50
and 56) Less participants expected to both be able to repair it themselves and have it
repaired (23 and 22) and to be able to repair the product themselves (16 and
13) The smallest share of participants indicated that they do not expect the product to
be repaired at all (8 and 6)
For clothing items ie coats and jackets a different picture emerges 32 of the
participants expected to be able to have their product repaired for them 23 expected
to both be able to repair their item themselves and have it repaired and 21 expected to
be able to repair it themselves With 18 the share of participants indicating to not
expect to have their product repaired at all is considerably higher in the clothing category
compared to the other categories
more frequently as newer models also contain improved technical features In contrast dishwashers are characterised by longer innovation cycles and not replaced because of trends
128 As mentioned before results on the other product categories are displayed in Section 7 the Annex document In general it was found that expectations regarding vacuum cleaners and television were between those of dishwashers and mobile phones With respect to clothing expectations regarding durability were on average also rather low but also country dependent
Behavioural Study on Consumersrsquo Engagement in the Circular Economy
123
Table 32 Expectations regarding repair services by product category (in )
Vacuum
Cleaner
Dishwas
her
Televisi
on
Mobile
Phone
Coat or
Jacket
I would expect to be able to
have this repaired for me
498 557 641 592 319
I would expect to be able to
repair this myself and have
it repaired for me
225 217 146 168 233
I would expect to be able to
repair this myself
159 125 63 73 213
None of the above 79 64 105 114 175
Donrsquot know 39 37 45 53 61
No of observations 4907 4463 4908 4914 4917
Note The question (Q61a) was as follows ldquoThinking about the following types of products do you expect that it would be possible for you to repair these products yourself or to have these products repaired for you (eg by a repair firm)rdquo
Source ConPolicy analysis of consumer survey data
Ease of self-repair
Participants that indicated that they expected to be able to repair a certain product by
themselves were then asked to rate the ease of self-repair ie how much time and effort
it would be for them Table 33 summarises the results for the different product
categories
The expected ease of self-repair varies substantially between categories For vacuum
cleaners (55) and coats or jackets (68) the majority of participants reported that
self-repair would be rather or very easy whereas for other products most
participants indicated that repairing their product themselves would be rather or very
difficult (65 for dishwashers 77 for televisions and 71 for mobile phones) The
proportion of participants who found self-repair very easy was largest in the clothing
category (9) The share of participants who found self-repair very difficult was largest
in the category of televisions (20) and mobile phones (18)
Table 33 Ease of self-repair by product category (in )
Vacuum
Cleaner
Dishwash
er
Televisio
n
Mobile
Phone
Coat or
Jacket
Very easy 34 21 11 28 89
Rather easy 511 331 222 263 590
Rather difficult 413 548 568 525 289
Very difficult 42 101 199 184 33
No of observations 1738 1386 929 1031 2141
Note Depending on participantsrsquo reply to the previous question they were asked (Q61b) ldquoYou said you would expect to be able to repair the following products yourself How difficult do you think this would be (ie how much time and effort for you) Please answer on a scale from 1 (ldquoVery easyrdquo) to 4 (ldquoVery difficultrdquo)rdquo
Source ConPolicy analysis of consumer survey data
Behavioural Study on Consumersrsquo Engagement in the Circular Economy
124
Ease of repair service
Table 34 shows the results of a question that asked participants to rate the ease with
which they could have a product repaired by a repair service The rating referred to the
personal costs ie time and effort for the participants themselves
Across all product categories the majority of participants expected it to be rather or
very easy to have a product repaired for them (69 to 51) Having a product repaired
was perceived to be easiest for coats or jackets (69) followed by mobile phones
(60) vacuum cleaners (57) televisions (53) and dishwashers (51)
Table 34 Ease of repair service by product category (in )
Vacuum
Cleaner
Dishwash
er
Televisio
n
Mobile
Phone
Coat or
Jacket
Very easy 53 57 55 80 106
Rather easy 518 457 477 515 588
Rather difficult 377 387 356 313 261
Very difficult 52 99 112 93 45
No of observations 2558 2619 3255 3075 1735
Note If participants indicated that they would expect to be able to have a product repaired they were asked the following question (Q61c) ldquoYou said you would expect to be able to have the following products repaired for you How difficult do you think this would be (ie how much time and effort for you) Please answer on a scale from 1 (ldquoVery easyrdquo) to 4 (ldquoVery difficultrdquo)rdquo
Source ConPolicy analysis of consumer survey data
Expectations regarding the satisfaction with repair services
As a next step participants were asked to indicate their expectations regarding how
satisfied they think they would be if they used a repair service Table 35 presents the
results
Overall expectations were positive With respect to convenience 85 indicated that
they expect a repair service to be at least fairly good including 21 indicating expecting
a very good performance Similarly expectations on the speed of repair were high
with 82 reporting they would expect at least a fairly good service in this respect
(including 25 expecting a very good service) Consumer friendliness was expected to
be at least fairly good by 89 of participants including 31 who expected a very good
service in this regard
Expectations with respect to the quality of repair were even higher A total of 92 of
the participants stated that they expected at least a fairly good quality of repair with a
high share of 42 even stating that they expected the quality of repair to be very good
Behavioural Study on Consumersrsquo Engagement in the Circular Economy
125
Table 35 Expectations regarding the satisfaction with repair services (in )
Very Poor Fairly Poor Fairly Good Very Good
Convenience 14 139 640 207
Speed of repair 14 163 576 247
Consumer friendliness 06 103 586 305
Quality of the repair 07 74 497 422
Note The question (Q62d) was ldquoSupposing you wished to have a product repaired by a repair service how good do you expect such a service would be in terms of the following factors Please answer on a scale from 1 (ldquoVery poorrdquo) to 4 (ldquoVery goodrdquo)rdquo N=4733
Source ConPolicy analysis of consumer survey data
543 After-sales expectations
The following section addresses consumersrsquo after-sales expectations The survey
questions regarded consumersrsquo expectations in general and were not linked to specific
past experiences with products they owned Survey participants were asked to indicate
what they would expect to happen in case a product became faulty
The question scenario varied the product in question as well as the productrsquos age when it
became faulty in the following way
Suppose you purchased a new [INSERT dishwasher vacuum cleaner television
smartphone coat] and it developed a fault that made it unusable after
[INSERT period] Which of the following remedies would you expect to be
available to you if any Please select all that apply
The periods were varied to capture whether expectations vary depending on whether
products have been shortly or for a long time been beyond the legal guarantee of 2
years
Vacuum cleaners 2 or 4 years
Dishwasher 4 or 6 years
Television 4 or 5 years
Smartphone 12 or 24 months
Coat 2 or 5 years
Results are presented in the table below
While 32 would expect their broken product to be repaired for free 34 said that they
would have to pay for the repair One quarter stated that they would be entitled to a free
replacement while 24 indicated they would have to purchase a replacement on own
expense Moreover 11 said that they would be entitled to a refund
Behavioural Study on Consumersrsquo Engagement in the Circular Economy
126
Table 36 After-sales expectations for faulty products (in )
Answer Category Percentage agreement
over all variants
I would need to pay to have the product repaired 340
I would be entitled have the product repaired for free 323
I would be entitled to a free replacement 245
I would need to purchase a replacement 237
I would be entitled to a refund 106
Other 13
Donrsquot know 68
Note The question (Q81) was ldquoSuppose you purchased a new dishwasher a new vacuum cleaner a new television a new smartphone a new coat and it developed a fault that made it unusable after [period] Which of the following remedies would you expect to be available to you if any Please select all that applyrdquo Overall the following ten variants were used 1 vacuum cleaner2 years 2 vacuum cleaner4 years 3 dishwasher4 years 4 dishwasher6 years 5 television4 years 6 television5 years 7 smartphone12 months 8 smartphone24 months 9 coat2 years 10 coat5 years Results are aggregated for the ten variants N=12064
Source ConPolicy analysis of consumer survey data
Interestingly the experimental conditions of the behavioural experiment had some
knock-on effects on responses to this survey question Respondents who were shown
manufacturer warranties or durability promises as part of an EU label were
significantly more likely to expect free replacement or free repairs of faulty
products Instead those who had not seen any information on CE product
characteristics or only information on the reparability of a product were significantly less
likely to expect free rectification of the fault in any way and instead more likely to expect
needing to pay for either repair or replacement
Subsequently consumersrsquo after-sales expectations regarding entitlement to a repair free
of charge were explored in more detail Participants were asked to indicate whether they
expected repair free of charge for different scenarios
Overall 41 of the participants expect repair free of charge in case the product breaks if
they purchased an extended commercial guarantee or insurance from the retailer
Free repair in case of defects are also expected by 32 of the respondents if the retailer
claimed that the product should last at least 10 years In case the product carried
an EU label indicating that it has a high durability rating 22 of the participants
indicated that they expected a repair free of charge One fifth stated this expectation in a
scenario where the fault developed during everyday use of the product
Respondents were less likely to expect free repair in other scenarios such as the product
carrying an EU label indicating that it is repairable the retailer claiming that ldquoThis
product can be easily repairedrdquo purchasing the product directly from the manufacturer or
a large retail chain the product being more expensive than other products of the same
type and purchasing the product from a small independent retailer
Behavioural Study on Consumersrsquo Engagement in the Circular Economy
127
Table 37 After-sales expectations regarding entitlement to a repair free of charge (in )
Answer Category Percentage Agreement
over all variants
I purchased an extended commercial guarantee or
insurance from the retailer
408
The retailer claimed that ldquoThis product should last at least
10 yearsrdquo
316
The product carried an EU label indicating that it has a high
durability rating
220
The fault developed during everyday use of the product 201
The product carried an EU label indicating that it is
repairable
144
The retailer claimed that ldquoThis product can be easily
repairedrdquo
104
I had purchased the product directly from the
manufacturer
103
I had purchased the product from a large retail chain 96
The product was more expensive than other products of
the same type
90
I had purchased the product from a small independent
retailer
57
None of the above 100
Donrsquot know 100
Note The question was (Q82 following on from the question presented in Table 36 ldquoAnd in this scenario where your new dishwasher your new vacuum cleaner your new television your new smartphone your new coat developed a fault after [period] would you expect repair free of charge in the following circumstancesrdquo N=12064
Source ConPolicy analysis of consumer survey data
Behavioural Study on Consumersrsquo Engagement in the Circular Economy
128
6 Durability and reparability information and its potential role
in consumersrsquo decision-making
Previous chapters have reported repeatedly that consumers seem to lack information
about the durability and reparability when purchasing products This chapter therefore
dives deeper into the effects of providing such information and how it could be delivered
most effectively
Key findings
As reported before (see especially sections 3 and 4) consumers value Circular
Economy product credentials The literature and stakeholders support the views that
providing information about product durability and reparability would encourage
consumers to purchase products with higher Circular Economy credentials At the
same time price remains of key importance
Consequently according to the literature stakeholder views and the consumer survey
durability was more important for large and expensive products (including expensive
clothing) and less so for fashion items
In fact in the consumer survey clothing was often an outlier category in the
sense that respondents most often ranked durability and reparability as not
important for this product category The reasons behind this finding seemed to
relate to the fact that respondents would not expect to use clothing items for a long
time and that they would not expect to repair clothes if they broke
In terms of other socio-demographic differences survey respondents from Romania
and Hungary attributed a higher relevance to durability and reparability in the
purchasing process Respondents from the Netherlands Germany Austria and
France on the other hand indicated lower rates for durability and reparability
relevance
Previous studies (including experimental evidence) focus group discussants and
stakeholder views pointed out that labels and brand reputation could carry
effective durability information More specifically presenting lifetime information
through the number of usage years was slightly more efficient than showing the
number of usage units (eg per wash) Following the findings from the literature
review for white goods brand name was very important while consumers would
highly value an indicator on durability for clothes
The consumer survey supported these findings but revealed also that the most
important self-declared factors influencing purchasing decisions were
quality price and how long products would last
A majority of survey respondents attached high importance to product durability
Among these respondents the top reason was that durable products would save
them money in the long run Yet difficulty of knowing how long a product would
last could be seen as a main barrier for giving durability high importance This was
found among survey respondents who did not rate product durability as important
Across all strands of research reparability was relatively less important for
purchasing decisions compared to durability
A previous experimental study found that presenting information about the
availability of spare parts was more influential on consumersrsquo decisions than
cost-related information The interviewed stakeholders stated that most
consumers looked for the availability of repair points
Guarantees were also considered as a potential source of information on reparability
Moreover as for durability brand names seem to be important as well Consumers
seem to take brand reputation as a promise to repair according to stakeholders
Focus group discussants found different types of reparability information useful such
as how difficult it would be to repair a product and how much time would be
required to repair
In the survey the possibility to save money with easily repairable products seemed to
motivate individuals to engage with reparability The desire to keep products for a
long time had the same effect Reparability was often not given high importance in
purchasing decisions because respondents trusted manufacturersrsquo warranties or
would not expect a product to break Finally feelings that repair would be expensive
also let reparability rank low in importance
Behavioural Study on Consumersrsquo Engagement in the Circular Economy
129
All strands of research suggest that durability and reparability information
would be best provided at the point of sale
Survey respondents mostly expected to receive information via product
descriptions or by virtue of including durability information in guarantees or
warranties129
Labels were generally found to be effective at providing CE product information
Indeed focus group participants reacted positively to the possibility of having
information provided on labels such as an augmented EU Energy Label
These views are supported by strong evidence from the behavioural experiment In
the behavioural experiment durability information was best provided via
manufacturer warranties or as an expected lifetime Showing durability
information via EU labels such as for example an augmented Energy or Ecolabel
was similarly effective
The effect sizes in the experiment were large When respectively durability or
reparability information was provided in the experiment consumers were almost
three times more likely to choose products with the highest durability on
offer and more than two times more likely to choose products with the
highest reparability ratings These shifts resulted from consumers turning away
from low durabilityreparability products in favour of those with better CE credentials
As usual with experimental findings these effects need to be seen in conjunction with
the experimental setup which consisted of a simplified purchasing process with
streamlined and standardised product information compared to real-world shopping
experiences It is thus possible that the effectiveness of durabilityreparability in
reality might be increased or dampened
General CE preferences were strongest when durability and reparability
information was presented together That is when durability and reparability
information was shown together individuals were most likely to purchase products
which rated high in both dimensions ndash durability and reparability Durability was
clearly the more influential factor of these preferences In the experiment durability
information provoked the strongest shifts in preferences while reparability only
marginally led participants to choose products with overall better CE credentials
These trends in purchasing decisions were confirmed also by analyses of willingness
to pay for durability and reparability Showing information on these CE
characteristics on product descriptions at the point of sale resulted in meaningful
willingness to pay Depending on how durabilityreparability information was
presented willingness-to-pay for an additional year of durability ranged
between euro20-36 for vacuum cleaners and dishwashers euro92-148 for TVs euro148-217
for smartphones and euro14-27 for coats Willingness-to-pay for an improved
reparability rating was around euro29-54 for vacuum cleaners euro83-105 for
dishwashers euro77-171 for TVs euro48-98 for smartphones and euro10-30 for coats130
Showing expected lifetimes or manufacturer warranties produced highest
willingness to pay closely followed by the information provided on EU labels via
icons As before the differences between the effectiveness of the EU label and
manufacturer-provided information were small and it is likely that the effectiveness of
the EU label would increase over time as the icons used to indicate
durabilityreparability become better known among consumers Further consumer
testing of different icons could be further explored
Lastly behaviourally informed lsquonudgesrsquo in the form of claims popping up on
respondentsrsquo screens prior to making purchasing decisions significantly increased
respondentsrsquo preferences for more durable products Two claims were tested i)
telling people that they could save money by purchasing products which last longer
129 This study did not address whether consumersrsquo attitudes were different for situations in which products were still covered by the 2 year legal guarantee covering all goods sold in the EU or covered by additional (extended or commercial) warranties See Glossary at the end of the report for definitions of (legal) guarantees and warranties
130 The willingness-to-pay was measured per year for durability and per two-step increase on the A-G scale for reparability See Section 272 and Section 8 in the Annex document for a detailed methodology
Behavioural Study on Consumersrsquo Engagement in the Circular Economy
130
and which are easy to repair ii) telling people that a majority of people chose
products which last longer and which are easy to repair Both claims were similarly
effective
61 Evidence from the literature and data collection
611 Relevance of durability characteristics in purchasing decisions
The perception of the durability of goods may vary from one consumer to another as was
seen in section 5 From literature dealing with durability considerations during the
purchasing process it seems that most consumers relate durability to longer
timespans without a fault (ie time until it breaks and not time until it cannot be
repaired anymore)
Overall the reviewed literature has provided little concrete quantitative data on how
much consumersrsquo value durability when purchasing a good However according to a
WRAP study carried out in 2013 consumers consider product lifetimes to be important
when they acquire a new good131 In 2016 a study was commissioned by the European
Economic and Social Committee aiming to analyse whether lifespan labelling on products
might influence consumers purchasing decisions This study also provides information on
the importance for consumers of a longer lifetime Indeed out of 2917 respondents
90 stated that they would be willing to pay an additional euro102 for a similar product
with a two year longer lifespan132 This point was confirmed by a study from the
European Commission (2017) more than eight out of 10 consumers would be willing to
pay extra for products that are advertised to last longer Therefore the future uptake of
longer life products can be maximised if these are accompanied by longer commercial
guarantee or warranties
For instance the above-mentioned WRAP (2013) study reports that older consumers and
lower income groups as well as consumers with a less consumption-driven mind-set
appear to place particular importance on product lifetimes during the purchasing process
regardless of the products (goods tested in the study were washing machines fridges
vacuum cleaners) An empirical study conducted on 1009 Austrian on behalf of the
Chamber of Labour in Vienna confirms that older people use products longer than
younger consumers133 No detailed figures were provided and the qualitative analysis
carried out by the project does not answer whether it is more a matter of age or
generation In addition this result may be driven by a number of factors such as
household income and educational level
Consideration of durability characteristics per specific products
Based on the literature review the importance of durability in consumer purchasing
decisions varies depending on the product category
According to Cox et al (2013) it seems that overall consumers attach less importance
to the lifetimes of products that are governed by fashion However even for clothes
traditionally the most fashion-influenced product consumers tend to attach importance
to durability to some extent
A WRAP (2012) study on the use and disposal of clothes in the UK provides an overview
of durability considerations in the clothing industry The report was based on a
survey with 7950 UK consumers It appears that when buying clothes consumers rank
value for money as their top purchase criterion Extending the lifetime of clothing is also
something that consumers want According to the survey consumers said that one of the
top criteria they use when buying clothes is finding items that are lsquomade to last and look
good for longerrsquo Different factors account for consumersrsquo decision to purchase more
durable clothes higher income associating particular brands with longer-lasting
131 WRAP 2013
132 European Economic and Social Committee 2016
133 AK Wien 2017
Behavioural Study on Consumersrsquo Engagement in the Circular Economy
131
products a lengthy guarantee against faults or a ldquodurability indexrdquo on the garment
label134
Another study provided information about the importance of durability in
purchasing decisions for electronic items A technical report by the Joint Research
Centre of the European Commission dated from 2017 revealed the importance of
durability during the purchase of electrical or electronic appliances135 This report
presents the outcomes of a survey with 1050 German consumers136 Respondents were
asked to rank the importance of a number of factors (including energy efficiency
durability price etc) in their last purchase or next planned purchase
The results are provided in Figure 39 Although the most important criteria for consumers
when choosing electrical or electronic appliances are the electricity consumption and
energy efficiency (49) durability is ranked second (43) before the price-
performance ratio (36)
Figure 39 Consumers consideration when purchasing electrical and electronic appliances
Source Verbraucherzentrale Bundesverband 2014
However consumersrsquo durability considerations when purchasing new electronic
appliances might differ depending on the type of electronic appliance According to a
WRAP survey with 1104 UK respondents some participants indicated that they might
give greater thought to product lifetimes when buying goods depending on how likely
they thought the product was to break down To illustrate washing machines vacuum
cleaners and laptops were thought to be more likely to break down than televisions and
fridges
612 Information on durability and its role in the purchasing decision
This section analyses in which way the type and quality of information on durability can
influence purchasing decisions
At the moment of purchase consumers do not feel knowledgeable enough
about how long their products will last Some of them also have doubts about
134 Although each factor was cited by around one-third of respondents they were not ranked in terms of preference by the UK respondents
135 European Commission Joint Research Centre 2017b
136 Verbraucherzentrale Bundesverband 2014
Behavioural Study on Consumersrsquo Engagement in the Circular Economy
132
whether the lifetime of products can be accurately measured137 Consumers use a
combination of general knowledge and proxies138 to make assessments about lifetimes of
comparable products139 Different factors are used by consumers to estimate product
durability including design technological change the cost of repair the availability of
spare parts household affluence aesthetics functional quality and fashion
Recent research has also found that in absence of reliable information on durability
consumers use intrinsic and extrinsic cues to judge the lifespan of products For
consumers expectations of lifespans can be subjective and influenced by brand name
perceived quality past experience age and income of the consumer as well as their
current needs140 Cox et al (2013) confirm this statement when the lifetime of products
is not included on the product label it is inferred by consumers through other indicators
such as the perceived reliability based on the general knowledge of consumers
Overall the studies reviewed agree on the fact that providing consumers with
information on a productrsquos lifespan would have a positive impact on their decision to
purchase more durable goods141 According to R Tansey with more information
consumers would make more rational decisions while also considering social and
environmental impact in their purchases which would in the end redirect demand to
more environmentally or socially respectful products142 The consumer market study
carried out in 2017 by GFK to support the European Commission Fitness Check of
Consumer and Marketing Law provides details about the effectiveness of information on
durability143 An experiment was realised to test whether consumers take durability and
reparability information into consideration when they purchase goods A sample of 7234
consumers coming from eight European countries had to choose between different
washing machines televisions and smartphones with different degrees of information
about durability and reparability provided One of the main outcomes of this study is the
positive impact of the presence of durability information on consumersrsquo
purchasing decisions When no information was provided the items in question were
selected by 27 of the respondents while 47 of the respondents chose the same
products when such information was present144 As shown in Figure 40 when durability
information is present respondents are on average willing to pay 5 (EUR 16) more
relative to the baseline for products with high durability In a Eurobarometer survey
from December 2012 92 out of the 25568 respondents across the EU27 indicated that
the lifespan of products should be indicated (92)145
To date there are no requirements at European level for manufacturers to inform
consumers about for example the averageexpectedminimal lifetime of goods except
the Ecodesign set of regulations on light bulbs In practice this kind of information about
the durability of goods is rarely present146
137 European Commission 2017
138 As defined by the authors general knowledge refers to the participants experience in using those products or to the experience of their relatives The proxies used by the consumers are brands prices or guarantees
139 Cox Herren King amp Knight 2013 European Commission 2017
140 Braithwaite Densley-Tingley amp Moreno 2015 pp 11-17
141 See for instance Tansey R 2015 ldquoReduccioacuten de residuos el reciclaje no es suficiente para alcanzar una economiacutea circularrdquo European Commission 2017 ldquoConsumer market study to support the fitness check of Consumer Rulesrdquo European Economic and Social Committee 2016 ldquoThe influence of lifespan labelling on consumerrdquo
142 Tansey 2015
143 European Commission 2017
144 European Commission 2017 p 429
145 European Commission 2017 p 416
146 European Commission 2017
Behavioural Study on Consumersrsquo Engagement in the Circular Economy
133
Figure 40 Impact of durability information on the consumersrsquo purchasing decision
Source (European Commission 2017 Consumer Market Study to support the Fitness Check of Consumer Rulesrsquo p 437)
How durability information is provided
People use a range of online andor in-store information sources during the purchasing
process147 Consumers believe that the main source of information they can access
during the decision-making process to compare the expected lifetime of different
products is to be found on online reviews from other consumers148
The presentation of durability information through labels would allow more
informed purchasing decisions from consumers The study commissioned by the
European Economic and Social Committee (EESC) in 2016 mentioned in section 611
revealed that on average a product is chosen 46 more often when lifespan is
indicated on the product label149 In a report from 2015 about the influence of energy
labels for washing machines Braithwaite et al (2015) confirmed the importance of
durability information on the product label for consumers According to this study a
specific lifespan label would increase the consumption of more durable products even
more
The Consumer Market Study realised by GFK found that presenting durability-related
information in terms of years has a slightly more powerful impact (485) than
in units (461)150In this instance units were presented as specific usage units For
example the number of wash cycles for a washing machine
Manufacturer guarantees or warranties act as another source of information for
consumers in their purchasing decisions According to a study carried out by Cox
Herren King amp Knight (2013) they are perceived as a show of faith by manufacturers in
the lifespan of their products The provision of longer warranties can prompt consumersrsquo
purchases towards products with longer lifetimes Indeed as evidenced in the same
study consumers value highly the reassurance provided by longer guarantees or
warranties and are even willing to pay a higher price when warrantees or guarantees are
147 Cox Herren King amp Knight 2013
148 Cox Herren King amp Knight 2013
149 European Economic and Social Committee 2016
150 European Commission 2017 p 437
Behavioural Study on Consumersrsquo Engagement in the Circular Economy
134
provided151 They tend to believe that products covered will be quickly repaired or
replaced if they break down Therefore the future uptake of longer life products can be
maximised if these are accompanied by longer warranties
The role of the durability information per specific product
The importance of durability-related information as well as the way it should be provided
when consumers purchase goods varies across product categories
For example preliminary findings of a study being conducted by a German consumer
association illustrate that for 81 of consumers durability information of electrical
equipment is (rather) important152
With regards to white goods the brand name is very important Often the implicit
assumption is that traditional white goodsrsquo manufacturers produce longer-lasting
products accompanied with consumer-oriented repair services Consumers tend to buy
white goods from traditional and popular brands so they have access to good repair
services153 As consumer expectations about lifetimes are often implicit providing a clear
indication of durability through a labelling system would substantiate those expectations
According to Braithwaite et al (2015) for washing machines labels presenting the
lifespan in terms of expected years of life have a bigger impact on consumersrsquo purchasing
decisions than the ones presenting lifespan in terms of units
When purchasing clothes consumers look for information about durability and
quality Indeed one-third of customers covered by the WRAP (2012) survey mentioned
in section 611 would value a durability indicator of some sort during the purchase
process WRAP (2017) has also developed a sustainable clothing guide aiming partly to
provide information on how to make clothes last longer According to WRAP given a little
direction consumers would be able to gauge the quality and potential durability of
garments before they buy them Information could include advice on evaluating seams
looking for loose threads and broken stitches and making consumers aware of the fact
that a higher density of stitches per inch is generally better Simply improving care
information on labels and packaging at the point of purchase would promote more
durable behaviour Moreover consumers attach less importance to the lifetime of
products that are subject to fashion154
613 Relevance of reparability characteristics in purchasing decisions
Section 3 has provided factual information about the growing consumer willingness to
engage with repair services In comparison with the durability characteristics the
literature review has found little information about the importance of reparability in
consumersrsquo purchasing decisions
614 Information on reparability and its role in the purchasing decision
This section offers an analysis on the way available information on reparability can
influence purchasing decisions
Preliminary findings of a study being conducted by a German consumer association
illustrate that for 82 of consumers information about the reparability of products is
(rather) important155
The main information retrieved about the role of reparability information on consumersrsquo
purchasing decisions comes from the Consumer Market Study (2017) undertaken by
GFK According to the experiment mentioned in section 612 on Information on
durability and its role in the purchasing decision it appears that providing information
151 European Commission 2017
152 Verbraucherzentrale Bundesverband 2017 p 6
153 Vangerow 2017
154 Cox Herren King amp Knight 2013
155 Verbraucherzentrale Bundesverband 2017 p 6
Behavioural Study on Consumersrsquo Engagement in the Circular Economy
135
on reparability (on the costavailability of spare parts) has a positive effect on
consumersrsquo purchasing decisions On average when reparability information was
present on the products tested (televisions washing machines and smartphones) those
products were selected by 43 of the consumers regardless of the type of reparability
information In comparison when there was no information provided on reparability the
same products were chosen by only 30 of the respondents
How reparability information is provided
Important findings about the most influential ways to present reparability-related
information were retrieved from the European Commission Consumer Market Study
(2017) mentioned above Information about reparability was framed in two different
ways a first option provided an indication of the cost of spare parts and the second
of the availability of those spare parts
Information presented in terms of the availability of spare parts was more
efficient than the financial information Indeed 7234 respondents were on average
willing to pay an extra euro14 for products with a longer availability of spare parts while
they were on average willing to pay euro7 less for products where the costs of repair were
indicated This variation of willingness can be explained by the fact that cost is the main
variable taken into account by consumers during their purchasing decisions Thus the
indication of the costs of repair is considered by the consumers as potential additional
costs
Figure 41 Role of reparability-related information on the consumersrsquo purchasing decision
Source European Commission 2017 p 437
Information about reparability does not affect all consumers in the same way The impact
of reparability information among consumers with a pro-environmental position was
greater than for consumers who are better financially positioned The effect of
reparability information also differs according to the consumerrsquos nationality Overall all
eight countries studied reported a positive impact for the presence of reparability
information However the effect of reparability information was greater in Portugal and
the Netherlands while the weakest impact was found in France and Poland No
explanatory factors for this variation were provided by this study
As seen in section 612 on Information on durability and its role in the purchasing
decision labels have a key role in informing consumers about the durability
characteristics of products No similar influence of labels for reparability characteristics
was indicated in the literature However an indicator rating the reparability
potential of an item can play a key role in consumersrsquo purchasing decision The
iFixit index is an example of such an indicator The reparability index ranks electronic
devices by ease of repair A reparability score between zero and 10 is calculated for each
new model of tablet laptop and smartphone of the main brands on the market A device
with a perfect score will be relatively inexpensive to repair and easy to disassemble The
difficulty of opening the device the types of fasteners found inside and the complexity
involved in replacing major components are also considered This makes this indicator
useful for policymakers product designers and users looking to buy devices with a
better reparability potential (European Environment Agency 2017)
Behavioural Study on Consumersrsquo Engagement in the Circular Economy
136
Role of the reparability information per specific product
Information about reparability could play a key role in consumersrsquo decision to
purchase clothes According to the WRAP study dated from 2012 mentioned in section
611 a quarter of the UK respondents would wear unworn clothes if they had the ability
to repair them The WRAP study further indicates that businesses could play a key role
by raising consumer awareness about how and where to use repair services
The European Commission Consumer Market Study completed by GFK in 2017 indicates
that the positive impact of reparability information on consumersrsquo purchasing decision
was slightly weaker for smartphones than for TVs and washing machines We
have not found explanatory factors for such phenomenon in the literature review
However the focus groups suggested that some consumers may not prioritise
reparability for smartphones because technological progress (ie software updates)
would make their smartphones obsolete and they may wish to purchase newer models
(see section 33)
According to a study conducted by Cox Herren King amp Knight (2013) for WRAP if
products were more durable reparability would become less important as a
consideration In the case of household appliances (in this study fridges washing
machines vacuum cleaners) the importance of lifetime is underpinned by a desire to
avoid the expense and inconvenience of repair or replacement if they break down
62 Evidence from the stakeholder interviews
621 Relevance of durability characteristics in purchasing decision
Overall interviewees indicated that durability characteristics matter for consumersrsquo
purchases but that it is not the main factor of decision-making
According to a representative of a European consumer association the first factor for
consumers when deciding to buy a new product is the quality As part of this quality
assessment durability is the principal component followed by the cost factor and usually
an association between quality and durability can be found According to a Romanian
academic quality represents the extent to which a product can satisfy consumer needs
so durability is part of quality as a factor
However the interviewed Romanian academic is the only one ranking durability and
quality as the first criteria of consumersrsquo purchasing decision Other interviewees either
mentioned the quality aspect in its relation to the price of the product or indicated that
the price is the main consideration in consumersrsquo purchasing decisions
According to a representative from a Spanish consumer organisation the most important
criterion when purchasing a new product is the ratio between quality and price Usually
consumers tend to consider that the higher is the price the longer the lifespan will be as
underlined by a representative of a UK NGO
The consideration for durability in purchasing decisions varies by age and
income Overall people with a higher income are more aware of CE practices and so pay
greater attention to durability In comparison findings from the reviewed literature
indicated that consumers with a lower income pay less attention to durability (see section
611)
In general the older the consumer is the more important durability is Young people
tend to buy less durable products However as highlighted by the Romanian academic
there is also a category of young people who are aware of the durability of products This
is comprised of young people working in corporations and who have higher income and
greater concerns regarding the Circular Economy Interviewees confirmed the findings of
the reviewed literature ndash young consumers tend to place less importance on durability
than older consumers (see section 611)
Consideration of durability characteristics in purchasing decisions per specific product
Consideration of durability in purchasing decisions varies depending on the product
category
Behavioural Study on Consumersrsquo Engagement in the Circular Economy
137
For large purchases such as large appliances and cars durability and
reparability characteristics are considered more in purchasing decisions
According to a representative of a Dutch public authority the smaller the purchase the
less important durability and reparability become
A Belgian national trade association representative indicated that the durability
consideration from consumers varies according to the expected use of the
product Consumers will consider the durability of goods depending on how often they
will use the product as highlighted by representatives from a European trade association
and a national consumer association If the product will be used less often consumers
may buy products of a lesser quality and so less durable products
Regarding smartphones consumers pay less attention to durability The first factor
explaining this is linked to technological progress According to the already mentioned
representative of a Belgian national trade association if new functionalities appear
consumers will be interested in the newest smartphones with these latest functionalities
A parallel can be drawn with the findings from the literature review which states that
consumers attach less importance to durability when purchasing products more related to
fashion The second factor deals with obsolescence As highlighted by an expert in the
field of Ecodesign smartphones may be victims of what could be labelled as technical
obsolescence because of software updates as products become slower and impossible to
maintain
622 Information on reparability and its role in purchasing decision
The following section analyses the way available information on durability influences
purchasing decisions
An interviewee from a Romanian consumer organisation highlighted that overall
consumers lack the information needed to assess durability and reparability of a
product They have to find that information by themselves The main sources for this
are formed by shops online forums or friends as mentioned by an interviewee from a
Romanian consumer association This tends to confirm the lack of information for
consumers identified from the literature
Moreover an interviewee from a European consumers association mentioned that
consumers would prefer to find this information in a standardised way In that
sense a label indicating the average lifespan would be welcomed This confirms findings
from the literature review which stated that a standardised lifespan label would be a key
tool to inform consumers about durability (see section 612)
Other sources of information for consumers were mentioned by interviewees from
a Romanian consumer organisation For washing machines and televisions the durability
characteristics of an item are highly related to the brand This was confirmed by an
interviewee from a household appliances manufacturer the reputation of a renowned
brand acts as a guarantee of a greater quality and so of a longer expected lifetime for the
product Another common measure of expected durability used by consumers is often
expressed in the guarantee period offered by the manufacturer as highlighted by a
representative of a UK trade association
623 Relevance of reparability characteristics in purchasing decision
Overall interviewees provided more information about durability characteristics than
about reparability characteristics
It appears that reparability is not a major consideration for consumers
According to a representative from a UK consumer organisation reparability is not taken
into account by consumers Another interviewee from a European trade association
confirmed this statement Consumers do not consider reparability when purchasing a new
product because in their mind-set products should be more durable but not necessarily
more repairable as highlighted by a representative from a Belgian trade association
This lack of information coming from interviews echoes the little information gathered
from the literature review
Behavioural Study on Consumersrsquo Engagement in the Circular Economy
138
Consideration of reparability characteristics in purchasing decision per specific products
According to a representative of a Dutch public authority for large purchases such as
large appliances (eg washing machines refrigerators and cars) reparability
definitely plays a role This input was confirmed by a consumer law expert from a
Romanian consumer organisation For washing machines reparability characteristics are
important
When purchasing clothes consumers pay less attention to the durability and reparability
characteristics However reparability is more important than durability in the
fashion sector as highlighted by the above-mentioned representative of a Dutch public
authority This greater consideration for reparability in clothes purchases confirms
findings from the literature review
624 Information on reparability and its role in the purchasing decision
This section describes the findings from the interviews on how available information on
reparability can influence purchasing decisions
It seems again that consumers suffered from a lack of information to motivate
their purchasing decisions According to an interviewee from a German public
authority with no durability and reparability information consumers always choose the
cheapest product
During an interview with a representative from a UK consumer organisation it was
stressed that retailers and manufacturers do not provide and sometimes may even hide
the available information about reparability The interviewee did not mention how or why
manufacturers might hide reparability information
According to a representative of a Hungarian NGO when consumers need information on
the degree of reparability of a product they look for it in the guarantee letter This
interviewee also indicated that the information that consumers look mostly is the
availability of repair points This partly mirrors the findings of the Consumer Market
Study conducted by GFK These state that the most impactful reparability-related
information on consumersrsquo purchasing decisions are about the availability of spare parts
rather than the information on costs of those spare parts According to an interview with
a German expert another implicit source of reparability information for consumers is the
brand of the products They expect that the manufacturer of certain brands will repair the
product The same stakeholder added that as reparability has many dimensions it would
be hard to imagine a simple indicator which could be put on a durability label
Guarantees could play an informative key role as they are easier to compare (eg one
company offers a longer period of repairing services under the guarantee conditions
compared to another company)
63 Evidence from the focus groups
631 Durability information
Participants welcomed the idea of being provided with information about the
durability of products and agreed that this should be presented on product labels or in
the shop at the time of purchase (or on the website if a product is purchased online)
Some suggested that sales staff should also be able to inform customers about a
productrsquos durability
Attitudes towards the suggestion of having the information presented on the EU Energy
Efficiency Label (or as a similar label) were very positive Participants felt that this
would enable displaying productsrsquo durability in a simple straightforward manner and
would enable consumers to easily compare products
Participants also made suggestions on how durability should be defined for each of the
different products
Washing machinedishwasher ndash estimated number of washes (rather than
number of years) participants across the different countries agreed that for these
products expressing durability in number of years would not be accurate because
some households use these more often than others
Behavioural Study on Consumersrsquo Engagement in the Circular Economy
139
Television ndash estimated number of years (Germany) or estimated number of hours
of use (Ireland) once again because the frequency of use for this type of product
varies by household Another suggestion was to combine information on number of
years with the average number of hours of use per day
ldquoAverage hours of use per year So if it says lsquothis TV will last 3 years for 6 hours
use per dayrsquo for example A vacuum cleaner is expected to be on for half an hour
a day So we would need a list on what they consider the average usage a day per
product type so for example a TV 6 hours a day laptop 6 hours vacuum 030h
etc You know that if you put your TV on 12h a day itrsquos not going to last that long
as indicated (Man mixed group Dublin)
Vacuum cleaners ndash estimated number of hours of use (Germany Ireland)
Smartphones ndash some participants suggested number of years others also
suggested number of battery charges (Ireland) In Germany some mentioned that
it would be helpful to have an indication of the batteryrsquos durability in number hours
(and the equivalent in number of years) because this is often the part that breaks
down first
Clothing ndash number of years or as some German participants suggested through
an indication of the quality of the fabrics used (low medium or high) Displaying
durability for clothing was seen as somewhat less important than for electrical
appliances although some participants welcomed the idea
632 Reparability information
Participants were generally favourable to the idea of being provided with information on
reparability Discussions on this topic were however more complex in Sweden ndash where
participants although positive to the idea of having products repaired had less
experience with reparability
ldquoI must spend a lot of time and there is almost no information to be found about
where to repair things What rights do I have Where can I fix it These are my
questions Why should I have to spend so much time and look look look for
information while the producers just send me advertising and promotions ndash that
must cost them muchrdquo Female 35 vulnerable group Stockholm)
Some participants in Ireland and Sweden flagged the fact that presenting information on
a productrsquos reparability might discourage people from buying it because it may suggest
that the product is likely to break down
Some of the types of information participants considered useful to have with regard to
productsrsquo reparability were
Whether repair would be possible
Whether the product is repairable through DIY (and instructions on how to repair it)
Availability of spare parts
Availability of repair services and possibly a list of repair services
An indication of the timeframe during which spare parts would be available
An indication of the timeframe during which a manufacturer can ensure the
productrsquos repair
An indication of the level of difficulty of the repair (low medium high) ndash
participants in Germany suggested indicating this with small icons ndash eg hammers
one for easy two for medium three for difficult)
As with durability participants felt that information on productsrsquo reparability should be
provided at the moment of purchaseat the point of sale (on the product or on
the productrsquos label) They were generally favourable towards the idea of having an
indication included on the EU Energy Efficiency label or on a similar label Many
also felt that information should be included in the productsrsquo instructions manual as
well as should be available online Some of the German participants suggested that it
would be useful to have tutorials on how to repair products for example on a YouTube
channel
Information on reparability was mainly considered useful for electronic goods and to a
slightly lesser extent for clothing Information provision for clothing was considered less
Behavioural Study on Consumersrsquo Engagement in the Circular Economy
140
necessary because some participants already have repaired clothing themselves or had
them repaired at a tailor shop or repair centre (mainly in the case of shoes)
633 Recyclability information
Some participants (particularly in Germany) found it useful to have information on
productsrsquo recyclability on the EU Energy Efficiency Label (or on a similar label) They
would also welcome more information on how to recycle products Other participants
particularly in Ireland and Sweden were a lot more informed about how to recycle
products (clothes and electrical appliances)
ldquoItrsquos common sense these days itrsquos everywhere Batteries phones clothing
collection etc so easy to recycle itrsquos everywhere Itrsquos in the supermarket So why
would you throw them away if they can make something out of it Itrsquos easy and
cheap and accessiblerdquo (Woman vulnerable group Dublin)
The main types of information participants thought would be useful with regard to
recycling and productsrsquo recyclability are as follows
Percentage of recycled material used when producing the product
Percentage of material that can be recycled and that will be recycled at the end of
the productrsquos lifecycle
An indication on which parts of the product will be recycled and what they will be
used for
More information on the recycling process (what happens to a product once it is
brought for recycling)
ldquoI want to be a responsible consumer But I also would like to know ndash what do you do
with my smartphone I would like a guarantee for the recycling so I know where
things end uprdquo (Woman vulnerable group Stockholm)
Information on recycling centres and on how these recycle large appliances
German participants suggested that it would be useful to have a QR-code on the label
giving further information about the recycling process
634 Views on displaying information on reparability durability and
recycling on a label
Participants generally welcomed the idea of displaying information on product durability
reparability and recyclability on the EU Energy Label or on a similar label The idea was
seen as most useful in the case of durability although many participants felt the same
way about reparability and recyclability
German participants were the most enthusiastic towards this and felt that all three
aspects (durability reparability and recyclability) should be displayed on the EU Energy
Label (with categories for each aspect underneath)
64 Evidence from the consumer survey
641 Importance of durability and reparability in purchasing decisions
Results from the consumer survey on the importance of durability and reparability in
purchasing decisions are presented To understand the relative importance of these
factors in purchasing decisions further dimensions such as costs quality or fashion were
evaluated in addition to looking at durability and reparability Hence these other factors
can be compared to durability as well as reparability Additionally the reasons for why
survey respondents rated durability reparability and the availability of repair services as
important were analysed in more detail
Behavioural Study on Consumersrsquo Engagement in the Circular Economy
141
Figure 42 Importance of certain factors in purchasing decisions (average)
Notes The question was Q34a ldquoThinking of the last time you bought a [dishwasher vacuum cleaner television smartphone coat] to what extent did the following influence your choice of product Please answer on a scale from 1 (meaning ldquoNone at allrdquo) to 4 (meaning ldquoA lotrdquo)rdquo In order to calculate averages
answer categories where re-labelled with ldquoa lotrdquo corresponding to a value of +10 and ldquonot at allrdquo corresponding to a value of -10 As a result a positive average means the factor is important a negative average means the factor is unimportant 0 means neither important nor unimportant N=12064
Source ConPolicy analysis of consumer survey data
Figure 42 summarizes the results on the average importance of different factors that
might be relevant during purchasing processes For eight factors (across all five product
categories) participants were asked how much influence each factor had on their
purchasing decisions
Overall the quality of the product was rated most influential followed by price How
long the product was expected to last (durability) reparability the existence of a
repair service and environmental credentials were also important to participants
The manufacturer or brand was ranked as less important and overall participants
rated the product being the latest model or trend as even less influential
As a next step the influence of these eight factors are reported individually across
product categories Figure 43 displays the results on the average importance ratings156
The price of the product
For all product categories price mattered a lot as its importance was consistently rated as
high As can be seen in the detailed Table 5 in Section 7 in the Annex document
between 50 and 60 indicated price as relevant in the survey In contrast only a very
small fraction ie below 3 for all product categories reported price to not matter at
all
The manufacturer or brand of the product
A more diverse picture emerged with respect to the importance of the manufacturer or
brand of the product When looking at the average ratings of this attribute in Figure 43
brand was most relevant for mobile phones followed by televisions vacuum cleaners and
dishwashers For mobile phones this factor was very important for 50 of the
participants For televisions the share was lower 43 while 40 and 34 indicated its
high relevance for vacuum cleaners and dishwashers In contrast the average rating as
well as the share of participants indicating clothing brands to be important was much
lower Overall only 20 of participants indicated the manufacturer or brand to matter
156 Additionally see the additional survey results in the Annex document for a table showing detailed results on consumer ratings of the importance for all categories and products in percent
Behavioural Study on Consumersrsquo Engagement in the Circular Economy
142
very much Interestingly the share of participants reporting the manufacturer or brand
to not matter at all was also 20 for clothing while these shares were below 6 for the
other product categories (See additional survey results in Table 5 in Section 7 of the
Annex document for detailed importance ratings by product)
The general quality of the product
Across all five product categories the majority of participants indicated that the general
quality of the product had a lot of influence on their purchasing decisions Overall there
exists no sizable difference between the individual product categories Quality was most
important for participants in the category of vacuum cleaners (70) followed by
televisions and mobile phones (69) dishwashers (63) and coats or jackets (63)
Again the shares of participants attributing no importance to this factor were low ie
less than 3 for all products See again the Annex for further detail
Whether the product was the latest model or trend
As indicated before trends were less relevant for purchasing decisions compared to for
example price Nevertheless there exist product categories for which trends were more
important compared to others As displayed in Figure 43 for televisions smartphones
and clothing items the average importance rating was positive implying that participants
thought trends to be influential When looking at the shares of respondents rating trends
to be of highest importance the following results emerged The largest share was found
among mobile phones (23) followed by televisions (22) and clothing items (19)
(see Table 5 in Section 7 in the Annex document) For vacuum cleaners and dishwashers
the average importance rating was lower and even below 0 indicating that respondents
rated that trends rather did not matter The shares of participants attributing a high
importance to trends were fairly sizable with 13 to 15 When looking at the other
extreme ie shares of respondents attributing no importance to trends at all no sizable
difference between product categories was found For vacuum cleaners dishwashers and
clothing items shares were around 20 while for electronic items ie mobile phones
(16) and televisions (14) they were slightly lower
How long the product could be expected to last
The expected lifespan of a product had a lot of influence on consumersrsquo purchasing
decisions Overall the average rating as shown in Figure 43 was high across all products
Though for dishwashers vacuum cleaners televisions and mobile phones the average
importance rating was higher than for clothing items As can be seen in the Annex the
share of participants indicating that the expected lifespan of a product had a lot of
influence on their purchasing decision was similar for dishwashers vacuum cleaners
televisions and mobile phones (46 to 53) and smaller but still sizable for coats or
jackets (33) Again looking at the shares of participants indicating no importance at
all for most product categories the shares amounted to below 4 Interestingly for
clothing items this share was much higher 10 which may capture a group of
consumers with a particular interest in the latest trends and lsquofast fashionrsquo
Whether the product could be repaired if broken
The reparability was on average rated as less important compared to durability but it was
still rated as important for most product categories As displayed in Figure 43 the
average rating of importance was positive for dishwashers vacuum cleaners televisions
and smartphones indicating that on average respondents stated that reparability was
important In more detail (see Table 5 in Section 7 in the Annex document) the share of
respondents attributing a lot of influence to reparability was 30-34 in the mentioned
product categories Clothing items again represented an outlier The average rating was
below 0 indicating that respondents rated reparability rather as unimportant Only about
11 indicated reparability as important for coats and jackets The same pattern emerged
for participants indicating that reparability played no role at all Less than 10 reported
this rating for most product categories Only for clothing items this share was larger with
36
Whether repair services exist for the product
A similar picture emerged for the existence of repair services On average the rating of
importance was above 0 for dishwashers vacuum cleaners televisions and smartphones
Behavioural Study on Consumersrsquo Engagement in the Circular Economy
143
showing that respondents found repair services to be rather influential in their purchasing
decision The share of respondents rating the availability of repair services as having a lot
of influence were around 30 Again clothing items were an outlier The average rating
of importance in this category was below 0 indicating no importance of this attribute
Accordingly the share of respondents attributing a lot of influence to this factor was only
7 When looking at the other extreme where participants indicated repair services to
have no importance at all a similar difference between product categories was detected
Between 8 and 13 of participants reported no importance of the factor at all for most
categories while 48 reported this for clothing
The environmental credentials of the product
Finally the share of participants who indicated that environmental credentials had a lot
of influence on their purchasing decisions was rather heterogeneous across the five
product categories The average rating as displayed in Figure 43 was positive for
dishwashers vacuum cleaners and televisions indicating that on average environmental
credentials played a role for respondents For smartphones it was close to 0 whereas it
was below 0 for clothing items When looking at the shares of respondents either
attributing a lot or no relevance for this factor (see Table 5 in Section 7 of the Annex) the
following results emerged For dishwashers 37 found environmental credentials to be
important followed by vacuum cleaners (28) and televisions (25) The importance of
environmental credentials was smaller for mobile phones (18) and coats or jackets
(14) Again these results were mirrored at the other extreme For vacuum cleaners
dishwashers and televisions the shares of participants stating that environmental
credentials had no importance at all were between 5 and 11 For mobile phones the
fraction was higher with 17 and even higher with 24 for coats and jackets
Figure 43 Importance of certain factors in purchasing decisions by product category
(average)
Behavioural Study on Consumersrsquo Engagement in the Circular Economy
144
Behavioural Study on Consumersrsquo Engagement in the Circular Economy
145
Notes The question was Q34a ldquoThinking of the last time you bought a [dishwasher vacuum cleaner television smartphone coat] to what extent did the following influence your choice of product Please answer on a scale from 1 (meaning ldquoNone at allrdquo) to 4 (meaning ldquoA lotrdquo)rdquo In order to calculate averages answer categories where re-labelled with ldquoa lotrdquo corresponding to a value of +10 and ldquonot at allrdquo corresponding to a value of -10 As a result a positive average means the factor is important a negative average means the factor is unimportant 0 means neither important nor unimportant Dishwasher N=4848 Vacuum Cleaner N=4096 Television N=4855 Smartphone Mobile Phone N=4893 Clothing (Coat or Jacket) N=4883
Source ConPolicy analysis of consumer survey data
Furthermore the importance of different factors influencing the purchasing decision were
analysed by country and socio-demographic factors These results are summarised here
below and displayed in detail in Section 7 in the Annex document
The average importance of price was high among all 12 examined countries In
particular Spain stuck out indicating a very large relevance of price followed by Romania
and Portugal The lowest importance ratings were observed in Austria the Netherland
and France When looking at age and education no noteworthy patterns emerged Not
surprisingly it was found that respondents who found it more difficult to make ends meet
at the end of the month gave more importance to price compared to those financially
better off
With respect to the importance of the manufacturer or brand two countries
Romania and Spain stuck out In these two Member States participants on average
revealed a larger relevance compared to the other countries Age did not seem to play a
role while the highest educational category rated the influence of brand more important
than the lower educational categories Furthermore participants indicating a very difficult
financial situation also revealed lower influence of brand compared to wealthier income
categories
As indicated above the quality of the product was overall the most important factor
and this was also true for the individual country ratings Compared to other countries
the French participants on average attributed a lower importance to quality With respect
to other socio-demographics no striking differences were observed
With respect to the product being the latest model or trend interesting country
differences emerged On the positive side ie countries attributing importance to trends
in particular Romania and Spain stuck out with relatively higher rates In contrast
Austria France and the Netherlands revealed negative average importance ratings
indicating that being the latest model or trend was not important Participants indicating
their financial situation to be very difficult attributed less importance to trends With
respect to other socio-demographic factors no particular patterns were visible
Behavioural Study on Consumersrsquo Engagement in the Circular Economy
146
Durability overall was on overage also influential While Romanian and Hungarian
participants were among the top two with respect to durability ratings lower rates were
observed for the Netherlands Germany Austria and France With respect to other socio-
demographics factors no striking differences were found
These results on country effects as well as age education and income differences were
mirrored for the importance of reparability and availability of repair services
Lastly a very similar pattern on country level and for the other socio-demographics
factors was observed for the importance of the environmental credentials of a product
Reasons for high importance of durability
Participants that indicated that durability had at least a little importance for their
purchasing decision were asked about the reasons for this rating as depicted in Table 38
The most prominent reason across all product categories was the perception that long-
lasting products would save money in the long run (45 to 55) Other important
reasons were the perceived higher quality of long lasting products (36 to 43) the
perception that durable products would be better for the environment (23 to 30)
the convenience of not having to shop for a replacement soon (23 to 28) and
that long lasting products typically are better value for money (22 to 26) Among
the different product categories no distinctive patterns emerged
Table 38 Reasons for high importance of durability by product category (in )
Vacuum
Cleaner
Dish-
washer
TV Mobile
Phone
Coat or
Jacket
Long lasting products will save
me money in the long run
547 548 509 507 453
Long lasting products are
typically better quality
360 365 360 345 430
Buying a long-lasting product
is better for the environment
300 291 272 274 226
To avoid the effort of shopping
for a replacement soon
227 229 269 278 256
Long lasting products are
typically better value for
money
226 258 245 220 252
Other 01 03 02 04 02
Donrsquot know 15 07 18 21 24
No of observations 3554 3556 4144 4085 3742
Note Following up on answers presented in Figure 42 and Figure 43 participants were asked (Q34b) ldquoYou said that when you last bought the following product(s) ldquohow long the product could be expected to lastrdquo had a lot of influence on your choice of product Why was this For each product please select the two most important reasonsrdquo Since participants indicated the two most appropriate reasons the totals do not sum up to 100
Source ConPolicy analysis of consumer survey data
Behavioural Study on Consumersrsquo Engagement in the Circular Economy
147
Reasons for low importance of durability
The reasons for participants indicating that durability had no or only very little
importance for their purchasing decisions are presented in Table 39
For all product categories the most prominent reason was that participants found it hard
to tell how long a product will last (62 to 70) For vacuum cleaners dishwashers
televisions as well as mobile phones the second most important reason was that longer
lasting products were hard to find (20 to 26) For clothing items another aspect was
ranked second though within this category 19 of participants indicated that durability
did not play a role for purchasing decisions because they did not expect to use the
product for a long time Overall fashion value and maintenance effort were relatively
less important
Table 39 Reasons for low importance of durability by product category (in )
Vacuum
Cleaner
Dish-
washer
TV Mobile
Phone
Coat or
Jacket
Itrsquos hard to tell how long a
product will last
603 702 683 641 618
Long lasting products are
harder to find
230 258 197 214 132
I am interested in owning
the latest
fashiontechnology
130 87 148 152 142
I did not expect to use the
product for a long time
120 124 95 160 191
How long a product will
last is not important to me
104 51 67 93 126
Long lasting products are
worse value for money
76 48 71 60 54
Long lasting products need
a lot of maintenance
41 35 26 41 47
Other 67 45 75 67 49
Donrsquot know 54 75 55 39 60
No of observations 346 396 541 611 1001
Note Following up on answers presented in Figure 42 and Figure 43 participants were asked (Q34c) ldquoYou said that when you last bought the following product(s) ldquohow long the product could be expected to lastrdquo had little influence on your choice of product Why was this For each product please select the two most important reasonsrdquo Since participants indicated the two most appropriate reasons the totals do not sum up to 100
Source ConPolicy analysis of consumer survey data
Behavioural Study on Consumersrsquo Engagement in the Circular Economy
148
Reasons for high importance of reparability
Table 40 presents the reasons for which participants rated reparability as important for
their purchasing decisions
Overall the top reason was once again saving money (31 to 37) followed by the
preference of keeping a product for as long as possible (28 to 35) Environmental
factors (22 to 26) using reparability as a signal for high quality (22 to 26)
the convenience of not having to shop for a replacement (21 to 25) as well as
using reparability as a signal of the manufacturer caring for the customer (17 to
24) were all of equivalent importance Compared to these aspects it is quite
interesting to see that the joy of repairing items was seen as much less important for
reparability (below 7 in all product categories)
Table 40 Reasons for high importance of reparability by product category (in )
Vacuum
Cleaner
Dish-
washer
TV Mobile
Phone
Coat or
Jacket
Repairing the product will
save me money
344 367 314 325 305
I wanted to keep the
product for as long as
possible
303 280 303 341 346
Repairing the product is
better for the environment
252 257 230 240 215
Itrsquos a sign that the product
is of high quality
230 253 241 223 261
Repairing avoids the effort
of shopping for a new one
250 240 243 236 206
It shows the manufacturer
cares about its customers
213 235 243 221 167
I enjoy repairing things 72 53 43 47 66
Other 02 03 03 03 002
Donrsquot know 14 11 25 22 44
No of observations 3127 2822 3438 3360 1909
Note Following up on answers presented in Figure 42 and Figure 43 participants were asked (Q34d) ldquoYou said that when you last bought the following product(s) ldquowhether the product could be repaired if it brokerdquo had a lot of influence on your choice of product Why was this For each product please select the two most important reasonsrdquo Since participants indicated the two most appropriate reasons the totals do not sum up to 100
Source ConPolicy analysis of consumer survey data
Behavioural Study on Consumersrsquo Engagement in the Circular Economy
149
Reasons for low importance of reparability
Table 41 displays the reasons for why participants attributed a low importance to
reparability in the purchasing process
On average four answer categories were rated more important than others namely
Trusting the manufacturerrsquos warranty (14 to 45) followed by the expectation
that the product will not break (26 to 35) the cost of repair (18 to 34) and
the reason that participants will replace it if it breaks (15 to 24) Not considering
repair the difficulty of repair the lower quality after repair and the reason that if a
product can be repaired easily it must be of low quality were less important
There were some interesting differences in ratings across product categories especially
for clothing For this category 23 of participants stated that they simply do not
consider repairing a clothing item whereas trust in the manufacturerrsquos warranty was
ranked comparatively low (14)
Table 41 Reasons for low importance of reparability by product category (in )
Vacuum
Cleaner
Dish-
washer
TV Mobile
Phone
Coat or
Jacket
I trust the manufacturerrsquos
warranty
326 446 340 329 138
I donrsquot expect this product
to break
289 339 292 259 351
Repairing the product
would be too expensive
296 244 329 342 181
If something breaks I
replace it
223 175 170 148 238
Repairing this product just
isnrsquot something Irsquod
consider
129 80 98 145 229
Repairing the product
would be too difficult
110 109 167 168 126
Products are not as good
after theyrsquove been repaired
44 66 50 89 100
If it can be repaired easily
it must be of low quality
37 25 37 14 26
Other 23 29 16 35 42
Donrsquot know 51 52 52 46 68
No of observations 775 1111 1208 1311 2752
Note Following up on answers presented in Figure 42 and Figure 43 participants were asked (Q34e) ldquoYou said that when you last bought the following product(s) ldquowhether the product could be repaired if it brokerdquo had little influence on your choice of product Why was this For each product please select the two most important reasonsrdquo Since participants indicated the two most appropriate reasons the totals do not sum up to 100
Source ConPolicy analysis of consumer survey data
Behavioural Study on Consumersrsquo Engagement in the Circular Economy
150
Reasons for high importance of availability of repair services
The reasons for participants attributing importance to the availability of repair services
are displayed in Table 42
As for reparability in general none of the presented answer categories stuck out as a top
reason for attaching high importance to the availability of repair services either Many
participants indicated that repairing the product could save money (33 to 40)
and that they wanted to keep the product for as long as possible (28 to 34)
Similarly other important reasons were that repairing avoids the effort of shopping
for a new onerdquo (24 to 28) repairing the product is better for the environment
(23 to 28) not being able to self-repair the product (18 to 25) and the
belief that repair services will do a good job (15 to 20) There were no striking
patterns across the different products categories
Table 42 Reasons for high importance of availability of repair services by product
category (in )
Vacuum
Cleaner
Dish-
washer
TV Mobile
Phone
Coat or
Jacket
Repairing the product
could save me money
393 399 371 352 329
I wanted to keep the
product for as long as
possible
293 280 290 326 341
Repairing avoids the effort
of shopping for a new one
279 267 269 243 238
Repairing the product is
better for the environment
268 284 247 252 229
I donrsquot think I could repair
this product myself
190 198 224 251 178
I believe repair services
will do a good job
197 213 185 182 151
Other 03 03 05 03 04
Donrsquot know 19 20 30 21 56
No of observations 3034 2767 3331 3201 1415
Note Following up on answers presented in Figure 42 and Figure 43 participants were asked (Q34f) ldquoYou said that when you last bought the following product(s) ldquowhether repair services exist for the productrdquo had a lot of influence on your choice of product Why was this For each product please select the two most important reasonsrdquo Since participants indicated the two most appropriate reasons the totals do not sum up to 100
Source ConPolicy analysis of consumer survey data
Behavioural Study on Consumersrsquo Engagement in the Circular Economy
151
Reasons for low importance of availability of repair services
Participants attributing little or no importance to repair services on average indicated
several reasons for their statements (Table 43) Overall trust in manufacturerrsquos
warranty costs the expectation that the product will not break as well as the
statement that faulty items would be simply replaced were reported
There were interesting differences between product categories Trust in manufacturersrsquo
warranties and expected high costs of repair services were named rather frequently for
vacuum cleaners dishwashers televisions and mobile phones However this was not
true for clothing items where only about 16 (warranty) and 17 (costs) stated this to
be a reason for attributing little importance to repair services Not considering repairing a
faulty product was stated more frequently for clothing items (26) compared to other
product categories (ranging from 7 to 13)
Table 43 Reasons for low importance of availability of repair services by product
category (in )
Vacuum
Cleaner
Dish-
washer
TV Mobile
Phone
Coat or
Jacket
I trust the manufacturerrsquos
warranty
364 445 371 346 161
Repair services are too
expensive
283 317 317 327 166
I donrsquot expect this product
to break
281 322 275 271 362
If something breaks I just
replace it
183 162 150 165 221
Repairing this product just
isnrsquot something Irsquod
consider
128 71 122 134 261
I wouldnrsquot know how to
find a repair service
105 75 76 81 94
Products are not as good
after theyrsquove been repaired
50 53 74 103 86
If repair services exist the
product must be low
quality
23 17 31 19 34
Other 39 54 28 41 59
Donrsquot know 69 47 69 61 73
No of observations 850 1164 1342 1461 3209
Note Following up on answers presented in Figure 42 and Figure 43 participants were asked (Q34g) You said that when you last bought the following product(s) ldquowhether repair services exist for the productrdquo had little influence on your choice of product Why was this For each product please select the two most important reasonsrdquo Since participants indicated the two most appropriate reasons the totals do not sum up to 100
Source ConPolicy analysis of consumer survey data
Behavioural Study on Consumersrsquo Engagement in the Circular Economy
152
642 Expectations on durability and reparability information
In the following section consumersrsquo expectations regarding durability and reparability
information are presented Firstly it is presented when respondents would like to
receive durability information during the purchasing process followed by ways how they
would like to receive this information Similar steps are followed also for reparability
information
When respondents would like to receive durability information
Visible from Table 44 across all product categories the majority of participants reported
that they expected durability information to be displayed at the point of purchase
Similarly a large percentage indicated that they expected this information when
comparing alternative products (between 38 and 50) Presenting this information
when products are advertised on the other hand was ranked less important and only a
very small share of participants reported that they expected durability information after
their purchase The overall rankings were fairly homogenous across the different product
categories
Table 44 Expectations regarding when to receive durability information (in )
Vacuu
m
Cleaner
Dish-
washer
TV Mobile
Phone
Coat or
Jacket
When products are
advertised (eg on TV in
store online)
195 189 200 221 125
When comparing alternative
products (in store online)
486 496 474 499 379
At the point of purchase (at
the online check-out or shop
counter)
520 544 525 528 518
After a purchase has been
made
52 46 61 68 78
Other 13 14 13 07 15
Donrsquot know 57 52 63 56 134
No of observations 4848 4096 4855 4893 4883
Note The question was Q52 ldquoFor each of the following products when would you expect to obtain information on how long the product will last that you are considering buyingrdquo
Source ConPolicy analysis of consumer survey data
How respondents would like to receive durability information
In addition to the timing of durability information participants were also asked to
indicate how they preferred to receive information on productsrsquo durability
Table 45 displays the results by product category
Overall participants reported most frequently that they expected durability information
via product descriptions (40 to 45) as well as via guarantees or warranties
(23 to 44) About 30 of respondents each expected to receive information via
retailers operating manuals or instructions or the manufacturerrsquos website These were
followed by the expectation of receiving information via an EU official label (18 - 23)
and an official label from a national authority (14 - 19) Websites of third parties as
well as social media sites were ranked as less important
For the individual product categories a difference in importance of guarantees and
warranties was found for clothing items Considerably fewer respondents wished to
receive information via guarantees for this product A similar difference was found for the
Behavioural Study on Consumersrsquo Engagement in the Circular Economy
153
relevance of operating manuals and instructions Again clothing items received a lower
rating (16) compared to the other products (above 30)
Table 45 Expectations regarding how to receive durability information (in )
Vacuum
Cleaner
Dish-
washer
TV Mobile
Phone
Coat or
Jacket
Via product descriptions 445 445 428 446 399
Via guarantees or
warranties
431 439 413 431 227
Via the retailer 334 346 352 345 360
Via operating manuals or
instructions
333 318 309 313 162
Via a manufacturerrsquos
website
291 293 295 318 185
Via an EU official label 216 232 212 208 182
Via an official label from
your national authority
176 186 160 171 135
Via the website of a third
party (eg consumer
association)
150 156 152 174 95
Via social media 107 110 113 148 85
Other 03 03 03 02 08
Donrsquot know 41 36 45 39 112
No of observations 4848 4096 4855 4893 4883
Note The question was Q53 ldquoAnd for each of the following products how would you expect to obtain information on how long the product will last that you are considering to purchase Select all that applyrdquo
Source ConPolicy analysis of consumer survey data
When respondents would like to receive reparability information
Table 46 presents participantsrsquo expectations on receiving reparability information
Respondent preferences for the timing of reparability information followed a similar
pattern to those for durability information discussed above Again the majority of
participants reported that they would expect to obtain reparability information at the
point of purchase for all product categories Here approval rates ranged from 56 to
59 Many respondents would also expect to receive reparability information when
comparing the product to others (ranging from 32 to 45) During advertisement
of products between 13 and 20 of the respondents would expect to be informed
Finally between 8 and 11 would expect to receive information after they bought the
product
Table 46 Expectations regarding when to receive reparability information (in )
Vacuum
Cleaner
Dish-
washer
TV Mobile
Phone
Coat or
Jacket
When products are
advertised (eg on TV in
store online)
186 180 180 202 126
When comparing
alternative products (in
store online)
445 440 413 440 319
Behavioural Study on Consumersrsquo Engagement in the Circular Economy
154
At the point of purchase
(at the online check-out or
shop counter)
567 591 572 582 555
After a purchase has been
made
83 78 96 96 111
Other 10 13 12 09 13
Donrsquot know 67 56 71 71 136
No of observations 4848 4096 4855 4893 4883
Notes The question was as follows Q54 ldquoStill thinking about the same products when would you expect to obtain information on how easy it is to repair the products that you are considering buyingrdquo
Source ConPolicy analysis of consumer survey data
How to receive reparability information
Table 47 presents the results on participantsrsquo preferences on how to receive reparability
information
Overall the responses were similar to the one regarding durability information
Most participants reported that they would expect to receive reparability information via
product descriptions (ranging from 34 to 40) and via guarantees or warranties
(ranging from 21 to 38) Similarly large shares reported their preference for
receiving information via the retailer (34 to 37) and manuals or instructions
(18 to 37) Expectations to receive information via the manufacturersquos website and an
EU official label were lower Even fewer respondents expected to receive information via
a label from a national authority the website of a third party andor social media
For most product categories answers were rather homogenous Although in the case of
coats or jackets participants indicated a lower expectation for receiving information via
guarantees or warranties (21) as well as operating manuals or instructions (18)
compared to the other product categories
Behavioural Study on Consumersrsquo Engagement in the Circular Economy
155
Table 47 Expectations regarding how to receive reparability information (in )
Vacuum
Cleaner
Dish-
washer
TV Mobile
Phone
Coat or
Jacket
Via product descriptions 394 397 360 390 336
Via guarantees or
warranties
365 367 360 380 209
Via the retailer 353 353 370 344 356
Via operating manuals or
instructions
372 359 336 345 182
Via a manufacturerrsquos
website
275 283 274 307 183
Via an EU official label 176 180 166 171 141
Via an official label from
your national authority
137 145 126 133 103
Via the website of a third
party (eg consumer
association)
121 131 132 159 91
Via social media 90 91 95 115 76
Other 02 02 01 03 08
Donrsquot know 49 42 60 54 136
No of observations 4848 4096 4855 4893 4883
Notes Participants were asked Q55 ldquoAnd how would you expect to obtain information on how easy it is to repair the products that you are considering to purchaserdquo
Source ConPolicy analysis of consumer survey data
65 Evidence from the behavioural experiment
This section reports findings from the purchasing experiment This experiment was
conducted to understand the drivers of CE behaviour in purchasing decisions
As described in further detail in Section 272 respondents were asked to purchase a
product on a simulated e-commerce website Six different product options were shown to
respondents These product options varied systematically in their price level of
durability157 and level of reparability158 in addition to also varying fictitious product
pictures brand and model names The experimental task was repeated by each
respondent for three different products
The sections below analyse the impact of durability by looking at the durability
preferences of respondents the average durability of products chosen in the experiment
and their willingness to pay for longer lasting products
Reparability is analysed by looking at the reparability preferences of respondents and
their willingness to pay for more easily repairable products
157 Defined in the experiment as lsquothe period in which a manufacturer promises to replace or repair the product for free in case of repairrsquo
158 Defined in the experiment as an lsquoease-of-repair rating based on availability of repair manuals spare parts and repair servicesrsquo The rating ran on a scale from A to G
Behavioural Study on Consumersrsquo Engagement in the Circular Economy
156
651 Effectiveness of providing durability or reparability information
One of the experimental conditions159 systematically varied whether and how durability
andor reparability information was shown in the product descriptions As explained in
more detail in section 272 (incl screenshots of the information used) durability andor
reparability information were either shown via icons within the EU EnergyEcolabel shown
as a manufacturer warranty or shown as an expected lifetime
The following definitions of durability and reparability were used on the EU labels
Respondents could reveal these definitions by clicking on the labels
Durability The period in which the manufacturer promises to replace or repair the
product free of charge
Reparability Ease-of-repair rating based on availability of repair manuals spare
parts and repair services
The lsquoManufacturer warrantyrsquo and lsquoExpected lifetimesrsquo were not explained further as it is
common market practice for manufacturers and retailers to display such promises in this
way at the point of sale
Durability information
Figure 44 shows the distribution of lsquodurability preferencesrsquo for different ways of disclosing
durability information to respondents The definition of durability preferences used in the
analysis is explained in detail in section 272 but in summary
Respondents who mostly chose products with high durability in the experiment were
classed as having lsquoHighrsquo durability preferences
Those who mostly chose products with low durability lsquoLowrsquo durability preferences
All others were classed as having lsquoIntermediatersquo durability preferences
Visible from the very left-hand bar in the figure as would be expected respondents that
did not see any durability information were unable to make durability a meaningful
criterion for their product choice For this group the distribution of durability preferences
was close to a random allocation (around 20 of respondents having chosen each low
and high durability products and almost 60 choosing intermediate durability levels) as
would be expected in this case This group of respondents forms the group of comparison
(baseline) for further analysis
159 Allocations to the various treatments in the experimental tasks were done independently and randomly across the different allocations This resulted in a full factorial design between products and treatments This means that group sizes for different variants within each treatment category were roughly equal and each respondent had the same likelihood of being assigned to any specific treatment This also ensures that on average there should not be any interactions between different types of experimental treatments
Behavioural Study on Consumersrsquo Engagement in the Circular Economy
157
Figure 44 Durability preferences for different forms of durability information
Notes 1988 respondents were shown no durability information 985 respondents were shown durability information on an EU label 1000 respondents were shown both durability and reparability information on an EU label 1027 respondents were shown a manufacturer warranty and 1042 respondents were shown an expected lifetime indication
The labels below the results show the respective durability information shown in the experiment Durability in the Energy (likewise in the Ecolabel for clothes) was shown using a lsquohandshakersquo icon and durability in years (months for smartphones) Reparability was shown using a lsquospanner and screwdriverrsquo icon with a reparability rating from A-G Clicking on the label (used by 31 of respondents) revealed additional information and definitions of durabilityreparability Durability on EU labels was defined as The period in which the manufacturer promises to replace or repair the product free of charge
Reparability on EU labels was defined as Ease-of-repair rating based on availability of repair manuals spare parts and repair services
The handshake icon shown in this figure is different from the one seen by respondents in the experiment for copyright reasons
Source LE Europe analysis of behavioural experiment
When durability information was shown respondents were significantly more likely to
choose more durable products On average across the four information remedies (see the
four right-hand bars in the figure above) the proportion of respondents with a
preference for high durability nearly tripled by virtue of providing durability
Behavioural Study on Consumersrsquo Engagement in the Circular Economy
158
information a change which was highly statistically significant160 Respondent
preferences shifted from both intermediate and low durability preferences towards high
durability preferences And at the same time the share of respondents with intermediate
and low durability preferences also decreased significantly
Looking in detail at how durability information in the experiment was best provided it
emerges that on this measure of durability preferences durability information either as a
manufacturer warranty or expected lifetime was most effective in the experiment
Showing durability information as part of an EU label161 was slightly less effective
This finding can be seen from the figure above The shares of respondents with high
durability preferences were highest in the conditions showing a manufacturer warranty or
expected lifetime indication and the shares of respondents with low durability
preferences were lowest in these conditions
However the difference in effectiveness of showing durability information (alone) on an
EU label compared to the information outside of the label was minor and not always
statistically significant More specifically the distribution of respondent preferences for
high and intermediate durability were equivalent across the three conditions But the
share of respondents choosing low durability products was significantly larger when
durability was shown on the EU label
It can be conjectured that the EU label was marginally less effective because it used only
icons while the manufacturer information contained descriptive language The icon used
on the EU labels (ie a handshake symbol) was novel and may not have been
immediately understood Respondents needed to click on the label to get additional
explanation about the meaning of the icon Overall 31 clicked on at least one label
throughout the three rounds of the experiment to enlarge it and see the definitions for
icons At the same time expected lifetimes and manufacturer warranties can already be
found in the market and are more self-explanatory compared to the icon Thus the
effectiveness of the durability information on the EU labels can be interpreted as a lower
bound and is likely to further increase as time passes after it was introduced as
consumers learn about the meaning of the icon and become more familiar with it
This finding is further underlined by the table below which shows the average durability
chosen by respondents for the different product categories For each product category
the average durability chosen was highest when durability information was shown either
using a manufacturer warranty or expected lifetime (see the last two rows) Providing
durability information on an EU label was similarly effective when it was shown on its
own (see third row)
When durability information on an EU label was shown in conjunction with reparability
information it was however significantly less effective compared to the other ways of
providing durability information (see fourth row) The group of respondents who saw
durability information together with reparability information chose on average ndash
statistically significantly ndash less durable products compared to respondents who saw
durability information on its own But respondents who saw durability and reparability
information together still chose product with higher average durability than the
respondents who did not see any durability information
160 Statistical significance verified using two-sided pairwise z-test of proportions
161 Mock EU Energy Labels which reproduced key features of the actual EU Energy Label were used for vacuum cleaners dishwashers TVs and smartphones The EU Ecolabel was adapted for clothes In both types of labels durability and reparability information was presented using the same format and icons See section 272 for further detail and screenshots of the labels
Behavioural Study on Consumersrsquo Engagement in the Circular Economy
159
Table 48 Average durability chosen by respondents in purchasing experiment in
months (smartphone) or years (all other products)
Type of information Vacuum
cleaners
Dish-
washers
TVs Smart-
phones
Coats
No durability information 56 77 44 329 57
Durability information on EU
label
82 122 58 365 72
Durability and reparability on
EU label
73 111 53 355 69
Manufacturer warranty 83 123 59 371 75
Expected lifetime 85 127 61 378 75
Source LE Europe analysis of behavioural experiment
Reparability information
Figure 45 shows the distribution of reparability preferences for different experimental
conditions which varied whether and how reparability information was disclosed
Reparability preferences are defined analogously to durability preferences Section 272
provides a more detailed explanation but in summary the preferences are defined as
follows
Respondents who mostly chose products with high reparability in the experiment
were classed as having lsquoHighrsquo reparability preferences
Those who mostly chose products with low reparability were classed as having lsquoLowrsquo
reparability preferences
All others were classed as having lsquoIntermediatersquo reparability preferences
Behavioural Study on Consumersrsquo Engagement in the Circular Economy
160
Figure 45 Reparability preferences for different forms of reparability information
Note 4029 respondents were shown no reparability information 1013 were shown reparability on an EU label and 1000 were shown reparability and durability on an EU label
The labels below the results show the respective reparability information shown in the experiment Reparability in the Energy (likewise in the Ecolabel for clothes) was shown using a lsquospanner and screwdriverrsquo icon with a reparability rating from A-G Reparability was shown using a lsquohandshakersquo icon and durability in years (months for smartphones) Clicking on the label revealed additional information and definitions of durabilityreparability
Reparability on EU labels was defined as Ease-of-repair rating based on availability of repair manuals spare parts and repair services
Durability on EU labels was defined as The period in which the manufacturer promises to replace or repair the product free of charge
The handshake icon shown in this figure is different from the one seen by respondents in the experiment for copyright reasons
Source LE Europe analysis of behavioural experiment
Similar to the effectiveness of durability information providing reparability
information induced respondents to choose more repairable products A higher
proportion of respondents had high reparability preferences and a lower proportion had
low or intermediate reparability preferences when reparability information was shown
The differences in these proportions were highly statistically significant in tests of
proportions
Behavioural Study on Consumersrsquo Engagement in the Circular Economy
161
The effects are however smaller in magnitude compared to the findings for
durability The proportion of respondents with a high reparability preference lsquoonlyrsquo
doubled when reparability information was shown while high durability preferences
tripled for a similar intervention The proportion of respondents with a low or
intermediate reparability preference decreased by respectively 11 and 5 percentage
points
Results for reparability might have been less strong because it appears that the
information on reparability as provided in the experiment was less attention grabbing
for respondents Around 42 of respondents who saw information on reparability
correctly recalled this after the experiment162 In contrast 71 of respondents who saw
durability information recalled this correctly Furthermore it seems that reparability
information (as provided in the experiment) was more difficult to understand and use
than information on durability163
Interaction between durability and reparability information
Combining the information provided in Figure 44 Table 49 and Figure 45 above sheds
light on the interaction between durability and reparability information Comparing
product choices when durability and reparability were provided as stand-alone
information to when they were provided together is telling for how respondents dealt
with the different amount of information
In the previous analyses providing durability and reparability information at the same
time seemed to decrease the importance of each of these individual pieces of
information The proportion of respondents who chose high durability products was
significantly higher when durability information was shown on its own rather than with
reparability information Similarly the average chosen durability was higher ndash often
statistically significantly so ndash when durability information was shown on its own (instead
of with reparability)
Similarly the proportion of respondents who selected products with high reparability was
larger when reparability information was shown without additional durability information
This suggested that showing both durability and reparability information on EU labels
might create a dilemma for CE behaviours of competing interest When only a single
piece of information was given respondents could adjust their behaviour with respect to
that piece of information However this was not possible or at least more difficult when
information about durability and reparability were given concurrently
It must be noted that the above analyses did not consider the effect of information
on durability and reparability jointly This was because a joint analysis required a
measure that combines preferences for durability and reparability The figure below
presents such a measure for general CE preferences These general CE preferences were
calculated by combining the previously presented measures for durability preferences
and reparability preferences Both durability and reparability received equal weighting in
this measure The figure below presents only the information treatments that were
presented as part of EU labels because only the EU labels presented both durability and
reparability information
162 Following the purchasing experiment respondents were asked the following question ldquoThinking about the last purchasing decision you just made what information did you get about the selection of products you saw Please select all that applyrdquo Answer options included ldquoAn indication of how long the products will lastrdquo and ldquoHow easy it is to repair the products or get them repairedrdquo
The answers to this question were compared with the information shown in the experiment to respondents This allows for an assessment whether participants who saw information on durability andor reparability recalled seeing this information correctly
163 This was found by comparing answers to follow up questions which asked respondents how easy they found respectively the durability and reparability information shown to them
Behavioural Study on Consumersrsquo Engagement in the Circular Economy
162
Figure 46 General CE preferences for different forms of information
Note 975 respondents were shown no information 985 were shown durability on an EU label 1013 were shown reparability on an EU label and 1000 were shown reparability and durability on an EU label
The labels below the results show the respective CE information shown in the experiment Durability in the Energy (likewise in the Ecolabel for clothes) was shown using a lsquohandshakersquo icon and durability in years (months for smartphones) Reparability was shown using a lsquospanner and screwdriverrsquo icon with a reparability rating from A-G Clicking on the label revealed additional information and definitions of durabilityreparability Durability on EU labels was defined as The period in which the manufacturer promises to replace or repair the product free of charge
Reparability on EU labels was defined as Ease-of-repair rating based on availability of repair manuals spare parts and repair services
The handshake icon shown in this figure is different from the one seen by respondents in the experiment for
copyright reasons
Source LE Europe analysis of behavioural experiment
This analysis shows that overall respondents chose products with the best mix of
durability and reparability when durability and reparability information was
shown together In fact providing both types of information was associated with the
largest proportion of respondents with high CE preferences and the joint lowest
proportion of respondents with low CE preferences
The figure above confirms the finding that providing information is important to
induce more environmentally friendly choices Respondents who saw either
durability or reparability information or both durability and reparability information
together were significantly more likely to display a high CE preferences and significantly
less likely to display a low CE preferences
Behavioural Study on Consumersrsquo Engagement in the Circular Economy
163
Durability information seemed to be the main driver of CE decisions The impact
of durability information on its own was statistically significantly larger than the impact of
reparability information alone Furthermore durability information provided some
additional impact beyond the impact of reparability information The reverse however
was not the case The proportions of high and low preferences were not statistically
different when durability was provided by itself or together with reparability information
Taking these findings together with findings from the literature stakeholder consultations
and focus groups seems to suggest that durability is perceived as a substitute for
reparability This is because a durable product could be seen as a high-quality product
which would not require repair thus making the ease of repair of the product irrelevant
Instead reparability on its own does not substitute for the need of product durability
Results from regression analysis
As a robustness check of the above results regression analyses were used to analyse the
preferences for durability and reparability and the general CE preferences further
including controlling for socio-demographics country specific effects and personal
attitudes See below for results
Behavioural Study on Consumersrsquo Engagement in the Circular Economy
164
Table 49 Results from ordered logit regression on durability reparability and general CE preferences
Outcome variable Durability preferences Reparability preferences General CE preferences
(1) (2) (3) (4) (5) (6)
Information treatment - Baseline No information given
Durability info only in EU label 5047 5282
0770 0780
3345 3521
(1200) (1232)
(-211) (-199)
(705) (731)
Reparability info only in EU label 0677 0671
2883 2975
2255 2308
(-297) (-303)
(871) (891)
(456) (467)
Durability and reparability info in EU label 2983 3014
1433 1422
3501 3501
(831) (836)
(302) (294)
(735) (733)
Manufacturers guarantee 5637 5986
0847 0857
3541 3721
(1327) (1360)
(-136) (-125)
(759) (780)
Expected Lifetime 6714 6882
0780 0775
3525 3530
(1446) (1470)
(-201) (-205)
(742) (745)
Label type treatment - Baseline Mini label
Full label 0976 0970
0915 0912
0907 0907
(-033) (-042)
(-124) (-129)
(-110) (-109)
Behavioural nudges treatment ndash Baseline No claim
Savings claim 1223 1215
0954 0942
1120 1105
(229) (219)
(-054) (-069)
(105) (092)
Social claim 1105 1096
1144 1132
1216 1208
(112) (101) (157) (143) (180) (171)
Country controls
Socio-demographics (age gender etc)
Personal attitudes (pro-CE pro trends etc)
Notes Odds ratio (exponentiated coefficients) reported t statistics in parentheses p lt 005 p lt 001 p lt 0001 N = 6042 for all regressions
Source LE Europe analysis of behavioural experiment
Behavioural Study on Consumersrsquo Engagement in the Circular Economy
165
The regression analyses confirmed the results reported above When looking at the
information treatment clearly respondents reacted to the treatment Providing
information about durability increased the likelihood that a respondent showed a high
durability or general CE preference Similarly showing reparability information increased
the likelihood that a respondent showed a high reparability or CE preference
Furthermore these results were robust to including other control variables namely
country effects socio-demographics and personal attitudes
Additional analyses of interaction terms between different treatment types and between
treatments and personal characteristics (socio-demographics and personal attitudes) did
not show any systematic patterns Thus it can be concluded that the treatments were
entirely responsible for the shifts in CE preferences and that the effectiveness of the
different treatments was equivalent across the Member States analysed here as well as
for different types of consumers (ie the treatments worked equally well for richer and
poorer respondents as well as for respondents with more or less pronounced pro-CE
attitudes) This is an important finding for policy interventions since EU-wide activities
would be expected to be effective across the different cultural and socio-economic
contexts of the various Member States
Summary of findings
In summary it can be concluded from the behavioural experiment that the provision of
durability and reparability information is vital for encouraging decision-making which
takes into account CE product characteristics The consumer survey indicated (see
section 34) that individuals look for information regarding how long their products are
likely to last as well as how easy they are to repair However often individuals find this
information difficult to find The behavioural experiment has delivered powerful evidence
that actual purchasing decisions might be strongly driven towards more CE-friendly
products when information especially on durability but also on reparability information is
provided in concise and comparable ways
Showing information on CE characteristics was effective for different types of
respondents as well as for different Member States regardless of differences in
demographic profiles personal CE attitudes and economic situations This indicates that
policy interventions would likely be similarly effective across various EU Member States
652 Willingness to pay for durability and reparability
An alternative way of looking at respondentsrsquo decision-making is to consider willingness
to pay (WTP) Willingness to pay shows the monetary amount that respondents were
willing to spend on additional durability or reparability The WTP amounts were derived
through a choice modelling approach (see the Annex for further methodological detail)
This approach takes advantage of choice data collected across all participants who saw
different choice sets
Table 50 shows the willingness to pay for an additional year or month of durability The
first row shows overall willingness to pay whereas the subsequent rows show willingness
to pay depending on the type of durability information It should be noted that the yearly
WTP figure for smartphones is derived from the monthly figure which was the estimate
derived directly from the data (since for smartphones durability was presented in months
rather than years in the choice task) While this is a reasonable extrapolation it does
imply an assumption namely that the relationship between WTP and length of durability
is linear (ie each extra month has the same value) which may or may not be a
reasonable assumption
Behavioural Study on Consumersrsquo Engagement in the Circular Economy
166
Table 50 Willingness to pay for durability (in euro per yearmonth of additional durability)
Vacuum
cleaners
Dish-
washers
TVs Smartphones Coats
Year Year Year Month Year Year
Overall
willingness to pay
(WTP) in the
experiment
1911 2053 7288 1033 12394 1354
Willingness to pay in different information treatment conditions
WTP when no
CE information
was shown[1]
Not statistically significant[2]
WTP when
durability
information
was shown on
EU label
3315 3005 12628 1478 17731 1778
WTP when
durability and
reparability
information
were shown
on EU label
2028 3112 9179 1232 14788 1396
WTP when
manufacturer
warranty was
shown
3288 3271 12783 1750 21004 2379
WTP when
expected
lifetime was
shown
3576 3591 14830 1812 21739 2727
Notes Willingness to pay for an additional month or year of product durability Respondents making decisions on smartphones originally saw durability in months Willingness to pay was multiplied by 12 to arrive at a willingness to pay for an additional year of durability this assumes linearity in willingness to pay
3612 respondents made decisions on vacuum cleaners 3605 on dishwashers 3627 on TVs 3638 on smartphones and 3644 on coats
[1] No CE information shown means no durability and no reparability information shown
[2] Respondents had no significant willingness to pay for durability when they were not shown any durability information This result might seem trivial yet it is an important sense check of the overall setup of the experiment which thus seems valid
Source LE Europe analysis of behavioural experiment
Overall willingness to pay across all respondents ranged from euro1354 for an
additional year of durability for coats to euro7288 for an additional year of
durability for TVs and euro1478 per month or euro12394 per year (derived from the
monthly figure) for smartphones
This comparison across products however should not be given too much importance
This is because the estimates of willingness to pay are not only determined by the
Behavioural Study on Consumersrsquo Engagement in the Circular Economy
167
importance of durability in decision-making but also by other factors especially the price
ranges presented in the choice experiment These were calibrated based on actual
market prices and varied significantly across the products Willingness to pay is inflated
by a larger variation in prices or a smaller variation in durability This explains why the
willingness to pay for smartphones is relatively large (large variation in price small
variation in durability) whereas the willingness to pay for vacuum cleaners is relatively
small (small variation in price large variation in durability) Even if consumers attached
the same importance to durability in decision-making across products the willingness to
pay is expected to be different across products if market conditions differ
Comparing willingness to pay across different ways of presenting CE information
but within each product category is more informative This comparison corroborates
many of the previous findings Firstly respondents required information on product
durability to be willing to pay for it164 Durability information provided via
manufacturer warranties or as an expected lifetime was most effective
Willingness to pay for additional durability was highest for all products when expected
lifetime was shown (respectively euro3576 (vacuum cleaner) euro3591 (dishwasher)
euro14830 (TV) euro21739 (smartphone) and euro2727 (coat) for an additional year of
durability) For all products except vacuum cleaners the manufacturer warranty was
associated with the second highest willingness to pay For vacuum cleaners showing
durability information on its own on an EU label proved second most effective with a
willingness to pay equal to euro3315
As before it must be noted that the differences between the manufacturer warranty and
expected lifetime on the one hand and durability information on its own on an EU label
on the other were minor For example the willingness to pay for durability for
dishwashers was euro3005 when durability information was shown on an EU label It was
only euro266 higher when information was shown as a manufacturer warranty
The effectiveness of information provided on an EU label was again similar to providing
information outside the EU labels In general WTP for additional durability was often
lower in the EU label conditions compared to showing durability outside of the EU label
For all products except dishwashers the willingness to pay for durability was lowest when
reparability was shown in addition to showing durability information This again suggests
that showing both pieces of information triggers difficulty for respondents when they
need to consider and trade-off information on different CE characteristics
Willingness to pay was also estimated for reparability Section 272 shows how
reparability was ranked on an A to G scale with lsquoArsquo being the most easily repaired
product More precisely products could be assigned the following rankings A C E or G
Therefore willingness to pay shows the monetary amount that respondents were willing
to pay for increasing the reparability of a product by two levels eg increasing
reparability from C to A or from G to E Table 51 provides the results
164 It is important to note that respondents had no significant willingness to pay for durability when they were not shown any durability information This result might seem trivial yet it is an important sense check of the overall setup of the experiment which thus seems valid
Behavioural Study on Consumersrsquo Engagement in the Circular Economy
168
Table 51 Willingness to pay for reparability (in euro per two-level improvement on A-G
scale)
Vacuum
cleaners
Dish-
washers
TVs Smart-
phones
Coats
Overall willingness to pay
(WTP)
1061 2075 3360 2033 673
Willingness to pay in different information treatment conditions
WTP when no information
was shown[1] Not statistically significant[2]
WTP when reparability
information was shown on
EU label
5424 10494 17058 9770 2987
WTP when reparability and
durability information were
shown on EU label
2856 8256 7648 4739 1042
Notes Willingness to pay for an increase of the productsrsquo reparability score (A-G) by two levels eg an increase from C to A
3612 respondents made decisions on vacuum cleaners 3605 on dishwashers 3627 on TVs 3638 on smartphones and 3644 on coats
[1] No information shown means no durability and no reparability information shown
2] Respondents had no significant willingness to pay for reparability when they were not shown any reparability information This result might seem trivial yet it is an important sense check of the overall setup of the experiment which thus seems valid
Source LE Europe analysis of behavioural experiment
The first row in Table 51 shows the overall willingness to pay for reparability It presents
an average of the willingness to pay presented in the last three rows and thus willingness
to pay pooled across all information designs According to these figures respondents
were willing to pay between euro673 and euro3360 for an increase in reparability
score by two levels This figure however is influenced by the fact that most
respondents did not see any type of reparability information in the experiment As
argued in more detail below respondents who did not see reparability information were
(logically) not willing to pay for it This lowered the overall willingness to pay
Looking at specific ways of presenting relevant information again it appears to be most
important to provide information on product reparability at all165 When relevant
information was provided respondents were willing to pay for ease of repair
Furthermore the willingness to pay for reparability was highest when reparability
information was provided on its own (respectively euro5424 (vacuum cleaner) euro10494
(dishwasher) euro17058 (TV) euro9770 (smartphone) and euro2987 (coat) for an increase of
two levels in reparability score) and not together with durability information
Willingness to pay also provides an opportunity to look at the relative importance of
durability and reparability in respondentsrsquo decisions Table 52 shows the willingness to
pay for durability and reparability for respondents that were shown both types of
165 The experiment did not test different ways of presenting reparability information It only tested whether the inclusion of reparability information using a screwdriver and spanner icon combined with an A-G scale had an impact on respondentsrsquo decision-making behaviour
Behavioural Study on Consumersrsquo Engagement in the Circular Economy
169
information on an EU label These were the only respondents that were given both types
of information
Table 52 Willingness to pay for durability (in euro per yearmonth additional durability) and
reparability (euro per two-level improvement on A-G scale) when both types of information
are shown
Vacuum
cleaners
Dish-
washers
TVs Smartphones Coats
Year Year Year Month Year Year
Willingness to pay for
more durability
2028 3112 9179 1232 14788 1396
Willingness to pay for
better reparability
2856 8256 7648 4739 1042
Notes Willingness to pay for additional month or year of product durability and willingness to pay for an increase of reparability score of two levels Respondents making decisions on smartphones originally saw durability in months Willingness to pay was multiplied by 12 to arrive at a willingness to pay for an additional year of durability
Willingness to pay for respondents that were shown durability and reparability concurrently on an EU label
595 respondents made decisions on vacuum cleaners 607 on dishwashers 605 on TVs 600 on smartphones and 593 on coats Results have been weighted to be EU-wide representative
The table shows that the relative importance of durability and reparability varies between
products For vacuum cleaners and coats the willingness to pay for both CE
characteristics (ie one year or month of durability and a two-level improvement on the
A-G reparability scale) was the same order of magnitude For dishwashers and
smartphones166 reparability was the more important characteristic in terms of
willingness to pay For TVs willingness to pay was higher for durability than for
reparability
653 Effectiveness of behavioural nudges
The experiment also tested the effectiveness of small behavioural lsquonudgesrsquo These were
introduced as claims shown on pop-up screens prior to each experimental round for
participants in the respective treatments See section 272 for further details and
screenshots of the experimental environment Some respondents were shown the claim
that longer lasting products might save money in the long-run (Savings claim)167 Other
respondents were shown the claim that a majority of people chose longer lasting and
more easily repairable products (Social claim)168 These two groups are compared with
the group of respondents that did not see any claim
Claims can be seen as an extension of information provided to respondents Information
in the previous section dealt with product characteristics The claims analysed in this
section relate more to information about the context in which a decision was made
Social nudges have been shown to work as small and cost-effective interventions which
in similar interventions increased for example timely tax collection rates energy
conservation or even high-stakes enrolment into job training169 For the savings claim
166 For smartphones the comparison between willingness to pay for durability and reparability is most appropriate using willingness to pay for an additional month of durability This is the framing that respondents saw in the experiment
167 The exact claim was ldquoProducts that last longer may save you money over timerdquo
168 The exact claim was ldquoA majority of people choose products that last longer and are easier to repairrdquo
169 See The Behavioural Insights Team (2015) EAST Four simple ways to apply behavioural insights available at httpwwwbehaviouralinsightscoukwp-contentuploads201507BIT-Publication-EAST_FA_WEBpdf
Behavioural Study on Consumersrsquo Engagement in the Circular Economy
170
the qualitative work for this study found that the decision to purchase products was to a
large extent driven by money-saving motives and the following tests verified whether
this could be used to enhance CE purchasing decisions
Figure 47 shows the distribution of durability preferences for the different groups of
respondents who saw different claims Note that only respondents who saw some form of
durability information are included Respondents who did not see durability information
would not be able to adjust behaviour based on the claim they saw
Figure 47 Durability preferences for different claims shown to respondents
Notes includes only respondents that saw some form of durability information
1376 respondents saw no claims 1325 respondents saw claims about long-term savings and 1353 saw social claims
Both types of claims led respondents to purchase more durable products
compared to when the respondents saw no claims There was a statistically
significant decrease in the proportion of respondents with a low durability preference
when either a savings or social claim was shown Furthermore the proportion of
respondents with a high durability preference was statistically significantly higher for
respondents having seen a savings claim compared to respondents having seen no claim
The proportions of respondents with intermediate preferences were not statistically
different for different claims Regression analysis showed however that these results
were not robust once other factors were taken into account (see regression results in
previous sub-section) Therefore the effectiveness of claims was rather limited compared
to other treatments
In general the claim about savings was ndash slightly ndash more effective than the social claim
However the distribution of durability preferences did not differ significantly between the
two types of claims
Claims seemed to only have negligible effects on the preferences for
reparability and general CE preferences There were no statistically significant
Allcott (2011) lsquoSocial norms and energy conservationrsquo Journal of Public Economics Coffmann et al (2017) lsquoCan Social Information Affect What Job You Choose and Keeprsquo American Economic Journal Applied Economics
Behavioural Study on Consumersrsquo Engagement in the Circular Economy
171
effects detected on reparability or general CE preferences in the conditions with claims
compared to the baseline without a claim
Overall these experimental tests seem to suggest that communication which underlines
the importance of CE characteristics in the purchasing process may increase consumersrsquo
interest in the CE In particular considering the shift in purchases of products with low to
those with high durability it seems that once individuals become interested in durability
they seek to purchase the most durable products instead of products with very low
durability At the same time looking at the large and stable share of respondents who
purchased products with intermediate durability it appears that there are parts of the
population who do not engage as much with the CE and do not change their purchasing
decisions in meaningful way
Although the experiment shows that nudges have an immediate if small effect on
durability it is silent on long-term effects If claims were shown to consumers eg only
for specific project which consumers purchase infrequently we would expect the effects
in real markets to align with the effects in our experiment If on the other hand claims
would be shown more frequently (eg on product descriptions for many types of
products) it is likely that the effect of claims decreases over time as people become used
to the claims made Alternatively repeated exposure might also reinforce the message
and its effectiveness The experiment cannot provide an answer to this question because
it was only set within a 15-minute timeframe
654 Other factors that influenced CE behaviours in purchasing decisions
Besides information on CE characteristics and claims the experiment also tested whether
the look and feel of the tested EU labels made a difference in respondentsrsquo CE behaviour
As noted before (screenshots of this treatment are shown in section 272) some
respondents saw a lsquomini labelrsquo of the EU Energy Label170 This was a reduced version of
the standard EU Energy Label but still included the most relevant information Others
saw a lsquofull labelrsquo which showed all the relevant information in the common EU Energy
Label format Both the lsquofullrsquo and the lsquominirsquo label were simplified versions of the real EU
Energy Label The lsquofullrsquo label did not display information which is currently displayed on
the Energy Label such as energy consumption in kilowatt hour or noise levels in decibel
Choices for durability and reparability did not differ171 between respondents
being shown a full or mini label One potential explanation for this might be that the
mini label contained all the information that was relevant for decision-making At the
same time it appears that additional information presented in the full label did not deter
respondents from acting on relevant information This is an encouraging finding since the
EU Energy Label for example carries a wealth of other non-CE related information The
experiment seems to suggest that individuals can to some extent abstract from other
information and still act on the CE characteristics
Another reason why the different ways of presenting the label had no impact might relate
to the fact that very few participants engaged with the labels further by clicking on them
Unless the labels were clicked on respondents would not have seen further explanation
about the label content Similar shares of respondents clicked on either the lsquofullrsquo or the
lsquominirsquo label For any given product only around 13 of respondents clicked a label172
Across all products this resulted in 31 of respondents clicking on at least one label
Therefore 69 of respondents did not show interest in obtaining more information about
170 Note that this is not relevant for decisions made on coats As noted in Section 272 the EU Ecolabel was used for coats and no distinction between lsquofullrsquo labels and lsquominirsquo labels was made
171 Two-sided pairwise z-tests of proportions showed no statistically significant differences between proportions for high intermediate or low preferences for durability reparability or overall CE This result was shown to be robust in ordered logit regression analysis
172 The exception is coats 17 of respondents making decisions on coats clicked a label Coats where the only product employing the EU Ecolabel rather than the EU Energy Label Arguably the former label is not as well-known explaining why respondents searched for additional information more often when making decisions on coats
Behavioural Study on Consumersrsquo Engagement in the Circular Economy
172
the labels These engagement rates with additional information are in line with previous
behavioural studies in other markets173 and further underline that information
presented must be relevant intuitive and salient at all stages to be impactful
The fact that different types of labels did not generate different CE behaviour is
comforting since the mini label and full label tend to be employed in different contexts
Mini labels are often used in online environments whereas full labels tend to be adopted
in brick-and-mortar shops The results of the experiment show that these different
market practices should not create different outcomes
Lastly a number of personal characteristics were tested for their effect on CE behaviour
in purchasing decisions These included standard demographic characteristics ndash such as
gender age and educational attainment ndash but also characteristics directly relevant to the
CE ndash such as attitudes towards recycling second hand products and durability and
reparability These personal characteristics did not play a major rule in driving
purchasing decisions For most personal characteristics no robust links to preferences
for CE-friendly products were found
An exception were attitudes towards fashion and trends in relation to the preference for
durability Respondents with a low preference for fashion and trends were significantly
and robustly more likely to have a higher durability preference
173 European Commission (2017) lsquoStudy on consumersrsquo decision-making in insurance services A behavioural economics perspectiversquo a report prepared by LE Europe VVA Europe and Ipsos
Behavioural Study on Consumersrsquo Engagement in the Circular Economy
173
CONCLUSIONS AND SUGGESTIONS FOR FUTURE POLICY ACTION
Behavioural Study on Consumersrsquo Engagement in the Circular Economy
174
7 Overall conclusions
The transition to a more Circular Economy in the European Union is picking up pace The
number of initiatives to stimulate this transition are increasing both top-down from
public authorities through policy actions as well as bottom-up led by industry initiatives
at company or cross-sectoral level At EU level the EU Action Plan for the Circular
Economy adopted in December 2015 has led to concerted policy and regulatory efforts
in various sectors and areas in order to stimulate a more Circular Economy Due to key
principles in (EU) environmental policy such as the polluter pays and producer
responsibility as well as the premise that the Circular Economy can save businesses
money many of the Circular Economy actions (to date) have had a production or supply
side focus Yet for Circular Economy activities to be successful the consumption
demand side needs to be equally well understood To date the consumer perspective on
the Circular Economy has not received as much research attention
This study aimed to fill this gap in the Circular Economy literature by investigating to
what extent consumers currently already engage in Circular Economy practices and what
determines their engagement with a focus on product durability and reparability Making
products more durable and easier to repair can extend their useful lives and increase
their utilisation As a result fewer products are needed to satisfy a similar level of
demand which results in lower use of resources and less waste generation
From a consumer perspective actions that extend the lifetime of products include
purchasing more durable products repairing products when broken and giving products a
second life by selling them in the second hand market Increasing the utilisation rate of
products can also be achieved through rentingleasing models Renting or leasing is
especially useful for products that people only use occasionally These options are
presented in Figure 48 for two types of consumer demand
Type 1 Demand for a functional replacement or equivalent for a product the
consumer already owns (but is defective) and
Type 2 Demand for a new product that they do not yet possess
The options for the first type are repair or replacement with a new or second hand
product The second type can only be satisfied by a new or used product (in ownership)
or through rentalleasing
Figure 48 Consumer choices in the Circular Economy and factors that influence their
decision-making process
To understand what influences consumer behaviour the study explored self-declared
attitudes towards the Circular Economy Additionally the study tested the
effectiveness of providing information on product reparability and durability and
what drives the decision to repair a defective product Furthermore it assessed the
Behavioural Study on Consumersrsquo Engagement in the Circular Economy
175
effects of nudging and the framing of information on purchasing and repair
decisions The study focused mainly on five products - vacuum cleaners dishwashers
televisions smartphones and clothing
The study used a comprehensive set of research methods (see section 2 for more
details)
A systematic literature review was undertaken spanning academic policy and
grey literature across the EU 28 Norway Iceland and four other non-European
countries (ie Canada Switzerland Japan and the United States)
Consumer focus groups were conducted in Ireland Germany Sweden and the
Czech Republic to explore consumersrsquo awareness understanding and expectations
with regard to Circular Economy practices including views from potentially vulnerable
consumers174
Stakeholder consultations with 50 experts from eg business and consumer
associations NGOs public authorities and academia were used to close gaps in the
literature and collect additional evidence
An online consumer survey was undertaken in 12 Member States namely in
Austria the Czech Republic France Germany Hungary Ireland Latvia the
Netherlands Portugal Romania Spain and Sweden with approximately 1000
respondents in each country who were representative of the general population in
terms of age gender and geographic region The survey collected information on
consumersrsquo experiences with CE practices such as repairing renting leasing and
purchasing second hand products their reasons behind engaging in the CE (or not)
as well as general socio-demographic characteristics and self-declared attitudes
towards the CE
The survey was complemented with two behavioural experiments in 6 of the 12
Member States (ie the Czech Republic Germany Ireland Romania and Sweden)
The respondents conducted exercises relating to their purchasing behaviour of new
products and their decisions whether to repair or replace a defective product
they already owned
The study conclusions are set out in the following way
Section 71 concludes on understanding consumer engagement in the Circular
Economy and
Section 72 on factors influencing consumer decision-making in the Circular Economy
71 Understanding consumer engagement in the Circular Economy
One objective of the study was to collect information on what consumers across the EU
most associate with lsquodurablersquo and lsquorepairablersquo products The study therefore addresses an
important gap in the Circular Economy literature This is because durability and
reparability are terms that can easily be given multiple interpretations if not defined
accurately
Most respondents reported being able to lsquouse a product for a long timersquo (57) and lsquothe
product staying in perfect working order for a long timersquo (56) as the most relevant
durability attributes This was in line with the limited existing literature which states that
consumers mainly link durability to a productrsquos performance over time Survey
respondentsrsquo understanding of reparability was instead best described by lsquospare parts
being available for the productrsquo (46) and the lsquopossibility to have the product repaired
by a repair firmrsquo (44)
Beyond these associations the study uncovered that the current state of consumer
engagement in the Circular Economy is characterised by a high willingness to act in line
with the Circular Economy but actual engagement is still rather low
174 Vulnerable consumers were defined as people who are in arrears with household bills or who struggle from time to time with household bills and are in any of the following situations unemployed retired long-term sick or disabled or single parents
Behavioural Study on Consumersrsquo Engagement in the Circular Economy
176
Consumers claim to be willing to engage in Circular Economy activities
The consumer survey found that most EU consumers claim to frequently engage
with the Circular Economy The majority of survey respondents reported that they
keep things they own for a long time (93) recycle unwanted possessions (78) and
repair possessions if they break (64) (see section 34) Respondents also reported that
their peers display similar levels of engagement in the Circular Economy
A lower yet substantial proportion of respondents reported being willing to
engage with novel Circular Economy practices such as leasing products or
buying second hand products The share of consumers who reported they were
interested in leasing varied across product groups between10 for vacuum cleaners
compared to 25 for mobile phones Overall around one in three consumers claim to
buy second hand products (see Section 34)
Previous research has found that consumersrsquo willingness to engage in Circular Economy
activities differs with the nature of the product That is consumers are more likely to buy
a durable product repair or lease a product for more expensive and less lsquofashion-
dependentrsquo items The focus groups and interviews confirmed these findings with
participants reporting that they would be particularly willing to buy durable or to
lease white goods (eg dishwashers) For more fashion-dependent items (smart
phones and clothing) respondents reported they would however be more willing to
purchase second hand compared to other products
A majority of respondents also claimed to be aware of the durability of products they
purchased (64) as well as repair services (58) Respondents reported that they
frequently looked for durabilityreparability information on products (62 for durability
and 55 for reparability) Respondents however often felt that this information was
difficult to find and that they would like better information on these features
These findings are in line with previous research which finds that consumers are
generally willing to engage in sustainable consumption and that this is particularly driven
by their concerns about the environment
However consumersrsquo actual engagement with repairing renting or leasing was found to
be low
Contrasting the high levels of self-claimed willingness to engage in the Circular Economy
there are still many consumers who have in the past not behaved accordingly The
consumer survey and experiment both showed that most consumers repair products
when they break (around 63) Yet the share of consumers who have not
repaired products after they broke was still substantial 36 on average across
the analysed products The highest non-repair rate was observed among Dutch survey
participants (on average 56) while the lowest was observed among Romanian
participants (on average 25) Age and other socio-demographic factors did not play an
important role with respect to repair behaviour
Those who had repaired a product had generally used a professional repair service (eg
26 used a repair service 17 had the product repaired by the manufacturer) Some
respondents especially for clothing items reported that they had decided to self-repair
24 for clothing 18 for vacuum cleaners 13 for dishwasher 6 for mobile phones
and 2 for televisions
Similarly despite a relatively high level of interest in novel Circular Economy practices
(see section 3) the consumer survey found that only a limited proportion of respondents
had ever leased products or purchased second hand And only between 5 and 9 of
respondents had bought a second hand vacuum cleaner dishwasher TV smartphone or
clothing Both the survey and experiment found that buying second hand is more likely
for smart phones and clothes (20) compared to the other products tested (13-14)
Even fewer 1 to 3 had rented or leased a product Observations from the
behavioural experiment support the self-reported survey findings Only 10 to 20 of
experiment participants decided to purchase a second hand product to replace a
defective product within the experiment all others preferred buying brand new
replacements These findings indicate that there is a large potential in closing the gap
between willingness to engage and actual engagement
Behavioural Study on Consumersrsquo Engagement in the Circular Economy
177
Many consumers expect products especially expensive products to last a long time
What consumers associate most with lsquodurabilityrsquo and lsquoreparabilityrsquo was roughly consistent
across different types of products At the same time consumers have different
expectations regarding how long different products should last Focus group
participants and survey respondents reported a wide range of life-time expectations for
the different products of the study such as
For vacuum cleaners 27 of survey participants expected a lifespan of between 4
and 7 years with another 27 who indicated an expectation of 7 to 10 years
For dishwashers the lifespan expectations were higher with 29 indicating that they
expected a lifespan between 7 and 10 years and another 29 with an expectation of
10 to 15 years
Similarly 31 indicated they expected a television to last for 7 to 10 years and
another 28 stated their expectation lay within the range of 10 to 15 years
For mobile phones and clothing items lifespan expectations were lower 38
expected a lifespan between 2 and 4 years for mobile phones and 35 indicated an
expected lifespan of 4 to 7 years For clothing 25 expected a lifespan between 2 to
4 years and a similar share between 4 to 7 years
Most consumers expect that repairing products is possible and easy to arrange
The survey found that there were two large groups of consumers One group who has
experience with repairing goods (63) and one who does not (36) The experienced
group was also more likely to expect that repairing would be possible and easy to
arrange The latter group who lacked experience with repairs seemed to have low
expectations regarding whether repairing goods would be worthwhile or even possible
Specifically for all five product categories a substantial majority of survey respondents ndash
ranging from 77 for coatsjackets to 90 for dishwashers ndash thought it would be
possible for these products to be repaired either by themselves or by someone else
on their behalf Most consumers expected it to be possible to have the products repaired
by a third party (ie friends and family professional repair services) However a non-
negligible minority between 10-23 either did not feel or know whether
repairing a product would be possible
Such inexperience coupled with low awareness of repair options likely obstructs the
potential for further engagement with Circular Economy practices Indeed some
interviewed stakeholders felt that consumersrsquo negative experiences with or expectations
regarding repair services acted as a barrier to the use of such services
However survey respondents typically expected a good level of service from
repair providers175 a majority would expect the service to be ldquofairlyrdquo or ldquoveryrdquo good in
terms of convenience (85) speed (82) friendliness (89) and quality of the repair
(92) Moreover the survey also suggests that actual experiences with repair services
were largely positive In most cases respondents reported their expectations were met
when having a product repaired (over 70) and in some cases even exceeded
Therefore it is likely that some especially inexperienced consumers might wrongly
expect repair services to perform poorly which prevents them from using such services
more often
72 Factors influencing consumer decision-making in the Circular Economy
The previous section established what current consumer engagement in the Circular
Economy is regarding how willing and likely they are to buy durable repair lease or
purchase second hand products Building upon this information this section draws
conclusions on what can enhance or inhibit such Circular Economy practices The figure
below provides an overview
175 No distinction was made here between independent repair services and manufacturer provided repairs
Behavioural Study on Consumersrsquo Engagement in the Circular Economy
178
Figure 49 Factors that influence consumersrsquo choice to replace repair or lease products
Price quality and convenience are most important for consumer decisions
A range of behavioural factors influence consumer decisions Survey respondents ranked
product quality and price as the two most important factors influencing their product
choice followed by product durability and reparability whether repair services exist and
environmental aspects Brands and trends (fashion or technological) were rated as less
important by survey respondents though the literature and focus groups frequently
pointed to these factors as being important While the survey often found that there were
differences between product categories price and quality were very important for all
products
The provision of durability information at the point of sale on for example a product
label and the use of behaviourally informed nudges have the potential to encourage the
selection of more durable products For example better information on the durability of a
product could increase the valuerelative weight of the productsrsquo environmental
characteristics on the purchasing decision (see Figure 50)
Figure 50 Providing durability information can influence the relative importance of price
in purchasing decisions
Overall all strands of research found that consumers lack information on product
durability and reparability Although survey respondents generally reported searching
for information on productsrsquo durability and reparability many including consumers in the
focus groups indicated that such information was difficult to find and that they had a
Behavioural Study on Consumersrsquo Engagement in the Circular Economy
179
desire for receiving better information This pattern of searching for information but
finding it difficult to find or understand was especially pronounced for older respondents
Consumers in the survey and focus groups reported that they were interested in seeing
durability information on product labels or via extended product warranties Some also
reported using brand reputation as an indicator of product durability Regarding
reparability information consumers would like to receive information on the availability
of spare parts repair services and the applicability of extended product warranties
The provision of durability and reparability information was found to be
effective in encouraging the purchase of more durable and repairable products
These findings indicate that the current state of information provision regarding product
durability and reparability might be a potential barrier for engaging in the Circular
Economy Provision of information in a consistent and straightforward format could help
in reducing this barrier
Providing information on product durability and reparability shifts purchasing decisions
towards products with better Circular Economy credentials
The behavioural experiment showed that giving respondents information on product
durability can have a substantial impact on purchasing decisions In a simulated
purchasing task with streamlined product information provision of durability
information increased the participantsrsquo preference for high durability products
almost threefold Provision of reparability information more than doubled the
preference for products with a high level of reparability Both these effects were
highly statistically significant Durability information was most effective when provided as
lsquomanufacturer warrantiesrsquo or lsquoexpected lifetimesrsquo176 EU labels (ie an augmented EU
Energy or Ecolabel with an added durability commitment icon or reparability icon and
rating A-G) were similarly effective177
General Circular Economy preferences were strongest when durability and reparability
information was presented together That is when durability and reparability
information was shown together individuals were most likely to purchase
products which rated high in both dimensions ndash durability and reparability
Durability was however the more influential factor on consumer decisions In the
experiment durability information provoked the strongest shifts in preferences while
reparability only marginally led participants to choose products with overall better CE
credentials
The findings were corroborated by showing significant willingness-to-pay for better
durabilityreparability for all product categories Depending on how
durabilityreparability information was presented willingness-to-pay for an additional
year of durability ranged between euro20-36 for vacuum cleaners and dishwashers euro92-148
for TVs euro148-217 for smartphones178 and euro14-27 for coats Willingness-to-pay for an
improved reparability179 rating was around euro29-54 for vacuum cleaners euro83-105 for
dishwashers euro77-171 for TVs euro48-98 for smartphones and euro10-30 for coats
176 lsquoManufacturer warrantyrsquo and lsquoExpected lifetimersquo were not explained or defined further in the experiment It is a common market practice for manufacturers and retailers to display durability claims beyond the legal guarantee of 2 years in this way Manufacturer warranties and expected lifetimes may be seen as a service to consumers or a possible signal for quality but the experiment remained silent about the precise meaning
177 Durability on EU labels was defined as The period in which the manufacturer promises to replace or repair the product free of charge
Reparability on EU labels was defined as Ease-of-repair rating based on availability of repair manuals spare parts and repair services
Around 31 of participants have clicked on the labels to enlarge these to include these additional definitions
178 Willingness-to-pay for additional durability of smartphones was measured in months and subsequently extrapolated to years A linear relationship between time and willingness-to-pay was assumed (ie each extra month has the same value)
179 The willingness-to-pay was measured per year for durability and per two-step increase on the A-G scale for reparability(eg from G to E C to A)
Behavioural Study on Consumersrsquo Engagement in the Circular Economy
180
The finding that durability information had a larger impact on respondentsrsquo choices in the
experiment than reparability information is in line with the findings from the survey
focus groups and literature Based on the survey findings this may be because
consumers said they trusted manufacturersrsquo warranties did not expect (durable)
products to break or felt that repair would be expensive As such durability is seen by
consumers as a substitute for reparability while the reverse is not the case In this
regard there seems to be divergence between consumer expectations and industry
perceptions because stakeholders representing the industry mentioned that reparability
was seen as a building block of durability by extending useful lifetimes via repairs or
upgrades Thus it might be beneficial to sensitise consumers further regarding the
benefits of easily repairable products to achieve further consumer engagement in the
Circular Economy Informing consumers about the durability benefits of easily repairable
products may help to achieve further consumer engagement in the Circular Economy
Importantly information provision was equally effective in encouraging more CE
behaviour across different types of consumers Its effectiveness was not restricted
to consumers belonging to certain socio-demographic groups or to those having pro-
environmental preferences This is interesting as the likelihood of choosing to repair a
product rather than replacing it did differ across consumer types (see further below and
in section 45)
The shifts in behaviour in the experiment resulted from consumers turning away from
low durabilityreparability products in favour of those with better CE
credentials As usual with experimental findings these effects need to be seen in
conjunction with the experimental setup which consisted of a simplified purchasing
process with streamlined and standardised product information compared to real-world
shopping experiences It is therefore possible that the effectiveness of
durabilityreparability information in reality might be increased or dampened
Information provision at the point of sale likely affects after-sales expectations
In terms of after-sales expectations there were contrasting views uncovered by
the different strands of research Stakeholders reported that consumers have low
expectations regarding product reparability Some focus group participants had the
impression that newer generations of products were less durable than products that were
produced some years ago This discussion around lower durability of newer products
sometimes led participants to mention the concept of planned obsolescence of
products
A joint analysis of the behavioural experiment and the consumer survey revealed that
consumers who have received durability information via manufacturer warranties
or durability promises at the point of sale in the purchasing exercise in the experiment
were significantly more likely to expect free replacement or free repairs of
faulty products Alternatively those who had not seen any information on CE product
characteristics or only information on the reparability of a product were significantly less
likely to expect free rectification of the fault in any way and instead were more likely to
expect to pay for either repair or replacement
These findings further underline the important role product information regarding product
durability and reparability could play in fostering consumer engagement in the Circular
Economy
Many customers try repairing before replacing products but repair decisions are easily
disrupted if arranging repair requires effort
As seen in the previous section a majority of consumers (63) have experience with
repairing products
Those who did not repair products in the past did not do so mainly because they
expected repair to be too expensive (between eg 25 for clothes and 50 for
dishwashers) and preferred getting a new product (17-25 across products) or felt
the old product was obsolete or out of fashion (20 for vacuum cleaners and
dishwashers 25-30 for clothes phones and TVs) Fewer (5-10 across products) said
they did not know howwhere to repair products or felt it would be too much effort to
repair (8-14 across products)
Behavioural Study on Consumersrsquo Engagement in the Circular Economy
181
The behavioural experiment furthermore tested what enhances or inhibits the decision to
repair It revealed that repairs must be easy to arrange as any additional effort could
discourage consumers from attempting repairs In the behavioural experiment the
number of respondents who never chose to repair180 in a repair versus replace choice
increased from 6 to 12 when the repair required minor additional effort compared to
purchasing a replacement product Similarly additional effort led to a decrease in the
proportion of participants choosing to repair from 42 to 35 Even when the effort for
repairing and replacing was identical many respondents still chose to replace the
defective products in the experiment It therefore seems that frictions in the
accessibility of repair services significantly lowered the attractiveness of
repairing while the same type of frictions had virtually no effect on the decision
to replace a product
This illustrates that effort is seen as an important inconvenience or lsquocostrsquo by the
consumer The balance between (perceived) cost and effort of repair can easily tip
consumers to favour replacement This was especially the case for consumers who placed
high importance on trends or fashion
Repairs which were framed as using lsquooriginal parts onlyrsquo compared to lsquooriginal and non-
original partsrsquo were slightly more attractive while consumers were indifferent
between whether the repair was provided by the manufacturer or an
independent repair service Other behaviourally motivated mechanisms which did not
change the cost or difficulty of repairing or replacing largely had no effect on choice
Merely framing repair prices as VAT exempt (while keeping prices constant) did not have
meaningful effects on repair decisions overall Such practices seemed to only strengthen
the decisions of certain groups of respondents For example those with pro-
environmental attitudes were even more likely to repair products when repair services
were framed as VAT exempt while those who attributed highest importance to trends
and fashion were further deterred from repairing
Drivers and barriers to renting leasing products and buying second hand
As mentioned before experience with rentingleasing (1) and buying second
hand (6) was rather low in the surveyed population The main reasons for not
having engaged with such practices were that respondents wished to own their
products and generally that they preferred new unused products Similarly
market data from Scandinavian countries showed that consumers would in general be
willing to make some sacrifices to improve Circular Economy outcomes unless it required
sharing goods or letting their own goods be used by other consumers
Among the few respondents who have rented or leased products in the past their
motivations for doing so were mixed Convenience the possibility to test the product the
chance of reusing the product after use or budget considerations all seemed to play a
role
Uncertainty about the quality of second hand products may act as an important barrier to
Circular Economy engagement by consumers Lack of trust in quality of used products
was seen as a barrier by survey respondents and focus group participants to purchasing
second hand products Respondents were more inclined to purchase second hand
clothing and furniture than electronic goods because of concern that used electronics
may break down faster than a new product 14-21 of respondents (across products)
viewed purchasing a new product as better value for money despite second hand
products being available at a lower price
Product durability and reparability are important for consumers as these can save them
money in the long run
180 Respondents repeated the ldquorepair experimentrdquo in which they were given the choice to repair vs replace defective products three times for different products Respondents could thus decide to repair products between 0 (ie never) and 3 times
Behavioural Study on Consumersrsquo Engagement in the Circular Economy
182
While quality and price were given the highest average importance in purchasing
decisions durability and reparability were also important Respondents who ranked
durability as an important factor reported that the top reason for this ranking was that
durable products would save them money in the long run This finding motivated the
experiment to test behavioural lsquonudgesrsquo introduced via pop-up messages during the
purchasing task These nudges had a positive impact on respondentsrsquo purchasing
decisions Informing respondents that they could save money by purchasing products
that last longer was effective in encouraging them to choose more durable products
Telling respondents that a majority of people chose products which last longer and which
are easy to repair was equally effective Nudges however did not influence respondentsrsquo
preferences for choosing products with higher levels of reparability
Even though reparability was relatively less important for purchasing decisions compared
to durability the possibility to save money with easily repairable products again
motivated individuals to engage with reparability so did the desire to keep products for a
long time
Personal attitudes towards the environment influences consumersrsquo engagement in the
Circular Economy
In the present study personal self-declared attitudes towards the Circular
Economy were largely consistent with actual engagement in the sense that
consumers who self-rated themselves as having pro-environmental attitudes were also
more likely to repair or purchase second hand products Similarly respondents who
categorised themselves as attaching high importance to fashion and technology were
significantly less likely to repair products These findings might seem trivial but they are
not It is often claimed including by some stakeholders in this study that self-declared
pro-environmental attitudes not necessarily translate into pro-environmental behaviours
Behavioural Study on Consumersrsquo Engagement in the Circular Economy
183
8 Suggestions for future policy action
There are a number of overarching findings that arose from this study
1 EU consumers are willing to engage in the Circular Economy but their actual
engagement is relatively limited This implies there is room to boost Circular
Economy practices further Consumers in the survey and experiment with
positive self-declared attitudes towards the environment acted in line with these
preferences in their actual behaviour Therefore by changing consumer
attitudes and their awareness surrounding sustainable and environmental
behaviours further engagement with Circular Economy practices could be
achieved
2 Key drivers influencing consumersrsquo purchase and replacement decisions were
found to be price quality and convenience Reducing the effort required to
repair products lowering prices and increasing quality of durable products could
therefore lead to more pro-Circular Economy purchasing and repair decisions
3 EU consumers lack information on durability and reparability when making
purchasereplacement decisions and would like to take these aspects into account
Providing this information has proven effective in increasing purchases of
products with higher durability andor reparability in the incentivised behavioural
experiment
These findings lead to a number of policy suggestions for EU and national local policy
makers in order to accelerate the transition towards a Circular Economy The policy
implications guide the structure of this chapter and serve as a taxonomy for classifying
subsequent policy recommendations Each policy implication is followed by a number of
policy recommendations (Figure 51) These recommendations include better
implementation or adaptation of existing instruments as well as suggestions for new
policy instruments
Behavioural Study on Consumersrsquo Engagement in the Circular Economy
184
Figure 51 Overview of key policy implications and recommendations
It needs to be stressed that the recommendations for (future) policy action made in
this section are directly derived from the findings and have not been subject to a
rigorous impact assessment that analyses their impacts effectiveness and efficiency in
reaching overall policy goals181 Before proceeding with concrete policy actions in these
areas it is clear that impact assessments would need to be conducted in line with the
European Commissions Better Regulation Agenda182 Suggestions for topics that should
be subject to additional research are included in section 84
81 Boosting CE engagement by strengthening pro-environmental
attitudes and awareness
To reiterate the conclusion from the previous chapter this study found that most EU
consumers try to keep products for a long time and to repair possessions when they
break Most survey respondents also agreed that it was important to be environmentally
friendly and wanted their friends to know that they cared about the environment At the
same time a substantial share of consumers still does not engage in CE practices 36
had not repaired products in the past and only a limited share of respondents had
actually purchased second hand products (5-9) or rentedleased (1-3) a product
181 Effectiveness = To what extent do the suggested recommendations contribute to reaching an overall policy objective Efficiency = At what costs are the (projected) results (being) achieved
182 httpseceuropaeuinfolawlaw-making-processplanning-and-proposing-lawbetter-regulation-why-and-how_en
bullRecommendation 1
bullBoosting pro-environmental attitudes
bullIncreasing consumer awareness of second hand rentingleasing and repair markets
bullPromoting benefits of durability and reparability
Boosting CE engagement by strengthening
pro-environmental attitudes and
awareness
bullRecommendation 2 ndash Making repair easier
bullMaking essential components in a product replaceable
Including repair instructions for minor defects in user manuals
Ensure the availability of spare parts in the longer run
bullEncourage manufacturers to offer a commitment to repair
bullRecommendation 3 - Create financial incentives for reparability and durability
The importance of price quality
and convenience to
support a Circular
Economy
bullRecommendation 4 - Making durability and reparability information available
bullIntegrate durability and reparability information into labels
bullDevelop a scoring system for reparability of products
bullProvide information on spare parts and repair services
bullRecommendation 5 - Strengthened enforcement of legislation requiring provision of accurate information
Enhancing product
information on durability and
reparability
Behavioural Study on Consumersrsquo Engagement in the Circular Economy
185
The study found that many consumers have a preference for new and fashionable
products or generally a preference for owning new unused products Such preferences
can act as a barrier to second hand purchases and product leasing
As consumers are willing to engage in pro-CE behaviours but their perceptions about
repaired or second hand products are not very favourable improving consumer
awareness and providing information about the advantages of durable products and
product repair may be effective in addressing this lsquopreference for the new and unusedrsquo
Recommendation 1 ndash Boosting CE engagement by strengthening pro-
environmental attitudes and awareness
Environmental awareness and consumer attitudes towards environmental practices are
among the key determinants of sustainable consumer choices
From the study follow at least three specific areas of action which could be taken by
policy makers and industry
1 Boosting pro-environmental attitudes The survey and experiment have
shown that pro-environmental attitudes can translate into pro-environmental
behaviours Consumers with stronger self-rated pro-environmental attitudes were
also more likely to make pro-environmental choices in the incentivised
behavioural experiment as well as in reality Thus strengthening such attitudes
via awareness campaigns could boost further consumer engagement in the
Circular Economy Furthermore strengthening pro-environmental attitudes could
also enhance the effectiveness of information campaigns and point-of-sale
information on product durability and reparability (see Recommendation 4)
The stakeholder interviews pointed out that consumer education is indeed
important and should be more widely employed For example when discussing
clothing a representative of a Dutch consultancy firm considered that educating
consumers on the quality of garments would help them distinguish between more
and less durable products
One way Member States could promote awareness is by focussing on educating
young people by for example including environmental awareness
education within school curricula
2 Increasing consumer awareness of second hand rentingleasing and
repair markets The study identified that consumers are generally willing to
engage in Circular Economy practices but that their actual engagement might fall
short because of an unawareness of how to purchase second hand rent lease or
repair products
Recently there has been an increase in the number of Circular Economy initiatives
and information awareness campaigns platforms at EU and Member State level
An example of this is the European Circular Economy Stakeholder Platform and
several Circular Economy initiatives at national level Similar initiatives could
target more consumer engagement in second hand products renting leasing of
products and repair markets
Repair cafes have been set-up in various cities Self-repair by using for example
modular phones such as the lsquoFairphonersquo have come to consumersrsquo attention
However these types of initiatives are still niche rather than mainstream
Awareness raising about the benefits of second hand products renting leasing
and repair should continue to be promoted to reach wider consumer audiences
In addition to awareness raising programmes additional information on product
durability and reparability could be provided at the point of sale (see
Recommendation 4) Product information could also be provided on how repair
can be arranged and on the availability of spare parts (see Recommendation 2)
3 Promoting benefits of durability and reparability Quality and price were
found to be key factors for consumers when choosing to purchase a product In
the experiment when consumers were informed that durable and more easily
repairable products can save them money in the long-term this information was
effective in steering them towards products of higher durability and reparability
Behavioural Study on Consumersrsquo Engagement in the Circular Economy
186
Policy makers could consider using marketing and behavioural science
strategies (nudging) to improve consumer awareness about the benefits
of durable and easily repairable products This could be done for example
by linking durable and easily repairable products with lsquohigh-qualityrsquo and lsquocost-
savingsrsquo in the long-term Instilling such associations with durability and
reparability could alter social norms towards the purchase of more durable and
more easily repairable products However to make such claims robust evidence
supporting the truthfulness of the claims is required Provision of this evidence
may require additional research
Another option would be to encourage other stakeholders including
manufacturers to conduct these marketing and communication strategies Also
the Circular Economy could be incorporated into the list of funding instrument
priority topics for example within the LIFE Programme183
82 The importance of price quality and convenience in purchasing and
repair decisions
Although consumers attach significant value to the durability and reparability of a
product the productrsquos price and quality often remain key factors determining final
consumer choices From a consumer perspective the total cost of a product also includes
the effort needed to acquire a product repair buy or to rentlease it As a result
anything that changes the price-quality ratio via eg price or ease of accessing the
options in favour of product repairs second hand purchases and rentingleasing
products could be effective in increasing the uptake of these sustainable choices
The following two recommendations could be explored
Recommendation 2 - Making repair easier
The behavioural experiment has robustly shown how easily consumers shy away from
repairs when repairing requires more effort compared to replacing products Beyond
promoting the awareness of repair services (recommendation 1) there are also several
additional ways in which repairs could be stimulated across Europe The following options
could be explored
1 Making essential components in a product replaceable by consumers by
adapting existing legislation Often a product needs to be replaced or sent for
professional repair if an essential component such as for example the battery a
LED light or a motor becomes defective However the study found that there is
a substantial interest in self-repairs 12 of survey respondents have experience
with self-repair 37 consider themselves to be good at repairing and 26 of
respondents associate lsquoreparabilityrsquo with being able to self-repair the product
As such the possibility of making essential product components
replaceable by consumers could be explored For example Directive
200666EC on Batteries and Accumulators already contains requirements on the
removal of batteries for certain electrical and electronic equipment184 A similar
requirement for batteries as well as other components could be applied to
products more widely This could potentially be done in the context of
implementing existing legislation (for example the implementing regulations under
the Ecodesign Directive)
This would give consumers the option to replace for example a battery or
another lsquoeasy-to-replacersquo component and create more incentives for consumers
to repair Moreover it would likely also stimulate the demand for repairs by
professionals (manufacturers and independent repair services) This is because
183 The LIFE programme is the EUrsquos funding instrument for the environment and climate action For more information see httpeceuropaeuenvironmentlifeabout
184 Batteries should be readily removable by end-users or have the possibility to have them removed by ldquoqualified professionalsrdquo
Behavioural Study on Consumersrsquo Engagement in the Circular Economy
187
consumers already have a high willingness to have products repaired by third
parties but some struggle to determine whether products can be repaired at all
Such uncertainty could be reduced by designing products such that they are more
evidently built to be repaired
2 Regulation to include repair instructions for minor defects in user
manuals Still regarding self-repairs Manufacturers could include instructions on
how to self-repair minor product breakdowns in user manuals or on the
internet Industry-led guidance and best practice could encourage manufacturers
to provide this information to consumers
The possibility to self-repair would have to take into account the safety of such an
activity for a regular consumer which implies restrictions on what products and
issues can be repaired Repair instructions should be considered only for minor
repairs that do not require specific skills or qualifications
An alternative that could be considered is the provision of such a requirement
within existing regulations and legislation This option would make it mandatory
for manufacturers to provide self-repair guidance for certain products and
breakdown issues Existing legislation could be used such as the Ecodesign
Directive
3 Ensure the availability of spare parts in the longer run The availability of
spare parts is essential for products to be repaired Spare parts for older products
are often difficult to find in particular when production of that product has ended
One option policy makers could investigate is the possibility of requiring
companies to provide spare parts for a certain period of time (and also
even after the product has been discontinued) For example a similar legal
obligation has been introduced in France Decree No 2014-1482 requires
producers to provide information about the time period for which spare parts will
be available185
Findings from all strands of research of this study support this recommendation
The availability of spare parts was for example the strongest association
consumers had with a ldquorepairable productrdquo Moreover the literature review and
stakeholder consultations identified that manufacturers should be required to
guarantee cheaply available spare parts for longer periods of time
4 Encouraging manufacturers to offer a commitment to repair throughout
technical product lifetimes The study found that consumers are willing to pay
significantly more for durable products and that the provision of information on
product durability can encourage consumers to purchase more durable products
The study also highlighted that consumers have high levels of trust in
manufacturer guarantees and are more likely to attempt a repair if a product is
still under guarantee Policy makers could explore the idea of encouraging
manufacturers to offer a repair service to consumers throughout the
technical lifetime of a product Offering such services might increase product
sales prices If this were the case manufacturers who offer this extended repair
service may find it useful to point this out prominently This way and in line with
the experiment findings manufacturers who offer extended repair services might
see consumersrsquo willingness to pay for their products increase Manufacturers who
do not offer such services might benefit from offering lower prices and could be
attractive for consumers who do not value reparability Such transparency could
contribute to having a level playing field among manufacturers
The provision of easier access to repair across a productrsquos technical lifespan may
reduce consumersrsquo effort when it comes to product repair as well as their
uncertainty regarding whether repairing would be possible at all thereby
encouraging more repairs
185 BEUC 2015
Behavioural Study on Consumersrsquo Engagement in the Circular Economy
188
Recommendation 3 ndash Create financial incentives for reparability and durability
Potential cost savings were found to be a key determinant of consumer engagement in
the Circular Economy Therefore financial incentives that encourage the production and
consumption of durable products product repair and the leasing or renting of products
have the potential to promote the uptake of these behaviours by both manufacturers and
consumers However further research would be required to confirm that there is
sufficient price sensitivity in consumers for such stimuli to be effective
Possible financial incentives include (but are not limited to) tax reductions or
exemptions for durable goods leasingrenting services and repair services
This could also include incentives for companies to provide spare parts for products for a
set period time after production has been discontinued (recommendation 2) An example
of a tax scheme was introduced in Sweden in 2017 This scheme introduced a lower VAT
rate for repair services and is known as the ldquorepair bonusrdquo
83 Enhancing product information on durability and reparability
Another main conclusion from this study was that EU consumers currently lack
information on durability and reparability and would appreciate receiving better
information Indeed when this information was provided participants in the behavioural
experiment were significantly more likely to select durable products or products that
could be more easily repaired This implies that providing more information to
consumers about the durability and reparability of products is effective in
shifting demand towards products with better environmental credentials Policy
makers could consider exploring the following two recommendations
Recommendation 4 - Making durability and reparability information available at
the point of sale
Based on the study findings it is suggested that policy makers and manufacturers explore
possibilities on how to make durability and reparability information available at
the point of sale
There are several points to consider
bull Explore the possibility of integrating durability and reparability
information into existing product labels The European Commission could
explore integrating durability and reparability information into the EU Energy
Label or the EU Ecolabel For example icons indicating expected lifetimes or
durability commitments as tested in the experiment could be embedded into the
existing EU Energy Label The EU Energy Label may be more appropriate than the
EU Ecolabel This is because the Ecolabel has only a PASS FAIL scale The Energy
Label instead shows an A to G scale and allows a number of other relevant pieces
of informationicons to be included
bull Explore the possibility to develop new EU consumer rules that would
include the display of durability and reparability information on products
Since the existing EU Energy Label and EU Ecolabel may have their limitations in
terms of scope or effectiveness to introduce durability and reparability information
for a wider range of products there may be a need to develop new EU rules
Including durability and reparability information into existing or new product
information would possibly also alleviate consumer concerns regarding
planned or premature obsolescence practices
bull Examine the development of a scoring system for reparability of
products In 2018 the European Commission launched a study to analyse and
develop a potential scoring system to rate the ability to repair and - where
relevant - upgrade products The technical background resulting from the study
Behavioural Study on Consumersrsquo Engagement in the Circular Economy
189
may be used to set the framework and grounds for the development of a
graphical label for inclusion in product information as mentioned above186
bull Provide product information to consumers on the availability of spare
parts and repair services The study found that consumers were interested in
repair information at the point of sale Providing information on where spare parts
can be obtained and where potential repair services can be found could make
repair easier (see also Recommendation 2) Where feasible the information
should also provide the costs of parts and repair services
Industry guidance and best practice may be most appropriate for encouraging
manufacturers and retailers to provide this information Alternatively policy
makers industry and consumer organisations (at EU and national level) could
investigate if producers and retailers need to be required to inform consumers
about reparability by integrating such provisions into existing EU legislation (eg
within the implementing regulations under the Ecodesign Directive) The
importance of producers informing consumers about the availability of spare parts
was also highlighted by stakeholders in the interviews
Recommendation 5 ndash Strengthened enforcement of consumer legislation
requiring the provision of accurate information to consumers
The provision of product information at the point of sale was found to be effective at
changing purchasing choices The provision of information not only needs to be presented
in a way that consumers can understand and effectively use it in their decision-making
but information also needs to be correct For example the Unfair Commercial Practices
Directive (200529EC) aims to boost consumer confidence and enable national enforcers
to curb a broad range of unfair commercial practices Examples of unfair commercial
practices include providing untruthful information to consumers aggressive marketing
techniques as well as specific issues such as misleading environmental claims and unfair
planned obsolescence practices To ensure the accurate provision of information to
consumers at the point of sale continued and strengthened enforcement of national
consumer laws is of great importance to support consumers in their choices surrounding
engagement in the Circular Economy
84 Suggestions for further research
In this section proposed areas for further research to fill remaining evidence and
information gaps are provided
841 Remaining knowledge gaps on consumer behaviour in relation to
Circular Economy engagement
This study has revealed many meaningful insights on consumer engagement within the
Circular Economy Product quality and price tend to drive consumer decisions over and
above product durability and reparability Therefore in order to further investigate
consumer engagement in the Circular Economy the following could be explored
bull Test with consumers how quality- and price-related characteristics can promote or
hinder the purchase of more durable products
bull Study whether other important factors besides price and quality (eg the brand)
can act as a driver for consumers to buy products with higher
durabilityreparability
bull Investigate further to what extent expected innovations and product
improvements play a role in the importance that consumers attach to the
durability and reparability of their products
bull Examine further the drivers of consumersrsquo desire for new products This study
revealed that for a similar level of effort many consumers prefer a buying new
186 For more information see httpsusprocjrceceuropaeuScoringSystemOnReparabilityindexhtml
Behavioural Study on Consumersrsquo Engagement in the Circular Economy
190
products over second hand leased or repaired products even when the price of
second hand products or a repair were considerably lower than that of a new
product A question for further research is how to identify the reasons behind this
preference and investigate whether there are ways to influence this preference
842 Research gaps relevant to the development of policy instruments to
stimulate engagement of the consumer in the Circular Economy
There are a range of ways that policy makers can promote the engagement of consumers
in the Circular Economy Several policy recommendations have been made above based
on the findings of this study To ensure the effective implementation of these
recommendations further research is advised
How to best provide durability and reparability information at the point of sale
The provision of durability and reparability information can improve consumer
engagement in the Circular Economy However how information is presented is
extremely important in terms of consumersrsquo understanding and use of the information in
their decisions Therefore further research on how to best present durability and
reparability information would ideally be undertaken For example
bull Which iconssymbols are best understood and used by consumers
bull How does consumer understanding of durability and reparability change with
increasing complexity of the remaining product information In other words when
do information overload and cognitive limitations come into play leading to a
decline in consumer understanding and engagement
Consumer price sensitivity for repairs
This study has identified important drivers and barriers of consumersrsquo decisions to repair
products Consumers are less likely to repair when repairing requires more or even a
similar amount of effort compared to replacing And consumers seem to be more inclined
to repair when repairing is substantially cheaper than buying a replacement However
there is limited information on consumersrsquo price responsiveness to changes in the cost of
repairing products If price-based mechanisms were to be considered by policy makers to
further incentivise repairs this information would be important
Reducing other barriers to repair
Beyond assessing how sensitive consumers are to the price of repair generally making it
easier to repair products may go some way towards boosting repairs According to this
study some options to pursue could be to increase the availability of spare parts and to
provide consumers with the ability to self-repair more easily However these may not be
the only barriers to repair Other factors such as lack of trust in repaired products or the
desire for new products may continue to prevent people from choosing to repair
Further investigation into what drives consumer choice in this area and whether
improving ease of access to repair will increase the number of consumers who choose to
repair could be undertaken For example policy makers could consider running small-
scale pilot projects to test the effect of increased ease of repair on the frequency at
which consumers choose to repair products
Impact assessments of new policy toolsamendments of existing policy instruments
As mentioned before most of the recommendations developed in this study relate to
policy initiatives that are new which means experience with the impact of such policies is
limited or non-existent Also some of the suggested interventions can have far-reaching
effects on consumers manufacturers and retailers and it is therefore important to assess
whether the intended policy instruments are proportional effective and efficient An ex-
ante impact assessment should be conducted for all policy recommendations requiring a
legislative change Below we highlight some aspects to which particular attention should
be paid
To stimulate product repair Recommendation 2 suggests increased availability of spare
parts and repair services This recommendation also suggests encouraging
manufacturers to commit to repair during the entire technical lifetime of the product
However such measures could have repercussions for the costs of manufacturers and
Behavioural Study on Consumersrsquo Engagement in the Circular Economy
191
retailers and may have an impact on the final price for consumers Therefore it is
important to carefully assess the financial implications of such measures against
the potential benefits achieved
Another essential element that needs to be assessed is the environmental impact of
promoting product repair or the purchasing of more durable products It is
important that Circular Economy actions are a means to achieving lower environmental
impacts and do not become a goal in itself For some products it might be very beneficial
to use them for as long as possible as the environmental impact of the production phase
is large and the materials used in the product are hardly recycled For other products
especially products that consume a lot of energy during their use phase it might be more
beneficial to replace them earlier in their lifetime This is because the use phase has a
larger effect on the overall environmental impact than the production phase and new
products might be more energy efficient In such cases replacement could be preferable
over repair It is important that this kind of information is considered when designing
policy instruments that promote durability and reparability Therefore the environmental
impacts of promoting the durability and reparability of products should be tested for
different product categories (for example using a life-cycle assessment) so that policies
promoting durability and reparability are only applied to the cases where this leads to a
reduction in the overall product environmental footprint
Behavioural Study on Consumersrsquo Engagement in the Circular Economy
192
Glossary and definitions
Country codes
AT Austria
BE Belgium
BG Bulgaria
HR Croatia
CY Cyprus
CZ Czech Republic
DK Denmark
EE Estonia
FI Finland
FR France
DE Germany
EL Greece
HU Hungary
IE Ireland
IT Italy
LV Latvia
LT Lithuania
LU Luxembourg
MT Malta
NL Netherlands
PL Poland
PT Portugal
RO Romania
SK Slovakia
SI Slovenia
ES Spain
SE Sweden
UK United Kingdom
IS Iceland
NO Norway
Abbreviations used
Chafea Consumers Health Agriculture and Food Executive Agency
B2C Business-to-consumer
CE Circular Economy
DGs Directorate Generals
EC European Commission
IoT Internet of Things
NGO Non-governmental organization
OEF Organisation Environmental Footprint
P2P Peer-to-peer
PET Product Environmental Footprint
PSS Product-service-systems
Definitions
Circular Economy In a Circular Economy the value of products and materials is
maintained for as long as possible waste and resource use are
minimised and resources are kept within the economy when a
product has reached the end of its life to be used again and
again to create further value (see
httpseceuropaeugrowthindustrysustainabilitycircular-
economy_en)
Durability It was one of the study objectives to find out what consumers
Behavioural Study on Consumersrsquo Engagement in the Circular Economy
193
associate with the concept of lsquodurabilityrsquo
In the behavioural experiment the following definition was
attached to the durability icon used on mock-EU Energy and EU
Ecolabels
The period in which the manufacturer promises to
replace or repair the product free of charge
For the stakeholder consultations the following working
definition for ldquoDurability informationrdquo was used
Information about the averageexpected or minimum
lifespan of products before they defect or break
Reparability
It was one of the study objectives to find out what consumers
associate with the concept of lsquoreparabilityrsquo In the behavioural
experiment the following definition was attached to the
durability icon used on mock-EU Energy and EU Ecolabels
Ease-of-repair rating based on availability of repair
manuals spare parts and repair services
For the stakeholder consultations the following working
definition for ldquoReparability informationrdquo was used
All types of information that could be relevant to repair
products in case of a defect
Legal guarantee EU law (Directive 199944EC) stipulates that sellers are liable
to consumers for any lack of conformity (defect) that existed at
the time of delivery and becomes apparent with a 2-year period
(legal guarantee) In some countries national law provide for
longer periods for sellerrsquos liability
Commercial guarantee
(warranty)
Manufacturers retailers (or insurers) can offer consumers
commercial guarantees (warranties) in addition to the legal
guarantee of the seller of the goods These can either be
included in the price of the product or at an extra cost Such
warranties are without prejudice to the legal guarantee
Behavioural Study on Consumersrsquo Engagement in the Circular Economy
194
Bibliography
Abramovski et al(2017) lsquoRedistribution efficiency and the design of VAT a review of
the theory and literaturersquo Institute for Fiscal Studies Available at
httpswwwifsorgukuploadspublicationsbnsBN212pdf
ADEME (2014)a lsquoEvolutions du comportement des Franccedilais face au deacuteveloppement
de leacuteconomie circulaire Paris ADEMErsquo Available at
httpwwwademefrsitesdefaultfilesassetsdocumentsadm00013585_evolutions
_comportement_des_francais_face_au_developpement_economie_circulaire_juin_201
4pdf
ADEME (2014)b lsquoPerceptions et pratiques des franccedilais en matiegravere de reacuteemploi des
produitsrsquo Available at
httpswwwademefrsitesdefaultfilesassetsdocumentsetude-socio-reemploi-
2014-rapport-finalpdf
Adler L amp Hlavcek J D (1978) lsquoKey Repair Service Factors for Consumer Durable
Goods Journal of Marketing Researchrsquo 634-638 Available at
httpswwwjstororgstable3150636seq=1page_scan_tab_contents
AK Wien (2017) lsquoSmartphones are replaced more frequently than T-shirtsrsquo Available
at httpwwwakeuropaeu_includesmodsakeudocsmain_report_en_457pdf
Allcott (2011) lsquoSocial norms and energy conservationrsquo Journal of Public Economics
Available at
httpswwwsciencedirectcomsciencearticleabspiiS0047272711000478
Armstrong C M (2014) lsquoSustainable product-service systems for clothing exploring
consumer perceptions of consumption alternatives in Finlandrsquo Available at
httpswwwsciencedirectcomsciencearticlepiiS0959652614000596
Benthin R et al (2017) lsquoEnvironmental awareness in Germany 2016 ndash Results of a
representative population surveyrsquo Available at httpswwwconpolicydeennews-
detailenvironmental-awareness-in-germany-2016-results-of-a-representative-
population-survey
BEUC (2015) lsquoDurable goods More sustainable products better consumer rights -
Consumer expectations from the EUrsquos resource efficiency and Circular Economy
agendarsquo Available at httpwwwbeuceupublicationsbeuc-x-2015-
069_sma_upa_beuc_position_paper_durable_goods_and_better_legal_guaranteespd
f
Braitwate N Densley-Tingley D amp Moreno M (2015) lsquoShould energy labels for
washing machines be expanded to include a durability ratingrsquo Available at
httpirepntuacukideprint85461220134_PubSub2377_Morenopdf
Bruumlggenwirth B amp Witte E (2016) lsquoPersbericht Dossier Duurzaam Duurzaamheid
bij consument in de lift Maarssen b-openrsquo Available at
httpwwwdossierduurzaamnlCms_DataContentsDossierDuurzaamDBMediapdfs
Persbericht-Dossier-Duurzaam-2016_defpdf
Cerdaacute E amp Khalilova A (2015) lsquoEconomiacutea Circularrsquo Available at
httpwwwminetadgobesPublicacionesPublicacionesperiodicasEconomiaIndustrial
RevistaEconomiaIndustrial401CERDC38120y20KHALILOVApdf
Coffmann et al (2017) lsquoCan Social Information Affect What Job You Choose and
Keeprsquo American Economic Journal Applied Economics Available at
httpswwwaeaweborgarticlesid=101257app20140468
Cox J Herren S King G amp Knight T (2013) lsquoElectrical and electronic product
design product lifetimersquo Available at httpwwwbrooklyndhurstcoukelectrical-
and-electronic-product-design-product-lifetime-_271html
Della Vigna (2009) lsquoPsychology and Economics Evidence from the Fieldrsquo Journal of
Economic Literature Available at
httpswwwaeaweborgarticlesid=101257jel472315
Digital Europe (2017) lsquoThe contribution of the Digital Industry to repair
remanufacturing and refurbishment in a Circular Economyrsquo Available at
httpwwwdigitaleuropeorgDesktopModulesBring2mindDMXDownloadaspxCom
mand=Core_DownloadampEntryId=2397amplanguage=en-USampPortalId=0ampTabId=353
Deloitte (2017) lsquoExpert workshop towards increased repair of household EEErsquo
Dufwenberg Gaumlchter Henning-Schmitdt (2011) lsquoThe framing of games and the
psychology of playrsquo Games and Economic Behavior Available at
httpswwwsciencedirectcomsciencearticlepiiS0899825611000376
Behavioural Study on Consumersrsquo Engagement in the Circular Economy
195
Duvall L McIntyre K amp Opsomer T (2016) lsquoEmpowering Repairrsquo Available at
httpswwwellenmacarthurfoundationorgassetsdownloadsce100Empowering-
Repair-Final-Public1pdf
Economische en Sociale Raad (2015) lsquoAdvies Overgang van het Brussels
Hoofdstedelijk Gewest naar de kringloopeconomiersquo
European Economic and Social Committee (2016) lsquoThe Influence of Lifespan Labelling
on Consumersrsquo Brussels European Economic and Social Committee Available at
httpwwweesceuropaeuresourcesdocsqe-04-16-076-en-npdf
European Commission (2012) lsquoResearch on EU product label options - Study delivered
by Ipsos MORI London Economics and AEArsquo available at
httpseceuropaeuenergysitesenerfilesdocuments2012-12-research-eu-
product-label-optionspdf
European Commission (2013) lsquoCommission staff working document Impact
Assessment Accompanying the Commission Regulation implementing Directive
2009125EC and the Commission Delegated Regulation supplementing Directive
201030EUrsquo Brussels European Commission
European Commission (2013) lsquoReduced rates of VAT frequently asked questions
MEMO03149rsquo Available at httpeuropaeurapidpress-release_MEMO-03-
149_enhtmlocale=en
European Commission (2017) lsquoStudy on consumersrsquo decision-making in insurance
services A behavioural economics perspectiversquo Available at
httpspublicationseuropaeuenpublication-detail-publicationb86d7f2d-9e77-
11e7-b92d-01aa75ed71a1language-enformat-PDFsource-search
European Commission (2003) lsquoProposal for a Council Directive amending Directive
77388EEC as regards reduced rates of value added taxrsquo COM(2003) 397 final
Available at httpeceuropaeutransparencyregdocrep12003EN1-2003-397-
EN-F1-1Pdf
European Commission DG Environment (2014) lsquoScoping study to identify potential
Circular Economy actions priority sectors material flows and value chainsrsquo Available
at httpswwweesceuropaeuresourcesdocsscoping-studypdf
European Commission DG JUSTCivic Consulting (2017) lsquoStudy for the Fitness Check
of EU consumer and marketing lawrsquo Available at
httpspublicationseuropaeuenpublication-detail-publicationf7b3958b-772b-
11e7-b2f2-01aa75ed71a1language-en
European Commission DG JUSTGfK (2017) lsquoConsumer Market Study to support the
Fitness Check of Consumer Rulesrsquo Available at
httpeceuropaeunewsroomjustitem-detailcfmitem_id=59332
European Commission Joint Research Centre (2018) lsquoGuide for the Assessment of
Material Efficiency application to smartphonesrsquo Available at
httpsusprocjrceceuropaeuE4CdocsJRC_report_smartph_v23_CLEANpdf
European Commission Joint Research Centre (2017)a lsquoAnalysis of the Future
Direction and Policy Needs of European Industryrsquo Available at
httpseceuropaeujrccommunitiescommunity248about
European Commission Joint Research Centre (2017)b lsquoEcodesign and Energy Label
for Household Dishwashers Luxembourg Publications Office of the European Unionrsquo
Available at httppublicationsjrceceuropaeurepositoryhandleJRC106993
European Commission Joint Research Centre (2018)a Assessment of the reparability
and upgradability of TVs (Draft) retrieved from
httpsusprocjrceceuropaeuE4CdocsJRC_report_TV_repair_v2-2_CLEANpdf
European Commission Joint Research Centre (2018)b Guide for the Assessment of
Material Efficiency application to smartphones (Draft) retrieved from
httpsusprocjrceceuropaeuE4CdocsJRC_report_smartph_v23_CLEANpdf
European Environment Agency (2017) lsquoCircular by design Products in the Circular
Economyrsquo Available at
httpscirculareconomyeuropaeuplatformsitesdefaultfilescircular_by_design_-
_products_in_the_circular_economypdf
European Parliament (2016) lsquoCircular Economy package four legislative proposals on
wastersquo Available at httpwwweuroparleuropaeuEPRSEPRS-Briefing-573936-
Circular-economy-package-FINALpdf
Behavioural Study on Consumersrsquo Engagement in the Circular Economy
196
Experian (2014) lsquoAn estimate of the effects of a reduction in the rate of VAT on
housing renovation and repair work 2015 to 2020rsquo
Federal Environment Agency (2017) lsquoObsolescence - Political strategies for improved
durability of productsrsquo Available at
httpswwwumweltbundesamtdesitesdefaultfilesmedien376dokumente2017-
06-01_obsolescence_scientific_opinion_paper_german_environment_agencypdf
French Packaging Council (2014) lsquoPackaging amp Circular Economyrsquo Available at
httpscirculareconomyeuropaeuplatformsitesdefaultfilespackaging-and-
circular-economy-final-report-en-september-2014pdf
Fernandez V (2001) lsquoObservable and unobservable determinants of replacement of
home appliancesrsquo Available at
httpswwwsciencedirectcomsciencearticlepiiS0140988300000669
French Ministry of Ecology Sustainable Development and Energy (2014) lsquoLeacuteconomie
circulaire eacutetat des lieux et perspectivesrsquo Available at
httpwwwladocumentationfrancaisefrvarstoragerapports-publics154000005pdf
Haze B Overstreet R amp Jones-Farmer A (2011) lsquoThe role of ambiguity tolerance
in consumer perception of remanufactured productsrsquo Available at
httpwwwtandfonlinecomezproxyulbacbedoipdf102752175630611X1309168
8930453
ICF (2017) lsquoStudy on the costs and benefits of extending certain rights under the
Consumer Sales and Guarantees Directive 199994ECrsquo Available at
httpeceuropaeunewsroomdocumentcfmdoc_id=44803
Lakatos E-S Crisan O-A LakatosS D-G Bejan M (2017) lsquoParadigma economiei
circulare O provocare pentru orasul inteligent Available at
httpwwwagirrobuletine2847pdf
Larrick Soll (2008) lsquoThe MPG Illusionrsquo Science Available at
httpsciencesciencemagorgcontent32058831593
Leboucq V (2016) lsquoSEB promet de reacuteparer ses produits pendant dix ans Les Echosrsquo
Levin et al (1998) lsquoAll frames are not created equal A typology and critical analysis
of framing effectsrsquo Organizational Behavior and Human Decision Processes Available
at httpswwwsciencedirectcomsciencearticlepiiS0749597898928047
Liberman Samuels Ross (2004) lsquoThe name of the game predictive power of
reputations vs situational labels in determining Prisonerrsquos Dilemma game movesrsquo
Personality and Social Psychology Bulletin 30 Available at
httpjournalssagepubcomdoiabs1011770146167204264004
London Economics Ipsos amp AEA (2012) lsquoResearch on EU product label optionsrsquo
Available at httpseceuropaeuenergysitesenerfilesdocuments2012-12-
research-eu-product-label-optionspdf
London Economics amp Ipsos (2014) lsquoStudy on the impact of the Energy Label ndash and
potential changes to it ndash on consumer understanding and on purchase decisionsrsquo
Available at
httpseceuropaeuinfositesinfofilesimpact_of_energy_labels_on_consumer_beh
aviour_enpdf
London Waste and Recycling Board (2017) lsquoLondons Circular Economy Roadmap
London LWARBrsquo Available at httpwwwlwarbgovukwp-
contentuploads201504LWARB-LondonE28099s-CE-route-
map_16617a_singlepages_smlpdf
McCullough J (2009) lsquoFactors impacting the demand for repair services of household
products the disappearing repair trades and the throwaway societyrsquo Available at
httpsonlinelibrarywileycomdoiabs101111j1470-6431200900793x
McCullough J (2010) lsquoConsumer Discount Rates and the Decision to Repair or
Replace a Durable Product A Sustainable Consumption Issuersquo Available at
httpswwwjstororgstable40647716
Michaud C a (2011) lsquoGreen Consumer Behaviour an Experimental Analysis of
Willingness to Pay for Remanufactured Productsrsquo Available at
httpsonlinelibrarywileycomdoiabs101002bse703
OCU et al (2016) lsquoiquestCollaboration or business From value for users to a society with
valuesrsquo
Pijnenburg R (2014) lsquoInkoper als aanjager van circulaire economiersquo Available at
httpsmvonederlandnlsystemfilesmediawfg_wk7_p14-15pdf
Behavioural Study on Consumersrsquo Engagement in the Circular Economy
197
Ross Ward (1996) lsquoNaive realism in everyday life Implications for social conflict
and misunderstandingrsquo In Reed et al (Eds) Values and Knowledge
Salvia G Cooper T Fisher T Harmer L and Barr C (2015) lsquoWhat is broken
Expected lifetime perception of brokenness and attitude towards maintenance and
repairrsquo Available at httpirepntuacukideprint12817
SB Insight (2017) lsquoThe Nordic Market for Circular Economy a Report about Business
Leader and Consumer Views on Circular Economyrsquo Available at httpwwwsb-
insightcomcircular-economy
Schwarz (1999) lsquoSelf-reports How the questions shape the answersrsquo American
psychologist Available at
httppsycnetapaorgdoiLandingdoi=1010372F0003-066X54293
Smeesters D L (2003) lsquoConsumer Motivation to Recycle When Recycling is
Mandatory Two Exploratory Studies Tijdschrift voor Economie en Managementrsquo
Available at httpnsmn1uhedudgraurnivtheMPGIllusionpdf
SPF Santeacute publique Seacutecuriteacute de la chaicircne alimentaire et Environnement (2014) lsquoVers
une Belgique prionniegravere de leacuteconomie circulairersquo Available at
httpeconomiefgovbefrbinariesVers_une_Belgique_Pionniere_de_l_economie_cir
culaire_tcm326-259697pdf
Sunstein (2017) lsquoNudges that failrsquo Behavioural Public Policy Available at
httpswwwcambridgeorgcorejournalsbehavioural-public-policyarticlenudges-
that-fail8DE5FFFFB7DA5BE14F8DC1E3D2C0C0AA
Tansey R (2015) lsquoReduccioacuten de residuos el reciclaje no es suficiente para alcanzar
una economiacutea circular Madrid Amigos de la tierrarsquo Available at
httpswwwtierraorgwp-
contentuploads201507reduccion_residuos_economia_circularpdf
The Behavioural Insights Team (2015) lsquoEAST Four simple ways to apply behavioural
insightsrsquo available at httpwwwbehaviouralinsightscoukwp-
contentuploads201507BIT-Publication-EAST_FA_WEBpdf
The Scottisch Government (2016) lsquoMaking things last A Circular Economy strategy
for Scotland Edinburgh The Scottish Governmentrsquo Available at
httpwwwgovscotPublications2016021761downloadsres-1
TNS Political amp Social (2013) lsquoFlash Eurobarometer 367 Attitudes of Europeans
towards Building the Single Market for Green Productrsquo Brussels European
Commission Directorate-General for Communication Available at
httpeceuropaeucommfrontofficepublicopinionflashfl_367_enpdf
Tversky and Kahneman (1981) lsquoThe framing of decisions and the psychology of
choicersquo Science Available at httpsciencesciencemagorgcontent2114481453
UK Office for Fair Trading (2010) lsquoThe impact of price frames on consumer decision
makingrsquo Available at
httpwebarchivenationalarchivesgovuk20140402165040httpoftgovukshare
d_ofteconomic_researchOFT1226pdf
Umwelt Bundesamt (2017) lsquoDas Ecodesign-Kit als Lehrmaterial fuumlr Hochschulenrsquo
Available at
httpswwwumweltbundesamtdesitesdefaultfilesmedien1968dokumente07_k
ossolobow_das_ecodesign-kit_al_s_lehrmaterial_fur_hochschulenpdf
Verbraucherzentrale Bundesverband (2014) lsquoComprehensibility of the EU Energy
Label ndash Results of two focus groups and a representative consumer surveyrsquo Available
at httpswwwverbraucherzentrale-rlpdemedia231718A
Verbraucherzentrale Bundesverband (2017) lsquoVerbraucherbefragung Haltbarkeit und
Reparierbarkeitrsquo Berlin KANTAR EMNID Available at
httpwwwvzbvdesitesdefaultfilesdownloads20170601umfrage_-
_haltbarkeit_und_reparierbarkeit_von_produkten_o_gewaehrleistungpdf
Wang Y amp Hazen B (2016) lsquoConsumer product knowledge and intention to
purchase remanufactured productsrsquo Available at
httpwwwvzbvdesitesdefaultfilesdownloads20170601umfrage_-
_haltbarkeit_und_reparierbarkeit_von_produkten_o_gewaehrleistungpdf
Watson M (2008) lsquoA Review of literature and research on public attitudes
perceptions and behaviour relating to remanufactured repaired and reused productsrsquo
Available at httpwwwremanufacturingorgukpdfstory1p143pdf
Behavioural Study on Consumersrsquo Engagement in the Circular Economy
198
Westblom C (2015) lsquoTowards a Circular Economy in Sweden - Barriers for new
business models and the need for policy interventionrsquo Available at
httpluplubluseluurdownloadfunc=downloadFileamprecordOId=8170322ampfileOId=
8170379
Wieser H amp Troumlger N (2012) lsquoDie Nutzungsdauer und Obsolenz von
Gebrauchsguumltern im Zeitalter der Beschleunigung Vienna Arbeiterkammer Wienrsquo
Available at
httpsmediaarbeiterkammeratwienPDFstudienBericht_Produktnutzungsdauerp
df
Wilhelm W B (2012) lsquoEncouraging Sustainable Consumption through Product
Lifetime Extension The Case of Mobile Phonesrsquo Available at
httpijbssnetcomjournalsVol_3_No_3_February_20122pdf
WRAP (2012) lsquoValuing our clothes The true cost of how we design use and dispose
of clothing in the UKrsquo Available at
httpwwwwraporguksitesfileswrapVoC20FINAL20online2020122007
2011pdf-CEIP-report-Designing-for-a-Circular-Economypdf
WRAP (2013) lsquoElectrical and electronic product design product lifetimersquo Available at
httpwwwbrooklyndhurstcoukelectrical-and-electronic-product-design-product-
lifetime-_271html
WRAP (2017) lsquoSustainable clothing A practical guide to enhancing clothing durability
and qualityrsquo Available at httpwwwwraporguksustainable-textilesscapextending-
clothing-lifeguidessustainable-clothing-guide
Behavioural Study on Consumersrsquo Engagement in the Circular Economy
199
Behavioural Study on Consumersrsquo Engagement in the Circular Economy
200
Behavioural Study on Consumersrsquo Engagement in the Circular Economy
HOW TO OBTAIN EU PUBLICATIONS
Free publications
bull one copy
via EU Bookshop (httpbookshopeuropaeu)
bull more than one copy or postersmaps
from the European Unionrsquos representations (httpeceuropaeurepresent_enhtm)
from the delegations in non-EU countries
(httpeeaseuropaeudelegationsindex_enhtm)
by contacting the Europe Direct service (httpeuropaeueuropedirectindex_enhtm)
or calling 00 800 6 7 8 9 10 11 (freephone number from anywhere in the EU) () () The information given is free as are most calls (though some operators phone boxes or hotels may charge you)
Priced publications
bull via EU Bookshop (httpbookshopeuropaeu)
doi102818956512
EB-0
4-1
8-4
98-E
N-N

EUROPEAN COMMISSION
Directorate-General for Justice and Consumers
2018
Authors
Dr Annette Cerulli-Harms (LE Europe)
James Suter (LE Europe)
Wouter Landzaat (LE Europe)
Dr Charlotte Duke (LE Europe)
Adriana Rodriguez Diaz (VVA Europe)
Lucas Porsch (VVA Europe)
Timotheacute Peroz (VVA Europe)
Dr Sara Kettner (ConPolicy)
Prof Dr Christian Thorun (ConPolicy)
Katarina Svatikova (Trinomics)
Jurgen Vermeulen (Trinomics)
Tycho Smit (Trinomics)
Femke Dekeulenaer (Ipsos)
Elena Lucica (Ipsos)
We would like to acknowledge the useful guidance and input provided during this
research by Prof Lucia Reisch (Copenhagen Business School) Prof Bodo Sturm (Leipzig
University of Applied Sciences) and Marta Ballesteros (Milieu Law amp Policy Consulting)
We furthermore acknowledge the helpful guidance received from the European
Commission departments involved such as Justice and Consumers Environment and the
Joint Research Centre (especially unit JRC I2 Foresight Behavioural Insights and Design
for Policy) We would also like to thank all the interviewed stakeholders for their
informative responses
Behavioural Study on Consumersrsquo Engagement in the Circular Economy
5
ldquoThis report was produced under the Consumer Programme (2014-2020) in the frame of a contract with CHAFEA acting on behalf of the European Commission The content of this report represents the views of LE Europe VVA Europe Ipsos ConPolicy Trinomics and is its sole responsibility it can in no way be taken to reflect the views of the European Commission andor CHAFEA do not guarantee the accuracy of the data included in this report nor do they accept responsibility for any use made by third parties thereofrdquo
More information on the European Union is available on the Internet (httpeuropaeu)
Luxembourg Publications Office of the European Union 2018
copy European Union 2018
Reproduction is authorised provided the source is acknowledged
PRINTED IN
PRINTED ON ELEMENTAL CHLORINE-FREE BLEACHED PAPER (ECF)
PRINTED ON TOTALLY CHLORINE-FREE BLEACHED PAPER (TCF)
PRINTED ON RECYCLED PAPER
PRINTED ON PROCESS CHLORINE-FREE RECYCLED PAPER (PCF)
Europe Direct is a service to help you find answers
to your questions about the European Union
Freephone number ()
00 800 6 7 8 9 10 11
() The information given is free as are most calls (though some operators phone boxes or hotels may charge you)
Project Number 20183140
Title Behavioural Study on Consumers Engagement in the Circular Economy - Final report
Linguistic version
MediaVolume Catalogue number ISBN DOI
EN PDF PDFVolume_01 EB-04-18-498-EN-N 978-92-9200-885-7 102818956512
Behavioural Study on Consumersrsquo Engagement in the Circular Economy
6
TABLE OF CONTENTS
EXECUTIVE SUMMARY 9
1 INTRODUCTION AND BACKGROUND 14
11 Policy context 14
12 Objectives of the study 16
METHODOLOGY 18
2 METHODOLOGY 19
21 Country selection 19
22 Product selection 21
23 Methodology for the literature review and desk research 22
24 Methodology for the stakeholder interviews 23
25 Methodology for the focus groups 26
26 Methodology for the consumer survey 27
27 Methodology for the behavioural experiment 30
EVIDENCE AND FINDINGS 46
3 CONSUMERSrsquo WILLINGNESS TO ENGAGE IN THE CIRCULAR ECONOMY 47
31 Evidence from the literature and data collection 48
32 Evidence from the stakeholder interviews 51
33 Evidence from the focus groups 53
34 Evidence from the consumer survey 55
4 DRIVERS BARRIERS AND TRADE-OFFS FACED BY CONSUMERS 65
41 Evidence from the literature and data collection 68
42 Evidence from the stakeholder interviews 74
43 Evidence from the focus groups 78
44 Evidence from the consumer survey 81
45 Evidence from the behavioural experiment 95
5 CONSUMERSrsquo AWARENESS UNDERSTANDING AND EXPECTATIONS ON DURABILITY AND REPARABILITY 110
51 Evidence from the literature and data collection 112
52 Evidence from the stakeholder interviews 114
53 Evidence from the focus groups 116
54 Evidence from the consumer survey 118
6 DURABILITY AND REPARABILITY INFORMATION AND ITS POTENTIAL ROLE IN CONSUMERSrsquo DECISION-MAKING 128
61 Evidence from the literature and data collection 130
62 Evidence from the stakeholder interviews 136
63 Evidence from the focus groups 138
64 Evidence from the consumer survey 140
65 Evidence from the behavioural experiment 155
CONCLUSIONS AND SUGGESTIONS FOR FUTURE POLICY ACTION 173
7 OVERALL CONCLUSIONS 174
71 Understanding consumer engagement in the Circular Economy 175
72 Factors influencing consumer decision-making in the Circular Economy 177
8 SUGGESTIONS FOR FUTURE POLICY ACTION 183
81 Boosting CE engagement by strengthening pro-environmental attitudes and awareness 184
82 The importance of price quality and convenience in purchasing and repair decisions 186
Behavioural Study on Consumersrsquo Engagement in the Circular Economy
7
83 Enhancing product information on durability and reparability 188
84 Suggestions for further research 189
GLOSSARY AND DEFINITIONS 192
BIBLIOGRAPHY 194
Behavioural Study on Consumersrsquo Engagement in the Circular Economy
9
Executive summary
Objectives
In 2017 LE Europe VVA Ipsos ConPolicy and Trinomics were commissioned by the
European Commission to conduct a behavioural study on consumersrsquo engagement in the
Circular Economy (CE) The objective was to provide policy-relevant insights to assist
with the implementation of the EU Circular Economy Action Plan
The study sought to
1 Identify barriers and trade-offs faced by consumers when deciding whether to
engage in the CE in particular whether to purchase a more or a less durable
good whether to have a good repaired or to discard it and buy a replacement
2 Establish the relative importance of economic social and psychological factors
that govern the extent to which consumers engage in the CE especially
purchasing durable products and seeking to repair products instead of disposing of
them and
3 Propose policy tools to enable and encourage consumers to engage in CE practices
related to durability and reparability
Methodology
The study mainly focussed on the following five products vacuum cleaners
televisions dishwashers smartphones and clothes
A systematic literature review was carried out across all 28 EU Member States
Norway Iceland Switzerland Japan Canada and the USA1 This review was
complemented by insights collected through 50 interviews with stakeholders from
eg business and consumer associations NGOs public authorities and academia and
consumer focus groups with the general public and potentially vulnerable consumer
groups in 4 countries2 These activities contributed towards the results of the study and
informed the design of an online consumer survey and behavioural experiment
conducted in respectively 12 and 6 countries with 12064 and 6042 respondents who
were representative of the general population for each country in terms of age gender
and geographic region3
The survey collected information on consumersrsquo experiences with CE practices such as
repairing renting leasing and purchasing second hand products their reasons behind
engaging in the CE (or not) as well as general socio-demographic characteristics and
self-declared attitudes towards the CE
The behavioural experiment contained two tasks a purchasing and a repair experiment
Both experiment tasks were financially incentivised for enhanced realism and external
validity
The purchasing experiment tested different forms of durability and reparability
information and their effects on consumersrsquo product choices The following treatments
were tested lsquomanufacturer warrantiesrsquo and lsquoexpected lifetimersquo claims durability
commitments and reparability ratings included in the EU Energy and Ecolabels using
novel icons4 Additionally the effects of behaviourally motivated lsquonudgesrsquo via claims such
1 Literature was reviewed in English German (AT DE) Czech French (FR LU BE) Hungarian Dutch (NL BE) Romanian and Spanish
2 Two groups were conducted in each of CZ DE IE and SE One group was held with participants from the general public the other with potentially vulnerable consumers (people who struggle or are in arrears with bills and are unemployed retired long-term sick or disabled or single parents)
3 The online consumer survey was conducted in AT CZ FR DE HU IE LV NL PT RO ES and SE The behavioural experiment was embedded in the survey in CZ DE IE RO ES and SE
4 lsquoManufacturer warrantyrsquo and lsquoExpected lifetimersquo were not explained or defined further in the experiment
Behavioural Study on Consumersrsquo Engagement in the Circular Economy
10
as lsquoProducts that last longer may save you money over timersquo and lsquoA majority of people
choose products that last longer and are easier to repairrsquo were tested
The repair experiment confronted respondents with a broken product for which they
could decide whether to have it repaired or to replace it with either a brand new or
second hand product The experimental conditions tested how the trade-offs between
repairing and replacing were affected by a real effort task which increased the effort
required to respectively repair or replace and framing effects of the repair option
Behavioural experiments allow the isolation of the drivers of consumer choice and are
widely used by policy makers internationally to test information provision on consumer
decision-making Experiments are necessarily simplifications of the real world as such
the findings of the experiment should be viewed in conjunction with the experimental
set-up which consisted of a simplified process with streamlined and standardised product
information
Findings and conclusions
In brief all strands of research found that consumers were generally willing to engage
in CE practices But actual engagement was rather low While a majority of
consumers repair products (64) a substantial share have not repaired products in
the past (36) andor have no experience rentingleasing or buying second hand
products (~90) A reason for this low engagement in CE practices could be that
consumers lack information regarding product durability and reparability as well as
the lack of sufficiently developed markets (eg for second hand products renting
leasing or sharing services etc) In the behavioural experiment the provision of such
information was found to be highly effective at shifting purchasing decisions
towards products with greater durability and reparability The survey and experiment
also found that repair decisions are easily disrupted if arranging repair requires
effort These findings indicate that there is a large potential to close the gap between
consumersrsquo willingness to engage and their actual engagement
Understanding consumer engagement in the Circular Economy
Survey respondents reported that they keep things they own for a long time (93)
recycle unwanted possessions (78) and repair possessions if they break (64) A
minority yet still sizable share (10-25) of survey respondents were interested in
engaging with novel CE practices such as leasing products instead of purchasing them
The study uncovered a high level of consistency between self-reported pro-CE
attitudes in the survey and actual behaviour in the monetarily incentivised
behavioural experiment Consumers who self-claimed having pro-CE attitudes were
also more likely to repair products in the experiment or to buy second hand rather than
brand new products
The different research methods showed that interest in product durability and
reparability was generally higher for large and expensive products (eg white
goods) and slightly lower for fashion items (eg clothes smartphones) For fashion
products there was however a higher willingness to buy second hand (clothes
smartphones) or to rent or lease such products (smartphones)
Consumer expectations and experiences with durability and reparability
All research methods found that consumers most associate durability with product
quality and reparability was most associated with availability of spare parts
Reparability was throughout the study found to be less important to consumers than
durability According to the survey this is because consumers trust manufacturer
warranties and would not expect durable products to break
Durability on EU labels was defined as The period in which the manufacturer promises to replace or repair the product free of charge
Reparability on EU labels was defined as Ease-of-repair rating based on availability of repair manuals spare parts and repair services
Behavioural Study on Consumersrsquo Engagement in the Circular Economy
11
The study did not find overwhelming evidence of a lsquothrowaway economyrsquo Across all
products a majority of survey respondents (~60) reported having repaired
products in the past Repairs were mostly done by professionals (26 repair services
17 manufacturers) but to some extent also by friendsfamily (8)) Self-repair was
less frequent but still substantial especially for clothes (12) Overall people were
happy with professional repair services Over 70 had their expectations in terms of
convenience speed quality and friendliness of the repair met or even exceeded
These findings seem to dispel perceptions that consumers are marked by negative
experiences with repair services which were reported by several stakeholders
A joint analysis of the behavioural experiment and survey revealed that consumers who
have received durability information via manufacturer warranties or durability
promises at the point of sale in a purchasing exercise were significantly more likely
to expect free replacement or free repairs of faulty products Instead those who
had not seen such information were significantly less likely to expect free repairs or
replacements and instead expected to pay for these services
Drivers barriers and trade-offs faced by consumers
It emerged clearly from the different strands of research that the price-quality ratio is
the most important driver and simultaneously barrier for consumer engagement in
the CE followed by convenience Many consumers were willing to pay more for
products with better durability and reparability but can be persuaded by low prices to
disregard CE credentials Similarly when replacement is more convenient than repairing
consumers are easily led to purchase new products This was especially pronounced for
consumers with a preference for new trends and technology However only about one in
ten consumers in the survey reported having strong preferences for new trends and
technology
The study found that repairing is popular but not ubiquitous Most consumers who did not
repair expected repairs to be too expensive (25-50 across products) preferred getting
a new product (17-25) or felt the old product was obsolete or out of fashion (20-
30) Some (5-10) however felt they did not know howwhere to repair products or
that it would be too much effort to repair (8-14)
In the online behavioural experiment 62-83 (depending on the product type) of
respondents chose to repair rather than replace products But repairs became less
frequent when additional effort was required to arrange the repair while an identical
level of effort left motivations to replace products unaffected Beyond convenience
marketing practices which increase the salience of repair had only a limited effect on
consumer decisions in the experiment Moreover consumers in the experiment were
indifferent to use repair services offered by manufacturers or independent repair shops
Effects of product information on purchasing decisions
Many consumers claimed they were aware of the durability and reparability of
products they had purchased yet the study uncovered that CE product information
(ie information on durability and reparability of products) was in fact difficult to find
and consumers wanted to receive better information
Evidence from the literature review stakeholder interviews focus groups and
experiment showed that improved information provision at the point of purchase (eg on
EU labels or provided by manufacturers) was effective at promoting CE behaviours
amongst consumers When respectively durability or reparability information was
provided in the experiment consumers were almost three times more likely to
choose products with the highest durability on offer and more than two times
more likely to choose products with the highest reparability ratings General CE
preferences were strongest when durability and reparability information was presented
together That is when durability and reparability information was shown together on the
product label individuals were most likely to purchase products which rated highly in
both dimensions ndash durability and reparability Durability was again clearly the more
influential factor These shifts in product choice resulted from consumers turning away
from low durabilityreparability products in favour of those with better CE credentials
Behavioural Study on Consumersrsquo Engagement in the Circular Economy
12
These findings are corroborated by consumersrsquo significant willingness-to-pay for
better durabilityreparability for all product categories Depending on how
durabilityreparability information was presented willingness-to-pay for an additional
year of durability ranged between euro20-36 for vacuum cleaners and dishwashers euro92-148
for TVs euro148-217 for smartphones5 and euro14-27 for coats Willingness-to-pay for an
improved reparability6 rating was around euro29-54 for vacuum cleaners euro83-105 for
dishwashers euro77-171 for TVs euro48-98 for smartphones and euro10-30 for coats
lsquoNudgesrsquo informing consumers of the benefits and social norms of buying
durablerepairable products increased the saliency of CE characteristics and triggered
shifts in preferences towards more durablerepairable products
Suggestions for future policy action
The study makes recommendations as outlined below to further enhance consumer
engagement in the CE
Recommendation 1 ndash Boosting CE engagement by strengthening pro-environmental
attitudes and awareness Environmental awareness and positive attitudes towards
environmentally favourable practices like buying second hand products and repairing
products were found to be key determinants for sustainable consumer choices From
the study follow at least three specific areas of action which could be taken by policy
makers and industry
o Boosting pro-environmental attitudes One way this could be done is by
focussing on educating young people by for example including
environmental awareness education within school curricula
o Increasing consumer awareness of second hand rentingleasing and repair
markets Recently there has been an increase in the number of CE
initiatives such as repair cafeacutes Similar initiatives could be promoted for
second hand products renting leasing of products
o Promoting benefits of durability and reparability According to the study
findings it would be beneficial to link durable and easily repairable products
with lsquohigh-qualityrsquo and lsquocost-savingsrsquo in the long-term Instilling such
associations with durability and reparability could alter social norms
towards the purchase of more durable and more easily repairable products
Recommendation 2 ndash Making repair easier Consumers are generally willing to
repair broken products yet their intentions can easily be tainted if repair is viewed as
too much effort compared to simply replacing the product Repair could be made
easier for example by
o Making essential product components replaceable by consumers
o Including repair instructions for minor defects in user manuals o Ensuring the availability of spare parts in the longer run For example by
requiring manufacturers to provide spare parts for a defined time period
(and also after a product has been discontinued)
o Encouraging manufacturers to offer a commitment to repair Commitments
could function in a similar way to manufacturer guarantees The study
found consumers have high trust in these guarantees and they are more
likely to seek repair of a product if it is covered by guarantee
Recommendation 3 ndash Create financial incentives for reparability and durability
Building on the importance of price in consumer decision-making fiscal instruments
providing economic incentives to producers and consumers to produce and
5 Willingness-to-pay for additional durability of smartphones was measured in months and subsequently extrapolated to years A linear relationship between time and willingness-to-pay was assumed (ie each extra month has the same value)
6 The willingness-to-pay was measured per year for durability and per two-step increase on the A-G scale for reparability(eg from G to E C to A)
Behavioural Study on Consumersrsquo Engagement in the Circular Economy
13
purchaserentlease durable products or to repair could enhance CE engagement
However further consumer research would be required to determine if there is
sufficient price sensitivity in consumers for such stimuli to be effective
Recommendation 4 - Making durability and reparability information available at the
point of sale The study showed that consumers lack durability and reparability
information and that the provision of such information is potentially very influential on
purchasing decisions Therefore the following options should be explored
o Integrate durability and reparability information into existing (EU) labels
o Develop new EU rules for this purpose
o Examine the development of a scoring system for reparability of products7
o Provide information to consumers on the availability of spare parts and
repair services
Recommendation 5 ndash Strengthened enforcement of legislation requiring the
provision of accurate information to consumers The provision of information not
only needs to be presented in a way that consumers can understand and effectively
use in their decision-making but it also needs to be accurate In order to ensure the
accurate provision of information to consumers at the point of sale continued and
strengthened enforcement of national consumer laws (such as on unfair commercial
practices) is of great importance to support consumers in their choices surrounding
engagement in the Circular Economy
7 For more information see httpsusprocjrceceuropaeuScoringSystemOnReparabilityindexhtml
Behavioural Study on Consumersrsquo Engagement in the Circular Economy
14
1 Introduction and background
The purpose of this behavioural study on consumersrsquo engagement in the Circular
Economy was to provide policy-relevant insights to assist with the implementation of the
EU Circular Economy Action Plan especially an analysis of options and actions for a more
coherent policy framework for the different work elements in the area of EU product
policy in their contribution to the Circular Economy In particular the study informed the
durability and reparability aspects of the Ecodesign and Energy Labelling framework (as
set out in the Ecodesign Working Plan 2016-2019)
11 Policy context
Action on the circular economy ties in closely with key EU priorities including jobs and
growth the investment agenda climate and energy the social agenda and industrial
innovation and with global efforts on sustainable development8 Although the European
commitment to a transition to the Circular Economy is relatively recent it is now
regarded as an essential contribution to the EUrsquos efforts to develop a sustainable low
carbon resource efficient and competitive economy9 Transition to a Circular Economy in
the EU was first promoted in a European Commission Communication ldquoTowards a
Circular Economyrdquo (COM2014398) in 2014
This was followed by the adoption of an ambitious Circular Economy Package in
December 2015 containing various elements to stimulate Europes transition towards a
Circular Economy with resources used in a more sustainable way including revised
legislative proposals on waste and a comprehensive action plan ldquoClosing the loop - An EU
action plan for the Circular Economyrdquo (COM20150614 Final) The proposed plans and
actions are expected to contribute to ldquoclosing the looprdquo of product lifecycles through
greater recycling and re-use while also fostering energy saving and reducing greenhouse
gas emissions
The Circular Economy Package established a clear long-term vision to increase recycling
and reduce landfilling while proposing concrete measures to address obstacles on the
ground to improve waste management and taking into account the different situations
across Member States The following are relevant in this regard10
Directive of The European Parliament and of The Council amending Directive
200898EC on Waste11
Proposed Directive on the landfill of waste (amending Directive 199931EC)12
Proposed Directive on packaging and packaging waste (amending Directive
9462EC)13
Directive on end-of-life vehicles on batteries and accumulators and waste batteries
and accumulators and on waste electrical and electronic equipment (amending
Directives 200053EC 200666 and 201219EU)14
The EU Action Plan for the Circular Economy15 establishes a concrete and ambitious
programme of action with measures covering the whole cycle from production and
8 COM20150614
9 European Commission Communication Towards a Circular Economy (COM2014398) in 2014
10 httpwwweuroparleuropaeuEPRSEPRS-Briefing-573936-Circular-economy-package-FINALpdf
11 httpseur-lexeuropaeulegal-contentENTXTPDFuri=CONSILPE_11_2018_REV_2ampfrom=EN
12 httpseur-lexeuropaeulegal-contentENTXTPDFuri=CELEX52015PC0594ampfrom=EN
13 httpseur-lexeuropaeuresourcehtmluri=cellarb68494d2-999f-11e5-b3b7 01aa75ed71a1001902DOC_1ampformat=PDF
14 httpwwweuroparleuropaeusidesgetDocdopubRef=-EPTEXT+TA+P8-TA-2018-
0113+0+DOC+XML+V0ENamplanguage=ENBKMD-9
15 European Commission Communication Closing the loop - An EU action plan for the Circular Economy (COM20150614 Final)
httpeur-lexeuropaeulegal-contentENTXTuri=CELEX52015DC0614
Behavioural Study on Consumersrsquo Engagement in the Circular Economy
15
consumption to waste management and the market for secondary raw materials An
annex to the Action Plan sets out the timeline of when the actions will be completed By
stimulating sustainable activity in key sectors and new business opportunities the Action
Plan is believed to help to unlock the growth and jobs potential of the Circular Economy
The transition to a Circular Economy will be supported financially by ESIF funding euro650
million from Horizon 2020 (the EU funding programme for research and innovation) euro55
billion from structural funds for waste management and investments in the circular
economy at national level16
One relevant initiative in the Action Plan timetable17 in the context of this study is to
ldquoexamine options and actions for a more coherent policy framework of the different
strands of work of EU product policy in their contribution to the circular economyrdquo
scheduled for 2018 According to the Action Plan EU product policy includes ldquoEcodesign
Energy Labelling Ecolabel Green Public Procurement and other relevant product
legislationrdquo Therefore some relevant legislation pertinent to the present study
includes18
Energy Labelling Regulation (repealing Directive 201030EU)19
Regulation on the EU Ecolabel (Regulation (EC) No 662010)20
Ecodesign Directive (Directive 2009125EC)21
Energy Efficiency Directive (Directive 201227EU)22
Further legislation relating to Green Public Procurement23
Legislation on waste from consumer goods24 including the proposed directives
mentioned above
Of particular relevance is the Energy Labelling Regulation which in addition to revising
the energy efficiency scale to a scale of A to G also includes for the majority of product
groups the absolute energy consumption in order to assist consumers to understand the
impact on energy bills The regulation also states
ldquoThe Commission should provide a long-term working plan for the revision of labels for
particular energy-related products including an indicative list of further energy-related
products for which an energy label could be established The working plan should be
implemented starting with a technical environmental and economic analysis of the
product groups concerned That analysis should also look at supplementary information
including the possibility and cost of providing consumers with information on the
performance of an energy-related product such as its energy consumption durability or
environmental performance in coherence with the objective to promote a circular
economy Such supplementary information should improve the intelligibility and
effectiveness of the label towards consumers and should not lead to any negative impact
on consumersrdquo (Clause 39)
Most recently the Commission published in early 2018 its report on the implementation
of the Circular Economy Action Plan25 which presents an overview of actions already
16 European Commission press release of 2 December 2015 httpeuropaeurapidpress-release_IP-15-
6203_enhtm
17 httpeur-lexeuropaeuresourcehtmluri=cellar8a8ef5e8-99a0-11e5-b3b7-
01aa75ed71a1001202DOC_2ampformat=PDF
18 Further relevant legislation might include Directive 200933EC on the promotion of clean and energy-
efficient road transport vehicles and Regulation (EC) No 1062008 on energy-efficiency labelling of office equipment
19 httpseur-lexeuropaeulegal-contentENTXTPDFuri=CELEX32017R1369ampfrom=EN
20 httpeur-lexeuropaeulegal-contentENTXTuri=CELEX32010R0066
21 httpeur-lexeuropaeulegal-contentENTXTuri=CELEX02009L0125-20121204
22 httpeur-lexeuropaeulegal-contentENTXTuri=CELEX32012L0027
23 httpeceuropaeuenvironmentgppeu_related_enhtm
24 httpeur-lexeuropaeusummarychapterenvironment200403htmlroot=200403
Behavioural Study on Consumersrsquo Engagement in the Circular Economy
16
delivered and introduces key deliverables for 2018 Some actions key in initiatives set
out in the report that were especially relevant in the context of the present study
include
Adoption of the Ecodesign Working Plan 2016-2019 which outlines the priorities for
the coming years in terms of new product groups for investigation and reviews of
existing Ecodesign and Energy Labelling regulations
Moves by European standardisation organisations on the Commissionrsquos request to
develop generic standards on the durability reusability and recyclability of products
(with the submission of a working plan and establishment of a working group)
Updated Guidance on the Unfair Commercial Practices Directive26 which includes
specific elements to make green claims more trustworthy and transparent
The Commissionrsquos publication of the Fitness Check on EU Ecolabel in 201727
12 Objectives of the study
The project addressed three objectives
Identify barriers and trade-offs faced by consumers when deciding whether to engage
in the circular economy in particular whether to purchase a more or a less durable
good whether to have a good repaired or to discard it and buy a replacement
Establish the relative importance of economic social and psychological factors that
govern the extent to which consumers engage in the circular economy especially
purchasing durable products and seeking to repair products instead of disposing of
them and
Propose policy tools to enable and encourage consumers to engage in circular
economy practices related to durability and reparability
The study did not use a precise definition of what constitutes a lsquodurablersquo or lsquorepairablersquo
product Instead it was one of the main aims of the study to uncover what consumers
associate with the concepts of lsquodurabilityrsquo and lsquoreparabilityrsquo The study thus potentially
takes a different point of view on these CE concepts compared to studies that are
focussed on industry standards Naturally industry standards require clear definitions of
what can be considered a lsquodurablersquo or lsquorepairablersquo product to be enforceable This study
instead covers the views and perceptions around durability and reparability of the general
population across different EU Member States
To meet the objectives of the study three main areas of work have been undertaken
A preparatory phase involving a literature review desk research collection of market
data collection of information on business practices assessment of repair service
business models and focus groups with consumers This early phase formulated
hypotheses for testing in the behavioural experiment (see below) In addition the
evidence collected in this phase contributed to answering the research questions set
out in the Tender Specifications and to the development of analytical conclusions and
policy recommendations
Behavioural experiment and surveys This task tested the hypotheses formulated in
the preparatory phase through a behavioural experiment and consumer survey in
Sweden Germany Ireland Spain Czech Republic and Romania The behavioural
experiment firstly tested situations in which consumers take durability andor
reparability information on products into account in purchasing decisions and
secondly situations in which respondents choose to repair rather than replace
products for five productsproduct categories
A consumer survey was conducted in Austria the Czech Republic Germany Spain
France Hungary Ireland Latvia the Netherlands Portugal Romania and Sweden
The survey explored consumersrsquo understanding of lsquodurabilityrsquo and lsquoreparabilityrsquo their
25 httpeceuropaeuenvironmentcircular-economyindex_enhtm
26 httpeceuropaeujusticeconsumer-marketingfilesucp_guidance_enpdf
27 httpeceuropaeuenvironmentemasemas_publicationspolicyfitness_check_enhtm
Behavioural Study on Consumersrsquo Engagement in the Circular Economy
17
engagement in the Circular Economy and drivers and barriers to this
(non-)engagement and their expectations understanding and awareness with
respect to durability and reparability
Analysis of results conclusions and policy recommendations which involved
quantitative and qualitative analysis in order to develop analytical conclusions and
recommendations for EU level policy tools
Behavioural Study on Consumersrsquo Engagement in the Circular Economy
18
METHODOLOGY
Behavioural Study on Consumersrsquo Engagement in the Circular Economy
19
2 Methodology
This section presents brief overviews of the methods applied for each of the strands of
research Some parts refer the interested reader to the annex document which contains
further details
The section is organised as follows
Section 21 presents the country selection
Section 22 presents the product selection
Section 23 presents the approach to the literature review and desk research
Section 24 presents the approach to the stakeholder interviews
Section 25 presents the methodology for the focus groups
Section 26 presents a short description of the consumer survey including brief details
on the sampling and questionnaire content
Section 27 presents how the behavioural experiments for this study were conducted
including a brief description of the tasks experimental treatments outcome
measures and incentives
21 Country selection
The sample of Member States covered in the study needed to reflect different levels of
CE engagement and aim for the broadest geographical coverage possible To create a
robust indicator of CE engagement across the EU Member States two types of measures
were used in the country selection namely consumersrsquo self-declared attitudes towards
different aspects of the Circular Economy and their actual behaviour with respect to the
Circular Economy
To capture consumersrsquo attitudes published data from Eurobarometers 388 and 397 was
used as follows
General environmental impact This dimension described how much the
environmental impact of goods or services influences consumersrsquo choices of goods or
services based on question 5 of Flash Eurobarometer 397 survey (ldquoConsidering
everything you bought during the last two weeks did the environmental impact of
any goods or services influence your choicerdquo)
Durability of products This dimension captured the importance of the longevity of
products to consumers in their purchasing decisions based on question 11 of Flash
Barometer 388 survey (ldquoWhich of the following aspects do you consider most
important when buying a durable product like a washing machine or a fridgerdquo
where respondents could select ldquoYou can use the product for a long timerdquo as an
answer option)
Recycling This dimension captured the relevance of the recyclability of products in
consumersrsquo purchasing decisions based on question 11 of Flash Barometer 388
survey (ldquoWhich of the following aspects do you consider most important when buying
a durable product like a washing machine or a fridgerdquo where respondents could
select ldquoThe product can be recycled after you use itrdquo as an answer option)
Reuse of products This dimension captured the importance to consumers of being
able to resell products based on question 11 in Flash Barometer 388 survey (ldquoWhich
of the following aspects do you consider most important when buying a durable
product like a washing machine or a fridgerdquo where respondents could select ldquoYou
can easily sell the product when you no longer want to use itrdquo as an answer option)
To capture consumersrsquo behaviour (ie the extent that their attitudes materialise)
Eurostat statistics were used to describe Member States on two variables
Recycling rate This dimension represented the actual recycling rate across
countries based on Eurostat statistics (dataset Municipal waste by waste operations
code env_wasmun)
Waste production This dimension captured how much waste each country
generates per capita (again using Eurostat data)
Behavioural Study on Consumersrsquo Engagement in the Circular Economy
20
The country selection was based on these six dimensions The selection captured
different parts of the distribution for these six measures (ie countries with relatively
high levels and those with relatively low levels) while paying attention to the
geographical coverage (ie the selection covered all the different regions of the EU
North South East and West) such that the findings may be extrapolated to all the
Member States Iceland and Norway
For the online survey and experiment the country selection comprised of
Survey (12 countries) Austria Netherlands Sweden Czech Republic Germany
France Ireland Hungary Latvia Spain Portugal and Romania
Behavioural experiment (6 countries) Sweden Germany Ireland Spain Czech
Republic and Romania
The literature review covered literature published in English from all 28 Member States
and further literature in seven additional European languages (French German Czech
Hungarian Dutch Portuguese and Romanian)
Additional online desk research and semi-structured interviews were conducted in
10 countries Austria Netherlands Sweden Czech Republic Germany France Ireland
Hungary and Romania This selection thus covered all experiment countries and ten of
the twelve survey countries (except Latvia and Portugal)
A subset of four of the six experiment countries were selected for the focus groups
these were Germany Ireland Sweden and the Czech Republic
The country selection is presented in the table below
Behavioural Study on Consumersrsquo Engagement in the Circular Economy
21
Table 1 Country selection
Literature review Online Desk
Research
Semi-structure
interviews
Consumer
focus group
Survey (S) Experiment
(E)
English
National
language
AT EN DE x x S
BE EN FR NL
BG EN
HR EN
CY EN
CZ EN CZ x x x S + E
DK EN
EE EN
FI EN
FR EN FR x x S
DE EN DE x x x S + E
EL EN
HU EN HU x x S
IE EN x x x S + E
IT EN
LV EN S
LT EN
LU EN FRDE[1]
MT EN
NL EN NL x x S
PL EN
PT EN S
RO EN RO x x S + E
SK EN
SI EN
ES EN ES x x S + E
SE EN x x x S + E
UK EN
Count 28 10 10 10 4 S=12 E=6
Note The researchers searched for literature from Luxembourg in English French and German Luxembourgish was not covered
22 Product selection
This section provides an overview of the criteria applied for the selection of the products
the study focuses on The study covered five products based on their relevance for the
Circular Economy namely smartphones televisions vacuum cleaners dishwashers and
clothing
The product selection followed four criteria Each criterion has been applied to ten
potential products that could have been covered in the project which formed the basis
for our suggested choice This choice was then narrowed down to the five products
mentioned above
bull Criterion 1 The first criterion concerned the reasoning on why consumers
replace a product The sample contains products that are replaced mainly for
fashion reasons and products that are replaced only if broken or technologically
outdated
bull Criterion 2 This criterion aimed to cover different options for more circular
processes offered by different products (eg repair recycling reuse or sharing)
bull Criterion 3 The third criterion described the potential positive environmental
outcomes that could be achieved by reducing resource use in these product
categories (eg environmental performance throughout their lifecycle product
environmental footprint (PEF) and organisation environmental footprint (OEF))
bull Criterion 4 The final criterion related to the political relevance of the product
category especially whether the product was covered by a number of different
Behavioural Study on Consumersrsquo Engagement in the Circular Economy
22
relevant Directives like the Ecodesign Directive andor Energy Labelling Regulation
or in other EU studies on similar subjects Additionally a product type was
favoured if existing industry initiatives show that the industry sees some potential
for Circular Economy changes
Using these criteria on an initial set of products the Consortium finally selected the
following five products mentioned
1 Smart phones purchases are innovation and fashion driven as innovation cycles
are swift and smart phones are important status symbols There is a big potential
for recycling and repair use of critical raw materials many on-going initiatives
and lastly they fall within the scope of the Ecodesign Directive were a focus of a
REFIT (Regulatory Fitness and Performance) study on consumer rules (EC DG
Justice and Consumer 2016) and were also covered in an EU study on lifespan
labelling (European Economic and Social Committee 2016)
2 Televisions innovation cycles have been also very quick in recent years but
compared to smart phones TV are less of a status symbol so it should be
expected that innovation is important in the purchasing decision and fashion less
so There is a large potential for repairing and recycling use of critical raw
materials and high GHG emissions there are many on-going initiatives and lastly
TVs are covered by the Ecodesign Directive and the Energy Labelling Directive
and were studied in the REFIT study recent studies on energy labelling (London
Economics amp Ipsos 2014) and lifespan labelling (European Economic and Social
Committee 2016) and the study on EU environmental and carbon footprint label
options conducted in 2012 (London Economics Ipsos amp AEA 2012)
3 Vacuum cleaners as innovation cycles are slower than in TV and smart phones
and vacuum cleaners are less of a status symbol purchasing decisions are
probably more driven by durability and less by technology or fashion There is a
large potential for recycling and repairing and some potential for sharing Vacuum
cleaners are covered by the Ecodesign Directive and the Energy Labelling
Regulation and were studied in the lifespan labelling study (European Economic
and Social Committee 2016)
4 Dishwashers as innovation cycles are slower than in TV and smart phones and
dishwashers are less of a status symbol purchasing decisions are again probably
more driven by the longevity (ie durability) of products there is some potential
for repair recycling and reuse high GHG emissions and lastly dishwashers are
covered by the Ecodesign Directive and the Energy Labelling Regulation
5 Clothing purchasing decisions are largely driven by fashion There is some
potential for repair and reuse and although they are not covered by the Energy
Labelling Regulation or Ecodesign Directive clothing items are covered by the
lifespan labelling study which studied trousers and sport shoes (European
Economic and Social Committee 2016)
Furthermore including clothing in the sample had an added value since technological
innovation is not such an important factor for clothing compared to the other product
categories For the other four product categories fashion plays a smaller role when
replacing a product
23 Methodology for the literature review and desk research
A literature review of existing English-language studies and documents in all EU Member
States Norway Iceland and four other non-European countries (Canada Switzerland
Japan and the United States) was carried out Additionally literature in six other
languages namely French German Czech Dutch Spanish and Romanian were
reviewed The literature review and desk research were conducted in parallel The aim of
the literature review was to provide an overview on the existing published knowledge
relevant to the research questions In order to answer the studiesrsquo research questions
(see Section 1 in the Annex document) the researchers focused on the following
aspects
Behavioural Study on Consumersrsquo Engagement in the Circular Economy
23
Characteristics of the Circular Economy such as durability and reparability of
products and the difference between durability and reparability characteristics
across the five product categories (televisions smartphones vacuum cleaners
dishwashers and clothes) types of information on durability and reparability of
products as well as key features of other circular practices such as product
leasing services and the sharing economy
Aspects of consumer purchasing decisions in the Circular Economy such as
consumer willingness to engage drivers barriers and trade-offs faced by
consumers consumer awareness understanding of and expectations about
durability and reparability and the role of durability and reparability information in
the purchasing decision
Market data on manufacturing complete recycling andor reuse consumption and
usage patterns and disposal trends) for the five products categories
Existing European and national policy measures in the area of the Circular
Economy and eco-innovation and their impacts at European and national level
Business models that can be found today in the Circular Economy with a focus on
product reparability and recyclability
During the literature review and desk research the study team pre-screened 224
documents including national and European consumer studies regulatory reports and
academic articles From those the study team fully analysed 105 documents Based on
the executive summaries or abstracts the documents were analysed if any of the
research questions seemed to be covered by the report The research questions were
structured and summarised into the following 10 themes to allow an easier overview
Theme 1 - Drivers barriers and trade-offs
Theme 2 - Willingness to engage
Theme 3 - Consumers expectations regarding durability
Theme 4 - Consumer expectations regarding reparability
Theme 5 - Importance of CE characteristics
Theme 6 - Durability information
Theme 7 - Reparability information
Theme 8 - After-sales expectations
Theme 9 - Policy tools
Theme 10 - Business models and market data
The collected information of the fully reviewed documents was organised in an excel file
to allow the analysis of all collected information by question
24 Methodology for the stakeholder interviews
241 List of stakeholders
During the inception phase a preliminary list of relevant stakeholders was developed
Relevant stakeholders were identified via desk research by searching for knowledgeable
individuals in 11 categories of organisations
European trade and businessindustry associations
European consumer associations
European NGOs in particular focusing on CEsustainable consumption
National public authorities
National consumer associations
National trade associations
National NGOs in particular focusing on CEsustainable consumption
Independent repair servicesassociations
Standardisationcertificationverification bodies
Eco-labelling bodiesinstitutions
Academics specialising in consumer-related policy and behavioural economics
The preliminary list of interviewees was further developed using suggestions of the
Commission and results of the desk research at Member State level The study team
identified additional organisations that hold up-to-date data and information about the
Circular Economy and contacted these organisations as well
Behavioural Study on Consumersrsquo Engagement in the Circular Economy
24
242 Preparation ahead of the interviewing process
To ensure that the study team had a full understanding of the questions and objectives of
both the study and the interviewing process the core team provided internal guidelines
to be used by the researchers The internal guidelines included
an introduction and the objectives of the study
research questions
descriptions of the research activities
The final interview guide is presented in Section 5 in the Annex document
243 Interviews at European and Member State level
The researchers contacted stakeholders at the European level in Switzerland and across
13 Member States Austria Belgium France the Czech Republic Germany Spain
Ireland the Netherlands Hungary Romania Sweden Portugal and the United Kingdom
Interviews aimed at obtaining up-to-date and first-hand information on the relevant
issues exploring in depth the study objectives with the help of the stakeholdersrsquo
expertise and lastly ensuring that no critical studies or data were missed
The interview questionnaire was shared with the interviewees allowing them to prepare
beforehand and gather necessary data before the interview
Most of the interviews were undertaken in the national languages In some specific
cases upon request from the stakeholders the interview guide was translated (ie
German Czech and Romanian)
Overall the study team completed 50 interviews Table 2 shows their distribution
between different types of stakeholders and between the 14 countries covered in this
study plus the European level
Behavioural Study on Consumersrsquo Engagement in the Circular Economy
25
Table 2 Distribution of interviews (in number of interviews)
Trad
e a
nd
bu
sin
ess
ind
ustr
y
asso
cia
tio
ns
Co
nsu
mer
asso
cia
tio
ns
NG
Os
focu
sin
g
on
CE
su
sta
inab
le
co
nsu
mp
tio
n
Pu
bli
c
au
tho
rit
ies
Acad
em
ics
exp
erts
Oth
er
To
tal
EU 6 3 1 10
AT 1 1
BE 1 2 1 4
CH 1 1
CZ 3 1 1 5
DE 1 1 2 1 5
ES 1 1 2
FR 1 1 2
HU 1 1 2
IE 1 1
NL 2 2 4
PT 1 1
RO 1 2 1 4
SE 1 2 3
UK 1 1 2 1 5
Total 50
The study team used a similar approach to conduct interviews to the approach used for
the literature review and desk research dividing the interview questions into the
following sections to allow a better overview and to help the interviewer structure the
interview
Section 1 - Drivers barriers and trade-offs
Section 2 - Willingness to engage
Section 3 - Consumers expectations on durability
Section 4 - Consumer expectations on reparability
Section 5 - Importance of CE characteristics
Section 6 - Durability information
Section 7 - Reparability information
Section 8 - After-sales expectations
Section 9 - Policy tools
Section 10 - Business models and market data
Behavioural Study on Consumersrsquo Engagement in the Circular Economy
26
Under each section there was a minimum set of three questions While the questions
under sections 1 5 6 7 and 9 were asked in all interviews the more detailed question in
the other sections were only asked if the interviewee had some expertise or interest in
the topics
The gathered information for the literature reviews and interviews was recorded in two
excel files The data in both files are structured by research question
25 Methodology for the focus groups
Eight consumer focus groups were carried out aiming to explore consumersrsquo awareness
understanding attitudes and expectations with regard to circular economy practices
Two focus groups were conducted in each of Ireland Germany Sweden and the Czech
Republic In each country groups were moderated in the local language Each group
session was designed to last 90 minutes
251 Sampling and recruitment
It was aimed to recruit on average eight participants per group In each country one
group was carried out with vulnerable consumers ndash defined as people who are in arrears
with household bills or who struggle from time to time with household bills and are in
any of the following situations unemployed retired long-term sick or disabled or single
parents28 The second group included a ldquomixrdquo of participants in terms of circular economy
engagement ndash people who tend to engage in circular economy practices people who tend
not to and people who tend to do this but only to a certain extent
In each group it was aimed to include a balanced mix of men and women aged 25 to 60
years old This age range was set in order to ensure that the age gap between
participants was not too wide bearing in mind the need to maximise communication and
participation and create an efficient group dynamic
In summary all participants had to meet the following eligibility requirements
Had not participated in another focus group in the past six months and
Had completed the screener questionnaire in order to assess their group membership
(circular economy engagement and vulnerability)
Respondents were recruited using the screener questionnaire In each country recruiters
were thoroughly trained by the project managers from the local fieldwork agencies The
recruitment process was strictly monitored
The following table presents the number of participants who took part in the focus groups
in each country as well as the fieldwork dates
Table 3 Participation in focus groups
Group Date Number of participants
Czech Republic Mixed 270617 8
Vulnerable 270617 8
Germany Mixed 060717 9
Vulnerable 060717 7
Ireland Mixed 050717 9
Vulnerable 050717 8
Sweden Mixed 290617 8
Vulnerable 290617 8
28 For a definition of consumer vulnerability see for example European Commission (2016) Consumer Vulnerability in Key Markets in the EU
Behavioural Study on Consumersrsquo Engagement in the Circular Economy
27
In each country participants received an incentive for attending the groups as a ldquothank
yourdquo for their participation The following table provides information with regards to the
incentives provided29
Table 4 Incentives for participation in focus groups
Country Incentive (per participant)
Czech Republic 700 CZK
Germany 50 EUR
Ireland 50 EUR
Sweden 600 SEK
252 Discussion guide
The discussion guide aimed to include questions that focused on three aspects of the
circular economy (durability reparability and recyclability) and referred to various types
of products (washing machinesdishwashers vacuum cleaners televisions smartphones
and clothing) The document was structured as follows
Introduction presentations introduction and brief definition of the three key concepts
(durability reparability and recyclability)
Awareness understanding attitudes and expectations regarding circular economy
practices
Barriers and drivers factors that encourage consumers from undertaking circular
economy practices as well as those that prevent them from it
Expectations with regard to information provision about durability reparability and
recyclability and how it should be presented
26 Methodology for the consumer survey
An online consumer survey was conducted in Austria the Czech Republic Germany
Spain France Hungary Ireland Latvia the Netherlands Portugal Romania and Sweden
with approx 1000 respondents each The obtained sample was representative in terms
of age gender and geographic region (see weighting strategy further below)
All survey participants received a monetary incentive for their participation in the survey
As outlined in the following section respondents who also conducted the experimental
task as part of the survey could earn additional incentives through their choices in the
experiment30
The survey contained questions in the following areas
Consumersrsquo understanding of lsquodurabilityrsquo and lsquoreparabilityrsquo
Consumersrsquo CE engagement and drivers and barriers of this (non-)engagement This
section included questions in the following sub-areas
o Experience with owning different types of products
o Experience with broken products
o Experience with repair and self-repair
o Experience with rentingleasing products and purchasing second hand
products
o The importance of durability and reparability information on purchasing
decisions
o General CE-related behaviours
Durability and reparability information
29 In each country incentives were established by the local agencies who conducted the groups according to their standard practice for compensating respondents for taking part in focus group research
30 The participation fee paid in Ipsos points converted into roughly euro1-euro2 depending on the country and the additional incentive paid for choices in the experiment amounted to an additional euro050 - euro1
Behavioural Study on Consumersrsquo Engagement in the Circular Economy
28
Expectations understanding and awareness with respect to durability and reparability
Buying versus leasing products
After-sales expectations
Socio-demographics and respondent attitudes and behavioural traits relevant to the
CE
This study did not address whether consumersrsquo attitudes were different for situations in
which products were still covered by the 2-year legal guarantee covering all goods sold in
the EU by additional Member State rules which are stricter than the 2-year legal
guarantee (eg in SE) or covered by additional (extended or commercial) warranties As
a result when asking respondents for example about their repair behaviour or after-
sales expectations the survey questions commonly referred to both guarantees and
warranties The survey did not give specific explanations about the difference of legal and
commercial guarantees
Sampling and weighting of the obtained data
Respondents in each country were randomly drawn from the online panels based on
available profile data (age gender and geographic region) and pre-defined sub-sample
sizes (ie quota) based on official population statistics published by Eurostat (2017)
ldquoFlexiblerdquo quota were used meaning that some leeway was granted to achieve the target
number of interviews in each sub-sample group In Romania the target number of
interviews for the oldest age group was not reached at the end of the fieldwork period
Any imbalance in the representativeness of the data due to the use of flexible quota is
managed using post-stratification weights Two types of weights are produced for this
study country weights and cross-national weights
Country weights adjust for gender and age distributions in each country such that the
weighted data matches the Eurostat statistics (2017) population data These weights are
applied when analysing the data at individual country level31
Cross-national weights adjust for country population size These weights are applied
when analysing the data across multiple countries Two weighting variables are included
in the dataset (1) a cross-national weighting variable to be applied when analysing all
12 countries (2) a cross-national weighting variable to be applied when only analysing
the six countries where respondents completed the experiment
31 These weights are generated using the iterative proportional fitting command ipfweight in Stata software package ipfweight is based on the iterative proportional fitting algorithm (also known as raking) first proposed by Deming and Stephan in 1940 It performs a stepwise adjustment of weights to achieve known population margins (gender and age) the adjustment process is repeated until the difference between the known population margins and the weighted margins of the variables gender and age is minimised
Behavioural Study on Consumersrsquo Engagement in the Circular Economy
29
Table 5 Sample composition Unweighted gender and age distribution
Country Number
of
completed
interviews
Gender
distribution (
unweighted)
Age distribution ( unweighted)
Men Women 18-
29y
30-
39y
40-
49y
50-
59y 60+y
AT 1005 518 482 154 176 193 198 279
CZ 1004 507 493 174 180 188 155 302
DE 1009 507 493 135 163 194 194 314
ES 1020 519 481 160 196 195 172 278
FR 1002 526 474 164 189 178 153 317
HU 1003 532 468 172 179 195 183 272
IE 1003 506 495 177 236 195 177 215
LV 1005 551 449 190 158 189 167 296
NL 1002 510 490 169 172 180 178 302
PT 1005 531 469 201 144 209 165 281
RO 1005 531 469 201 260 203 206 130
SE 1001 509 492 170 153 150 188 340
Source Ipsos analysis of fieldwork data
261 Random allocations of respondents to survey items product
categories and experimental treatments
As explained above the survey and experiment covered five different product categories
ndash dishwashers vacuum cleaners televisions mobile phones and clothing items ndash and
tested a large number of experimental treatments (see components of the purchasing
and repair experiments below) To keep the tasks manageable for respondents in terms
of time and complexity and to avoid respondent fatigue not all respondents answered
strictly all questions for all products Instead a system of random allocations was set up
to obtain a balanced data set across the various products and scenarios tested
To this end at the start of the consumer survey each respondent was asked about their
experience with purchasingowning any of the five products under examination and
whether they had purchased these products themselves (rather than having received
these as gifts or alike) and whether any of these products had broken down in the past
This information was then used to form three sets of respondents as shown below to
ensure respondents were routed to relevant questions throughout the survey
Set 1 Respondents in Set 1 answered in-depth survey questions for up to two
randomly selected products which they currently or previously owned and which
have broken down in the past Products which respondents purchased themselves
were prioritised
Sets 2 and 3 slightly relaxed some requirements of Set 1 in the following way
Set 2 Respondents in Set 2 answered questions for up to two randomly selected
products which they currently or previously owned and which they purchased
themselves Products which respondents have broken down were prioritised
Set 3 This set finally covered two randomly selected products where it was sufficient
for respondents to have simply owned the products Products which were bought
by the respondent and products which have broken down were prioritised but it was
not necessary to have such experiences to be included in Set 3
Behavioural Study on Consumersrsquo Engagement in the Circular Economy
30
The final allocation across sets and products was as follows
Table 6 Number of respondents allocated to different sets and products
Set Vacuum
cleaners
Dishwashers TVs Mobile
phones
Coat or
jacket
Set 1 2350 2008 2045 3053 1503
Set 2 4848 4096 4855 4893 4883
Set 3 4907 4463 4908 4914 4917
Allocations to the various treatments in the experimental tasks were done independently
and randomly across the different allocations This resulted in a full factorial design
between products and treatments This means that group sizes for different variants
within each treatment category were roughly equal and each respondent had the same
likelihood of being assigned to any specific treatment This also ensures that on average
there should not be any interactions between different types of experimental treatments
(see Section 9 in the Annex document for the full argument) In the analyses in the
following sections sample sizes for the various groups are mentioned in table notes
27 Methodology for the behavioural experiment
The behavioural experiment was embedded as an additional module within the general
consumer survey All respondents answered questions regarding their socio-demographic
background and general survey questions (see above) Respondents from countries in
which the behavioural experiment was conducted ie in the Czech Republic Germany
Spain Ireland Romania and Sweden additionally completed two additional tasks
namely a repair experiment and a purchasing experiment
The sequence of these different components is shown in Figure 1 below each component
is described in further detail in turn in the following sub-sections
Figure 1 Components and sequence of the consumer survey and behavioural experiment
Source LE Europe
Behavioural Study on Consumersrsquo Engagement in the Circular Economy
31
271 Components of the repair experiment
The repair experiment was targeted to test behaviour in the circular economy with a
focus on the drivers and barriers of repair decisions Furthermore it assessed attitudes
towards replacing broken products with second hand as opposed to brand new products
Respondents were given a scenario in which they owned a defective product which could
not be self-repaired and which due to its age was no longer covered by a legal
guarantee Respondents were asked to choose whether to have their product repaired or
to replace it either with a second hand or a brand new product
Decisions in the repair game followed a two-step process Firstly respondents were
asked to choose whether they wanted to repair a product or replace it Secondly if
respondents decided to replace a product they were asked to choose whether to replace
their faulty products with a second hand or brand new product
Example screenshots of both decisions are shown in the two figures below
The experiment was monetarily incentivised (see further below) and the prices used were
calibrated to closely mimic real decisions Repairing cost was approximately 25 of the
original product price (ie price of the broken product when it was new) Replacing the
defective product with a brand new version (new unused and of latest technology) cost
120 of the original product price Replacing it with a second hand product (used same
technology as defective product but fully functional) cost 70 of the original product
price The cost for repair or replacement was held constant within a product category
Figure 2 Decision to repair or replace in the repair experiment
Notes The picture of the mobile phone shown in this figure is different from the one seen in the experiment by
respondents for copyright reasons
Behavioural Study on Consumersrsquo Engagement in the Circular Economy
32
Figure 3 Decision to buy second hand or brand new in the repair experiment
Product coverage in the repair experiment
The experiment was conducted for TVs dishwashers vacuum cleaners smartphones and
coats Each respondent repeated the task for three different products Which products
were covered and the order in which respondents saw the different products were
randomised
Outcome measures of the repair experiment
There were two main outcome measures in this experimental task
Likelihood of choosing to repair
Likelihood of choosing a second hand product This choice was evidently only relevant
for respondents who chose to replace the product in the first stage
Experimental treatments in the repair experiment
The experimental treatments systematically varied the look and feel of the experimental
task for different respondents Allocations to the various treatments in the experimental
tasks were done independently and randomly across the different allocations This
resulted in a full factorial design between products and treatments This means that
group sizes for different variants within each treatment category were roughly equal and
each respondent had the same likelihood of being assigned to any specific treatment
This also ensures that on average there should not be any interactions between
different types of experimental treatments (see Section 9 in the Annex document for the
full argument)32
Effort treatment This treatment changed the relative cost of either repairing or
replacing the product by introducing a real effort task This treatment aimed to test
whether non-price related frictions such as search costs time investment etc
represent barriers for engagement in the CE There were three variants
32 Since the same percentage of participants were exposed to a specific treatment variant in all other treatments (eg the same number of respondents saw the no effort effort after repair effort after replace conditions in all other treatments) the effect of the treatment on other treatment is cancelled out on average In the analysis each treatment is analysed in isolation ie averaging across all variants of any other treatment This setup should safeguard that there is no lsquocontaminationrsquo between different types of treatments and is common practices in large-scale controlled behavioural experiments like this one (see for example the setup of the behavioural experiment (experiment 3) in the lsquoConsumer Market Study to support the Fitness Check of EU consumer and marketing lawrsquo European Commission 2017 available at httpeceuropaeunewsroomjustitem-detailcfmitem_id=59332
Behavioural Study on Consumersrsquo Engagement in the Circular Economy
33
o No effort Both repairing and replacing were lsquoeffortlessrsquo
o Repairing was associated with effort The repair decision was followed-up
by an effort task replacing an item (with a brand new version or a second
hand version) instead was effortless
o Replacing was associated with effort This was the flipside of the
above Effort was required for buying a second hand or a brand new
product while repairing was effortless
Figure 4 provides an example of the effort task associated with repairing The
effort task associated with replacing was the same except for the framing of the
reason for repair The fact that effort was required was announced in previous
stages of the repair experiment That is on the first decision screen see Figure 2
in the effort treatment it was indicated under lsquoSteps to takersquo that respondents
needed to complete an additional task
Figure 4 Effort in the repair experiment
Notes the picture of the mobile phone shown in the figure is different from the one seen in the experiment by respondents for copyright reasons
Framing of the source of repair This treatment varied who would repair the
product ndash the manufacturer or an independent repair shop Moreover it varied
whether the repair was done using original parts only or a mix of original and
non-original parts This setup resulted in the following 2 x 2 factorial design with 4
variants
Table 7 Design for the framing of the source of repair
Original parts only Original and non-
original parts
Manufacturer repair A B
Independent repair C D
The variants A amp C varied whether the manufacturer or an independent repair
shop would perform the repair Variants B amp D varied the type of spare parts to be
used for repair The treatment aimed to test whether certain characteristic of a
repair service make the option to repair more or less attractive
Behavioural Study on Consumersrsquo Engagement in the Circular Economy
34
The source of repair was shown to respondents with information on repair in the
first stage of the experiment (see Figure 2) Figure 5 provides an example of the
way that different sources of repair were shown
Figure 5 Framing of the source of repair in the repair experiment
Framing repair prices as VAT exempt This treatment had two variants and varied
whether prices were shown as including VAT or as VAT exempt This treatment aimed
to test whether framing repair prices as VAT exempt made the option to repair a
product more attractive This can be considered purely as an advertising practice
Prices were not varied ie VAT exempt prices were not actually cheaper compared to
VAT incl prices The treatment only tested the way prices were presented not the
actual price elasticity In the behavioural economics literature framing of choices is
often found to be very influential on how individuals perceive and choose between
options33
VAT exemption for repair was shown to respondents in two ways (see Figure 6)
Firstly the price for repair included explicit reference vat exemption or inclusion
Secondly a red-bordered label was shown if repair was VAT exempt
33 See for example UK Office for Fair Trading (2010) lsquoThe impact of price frames on consumer decision makingrsquo a report prepared by London Economics Tversky and Kahneman (1981) lsquoThe framing of decisions and the psychology of choicersquo Science Levin et al (1998) lsquoAll frames are not created equal A typology and critical analysis of framing effectsrsquo Organizational Behavior and Human Decision Processes
As a result this study aimed to test such framing effects only Standard economy theory tells us that demand for repair prices would increase if prices were lowered by the amount of VAT This study did not aim to measure the precise price elasticity of demand for repair services and thus omitted testing price changes in this treatment
Behavioural Study on Consumersrsquo Engagement in the Circular Economy
35
Figure 6 Framing of VAT exemption in the repair experiment
Each respondent was randomly allocated to one variant within each of the treatment
categories resulting in a full factorial experiment design (see Section 9 in the Annex
document for the full argument)
Incentives in the repair experiment
The repair experiment was incentivised Respondents could earn additional Ipsos survey
points through their choices More specifically respondents were given a budget for each
of the three rounds of the experiment task which they could use to pay for
replacingrepairing their products
The cost of repairingreplacing was deducted from the budget to reflect real-life
budgetary constraints Respondents then lsquoearnedrsquo points for the longevity of their
repaired (or replacement) product This latter mechanism reflected real-life monetary
advantage of durable products
The setup of the tasks and incentive structure were clearly explained before starting the
task (see box below) Additionally respondents answered comprehension questions on
the functioning of the task and incentives to ensure they indeed understood A more
detailed description of the experiment incentives is provided in Section 11 in the Annex
document
The following instructions34 were shown to respondents
TASK DESCRIPTION
You will play 3 rounds of this game
In every round you will be given a budget You can use this budget to repair or replace a
product Whatever you donrsquot spend you keep You will receive 1 point for every euro100
you have at the end of this survey
Like in reality you will get some lsquobenefitsrsquo from using a well-functioning product like the
pleasure of clean plates from your dishwasher or using technology on a smartphone
These benefits in form of additional survey points accrue over time You will get some
indication on the benefits of your choice but like in reality this information might not be
accurate The more benefits you get from your choice the more points you earn
Each choice is designed to be an attractive option so you must choose what you
think is the best choice for yourself
272 Components of the purchasing experiment
The purchasing experiment was targeted to test what drives CE considerations in
purchasing decisions In particular the experiment tested how the presentation of
product information regarding durability and reparability of products at the point of sale
impacts product choice and willingness-to-pay for better durability andor reparability of
products
34 Prices were converted into local currencies in non-Euro countries
Behavioural Study on Consumersrsquo Engagement in the Circular Economy
36
To this end respondents were given a scenario in which they needed to shop for a
product on a simulated e-commerce website showing them six products to choose from
(eg six different models of vacuum cleaners were shown and one needed to be
chosen) Figure 7 and Figure 8 show the basic components of this simulated website For
each product respondents saw the following picture name and price of the product and
a label The EU Ecolabel was employed when respondents needed to make decisions on
coats (see Figure 8) For all other products the EU Energy Label was used (see Figure 7)
Additionally durability andor reparability information was inserted as described further
below
Pictures and product names were varied across the 6 products The energy rating was
held constant at class lsquoBrsquo for all products (no rating applied to coats) This was done to
simplify the setup such that the impact of durability and reparability information could
clearly be measured
Figure 7 Purchasing experiment using EU Energy Labels
Notes The pictures of vacuum cleaners shown in this figure are different from the ones seen in the experiment by respondents for copyright reasons
Behavioural Study on Consumersrsquo Engagement in the Circular Economy
37
Figure 8 Purchasing experiment using EU Ecolabels
Notes The pictures of coats shown in this figure are different from the ones seen in the experiment by respondents for copyright reasons The experiment used gender-neutral images of coats
Product coverage in the purchasing experiment
Analogous to the setup of the repair experiment the purchasing experiment was also
repeated three times each time for a different product Each respondent thus was
randomly assigned to making purchasing decisions for 3 out of 5 products among TVs
dishwashers vacuum cleaners smartphones and coats
Outcome measures of the purchasing experiment
There were three main outcome measures in this experimental task
Preferences for durability Preferences for durability were measured as the
likelihood of choosing a product with a specific level of durability Moreover the
average durability per product category was measured across the different
experimental conditions as well as for different groups of respondents
Each product was assigned one of four levels of durability For each product category
a given durability level mapped to a specific number of yearsmonths of durability as
shown in the table below
Behavioural Study on Consumersrsquo Engagement in the Circular Economy
38
Table 8 Levels of durability and reparability in the purchasing experiment
Durability level Reparability
level
Vacuum
cleaners
Dish-
washers
TVs Smart-
phones
Coats All products
Level 1 10 years 15 years 7 years 42 months 10 years A
Level 2 7 years 10 years 5 years 36 months 7 years C
Level 3 4 years 5 years 4 years 30 months 4 years E
Level 4 2 years 2 years 2 years 24 months 2 years G
In the analyses further below we refer to respondents having either
o Preferences for high durability respondents who chose
the highest level of durability three times or
the highest level of durability twice and never the lowest level or
the highest level of durability once and the second highest level of
durability twice
o Preferences for low durability respondents who chose
the lowest level of durability three times or
the lowest level of durability twice and never the highest level or
the lowest level of durability once and the second lowest level of
durability twice and
o Intermediate preferences respondents who were neither had a preference
for high or low durability
o Preferences for reparability In analogy to the setup for durability there
were also 4 levels of reparability More specifically reparability was rated on
an A-G scale as a potential addition to the EU Energy Label Also analogously
respondents are referred to as having a high intermediate or low preference
for reparability These preferences were defined similarly as the definitions
used for durability preferences
o Willingness-to-pay Willingness-to-pay for additional durability or
reparability was measured via a choice modelling approach (see Section 8 in
the Annex document for a detailed methodology) In brief the products
presented to different respondents were systematically varied in terms of their
attributes price name picture durability and reparability35 For example
some respondents saw during the experiment a more expensive price for a
very durable product others saw a lower price for the same level of durability
Some saw products with higher others with lower durability and similarly for
reparability etc
WTP was then estimated using statistical methods by pooling responses across
respondents This approach avoids that respondents would be primed by any specific
product attributes or by any price relationships with durabilityreparability
Experimental treatments in the purchasing experiment
As for the repair experiment the experimental treatments systematically varied the look
and feel of the experimental task for different respondents Once again allocations to the
various treatments in the experimental tasks were done independently and randomly
across the different allocations This resulted in a full factorial design between products
35 Product attributes were varied in addition to varying the way this information was presented via experimental treatments (see next subsection)
Behavioural Study on Consumersrsquo Engagement in the Circular Economy
39
and treatments This means that group sizes for different variants within each treatment
category were roughly equal and each respondent had the same likelihood of being
assigned to any specific treatment This also ensures that on average there should not
be any interactions between different types of experimental treatments (see Section 9 in
the Annex document for the full argument)36
Framing of durability and reparability information All respondents were always
shown the EU Energy Label or Ecolabel (for coats) as shown in Figure 7 and Figure 8
This information treatment varied how and whether information on durability andor
reparability was available in addition to the EU EnergyEcolabel The setup was a full
factorial design with 2x6 variants as shown in Table 9 below (see Section 9 in the
Annex document for the full argument)
An example of how the experiment screen looked with durability information is shown
below in Figure 9 Table 9 then shows the different information variants and examples
of these are shown thereafter
Figure 9 Purchasing experiment using the EU Energy Label and durability information
treatment displayed as lsquoExpected lifetimersquo
Notes The pictures of mobile phones shown in this figure are different from the ones seen in the experiment by respondents for copyright reasons
36 Since the same percentage of participants were exposed to a specific treatment variant in all other treatments (eg the same number of respondents saw the no claim social claim savings claim conditions in all other treatments) the effect of the treatment on other treatment is cancelled out on average In the analysis each treatment is analysed in isolation ie averaging across all variants of any other treatment This setup should safeguard that there is no lsquocontaminationrsquo between different types of treatments and is common practices in large-scale controlled behavioural experiments like this one (see for example the setup of the behavioural experiment in the Lot 3 study to support the lsquoStudy for the Fitness Check of EU consumer and marketing lawrsquo European Commission 2017
Behavioural Study on Consumersrsquo Engagement in the Circular Economy
40
Table 9 Treatment variants of the framing of durability and reparability treatment
Notes [1] lsquoManufacturer warrantyrsquo and lsquoExpected lifetimersquo were not explained or defined further in the experiment It is a common market practice for manufacturers and retailers to display durability claims beyond the legal guarantee of 2 years in this way Manufacturer warranties and expected lifetimes may be seen as a service to consumers or a possible signal for quality but the experiment remained silent about the precise meaning
[2] Durability on EU labels was defined as The period in which the manufacturer promises to replace or repair the product free of charge
[3] Reparability on EU labels was defined as Ease-of-repair rating based on availability of repair manuals spare parts and repair services
The lsquomini labelrsquo refers to a reduced version of the EU Energy Label which was shown as
part of the product description Such lsquomini labelsrsquo are commonly found in product
descriptions of online retailers Full labels instead are usually shown on products in brick-
and-mortar shops Like in reality clicking on the label expanded it to the lsquofull labelrsquo
version and showed additional information on the label elements (eg descriptions of the
meaning of its elements) In the lsquofull labelrsquo variants the full EU Energy Label was
featured on the product descriptions right away Clicking on the label expanded its size
and showed additional information as in the mini version The two label versions as they
appeared in the purchasing experiment are shown in the figure below
Durability information Reparability
information
Label type Variant
number
Not shown Not shown Mini label 1a
Full label 1b
Shown on EU label[2]
(handshake icon amp years
months)
Not shown Mini label 2a
Full label 2b
Not shown Shown on EU label
(spanner amp screwdriver
icon with A-G rating)[3]
Mini label 3a
Full label 3b
Shown on EU label[2]
(handshake icon amp years
months)
Shown on EU label
(spanner amp screwdriver
icon with A-G rating)[3]
Mini label 4a
Full label 4b
Shown as lsquoManufacturer
warrantyrsquo[1] not on EU
label
Not shown Mini label 5a
Full label 5b
Shown as lsquoExpected
lifetimersquo[1]
not on EU label
Not shown Mini label 6a
Full label 6b
Behavioural Study on Consumersrsquo Engagement in the Circular Economy
41
Figure 10 Full label and lsquomini-labelrsquo in the purchasing experiment
The different types of durability and reparability information were shown to respondents
either within an EU label (ie EU Energy or EU Ecolabel) or outside of it Figure 11 shows
the look of durability and reparability information within the EU Energy Label The label
using the handshake icon represents durability information (here 15 years)37 The label
with the spanner and screwdriver icon represents reparability information (here category
A)38
Clicking on the EU labels enlarged the label and provided additional information on the
meaning of the different label elements Durability and reparability were defined as
follows
bull Durability The period in which the manufacturer promises to replace or
repair the product free of charge
bull Reparability Ease-of-repair rating based on availability of repair
manuals spare parts and repair services
37 Different icons were discussed for representing durability in the experiment design phase The handshake icons was chosen but not tested beforehand It is thus possible that other types of icons would be more or less effective compared to the icon chosen for this study
38 As for durability different icons were discussed for representing reparability as well Previous studies seemed to suggest that the chosen A-G scale is well understood by consumers Instead scales with for example star ratings or numeric ratings may work less well
Behavioural Study on Consumersrsquo Engagement in the Circular Economy
42
Figure 11 Durability and reparability information within EU labels
Notes the handshake icon shown in the figure is different from the one seen by respondents in the experiment for copyright reasons
Label variants as numbered in Table 9 above From left to right 1b 2b 3b 4b Durability ranged from 2-10y for VC 2-15y for DW 2-7y for TVs 2-10y for coats and 24-42 months for smartphones Reparability took values A C E or G (see Table 8)
Figure 12 shows durability information shown outside of an EU label as it would appear
in the experiment for smartphones As the figure shows the EU label was always shown
to respondents
Figure 12 Durability information outside of EU labels
Note Label variants as numbered in Table 9 above From left to right 1b 5b 6b Durability ranged from 2-10y for VC 2-15y for DW 2-7y for TVs 2-10y for coats and 24-42 months for smartphones (see Table 8)
Behavioural Study on Consumersrsquo Engagement in the Circular Economy
43
The way durability and reparability information were shown was carefully designed in line
with existing evidence on the types of labels which can be expected to be most impactful
and best understood by consumers A European Commission study39 on environmental
labelling tested star ratings lsquowater droprsquo ratings and letter (A-G) ratings and found that
the letter rating was universally best understood The study revealed that star ratings
were appealing to consumers which was also found in focus group discussions in this
study (see section 63) however this appeal did not translate into better understanding
Similar conclusions were also drawn by an EESC study40
Another European Commission study in 201741 tested the presentation of durability
information in terms of years and functional lifetime The study showed that providing
durability information had an impact on behaviour but there was no difference between
the different presentations of durability information Other evidence instead seems to
suggest that consumers find it difficult to understand functional lifetime information
because they have difficulty estimating the meaning of different unit or their use of
products42
Nudges and claims about durability This treatment varied whether respondents
would see a claim highlighting potential positive impacts of durability Similar claims
have been shown to have significant effects on subsequent behaviour43 The following
variants were used
o No claim Respondents did not see any claim about durability
o Claim about long-term savings Respondents in this variant saw the claim
that more durable products may generate long-term savings Figure 13 shows
a screenshot of this claim in the experiment
o Claim about other people Respondents in this variant saw a different claim
which stated that the majority of people choose more durable and more easily
repairable products Figure 14 provides an example of the claim as used in the
purchasing experiment
Figure 13 Savings claim in purchasing experiment
Notes The claim was shown to respondents in the respective treatment as a pop-up on screen at the beginning of each purchasing stage
39 European Commission (2012) lsquoResearch on EU product label options - Study delivered by Ipsos MORI London Economics and AEArsquo available at httpseceuropaeuenergysitesenerfilesdocuments2012-12-research-eu-product-label-optionspdf
40 European Economic and Social Committee (2016) lsquoThe Influence of Lifespan Labelling on Consumersrsquo available at httpswwweesceuropaeuresourcesdocs16_123_duree-dutilisation-des-produits_complet_enpdf
41 European Commission (2017) lsquoConsumer Market Study to Support the Fitness Check of EU Consumer and Marketing Lawrsquo a study by GfK Belgium available at httpeceuropaeunewsroomjustitem-detailcfmitem_id=59332
42 Larrick Soll (2008) lsquoThe MPG Illusionrsquo Science Schwarz (1999) lsquoSelf-reports How the questions shape the answersrsquo American psychologist
43 See The Behavioural Insights Team (2015) EAST Four simple ways to apply behavioural insights available at httpwwwbehaviouralinsightscoukwp-contentuploads201507BIT-Publication-EAST_FA_WEBpdf Allcott (2011) lsquoSocial norms and energy conservationrsquo Journal of Public Economics Coffmann et al (2017) lsquoCan Social Information Affect What Job You Choose and Keeprsquo American Economic Journal Applied Economics
Behavioural Study on Consumersrsquo Engagement in the Circular Economy
44
Figure 14 Social claim in purchasing experiment
Notes The claim was shown to respondents in the respective treatment as a pop-up on screen at the beginning of each purchasing stage
This lsquoclaimsrsquo treatment was tested in addition to the treatment above which varied
whether and how durabilityreparability information was disclosed It could be expected
that the claims treatment would have increased the attention respondents paid to the
durabilityreparability information in the other treatment ie there could have been a
positive interaction between these two treatment conditions Due to the way the
experiment was set up such potential lsquocontaminationrsquo effects have been controlled for
because there was an equal number of respondents who saw lsquono claimrsquo the lsquosavings
claimrsquo and the lsquosocial claimrsquo and who would have seen respectively lsquono CE informationrsquo
lsquodurability information on an EU labelrsquo etc When analysing the results of the information
treatment an average of all respondents in the claims treatment is taken (ie including
those who saw a claim and those who did not) such that one would expect the effect of
the lsquoclaimsrsquo treatment to average out and not contaminate the lsquoinformationrsquo treatment
This approach is common practice in similar controlled behavioural experimental studies
(see for example the design of the Lot 3 study supporting the lsquoStudy for the Fitness
Check of EU consumer and marketing lawrsquo European Commission 2017 and the Annex
for a theoretical development of the validity of this approach)
Incentives in the purchasing experiment
Similar to the setup of the repair experiment the purchasing experiment also had
additional monetary incentives
The following instructions44 were shown to respondents
TASK DESCRIPTION
You will play 3 rounds of this game
In every round you will be given a budget You can use this budget to purchase
products in this game Whatever you donrsquot spend you keep You will receive 1 point
for every euro100 you have at the end of this survey
Like in reality you will get some lsquobenefitsrsquo from using a product like the pleasure of
watching a film on a nice TV or looking good in a new coat These benefits in form of
additional survey points accrue over time You might get some indication on how
long the product will work well but like in reality this information might not be accurate
The more benefits you get from a product the more points you earn
Each product is designed to be an attractive option so you must choose what you
think is the best product for yourself
As for the repair experiment respondents were given a budget for each of the three
rounds of the experiment task which they could use to pay for purchasing the products
44 Prices were converted into local currencies in non-Euro countries
Behavioural Study on Consumersrsquo Engagement in the Circular Economy
45
The cost of the purchased product was deducted from the budget to reflect real-life
budgetary constraints Respondents then lsquoearnedrsquo points for the longevity of their
products This latter mechanism reflected real-life monetary advantages of durable
products
As before respondents completed a comprehension stage with a detailed description of
the task and incentives as well as comprehension questions
Behavioural Study on Consumersrsquo Engagement in the Circular Economy
46
EVIDENCE AND FINDINGS
Behavioural Study on Consumersrsquo Engagement in the Circular Economy
47
3 Consumersrsquo willingness to engage in the Circular Economy
This section of the report provides information gathered from the literature stakeholder
interviews focus groups and consumer survey on consumersrsquo willingness to consider the
durability andor reparability of products in other words consumersrsquo willingness to
engage in the Circular Economy This section highlights if why and how consumers take
the durability and reparability of products into account in general for example when
purchasing new products and when using products
Later sections dive deeper into many of the topics which were touched upon in this
section
Key findings
All strands of research demonstrated that consumers were generally willing
to consider the durability and reparability of products when purchasing new
products
All strands of research found indications that consumers are motivated to engage
in the CE because they care for the environment The focus groups furthermore
highlighted that being able to save money was another key motivator for
purchasing more durable products
A majority of survey respondents claimed to be aware of the durability of the
products they purchased (64) as well as of repair services (58)
Respondents also indicated that they frequently searched for durability and
reparability information of products (62 for durability and 55 for
reparability) Yet as found in the further analysis presented in section 4
respondents often felt durability and reparability information was difficult to find
and would like to receive better information regarding these types of product
characteristics
A majority of respondents (93) reported that they kept things they owned for a
long time recycled unwanted possessions (78) and repaired possessions if they
broke (64) Respondents furthermore felt that their peers (close friends and
family) displayed similar levels of engagement in CE practices
These stated attitudes in the survey were widely supported by the literature
stakeholder interviews and focus groups
Some previously conducted surveys assessed as part of the literature review
found that consumers are at least to some extent willing to change their
lifestyle to address sustainability issues In particular some previous studies
as well as interviews with stakeholders have documented that consumer are
willing to pay for products with better environmental credentials Yet the French
CREDOC for example reported that consumers could be reluctant to adopt more
sustainable purchasing choices Other experts have highlighted that survey
research needs to be interpreted with caution as there might be a discrepancy
between what people say about their CE behaviours and what they
actually do
Generally there was agreement across the different strands of research that
many CE decisions depend on a trade-off between price and other considerations
(such as eg quality convenience caring for the environment being good at
repairing) The literature stakeholder interviews and focus groups reported a
certain level of caution towards CE product characteristics Consumers may find it
difficult to assess whether repairing a product would be worthwhile whether
refurbished or second hand products presented good value for money Such
uncertainty can lead consumers to purchase brand new products instead
especially when the price difference between new and second hand or
refurbished products is not substantial
Regarding product-specific willingness to engage in the CE according to the
literature stakeholders and focus groups durability and reparability were seen as
most important for large more expensive and less fashion-dependent products
such as white goods Instead these CE credentials were seen as less important
for fashion and technology items which are replaced more frequently At the same
time consumers can become attached to fashion items especially clothing which
then makes them reluctant to replace items and opt for repair instead
Behavioural Study on Consumersrsquo Engagement in the Circular Economy
48
Furthermore for fashion products there was a higher willingness to buy second
hand (clothes smartphones) or to rent or lease such products (smartphones)
It emerged from the focus group discussions that some consumers especially
those in potentially vulnerable situations were interested in purchasing
smartphones second hand to save money compared to brand new phones
A minority yet still sizable share of survey respondents were interested in
engaging with novel CE practices such as leasing products instead of
purchasing them The share of respondents who would be willing to lease a
product rather than purchase it was lowest for vacuum cleaners (10) and
highest for smartphones (25) These relatively low levels of interest may have
been partly driven by general unfamiliarity with such practices Yet taking into
consideration that leasing practices are novel there seems to be a sizable
market potential currently untapped by leasing providers Leasing and renting
practices are further discussed in section 442
31 Evidence from the literature and data collection
311 General willingness to engage in CE practices
The literature shows that consumers are to a certain extent willing to engage in CE
practices and are willing to pay for more durable products Consumersrsquo willingness to
engage in sustainable purchasing practices derives primarily from their concern about the
environmental impact of the linear economy and to a lesser extent from their desire to
save money for example by repairing or buying a second hand product
As several surveys show consumers take the environmental impact of their
purchasing decisions into account In a survey carried out by the French Agency for
Environment and the Management of Energy ADEME in 2013 65 out of a panel of
1000 French respondents reported environmental issues as being the most important of
their concerns while 53 chose better material and a better life standard as one of their
considerations when purchasing new products (ADEME 2014 p 10) Recent research
has found that German consumers also prioritise global environmental challenges like
climate change deforestation and over-fishing over more local and personal problems
such as the health advantages of bio-products45 In Romania consumers are also aware
of the benefits of recyclability (32) energy waste (34) and water waste (29)46 At
EU level Flash Eurobarometer 397 conducted in 2015 shows that on average more than
half of consumers (median of country-level results = 54) reported that they take the
environmental impact of goods and services into account when making a purchasing
choice47 Figure 15 illustrates consumer attitudes towards the environmental impact of
products by country
45 Benthin amp Gellrich 2016
46 Bejan Crisan Lakatos amp Lakatos 2012
47 European Commission 2013
Behavioural Study on Consumersrsquo Engagement in the Circular Economy
49
Figure 15 Consumer attitudes towards the environmental impact of products48
Source TNS Political amp Social 2013
Apart from taking the environmental impact of their purchasing decisions into account
recent Eurobarometer research has shown that 77 of EU citizens are generally willing
to pay somewhat more for products if they are confident that they are environmentally
friendly49 Moreover consumers also tend to be willing to pay more for longer
lasting products without necessarily knowing their environmental impact
Research making use of a focus group in England and Wales and a nationally
representative survey of 1104 consumers has shown that more than eight out of ten
consumers would be willing to pay extra for household electrical appliances that are
advertised to last longer and have a longer commercial guarantee or warranty On
average they would be willing to pay 10 more50 Although it is generally not the
foremost consideration when buying a new product consumers do see a long lifetime as
a core requirement and there is a clear interest from consumers in longer lasting
products51
In the Netherlands 55 of consumers take durability into consideration when making
purchases up from 50 last year Bruumlggenwirth amp Witte (2016 p 1) find that 29 of
consumers remain highly enthusiastic about the Circular Economy and are the
forerunners in engaging in CE practices These are known as the so-called ldquodriversrdquo and
ldquosympathisersrdquo However the group of the ldquowilling people who are willing to participate
in the Circular Economy but who are not leaders and who need to be motivated to
engage has grown from 22 to 26 last year
Consumers in the Nordic countries (SE NO FI and DK) are more willing to establish
circular behaviours such as recycling repair and second hand trade rather than renting
and co-owning products According to a survey conducted in the four Nordic countries in
which 300 respondents per country participated the main reason for consumers to
repair or buy second hand products is to save money To be specific 74 of
Swedish 67 of Norwegian 68 of Danish and 59 of Finnish respondents were
interested in repairing or buying second hand products because of potential cost savings
The same study highlights that millennials (young people born between 1990 and 2000)
in the Nordic countries are much more interested than the average population in
engaging in CE practices such as recycling repair and second hand trade and that
48 Note Values on the y-axis represent the percentage of respondents that answered the question ldquoConsidering everything you bought during the last two weeks did the environmental impact of any goods or services influence your choicerdquo in the survey with ldquoYes for all or most goods or services you boughtrdquo ldquoYes but only for somerdquo or ldquoYes but only for one or twordquo
49 European Commission 2013 p 55
50 Knight King Herren amp Cox 2013
51 Knight King Herren amp Cox 2013 p 4
Behavioural Study on Consumersrsquo Engagement in the Circular Economy
50
women age between 30 and 44 years with children living in urban areas are more open
to participate in circular activity of any description in the near future They are
characterised as ldquochange makersrdquo Nordic citizens are the most circular today and open
to do even more tomorrow and therefore they are the ones that companies and
governments should target52 In a 2014 Eurobarometer 77 of citizens in the EU claim
to prefer making an effort to repair their products to buying new ones and 37 are
willing to buy second hand household appliances because of the expected economic
savings
Moreover the decision to repair a product or buy a more durable product may be
influenced by the behaviour of others As mentioned above in the Netherlands the
group of people who are willing to participate in the Circular Economy but who are not
leaders and who need to be motivated to engage was the fastest growing from 22 in
2014 to 26 last year53 This role as ldquolaunching customerrdquo could be played by national
governments or the European Union54
Several factors play a role in accounting for the growing consumer interest in
participating in CE practices For instance consumers can frequently change their
behaviour patterns because of their growing concern about environmental preservation
85 out of the 1000 French respondents indicated that they believed that a change of
lifestyle was needed because of environmental concerns resulting in a bigger
commitment to reuse products55 Moreover social factors may also account for the
willingness of consumers to engage in the Circular Economy As in Spain this
commitment can also be explained by a renewed interest for the feeling of belonging to a
community and the wish to participate in social networks56 Culturally consumers will
need to abandon their conception of ownership of the product for more sustainable
usage57 Lastly the rise of collaborative consumption tends to indicate an increasing
consumer preference for having access to a product rather than owning it (European
Environment Agency 2017) A survey of 8670 respondents carried out in Belgium Italy
Portugal and Spain indicated that 72 of the respondents participate in collaborative
economy activities 58 For an in-depth discussion of the drivers that play a role to
encourage consumers to engage in CE practices see Sections 411 421 and 421
However despite this willingness to preserve the environment as mentioned above it
appears that consumers can be quite reluctant to adopt more sustainable
purchasing choices CREDOC a French observatory specialising in making analyses of
the living conditions in French households researches yearly consumption behaviours In
2013 only 14 out of all the households surveyed indicated that they would adopt by
themselves consumption behaviour in line with the Circular Economy59 (A total change of
mind-set may be required to shift from linear economic consumption to a circular)
312 Willingness to engage in CE practices across products
The reviewed literature did not provide much information on consumer willingness to
engage in Circular Economy practices across products Only the WRAP study on the
product life time of electrical and electronic products stated consumersrsquo willingness to
purchase more durable product for a specific product category The study illustrates
consumersrsquo willingness to engage into certain CE practices for specific product types
ldquoworkhorserdquo products which include washing machines fridges and vacuum cleaners
52 SB Insight 2017
53 Bruumlggenwirth amp Witte 2016 p 1
54 Pijnenburg 2014
55 ADEME 2014 p 10
56 Cerdaacute amp Khalilova 2015
57 SPF Santeacute publique Seacutecuriteacute de la chaicircne alimentaire et Environnement 2014
58 Split of respondents per country BE (2132) IT (2336) PT (1698) amp ES (2313) OCU et al 2016
59 French Ministry of Ecology Sustainable Development and Energy 2014 p 38)
Behavioural Study on Consumersrsquo Engagement in the Circular Economy
51
The study suggests that consumers are willing to pay over 30 more for such products
that are backed by a longer standard warranty60 also discussed in section 411
32 Evidence from the stakeholder interviews
321 General willingness to engage in CE practices
The interviewees tended to confirm the findings from the literature review consumers
are generally willing to engage in Circular Economy practices The main difference
between the literature reviewed and stakeholder interviews is that only one interviewee
mentioned consumersrsquo increasing environmental concern as a primary factor for
consumersrsquo engagement in more sustainable purchasing practices Also a representative
of a European e-commerce trade association highlighted that online purchasing
consumers do not pay much attention to durable or repairable products Thus according
to interviewees consumers are less concerned than they claim to be about the
environmental impact when engaging in circular purchasing practices Furthermore
interviewees highlighted differences in attitudes towards Circular Economy practices
across EU Member States
Representatives of European and national consumer associations highlighted that
consumers are willing to engage in CE practices such as buying more durable
products even if that means that they need to pay more for these products One
European consumer association mentioned that consumers with lower incomes are
normally more impacted if a product breaks therefore they tend to have a greater
interest in the durability of products A good way of measuring consumersrsquo engagement
with product durability and reparability is to examine whether at the moment of purchase
consumers buy an extended guarantee service plan or insurance If a consumer has
purchased one of these things it is very likely they have considered durability and ease
of repair to some degree according to a representative of an NGO based in the UK
However it is important to note that consumers may take longer warrantiesextended
commercial guarantees61 as a proxy for durability The European trade association
representative highlighted that even though longer warrantiesextended commercial
guarantees are used as proxies it does not mean that products with longer
warrantiesextended commercial guarantees are easier to repair or more durable
Regarding reparability the situation is a bit different according to a representative of a
European consumer association as consumers are interested in repair but the
process is often too difficult long or expensive A Dutch Circular Economy expert
also emphasised that people are very interested in repair and self-repair and he
mentioned that repair is still a very niche practice among consumers but that it has a lot
of potential However an NGO representative from the Czech Republic indicated that lsquothe
Czech Republic is a nation that is used to repairing if something breaksrsquo
Most of the national and European trade associations also believe consumers are
willing to engage in more suitable purchasing practices In addition national and
European trade association representatives highlighted that consumers are starting to
shift their need from product ownership to product accessibility According to a
representative of a European trade association in Austria consumers are starting to rent
washing machines from an organisation that repairs used electronic appliances The
organisation offers repair services and replacement services in case the rental machine
stops working When available leasing and repair services are being considered more
often than before by consumers Only a representative of a European e-commerce trade
association highlighted that consumers are less willing to engage in more suitable
60 WRAP 2013
61 According to Article 2 (14) of the Directive 201183EU a commercial guarantee is defined as ldquoany undertaking by the trader or a producer (the guarantor) to the consumer in addition to his legal obligation relating to the guarantee of conformity to reimburse the price paid or to replace repair or service goods in any way if they do not meet the specifications or any other requirements not related to conformity set out in the guarantee statement or in the relevant advertising available at the time of or before the conclusion of the contractrdquo See httpeur-lexeuropaeulegal-contentENTXTPDFuri=CELEX32011L0083amprid=1
Behavioural Study on Consumersrsquo Engagement in the Circular Economy
52
purchasing practices meaning buying longer lasting goods and products that could be
repaired when buying online The interviewee highlighted that this is due to the
decreasing prices of technology consumers tend to change their products more
regularly
Representatives from two Dutch public authorities said that there are important
differences between what consumers say in surveys and what their actual considerations
are when purchasing products This is because price differences between durable
and less durable products still play an important role However as mentioned by
the same interviewees it is important to take into account the type of consumers
Many consumers do not care about the Circular Economy at all but some consumers are
intrinsically motivated to live sustainably and are usually willing to consider the durability
or reparability of products
322 Willingness to engage in CE practices across products
From the interviews conducted it has become clear that there are some variations across
products for certain products consumers are more willing to engage in CE practices
than for other products
Consumers are willing to invest more in durable products that are less dependent
on fashion trends like washing machines and other white goods as highlighted by a
Dutch public authority representative On the other hand according to an expert in the
field of Ecodesign product durability is a concern for consumers only for those products
that break down often (eg smartphones) Both interviewees agreed that for large
domestic appliances durability is a concern when purchasing a new product and
consumers would be willing to pay more if these products lasted longer Interviewees
confirmed this statement from the literature review in Section 312 consumers are
willing to pay more for more durable washing machines An interviewee from a
Hungarian NGO also highlighted that consumers take durability characteristics of large
domestic appliances more into account in comparison to smartphones when purchasing
because there is more durability information available for this product category
According to a Circular Economy expert from the clothes industry if consumers perceive
pieces of clothing to be more fancy or special they take better care of them and they
are more willing to bring it to a repair service or repair it themselves It is
important to note that the degree to which consumers are willing to pay for the repair of
their products is dependent on the consumerrsquos perception of how special the piece of
clothing is and not how expensive the piece of clothing actually was On the other hand
an NGO representative mentioned that young consumers are not used to self-repair they
do not know how to sew anymore and are not interested in acquiring the skill The
willingness to repair or replace a product is influenced by the degree of product
attachment People feel an emotional attachment to certain products (clothes and
phones for instance) and consequently they want these to last longer as highlighted by
a representative of a UK NGO
Furthermore two Czech interviewees one representing a consumer association and the
other an NGO highlighted that consumers expect more durability and reparability
from electronic products than from clothes even though they have observed that
consumers are getting more and more used to products not being repairable However
the interviewees reported that consumer willingness to engage more in CE practices
depends on how convenient a repair would be for them For the two product categories
mentioned electronic products and clothes there are established repair services and
therefore these are easier to repair For other products this is less so therefore
consumers are also less willing to let these products be repaired The interviewees noted
that consumers are also more willing to engage in CE practices for product groups such
as white goods which are traditionally more consumer-oriented and which have more
developed systems for customer care services including repair
Behavioural Study on Consumersrsquo Engagement in the Circular Economy
53
33 Evidence from the focus groups
331 Willingness to engage in CE practices across products
Durability
Focus group participants considered durability - the time period during which a product
can be used before it breaks down ndash to be highly important (see also section 431)
Therefore participants across the four countries were very interested in purchasing
products that lasted longer This was particularly the case for products that participants
considered to be ldquoimportant investmentsrdquo such as dishwashers and washing machines
When talking about white goods (washing machinesdishwashers) views with regard to
the importance of durability were nearly unanimous Opinions with regard to the
importance of durability varied more when talking about other types of products Some
participants felt that durability was just as important for products such as televisions
and smartphones while for others technological progress was a factor influencing them
to purchase this type of products more frequently and therefore their expectations with
regard to these productsrsquo lifetime were lower
ldquoI like having products a long time I do not need the newest device I still have
my TV that I bought 30 years ago It still works so why should I buy a new onerdquo
(Man vulnerable group Berlin)
ldquoWell you know there are so many new developments and sure I like to have a
new TV or a new Smartphone from time to time I have old smartphones in my
drawers and I think they still workrdquo (Man mixed group Berlin)
Similarly for clothing participants expected durability to vary according to price and
brand Fashion was also brought up because people tend to purchase certain clothing
items more often due to changing fashion trends
Reparability
Opinions varied with regard to having products repaired Participants were generally
willing to have products repaired (particularly white goods such as washing machines
and dishwashers) as long as they were still under warranty Once products were no
longer under warranty preferences towards having them repaired or replaced with new
ones varied according to various factors such as
Price of repair vs price of the new product ldquoIf the difference in cost between
repair and a new one is too little I prefer the new one Maybe I also get some
improvementsrdquo (Male vulnerable group Stockholm)
The price of the product itself (the lower the price the more likely participants
were to prefer a replacement) ldquoMy hoover for 19 euros I wouldnrsquot think about fixing
itrdquo (Man mixed group Dublin)
The time it would take to have a product repaired
Technological progress
Trust towards the quality of the repair ldquoWhen they repair a product you never
know if it will really work again properly and you do not know how long it will work
again I would rather decide on a new one also because there are new technologies
out there yet againrdquo (Man mixed group Berlin)
Views also varied in the case of smartphones Some would prefer buying a new one
because technology for smartphones progresses fast Others flagged the fact that
smartphones carry a lot of personal data (such as pictures) This factor adds emotional
value to them moreover transferring this type of information from one device to
another was perceived as difficult As such having a smartphone repaired was
sometimes seen as preferable
ldquoMy smartphone has all my pictures and memories on it I would even say I have
an emotional connection to it That is why I do prefer to repair it Also because it
is always a hassle to transfer everything on a new phonerdquo (Woman vulnerable
group Berlin)
Behavioural Study on Consumersrsquo Engagement in the Circular Economy
54
In Germany and Ireland willingness to have products repaired was somewhat stronger
among some of the participants from the vulnerable groups However the above-
mentioned factors were also taken into account by these participants
For clothing Irish participants (particularly from the vulnerable group) flagged the fact
that they would be willing to have them repaired This applied however mainly to more
expensive purchases such as shoes or coats and to a lesser extent to other clothing
items
ldquoI had a jacket for ages and the buttons started to come off so I asked my dad
to sew them back on Thatrsquos reparabilityrdquo (Man mixed group Dublin)
When discussing reparability participants mainly took into account aspects such as
saving money or being able to keep their products Reparability being linked to
environmental aspects was also brought up although to a much lesser extent For
example some participants in Sweden brought up the possibility of saving resources
ldquoI really do want to think about these things We have to take care of the planetrdquo
(Male mixed group Stockholm)
Recyclability
Participants in Sweden Germany and Ireland were generally willing to recycle products ndash
whether it was electronics or clothing Willingness to recycle was somewhat lower in the
Czech Republic In this country recycling was seen as time consuming as well as too
much of an effort Participants felt that recycling should be motivated by a financial
bonus for example a discount on the next purchase
Purchasing refurbished goods and second hand products
Views with regard to purchasing refurbished electronics (whether large white goods or
smartphones) were mixed In Ireland some participants (particularly from the vulnerable
group) were more willing to do this as long as they felt that the price-quality ratio was
good or that there was a large price difference between refurbished (or second hand)
products and new ones Others were concerned with the fact that products bought
refurbished or second hand would break down more easily
ldquoAnything if itrsquos quality for a bargain If the price is right also a washing
machinerdquo (Man vulnerable group Dublin)
ldquoSmartphone - I would be tempted because they are cheaper Smartphones are
so expensive The price is great then and they give the details and mention itrsquos
refurbished My current smartphone is really old and it got my moneyrsquos worth out
of it I would love to get a new one In the refurbished shop it will be 34th of the
price to buy a new onerdquo (Woman vulnerable group Dublin)
ldquoThe last time I went to buy a new phone I actually went in and looked at the
second hand phones but then still bought a new one For the same money I can
buy a new phone The other one second hand was about 2-3 years You know
what you get What you get is an old phone and for a bit more money you get a
new onerdquo (Man mixed group Dublin)
In the Czech Republic purchasing refurbished electronics was not very common and
some participants even had bad experiences with such purchases
We wanted to buy a Rainbow vacuum cleaner that cannot be bought in shops
just from dealers I heard only good things about them how wonderful they were
but they are very expensive Because we have allergic kids I wanted to buy it so
because of the price I got some refurbished one It was terrible it did not vacuum
much Moreover it was from Germany I kept writing to them that it did not work
but at the end it stayed with us so I threw it away and bought a normal bag-less
onerdquo (Woman mixed group Prague)
On the contrary across the four countries purchasing second hand clothing was a lot
more common (especially among the more vulnerable groups) Reasons for this were
related to cost but also to quality Many participants felt that second hand (or ldquovintagerdquo)
clothing was of higher quality and more durable than new clothing
Behavioural Study on Consumersrsquo Engagement in the Circular Economy
55
ldquoIn the past clothing was of much better quality than today and often you find
clothes that have hardly been wornrdquo (Woman vulnerable group Prague)
ldquoI really like to buy second hand clothing and I also repair my clothes when I
really like them I feel it is a good thing to dordquo (Woman vulnerable group Berlin)
ldquoI went to second hand shop because I was looking for a costume for a party but
then I got good pair of jeans Levirsquos and they were very cheap (20 euros) and very
good quality and now Irsquom going to go back And you see stuff that yoursquove never
seen before but if you go into another shop you look at stuff that is currentrdquo
(Man vulnerable group Dublin)
Participants also felt positive about purchasing second hand furniture or furniture
made from recycled materials Participants were not only motivated to purchase second
hand furniture by economic reasons but also aesthetics
ldquoI buy furniture second hand and polish them again It depends I shop in second
hand shops I would buy glasses and different thingsrdquo (Woman vulnerable group
Dublin)
ldquoThere are some shops that only sell products made from recycled material but
that is clothes or small stuff not machines Even Ikea has a small department of
stuff like that It is a good ideardquo (Man mixed group Stockholm)
Generally participantsrsquo willingness to engage in circular economy practices was
mainly driven by financial factors and by the need of having products taken away once
they break down or are no longer in use (recyclability) Environmental reasons were also
brought up but to a slightly lesser extent Participants in the Czech Republic were
somewhat less inclined to mention environmental reasons than those in other countries
34 Evidence from the consumer survey
Participants were asked to assess several statements regarding general CE related
behaviours Results are depicted in Table 10
With respect to keeping things for a long time agreement rates were high Overall
93 agreed to this statement with 42 even stating strong agreement In addition
78 of the participants agreed that they always recycle their unwanted
possessions including 26 even strongly agreeing Agreement with the statement of
always repairing possessions if they break was lower 64 including 11 stating
strong agreement with the statement Buying products second hand received the
lowest agreement rates with respect to CE related behaviours (28 including 5
strongly agreeing)
In addition participants were asked for their preference for fashion and new gadgets
Only 34 agreed with always buying the latest fashion for clothes including 5
strongly agreeing New electronic goods and gadgets seemed to be more important
to participants Overall 45 agreed to always buy new gadgets including 8 who even
strongly agreed
Behavioural Study on Consumersrsquo Engagement in the Circular Economy
56
Table 10 Agreement to statements on general CE-related behaviours (in )
Strongly
disagree
Tend to
disagree
Tend to
agree
Strongly
agree
I always keep things I
own for a long time
08 58 517 417
I always recycle my
unwanted possessions
34 188 520 258
I always repair my
possessions if they break
74 291 527 108
I buy second hand
products
311 405 238 46
I always buy the latest
fashion for clothes
217 450 289 45
I always buy new the
newest electronic goods
and gadgets
152 396 371 82
Note Participants had to rate six different statements regarding the question Q35 ldquoTo what extent do you agree or disagree with the following statements about yourselfrdquo N=12064
Source ConPolicy analysis of consumer survey data
These results are supported by results displayed in Figure 16 When calculating average
agreement to these statements and ranking them it was found that consumers in the
survey showed the strongest agreement to the statement lsquoI always keep things I own for
a long timersquo followed by lsquoI recycle my unwanted possessionrsquo In contrast average
agreement rates were below 0 ie (rather) disagreeing for buying second hand
products Similarly buying new gadgets or fashion resulted in negative average
agreement ie consumers in the survey indicated that they (on average) disagreed with
the corresponding statements
Figure 16 Agreement to statements on general CE-related behaviours (average)
Note Participants had to rate six different statements regarding the question Q35 ldquoTo what extent do you agree or disagree with the following statements about yourselfrdquo Answer categories were labelled with ldquoStrongly agreerdquo corresponding to a value of +10 ldquoTend to agreerdquo corresponding to a value of +3 13 ldquoTend to disagreerdquo corresponding to a value of ndash 3 13 and ldquoStrongly disagreerdquo corresponding to a value of -10 Average values above 0 correspond to (rather) agreeing to the statement while values below 0 correspond to (rather) disagreeing Hence an average value of 0 corresponds to neither agreeing nor disagreeing N=12064
Source ConPolicy analysis of consumer survey data
Behavioural Study on Consumersrsquo Engagement in the Circular Economy
57
Next these answers where analysed by country and socio-demographic factors The
results are displayed in detailed tables in Section 7 in the Annex document and
summarised here below
For the statement I always keep things for a long time respondents in all countries
on average revealed high agreement rates The three countries with the highest average
agreement rates were Germany Austria and Portugal The lowest agreement rates were
found in the Czech Republic Hungary and Latvia With respect to participantsrsquo age a
positive trend was found The higher the age category the higher average agreement
With respect to education and income no systematic differences between average
agreements were observed
Respondents agreed less to the statement of always recycling their possessions
compared to keeping things for a long time The highest agreement rates were found in
Sweden but Ireland and Spain similarly revealed high agreement rates The lowest
agreement rates were observed in Hungary and Latvia Again a positive trend was
observed for the different age groups while education and income seemed to not follow
systematic patterns
As stated above respondents less often said they always repaired their possessions
This was true for all the different Member States The Czech Republic and Romania on
average even rather disagreed with the repair statement While all other Member States
at least tended to agree With respect to the other socio-demographic factors ie age
education and income no systematic patterns were found
Agreement with buying second hand products was on average even lower The
country averages indicated disagreement with the statement especially in Austria Spain
and the Czech Republic When looking at the different age categories a negative trend
was found The higher the age category was the lower was the self-reported agreement
rate With respect to the other socio-demographic factors no systematic patterns were
observed
In the fashion-category there were interesting country differences as well In all
countries but Romania survey participants on average tended to disagree with lsquoalways
buying the latest fashion for clothingrsquo Agreement rates were lower among older age
groups With respect to education and financial status differences were not as
pronounced
Lastly agreement rates on buying new electronic gadgets were on average also low
Romania was again an exception in this category On average Romanian consumers
indicated to tend to agree to buy new electronic items The same was true for the
Netherlands and France With respect to age and education no specific patterns were
observed while consumers indicating their financial situation to be very difficult indicated
less agreement to buying new gadgets compared to wealthier income groups
In parallel participants were asked the same question but this time not with respect to
their own behaviour but with respect to the behaviour of their close friends and relatives
Results are displayed in Table 11
It appears that a majority of respondents think that their peers reveal similar CE-related
behaviours to themselves A majority (80) agreed that their friends and relatives keep
things they own for a long time including 12 who strongly agreed They also believe
that their friends and relatives recycle their unwanted possessions (70 tended to
agree and 12 strongly agreed) and the majority of participants also stated agreement
to the statement that friends and relatives always repair their possessions if they
break (61 including 6 strong agreement) Similar to their own behaviour agreement
to friends and relatives buying second hand products was lower with 34 (including
2 strongly agreeing)
Friendsrsquo and relativesrsquo preferences for fashion or gadget trends were similarly aligned
with own behaviour 43 agreed with the statement that their friends and relatives
always follow the latest trend or fashion including 4 stating their strong
agreement In addition 46 indicated their agreement to the statement that their
friends and relatives always buy the newest electronic goods and gadgets (including
5 strongly agreeing)
Behavioural Study on Consumersrsquo Engagement in the Circular Economy
58
Table 11 Agreement to statements on general CE-related behaviours of friends and
relatives (in )
Strongly
disagree
Tend to
disagree
Tend to
agree
Strongly
agree
Keep things they own for a
long time
10 190 678 121
Recycle their unwanted
possessions
26 274 580 120
Always repair their
possessions if they break
43 352 550 55
Buy second hand goods 160 499 319 22
Always follow the latest
trend or fashion
100 468 394 38
Always buy the newest
electronic goods and
gadgets
87 450 413 51
Note Participants had to rate six different statements regarding the question Q91 ldquoTo what extent do you agree or disagree with the following statements about your close friends and relatives Most of my close friends and relativeshelliprdquo N=12064
Source ConPolicy analysis of consumer survey data
These results are supported by Figure 17 wherein average agreement to the
corresponding statements is displayed The ranking of agreement rates for friends and
relatives is in parallel to those for survey participants themselves (compare Figure 16
from above)
Figure 17 Agreement to statements on general CE-related behaviours of friends and
relatives (average)
Note Participants had to rate six different statements regarding the question Q91 ldquoTo what extent do you agree or disagree with the following statements about your close friends and relatives Most of my close friends and relativeshelliprdquo Answer categories were labelled with ldquoStrongly agreerdquo corresponding to a value of +10 ldquoTend to agreerdquo corresponding to a value of +3 13 ldquoTend to disagreerdquo corresponding to a value of ndash 3 13 and ldquoStrongly disagreerdquo corresponding to a value of -10 Average values above 0 correspond to (rather) agreeing to the statement while values below 0 correspond to (rather) disagreeing Hence an average value of 0 corresponds to neither agreeing nor disagreeing N=12064
Source ConPolicy analysis of consumer survey data
Next participants were asked to rate their agreement with further statements regarding
environmental attitudes and general CE-behaviours Results can be found in Table 12
Behavioural Study on Consumersrsquo Engagement in the Circular Economy
59
With respect to environmental attitudes high agreement rates can be found Overall
91 of the participants agreed with the statement that it is important to be
environmentally friendly including 40 agreeing strongly Another 62 agreed with
the statement that they want their friends to know that they care for the
environment including 14 agreeing strongly
Generally respondents displayed attitudes in favour of CE practices A majority of
participants (64) stated that they know the expected lifespan of a product when
they buy things (with 7 agreeing strongly) Agreement with being aware of repair
services for the products they own was 58 with 9 indicating strong agreement
With respect to the statement that second hand products are usually good quality
49 of participants indicated their agreement including 3 agreeing strongly
At the same time a majority of respondents 77 also indicated preferences for
brand new possessions Yet only 18 of participants stated that they agreed to the
statement that they wanted their friends to know that they own the latest trend or
fashion (including 3 strong agreement)
Table 12 Agreement to further statements on general CE-related behaviours and
environmental attitudes (in )
Strongly
disagree
Tend to
disagree
Tend to
agree
Strongly
agree
It is important to be
environmentally friendly
15 74 516 395
I want my friends to know
that I care for the
environment
85 290 486 139
When I buy things I know
the expected lifespan of the
product
44 319 569 67
I am aware of repair
services for the products I
own
67 349 495 89
Second hand products are
usually good quality
50 457 460 32
I much prefer possessions
that are brand new
34 191 552 222
I want my friends to know I
own the latest trends or
fashion
381 439 154 27
I trust claims made by
companies about their
products
72 454 446 28
I am usually very busy and
lack free time
103 395 420 81
If something is good
enough I donrsquot need it to
be perfect
17 145 686 152
Note Participants answered the question Q41 ldquoTo what extent do you agree or disagree with the following statementsrdquo N=12064
Source ConPolicy analysis of consumer survey data
Figure 18 presents further insights on the question Here average agreement was
calculated for each item and results were ranked by average agreement The highest
Behavioural Study on Consumersrsquo Engagement in the Circular Economy
60
average agreement was reported for the importance of being environmentally friendly
On the lower end survey participants on average disagreed with the statement lsquoI want
my friend to know I own the latest trends or fashionrsquo
Figure 18 Agreement to further statements on general CE-related behaviours and
environmental attitudes (average)
Note Participants answered the question Q41 ldquoTo what extent do you agree or disagree with the following statementsrdquo Answer categories were labelled with ldquoStrongly agreerdquo corresponding to a value of +10 ldquoTend to agreerdquo corresponding to a value of +3 13 ldquoTend to disagreerdquo corresponding to a value of ndash 3 13 and ldquoStrongly disagreerdquo corresponding to a value of -10 Average values above 0 correspond to (rather) agreeing to the statement while values below 0 correspond to (rather) disagreeing Hence an average value of 0 corresponds to neither agreeing nor disagreeing N=12064
Source ConPolicy analysis of consumer survey data
Finally participants were asked to indicate whether they search for durability and
reparability information when purchasing a product Table 13 shows the results
62 indicated that they always search for information on how long a product will
last (including 10 strong agreement) Similarly a majority also indicated searching
for reparability information (55 including 8 strongly agreeing with the statement)
Behavioural Study on Consumersrsquo Engagement in the Circular Economy
61
Table 13 Agreement to searching for durability and reparability information (in )
Strongly
disagree
Tend to
disagree
Tend to
agree
Strongly
agree
I always search for
information on how long a
product will last
54 329 516 102
I always search for
information on how easy it
is to repair a product
73 378 464 84
Note Participants answered the question Q51 ldquoTo what extent do you agree or disagree with the following statementsrdquo N=12064
Source ConPolicy analysis of consumer survey data
Figure 19 displays results when transferring answer categories and calculating average
agreement It can be found that average agreement rates for both statements resulted in
a positive but rather low average agreement ie survey participants indicated that they
rather agreed on searching for durability and reparability information
Figure 19 Agreement to searching for durability and reparability information (average)
Note Participants answered the question Q51 ldquoTo what extent do you agree or disagree with the following
statementsrdquo Answer categories were labelled with ldquoStrongly agreerdquo corresponding to a value of +10 ldquoTend to agreerdquo corresponding to a value of +3 13 ldquoTend to disagreerdquo corresponding to a value of ndash 3 13 and ldquoStrongly disagreerdquo corresponding to a value of -10 Average values above 0 correspond to (rather) agreeing to the statement while values below 0 correspond to (rather) disagreeing Hence an average value of 0 corresponds to neither agreeing nor disagreeing N=12064
Source ConPolicy analysis of consumer survey data
In addition results on searching for durability as well as reparability information were
analysed by country and socio-demographic factors which are summarised here below
and displayed in detail in Section 7 in the Annex document
With respect to searching for durability information the highest agreement rates
were found for Romania In contrast the lowest agreement rates were observed in
Sweden the Netherlands and Germany where participants on average indicated that they
neither agreed nor disagreed to the statement With respect to age a small positive
trend was observed and similarly participants with higher education also revealed higher
average agreement rates Respondentsrsquo financial situation on the other hand did not
influence agreement rates
Searching for reparability information was country dependent as well While
countries such as Portugal Romania and Hungary tended to agree that they searched for
reparability information Germany Sweden and in particular the Netherlands revealed
agreement rates below 0 ie on average they disagreed with the statement of searching
for reparability information There were also small age trends While agreement rates
among the youngest age group were below 0 indicating that on average participants did
not tend to search for reparability information it was above 0 among older age groups
Education again did not seem to play an important role while respondentsrsquo financial
situation did in the sense that poorer individuals were more likely to search for
reparability information
Behavioural Study on Consumersrsquo Engagement in the Circular Economy
62
341 Willingness to engage with leasing products
As a next step participantsrsquo willingness to engage with leasing products was analysed A
few companies across the EU have recently launched leasing models for baby clothing
consumer electronics or jeans62 The leasing business model is based on circular
practices as the products are not owned by the individual but instead the leasing price
includes maintenance and repair as well as exchange of the products when it has gone
out of fashion or when the consumer wishes an upgrade This way the same product
may be used by more than one consumer and materials from old products may be
recycled into new ones
The consumer survey tried to elicit consumer preferences for such leasing models via a
hypothetical choice exercise Each respondent was asked to indicate their preference
between a lsquostandardrsquo full ownership of a product or a leasing contract for a varying
number of months Respondents were told that repairs and replacement services in case
of a defect were included in the monthly price
Respondents were given the following choices
bull Purchase the product for full price
bull Lease product for 612244860 months
To ensure realism of the task monthly lease prices were calibrated using examples from
actual leasing business models Since actual business models tend not to exceed a
maximum lease of 24 months longer leases in this exercise were calibrated assuming
that beyond 24 months a product would become more likely defective or require
replacement pushing costs beyond the initial full purchasing price
The total cost of leasing for different lease durations amounted roughly to63
Table 14 Duration and cost of leasing
Lease duration Total cost of lease contract
6 months approx 40 of full purchasing price
12 months approx 60-70 of full purchasing price
24 months approx 100-110 of full purchasing price
36 months approx 130-135 of full purchasing price
48 months approx 150-165 of full purchasing price
60 months approx 165-190 of full purchasing price
Visible from Figure 20 across all product types a vast majority of participants preferred
purchasing the product instead of leasing it Around 10-15 of respondents indicated an
interest in the various leasing propositions for TVs dishwashers vacuum cleaners and
jeans Only for smartphones interest in leasing was higher around 25 and another
18 of respondent indicating lsquoDonrsquot knowrsquo which may be an indicator for indecision
62 See for example httpsviggaus (baby clothing) httpswwwottonowde (consumer electronics and durables) and httpwwwmudjeanseu (jeans)
63 Price levels were adapted for each type of product between smartphones TVs dishwashers vacuum cleaners and jeans
Behavioural Study on Consumersrsquo Engagement in the Circular Economy
63
Over all products longer lease durations were less preferred that shorter ones While
between 2-8 of the participants indicated to be willing to lease between 6 and 24
months only 0-3 stated to be willing to lease between 36 and 60 months64
The Annex displays results for the individual lease duration categories and by product in
more detail
Figure 20 Willingness to lease products for different time periods (in )
Note Participants answered the question Q71 ldquoSuppose you wish to get a new smartphone TV dishwasher vacuum cleaner jeans You have the option to either buy the phone outright for euro34999 euro71999 euro35999 euro15999 euro5999 or lease it for a certain number of months Leasing the product means that you will not own the product instead you will return it at the end of the lease for example to start a new lease for a new product or continue to use your product at a lower price Included in the monthly lease are repairs and replacement services in case of a defect Which option would you preferrdquo Smartphone N=2412 TV N=2416 Dishwasher N=2409 Vacuum cleaner N=2412 Jeans N=2415
See the Section 7 in the Annex document for a breakdown of different lease durations between 6 and 60 months
Source ConPolicy analysis of consumer survey data
When further splitting preferences for different lease durations and products 6-7 of the
participants were willing to lease televisions dishwashers and vacuum cleaners for a year
or less at a cost-equivalent of less than 70 of the actual total purchasing price Longer
leases tended to be less popular Thus it seems that there was little willingness to pay a
mark-up on original purchasing prices for maintenance and replacement services which
would be offered by leasing companies For smartphones 5-7 of respondents indicated
interest in leasing the product for each length of 6 12 and 24 months It is quite likely
that the willingness to lease smartphones is grounded in the fact that phone providers
across the EU have for a long time offered phone contracts which included
communication and a handset with typical contract durations between 12 and 24 months
The results here are corroborated also by findings presented in section 442 which report
respondentsrsquo actual experience with renting or leasing products Indeed only a small
minority of respondents (1-3) have rented or leased any of the products under
examination in the past 5 years It is thus likely that the relatively low willingness to
lease products in this hypothetical exercise was at least partly driven by substantial
unfamiliarity65 with the novel type of business model Indeed it could be conjectured
64 Within the two duration categories ie shorter with 6 to 24 months and longer with 36 to 60 months no sizable differences were found with respect to respondentsrsquo willingness to lease
65 In situations of uncertainty individuals have been shown to use the decision heuristic of choosing what is familiar to them instead of considering their true preferences See for example Della Vigna (2009) lsquoPsychology and Economics Evidence from the Fieldrsquo Journal of Economic Literature
56
27
18
72
15
14
74
13
13
79
11
10
74
16
11
0 10 20 30 40 50 60 70 80 90 100
Purchase for full price
Lease for 6 to 60 months
Donrsquot know
Smartphone TV Dishwasher Vacuum Cleaner Jeans
Behavioural Study on Consumersrsquo Engagement in the Circular Economy
64
that the willingness to engage with leasing contracts is actually sizable given the
unfamiliarity with this type of business model With growing familiarity it is well possible
that the market size for renting and leasing products could further grow thus enhancing
consumer engagement in with the Circular Economy
Findings presented in this study see for example section 44 show that respondents
desired fully owning their products and wished to use new unused products These
preferences clearly limit the attractiveness of leasing models and the study does not
deliver evidence as to whether these preferences might change if leasing models become
more widely available and better known
Behavioural Study on Consumersrsquo Engagement in the Circular Economy
65
4 Drivers barriers and trade-offs faced by consumers
This section provides information gathered on factors which motivate and discourage
consumers to engage in the CE for example via buying more durable products
repairing products when they are broken rather than replacing them buying second
hand products or leasing products rather than buying them In other words it
provides evidence gathered on the drivers (ie motivators) and barriers (ie obstacles)
to consumer engagement in the Circular Economy
This section reports findings from all methods (ie literature stakeholder interviews
focus groups consumer survey and behavioural experiment) The literature stakeholder
consultations and focus groups covered a broad scope to capture a wide range of drivers
and barriers The consumer survey built upon the findings of this qualitative research by
asking about consumersrsquo past experiences with CE practices and their reasons for taking
Circular Economy decisions (or not) Finally the behavioural experiment looked more
closely into what drives consumersrsquo decisions to repair or replace a broken product The
relative importance of economic social and psychological aspects that determine
consumersrsquo engagement in Circular Economy practices is also highlighted in this section
Key findings
It emerged clearly from the different strands of research that price is the most
important driver and simultaneously a barrier for consumer engagement
in the CE followed by convenience
More specifically in the literature three main drivers have been named for
consumers to participate in the Circular Economy which were also confirmed by
the interviewed stakeholders
o Providing consumers more and better information about the durability
of products
o Designing products with better CE credentials and
o Widening the offer of repair services from manufacturers and retailers
Four main barriers were distinguished in the literature review and corroborated
by stakeholders as well namely
o consumersrsquo lack of knowledge
o the absence of reliable information about durabilityreparability
features of a product
o high cost of repair services and
o consumersrsquo lack of trust in repair services
It seems to emerge from the findings in the literature stakeholder interviews and
focus groups that consumers are to some extent willing to trade-off price
and CE product characteristics For example consumers in a previously
conducted behavioural study were found to be willing to pay more for products
with higher durability However as highlighted by stakeholders such willingness
to pay for more durable products hinges on information provision about product
durability
Individual stakeholders have named various other factors which could act as
drivers of more engagement with the CE such as social norms about (resource)
efficiency extended warranties and better education about the topic On the
other hand they named as potential barriers to more CE engagement practical
problems with repair the availability of low-quality but cheap products fashion
and style social pressure marketing and advertising conspicuous consumption
and the cultural problem where society does not reward consumers who do
engage in CE practices
A key barrier identified by the focus groups was that consumers found it
difficult to pinpoint the durability of products Furthermore there was a
sense that newer generations of products were less durable than products that
were produced some years ago This discussion around lower durability of newer
products sometime led participants to mention the concept of planned
obsolescence
The consumer survey has instead revealed that survey respondents generally
indicated being aware of product durability and reparability (section also
34) Yet when asked specifically about the provision of such information many
Behavioural Study on Consumersrsquo Engagement in the Circular Economy
66
indicated a desire for receiving better information because they felt that it
was often difficult to find information regarding how long products would last and
how easy it was to repair products
Some interesting country differences emerged from the survey Dutch and
German survey respondents were less likely to search for durability information
compared to respondents from other Member States Dutch respondents also did
not seem to lack better information while German respondents felt strongly that
durability and reparability information was difficult to find Respondents from
Romania on the other hand were more likely to search for durability information
found this information relatively easy to find but still desired further improvement
of information provision
With respect to other socio-demographic factors age played a role for drivers and
barriers While older participants indicated to search more frequently for
durability and reparability information (section 34) they also expressed a
stronger preference for better information and indicated more frequently that
it was difficult to find the appropriate information
This indicates that the current state of information provision regarding product
durability and reparability might be a potential barrier for engaging in the CE
Providing information consistently and in straightforward format might thus be
seen as a driver for further CE engagement Findings from the behavioural
experiment shown in section 65 confirmed these findings from the consumer
survey
The study did not find overwhelming evidence of a lsquothrowaway economyrsquo This
means that the study results were mixed Though large shares of respondents
have not repaired broken products (36) a majority of consumers instead
did repair broken products across all product categories (63) Results by
product are presented in section 441
Among those with repair experience a majority had products repaired for them by
friends family or professional services
Self-repair was generally less frequent (12) compared to having products
repaired (51) The incidence of self-repair furthermore varied by product
category Self-repair was most prominent for clothing items (244) There
were some significant incidences of self-repair reported also for vacuum cleaners
and dishwashers whereas self-repair very rarely occurred for mobile phones and
TVs
The highest non-repair rate was observed among Dutch survey participants (on
average 56) while the lowest was observed among Romanian participants (on
average 25) Age and other socio-demographic factors did not play an important
role with respect to repair behaviour
Those who have self-repaired products in the past indicated lower costs being
good at repairing convenience and environmental reasons as the main
reasons for having self-repaired
The top reasons for not repairing products were price of repair the preference
to get a new product fashiontechnology or products being beyond repair
Depending on the product category consumers had meaningful experience with
third party repair services Overall experiences with such services were positive
and frequently even exceeded expectations in terms of convenience speed of
repair consumer friendliness and quality of repair
The behavioural experiment corroborated many of the findings from the consumer
survey In line with reported behaviour in the survey a majority of
respondents also decided to repair defective products in a task which
simulated the decision to repair or replace a faulty product with realistic monetary
incentives (see section 271 for the methodology section 45 for results)
The experiment has clearly confirmed the finding from the qualitative research
that convenience and ease of accessibility of repair are important drivers
of repair decisions When repairing involved slightly more effort compared to
replacing an item many respondents refrained from repairing and bought
replacement products instead The same level of effort instead did not prevent
individuals from replacing products
Behavioural Study on Consumersrsquo Engagement in the Circular Economy
67
Other behaviourally motivated mechanisms which did not change the cost of
repairing or replacing remained largely without effects Merely framing repair
prices as VAT exempt (while keeping prices constant) or providing details about
the characteristics of the repair services (eg whether repair was done by the
manufacturer or an independent shop again at constant prices) did not have
meaningful effects on repair decisions Such practices seemed to only strengthen
the decisions of certain groups of respondents For example those with pro-
environmental attitudes were even more likely to repair products when repair
services were framed as VAT exempt Instead those who attributed highest
importance to trends and fashion were further deterred from repairing by the
same treatment
Personal self-declared attitudes towards the CE were largely consistent
with actual engagement in the CE in the monetarily incentivised
experimental repair vs replace task For example respondents who
categorised themselves as attaching high importance to fashion and technology
were significantly less likely to repair products while individuals with more self-
rated pro-CE attitudes were indeed significantly more likely to repair their
products This is an important finding because it is often argued including by
some stakeholders in this study that self-reported attitudes are a result of
wanting to please the survey administrators and would not translate into actual
behaviour The behavioural experiment provided strong evidence against such
predicaments and instead reinforced that attitudes can translate into actual
behaviour especially when certain conditions are met (eg provision of CE
information)
Experience with renting leasing (1) and buying second hand (6) was
rather low in the surveyed population The main reasons for not having engaged
with such practices were that respondents wished to own their products and
generally that they preferred new unused products Among the few
respondents who have rented or leased products in the past their motivations to
do so were mixed Convenience the possibility to test the product the chance of
reusing the product after use or budget considerations all seemed to play a role
When comparing respondentsrsquo actual experience with leasing and their willingness
to lease as presented in section 3 there seems to exist a sizable market potential
for business models offering leasing products
Market data from Scandinavian countries instead showed that consumers would
in general be willing to make some sacrifices unless it required sharing goods
and letting their own goods being used by other consumers
According to the survey a limited share of consumers had purchased
second hand vacuum cleaners dishwashers TVs smartphones and
clothes Main motivators for buying second hand were price items being better
value for money and environmental reasons The main barriers to buying
second hand products seemed again to be the preferences for using new unused
products a lack of trust in second hand products as well as the perception that
new products were better value for money
Romania stood out with highest rates of buying second hand (15) while
for Portuguese consumers much lower incidences (3) were found Participants
from Ireland and Hungary also revealed comparatively larger shares of buying
second hand (10) Older respondents were generally less likely to purchase
second hand Instead consumers in a very difficult economic situation indicated a
higher frequency of buying second hand (11)
In line with findings from the survey in the behavioural experiment as well there
was relatively little engagement with second hand products In the
experiment second hand products were presented with the same prominence and
availability as new products nevertheless only about one to two respondents in
ten decided to purchase a second hand product to replace a defective product
As in the survey the likelihood of purchasing second hand in the experiment was
slightly higher for smartphones and clothes (20 chose a second hand phone or
coat) compared to the other products (13-14 chose second hand) For coats it
appeared to be the least fashion driven consumers who most often decided to buy
second hand Second hand products might be attractive if they help balance the
Behavioural Study on Consumersrsquo Engagement in the Circular Economy
68
desire to change a product with budgetary pressures (see also further findings
from the consumer survey reported in section 64)
41 Evidence from the literature and data collection
411 Drivers
From the literature review three main drivers for the participation of consumers in more
Circular Economy practices emerged
The first driver is to provide more and better information about the durability
potential of the product which mirrors the lack of knowledge For an in-depth
discussion of which information should be included exactly see sections 612 and
614
The second driver pertains to the design of the product itself
The third driver is a greater offer of repair services from manufacturers
Academic reports regulatory reports and other sources reviewed stress that better
information for consumers on product features may drive their participation in
more Circular Economy (CE) practices66
In that sense labels are useful tools for the information they provide In March
2016 a study was carried out by the SIRCOME agency the University of South Brittany
and the University of South Bohemia commissioned by the European Economic and Social
Committee on the influence of lifespan labelling on consumers67 Some 2917 participants
were asked to choose between different goods with or without labels The products
displaying lifespan information were on average chosen 46 more often than the ones
without such information In addition in the same category of products the ones with a
lifespan information label were sold 138 more often than the ones without The label
displaying lifespan in years or months had the greatest impact on consumers however
consumers had difficulty mentally picturing large numbers68 According to S Maurer and
U Pachl providing information on a productrsquos lifespan could also encourage less wealthy
households to pay more for a product that is expected to last longer69
The literature also suggests that a label providing information on the energy
performance of the good would have a positive impact on consumersrsquo
behaviours70 The lack of information about the environmental footprint of specific
goods may again be a barrier to consumers participating in the Circular Economy For
instance BHaze A Jones-Farmer and R Overstreet pointed out that consumers lack
awareness about the environmental impact of refrigerators71 However a report carried
out for the French Ministry of Environment stressed the risk of potential confusion for
consumers by the possible duplication of information with the existing Ecolabels A
clearer hierarchy would be in that sense useful72 Underlying further the influence of a
label as developed above the White Book for a Circular Economy in Greater Paris
suggests the creation of a label for second hand goods73
In addition some brands have also developed their own label For instance in 2016
the French brand SEB - one of the leaders of household appliances manufacture-
launched a logo (Figure 21) stating that the product will be repairable for ten years74
66 Westblom 2015 BEUC 2015 European Commission Joint Research Centre 2017a
67 European Economic and Social Committee 2016)
68 European Economic and Social Committee 2016
69 BEUC 2015
70 French Ministry of Ecology Sustainable Development and Energy 2014
71 Haze Overstreet amp Jones-Farmer 2011
72 French Ministry of Environment 2014
73 ADEME 2016
74 Leboucq 2016
Behavioural Study on Consumersrsquo Engagement in the Circular Economy
69
This logo will be added to every product sold by the brand According to a survey carried
out by SEB consumers would be positively influenced by this label in their purchasing
decisions75
Figure 21 SEB logo
Source Leboucq 201676
Consumers also need more guidance on how to choose more durable products and
how to take care of these products Regarding clothes for instance consumers could
be made aware of the importance of evaluating seams and the density of stitches or the
fact that fibre content plays a big role in clothing durability77 The department store John
Lewis provides shop floor staff with a guide (the Selling Partner Learning Guide78)
containing information that they can communicate to customers This includes messages
from WRAPrsquos Love Your Clothes Campaign and shares key messages on clothing
durability by making the connection between durability and higher quality the lower
environmental impact of those garments in comparison to disposable fashion and by
explaining how washing habits can affect the life expectancy of clothes and reduce their
environmental impact If labels can positively enhance consumer behaviour the design
of the products itself can incentivise a change
BHaze A Jones-Farmer and R Overstreet (2011) define consumption not only as an
act of purchasing but also as lsquodeveloping routines and rituals of use and modifying the
product concretely or symbolicallyrsquo Therefore designers and design can impact
consumers use of products in a more durable way For instance equipping refrigerators
with a transparent door can have an energy saving effect79 The user would directly take
the product he needs instead of opening the door and then start looking for it
Companies and manufacturers are the intermediaries between goods and consumers
Some of their strategies can drive more consumers to participate in the Circular
Economy For instance according to a report from Digital Europe on the Circular
Economy there is a growing trend towards establishing more repair services Besides
do-it-yourself shops where people who tend to perform self-repair can buy the necessary
75 Leboucq 2016
76 Leboucq 2016
77 WRAP 2017
78 WRAP June 2017 Sustainable Clothing a practical guide to enhancing durability and quality of clothes
79 Haze Overstreet amp Jones-Farmer 2011
Behavioural Study on Consumersrsquo Engagement in the Circular Economy
70
tools in order to do so companies have invested in establishing in-house repair
services and sub-contracting repair operators80 Some market leaders have also
been committed to providing more remanufacturingrefurbishment facilities Digital
Europe gives the example of Nokia which has been remanufacturing telecommunications
equipment since 1991 Considering as mentioned above the importance of the
consumersrsquo trust in the quality of the repair services this involvement in the repair
service market from manufacturers may enhance consumersrsquo participation in more CE
practices The fact that companies have established more repair services comes from the
growing interest of consumers in these services and in turn the new repair services may
attract more consumers to let their products be repaired rather than replace them when
they break down Besides SEB -one of the world leaders for household appliances-
supports consumers in their choice to repair instead of buying new product though
economic incentives They commit themselves to offer replacement parts which will not
exceed a threshold of 50 of the price of a new product In addition the cost of repair
will not exceed 13 of the price of the new item SEB also encourages the consumers to
rent certain products as well as to repair damaged goods by themselves Parts and
accessories will be available on a website and the brand will provide tutorials on how to
repair products81
412 Barriers
The literature review identified three main barriers faced by consumers when taking
durabilityreparability of products into consideration They relate to cognitive economic
and psychological factors and can be summarised as follows
The lack of knowledge about durabilityreparability features of a good and the
lack of reliable information about it
The cost of repair services
The lack of trust from the consumer in repair services
As economic agents consumers tend to be rational when making purchasing decisions
Wang and Hazen note that consumers assess the value and risk of the goods they are
buying82 (Two important variables were identified by the authors while lsquoquality
knowledgersquo exerts the strongest effect on perceptions the cost awareness is the second
most important factor influencing a purchasersquo83
The lack of knowledge of durability and reparability may hinder the purchase of
more durable appliances For instance S Maurer and U Pachl highlight that
consumers do not feel knowledgeable about how long fridges washing machines and
vacuum cleaners last nor do they know where to find reliable information on these
features In addition to the lack of awareness about the expected lifetime of a product
consumers also lack crucial information on the reparability of goods as well as on the
availability and costs of spare parts84 Without such information consumers are not able
to reward manufacturers who produce long lasting and easy repairable goods For a more
detailed discussion of consumersrsquo expectations understanding and awareness of the
durability and reparability of the products they buy see section 5
The other main barrier to consumer participation in repair services is the cost of
such services as identified in an article dated from 2008 in which M Watson reviewed
literature on consumersrsquo perceptions and behaviour relating to remanufactured repaired
and reused products85 It clearly appears that a lower price is the main reason people
would buy repaired goods rather than new ones Moreover the author quoted a survey
80 Digital Europe 2017
81 Leboucq 2016
82 Wang amp Hazen 2016
83 Wang amp Hazen 2016 p 466
84 BEUC 2015
85 Watson 2008
Behavioural Study on Consumersrsquo Engagement in the Circular Economy
71
which found that 68 of respondents mention high cost as the main reason they did not
get items repaired86 Similarly households with higher incomes are associated with a
higher probability of replacement87 As mentioned above consumers assess value and
risk when making a purchasing decision88 Once informed about the cost advantages of
remanufactured products compared to new ones the value of the product tends to
increase while the risk perception decreases89
When households need to repair an appliance they balance between the cost of repair
and the price of replacing it with an equivalent new product According to the literature
reviewed the ratio between the cost of repair and the price of replacement is the
main variable accounting for the replacement of product Where the cost of repair
or upgrading is higher than that of replacement consumers will logically go for a
replacement purchase90 The cost of repair can be relatively high compared to the price
of a new good particularly bearing in mind that a repair usually is labour-intensive work
As a result nearly half of the EU citizens (47) did not repair any faulty product during
the last 12 months As a national example French consumers are generally not willing to
pay more than 30 of the price of a new product for repair91 J McCullough (2009) in
an article written in 2009 provided a historical perspective of this relation between the
cost of repair and that of replacement92 Appliances are made in countries where labour
is cheaper than the country in which they will be repaired Therefore buying new
products tends to be cheaper than repairing old ones In a consumer report from 2001
34 of the respondents revealed that they did not repair a product because of the
decreasing replacement prices93 J McCullough (2010) provides another example of this
balance between repair and replacement prices for consumers through the impact of
discount rates Consumers with a high discount rate have a tendency toward instant
gratification and will replace an old appliance by a new one despite the fact that the older
appliance could still be repaired Once again this illustrates that a replacement price
lower than the repair cost will tend to hinder consumer use of repair services
The final barrier identified in the literature reviewed is the lack of trust with
consumers in repair services Consumer trust acts as an important psychological
factor when making purchase decisions JMcCollough (2009) reviewed a substantial part
of the scientific literature on the factors impacting the demand for repair services It
seems that considering the information asymmetry between technicians and consumers
consumersrsquo trust in the quality of the repair service has a great influence on their
decision to use it Indeed according to J McCullough lsquothe more trust a consumer has in
a mechanic (either because the mechanic is certified or has an excellent word of mouthrdquo
reputation or has been endorsed by a rating agency) the higher the expectation that a
repair will be correctly madersquo94 According to the information provided in an expert
workshop about repairs of household products a significant share of EU citizens (39)
think that repairing a broken product is often difficult or economically disadvantageous
This is mainly due to incomplete information (eg low transparency on the repair price)
but it is also due to general perception of high repair costs95
86 Watson 2008
87 Fernandez 2001
88 Wang amp Hazen 2016
89 Wang amp Hazen 2016
90 European Environment Agency 2017
91 Deloitte 2017
92 McCullough 2009
93 McCullough 2009
94 McCullough 2009 p 622
95 Deloitte 2017
Behavioural Study on Consumersrsquo Engagement in the Circular Economy
72
413 Trade-offs
The literature provides even less evidence about trade-offs and whether consumers are
willing to give up something in order to benefit from something else
A first finding comes from a European Commission Market Study mentioned in section 3
Consumers were willing to pay more (ie give up on a lower price) when
durabilityreparability information were present96 Durability information
presented in terms of years or usage units increases consumer willingness to pay more
for a more durable product Providing information on reparability also encourages
consumers to purchase more repairable products However the type of reparability
information matters Presenting the availability of spare parts substantially increases
consumer willingness to pay On the contrary providing information on the cost of spare
parts has a negative effect97
Another trade-off mentioned in a 2011 article by Ceacuteline Michaud and Daniel Llerena
involves giving up low price for more quality and environmental friendliness This article
quotes a 2009 Eurobarometer that states only a minority of consumersrsquo rate
environmental impact as more important than a productrsquos quality or price (7
and 19 respectively) So only a minority of consumers is willing to make the trade-off
where they give up on products with a lower price or products with a higher quality in
order to buy products that are more environmentally friendly As far as remanufacturing
is concerned consumers seem to face important trade-offs between the various
attributes of the product Based on the participantsrsquo written feedback during the
debriefing the authors concluded that consumers show concern for the lower quality of
remanufactured products A potential solution for this would be for companies to provide
consumers with better quality warranties98
What is more recycling and reuse are sometimes perceived as methods to lessen
guilt associated with excess consumption In other words consumers sometimes choose
the recycling and reuse for certain products because they have in their eyes given into
excess consumption when buying other goods earlier99
Another argument regarding consumer trade-offs comes from classic game theory
consumers can choose between lsquodefaultingrsquo behaviour that minimises personal
costs (inappropriate sorting burning waste littering etc) and cooperative behaviour
that will maximise the social pay-off but they will only do the latter if the majority of
the population cooperates as well Mere consideration of self-interest would always
dictate the lsquodefaultingrsquo choice The social marketing task of promoting cooperation in the
recycling dilemma is made even more difficult as the social pay-off (a cleaner
environment a better world etc) typically does not accrue to the recycling individuals
but to subsequent generations Two strategic routes to encourage cooperation are
available to social marketers an ldquoattitudinal routerdquo which induces individuals to
cooperate for the sake of cooperation and a ldquostructural routerdquo which seeks to change
the properties of the decision situation such that it is no longer a social dilemma
Structural solutions change the payoff structure such that cooperation is the alternative
with the lowest personal cost100
Regarding the situation in the Scandinavian countries research finds that many Swedes
are positive to very positive about making sacrifices in order to buy more durable
products As mentioned in section 3 in Norway the willingness to make sacrifices is fairly
96 European Commission 2017 European Commission DG JUSTGfK (2017) lsquoConsumer Market Study to support the Fitness Check of Consumer Rulesrsquo
97 Knight King Herren amp Cox 2013
98 Michaud 2011
99 Armstrong 2014 p 32
100 Smeesters 2003 p 452
Behavioural Study on Consumersrsquo Engagement in the Circular Economy
73
high when talking about more traditional circular behaviours like buying or selling
second hand products and recycling However this willingness drops significantly
when talking about engaging in the collaborative economy and sharing things
and therefore interacting with other people Especially if it entails letting other
people use onersquos own things Danes are generally more willing to make sacrifices to be
circular when it concerns the areas that they are more familiar with Examples of this are
particularly recycling and buying goods on the second hand market (73 of the
respondents were positive about recycling) When it comes to sharing and renting Danes
are not very interested in making major sacrifices to change their current behaviour
(31 of the respondents were positive about renting and borrowing and 15 about co-
ownership) Especially if sharing entails letting other people use their own belongings
The willingness to make more sacrifices to increase circular behaviour is fairly high
among Finns when it comes to the areas they are used to such as recycling and buying
second hand goods However only a small percentage of Finns are willing to make
sacrifices to co-own or rent outlend more goods to others especially when it entails
more personal commitment (only 22 of the respondents were positive about renting
out and 14 positive about co-ownership) (SB Insight 2017) For more information on
consumersrsquo willingness to engage in more sustainable purchasing and collaborative
practices see section 3
There is also a potential trade-off that could be made between durability and
energy savings if we consider that more durable products may delay sales of newer
more energy-efficient products Such a trade-off can be avoided by introducing durability
requirements together with stringent energy efficiency requirements This would also
give the industry time to redesign their products to comply with these requirements101
414 Variations across productsproduct categories
It seems however that the impact of all the drivers barriers and trade-offs mentioned
in this section do not affect all products in the same way
According to a study on lifespan labelling suitcases and printers were more impacted by
such labels while smartphones were the least affected by this102 When a label was
present 24 more suitcases were sold than without labels printers 20 and 11 for
smartphones As suitcases are mainly for travel their robustness is a crucial factor
accounting for their purchase especially if they are used on an occasional basis As for
printers they are technological objects that are perceived to have a short lifespan This
perception may have contributed to the degree of influence awarded to the label103 The
weakest impact of lifespan labelling concerned smartphones which may be attributed to
the fast development of smartphone technology
Clothes and smartphones were reported as the product category for which consumers
face the most difficulties to assess the durabilityreparability potential104
Due to the fast-moving technology of smartphones consumers may have trouble
using them in a sustainable way One of the issues relates to the gap between the
pace of software updates and the upgradable potential of the smartphones For instance
the Dutch Consumentenbond reported that 84 of all Android-smartphones that the
consumer organisation had tested within the last two years could already not rely on the
latest software anymore Moreover consumers experience frequent problems related to
failures of devices and components105 In addition the way smartphones are engineered
101 European Commission 2013 p 36
102 European Economic and Social Committee 2016
103 European Economic and Social Committee 2016 p 84
104 European Economic and Social Committee 2016
105 BEUC 2015
Behavioural Study on Consumersrsquo Engagement in the Circular Economy
74
may limit the possibility to physically access some components such as the battery and
therefore hinders the ease with which to dismantle and repair them106
Also consumers are reported to lack knowledge about the durability potential of
clothes There is large room for improvement in driving consumers towards more
durable practices in the clothes sector A WRAP (2012) research has reported that lsquonearly
four in ten consumers think there is currently too little environmental information
available about the clothes they buyrsquo A slight increase in the lifespan of clothes would
have a significant impact on the environmental footprint The WRAP report indicates that
rsquoextending the life of clothing by an extra nine-month period of active use would reduce
carbon waste and water footprints by around 20-30 each and cut resource costs by
20 (euro55 billion)rsquo Besides the ecological impact it seems that even by providing basic
information to consumers on how to treat their clothes could have a profound influence
on their expected durability Simply informing people on the way they should wash their
clothes how they can preserve the characteristics of its fibres and fabric and as a result
increase its durability could already be enough in this regard Most often clothes are
unused because they no longer fit107 Therefore one option with a high potential
regarding durability would be to provide more information on how to remake and repair
clothes (WRAP 2012)
42 Evidence from the stakeholder interviews
421 Drivers
The results from the stakeholder interviews are largely compatible with those from the
literature review and data collection The three main drivers were distinguished during
the literature review to provide more and better information about the durability
potential of the product the design of the product itself and a greater offer of repair
services from manufacturers These results were mirrored during the stage of the
stakeholder interviews
First of all a representative from a Czech consumer association stated that many
consumers in the Czech Republic are willing to pay more for more durable products
as long as they have objective information on which they can rely At present they
have little faith in producers and manufacturers and according to them this information
should be provided for free to consumers This underlines what has been found in the
literature consumers are willing to pay extra for more durable products but they need
better and more reliable information in order to actually do so in practice For an in-depth
discussion of which information should be provided to consumers see section 5
Next the design of the product itself attracted less focus from the interviewees as a
driver for consumer participation in CE practices A representative from a social
enterprise active in the area of the Circular Economy in the Netherlands pointed to the
lack of knowledge of clothing materials and construction among consumers
Difficulties exist when it comes to establishing norms for clothes and what to measure for
clothes labelling The design of clothes and consumer knowledge about this could thus
enhance their knowledge and could facilitate their choice for more durable products
Lastly some interviewees discussed the poor quality and low availability of repair
services as a reason for consumers not using repair services A German academic talked
about a series of consumer studies performed by Stiftung Warentest a German
consumer organisation where they tested repair services on the costs that are involved
with repairing spare part availability the quality of the service how fast the repair
service is whether consumers get a replacement product during the period of the repair
and how good this is They found that there were many problems with the repair services
of most big companies consumers were especially bothered by the high price of repair
and the rather low availability of these repair services The same interviewee
stated that consumers do want to consider using repair services but that it is not really a
106 SPF Santeacute publique 2014
107 WRAP 2017
Behavioural Study on Consumersrsquo Engagement in the Circular Economy
75
realistic option for them right now because of the above reasons More and better repair
services could thus act as an important driver for consumers to engage in CE practices
An additional driver was named by a representative from a company active in the
German repair market who stated that the key to more use of repair services would be
to force producers to guarantee the affordable availability of exchange parts for a
longer period This would enable an infrastructure of repair services to stay alive and to
develop According to a technical expert in repair initiatives availability of spare parts is
the key driver for enhancing the consumersrsquo use of repair services as right now the
producers have little interest in spare parts as the added value of repair is not with them
The literature paid less attention to price which interviewees named as the most
important driver A representative from a UK-based NGO focusing on the Circular
Economy and sustainable consumption mentioned that consumers are more likely to say
that product lifetime was a key factor when they bought higher priced products
than when they bought lower priced products of the same type Especially in
Romania this is the case where all interviewees representing the non-profit and
consumers interests have pointed to the fact that durability concerns are more visible
with the richer middle-classes than with other groups such as elderly and young people
Other drivers that were mentioned briefly but not explained in detail are extended
warranties mentioned by a Romanian NGO representative social pressure marketing
and advertising cultural and generational drivers social norms about (resource)
efficiency and the underlying psychological driver where people feel emotionally
attached to their products and want to engage with them according to a representative
of an Austrian consumer association as well as better education about the topic as
highlighted by representatives from NGOs and national consumer associationsrsquo
representatives With respect to marketing and advertising practices a representative
from a famous electronic appliances manufacturer added further details For instance
offering a label about the length of reparability for their products is clearly part of a
strategy which aims to influence consumers in their purchasing decisions
422 Barriers
The results from the stakeholder interviews are largely compatible with those from the
literature review and data collection To recall here three main barriers were
distinguished during the literature review the lack of knowledge about
durabilityreparability features of a good and the lack of reliable information the cost of
repair services and the lack of trust from the consumer in repair services
Several interviewees confirmed the first barrier as the most important A representative
from a German public authority stated that a lack of reliable information regarding
durability and reparability plays an important role as there are no standards for
durability information and there is a lack of good measurement procedures for durability
Notwithstanding it is not easy to design tests for all products in such a way that
durability information is available before the products are being sold as was highlighted
by the interviewee representing a German public authority A representative from a
Czech association of consumers underlined this by pointing to the fact that there is a lack
of information about the quality of products as many producers present their products as
flawless but the reality is often very different Lastly a representative from a social
enterprise active in the area of the Circular Economy in the Netherlands pointed to the
lack of knowledge of consumers regarding the materials and fabrics of clothes as an
important barrier for them to become more active in CE practices If consumers cannot
distinguish between good and durable fabrics do not know how to treat the clothes they
buy to make them last longer and do not know how to self-repair them if they become
damaged it is impossible for them to make the right choices even if they would
normally be willing to do so
Interviewees also discussed the high costs of repair services A representative from a
Czech association for social responsibility discussed the price of recyclable products as
these are usually more expensive than products that are not recyclable Also the
availability of recyclable products is relatively scarce as other not-recyclable products
are still being produced A representative from a company active in the German repair
market talked about the prices of spare parts specifically He used the example of Miele
Behavioural Study on Consumersrsquo Engagement in the Circular Economy
76
who provides electronics for their washing machines for EUR 400 while the real costs are
only about EUR 20 making the repair of washing machines uneconomic
The interviews also complemented what has been found in the literature by adding that
there are also many practical problems with repair A representative from a Dutch
public authority discussed that products nowadays are designed in such a way that the
whole product stops functioning when one small component breaks down A
representative from a German consumer organisation stated that manufacturers and
producers have most of the know-how about products and that there is not much
knowledge otherwise which makes for an unbalanced relationship with consumers
Moreover there is a trend of producing bigger and more complex machines which are
highly integrated and hard to repair
Additionally interviewees mentioned some other barriers that have been treated less in
the literature The first and foremost of these is the availability of low-quality but
cheap products tempting consumers to replace goods rather than self-repair them A
representative from a European trade association discussed the availability of cheap
clothing The main conclusion from a 2006 clothing study was that the durability of cloths
is decreasing because of a decrease in the quality of garment causing in turn a drop-in
the donation of clothes A representative from a European industry association concluded
from this that fast fashion stores therefore put pressure on the second hand industry
This was confirmed by a representative from a European trade association who pointed
to the availability of very cheap fashion particularly in the United Kingdom as an
important barrier to consumer interest in durability
Another barrier mentioned in the interviews is the fashion aspect for example in the
interview with a representative from an Austrian consumer association This is especially
the case for young people and especially for products like clothes and smartphones
Style plays an important role here and this refers to the emotional durability of
products rather than the physical durability for more information on this see section
511
Other barriers that were mentioned briefly but not explained in detail are social
pressure marketing and advertising mentioned by the same Austrian consumer
associationrsquo representative conspicuous consumption where consumers do not
consider the impacts of their user profile both regarding time and money as discussed
by a German academic and the cultural problem where society does not reward
consumers who do engage in CE practices as highlighted by a representative of a
Belgian NGO
423 Trade-offs
As with the literature review most interviewees had less to say about trade-offs and
whether consumers are willing to give up something in order to benefit from something
else For instance it is less clear whether consumers would be willing to pay more (ie
forego on a lower price) as long as they know the products are more durable
Some things were however still mentioned First of all most interviewees pointed at the
fact that price is still a very important if not the most important factor accounting
for consumer decisions An ever-growing fraction of consumers are willing to consider CE
characteristics and the reparability and durability of products but they are only willing to
pay more to a certain extent Price-sensitivity still plays a huge role There is also a
certain difference visible across products but this is discussed in detail in the next
section 424 A representative from a German consumer organisation stated that
consumers are willing to pay a bit more for durable products and that price-sensitivity
plays a role in accounting for differences in willingness across products For vacuum
cleaners for example consumers are very price-sensitive The general rule is the
higher the investment the more people are willing to pay extra for repair The
price of the durable product and the price difference with less durable products therefore
forms the most important driver for consumers in whether they are prepared to trade off
something in return for more durable products
A representative from a charity and independent think tank from the United Kingdom
highlighted that the rational choice of model based on costs and benefits alone
does not explain Circular Economy behaviour because in reality there is a more
Behavioural Study on Consumersrsquo Engagement in the Circular Economy
77
complex set of factors This confirms the finding from the literature that referred to
classic game theory even though consumers might be inclined to buy more durable
products and to self-repair rather than to replace it only makes sense for them to
actually do so when they know other consumers are doing the same This is a classic
example of the prisonerrsquos dilemma in practice and the government could play an
important role in making sure the prerequisites are such that it makes more sense for
consumers to engage in CE practices
424 Variations across productsproduct categories
From the literature review it has already become clear that the impact of all the
drivers barriers and trade-offs mentioned in this section do not affect all
products in the same way This was largely confirmed by what interviewees discussed
First of all every product requires its own approach CE practices that work well for
one product are less appropriate for others For instance a representative from a Dutch
public authority discussed that while car-sharing services are working well already
sharing platforms for other household items (such as power drills or tents) are far less
popular as sharing platforms for cars provide much more comfort and ease than sharing
platforms for household items For smartphones the same is true but here durability
and the speed of technological development play a role as well Dishwashers are
especially well suited for lease systems with repair contracts built in and there are some
experiments with contracts where you pay per wash For clothes buying new clothes is
often cheaper than having them repaired There is a growing second hand market for
clothes but this is not yet common place in all layers of society
A German academic highlighted that for each price category there are different
drivers deciding which products consumers will buy and durability plays a different role
for each category of consumers For more expensive products consumers are willing to
spend more time to make sure they buy a product that will last long enough for their
investment to be worth it In a way thus a higher price can form a driver to
consider buying more durable products Other products on the other hand are so
cheap that it doesnrsquot make sense for consumers to spend too much time or money on
avoiding buying non-durable products This was complemented by what a representative
of a Hungarian NGO stated when she said that for televisions and washing machines
consumers do consider durability but not so much for smartphones or clothes
Furthermore she stated that the guarantee and its terms and whether it can be
extended are important to consumers as well A representative from a German
consumer organisation stated that with vacuum cleaners people tend to buy rather
cheap and less durable machines while with washing machines consumers take
durability much more into account during the purchase process
A representative from a Portuguese NGO mentioned that for mobile telephones
televisions and tablets technological advancement acts as a barrier as it is quite
common to replace these products because consumers want to have the latest model
with the most up-to-date technology Clothes are rather fashion dependent products as
well and this forces many consumers to buy new clothes regularly acting as a barrier to
CE practices The low prices of certain pieces of clothing act as an additional barrier
making consumers more prone to buy new clothes For childrenrsquos clothing there is a
network of second hand stores and platforms ensuring that buying second hand clothes
is becoming more and more common The economic crisis certainly helped clothes
exchanges but it is still a very niche market Repairing clothes was much more common
twenty years ago than it is today but the younger generation seems more interested in
learning to repair their own clothes again
Regarding repairing a representative from a company active in the German repair
market stated that white goods have a lively repair service system already as
people do not change big and expensive goods like these without serious consideration
and many consumers would consider repair before replacement What is more many
producers see an excellent repair service as part of their brand message and as part
of having a well-working customer service In the television sector there is hardly
any repair being done due to a broad range of models and technologies but for
smartphones there is a substantial repair sector due to independent companies
performing the easy fixes like cracks in the display
Behavioural Study on Consumersrsquo Engagement in the Circular Economy
78
Lastly a German academic pointed to another distinction that needs to be taken into
account The interviewee stated that the classical categorisation of products is not
enough In her eyes an additional distinction needs to be made between
ldquoworkhorserdquo products and investment products which would be a more useful
category in the analysis For workhorse products durability and reparability is more
important as consumers want them to work most of the time Functioning is more
important here and consumers are willing to pay a little more for durable and repairable
products in this category The need to have a constantly functioning product is an
important driver here to buy more durable products For investment products on the
other hand reparability is more important as they tend to be expensive and consumers
tend to prefer to have them repaired rather than replaced once they buy them and they
reserve money for that during the purchase process already (write-off)
43 Evidence from the focus groups
431 Durability
According to the focus group participants factors that can encourage people to
purchase products that are more durable were
Saving money
Saving time and effort (for example by not having to go through the entire
selection and purchasing process for a new product)
Protecting the environment
Being able to purchase durable goods for lower prices and
Having a way of knowing how durable a product is
Some of the main indicators of a productrsquos durability were considered to be the brand
(certain brands being known for manufacturing more durable products) online consumer
reviews as well as word-of-mouth
When it comes to barriers (factors discouraging people from purchasing durable
products) participants across the different countries brought up the following factors
Difficulty of knowing how durable products are and which ones are more durable
The trustworthiness of costumer reviews as well as brandsrsquo reputation were
questioned Many participants flagged the fact that there were no sources of
information with regard to productsrsquo durability and made various suggestions with
regard to what type of information they would find useful and how this should be
presented (further details about this topic are provided in section 631)
ldquoVery difficult You google it before you buy it and you look at reviews Even then
itrsquos difficult to know Do I trust that You donrsquot know who writes that eg lsquothis
product is fantasticrdquo (Man mixed group Dublin)
Some participants brought up price as a barrier feeling that brands that have the
reputation of designing durable products are more expensive
[brand name] appliances ndash I say to myself they might last longer if I had the
money It is twice the price and I cannot afford itrdquo (Man vulnerable group
Prague)
Others however felt that even brands that have a strong reputation do not produce
durable products anymore The concept of planned obsolesce was brought up
during most group sessions
ldquoYou already envisage that something breaks down after a while It is sad We live
in a disposable society and it is intended by the industry that things do not lastrdquo
(Man mixed group Berlin)
Technological progress was cited as another factor discouraging people from
seeking more durable products (especially in the case of electronics)
When it comes to televisions the progress is so fast they (the televisions) are
computers now really after five years the technology can be oldrdquo (Man mixed
group Prague)
Behavioural Study on Consumersrsquo Engagement in the Circular Economy
79
ldquoIt is not only with the hardware of products that is not compatible It is also the
software When your phone is too old a certain software is not supported and you
are forced to buy a new device even though it still works That is the power of the
industry You depend on themrdquo (Man mixed group Berlin)
Fashion trends are another barrier not only for clothing but also for other types of
products
ldquoThere is a hysteria in Sweden today people love to renovate their homes and
exchange everything ndash they throw away well-functioning machines That is crazyrdquo
(Man vulnerable group Stockholm)
432 Reparability
The main factors encouraging people to have products repaired (instead of buying
new ones) can be summarised as follows
Having the possibility to repair products (ie the product itself being repairable)
Being able to repair products at a lower price than purchasing new ones
Knowing that manufacturers can produce and sell spare parts
In the case of electronics being able to receive and use a courtesy replacement
product (smartphone computer) while having onersquos own product repaired and
Being able to have products repaired in a short time (particularly for products such
as dishwashers and washing machines)
I needed my washing machine to be repaired you cannot be without it really
First they said they would do diagnostics and then they would call me And then
they have 30 days to repair it so you worry about how to wash clothes
ldquo(Woman mixed group Prague)
In terms of barriers the main factors brought up were
Belief that certain types of products (smartphones) are not made to be repairable
ldquoI think to encourage people to repair products they need to make the production
process more transparent and should not put obstacles in your way which
prevent repairing a smartphone for examplerdquo (Woman vulnerable group Berlin)
ldquoIt is possible to think more about the circular economy ndash if you are interested
you can do some things yourself change batteries on the smartphone But for
[smartphone brand] you canrsquotrdquo (Man Vulnerable group Stockholm)
Difficulties in finding spare parts
Having products repaired requires time and effort
High repair costs
Today appliances have such electronics that they change whole big parts and
the repair costs 50 and more of the cost of a new one So it is not worth itrdquo
(Man vulnerable group Prague)
Previous negative experiences when trying to have products repaired
My daughter chose [smartphone brand] and we have already claimed it four
times during the warranty period In the Prague shop where we bought it they
told us they had to send it to Germany it took 3 months it worked for 2 months
and then a claim again Then it happened for the third time and it was the same
thing They donrsquot want to give us money back because they claim to have
replaced the motherboard and therefore they see it as a new phone and the
warranty extends I donrsquot know what to do with it (Woman 37 vulnerable
group Prague)
Lack of services (for example for products purchased from foreign shops or from
foreign brands or from brands that no longer exist)
ldquoI bought kitchen appliances from one British brand ndash cooktop microwave and
dishwasher they used to have a store in the centre of Prague then They finished
after a year and a half and they disappeared from the CR even though they are
still in Britain but that is too bad for me The display stopped working on the
Behavioural Study on Consumersrsquo Engagement in the Circular Economy
80
microwave and I donrsquot know what to do the company does not even have any
representation here So I will keep using it without a display while it still works
(Woman mixed group Prague)
The fact that stores or manufacturers sometimes automatically replace
products rather than have them repaired without giving customers a choice
I bought a wood grinder and the key screw was made of plastic so they counted
on it breaking I went into the shop with it within the warranty period and they
replaced it with a new piece automatically instead of repairing it It is such waste
then (Man vulnerable group Prague)
433 Recyclability
The main reasons behind recycling can be summarised as follows
Concerns for the environment
ldquoI think it is really a good thing for the environment We have so many things
nowadays I really do not want to think about what happens to the planet It
scares merdquo (Woman vulnerable group Berlin)
The need to dispose of products that are no longer used
The possibility of saving or earning money when returning products to a
manufacturer (eg when purchasing a new washing machine or dishwasher)
The possibility of helping others (eg by recycling clothes and bringing them to
humanitarian associations or second hand shops)
Saving money (for example by purchasing second hand products)
Fashion trends (purchasing vintage furniture or clothing)
ldquoIt is trendy with vintage Young people realise how much they get for their
money when buying second hand Even jeans they probably have a better quality
than new jeansrdquo (Woman vulnerable group Stockholm)
Concerns for the environment were of high importance especially in Sweden In this
country willingness to recycle was high especially for products with components that are
dangerous for the environment In the Czech Republic on the other hand concerns for
the environment were mentioned by some participants but other factors were perceived
as equally important such as the need to dispose of products and the possibility of
saving money
In some countries participants brought up several factors that could encourage
recycling
Having transparent information about how the recycling process works and being
able to trust that products are actually being recycled (Germany Sweden)
The recycling process being more straightforward taking less time and effort
(Germany Czech Republic)
Strict laws influencing companies to be transparent with regard to the materials
they use as part of the production process and whether these are recyclable or
whether they come from recycling (Germany)
Having more information about recycling through labels similar to energy
efficiency labels (Czech Republic)
When asked about possible barriers or factors that can discourage people from
recycling participants brought up the following main aspects
Complexity along with a lack of awareness (not knowing where to recycle
products or who to contact)
ldquoI feel it is complicated I do not know where to bring old devices I also do not
find it credible as I do not know if things really get recycled or if companies just
say that It is all a hasslerdquo (Woman mixed group Berlin)
Lack of time
You have to devote time to it take it somewhere for example to recycling
centre (Man mixed group Prague)
Behavioural Study on Consumersrsquo Engagement in the Circular Economy
81
Lack of trust and lack of transparency (not knowing what is done with the
products and whether they are actually being recycled)
ldquoIt is so hard with recycling So much to think about Who is collecting it Where
does it end uprdquo (Male vulnerable group Stockholm)
For smartphones lack of awareness with regard to what happens to the data stored
on the phone Smartphones include a lot of personal data and photos making some
participants sceptical about recycling possibilities
ldquoBut for my phone I donrsquot do that for data protection issuesrdquo (Man vulnerable
group Dublin)
44 Evidence from the consumer survey
Drivers
As indicated previously in Table 13 in section 34 a majority of participants indicated
that they search for durability and reparability information on products Subsequently
the survey asked whether respondents felt that the information provided on
durabilityreparability was sufficient Table 15 shows the results
In total 86 of participants agreed that they would like to receive better
information on how long a product will last (including 25 even strongly agreeing to
the statement) Similarly strong was agreement on wishing to receive better information
on how easy it is to repair a product (83 including 23 strongly agreeing)
Table 15 Agreement to preferring better durability and reparability information (in )
Strongly
disagree
Tend to
disagree
Tend to
agree
Strongly
agree
I would like to receive
better information on how
long a product will last
20 118 613 249
I would like to receive
better information on how
easy it is to repair a
product
23 139 607 230
Note The question was Q51 ldquoTo what extent do you agree or disagree with the following statementsrdquo N=12064
Source ConPolicy analysis of consumer survey data
Figure 22 displays the results when calculating average agreement rates for the above
statements It can be found that survey participants on average agreed to prefer better
durability and reparability information
Figure 22 Agreement to preferring better durability and reparability information
(average)
Note The question was Q51 ldquoTo what extent do you agree or disagree with the following statementsrdquo Answer categories were labelled with ldquoStrongly agreerdquo corresponding to a value of +10 ldquoTend to agreerdquo corresponding to a value of +3 13 ldquoTend to disagreerdquo corresponding to a value of ndash 3 13 and ldquoStrongly disagreerdquo corresponding to a value of -10 Average values above 0 correspond to (rather) agreeing to the statement while values below 0 correspond to (rather) disagreeing Hence an average value of 0 corresponds to neither agreeing nor disagreeing N=12064
Source ConPolicy analysis of consumer survey data
Behavioural Study on Consumersrsquo Engagement in the Circular Economy
82
In addition the results were analysed by country as well as socio-demographic factors
Detailed results are displayed in detail in Section 7 in the Annex document and
summarised here below
On average participants in all twelve Member States indicated preferring better
durability information Highest agreement rates were observed in Romania Sweden
and Portugal Participants from Austria Latvia and especially the Netherlands showed the
lowest rates of agreement Averages for the different age and education groups were
slightly increasing ie older and more educated participants had a higher preference for
receiving better durability information With respect to respondentsrsquo financial situation no
systematic differences emerged
A very similar pattern was observed for preferences by country with respect to better
reparability information The individual averages were positive indicating that in all
countries participants said they preferred receiving better reparability information The
highest averages were observed in Spain Portugal and Romania and the lowest in
Austria Latvia and the Netherlands Again a small positive trend was observed with
respect to age and education Respondentsrsquo financial situation was again less influential
Barriers
The consumer survey also contained two questions regarding potential barriers to finding
information on durability and reparability Overall 82 of the participants agreed that it
is difficult to find information on how long a product will last with 27 even
indicating strong agreement with the statement Again 82 also stated the same for
reparability information with 25 indicating strong agreement
Table 16 summarizes the results for these two questions
Overall 82 of the participants agreed that it is difficult to find information on how
long a product will last with 27 even indicating strong agreement with the
statement Again 82 also stated the same for reparability information with 25
indicating strong agreement
Table 16 Agreement to having difficulties in finding durability and reparability
information (in )
Strongly
disagree
Tend to
disagree
Tend to
agree
Strongly
agree
It is difficult to find
information on how long a
product will last
14 169 549 268
It is difficult to find
information on how easy it
is to repair a product
13 168 566 253
Note The survey question was Q51 ldquoTo what extent do you agree or disagree with the following statementsrdquo N=12064
Source ConPolicy analysis of consumer survey data
Results on average agreement for the above statements were calculated as well and are
depicted in Figure 23 Again the averages being above 0 reveal that survey participants
indicated that they on average agree on having difficulties to find both durability as well
as reparability information
Behavioural Study on Consumersrsquo Engagement in the Circular Economy
83
Figure 23 Agreement to having difficulties in finding durability and reparability
information (average)
Note The survey question was Q51 ldquoTo what extent do you agree or disagree with the following statementsrdquo Answer categories were labelled with ldquoStrongly agreerdquo corresponding to a value of +10 ldquoTend to agreerdquo corresponding to a value of +3 13 ldquoTend to disagreerdquo corresponding to a value of ndash 3 13 and ldquoStrongly disagreerdquo corresponding to a value of -10 Average values above 0 correspond to (rather) agreeing to the statement while values below 0 correspond to (rather) disagreeing Hence an average value of 0 corresponds to neither agreeing nor disagreeing N=12064
Source ConPolicy analysis of consumer survey data
Section 7 in the Annex document displays the detailed results on difficulties in finding
durability and reparability information by country age education and financial situation
are displayed A summary is provided here below
Across all Member States a majority agreed that finding both durability and
reparability information was difficult The top three countries with respect to
average agreement rates were Sweden Germany and Austria Agreement rates were
lowest for the Netherlands Latvia and Romania Again a slight positive trend for the
different age groups was found ie older participants found it more difficult to find
durability information With respect to education and respondentsrsquo financial situation no
clear pattern emerged
Taking the findings from this section together with the fact that consumers seem to be
looking for durability andor reparability information it appears that the current (poor
state of information provision regarding durabilityreparability is a potential barrier to
consumer engagement in the CE It seems to emerge from the survey that better
information provision could drive further CE engagement The behavioural experiment in
section 65 looks at information provision and its effect on purchasing decisions in further
detail
441 Experience with repairing products
As a next step actual CE behaviours are analysed in more detail To this end consumersrsquo
experience with repairing products as well as reasons for repairing are discussed The
first section describes actual behaviour followed by reasons for not repairing a product
Subsequently reasons for self-repair are presented As a last step the reasons for
having a product repaired by another person are discussed including the use of
professional repair services as well as consumersrsquo satisfaction with repair services
Figure 24 displays participantsrsquo actual repair behaviour pooled over the different product
categories with corresponding shares indicating that they (i) did not repair a product
(ii) repaired a product themselves or (iii) had a product repaired for them ie by
a friend or relative a professional repair service or the manufacturer
36 indicated that they did not repair followed by having the product repaired by a
repair service (26) Another 17 had the product repaired by the manufacturer
retailer and another 12 indicated that they chose self-repair The lowest share pooled
over all product categories was revealed with respect to having a product repaired by a
friend or relative (8)
Behavioural Study on Consumersrsquo Engagement in the Circular Economy
84
Figure 24 Experience with repair pooled over product categories (in )
Note Participants were asked Q32a ldquoThinking about the last time these products broke down or became faulty did you repair these products yourself or have these products repaired for you Please select one answer for each productrdquo N=12064
Source ConPolicy analysis of consumer survey data
Table 17 shows participantsrsquo actual repair behaviour for the five different product
categories Depending on the product category either having a product repaired or not
repairing a product was the most common behaviour In the following behaviour is
reported separately for the different product categories
For vacuum cleaners participants decided either to not repair the product (41) or
having it repaired (40) whereas a lower share of 19 reported to have repaired their
faulty vacuum cleaner by themselves In the case of dishwashers the vast majority
(61) indicated to have the product repaired for them while only 25 did not repair
their faulty machine and 13 repaired it by themselves In the product category of
televisions a similarly large share (58) reported that a third person repaired their
faulty item for them 37 indicated that they did not repair their faulty television and
only 4 reported that they repaired their television by themselves This pattern is similar
for mobile phones Here 56 decided to have their faulty product repaired for them
37 did not repair it and 6 repaired it by themselves For clothing items ie coats or
jackets a different picture emerged The most frequently observed behaviour (39) was
not repairing the product closely followed by having the product repaired (35)
Additionally the share of participants who indicated that they repaired the clothing item
by themselves was larger compared to other products 24
1
17
26
8
12
36
0 10 20 30 40
Dont know
Had the product repaired by manufacturerretailer
Had the product repaired by repair service
Had the product repaired by friend or relative
Repaired the product myself
Did not repair the product
Behavioural Study on Consumersrsquo Engagement in the Circular Economy
85
Table 17 Experience with repair by product category (in )
Vacuum
cleaner
Dish-
washer
TV Mobile
phone
Coat or
jacket
No I did not repair
it or have it repaired
410 252 374 369 389
Repaired the
product myself
188 134 38 63 244
Had the product
repaired for me by a
friend or relative
98 91 63 43 145
Had the product
repaired for me by a
professional repair
service
170 394 361 259 168
Had the product
repaired for me by
the manufacturer
(including via a
retailer)
127 121 158 259 40
Donrsquot know 06 07 06 06 15
No of observations 2350 2008 2045 3053 1503
Note Participants were asked Q32a ldquoThinking about the last time these products broke down or became faulty did you repair these products yourself or have these products repaired for you Please select one answer for each productrdquo
Source ConPolicy analysis of consumer survey data
Furthermore repair behaviour was analysed for the different countries and by socio-
demographic factors A summary is written here below detailed results are shown in
Section 7 in the Annex document
Repair behaviour by country revealed some interesting patterns In the Netherlands the
majority of participants (56) indicated that they did not repair For other countries the
non-repair-rates were at least above 30 while in Romania not repairing a product was
only an option for 25 of the participants Together with this low non-repair rate
emerged high rates of having the product repaired by a repair service (40) among
Romanian participants Further individual country differences can be found in the Annex
When analysing repair behaviour by age education and income no specific patterns were
observed
Reasons for not repairing
The above presented results on repair behaviour showed that participants chose quite
frequently not to repair a product The percentage for individual product categories
ranged from 25 to 41 In the following the reasons for this behaviour are analysed
more closely
On average the most important reason for not repairing a product was the price of
repair Between 50 (dishwashers) and 25 (clothing) of participants reported that
repair would have been too expensive The second most important reason for not
repairing or having a product repaired is not as clear-cut In some cases participants
indicated that they simply preferred to get a new product while others indicated that
the item was obsolete or out of fashion In addition approximately 20 of
participants reported that the product could not be repaired
The following patterns by product category emerged For vacuum cleaners both costs
(36) and preferring to get a new vacuum cleaner (33) were indicated to be
important Additionally 21 of participants indicated that the product could not have
Behavioural Study on Consumersrsquo Engagement in the Circular Economy
86
been repaired Obsolescence or fashion (20) played a role as well For dishwashers
the difference between the most and second most important reason was larger 50 of
participants indicated that it was too expensive to repair their dishwasher or having it
repaired A lower share approximately 20 each indicated they preferred a new
product inability to repair obsolescence or fashion In the case of faulty televisions
reasons for not repairing were mixed 34 of participants reported high costs as the
main factor followed by 31 indicating to prefer a new television to a repaired one
Similarly important (30) were obsolescence or fashion and another 25 indicated
that their faulty television could not have been repaired For mobile phones 40 of
participants reported that repair would have been too expensive followed by 33
indicating that the reason for not repairing or having their faulty mobile phone repaired
was obsolescence or fashion Lastly for clothing items ie coats or jackets 47 of
participants said they preferred to get a new item instead of repairing it Compared to
the other product categories fewer participants named price (25) and obsolescence or
fashion (25) as reasons for not repairing or having a clothing item repaired
Table 18 Reasons not to repair by product category (in )
Vacuum
cleaner
Dish-
washer
TV Mobile
phone
Coat or
jacket
I preferred to get a
new one
332 204 308 334 465
It would have been
too expensive
360 496 343 398 247
The product could not
be repaired
213 192 251 168 167
The product was
obsolete or out of
fashion
197 199 295 279 245
I did not know how to
repair itwhere to get
it repaired
69 103 48 60 88
It would have been
too much effort
104 130 74 99 139
The partsmaterials
required werenrsquot
available
71 39 54 28 09
Other 45 70 52 55 38
Donrsquot know 08 08 04 05 15
No of observations 964 507 765 1128 584
Note The question was Q32d ldquoYou said that when the following product(s) broke down or became faulty you did not repair them yourself or have them repaired for you Why was this For each product please select the two most important reasonsrdquo
Source ConPolicy analysis of consumer survey data
Reasons for self-repair
As shown above self-repair was a rather uncommon practice compared to not repairing
an item or having it repaired by a third party To understand what motivates self-repair
participants were asked to indicate the two most important reasons for repairing a
product themselves The results are presented in Table 19
The most frequently cited reason for self-repairing a product was that it was cheaper to
repair than buying a new product The percentage of participants indicating this aspect
among the most important ranged from 61 for dishwashers to 33 for televisions In
Behavioural Study on Consumersrsquo Engagement in the Circular Economy
87
addition participants reported that being good at repairing things by themselves was
an important reason for self-repair 41 indicated this reason for dishwashers and 31
for televisions Another important reason for self-repair was that repairing a product was
easier than buying a new product Between 31 and 16 indicated this to be one of
the most important aspects The fourth most important reason participants indicated was
that self-repair is better for the environment
When looking at individual product categories there exist differences in the motives for
self-repair The above reported ranking of reasons seems to hold for vacuum cleaners
dishwashers and coats or jackets For these products price was the most important
driver The reported motives for televisions and mobile phones were less clear-cut price
(33) convenience (31) and repair skills (31) were ranked equally important for
televisions In contrast environmental reasons were reported with a lower frequency
(17) For mobile phones a different picture emerged While the most important reason
was price (53) self-repair skills were ranked second (40) and environmental
reasons occupied a more important position (21) than convenience (16)
Table 19 Reasons for self-repair by product category (in )
Vacuum
cleaner
Dish-
washer
TV Mobile
phone
Coat or
jacket
It was cheaper than
buying a new one
479 611 331 529 506
I am good at repairing
things myself
335 409 306 395 402
It was easier than
buying a new one
264 232 313 162 201
It is better for the
environment than
buying a new one
236 216 171 210 180
I was particularly fond
of my current product
95 32 111 137 298
My preferred product
was no longer in
production
23 21 96 95 22
Other 38 37 66 59 36
Donrsquot know 01 0 0 0 0
No of observations 422 269 78 191 366
Note The question was Q32b ldquoYou said you repaired the following product(s) yourself when these broke down or became faulty Why did you decide to do this For each product please select the two most important reasonsrdquo
Source ConPolicy analysis of consumer survey data
Reasons for having a product repaired
Another way to cope with faulty products was to have a third party repair the product
Compared to self-repair this behaviour was indicated more frequently Between 35 and
61 of participants had previous experience with having different products repaired for
them As before the survey asked respondents to indicate the most important reasons
for having products repaired
On average the most important reason was again price ie having a product repaired
was cheaper than buying a new product The share of respondents indicating this reason
Behavioural Study on Consumersrsquo Engagement in the Circular Economy
88
ranged from 55 for dishwashers to 35 for mobile phones The second most important
reason was that the product was still under guarantee108 ranging from 45 for
mobile phones to 11 for clothing
The wide ranges reported above show that there exist important differences between
product categories While for vacuum cleaners dishwashers and televisions price
and guarantees were most important this was not the case for mobile phones Instead
an existing guarantee (45) was ranked more important than price (35) For clothing
items another aspect namely being particularly fond of their current possession was
relevant (39) in addition to price (51) Guarantees on the other hand did not play
an important role (11) for clothing
Table 20 Reasons for having a product repaired by product category (in )
Vacuum
cleaner
Dish-
washer
TV Mobile
phone
Coat or
jacket
It was cheaper than
buying a new one
490 552 420 351 509
The product was still
under guarantee
262 242 342 450 107
It was easier than
buying a new one
181 170 163 142 189
I am not good at
repairing things
myself
161 154 142 122 227
I was particularly fond
of my current product
133 73 134 176 387
My preferred product
was no longer in
production
43 21 29 43 32
It is better for the
environment than
buying a new one
171 201 146 134 116
Other 21 46 35 30 41
Donrsquot know 04 04 07 02 11
No of observations 929 1217 1190 1715 531
Note The question was Q32c ldquoYou said you had the following product(s) repaired for you when these broke down or became faulty Why did you decide to do this For each product please select the two most important reasonsrdquo
Source ConPolicy analysis of consumer survey data
Experience with repair services
The previous section reported experiences with having a person repair the product
including repair by friends relatives manufacturers as well as professional repair
services Table 21 displays the shares of participants who have used a repair service for
each of the different product categories
108 This study did not address whether consumersrsquo attitudes were different for situations in which products were still covered by the 2 year legal guarantee covering all goods sold in the EU or covered by additional (extended or commercial) warranties See Glossary at the end of the report for definitions of (legal) guarantees and warranties
Behavioural Study on Consumersrsquo Engagement in the Circular Economy
89
Overall 20-24 of participants indicated that they had used a professional repair service
for a faulty mobile phone television or dishwasher Much fewer participants had used
such services for vacuum cleaners (9) and clothing items (7)
Table 21 Experience with repair services by product category (in )
Vacuum
cleaner
Dish-
washer
TV Mobile
phone
Coat or
jacket
Share of respondents
with experience with
repair services
92 195 223 244 73
Note The question was Q62a ldquoHave you used a professional repair service to repair any of the following products in the past Please select all that applyrdquo N=12064
Source ConPolicy analysis of consumer survey data
Next to these product categories it was also asked whether participants had additional
experience with a repair service ie for other products Overall 46 of the participants
reported that they had experience with repair services for products except the five pre-
defined categories
Satisfaction with professional repair services
Participants who indicated having used a professional repair service for their faulty
product were asked to indicate their satisfaction with convenience speed consumer
friendliness and quality of the repair service109 Table 22 displays aggregate results for
all product categories
Overall consumers appeared to be rather satisfied with repair services On average 83
rated convenience of using a repair service at least fairly good including 20 that rated
it even very good Speed of repair was rated similarly satisfactory with a total of 81
rating the received service at least as fairly good including 20 indicating to have used a
very good service Consumer friendliness received an even higher rating with 88
stating the service as at least fairly good with 27 agreeing on it being very good
Lastly quality of repair was also rated as satisfactory Here 88 indicated having
received at least a fairly good service with 34 stating the service to have been very
good
Table 22 Satisfaction with professional repair services (in )
Very poor Fairly poor Fairly good Very good
Convenience 24 141 633 201
Speed of repair 35 157 610 198
Consumer friendliness 21 103 611 265
Quality of the repair 31 94 540 335
Note The question was Q62b ldquoThinking about the time you used a repair service for a [vacuum cleaner dishwasher mobile phone coat or jacket] how would you rate this service in terms of the following factors Please answer on a scale from 1 (ldquoVery poorrdquo) to 4 (ldquoVery goodrdquo) The respective product was chosen randomly for each participant given that he or she reported to have used a repair service for this product in the past
N=7331
Source ConPolicy analysis of consumer survey data
109 The focus of the following survey questions was to assess consumersrsquo expectations with regard to characteristics of repair service rather than price The preceding sections of the survey asked about the importance of prices in repair vs replace decisions and highlighted that consumers judge prices as a main driver of their decisions
Behavioural Study on Consumersrsquo Engagement in the Circular Economy
90
Additionally satisfaction with professional repair services was analysed individually for
the five different product categories Detailed results are displayed in Section 7 in the
Annex document Overall satisfaction was positive for all products While clothing items
received the highest ratings for convenience speed consumer friendliness and quality of
repair smart phones received the lowest ratings For all product categories it was
observed that the highest average satisfaction rates were achieved for quality of repair
while speed of repair received comparatively lower satisfaction ratings
Table 23 displays findings on whether repair services met consumersrsquo expectations
Overall consumers indicated that professional repair services rather met their
expectations 74 reported that the engaged service was at least above their
expectations with respect to convenience of repair (including 4 stating that is was
even well above their expectations) With respect to speed of repair a similar rating
emerged 72 stated that the service was at least above their expectations with 7
rating the service even better Consumer friendliness received a slightly better rating
Here 81 indicated that the repair service performed at least above their expectations
including 9 stating that it performed even well above their expectations Lastly
quality of repair was rated with a total of 80 indicating the servicesrsquo results to have
been at least above their expectations with 10 stating them to be even well above their
expectations
Table 23 Rating whether professional repair services met expectations (in )
Well below
expectations
Below
expectations
Above
expectations
Well above
expectations
Convenience 36 227 694 43
Speed of repair 50 233 650 66
Consumer
friendliness
32 156 726 86
Quality of the repair 46 152 697 104
Note The question was Q62c ldquoAnd to what extent did the repair service live up to your expectations in terms of these factorsrdquo follow up to previous Table 22 N=7331
Source ConPolicy analysis of consumer survey data
Again results on consumersrsquo expectations were analysed on the individual product level
as well Detailed results are depicted in Section 7 in the Annex document For all product
categories it was found that expectations were largely met The highest average ratings
were observed for clothing items while ratings were lowest for smart phones Similarly
ratings were on average lower for repair services in the product category of televisions
When looking at the different rated categories ie convenience speed consumer
friendliness and quality it was found that consumersrsquo expectations more likely met for
consumer friendliness and quality than for convenience and speed
442 Experience with rentingleasing products or buying products second
hand
The following section addresses consumersrsquo actual experience with renting or leasing
products as well as buying products second hand Respondents were asked if they had
experience with such practices in the last 5 years The same product categories as before
were covered (ie vacuum cleaners dishwashers TVs mobile phones and
coatsjackets) This section is thus distinct from the analysis presented in section 341
which showed hypothetical willingness to lease product as an indicator for willingness to
engage in CE practices
Figure 25 displays results on renting or leasing and buying second hand behaviour pooled
over the product categories A vast majority of 92 indicated that they neither rented
nor bought second hand in the last 5 years Purchasing second hand was more frequent
than renting ie 6 of the participants indicated to have bought second hand products
whereas 1 indicated to have rented or leased a product
Behavioural Study on Consumersrsquo Engagement in the Circular Economy
91
Figure 25 Experience with renting leasing or buying second hand pooled over product
categories (in )
Note The question was Q33a ldquoFor each of the products below have you rented or leased such a product or purchased a product second hand in the last 5 yearsrdquo N=12064
Source ConPolicy analysis of consumer survey data
Table 24 shows behaviour for the individual product categories Clothing items and
mobile phones were bought almost twice as often second hand compared to other
products Apart from that there were no substantial differences between product
categories
Table 24 Experience with renting leasing or buying second hand by product category
(in )
Vacuum
cleaner
Dish-
washer
TV Mobile
phone
Coat or
jacket
Rented or leased a
product
08 11 11 26 08
Purchased a second
hand product
46 54 48 83 89
Neither of the above 937 928 934 882 894
Donrsquot know 11 07 08 10 09
No of observations 4907 4463 4908 4914 4917
Note The question was Q33a ldquoFor each of the products below have you rented or leased such a product or
purchased a product second hand in the last 5 yearsrdquo
Source ConPolicy analysis of consumer survey data
Behaviour was also analysed with respect to country and socio-demographic factors The
detailed results can be found in Section 7 in the Annex document with a summary here
below
The share of participants not renting or buying second hand ranged from 81 (Romania)
to 93 (Portugal and Spain) 15 of the Romanian participants indicated to have bought
second hand while this share was much lower among Portuguese participants (3)
Participants from Ireland and Hungary also revealed comparatively larger shares of
buying second hand (10) A small age trend was observed for buying second hand
While 10 of the youngest participants indicated to have bought second hand only 4
indicated this behaviour in the oldest age group Education did not seem to play a role
while there was again a trend with respect to income Participants indicating their
financial situation to be very difficult revealed in 11 of the cases to have bought second
hand while participants indicating their financial situation to be very easy bought second
hand in only 5 of the cases
1
6
1
91
0 10 20 30 40 50 60 70 80 90 100
Dont know
Purchased second hand
Rented or leased a product
Neither rented nor second hand
Behavioural Study on Consumersrsquo Engagement in the Circular Economy
92
Reasons for renting or leasing a product
As seen before only few participants have rented or leased any of the products in the
past Table 25 depicts the reasons for renting or leasing specific products for this (small)
group of participants The importance of the reasons seemed to be product specific and
no clear general patterns emerged
The most popular reason for renting or leasing vacuum cleaners was that it was easier
to rent a vacuum cleaner than to buy one (24) The same was true for renting and
leasing coats or jackets (31) Televisions were rented or leased most frequently
because people wanted to test the product before buying it (22) The most
important reason for renting a dishwasher was that people liked that the product was
also reused afterwards (31) The price was the most important reason for
participants that rented or leased a mobile phone 32 indicated that they rented or
leased a mobile phone product because they could not afford to buy it
Table 25 Reasons for renting or leasing a product by product category (in )
Vacuum
cleaner
Dish-
washer
TV Mobile
phone
Coat or
jacket
It was easier than
buying one
237 110 181 256 311
I wanted to test the
product before
buying it
187 256 219 129 226
I liked that the
product would be re-
used afterwards
93 312 159 159 97
I could not afford to
buy the product
151 228 112 316 79
Maintenance was
included
185 105 134 167 170
I only needed the
product for a short
time
172 176 105 115 141
I could get rid of the
product more easily
148 80 121 57 133
Other 52 38 68 79 38
Donrsquot know 23 05 93 36 137
No of observations 55 71 69 130 52
Note the question was Q33b ldquoYou said that you have rented or leased the following product(s) in the last 5 years Why did you decide to do this For each product please select the two most important reasonsrdquo Since participants indicated the two most appropriate reasons the totals do not sum up to 100
Source ConPolicy analysis of consumer survey data
Reasons for not renting or leasing a product
As indicated before the vast majority of the participants had no experience with renting
or leasing products Table 26 illustrates the reasons why participants had not engaged
with such practices in the past
The two most important reasons for all product categories were that participants wanted
to own the products they use (ranging from 44 to 49) as well as wanting a new
unused product (ranging from 41 to 51) Preferring not to be bound by
contracts not knowing that renting a product was possible or higher costs of
renting were all of moderate importance Negligible reasons were the inability to find a
product for rent (below 4 for all products) and lack of trust in rentalleasing firms
(below 7 for all products)
Behavioural Study on Consumersrsquo Engagement in the Circular Economy
93
Having a look at the differences between product groups it becomes obvious that there
were almost no noteworthy differences Being bound by a contract was a less important
reason not to rent a clothing item (10) compared to other product categories (about
20)
Table 26 Reasons for not renting or leasing a product by product category (in )
Vacuum
cleaner
Dishwasher Television Mobile
phone
Coat or
jacket
I like to own the
products I use
476 440 465 448 494
I wanted a new
unused product
410 415 428 429 505
I prefer not to be
bound by contracts
195 198 210 213 100
I did not know it was
possible
159 147 132 109 124
It was more
expensive than
buying the product
133 134 123 130 76
I could not find a
product for rent
24 30 18 25 25
I do not trust
rentalleasing firms
49 59 61 61 36
Other 20 28 17 23 15
Donrsquot know 10 16 11 13 24
No of observations 4796 4351 4799 4726 4809
Note The question was Q33c ldquoYou said that you have not rented or leased the following product(s) in the last 5 years Why is this For each product please select the two most important reasonsrdquo Since participants indicated the two most appropriate reasons the totals do not sum up to 100
Source ConPolicy analysis of consumer survey data
Reasons for buying a product second hand
Buying products second hand was overall more popular than renting or leasing Table 27
depicts the reasons for buying products second hand Price played an important role for
all product categories (ranging from 41 to 65) followed by the reason that
participants thought second hand products to be better value for money (ranging from
31 to 39) Moreover between 13 and 31 of participants bought second hand due
to environmental reasons Simplicity of the buying process as well as availability were
only important to a small fraction of participants that bought second hand
Furthermore a notable difference between the product categories exists regarding
environmental motives for purchasing second hand Only 13 to 20 of participants
indicated that they bought a vacuum cleaner dishwasher television or mobile phone
second hand for environmental reasons while this was true for 31 of participants
buying second hand clothing items
Behavioural Study on Consumersrsquo Engagement in the Circular Economy
94
Table 27 Reasons for buying a product second hand by product category (in )
Vacuum
cleaner
Dishwasher Television Mobile
phone
Coat or
jacket
It was cheaper than
buying a new one
414 555 509 646 579
Second hand
products are better
value for money
309 313 350 332 393
Buying goods second
hand is better for the
environment
177 164 131 196 311
It was easier than
buying a new one
151 179 167 161 66
The product I wanted
is no longer in
production
78 72 85 93 104
Second hand
products are better
quality
108 81 33 30 74
Other 38 39 52 16 15
Donrsquot know 18 07 41 22 46
No of observations 245 287 297 458 545
Note The question was Q33d ldquoYou said that you have purchased the following product(s) second hand in the last 5 years Why did you decide to do this For each product please select the two most important reasonsrdquo Since participants indicated the two most appropriate reasons the totals do not sum up to 100
Source ConPolicy analysis of consumer survey data
Reasons for not buying a product second hand
According to Table 28 the most important reason for not buying second hand was that
participants wanted to have new products instead of old ones The shares of
participants choosing this answer category ranged between 55 and 68 Lack of trust
in second hand products was on average the second most important reason followed
by agreeing to new products being better value for money Possible inferior quality of
second hand products and difficulties in buying second hand were only important to a
small share of the participants
Furthermore there exists an interesting difference regarding the trust in second hand
products between different product categories While trust in the products seemed to be
an important driver for dishwashers (30) televisions (31) mobile phones (36) and
even clothing items (20) it was a very negligible reason for vacuum cleaners (3)
Behavioural Study on Consumersrsquo Engagement in the Circular Economy
95
Table 28 Reasons for not buying a product second hand by product category (in )
Vacuum
cleaner
Dishwasher Television Mobile
phone
Coat or
jacket
I prefer having brand
new products
549 569 585 580 684
New products are
better value for
money
206 210 210 182 138
I do not trust second
hand products
29 303 309 356 203
It is more difficult
than buying a new
one
110 108 92 68 85
Second hand
products are of
inferior quality
82 66 77 103 88
I donrsquot know where
to buy a second hand
product
76 60 52 48 55
Second hand
products cost more
to maintain
53 73 64 46 22
Other 52 51 40 40 43
Donrsquot know 29 26 30 29 50
No of observations 4606 4135 4571 4398 4316
Note The question was Q33e ldquoYou said that you have not purchased the following product(s) second hand in the last 5 years Why is this For each product please select the two most important reasonsrdquo Since participants indicated the two most appropriate reasons the totals do not sum up to 100
Source ConPolicy analysis of consumer survey data
45 Evidence from the behavioural experiment
This section reports findings from the repair experiment which was part of the
behavioural experiment A short description of the experimental tasks outcome
measures treatments and monetary incentives can be found in section 271
The repair experiment had two stages First respondents needed to decide whether they
wished to repair or replace a defective product which was beyond the 2-year legal
guarantee110 In case they decided to replace their product they were given a choice to
replace it with either a brand new product or a second hand product We report findings
for each of these stages in turn below
451 Likelihood to repair
Experiment respondents had generally positive attitudes towards repairing defective
products A vast majority (92) decided to repair at least one product over the course of
the three rounds of the repair experiment task
110 To avoid confusion by respondents with regards to whether the defect was covered by a legal guarantee the product age was indicated as being 2 years for coats and smartphone and 5 years for TVs vacuum cleaners and dishwashers
Behavioural Study on Consumersrsquo Engagement in the Circular Economy
96
Figure 26 Frequency of choosing to repair across all respondents and rounds of the task
Note The repair experiment was repeated three times by each respondent each time making decisions about a different type of product N=6042
Source LE Europe analysis of behavioural experiment
The likelihood of choosing to repair a product was roughly equivalent across the different
products Only for Dishwashers the share of respondents choosing to repair was
significantly larger than for all other products as shown in Figure 27 below
Figure 27 Shares of respondents choosing to repair and replace by product type
Note Numbers of observations by product VC=3627 DW=3638 TV=3644 SM=3612 CL=3605
Source LE Europe analysis of behavioural experiment
The top two reasons for choosing to repair a product rather than replacing it in this
experiment task were
Always trying to repair products before replacing them and
Thinking that a repair would be worthwhile
Other reasons including other monetary motives and fashiontechnology preferences
were less important but still frequently mentioned as shown in Figure 28
Behavioural Study on Consumersrsquo Engagement in the Circular Economy
97
Figure 28 Reason for choosing to repair
Note Answers to follow-up question FR2 Why did you choose to repair the product instead of replacing it Select all that apply N=3769
Source LE Europe analysis of behavioural experiment
Impact of socio-psychological attitudes on repair decisions
Socio-psychological attitudes seemed to play an important role in repair or replace
decisions The consumer survey elicited several self-declared personal attitudes towards
different aspects of the CE These survey questions were used to derive indicators for the
following attitudes
Preferences for trends and fashion
Pro-environmental attitudes in general
Positive attitudes towards second hand products
Pro-CE attitudes of peers (eg family and friends)
Self-rated awareness of durability and reparability and
Positive attitudes towards durability and reparability
Shown in Figure 29 the different attitudes appear to be systematically related to the
likelihood of choosing to repair rather than to replace in the experimental task
Individuals with strong preferences for trends and fashion chose less often to repair
compared to those who had medium or weak preferences for trends and fashion In
particular the share of respondents who repaired once or twice over the course of the
three repetitions of the experiment seems to be fairly constant across different attitudes
(47-52) At the same time those with weak preferences for fashion and trends were
much less likely to never repair (5) compared to those with strong preferences for
trends and fashion (13) and much more likely to choose to repair in every round (48
compared to 35)
Similar patterns were observed for the other personal attitudes as well as for attitudes of
peers
Interestingly also individuals with positive attitudes towards second hand products were
more likely to repair rather than replace This was despite the fact that individuals could
have chosen to purchase a second hand product as a replacement product
Behavioural Study on Consumersrsquo Engagement in the Circular Economy
98
Figure 29 Likelihood to repair for respondents with different socio-psychological
attitudes relative to the CE
Preferences for trends and fashion Pro-environmental attitudes
Positive attitudes towards second hand products
Pro-CE attitudes of peers
Awareness of durability and reparability Positive attitudes towards durability and reparability
Never repaired Repaired once Repaired twice Repaired three times
Source LE Europe analysis of behavioural experiment
The reported findings were verified using regression analyses (see the Annex for further
detail) These analyses confirmed that socio-psychological factors and particularly
attitudes towards trends and fashion and attitudes towards durability and reparability
were strong drivers of the decision to repair or replace
Behavioural Study on Consumersrsquo Engagement in the Circular Economy
99
The effects of effort frictions in repair or replace decisions
The experiment systematically varied how the choice to repair was presented via
experimental treatments111 In a first step it was varied whether individuals needed to
exert more effort in order to repair or replace This treatment thus simulated the fact
that in reality it can be difficult to arrange for repair similarly it can be time consuming
to search for a replacement product either new or second hand Figure 30 below shows
how the likelihood to repair across the different experimental rounds varied under
different treatment conditions
Behaviour in the baseline condition where both repairing and replacing were effortless112
resembled behaviour in the condition in which replacement required effort 6-7 of
respondents in these conditions never repaired while 76-80 decided to repair twice
or three times
When instead repairing required effort the share of respondents deciding to never repair
doubled from 6 to 12 At the same time the share of respondents who chose to
always (three times) repair dropped from 42 to 35 Both movements are highly
statistically significant
Regression analysis reported in Table 29 similarly finds that effort in the experiment
discouraged repair but it did not discourage replacement of a broken product with either
a new or second hand product This finding was robust to the inclusion of socio-
psychological characteristics and demographics
It thus seems that frictions in the accessibility of repair services significantly
lowered the attractiveness of repairing while the same type of frictions had
virtually no effect on the decision to replace a product Overall repairing was the
most popular choice in this experiment However it seems that respondents at some
occasions had a clear motivation behind their decision to replace rather than repair For
example many respondents who replaced did not think a repair would have been
worthwhile or were interested in owning the latest fashiontechnology (see next
subsection for further details) It seems that when this was the case respondents were
not put off replacing even when it required them to go through an additional tedious
task
A possible reason for this can be seen in the behavioural economics literature which finds
that when the intrinsic motivation for a certain behaviour is strong it can outweigh
nudges and other environmental factors which could otherwise influence behaviour113
This means that in the experiment although the effort associated with repairing and
replacing was identical respondents may have still perceived that repairing would be
more tedious by taking their real-world expectations about repair into the experiment
environment Indeed it is regularly found in well-known economic experiments that
respondent behaviour can differ due to framing or labelling effects114
111 Allocations to the various treatments in the experimental tasks were done independently and randomly across the different allocations This resulted in a full factorial design between products and treatments This means that group sizes for different variants within each treatment category were roughly equal and each respondent had the same likelihood of being assigned to any specific treatment This also ensures that on average there should not be any interactions between different types of experimental treatments
112 Repairing required only clicking on a lsquoRepairrsquo button replacing required clicking on a lsquoReplacersquo button and then selecting a replacement product between a brand new or second hand product
113 Sunstein (2017) lsquoNudges that failrsquo Behavioural Public Policy
114 For example behaviour in a prisonersrsquo dilemma game differs widely depending on whether it is labelled as a ldquoCommunity Gamerdquo or a ldquoWall Street Gamerdquo similarly contributions in public goods game are different depending on whether the experiment is labelled as a ldquoCommunity Gamerdquo or simply as an ldquoExperimentrdquo See respectively Ross Ward (1996) lsquoNaive realism in everyday life Implications for social conflict and misunderstandingrsquo In Reed et al (Eds) Values and Knowledge Liberman Samuels Ross (2004) lsquoThe name of the game predictive power of reputations vs situational labels in determining Prisonerrsquos Dilemma game movesrsquo Personality and Social Psychology Bulletin 30 Dufwenberg Gaumlchter Henning-Schmidt (2011) lsquoThe framing of games and the psychology of playrsquo Games and Economic Behavior
Behavioural Study on Consumersrsquo Engagement in the Circular Economy
100
Overall however it should not be disregarded that a more than one in three experiment
participants decided to repair in each of the three rounds and were never dissuaded from
doing so because of the additional effort required
Figure 30 Frequency of repair choices in different effort conditions
Note Number of observations in different treatment conditions No effort N=2020 Effort after repair N=1991 Effort after replace N=2022
Source LE Europe analysis of behavioural experiment
Behavioural Study on Consumersrsquo Engagement in the Circular Economy
101
Table 29 Results from ordered logit regression on number of repairs chosen and logit regression on proportion of second hand products chosen
Outcome variable Number of times repair was chosen across three rounds
Proportion of second hand products chosen if respondent replaced
(1) (2) (3) (4)
Effort treatment ndash Baseline no effort
Effort after repair 0710 0699 1130 1114
(-421) (-434) (086) (073)
Effort after replace 1143 1138 0942 0930
(168) (159) (-039) (-045)
VAT treatment ndash Baseline Repair is not VAT exempt
VAT exempt 0995 0960 0999 1033
(-007) (-061) (-001) (026)
Source of repair treatment ndash Baseline Manufacturer repair with original parts only
Manufacturer repair with non-original parts 0853 0860 1306 1211
(-174) (-162) (159) (108)
Independent repair with original parts only 0974 0961 1131 1066
(-029) (-042) (072) (035)
Independent repair with non-original parts 0847 0843 1060 1058
(-176) (-177) (034) (031)
Country controls
Socio-demographics (age gender etc)
Personal attitudes (pro-CE pro-trends etc)
Model Ordered logit Ordered logit Logit Logit
N 6042 6042 3711 3711
Note Odds ratios (exponent coefficients) reported t statistics in parentheses p lt 005 plt 001 p lt 0001
Behavioural Study on Consumersrsquo Engagement in the Circular Economy
103
The effects of framing repair prices as VAT exempt
Another experimental condition varied the display of the repair prices by labelling
repair prices as including VAT or as VAT exempt It is important to note that this
experimental treatment did not vary the prices for repair as such (eg prices which were
labelled as VAT exempt were not cheaper than VAT inclusive prices)115 This is because it
was not the objective of this study to assess the price elasticity in demand for repair
services but rather to assess whether non-price related measures might make the option
to repair product more or less attractive Indeed the behavioural economics literature
often finds that the way in which prices are presented (ie framed) has important effects
on choice behaviour116 This experimental condition alluded that repair may have been a
lsquogood dealrsquo (since it was labelled as VAT exempt) and at the same time it made the
decision to repair more salient (via a red label ldquoVAT EXEMPTrdquo see section 271 for
screenshots of the experiment environment) Both these characteristics of the
experiment had been hypothesized to make repairing more attractive In the present
experiment however choices were virtually unaffected by the framing see Figure 31
and Table 29
Figure 31 Frequency of repair choices in VAT framing treatment
Note Number of observations in different treatment conditions VAT not exempt N=2997 VAT exempt N=3045 The treatment tested framing only This means that prices were identical in both experimental conditions
Source LE Europe analysis of behavioural experiment
The finding is in line with what classical economic theory would predict Classical
economic theory would not expect a shift in the demand for repair unless prices were
different Thus further efforts to expand VAT exemption of repair services should take
into account consumersrsquo price sensitivity for repair services It would need to be verified
whether demand for repair services is elastic such that price reductions due to VAT
exemption would actually increase the use of repair services According to the
behavioural experiment preferential VAT treatment purely in a marketing sense might
remain without an effect
115 For example the price to repair a dishwasher would have been euro79 incl VAT in one condition and euro79 excl VAT in another Prices were calibrated in this way to disentangle price effects from VAT framing effects
116 See for example UK Office for Fair Trading (2010) lsquoThe impact of price frames on consumer decision makingrsquo a report prepared by London Economics Tversky and Kahneman (1981) lsquoThe framing of decisions and the psychology of choicersquo Science Levin et al (1998) lsquoAll frames are not creaed equal A typology and critical analysis of framing effectsrsquo Organizational Behavior and Human Decision Processes
Behavioural Study on Consumersrsquo Engagement in the Circular Economy
104
At the same time it is important to consider that other assessments of the effects of
preferential VAT taxation (or VAT exemption) of specific goods and services are
inconclusive Most theoretical studies and pre-assessments argue that demand for the
concerned goods and services would increase due to the price reductions which would in
turn increase supply and employment in the affected sectors However these effects are
not (consistently) confirmed by post-implementation evaluations One problem in the
chain of the above arguments is that VAT reductions are often not passed on to the
consumers thus resulting in stable prices and demand117
The importance of characteristics of the repair service
Lastly the experiment tested whether repair decisions were driven by certain (non-price)
characteristics of the repair services It was varied whether repair services were more
attractive when offered by the manufacturer compared to by an independent repair
service And secondly it was varied whether the repair was done using original parts
only or original as well as non-original parts Prices across these different conditions
were held constant So this treatment can again be seen as a lsquoframingrsquo treatment
Shown in Figure 32 this experimental condition also left choices mostly unaffected
Yet further regression analysis suggested that the impact of labelling might have been
different for certain groups of consumers For example the VAT exempt label seems to
have attracted individuals who give low importance to fashion and trends towards repair
while those who attribute high importance to trends and fashion and those who had
negative attitudes towards second hand products were significantly less likely to choose
repair when it was labelled as VAT exempt The framing of repair prices as VAT exempt
has also led some respondents in more difficult financial situations to repair more
Figure 32 Frequency of repair choices by (non-price) repair characteristics
Note Number of observations in different treatment conditions Manufacturer with original parts N=1475 Manufacturer with non-original parts N=1544 Independent repair with original parts N=1524 Independent with non-original parts N=1499 The treatment tested framing only This means that prices were identical in all four experimental conditions
Source LE Europe analysis of behavioural experiment
117 For some overviews of the effects of VAT and VAT changes see for example European Commission (2013) Reduced rates of VAT frequently asked questions MEMO03149 European Commission COM(2003) 397 final Abramovski et al(2017) lsquoRedistribution efficiency and the design of VAT a review of the theory and literaturersquo Institute for Fiscal Studies Experian (2014) An estimate of the effects of a reduction in the rate of VAT on housing renovation and repair work 2015 to 2020
Behavioural Study on Consumersrsquo Engagement in the Circular Economy
105
It appears that if at all repair decisions were affected by the use of non-original parts
When aggregating data from the table above it seems that repair was slightly less
attractive when the repair service used original and non-original parts compared
to the conditions in which original parts were used exclusively At the same time
whether the repair service was offered by the manufacturer or an independent
repair shop was indifferent for respondents
Regression analysis suggested that the repair characteristics mattered to some extent to
different age groups However no clear patterns arose For example younger
respondents (aged 18-34) were less likely to repair when repair would have been done
using original parts only Instead older respondents (55+) were more likely to choose to
repair when an independent repair shop provided the service rather than the
manufacturer
These findings thus suggest that there are no strong inherent differences in consumer
attitudes towards manufacturer or independent repairs Such differences could arise for
example due to differences in trust
The present experiment however did not test whether preferences would shift for
example if repairs by the manufacturer were more expensive than repairs offered by an
independent repair shop It is likely that a difference in price would also shift consumer
preferences
As mentioned above a majority of respondents in this experiment felt a repair would be
worthwhile Interestingly more respondents indicated this reason for repairing when
repair was offered by the manufacturer with original parts only or when offered by an
independent repair shop using both original and non-original parts Instead when the
manufacturer would have used also non-original parts or an independent shop only
original parts respondents seemed to have the impression that this made repair less
worthwhile
452 Likelihood to purchase second hand
As mentioned above following the decision to repair or replace a product respondents
who chose to replace were asked whether they wished to purchase a brand new or
second hand replacement product All results presented in this section thus only show
choices for respondents who initially chose to replace and not repair their products in
the first stage
Second hand products were calibrated to be equivalent to the state of technologyfashion
of the already owned defective product whereas brand new products would have
represented an upgrade Second hand products were roughly 40 cheaper compared to
brand new replacement products
Visible from Figure 33 respondents who wished to replace their products rather than
repair them had an overwhelming preference for brand new products Only 20 of
respondents had a tendency to choose the second hand option over the option of
purchasing brand new at this decision stage
Behavioural Study on Consumersrsquo Engagement in the Circular Economy
106
Figure 33 Choices between brand new and second hand products results pooled across
all respondents repetitions of the task and experimental treatments
Note This figure presents data aggregated across the three repetitions of the experiment The left-hand bar indicates respondents who have chosen the second hand product at least once when they reached the replace stage once or twice and respondents who chose the second hand product at least twice if they reached the replace stage three times The right-hand bar shows the residual individuals who were thus more likely overall to have chosen the brand new over the second hand product
Number of respondents included in the chart N=3711 Total number of respondents in the experiment was
6042 of which 3711 (61) have chosen to replace at least once
Source LE Europe analysis of behavioural experiment
The strong preferences for brand new products were equivalent for vacuum cleaners
dishwashers and televisions with 86-87 of respondents choosing brand new over 13-
14 choosing second hand products (Figure 34) Yet for smartphones and clothes
(coats) respondents were more likely to purchase the second hand product 20
compared to the other product categories At least for coats this was likely due to the
fact that it was less fashion-driven respondents who were most likely to purchase second
hand For smartphones instead no particular respondent group drove the result
The other strands of research (literature review focus groups and stakeholder
consultations) suggested that different attitudes could drive behaviour differently for
different product categories in the sense that fashion and technology might influence
some product decisions more than others
Behavioural Study on Consumersrsquo Engagement in the Circular Economy
107
Figure 34 Choices between brand new and second hand products results pooled across
all respondents repetitions of the task and experimental treatments
Note VC=1324 DW=782 TV=1283 SM=1260 CL=1345
Source LE Europe analysis of behavioural experiment
Reasons for replacing rather than repairing were quite mixed The most important
reasons seemed to relate to scepticism around the quality of repair 47 of respondents
indicated that they did not think that repair would be worthwhile that it would be too
expensive (27) and that it would be too much hassle (18) These reasons prevailed
although only a minority of respondents thought that the product could not be repaired
(9)
At the same time a considerable proportion of respondents 35 indicated being
interested in owning the latest fashion andor technology which naturally made the
options to repair or purchase a second hand product less attractive
Figure 35 Reasons for replacing rather than repairing products
Note Answers to follow-up question FR3 Why did you choose to replace the product instead of repairing it
Select all that apply N=2273
Source LE Europe analysis of behavioural experiment
Behavioural Study on Consumersrsquo Engagement in the Circular Economy
108
Impact of socio-psychological attitudes on replacement decisions
Compared to the importance of socio-psychological attitudes on repair decisions these
factors seemed to play a less important role in replacement decisions Visible from Figure
36 the decision to purchase a second hand product was again slightly increased by more
pro-CE attitudes but the patterns were less distinct than in the preceding stage
The most notable difference in behaviour was observed for respondents with positive
attitudes for second hand products These individuals were more than four times more
likely to purchase a second hand product compared to individuals with negative attitudes
towards used products 41 compared to 9 Similarly the regression analyses
confirmed that the attitude towards second hand products was the main driver of the
decision to purchase second hand
Figure 36 Likelihood to repair for respondents with different socio-psychological
attitudes relative to the CE
Preferences for fashion and trends Pro-environmental attitudes
Positive attitudes towards second hand products
Pro-CE attitudes of peers
Awareness of durability and reparability Positive attitudes towards durability and reparability
Behavioural Study on Consumersrsquo Engagement in the Circular Economy
109
Mostly chose second hand product Mostly chose brand new product
Source LE Europe analysis of behavioural experiment
Impact of experimental treatments on the replacement decisions
The experiment did not introduce systematic changes at this decision stage None of the
experimental treatments that were applied at the first repair vs replace stage had
knock-on effects on the decision whether to replace the product with a brand new or
second hand product
Behavioural Study on Consumersrsquo Engagement in the Circular Economy
110
5 Consumersrsquo awareness understanding and expectations on
durability and reparability
The present study did not use a precise definition of what constitutes a lsquodurablersquo or
lsquorepairablersquo product Instead it was one of the main scopes of the study to uncover
what consumers associate with the concepts of lsquodurabilityrsquo and lsquoreparabilityrsquo
The study thus potentially takes a different point of view on these CE concepts compared
to studies that are focussed on industry standards Naturally industry standards require
clear definitions of what can be considered a lsquodurablersquo or lsquorepairablersquo product to be
enforceable This study instead covers the views and perceptions around durability
and reparability of the general population across different EU Member States
Based on findings from the literature stakeholder interviews focus group discussions
and the consumer survey this section presents findings on consumersrsquo awareness of
durability and reparability characteristics and what they understand by durability and
reparability as well as their expectations about such product characteristics Differences
by product category and differences in behaviour of different consumer groups in terms
of CE attitudes or socio-demographics are highlighted throughout Secondly a focus is
put on consumersrsquo after-sales expectations For example when do consumers expect a
free repair or replacement of a broken product and how do such expectations vary
depending on the product information received at the point of sale
Key findings
According to stakeholders focus group participants and survey respondents
consumers most associate products lasting for a long time with lsquodurabilityrsquo
Secondly consumers tend to collapse the concepts of durability quality and
price in the sense that they expect longer life spans for more expensive products
More specifically in the consumer survey properties most associated with a ldquodurablerdquo
product were being able to use a product for a long time and the product
staying in perfect working order for a long time
As highlighted in previous sections these consumer associations are heavily
influenced by a substantial lack of awareness and missing product information
regarding CE product characteristics
Stakeholders reported that consumer expectations about durability decreased with
time after purchase and that consumersrsquo after-sales expectations about reparability
were low
Various strands of research pointed out that older consumers expected products to
last longer
A stakeholder mentioned that consumers from former communist countries of Eastern
Europe tend to exhibit higher durability expectations At the same time as reported
already in section 4 consumers from Eastern Europe also display a higher willingness
to repair
Focus group participants felt that products produced in the past were more durable
compared to modern products
In the consumer survey the properties most associated with a ldquorepairablerdquo
product were spare parts being available for the product and the possibility to
have the product repaired by a repair firm
Several stakeholders for example from trade associations and industry highlighted
how reparability and durability should be seen in conjunction in the sense that easy
reparability can enhance durability Instead it appears that consumersrsquo mostly
view durability as a substitute for reparability because a long-lasting product would
not require repairs (see also findings from the behavioural experiment reported in
section 6 which highlight that durability plays a more important role for consumers
compared to reparability)
What consumers associate with lsquodurabilityrsquo and lsquoreparabilityrsquo seems to be consistent
across different types of products At the same time consumers have different
expectations regarding how long different products should last Focus group
participants and survey respondents have reported wide ranges of life-time
expectations for the different products of the study such as
Behavioural Study on Consumersrsquo Engagement in the Circular Economy
111
o For vacuum cleaners 27 of survey participants expected a lifespan between
4 and 7 years with another 27 that indicated an expectation of 7 to 10
years
o For dishwashers the lifespan expectations were higher with 29 indicating
that they expected a lifespan between 7 and 10 years and another 29 with
an expectation of 10 to 15 years
o Similarly 31 indicated they expected a television to last for 7 to 10 years
and another 28 stated their expectation to lie within the range of 10 to 15
years
o For mobile phones and clothing items lifespan expectations were lower 38
expected a lifespan between 2 and 4 years for mobile phones and 35
indicated a lifespan of 4 to 7 years
o For clothing items lifespan expectations were indicated to lie within 2 to 4
years by 25 and within 4 to 7 years by 26 of the participants
For all five product categories a substantial majority of survey respondents ndash ranging
from 77 for coatsjackets to 90 for dishwashers ndash thought it would be possible
for these products to be repaired either by themselves or by someone else on
their behalf This high overall percentage was largely due to an expectation that it
would be possible to have the products repaired by a third party (ie friends and
family professional repair services)
Most survey respondents who said they would be able to repair the products
themselves believed it would be ldquoratherrdquo or ldquoveryrdquo easy to repair a vacuum
cleaner (55) or coatjacket (58) whereas the shares who gave this answer
were much lower for dishwashers televisions and mobile phones (35 23 and
29 respectively)
Across all product categories most consumers expected it would be ldquoratherrdquo or ldquoveryrdquo
easy to have a product repaired for them (ranging from 51 to 69)
In terms of after-sales expectations there were contrasting views uncovered
by the different strands of research Stakeholders reported low after-sales
expectations of consumers for the reparability of products These low expectations
were grounded in negative experiences in terms of support from the retailers
These reported negative experiences seem however to contrast with findings from the
consumer survey Across the representative samples across 12 Member States most
consumers would expect a good service from repair services a substantial
majority would expect the service to be ldquofairlyrdquo or ldquoveryrdquo good in terms of
convenience (85) speed (82) friendliness (89) and quality of the repair
(92) And as reported in the previous section experiences with repair services were
mostly positive and repair services regularly exceeded expectations There thus
seems to be a mismatch between consumersrsquo expectations and actual
experiences that might be driven by exemplary negative experiences of a
minority of consumers
Generally guarantees seem to affect consumersrsquo expectations according to
stakeholder and consumer views from the survey and focus groups The longer a
product is under guarantee the longer consumers expect the product to last and the
higher are their expectations also regarding the reparability of a product Moreover if
a product breaks down during the guarantee period consumers are more likely to
return it to the retailer or manufacturer to receive a replacement or free repair
The survey revealed mixed views regarding what should happen if a product were to
become faulty For example 34 of consumers would expect to have to repair the
product at their own expense while 32 would expect repair free of charge
Repair free of charge was often expected when consumers held extended
commercial guarantees or insurance from retailers (41) the retailer claimed
that the product would ldquolast at least 10 yearsrdquo (32) or the product carried an EU
label indicating that it has a high durability rating (22)
A joint analysis of the behavioural experiment and the consumer survey has revealed
that consumers who have received durability information via manufacturer
warranties or durability promises at the point of sale in a purchasing exercise in the
experiment were significantly more likely to expect free replacement or free
repairs of faulty products Instead those who had not seen any information on CE
product characteristics or only information on the reparability of a product were
Behavioural Study on Consumersrsquo Engagement in the Circular Economy
112
significantly less likely to expect free rectification of the fault in any way and instead
more likely to expect needing to pay for either repair or replacement
51 Evidence from the literature and data collection
511 Consumersrsquo awareness understanding and expectations about
durability
Consumers understanding of durability
Braithwaite et al (2015) have studied the impact of durability information on consumersrsquo
purchasing decisions They have reviewed the part of the literature on consumersrsquo
durability understanding They have found that the meaning of durability varies among
consumers It can be linked to products that have lifetime guarantees or that have parts
that can be updated or modifiedrsquo Durability is also linked to the productrsquos performance
over time
The other sections of this report have indicated that consumers mainly link durability
to a longer lifespan (see especially section 611) The importance of lifespan
information on labels in consumersrsquo purchasing decisions confirms this statement
Moreover according to a WRAP study for a consumer the durability of a product is
measured by how long the product provides a useful service to them118
Consumersrsquo awareness of durability
Sections 612 and 614 present the importance of information about durability on
consumersrsquo purchasing decisions The reviewed literature showed that this positive
impact is explained by the consumersrsquo initial lack of knowledge on durability
characteristics The study carried out on behalf of the European Economic and Social
Committee indicated that on average a product was chosen 46 more often when the
lifespan of the product was indicated119 From this it can be concluded that consumers
are not aware of the durability of products unless they are informed about it
As an example of a white good and according to a European Commission report about
household dishwashers consumers do not feel knowledgeable about how long washing
machines last and are not aware of the information available120 Some consumers also
have doubts about whether the lifetime of products can be accurately measured
As the degree of consumersrsquo awareness varies according to the information provided it
may be assumed that having a legally required indication may enhance consumersrsquo
awareness of a productrsquos durability The Annex illustrates some specific cases where such
durability information is mandatory (see Section 3 lsquoOverview of existing policy initiatives
and potential improvements suggested by stakeholdersrsquo in the Annex document) For
instance under the European Ecodesign Directive traders shall indicate a minimum
information about the expected lifespan of vacuum cleaners and light bulbs121
Consumersrsquo expectations about durability
The reviewed literature has indicated that consumersrsquo expectation about durability
varies across products
In 2013 a WRAP study on consumersrsquo purchasing behaviour towards electronic
appliances stated that the expected durability for washing machines vacuum
cleaners and laptops were lower than for TVs and fridges However no detailed
figures or explanation were provided in this study
118 WRAP 2017
119 European Economic and Social Committee 2016
120 European Commission (2017) European Commission DG JUSTGfK (2017) lsquoConsumer Market Study to support the Fitness Check of Consumer Rulesrsquo
121 BEUC 2015
Behavioural Study on Consumersrsquo Engagement in the Circular Economy
113
Figure 37 below illustrates the desired lifespan of consumer goods according to an online
study carried out on behalf of the Chamber of Labour in Vienna in 2017 with 1009
respondents It seems that expectations regarding lifespan are higher for major
household appliances and furniture than for clothes and electronic items
Figure 37 Desired lifespan of consumer goods (in years)
Source AK Wien 2017 p 8
512 Consumersrsquo awareness understanding and expectations about
reparability
Consumersrsquo understanding of reparability
The reviewed literature provided information about the positive impact of the information
on reparability and the best way to frame this information (see section 614) However
no relevant information about consumersrsquo understanding of reparability were retrieved
Consumersrsquo awareness of reparability
As for consumersrsquo understanding of reparability no information was found in the
literature
Consumersrsquo expectations about reparability
Two main points emerged from the literature review consumersrsquo preference to use
either a professional or an independent repair service and the question of what
consumers expect when using a repair service
The first category of products for which we retrieved information is clothes According to
a WRAP study carried out in 2012 50 of survey respondents declared that they
repaired their clothes by themselves while 25 said they gave them to a friend or to a
family member to have them repaired Only 25 of the remaining respondents reported
using a professional repair service This willingness to use non-professional repair
services may be partly explained by the fact that 40 of the consumers surveyed
expressed their confidence in repairing their clothes by themselves while 15 of the
other respondents were eager to learn how to do it122
122 WRAP 2012 pp 63 65
Behavioural Study on Consumersrsquo Engagement in the Circular Economy
114
Preliminary findings of a study being conducted by a German consumer association
illustrate that 34 of consumers get their products repaired by the seller from which
they purchased it123
The next important findings deal with consumersrsquo general expectations about repair
services and the variation of those expectations across different product
(categories)
In 1978 L Adler and J Hlavcek conducted a field study on the importance of certain
repair services characteristics for consumers Following their study the five most
important repair service characteristics mentioned by consumers were cost speed
reputation quality and location
The importance of those characteristics varies across products Quality of the repair work
is the most important consideration for automobiles televisions refrigerators stoves
and stereos For electric can openers toasters and pocket calculators cost is the most
critical repair consideration In the case of typewriters and vacuum cleaners cost is
somewhat more important than quality All categories have in common that location is
the least impactful characteristic124
Finally HWieser and NTroumlger (2012) also pointed out that consumers have higher
expectations of repair services for more expensive and bigger household products
513 After-sales expectations
The literature review did not find evidence on after-sales expectations because most
studies were focussed on the purchasing process
52 Evidence from the stakeholder interviews
521 Consumersrsquo awareness understanding and expectations about
durability
Consumersrsquo understanding of durability
Interviewees underlined the conclusions from the literature review regarding consumersrsquo
understanding of durability Indeed the main input from interviewees is that durability
is interlinked with quality According to a representative from a European consumer
association the first consideration from consumers in their purchasing decision is about
quality According to him for consumers durability is the principal component of a
quality assessment A Romanian academic confirmed this association between durability
and quality
Another finding of our interview with a representative from a European trade association
the definition of the durability should be broader than the expected lifespan It
should also integrate the possibility to repair the product Indeed the easier it is to
repair the product the longer the lifespan will be Furthermore the durability definition
should also better integrate the concrete usage of the product Indeed there may be
some gaps between the metrics of a legal definition and the concrete use by the
consumer This need to broaden the definition of durability was confirmed by the
interviewee from a renowned manufacturer of household appliances The definition of
durability should also encompass the notion of reparability as the latter extends the
lifetime of a product
Consumersrsquo awareness of durability
Overall all interviews showed consistently the fact that consumersrsquo lack of information
negatively impacts their awareness of durability
The representative from a European trade association highlighted that consumers are
not aware of the durability of products because they lack crucial information
123 Verbraucherzentrale Bundesverband 2017
124 Adler amp Hlavcek 1978
Behavioural Study on Consumersrsquo Engagement in the Circular Economy
115
However as mentioned in the literature review part legal requirements of EU regulations
could fill this gap by making the information about durability mandatory
Consumersrsquo expectations of durability
A representative from a Dutch public authority mentioned that more expensive products
have better durability in general Another circular economy expert interviewed for this
study stated that consumers expect a longer life span for more expensive pieces
of clothing for example suits and coats We have found that both literature reviews and
interviews conducted agree on this
Moreover according to a European consumer association representative gender and
age also play a key role in consumer expectations For instance older people
expect products to last longer
There are also differences visible among countries Two representatives from NGOs
highlighted that in former communist countries of Eastern Europe consumer
expectations regarding durability are higher because during the communist era
products were produced in a more durable way
According to an Austrian consumer association another important point to highlight is
that consumers have rather low expectations because of past problems A representative
from a European trade association who was mentioned in the two previous sections
confirmed this point It was underlined that past negative experiences impacted
consumersrsquo expectations
522 Consumersrsquo awareness understanding and expectations about
reparability
Consumersrsquo understanding of reparability
Similar to the literature review we could not gather information on what consumers
understand by reparability
Consumersrsquo awareness of reparability
A representative from a Hungarian NGO indicated that consumer associations are well
informed and that they understand product durability and reparability However
consumers do not understand those characteristics neither are they aware of them A
representative from a European trade association highlighted that this low degree of
awareness is consistent across all product categories
Consumersrsquo expectations about reparability
Some of our interviewees agreed with the fact that expectations about reparability
vary across products and have changed over time It used to be more common to
get items like televisions and vacuum cleaners repaired Nowadays most consumers
replace them because it is easier and faster and somewhat cheaper Clothes will only be
repaired if the item has sentimental value was very expensive or is a unique item
According to other interviewees when dealing with expensive household goods
consumers expect that they will not break down at all during the minimum
lifespan They also expect that small defects will be easily repairable Thus consumers
have higher expectations about the reparability of these products This statement was
confirmed by a representative of a well-known electric appliances manufacturer who also
added that these expectations were the same for products manufactured by reputable
brands
With regards to the use of independent or professional repair services representatives of
different national consumer associations and NGOs have pointed out the fact that for
cheaper products consumers prefer independent repairers while for more
expensive products consumers prefer official repair centres from the retailers
For the latter independent centres will only be used if they have certification from
manufacturers An interviewee from an important company producing electric appliances
stressed that in general consumersrsquo preferences go towards official repair centres or at
least repair points directly working with the manufacturer
Behavioural Study on Consumersrsquo Engagement in the Circular Economy
116
523 After-sales expectations
More information about after-sales expectations were retrieved from the interviews than
in the literature review
After-sales expectations about durability
A German academic stated that consumersrsquo expectations about durability decrease
after purchase At the time of the purchase consumers have high expectations about
product lifespan As time passes consumers are more willing to change that product for
a new one
After-sales expectations about reparability
According to a representative from a European consumer association consumersrsquo
after-sales expectations about reparability are low The main reason is that a lot of
consumers have negative experience in terms of support from the retailers For instance
according to the same stakeholder several retailers have refused to repairreplace
certain components that failed (eg batteries in cell phones) while the product was still
under guarantee
Moreover a representative from a Hungarian NGO mentioned that consumers tend to
often choose replacement and refund over repair When the guarantee period is still
effective replacement is the most frequent remedy chosen This also gives an indication
about the low level of expectations about reparability from consumers
Lastly an English NGO highlighted that after-sales expectations from consumers
also depends on the kind of additional guarantee they get with a product The
longer the guarantee is the higher the expectations consumers have about reparability
53 Evidence from the focus groups
531 Consumersrsquo awareness understanding and expectations about
durability
Across the different countries durability was considered to be an important aspect
Participantsrsquo main sources of information with regard to productsrsquo durability were
Questions asked to the sales staff
Product labels
Online costumer reviews
Price (more expensive products are sometimes considered to be more durable)
Productsrsquo appearance and materials used (eg for white goods and electronics
stability metal vs plastic etc)
Brand reputation
Previous experience with certain brands
Word-of-mouth and
Duration of the guarantee (the longer the guarantee the longer the expectation
regarding the productsrsquo lifetime)
As explained in more detail in section 421 many participants pointed out that
nowadays it is very difficult to estimate a productrsquos durability Criteria such as
brand reputation price and costumer reviews are not always seen as accurate indicators
There was a large variation with regard to participantsrsquo expectations on how long
products should actually last Views varied by product category but also according to
participantsrsquo personal opinions and experiences Some participants pointed out that
products made in the past were a lot more durable than those manufactured nowadays
rdquoI have a mixer made in the GDR And it still works So more than 27 years A
friend bought a new one and it broke down after 2 years Crazyrdquo (Woman mixed
group Berlin)
Participants generally had higher expectations with regard to the durability of white
goods (washing machines dishwashers vacuum cleaners) These types of products
were generally expected to last between five and ten years
Behavioural Study on Consumersrsquo Engagement in the Circular Economy
117
Views varied more when talking about the durability of other products For televisions
some estimated durability should be between two and five years while for others a
television should be made to last between 10 and 20 years For smartphones durability
was generally expected to be between three and five years Views also varied when
discussing the durability of clothing items Some estimated durability at three years
while for others clothing should last between five and fifteen years
Views on this topic also varied by type of participants In Germany participants from the
vulnerable group had higher expectations with regard to productsrsquo durability than those
from the ldquomixedrdquo group For white goods (dishwashers washing machines vacuum
cleaners) as well as televisions participants from the vulnerable group expected these
to last twice as long as those from the ldquomixedrdquo group
When talking about productsrsquo durability participants also showed a certain level of
distrust towards manufacturers Many suggested that products made nowadays are
deliberately not ldquobuilt to lastrdquo while products made years ago were designed to be more
resistant Some participants felt that this applied to most types of products (whether
electronics or clothing) and stated that regardless of price or brand products are
designed to last only for as long as their warranty is valid
ldquoWashing machine I would have always bought the biggest and top brands for
washing machines but I have discovered that they didnrsquot last as long as I was
counting on them to last If itrsquos cheap and it works and when itrsquos gone itrsquos gone I
bought one and spend out 550 euros on it and it didnrsquot last and then the
warranty was out after a year so the next one I got was 250 euro in [store name]
and it did last as long as the other onerdquo (Woman vulnerable group Dublin)
532 Consumersrsquo awareness understanding and expectations about
reparability
Experiences attitudes and awareness with regard to reparability varied by country by
participantsrsquo situation (ldquomixedrdquo vs vulnerable group) as well as by type of product
Participants in Sweden were generally less aware of the possibility of having products
repaired than those in other countries Participants in Sweden had little knowledge with
regard to how to go about having products repaired and how to find a repair centre
ldquoI would like to find the classic old man across the street repairing all sorts of
things and if I have used mine for fifteen years he can fix it and it works for
fifteen more yearsrdquo (Female 58 mixed group Stockholm)
In Germany and Ireland awareness was higher particularly among participants from the
vulnerable groups When having to repair products that were out of warranty
participants had a preference towards small independent local repair centres
In the Czech Republic participants mentioned looking up information online about where
they can have a product repaired that is out of warranty
For products that break down while still covered by the warranty participants usually
brought these back to the manufacturer or shop where they were purchased
Some participants were mainly willing to repair products that were more expensive such
as white goods (dishwashers and washing machines) as well as smartphones and
televisions They explained that having them repaired was more advantageous than
purchasing new ones
ldquoWashing machines because (they are) very expensive so we try to fix it before
we get another one Mine could be fixed it was positive but because it was old
and really good Our TV as well it was expensive so we fixed itrdquo (Woman
vulnerable group Dublin)
Others felt that it was easier to have smaller items repaired such as small electronics
(eg vacuum cleaner) or clothing items (shoes or coats)
When talking about productsrsquo reparability one of the things participants pointed out was
that todayrsquos technology was so complex that people can no longer envisage repairing
products themselves
Behavioural Study on Consumersrsquo Engagement in the Circular Economy
118
ldquoYou know nowadays it just is not possible anymore to repair something In the
past it was easy but now with all the technology it all got too complicated and
even the mechanics find it hardrdquo (Man 56 vulnerable group Berlin)
When talking about repairing products that are no longer under warranty participantsrsquo
expectations can be summarised as follows
The price of repairing is ldquosignificantly lowerrdquo than the price of purchasing a new
product
The availability of services (being able to easily find a repair centre)
Not having to wait for too long for a product to be repaired and
Being able to find spare parts
For products still under warranty people expect to be able to have these repaired for
free
533 Consumersrsquo awareness understanding and expectations about
recyclability
Awareness with regard to how to recycle products was highest in Ireland Germany and
Sweden Participants in these countries mentioned having already recycled products by
bringing them to shops or manufacturers waste collection centres or charity
associations
In the Czech Republic participants mentioned the financial benefits of recycling In this
country some of the participants were motivated by the financial reward they got from
selling products that they no longer used on eBay
Awareness with regard to productsrsquo recyclability was however low Participants knew
little about aspects such as whether or not products they purchase are made of recycled
materials which parts of the products can be recycled and more generally what
happens to products once they are brought in for recycling (whether or not these are
actually being recycled which components are recycled and for which purposes etc) The
fact of not having this type of information was sometimes felt as discouraging for
participants
ldquoRecycling here Recycling there What does that even mean I feel that term is
used far too much and one cannot trust it anymore In Germany we recycle the
waste and then it gets burned That is annoyingrdquo (Man 46 mixed group Berlin)
Participantsrsquo expectations with regard to recyclability can be summarised as follows
Having more information with regard to productsrsquo recyclability (how products are
recycled which parts are recycled whether products they purchase are made from
recycled materials) ndash more information on this can be found in section 633
Having more information with regard to how to recycle products (where to bring
these or who to contact)
Being able to recycle easily Some participants mentioned that recycling can be
complex and time-consuming particularly in the case of having to dispose of large
electronics which requires effort as well as having a car They felt that
manufacturers and shops should be the ones in charge of undertaking some of
these tasks making it easier for consumers
ldquoIt is very hard to recycle You need a car or ask someone for help Why canacutet the
producersretailers have this service So that I can leave it with themrdquo (Female 35
vulnerable group Stockholm)
54 Evidence from the consumer survey
541 General associations with durabilityreparability
The following section analyses consumersrsquo general associations with durability and
reparability
Table 30 shows that the participants mostly associated two properties with a lsquodurable
productrsquo namely 57 indicated that they associate the term with being able to use
the product for a long time while 56 reported that they associate the term with
products staying in perfect working order for a long time Around one out of four
Behavioural Study on Consumersrsquo Engagement in the Circular Economy
119
participants also stated that durable means that a user is able to use the product very
frequently or that the product will not break under severe stresses
Table 30 Properties most associated with a ldquodurablerdquo product (in )
Answer Percentage
Being able to use the product for a long time 567
The product will stay in perfect working order for a long time 564
The product will not break under severe stresses 276
Being able to use the product very frequently 256
Other 16
None of the above 06
Donrsquot know 11
Note Participants were asked (Q21) ldquoPlease select the two properties you most associate with a ldquodurablerdquo productrdquo Since participants indicated the two most appropriate reasons the totals do not sum up to 100 There were no correct or incorrect answers the question purely asked about respondentsrsquo associations N=12064
Source ConPolicy analysis of consumer survey data
There is a more heterogeneous pattern with respect to respondentsrsquo associations with
lsquorepairable productsrsquo Table 31 present the results
46 of the participants reported that they associated repairable products with spare
parts being available for the products followed by 44 that indicated that a repairable
product could be repaired by a repair firm 33 of the participants stated that they
associate reparability with the manufacturerretailer repairing the products if it
breaks For around one out of four participants reparability refers to the possibility to
repair a product by themselves The last two associations ie that all components of
the product (eg battery) are easily accessible to the end-user and instructions manuals
are available to help with repair received lower agreement from participants (18 and
7)
Behavioural Study on Consumersrsquo Engagement in the Circular Economy
120
Table 31 Properties most associated with a ldquorepairablerdquo product (in )
Answer Percentage
Spare parts are available for the product 462
I could have the product repaired by a repair firm 443
The manufacturerretailer will repair the product for me 327
I could repair the product myself 257
All components of the product (eg battery) are easily accessible to
the end-user
184
Instruction manuals are available to help with repair 70
Other 03
None of the above 04
Donrsquot know 16
Note The corresponding question (Q22) was ldquoPlease select the two properties you most associate with a ldquorepairablerdquo productrdquo Since participants indicated the two most appropriate reasons the totals do not sum up to 100 There were no correct or incorrect answers the question purely asked about respondentsrsquo associations N=12064
Source ConPolicy analysis of consumer survey data
As seen in Table 30 the top two associations with the term durable both include a time
dimension ie using and working for a long time Hence participants were asked to
indicate their expectations regarding how long a specific product would last
For vacuum cleaners the largest share of participants (27) indicated an expected
lifespan of 4 to 7 years followed by another 27 that indicated that they expected their
vacuum cleaner to last between 7 to 10 years For dishwashers 29 of the survey
participants indicated an expected lifespan of 7 to 10 years with another 29 that
indicated an expected lifespan of 10 to 15 years The expectations for televisions were
very similar The largest share of participants (31) indicated a lifespan expectation of 7
to 10 years and 28 indicated a lifespan expectation of 10 to 15 years For mobile
phones and clothing items expectations were lower In the case of mobile phones 38
of the participants indicated an expected lifespan of 2 to 4 years and another 35
indicated an expected lifespan of 4 to 7 years Lastly for clothing items the largest share
of participants (26) indicated an expected lifespan of 4 to 7 years while another 25
indicated their expectation to lie within the range of 2 to 4 years
Figure 38 displays differences for the individual product categories The individual values
for the different product types and answer categories can be found in the Annex
For vacuum cleaners the largest share of participants (27) indicated an expected
lifespan of 4 to 7 years followed by another 27 that indicated that they expect their
vacuum cleaner to last between 7 to 10 years For dishwashers 29 of the survey
participants indicated an expected lifespan of 7 to 10 years with another 29 that
indicated an expected lifespan of 10 to 15 years The expectations for televisions were
very similar The largest share of participants (31) indicated a lifespan expectation of 7
to 10 years and 28 indicated a lifespan expectation of 10 to 15 years For mobile
phones and clothing items expectations were lower In the case of mobile phones 38
of the participants indicated an expected lifespan of 2 to 4 years and another 35
indicated an expected lifespan of 4 to 7 years Lastly for clothing items the largest share
of participants (26) indicated an expected lifespan of 4 to years while another 25
indicated their expectation to lie within the range of 2 to 4 years
Behavioural Study on Consumersrsquo Engagement in the Circular Economy
121
Figure 38 Expectations on durability by product category (in )
Note The question was Q63 ldquoFor how long would you expect the following products to last on average under normal use conditions in terms of the number of years before they need to be replaced By lsquonormal use conditionsrsquo we mean normal frequency of use and taking into account usual maintenance servicing and small repairs of the product Donrsquot worry if you do not know exactly ndash please provide your best estimate for each productrdquo N=12064
Source ConPolicy analysis of consumer survey data
Furthermore the results from the consumer survey can be compared with existing data
on product lifetimes With respect to televisions the average lifecycle is 7 years125
When comparing this value to the results from the consumer survey it can be found that
27 of the participants had a lower expectation than the average lifecycle while the
majority of 70 indicated to have a higher expectation
Additionally there exists data on the average lifecycle of smartphones which is
estimated to be approximately 2 years126 When comparing this lifecyclelifetime with the
expectations of participants in the consumer survey it can be found that 7 indicated
their expectation to be lower than the average lifecycle time while the majority of 89
reported a higher expectation
Furthermore country differences were analysed with respect to lifespan expectations
Results for all product categories and the twelve countries are displayed in the Annex
Exemplary specific results for two product categories are described in the following
namely for mobile phones and dishwashers127
125 European Commission Joint Research Centre (2018)a Assessment of the reparability and upgradability of TVs (Draft) retrieved from httpsusprocjrceceuropaeuE4CdocsJRC_report_TV_repair_v2-2_CLEANpdf It has to be kept in mind that the reported data on the average lifecycle ie the replacement cycle does not refer to the actual technical lifetime of the product While the actual technical lifetime refers to products being replaced due to breakage or malfunctioning the replacement lifecycle also includes products that are replaced due to a preference for a newer version ie still functioning Hence the actual technical lifetime of televisions can differ from the reported average lifecycle replacement cycle
126 European Commission Joint Research Centre (2018)b Guide for the Assessment of Material Efficiency application to smartphones (Draft) retrieved from httpsusprocjrceceuropaeuE4CdocsJRC_report_smartph_v23_CLEANpdf Similarly to the data on televisions it has to be kept in mind that the data on average lifecycle includes both cases where a product is replaced due to breakage or malfunctioning (technical lifetime) as well as due to a preference for a newer version ie still functioning Hence the actual technical lifetime of smartphones can differ from the reported average lifecycle replacement cycle
127 The reason for selecting those two product categories are the following Mobile phones can be characterised by shorter innovation cycles and are considered to be an electronic gadget ie consumers replace their phone
1
1
1
1
2
2
2
1
6
6
11
5
5
38
25
27
18
20
35
26
27
29
31
10
15
21
29
28
4
11
5
7
7
1
4
2
3
3
1
5
3
7
3
3
6
0 10 20 30 40 50 60 70 80 90 100
VC
DW
TV
SM
CL
Less than 1 year More than 1 but less than 2 years More than 2 but less than 4 years
More than 4 but less than 7 years More than 7 but less than 10 years More than 10 but less than 15 years
More than 15 but less than 20 years More than 20 years Donrsquot know
Behavioural Study on Consumersrsquo Engagement in the Circular Economy
122
For mobile phones around 45 - 47 of the respondents in Romania Ireland Sweden
the Netherlands and Latvia indicated an expected lifespan between 2 and 4 years In
contrast 43 of German participants indicated a higher lifespan expectancy of 4 to 7
years
When looking at dishwashers further interesting country differences were found German
and Swedish participants had a rather strong expectation for their dishwasher to last
between 7 and 15 years (ie 65 and 69) In contrast 59 of the Irish 55 of the
French and 50 of the Romanian participants indicated a shorter expected lifespan
between 4 and 10 years Furthermore a comparatively large share of 29 among the
Latvian participants indicated not to know the expected lifespan128
542 Expectations regarding repair services
The following section considers consumer expectations regarding repair services Firstly
general expectations on repair are presented Secondly results of consumersrsquo
expectations regarding the ease of self-repair are shown followed by expectations on
ease of repair by a repair service Lastly consumersrsquo expectations about the likelihood
that they would be satisfied with a repair service are presented
Table 32 shows the participantsrsquo expectations regarding the repair possibilities of the five
product categories The most common answer across all five categories was that the
participants would expect to be able to have the product repaired for them eg by
the manufacturer a professional service provider or friends and family The percentage
of participants indicating this expectation ranged from 64 to 32
Also important was the answer that they both expect to be able to repair the
product themselves and have it repaired for them (ranging from 23 to 15)
followed by the expectancy to be able to repair the product themselves (ranging from
21 to 6) A smaller share of participants indicated that they expected neither of the
above (ranging from 18 to 6)
The following differences in expectations between the individual product categories can
be seen from the results
For mobile phones and televisions the majority (59 and 64) expected to be able
to have the product repaired for them compared to a smaller share of participants
expecting to both be able to repair the products themselves and have it repaired (17
and 15) Interestingly a larger fraction of participants indicated that they expect to not
have their product repaired at all (11 and 11) compared to being able to repair the
product by themselves (7 and 6)
Similar to mobile phones and televisions for vacuum cleaners and dishwashers the
majority of participants expected to be able to have the product repaired for them (50
and 56) Less participants expected to both be able to repair it themselves and have it
repaired (23 and 22) and to be able to repair the product themselves (16 and
13) The smallest share of participants indicated that they do not expect the product to
be repaired at all (8 and 6)
For clothing items ie coats and jackets a different picture emerges 32 of the
participants expected to be able to have their product repaired for them 23 expected
to both be able to repair their item themselves and have it repaired and 21 expected to
be able to repair it themselves With 18 the share of participants indicating to not
expect to have their product repaired at all is considerably higher in the clothing category
compared to the other categories
more frequently as newer models also contain improved technical features In contrast dishwashers are characterised by longer innovation cycles and not replaced because of trends
128 As mentioned before results on the other product categories are displayed in Section 7 the Annex document In general it was found that expectations regarding vacuum cleaners and television were between those of dishwashers and mobile phones With respect to clothing expectations regarding durability were on average also rather low but also country dependent
Behavioural Study on Consumersrsquo Engagement in the Circular Economy
123
Table 32 Expectations regarding repair services by product category (in )
Vacuum
Cleaner
Dishwas
her
Televisi
on
Mobile
Phone
Coat or
Jacket
I would expect to be able to
have this repaired for me
498 557 641 592 319
I would expect to be able to
repair this myself and have
it repaired for me
225 217 146 168 233
I would expect to be able to
repair this myself
159 125 63 73 213
None of the above 79 64 105 114 175
Donrsquot know 39 37 45 53 61
No of observations 4907 4463 4908 4914 4917
Note The question (Q61a) was as follows ldquoThinking about the following types of products do you expect that it would be possible for you to repair these products yourself or to have these products repaired for you (eg by a repair firm)rdquo
Source ConPolicy analysis of consumer survey data
Ease of self-repair
Participants that indicated that they expected to be able to repair a certain product by
themselves were then asked to rate the ease of self-repair ie how much time and effort
it would be for them Table 33 summarises the results for the different product
categories
The expected ease of self-repair varies substantially between categories For vacuum
cleaners (55) and coats or jackets (68) the majority of participants reported that
self-repair would be rather or very easy whereas for other products most
participants indicated that repairing their product themselves would be rather or very
difficult (65 for dishwashers 77 for televisions and 71 for mobile phones) The
proportion of participants who found self-repair very easy was largest in the clothing
category (9) The share of participants who found self-repair very difficult was largest
in the category of televisions (20) and mobile phones (18)
Table 33 Ease of self-repair by product category (in )
Vacuum
Cleaner
Dishwash
er
Televisio
n
Mobile
Phone
Coat or
Jacket
Very easy 34 21 11 28 89
Rather easy 511 331 222 263 590
Rather difficult 413 548 568 525 289
Very difficult 42 101 199 184 33
No of observations 1738 1386 929 1031 2141
Note Depending on participantsrsquo reply to the previous question they were asked (Q61b) ldquoYou said you would expect to be able to repair the following products yourself How difficult do you think this would be (ie how much time and effort for you) Please answer on a scale from 1 (ldquoVery easyrdquo) to 4 (ldquoVery difficultrdquo)rdquo
Source ConPolicy analysis of consumer survey data
Behavioural Study on Consumersrsquo Engagement in the Circular Economy
124
Ease of repair service
Table 34 shows the results of a question that asked participants to rate the ease with
which they could have a product repaired by a repair service The rating referred to the
personal costs ie time and effort for the participants themselves
Across all product categories the majority of participants expected it to be rather or
very easy to have a product repaired for them (69 to 51) Having a product repaired
was perceived to be easiest for coats or jackets (69) followed by mobile phones
(60) vacuum cleaners (57) televisions (53) and dishwashers (51)
Table 34 Ease of repair service by product category (in )
Vacuum
Cleaner
Dishwash
er
Televisio
n
Mobile
Phone
Coat or
Jacket
Very easy 53 57 55 80 106
Rather easy 518 457 477 515 588
Rather difficult 377 387 356 313 261
Very difficult 52 99 112 93 45
No of observations 2558 2619 3255 3075 1735
Note If participants indicated that they would expect to be able to have a product repaired they were asked the following question (Q61c) ldquoYou said you would expect to be able to have the following products repaired for you How difficult do you think this would be (ie how much time and effort for you) Please answer on a scale from 1 (ldquoVery easyrdquo) to 4 (ldquoVery difficultrdquo)rdquo
Source ConPolicy analysis of consumer survey data
Expectations regarding the satisfaction with repair services
As a next step participants were asked to indicate their expectations regarding how
satisfied they think they would be if they used a repair service Table 35 presents the
results
Overall expectations were positive With respect to convenience 85 indicated that
they expect a repair service to be at least fairly good including 21 indicating expecting
a very good performance Similarly expectations on the speed of repair were high
with 82 reporting they would expect at least a fairly good service in this respect
(including 25 expecting a very good service) Consumer friendliness was expected to
be at least fairly good by 89 of participants including 31 who expected a very good
service in this regard
Expectations with respect to the quality of repair were even higher A total of 92 of
the participants stated that they expected at least a fairly good quality of repair with a
high share of 42 even stating that they expected the quality of repair to be very good
Behavioural Study on Consumersrsquo Engagement in the Circular Economy
125
Table 35 Expectations regarding the satisfaction with repair services (in )
Very Poor Fairly Poor Fairly Good Very Good
Convenience 14 139 640 207
Speed of repair 14 163 576 247
Consumer friendliness 06 103 586 305
Quality of the repair 07 74 497 422
Note The question (Q62d) was ldquoSupposing you wished to have a product repaired by a repair service how good do you expect such a service would be in terms of the following factors Please answer on a scale from 1 (ldquoVery poorrdquo) to 4 (ldquoVery goodrdquo)rdquo N=4733
Source ConPolicy analysis of consumer survey data
543 After-sales expectations
The following section addresses consumersrsquo after-sales expectations The survey
questions regarded consumersrsquo expectations in general and were not linked to specific
past experiences with products they owned Survey participants were asked to indicate
what they would expect to happen in case a product became faulty
The question scenario varied the product in question as well as the productrsquos age when it
became faulty in the following way
Suppose you purchased a new [INSERT dishwasher vacuum cleaner television
smartphone coat] and it developed a fault that made it unusable after
[INSERT period] Which of the following remedies would you expect to be
available to you if any Please select all that apply
The periods were varied to capture whether expectations vary depending on whether
products have been shortly or for a long time been beyond the legal guarantee of 2
years
Vacuum cleaners 2 or 4 years
Dishwasher 4 or 6 years
Television 4 or 5 years
Smartphone 12 or 24 months
Coat 2 or 5 years
Results are presented in the table below
While 32 would expect their broken product to be repaired for free 34 said that they
would have to pay for the repair One quarter stated that they would be entitled to a free
replacement while 24 indicated they would have to purchase a replacement on own
expense Moreover 11 said that they would be entitled to a refund
Behavioural Study on Consumersrsquo Engagement in the Circular Economy
126
Table 36 After-sales expectations for faulty products (in )
Answer Category Percentage agreement
over all variants
I would need to pay to have the product repaired 340
I would be entitled have the product repaired for free 323
I would be entitled to a free replacement 245
I would need to purchase a replacement 237
I would be entitled to a refund 106
Other 13
Donrsquot know 68
Note The question (Q81) was ldquoSuppose you purchased a new dishwasher a new vacuum cleaner a new television a new smartphone a new coat and it developed a fault that made it unusable after [period] Which of the following remedies would you expect to be available to you if any Please select all that applyrdquo Overall the following ten variants were used 1 vacuum cleaner2 years 2 vacuum cleaner4 years 3 dishwasher4 years 4 dishwasher6 years 5 television4 years 6 television5 years 7 smartphone12 months 8 smartphone24 months 9 coat2 years 10 coat5 years Results are aggregated for the ten variants N=12064
Source ConPolicy analysis of consumer survey data
Interestingly the experimental conditions of the behavioural experiment had some
knock-on effects on responses to this survey question Respondents who were shown
manufacturer warranties or durability promises as part of an EU label were
significantly more likely to expect free replacement or free repairs of faulty
products Instead those who had not seen any information on CE product
characteristics or only information on the reparability of a product were significantly less
likely to expect free rectification of the fault in any way and instead more likely to expect
needing to pay for either repair or replacement
Subsequently consumersrsquo after-sales expectations regarding entitlement to a repair free
of charge were explored in more detail Participants were asked to indicate whether they
expected repair free of charge for different scenarios
Overall 41 of the participants expect repair free of charge in case the product breaks if
they purchased an extended commercial guarantee or insurance from the retailer
Free repair in case of defects are also expected by 32 of the respondents if the retailer
claimed that the product should last at least 10 years In case the product carried
an EU label indicating that it has a high durability rating 22 of the participants
indicated that they expected a repair free of charge One fifth stated this expectation in a
scenario where the fault developed during everyday use of the product
Respondents were less likely to expect free repair in other scenarios such as the product
carrying an EU label indicating that it is repairable the retailer claiming that ldquoThis
product can be easily repairedrdquo purchasing the product directly from the manufacturer or
a large retail chain the product being more expensive than other products of the same
type and purchasing the product from a small independent retailer
Behavioural Study on Consumersrsquo Engagement in the Circular Economy
127
Table 37 After-sales expectations regarding entitlement to a repair free of charge (in )
Answer Category Percentage Agreement
over all variants
I purchased an extended commercial guarantee or
insurance from the retailer
408
The retailer claimed that ldquoThis product should last at least
10 yearsrdquo
316
The product carried an EU label indicating that it has a high
durability rating
220
The fault developed during everyday use of the product 201
The product carried an EU label indicating that it is
repairable
144
The retailer claimed that ldquoThis product can be easily
repairedrdquo
104
I had purchased the product directly from the
manufacturer
103
I had purchased the product from a large retail chain 96
The product was more expensive than other products of
the same type
90
I had purchased the product from a small independent
retailer
57
None of the above 100
Donrsquot know 100
Note The question was (Q82 following on from the question presented in Table 36 ldquoAnd in this scenario where your new dishwasher your new vacuum cleaner your new television your new smartphone your new coat developed a fault after [period] would you expect repair free of charge in the following circumstancesrdquo N=12064
Source ConPolicy analysis of consumer survey data
Behavioural Study on Consumersrsquo Engagement in the Circular Economy
128
6 Durability and reparability information and its potential role
in consumersrsquo decision-making
Previous chapters have reported repeatedly that consumers seem to lack information
about the durability and reparability when purchasing products This chapter therefore
dives deeper into the effects of providing such information and how it could be delivered
most effectively
Key findings
As reported before (see especially sections 3 and 4) consumers value Circular
Economy product credentials The literature and stakeholders support the views that
providing information about product durability and reparability would encourage
consumers to purchase products with higher Circular Economy credentials At the
same time price remains of key importance
Consequently according to the literature stakeholder views and the consumer survey
durability was more important for large and expensive products (including expensive
clothing) and less so for fashion items
In fact in the consumer survey clothing was often an outlier category in the
sense that respondents most often ranked durability and reparability as not
important for this product category The reasons behind this finding seemed to
relate to the fact that respondents would not expect to use clothing items for a long
time and that they would not expect to repair clothes if they broke
In terms of other socio-demographic differences survey respondents from Romania
and Hungary attributed a higher relevance to durability and reparability in the
purchasing process Respondents from the Netherlands Germany Austria and
France on the other hand indicated lower rates for durability and reparability
relevance
Previous studies (including experimental evidence) focus group discussants and
stakeholder views pointed out that labels and brand reputation could carry
effective durability information More specifically presenting lifetime information
through the number of usage years was slightly more efficient than showing the
number of usage units (eg per wash) Following the findings from the literature
review for white goods brand name was very important while consumers would
highly value an indicator on durability for clothes
The consumer survey supported these findings but revealed also that the most
important self-declared factors influencing purchasing decisions were
quality price and how long products would last
A majority of survey respondents attached high importance to product durability
Among these respondents the top reason was that durable products would save
them money in the long run Yet difficulty of knowing how long a product would
last could be seen as a main barrier for giving durability high importance This was
found among survey respondents who did not rate product durability as important
Across all strands of research reparability was relatively less important for
purchasing decisions compared to durability
A previous experimental study found that presenting information about the
availability of spare parts was more influential on consumersrsquo decisions than
cost-related information The interviewed stakeholders stated that most
consumers looked for the availability of repair points
Guarantees were also considered as a potential source of information on reparability
Moreover as for durability brand names seem to be important as well Consumers
seem to take brand reputation as a promise to repair according to stakeholders
Focus group discussants found different types of reparability information useful such
as how difficult it would be to repair a product and how much time would be
required to repair
In the survey the possibility to save money with easily repairable products seemed to
motivate individuals to engage with reparability The desire to keep products for a
long time had the same effect Reparability was often not given high importance in
purchasing decisions because respondents trusted manufacturersrsquo warranties or
would not expect a product to break Finally feelings that repair would be expensive
also let reparability rank low in importance
Behavioural Study on Consumersrsquo Engagement in the Circular Economy
129
All strands of research suggest that durability and reparability information
would be best provided at the point of sale
Survey respondents mostly expected to receive information via product
descriptions or by virtue of including durability information in guarantees or
warranties129
Labels were generally found to be effective at providing CE product information
Indeed focus group participants reacted positively to the possibility of having
information provided on labels such as an augmented EU Energy Label
These views are supported by strong evidence from the behavioural experiment In
the behavioural experiment durability information was best provided via
manufacturer warranties or as an expected lifetime Showing durability
information via EU labels such as for example an augmented Energy or Ecolabel
was similarly effective
The effect sizes in the experiment were large When respectively durability or
reparability information was provided in the experiment consumers were almost
three times more likely to choose products with the highest durability on
offer and more than two times more likely to choose products with the
highest reparability ratings These shifts resulted from consumers turning away
from low durabilityreparability products in favour of those with better CE credentials
As usual with experimental findings these effects need to be seen in conjunction with
the experimental setup which consisted of a simplified purchasing process with
streamlined and standardised product information compared to real-world shopping
experiences It is thus possible that the effectiveness of durabilityreparability in
reality might be increased or dampened
General CE preferences were strongest when durability and reparability
information was presented together That is when durability and reparability
information was shown together individuals were most likely to purchase products
which rated high in both dimensions ndash durability and reparability Durability was
clearly the more influential factor of these preferences In the experiment durability
information provoked the strongest shifts in preferences while reparability only
marginally led participants to choose products with overall better CE credentials
These trends in purchasing decisions were confirmed also by analyses of willingness
to pay for durability and reparability Showing information on these CE
characteristics on product descriptions at the point of sale resulted in meaningful
willingness to pay Depending on how durabilityreparability information was
presented willingness-to-pay for an additional year of durability ranged
between euro20-36 for vacuum cleaners and dishwashers euro92-148 for TVs euro148-217
for smartphones and euro14-27 for coats Willingness-to-pay for an improved
reparability rating was around euro29-54 for vacuum cleaners euro83-105 for
dishwashers euro77-171 for TVs euro48-98 for smartphones and euro10-30 for coats130
Showing expected lifetimes or manufacturer warranties produced highest
willingness to pay closely followed by the information provided on EU labels via
icons As before the differences between the effectiveness of the EU label and
manufacturer-provided information were small and it is likely that the effectiveness of
the EU label would increase over time as the icons used to indicate
durabilityreparability become better known among consumers Further consumer
testing of different icons could be further explored
Lastly behaviourally informed lsquonudgesrsquo in the form of claims popping up on
respondentsrsquo screens prior to making purchasing decisions significantly increased
respondentsrsquo preferences for more durable products Two claims were tested i)
telling people that they could save money by purchasing products which last longer
129 This study did not address whether consumersrsquo attitudes were different for situations in which products were still covered by the 2 year legal guarantee covering all goods sold in the EU or covered by additional (extended or commercial) warranties See Glossary at the end of the report for definitions of (legal) guarantees and warranties
130 The willingness-to-pay was measured per year for durability and per two-step increase on the A-G scale for reparability See Section 272 and Section 8 in the Annex document for a detailed methodology
Behavioural Study on Consumersrsquo Engagement in the Circular Economy
130
and which are easy to repair ii) telling people that a majority of people chose
products which last longer and which are easy to repair Both claims were similarly
effective
61 Evidence from the literature and data collection
611 Relevance of durability characteristics in purchasing decisions
The perception of the durability of goods may vary from one consumer to another as was
seen in section 5 From literature dealing with durability considerations during the
purchasing process it seems that most consumers relate durability to longer
timespans without a fault (ie time until it breaks and not time until it cannot be
repaired anymore)
Overall the reviewed literature has provided little concrete quantitative data on how
much consumersrsquo value durability when purchasing a good However according to a
WRAP study carried out in 2013 consumers consider product lifetimes to be important
when they acquire a new good131 In 2016 a study was commissioned by the European
Economic and Social Committee aiming to analyse whether lifespan labelling on products
might influence consumers purchasing decisions This study also provides information on
the importance for consumers of a longer lifetime Indeed out of 2917 respondents
90 stated that they would be willing to pay an additional euro102 for a similar product
with a two year longer lifespan132 This point was confirmed by a study from the
European Commission (2017) more than eight out of 10 consumers would be willing to
pay extra for products that are advertised to last longer Therefore the future uptake of
longer life products can be maximised if these are accompanied by longer commercial
guarantee or warranties
For instance the above-mentioned WRAP (2013) study reports that older consumers and
lower income groups as well as consumers with a less consumption-driven mind-set
appear to place particular importance on product lifetimes during the purchasing process
regardless of the products (goods tested in the study were washing machines fridges
vacuum cleaners) An empirical study conducted on 1009 Austrian on behalf of the
Chamber of Labour in Vienna confirms that older people use products longer than
younger consumers133 No detailed figures were provided and the qualitative analysis
carried out by the project does not answer whether it is more a matter of age or
generation In addition this result may be driven by a number of factors such as
household income and educational level
Consideration of durability characteristics per specific products
Based on the literature review the importance of durability in consumer purchasing
decisions varies depending on the product category
According to Cox et al (2013) it seems that overall consumers attach less importance
to the lifetimes of products that are governed by fashion However even for clothes
traditionally the most fashion-influenced product consumers tend to attach importance
to durability to some extent
A WRAP (2012) study on the use and disposal of clothes in the UK provides an overview
of durability considerations in the clothing industry The report was based on a
survey with 7950 UK consumers It appears that when buying clothes consumers rank
value for money as their top purchase criterion Extending the lifetime of clothing is also
something that consumers want According to the survey consumers said that one of the
top criteria they use when buying clothes is finding items that are lsquomade to last and look
good for longerrsquo Different factors account for consumersrsquo decision to purchase more
durable clothes higher income associating particular brands with longer-lasting
131 WRAP 2013
132 European Economic and Social Committee 2016
133 AK Wien 2017
Behavioural Study on Consumersrsquo Engagement in the Circular Economy
131
products a lengthy guarantee against faults or a ldquodurability indexrdquo on the garment
label134
Another study provided information about the importance of durability in
purchasing decisions for electronic items A technical report by the Joint Research
Centre of the European Commission dated from 2017 revealed the importance of
durability during the purchase of electrical or electronic appliances135 This report
presents the outcomes of a survey with 1050 German consumers136 Respondents were
asked to rank the importance of a number of factors (including energy efficiency
durability price etc) in their last purchase or next planned purchase
The results are provided in Figure 39 Although the most important criteria for consumers
when choosing electrical or electronic appliances are the electricity consumption and
energy efficiency (49) durability is ranked second (43) before the price-
performance ratio (36)
Figure 39 Consumers consideration when purchasing electrical and electronic appliances
Source Verbraucherzentrale Bundesverband 2014
However consumersrsquo durability considerations when purchasing new electronic
appliances might differ depending on the type of electronic appliance According to a
WRAP survey with 1104 UK respondents some participants indicated that they might
give greater thought to product lifetimes when buying goods depending on how likely
they thought the product was to break down To illustrate washing machines vacuum
cleaners and laptops were thought to be more likely to break down than televisions and
fridges
612 Information on durability and its role in the purchasing decision
This section analyses in which way the type and quality of information on durability can
influence purchasing decisions
At the moment of purchase consumers do not feel knowledgeable enough
about how long their products will last Some of them also have doubts about
134 Although each factor was cited by around one-third of respondents they were not ranked in terms of preference by the UK respondents
135 European Commission Joint Research Centre 2017b
136 Verbraucherzentrale Bundesverband 2014
Behavioural Study on Consumersrsquo Engagement in the Circular Economy
132
whether the lifetime of products can be accurately measured137 Consumers use a
combination of general knowledge and proxies138 to make assessments about lifetimes of
comparable products139 Different factors are used by consumers to estimate product
durability including design technological change the cost of repair the availability of
spare parts household affluence aesthetics functional quality and fashion
Recent research has also found that in absence of reliable information on durability
consumers use intrinsic and extrinsic cues to judge the lifespan of products For
consumers expectations of lifespans can be subjective and influenced by brand name
perceived quality past experience age and income of the consumer as well as their
current needs140 Cox et al (2013) confirm this statement when the lifetime of products
is not included on the product label it is inferred by consumers through other indicators
such as the perceived reliability based on the general knowledge of consumers
Overall the studies reviewed agree on the fact that providing consumers with
information on a productrsquos lifespan would have a positive impact on their decision to
purchase more durable goods141 According to R Tansey with more information
consumers would make more rational decisions while also considering social and
environmental impact in their purchases which would in the end redirect demand to
more environmentally or socially respectful products142 The consumer market study
carried out in 2017 by GFK to support the European Commission Fitness Check of
Consumer and Marketing Law provides details about the effectiveness of information on
durability143 An experiment was realised to test whether consumers take durability and
reparability information into consideration when they purchase goods A sample of 7234
consumers coming from eight European countries had to choose between different
washing machines televisions and smartphones with different degrees of information
about durability and reparability provided One of the main outcomes of this study is the
positive impact of the presence of durability information on consumersrsquo
purchasing decisions When no information was provided the items in question were
selected by 27 of the respondents while 47 of the respondents chose the same
products when such information was present144 As shown in Figure 40 when durability
information is present respondents are on average willing to pay 5 (EUR 16) more
relative to the baseline for products with high durability In a Eurobarometer survey
from December 2012 92 out of the 25568 respondents across the EU27 indicated that
the lifespan of products should be indicated (92)145
To date there are no requirements at European level for manufacturers to inform
consumers about for example the averageexpectedminimal lifetime of goods except
the Ecodesign set of regulations on light bulbs In practice this kind of information about
the durability of goods is rarely present146
137 European Commission 2017
138 As defined by the authors general knowledge refers to the participants experience in using those products or to the experience of their relatives The proxies used by the consumers are brands prices or guarantees
139 Cox Herren King amp Knight 2013 European Commission 2017
140 Braithwaite Densley-Tingley amp Moreno 2015 pp 11-17
141 See for instance Tansey R 2015 ldquoReduccioacuten de residuos el reciclaje no es suficiente para alcanzar una economiacutea circularrdquo European Commission 2017 ldquoConsumer market study to support the fitness check of Consumer Rulesrdquo European Economic and Social Committee 2016 ldquoThe influence of lifespan labelling on consumerrdquo
142 Tansey 2015
143 European Commission 2017
144 European Commission 2017 p 429
145 European Commission 2017 p 416
146 European Commission 2017
Behavioural Study on Consumersrsquo Engagement in the Circular Economy
133
Figure 40 Impact of durability information on the consumersrsquo purchasing decision
Source (European Commission 2017 Consumer Market Study to support the Fitness Check of Consumer Rulesrsquo p 437)
How durability information is provided
People use a range of online andor in-store information sources during the purchasing
process147 Consumers believe that the main source of information they can access
during the decision-making process to compare the expected lifetime of different
products is to be found on online reviews from other consumers148
The presentation of durability information through labels would allow more
informed purchasing decisions from consumers The study commissioned by the
European Economic and Social Committee (EESC) in 2016 mentioned in section 611
revealed that on average a product is chosen 46 more often when lifespan is
indicated on the product label149 In a report from 2015 about the influence of energy
labels for washing machines Braithwaite et al (2015) confirmed the importance of
durability information on the product label for consumers According to this study a
specific lifespan label would increase the consumption of more durable products even
more
The Consumer Market Study realised by GFK found that presenting durability-related
information in terms of years has a slightly more powerful impact (485) than
in units (461)150In this instance units were presented as specific usage units For
example the number of wash cycles for a washing machine
Manufacturer guarantees or warranties act as another source of information for
consumers in their purchasing decisions According to a study carried out by Cox
Herren King amp Knight (2013) they are perceived as a show of faith by manufacturers in
the lifespan of their products The provision of longer warranties can prompt consumersrsquo
purchases towards products with longer lifetimes Indeed as evidenced in the same
study consumers value highly the reassurance provided by longer guarantees or
warranties and are even willing to pay a higher price when warrantees or guarantees are
147 Cox Herren King amp Knight 2013
148 Cox Herren King amp Knight 2013
149 European Economic and Social Committee 2016
150 European Commission 2017 p 437
Behavioural Study on Consumersrsquo Engagement in the Circular Economy
134
provided151 They tend to believe that products covered will be quickly repaired or
replaced if they break down Therefore the future uptake of longer life products can be
maximised if these are accompanied by longer warranties
The role of the durability information per specific product
The importance of durability-related information as well as the way it should be provided
when consumers purchase goods varies across product categories
For example preliminary findings of a study being conducted by a German consumer
association illustrate that for 81 of consumers durability information of electrical
equipment is (rather) important152
With regards to white goods the brand name is very important Often the implicit
assumption is that traditional white goodsrsquo manufacturers produce longer-lasting
products accompanied with consumer-oriented repair services Consumers tend to buy
white goods from traditional and popular brands so they have access to good repair
services153 As consumer expectations about lifetimes are often implicit providing a clear
indication of durability through a labelling system would substantiate those expectations
According to Braithwaite et al (2015) for washing machines labels presenting the
lifespan in terms of expected years of life have a bigger impact on consumersrsquo purchasing
decisions than the ones presenting lifespan in terms of units
When purchasing clothes consumers look for information about durability and
quality Indeed one-third of customers covered by the WRAP (2012) survey mentioned
in section 611 would value a durability indicator of some sort during the purchase
process WRAP (2017) has also developed a sustainable clothing guide aiming partly to
provide information on how to make clothes last longer According to WRAP given a little
direction consumers would be able to gauge the quality and potential durability of
garments before they buy them Information could include advice on evaluating seams
looking for loose threads and broken stitches and making consumers aware of the fact
that a higher density of stitches per inch is generally better Simply improving care
information on labels and packaging at the point of purchase would promote more
durable behaviour Moreover consumers attach less importance to the lifetime of
products that are subject to fashion154
613 Relevance of reparability characteristics in purchasing decisions
Section 3 has provided factual information about the growing consumer willingness to
engage with repair services In comparison with the durability characteristics the
literature review has found little information about the importance of reparability in
consumersrsquo purchasing decisions
614 Information on reparability and its role in the purchasing decision
This section offers an analysis on the way available information on reparability can
influence purchasing decisions
Preliminary findings of a study being conducted by a German consumer association
illustrate that for 82 of consumers information about the reparability of products is
(rather) important155
The main information retrieved about the role of reparability information on consumersrsquo
purchasing decisions comes from the Consumer Market Study (2017) undertaken by
GFK According to the experiment mentioned in section 612 on Information on
durability and its role in the purchasing decision it appears that providing information
151 European Commission 2017
152 Verbraucherzentrale Bundesverband 2017 p 6
153 Vangerow 2017
154 Cox Herren King amp Knight 2013
155 Verbraucherzentrale Bundesverband 2017 p 6
Behavioural Study on Consumersrsquo Engagement in the Circular Economy
135
on reparability (on the costavailability of spare parts) has a positive effect on
consumersrsquo purchasing decisions On average when reparability information was
present on the products tested (televisions washing machines and smartphones) those
products were selected by 43 of the consumers regardless of the type of reparability
information In comparison when there was no information provided on reparability the
same products were chosen by only 30 of the respondents
How reparability information is provided
Important findings about the most influential ways to present reparability-related
information were retrieved from the European Commission Consumer Market Study
(2017) mentioned above Information about reparability was framed in two different
ways a first option provided an indication of the cost of spare parts and the second
of the availability of those spare parts
Information presented in terms of the availability of spare parts was more
efficient than the financial information Indeed 7234 respondents were on average
willing to pay an extra euro14 for products with a longer availability of spare parts while
they were on average willing to pay euro7 less for products where the costs of repair were
indicated This variation of willingness can be explained by the fact that cost is the main
variable taken into account by consumers during their purchasing decisions Thus the
indication of the costs of repair is considered by the consumers as potential additional
costs
Figure 41 Role of reparability-related information on the consumersrsquo purchasing decision
Source European Commission 2017 p 437
Information about reparability does not affect all consumers in the same way The impact
of reparability information among consumers with a pro-environmental position was
greater than for consumers who are better financially positioned The effect of
reparability information also differs according to the consumerrsquos nationality Overall all
eight countries studied reported a positive impact for the presence of reparability
information However the effect of reparability information was greater in Portugal and
the Netherlands while the weakest impact was found in France and Poland No
explanatory factors for this variation were provided by this study
As seen in section 612 on Information on durability and its role in the purchasing
decision labels have a key role in informing consumers about the durability
characteristics of products No similar influence of labels for reparability characteristics
was indicated in the literature However an indicator rating the reparability
potential of an item can play a key role in consumersrsquo purchasing decision The
iFixit index is an example of such an indicator The reparability index ranks electronic
devices by ease of repair A reparability score between zero and 10 is calculated for each
new model of tablet laptop and smartphone of the main brands on the market A device
with a perfect score will be relatively inexpensive to repair and easy to disassemble The
difficulty of opening the device the types of fasteners found inside and the complexity
involved in replacing major components are also considered This makes this indicator
useful for policymakers product designers and users looking to buy devices with a
better reparability potential (European Environment Agency 2017)
Behavioural Study on Consumersrsquo Engagement in the Circular Economy
136
Role of the reparability information per specific product
Information about reparability could play a key role in consumersrsquo decision to
purchase clothes According to the WRAP study dated from 2012 mentioned in section
611 a quarter of the UK respondents would wear unworn clothes if they had the ability
to repair them The WRAP study further indicates that businesses could play a key role
by raising consumer awareness about how and where to use repair services
The European Commission Consumer Market Study completed by GFK in 2017 indicates
that the positive impact of reparability information on consumersrsquo purchasing decision
was slightly weaker for smartphones than for TVs and washing machines We
have not found explanatory factors for such phenomenon in the literature review
However the focus groups suggested that some consumers may not prioritise
reparability for smartphones because technological progress (ie software updates)
would make their smartphones obsolete and they may wish to purchase newer models
(see section 33)
According to a study conducted by Cox Herren King amp Knight (2013) for WRAP if
products were more durable reparability would become less important as a
consideration In the case of household appliances (in this study fridges washing
machines vacuum cleaners) the importance of lifetime is underpinned by a desire to
avoid the expense and inconvenience of repair or replacement if they break down
62 Evidence from the stakeholder interviews
621 Relevance of durability characteristics in purchasing decision
Overall interviewees indicated that durability characteristics matter for consumersrsquo
purchases but that it is not the main factor of decision-making
According to a representative of a European consumer association the first factor for
consumers when deciding to buy a new product is the quality As part of this quality
assessment durability is the principal component followed by the cost factor and usually
an association between quality and durability can be found According to a Romanian
academic quality represents the extent to which a product can satisfy consumer needs
so durability is part of quality as a factor
However the interviewed Romanian academic is the only one ranking durability and
quality as the first criteria of consumersrsquo purchasing decision Other interviewees either
mentioned the quality aspect in its relation to the price of the product or indicated that
the price is the main consideration in consumersrsquo purchasing decisions
According to a representative from a Spanish consumer organisation the most important
criterion when purchasing a new product is the ratio between quality and price Usually
consumers tend to consider that the higher is the price the longer the lifespan will be as
underlined by a representative of a UK NGO
The consideration for durability in purchasing decisions varies by age and
income Overall people with a higher income are more aware of CE practices and so pay
greater attention to durability In comparison findings from the reviewed literature
indicated that consumers with a lower income pay less attention to durability (see section
611)
In general the older the consumer is the more important durability is Young people
tend to buy less durable products However as highlighted by the Romanian academic
there is also a category of young people who are aware of the durability of products This
is comprised of young people working in corporations and who have higher income and
greater concerns regarding the Circular Economy Interviewees confirmed the findings of
the reviewed literature ndash young consumers tend to place less importance on durability
than older consumers (see section 611)
Consideration of durability characteristics in purchasing decisions per specific product
Consideration of durability in purchasing decisions varies depending on the product
category
Behavioural Study on Consumersrsquo Engagement in the Circular Economy
137
For large purchases such as large appliances and cars durability and
reparability characteristics are considered more in purchasing decisions
According to a representative of a Dutch public authority the smaller the purchase the
less important durability and reparability become
A Belgian national trade association representative indicated that the durability
consideration from consumers varies according to the expected use of the
product Consumers will consider the durability of goods depending on how often they
will use the product as highlighted by representatives from a European trade association
and a national consumer association If the product will be used less often consumers
may buy products of a lesser quality and so less durable products
Regarding smartphones consumers pay less attention to durability The first factor
explaining this is linked to technological progress According to the already mentioned
representative of a Belgian national trade association if new functionalities appear
consumers will be interested in the newest smartphones with these latest functionalities
A parallel can be drawn with the findings from the literature review which states that
consumers attach less importance to durability when purchasing products more related to
fashion The second factor deals with obsolescence As highlighted by an expert in the
field of Ecodesign smartphones may be victims of what could be labelled as technical
obsolescence because of software updates as products become slower and impossible to
maintain
622 Information on reparability and its role in purchasing decision
The following section analyses the way available information on durability influences
purchasing decisions
An interviewee from a Romanian consumer organisation highlighted that overall
consumers lack the information needed to assess durability and reparability of a
product They have to find that information by themselves The main sources for this
are formed by shops online forums or friends as mentioned by an interviewee from a
Romanian consumer association This tends to confirm the lack of information for
consumers identified from the literature
Moreover an interviewee from a European consumers association mentioned that
consumers would prefer to find this information in a standardised way In that
sense a label indicating the average lifespan would be welcomed This confirms findings
from the literature review which stated that a standardised lifespan label would be a key
tool to inform consumers about durability (see section 612)
Other sources of information for consumers were mentioned by interviewees from
a Romanian consumer organisation For washing machines and televisions the durability
characteristics of an item are highly related to the brand This was confirmed by an
interviewee from a household appliances manufacturer the reputation of a renowned
brand acts as a guarantee of a greater quality and so of a longer expected lifetime for the
product Another common measure of expected durability used by consumers is often
expressed in the guarantee period offered by the manufacturer as highlighted by a
representative of a UK trade association
623 Relevance of reparability characteristics in purchasing decision
Overall interviewees provided more information about durability characteristics than
about reparability characteristics
It appears that reparability is not a major consideration for consumers
According to a representative from a UK consumer organisation reparability is not taken
into account by consumers Another interviewee from a European trade association
confirmed this statement Consumers do not consider reparability when purchasing a new
product because in their mind-set products should be more durable but not necessarily
more repairable as highlighted by a representative from a Belgian trade association
This lack of information coming from interviews echoes the little information gathered
from the literature review
Behavioural Study on Consumersrsquo Engagement in the Circular Economy
138
Consideration of reparability characteristics in purchasing decision per specific products
According to a representative of a Dutch public authority for large purchases such as
large appliances (eg washing machines refrigerators and cars) reparability
definitely plays a role This input was confirmed by a consumer law expert from a
Romanian consumer organisation For washing machines reparability characteristics are
important
When purchasing clothes consumers pay less attention to the durability and reparability
characteristics However reparability is more important than durability in the
fashion sector as highlighted by the above-mentioned representative of a Dutch public
authority This greater consideration for reparability in clothes purchases confirms
findings from the literature review
624 Information on reparability and its role in the purchasing decision
This section describes the findings from the interviews on how available information on
reparability can influence purchasing decisions
It seems again that consumers suffered from a lack of information to motivate
their purchasing decisions According to an interviewee from a German public
authority with no durability and reparability information consumers always choose the
cheapest product
During an interview with a representative from a UK consumer organisation it was
stressed that retailers and manufacturers do not provide and sometimes may even hide
the available information about reparability The interviewee did not mention how or why
manufacturers might hide reparability information
According to a representative of a Hungarian NGO when consumers need information on
the degree of reparability of a product they look for it in the guarantee letter This
interviewee also indicated that the information that consumers look mostly is the
availability of repair points This partly mirrors the findings of the Consumer Market
Study conducted by GFK These state that the most impactful reparability-related
information on consumersrsquo purchasing decisions are about the availability of spare parts
rather than the information on costs of those spare parts According to an interview with
a German expert another implicit source of reparability information for consumers is the
brand of the products They expect that the manufacturer of certain brands will repair the
product The same stakeholder added that as reparability has many dimensions it would
be hard to imagine a simple indicator which could be put on a durability label
Guarantees could play an informative key role as they are easier to compare (eg one
company offers a longer period of repairing services under the guarantee conditions
compared to another company)
63 Evidence from the focus groups
631 Durability information
Participants welcomed the idea of being provided with information about the
durability of products and agreed that this should be presented on product labels or in
the shop at the time of purchase (or on the website if a product is purchased online)
Some suggested that sales staff should also be able to inform customers about a
productrsquos durability
Attitudes towards the suggestion of having the information presented on the EU Energy
Efficiency Label (or as a similar label) were very positive Participants felt that this
would enable displaying productsrsquo durability in a simple straightforward manner and
would enable consumers to easily compare products
Participants also made suggestions on how durability should be defined for each of the
different products
Washing machinedishwasher ndash estimated number of washes (rather than
number of years) participants across the different countries agreed that for these
products expressing durability in number of years would not be accurate because
some households use these more often than others
Behavioural Study on Consumersrsquo Engagement in the Circular Economy
139
Television ndash estimated number of years (Germany) or estimated number of hours
of use (Ireland) once again because the frequency of use for this type of product
varies by household Another suggestion was to combine information on number of
years with the average number of hours of use per day
ldquoAverage hours of use per year So if it says lsquothis TV will last 3 years for 6 hours
use per dayrsquo for example A vacuum cleaner is expected to be on for half an hour
a day So we would need a list on what they consider the average usage a day per
product type so for example a TV 6 hours a day laptop 6 hours vacuum 030h
etc You know that if you put your TV on 12h a day itrsquos not going to last that long
as indicated (Man mixed group Dublin)
Vacuum cleaners ndash estimated number of hours of use (Germany Ireland)
Smartphones ndash some participants suggested number of years others also
suggested number of battery charges (Ireland) In Germany some mentioned that
it would be helpful to have an indication of the batteryrsquos durability in number hours
(and the equivalent in number of years) because this is often the part that breaks
down first
Clothing ndash number of years or as some German participants suggested through
an indication of the quality of the fabrics used (low medium or high) Displaying
durability for clothing was seen as somewhat less important than for electrical
appliances although some participants welcomed the idea
632 Reparability information
Participants were generally favourable to the idea of being provided with information on
reparability Discussions on this topic were however more complex in Sweden ndash where
participants although positive to the idea of having products repaired had less
experience with reparability
ldquoI must spend a lot of time and there is almost no information to be found about
where to repair things What rights do I have Where can I fix it These are my
questions Why should I have to spend so much time and look look look for
information while the producers just send me advertising and promotions ndash that
must cost them muchrdquo Female 35 vulnerable group Stockholm)
Some participants in Ireland and Sweden flagged the fact that presenting information on
a productrsquos reparability might discourage people from buying it because it may suggest
that the product is likely to break down
Some of the types of information participants considered useful to have with regard to
productsrsquo reparability were
Whether repair would be possible
Whether the product is repairable through DIY (and instructions on how to repair it)
Availability of spare parts
Availability of repair services and possibly a list of repair services
An indication of the timeframe during which spare parts would be available
An indication of the timeframe during which a manufacturer can ensure the
productrsquos repair
An indication of the level of difficulty of the repair (low medium high) ndash
participants in Germany suggested indicating this with small icons ndash eg hammers
one for easy two for medium three for difficult)
As with durability participants felt that information on productsrsquo reparability should be
provided at the moment of purchaseat the point of sale (on the product or on
the productrsquos label) They were generally favourable towards the idea of having an
indication included on the EU Energy Efficiency label or on a similar label Many
also felt that information should be included in the productsrsquo instructions manual as
well as should be available online Some of the German participants suggested that it
would be useful to have tutorials on how to repair products for example on a YouTube
channel
Information on reparability was mainly considered useful for electronic goods and to a
slightly lesser extent for clothing Information provision for clothing was considered less
Behavioural Study on Consumersrsquo Engagement in the Circular Economy
140
necessary because some participants already have repaired clothing themselves or had
them repaired at a tailor shop or repair centre (mainly in the case of shoes)
633 Recyclability information
Some participants (particularly in Germany) found it useful to have information on
productsrsquo recyclability on the EU Energy Efficiency Label (or on a similar label) They
would also welcome more information on how to recycle products Other participants
particularly in Ireland and Sweden were a lot more informed about how to recycle
products (clothes and electrical appliances)
ldquoItrsquos common sense these days itrsquos everywhere Batteries phones clothing
collection etc so easy to recycle itrsquos everywhere Itrsquos in the supermarket So why
would you throw them away if they can make something out of it Itrsquos easy and
cheap and accessiblerdquo (Woman vulnerable group Dublin)
The main types of information participants thought would be useful with regard to
recycling and productsrsquo recyclability are as follows
Percentage of recycled material used when producing the product
Percentage of material that can be recycled and that will be recycled at the end of
the productrsquos lifecycle
An indication on which parts of the product will be recycled and what they will be
used for
More information on the recycling process (what happens to a product once it is
brought for recycling)
ldquoI want to be a responsible consumer But I also would like to know ndash what do you do
with my smartphone I would like a guarantee for the recycling so I know where
things end uprdquo (Woman vulnerable group Stockholm)
Information on recycling centres and on how these recycle large appliances
German participants suggested that it would be useful to have a QR-code on the label
giving further information about the recycling process
634 Views on displaying information on reparability durability and
recycling on a label
Participants generally welcomed the idea of displaying information on product durability
reparability and recyclability on the EU Energy Label or on a similar label The idea was
seen as most useful in the case of durability although many participants felt the same
way about reparability and recyclability
German participants were the most enthusiastic towards this and felt that all three
aspects (durability reparability and recyclability) should be displayed on the EU Energy
Label (with categories for each aspect underneath)
64 Evidence from the consumer survey
641 Importance of durability and reparability in purchasing decisions
Results from the consumer survey on the importance of durability and reparability in
purchasing decisions are presented To understand the relative importance of these
factors in purchasing decisions further dimensions such as costs quality or fashion were
evaluated in addition to looking at durability and reparability Hence these other factors
can be compared to durability as well as reparability Additionally the reasons for why
survey respondents rated durability reparability and the availability of repair services as
important were analysed in more detail
Behavioural Study on Consumersrsquo Engagement in the Circular Economy
141
Figure 42 Importance of certain factors in purchasing decisions (average)
Notes The question was Q34a ldquoThinking of the last time you bought a [dishwasher vacuum cleaner television smartphone coat] to what extent did the following influence your choice of product Please answer on a scale from 1 (meaning ldquoNone at allrdquo) to 4 (meaning ldquoA lotrdquo)rdquo In order to calculate averages
answer categories where re-labelled with ldquoa lotrdquo corresponding to a value of +10 and ldquonot at allrdquo corresponding to a value of -10 As a result a positive average means the factor is important a negative average means the factor is unimportant 0 means neither important nor unimportant N=12064
Source ConPolicy analysis of consumer survey data
Figure 42 summarizes the results on the average importance of different factors that
might be relevant during purchasing processes For eight factors (across all five product
categories) participants were asked how much influence each factor had on their
purchasing decisions
Overall the quality of the product was rated most influential followed by price How
long the product was expected to last (durability) reparability the existence of a
repair service and environmental credentials were also important to participants
The manufacturer or brand was ranked as less important and overall participants
rated the product being the latest model or trend as even less influential
As a next step the influence of these eight factors are reported individually across
product categories Figure 43 displays the results on the average importance ratings156
The price of the product
For all product categories price mattered a lot as its importance was consistently rated as
high As can be seen in the detailed Table 5 in Section 7 in the Annex document
between 50 and 60 indicated price as relevant in the survey In contrast only a very
small fraction ie below 3 for all product categories reported price to not matter at
all
The manufacturer or brand of the product
A more diverse picture emerged with respect to the importance of the manufacturer or
brand of the product When looking at the average ratings of this attribute in Figure 43
brand was most relevant for mobile phones followed by televisions vacuum cleaners and
dishwashers For mobile phones this factor was very important for 50 of the
participants For televisions the share was lower 43 while 40 and 34 indicated its
high relevance for vacuum cleaners and dishwashers In contrast the average rating as
well as the share of participants indicating clothing brands to be important was much
lower Overall only 20 of participants indicated the manufacturer or brand to matter
156 Additionally see the additional survey results in the Annex document for a table showing detailed results on consumer ratings of the importance for all categories and products in percent
Behavioural Study on Consumersrsquo Engagement in the Circular Economy
142
very much Interestingly the share of participants reporting the manufacturer or brand
to not matter at all was also 20 for clothing while these shares were below 6 for the
other product categories (See additional survey results in Table 5 in Section 7 of the
Annex document for detailed importance ratings by product)
The general quality of the product
Across all five product categories the majority of participants indicated that the general
quality of the product had a lot of influence on their purchasing decisions Overall there
exists no sizable difference between the individual product categories Quality was most
important for participants in the category of vacuum cleaners (70) followed by
televisions and mobile phones (69) dishwashers (63) and coats or jackets (63)
Again the shares of participants attributing no importance to this factor were low ie
less than 3 for all products See again the Annex for further detail
Whether the product was the latest model or trend
As indicated before trends were less relevant for purchasing decisions compared to for
example price Nevertheless there exist product categories for which trends were more
important compared to others As displayed in Figure 43 for televisions smartphones
and clothing items the average importance rating was positive implying that participants
thought trends to be influential When looking at the shares of respondents rating trends
to be of highest importance the following results emerged The largest share was found
among mobile phones (23) followed by televisions (22) and clothing items (19)
(see Table 5 in Section 7 in the Annex document) For vacuum cleaners and dishwashers
the average importance rating was lower and even below 0 indicating that respondents
rated that trends rather did not matter The shares of participants attributing a high
importance to trends were fairly sizable with 13 to 15 When looking at the other
extreme ie shares of respondents attributing no importance to trends at all no sizable
difference between product categories was found For vacuum cleaners dishwashers and
clothing items shares were around 20 while for electronic items ie mobile phones
(16) and televisions (14) they were slightly lower
How long the product could be expected to last
The expected lifespan of a product had a lot of influence on consumersrsquo purchasing
decisions Overall the average rating as shown in Figure 43 was high across all products
Though for dishwashers vacuum cleaners televisions and mobile phones the average
importance rating was higher than for clothing items As can be seen in the Annex the
share of participants indicating that the expected lifespan of a product had a lot of
influence on their purchasing decision was similar for dishwashers vacuum cleaners
televisions and mobile phones (46 to 53) and smaller but still sizable for coats or
jackets (33) Again looking at the shares of participants indicating no importance at
all for most product categories the shares amounted to below 4 Interestingly for
clothing items this share was much higher 10 which may capture a group of
consumers with a particular interest in the latest trends and lsquofast fashionrsquo
Whether the product could be repaired if broken
The reparability was on average rated as less important compared to durability but it was
still rated as important for most product categories As displayed in Figure 43 the
average rating of importance was positive for dishwashers vacuum cleaners televisions
and smartphones indicating that on average respondents stated that reparability was
important In more detail (see Table 5 in Section 7 in the Annex document) the share of
respondents attributing a lot of influence to reparability was 30-34 in the mentioned
product categories Clothing items again represented an outlier The average rating was
below 0 indicating that respondents rated reparability rather as unimportant Only about
11 indicated reparability as important for coats and jackets The same pattern emerged
for participants indicating that reparability played no role at all Less than 10 reported
this rating for most product categories Only for clothing items this share was larger with
36
Whether repair services exist for the product
A similar picture emerged for the existence of repair services On average the rating of
importance was above 0 for dishwashers vacuum cleaners televisions and smartphones
Behavioural Study on Consumersrsquo Engagement in the Circular Economy
143
showing that respondents found repair services to be rather influential in their purchasing
decision The share of respondents rating the availability of repair services as having a lot
of influence were around 30 Again clothing items were an outlier The average rating
of importance in this category was below 0 indicating no importance of this attribute
Accordingly the share of respondents attributing a lot of influence to this factor was only
7 When looking at the other extreme where participants indicated repair services to
have no importance at all a similar difference between product categories was detected
Between 8 and 13 of participants reported no importance of the factor at all for most
categories while 48 reported this for clothing
The environmental credentials of the product
Finally the share of participants who indicated that environmental credentials had a lot
of influence on their purchasing decisions was rather heterogeneous across the five
product categories The average rating as displayed in Figure 43 was positive for
dishwashers vacuum cleaners and televisions indicating that on average environmental
credentials played a role for respondents For smartphones it was close to 0 whereas it
was below 0 for clothing items When looking at the shares of respondents either
attributing a lot or no relevance for this factor (see Table 5 in Section 7 of the Annex) the
following results emerged For dishwashers 37 found environmental credentials to be
important followed by vacuum cleaners (28) and televisions (25) The importance of
environmental credentials was smaller for mobile phones (18) and coats or jackets
(14) Again these results were mirrored at the other extreme For vacuum cleaners
dishwashers and televisions the shares of participants stating that environmental
credentials had no importance at all were between 5 and 11 For mobile phones the
fraction was higher with 17 and even higher with 24 for coats and jackets
Figure 43 Importance of certain factors in purchasing decisions by product category
(average)
Behavioural Study on Consumersrsquo Engagement in the Circular Economy
144
Behavioural Study on Consumersrsquo Engagement in the Circular Economy
145
Notes The question was Q34a ldquoThinking of the last time you bought a [dishwasher vacuum cleaner television smartphone coat] to what extent did the following influence your choice of product Please answer on a scale from 1 (meaning ldquoNone at allrdquo) to 4 (meaning ldquoA lotrdquo)rdquo In order to calculate averages answer categories where re-labelled with ldquoa lotrdquo corresponding to a value of +10 and ldquonot at allrdquo corresponding to a value of -10 As a result a positive average means the factor is important a negative average means the factor is unimportant 0 means neither important nor unimportant Dishwasher N=4848 Vacuum Cleaner N=4096 Television N=4855 Smartphone Mobile Phone N=4893 Clothing (Coat or Jacket) N=4883
Source ConPolicy analysis of consumer survey data
Furthermore the importance of different factors influencing the purchasing decision were
analysed by country and socio-demographic factors These results are summarised here
below and displayed in detail in Section 7 in the Annex document
The average importance of price was high among all 12 examined countries In
particular Spain stuck out indicating a very large relevance of price followed by Romania
and Portugal The lowest importance ratings were observed in Austria the Netherland
and France When looking at age and education no noteworthy patterns emerged Not
surprisingly it was found that respondents who found it more difficult to make ends meet
at the end of the month gave more importance to price compared to those financially
better off
With respect to the importance of the manufacturer or brand two countries
Romania and Spain stuck out In these two Member States participants on average
revealed a larger relevance compared to the other countries Age did not seem to play a
role while the highest educational category rated the influence of brand more important
than the lower educational categories Furthermore participants indicating a very difficult
financial situation also revealed lower influence of brand compared to wealthier income
categories
As indicated above the quality of the product was overall the most important factor
and this was also true for the individual country ratings Compared to other countries
the French participants on average attributed a lower importance to quality With respect
to other socio-demographics no striking differences were observed
With respect to the product being the latest model or trend interesting country
differences emerged On the positive side ie countries attributing importance to trends
in particular Romania and Spain stuck out with relatively higher rates In contrast
Austria France and the Netherlands revealed negative average importance ratings
indicating that being the latest model or trend was not important Participants indicating
their financial situation to be very difficult attributed less importance to trends With
respect to other socio-demographic factors no particular patterns were visible
Behavioural Study on Consumersrsquo Engagement in the Circular Economy
146
Durability overall was on overage also influential While Romanian and Hungarian
participants were among the top two with respect to durability ratings lower rates were
observed for the Netherlands Germany Austria and France With respect to other socio-
demographics factors no striking differences were found
These results on country effects as well as age education and income differences were
mirrored for the importance of reparability and availability of repair services
Lastly a very similar pattern on country level and for the other socio-demographics
factors was observed for the importance of the environmental credentials of a product
Reasons for high importance of durability
Participants that indicated that durability had at least a little importance for their
purchasing decision were asked about the reasons for this rating as depicted in Table 38
The most prominent reason across all product categories was the perception that long-
lasting products would save money in the long run (45 to 55) Other important
reasons were the perceived higher quality of long lasting products (36 to 43) the
perception that durable products would be better for the environment (23 to 30)
the convenience of not having to shop for a replacement soon (23 to 28) and
that long lasting products typically are better value for money (22 to 26) Among
the different product categories no distinctive patterns emerged
Table 38 Reasons for high importance of durability by product category (in )
Vacuum
Cleaner
Dish-
washer
TV Mobile
Phone
Coat or
Jacket
Long lasting products will save
me money in the long run
547 548 509 507 453
Long lasting products are
typically better quality
360 365 360 345 430
Buying a long-lasting product
is better for the environment
300 291 272 274 226
To avoid the effort of shopping
for a replacement soon
227 229 269 278 256
Long lasting products are
typically better value for
money
226 258 245 220 252
Other 01 03 02 04 02
Donrsquot know 15 07 18 21 24
No of observations 3554 3556 4144 4085 3742
Note Following up on answers presented in Figure 42 and Figure 43 participants were asked (Q34b) ldquoYou said that when you last bought the following product(s) ldquohow long the product could be expected to lastrdquo had a lot of influence on your choice of product Why was this For each product please select the two most important reasonsrdquo Since participants indicated the two most appropriate reasons the totals do not sum up to 100
Source ConPolicy analysis of consumer survey data
Behavioural Study on Consumersrsquo Engagement in the Circular Economy
147
Reasons for low importance of durability
The reasons for participants indicating that durability had no or only very little
importance for their purchasing decisions are presented in Table 39
For all product categories the most prominent reason was that participants found it hard
to tell how long a product will last (62 to 70) For vacuum cleaners dishwashers
televisions as well as mobile phones the second most important reason was that longer
lasting products were hard to find (20 to 26) For clothing items another aspect was
ranked second though within this category 19 of participants indicated that durability
did not play a role for purchasing decisions because they did not expect to use the
product for a long time Overall fashion value and maintenance effort were relatively
less important
Table 39 Reasons for low importance of durability by product category (in )
Vacuum
Cleaner
Dish-
washer
TV Mobile
Phone
Coat or
Jacket
Itrsquos hard to tell how long a
product will last
603 702 683 641 618
Long lasting products are
harder to find
230 258 197 214 132
I am interested in owning
the latest
fashiontechnology
130 87 148 152 142
I did not expect to use the
product for a long time
120 124 95 160 191
How long a product will
last is not important to me
104 51 67 93 126
Long lasting products are
worse value for money
76 48 71 60 54
Long lasting products need
a lot of maintenance
41 35 26 41 47
Other 67 45 75 67 49
Donrsquot know 54 75 55 39 60
No of observations 346 396 541 611 1001
Note Following up on answers presented in Figure 42 and Figure 43 participants were asked (Q34c) ldquoYou said that when you last bought the following product(s) ldquohow long the product could be expected to lastrdquo had little influence on your choice of product Why was this For each product please select the two most important reasonsrdquo Since participants indicated the two most appropriate reasons the totals do not sum up to 100
Source ConPolicy analysis of consumer survey data
Behavioural Study on Consumersrsquo Engagement in the Circular Economy
148
Reasons for high importance of reparability
Table 40 presents the reasons for which participants rated reparability as important for
their purchasing decisions
Overall the top reason was once again saving money (31 to 37) followed by the
preference of keeping a product for as long as possible (28 to 35) Environmental
factors (22 to 26) using reparability as a signal for high quality (22 to 26)
the convenience of not having to shop for a replacement (21 to 25) as well as
using reparability as a signal of the manufacturer caring for the customer (17 to
24) were all of equivalent importance Compared to these aspects it is quite
interesting to see that the joy of repairing items was seen as much less important for
reparability (below 7 in all product categories)
Table 40 Reasons for high importance of reparability by product category (in )
Vacuum
Cleaner
Dish-
washer
TV Mobile
Phone
Coat or
Jacket
Repairing the product will
save me money
344 367 314 325 305
I wanted to keep the
product for as long as
possible
303 280 303 341 346
Repairing the product is
better for the environment
252 257 230 240 215
Itrsquos a sign that the product
is of high quality
230 253 241 223 261
Repairing avoids the effort
of shopping for a new one
250 240 243 236 206
It shows the manufacturer
cares about its customers
213 235 243 221 167
I enjoy repairing things 72 53 43 47 66
Other 02 03 03 03 002
Donrsquot know 14 11 25 22 44
No of observations 3127 2822 3438 3360 1909
Note Following up on answers presented in Figure 42 and Figure 43 participants were asked (Q34d) ldquoYou said that when you last bought the following product(s) ldquowhether the product could be repaired if it brokerdquo had a lot of influence on your choice of product Why was this For each product please select the two most important reasonsrdquo Since participants indicated the two most appropriate reasons the totals do not sum up to 100
Source ConPolicy analysis of consumer survey data
Behavioural Study on Consumersrsquo Engagement in the Circular Economy
149
Reasons for low importance of reparability
Table 41 displays the reasons for why participants attributed a low importance to
reparability in the purchasing process
On average four answer categories were rated more important than others namely
Trusting the manufacturerrsquos warranty (14 to 45) followed by the expectation
that the product will not break (26 to 35) the cost of repair (18 to 34) and
the reason that participants will replace it if it breaks (15 to 24) Not considering
repair the difficulty of repair the lower quality after repair and the reason that if a
product can be repaired easily it must be of low quality were less important
There were some interesting differences in ratings across product categories especially
for clothing For this category 23 of participants stated that they simply do not
consider repairing a clothing item whereas trust in the manufacturerrsquos warranty was
ranked comparatively low (14)
Table 41 Reasons for low importance of reparability by product category (in )
Vacuum
Cleaner
Dish-
washer
TV Mobile
Phone
Coat or
Jacket
I trust the manufacturerrsquos
warranty
326 446 340 329 138
I donrsquot expect this product
to break
289 339 292 259 351
Repairing the product
would be too expensive
296 244 329 342 181
If something breaks I
replace it
223 175 170 148 238
Repairing this product just
isnrsquot something Irsquod
consider
129 80 98 145 229
Repairing the product
would be too difficult
110 109 167 168 126
Products are not as good
after theyrsquove been repaired
44 66 50 89 100
If it can be repaired easily
it must be of low quality
37 25 37 14 26
Other 23 29 16 35 42
Donrsquot know 51 52 52 46 68
No of observations 775 1111 1208 1311 2752
Note Following up on answers presented in Figure 42 and Figure 43 participants were asked (Q34e) ldquoYou said that when you last bought the following product(s) ldquowhether the product could be repaired if it brokerdquo had little influence on your choice of product Why was this For each product please select the two most important reasonsrdquo Since participants indicated the two most appropriate reasons the totals do not sum up to 100
Source ConPolicy analysis of consumer survey data
Behavioural Study on Consumersrsquo Engagement in the Circular Economy
150
Reasons for high importance of availability of repair services
The reasons for participants attributing importance to the availability of repair services
are displayed in Table 42
As for reparability in general none of the presented answer categories stuck out as a top
reason for attaching high importance to the availability of repair services either Many
participants indicated that repairing the product could save money (33 to 40)
and that they wanted to keep the product for as long as possible (28 to 34)
Similarly other important reasons were that repairing avoids the effort of shopping
for a new onerdquo (24 to 28) repairing the product is better for the environment
(23 to 28) not being able to self-repair the product (18 to 25) and the
belief that repair services will do a good job (15 to 20) There were no striking
patterns across the different products categories
Table 42 Reasons for high importance of availability of repair services by product
category (in )
Vacuum
Cleaner
Dish-
washer
TV Mobile
Phone
Coat or
Jacket
Repairing the product
could save me money
393 399 371 352 329
I wanted to keep the
product for as long as
possible
293 280 290 326 341
Repairing avoids the effort
of shopping for a new one
279 267 269 243 238
Repairing the product is
better for the environment
268 284 247 252 229
I donrsquot think I could repair
this product myself
190 198 224 251 178
I believe repair services
will do a good job
197 213 185 182 151
Other 03 03 05 03 04
Donrsquot know 19 20 30 21 56
No of observations 3034 2767 3331 3201 1415
Note Following up on answers presented in Figure 42 and Figure 43 participants were asked (Q34f) ldquoYou said that when you last bought the following product(s) ldquowhether repair services exist for the productrdquo had a lot of influence on your choice of product Why was this For each product please select the two most important reasonsrdquo Since participants indicated the two most appropriate reasons the totals do not sum up to 100
Source ConPolicy analysis of consumer survey data
Behavioural Study on Consumersrsquo Engagement in the Circular Economy
151
Reasons for low importance of availability of repair services
Participants attributing little or no importance to repair services on average indicated
several reasons for their statements (Table 43) Overall trust in manufacturerrsquos
warranty costs the expectation that the product will not break as well as the
statement that faulty items would be simply replaced were reported
There were interesting differences between product categories Trust in manufacturersrsquo
warranties and expected high costs of repair services were named rather frequently for
vacuum cleaners dishwashers televisions and mobile phones However this was not
true for clothing items where only about 16 (warranty) and 17 (costs) stated this to
be a reason for attributing little importance to repair services Not considering repairing a
faulty product was stated more frequently for clothing items (26) compared to other
product categories (ranging from 7 to 13)
Table 43 Reasons for low importance of availability of repair services by product
category (in )
Vacuum
Cleaner
Dish-
washer
TV Mobile
Phone
Coat or
Jacket
I trust the manufacturerrsquos
warranty
364 445 371 346 161
Repair services are too
expensive
283 317 317 327 166
I donrsquot expect this product
to break
281 322 275 271 362
If something breaks I just
replace it
183 162 150 165 221
Repairing this product just
isnrsquot something Irsquod
consider
128 71 122 134 261
I wouldnrsquot know how to
find a repair service
105 75 76 81 94
Products are not as good
after theyrsquove been repaired
50 53 74 103 86
If repair services exist the
product must be low
quality
23 17 31 19 34
Other 39 54 28 41 59
Donrsquot know 69 47 69 61 73
No of observations 850 1164 1342 1461 3209
Note Following up on answers presented in Figure 42 and Figure 43 participants were asked (Q34g) You said that when you last bought the following product(s) ldquowhether repair services exist for the productrdquo had little influence on your choice of product Why was this For each product please select the two most important reasonsrdquo Since participants indicated the two most appropriate reasons the totals do not sum up to 100
Source ConPolicy analysis of consumer survey data
Behavioural Study on Consumersrsquo Engagement in the Circular Economy
152
642 Expectations on durability and reparability information
In the following section consumersrsquo expectations regarding durability and reparability
information are presented Firstly it is presented when respondents would like to
receive durability information during the purchasing process followed by ways how they
would like to receive this information Similar steps are followed also for reparability
information
When respondents would like to receive durability information
Visible from Table 44 across all product categories the majority of participants reported
that they expected durability information to be displayed at the point of purchase
Similarly a large percentage indicated that they expected this information when
comparing alternative products (between 38 and 50) Presenting this information
when products are advertised on the other hand was ranked less important and only a
very small share of participants reported that they expected durability information after
their purchase The overall rankings were fairly homogenous across the different product
categories
Table 44 Expectations regarding when to receive durability information (in )
Vacuu
m
Cleaner
Dish-
washer
TV Mobile
Phone
Coat or
Jacket
When products are
advertised (eg on TV in
store online)
195 189 200 221 125
When comparing alternative
products (in store online)
486 496 474 499 379
At the point of purchase (at
the online check-out or shop
counter)
520 544 525 528 518
After a purchase has been
made
52 46 61 68 78
Other 13 14 13 07 15
Donrsquot know 57 52 63 56 134
No of observations 4848 4096 4855 4893 4883
Note The question was Q52 ldquoFor each of the following products when would you expect to obtain information on how long the product will last that you are considering buyingrdquo
Source ConPolicy analysis of consumer survey data
How respondents would like to receive durability information
In addition to the timing of durability information participants were also asked to
indicate how they preferred to receive information on productsrsquo durability
Table 45 displays the results by product category
Overall participants reported most frequently that they expected durability information
via product descriptions (40 to 45) as well as via guarantees or warranties
(23 to 44) About 30 of respondents each expected to receive information via
retailers operating manuals or instructions or the manufacturerrsquos website These were
followed by the expectation of receiving information via an EU official label (18 - 23)
and an official label from a national authority (14 - 19) Websites of third parties as
well as social media sites were ranked as less important
For the individual product categories a difference in importance of guarantees and
warranties was found for clothing items Considerably fewer respondents wished to
receive information via guarantees for this product A similar difference was found for the
Behavioural Study on Consumersrsquo Engagement in the Circular Economy
153
relevance of operating manuals and instructions Again clothing items received a lower
rating (16) compared to the other products (above 30)
Table 45 Expectations regarding how to receive durability information (in )
Vacuum
Cleaner
Dish-
washer
TV Mobile
Phone
Coat or
Jacket
Via product descriptions 445 445 428 446 399
Via guarantees or
warranties
431 439 413 431 227
Via the retailer 334 346 352 345 360
Via operating manuals or
instructions
333 318 309 313 162
Via a manufacturerrsquos
website
291 293 295 318 185
Via an EU official label 216 232 212 208 182
Via an official label from
your national authority
176 186 160 171 135
Via the website of a third
party (eg consumer
association)
150 156 152 174 95
Via social media 107 110 113 148 85
Other 03 03 03 02 08
Donrsquot know 41 36 45 39 112
No of observations 4848 4096 4855 4893 4883
Note The question was Q53 ldquoAnd for each of the following products how would you expect to obtain information on how long the product will last that you are considering to purchase Select all that applyrdquo
Source ConPolicy analysis of consumer survey data
When respondents would like to receive reparability information
Table 46 presents participantsrsquo expectations on receiving reparability information
Respondent preferences for the timing of reparability information followed a similar
pattern to those for durability information discussed above Again the majority of
participants reported that they would expect to obtain reparability information at the
point of purchase for all product categories Here approval rates ranged from 56 to
59 Many respondents would also expect to receive reparability information when
comparing the product to others (ranging from 32 to 45) During advertisement
of products between 13 and 20 of the respondents would expect to be informed
Finally between 8 and 11 would expect to receive information after they bought the
product
Table 46 Expectations regarding when to receive reparability information (in )
Vacuum
Cleaner
Dish-
washer
TV Mobile
Phone
Coat or
Jacket
When products are
advertised (eg on TV in
store online)
186 180 180 202 126
When comparing
alternative products (in
store online)
445 440 413 440 319
Behavioural Study on Consumersrsquo Engagement in the Circular Economy
154
At the point of purchase
(at the online check-out or
shop counter)
567 591 572 582 555
After a purchase has been
made
83 78 96 96 111
Other 10 13 12 09 13
Donrsquot know 67 56 71 71 136
No of observations 4848 4096 4855 4893 4883
Notes The question was as follows Q54 ldquoStill thinking about the same products when would you expect to obtain information on how easy it is to repair the products that you are considering buyingrdquo
Source ConPolicy analysis of consumer survey data
How to receive reparability information
Table 47 presents the results on participantsrsquo preferences on how to receive reparability
information
Overall the responses were similar to the one regarding durability information
Most participants reported that they would expect to receive reparability information via
product descriptions (ranging from 34 to 40) and via guarantees or warranties
(ranging from 21 to 38) Similarly large shares reported their preference for
receiving information via the retailer (34 to 37) and manuals or instructions
(18 to 37) Expectations to receive information via the manufacturersquos website and an
EU official label were lower Even fewer respondents expected to receive information via
a label from a national authority the website of a third party andor social media
For most product categories answers were rather homogenous Although in the case of
coats or jackets participants indicated a lower expectation for receiving information via
guarantees or warranties (21) as well as operating manuals or instructions (18)
compared to the other product categories
Behavioural Study on Consumersrsquo Engagement in the Circular Economy
155
Table 47 Expectations regarding how to receive reparability information (in )
Vacuum
Cleaner
Dish-
washer
TV Mobile
Phone
Coat or
Jacket
Via product descriptions 394 397 360 390 336
Via guarantees or
warranties
365 367 360 380 209
Via the retailer 353 353 370 344 356
Via operating manuals or
instructions
372 359 336 345 182
Via a manufacturerrsquos
website
275 283 274 307 183
Via an EU official label 176 180 166 171 141
Via an official label from
your national authority
137 145 126 133 103
Via the website of a third
party (eg consumer
association)
121 131 132 159 91
Via social media 90 91 95 115 76
Other 02 02 01 03 08
Donrsquot know 49 42 60 54 136
No of observations 4848 4096 4855 4893 4883
Notes Participants were asked Q55 ldquoAnd how would you expect to obtain information on how easy it is to repair the products that you are considering to purchaserdquo
Source ConPolicy analysis of consumer survey data
65 Evidence from the behavioural experiment
This section reports findings from the purchasing experiment This experiment was
conducted to understand the drivers of CE behaviour in purchasing decisions
As described in further detail in Section 272 respondents were asked to purchase a
product on a simulated e-commerce website Six different product options were shown to
respondents These product options varied systematically in their price level of
durability157 and level of reparability158 in addition to also varying fictitious product
pictures brand and model names The experimental task was repeated by each
respondent for three different products
The sections below analyse the impact of durability by looking at the durability
preferences of respondents the average durability of products chosen in the experiment
and their willingness to pay for longer lasting products
Reparability is analysed by looking at the reparability preferences of respondents and
their willingness to pay for more easily repairable products
157 Defined in the experiment as lsquothe period in which a manufacturer promises to replace or repair the product for free in case of repairrsquo
158 Defined in the experiment as an lsquoease-of-repair rating based on availability of repair manuals spare parts and repair servicesrsquo The rating ran on a scale from A to G
Behavioural Study on Consumersrsquo Engagement in the Circular Economy
156
651 Effectiveness of providing durability or reparability information
One of the experimental conditions159 systematically varied whether and how durability
andor reparability information was shown in the product descriptions As explained in
more detail in section 272 (incl screenshots of the information used) durability andor
reparability information were either shown via icons within the EU EnergyEcolabel shown
as a manufacturer warranty or shown as an expected lifetime
The following definitions of durability and reparability were used on the EU labels
Respondents could reveal these definitions by clicking on the labels
Durability The period in which the manufacturer promises to replace or repair the
product free of charge
Reparability Ease-of-repair rating based on availability of repair manuals spare
parts and repair services
The lsquoManufacturer warrantyrsquo and lsquoExpected lifetimesrsquo were not explained further as it is
common market practice for manufacturers and retailers to display such promises in this
way at the point of sale
Durability information
Figure 44 shows the distribution of lsquodurability preferencesrsquo for different ways of disclosing
durability information to respondents The definition of durability preferences used in the
analysis is explained in detail in section 272 but in summary
Respondents who mostly chose products with high durability in the experiment were
classed as having lsquoHighrsquo durability preferences
Those who mostly chose products with low durability lsquoLowrsquo durability preferences
All others were classed as having lsquoIntermediatersquo durability preferences
Visible from the very left-hand bar in the figure as would be expected respondents that
did not see any durability information were unable to make durability a meaningful
criterion for their product choice For this group the distribution of durability preferences
was close to a random allocation (around 20 of respondents having chosen each low
and high durability products and almost 60 choosing intermediate durability levels) as
would be expected in this case This group of respondents forms the group of comparison
(baseline) for further analysis
159 Allocations to the various treatments in the experimental tasks were done independently and randomly across the different allocations This resulted in a full factorial design between products and treatments This means that group sizes for different variants within each treatment category were roughly equal and each respondent had the same likelihood of being assigned to any specific treatment This also ensures that on average there should not be any interactions between different types of experimental treatments
Behavioural Study on Consumersrsquo Engagement in the Circular Economy
157
Figure 44 Durability preferences for different forms of durability information
Notes 1988 respondents were shown no durability information 985 respondents were shown durability information on an EU label 1000 respondents were shown both durability and reparability information on an EU label 1027 respondents were shown a manufacturer warranty and 1042 respondents were shown an expected lifetime indication
The labels below the results show the respective durability information shown in the experiment Durability in the Energy (likewise in the Ecolabel for clothes) was shown using a lsquohandshakersquo icon and durability in years (months for smartphones) Reparability was shown using a lsquospanner and screwdriverrsquo icon with a reparability rating from A-G Clicking on the label (used by 31 of respondents) revealed additional information and definitions of durabilityreparability Durability on EU labels was defined as The period in which the manufacturer promises to replace or repair the product free of charge
Reparability on EU labels was defined as Ease-of-repair rating based on availability of repair manuals spare parts and repair services
The handshake icon shown in this figure is different from the one seen by respondents in the experiment for copyright reasons
Source LE Europe analysis of behavioural experiment
When durability information was shown respondents were significantly more likely to
choose more durable products On average across the four information remedies (see the
four right-hand bars in the figure above) the proportion of respondents with a
preference for high durability nearly tripled by virtue of providing durability
Behavioural Study on Consumersrsquo Engagement in the Circular Economy
158
information a change which was highly statistically significant160 Respondent
preferences shifted from both intermediate and low durability preferences towards high
durability preferences And at the same time the share of respondents with intermediate
and low durability preferences also decreased significantly
Looking in detail at how durability information in the experiment was best provided it
emerges that on this measure of durability preferences durability information either as a
manufacturer warranty or expected lifetime was most effective in the experiment
Showing durability information as part of an EU label161 was slightly less effective
This finding can be seen from the figure above The shares of respondents with high
durability preferences were highest in the conditions showing a manufacturer warranty or
expected lifetime indication and the shares of respondents with low durability
preferences were lowest in these conditions
However the difference in effectiveness of showing durability information (alone) on an
EU label compared to the information outside of the label was minor and not always
statistically significant More specifically the distribution of respondent preferences for
high and intermediate durability were equivalent across the three conditions But the
share of respondents choosing low durability products was significantly larger when
durability was shown on the EU label
It can be conjectured that the EU label was marginally less effective because it used only
icons while the manufacturer information contained descriptive language The icon used
on the EU labels (ie a handshake symbol) was novel and may not have been
immediately understood Respondents needed to click on the label to get additional
explanation about the meaning of the icon Overall 31 clicked on at least one label
throughout the three rounds of the experiment to enlarge it and see the definitions for
icons At the same time expected lifetimes and manufacturer warranties can already be
found in the market and are more self-explanatory compared to the icon Thus the
effectiveness of the durability information on the EU labels can be interpreted as a lower
bound and is likely to further increase as time passes after it was introduced as
consumers learn about the meaning of the icon and become more familiar with it
This finding is further underlined by the table below which shows the average durability
chosen by respondents for the different product categories For each product category
the average durability chosen was highest when durability information was shown either
using a manufacturer warranty or expected lifetime (see the last two rows) Providing
durability information on an EU label was similarly effective when it was shown on its
own (see third row)
When durability information on an EU label was shown in conjunction with reparability
information it was however significantly less effective compared to the other ways of
providing durability information (see fourth row) The group of respondents who saw
durability information together with reparability information chose on average ndash
statistically significantly ndash less durable products compared to respondents who saw
durability information on its own But respondents who saw durability and reparability
information together still chose product with higher average durability than the
respondents who did not see any durability information
160 Statistical significance verified using two-sided pairwise z-test of proportions
161 Mock EU Energy Labels which reproduced key features of the actual EU Energy Label were used for vacuum cleaners dishwashers TVs and smartphones The EU Ecolabel was adapted for clothes In both types of labels durability and reparability information was presented using the same format and icons See section 272 for further detail and screenshots of the labels
Behavioural Study on Consumersrsquo Engagement in the Circular Economy
159
Table 48 Average durability chosen by respondents in purchasing experiment in
months (smartphone) or years (all other products)
Type of information Vacuum
cleaners
Dish-
washers
TVs Smart-
phones
Coats
No durability information 56 77 44 329 57
Durability information on EU
label
82 122 58 365 72
Durability and reparability on
EU label
73 111 53 355 69
Manufacturer warranty 83 123 59 371 75
Expected lifetime 85 127 61 378 75
Source LE Europe analysis of behavioural experiment
Reparability information
Figure 45 shows the distribution of reparability preferences for different experimental
conditions which varied whether and how reparability information was disclosed
Reparability preferences are defined analogously to durability preferences Section 272
provides a more detailed explanation but in summary the preferences are defined as
follows
Respondents who mostly chose products with high reparability in the experiment
were classed as having lsquoHighrsquo reparability preferences
Those who mostly chose products with low reparability were classed as having lsquoLowrsquo
reparability preferences
All others were classed as having lsquoIntermediatersquo reparability preferences
Behavioural Study on Consumersrsquo Engagement in the Circular Economy
160
Figure 45 Reparability preferences for different forms of reparability information
Note 4029 respondents were shown no reparability information 1013 were shown reparability on an EU label and 1000 were shown reparability and durability on an EU label
The labels below the results show the respective reparability information shown in the experiment Reparability in the Energy (likewise in the Ecolabel for clothes) was shown using a lsquospanner and screwdriverrsquo icon with a reparability rating from A-G Reparability was shown using a lsquohandshakersquo icon and durability in years (months for smartphones) Clicking on the label revealed additional information and definitions of durabilityreparability
Reparability on EU labels was defined as Ease-of-repair rating based on availability of repair manuals spare parts and repair services
Durability on EU labels was defined as The period in which the manufacturer promises to replace or repair the product free of charge
The handshake icon shown in this figure is different from the one seen by respondents in the experiment for copyright reasons
Source LE Europe analysis of behavioural experiment
Similar to the effectiveness of durability information providing reparability
information induced respondents to choose more repairable products A higher
proportion of respondents had high reparability preferences and a lower proportion had
low or intermediate reparability preferences when reparability information was shown
The differences in these proportions were highly statistically significant in tests of
proportions
Behavioural Study on Consumersrsquo Engagement in the Circular Economy
161
The effects are however smaller in magnitude compared to the findings for
durability The proportion of respondents with a high reparability preference lsquoonlyrsquo
doubled when reparability information was shown while high durability preferences
tripled for a similar intervention The proportion of respondents with a low or
intermediate reparability preference decreased by respectively 11 and 5 percentage
points
Results for reparability might have been less strong because it appears that the
information on reparability as provided in the experiment was less attention grabbing
for respondents Around 42 of respondents who saw information on reparability
correctly recalled this after the experiment162 In contrast 71 of respondents who saw
durability information recalled this correctly Furthermore it seems that reparability
information (as provided in the experiment) was more difficult to understand and use
than information on durability163
Interaction between durability and reparability information
Combining the information provided in Figure 44 Table 49 and Figure 45 above sheds
light on the interaction between durability and reparability information Comparing
product choices when durability and reparability were provided as stand-alone
information to when they were provided together is telling for how respondents dealt
with the different amount of information
In the previous analyses providing durability and reparability information at the same
time seemed to decrease the importance of each of these individual pieces of
information The proportion of respondents who chose high durability products was
significantly higher when durability information was shown on its own rather than with
reparability information Similarly the average chosen durability was higher ndash often
statistically significantly so ndash when durability information was shown on its own (instead
of with reparability)
Similarly the proportion of respondents who selected products with high reparability was
larger when reparability information was shown without additional durability information
This suggested that showing both durability and reparability information on EU labels
might create a dilemma for CE behaviours of competing interest When only a single
piece of information was given respondents could adjust their behaviour with respect to
that piece of information However this was not possible or at least more difficult when
information about durability and reparability were given concurrently
It must be noted that the above analyses did not consider the effect of information
on durability and reparability jointly This was because a joint analysis required a
measure that combines preferences for durability and reparability The figure below
presents such a measure for general CE preferences These general CE preferences were
calculated by combining the previously presented measures for durability preferences
and reparability preferences Both durability and reparability received equal weighting in
this measure The figure below presents only the information treatments that were
presented as part of EU labels because only the EU labels presented both durability and
reparability information
162 Following the purchasing experiment respondents were asked the following question ldquoThinking about the last purchasing decision you just made what information did you get about the selection of products you saw Please select all that applyrdquo Answer options included ldquoAn indication of how long the products will lastrdquo and ldquoHow easy it is to repair the products or get them repairedrdquo
The answers to this question were compared with the information shown in the experiment to respondents This allows for an assessment whether participants who saw information on durability andor reparability recalled seeing this information correctly
163 This was found by comparing answers to follow up questions which asked respondents how easy they found respectively the durability and reparability information shown to them
Behavioural Study on Consumersrsquo Engagement in the Circular Economy
162
Figure 46 General CE preferences for different forms of information
Note 975 respondents were shown no information 985 were shown durability on an EU label 1013 were shown reparability on an EU label and 1000 were shown reparability and durability on an EU label
The labels below the results show the respective CE information shown in the experiment Durability in the Energy (likewise in the Ecolabel for clothes) was shown using a lsquohandshakersquo icon and durability in years (months for smartphones) Reparability was shown using a lsquospanner and screwdriverrsquo icon with a reparability rating from A-G Clicking on the label revealed additional information and definitions of durabilityreparability Durability on EU labels was defined as The period in which the manufacturer promises to replace or repair the product free of charge
Reparability on EU labels was defined as Ease-of-repair rating based on availability of repair manuals spare parts and repair services
The handshake icon shown in this figure is different from the one seen by respondents in the experiment for
copyright reasons
Source LE Europe analysis of behavioural experiment
This analysis shows that overall respondents chose products with the best mix of
durability and reparability when durability and reparability information was
shown together In fact providing both types of information was associated with the
largest proportion of respondents with high CE preferences and the joint lowest
proportion of respondents with low CE preferences
The figure above confirms the finding that providing information is important to
induce more environmentally friendly choices Respondents who saw either
durability or reparability information or both durability and reparability information
together were significantly more likely to display a high CE preferences and significantly
less likely to display a low CE preferences
Behavioural Study on Consumersrsquo Engagement in the Circular Economy
163
Durability information seemed to be the main driver of CE decisions The impact
of durability information on its own was statistically significantly larger than the impact of
reparability information alone Furthermore durability information provided some
additional impact beyond the impact of reparability information The reverse however
was not the case The proportions of high and low preferences were not statistically
different when durability was provided by itself or together with reparability information
Taking these findings together with findings from the literature stakeholder consultations
and focus groups seems to suggest that durability is perceived as a substitute for
reparability This is because a durable product could be seen as a high-quality product
which would not require repair thus making the ease of repair of the product irrelevant
Instead reparability on its own does not substitute for the need of product durability
Results from regression analysis
As a robustness check of the above results regression analyses were used to analyse the
preferences for durability and reparability and the general CE preferences further
including controlling for socio-demographics country specific effects and personal
attitudes See below for results
Behavioural Study on Consumersrsquo Engagement in the Circular Economy
164
Table 49 Results from ordered logit regression on durability reparability and general CE preferences
Outcome variable Durability preferences Reparability preferences General CE preferences
(1) (2) (3) (4) (5) (6)
Information treatment - Baseline No information given
Durability info only in EU label 5047 5282
0770 0780
3345 3521
(1200) (1232)
(-211) (-199)
(705) (731)
Reparability info only in EU label 0677 0671
2883 2975
2255 2308
(-297) (-303)
(871) (891)
(456) (467)
Durability and reparability info in EU label 2983 3014
1433 1422
3501 3501
(831) (836)
(302) (294)
(735) (733)
Manufacturers guarantee 5637 5986
0847 0857
3541 3721
(1327) (1360)
(-136) (-125)
(759) (780)
Expected Lifetime 6714 6882
0780 0775
3525 3530
(1446) (1470)
(-201) (-205)
(742) (745)
Label type treatment - Baseline Mini label
Full label 0976 0970
0915 0912
0907 0907
(-033) (-042)
(-124) (-129)
(-110) (-109)
Behavioural nudges treatment ndash Baseline No claim
Savings claim 1223 1215
0954 0942
1120 1105
(229) (219)
(-054) (-069)
(105) (092)
Social claim 1105 1096
1144 1132
1216 1208
(112) (101) (157) (143) (180) (171)
Country controls
Socio-demographics (age gender etc)
Personal attitudes (pro-CE pro trends etc)
Notes Odds ratio (exponentiated coefficients) reported t statistics in parentheses p lt 005 p lt 001 p lt 0001 N = 6042 for all regressions
Source LE Europe analysis of behavioural experiment
Behavioural Study on Consumersrsquo Engagement in the Circular Economy
165
The regression analyses confirmed the results reported above When looking at the
information treatment clearly respondents reacted to the treatment Providing
information about durability increased the likelihood that a respondent showed a high
durability or general CE preference Similarly showing reparability information increased
the likelihood that a respondent showed a high reparability or CE preference
Furthermore these results were robust to including other control variables namely
country effects socio-demographics and personal attitudes
Additional analyses of interaction terms between different treatment types and between
treatments and personal characteristics (socio-demographics and personal attitudes) did
not show any systematic patterns Thus it can be concluded that the treatments were
entirely responsible for the shifts in CE preferences and that the effectiveness of the
different treatments was equivalent across the Member States analysed here as well as
for different types of consumers (ie the treatments worked equally well for richer and
poorer respondents as well as for respondents with more or less pronounced pro-CE
attitudes) This is an important finding for policy interventions since EU-wide activities
would be expected to be effective across the different cultural and socio-economic
contexts of the various Member States
Summary of findings
In summary it can be concluded from the behavioural experiment that the provision of
durability and reparability information is vital for encouraging decision-making which
takes into account CE product characteristics The consumer survey indicated (see
section 34) that individuals look for information regarding how long their products are
likely to last as well as how easy they are to repair However often individuals find this
information difficult to find The behavioural experiment has delivered powerful evidence
that actual purchasing decisions might be strongly driven towards more CE-friendly
products when information especially on durability but also on reparability information is
provided in concise and comparable ways
Showing information on CE characteristics was effective for different types of
respondents as well as for different Member States regardless of differences in
demographic profiles personal CE attitudes and economic situations This indicates that
policy interventions would likely be similarly effective across various EU Member States
652 Willingness to pay for durability and reparability
An alternative way of looking at respondentsrsquo decision-making is to consider willingness
to pay (WTP) Willingness to pay shows the monetary amount that respondents were
willing to spend on additional durability or reparability The WTP amounts were derived
through a choice modelling approach (see the Annex for further methodological detail)
This approach takes advantage of choice data collected across all participants who saw
different choice sets
Table 50 shows the willingness to pay for an additional year or month of durability The
first row shows overall willingness to pay whereas the subsequent rows show willingness
to pay depending on the type of durability information It should be noted that the yearly
WTP figure for smartphones is derived from the monthly figure which was the estimate
derived directly from the data (since for smartphones durability was presented in months
rather than years in the choice task) While this is a reasonable extrapolation it does
imply an assumption namely that the relationship between WTP and length of durability
is linear (ie each extra month has the same value) which may or may not be a
reasonable assumption
Behavioural Study on Consumersrsquo Engagement in the Circular Economy
166
Table 50 Willingness to pay for durability (in euro per yearmonth of additional durability)
Vacuum
cleaners
Dish-
washers
TVs Smartphones Coats
Year Year Year Month Year Year
Overall
willingness to pay
(WTP) in the
experiment
1911 2053 7288 1033 12394 1354
Willingness to pay in different information treatment conditions
WTP when no
CE information
was shown[1]
Not statistically significant[2]
WTP when
durability
information
was shown on
EU label
3315 3005 12628 1478 17731 1778
WTP when
durability and
reparability
information
were shown
on EU label
2028 3112 9179 1232 14788 1396
WTP when
manufacturer
warranty was
shown
3288 3271 12783 1750 21004 2379
WTP when
expected
lifetime was
shown
3576 3591 14830 1812 21739 2727
Notes Willingness to pay for an additional month or year of product durability Respondents making decisions on smartphones originally saw durability in months Willingness to pay was multiplied by 12 to arrive at a willingness to pay for an additional year of durability this assumes linearity in willingness to pay
3612 respondents made decisions on vacuum cleaners 3605 on dishwashers 3627 on TVs 3638 on smartphones and 3644 on coats
[1] No CE information shown means no durability and no reparability information shown
[2] Respondents had no significant willingness to pay for durability when they were not shown any durability information This result might seem trivial yet it is an important sense check of the overall setup of the experiment which thus seems valid
Source LE Europe analysis of behavioural experiment
Overall willingness to pay across all respondents ranged from euro1354 for an
additional year of durability for coats to euro7288 for an additional year of
durability for TVs and euro1478 per month or euro12394 per year (derived from the
monthly figure) for smartphones
This comparison across products however should not be given too much importance
This is because the estimates of willingness to pay are not only determined by the
Behavioural Study on Consumersrsquo Engagement in the Circular Economy
167
importance of durability in decision-making but also by other factors especially the price
ranges presented in the choice experiment These were calibrated based on actual
market prices and varied significantly across the products Willingness to pay is inflated
by a larger variation in prices or a smaller variation in durability This explains why the
willingness to pay for smartphones is relatively large (large variation in price small
variation in durability) whereas the willingness to pay for vacuum cleaners is relatively
small (small variation in price large variation in durability) Even if consumers attached
the same importance to durability in decision-making across products the willingness to
pay is expected to be different across products if market conditions differ
Comparing willingness to pay across different ways of presenting CE information
but within each product category is more informative This comparison corroborates
many of the previous findings Firstly respondents required information on product
durability to be willing to pay for it164 Durability information provided via
manufacturer warranties or as an expected lifetime was most effective
Willingness to pay for additional durability was highest for all products when expected
lifetime was shown (respectively euro3576 (vacuum cleaner) euro3591 (dishwasher)
euro14830 (TV) euro21739 (smartphone) and euro2727 (coat) for an additional year of
durability) For all products except vacuum cleaners the manufacturer warranty was
associated with the second highest willingness to pay For vacuum cleaners showing
durability information on its own on an EU label proved second most effective with a
willingness to pay equal to euro3315
As before it must be noted that the differences between the manufacturer warranty and
expected lifetime on the one hand and durability information on its own on an EU label
on the other were minor For example the willingness to pay for durability for
dishwashers was euro3005 when durability information was shown on an EU label It was
only euro266 higher when information was shown as a manufacturer warranty
The effectiveness of information provided on an EU label was again similar to providing
information outside the EU labels In general WTP for additional durability was often
lower in the EU label conditions compared to showing durability outside of the EU label
For all products except dishwashers the willingness to pay for durability was lowest when
reparability was shown in addition to showing durability information This again suggests
that showing both pieces of information triggers difficulty for respondents when they
need to consider and trade-off information on different CE characteristics
Willingness to pay was also estimated for reparability Section 272 shows how
reparability was ranked on an A to G scale with lsquoArsquo being the most easily repaired
product More precisely products could be assigned the following rankings A C E or G
Therefore willingness to pay shows the monetary amount that respondents were willing
to pay for increasing the reparability of a product by two levels eg increasing
reparability from C to A or from G to E Table 51 provides the results
164 It is important to note that respondents had no significant willingness to pay for durability when they were not shown any durability information This result might seem trivial yet it is an important sense check of the overall setup of the experiment which thus seems valid
Behavioural Study on Consumersrsquo Engagement in the Circular Economy
168
Table 51 Willingness to pay for reparability (in euro per two-level improvement on A-G
scale)
Vacuum
cleaners
Dish-
washers
TVs Smart-
phones
Coats
Overall willingness to pay
(WTP)
1061 2075 3360 2033 673
Willingness to pay in different information treatment conditions
WTP when no information
was shown[1] Not statistically significant[2]
WTP when reparability
information was shown on
EU label
5424 10494 17058 9770 2987
WTP when reparability and
durability information were
shown on EU label
2856 8256 7648 4739 1042
Notes Willingness to pay for an increase of the productsrsquo reparability score (A-G) by two levels eg an increase from C to A
3612 respondents made decisions on vacuum cleaners 3605 on dishwashers 3627 on TVs 3638 on smartphones and 3644 on coats
[1] No information shown means no durability and no reparability information shown
2] Respondents had no significant willingness to pay for reparability when they were not shown any reparability information This result might seem trivial yet it is an important sense check of the overall setup of the experiment which thus seems valid
Source LE Europe analysis of behavioural experiment
The first row in Table 51 shows the overall willingness to pay for reparability It presents
an average of the willingness to pay presented in the last three rows and thus willingness
to pay pooled across all information designs According to these figures respondents
were willing to pay between euro673 and euro3360 for an increase in reparability
score by two levels This figure however is influenced by the fact that most
respondents did not see any type of reparability information in the experiment As
argued in more detail below respondents who did not see reparability information were
(logically) not willing to pay for it This lowered the overall willingness to pay
Looking at specific ways of presenting relevant information again it appears to be most
important to provide information on product reparability at all165 When relevant
information was provided respondents were willing to pay for ease of repair
Furthermore the willingness to pay for reparability was highest when reparability
information was provided on its own (respectively euro5424 (vacuum cleaner) euro10494
(dishwasher) euro17058 (TV) euro9770 (smartphone) and euro2987 (coat) for an increase of
two levels in reparability score) and not together with durability information
Willingness to pay also provides an opportunity to look at the relative importance of
durability and reparability in respondentsrsquo decisions Table 52 shows the willingness to
pay for durability and reparability for respondents that were shown both types of
165 The experiment did not test different ways of presenting reparability information It only tested whether the inclusion of reparability information using a screwdriver and spanner icon combined with an A-G scale had an impact on respondentsrsquo decision-making behaviour
Behavioural Study on Consumersrsquo Engagement in the Circular Economy
169
information on an EU label These were the only respondents that were given both types
of information
Table 52 Willingness to pay for durability (in euro per yearmonth additional durability) and
reparability (euro per two-level improvement on A-G scale) when both types of information
are shown
Vacuum
cleaners
Dish-
washers
TVs Smartphones Coats
Year Year Year Month Year Year
Willingness to pay for
more durability
2028 3112 9179 1232 14788 1396
Willingness to pay for
better reparability
2856 8256 7648 4739 1042
Notes Willingness to pay for additional month or year of product durability and willingness to pay for an increase of reparability score of two levels Respondents making decisions on smartphones originally saw durability in months Willingness to pay was multiplied by 12 to arrive at a willingness to pay for an additional year of durability
Willingness to pay for respondents that were shown durability and reparability concurrently on an EU label
595 respondents made decisions on vacuum cleaners 607 on dishwashers 605 on TVs 600 on smartphones and 593 on coats Results have been weighted to be EU-wide representative
The table shows that the relative importance of durability and reparability varies between
products For vacuum cleaners and coats the willingness to pay for both CE
characteristics (ie one year or month of durability and a two-level improvement on the
A-G reparability scale) was the same order of magnitude For dishwashers and
smartphones166 reparability was the more important characteristic in terms of
willingness to pay For TVs willingness to pay was higher for durability than for
reparability
653 Effectiveness of behavioural nudges
The experiment also tested the effectiveness of small behavioural lsquonudgesrsquo These were
introduced as claims shown on pop-up screens prior to each experimental round for
participants in the respective treatments See section 272 for further details and
screenshots of the experimental environment Some respondents were shown the claim
that longer lasting products might save money in the long-run (Savings claim)167 Other
respondents were shown the claim that a majority of people chose longer lasting and
more easily repairable products (Social claim)168 These two groups are compared with
the group of respondents that did not see any claim
Claims can be seen as an extension of information provided to respondents Information
in the previous section dealt with product characteristics The claims analysed in this
section relate more to information about the context in which a decision was made
Social nudges have been shown to work as small and cost-effective interventions which
in similar interventions increased for example timely tax collection rates energy
conservation or even high-stakes enrolment into job training169 For the savings claim
166 For smartphones the comparison between willingness to pay for durability and reparability is most appropriate using willingness to pay for an additional month of durability This is the framing that respondents saw in the experiment
167 The exact claim was ldquoProducts that last longer may save you money over timerdquo
168 The exact claim was ldquoA majority of people choose products that last longer and are easier to repairrdquo
169 See The Behavioural Insights Team (2015) EAST Four simple ways to apply behavioural insights available at httpwwwbehaviouralinsightscoukwp-contentuploads201507BIT-Publication-EAST_FA_WEBpdf
Behavioural Study on Consumersrsquo Engagement in the Circular Economy
170
the qualitative work for this study found that the decision to purchase products was to a
large extent driven by money-saving motives and the following tests verified whether
this could be used to enhance CE purchasing decisions
Figure 47 shows the distribution of durability preferences for the different groups of
respondents who saw different claims Note that only respondents who saw some form of
durability information are included Respondents who did not see durability information
would not be able to adjust behaviour based on the claim they saw
Figure 47 Durability preferences for different claims shown to respondents
Notes includes only respondents that saw some form of durability information
1376 respondents saw no claims 1325 respondents saw claims about long-term savings and 1353 saw social claims
Both types of claims led respondents to purchase more durable products
compared to when the respondents saw no claims There was a statistically
significant decrease in the proportion of respondents with a low durability preference
when either a savings or social claim was shown Furthermore the proportion of
respondents with a high durability preference was statistically significantly higher for
respondents having seen a savings claim compared to respondents having seen no claim
The proportions of respondents with intermediate preferences were not statistically
different for different claims Regression analysis showed however that these results
were not robust once other factors were taken into account (see regression results in
previous sub-section) Therefore the effectiveness of claims was rather limited compared
to other treatments
In general the claim about savings was ndash slightly ndash more effective than the social claim
However the distribution of durability preferences did not differ significantly between the
two types of claims
Claims seemed to only have negligible effects on the preferences for
reparability and general CE preferences There were no statistically significant
Allcott (2011) lsquoSocial norms and energy conservationrsquo Journal of Public Economics Coffmann et al (2017) lsquoCan Social Information Affect What Job You Choose and Keeprsquo American Economic Journal Applied Economics
Behavioural Study on Consumersrsquo Engagement in the Circular Economy
171
effects detected on reparability or general CE preferences in the conditions with claims
compared to the baseline without a claim
Overall these experimental tests seem to suggest that communication which underlines
the importance of CE characteristics in the purchasing process may increase consumersrsquo
interest in the CE In particular considering the shift in purchases of products with low to
those with high durability it seems that once individuals become interested in durability
they seek to purchase the most durable products instead of products with very low
durability At the same time looking at the large and stable share of respondents who
purchased products with intermediate durability it appears that there are parts of the
population who do not engage as much with the CE and do not change their purchasing
decisions in meaningful way
Although the experiment shows that nudges have an immediate if small effect on
durability it is silent on long-term effects If claims were shown to consumers eg only
for specific project which consumers purchase infrequently we would expect the effects
in real markets to align with the effects in our experiment If on the other hand claims
would be shown more frequently (eg on product descriptions for many types of
products) it is likely that the effect of claims decreases over time as people become used
to the claims made Alternatively repeated exposure might also reinforce the message
and its effectiveness The experiment cannot provide an answer to this question because
it was only set within a 15-minute timeframe
654 Other factors that influenced CE behaviours in purchasing decisions
Besides information on CE characteristics and claims the experiment also tested whether
the look and feel of the tested EU labels made a difference in respondentsrsquo CE behaviour
As noted before (screenshots of this treatment are shown in section 272) some
respondents saw a lsquomini labelrsquo of the EU Energy Label170 This was a reduced version of
the standard EU Energy Label but still included the most relevant information Others
saw a lsquofull labelrsquo which showed all the relevant information in the common EU Energy
Label format Both the lsquofullrsquo and the lsquominirsquo label were simplified versions of the real EU
Energy Label The lsquofullrsquo label did not display information which is currently displayed on
the Energy Label such as energy consumption in kilowatt hour or noise levels in decibel
Choices for durability and reparability did not differ171 between respondents
being shown a full or mini label One potential explanation for this might be that the
mini label contained all the information that was relevant for decision-making At the
same time it appears that additional information presented in the full label did not deter
respondents from acting on relevant information This is an encouraging finding since the
EU Energy Label for example carries a wealth of other non-CE related information The
experiment seems to suggest that individuals can to some extent abstract from other
information and still act on the CE characteristics
Another reason why the different ways of presenting the label had no impact might relate
to the fact that very few participants engaged with the labels further by clicking on them
Unless the labels were clicked on respondents would not have seen further explanation
about the label content Similar shares of respondents clicked on either the lsquofullrsquo or the
lsquominirsquo label For any given product only around 13 of respondents clicked a label172
Across all products this resulted in 31 of respondents clicking on at least one label
Therefore 69 of respondents did not show interest in obtaining more information about
170 Note that this is not relevant for decisions made on coats As noted in Section 272 the EU Ecolabel was used for coats and no distinction between lsquofullrsquo labels and lsquominirsquo labels was made
171 Two-sided pairwise z-tests of proportions showed no statistically significant differences between proportions for high intermediate or low preferences for durability reparability or overall CE This result was shown to be robust in ordered logit regression analysis
172 The exception is coats 17 of respondents making decisions on coats clicked a label Coats where the only product employing the EU Ecolabel rather than the EU Energy Label Arguably the former label is not as well-known explaining why respondents searched for additional information more often when making decisions on coats
Behavioural Study on Consumersrsquo Engagement in the Circular Economy
172
the labels These engagement rates with additional information are in line with previous
behavioural studies in other markets173 and further underline that information
presented must be relevant intuitive and salient at all stages to be impactful
The fact that different types of labels did not generate different CE behaviour is
comforting since the mini label and full label tend to be employed in different contexts
Mini labels are often used in online environments whereas full labels tend to be adopted
in brick-and-mortar shops The results of the experiment show that these different
market practices should not create different outcomes
Lastly a number of personal characteristics were tested for their effect on CE behaviour
in purchasing decisions These included standard demographic characteristics ndash such as
gender age and educational attainment ndash but also characteristics directly relevant to the
CE ndash such as attitudes towards recycling second hand products and durability and
reparability These personal characteristics did not play a major rule in driving
purchasing decisions For most personal characteristics no robust links to preferences
for CE-friendly products were found
An exception were attitudes towards fashion and trends in relation to the preference for
durability Respondents with a low preference for fashion and trends were significantly
and robustly more likely to have a higher durability preference
173 European Commission (2017) lsquoStudy on consumersrsquo decision-making in insurance services A behavioural economics perspectiversquo a report prepared by LE Europe VVA Europe and Ipsos
Behavioural Study on Consumersrsquo Engagement in the Circular Economy
173
CONCLUSIONS AND SUGGESTIONS FOR FUTURE POLICY ACTION
Behavioural Study on Consumersrsquo Engagement in the Circular Economy
174
7 Overall conclusions
The transition to a more Circular Economy in the European Union is picking up pace The
number of initiatives to stimulate this transition are increasing both top-down from
public authorities through policy actions as well as bottom-up led by industry initiatives
at company or cross-sectoral level At EU level the EU Action Plan for the Circular
Economy adopted in December 2015 has led to concerted policy and regulatory efforts
in various sectors and areas in order to stimulate a more Circular Economy Due to key
principles in (EU) environmental policy such as the polluter pays and producer
responsibility as well as the premise that the Circular Economy can save businesses
money many of the Circular Economy actions (to date) have had a production or supply
side focus Yet for Circular Economy activities to be successful the consumption
demand side needs to be equally well understood To date the consumer perspective on
the Circular Economy has not received as much research attention
This study aimed to fill this gap in the Circular Economy literature by investigating to
what extent consumers currently already engage in Circular Economy practices and what
determines their engagement with a focus on product durability and reparability Making
products more durable and easier to repair can extend their useful lives and increase
their utilisation As a result fewer products are needed to satisfy a similar level of
demand which results in lower use of resources and less waste generation
From a consumer perspective actions that extend the lifetime of products include
purchasing more durable products repairing products when broken and giving products a
second life by selling them in the second hand market Increasing the utilisation rate of
products can also be achieved through rentingleasing models Renting or leasing is
especially useful for products that people only use occasionally These options are
presented in Figure 48 for two types of consumer demand
Type 1 Demand for a functional replacement or equivalent for a product the
consumer already owns (but is defective) and
Type 2 Demand for a new product that they do not yet possess
The options for the first type are repair or replacement with a new or second hand
product The second type can only be satisfied by a new or used product (in ownership)
or through rentalleasing
Figure 48 Consumer choices in the Circular Economy and factors that influence their
decision-making process
To understand what influences consumer behaviour the study explored self-declared
attitudes towards the Circular Economy Additionally the study tested the
effectiveness of providing information on product reparability and durability and
what drives the decision to repair a defective product Furthermore it assessed the
Behavioural Study on Consumersrsquo Engagement in the Circular Economy
175
effects of nudging and the framing of information on purchasing and repair
decisions The study focused mainly on five products - vacuum cleaners dishwashers
televisions smartphones and clothing
The study used a comprehensive set of research methods (see section 2 for more
details)
A systematic literature review was undertaken spanning academic policy and
grey literature across the EU 28 Norway Iceland and four other non-European
countries (ie Canada Switzerland Japan and the United States)
Consumer focus groups were conducted in Ireland Germany Sweden and the
Czech Republic to explore consumersrsquo awareness understanding and expectations
with regard to Circular Economy practices including views from potentially vulnerable
consumers174
Stakeholder consultations with 50 experts from eg business and consumer
associations NGOs public authorities and academia were used to close gaps in the
literature and collect additional evidence
An online consumer survey was undertaken in 12 Member States namely in
Austria the Czech Republic France Germany Hungary Ireland Latvia the
Netherlands Portugal Romania Spain and Sweden with approximately 1000
respondents in each country who were representative of the general population in
terms of age gender and geographic region The survey collected information on
consumersrsquo experiences with CE practices such as repairing renting leasing and
purchasing second hand products their reasons behind engaging in the CE (or not)
as well as general socio-demographic characteristics and self-declared attitudes
towards the CE
The survey was complemented with two behavioural experiments in 6 of the 12
Member States (ie the Czech Republic Germany Ireland Romania and Sweden)
The respondents conducted exercises relating to their purchasing behaviour of new
products and their decisions whether to repair or replace a defective product
they already owned
The study conclusions are set out in the following way
Section 71 concludes on understanding consumer engagement in the Circular
Economy and
Section 72 on factors influencing consumer decision-making in the Circular Economy
71 Understanding consumer engagement in the Circular Economy
One objective of the study was to collect information on what consumers across the EU
most associate with lsquodurablersquo and lsquorepairablersquo products The study therefore addresses an
important gap in the Circular Economy literature This is because durability and
reparability are terms that can easily be given multiple interpretations if not defined
accurately
Most respondents reported being able to lsquouse a product for a long timersquo (57) and lsquothe
product staying in perfect working order for a long timersquo (56) as the most relevant
durability attributes This was in line with the limited existing literature which states that
consumers mainly link durability to a productrsquos performance over time Survey
respondentsrsquo understanding of reparability was instead best described by lsquospare parts
being available for the productrsquo (46) and the lsquopossibility to have the product repaired
by a repair firmrsquo (44)
Beyond these associations the study uncovered that the current state of consumer
engagement in the Circular Economy is characterised by a high willingness to act in line
with the Circular Economy but actual engagement is still rather low
174 Vulnerable consumers were defined as people who are in arrears with household bills or who struggle from time to time with household bills and are in any of the following situations unemployed retired long-term sick or disabled or single parents
Behavioural Study on Consumersrsquo Engagement in the Circular Economy
176
Consumers claim to be willing to engage in Circular Economy activities
The consumer survey found that most EU consumers claim to frequently engage
with the Circular Economy The majority of survey respondents reported that they
keep things they own for a long time (93) recycle unwanted possessions (78) and
repair possessions if they break (64) (see section 34) Respondents also reported that
their peers display similar levels of engagement in the Circular Economy
A lower yet substantial proportion of respondents reported being willing to
engage with novel Circular Economy practices such as leasing products or
buying second hand products The share of consumers who reported they were
interested in leasing varied across product groups between10 for vacuum cleaners
compared to 25 for mobile phones Overall around one in three consumers claim to
buy second hand products (see Section 34)
Previous research has found that consumersrsquo willingness to engage in Circular Economy
activities differs with the nature of the product That is consumers are more likely to buy
a durable product repair or lease a product for more expensive and less lsquofashion-
dependentrsquo items The focus groups and interviews confirmed these findings with
participants reporting that they would be particularly willing to buy durable or to
lease white goods (eg dishwashers) For more fashion-dependent items (smart
phones and clothing) respondents reported they would however be more willing to
purchase second hand compared to other products
A majority of respondents also claimed to be aware of the durability of products they
purchased (64) as well as repair services (58) Respondents reported that they
frequently looked for durabilityreparability information on products (62 for durability
and 55 for reparability) Respondents however often felt that this information was
difficult to find and that they would like better information on these features
These findings are in line with previous research which finds that consumers are
generally willing to engage in sustainable consumption and that this is particularly driven
by their concerns about the environment
However consumersrsquo actual engagement with repairing renting or leasing was found to
be low
Contrasting the high levels of self-claimed willingness to engage in the Circular Economy
there are still many consumers who have in the past not behaved accordingly The
consumer survey and experiment both showed that most consumers repair products
when they break (around 63) Yet the share of consumers who have not
repaired products after they broke was still substantial 36 on average across
the analysed products The highest non-repair rate was observed among Dutch survey
participants (on average 56) while the lowest was observed among Romanian
participants (on average 25) Age and other socio-demographic factors did not play an
important role with respect to repair behaviour
Those who had repaired a product had generally used a professional repair service (eg
26 used a repair service 17 had the product repaired by the manufacturer) Some
respondents especially for clothing items reported that they had decided to self-repair
24 for clothing 18 for vacuum cleaners 13 for dishwasher 6 for mobile phones
and 2 for televisions
Similarly despite a relatively high level of interest in novel Circular Economy practices
(see section 3) the consumer survey found that only a limited proportion of respondents
had ever leased products or purchased second hand And only between 5 and 9 of
respondents had bought a second hand vacuum cleaner dishwasher TV smartphone or
clothing Both the survey and experiment found that buying second hand is more likely
for smart phones and clothes (20) compared to the other products tested (13-14)
Even fewer 1 to 3 had rented or leased a product Observations from the
behavioural experiment support the self-reported survey findings Only 10 to 20 of
experiment participants decided to purchase a second hand product to replace a
defective product within the experiment all others preferred buying brand new
replacements These findings indicate that there is a large potential in closing the gap
between willingness to engage and actual engagement
Behavioural Study on Consumersrsquo Engagement in the Circular Economy
177
Many consumers expect products especially expensive products to last a long time
What consumers associate most with lsquodurabilityrsquo and lsquoreparabilityrsquo was roughly consistent
across different types of products At the same time consumers have different
expectations regarding how long different products should last Focus group
participants and survey respondents reported a wide range of life-time expectations for
the different products of the study such as
For vacuum cleaners 27 of survey participants expected a lifespan of between 4
and 7 years with another 27 who indicated an expectation of 7 to 10 years
For dishwashers the lifespan expectations were higher with 29 indicating that they
expected a lifespan between 7 and 10 years and another 29 with an expectation of
10 to 15 years
Similarly 31 indicated they expected a television to last for 7 to 10 years and
another 28 stated their expectation lay within the range of 10 to 15 years
For mobile phones and clothing items lifespan expectations were lower 38
expected a lifespan between 2 and 4 years for mobile phones and 35 indicated an
expected lifespan of 4 to 7 years For clothing 25 expected a lifespan between 2 to
4 years and a similar share between 4 to 7 years
Most consumers expect that repairing products is possible and easy to arrange
The survey found that there were two large groups of consumers One group who has
experience with repairing goods (63) and one who does not (36) The experienced
group was also more likely to expect that repairing would be possible and easy to
arrange The latter group who lacked experience with repairs seemed to have low
expectations regarding whether repairing goods would be worthwhile or even possible
Specifically for all five product categories a substantial majority of survey respondents ndash
ranging from 77 for coatsjackets to 90 for dishwashers ndash thought it would be
possible for these products to be repaired either by themselves or by someone else
on their behalf Most consumers expected it to be possible to have the products repaired
by a third party (ie friends and family professional repair services) However a non-
negligible minority between 10-23 either did not feel or know whether
repairing a product would be possible
Such inexperience coupled with low awareness of repair options likely obstructs the
potential for further engagement with Circular Economy practices Indeed some
interviewed stakeholders felt that consumersrsquo negative experiences with or expectations
regarding repair services acted as a barrier to the use of such services
However survey respondents typically expected a good level of service from
repair providers175 a majority would expect the service to be ldquofairlyrdquo or ldquoveryrdquo good in
terms of convenience (85) speed (82) friendliness (89) and quality of the repair
(92) Moreover the survey also suggests that actual experiences with repair services
were largely positive In most cases respondents reported their expectations were met
when having a product repaired (over 70) and in some cases even exceeded
Therefore it is likely that some especially inexperienced consumers might wrongly
expect repair services to perform poorly which prevents them from using such services
more often
72 Factors influencing consumer decision-making in the Circular Economy
The previous section established what current consumer engagement in the Circular
Economy is regarding how willing and likely they are to buy durable repair lease or
purchase second hand products Building upon this information this section draws
conclusions on what can enhance or inhibit such Circular Economy practices The figure
below provides an overview
175 No distinction was made here between independent repair services and manufacturer provided repairs
Behavioural Study on Consumersrsquo Engagement in the Circular Economy
178
Figure 49 Factors that influence consumersrsquo choice to replace repair or lease products
Price quality and convenience are most important for consumer decisions
A range of behavioural factors influence consumer decisions Survey respondents ranked
product quality and price as the two most important factors influencing their product
choice followed by product durability and reparability whether repair services exist and
environmental aspects Brands and trends (fashion or technological) were rated as less
important by survey respondents though the literature and focus groups frequently
pointed to these factors as being important While the survey often found that there were
differences between product categories price and quality were very important for all
products
The provision of durability information at the point of sale on for example a product
label and the use of behaviourally informed nudges have the potential to encourage the
selection of more durable products For example better information on the durability of a
product could increase the valuerelative weight of the productsrsquo environmental
characteristics on the purchasing decision (see Figure 50)
Figure 50 Providing durability information can influence the relative importance of price
in purchasing decisions
Overall all strands of research found that consumers lack information on product
durability and reparability Although survey respondents generally reported searching
for information on productsrsquo durability and reparability many including consumers in the
focus groups indicated that such information was difficult to find and that they had a
Behavioural Study on Consumersrsquo Engagement in the Circular Economy
179
desire for receiving better information This pattern of searching for information but
finding it difficult to find or understand was especially pronounced for older respondents
Consumers in the survey and focus groups reported that they were interested in seeing
durability information on product labels or via extended product warranties Some also
reported using brand reputation as an indicator of product durability Regarding
reparability information consumers would like to receive information on the availability
of spare parts repair services and the applicability of extended product warranties
The provision of durability and reparability information was found to be
effective in encouraging the purchase of more durable and repairable products
These findings indicate that the current state of information provision regarding product
durability and reparability might be a potential barrier for engaging in the Circular
Economy Provision of information in a consistent and straightforward format could help
in reducing this barrier
Providing information on product durability and reparability shifts purchasing decisions
towards products with better Circular Economy credentials
The behavioural experiment showed that giving respondents information on product
durability can have a substantial impact on purchasing decisions In a simulated
purchasing task with streamlined product information provision of durability
information increased the participantsrsquo preference for high durability products
almost threefold Provision of reparability information more than doubled the
preference for products with a high level of reparability Both these effects were
highly statistically significant Durability information was most effective when provided as
lsquomanufacturer warrantiesrsquo or lsquoexpected lifetimesrsquo176 EU labels (ie an augmented EU
Energy or Ecolabel with an added durability commitment icon or reparability icon and
rating A-G) were similarly effective177
General Circular Economy preferences were strongest when durability and reparability
information was presented together That is when durability and reparability
information was shown together individuals were most likely to purchase
products which rated high in both dimensions ndash durability and reparability
Durability was however the more influential factor on consumer decisions In the
experiment durability information provoked the strongest shifts in preferences while
reparability only marginally led participants to choose products with overall better CE
credentials
The findings were corroborated by showing significant willingness-to-pay for better
durabilityreparability for all product categories Depending on how
durabilityreparability information was presented willingness-to-pay for an additional
year of durability ranged between euro20-36 for vacuum cleaners and dishwashers euro92-148
for TVs euro148-217 for smartphones178 and euro14-27 for coats Willingness-to-pay for an
improved reparability179 rating was around euro29-54 for vacuum cleaners euro83-105 for
dishwashers euro77-171 for TVs euro48-98 for smartphones and euro10-30 for coats
176 lsquoManufacturer warrantyrsquo and lsquoExpected lifetimersquo were not explained or defined further in the experiment It is a common market practice for manufacturers and retailers to display durability claims beyond the legal guarantee of 2 years in this way Manufacturer warranties and expected lifetimes may be seen as a service to consumers or a possible signal for quality but the experiment remained silent about the precise meaning
177 Durability on EU labels was defined as The period in which the manufacturer promises to replace or repair the product free of charge
Reparability on EU labels was defined as Ease-of-repair rating based on availability of repair manuals spare parts and repair services
Around 31 of participants have clicked on the labels to enlarge these to include these additional definitions
178 Willingness-to-pay for additional durability of smartphones was measured in months and subsequently extrapolated to years A linear relationship between time and willingness-to-pay was assumed (ie each extra month has the same value)
179 The willingness-to-pay was measured per year for durability and per two-step increase on the A-G scale for reparability(eg from G to E C to A)
Behavioural Study on Consumersrsquo Engagement in the Circular Economy
180
The finding that durability information had a larger impact on respondentsrsquo choices in the
experiment than reparability information is in line with the findings from the survey
focus groups and literature Based on the survey findings this may be because
consumers said they trusted manufacturersrsquo warranties did not expect (durable)
products to break or felt that repair would be expensive As such durability is seen by
consumers as a substitute for reparability while the reverse is not the case In this
regard there seems to be divergence between consumer expectations and industry
perceptions because stakeholders representing the industry mentioned that reparability
was seen as a building block of durability by extending useful lifetimes via repairs or
upgrades Thus it might be beneficial to sensitise consumers further regarding the
benefits of easily repairable products to achieve further consumer engagement in the
Circular Economy Informing consumers about the durability benefits of easily repairable
products may help to achieve further consumer engagement in the Circular Economy
Importantly information provision was equally effective in encouraging more CE
behaviour across different types of consumers Its effectiveness was not restricted
to consumers belonging to certain socio-demographic groups or to those having pro-
environmental preferences This is interesting as the likelihood of choosing to repair a
product rather than replacing it did differ across consumer types (see further below and
in section 45)
The shifts in behaviour in the experiment resulted from consumers turning away from
low durabilityreparability products in favour of those with better CE
credentials As usual with experimental findings these effects need to be seen in
conjunction with the experimental setup which consisted of a simplified purchasing
process with streamlined and standardised product information compared to real-world
shopping experiences It is therefore possible that the effectiveness of
durabilityreparability information in reality might be increased or dampened
Information provision at the point of sale likely affects after-sales expectations
In terms of after-sales expectations there were contrasting views uncovered by
the different strands of research Stakeholders reported that consumers have low
expectations regarding product reparability Some focus group participants had the
impression that newer generations of products were less durable than products that were
produced some years ago This discussion around lower durability of newer products
sometimes led participants to mention the concept of planned obsolescence of
products
A joint analysis of the behavioural experiment and the consumer survey revealed that
consumers who have received durability information via manufacturer warranties
or durability promises at the point of sale in the purchasing exercise in the experiment
were significantly more likely to expect free replacement or free repairs of
faulty products Alternatively those who had not seen any information on CE product
characteristics or only information on the reparability of a product were significantly less
likely to expect free rectification of the fault in any way and instead were more likely to
expect to pay for either repair or replacement
These findings further underline the important role product information regarding product
durability and reparability could play in fostering consumer engagement in the Circular
Economy
Many customers try repairing before replacing products but repair decisions are easily
disrupted if arranging repair requires effort
As seen in the previous section a majority of consumers (63) have experience with
repairing products
Those who did not repair products in the past did not do so mainly because they
expected repair to be too expensive (between eg 25 for clothes and 50 for
dishwashers) and preferred getting a new product (17-25 across products) or felt
the old product was obsolete or out of fashion (20 for vacuum cleaners and
dishwashers 25-30 for clothes phones and TVs) Fewer (5-10 across products) said
they did not know howwhere to repair products or felt it would be too much effort to
repair (8-14 across products)
Behavioural Study on Consumersrsquo Engagement in the Circular Economy
181
The behavioural experiment furthermore tested what enhances or inhibits the decision to
repair It revealed that repairs must be easy to arrange as any additional effort could
discourage consumers from attempting repairs In the behavioural experiment the
number of respondents who never chose to repair180 in a repair versus replace choice
increased from 6 to 12 when the repair required minor additional effort compared to
purchasing a replacement product Similarly additional effort led to a decrease in the
proportion of participants choosing to repair from 42 to 35 Even when the effort for
repairing and replacing was identical many respondents still chose to replace the
defective products in the experiment It therefore seems that frictions in the
accessibility of repair services significantly lowered the attractiveness of
repairing while the same type of frictions had virtually no effect on the decision
to replace a product
This illustrates that effort is seen as an important inconvenience or lsquocostrsquo by the
consumer The balance between (perceived) cost and effort of repair can easily tip
consumers to favour replacement This was especially the case for consumers who placed
high importance on trends or fashion
Repairs which were framed as using lsquooriginal parts onlyrsquo compared to lsquooriginal and non-
original partsrsquo were slightly more attractive while consumers were indifferent
between whether the repair was provided by the manufacturer or an
independent repair service Other behaviourally motivated mechanisms which did not
change the cost or difficulty of repairing or replacing largely had no effect on choice
Merely framing repair prices as VAT exempt (while keeping prices constant) did not have
meaningful effects on repair decisions overall Such practices seemed to only strengthen
the decisions of certain groups of respondents For example those with pro-
environmental attitudes were even more likely to repair products when repair services
were framed as VAT exempt while those who attributed highest importance to trends
and fashion were further deterred from repairing
Drivers and barriers to renting leasing products and buying second hand
As mentioned before experience with rentingleasing (1) and buying second
hand (6) was rather low in the surveyed population The main reasons for not
having engaged with such practices were that respondents wished to own their
products and generally that they preferred new unused products Similarly
market data from Scandinavian countries showed that consumers would in general be
willing to make some sacrifices to improve Circular Economy outcomes unless it required
sharing goods or letting their own goods be used by other consumers
Among the few respondents who have rented or leased products in the past their
motivations for doing so were mixed Convenience the possibility to test the product the
chance of reusing the product after use or budget considerations all seemed to play a
role
Uncertainty about the quality of second hand products may act as an important barrier to
Circular Economy engagement by consumers Lack of trust in quality of used products
was seen as a barrier by survey respondents and focus group participants to purchasing
second hand products Respondents were more inclined to purchase second hand
clothing and furniture than electronic goods because of concern that used electronics
may break down faster than a new product 14-21 of respondents (across products)
viewed purchasing a new product as better value for money despite second hand
products being available at a lower price
Product durability and reparability are important for consumers as these can save them
money in the long run
180 Respondents repeated the ldquorepair experimentrdquo in which they were given the choice to repair vs replace defective products three times for different products Respondents could thus decide to repair products between 0 (ie never) and 3 times
Behavioural Study on Consumersrsquo Engagement in the Circular Economy
182
While quality and price were given the highest average importance in purchasing
decisions durability and reparability were also important Respondents who ranked
durability as an important factor reported that the top reason for this ranking was that
durable products would save them money in the long run This finding motivated the
experiment to test behavioural lsquonudgesrsquo introduced via pop-up messages during the
purchasing task These nudges had a positive impact on respondentsrsquo purchasing
decisions Informing respondents that they could save money by purchasing products
that last longer was effective in encouraging them to choose more durable products
Telling respondents that a majority of people chose products which last longer and which
are easy to repair was equally effective Nudges however did not influence respondentsrsquo
preferences for choosing products with higher levels of reparability
Even though reparability was relatively less important for purchasing decisions compared
to durability the possibility to save money with easily repairable products again
motivated individuals to engage with reparability so did the desire to keep products for a
long time
Personal attitudes towards the environment influences consumersrsquo engagement in the
Circular Economy
In the present study personal self-declared attitudes towards the Circular
Economy were largely consistent with actual engagement in the sense that
consumers who self-rated themselves as having pro-environmental attitudes were also
more likely to repair or purchase second hand products Similarly respondents who
categorised themselves as attaching high importance to fashion and technology were
significantly less likely to repair products These findings might seem trivial but they are
not It is often claimed including by some stakeholders in this study that self-declared
pro-environmental attitudes not necessarily translate into pro-environmental behaviours
Behavioural Study on Consumersrsquo Engagement in the Circular Economy
183
8 Suggestions for future policy action
There are a number of overarching findings that arose from this study
1 EU consumers are willing to engage in the Circular Economy but their actual
engagement is relatively limited This implies there is room to boost Circular
Economy practices further Consumers in the survey and experiment with
positive self-declared attitudes towards the environment acted in line with these
preferences in their actual behaviour Therefore by changing consumer
attitudes and their awareness surrounding sustainable and environmental
behaviours further engagement with Circular Economy practices could be
achieved
2 Key drivers influencing consumersrsquo purchase and replacement decisions were
found to be price quality and convenience Reducing the effort required to
repair products lowering prices and increasing quality of durable products could
therefore lead to more pro-Circular Economy purchasing and repair decisions
3 EU consumers lack information on durability and reparability when making
purchasereplacement decisions and would like to take these aspects into account
Providing this information has proven effective in increasing purchases of
products with higher durability andor reparability in the incentivised behavioural
experiment
These findings lead to a number of policy suggestions for EU and national local policy
makers in order to accelerate the transition towards a Circular Economy The policy
implications guide the structure of this chapter and serve as a taxonomy for classifying
subsequent policy recommendations Each policy implication is followed by a number of
policy recommendations (Figure 51) These recommendations include better
implementation or adaptation of existing instruments as well as suggestions for new
policy instruments
Behavioural Study on Consumersrsquo Engagement in the Circular Economy
184
Figure 51 Overview of key policy implications and recommendations
It needs to be stressed that the recommendations for (future) policy action made in
this section are directly derived from the findings and have not been subject to a
rigorous impact assessment that analyses their impacts effectiveness and efficiency in
reaching overall policy goals181 Before proceeding with concrete policy actions in these
areas it is clear that impact assessments would need to be conducted in line with the
European Commissions Better Regulation Agenda182 Suggestions for topics that should
be subject to additional research are included in section 84
81 Boosting CE engagement by strengthening pro-environmental
attitudes and awareness
To reiterate the conclusion from the previous chapter this study found that most EU
consumers try to keep products for a long time and to repair possessions when they
break Most survey respondents also agreed that it was important to be environmentally
friendly and wanted their friends to know that they cared about the environment At the
same time a substantial share of consumers still does not engage in CE practices 36
had not repaired products in the past and only a limited share of respondents had
actually purchased second hand products (5-9) or rentedleased (1-3) a product
181 Effectiveness = To what extent do the suggested recommendations contribute to reaching an overall policy objective Efficiency = At what costs are the (projected) results (being) achieved
182 httpseceuropaeuinfolawlaw-making-processplanning-and-proposing-lawbetter-regulation-why-and-how_en
bullRecommendation 1
bullBoosting pro-environmental attitudes
bullIncreasing consumer awareness of second hand rentingleasing and repair markets
bullPromoting benefits of durability and reparability
Boosting CE engagement by strengthening
pro-environmental attitudes and
awareness
bullRecommendation 2 ndash Making repair easier
bullMaking essential components in a product replaceable
Including repair instructions for minor defects in user manuals
Ensure the availability of spare parts in the longer run
bullEncourage manufacturers to offer a commitment to repair
bullRecommendation 3 - Create financial incentives for reparability and durability
The importance of price quality
and convenience to
support a Circular
Economy
bullRecommendation 4 - Making durability and reparability information available
bullIntegrate durability and reparability information into labels
bullDevelop a scoring system for reparability of products
bullProvide information on spare parts and repair services
bullRecommendation 5 - Strengthened enforcement of legislation requiring provision of accurate information
Enhancing product
information on durability and
reparability
Behavioural Study on Consumersrsquo Engagement in the Circular Economy
185
The study found that many consumers have a preference for new and fashionable
products or generally a preference for owning new unused products Such preferences
can act as a barrier to second hand purchases and product leasing
As consumers are willing to engage in pro-CE behaviours but their perceptions about
repaired or second hand products are not very favourable improving consumer
awareness and providing information about the advantages of durable products and
product repair may be effective in addressing this lsquopreference for the new and unusedrsquo
Recommendation 1 ndash Boosting CE engagement by strengthening pro-
environmental attitudes and awareness
Environmental awareness and consumer attitudes towards environmental practices are
among the key determinants of sustainable consumer choices
From the study follow at least three specific areas of action which could be taken by
policy makers and industry
1 Boosting pro-environmental attitudes The survey and experiment have
shown that pro-environmental attitudes can translate into pro-environmental
behaviours Consumers with stronger self-rated pro-environmental attitudes were
also more likely to make pro-environmental choices in the incentivised
behavioural experiment as well as in reality Thus strengthening such attitudes
via awareness campaigns could boost further consumer engagement in the
Circular Economy Furthermore strengthening pro-environmental attitudes could
also enhance the effectiveness of information campaigns and point-of-sale
information on product durability and reparability (see Recommendation 4)
The stakeholder interviews pointed out that consumer education is indeed
important and should be more widely employed For example when discussing
clothing a representative of a Dutch consultancy firm considered that educating
consumers on the quality of garments would help them distinguish between more
and less durable products
One way Member States could promote awareness is by focussing on educating
young people by for example including environmental awareness
education within school curricula
2 Increasing consumer awareness of second hand rentingleasing and
repair markets The study identified that consumers are generally willing to
engage in Circular Economy practices but that their actual engagement might fall
short because of an unawareness of how to purchase second hand rent lease or
repair products
Recently there has been an increase in the number of Circular Economy initiatives
and information awareness campaigns platforms at EU and Member State level
An example of this is the European Circular Economy Stakeholder Platform and
several Circular Economy initiatives at national level Similar initiatives could
target more consumer engagement in second hand products renting leasing of
products and repair markets
Repair cafes have been set-up in various cities Self-repair by using for example
modular phones such as the lsquoFairphonersquo have come to consumersrsquo attention
However these types of initiatives are still niche rather than mainstream
Awareness raising about the benefits of second hand products renting leasing
and repair should continue to be promoted to reach wider consumer audiences
In addition to awareness raising programmes additional information on product
durability and reparability could be provided at the point of sale (see
Recommendation 4) Product information could also be provided on how repair
can be arranged and on the availability of spare parts (see Recommendation 2)
3 Promoting benefits of durability and reparability Quality and price were
found to be key factors for consumers when choosing to purchase a product In
the experiment when consumers were informed that durable and more easily
repairable products can save them money in the long-term this information was
effective in steering them towards products of higher durability and reparability
Behavioural Study on Consumersrsquo Engagement in the Circular Economy
186
Policy makers could consider using marketing and behavioural science
strategies (nudging) to improve consumer awareness about the benefits
of durable and easily repairable products This could be done for example
by linking durable and easily repairable products with lsquohigh-qualityrsquo and lsquocost-
savingsrsquo in the long-term Instilling such associations with durability and
reparability could alter social norms towards the purchase of more durable and
more easily repairable products However to make such claims robust evidence
supporting the truthfulness of the claims is required Provision of this evidence
may require additional research
Another option would be to encourage other stakeholders including
manufacturers to conduct these marketing and communication strategies Also
the Circular Economy could be incorporated into the list of funding instrument
priority topics for example within the LIFE Programme183
82 The importance of price quality and convenience in purchasing and
repair decisions
Although consumers attach significant value to the durability and reparability of a
product the productrsquos price and quality often remain key factors determining final
consumer choices From a consumer perspective the total cost of a product also includes
the effort needed to acquire a product repair buy or to rentlease it As a result
anything that changes the price-quality ratio via eg price or ease of accessing the
options in favour of product repairs second hand purchases and rentingleasing
products could be effective in increasing the uptake of these sustainable choices
The following two recommendations could be explored
Recommendation 2 - Making repair easier
The behavioural experiment has robustly shown how easily consumers shy away from
repairs when repairing requires more effort compared to replacing products Beyond
promoting the awareness of repair services (recommendation 1) there are also several
additional ways in which repairs could be stimulated across Europe The following options
could be explored
1 Making essential components in a product replaceable by consumers by
adapting existing legislation Often a product needs to be replaced or sent for
professional repair if an essential component such as for example the battery a
LED light or a motor becomes defective However the study found that there is
a substantial interest in self-repairs 12 of survey respondents have experience
with self-repair 37 consider themselves to be good at repairing and 26 of
respondents associate lsquoreparabilityrsquo with being able to self-repair the product
As such the possibility of making essential product components
replaceable by consumers could be explored For example Directive
200666EC on Batteries and Accumulators already contains requirements on the
removal of batteries for certain electrical and electronic equipment184 A similar
requirement for batteries as well as other components could be applied to
products more widely This could potentially be done in the context of
implementing existing legislation (for example the implementing regulations under
the Ecodesign Directive)
This would give consumers the option to replace for example a battery or
another lsquoeasy-to-replacersquo component and create more incentives for consumers
to repair Moreover it would likely also stimulate the demand for repairs by
professionals (manufacturers and independent repair services) This is because
183 The LIFE programme is the EUrsquos funding instrument for the environment and climate action For more information see httpeceuropaeuenvironmentlifeabout
184 Batteries should be readily removable by end-users or have the possibility to have them removed by ldquoqualified professionalsrdquo
Behavioural Study on Consumersrsquo Engagement in the Circular Economy
187
consumers already have a high willingness to have products repaired by third
parties but some struggle to determine whether products can be repaired at all
Such uncertainty could be reduced by designing products such that they are more
evidently built to be repaired
2 Regulation to include repair instructions for minor defects in user
manuals Still regarding self-repairs Manufacturers could include instructions on
how to self-repair minor product breakdowns in user manuals or on the
internet Industry-led guidance and best practice could encourage manufacturers
to provide this information to consumers
The possibility to self-repair would have to take into account the safety of such an
activity for a regular consumer which implies restrictions on what products and
issues can be repaired Repair instructions should be considered only for minor
repairs that do not require specific skills or qualifications
An alternative that could be considered is the provision of such a requirement
within existing regulations and legislation This option would make it mandatory
for manufacturers to provide self-repair guidance for certain products and
breakdown issues Existing legislation could be used such as the Ecodesign
Directive
3 Ensure the availability of spare parts in the longer run The availability of
spare parts is essential for products to be repaired Spare parts for older products
are often difficult to find in particular when production of that product has ended
One option policy makers could investigate is the possibility of requiring
companies to provide spare parts for a certain period of time (and also
even after the product has been discontinued) For example a similar legal
obligation has been introduced in France Decree No 2014-1482 requires
producers to provide information about the time period for which spare parts will
be available185
Findings from all strands of research of this study support this recommendation
The availability of spare parts was for example the strongest association
consumers had with a ldquorepairable productrdquo Moreover the literature review and
stakeholder consultations identified that manufacturers should be required to
guarantee cheaply available spare parts for longer periods of time
4 Encouraging manufacturers to offer a commitment to repair throughout
technical product lifetimes The study found that consumers are willing to pay
significantly more for durable products and that the provision of information on
product durability can encourage consumers to purchase more durable products
The study also highlighted that consumers have high levels of trust in
manufacturer guarantees and are more likely to attempt a repair if a product is
still under guarantee Policy makers could explore the idea of encouraging
manufacturers to offer a repair service to consumers throughout the
technical lifetime of a product Offering such services might increase product
sales prices If this were the case manufacturers who offer this extended repair
service may find it useful to point this out prominently This way and in line with
the experiment findings manufacturers who offer extended repair services might
see consumersrsquo willingness to pay for their products increase Manufacturers who
do not offer such services might benefit from offering lower prices and could be
attractive for consumers who do not value reparability Such transparency could
contribute to having a level playing field among manufacturers
The provision of easier access to repair across a productrsquos technical lifespan may
reduce consumersrsquo effort when it comes to product repair as well as their
uncertainty regarding whether repairing would be possible at all thereby
encouraging more repairs
185 BEUC 2015
Behavioural Study on Consumersrsquo Engagement in the Circular Economy
188
Recommendation 3 ndash Create financial incentives for reparability and durability
Potential cost savings were found to be a key determinant of consumer engagement in
the Circular Economy Therefore financial incentives that encourage the production and
consumption of durable products product repair and the leasing or renting of products
have the potential to promote the uptake of these behaviours by both manufacturers and
consumers However further research would be required to confirm that there is
sufficient price sensitivity in consumers for such stimuli to be effective
Possible financial incentives include (but are not limited to) tax reductions or
exemptions for durable goods leasingrenting services and repair services
This could also include incentives for companies to provide spare parts for products for a
set period time after production has been discontinued (recommendation 2) An example
of a tax scheme was introduced in Sweden in 2017 This scheme introduced a lower VAT
rate for repair services and is known as the ldquorepair bonusrdquo
83 Enhancing product information on durability and reparability
Another main conclusion from this study was that EU consumers currently lack
information on durability and reparability and would appreciate receiving better
information Indeed when this information was provided participants in the behavioural
experiment were significantly more likely to select durable products or products that
could be more easily repaired This implies that providing more information to
consumers about the durability and reparability of products is effective in
shifting demand towards products with better environmental credentials Policy
makers could consider exploring the following two recommendations
Recommendation 4 - Making durability and reparability information available at
the point of sale
Based on the study findings it is suggested that policy makers and manufacturers explore
possibilities on how to make durability and reparability information available at
the point of sale
There are several points to consider
bull Explore the possibility of integrating durability and reparability
information into existing product labels The European Commission could
explore integrating durability and reparability information into the EU Energy
Label or the EU Ecolabel For example icons indicating expected lifetimes or
durability commitments as tested in the experiment could be embedded into the
existing EU Energy Label The EU Energy Label may be more appropriate than the
EU Ecolabel This is because the Ecolabel has only a PASS FAIL scale The Energy
Label instead shows an A to G scale and allows a number of other relevant pieces
of informationicons to be included
bull Explore the possibility to develop new EU consumer rules that would
include the display of durability and reparability information on products
Since the existing EU Energy Label and EU Ecolabel may have their limitations in
terms of scope or effectiveness to introduce durability and reparability information
for a wider range of products there may be a need to develop new EU rules
Including durability and reparability information into existing or new product
information would possibly also alleviate consumer concerns regarding
planned or premature obsolescence practices
bull Examine the development of a scoring system for reparability of
products In 2018 the European Commission launched a study to analyse and
develop a potential scoring system to rate the ability to repair and - where
relevant - upgrade products The technical background resulting from the study
Behavioural Study on Consumersrsquo Engagement in the Circular Economy
189
may be used to set the framework and grounds for the development of a
graphical label for inclusion in product information as mentioned above186
bull Provide product information to consumers on the availability of spare
parts and repair services The study found that consumers were interested in
repair information at the point of sale Providing information on where spare parts
can be obtained and where potential repair services can be found could make
repair easier (see also Recommendation 2) Where feasible the information
should also provide the costs of parts and repair services
Industry guidance and best practice may be most appropriate for encouraging
manufacturers and retailers to provide this information Alternatively policy
makers industry and consumer organisations (at EU and national level) could
investigate if producers and retailers need to be required to inform consumers
about reparability by integrating such provisions into existing EU legislation (eg
within the implementing regulations under the Ecodesign Directive) The
importance of producers informing consumers about the availability of spare parts
was also highlighted by stakeholders in the interviews
Recommendation 5 ndash Strengthened enforcement of consumer legislation
requiring the provision of accurate information to consumers
The provision of product information at the point of sale was found to be effective at
changing purchasing choices The provision of information not only needs to be presented
in a way that consumers can understand and effectively use it in their decision-making
but information also needs to be correct For example the Unfair Commercial Practices
Directive (200529EC) aims to boost consumer confidence and enable national enforcers
to curb a broad range of unfair commercial practices Examples of unfair commercial
practices include providing untruthful information to consumers aggressive marketing
techniques as well as specific issues such as misleading environmental claims and unfair
planned obsolescence practices To ensure the accurate provision of information to
consumers at the point of sale continued and strengthened enforcement of national
consumer laws is of great importance to support consumers in their choices surrounding
engagement in the Circular Economy
84 Suggestions for further research
In this section proposed areas for further research to fill remaining evidence and
information gaps are provided
841 Remaining knowledge gaps on consumer behaviour in relation to
Circular Economy engagement
This study has revealed many meaningful insights on consumer engagement within the
Circular Economy Product quality and price tend to drive consumer decisions over and
above product durability and reparability Therefore in order to further investigate
consumer engagement in the Circular Economy the following could be explored
bull Test with consumers how quality- and price-related characteristics can promote or
hinder the purchase of more durable products
bull Study whether other important factors besides price and quality (eg the brand)
can act as a driver for consumers to buy products with higher
durabilityreparability
bull Investigate further to what extent expected innovations and product
improvements play a role in the importance that consumers attach to the
durability and reparability of their products
bull Examine further the drivers of consumersrsquo desire for new products This study
revealed that for a similar level of effort many consumers prefer a buying new
186 For more information see httpsusprocjrceceuropaeuScoringSystemOnReparabilityindexhtml
Behavioural Study on Consumersrsquo Engagement in the Circular Economy
190
products over second hand leased or repaired products even when the price of
second hand products or a repair were considerably lower than that of a new
product A question for further research is how to identify the reasons behind this
preference and investigate whether there are ways to influence this preference
842 Research gaps relevant to the development of policy instruments to
stimulate engagement of the consumer in the Circular Economy
There are a range of ways that policy makers can promote the engagement of consumers
in the Circular Economy Several policy recommendations have been made above based
on the findings of this study To ensure the effective implementation of these
recommendations further research is advised
How to best provide durability and reparability information at the point of sale
The provision of durability and reparability information can improve consumer
engagement in the Circular Economy However how information is presented is
extremely important in terms of consumersrsquo understanding and use of the information in
their decisions Therefore further research on how to best present durability and
reparability information would ideally be undertaken For example
bull Which iconssymbols are best understood and used by consumers
bull How does consumer understanding of durability and reparability change with
increasing complexity of the remaining product information In other words when
do information overload and cognitive limitations come into play leading to a
decline in consumer understanding and engagement
Consumer price sensitivity for repairs
This study has identified important drivers and barriers of consumersrsquo decisions to repair
products Consumers are less likely to repair when repairing requires more or even a
similar amount of effort compared to replacing And consumers seem to be more inclined
to repair when repairing is substantially cheaper than buying a replacement However
there is limited information on consumersrsquo price responsiveness to changes in the cost of
repairing products If price-based mechanisms were to be considered by policy makers to
further incentivise repairs this information would be important
Reducing other barriers to repair
Beyond assessing how sensitive consumers are to the price of repair generally making it
easier to repair products may go some way towards boosting repairs According to this
study some options to pursue could be to increase the availability of spare parts and to
provide consumers with the ability to self-repair more easily However these may not be
the only barriers to repair Other factors such as lack of trust in repaired products or the
desire for new products may continue to prevent people from choosing to repair
Further investigation into what drives consumer choice in this area and whether
improving ease of access to repair will increase the number of consumers who choose to
repair could be undertaken For example policy makers could consider running small-
scale pilot projects to test the effect of increased ease of repair on the frequency at
which consumers choose to repair products
Impact assessments of new policy toolsamendments of existing policy instruments
As mentioned before most of the recommendations developed in this study relate to
policy initiatives that are new which means experience with the impact of such policies is
limited or non-existent Also some of the suggested interventions can have far-reaching
effects on consumers manufacturers and retailers and it is therefore important to assess
whether the intended policy instruments are proportional effective and efficient An ex-
ante impact assessment should be conducted for all policy recommendations requiring a
legislative change Below we highlight some aspects to which particular attention should
be paid
To stimulate product repair Recommendation 2 suggests increased availability of spare
parts and repair services This recommendation also suggests encouraging
manufacturers to commit to repair during the entire technical lifetime of the product
However such measures could have repercussions for the costs of manufacturers and
Behavioural Study on Consumersrsquo Engagement in the Circular Economy
191
retailers and may have an impact on the final price for consumers Therefore it is
important to carefully assess the financial implications of such measures against
the potential benefits achieved
Another essential element that needs to be assessed is the environmental impact of
promoting product repair or the purchasing of more durable products It is
important that Circular Economy actions are a means to achieving lower environmental
impacts and do not become a goal in itself For some products it might be very beneficial
to use them for as long as possible as the environmental impact of the production phase
is large and the materials used in the product are hardly recycled For other products
especially products that consume a lot of energy during their use phase it might be more
beneficial to replace them earlier in their lifetime This is because the use phase has a
larger effect on the overall environmental impact than the production phase and new
products might be more energy efficient In such cases replacement could be preferable
over repair It is important that this kind of information is considered when designing
policy instruments that promote durability and reparability Therefore the environmental
impacts of promoting the durability and reparability of products should be tested for
different product categories (for example using a life-cycle assessment) so that policies
promoting durability and reparability are only applied to the cases where this leads to a
reduction in the overall product environmental footprint
Behavioural Study on Consumersrsquo Engagement in the Circular Economy
192
Glossary and definitions
Country codes
AT Austria
BE Belgium
BG Bulgaria
HR Croatia
CY Cyprus
CZ Czech Republic
DK Denmark
EE Estonia
FI Finland
FR France
DE Germany
EL Greece
HU Hungary
IE Ireland
IT Italy
LV Latvia
LT Lithuania
LU Luxembourg
MT Malta
NL Netherlands
PL Poland
PT Portugal
RO Romania
SK Slovakia
SI Slovenia
ES Spain
SE Sweden
UK United Kingdom
IS Iceland
NO Norway
Abbreviations used
Chafea Consumers Health Agriculture and Food Executive Agency
B2C Business-to-consumer
CE Circular Economy
DGs Directorate Generals
EC European Commission
IoT Internet of Things
NGO Non-governmental organization
OEF Organisation Environmental Footprint
P2P Peer-to-peer
PET Product Environmental Footprint
PSS Product-service-systems
Definitions
Circular Economy In a Circular Economy the value of products and materials is
maintained for as long as possible waste and resource use are
minimised and resources are kept within the economy when a
product has reached the end of its life to be used again and
again to create further value (see
httpseceuropaeugrowthindustrysustainabilitycircular-
economy_en)
Durability It was one of the study objectives to find out what consumers
Behavioural Study on Consumersrsquo Engagement in the Circular Economy
193
associate with the concept of lsquodurabilityrsquo
In the behavioural experiment the following definition was
attached to the durability icon used on mock-EU Energy and EU
Ecolabels
The period in which the manufacturer promises to
replace or repair the product free of charge
For the stakeholder consultations the following working
definition for ldquoDurability informationrdquo was used
Information about the averageexpected or minimum
lifespan of products before they defect or break
Reparability
It was one of the study objectives to find out what consumers
associate with the concept of lsquoreparabilityrsquo In the behavioural
experiment the following definition was attached to the
durability icon used on mock-EU Energy and EU Ecolabels
Ease-of-repair rating based on availability of repair
manuals spare parts and repair services
For the stakeholder consultations the following working
definition for ldquoReparability informationrdquo was used
All types of information that could be relevant to repair
products in case of a defect
Legal guarantee EU law (Directive 199944EC) stipulates that sellers are liable
to consumers for any lack of conformity (defect) that existed at
the time of delivery and becomes apparent with a 2-year period
(legal guarantee) In some countries national law provide for
longer periods for sellerrsquos liability
Commercial guarantee
(warranty)
Manufacturers retailers (or insurers) can offer consumers
commercial guarantees (warranties) in addition to the legal
guarantee of the seller of the goods These can either be
included in the price of the product or at an extra cost Such
warranties are without prejudice to the legal guarantee
Behavioural Study on Consumersrsquo Engagement in the Circular Economy
194
Bibliography
Abramovski et al(2017) lsquoRedistribution efficiency and the design of VAT a review of
the theory and literaturersquo Institute for Fiscal Studies Available at
httpswwwifsorgukuploadspublicationsbnsBN212pdf
ADEME (2014)a lsquoEvolutions du comportement des Franccedilais face au deacuteveloppement
de leacuteconomie circulaire Paris ADEMErsquo Available at
httpwwwademefrsitesdefaultfilesassetsdocumentsadm00013585_evolutions
_comportement_des_francais_face_au_developpement_economie_circulaire_juin_201
4pdf
ADEME (2014)b lsquoPerceptions et pratiques des franccedilais en matiegravere de reacuteemploi des
produitsrsquo Available at
httpswwwademefrsitesdefaultfilesassetsdocumentsetude-socio-reemploi-
2014-rapport-finalpdf
Adler L amp Hlavcek J D (1978) lsquoKey Repair Service Factors for Consumer Durable
Goods Journal of Marketing Researchrsquo 634-638 Available at
httpswwwjstororgstable3150636seq=1page_scan_tab_contents
AK Wien (2017) lsquoSmartphones are replaced more frequently than T-shirtsrsquo Available
at httpwwwakeuropaeu_includesmodsakeudocsmain_report_en_457pdf
Allcott (2011) lsquoSocial norms and energy conservationrsquo Journal of Public Economics
Available at
httpswwwsciencedirectcomsciencearticleabspiiS0047272711000478
Armstrong C M (2014) lsquoSustainable product-service systems for clothing exploring
consumer perceptions of consumption alternatives in Finlandrsquo Available at
httpswwwsciencedirectcomsciencearticlepiiS0959652614000596
Benthin R et al (2017) lsquoEnvironmental awareness in Germany 2016 ndash Results of a
representative population surveyrsquo Available at httpswwwconpolicydeennews-
detailenvironmental-awareness-in-germany-2016-results-of-a-representative-
population-survey
BEUC (2015) lsquoDurable goods More sustainable products better consumer rights -
Consumer expectations from the EUrsquos resource efficiency and Circular Economy
agendarsquo Available at httpwwwbeuceupublicationsbeuc-x-2015-
069_sma_upa_beuc_position_paper_durable_goods_and_better_legal_guaranteespd
f
Braitwate N Densley-Tingley D amp Moreno M (2015) lsquoShould energy labels for
washing machines be expanded to include a durability ratingrsquo Available at
httpirepntuacukideprint85461220134_PubSub2377_Morenopdf
Bruumlggenwirth B amp Witte E (2016) lsquoPersbericht Dossier Duurzaam Duurzaamheid
bij consument in de lift Maarssen b-openrsquo Available at
httpwwwdossierduurzaamnlCms_DataContentsDossierDuurzaamDBMediapdfs
Persbericht-Dossier-Duurzaam-2016_defpdf
Cerdaacute E amp Khalilova A (2015) lsquoEconomiacutea Circularrsquo Available at
httpwwwminetadgobesPublicacionesPublicacionesperiodicasEconomiaIndustrial
RevistaEconomiaIndustrial401CERDC38120y20KHALILOVApdf
Coffmann et al (2017) lsquoCan Social Information Affect What Job You Choose and
Keeprsquo American Economic Journal Applied Economics Available at
httpswwwaeaweborgarticlesid=101257app20140468
Cox J Herren S King G amp Knight T (2013) lsquoElectrical and electronic product
design product lifetimersquo Available at httpwwwbrooklyndhurstcoukelectrical-
and-electronic-product-design-product-lifetime-_271html
Della Vigna (2009) lsquoPsychology and Economics Evidence from the Fieldrsquo Journal of
Economic Literature Available at
httpswwwaeaweborgarticlesid=101257jel472315
Digital Europe (2017) lsquoThe contribution of the Digital Industry to repair
remanufacturing and refurbishment in a Circular Economyrsquo Available at
httpwwwdigitaleuropeorgDesktopModulesBring2mindDMXDownloadaspxCom
mand=Core_DownloadampEntryId=2397amplanguage=en-USampPortalId=0ampTabId=353
Deloitte (2017) lsquoExpert workshop towards increased repair of household EEErsquo
Dufwenberg Gaumlchter Henning-Schmitdt (2011) lsquoThe framing of games and the
psychology of playrsquo Games and Economic Behavior Available at
httpswwwsciencedirectcomsciencearticlepiiS0899825611000376
Behavioural Study on Consumersrsquo Engagement in the Circular Economy
195
Duvall L McIntyre K amp Opsomer T (2016) lsquoEmpowering Repairrsquo Available at
httpswwwellenmacarthurfoundationorgassetsdownloadsce100Empowering-
Repair-Final-Public1pdf
Economische en Sociale Raad (2015) lsquoAdvies Overgang van het Brussels
Hoofdstedelijk Gewest naar de kringloopeconomiersquo
European Economic and Social Committee (2016) lsquoThe Influence of Lifespan Labelling
on Consumersrsquo Brussels European Economic and Social Committee Available at
httpwwweesceuropaeuresourcesdocsqe-04-16-076-en-npdf
European Commission (2012) lsquoResearch on EU product label options - Study delivered
by Ipsos MORI London Economics and AEArsquo available at
httpseceuropaeuenergysitesenerfilesdocuments2012-12-research-eu-
product-label-optionspdf
European Commission (2013) lsquoCommission staff working document Impact
Assessment Accompanying the Commission Regulation implementing Directive
2009125EC and the Commission Delegated Regulation supplementing Directive
201030EUrsquo Brussels European Commission
European Commission (2013) lsquoReduced rates of VAT frequently asked questions
MEMO03149rsquo Available at httpeuropaeurapidpress-release_MEMO-03-
149_enhtmlocale=en
European Commission (2017) lsquoStudy on consumersrsquo decision-making in insurance
services A behavioural economics perspectiversquo Available at
httpspublicationseuropaeuenpublication-detail-publicationb86d7f2d-9e77-
11e7-b92d-01aa75ed71a1language-enformat-PDFsource-search
European Commission (2003) lsquoProposal for a Council Directive amending Directive
77388EEC as regards reduced rates of value added taxrsquo COM(2003) 397 final
Available at httpeceuropaeutransparencyregdocrep12003EN1-2003-397-
EN-F1-1Pdf
European Commission DG Environment (2014) lsquoScoping study to identify potential
Circular Economy actions priority sectors material flows and value chainsrsquo Available
at httpswwweesceuropaeuresourcesdocsscoping-studypdf
European Commission DG JUSTCivic Consulting (2017) lsquoStudy for the Fitness Check
of EU consumer and marketing lawrsquo Available at
httpspublicationseuropaeuenpublication-detail-publicationf7b3958b-772b-
11e7-b2f2-01aa75ed71a1language-en
European Commission DG JUSTGfK (2017) lsquoConsumer Market Study to support the
Fitness Check of Consumer Rulesrsquo Available at
httpeceuropaeunewsroomjustitem-detailcfmitem_id=59332
European Commission Joint Research Centre (2018) lsquoGuide for the Assessment of
Material Efficiency application to smartphonesrsquo Available at
httpsusprocjrceceuropaeuE4CdocsJRC_report_smartph_v23_CLEANpdf
European Commission Joint Research Centre (2017)a lsquoAnalysis of the Future
Direction and Policy Needs of European Industryrsquo Available at
httpseceuropaeujrccommunitiescommunity248about
European Commission Joint Research Centre (2017)b lsquoEcodesign and Energy Label
for Household Dishwashers Luxembourg Publications Office of the European Unionrsquo
Available at httppublicationsjrceceuropaeurepositoryhandleJRC106993
European Commission Joint Research Centre (2018)a Assessment of the reparability
and upgradability of TVs (Draft) retrieved from
httpsusprocjrceceuropaeuE4CdocsJRC_report_TV_repair_v2-2_CLEANpdf
European Commission Joint Research Centre (2018)b Guide for the Assessment of
Material Efficiency application to smartphones (Draft) retrieved from
httpsusprocjrceceuropaeuE4CdocsJRC_report_smartph_v23_CLEANpdf
European Environment Agency (2017) lsquoCircular by design Products in the Circular
Economyrsquo Available at
httpscirculareconomyeuropaeuplatformsitesdefaultfilescircular_by_design_-
_products_in_the_circular_economypdf
European Parliament (2016) lsquoCircular Economy package four legislative proposals on
wastersquo Available at httpwwweuroparleuropaeuEPRSEPRS-Briefing-573936-
Circular-economy-package-FINALpdf
Behavioural Study on Consumersrsquo Engagement in the Circular Economy
196
Experian (2014) lsquoAn estimate of the effects of a reduction in the rate of VAT on
housing renovation and repair work 2015 to 2020rsquo
Federal Environment Agency (2017) lsquoObsolescence - Political strategies for improved
durability of productsrsquo Available at
httpswwwumweltbundesamtdesitesdefaultfilesmedien376dokumente2017-
06-01_obsolescence_scientific_opinion_paper_german_environment_agencypdf
French Packaging Council (2014) lsquoPackaging amp Circular Economyrsquo Available at
httpscirculareconomyeuropaeuplatformsitesdefaultfilespackaging-and-
circular-economy-final-report-en-september-2014pdf
Fernandez V (2001) lsquoObservable and unobservable determinants of replacement of
home appliancesrsquo Available at
httpswwwsciencedirectcomsciencearticlepiiS0140988300000669
French Ministry of Ecology Sustainable Development and Energy (2014) lsquoLeacuteconomie
circulaire eacutetat des lieux et perspectivesrsquo Available at
httpwwwladocumentationfrancaisefrvarstoragerapports-publics154000005pdf
Haze B Overstreet R amp Jones-Farmer A (2011) lsquoThe role of ambiguity tolerance
in consumer perception of remanufactured productsrsquo Available at
httpwwwtandfonlinecomezproxyulbacbedoipdf102752175630611X1309168
8930453
ICF (2017) lsquoStudy on the costs and benefits of extending certain rights under the
Consumer Sales and Guarantees Directive 199994ECrsquo Available at
httpeceuropaeunewsroomdocumentcfmdoc_id=44803
Lakatos E-S Crisan O-A LakatosS D-G Bejan M (2017) lsquoParadigma economiei
circulare O provocare pentru orasul inteligent Available at
httpwwwagirrobuletine2847pdf
Larrick Soll (2008) lsquoThe MPG Illusionrsquo Science Available at
httpsciencesciencemagorgcontent32058831593
Leboucq V (2016) lsquoSEB promet de reacuteparer ses produits pendant dix ans Les Echosrsquo
Levin et al (1998) lsquoAll frames are not created equal A typology and critical analysis
of framing effectsrsquo Organizational Behavior and Human Decision Processes Available
at httpswwwsciencedirectcomsciencearticlepiiS0749597898928047
Liberman Samuels Ross (2004) lsquoThe name of the game predictive power of
reputations vs situational labels in determining Prisonerrsquos Dilemma game movesrsquo
Personality and Social Psychology Bulletin 30 Available at
httpjournalssagepubcomdoiabs1011770146167204264004
London Economics Ipsos amp AEA (2012) lsquoResearch on EU product label optionsrsquo
Available at httpseceuropaeuenergysitesenerfilesdocuments2012-12-
research-eu-product-label-optionspdf
London Economics amp Ipsos (2014) lsquoStudy on the impact of the Energy Label ndash and
potential changes to it ndash on consumer understanding and on purchase decisionsrsquo
Available at
httpseceuropaeuinfositesinfofilesimpact_of_energy_labels_on_consumer_beh
aviour_enpdf
London Waste and Recycling Board (2017) lsquoLondons Circular Economy Roadmap
London LWARBrsquo Available at httpwwwlwarbgovukwp-
contentuploads201504LWARB-LondonE28099s-CE-route-
map_16617a_singlepages_smlpdf
McCullough J (2009) lsquoFactors impacting the demand for repair services of household
products the disappearing repair trades and the throwaway societyrsquo Available at
httpsonlinelibrarywileycomdoiabs101111j1470-6431200900793x
McCullough J (2010) lsquoConsumer Discount Rates and the Decision to Repair or
Replace a Durable Product A Sustainable Consumption Issuersquo Available at
httpswwwjstororgstable40647716
Michaud C a (2011) lsquoGreen Consumer Behaviour an Experimental Analysis of
Willingness to Pay for Remanufactured Productsrsquo Available at
httpsonlinelibrarywileycomdoiabs101002bse703
OCU et al (2016) lsquoiquestCollaboration or business From value for users to a society with
valuesrsquo
Pijnenburg R (2014) lsquoInkoper als aanjager van circulaire economiersquo Available at
httpsmvonederlandnlsystemfilesmediawfg_wk7_p14-15pdf
Behavioural Study on Consumersrsquo Engagement in the Circular Economy
197
Ross Ward (1996) lsquoNaive realism in everyday life Implications for social conflict
and misunderstandingrsquo In Reed et al (Eds) Values and Knowledge
Salvia G Cooper T Fisher T Harmer L and Barr C (2015) lsquoWhat is broken
Expected lifetime perception of brokenness and attitude towards maintenance and
repairrsquo Available at httpirepntuacukideprint12817
SB Insight (2017) lsquoThe Nordic Market for Circular Economy a Report about Business
Leader and Consumer Views on Circular Economyrsquo Available at httpwwwsb-
insightcomcircular-economy
Schwarz (1999) lsquoSelf-reports How the questions shape the answersrsquo American
psychologist Available at
httppsycnetapaorgdoiLandingdoi=1010372F0003-066X54293
Smeesters D L (2003) lsquoConsumer Motivation to Recycle When Recycling is
Mandatory Two Exploratory Studies Tijdschrift voor Economie en Managementrsquo
Available at httpnsmn1uhedudgraurnivtheMPGIllusionpdf
SPF Santeacute publique Seacutecuriteacute de la chaicircne alimentaire et Environnement (2014) lsquoVers
une Belgique prionniegravere de leacuteconomie circulairersquo Available at
httpeconomiefgovbefrbinariesVers_une_Belgique_Pionniere_de_l_economie_cir
culaire_tcm326-259697pdf
Sunstein (2017) lsquoNudges that failrsquo Behavioural Public Policy Available at
httpswwwcambridgeorgcorejournalsbehavioural-public-policyarticlenudges-
that-fail8DE5FFFFB7DA5BE14F8DC1E3D2C0C0AA
Tansey R (2015) lsquoReduccioacuten de residuos el reciclaje no es suficiente para alcanzar
una economiacutea circular Madrid Amigos de la tierrarsquo Available at
httpswwwtierraorgwp-
contentuploads201507reduccion_residuos_economia_circularpdf
The Behavioural Insights Team (2015) lsquoEAST Four simple ways to apply behavioural
insightsrsquo available at httpwwwbehaviouralinsightscoukwp-
contentuploads201507BIT-Publication-EAST_FA_WEBpdf
The Scottisch Government (2016) lsquoMaking things last A Circular Economy strategy
for Scotland Edinburgh The Scottish Governmentrsquo Available at
httpwwwgovscotPublications2016021761downloadsres-1
TNS Political amp Social (2013) lsquoFlash Eurobarometer 367 Attitudes of Europeans
towards Building the Single Market for Green Productrsquo Brussels European
Commission Directorate-General for Communication Available at
httpeceuropaeucommfrontofficepublicopinionflashfl_367_enpdf
Tversky and Kahneman (1981) lsquoThe framing of decisions and the psychology of
choicersquo Science Available at httpsciencesciencemagorgcontent2114481453
UK Office for Fair Trading (2010) lsquoThe impact of price frames on consumer decision
makingrsquo Available at
httpwebarchivenationalarchivesgovuk20140402165040httpoftgovukshare
d_ofteconomic_researchOFT1226pdf
Umwelt Bundesamt (2017) lsquoDas Ecodesign-Kit als Lehrmaterial fuumlr Hochschulenrsquo
Available at
httpswwwumweltbundesamtdesitesdefaultfilesmedien1968dokumente07_k
ossolobow_das_ecodesign-kit_al_s_lehrmaterial_fur_hochschulenpdf
Verbraucherzentrale Bundesverband (2014) lsquoComprehensibility of the EU Energy
Label ndash Results of two focus groups and a representative consumer surveyrsquo Available
at httpswwwverbraucherzentrale-rlpdemedia231718A
Verbraucherzentrale Bundesverband (2017) lsquoVerbraucherbefragung Haltbarkeit und
Reparierbarkeitrsquo Berlin KANTAR EMNID Available at
httpwwwvzbvdesitesdefaultfilesdownloads20170601umfrage_-
_haltbarkeit_und_reparierbarkeit_von_produkten_o_gewaehrleistungpdf
Wang Y amp Hazen B (2016) lsquoConsumer product knowledge and intention to
purchase remanufactured productsrsquo Available at
httpwwwvzbvdesitesdefaultfilesdownloads20170601umfrage_-
_haltbarkeit_und_reparierbarkeit_von_produkten_o_gewaehrleistungpdf
Watson M (2008) lsquoA Review of literature and research on public attitudes
perceptions and behaviour relating to remanufactured repaired and reused productsrsquo
Available at httpwwwremanufacturingorgukpdfstory1p143pdf
Behavioural Study on Consumersrsquo Engagement in the Circular Economy
198
Westblom C (2015) lsquoTowards a Circular Economy in Sweden - Barriers for new
business models and the need for policy interventionrsquo Available at
httpluplubluseluurdownloadfunc=downloadFileamprecordOId=8170322ampfileOId=
8170379
Wieser H amp Troumlger N (2012) lsquoDie Nutzungsdauer und Obsolenz von
Gebrauchsguumltern im Zeitalter der Beschleunigung Vienna Arbeiterkammer Wienrsquo
Available at
httpsmediaarbeiterkammeratwienPDFstudienBericht_Produktnutzungsdauerp
df
Wilhelm W B (2012) lsquoEncouraging Sustainable Consumption through Product
Lifetime Extension The Case of Mobile Phonesrsquo Available at
httpijbssnetcomjournalsVol_3_No_3_February_20122pdf
WRAP (2012) lsquoValuing our clothes The true cost of how we design use and dispose
of clothing in the UKrsquo Available at
httpwwwwraporguksitesfileswrapVoC20FINAL20online2020122007
2011pdf-CEIP-report-Designing-for-a-Circular-Economypdf
WRAP (2013) lsquoElectrical and electronic product design product lifetimersquo Available at
httpwwwbrooklyndhurstcoukelectrical-and-electronic-product-design-product-
lifetime-_271html
WRAP (2017) lsquoSustainable clothing A practical guide to enhancing clothing durability
and qualityrsquo Available at httpwwwwraporguksustainable-textilesscapextending-
clothing-lifeguidessustainable-clothing-guide
Behavioural Study on Consumersrsquo Engagement in the Circular Economy
199
Behavioural Study on Consumersrsquo Engagement in the Circular Economy
200
Behavioural Study on Consumersrsquo Engagement in the Circular Economy
HOW TO OBTAIN EU PUBLICATIONS
Free publications
bull one copy
via EU Bookshop (httpbookshopeuropaeu)
bull more than one copy or postersmaps
from the European Unionrsquos representations (httpeceuropaeurepresent_enhtm)
from the delegations in non-EU countries
(httpeeaseuropaeudelegationsindex_enhtm)
by contacting the Europe Direct service (httpeuropaeueuropedirectindex_enhtm)
or calling 00 800 6 7 8 9 10 11 (freephone number from anywhere in the EU) () () The information given is free as are most calls (though some operators phone boxes or hotels may charge you)
Priced publications
bull via EU Bookshop (httpbookshopeuropaeu)
doi102818956512
EB-0
4-1
8-4
98-E
N-N