behind start of take-off roll aircraft sound level ... · pdf filebehind aircraft...
TRANSCRIPT

Behind Start of Take-off RollAircraft Sound Level Directivity Study – Revision 1 Final ReportApril 2015
Prepared for: Prepared by:National Aeronautics and Space Administration U.S. Department of TransportationLangley Research Center Research and Innovative Technology AdministrationStructural Acoustics Branch Division John A. Volpe National Transportation Systems CenterHampton, VA 23681-2199 Environmental Measurement and Modeling Division
Cambridge, MA 02142
U.S. Department ofTransportation
DOT-VNTSC-NASA-12-01NASA/TM-2012-217783
https://ntrs.nasa.gov/search.jsp?R=20150008957 2018-05-20T03:51:00+00:00Z

___________________________________________________________________________ i
Notice
This document is disseminated under the sponsorship of the Department of Transportation in the interest of information exchange. The United States Government assumes no liability for its contents or use thereof.
Notice
The United States Government does not endorseproducts or manufacturers. Trade or manufacturers’names appear herein solely because they areconsidered essential to the objective of this report.

___________________________________________________________________________ ii
REPORT DOCUMENTATION PAGE Form Approved OMB No. 0704-0188
Public reporting burden for this collection of information is estimated to average 1 hour per response, including the time for reviewing instructions, searching existing data sources, gathering and maintaining the data needed, and completing and reviewing the collection of information. Send comments regarding this burden estimate or any other aspect of this collection of information, including suggestions for reducing this burden, to Washington Headquarters Services, Directorate for Information Operations and Reports, 1215 Jefferson Davis Highway, Suite 1204, Arlington, VA 22202-4302, and to the Office of Management and Budget, Paperwork Reduction Project (0704-0188), Washington, DC 20503.
1. AGENCY USE ONLY (Leave blank) 2. REPORT DATE
April 2015 (revision to December 2012)
3. REPORT TYPE AND DATES COVERED
Final Report 4. TITLE AND SUBTITLE
Behind Start of Take-off Roll Aircraft Sound Level Directivity Study – Revision 1
5. FUNDING NUMBERS
VX83 - BS243, FA4SCD LTA596. AUTHOR(S)
Michael C. Lau, Christopher J. Roof, Gregg G. Fleming, Amanda S. Rapoza, Eric R. Boeker, David A. McCurdy, and Kevin P. Shepherd 7. PERFORMING ORGANIZATION NAME(S) AND ADDRESS(ES)
U.S. Department of Transportation Research and Innovative Technology Administration John A. Volpe National Transportation Systems Center Environmental Measurement and Modeling Division, RVT-41 Cambridge, MA 02142-1093
8. PERFORMING ORGANIZATION REPORT NUMBER DOT-VNTSC-NASA-12-01
9. SPONSORING/MONITORING AGENCY NAME(S) AND ADDRESS(ES) National Aeronautics and Space Administration Langley Research Center, Structural Acoustics Branch Mail Stop 463, Hampton, VA 23681-2199
10.SPONSORING/MONITORING AGENCY REPORT NUMBER
NASA/TM-2012-217783
11. SUPPLEMENTARY NOTES
NASA Program Managers: Kevin P. Shepherd, David A. McCurdy 12a. DISTRIBUTION/AVAILABILITY STATEMENT 12b. DISTRIBUTION CODE
13. ABSTRACT (Maximum 200 words) The National Aeronautics and Space Administration (NASA), Langley Research Center (LaRC) and the Environmental Measurement and Modeling Division of the United States Department of Transportation’s John A. Volpe National Transportation Systems Center (Volpe) conducted a noise measurement study to examine the sound level directivity pattern behind aircraft start-of-takeoff roll. This report discusses the procedures and methodologies used to measure and quantify data acquired from the Study. This is a revision to the December 2012 that addresses a rounding error in equation 4 (Section 5.4) and the supporting text in Section 5 and Appendix F.14. SUBJECT TERMS noise, aircraft noise, airport noise, behind start of take-off roll, aircraft directivity patterns, take-off roll noise, INM, Integrated Noise Model, AEDT, Aviation Environmental Design Tool, noise prediction, computer noise model
15. NUMBER OF PAGES
8916. PRICE CODE
17. SECURITY CLASSIFICATION OF REPORT Unclassified
18. SECURITY CLASSIFICATION OF THIS PAGE
Unclassified
19. SECURITY CLASSIFICATION OF ABSTRACT
Unclassified
20. LIMITATION OF ABSTRACT
NSN 7540-01-280-5500 Standard Form 298 (Rev. 2-89) Prescribed by ANSI Std. 239-18
298-102

Behind Start of Take-off Roll Sound Level Directivity Study Table of Contents
___________________________________________________________________________ iii
TABLE OF CONTENTS
1 INTRODUCTION ..................................................................................................................... 11.1 Background ..................................................................................................................... 11.2 Objective ......................................................................................................................... 3
2 SITE SELECTION AND LOGISTICS .................................................................................. 42.1 Candidate Airport Selection ............................................................................................ 4
2.1.1 Geographic Location ................................................................................................... 42.1.2 Airport Elevation ........................................................................................................ 42.1.3 Airport Fleet Mix ........................................................................................................ 42.1.4 Site Terrain, Near Runway ......................................................................................... 52.1.5 Site Terrain, Distant .................................................................................................... 92.1.6 Runway Configuration .............................................................................................. 102.1.7 Other Factors Considered ......................................................................................... 102.1.8 Site Selection Results ................................................................................................ 102.1.9 Meteorological Data.................................................................................................. 102.1.10 Selection of Study Airport .................................................................................... 11
2.2 Measurement Site Logistics .......................................................................................... 132.2.1 Primary Runway for Measurements ......................................................................... 132.2.2 Aircraft Departure Schedule ..................................................................................... 132.2.3 Preliminary Site Survey ............................................................................................ 16
3 INSTRUMENTATION ........................................................................................................ 173.1 Acoustic Instrumentation .............................................................................................. 17
3.1.1 Specifications ............................................................................................................ 183.1.1.1 NASA Acoustic Vans ........................................................................................... 183.1.1.2 Volpe Acoustic Measurement Systems ................................................................ 203.1.2 Locations ................................................................................................................... 20
3.2 Aircraft Tracking System .............................................................................................. 253.2.1 Specifications ............................................................................................................ 253.2.2 Locations ................................................................................................................... 26
3.3 Portable Weather Stations ............................................................................................. 263.3.1 Specifications ............................................................................................................ 263.3.2 Locations ................................................................................................................... 27
3.4 Tail Logging Instrumentation ....................................................................................... 273.4.1 Specifications ............................................................................................................ 273.4.2 Locations ................................................................................................................... 28
3.5 Other Instrumentation ................................................................................................... 283.5.1 Specifications ............................................................................................................ 293.5.2 Locations ................................................................................................................... 29
4 MEASUREMENT PROCEDURES ........................................................................................ 304.1 NASA Acoustic Vans ................................................................................................... 30
4.1.1 Deployment ............................................................................................................... 304.1.2 During Measurements ............................................................................................... 30
4.2 Volpe Acoustic Measurement Systems ........................................................................ 31

Behind Start of Take-off Roll Sound Level Directivity Study Table of Contents
___________________________________________________________________________ iv
4.2.1 Deployment ............................................................................................................... 314.2.2 During Measurements ............................................................................................... 31
4.3 Digital Video Tracking System .................................................................................... 314.3.1 Deployment ............................................................................................................... 314.3.2 During an Event ........................................................................................................ 32
4.4 Meteorological Station .................................................................................................. 324.4.1 Deployment ............................................................................................................... 324.4.2 During an Event ........................................................................................................ 32
4.5 Aircraft Tail Number Loggers ...................................................................................... 324.5.1 Deployment ............................................................................................................... 324.5.2 During an Event ........................................................................................................ 32
4.6 Test Director ................................................................................................................. 334.6.1 Deployment ............................................................................................................... 334.6.2 During an Event ........................................................................................................ 33
4.7 Communications ........................................................................................................... 354.8 Quality Assurance ......................................................................................................... 35
5 DATA REDUCTION AND ANALYSIS ............................................................................. 365.1 Data Reduction Process ................................................................................................ 38
5.1.1 Acoustic Data ............................................................................................................ 385.1.2 Aircraft Tail Numbers ............................................................................................... 395.1.3 Meteorological Data.................................................................................................. 395.1.4 Quality Assurance ..................................................................................................... 40
5.1.4.1 Take-off Roll Type ........................................................................................... 405.1.4.2 Line-of-Sight Blockage ..................................................................................... 405.1.4.3 Idling Aircraft and Terminal Noise ................................................................... 415.1.4.4 Data Collected at 1950 ft .................................................................................. 41
5.2 Deriving Directivity Patterns ........................................................................................ 425.2.1 Noise Metrics ............................................................................................................ 425.2.2 Normalizing Data to 285-Degrees ............................................................................ 45
5.3 Comparison of Newly Developed Patterns with AIR-1845 ......................................... 475.4 Proposed Updated Directivity Adjustment ................................................................... 545.5 Additional Directivity Investigations ............................................................................ 575.6 Case Studies .................................................................................................................. 60
5.6.1 Single Event Analysis ............................................................................................... 605.6.2 Airport Analysis ........................................................................................................ 64
6 CONCLUSIONS AND RECOMMENDATIONS ............................................................... 667 FUTURE RESEARCH ......................................................................................................... 67REFERENCES ............................................................................................................................. 68APPENDIX A: SUMMARY OF INSTRUMENTATION LOCATIONS .................................. 69APPENDIX B: TEST DIRECTOR LOG SHEET ....................................................................... 70APPENDIX C: TAIL NUMBER LOG SHEET .......................................................................... 71APPENDIX D: VOLPE NOISELOGGER SYSTEM SETUP .................................................... 72APPENDIX E: DIRECTIVITY PATTERNS AT 1950 FT ......................................................... 73APPENDIX F: AIRCRAFT FLEET PERCENTAGE FOR DIRECTIVTY ADJUSTMENT
DERIVATION ................................................................................................... 80

Behind Start of Take-off Roll Sound Levels Directivity Study List of Tables
___________________________________________________________________________ v
LIST OF TABLES
Table 1. Fleet Mix Rating Methodology........................................................................................ 5Table 2. IAD Runway Usage Data .............................................................................................. 13Table 3. Summary of Primary Instrumentation ........................................................................... 17Table 4. Totals for Recorded Departure Events........................................................................... 36Table 5. Totals for Turbo-Propeller Aircraft Events ................................................................... 36Table 6. Totals for Aircraft in the “Other” Category ................................................................... 37Table 7. Measured vs. INM-Modeled Comparison for a Microphone at 285-Degrees ............... 47Table 8. No. of Angular Offset Points which Exhibit Similarity between Aircraft ..................... 58Table 9. Horizontal Separation Distances between Engines ....................................................... 59Table 10. Modeled Noise Levels behind Take-off roll Using Current SOTR Adjustment ......... 61Table 11. Modeled Noise Levels behind Take-off roll Using Proposed SOTR Adjustment ...... 61Table 12. Difference in Modeled Noise Levels for Two Different SOTR Implementations
(Current – Proposed) ................................................................................................... 62Table 13. Difference in Modeled Noise Levels for Two Different
SOTR Implementations (Current – Proposed) at Three Different Airports ............... 64Table 14. Summary of Instrument Locations .............................................................................. 69Table 15. Test Director Log Sheet ............................................................................................... 70Table 16. Tail Number Log Sheet ................................................................................................ 71Table 17. Jet Aircraft Fleet Percentages for Directivity Adjustment Derivation ........................ 81

Behind Start of Take-off Roll Sound Level Directivity Study List of Figures
_____________________________________________________________________ vi
LIST OF FIGURES
Figure 1. Plots of Current Directivity Algorithm…………………………………………………2 Figure 2. Ideal Microphone Array ................................................................................................. 6Figure 3. Aerial Photo of Runway 35L at Austin-Bergstrom Airport ........................................... 7Figure 4. An Aerial Photo of Runway 1R at Dulles International Airport .................................... 8Figure 5. An Aerial Photo of Runway 9 at Tampa International Airport ...................................... 8Figure 6. Aerial Photo of Runway 17R at Austin-Bergstrom Airport ........................................... 9Figure 7. Airport Diagram of Dulles International Airport (IAD)............................................... 12Figure 8. Departure Flights at IAD During 10/1/03-10/7-03 ....................................................... 14Figure 9. Boeing 747 Departure Flights at IAD During 10/1/03-10/7-03 ................................... 15Figure 10. Airbus A340 Departure Flights at IAD During 10/1/03-10/7-03 ............................... 15Figure 11. NASA Acoustic Van 2, Designated as “Barth/72” .................................................... 19Figure 12. NASA Microphone System with Power Booster Box ............................................... 19Figure 13. Volpe Acoustic Measurement System........................................................................ 20Figure 14. Taxiway Turning Points Y, Z, Q on IAD Runway 30................................................ 21Figure 15. Local Cartesian Coordinate System Used on Runway 30 .......................................... 21Figure 16. Microphone Location Zones Behind Runway 30 ....................................................... 22Figure 17. Final Instrumentation Locations ................................................................................. 24Figure 18. Digital Video Tracking System .................................................................................. 25Figure 19. Transportable Automated Meteorological Station (TAMS) ....................................... 27Figure 20. Primary Tail Number Logger ..................................................................................... 28Figure 21. Differential Global Positioning System (dGPS) Receiver Antenna ........................... 29Figure 22. Measurement Schedule ............................................................................................... 30Figure 23. Task Sequence for Each Event ................................................................................... 34Figure 24. NDAT Software Program ........................................................................................... 38Figure 25. Maximum Wind Speeds during Measurement Days .................................................. 39Figure 26. Symmetrical Microphones N1 and V1 at 900 ft ......................................................... 41Figure 27. Mean LAE at 900 ft Microphone Locations for the Airbus A319 ............................... 42Figure 28. Comparison between Different Metrics Used to Process A320 Events ..................... 44Figure 29. Comparison between Different Metrics Used to Process B767 Events ..................... 44Figure 30. AIR-1845 Directivity Pattern at 900 ft ....................................................................... 45Figure 31. Directivity Pattern for the Airbus A319 at 900 ft ....................................................... 46Figure 32. Airbus A319 Directivity Pattern at 900 ft (16 Events) ............................................... 48Figure 33. Airbus A320 Directivity Pattern at 900 ft (48 Events) ............................................... 48Figure 34. Airbus A330 Directivity Pattern at 900 ft (4 Events) ................................................. 49Figure 35. Airbus A340 Directivity Pattern at 900 ft (5 Events) ................................................. 49Figure 36. Boeing 717 Directivity Pattern at 900 ft (3 Events) ................................................... 50Figure 37. Boeing 737 Directivity Pattern at 900 ft (20 Events) ................................................. 50Figure 38. Boeing 747 Directivity Pattern at 900 ft (7 Events) ................................................... 51Figure 39. Boeing 757 Directivity Pattern at 900 ft (12 Events) ................................................. 51Figure 40. Boeing 767 Directivity Pattern at 900 ft (27 Events) ................................................. 52Figure 41. Boeing 777 Directivity Pattern at 900 ft (12 Events) ................................................. 52Figure 42. McDonnell Douglas DC9 Directivity Pattern at 900 ft (23 Events) .......................... 53

Behind Start of Take-off Roll Sound Level Directivity Study List of Figures
_____________________________________________________________________ vii
Figure 43. Bombardier CL600 Directivity Pattern at 900 ft (104 Events) .................................. 53Figure 44. Turbo-Propeller Aircraft Directivity Pattern at 900 ft (14 Events) ............................ 54Figure 45. The Current and Proposed behind Start of Take-off Roll Directivity Adjustments ... 56Figure 46. The Differences between the Current and Proposed behind Start of Take-off Roll
Directivity Adjustments for Jet and Turboprop Aircraft ........................................... 57Figure 47. LAE Contours for the Boeing 737 Jet Aircraft with the Current and Proposed behind
Start of Take-off Roll Directivity Adjustments for Jet (70 to 85 dB LAE in 5 dBincrements) ................................................................................................................ 63
Figure 48. LAE Contours for the Beech 1900D Turboprop Aircraft with the Current and Proposed behind Start of Take-off Roll Directivity Adjustments for Turboprops (70 to 85 dB LAE in 5 dB increments) .............................................................................. 63
Figure 49. LDN Contours at Airport A2 with the Current and Proposed behind Start of Take-offRoll Directivity Adjustments (55 to 75 dB LDN in 10 dB increments) ..................... 65
Figure 50. Volpe NoiseLoggerTM System Setup.......................................................................... 72Figure 51. Airbus A310 Directivity Pattern at 1950 ft (1 Event) ................................................ 73Figure 52. Airbus A319 Directivity Pattern at 1950 ft (16 Events) ............................................. 73Figure 53. Airbus A320 Directivity Pattern at 1950 ft (48 Events) ............................................. 74Figure 54. Airbus A330 Directivity Pattern at 1950 ft (4 Events) ............................................... 74Figure 55. Airbus A340 Directivity Pattern at 1950 ft (5 Events) ............................................... 75Figure 56. Boeing 717 Directivity Pattern at 1950 ft (3 Events) ................................................. 75Figure 57. Boeing 737 Directivity Pattern at 1950 ft (20 Events) ............................................... 76Figure 58. Boeing 747 Directivity Pattern at 1950 ft (7 Events) ................................................. 76Figure 59. Boeing 757 Directivity Pattern at 1950 ft (12 Events) ............................................... 77Figure 60. Boeing 767 Directivity Pattern at 1950 ft (27 Events) ............................................... 77Figure 61. Boeing 777 Directivity Pattern at 1950 ft (12 Events) ............................................... 78Figure 62. McDonnell Douglas DC9 Directivity Pattern at 1950 ft (23 Events) ........................ 78Figure 63. Bombardier CL600 Directivity Pattern at 1950 ft (104 Events) ................................ 79Figure 64. Turbo-Propeller Aircraft Directivity Pattern at 1950 ft (14 Events) .......................... 79

Behind Start of Take-off Roll Sound Level Directivity Study Introduction
_____________________________________________________________________ 1
1 INTRODUCTION
The National Aeronautics and Space Administration (NASA), Langley Research Center(LaRC) and the Environmental Measurement and Modeling Division of the Departmentof Transportation’s Volpe National Transportation Systems Center (Volpe) conducted anoise measurement study to examine aircraft sound level directivity patterns behind thestart-of-takeoff roll. The study was conducted at Washington Dulles InternationalAirport (IAD) from October 4 through 20, 2004.
1.1 Background
The Society of Automotive Engineers (SAE) Aircraft Noise Committee (A-21) initiatedan activity to update the behind start of take-off roll algorithm in SAE AIR 1845, Procedure for the Calculation of Airplane Noise in the Vicinity of Airports1, which isbased on the 1980 report, Analysis of Selected Topics in the Methodology of theIntegrated Noise Model2. AIR-1845 is the foundation on which the Federal Aviation Administration’s (FAA) Integrated Noise Model (INM3, 4) is based, as well as otheraircraft noise prediction models. The INM, first released in 1978, is a software programdesigned to model noise in the vicinity of airports. It will be replaced by the FAA’s nextgeneration of environment modeling tool; the Aviation Environmental Design Tool(AEDT), which is currently under development. Both AEDT and INM model take-offnoise using two parameters; (1) aircraft- and operation-specific noise data; and (2) a fleet-average behind start of take-off roll (SOTR) directivity adjustment. The aircraft andoperation-specific noise data consist of noise-power-distance (NPD) data and one-thirdoctave-band spectral data for each aircraft in the INM/AEDT database that are routinelyupdated by aircraft manufacturers and acoustic consultants, and have been strictly vettedthrough a verification and validation process. The SOTR directivity adjustment was notaircraft-specific, and it was based on now out-of-date aircraft fleet data.
The current SOTR directivity adjustment is represented in the following equations:
(1)
(2)
The SOTR directivity adjustment is 0.0 dB for azimuth angles between 0 and 90 degrees,and is symmetrical on either side of the aircraft. The current SOTR directivityadjustment is shown in Figure 1. The graphic presents aircraft sound level datacorrections to be applied during SOTR as a function of polar angle and distance behind the aircraft. The pattern shows a “notch” of decreased sound level directly behind theaircraft which smoothes out as a function of distance behind SOTR. Note also that thedirectivity pattern is symmetrical about the axis defined by the aircraft fuselage.
4.14890For32 000047173.0015147.0553.144.51ADJDIR
1804.148For32 000044193.00045545.05802.218.339ADJDIR

Behind Start of Take-off Roll Sound Level Directivity Study Introduction
_____________________________________________________________________ 2
Figure 1. Plots of Current Directivity Algorithm
In INM/AEDT the SOTR directivity adjustment is applied to the noise levels associatedwith the first segment of an aircraft departure according to the azimuth angle behind theaircraft. It is also applied to noise from aircraft run-up operations. In addition, asmoothing algorithm is applied to the noise levels for receivers at distances behind thestart of take-off roll greater than 2500 ft.
The current algorithm is based on measurements of older-generation, low by-pass ratioaircraft, primarily configured with fuselage-mounted engines. Since most modern jetaircraft are configured with wing-mounted engines, which tend to have higher by-passratios as well as operate at higher thrust levels, measurements to collect updated datawere needed to better represent modeling of the current and anticipated future aircraftfleet. Additionally, directivity data for 4-engine commercial jet aircraft (which waslimited to a single 747 event in the 1980 study), as well as propeller-driven aircraft wereneeded.
In October 2004, the National Aeronautics and Space Administration (NASA), LangleyResearch Center (LaRC), with support provided by the Volpe National Transportation Systems Center (Volpe), conducted a study at Dulles International Airport (IAD) toupdate the directivity algorithm in AIR-1845. In conjunction with the joint NASA/VolpeBehind Start of Take-off Roll study, the FAA’s Partnership in Aviation Noise and Emissions Reduction (PARTNER) Center of Excellence (COE) conducted asimultaneous low frequency noise study at IAD. The low frequency noise study wasdesigned to determine the effects of aircraft take-off noise on nearby structures as well asto study thrust reverser noise5. Although the NASA/Volpe and COE study sharedinstrumentation and ultimately utilized some of the same data, this report focuses on theNASA/Volpe study.

Behind Start of Take-off Roll Sound Level Directivity Study Introduction
_____________________________________________________________________ 3
1.2 Objective
The objective of the joint NASA/Volpe study was to modernize the behind start of take-off roll sound level directivity algorithm in AIR-1845. This was accomplished by conducting field measurements at one or more large U.S. airports with a large variety ofaircraft, analyzing the data to confirm and/or update the AIR-1845 algorithm, and recommending updated algorithms, potentially dependent on several variables, includingaircraft-type.

Behind Start of Take-off Roll Sound Level Directivity Study Site Selection and Logistics
_____________________________________________________________________ 4
2 SITE SELECTION AND LOGISTICS
2.1 Candidate Airport Selection
A total of 983 U.S. commercial airports were evaluated as potential measurement sites.In selecting candidate sites, several key factors were considered, including airportoperations, fleet mix, runway configuration, and practical field measurementconsiderations, e.g., geographic location, accessibility and site terrain. Note that eachfactor has an associated set of benefits and/or detriments. For example, to minimizecontamination from other aircraft, airports with a single runway might be consideredideal. The tradeoff in this example case would be the likely decrease in overall airportoperations (and possibly fleet mix) due to the existence of only a single runway. Toselect appropriate candidate airports for measurements, key factors and tradeoffs wereevaluated. This section presents a list of prioritized, candidate measurement sites and themethodology used to identify these sites. Based on the considerations documentedherein, the goal was to identify at least ten candidate airports.
In selecting potential measurement sites, characteristics of each airport were examinedand evaluated. These characteristics, which were used to narrow the list of potentialmeasurement sites, include:
1. Geographic Location 2. Airport Elevation 3. Airport Fleet Mix4. Site Terrain5. Runway Configuration 6. Meteorological Conditions7. Other Factors (i.e., NASA acoustic van accessibility, runway usage, etc.)
2.1.1 Geographic Location
Airports in Alaska and Hawaii were removed from the list of potential measurement sitesto minimize obvious travel and logistical costs.
2.1.2 Airport Elevation
Airports at elevations of greater than 2,000 ft were removed from the list of potential sitesto minimize the effect of altitude on aircraft performance.
2.1.3 Airport Fleet Mix
Airport fleet mix data were obtained by querying departure operations for 2003 from theOfficial Airline Guide (OAG) schedule. Fleet mix was examined for each airport. Threemain types of aircraft were considered in rating airport fleet mix, starting with the highestpriority: 1) Large commercial jet aircraft with wing-mounted engines such as the Boeing 737 and Airbus A320; 2) Large commercial jet aircraft with fuselage-mounted engines

Behind Start of Take-off Roll Sound Level Directivity Study Site Selection and Logistics
_____________________________________________________________________ 5
such as the McDonnell Douglas DC9; and 3) Four engine commercial jet aircraft andmiscellaneous aircraft, such as the Boeing 747, Airbus A340, Embraer and BombardierCanadair Regional Jet. Consideration was also given to airports with a wide variety ofturboprop operations. Fleet mix for each airport was then evaluated and rated using thefollowing method:
Table 1. Fleet Mix Rating Methodology
Priority Aircraft Category Rating Points
High Large jet aircraft with wing-mounted engines
Excellent 9 Average 6 Poor 3
Medium Large jet aircraft withfuselage-mounted engines
Excellent 6 Average 4 Poor 2
LowFour engine jet aircraft and
miscellaneous aircraft,including turboprops
Excellent 3 Average 2 Poor 1
Points for each category were then totaled to obtain an overall fleet mix score. Airportsthat were considered to have high fleet mix scores were selected for final screening.
After considering fleet mix and removing airports due to elevation and geographiccriteria, candidate airports were reduced to 48.
2.1.4 Site Terrain, Near Runway
Figure 2 presents ideal microphone locations, relative to a conceptual runway end, forbehind start of take-off roll measurements. In general, the most complete microphonearray would be located at the 1,000 ft radial. Fifteen microphones, each separated by 15 degrees, would be positioned along the 1,000 ft radial as shown in the illustration.

Behind Start of Take-off Roll Sound Level Directivity Study Site Selection and Logistics
_____________________________________________________________________ 6
Figure 2. Ideal Microphone Array
Candidate measurement sites that allowed for the placement of microphones along aradial of approximately 1,000 ft behind the runway were considered acceptable.Additionally, an unimpeded line of sight from the microphone arc to the start of therunway was desired.

Behind Start of Take-off Roll Sound Level Directivity Study Site Selection and Logistics
_____________________________________________________________________ 7
Using USGS aerial photos of the 48 candidate airports and a modified version of standardGeographic Information Systems (GIS) software, a semi-circle of 1,000 ft radius wassuperimposed on the start of each candidate runway. Figure 3 presents a representativephoto for Runway 35L at Austin-Bergstrom Airport.
Figure 3. Aerial Photo of Runway 35L at Austin-Bergstrom Airport
The semi-circle behind the runway represents the nominal microphone line. The areawithin the semi-circle was visually surveyed for obstructions such as buildings, parking lots, heavy vegetation, bodies of water, and noticeable changes in elevation. This wasdone for runway ends at each of the remaining 48 candidate airports. This process alsorevealed other sources of practical problems, including highways, roadways, cross-runways and taxiways in close proximity.
Figure 4 shows an example of what was considered to be an ideal measurement site. Thearea behind the runway is obstacle free within a 1,000 ft radius and does not appear tohave other noise sources in the immediate vicinity.

Behind Start of Take-off Roll Sound Level Directivity Study Site Selection and Logistics
_____________________________________________________________________ 8
Figure 4. An Aerial Photo of Runway 1R at Dulles International Airport
Figure 5 shows a runway that was eliminated as a potential measurement site, given theclose proximity of a major roadway, building and what appears to be a parking lot.
Figure 5. An Aerial Photo of Runway 9 at Tampa International Airport

Behind Start of Take-off Roll Sound Level Directivity Study Site Selection and Logistics
_____________________________________________________________________ 9
2.1.5 Site Terrain, Distant
The need to quantify the directivity characteristics, as a function of increasing source-to-receiver distance, necessitated the addition of microphones at locations on semicircles2,000 to 4,000 ft behind the runway. As depicted in Figure 2, nine microphones, alsoseparated by 15 degrees, would ideally be utilized at 2,000 ft in order to help quantifyaircraft directivity characteristics as a function of distance. “Centerline” microphoneswould also be placed directly behind the aircraft at approximately 1,500, 3,000 and 4,000 ft to further quantify the distance dependence. Accordingly, red semi-circles with radiiequal to the 2,000 and 4,000 ft distances were superimposed on runway-end aerialphotographs as shown in the example in Figure 6.
Figure 6. Aerial Photo of Runway 17R at Austin-Bergstrom Airport
As with the 1,000 ft semi-circle (in yellow), areas within the red semi-circles werevisually inspected for obstructions. However, the entire area within the red semi-circlesdid not necessarily have to be obstruction free. As seen in Figure 2, microphones wereonly anticipated for placement at limited positions along the 2,000 ft semi-circle and atcenterline locations at 1,500 ft, 3,000 ft and 4,000 ft. Only areas where microphoneswere planned for deployment were evaluated. Depending on the results obtained at 1000 ft, it was hypothesized that the data measured on one half of the 2,000 ft semicircle couldbe “reflected” over the centerline axis, if necessary i.e., the directivity pattern issymmetrical to the left and right side of the aircraft.
After completing an aerial photo analysis of the local terrain at near and distant runwayends, 18 additional airports were eliminated, leaving 30 potential candidate sites.

Behind Start of Take-off Roll Sound Level Directivity Study Site Selection and Logistics
_____________________________________________________________________ 10
2.1.6 Runway Configuration
Any candidate airport runway that had another runway within a 5,000 ft arc behind it waseliminated because of: 1) potential noise contamination from aircraft on the crossrunway, 2) the inability to place microphones on the cross runway, and 3) the inability torun cables across the cross runway. Airports were then grouped by number of eligiblerunways, where fleet mix scores were re-evaluated in the final selection of candidateairports. Although particular runways were eliminated, none of the 30 candidate airportswere removed from the list.
2.1.7 Other Factors Considered
Due to their ability to collect 10 channels of time-synchronized acoustic data, the NASAacoustic vans were considered strong candidates for use in the measurement study. Thevans, however, require a measurement site that is free of roadways, runways, and taxiways, to facilitate cable runs between the vans and microphones. Microphonesystems at locations the NASA vans cannot access were to be instrumented with Volpeportable acoustic measurement systems.
It was also necessary to evaluate airport operations data to determine runway usagespecific to departures. The OAG data do not provide runway usage information, simplytotal airport operations. It was possible for a candidate runway to be used mainly foraircraft arrivals, which would make the runway less desirable for this study. Thereforeindividual airport tower logs were needed.
2.1.8 Site Selection Results
Airports were ranked by fleet mix and number of eligible runways. The top ten candidateairports for measurements were as follows:
1. Seattle-Tacoma International (SEA), Washington 2. Cincinnati/Northern Kentucky (CVG), Kentucky 3. Dulles International (IAD), Washington D.C.4. Portland International (PDX), Oregon 5. Orlando International (MCO), Florida6. Minneapolis-St. Paul International (MSP), Minnesota7. Raleigh-Durham International (RDU), North Carolina8. Kansas City International (MCI), Missouri9. Indianapolis International (IND), Indiana10. Charlotte/Douglas International (CLT), North Carolina
2.1.9 Meteorological Data
In general, outdoor acoustic measurements require minimal winds in the vicinity of themeasurement site. Accordingly, meteorological data were obtained and evaluated for thetop ten candidate airports. Surface meteorological data for the years 1984, 1989, and

Behind Start of Take-off Roll Sound Level Directivity Study Site Selection and Logistics
_____________________________________________________________________ 11
1992 were downloaded from an EPA website6. The data provided hourly averaged wind speeds throughout the year. The wind data for the three years were then averaged.Results showed that winds at the ten airports were relatively similar. None of thecandidate airports were eliminated as a result of the wind speed data.
2.1.10 Selection of Study Airport
In the above list of candidate airports, IAD was considered the preferred choice, givenVolpe’s familiarity with the airport due to recent measurements, the team’s knowledge ofkey personnel at IAD, and Langley’s relatively close proximity to the airport.

Behind Start of Take-off Roll Sound Level Directivity Study Site Selection and Logistics
_____________________________________________________________________ 12
Figure 7. Airport Diagram of Dulles International Airport (IAD)
Behind Start of Take-off Roll Sound Level Directivity Study Site Selection and Logistics
_____________________________________________________________________ 13
2.2 Measurement Site Logistics
2.2.1 Primary Runway for Measurements
Subsequent to approval from airport management to conduct the study, furthercommunication with appropriate personnel, specifically IAD Air Traffic Control (ATC)was conducted. The purpose of the communications was to gather information regarding runway usage as discussed in Section 2.1.7. Information on airport traffic operations atIAD (Table 2) led to the conclusion that Runway 30 would be the target runway formeasurements. These data suggest that the majority of aircraft take-off operations occuron Runway 30.
Table 2. IAD Runway Usage Data
Condition How often (rarely, sometimes, mostly) ?
1L 1R 19L 19R 12 30
Landing to the North (high departures demand) mostly L L/T x x x TLanding to the North (high arrivals demand) mostly L L TLanding to the South (high arrivals demand) mostly L/T L LLanding to the South (high departures demand) mostly T L x TLanding to the South (winds prohibit 30 departs.) sometimes L/T L/T x xLanding to the North (strong NW winds) rarely x L L/TLanding to the North (strong NW winds) rarely x x L/TLanding to the South (strong E-SE winds) extremely rare x x L/T
T = Take-offL = Landingx = not used
Dulles International Airport Traffic Operations
2.2.2 Aircraft Departure Schedule
IAD airport operations data for a week in October were obtained from the 2003 OAGschedule. The data, presented in Figure 8 suggest that peak operations occur during thetime blocks of 8:00-10:00, 12:00-14:00, 16:00-18:00, and 20:00-22:00. Operations dataobtained from Federal Aviation Administration's System for assessing Aviation’s GlobalEmissions (SAGE)7 showed generally consistent trends in departure operations.Observations during the preliminary site survey (described in the next Section) alsoconfirmed the overall trend.

Behind Start of Take-off Roll Sound Level Directivity Study Site Selection and Logistics
_____________________________________________________________________ 14
0
100
200
300
400
500
600
700
0:00-2:00 2:00-4:00 4:00-6:00 6:00-8:00 8:00-10:00 10:00-12:00
12:00-14:00
14:00-16:00
16:00-18:00
18:00-20:00
20:00-22:00
22:00-24:00
Time
Num
ber o
f Dep
artu
es
Figure 8. Departure Flights at IAD During 10/1/03-10/7-03
Wing-mounted 4 engine aircraft were of particular interest in the study. Figure 9 indicates that IAD generally has a small number of Boeing 747 departures. Figure 10 also shows a small number of flights for the Airbus A340. The majority of the wing-mounted, 4 engine aircraft departures in October (i.e., the planned month for the study)occurred during the time period of 16:00 to 22:00.

Behind Start of Take-off Roll Sound Level Directivity Study Site Selection and Logistics
_____________________________________________________________________ 15
Figure 9. Boeing 747 Departure Flights at IAD During 10/1/03-10/7-03
Figure 10. Airbus A340 Departure Flights at IAD During 10/1/03-10/7-03
0
1
2
3
4
5
6
7
8
9
10
0:00-2:00 2:00-4:00 4:00-6:00 6:00-8:00 8:00-10:00 10:00-12:00
12:00-14:00
14:00-16:00
16:00-18:00
18:00-20:00
20:00-22:00
22:00-24:00
Time
Num
bero
fFlig
hts
0
1
2
3
4
5
6
7
8
9
10
0:00-2:00 2:00-4:00 4:00-6:00 6:00-8:00 8:00-10:00 10:00-12:00
12:00-14:00
14:00-16:00
16:00-18:00
18:00-20:00
20:00-22:00
22:00-24:00
Time
Num
ber o
fFlig
hts

Behind Start of Take-off Roll Sound Level Directivity Study Site Selection and Logistics
_____________________________________________________________________ 16
As a result of these findings, measurements were targeted for the time periods of 8:00 to14:00 or 12:00 to 18:00. The specific time period for each measurement day was chosendepending on meteorological conditions e.g., if more suitable weather was forecast in theevening hours then measurements that day would be scheduled for the 12:00 to 18:00 time period. Measurements were not conducted after 18:00 because of the inability touse the aircraft video tracking system (described in Section 3.2) and to identify aircrafttail numbers.
2.2.3 Preliminary Site Survey
A preliminary site survey was conducted prior to measurements to identify siteinstrumentation locations behind Runway 30 at IAD (see Section 3.1.2). Coordinates ofthe microphone array were saved onto a laptop computer and used with a differentialGlobal Positioning System (dGPS, described Section 3.5) to locate the predeterminedcoordinates to within a few inches. Once the locations were found, a short stake withsurveying tape was fixed to the ground for easy identification during deployment.

Behind Start of Take-off Roll Sound Level Directivity Study Instrumentation
_____________________________________________________________________ 17
3 INSTRUMENTATION
The primary instrumentation used during measurements is listed in Table 3. For clarity, instrumentation specifications and locations are described in more detail in Sections 3.1 through 3.5. Measurement procedures are described in Section 4. A detailed layout ofthe instrumentation used in the study can be found in Appendix A. Angle, X and Ycoordinates of the instrumentation locations are based on the local Cartesian coordinatesystem as described in Section 3.1.2
Table 3. Summary of Primary Instrumentation
Instrumentation Quantity Responsible Organization Purpose Comments
DGPS System 1 Volpe Survey of instrumentation locations
In addition to maps and aerial photos, the dGPS system was used to survey the location of instrumentation to an accuracy of better than a meter
Acoustic Vans 2 NASA Collection of acoustic data
Microphone system (up to 10 microphones per van)
Portable Acoustic System
8 Volpe Collection of acoustic data
Portable microphone system
Digital Video Tracking System
2 Volpe Tracking of aircraft position and acceleration profile
This system will define the break release point, liftoff point and acceleration profile
Portable Weather Station: TAMS
System
1 Volpe Collection of position-specific meteorological data
This information will supplement the airport tower meteorological data and allow for a much more detailed definition of meteorological
3.1 Acoustic Instrumentation
Acoustic instrumentation used during measurements consisted of a combination ofNASA and Volpe microphone systems.
The NASA microphone system consisted of two separate vans for acoustic dataacquisition. NASA Van 1, designated as GMC/19, was deployed to collect data fromnine microphones in the 900 ft array and the centerline microphone at 1350 ft. NASAVan 2, designated as Barth/72 (Figure 11), was deployed to collect data from sixmicrophones in the 1950 ft array, two microphones at 2500 ft, and one microphone at3450 ft Portable Volpe acoustic measurement systems were deployed to facilitate datacollection at remote locations.

Behind Start of Take-off Roll Sound Level Directivity Study Instrumentation
_____________________________________________________________________ 18
3.1.1 Specifications
3.1.1.1 NASA Acoustic Vans
Each of the NASA acoustic vans were outfitted with a Digital Acquisition MeasurementSystem (DAMS) capable of collecting ten independent channels of acoustic data. Foreach channel of the system, the signal was digitized at the microphone, transmitted viacable to the van, multiplexed with time and test run information, and then recorded on ahard disk drive. The sample rate at each microphone was 25 kHz with the anti-aliasingfrequency set at 12.5 kHz. The data were transferred from the hard disk drive to a PC forsignal processing. The digital acoustic time domain data were transformed to thefrequency domain at one second intervals using the average of eleven 4096-point fastFourier transforms (FFTs) with a Hamming window and 50 percent overlap applied, resulting in 0.983-second blocks of data. These FFTs were used to compute narrowbanddata, which were converted to 1/3-octave band data. The processed data were stored on digital video disks (DVD) for later off-line reduction and analysis.
The NASA microphones were the Bruel and Kjaer (B&K) Model 4134. These arecondenser microphones requiring a polarization voltage. The polarization voltage wassupplied by either a B&K Model 2669 or 2619 preamplifier in conjunction with amodified version of the B&K Model 2804 power supply. Battery powered booster boxes,consisting of a transceiver in and a transceiver out, provided polarization voltage tomicrophones at far distances. Digitization of the acoustic signal was performed using aBurr-Brown Model ADC 76KG A-to-D converter. A B&K Model 0238 3.5 inch (9 cm)diameter foam windscreen was placed atop each microphone to reduce the effects ofwind-generated noise on the microphone diaphragm. Microphones were installed on tripods at a height of 4 ft above ground level (Figure 12).

Behind Start of Take-off Roll Sound Level Directivity Study Instrumentation
_____________________________________________________________________ 19
Figure 11. NASA Acoustic Van 2, Designated as “Barth/72”
Figure 12. NASA Microphone System with Power Booster Box

Behind Start of Take-off Roll Sound Level Directivity Study Instrumentation
_____________________________________________________________________ 20
3.1.1.2 Volpe Acoustic Measurement Systems
The Volpe acoustic measurement system is a specialized measurement system, whichmay be used to conduct unattended, long-term (30+ days) and continuous 1/3-octaveband noise measurements in outdoor environments. The system is designed to becompact, light, rugged, and can run for 96 hours with external battery power, orcontinuously with solar panels, thus, making the system able to store significant amountsof data. The system uses G.R.A.S. Model 40 AE or Model 40AQ ½-inch electretmicrophones and is powered by a G.R.A.S. Model PRM902 preamplifier. A B&K Model0237 3.5 inch (9 cm) diameter foam windscreen was placed atop each microphone. Eachmicrophone is interfaced to a Larson Davis Model 824 real-time analyzer/sound levelmeter. Data are stored on an Itronix Husky Fex21 handheld computer. The system alsoincludes a FT Technologies Model 702 ultrasonic anemometer to measure wind speedand direction. The output of the anemometer is also stored on the handheld computer.The system collected 1/3-octave acoustic data along with wind speed and direction dataat 1-second intervals. Both the microphones and anemometers were installed on tripodsat a height of 4 ft above the local ground surface (Figure 13). Appendix D displays inmore detail a diagram of the Volpe acoustic measurement system set up.
Figure 13. Volpe Acoustic Measurement System
3.1.2 Locations
Runway 30 has three taxiway turning points (Y, Z, Q in Figure 14). The turning pointused for the majority of take-offs is crucial since it would be ideal to define the origin ofthe microphone array based on the location of the start of take-off roll for the majority of

Behind Start of Take-off Roll Sound Level Directivity Study Instrumentation
_____________________________________________________________________ 21
operations. IAD air traffic control indicated that taxiway turning point Q is used mostfrequently during departures.
Figure 14. Taxiway Turning Points Y, Z, Q on IAD Runway 30
As a result, a local Cartesian coordinate system (x, y, z) was established with the origin(0, 0, 0) at 300 ft from the end of Runway 30, where aircraft taxiing from turning point Qwere observed to begin take-off roll. The centerline of Runway 30 was designated as thex-axis such that positive x values increase throughout the ground roll.
Figure 15. Local Cartesian Coordinate System Used on Runway 30
Local coordinates were calculated for the corresponding microphone locations depictedin Figure 2. Coordinates for alternate microphone locations were also calculated in casea site survey led to some revisions of microphone locations e.g., a new location wasnecessary if the preferred location was obstructed from view of the runway. As a result

Behind Start of Take-off Roll Sound Level Directivity Study Instrumentation
_____________________________________________________________________ 22
of this precaution, “zones” of where microphones could be placed were superimposedonto an aerial photograph of Runway 30. Figure 16 shows a range of potentialmicrophone locations. The semicircle zones are 200 ft wide and are centered at 1,000, 2,000, and 4,000 ft radii from the origin.
Figure 16. Microphone Location Zones Behind Runway 30
The primary and a set of alternate coordinates were then saved onto a laptop computerand used in conjunction with dGPS to identify and mark instrumentation positions (seeSection 2.2.3). The microphone location zones proved useful when a site surveydiscovered unforeseen terrain complications and obstructions at 1000 and 2000 ft. The1000 and 2000 ft radials were moved to 900 and 1950 ft, respectively. A taxiway at theleft side of the arc on Runway 30 disallowed the placement of microphones at 90 and 105 degrees. The microphone at 900 ft and 135 degrees, designated as N2, was placed in alocation with an approximate 5 ft depression. Line-of-sight blockage was observed at

Behind Start of Take-off Roll Sound Level Directivity Study Instrumentation
_____________________________________________________________________ 23
this location. As a precaution, an additional microphone, N2A, was placed at 900 ft and 140 degrees, which did not have line-of-sight blockage.
As mentioned in Section 2.1.5, centerline microphones were to be ideally placed directlybehind the aircraft at approximately 1,500, 3,000 and 4,000 ft to quantify the drop-off insound level. However, to assist the FAA PARTNER COE low frequency noise study, the3,000 ft centerline microphone was moved to a location at 3,600 ft. As a result, the 4,000 ft centerline microphone was moved to 4,600 ft. An additional centerline microphonewas also added at 2,600 ft. The resulting IAD, Runway 30-specific microphone setup isshown in Figure 17.

Behind Start of Take-off Roll Sound Level Directivity Study Instrumentation
_____________________________________________________________________ 24
Figure 17. Final Instrumentation Locations

Behind Start of Take-off Roll Sound Level Directivity Study Instrumentation
_____________________________________________________________________ 25
3.2 Aircraft Tracking System
A digital video tracking system was used to determine location of the aircraft brakerelease point, point of lift-off and aircraft acceleration profile. The system utilized thelocal Cartesian coordinate system discussed in the previous Section. The X, Y, and Zposition of the aircraft must be known to track the aircrafts’ movement on the runway. The assumption that the aircraft followed the runway centerline during take-off rollindicated that the Y-coordinate would be at a constant value of zero. The digital videotracking system is capable of defining the X and Z coordinates of the aircraft during take-off roll.
Figure 18. Digital Video Tracking System
3.2.1 Specifications
The digital video tracking system uses two Canon Optura digital video cameras. Thecameras have a 720 by 480 pixel Charged Couple Device (CCD) and create a videoimage stored on the mini-DV tape medium. Installed on the cameras are Kenko wide-angle lenses (Model VC-050Hi), which allow for a usable viewing angle ofapproximately 60 degrees.
For determination of an aircraft acceleration profile, the tracking system required a timecoordination sub-system. The time coordination sub-system is comprised of a TrueTimetime code generator (Model 705-326), a laptop computer, and a LED box mounted in

Behind Start of Take-off Roll Sound Level Directivity Study Instrumentation
_____________________________________________________________________ 26
view of the camera. The basic principle of the timing coordination system is that forevery tracked object, the exact time of all the frames in both cameras must be known. Toaccomplish this, DOS software was developed and installed onto a laptop computer tocommunicate with the TrueTime time code generator and LED box. The DOS softwareinstructs the time code generator to send a precisely known timing pulse to the LED box. When the time code generator receives the signal, a voltage is sent to the LED box, theLED illuminates, and the camera captures this image. The DOS software records thetime at which the timing pulse is sent to the LED box.
Optical targets are manually placed in the field of view of the cameras. Each cameramust have two targets in its field of view during the entire event of interest. One target,referred to as the Direct Target, determines the pitch and yaw of the camera relative tothe coordinate system. The other target, referred to as the Angle Target, is used togetherwith the Direct Target to determine the roll of the camera relative to the coordinatesystem. An important feature of the system is that the cameras can be rotated betweenevents of interests - as long as two targets are in view of the camera, the system softwarecan determine the roll, pitch and yaw of the camera. The Optical Targets are 2 ft squareplywood boards with alternating 1 ft black and white squares on one side and a supportand mounting structure on the other side. The Optical Targets are designed to mount on top of standard consumer-grade photography tripods. When mounted, the OpticalTargets were two to three feet above the ground.
3.2.2 Locations
A digital video tracking system camera (TRACK1 in Figure 17) was placed atapproximately 1100 ft from the southern side of Runway 30’s centerline. TRACK1captured the aircraft at its brake release point within its field of view. A second digitalvideo tracking system camera (TRACK2) was placed approximately 2500 ft from thenorthern side of Runway 30. This setup allowed a combined field of view of about 5,500 ft of the runway allowing the cameras to capture the entire take-off roll profile and lift-offpoints for the majority of aircraft types.
3.3 Portable Weather Stations
3.3.1 Specifications
A Qualimetrics Transportable Automated Meteorological Station (TAMS) was used tomeasure wind speed, wind direction, relative humidity, and air temperature at one-secondintervals. A complete TAMS system consists of a sensor unit and a control/display unitthat displays real time meteorological data. The battery-powered stations are portableand well suited for remote sampling. Wind speed can be measured from a stall speed of 2 mph, to a maximum of 55 mph, with an accuracy of 1 mph or 5% of range (whichever isgreater) and a resolution of 1 mph. Wind direction can be measured a full 360 degreeswith a root mean standard error of 18 degrees and a resolution of 10 degrees.Temperatures can be measured from –9 to 110 degrees Fahrenheit with an accuracy and resolution of 1 degree. Relative humidity is accurate to within 3%, with a resolution of

Behind Start of Take-off Roll Sound Level Directivity Study Instrumentation
_____________________________________________________________________ 27
1%. The unit was placed on a tripod at a height of 4 ft. Data from the control unit isautomatically saved onto a Hewlett Packard Model 200LX palmtop computer.
Figure 19. Transportable Automated Meteorological Station (TAMS)
3.3.2 Locations
TAMS was positioned at the Test Director’s location (TD/ TL in Figure 17) so that windspeeds could be monitored before and during an event. The Test Director was able toeasily determine if an event was good/no good based on pre-determined wind speedcriteria.
3.4 Tail Logging Instrumentation
3.4.1 Specifications
Standard binoculars were used to log tail numbers during measurements. Aircraft tailnumbers, event start/stop times, event identification, aircraft and engine types werehandwritten onto a log sheet (see sample in Appendix C).
Behind Start of Take-off Roll Sound Level Directivity Study Instrumentation
_____________________________________________________________________ 28
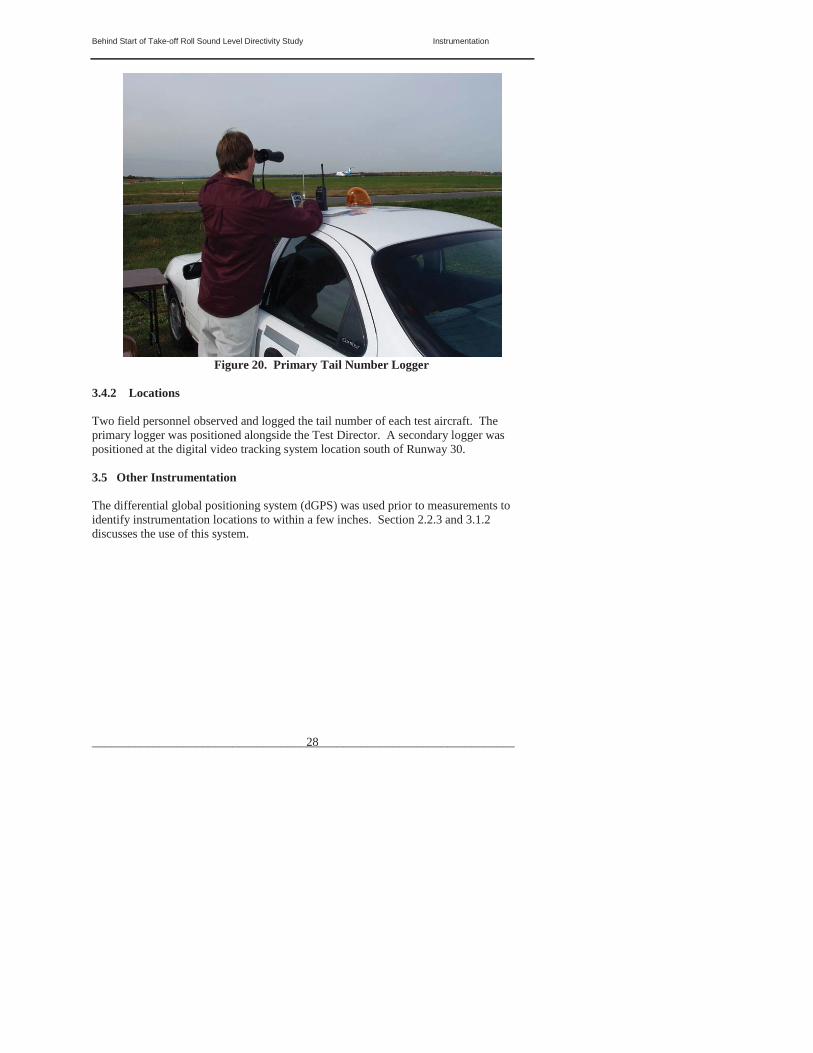
Figure 20. Primary Tail Number Logger
3.4.2 Locations
Two field personnel observed and logged the tail number of each test aircraft. Theprimary logger was positioned alongside the Test Director. A secondary logger waspositioned at the digital video tracking system location south of Runway 30.
3.5 Other Instrumentation
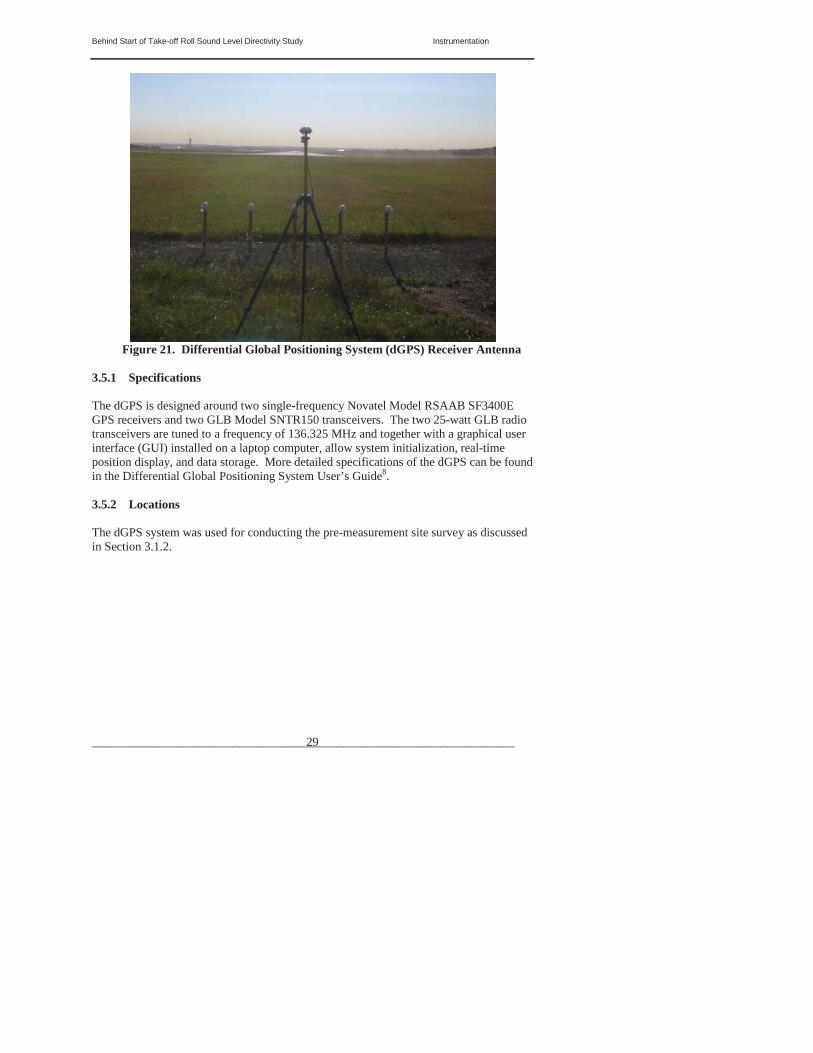
The differential global positioning system (dGPS) was used prior to measurements toidentify instrumentation locations to within a few inches. Section 2.2.3 and 3.1.2 discusses the use of this system.
Behind Start of Take-off Roll Sound Level Directivity Study Instrumentation
_____________________________________________________________________ 29
Figure 21. Differential Global Positioning System (dGPS) Receiver Antenna
3.5.1 Specifications
The dGPS is designed around two single-frequency Novatel Model RSAAB SF3400EGPS receivers and two GLB Model SNTR150 transceivers. The two 25-watt GLB radiotransceivers are tuned to a frequency of 136.325 MHz and together with a graphical userinterface (GUI) installed on a laptop computer, allow system initialization, real-timeposition display, and data storage. More detailed specifications of the dGPS can be found in the Differential Global Positioning System User’s Guide8.
3.5.2 Locations
The dGPS system was used for conducting the pre-measurement site survey as discussedin Section 3.1.2.

Behind Start of Take-off Roll Sound Level Directivity Study Measurement Procedures
_____________________________________________________________________ 30
4 MEASUREMENT PROCEDURES
The following section describes the procedures for a typical day of measurements.Measurements took place during October 2004 and consisted of 10 days of datacollection. Figure 22 below summarizes the measurement schedule.
Figure 22. Measurement Schedule
4.1 NASA Acoustic Vans
4.1.1 Deployment
Prior to measurements each day, a calibration tone comprised of a sine wave of 124 dB at250 Hz was applied to each NASA microphone and the resultant signal was recorded.White noise was then passed through the system and also recorded. The system clockswere automatically time synchronized using GPS. The Test Director was notified oncecalibration was complete and that the acoustic vans were standing by for data collection.
4.1.2 During Measurements
When the Test Director announced the event number and “data on” (see Section 4.6.2)over 2-way radio, data collection commenced on both NASA acoustic vans. Fieldpersonnel from the vans recorded the event number. Real time data were monitored tomake certain systems functioned normally and to detect potential contamination. At theend of each measurement day, the same calibration tone used at the beginning of the daywas applied to the microphones and recorded to ensure the system’s input sensitivity hadnot changed.
Behind Start of Take-off Roll Sound Level Directivity Study Measurement Procedures
_____________________________________________________________________ 31
4.2 Volpe Acoustic Measurement Systems
4.2.1 Deployment
Prior to measurements each day, a calibration tone comprised of a sine wave of 94 dB at1 kHz was applied to each portable acoustic system and the resultant signal was recorded.A microphone simulator, used to measure the noise floor of the system, was then appliedto the system and recorded. The system clocks were then synchronized. Timesynchronization was accomplished using a digital wristwatch, synchronized to theTrueTime time code generator used in the digital video tracking system (Section 3.2.1).Data acquisition began upon completion of calibration and time synchronization. TheTest Director was then notified that calibration was complete and measurements with theportable acoustic systems had been initiated.
4.2.2 During Measurements
The portable acoustic measurement system recorded data continuously from deploymentuntil the end of the measurement day. During periods where no measurements weremade (e.g., when aircraft did not depart from Runway 30), functionality of the systemswas periodically checked. These quality assurance checks consisted of a power check,cable connection check, and data recording check. At the end of the measurement day, the same calibration tone used at the beginning of the day was applied to each portableacoustic measurement system and recorded to ensure the system’s input sensitivity hadnot changed.
4.3 Digital Video Tracking System
4.3.1 Deployment
Prior to measurements, a manual survey of the vertical positioning of the cameras andoptical targets was completed. Using a transit (and its associated tripod and leveling devices) and a measuring stick, the vertical positions of the cameras and targets weremeasured. Measured positions were noted in a log sheet to be used for latter dataprocessing.
At the beginning of each measurement day, camera systems were set up, heights of thecenter of the camera lens and targets were measured, and the clock on each camera waschecked to ensure the correct time was displayed. The system laptop computer and theTrueTime time code generator were then set-up and the LED indicator was tested forfunctionality. Upon completion of deployment and testing, the Test Director was notifiedthat deployment was complete and the Digital Tracking System was ready for datacollection.

Behind Start of Take-off Roll Sound Level Directivity Study Measurement Procedures
_____________________________________________________________________ 32
4.3.2 During an Event
When the Test Director transmits over two-way radio that an event was about to begin,camera operators immediately used the DOS program (see Section 3.2.1) to send an LEDsignal to the cameras. Operators confirmed the LED indicators and entered the eventnumber into the laptop computer. The laptop computer automatically logged the timeassociated with the LED indicator.
4.4 Meteorological Station
4.4.1 Deployment
The TAMS meteorological system was set up at the Test Director’s location. The systemclock was synchronized using a TrueTime time code generator. The TAMS unit begancollecting data immediately after the system was deployed.
4.4.2 During an Event
The TAMS system recorded data continuously from deployment until the end of themeasurement day. Real time wind speed was also displayed on the control unit. TheTest Director used the TAMS system as a guide to help judge whether an event wasgood/no good due to wind speeds. As recommended by AIR 1845, any event in whichthe wind speed exceeded 15 knots (approximately 18 mph) was considered no good.
4.5 Aircraft Tail Number Loggers
4.5.1 Deployment
Prior to measurements both tail number loggers positioned themselves in a location thatprovided clear view of the aircraft tail numbers. Once both loggers were in position, theTest Director was notified.
4.5.2 During an Event
During an event, both tail loggers noted the event start time, which was when the TestDirector announced, “data on.” The tail loggers also recorded the end time, event ID, tailnumber, airline, number of engines, body type, engine configuration, starting point (seeSection 3.1.2), and type of take-off roll (see paragraph below) onto log sheets. The tailnumber loggers noted their best guess of the aircraft type as well. An example of the log sheet is included in Appendix C.
There were three types of start of take-off roll: rolling, static, and continuous as follows:
A rolling start occurred when the aircraft reached the runway end to initiate take-off and came to a full stop. Brakes were then released and engine run-up began.The aircraft begins its ground roll as engine power was spooled up. In this

Behind Start of Take-off Roll Sound Level Directivity Study Measurement Procedures
_____________________________________________________________________ 33
scenario the aircraft may not achieve take-off thrust until several hundred feetdown the runway as a result of the engines’ spool-up time. This was the mostcommon type of take-off roll.A static start occurred when the pilot applied full take-off power, holding theaircraft brakes until take-off power was achieved, then released the brakes andinitiated ground roll. In this scenario, take-off power was achieved closer to theend of the runway. This was more common for larger aircraft such as the Boeing 747 and 777.The third type of take-off roll, continuous, occurred when the aircraft approachedthe runway but did not come to a full stop. Engine run-up was noticed midwayduring the aircraft’s turn onto the runway. The aircraft remained in motion fromthe turning point and throughout the entire ground roll. In this scenario theaircraft may not achieve take-off thrust until several hundred feet after alignmenton the runway, due to the combination of the aircraft moving and the engines’spool-up time.
There was a considered possibility that the take-off roll type could affect thecharacteristics of a directivity pattern. As a result, the tail number loggers noted the typeof take-off roll for each event.
4.6 Test Director
4.6.1 Deployment
The position of the Test Director was chosen to be in the vicinity of the end of Runway30 where a potential event could be spotted and external contamination could be mosteasily judged. This location was also far enough away from the microphones to avoidexternal contamination of the data.
Prior to deployment, the Test Director synchronized his watch with the TrueTime GPStime code generator. Communications with field personnel at all systems were facilitatedby the Test Director to determine when all systems were deployed and ready for datacollection. Once the Test Director acknowledged all systems are ready, a 2-way radiobroadcast was sent to field personnel informing them that all systems are “go” and measurements were to commence.
4.6.2 During an Event
The Test Director announced twice to all field teams, via 2-way radio, the start of anevent and the event number. The Test Director then watched and listened for externalnoise contamination during the event. The director also monitored the wind speed in realtime via the TAMS meteorological system. If the event was deemed “no good” (due topotential external contamination or high wind speeds), the Test Director broadcast thismessage to all field personnel. The Test Director also noted in the log sheet (included inAppendix B), the event ID, start and end times, average wind speed, idling aircraft inclose proximity to the event aircraft, and any comments on external noise.

Behind Start of Take-off Roll Sound Level Directivity Study Measurement Procedures
_____________________________________________________________________ 34
Figure 23 below summarizes the task sequence during an event.
Turn on acousticinstrumentation for
recording
Begin recording, activateLEDs, and confirm LEDs
have lit properly
Record aircraft tail numberand event number
Potential Event Sighted Before Event After EventDuring Event
Test Director Annouce event number andevent time twice,
hand log event numberevent time, average windspeed, and nearby idling
aircraft
Note event time andevent number
Enter in event number inlaptop
Note the event time, airline,number of engines, engineconfiguration, aircraft type,
and starting point
Watch and listen forexternal contamination to
determine if event is good/no good
Continue recording,maintain radio silence
Ensure digital cameras arerecording,
maintain radio silence
Maintain radio silence
Repeat event number,declare event is good/no
good, hand log anycomments on potentialcontamination and also
issues on field equipment
Confirm event number,turn off acousticinstrumentation,
report to test directorcontamination/
instrumentation issues
Confirm event number, stoprecording on cameras,report to test director
contamination/instrumentation issues
Confirm event number,report to test director
contamination/instrumentation issues
Announce incomingpotential event
TestDirector
NASAAcoustic
Vans
VideoTrackingSystem
Tail NumberLoggers
Figure 23. Task Sequence for Each Event

Behind Start of Take-off Roll Sound Level Directivity Study Measurement Procedures
_____________________________________________________________________ 35
4.7 Communications
Person-to-person communication within individual organizations was facilitated using Nextel 2-way radios. Event information and group broadcasts were facilitated using 2-way CB radios. During an event, there were no radio communications, unless the TestDirector deemed the event “no good.”
4.8 Quality Assurance
Throughout field measurements, logs were maintained for each system. For example,calibration data were not only recorded by the system, but also manually included in fieldlogs. Field logs also contained information on file names, measurement times on eachfile, the dates and times of measurements and event numbers. To help supplement thefield logs, field photography, diagrams, and maps were used.
Special attention was given to detecting external contamination. Test directors noted any noise sources, e.g., overhead aircraft, construction and airport vehicles that couldpotentially contaminate an event. Times when the potential contamination eventoccurred were also noted.
For all instrumentation, raw data were backed up as appropriate at the end of eachmeasurement day to prevent loss of data.
Behind Start of Take-off Roll Sound Level Directivity Study Data Reduction and Analysis
_____________________________________________________________________ 36
5 DATA REDUCTION AND ANALYSIS
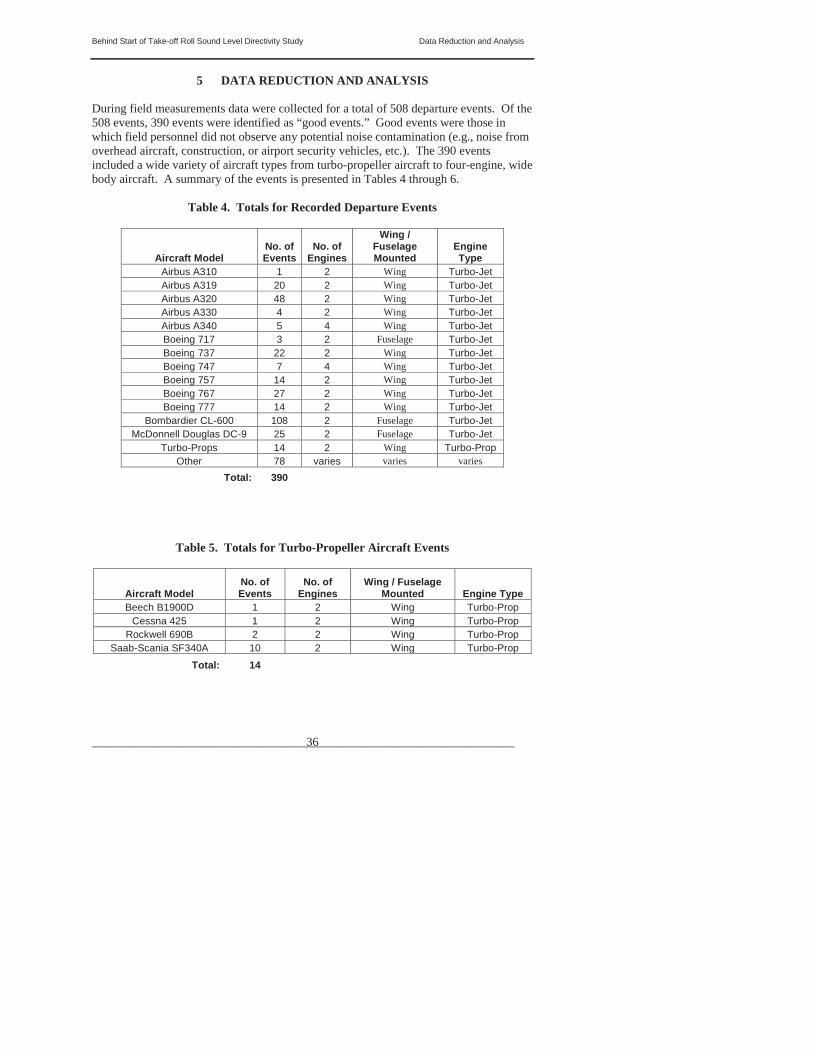
During field measurements data were collected for a total of 508 departure events. Of the508 events, 390 events were identified as “good events.” Good events were those inwhich field personnel did not observe any potential noise contamination (e.g., noise fromoverhead aircraft, construction, or airport security vehicles, etc.). The 390 eventsincluded a wide variety of aircraft types from turbo-propeller aircraft to four-engine, widebody aircraft. A summary of the events is presented in Tables 4 through 6.
Table 4. Totals for Recorded Departure Events
Aircraft Model No. ofEvents
No. ofEngines
Wing /FuselageMounted
EngineType
Airbus A310 1 2 Wing Turbo-Jet Airbus A319 20 2 Wing Turbo-JetAirbus A320 48 2 Wing Turbo-Jet Airbus A330 4 2 Wing Turbo-Jet Airbus A340 5 4 Wing Turbo-Jet Boeing 717 3 2 Fuselage Turbo-Jet Boeing 737 22 2 Wing Turbo-JetBoeing 747 7 4 Wing Turbo-Jet Boeing 757 14 2 Wing Turbo-Jet Boeing 767 27 2 Wing Turbo-Jet Boeing 777 14 2 Wing Turbo-Jet
Bombardier CL-600 108 2 Fuselage Turbo-Jet McDonnell Douglas DC-9 25 2 Fuselage Turbo-Jet
Turbo-Props 14 2 Wing Turbo-PropOther 78 varies varies varies
Total: 390
Table 5. Totals for Turbo-Propeller Aircraft Events
Aircraft ModelNo. ofEvents
No. ofEngines
Wing / FuselageMounted Engine Type
Beech B1900D 1 2 Wing Turbo-Prop Cessna 425 1 2 Wing Turbo-Prop
Rockwell 690B 2 2 Wing Turbo-Prop Saab-Scania SF340A 10 2 Wing Turbo-Prop
Total: 14

Behind Start of Take-off Roll Sound Level Directivity Study Data Reduction and Analysis
_____________________________________________________________________ 37
Table 6. Totals for Aircraft in the “Other” Category
Aircraft Model No. ofEvents
No. ofEngines
Wing-mounted / Fuselagemounted Engine Type
Hildebrand Glaster 1 1 Nose ReciprocatingP Z L Koliber 150A 1 1 Nose Reciprocating
Cessna 310Q 1 2 Wing ReciprocatingPiper PA-31-235 Navajo 1 2 Wing Reciprocating
Piper PA-31-350 1 2 Wing ReciprocatingBAE 125 SERIES 800A 4 2 Fuselage Turbo-Jet
BAC 1-11 419/EP 1 2 Fuselage Turbo-Jet Cessna 560XL 1 2 Fuselage Turbo-Jet
Cessna 560 1 2 Fuselage Turbo-Jet Cessna 750 3 2 Fuselage Turbo-Jet
Dassault FALCON 20 1 2 Fuselage Turbo-Jet Dassault FALCON 2000 1 2 Fuselage Turbo-Jet
Embraer EMB-135 1 2 Fuselage Turbo-Jet Embraer EMB-135KL 1 2 Fuselage Turbo-Jet
Embraer EMB-145 2 2 Fuselage Turbo-Jet Embraer EMB-145LR 19 2 Fuselage Turbo-Jet Embraer EMB-145XR 1 2 Fuselage Turbo-Jet
Grumman G-1159 1 2 Fuselage Turbo-Jet Gulfstream G-1159A 2 2 Fuselage Turbo-Jet
Gulfstream G-IV 5 2 Fuselage Turbo-Jet Gulfstream G-V 1 2 Fuselage Turbo-Jet
Hawker Siddely 125 SERIES 700A 1 2 Fuselage Turbo-Jet
Israel Aircraft 1124A 1 2 Fuselage Turbo-Jet Israel Aircraft G-200 1 2 Fuselage Turbo-Jet
Lear Jet 24D 1 2 Fuselage Turbo-Jet Lear Jet 45 1 2 Fuselage Turbo-JetLear Jet 55 1 2 Fuselage Turbo-Jet Lear Jet 60 2 2 Fuselage Turbo-Jet
McDonnel Douglas MD-88 4 2 Fuselage Turbo-Jet Raytheon 400A 2 2 Fuselage Turbo-Jet
Dassault FALCON 900 EX 1 3 Fuselage Turbo-Jet Dassault FALCON 900B 3 3 Fuselage Turbo-Jet
Dassault MYSTERE-FALCON 50 3 3 Fuselage Turbo-Jet Vickers VC-10 1 4 Fuselage Turbo-Jet
DORNIER 328-300 4 2 Wing Turbo-Jet Embraer ERJ 170-100 1 2 Wing Turbo-Jet
BAE 146 SERIES 200A 1 4 Wing Turbo-Jet Total: 78

Behind Start of Take-off Roll Sound Level Directivity Study Data Reduction and Analysis
_____________________________________________________________________ 38
5.1 Data Reduction Process
Continuous, one-third octave-band acoustic data, aircraft position information, tailnumbers, and meteorological data were collected and processed. This section discussesdata reduction and aggregation.
5.1.1 Acoustic Data
Acoustic data collected by the NASA acoustic vans and portable acoustic measurementsystems were processed using a Volpe-developed software program, NoiseloggerTM DataAnalysis Tool (NDAT). NDAT is a Windows-based program that uses one-third octavespectral time history data and event times as input and plots the overall sound pressurelevels for each event. The tool allows the user to visually inspect the recorded data forcontamination not detected by field personnel.
Figure 24. NDAT Software Program
The program also imports and displays all pertinent event information recorded in thefield, including aircraft type, number of engines, and Test Director’s comments to aid theuser. Once the user has visually inspected the data for an event and has fine-tuned theevent duration for metric computation, the program computes Sound Exposure Levels(LE) and Equivalent Sound Levels (Leq) for multiple averaging times. The program iscapable of computing results with multiple weighting options (A-weighting, C-weighting, Z-weighting -- or no weighting). The majority of aircraft noise prediction models basedon SAE-AIR-1845 use the A-weighted Sound Exposure Level (LAE) metric. As a result,

Behind Start of Take-off Roll Sound Level Directivity Study Data Reduction and Analysis
_____________________________________________________________________ 39
LAE was the primary metric used for this study. An analysis (discussed in Section 5.3)later indicated there is little sensitivity to the use of either LAeq or LAE.
5.1.2 Aircraft Tail Numbers
Aircraft tail numbers bridged the relationship between the measured acoustic data andspecific aircraft type. Tail numbers obtained from field loggers were entered into anaircraft registration website9 to identify the aircraft type for each event. Comments notedby the primary and secondary tail loggers such as aircraft type, number of engines, engineconfiguration, and best guess of aircraft model were compared to results from theregistration website to ensure the proper aircraft was identified.
5.1.3 Meteorological Data
Meteorological data obtained during the study characterized the wind speed and directionat the measurement site. Aside from a single day where measurements were postponedbecause of high winds, wind conditions during the measurement period were relativelycalm. As noted in Section 4.4.2, AIR-1845 recommends that data should not be collectedwhen wind speeds exceed 15 knots (approximately 18 mph). Test Directors monitoringthe TAMS meteorological unit did not detect wind exceeding 18 mph during measurements of any of the events. An analysis of the meteorological data confirmedthat at no time during the measurement period did wind speeds exceed 13.3 mph. Figure25 displays the highest instantaneous wind speed recorded each day during measurements.
Figure 25. Maximum Wind Speeds during Measurement Days
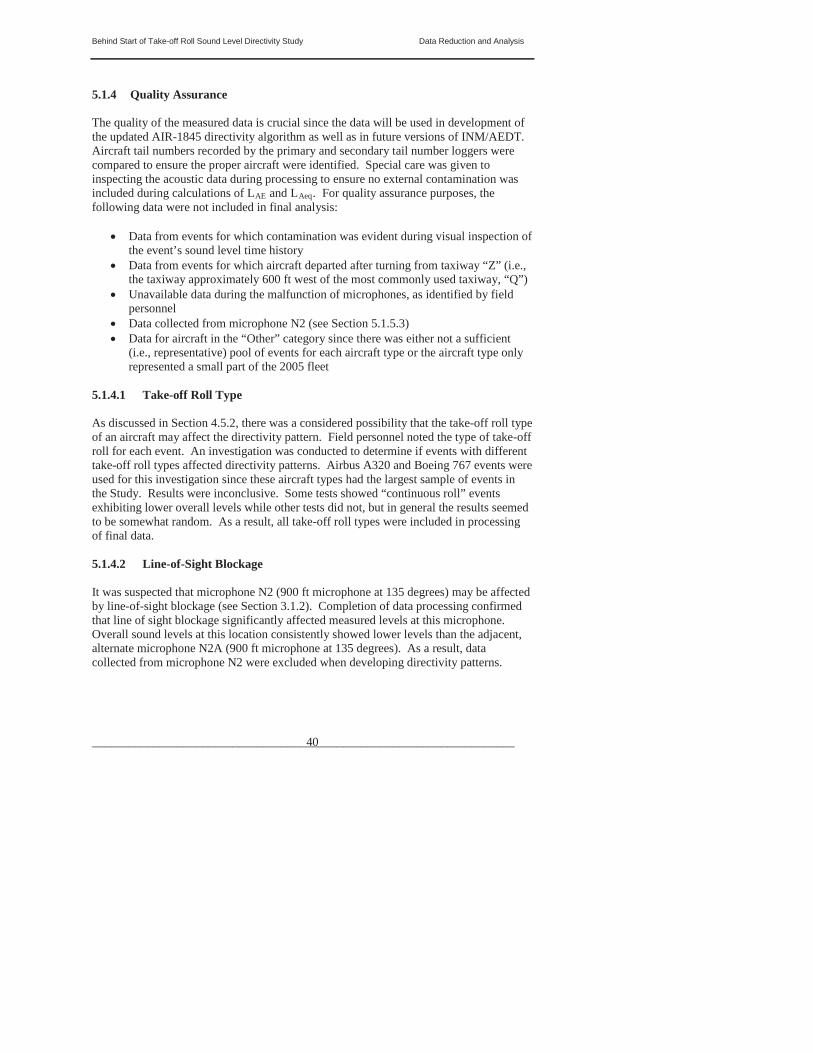
Behind Start of Take-off Roll Sound Level Directivity Study Data Reduction and Analysis
_____________________________________________________________________ 40
5.1.4 Quality Assurance
The quality of the measured data is crucial since the data will be used in development ofthe updated AIR-1845 directivity algorithm as well as in future versions of INM/AEDT.Aircraft tail numbers recorded by the primary and secondary tail number loggers werecompared to ensure the proper aircraft were identified. Special care was given toinspecting the acoustic data during processing to ensure no external contamination wasincluded during calculations of LAE and LAeq. For quality assurance purposes, thefollowing data were not included in final analysis:
Data from events for which contamination was evident during visual inspection ofthe event’s sound level time historyData from events for which aircraft departed after turning from taxiway “Z” (i.e., the taxiway approximately 600 ft west of the most commonly used taxiway, “Q”)Unavailable data during the malfunction of microphones, as identified by fieldpersonnelData collected from microphone N2 (see Section 5.1.5.3)Data for aircraft in the “Other” category since there was either not a sufficient(i.e., representative) pool of events for each aircraft type or the aircraft type onlyrepresented a small part of the 2005 fleet
5.1.4.1 Take-off Roll Type
As discussed in Section 4.5.2, there was a considered possibility that the take-off roll typeof an aircraft may affect the directivity pattern. Field personnel noted the type of take-offroll for each event. An investigation was conducted to determine if events with differenttake-off roll types affected directivity patterns. Airbus A320 and Boeing 767 events wereused for this investigation since these aircraft types had the largest sample of events inthe Study. Results were inconclusive. Some tests showed “continuous roll” eventsexhibiting lower overall levels while other tests did not, but in general the results seemedto be somewhat random. As a result, all take-off roll types were included in processing of final data.
5.1.4.2 Line-of-Sight Blockage
It was suspected that microphone N2 (900 ft microphone at 135 degrees) may be affectedby line-of-sight blockage (see Section 3.1.2). Completion of data processing confirmedthat line of sight blockage significantly affected measured levels at this microphone.Overall sound levels at this location consistently showed lower levels than the adjacent,alternate microphone N2A (900 ft microphone at 135 degrees). As a result, datacollected from microphone N2 were excluded when developing directivity patterns.
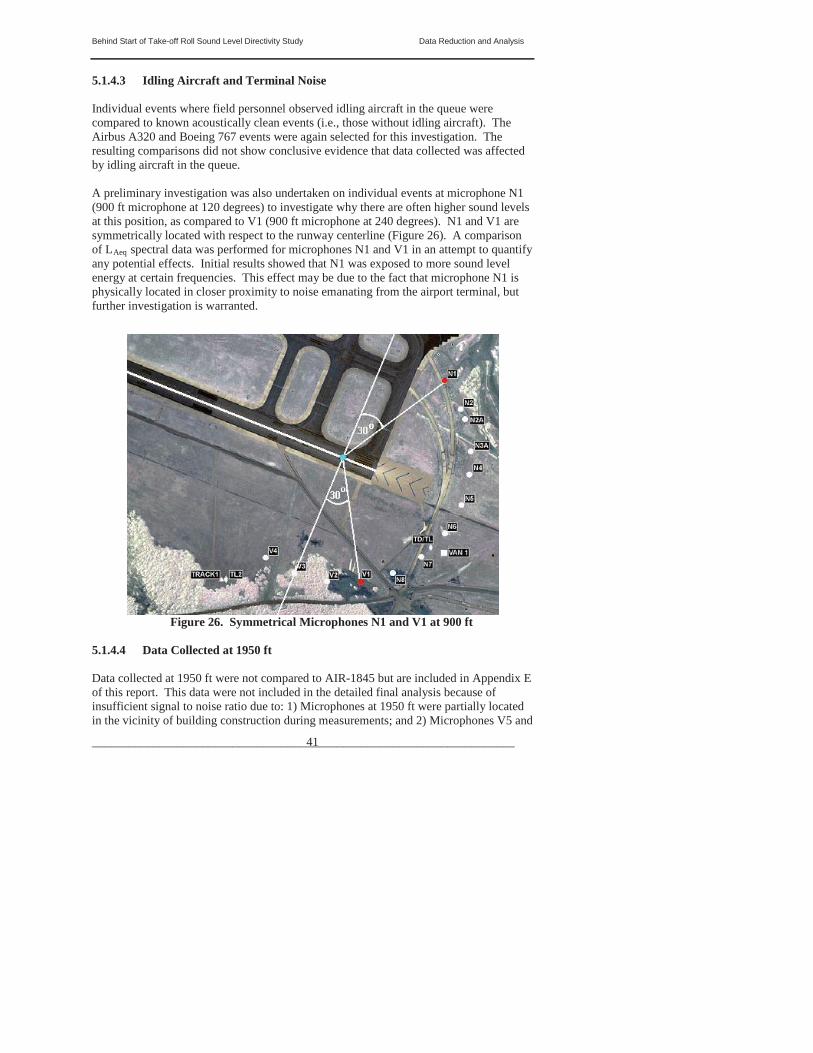
Behind Start of Take-off Roll Sound Level Directivity Study Data Reduction and Analysis
_____________________________________________________________________ 41
5.1.4.3 Idling Aircraft and Terminal Noise
Individual events where field personnel observed idling aircraft in the queue werecompared to known acoustically clean events (i.e., those without idling aircraft). TheAirbus A320 and Boeing 767 events were again selected for this investigation. Theresulting comparisons did not show conclusive evidence that data collected was affectedby idling aircraft in the queue.
A preliminary investigation was also undertaken on individual events at microphone N1(900 ft microphone at 120 degrees) to investigate why there are often higher sound levelsat this position, as compared to V1 (900 ft microphone at 240 degrees). N1 and V1 aresymmetrically located with respect to the runway centerline (Figure 26). A comparison of LAeq spectral data was performed for microphones N1 and V1 in an attempt to quantifyany potential effects. Initial results showed that N1 was exposed to more sound levelenergy at certain frequencies. This effect may be due to the fact that microphone N1 isphysically located in closer proximity to noise emanating from the airport terminal, butfurther investigation is warranted.
Figure 26. Symmetrical Microphones N1 and V1 at 900 ft
5.1.4.4 Data Collected at 1950 ft
Data collected at 1950 ft were not compared to AIR-1845 but are included in Appendix Eof this report. This data were not included in the detailed final analysis because ofinsufficient signal to noise ratio due to: 1) Microphones at 1950 ft were partially locatedin the vicinity of building construction during measurements; and 2) Microphones V5 and
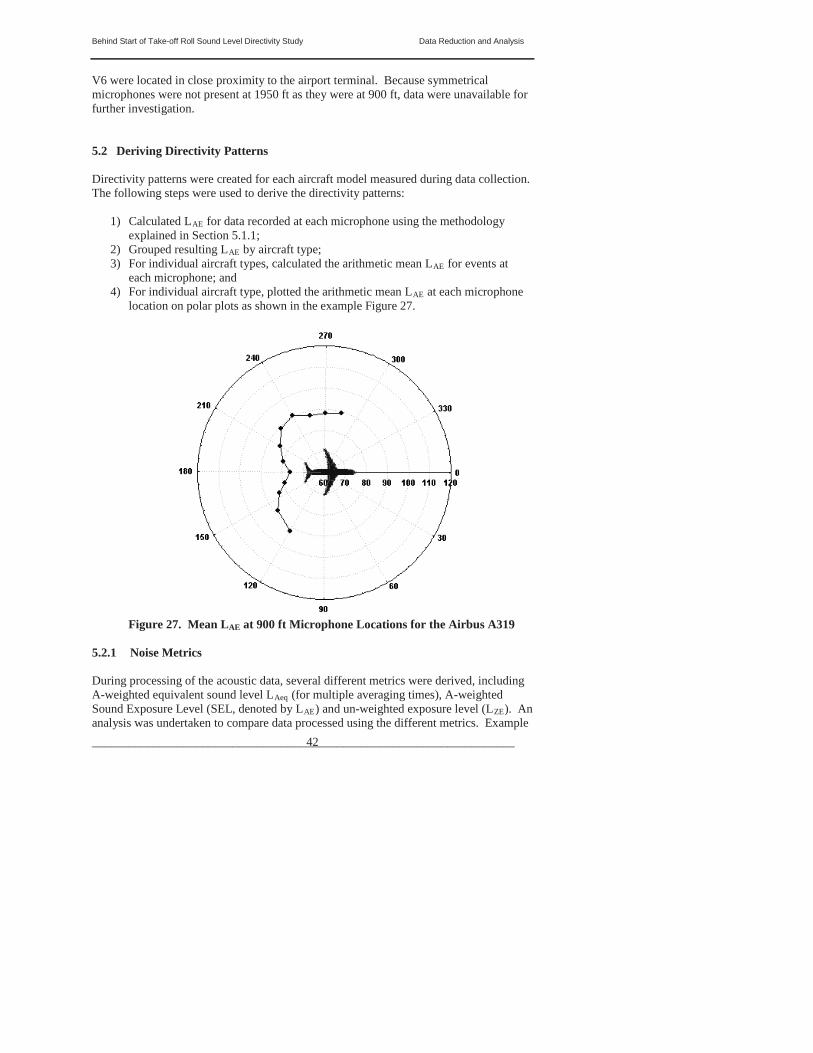
Behind Start of Take-off Roll Sound Level Directivity Study Data Reduction and Analysis
_____________________________________________________________________ 42
V6 were located in close proximity to the airport terminal. Because symmetricalmicrophones were not present at 1950 ft as they were at 900 ft, data were unavailable forfurther investigation.
5.2 Deriving Directivity Patterns
Directivity patterns were created for each aircraft model measured during data collection. The following steps were used to derive the directivity patterns:
1) Calculated LAE for data recorded at each microphone using the methodology explained in Section 5.1.1;
2) Grouped resulting LAE by aircraft type;3) For individual aircraft types, calculated the arithmetic mean LAE for events at
each microphone; and 4) For individual aircraft type, plotted the arithmetic mean LAE at each microphone
location on polar plots as shown in the example Figure 27.
Figure 27. Mean LAE at 900 ft Microphone Locations for the Airbus A319
5.2.1 Noise Metrics
During processing of the acoustic data, several different metrics were derived, including A-weighted equivalent sound level LAeq (for multiple averaging times), A-weightedSound Exposure Level (SEL, denoted by LAE) and un-weighted exposure level (LZE). Ananalysis was undertaken to compare data processed using the different metrics. Example

Behind Start of Take-off Roll Sound Level Directivity Study Data Reduction and Analysis
_____________________________________________________________________ 43
results, displayed in Figures 28 and 29, indicate there is little sensitivity to the use ofeither LAeq or LAE. This may also suggest that the level at LASmx predominantly definesthe directivity pattern. Analysis using the un-weighted exposure level showed more of apronounced indent at 180 degrees.

Behind Start of Take-off Roll Sound Level Directivity Study Data Reduction and Analysis
_____________________________________________________________________ 44
Figure 28. Comparison between Different Metrics Used to Process A320 Events
Figure 29. Comparison between Different Metrics Used to Process B767 Events

Behind Start of Take-off Roll Sound Level Directivity Study Data Reduction and Analysis
_____________________________________________________________________ 45
5.2.2 Normalizing Data to 285-Degrees
The current AIR-1845 directivity pattern (shown in Figure 30) is presented as“corrections” as opposed to absolute levels.
Figure 30. AIR-1845 Directivity Pattern at 900 ft
To allow comparison with the AIR-1845 algorithm, the computed directivity patterns hadto be converted into directivity corrections. This conversion was accomplished by using the LAE data from the current study and normalizing it, by subtracting the level at the285-degree microphone from the levels at all other microphones. Since the 1980 algorithm prescribes a 0 dB correction at 285 degrees, normalizing the current data to theLAE at 285-degree level readily allows for comparison of the new data with the olderalgorithm. Figure 31 shows an example of converting the directivity pattern from Figure27 to directivity corrections. Note that normalizing absolute LAE to the 285-degreemicrophone did not change the shape of the pattern.

Behind Start of Take-off Roll Sound Level Directivity Study Data Reduction and Analysis
_____________________________________________________________________ 46
Figure 31. Directivity Pattern for the Airbus A319 at 900 ft
To confirm the reasonableness of the 0 dB correction at the 285-degree microphone, ananalysis was performed to compare the measured versus INM-modeled values at thatangle. Take-off weight, thrust configurations, aircraft speed and altitude were obtainedfrom the Aircraft Communication Addressing and Reporting System (ACARS) of amajor U.S. carrier operating at IAD during the study. ACARS is a digital data link transmitted from the aircraft via VHF radio to individual airline archives. Temperaturedata were obtained from the TAMS meteorological station. These data were then enteredinto INM and computed for a variety of aircraft where ACARS data were available. Theresultant comparisons are presented in Table 7. The analysis shows overall, good agreement between measured versus modeled results at 285-degrees.

Behind Start of Take-off Roll Sound Level Directivity Study Data Reduction and Analysis
_____________________________________________________________________ 47
Table 7. Measured vs. INM-Modeled Comparison for a Microphone at 285-Degrees
Event Aircraft Type Measured Modeled Delta164 A319 88.3 89.1 -0.8271 A320 88.3 91.1 -2.8207 A320 88.8 91.0 -2.2303 A320 88.9 92.0 -3.1306 A320 89.1 92.0 -2.9372 B737 87.0 88.1 -1.1450 B747 96.3 97.4 -1.1277 B757 89.9 91.3 -1.4208 B757 90.7 91.3 -0.6225 B767 95.0 97.0 -2.0
Average: 90.2 92.0 -1.8
5.3 Comparison of Newly Developed Patterns with AIR-1845
An analysis was conducted to determine if the newly developed directivity patterns weredifferent from the AIR-1845 directivity patterns. T-tests were utilized to determine if thedata measured at each angular offset position were statistically different from the SAE-1845 adjustment at that position. These tests answered the question: “Is there at least a95% probability that the mean of the data is statistically similar to the value of the AIR-1845 adjustment?”
The average measured corrections and corresponding +-95% CI are plotted along withthe AIR-1845 directivity pattern (displayed as a continuous, gray line) and shown inFigures 34-46. Points which are statistically similar to the reference are shown in blue,points are not statistically similar to the reference are shown in red.

Behind Start of Take-off Roll Sound Level Directivity Study Data Reduction and Analysis
_____________________________________________________________________ 48
Figure 32. Airbus A319 Directivity Pattern at 900 ft (16 Events)
Figure 33. Airbus A320 Directivity Pattern at 900 ft (48 Events)

Behind Start of Take-off Roll Sound Level Directivity Study Data Reduction and Analysis
_____________________________________________________________________ 49
Figure 34. Airbus A330 Directivity Pattern at 900 ft (4 Events)
Figure 35. Airbus A340 Directivity Pattern at 900 ft (5 Events)

Behind Start of Take-off Roll Sound Level Directivity Study Data Reduction and Analysis
_____________________________________________________________________ 50
Figure 36. Boeing 717 Directivity Pattern at 900 ft (3 Events)
Figure 37. Boeing 737 Directivity Pattern at 900 ft (20 Events)

Behind Start of Take-off Roll Sound Level Directivity Study Data Reduction and Analysis
_____________________________________________________________________ 51
Figure 38. Boeing 747 Directivity Pattern at 900 ft (7 Events)
Figure 39. Boeing 757 Directivity Pattern at 900 ft (12 Events)
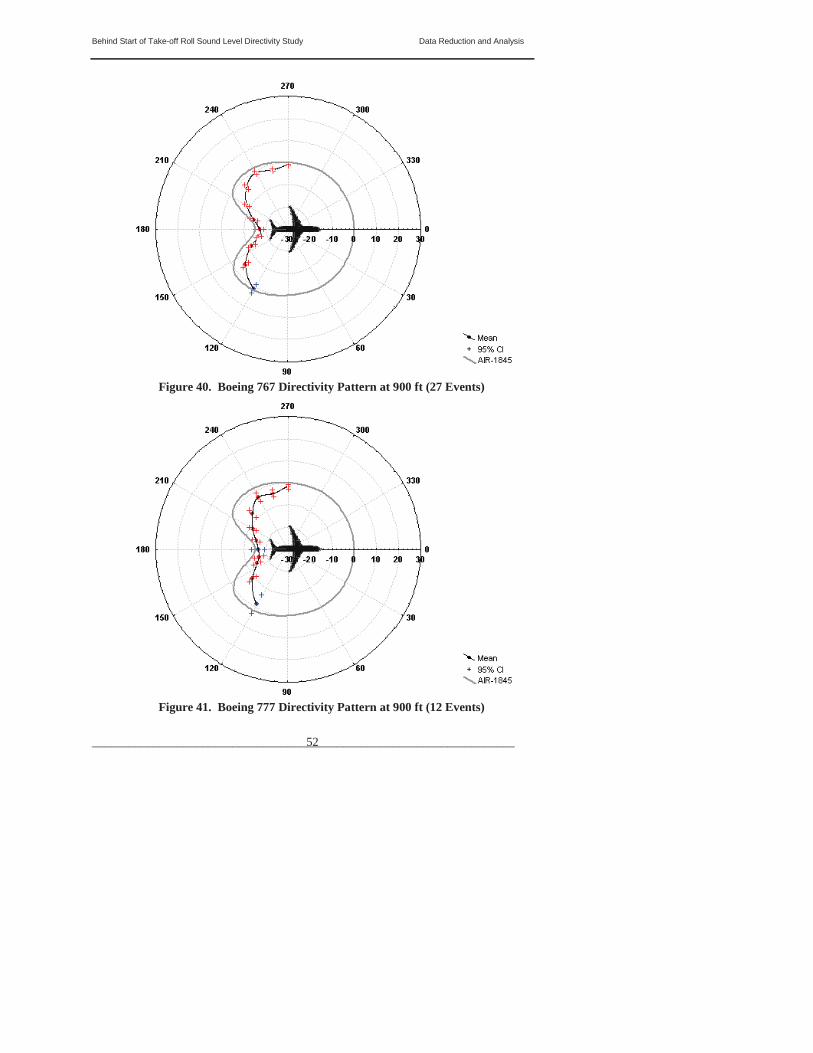
Behind Start of Take-off Roll Sound Level Directivity Study Data Reduction and Analysis
_____________________________________________________________________ 52
Figure 40. Boeing 767 Directivity Pattern at 900 ft (27 Events)
Figure 41. Boeing 777 Directivity Pattern at 900 ft (12 Events)

Behind Start of Take-off Roll Sound Level Directivity Study Data Reduction and Analysis
_____________________________________________________________________ 53
Figure 42. McDonnell Douglas DC9 Directivity Pattern at 900 ft (23 Events)
Figure 43. Bombardier CL600 Directivity Pattern at 900 ft (104 Events)

Behind Start of Take-off Roll Sound Level Directivity Study Data Reduction and Analysis
_____________________________________________________________________ 54
Figure 44. Turbo-Propeller Aircraft Directivity Pattern at 900 ft (14 Events)
An analysis of the comparisons concluded the following:
The majority of jet aircraft show similarity with the current standard around 180 degrees, but differ by 2 to 4.5 dB in the “lobes” from 135-155 and 225-245 degreesThe Boeing 717 is the only aircraft, which exhibits statistical similarity at all polarangles with the AIR-1845 algorithm. This , however, is a result of the fact thatthere were only 3 events for this aircraft
5.4 Proposed Updated Directivity Adjustment
The proposed, updated SOTR directivity adjustments were computed from the datathrough a fleet-weighted average. First, the arithmetic average noise level was computedfor each aircraft type at each azimuth angle from 90 to 180 degrees (symmetricaldirectivity was assumed). Then the SOTR directivity noise levels were normalized to 0.0 dB at 285 degrees.
Through the comparison of the average, aircraft-specific SOTR directivities, it becameapparent that a single directivity adjustment would be insufficient in describing thebehind SOTR noise levels of today’s fleet. Since turboprop’s SOTR directivities weresignificantly different from the directivities of jet aircraft, they were evaluated separately.

Behind Start of Take-off Roll Sound Level Directivity Study Data Reduction and Analysis
_____________________________________________________________________ 55
Two sets of SOTR directivity adjustments were developed; one for jet aircraft, and theother for turboprop aircraft.
For jet aircraft, a fleet-weighted regression was fitted to the average sound exposure leveldata for each aircraft to develop the SOTR directivity adjustment. The regressionweighting factors were chosen such that the aircraft are represented in proportion to theirrelative operational presence in the 2005 global fleet*. The individual aircraft typesmeasured represented 85% of the aircraft types in the 2005 fleet. Descriptions of theaircraft fleet used for these derivations are presented in Appendix F of this report.
For turboprop aircraft, a standard regression fitting process was used to develop theSOTR directivity adjustment. The regression was computed using all data from theevents measured. No weighting factor was applied, as the measured data set was small(14 events) and could not adequately represent the majority of the fleet of turbopropaircraft.
This resulted in two sets of updated SOTR directivity adjustments. The updated SOTRdirectivity adjustment for jet aircraft is represented by the following equation:
(3)
The SOTR directivity adjustment for turboprop aircraft is represented by the following equation:
(4)
* AEDT Common Operations Database (COD) for the FAA Destination 2025 environmental inventory ofthe calendar year 2005.
2180
ln3.17403338
180ln
4601.3
180exp51.110573.844.2329ADJDIR
7
19
6
17
5
16
4
14
3
12
2
1030506872.11090084471.7
1002271504.21083584442.210349298567.2
1114915739330722162898.34643ADJDIR
18090For
18090For
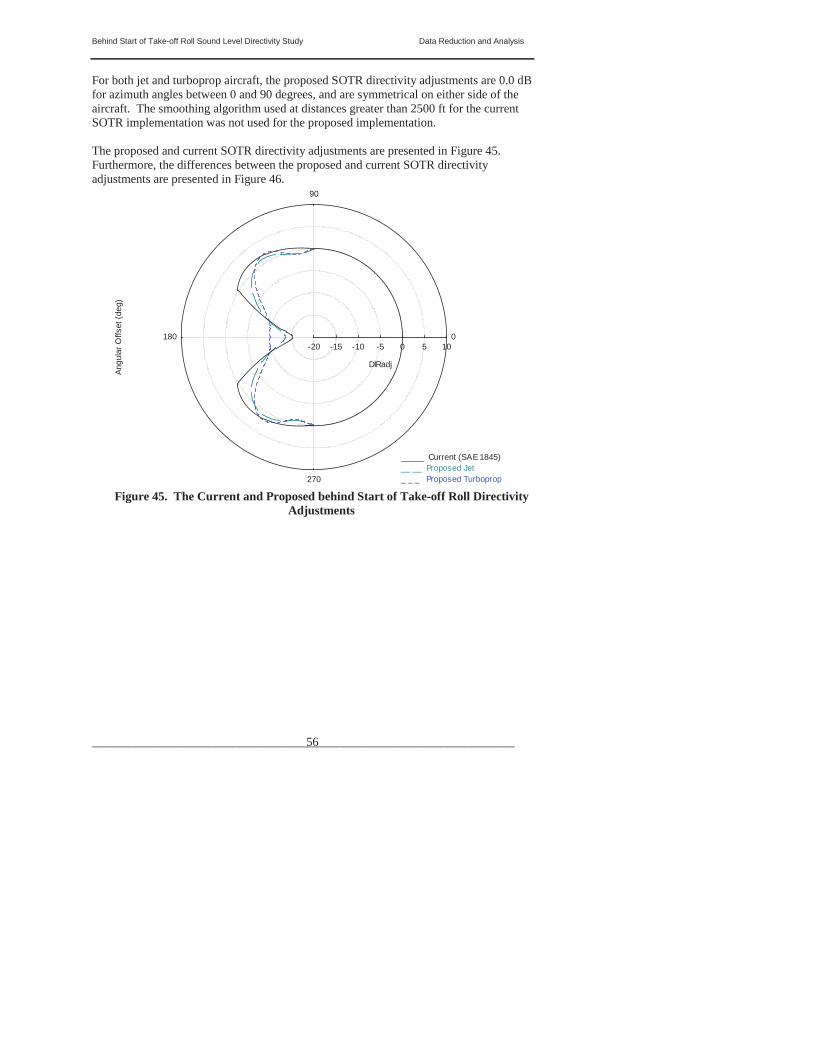
Behind Start of Take-off Roll Sound Level Directivity Study Data Reduction and Analysis
_____________________________________________________________________ 56
For both jet and turboprop aircraft, the proposed SOTR directivity adjustments are 0.0 dBfor azimuth angles between 0 and 90 degrees, and are symmetrical on either side of theaircraft. The smoothing algorithm used at distances greater than 2500 ft for the currentSOTR implementation was not used for the proposed implementation.
The proposed and current SOTR directivity adjustments are presented in Figure 45. Furthermore, the differences between the proposed and current SOTR directivityadjustments are presented in Figure 46.
-20 -15 -10 -5 0 5 10
DIRadj
90
180
270
0
Angu
lar O
ffset
(deg
)
_____ Current (SAE 1845)__ __ Proposed Jet_ _ _ Proposed Turboprop
Figure 45. The Current and Proposed behind Start of Take-off Roll DirectivityAdjustments

Behind Start of Take-off Roll Sound Level Directivity Study Data Reduction and Analysis
_____________________________________________________________________ 57
-6
-4
-2
0
2
4
6
8
90 100 110 120 130 140 150 160 170 180
Azimuth Angle (degrees)
Diff
eren
ce in
Sou
nd P
ress
ure
Leve
l Adj
ustm
ent
(Cur
rent
- Pr
opos
ed, d
B)
Jets
Turboprops
Figure 46. The Differences between the Current and Proposed behind Start ofTake-off Roll Directivity Adjustments for Jet and Turboprop Aircraft
5.5 Additional Directivity Investigations
Several alternative SOTR implementations for jet aircraft were investigated. Using theIAD data set, the jet SOTR directivity data were grouped according to a variety ofdifferent parameters, and average SOTR directivity adjustments were developed for eachof the groups. The SOTR directivity data for turboprop aircraft were not furthersubdivided, because of the small number of turboprop departures measured at IAD.
One approach was to group aircraft according to engine separation distance, working offthe assumption that engine location was dominant influence on the SOTR directivity. Itwas anticipated that aircraft with similar engine mounting configurations (i.e., fuselage-mount and wing-mount) might have similar directivity patterns. This analysis utilized t-tests to determine if the measured data at each angular offset were similar from aircraft toaircraft. For example, the mean correction at 120 degrees for the A319 was compared tothe mean correction for the A320 at 120 degrees. An independent sample t-test wasperformed to determine if the difference between these two means was statistically
a 95% probability that the means of these two data sets are statistically similar?” Thistest was performed at each offset angle for all possible aircraft combinations.
Table 8 shows the number of angular offset points (out of a total of 11) where the averageadjustments are similar for each combination of aircraft. Those aircraft combinations thathad 10 or 11 similar angles are highlighted in yellow. Those with 9 similar angles arehighlighted in a lighter yellow.
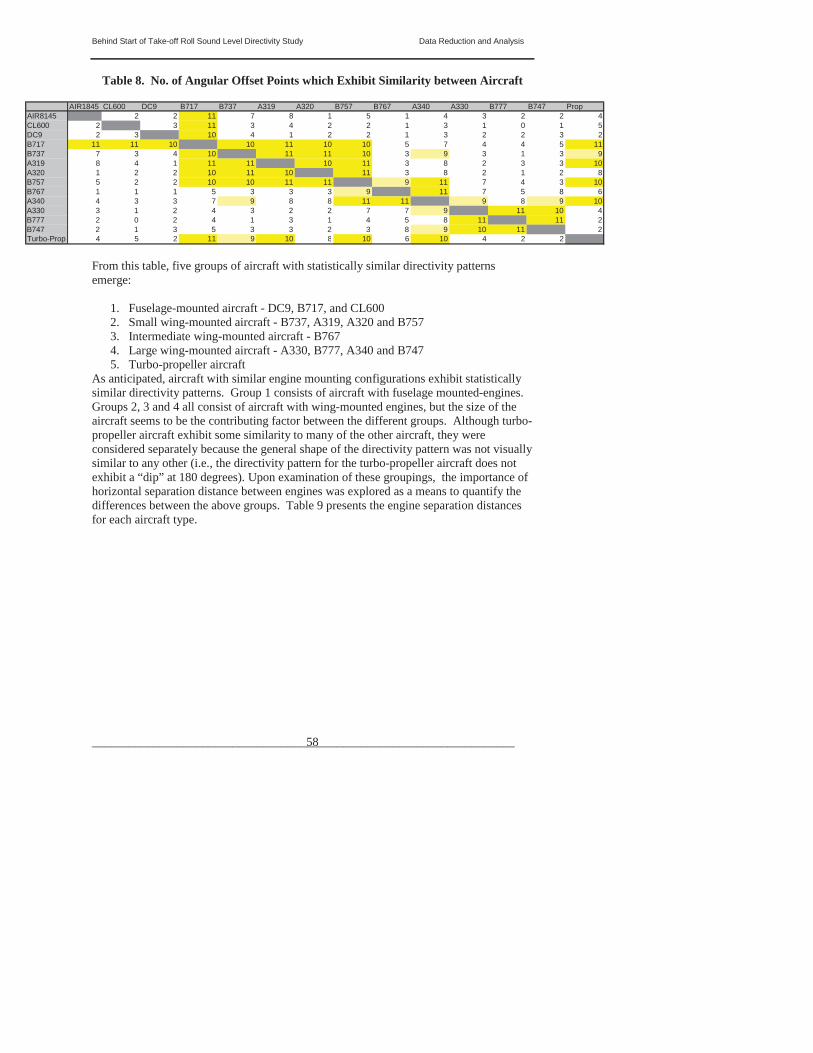
Behind Start of Take-off Roll Sound Level Directivity Study Data Reduction and Analysis
_____________________________________________________________________ 58
Table 8. No. of Angular Offset Points which Exhibit Similarity between Aircraft
AIR1845 CL600 DC9 B717 B737 A319 A320 B757 B767 A340 A330 B777 B747 PropAIR8145 2 2 11 7 8 1 5 1 4 3 2 2 4CL600 2 3 11 3 4 2 2 1 3 1 0 1 5DC9 2 3 10 4 1 2 2 1 3 2 2 3 2B717 11 11 10 10 11 10 10 5 7 4 4 5 11B737 7 3 4 10 11 11 10 3 9 3 1 3 9A319 8 4 1 11 11 10 11 3 8 2 3 3 10A320 1 2 2 10 11 10 11 3 8 2 1 2 8B757 5 2 2 10 10 11 11 9 11 7 4 3 10B767 1 1 1 5 3 3 3 9 11 7 5 8 6A340 4 3 3 7 9 8 8 11 11 9 8 9 10A330 3 1 2 4 3 2 2 7 7 9 11 10 4B777 2 0 2 4 1 3 1 4 5 8 11 11 2B747 2 1 3 5 3 3 2 3 8 9 10 11 2Turbo-Prop 4 5 2 11 9 10 8 10 6 10 4 2 2
From this table, five groups of aircraft with statistically similar directivity patternsemerge:
1. Fuselage-mounted aircraft - DC9, B717, and CL600 2. Small wing-mounted aircraft - B737, A319, A320 and B757 3. Intermediate wing-mounted aircraft - B767 4. Large wing-mounted aircraft - A330, B777, A340 and B747 5. Turbo-propeller aircraft
As anticipated, aircraft with similar engine mounting configurations exhibit statisticallysimilar directivity patterns. Group 1 consists of aircraft with fuselage mounted-engines.Groups 2, 3 and 4 all consist of aircraft with wing-mounted engines, but the size of theaircraft seems to be the contributing factor between the different groups. Although turbo-propeller aircraft exhibit some similarity to many of the other aircraft, they wereconsidered separately because the general shape of the directivity pattern was not visuallysimilar to any other (i.e., the directivity pattern for the turbo-propeller aircraft does notexhibit a “dip” at 180 degrees). Upon examination of these groupings, the importance ofhorizontal separation distance between engines was explored as a means to quantify thedifferences between the above groups. Table 9 presents the engine separation distancesfor each aircraft type.
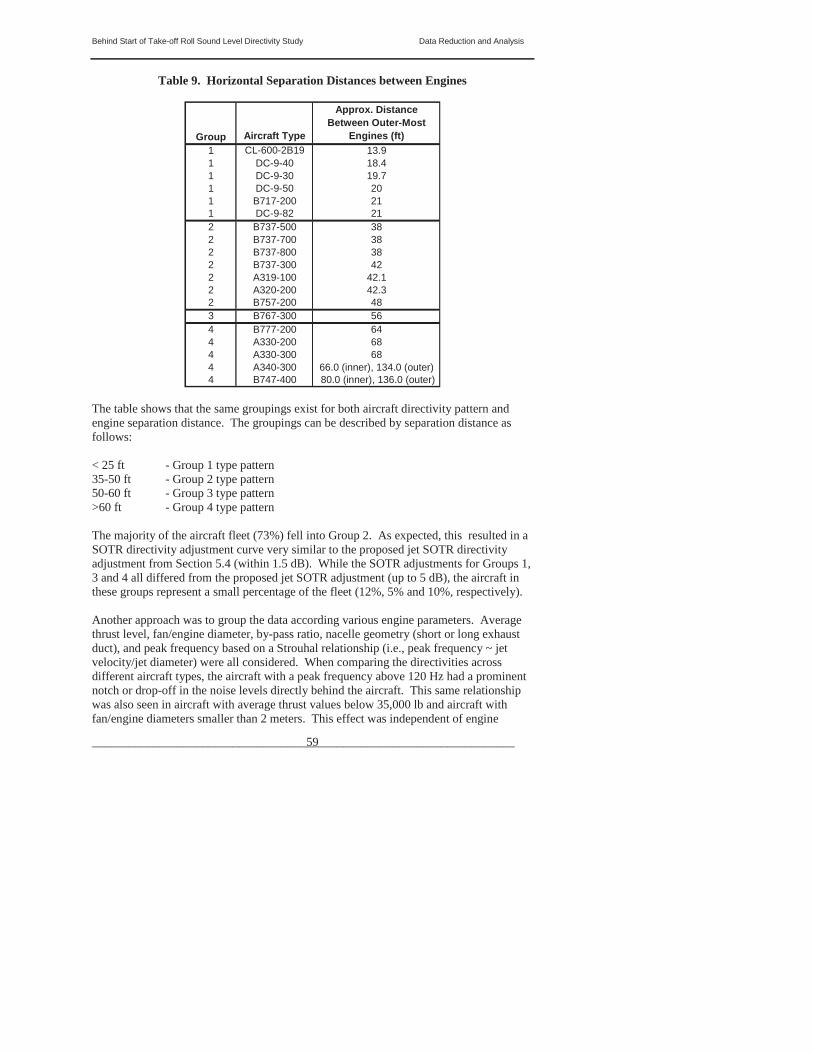
Behind Start of Take-off Roll Sound Level Directivity Study Data Reduction and Analysis
_____________________________________________________________________ 59
Table 9. Horizontal Separation Distances between Engines
Group Aircraft Type
Approx. Distance Between Outer-Most
Engines (ft)1 CL-600-2B19 13.91 DC-9-40 18.41 DC-9-30 19.71 DC-9-50 201 B717-200 211 DC-9-82 212 B737-500 382 B737-700 382 B737-800 382 B737-300 422 A319-100 42.12 A320-200 42.32 B757-200 483 B767-300 564 B777-200 644 A330-200 684 A330-300 684 A340-300 66.0 (inner), 134.0 (outer)4 B747-400 80.0 (inner), 136.0 (outer)
The table shows that the same groupings exist for both aircraft directivity pattern and engine separation distance. The groupings can be described by separation distance asfollows:
< 25 ft - Group 1 type pattern35-50 ft - Group 2 type pattern50-60 ft - Group 3 type pattern>60 ft - Group 4 type pattern
The majority of the aircraft fleet (73%) fell into Group 2. As expected, this resulted in aSOTR directivity adjustment curve very similar to the proposed jet SOTR directivityadjustment from Section 5.4 (within 1.5 dB). While the SOTR adjustments for Groups 1, 3 and 4 all differed from the proposed jet SOTR adjustment (up to 5 dB), the aircraft inthese groups represent a small percentage of the fleet (12%, 5% and 10%, respectively).
Another approach was to group the data according various engine parameters. Averagethrust level, fan/engine diameter, by-pass ratio, nacelle geometry (short or long exhaustduct), and peak frequency based on a Strouhal relationship (i.e., peak frequency ~ jetvelocity/jet diameter) were all considered. When comparing the directivities acrossdifferent aircraft types, the aircraft with a peak frequency above 120 Hz had a prominentnotch or drop-off in the noise levels directly behind the aircraft. This same relationshipwas also seen in aircraft with average thrust values below 35,000 lb and aircraft withfan/engine diameters smaller than 2 meters. This effect was independent of engine

Behind Start of Take-off Roll Sound Level Directivity Study Data Reduction and Analysis
_____________________________________________________________________ 60
mounting location, by-pass ratio and nacelle geometry. Therefore the jet aircraft weresorted into two different categories: jets with a prominent notch (Group 5) and jets withan absent notch (Group 6). The majority of the aircraft fleet fell into Group 5, whichresulted in a SOTR directivity adjustment curve that was very similar to the proposed jetSOTR directivity adjustment from Section 5.4 (within 1.0 dB). While the SOTRadjustments for Group 6 differed from the proposed jet SOTR adjustment (up to 5 dB), itrepresented a small percentage of the fleet (14%).
The additional SOTR directivity adjustment investigations led to two significantobservations. First, the proposed jet SOTR directivity adjustment from Section 5.4 is agood representation for the aircraft comprising the majority of the current fleet. Second, depending on data availability, it may be worthwhile to investigate additional directivitycurves or even aircraft-specific SOTR directivity curves.
5.6 Case Studies
5.6.1 Single Event Analysis
The effects of the current and proposed update to the SOTR directivity adjustment (fromSections 1.1 and 5.4, respectively) were assessed on a single event basis in a prerelease,research version of AEDT (AEDT-alpha). Individual departures for four jet aircraft(Boeing 737, Boeing 777, Airbus A320 and Airbus A330) and two turboprop aircraft(Beech 1900D and Saab SF340) from the IAD fleet were modeled in AEDT-alpha, and the sound exposure level (LAE) results were analyzed. Because the behind SOTRadjustments are independent of aircraft type (other than the distinction between jet and turboprop engines), these six aircraft were chosen as representative aircraft, in order toillustrate the typical effect the proposed changes to the SOTR directivity adjustment.
The LAE modeled results were computed at six different locations behind the start oftake-off roll segment for each aircraft in AEDT (see Tables 10 and 11). These analysislocations corresponded to measurement locations from the IAD study at different azimuthangles relative to the departure flight track. The differences between the current andproposed SOTR adjustments are presented in Table 12. These differences are equivalentto the expected difference between the SOTR algorithms presented in Equations 1 through 4.
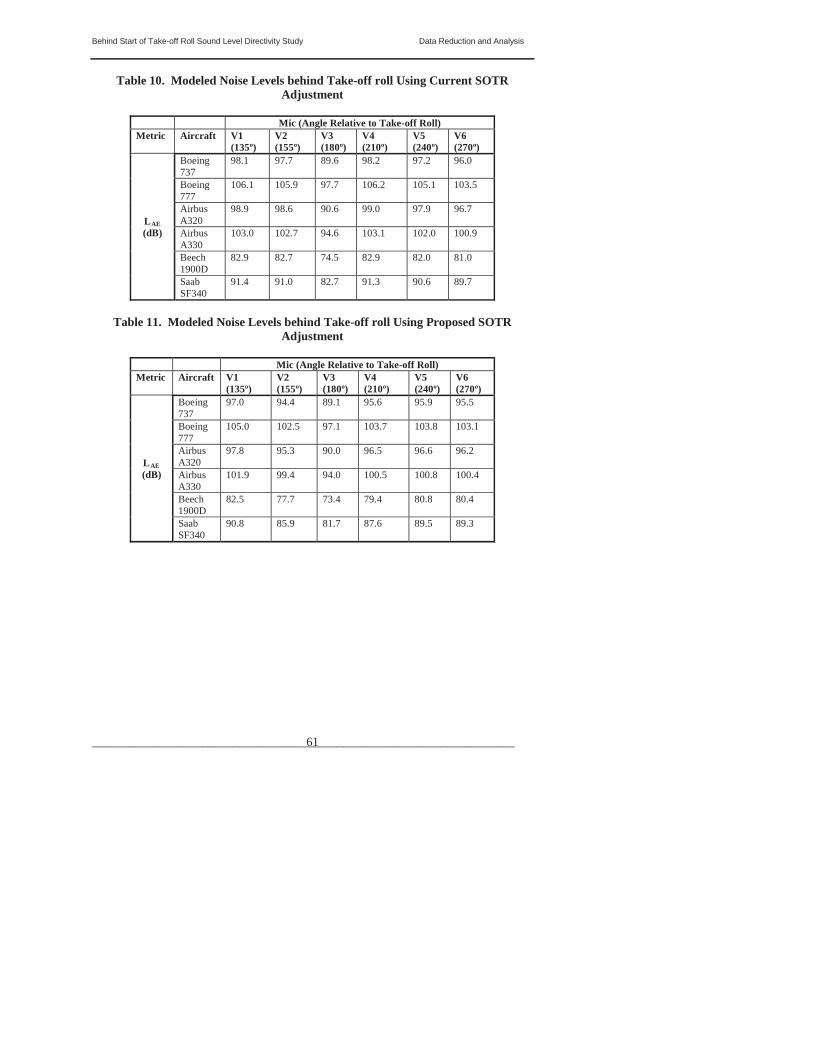
Behind Start of Take-off Roll Sound Level Directivity Study Data Reduction and Analysis
_____________________________________________________________________ 61
Table 10. Modeled Noise Levels behind Take-off roll Using Current SOTRAdjustment
Mic (Angle Relative to Take-off Roll)Metric Aircraft V1
(135º)V2(155º)
V3(180º)
V4(210º)
V5(240º)
V6(270º)
LAE(dB)
Boeing737
98.1 97.7 89.6 98.2 97.2 96.0
Boeing777
106.1 105.9 97.7 106.2 105.1 103.5
AirbusA320
98.9 98.6 90.6 99.0 97.9 96.7
AirbusA330
103.0 102.7 94.6 103.1 102.0 100.9
Beech1900D
82.9 82.7 74.5 82.9 82.0 81.0
SaabSF340
91.4 91.0 82.7 91.3 90.6 89.7
Table 11. Modeled Noise Levels behind Take-off roll Using Proposed SOTRAdjustment
Mic (Angle Relative to Take-off Roll)Metric Aircraft V1
(135º)V2(155º)
V3(180º)
V4(210º)
V5(240º)
V6(270º)
LAE(dB)
Boeing737
97.0 94.4 89.1 95.6 95.9 95.5
Boeing777
105.0 102.5 97.1 103.7 103.8 103.1
AirbusA320
97.8 95.3 90.0 96.5 96.6 96.2
AirbusA330
101.9 99.4 94.0 100.5 100.8 100.4
Beech1900D
82.5 77.7 73.4 79.4 80.8 80.4
SaabSF340
90.8 85.9 81.7 87.6 89.5 89.3

Behind Start of Take-off Roll Sound Level Directivity Study Data Reduction and Analysis
_____________________________________________________________________ 62
Table 12. Difference in Modeled Noise Levels for Two Different SOTRImplementations (Current – Proposed)
Mic (Angle Relative to Take-off Roll)Metric Aircraft V1
(135º)V2(155º)
V3(180º)
V4(210º)
V5(240º)
V6(270º)
LAE(dB)
Boeing737
1.1 3.3 0.6 2.6 1.3 0.5
Boeing777
1.1 3.4 0.6 2.5 1.3 0.4
AirbusA320
1.1 3.3 0.6 2.6 1.3 0.5
AirbusA330
1.1 3.4 0.6 2.5 1.3 0.5
Beech1900D
0.4 5.0 1.2 3.5 1.2 0.6
SaabSF340
0.5 5.0 1.0 3.7 1.1 0.4
Table 12 verifies that the different SOTR adjustments were implemented consistentlyacross all six aircraft analyzed.
These single events were also run in a research version of INM 7.0a. The SOTRadjustment implementation was confirmed to be consistent across INM and AEDT.Since AEDT-alpha does not support the capability to generate noise contours, noisecontours were generated in the research version of INM 7.0a.
LAE contours for the Boeing 737 jet aircraft were plotted in Figure 47, to illustrate thetypical differences in sound level due using both the current and proposed SOTRdirectivity adjustment. Similar results were observed for Boeing 777, Airbus A320 and Airbus A330 jet aircraft.

Behind Start of Take-off Roll Sound Level Directivity Study Data Reduction and Analysis
_____________________________________________________________________ 63
Figure 47. LAE Contours for the Boeing 737 Jet Aircraft with the Current andProposed behind Start of Take-off Roll Directivity Adjustments for Jet (70 to 85
dB LAE in 5 dB increments)
LAE contours for the Beech 1900D turboprop aircraft were plotted in Figure 48, toillustrate the typical differences in sound level due using both the current and proposedSOTR directivity adjustment. Similar results were observed for the Saab SF340 turboprop aircraft.
Figure 48. LAE Contours for the Beech 1900D Turboprop Aircraft with theCurrent and Proposed behind Start of Take-off Roll Directivity Adjustments for
Turboprops (70 to 85 dB LAE in 5 dB increments)
Current SOTR
Proposed SOTR
Current SOTR
Proposed SOTR

Behind Start of Take-off Roll Sound Level Directivity Study Data Reduction and Analysis
_____________________________________________________________________ 64
For all six of the aircraft, the area for each of the 70 to 85 dB LAE contours decreased by 0.5-2.0% with the proposed SOTR directivity adjustment when compared to the resultwith the current SOTR adjustment. This decrease in contour area was limited to the areabehind the start of take-off roll, as expected.
5.6.2 Airport Analysis
The effects of the proposed change to the behind start of take-off roll adjustment inAEDT and INM were investigated on a study-wide scale. Three international airports(A1, A2, and A3) were modeled in the research version of INM 7.0a with both thecurrent and the proposed SOTR directivity adjustment implementations. All threeairports have diverse fleet mixes with both jet and turboprop aircraft.
The differences in day night sound pressure level (LDN) between the current and theproposed SOTR directivity implementation at three different airports are presented inTable 13.
Table 13. Difference in Modeled Noise Levels for Two Different SOTR Implementations (Current – Proposed) at Three Different Airports
Airport Level (dB LDN)
Current SOTR(sq. mi.)
Proposed SOTR(sq. mi.)
Difference (Current – Proposed, %)
A1 55 84.517 83.948 -0.67%A1 65 14.448 14.288 -1.11%A2 55 70.449 70.02 -0.61%A2 65 12.815 12.648 -1.30%A3 55 92.991 92.486 -0.54%A3 65 16.188 16.1 -0.54%
For all three airports, the area for each of the 55 and 65 dB LDN contours decreased by 0.5-1.5%with the proposed SOTR directivity adjustment when compared to the resultwith the current SOTR adjustment. This difference became smaller for quieter noisecontours, which were farther away from the runways. A similar trend was observed formaximum A-weighted sound pressure level (LASmx) contours at the three airports.
While the overall area of each LDN contour is not drastically affected by the change of theSOTR directivity adjustment, the shape of the contour can be affected. Contours neardeparture runway will be affected by the proposed SOTR directivity adjustment, asillustrated in Figure 49. This would be particularly relevant at smaller airports dominatedby turboprop operations.

Behind Start of Take-off Roll Sound Level Directivity Study Data Reduction and Analysis
_____________________________________________________________________ 65
Figure 49. LDN Contours at Airport A2 with the Current and Proposed behindStart of Take-off Roll Directivity Adjustments (55 to 75 dB LDN in 10 dB
increments)
Current SOTR
Proposed SOTR

Behind Start of Take-off Roll Sound Level Directivity Study Conclusions and Recommendations
_____________________________________________________________________ 66
6 CONCLUSIONS AND RECOMMENDATIONS
Based on the analysis of the data collected at IAD, it is concluded that the directivitypatterns of modern aircraft appear to have only marginal similarities with the existing AIR-1845 directivity pattern. A change in the behind start of take-off roll directivityadjustment implementation to the proposed implementation would benefit AEDT andINM. The proposed adjustments would better represent the current aircraft fleet, andwould allow for the directivity associated with jet and turboprop aircraft to be representedseparately in the models. While the effects of the proposed SOTR directivity adjustmentsmay be negligible on some full-airport studies, it will allow for a more accuraterepresentation of aircraft departure noise from the current fleet in communities and othernoise sensitive areas located near airport runways.
Behind Start of Take-off Roll Sound Level Directivity Study Future Research
_____________________________________________________________________ 67
7 FUTURE RESEARCH
While the proposed changes to the SOTR directivity adjustment implementation willbetter represent the departure noise generated by the current fleet in AEDT and INM,several steps can be taken to further advance this area of research. First, an additionalsensitivity analysis could be done for individual aircraft types, to identify (a) if some jetaircraft are better represented by the current SOTR adjustment instead of the proposedSOTR adjustment, and (b) if certain jet aircraft are better represented by aircraft-specificSOTR directivity adjustments. Second, the IAD data set could be reprocessed; in order toestablish a set of criteria for determining under what circumstances should additionalSOTR directivity adjustments be used. This could include, but is not limited to, thefurther assessment of the following parameters: engine separation distance; nacellegeometry; engine or fan diameter; by-pass ratio; peak frequency; number of engines, andaverage thrust level. Third, additional SOTR directivity data could be measured tosupplement the Dulles data. This could be especially useful for turboprop andsmaller/low thrust jet aircraft, which were only sparsely represented in the IAD data.

Behind Start of Take-off Roll Sound Level Directivity Study References
_____________________________________________________________________ 68
REFERENCES
1. Society of Automotive Engineers, Committee A-21, Aircraft Noise, “Procedurefor the Calculation of Airplane Noise in the Vicinity of Airports,” AerospaceInformation Report No. 1845, Society of Automotive Engineers, Inc.,Warrendale, Pennsylvania, January 1986.
2. Eldred, K M., Miller, R.L., “Analysis of Selected Topics in the Methodology ofthe Integrated Noise Model,” BBN Report No. 4413, Bolt Beranek and Newman,Cambridge, Massachusetts, November 1980.
3. He, Hua, et al., Integrated Noise Model (INM) Version 7.0 User's Guide, ReportNo. FAA-AEE-07-04, FAA, Office of Environment and Energy Washington,D.C., April 2007.
4. Boeker, E.R., et al., Integrated Noise Model (INM) Version 7.0 TechnicalManual, Report No. FAA-AEE-08-01, FAA, Office of Environment and Energy Washington, D.C., January 2008.
5. Gutierrez, R.M., et al., “Low-Frequency Commercial Aircraft NoiseCharacterization During Start of Take-Off Roll and Thrust Reverser,”Pennsylvania State University, State College, Pennsylvania, 2005.
6. http://www.epa.gov/ttn/scram, September 28, 2005.
7. Federal Aviation Administration (FAA), System for assessing Aviation’s GlobalEmissions (SAGE), Version 1.5, Technical Manual, Report No. FAA-AEE-2005-01, FAA, Office of Environment and Energy, Washington, D.C., September 2005.
8. Federal Aviation Administration (FAA), Volpe Center Acoustics Facility Time-Space-Position-Information System Differential Global Positioning SystemUser’s Guide, John A. Volpe National Transportation Systems Center,Cambridge, Massachusetts, July 2001.
9. http://162.58.35.241/acdatabase/NNum_inquiry.asp, September 28, 2005.
10. Statistica Version 7.0, StatSoft, Inc., Tulsa, Oklahoma, 2004.

Behind Start of Take-off Roll Sound Level Directivity Study Appendix A
_____________________________________________________________________ 69
APPENDIX A: SUMMARY OF INSTRUMENTATION LOCATIONS
Table 14. Summary of Instrument Locations
X (ft) Y (ft) Lat (deg) Long (deg)NASA Acoustic Van 1 mic N1 120 900 -450 -779 38.93541308 -77.45424897 AcousticNASA Acoustic Van 1 mic N2 135 900 -636 -636 38.93486683 -77.45381874 AcousticNASA Acoustic Van 1 mic N2A 140 900 -689 -579 38.93466755 -77.45370824 AcousticNASA Acoustic Van 1 mic N3A 155 900 -816 -380 38.93403338 -77.45354325 AcousticNASA Acoustic Van 1 mic N4 165 900 -869 -233 38.93357914 -77.45356191 AcousticNASA Acoustic Van 1 mic N5 180 900 -900 0 38.93297614 -77.45373692 AcousticNASA Acoustic Van 1 mic N6 195 900 -869 233 38.93240412 -77.45412636 AcousticNASA Acoustic Van 1 mic N7 210 900 -779 450 38.93193052 -77.45469144 AcousticNASA Acoustic Van 1 mic N8 225 900 -636 636 38.93159738 -77.45539039 AcousticVolpe Acoustic System V1 240 900 -450 779 38.93141035 -77.45618147 Acoustic/Wind Speed/Wind DirectionVolpe Acoustic System V2 255 900 -233 869 38.93139111 -77.45701438 Acoustic/Wind Speed/Wind DirectionVolpe Acoustic System V3 270 900 0 900 38.93153509 -77.45782548 Acoustic/Wind Speed/Wind DirectionVolpe Acoustic System V4 285 900 233 869 38.93183678 -77.45854469 Acoustic/Wind Speed/Wind DirectionNASA Acoustic Van 1 mic N9 180 1350 -1350 0 38.93253624 -77.45225366 AcousticVolpe Acoustic System V5 105 1950 -505 -1884 38.93819808 -77.45270117 Acoustic/Wind Speed/Wind DirectionVolpe Acoustic System V6 120 1950 -975 -1689 38.93722718 -77.45140391 Acoustic/Wind Speed/Wind DirectionNASA Acoustic Van 2 mic N10 135 1950 -1379 -1379 38.93605635 -77.45044372 AcousticNASA Acoustic Van 2 mic N10A 140 1950 -1494 -1253 38.93561349 -77.45022118 AcousticNASA Acoustic Van 2 mic N11A 155 1950 -1767 -824 38.93424189 -77.44985674 AcousticNASA Acoustic Van 2 mic N12 165 1950 -1884 -505 38.93334105 -77.44985950 AcousticNASA Acoustic Van 2 mic N13 180 1950 -1950 0 38.93195737 -77.45028411 AcousticNASA Acoustic Van 2 mic N14 195 1950 -1884 505 38.93072243 -77.45112207 AcousticNASA Acoustic Van 2 mic N15A 140 2500 -1915 -1607 38.93610901 -77.44840779 AcousticNASA Acoustic Van 2 mic N16 180 2500 -2500 0 38.93142382 -77.44847377 AcousticNASA Acoustic Van 2 mic N17A 140 3500 -2681 -2250 38.93701187 -77.44508845 AcousticVolpe Acoustic System V7 180 3500 -3500 0 38.93045647 -77.44518064 Acoustic/Wind Speed/Wind DirectionVolpe Acoustic System V8 180 4400 -4400 0 38.92958475 -77.44222587 Acoustic/Wind Speed/Wind DirectionVideo Tracking System 1 TRACK1 NA 1213 449.5 1126.2 38.93138737 -77.45957142 Aircraft PositionVideo Tracking System 2 TRACK2 NA 3133 2617.2 -1722.9 38.94080657 -77.46317287 Aircraft PositionMeteorological Station MET NA 292 -250 -150 38.93212000 -77.45447000 Wind Speed/Wind Direction/Temp/RH/BPTail Logging System (Primary) LOG1 NA 292 -250 -150 38.93212000 -77.45447000 Aircraft Tail NumbersTail Logging System (Secondary) LOG2 NA 922 200 900 38.93138737 -77.45957142 Aircraft Tail NumbersOrigin Origin NA 0 0 0 38.93384721 -77.45670386 NA
Data TypeLocal Coordinates dGPS Actual CoordinatesIDInstrumentation Angle (deg) Distance
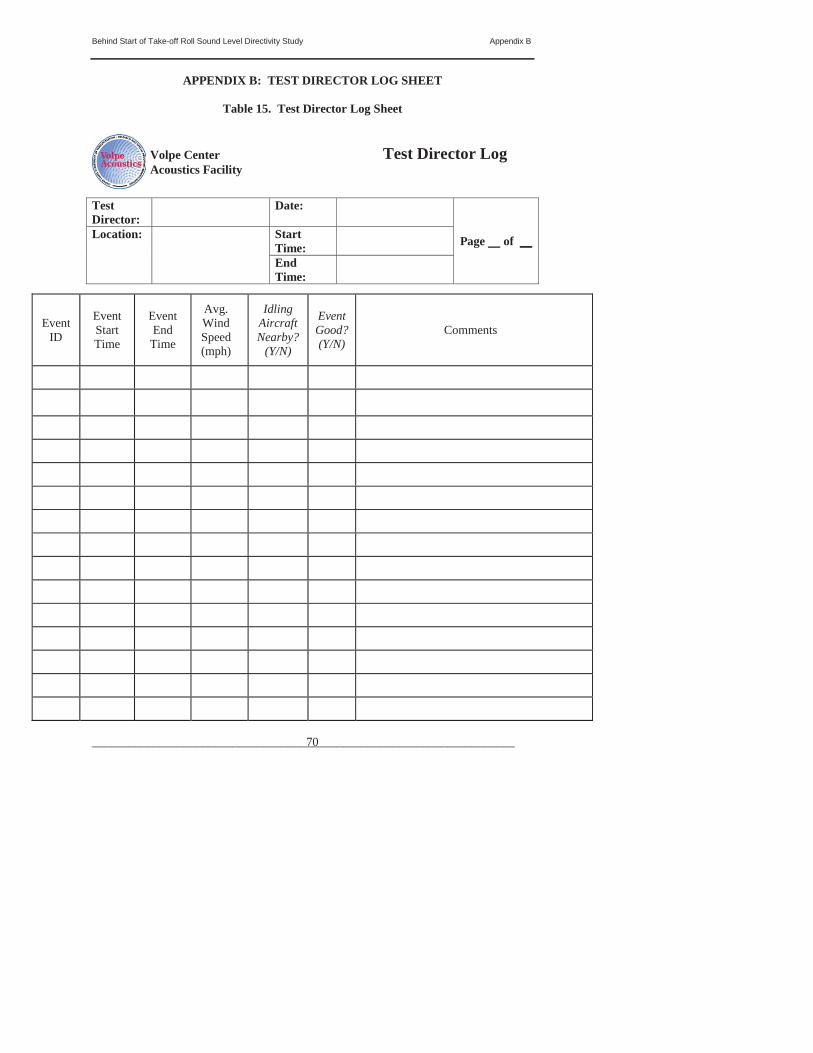
Behind Start of Take-off Roll Sound Level Directivity Study Appendix B
_____________________________________________________________________ 70
APPENDIX B: TEST DIRECTOR LOG SHEET
Table 15. Test Director Log Sheet
Volpe Center Test Director Log Acoustics Facility
TestDirector:
Date:
Page of __Location: StartTime:EndTime:
EventID
EventStartTime
EventEnd Time
Avg. Wind Speed(mph)
Idling AircraftNearby?
(Y/N)
EventGood? (Y/N)
Comments
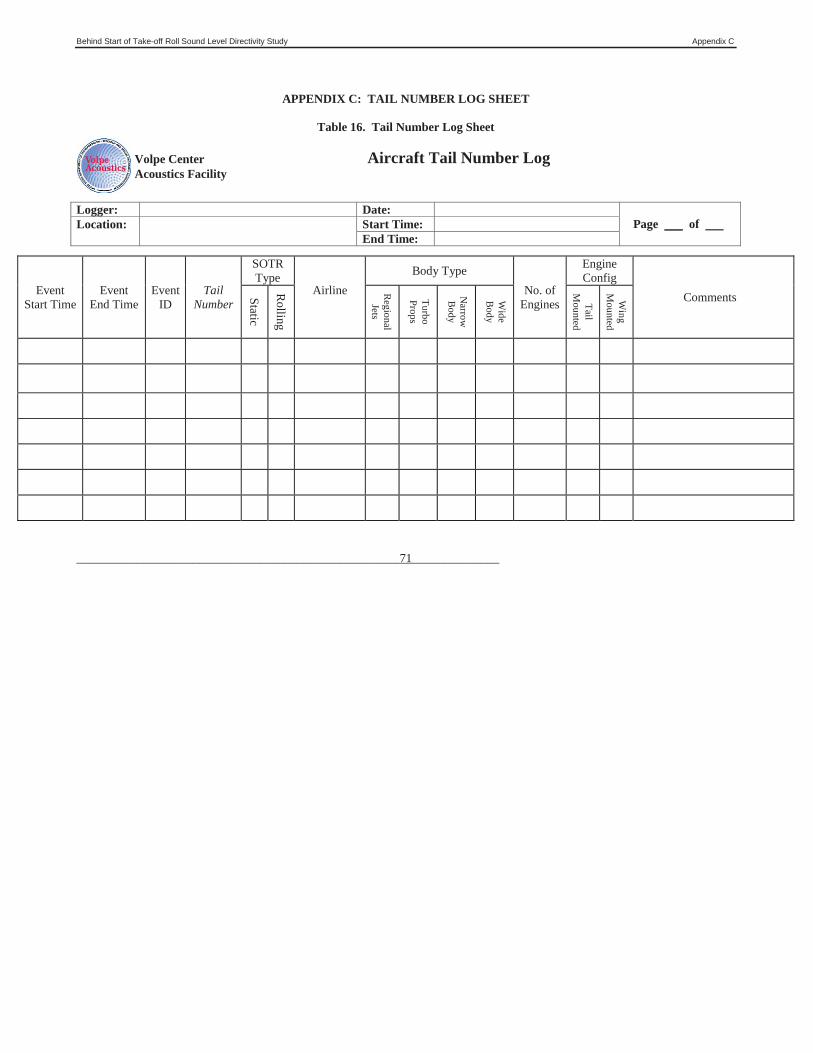
Behind Start of Take-off Roll Sound Level Directivity Study Appendix C
_____________________________________________________________________ 71
APPENDIX C: TAIL NUMBER LOG SHEET
Table 16. Tail Number Log Sheet
Volpe Center Aircraft Tail Number Log Acoustics Facility
Logger: Date:Page of .Location: Start Time:
End Time:
EventStart Time
EventEnd Time
EventID
TailNumber
SOTRType
AirlineBody Type
No. ofEngines
EngineConfig
CommentsStatic
Rolling
RegionalJets
Turbo Props
Narrow
Body
Wide
Body
TailM
ounted
Wing
Mounted

Behind Start of Take-off Roll Sound Level Directivity Study Appendix D
_____________________________________________________________________ 72
APPENDIX D: VOLPE NOISELOGGER SYSTEM SETUP
Figure 50. Volpe NoiseLoggerTM System Setup

Behind Start of Take-off Roll Sound Level Directivity Study Appendix E
_____________________________________________________________________ 73
APPENDIX E: DIRECTIVITY PATTERNS AT 1950 FT
Figure 51. Airbus A310 Directivity Pattern at 1950 ft (1 Event)
Figure 52. Airbus A319 Directivity Pattern at 1950 ft (16 Events)

Behind Start of Take-off Roll Sound Level Directivity Study Appendix E
_____________________________________________________________________ 74
Figure 53. Airbus A320 Directivity Pattern at 1950 ft (48 Events)
Figure 54. Airbus A330 Directivity Pattern at 1950 ft (4 Events)
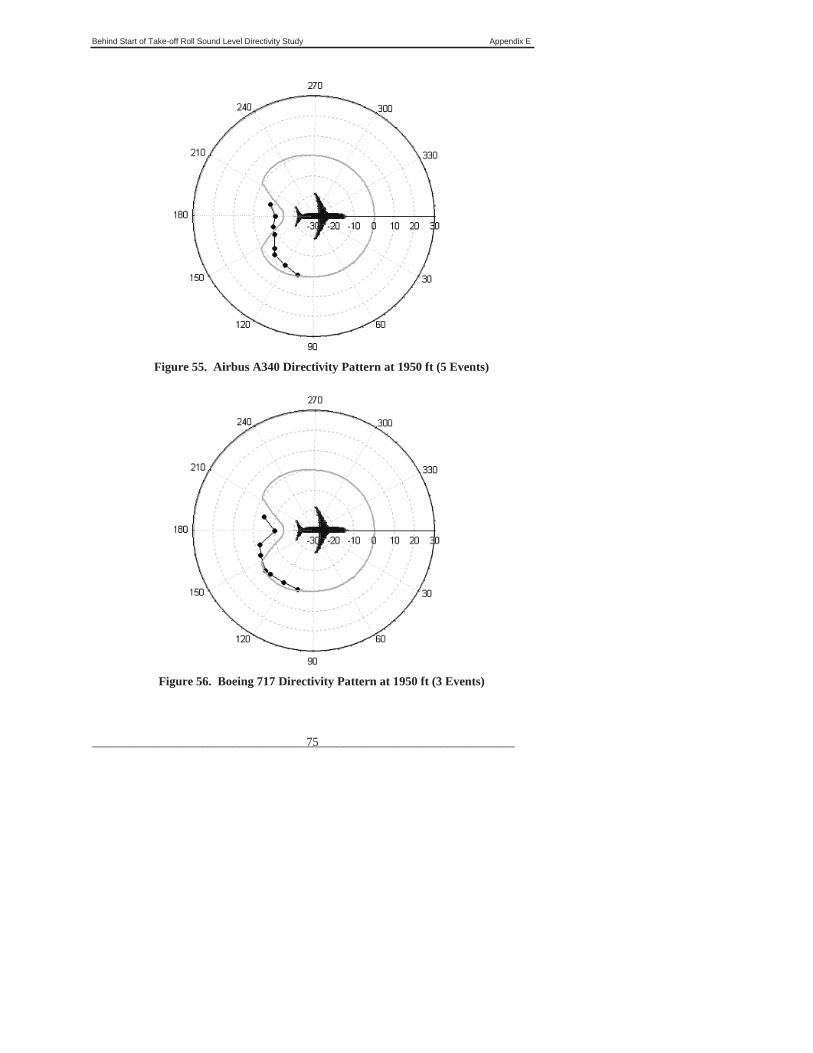
Behind Start of Take-off Roll Sound Level Directivity Study Appendix E
_____________________________________________________________________ 75
Figure 55. Airbus A340 Directivity Pattern at 1950 ft (5 Events)
Figure 56. Boeing 717 Directivity Pattern at 1950 ft (3 Events)

Behind Start of Take-off Roll Sound Level Directivity Study Appendix E
_____________________________________________________________________ 76
Figure 57. Boeing 737 Directivity Pattern at 1950 ft (20 Events)
Figure 58. Boeing 747 Directivity Pattern at 1950 ft (7 Events)

Behind Start of Take-off Roll Sound Level Directivity Study Appendix E
_____________________________________________________________________ 77
Figure 59. Boeing 757 Directivity Pattern at 1950 ft (12 Events)
Figure 60. Boeing 767 Directivity Pattern at 1950 ft (27 Events)
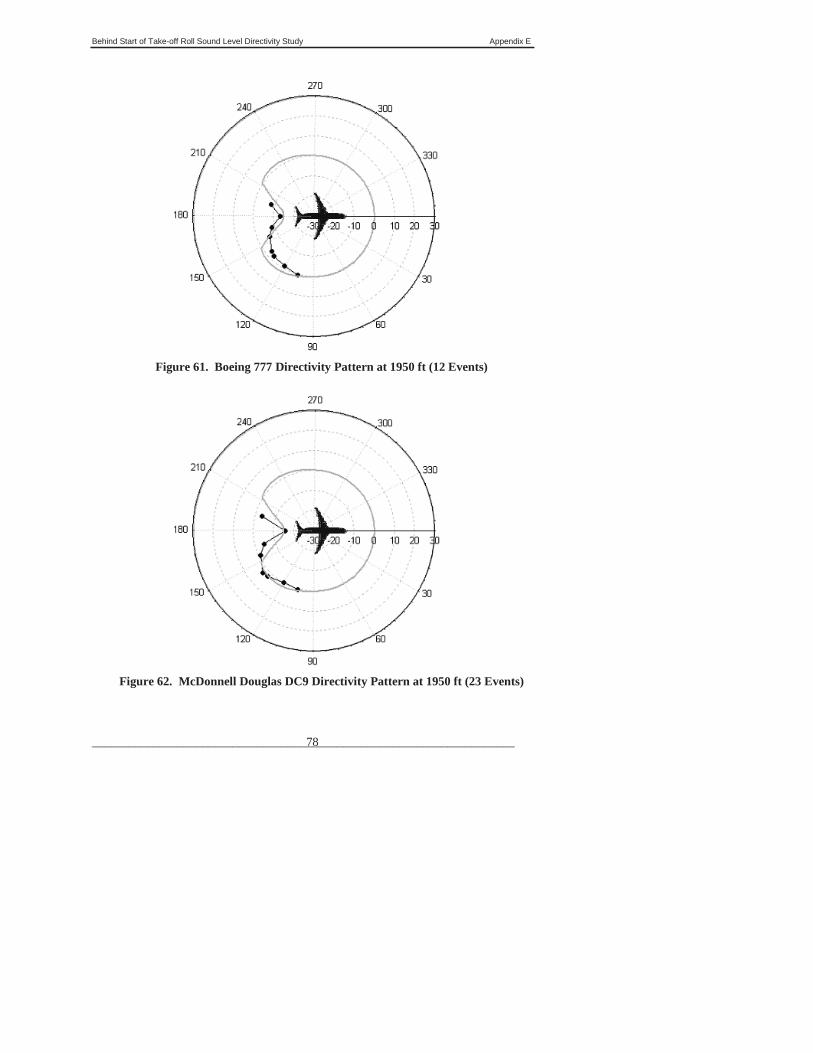
Behind Start of Take-off Roll Sound Level Directivity Study Appendix E
_____________________________________________________________________ 78
Figure 61. Boeing 777 Directivity Pattern at 1950 ft (12 Events)
Figure 62. McDonnell Douglas DC9 Directivity Pattern at 1950 ft (23 Events)
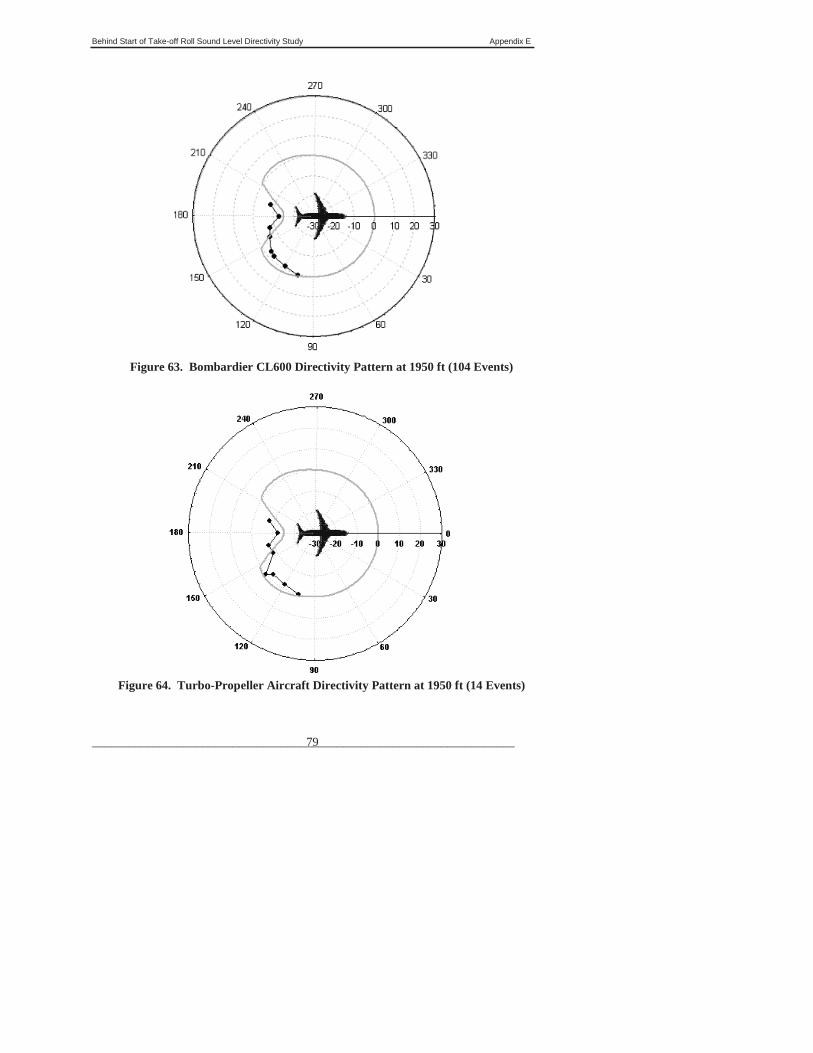
Behind Start of Take-off Roll Sound Level Directivity Study Appendix E
_____________________________________________________________________ 79
Figure 63. Bombardier CL600 Directivity Pattern at 1950 ft (104 Events)
Figure 64. Turbo-Propeller Aircraft Directivity Pattern at 1950 ft (14 Events)

Behind Start of Take-off Roll Sound Level Directivity Study Appendix E
_____________________________________________________________________ 80
APPENDIX F: AIRCRAFT FLEET PERCENTAGE FOR DIRECTIVTYADJUSTMENT DERIVATION
Two sets of -weighted SOTR directivity adjustments were developed; one for jet aircraft,and the other for turboprop aircraft.
For jet aircraft, a fleet-weighted regression was fitted to the average sound exposure leveldata measured for each aircraft type to develop the SOTR directivity adjustment. Theregression weighting factors were chosen, such that aircraft were represented inproportion to their relative operational presence in the 2005 global fleet*. The number of2005 operations and corresponding percentage of each of the jet aircraft measured ispresented in Table 17. As shown in the rightmost column, the aircraft measured during this study represent 85% of the total operations in 2005.
The weighting factors applied to the average noise level (in decibels) for each aircraft ateach azimuth angle behind SOTR reflect the percentage of the measured jet fleet. Themeasured jet fleet is not inclusive of all aircraft in the total fleet (15% of the 2005 operations were jet aircraft not available within the measured data and 23% of theoperations were propeller aircraft). Thus, weighting factors reflect only the jet aircraftincluded in the measurement data. For example, the Airbus A319 represents only 5% oftotal operations in 2005, but 9% of operations when only those corresponding to aircraftin the measured jet fleet are considered. Thus, weighting factor of 9 was applied to thedata for the Airbus A319†.
* AEDT Common Operations Database (COD) for the FAA Destination 2025 environmental inventory ofthe calendar year 2005. † Weighting factors were entered as integers, and the total of all weighting factors equaled 100.

Behind Start of Take-off Roll Sound Level Directivity Study Appendix E
_____________________________________________________________________ 81
Table 17. Jet Aircraft Fleet Percentages for Directivity Adjustment Derivation
Aircraft
Airbus A319 9 5%Airbus A320 14 9%Airbus A330 2 1%Airbus A340 1 1%Boeing 717 2 1%Boeing 737 43 27%Boeing 747 4 2%Boeing 757 7 4%Boeing 767 5 3%Boeing 777 3 2%McDonnell Douglas DC-9 2 1%Bombardier CL-600 8 5%Propeller Aircraft 23%Not Measured
Total:
For turboprop aircraft, a standard regression fitting process was used to develop theSOTR directivity adjustment. The regression was computed using all data from theevents measured. No weighting factor was applied, as the measured data set was small(14 events) and cannot adequately represent the turboprop fleet. The measured datasetincludes the Saab SF340 (10 of 14 events), Cessna 425 (1 of 14 events), Rockwell 690B(2 of 14 events) and Beech 1900D (1 of 14 events).