belgian national burden of disease study
TRANSCRIPT
BELGIAN NATIONAL
BURDEN OF DISEASE
STUDY
Guidelines for the calculation of DALYs in Belgium
–
Astrid CORNEZ • Brecht DEVLEESSCHAUWER
January 2020, Brussels, Belgium

2
CONTENTS
1. GENERAL OUTLINE ................................................................................................................................. 4
1.1 Introduction .............................................................................................................................................. 4
1.2 Objectives ................................................................................................................................................. 6
1.3 Implementation ........................................................................................................................................ 7
1.4 Management ............................................................................................................................................. 8
1.5 Methodological choices .......................................................................................................................... 9
1.6 Outline of the guidelines ....................................................................................................................... 11
2. YEARS OF LIFE LOST ........................................................................................................................... 12
2.1 Introduction ............................................................................................................................................ 12
2.2 Source of mortality data ........................................................................................................................ 12
2.3 Allocating deaths to causes .................................................................................................................. 13
2.4 Redistribution of ill-defined deaths ...................................................................................................... 13
2.5 Expert evaluation of methods and results ........................................................................................... 15
3. YEARS LIVED WITH DISABILITY .......................................................................................................... 16
3.1 Introduction ............................................................................................................................................ 16
3.2 Prioritization of outcomes ..................................................................................................................... 16
3.3 Establishment of case definition for outcomes .................................................................................. 18
3.4 Identification of data sources ............................................................................................................... 19
3.5 Evaluation of data sources ................................................................................................................... 24
3.6 Quantification of “best” estimates ....................................................................................................... 27
3.7 Review of disease models ..................................................................................................................... 27
3.8 Calculation of YLDs ............................................................................................................................... 29
3.9 Expert evaluation of methods and results ........................................................................................... 30
4. CANCER .................................................................................................................................................. 31
4.1 Introduction ............................................................................................................................................ 31
4.2 Data source ............................................................................................................................................ 31
4.3 Disease model ........................................................................................................................................ 31
4.4 DALY calculation ................................................................................................................................... 34
5. REFERENCES ........................................................................................................................................ 35
ANNEX 1. TOP 30 SPECIFIC CAUSES OF DALYS ACCORDING TO WHO GLOBAL HEALTH
ESTIMATES 2016 ................................................................................................................................................. 38
ANNEX 2. GBD2017 THEORETICAL MINIMUM RISK REFERENCE LIFE TABLE ........................................... 40
ANNEX 3. DISEASE-SPECIFIC METHODS ........................................................................................................ 41

3
ACKNOWLEDGMENTS
The Belgian National Burden of Disease Study (BeBOD) is an initiative of the Lifestyle and
Chronic Disease Service, Department of Epidemiology and Public Health, Sciensano.
BeBOD is conducted as part of the Health Status Report project, and receives financial
support of the National Institute for Health and Disability Insurance.

4
1. General outline
1.1 INTRODUCTION
The main goal of public health policy is to protect and promote the population's health. This
requires information on the health status of the population, often referred to as the "burden
of disease". More than just the presence/absence of specific diseases and conditions,
disease burden encompasses a comprehensive and comparable quantification of the
physical and psychosocial health impact of diseases, injuries and risk factors
(Devleesschauwer et al., 2014).
Evidence on the disease burden is important for decision-making processes within the health
sector. In order to make relevant decisions and set appropriate priorities, policy makers need
to be informed about the size of health problems in the population, the groups that are
particularly at risk, and the health trends over time. In addition, an accurate estimate of the
population's health status can be used for determining expected health care use and is vital
for prioritizing effective interventions and evaluating their impact and cost-effectiveness
(Tan-Torres Edejer et al., 2003).
The disease burden of a population can be described by a variety of indicators. Indeed,
population health is a multifactorial phenomenon with many facets and different ways to
measure it. Typical indicators of population health are life expectancy, cause-specific
mortality rates, numbers of new and existing cases of specific diseases (i.e., incidence and
prevalence), and self-perceived health. However, these indicators highlight only one facet of
public health, i.e., either mortality or morbidity.
Summarizing population health in terms of mortality-based indicators, such as life
expectancy, dates from the time when only reliable data for mortality existed. In many
countries, however, one has been confronted with a demographic and epidemiological
transition, replacing the importance of early mortality due to plagues and famine by that of
chronic, non-communicable diseases (Marshall, 2004). Cardiovascular diseases and
cancers have replaced infectious diseases as the main causes of death. However, these
diseases are also associated with an important morbidity component, due to the life
prolonging effect of continuously improving medical practice (Jelenc et al., 2012). Moreover,
not only an extended life expectancy per se is desired, living these extra years in good
health has become just as important (Cleemput et al., 2014). As a result, current health
policy requires a global overview of population health, one that combines morbidity and
mortality and takes into account health-related quality of life (Robine et al., 2013).

5
Given the importance of combining morbidity and mortality, the last few decades have seen
important methodological advances in so-called summary measures of population health
(SMPH) (Murray et al., 2000). By and large, SMPHs may be divided into two broad families,
namely health expectancies and health gaps. Metrics of each family combine morbidity and
mortality into a single figure. Health expectancy-based metrics, such as Disability-Free Life
Expectancy, Healthy Life Years, and Disability-Adjusted Life Expectancy, translate these
indicators into a health-adjusted life expectancy (Robine et al., 2013). Health gap metrics,
such as the Disability-Adjusted Life Year (DALY), translate these indicators into a number of
life years lost due to ill health and mortality.
Driven by the Global Burden of Disease (GBD) projects initiated in the early 1990s (Murray
and Lopez, 1996), the DALY has become the key SMPH for quantifying burden of disease.
DALYs measure the health gap from a life lived in perfect health, and quantify this health
gap as the number of potentially healthy life years lost due to morbidity, disability and
mortality. A disease burden of 100 DALYs per 1000 people-year would thus imply a loss of
100 healthy life years per 1000 people per year. Diseases or risk factors accounting for more
DALYs thus have a higher population health impact. By quantifying the total disease burden
and the contribution of different diseases and risk factors, DALYs are a highly valuable
measure to set priorities for public health research and policy. Furthermore, DALYs may be
calculated for different (sub)populations (e.g. gender, geographical areas, socioeconomic
groups), allowing for a more detailed perspective on population health. By regularly updating
the DALY estimates based on the best available data, trends in population health can be
monitored over time, and the impact of macro-level policies can be evaluated. As a result,
DALYs are an important tool to support policies that aim to improve population health and
reduce health inequalities (Ikram et al., 2014).
Estimates on the burden of disease in Belgium, expressed as DALYs, are available from
both international and national efforts. To date, the most comprehensive sources of disease
burden estimates for Belgium are the GBD studies conducted by the World Health
Organization
[https://www.who.int/healthinfo/global_burden_disease/estimates/en/index1.html] and by the
Institute for Health Metrics and Evaluation (IHME) [http://www.healthdata.org/Belgium].
These studies showed that non-communicable diseases dominate the overall disease
burden, while tobacco smoking, dietary risks, and alcohol use are the major behavioral risk
factors for ill health. So far, only few national efforts have been undertaken to study the
disease burden in Belgium. The use of DALYs as a policy-relevant instrument in Belgium
was first described in the Flemish Health Indicator Report 1998 (Baert et al., 2000). To
demonstrate the use of DALYs, the authors initiated a pilot study, in collaboration with

6
Sciensano, in which they quantified the Flemish disease burden for reference year 1997
(Baert et al., 2002). The Flemish Institute for Technological Research (VITO) assessed the
burden of environmental risk factors in Flanders, commissioned by the Flemish Environment
Agency (Buekers et al., 2012). In addition to these larger studies, several researchers
estimated the burden of specific health conditions in Belgium, i.e., transportation noise in
Flanders (Stassen et al., 2008), road traffic accidents in Flanders and Brussels (Dhondt et
al., 2013), haemophilia in Belgium (Henrard et al., 2014), melanoma in Belgium (Pil et al.,
2016; Tromme et al., 2016), and legal and illegal drugs in Belgium (Lievens et al., 2016).
Despite these efforts, several constraints can be identified that hamper the policy relevance
of the currently available estimates. While global estimates provide a broad overview of the
health status in Belgium, it remains a question to what extent these estimates are grounded
in the best available local data. These global exercises are currently also not able to respond
to country-specific needs, such as the need for regional burden disaggregation. They also
present hurdles in terms of timeliness and ownership. While national research groups did
more efforts to apply local data sources, there appears to be little consistency in the applied
DALY calculation methodology. As a result, the nationally generated estimates are not
comparable, hampering the main use of DALYs as a tool for comparison and prioritization.
Most DALY estimations also remained academic exercises, with little or no direct knowledge
transfer to the concerned policy instances. Therefore, if disease burden were to support
health policy, a more systematic approach is required, generating comparable estimates
rooted in recent, local data.
1.2 OBJECTIVES
Given the need for disease burden estimates to guide decision-making processes within the
health sector and the limitations of the currently available burden estimates, Sciensano has
taken the lead in launching a Belgian National Burden of Disease Study, BeBOD, which
builds on a coherent framework for routinely quantifying the burden of disease in Belgium
using the DALY metric. The project is conducted as part of the Health Status Report project,
and receives financial support of the National Institute for Health and Disability Insurance.
Implementing a national burden of disease study addresses several of the limitations of the
currently available burden estimates:
Ownership and sustainability are guaranteed.
The study can be maximally embedded within the local context. Indeed, Sciensano and
its partners have established expertise in the use and valorization of the various Belgian
health information systems. As a result, they have access to more, better, and more up-
to-date data than international groups. Furthermore, they have the necessary contextual

7
knowledge to properly interpret and appraise the available data and the resulting burden
estimates. Finally, they have established modes of interaction with federal and regional
policy-makers and stakeholders, supporting credibility and maximizing knowledge
transfer.
Methodological flexibility and transparency is ensured. Instead of relying on external
analyses or global interpolations, BeBOD allows making own assumptions and setting
own priorities. By adopting a harmonized methodology across health causes,
transparency of the resulting burden estimates is ensured.
The process as such benefits capacity building. In addition to the results of the project,
the process of implementing a national burden of disease study also has important
indirect outcomes. Indeed, the project is an impetus to appraise the quality of the local
data and to address data gaps. Furthermore, the project also leads to substantial
scientific capacity building, thereby increasing awareness and strengthening critical
mass in Belgium, and furthering the scientific process.
Despite these benefits, it is also important to acknowledge the limitations of the BeBOD
project. First, it should be clear that BeBOD will not be able to answer all possible policy-
relevant questions. Indeed, the project allows measuring problems, but not their solutions.
Burden estimates identify potential for health gain and unmet needs, but do not replace cost-
effectiveness studies. Furthermore, when prioritizing diseases, it should be clear that health
impact is just one of the many aspects that can be considered. Other factors include
economic impact, general awareness, stakeholder interests, epidemic potential, and
possible "shock" effects of rare but severe conditions.
1.3 IMPLEMENTATION
In 2001, the World Health Organization published guidelines for countries wishing to
undertake a national burden of disease study (Mathers et al., 2001). They described the
different steps in a national burden of disease study as follows:
1. Make the necessary methodological choices
- levels of analysis: year, age groups, sexes, causes, sub-populations
- social values
2. Establish a demographic baseline
3. Perform a cause of death analysis
4. Perform an epidemiological description non-fatal outcomes
5. Evaluate internal consistency of epidemiological estimates
6. Calculate YLLs, YLDs, DALYs, and HALE

8
7. Perform a comparative risk assessment
8. Perform a sensitivity analysis
9. Disseminate results
The overall philosophy of BeBOD consists of a stepwise implementation of these steps and
a gradual scaling-up of activities and capacity. As far as possible, routine data sources are
used (Figure 1), allowing the implementation of a framework for routinely quantifying the
burden of disease in Belgium. BeBOD estimates the true disease burden in a transparent
way, and includes actions to expand ownership of data and results. For each of the specific
steps in the project, the subsequent chapters and annexes document the methodological
choices.
Figure 1. Data needs for the Belgian National Burden of Disease project
1.4 MANAGEMENT
BeBOD is managed by Sciensano and followed up by a steering committee comprised of
external experts.
General coordinator
Develop support tools (e.g., DALY calculation guidelines, DALY calculation workshop,
and DALY calculation tools)

9
Initiate, support and harmonize DALY initiatives
Interact with stakeholders
Act as link with national burden of disease studies in other countries and with related
international activities (such as the WHO/EURO European Burden of Disease Network
and the COST Action CA18218 www.burden-eu.net)
Scientific collaborators across Sciensano units
Act as link between BeBOD coordinator and unit
Identify ongoing DALY activities within the unit
Explore opportunities for new DALY activities within the unit
Follow-up on progress of ongoing and new DALY activities within the unit
Interact with unit-specific stakeholders: put burden of disease on the agenda
Steering committee
Follow-up on project progress through annual meetings
Provide technical feedback through reviewing technical reports
Identify opportunities for further developing resources and capacities (e.g., new
collaborations, projects, human resources …)
The steering committee is composed of representatives from the following partner
organizations:
FPS Public Health, Environment and Food Safety
RIZIV-INAMI
Vlaams Agentschap Zorg en Gezondheid (VAZG)
Agence pour une Vie de Qualité (AViQ)
Brussels-Capital Health and Social Observatory
Statbel
InterMutualistic Agency (IMA-AIM)
Academia
1.5 METHODOLOGICAL CHOICES
1.5.1 Levels of analyses
BeBOD adopts the list of disease and injury categories used for the Global Burden of
Disease study (Murray et al., 2012). This classification system corresponds to a tree
structure of causes of death, with four levels of disaggregation and more than 100 specific
diseases and injuries. The first level defines three broad groups of causes: Group I,
consisting of communicable diseases, maternal causes, conditions arising in the perinatal

10
period and nutritional deficiencies, Group II encompassing the non-communicable diseases;
and Group III, comprising intentional and unintentional injuries. Each group has been divided
into several sub-categories of disease and injury that are mutually exclusive and exhaustive.
A third level of disaggregation is used to identify more specific causes within each of the
subcategories. Finally, for some level 3 causes, a fourth level of disaggregation is provided,
specifying further subtypes of the cause.
Given the currently limited resources for the BeBOD project, initial priority is given to
conditions that are estimated by IHME and WHO to cause the greatest health burden in
Belgium (e.g., the DALY top 30) (Annex 1).
The reference population for BeBOD is the Belgian population as defined by the national
registry. Subnational estimates are generated for the Flemish, Walloon and Brussels-Capital
region.
The reference year for BeBOD is the most recent year for which validated cause-of-death
data are available. At the moment of writing, the reference year is 2016.
Estimates are generated by sex and age, with age group breaks compatible to (0, 1, 5, 10,
15, …, 85+). Results are presented by sex and broad age groups, i.e., 0-4, 5-14, 15-44, 45-
64, and 65+.
1.5.2 DALY calculation methods
The calculation of Years of Life Lost (YLLs) is based on the standard life expectancy table
used in the most recent Global Burden of Disease study. At the moment of writing, this
would correspond to the standard life expectancy table developed for the GBD 2017 study
(Murray et al., 2012; Annex 2).
Years Lived with Disability (YLDs) are calculated from a prevalence perspective for non-
communicable and chronic diseases. This choice reflects the common use of prevalence to
monitor chronic diseases (although exceptions exist), and is in line with the GBD study.
Disability weights for the calculation of YLDs are the set used in the most recent Global
Burden of Disease study. At the moment of writing, this corresponds to the set developed for
the GBD 2013 study (Salomon et al., 2015).
In the initial phase of the project, no external comorbidity adjustments are performed. This
implies that disability weights are added when causes occur simultaneously.
Age weighting and time discounting functions are not applied, in line with current GBD
methods.

11
1.5.3 Data adjustments
BeBOD aims to estimate the true disease burden, implying that biases in these data sources
are evaluated and corrected, and best estimates are generated for the intermediary
epidemiological parameters. In the initial phase of the project, no models are implemented to
enforce internal consistency between epidemiological parameters.
1.5.4 Uncertainties
Throughout all steps, uncertainties are documented, quantified, and propagated. In the initial
phase of the project, no formal sensitivity analyses are performed. Scenario analyses are
performed on an ad hoc basis, if warranted by model uncertainties.
1.6 OUTLINE OF THE GUIDELINES
The following sections of the guidelines describe in more detail the methods used for key
elements of the BeBOD study:
Years of Life Lost
Years Lived with Disability
Cancer

12
2. Years of Life Lost
2.1 INTRODUCTION
Disability-Adjusted Life Years (DALYs) are composed of years of life lost due to premature
mortality (YLLs) and years lived with disability, adjusted for severity (YLDs):
𝐷𝐴𝐿𝑌 = 𝑌𝐿𝐿 + 𝑌𝐿𝐷
The YLL component reflects the impact of fatal health outcomes. For each considered
cause, YLLs are obtained by multiplying the age specific number of deaths with the standard
expected residual life expectancy at age of death:
𝑌𝐿𝐿 =∑𝑀𝑖 ∗ 𝑅𝐿𝐸𝑖
𝑎
𝑖=1
where 𝑖 = 1,… , 𝑎 is one of a considered age groups, 𝑀𝑖 the age specific number of deaths
due to the outcome, and 𝑅𝐿𝐸𝑖 the age-specific residual life expectancy.
For the BeBOD study, a decision has been made to use the most recent GBD life
expectancy table. At the moment of writing, this corresponds to the life expectancy table
used in the GBD 2017 study. The corresponding age specific residual life expectancy values
are provided in Annex 2.
According to the WHO national burden of disease manual (Mathers et al., 2001), countries
with good vital registration systems such as Belgium can directly estimate YLLs from these
data, considering adjustments for incompleteness and miscertification. In what follows, we
described the different steps leading to the estimation of YLLs.
2.2 SOURCE OF MORTALITY DATA
Cause of death and population data for Belgium are provided by Statistics Belgium (Statbel),
the directorate in charge of the production of vital statistics at the national level. The causes
of death are specified in death certificates by a medical doctor; they are subsequently coded
according to the ICD-10 rules by trained staff within two regional Health Agencies (one for
Flanders and Brussels, one for Wallonia), before being pooled at the national level by
Statistics Belgium. Regular coordination meetings between the regional and federal levels
are organized in order to guarantee consistency in the coding/registration rules.
Deaths of non-residents are not excluded, as these account for only a minor proportion of all
deaths registered in Belgium.

13
2.3 ALLOCATING DEATHS TO CAUSES
In a first step, the ICD-10 coded definition of the underlying cause of death is mapped to the
GBD cause list (GBD 2017 Mortality and Causes of Death Collaborators, 2018). The GBD
cause list arranges the 350 causes of health loss studied within the GBD in hierarchical
nested categories – referred to as “levels”. At the highest level, causes are split into very
large categories: communicable, maternal, neonatal, and nutritional causes; non-
communicable diseases; and injuries. Within each of those categories, causes of health loss
are broken down with increasing specificity at each level. For example, consider acute
myocardial infarct, which is a level 4 cause in the GBD cause list:
Level 1: Non-communicable diseases
Level 2: Cardiovascular diseases
Level 3: Ischemic heart disease
Level 4: Acute myocardial infarct
The cause list is mutually exclusive and collectively exhaustive at every level of aggregation;
causes not individually specified are captured in residual categories, such as “other intestinal
infectious diseases.”
2.4 REDISTRIBUTION OF ILL-DEFINED DEATHS
When assigning each individual death on the basis of the ICD-10 code, the majority of ICD-
10 codes are directly assigned to a specific cause of death. In some cases, the ICD-10 code
is assigned to what are termed ill-defined causes of death (IDD) in burden of disease
studies. These IDDs are causes of death that have been coded with ICD-10 codes in vital
registers but for the purposes of burden of disease studies, are not regarded as sufficiently
specific causes of death. These IDDs therefore need to be redistributed amongst specific
causes of death across the burden of disease cause list. Specific examples of IDDs include
the following:
Causes that should not be considered as the underlying cause or that are implausible as
a cause of death, such as hypertension and paraplegia;
Intermediate causes: causes such as septicemia and pneumonitis that likely had some
other precipitating cause;
Immediate causes: causes that are generally observed as modes of dying, such as
cardiac arrest, heart failure and respiratory failure; and
Causes that are ill-defined or unspecified within a larger ICD cause group; for example,
C26.0 “Malignant neoplasm of intestinal tract, part unspecified”, or R99 “Ill-defined and
unknown cause of mortality”.

14
The BeBOD study reclassifies IDDs to cause-specific deaths respecting the methods which
have been utilized in the GBD studies (Murray et al., 2012; Zhou et al., 2016; GBD 2015
Mortality and Causes of Death Collaborators, 2016), and adapted by the Scottish Public
Health Office (ScotPHO) for their national burden of disease study.
The redistribution algorithm defines a set of IDD groupings and each IDD has a number of
target causes upon which the IDD death should be allocated to. In the GBD study, this is
done either using fixed coefficients or based on a regression model (Ahern et al., 2011). The
latter method is not implemented as part of the BeBOD study because it requires data from
multiple countries. Instead the IDD are redistributed to the target cause-specific diseases
respecting their relative proportions by sex and age group (<1, 1-4, 5-14, 15-49, 50-59, 60+).
The relative proportions are calculated based on all deaths in Belgium during the 5-year-
period prior to the reference year. For each IDD, a specific cause is simulated based on the
age and sex specific relative proportions. When no target specific causes are observed for a
given age and sex group, each target cause receives an equal weight. The simulation
process is repeated 100 times, thus resulting in 100 datasets containing only specific
causes. The random draws are summarized by their mean and a 95% uncertainty interval.
The IDDs can be classified in two different ways:
According to the level of redistribution
Level 0 includes all garbage codes for which a Level 1 GBD cause cannot be directly
assigned. For example, the underlying causes of sepsis or peritonitis, if not specified in
the data, could be an injury, a non‐communicable disease, or a type of communicable
disease. In these cases, deaths are redistributed across all three of these Level 1
causes. In addition, deaths coded to impossible or ill‐defined causes of death, including
senility and unspecified causes, fall into this category, as they are redistributed onto all
causes.
Level 1 includes all garbage codes that can be assigned to one specific Level 1 cause in
the GBD cause list. This would include deaths coded to unspecified injuries (X59), which
are redistributed onto all injuries.
Level 2 includes all garbage codes for which we know the Level 2 cause of death, and
can redistribute onto Level 3 causes. This includes deaths coded to causes such as
unspecified cardiovascular disease, which falls within the Level 2 cause cardiovascular
diseases, as well as those coded to unspecified cancer site, which falls within the Level 2
neoplasms cause.

15
Level 3 includes all garbage codes for underlying causes of death that can be
redistributed within a Level 3 cause. This includes garbage codes such as “unspecified
stroke” or “unspecified road injuries.”
According to the redistribution target
Target distributions defined in terms of ICD codes. This covers the largest proportion of
IDDs.
Target distributions defined in terms of GBD causes. This only covers a minor proportion
of IDDs.
Target distribution corresponding to all causes. For the sake of computational simplicity,
these IDDs are redistributed to all GBD causes, because the number of GBD causes is
much smaller than the number of ICD codes.
The three types of redistribution targets are implemented in a sequential way. First, all ICD-
based redistributions are performed. Then, the GBD cause-based redistributions are
performed, using the dataset resulting from the previous step to define the target distribution.
Finally, the remaining IDDs are redistributed to all causes, using the dataset resulting from
the previous two steps to defined the target distribution.
2.5 EXPERT EVALUATION OF METHODS AND RESULTS
Expert evaluations are set up to assess and evaluate the proposed methods and the
ensuing results, in particular those of the redistribution of IDDs. The expert group comprises
representatives of Statbel and the Belgian Mortality and Cause of Death evaluation group.

16
3. Years Lived with Disability
3.1 INTRODUCTION
Disability-Adjusted Life Years (DALYs) are composed of years of life lost due to premature
mortality (YLLs) and years lived with disability, adjusted for severity (YLDs):
𝐷𝐴𝐿𝑌 = 𝑌𝐿𝐿 + 𝑌𝐿𝐷
The YLD component reflects the impact of non-fatal health outcomes. In BeBOD, a
prevalence approach is applied for estimating YLDs for non-communicable diseases:
𝑌𝐿𝐷 = 𝑝 ∗ 𝐷𝑊
where 𝑝 is the prevalence of the outcome and 𝐷𝑊 the associated disability weight.
This definition thus implies a need to derive age and sex specific prevalence estimates for all
relevant non-fatal outcomes, as well as corresponding disability weights.
The World Health Organization provides a general step-by-step description of how to
proceed with estimating YLDs (WHO, 2001). Based on this description, we define the
following stepwise approach to estimate Belgian YLDs:
1. Prioritization of outcomes
2. Establishment of case definition for outcomes
3. Identification of data sources
4. Evaluation of data sources
5. Quantification of prevalence “best estimate”
6. Review of disease models
7. Calculation of YLDs
8. Expert evaluation of methods and results
For each individual outcome, the selected methods are documented in a dedicated technical
appendix.
An exception to this general approach for calculating YLDs is cancer, for which the starting
point is an incidence-based disease model. The specific methods for this group of conditions
are explained in more detail in Chapter 4.
3.2 PRIORITIZATION OF OUTCOMES
Since there is no single comprehensive data source on prevalence of non-fatal health
outcomes in Belgium, each outcome (or outcome cluster) needs to be addressed in an ad
hoc way. This calls for a prioritization procedure, which would ensure that 1) available
17
knowledge and resources are optimally used, and 2) the top causes of disease burden are
addressed. The following prioritization process is therefore applied:
Top causes of disease burden in Belgium based on the WHO Global Health Estimates
(but excluding ill-defined outcomes)
Outcomes for which Sciensano has specific expertise and resources
Annex 1 shows the top 30 outcomes per the WHO Global Health Estimates 2016. Among
these outcomes, Sciensano has specific knowledge and resources related to malignant
neoplasms (Cancer Center), diabetes (Initiative for Quality promotion and Epidemiology in
Diabetes care), and drug use disorders (Drugs Team).
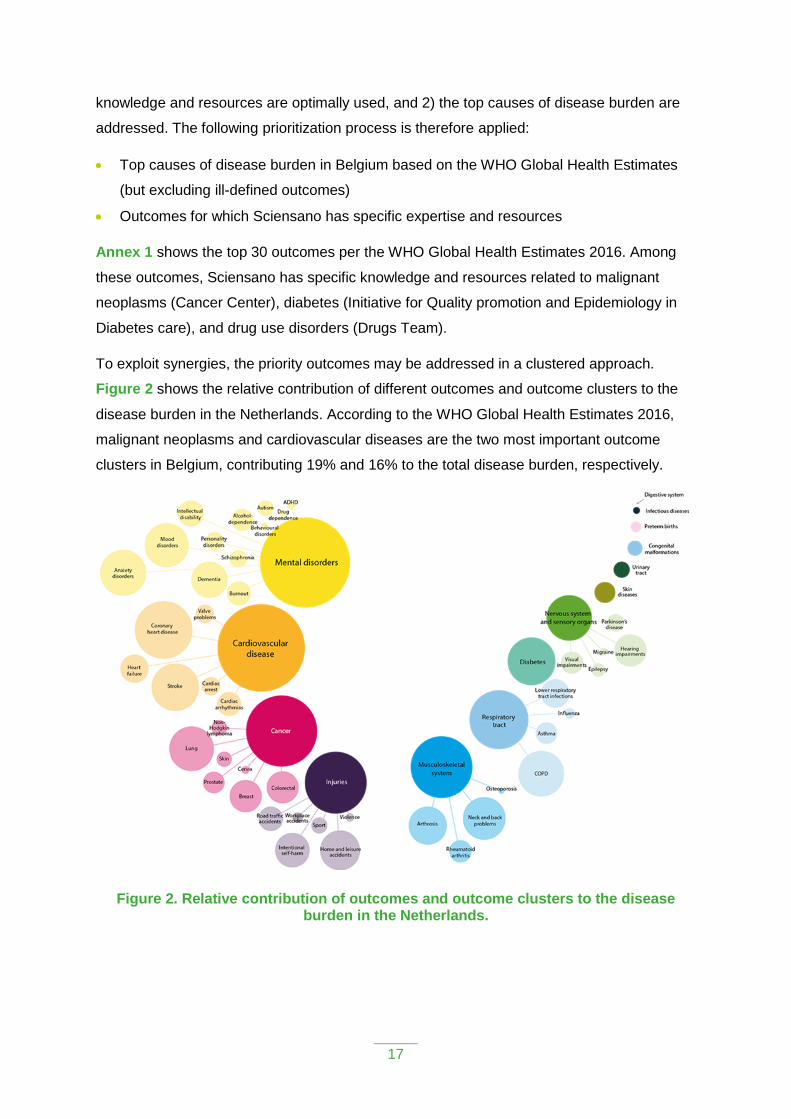
To exploit synergies, the priority outcomes may be addressed in a clustered approach.
Figure 2 shows the relative contribution of different outcomes and outcome clusters to the
disease burden in the Netherlands. According to the WHO Global Health Estimates 2016,
malignant neoplasms and cardiovascular diseases are the two most important outcome
clusters in Belgium, contributing 19% and 16% to the total disease burden, respectively.
Figure 2. Relative contribution of outcomes and outcome clusters to the disease burden in the Netherlands.

18
3.3 ESTABLISHMENT OF CASE DEFINITION FOR OUTCOMES
Case definitions help to understand the value and validity of different data sources, and are
consequently an important tool to compare the data obtained in different data sources. Case
definitions furthermore allow making an explicit link between the prevalence data and the
disease model, since the definition of what constitutes a case should be the same for both.
In addition to case definitions based on clinical signs and symptoms, standardized
classification system can be used to define cases and improve interoperability. The main
classification systems used in the Belgian health information system are described below.
3.3.1 International Classification of Diseases (ICD)
The ICD is a classification system created by the World Health Organization to use as an
international standard for reporting diseases and conditions. It is the diagnostic classification
standard for all clinical and research purposes. The current version is the ICD-10, but in the
near future the ICD-11 will be launched. In Belgium, the ICD classification is used in the
hospital discharge datasets. Before 2015, the ICD-9 classification in use, while from 2016
onwards, the ICD-10 classification is in use.
3.3.2 International Classification of Primary Care (ICPC-2)
The ICPC classification system is used to code both symptoms/complaints and diagnoses in
primary care. In Belgium, the ICPC classification is used in the framework of registration
based on general practitioner’s health records.
3.3.3 Anatomical Therapeutic Chemical (ATC) classification system
The ATC classification system is a drug classification system of the active ingredients of
drugs according to the organ or system on which they act and their therapeutic,
pharmacological and chemical properties. In Belgium, the ATC classification is used in the
health insurance datasets.
3.3.4 Nomenclatures codes
Nomenclature codes are used to classify healthcare provisions partially or totally reimbursed
by the healthcare insurance. In Belgium, nomenclature codes are used in the health
insurance datasets.
3.3.5 Diagnostic and Statistical Manual of Mental Disorders (DSM)
The DSM is a classification of the mental disorders and diseases published by the American
Psychiatric Association. This classification can be used for the case definition of mental
diseases or substance use disorders. In Belgium, the DSM is used to guide the definition of
questions on mental and substance use disorders in the Health Interview Survey.

19
The choice was made to use the DSM-IV instead of the more recent DSM-V (published in
2013) for several reasons. First, for comparability reasons since DSM-IV classification is
widely used in research for more than twenty years. Second, the DSM-IV is the classification
used in the GBD studies. Finally, evidence has shown that changes made in the DSM-V
have a minimal impact on the prevalence of the substance use disorders diagnoses despite
some undeniable advantages, e.g., the capacity to capture “diagnostic orphans” (individuals
meeting one or two criteria for dependence and none for abuse, and thus not receiving a
DSM-IV substance use disorders diagnosis) or the addition of a “craving” criterion. It has to
be noticed that a major change from DSM-IV to DSM-V is the combination of substance
abuse disorder and substance dependence into a single substance use disorder.
3.4 IDENTIFICATION OF DATA SOURCES
In the past, several initiatives have generated an overview of available health information
sources in Belgium:
The MORBIDAT project, an electronic overview of databases about morbidity and
health‐related behaviors and the corresponding regulations in Belgium (http://www.wiv‐
isp.be/epidemio/morbidat/);
An inventory of health care databases in Belgium performed in 2006 by the Health Care
Knowledge Centre (KCE);
An inventory and analysis of existing data sources and indicators to meet as a Member
State of the European Union the scientific requirements of the European system of
health indicators performed by the Scientific Institute of Public Health in 2009‐2010;
An inventory made in the framework of the Eurostat pilot project on diagnosis‐specific
morbidity statistics (2011);
The inventory of health information systems currently covered by healthdata.be
(https://healthdata.Sciensano.be/nl/inventarisatie-van-registraties).
In the Belgian health information system, five (types of) data sources allow monitoring
disease prevalence. These sources are presented below, along with an overview of general
strengths and weaknesses.
3.4.1 Disease-specific registries
Disease-specific registers exist only for a very limited number of diseases. Nationally
representative registries include the Belgian Cancer Registry and the registries for rare
diseases (cystic fibrosis, neuromuscular disorders). Other registries are of regional or local
scale.

20
The methods of data collection for disease-specific registers vary. In some cases, there may
be a direct reporting from the diagnosing doctor or another health professional or institution
(as is the case for the rare diseases registries). In other cases, the register is a secondary
data source which collects together records from hospitals and other services (as is the case
for the Belgian Cancer Registry).
Strengths
Diagnoses are typically made by medical professionals, often following standardized
protocols
Routinely collected data, allowing for a longitudinal approach
Weaknesses
Registries may not include all patients
Regional and local registries offer incomplete geographical coverage
Registries managed by academic research groups may have limited sustainability
3.4.2 Hospital discharge data
Belgium collects records for all hospital stays (general hospitals) in the Minimum Clinical
Data (MCD). MCD registration for hospitalized patients was developed in the 1980s and
recording this data for all patients became compulsory in 1990. The information in the MCD
includes relevant clinical data (e.g. primary and secondary diagnosis) and demographic
characteristics of patients. Records are pseudonymized, thus patients cannot be directly
identified in the data set. The MCD are used to group hospitalized patients in Diagnosis
Related Groups (DRGs). In 1995, All Patient DRGs (AP‐DRGs) were chosen as the
grouping method to establish hospital comparisons for financial purposes. In 2002, AP‐
DRGs were replaced by APR-DRGs (All Patient Refined DRGs, 3M HIS version 15.0) in
order to pay more attention to the severity of illness. An integrated system for data collection,
the Minimum Hospital Data Set (MHD‐MZG‐RHM) was launched in 2009, integrating the
MCD, Minimum Nursing Data (MND) and Medical Urgencies Data (MUG). In addition to the
MHD, Belgium collects records for all hospital stays in psychiatric hospitals, psychiatric
departments of acute care hospitals, psychiatric nursing homes and initiatives for sheltered
living in the Minimum Psychiatric Data (MPD). The MPD contains socioeconomic
characteristics of the patient, diagnosis and pre‐admission problems, treatment data, and
diagnosis and residual problems at discharge.
The Hospital Discharge Data are mainly collected as tools for the measurement of hospital
needs for public financing, and evaluation of the effectiveness and quality of hospital care.

21
Other objectives include the possibility of using the data for internal management and to
determine population needs through epidemiological studies.
Strengths
Official database, organized and managed by public health authorities
National database
Exhaustive information on all hospitalized cases
Diagnoses by medical doctor
Weaknesses
No information on patients who were not admitted to hospital during the reference year;
this may represent a rather large proportion of all cases
Hospital discharge data are primarily used for administrative purposes, which could
result in some problems when data have to be used for epidemiological purposes
No data are available for 2015, when the database switched from ICD-9 to ICD-10
3.4.3 Health insurance databases
In Belgium the compulsory health insurance is covering 98% of the population. This
insurance either covers partially or in some cases completely the costs of a wide range of
medical and paramedical services and medicines. There are several specific health
insurance databases:
3.4.3.1 Pharmanet
Pharmanet is a database of the National Institute for Health and Disability Insurance (RIZIV-
INAMI) that monitors since 1996 prescribing practices of general practitioners and specialist
physicians. In the framework of Pharmanet, data are collected – by prescriber – on the
pharmaceutical supplies (masterly preparations, diabetic sterile syringes, etc.) delivered by
public dispensaries. As an information network, Pharmanet focuses exclusively on
reimbursed prescription drugs (in ambulatory medicine) delivered by public dispensaries
(pharmacies). Information on the unique beneficiary identification number is kept for a period
of only 3 years.
The Pharmanet data has been used by RIZIV-INAMI to identify specific pathologies. These
“pseudo-diagnosis”, or “pseudo-pathologies” have been determined by experts, based on
the delivery of drugs in the public pharmacies, using the Anatomical Therapeutic Chemical
Classification System (ATC codes), a system of alphanumeric codes developed by the
World Health Organization for the classification of drugs and other medical products. A case
of “pseudo-pathology” is attributed to a person when the total of the Defined Daily Dose

22
(DDD) is higher or equals 90 during the reference year. According to WHO, a DDD is the
assumed average maintenance dose per day for a drug used for its main indication in adults.
3.4.3.2 Gezondheidszorg – Soins de Santé
Since January 2014, the IMA database also contains a permanent healthcare dataset called
Gezondheidszorg – Soins de Santé (GZSS). For all insured persons within the mandatory
health insurance, this dataset contains details of their reimbursed healthcare provisions
using nomenclature codes, which is a coded list of the healthcare provisions partially or
totally reimbursed by the healthcare insurance. Information on reimbursed prescription drugs
in hospitals pharmacies is also available.
3.4.3.3 Echantillon permanent – Permanente steekproef
The administrative management of the health insurance is done by 7 health insurance
organizations, the so‐called “mutualiteiten” or “mutualités”. In 2002 an agency was found
with as objective to collect and analyze the data from all 7 health insurance organizations:
the InterMutualistic Agency (IMA). The IMA database contains the Pharmanet and GZSS
datasets, as well as socio‐demographic data for all Belgian citizens with (compulsory) health
insurance. For research purposes, the IMA created the permanent sample (EPS), i.e., a
sample of 1/40 of the IMA data, with an oversampling of 1/20 of the population older than 65
years. A legal framework regulates the modalities for using the EPS to study and monitor
health care consumption and expenditure in Belgium. Data are available from 2002 onwards.
In contrast to the Pharmanet dataset, the EPS data is a longitudinal dataset with a patient
identifier that does not get deleted.
Strengths
Routinely collected data, allowing for a longitudinal approach
Validated “pseudo-diagnoses”, based on medication and care, for a certain number of
conditions
Health insurance data cover nearly 100% of the population
The EPS is a sufficiently large and representative sample of the complete dataset
Weaknesses
Health insurance data focus exclusively on reimbursed prescription drugs and medical
acts; they thus exclude non-reimbursed drugs.
The databases do not contain information on diagnoses; however, for a certain number
of conditions “pseudo-diagnoses” are constructed based on medication and care

23
The database will not capture patients that do not consume reimbursed medication or
care, leading to a potentially high number of false negatives when estimating disease
prevalence
3.4.4 Sentinel networks of general practitioners
In Belgium, there are two sentinel network of general practitioners: the Intego sentinel
network of general practitioners and Sciensano network of general practitioners (SGPs).
3.4.4.1 Intego sentinel network of general practitioners
The Intego network, operational since 1994, is an electronic patient record (EPR)-based
network of 54 voluntarily participating GP practices in Flanders, the northern region of the
country, which all use the same EPR software. The network is coordinated by the Academic
Centre for General Practice at the KU Leuven and covers approximately 2% of the Flemish
population. The Intego database contains information on diagnoses (primarily based on the
International Classification of Primary Care (ICPC) coding system) and prescribed drugs.
Aggregated results for the most common disorders can be explored online via
https://intego.gbiomed.kuleuven.be/intego-apps/inc_prev_v0/.
Strengths
Diagnoses are made by medical professionals
Routinely collected data, allowing for a longitudinal approach
Weaknesses
Does not capture patients that bypass the GP (emergency department, hospitalization)
unless the information is transmitted to the GP
Results are limited to Flanders
At the level of Flanders, the representativeness cannot be 100% guaranteed (the
network only includes a sample of GPs using a specific software and interested in
registration)
While GPs are representative of the global group of GPs in Flanders according to age
and sex, they might not be representative for their management of health problems
Since there are no patient lists per GP in Belgium, it is difficult to estimate the
denominator correctly
3.4.4.2 Sciensano network of general practitioners (SGPs)
The network of sentinel GPs exists since 1979. The network comprises about 120 general
practices all over Belgium who weekly report data about 8 different health problems
(infectious and non-infectious diseases). Other are monitored recurrently to gather data at

24
regular intervals . The coverage of the network is estimated at 1.1% – 1.5% of the Belgian
population. The registration is done on the website of the network of sentinel general
practitioners.
Strengths
Diagnoses are made by medical professionals
Routinely collected data, allowing for a longitudinal approach
Representativeness of GPs in Belgium
Weaknesses
Does not capture patients that bypass the GP (emergency department, hospitalization)
unless the information is transmitted to the GP
Some diseases are not yearly registered
Since there are no patient lists per GP in Belgium, it is difficult to estimate the
denominator correctly
3.4.5 Health interview survey
The Belgian Health Interview Survey (HIS) collects information on the health status, life style
and medical consumption of a representative sample of the general Belgian population,
including elderly staying in a home. Information is also collected on a wide range of
sociodemographic background characteristics. Interviews are carried out through a face-to-
face interview and a self-complete questionnaire. The basic sample consists of 10,000
persons but oversampling of specific population groups is possible. By using weighting
factors representative results can be calculated at the level of the total population. To date, a
HIS has been organized in Belgium in 1997, 2001, 2004, 2008, 2013, and 2018.
Strengths
Based on information from a representative sample of the Belgian population
Provides representative results at national and regional levels
Weaknesses
Self-reported information may lead to false positive and false negatives
Not yearly available (+/- every 5 years)
Comparing estimates between subgroups of the sample might lack statistical precision
3.5 EVALUATION OF DATA SOURCES
For each of the included outcomes, an overview is made of the available databases,
including an assessment of the operational case definition, strengths, weaknesses, and

25
sensitivity/specificity of the database. The latter is assessed in a qualitative way (i.e., high,
medium, low), unless quantifications are available from scientific literature.
Several criteria are used to consider sources for best estimates:
Is the database exhaustive or is it a sample?
Is the case definition based on a medical diagnosis or a proxy?
Will the source capture all the cases?
Is it a regional or a national level?
Are there yearly or periodic updates?
Figure 3 describes the steps followed in the choice of the best estimate.
Step 1: Is there in Belgium an exhaustive and reliable registry of the disease?
- If yes, registry is selected as best estimate.
- If no, go to step 2.
Step 2: Are most of the cases treated in the hospital?
- If yes, HDD is selected as best estimate.
- If no, go to step 3.
Step 3: Are there nomenclature codes or reimbursed drugs specific to the disease? Is
the prescription rate for those drugs high?
- If yes, health insurance data is selected as best estimate.
- If no, go to step 4.
Step 4: Are people suffering from the disease frequently in contact with GPs? Is the
disease known to be well recognized in primary care?
- If yes, sentinel GP network is selected as best estimate.
- If no, go to step 5.
Step 5: Is there a question related to the disease in the HIS? Is it a risk that question
on the disease leads to a social desirability bias?
- If yes, HIS is selected as best estimate.
- If no, no best estimate can be selected. Then choose the best source available
depending on the sensitivity/specificity assessment.
Depending on the disease and the type of the data source, and in absence of quantifications
from the scientific literature, sensitivity is assessed using several indicators:

26
Hospital discharge data (HDD): the hospitalization rate, i.e. the proportion of people
usually hospitalized with this disease/condition as primary diagnosis in a year.
Health insurance data: the prescription rate of a reimbursed drug specific to the
disease in patients with the disease.
Health interview survey: the importance of a potential social desirability bias, i.e. the
fact that some people report an illness incorrectly because the disease is perceived as
not socially acceptable.
Sentinel GPs Network: the frequency of contacts with the GP when people are
suffering from the disease and/or the recognition rate of the disease by the primary care
practitioner.
Figure 3. Evaluation process of the data sources
Regarding the validity of the health insurance data source using a defined set of ATC codes,
an evaluation of the validity of the “pseudo-diagnoses” or “pseudo-pathologies” has been
made in the HISLINK 2013 project (Berete et al., 2019) through a linkage between the
Health Insurance data (IMA) and the data from the Health Interview Survey (HIS).
The agreement between the two databases has been assessed by calculating the following
validity measures: the sensitivity, the specificity, the positive and negative predictive values
and the Cohen’s kappa coefficient, using the HIS 2008 data as gold standard. The same
analysis is under way with data from the HIS 2013 and could be extended to the HIS 2018
edition.
In this case, the validity measures were defined as following:

27
Sensitivity is the percentage of people with chronic disease in the HIS (true patients) who
have been correctly identified as having this disease in the IMA database.
Specificity is the percentage of people who do not suffer from chronic disease in the HIS
and who are identified as not having this chronic disease in the IMA database.
The positive predictive value (PPV) is the percentage of people who are identified as
having a chronic disease in the IMA database and who actually suffer from this disease
according to the HIS.
The negative predictive value (NPV) is the percentage of people who are identified as
not suffering from a pseudo-pathology according to the IMA database and who are
effectively not suffering from this disease according to the HIS.
The Cohen’s Kappa Coefficient is used here to measure the agreement between the two
databases, by computing the percentage of chance that the results are matching
accidentally. Kappa = 0 means that the agreement between the two databases is
random, and a kappa = 1 means that there is a perfect match between the two
databases. The kappa agreement levels are: mediocre (k <0.20), weak (k = 0.20 to
0.39), moderate (k = 0.40 to 0.59), good (k = 0.60 to 0.79), and very good ( k = 0.80 to
1.00).
The same analysis has been done in function of different cut-off points of DDD, allowing to
increase the sensitivity, i.e. to identify more cases of the cases identified in the HIS, when
using the IMA database.
3.6 QUANTIFICATION OF “BEST” ESTIMATES
For each outcome, one “best” national prevalence estimate needs to be generated. There
are different ways of obtaining such a best estimate:
Select one data source and correct for possible misclassification (cf Section 3.4)
Develop triangulation based on multiple data sources
Develop pooled estimate based on multiple data sources
For each outcome, the selection of the most appropriate method is based on an appraisal of
the available data sources and based on practical considerations. Annex 3 documents these
evaluations for the considered diseases. Prevalence estimates by age group, sex, and
region are registered in a standardized Excel spreadsheet.
3.7 REVIEW OF DISEASE MODELS
The relationship between the different health states associated with a given outcome may be
visualized in a disease model or outcome tree. Health states include the different acute and
chronic stages of the outcome (including complications), which may be stratified in different

28
severity levels (e.g., mild, moderate, severe). Disease models used in burden of disease
studies primarily aim to document the considered health states, and do not aim at a
representation of the complete clinical picture of the condition. The disease instead models
help in understanding how the number of cases for each health state is calculated. Models
typically start with one “parent node”, which contains all cases. This parent node then gives
rise to multiple “child nodes”, with the terminal child nodes representing the individual health
states. The number of cases for a given health state is then obtained by multiplying the
number of cases in the parent node, with the proportions corresponding to each split.
Figure 4 shows a theoretical disease model.
Figure 4. Theoretical disease model, severity distribution and disability weights.
This model presents a theoretical disease and the different associated health states. In the
example, 15% of the cases are acute cases and 85% are chronic cases, which are split in 3
severity levels (i.e., mild, moderate and severe). The disability weights reflect the severity of
each stage of the disease. Years of life Lost due to Disability (YLD) are calculated by
multiplying the proportion of prevalent cases and disability weights for each health state of
the condition. The model can also be represented in a table, which also facilitates the
calculations (Table 1).
Based on the disease model, the average disability weight per case can be calculated, which
is the weighted sum of the health state specific disability weights. The “weights” for this sum
correspond to the proportion of patients in each of the health states that are associated with
a disability weight (the blue boxes in Figure 4). In our example, the disability weight per case
corresponds to 0.012+0.045+0.082+0.099=0.238. This disability weight per case is also
referred to in this document as the “severity-weighted” disability weight.
Disease 100%
Acute disease 15%
DW=0.080
Chronic disease 85%
Mild 50%
DW=0.105
Moderate 30%
DW=0.320
Severe 10%
DW=0.580

29
Table 1. Proportion of patients in the different health states considered in the example disease model
Health state Parent Proportion Disability Weight
Disability weight, proportional
Disease (parent) N/A 100% N/A N/A
Acute disease Disease (parent) 15% 0.080 15%*0.080=0.012
Chronic disease Disease (parent) 85% N/A N/A
Chronic disease, mild
Chronic disease 50% 0.105 85%*50%*0.105 =0.045
Chronic disease, moderate
Chronic disease 30% 0.320 85%*30%*0.320 =0.082
Chronic disease, severe
Chronic disease 20% 0.580 85%*20%*0.580 =0.099
Disease models and severity distributions for the concerned outcomes are adapted from
existing literature and national burden of disease studies conducted in other countries (e.g.,
the Netherlands, Scotland). The disease models and severity distributions used in the Global
Burden of Disease study are used as a starting point (Burstein et al., 2015; GBD 2017
Disease and Injury Incidence and Prevalence Collaborators, 2018). Where possible, severity
distributions are adapted to the Belgian context. When no information on severity distribution
is available, a default severity distribution is used that assumes milder health states to be
more common than more severe outcomes. For instance, when there are 3 severity levels, it
will be assumed that out of 6 patients, 3 have mild symptoms, 2 have moderate symptoms,
and 1 has severe symptoms.
Disability weights are adapted from the Global Burden of Disease study (Salomon et al.,
2015), as these provide an exhaustive set of internally consistent disability weights. Where
relevant, internal comorbidity is addressed using a multiplicative model: 𝐷𝑊𝑐𝑜𝑚𝑏 = 1 −
∏ (1 − 𝐷𝑊𝑖)𝑖 .
Appendix 3 documents the disease models for the different diseases. Severity-weighted
disability weights by age group, sex, and region are registered in a standardized Excel
spreadsheet.
3.8 CALCULATION OF YLDS
Calculation of YLDs is conducted by integrating the “best” prevalence estimates with the
disease model and severity-weighted disability weights. YLDs are calculated by age, sex
and region. Results are registered in disease-specific, standardized csv files.

30
3.9 EXPERT EVALUATION OF METHODS AND RESULTS
For each outcome or outcome cluster, an expert evaluation is set up to assess and evaluate
the proposed methods and the ensuing results. The expert evaluation addresses the
following steps:
Identification of data sources
Selection of “best estimate”
Selection of disease model
Experts are defined as individuals with relevant epidemiological and/or clinical knowledge
with regards to the concerned outcome (cluster).

31
4. Cancer
4.1 INTRODUCTION
Cancer is a broad family of diseases that involve abnormal cell growth with the potential to
invade or spread to other parts of the body. It is one of the most important disease groups in
terms of premature mortality, ill health, and healthcare expenditure. According to the WHO
Global Health Estimates 2016, cancer is the most important cluster of health outcomes in
Belgium, contributing 19% of the total disease burden (Annex 1).
The approach for calculating DALYs for the different cancers does not follow the default
calculation methods as described before and is therefore treated separately. The two main
distinguishing features are 1) the availability of quasi complete data on cancer incidence
from the Belgian Cancer Registry Foundation and 2) the application of a generic incidence-
based disease model.
4.2 DATA SOURCE
Data on new cancer cases in Belgium are collected by the Belgian Cancer Registry
Foundation. The Belgian Cancer Registry is nationally representative and exhaustive. It
collects and records both clinical and pathological data from the anatomic pathology service.
The recording of data (topography and morphology) is done using the International
Classification of Diseases for Oncology.
Cancer incidence data for Belgium are obtained through the website of the Belgian Cancer
Registry. They are extracted by cancer type, 5-year age group, sex, and region, for the
period from 2004 to 2016. Cancer prevalence data for Belgium are not routinely available
from the Belgian Cancer Registry.
Data on the relative survival, by cancer type, age, sex, year, and region, are obtained from
the Belgian Cancer Registry Foundation through a personal communication.
4.3 DISEASE MODEL
We adopted the generic incidence-based disease model used in the Global Burden of
Disease study and the Scottish Burden of Disease Study. The model illustrates different
cancer stages from diagnosis to death or to remission (Figure 5). Incident cases are divided
as follows: for a defined period of 10 years, each new case of cancer will evolve either to
remission or to death. In either case, the first stage of the disease is the period during which
a diagnosis is made and treatment initiated. Then comes the "control" stage, in which the
survivors will stay for a certain time (10 years after the diagnosis stage), and through which
will pass the deceased patients. The latter will then go through the last two stages, namely
that of a cancer with metastases and the terminal stage before dying.

32
Figure 5. Generic incidence-based cancer disease model
The disability weights for the cancer health states are derived from Salomon et al. (2015)
and shown in Table 2. The (cancer type-dependent) durations for the different cancer health
states are derived from the GBD 2017 study (GBD 2017 Disease and Injury Incidence and
Prevalence Collaborators, 2018) and are shown in Table 3.
Table 2. Health states and disability weights for the generic incidence-based cancer disease model.
Health state Lay description Disability Weight
Cancer, diagnosis and primary therapy
This person has pain, nausea, fatigue, weight loss and high anxiety
0.288
Cancer, controlled phase This person has a chronic disease that requires medication every day and causes some worry but minimal interference with daily activities.
0.049
Cancer, metastatic This person has severe pain, extreme fatigue, weight loss and high anxiety.
0.451
Terminal phase, with medication
This person has lost a lot of weight and regularly uses strong medication to avoid constant pain. The person has no appetite, feels nauseous, and needs to spend most of the day in bed.
0.540

33
Table 3. Health states and durations (in months) for the generic incidence-based cancer disease model.
Cancer Diagnosis/Treatment Controlled Metastatic Terminal
Esophagus 5.0
Calculated based on remainder
of time after attributing
other cancer stages.
4.60
1 month
Stomach 5.2 3.88
Liver 4.0 2.51
Larynx 5.3 8.84
Lung 3.3 4.51
Breast 3.0 17.7
Cervical 4.8 9.21
Uterus 4.6 11.60
Prostate 4.0 30.35
Colorectal 4.0 9.69
Oral 5.3 9.33
Nasopharynx 5.3 13.19
Other part of pharynx 5.3 7.91
Gallbladder 4.0 3.47
Pancreas 4.1 2.54
Melanoma 2.9 7.18
Ovary 3.2 25.60
Testicle 3.7 19.47
Kidney 5.3 5.38
Bladder 5.1 5.80
Brain 5.0 6.93
Thyroid 3.0 19.39
Mesothelioma 4.0 7.75
Hodgkin lymphoma 3.7 26.00
Non-Hodgkin lymphoma 3.7 7.70
Multiple myeloma 7.0 36.82
Leukemia 5.0 43.67
Acute lymphocytic leukemia 12 7.02
Acute myeloid leukemia 6.0 4.60
Chronic lymphocytic leukemia 6.0 48.00
Chronic myeloid leukemia 6.0 4.60
Leukemia, other 6.0 48.00
Other 4.4 (mean of other cancer durations)
15.81

34
4.4 DALY CALCULATION
The calculation of YLDs and YLLs follows a step-wise approach based on the generic
disease model (Figure 5). Calculations are performed per cancer type, sex, age, region, and
year, and consequently aggregated to obtain (sub)totals.
For each number of incident cases, relative survival rates at year y={1,2,…,10} after
diagnosis are applied to obtain the number of survivors and deaths at year y.
For the individuals that die within 10 years after diagnosis, YLDs are calculated by assigning
the 4 different cancer health states in the following order:
1. Terminal phase: duration = 1 month
2. Diagnosis/treatment: duration = min(health state duration, remaining time till death)
3. Metastasis = min(health state duration, remaining time till death)
4. Control = remaining time till death
For the individuals that survive 10 years after diagnosis, YLDs are calculated by assigning
the 2 different cancer health states in the following order:
1. Diagnosis/treatment: duration = health state duration
2. Control = remaining time till death
Finally, for the individuals that die within 10 years after diagnosis, YLLs are calculated as the
product of the number of deaths with the residual life expectancy at the average age of
death (Annex 1). The latter is obtained as the sum of the age at diagnosis and the time till
death.

35
5. References
Ahern R, Lozano R, Naghavi M, Foreman K, Gakidou E, Murray CJL. Improving the public health
utility of global cardiovascular mortality data: the rise of ischemic heart disease. Popul Health
Metr. 2011;9:2063-6.
Baert E, Van Oyen H, Aelvoet W, De Henauw S, De Backer G. DALY (disability adjusted life years):
een conceptueel model van geïntegreerde gezondheidsindicator op basis van verloren
levensjaren door voortijdige sterfte en ziekte [DALY (disability adjusted life years): a conceptual
model of integrated health indicator based on years of life lost due to premature death and
disease]. In: Gezondheidsindicatoren 1998. Brussels: Flemish Agency for Care and Health; 2000.
Baert E, De Backer G, Byttebier G, De Henauw S, Van Oyen H, Aelvoet W. Disability Adjusted Life
Years. Een eerste berekening voor Vlaanderen [Disability Adjusted Life Years. A first calculation
for Flanders]. In: Gezondheidsindicatoren 2000. Brussels: Flemish Agency for Care and Health;
2002.
Bechthold A, Boeing H, Schwedhelm C, Hoffmann G, Knüppel S, Iqbal K, De Henauw S, Michels N,
Devleesschauwer B, Schlesinger S, Schwingshackl L. Food groups and risk of coronary heart
disease, stroke and heart failure: A systematic review and dose-response meta-analysis of
prospective studies. Crit Rev Food Sci Nutr. 2017:1-20.
Berete F, Demarest S, Van der Heyden J, Tafforeau J. Projet HISLINK 2013. Couplage des données
de l’enquête de santé 2013 avec les données des organismes assureurs. Etude de validité des
indicateurs de pseudopathologies. Sciensano, 2019.
Buekers J, Torfs R, Deutsch F, Lefebvre W, Bossuyt M. Inschatting ziektelast en externe kosten
veroorzaakt door verschillende milieufactoren in Vlaanderen [Assessment of disease burden and
external costs caused by various environmental factors in Flanders]. Mechelen: Flemish
Environment Agency (VMM); 2012.
Burstein R, Fleming T, Haagsma J, Salomon JA, Vos T, Murray CJ. Estimating distributions of health
state severity for the global burden of disease study. Popul Health Metr. 2015;13:31.
Cleemput I, Devriese S, Kohn L, Devos C, van Til J, Groothuis-Oudshoorn K, et al. Incorporating
societal preferences in reimbursement decisions – Relative importance of decision criteria
according to Belgian citizens. KCE Reports 234. D/2014/10.273/9. Brussels: Belgian Health Care
Knowledge Centre (KCE); 2014.
Devleesschauwer B, Maertens de Noordhout C, Smit GS, Duchateau L, Dorny P, Stein C, et al.
Quantifying burden of disease to support public health policy in Belgium: opportunities and
constraints. BMC Public Health. 2014;14:1196.
Dhondt S, Macharis C, Terryn N, Van Malderen F, Putman K. Health burden of road traffic accidents,
an analysis of clinical data on disability and mortality exposure rates in Flanders and Brussels.
Accid Anal Prev. 2013;50:659-66.
GBD 2013 Risk Factors Collaborators, et al. Global, regional, and national comparative risk
assessment of 79 behavioural, environmental and occupational, and metabolic risks or clusters of
risks in 188 countries, 1990-2013: a systematic analysis for the Global Burden of Disease Study
2013. Lancet. 2015;386:2287-323.
GBD 2015 Mortality and Causes of Death Collaborators. Global, regional, and national life
expectancy, all-cause mortality, and cause-specific mortality for 249 causes of death, 1980–2015:
a systematic analysis for the Global Burden of Disease Study 2015. The Lancet 2016 Oct
8;388(10053):1459-544.

36
GBD 2017 Disease and Injury Incidence and Prevalence Collaborators. Global, regional, and national
incidence, prevalence, and years lived with disability for 354 diseases and injuries for 195
countries and territories, 1990-2017: a systematic analysis for the Global Burden of Disease
Study 2017. Lancet. 2018;392:1789-858.
Henrard S, Devleesschauwer B, Beutels P, Callens M, De Smet F, Hermans C, et al. The health and
economic burden of haemophilia in Belgium: a rare, expensive and challenging disease.
Orphanet J Rare Dis 2014, 9:39.
Ikram UZ, Kunst AE, Lamkaddem M, Stronks K. The disease burden across different ethnic groups in
Amsterdam, the Netherlands, 2011–2030. Eur J Public Health. 2014;24:600-5.
Jelenc M, Van Hoof E, Albreht T, Meglic M, Seljak M, Krnel SR. Joint action European partnership for
action against cancer. Arch Public Health. 2012;70:24.
Lievens D, Vander Laenen F, Verhaeghe N, Schils N, Putman K, Pauwels L, et al. The social cost of
legal and illegal drugs in Belgium. IRCP research series. Antwerpen: Maklu; 2016.
Marshall SJ. Developing countries face double burden of disease. Bull World Health Organ.
2004;82:556.
Mathers CD, Vos T, Lopez AD, Salomon J, Ezzati M. National Burden of Disease Studies: A Practical
Guide. Edition 2.0. Global Program on Evidence for Health Policy. Geneva: World Health
Organization; 2001. [www.who.int/healthinfo/nationalburdenofdiseasemanual.pdf ]
Murray C, Lopez A. The Global Burden of Disease: a comprehensive assessment of mortality and
disability from diseases, injuries and risk factors in 1990 and projected to 2020. Cambridge:
Harvard University Press; 1996.
Murray CJ, Salomon JA, Mathers C. A critical examination of summary measures of population
health. Bull World Health Organ. 2000;78:981–994.
Murray CJ, Ezzati M, Flaxman AD, Lim S, Lozano R, Michaud C, et al. GBD 2010: design, definitions,
and metrics. Lancet. 2012;380:2063-6.
Pil L, Hoorens I, Vossaert K, Kruse V, Tromme I, Speybroeck N, et al. Burden of skin cancer in
Belgium and cost-effectiveness of primary prevention by reducing ultraviolet exposure. Prev Med.
2016;93:177-182.
Robine JM, Cambois E, Nusselder W, Jeune B, Van Oyen H, Jagger C. The joint action on healthy
life years (JA: EHLEIS). Arch Public Health. 2013;71:2.
Salomon JA, Haagsma JA, Davis A, Maertens de Noordhout C, Polinder S, Havelaar AH, et al.
Disability weights for the Global Burden of Disease 2013 study. Lancet Glob Health. 2015;3:e712-
23.
Schwingshackl L, Hoffmann G, Lampousi AM, Knüppel S, Iqbal K, Schwedhelm C, Bechthold A,
Schlesinger S, Boeing H. Food groups and risk of type 2 diabetes mellitus: a systematic review
and meta-analysis of prospective studies. Eur J Epidemiol. 2017;32:363-75.
Schwingshackl L, Schwedhelm C, Hoffmann G, Knüppel S, Laure Preterre A, Iqbal K, Bechthold A,
De Henauw S, Michels N, Devleesschauwer B, Boeing H, Schlesinger S. Food groups and risk of
colorectal cancer. Int J Cancer. 2018;142:1748-58.
Stassen KR, Collier P, Torfs R. Environmental burden of disease due to transportation noise in
Flanders (Belgium). Transport Res D-Tr E. 2008;13:355-8.
Tan-Torres Edejer T, Baltussen R, Adam T, Hutubessy R, Acharya A, Evans D, et al. Making choices
in health: WHO guide to cost-effectiveness analysis. Geneva: WHO Press; 2003.

37
Tromme I, Legrand C, Devleesschauwer B, Leiter U, Suciu S, Eggermont A, et al. Melanoma burden
by melanoma stage: Assessment through a disease transition model. Eur J Cancer. 2016;53:33-
41.
World Health Organization. WHO methods and data sources for global burden of disease estimates
2000-2011. Global Health Estimates Technical Paper WHO/HIS/HSI/GHE/2013.4. Department of
Health Statistics and Information Systems. Geneva: World Health Organization; 2013.
[http://www.who.int/healthinfo/statistics/GlobalDALYmethods_2000_2011.pdf]
Zhou M, Wang H, Zhu J, et al. Cause-specific mortality for 240 causes in China during 1990–2013: a
systematic subnational analysis for the Global Burden of Disease Study 2013. Lancet 2016; 387:
251–72.

38
ANNEXES
Annex 1. Top 30 specific causes of DALYs according to
WHO Global Health Estimates 2016
Rank Cause DALYs (‘000) DALYs (% of total)
1 Ischemic heart disease 234 7.2%
2 Trachea, bronchus, lung cancers 155 4.8%
3 Back and neck pain 136 4.2%
4 Alzheimer disease and other dementias 129 4.0%
5 Stroke 128 3.9%
6 Chronic obstructive pulmonary disease 124 3.8%
7 Falls 97 3.0%
8 Self-harm 90 2.8%
9 Depressive disorders 87 2.7%
10 Lower respiratory infections 73 2.3%
11 Diabetes mellitus 67 2.1%
12 Colon and rectum cancers 62 1.9%
13 Breast cancer 60 1.9%
14 Migraine 59 1.8%
15 Road injury 55 1.7%
16 Anxiety disorders 55 1.7%
17 Cirrhosis of the liver 46 1.4%
18 Kidney diseases 40 1.2%
19 Pancreas cancer 36 1.1%
20 Edentulism 35 1.1%
21 Uncorrected refractive errors 35 1.1%
22 Skin diseases 34 1.0%
23 Alcohol use disorders 32 1.0%
24 Osteoarthritis 30 0.9%
25 Lymphomas, multiple myeloma 29 0.9%
26 Prostate cancer 28 0.9%
27 Drug use disorders 27 0.8%
28 Asthma 27 0.8%
29 Bipolar disorder 26 0.8%
30 Brain and nervous system cancers 23 0.7%

39
Source: Global Health Estimates 2016: Disease burden by Cause, Age, Sex, by Country and
by Region, 2000-2016. Geneva, World Health Organization; 2018.
https://www.who.int/healthinfo/global_burden_disease/estimates/en/index1.html

40
Annex 2. GBD2017 theoretical minimum risk reference life
table
0 Life expectancy
0 87.89
1 87.01
5 83.04
10 78.05
15 73.07
20 68.11
25 63.16
30 58.21
35 53.27
40 48.37
45 43.50
50 38.70
55 33.98
60 29.32
65 24.73
70 20.32
75 16.09
80 12.18
85 8.78
90 6.06
95 3.90
100 2.23
105 1.61
110 1.36
Source: GBD 2017 Causes of Death Collaborators. Global, regional, and national age-sex-
specific mortality for 282 causes of death in 195 countries and territories, 1980-2017: a
systematic analysis for the Global Burden of Disease Study 2017. Lancet.
2018;392(10159):1736-1788. https://doi.org/10.1016/S0140-6736(18)32203-7

41
Annex 3. Disease-specific methods
1 ACUTE MYOCARDIAL INFARCTION (AMI) ................................................................................................. 42
2 ANGINA PECTORIS ...................................................................................................................................... 47
3 CEREBROVASCULAR DISEASE ................................................................................................................. 52
4 DIABETES ..................................................................................................................................................... 61
5 EPILEPSY ...................................................................................................................................................... 71
6 PARKINSON’S DISEASE .............................................................................................................................. 77
7 LOW BACK PAIN (LBP)................................................................................................................................ 84
8 NECK PAIN (NP) ........................................................................................................................................... 90

42
1 ACUTE MYOCARDIAL INFARCTION (AMI)
1.1 Case definition
Acute myocardial infarction (AMI), commonly known as a heart attack, is the interruption of
blood supply to a part of the heart, causing heart cells to die. This is most commonly due to
occlusion (blockage) of a coronary artery following the rupture of a vulnerable atherosclerotic
plaque, which is an unstable collection of lipids (fatty acids) and white blood cells (especially
macrophages) in the wall of an artery. The resulting ischemia (restriction in blood supply)
and oxygen shortage, if left untreated for a sufficient period of time, can cause damage or
death (infarction) of heart muscle tissue (myocardium).
The definitions of definite and possible myocardial infarction (AMI) according to the third
universal definition of myocardial infarction are as follows:
1. When there is clinical evidence of myocardial necrosis in a clinical setting consistent with
myocardial ischemia or
2. Detection of a rise and/or fall of cardiac biomarker values and with at least one of the
following: i) symptoms of ischemia, ii) new or presumed new ST-segment-T wave
changes or new left bundle branch block, iii) development of pathological Q waves in the
ECG, iv) imaging evidence of new loss of viable myocardium or new regional wall motion
abnormality, or v) identification of an intracoronary thrombus by angiography or autopsy.
3. Sudden (abrupt) unexplained cardiac death, involving cardiac arrest or no evidence of a
non-coronary cause of death. These cases however do not contribute Years Lived with
Disability.
Prevalent AMI is considered to last from the onset of the event to 28 days after the event
and is divided into an acute phase (0-2 days) and subacute (3-28 days).
1.1.1 Corresponding disease classification codes
ICD-10 codes
I21 Acute myocardial infarction
I22 Subsequent ST elevation (STEMI) and non-ST elevation (NSTEMI) myocardial
infarction
I23 Certain current complications following acute myocardial infarction
I24 Other acute ischemic heart diseases
ICD-9 codes
410 Acute myocardial infarction
411 Other acute and subacute forms of ischemic heart disease

43
ICPC-2 codes
K75 Acute myocardial infarction
K76 Ischemic heart disease w/o angina
ATC codes
Not applicable: there are no drugs sufficiently specific for treatment of AMI.
Nomenclature codes
Not applicable: there are no nomenclature codes sufficiently specific to match the case
definition of AMI.
1.2 Disease model
1.2.1 Health states
Figure 1. Acute myocardial infarction disease model
1.2.2 Disability weights
Table 1. Disability weights (DW) by health state for acute myocardial infarction according to the Global Burden of Disease study (Salomon et al., 2015)
Health state Lay description DW
Acute myocardial infarction, days 1-2
Has severe chest pain that becomes worse with any physical activity. The person feels nauseated, short of breath, and very anxious.
0.432
Acute myocardial infarction, days 3-28
Gets short of breath after heavy physical activity, and tires easily, but has no problems when at rest. The person has to take medication every day and has some anxiety.
0.074
Acute myocardial infarction, day 1-2
DW=0.432
Acute myocardial infarction, day 3-28
DW=0.074

44
1.2.3 Proportion of patients in the considered health states
Table 2. Proportion of patients in the different health states considered in the acute myocardial infarction disease model, Belgium.
Health state Parent Proportion Source
Acute myocardial infarction, days 1-2
N/A 100% Per definition
Acute myocardial infarction, days 3-28
Acute myocardial infarction, days 1-2
100% Per definition
1.2.4 Discussion
Disability weights for the Belgian national burden of disease study are adapted from the
Global Burden of Disease study (1), as these provide an exhaustive set of internally
consistent disability weights.
The definition of the disease model for AMI closely follows the case definition of AMI. It is
assumed that each (non-fatal) case of AMI has a duration of 28 days, including an acute
phase of 2 days with severe symptoms, followed by a subacute phase of 26 days with mild
symptoms.
1.3 Prevalence
1.3.1 Data sources
Different data sources exist for AMI, each with a specific case definition:
1. MONICA Registries of Acute Coronary Attacks (RACA): person with AMI recorded in
the registries of Ischemic heart diseases of Charleroi, Ghent/Bruges and Luxembourg
during the reference year.
2. Hospital discharge data: patient with AMI admitted to the hospital during the reference
year (before 2015: ICD-9 codes 410 and 411; after 2015 ICD-10 codes: I21, I22, I23, and
I24).
3. Health insurance data: not applicable; there are no (reimbursed) medications or health
care usages that would allow a sufficiently specific diagnosis of AMI
4. Health Interview Survey: number of respondents with positive answer to the question
“in the past 12 months, have you had myocardial infarction?”.
5. Sentinel GP network data (Intego): number of individuals with myocardial infarction
diagnosis ever recorded by GP (ICPC code K75 and K76) who had a GP contact during
the reference year.
6. Sentinel GP network data (Sciensano): number of individuals with AMI diagnosis
recorded by a sentinel GP (ICPC-2 code K75 and K76) during the reference year.

45
Table 3. Potential sources and methods for the computation of acute myocardial infarction prevalence in Belgium.
Source Strengths Weaknesses Evaluation
MONICA Registries of Acute Coronary Attacks (RACA)
Use of an international standard protocol and case definition
Long and solid history
Limited geographical area
Only population 25-74 included (25-69 in Charleroi)
Retrospective data collection
No longer operational since 2009
Sensitivity: low
Specificity: high
Hospital discharge data
Exhaustive information on all cases hospitalized for AMI
Diagnoses by medical doctor
Official database, organized and managed by public health authorities
National database
No information on AMI patients who were not admitted to hospital during the reference year; this is only assumed to be a small proportion of all (non-fatal) AMI patients
HDD is primarily used for administrative purposes, which could result in some problems when data have to be used for epidemiological purposes
Sensitivity: high
Specificity: high
Health insurance data (IMA/EPS)
N/A: there are no (reimbursed) medications or health care usages that would allow a sufficiently specific diagnosis of AMI
Health Interview Survey
Based on information from a representative sample
Provides representative results at national and regional levels
Self-reported information; it is assumed that there may be many false positive and false negatives
Not yearly available (+/- every 5 years)
Comparing estimates between subgroups of the sample might lack statistical precision
Sensitivity: medium
Specificity: medium
Sentinel GP network data (Intego)
Diagnosis by medical professional
Longitudinal approach
Will not capture patients that bypass the GP (ED, hospitalisation) unless the information is transmitted to the GP
Results are limited to Flanders
At the level of Flanders, the representativeness
Sensitivity: low
Specificity: high

46
cannot be 100% guaranteed (the network only includes a sample of GPs using a specific software and interested in registration)
For the PP: not possible to identify the reason for consultation, so might not be related to AMI.
Sentinel GP network data (Sciensano)
Diagnosis by medical professionals
120 GP distributed evenly all over the country
Representativeness of GPs in Belgium (for age and sex)
Will not capture patients that bypass the GP (ED, hospitalization) unless the information is transmitted to the GP
Only periodic registration
Last registration: 1985-1987
Sensitivity: medium
Specificity: high
1.3.2 National best estimate
Although the MONICA registries provide the most reliable data, they are limited in coverage.
It is therefore proposed to use the hospital discharge data as the best national estimate for
AMI incidence. To obtain prevalence estimates, incidence estimates can be multiplied with
the duration of the condition in years, i.e., 28/365.
1.4 References
GBD 2017 Causes of Death Collaborators. Global, regional, and national age-sex-specific mortality
for 282 causes of death in 195 countries and territories, 1980-2017: a systematic analysis for the
Global Burden of Disease Study 2017. Lancet 2018 Nov 10;392(10159):1736-88.
Salomon JA, Haagsma JA, Davis A, de Noordhout CM, Polinder S, Havelaar AH, et al. Disability
weights for the Global Burden of Disease 2013 study. Lancet Glob Health 2015 Nov;3(11):e712-
e723.
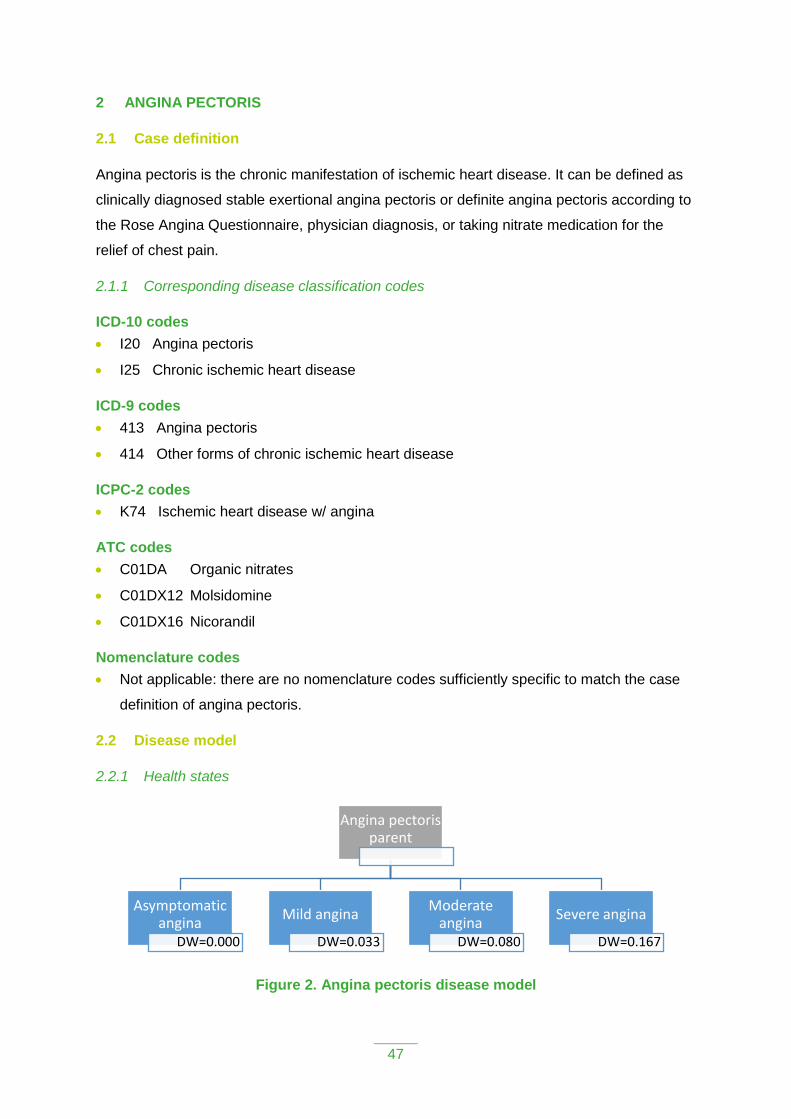
47
2 ANGINA PECTORIS
2.1 Case definition
Angina pectoris is the chronic manifestation of ischemic heart disease. It can be defined as
clinically diagnosed stable exertional angina pectoris or definite angina pectoris according to
the Rose Angina Questionnaire, physician diagnosis, or taking nitrate medication for the
relief of chest pain.
2.1.1 Corresponding disease classification codes
ICD-10 codes
I20 Angina pectoris
I25 Chronic ischemic heart disease
ICD-9 codes
413 Angina pectoris
414 Other forms of chronic ischemic heart disease
ICPC-2 codes
K74 Ischemic heart disease w/ angina
ATC codes
C01DA Organic nitrates
C01DX12 Molsidomine
C01DX16 Nicorandil
Nomenclature codes
Not applicable: there are no nomenclature codes sufficiently specific to match the case
definition of angina pectoris.
2.2 Disease model
2.2.1 Health states
Figure 2. Angina pectoris disease model
Angina pectoris parent
Asymptomatic angina
DW=0.000
Mild angina
DW=0.033
Moderate angina
DW=0.080
Severe angina
DW=0.167

48
2.2.2 Disability weights
Table 1. Disability weights (DW) by health state for angina pectoris according to the Global Burden of Disease study (Salomon et al., 2015)
Health state Lay description DW
Asymptomatic angina N/A 0.000
Mild angina Has chest pain that occurs with strenuous physical activity, such as running or lifting heavy objects. After a brief rest, the pain goes away.
0.033
Moderate angina Has chest pain that occurs with moderate physical activity, such as walking uphill or more than half a kilometer (around a quarter-mile) on level ground. After a brief rest, the pain goes away.
0.080
Severe angina Has chest pain that occurs with minimal physical activity, such as walking only a short distance. After a brief rest, the pain goes away. The person avoids most physical activities because of the pain.
0.167
2.2.3 Proportion of patients in the considered health states
Table 2. Proportion of patients in the different health states considered in the angina pectoris disease model, Belgium.
Health state Parent Proportion Source
Angina pectoris, parent
N/A 100% Per definition
Asymptomatic angina Angina pectoris, parent
30.5% Burstein et al. (2015)
Mild angina Angina pectoris, parent
24.0% Burstein et al. (2015)
Moderate angina Angina pectoris, parent
12.6% Burstein et al. (2015)
Severe angina Angina pectoris, parent
33.0% Burstein et al. (2015)
2.2.4 Discussion
Disability weights for the Belgian national burden of disease study are adapted from the
Global Burden of Disease study (1), as these provide an exhaustive set of internally
consistent disability weights.
The severity distribution in the GBD model is based exclusively on data from the USA,
raising questions on applicability for the Belgian context. The severity distribution was
derived from an analysis of the Medical Expenditure Panel Surveys (MEPS) in the USA
(https://meps.ahrq.gov/mepsweb/). MEPS is an overlapping continuous panel survey of the
United States non-institutionalized population whose primary purpose is to collect
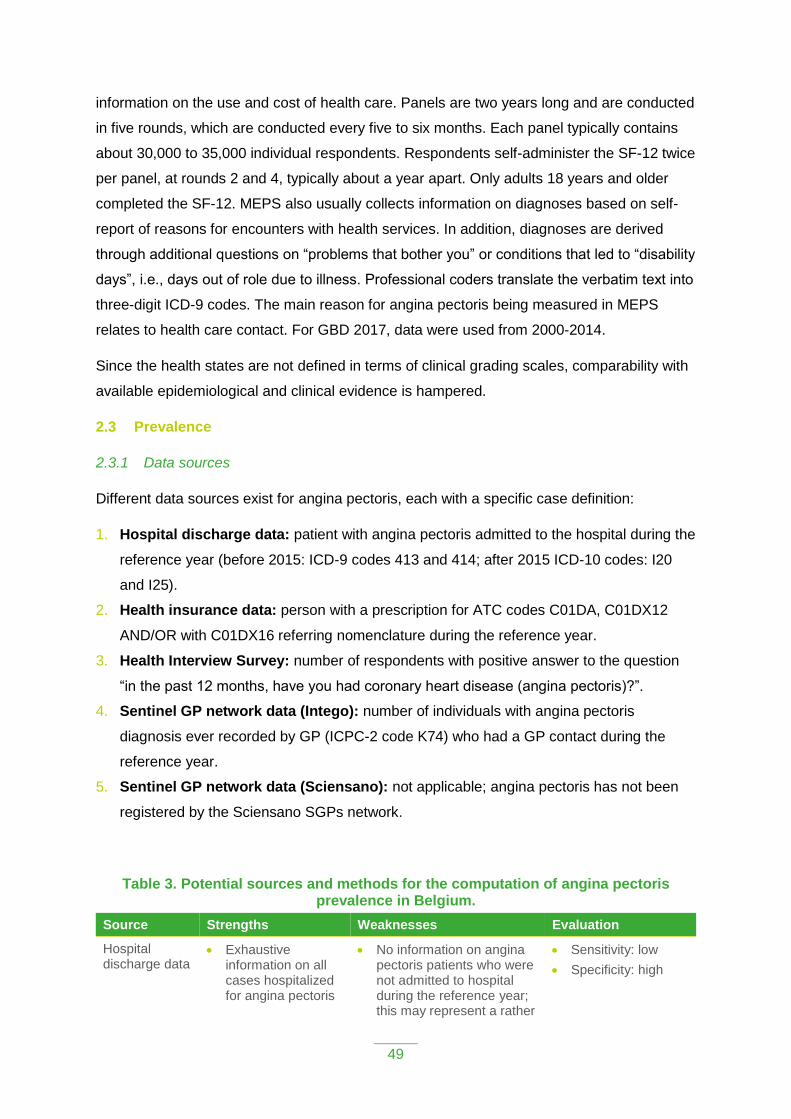
49
information on the use and cost of health care. Panels are two years long and are conducted
in five rounds, which are conducted every five to six months. Each panel typically contains
about 30,000 to 35,000 individual respondents. Respondents self-administer the SF-12 twice
per panel, at rounds 2 and 4, typically about a year apart. Only adults 18 years and older
completed the SF-12. MEPS also usually collects information on diagnoses based on self-
report of reasons for encounters with health services. In addition, diagnoses are derived
through additional questions on “problems that bother you” or conditions that led to “disability
days”, i.e., days out of role due to illness. Professional coders translate the verbatim text into
three-digit ICD-9 codes. The main reason for angina pectoris being measured in MEPS
relates to health care contact. For GBD 2017, data were used from 2000-2014.
Since the health states are not defined in terms of clinical grading scales, comparability with
available epidemiological and clinical evidence is hampered.
2.3 Prevalence
2.3.1 Data sources
Different data sources exist for angina pectoris, each with a specific case definition:
1. Hospital discharge data: patient with angina pectoris admitted to the hospital during the
reference year (before 2015: ICD-9 codes 413 and 414; after 2015 ICD-10 codes: I20
and I25).
2. Health insurance data: person with a prescription for ATC codes C01DA, C01DX12
AND/OR with C01DX16 referring nomenclature during the reference year.
3. Health Interview Survey: number of respondents with positive answer to the question
“in the past 12 months, have you had coronary heart disease (angina pectoris)?”.
4. Sentinel GP network data (Intego): number of individuals with angina pectoris
diagnosis ever recorded by GP (ICPC-2 code K74) who had a GP contact during the
reference year.
5. Sentinel GP network data (Sciensano): not applicable; angina pectoris has not been
registered by the Sciensano SGPs network.
Table 3. Potential sources and methods for the computation of angina pectoris prevalence in Belgium.
Source Strengths Weaknesses Evaluation
Hospital discharge data
Exhaustive information on all cases hospitalized for angina pectoris
No information on angina pectoris patients who were not admitted to hospital during the reference year; this may represent a rather
Sensitivity: low
Specificity: high

50
Diagnoses by medical doctor
Official database, organized and managed by public health authorities
National database
large proportion of all cases
HDD is primarily used for administrative purposes, which could result in some problems when data have to be used for epidemiological purposes
Health insurance data (IMA/EPS)
Case definition based on medication and care
Large, representative sample
Longitudinal approach
Case definitions based on prescription of medicines and not on a medical diagnosis, may generate false positives and false negatives
False positives: patients without angina, treated with the concerned drugs for other reasons
False negatives: angina patients without medical treatment
People who are not insured (e.g. homeless and illegal people, foreigners with their official residence abroad) are not included; this however comprises a small part of the total population (~2%)
Sensitivity: medium
Specificity: medium
Health Interview Survey
Based on information from a representative sample
Provides representative results at national and regional levels
Self-reported information may lead to false positive and false negatives
Not yearly available (+/- every 5 years)
Comparing estimates between subgroups of the sample might lack statistical precision
Sensitivity: medium
Specificity: medium
Sentinel GP network data (Intego)
Diagnosis by medical professional
Longitudinal approach
Will not capture patients that bypass the GP (ED, hospitalisation) unless the information is transmitted to the GP
Results are limited to Flanders
At the level of Flanders, the representativeness cannot be 100% guaranteed (the network only includes a sample of GPs using a specific software and interested in registration)
For the PP: not possible to identify the reason for consultation, so might not
Sensitivity: low
Specificity: high

51
be related to the condition in question.
Sentinel GP network data (Sciensano)
Not available. Angina pectoris has not been registered by the Sciensano SGPs network.
2.3.2 National best estimate
All available data sources are to a lesser or more extent limited in providing nationally
representative and accurate information on the prevalence of angina pectoris. Given the lack
of a validated “pseudodiagnosis” in the health insurance dataset, the use of the Health
Interview Survey data is preferred over the health insurance data.
2.3.3 Discussion
The validity of the selected data source remains unclear. Additional research, using linked
datasets, is needed to assess the sensitivity and specificity of the HIS data. The question on
coronary heart disease (angina pectoris) was introduced in the HIS2013. Therefore, limited
information is available on historical trends.
2.4 References
Burstein R, Fleming T, Haagsma J, Salomon JA, Vos T, Murray CJ. Estimating distributions of health
state severity for the global burden of disease study. Popul Health Metr 2015;13:31.
GBD 2017 Causes of Death Collaborators. Global, regional, and national age-sex-specific mortality
for 282 causes of death in 195 countries and territories, 1980-2017: a systematic analysis for the
Global Burden of Disease Study 2017. Lancet 2018 Nov 10;392(10159):1736-88.
Salomon JA, Haagsma JA, Davis A, de Noordhout CM, Polinder S, Havelaar AH, et al. Disability
weights for the Global Burden of Disease 2013 study. Lancet Glob Health 2015 Nov;3(11):e712-
e723.

52
3 CEREBROVASCULAR DISEASE
3.1 Case definition
Cerebrovascular diseases (CVD) refer to a group of diseases, conditions or troubles that
affect the circulation of blood in the brain, either because of a vascular occlusion or because
of a vascular bleeding, leading to a lack of the oxygen supply to the brain cells, resulting in a
brain infarction or hemorrhage (Ferrer and Vidal, 2018). Cerebrovascular diseases include
stroke, aneurysm, transient ischemic attack (TIA) and vascular malformation. However, we
excluded the TIA from the case definition as it does not contribute to the Years Lived with
Disability because of its very short duration.
Since most of cerebrovascular diseases manifest themselves as ischemic or hemorrhagic
strokes (Ferrer and Vidal, 2018), and for reasons of consistency, the burden of CVDs is
calculated based on the stroke model, as in the GBD methodology (GBD 2017 Disease and
Injury Incidence and Prevalence Collaborators, 2018). We therefore refer to the stroke
disease model and the stroke severity distribution when estimating the burden of CVDs,
making the assumption that CVDs follow the same disease model as stroke.
According to the World Health Organization (WHO), strokes are caused by disruption of the
blood supply to the brain. This is the consequence either of a blockage (ischemic stroke) or
of a rupture of a blood vessel (hemorrhagic stroke).
A distinction is furthermore made between:
Acute stroke: Stroke cases are considered acute from the day of incidence of a first-
ever stroke through day 28 following the event.
Chronic stroke: Stroke cases are considered chronic beginning 28 days following the
occurrence of an event. Chronic stroke includes the sequelae of an acute stroke AND all
recurrent stroke events.
3.1.1 Corresponding disease classification codes
The ICD-10 classification contains several codes for cerebrovascular diseases (I60-I69).
Here, the choice was made to exclude transient ischemic attack (TIA; ICD-10 code G45;
ICD-9 code 435) from the case definition for the calculation of the Years Lived with Disability
(YLDs) since, by definition, the duration of TIA is very short (<24h) and causes no
permanent disability. We have also excluded ICD-10 code I69 (sequelae of cerebrovascular
disease) from the acute stroke prevalence calculation, since, by definition, it refers to chronic
stroke.

53
ICD-10 codes
I60 Subarachnoid hemorrhage
I61 Intracerebral hemorrhage
I62 Other, non-traumatic intracranial hemorrhage
I63 Cerebral infarction
I64 Stroke, not specified as hemorrhage or infarction
I65 Occlusion/stenosis of pre-cerebral arteries without infarction
I66 Occlusion/stenosis of cerebral arteries without infarction
I67 Other cerebrovascular diseases
I68 Cerebrovascular diseases in disorders classified elsewhere
I69 Sequelae of cerebrovascular disease (excluded)
G45 Transient ischemic attack (TIA) (excluded)
G46 Vascular syndromes of brain in cerebrovascular disease
ICD-9 codes
430 Subarachnoid hemorrhage
431 Intracerebral hemorrhage
432 Other and unspecified intracranial hemorrhage
433 Occlusion and stenosis of precerebral arteries
434 Occlusion of cerebral arteries
435 Transient cerebral ischemia (excluded)
436 Acute, but ill-defined, cerebrovascular disease
437 Other and ill-defined cerebrovascular disease
ICPC-2 codes
K90 Stroke/cerebrovascular accident
K91 Cerebrovascular disease
ATC codes
Not applicable: there are no drugs sufficiently specific for treatment of CVD.
Nomenclature codes
477724 Fees for the neurology specialist for the coordination of a diagnostic and the
establishment of a treatment plan by a multidisciplinary team in stroke care when taking
charge of the treatment of a patient hospitalized due to a recent stroke (date of creation
01/09/2012)
477746 Fees for the accredited neurology specialist for the coordination of a diagnostic
and the establishment of a treatment plan by a multidisciplinary team in stroke care when

54
taking charge of the treatment of a patient hospitalized due to a recent stroke (date of
creation 01/09/2012)
477761 Fees for the neurology specialist to coordinate a multi-disciplinary stroke care
team to establish a care plan for a patient hospitalized due to a stroke (date of creation
01/09/2012)
477783 Fees for the accredited neurology specialist to coordinate a multi-disciplinary
stroke care team to establish a care plan for a patient hospitalized due to a stroke (date
of creation 01/09/2012)
3.2 Disease model
In the case of cerebrovascular diseases, the choice has been made to follow the stroke
disease model, since strokes represent most of the CVDs cases (Ferrer and Vidal, 2018).
The same choice has been made in the GBD study (GBD 2017 Disease and Injury Incidence
and Prevalence Collaborators, 2018). A distinction is furthermore made between acute
stroke (≤28 days) and chronic stroke (>28 days). Both models have the same health states
with the same disability weights, but different severity distributions; the chronic stroke
disease model furthermore has an asymptomatic health state (with DW=0).
3.2.1 Health states
Figure 1. Acute cerebrovascular disease (stroke) disease model
Figure 2. Chronic cerebrovascular disease (stroke) disease model
Acute CVD (≤28 days)
Mild
DW=0.019
Moderate
DW=0.070
Moderate plus cognition problems
DW=0.316
Severe
DW=0.552
Severe plus cognition problems
DW=0.588
Chronic CVD (>28 days)
Asymptomatic
DW=0.000
Mild
DW=0.019
Moderate
DW=0.070
Moderate plus cognition problems
DW=0.316
Severe
DW=0.552
Severe plus cognition problems
DW=0.588

55
3.2.2 Disability weights
Table 1. Disability weights (DW) by health state for cerebrovascular disease (stroke) according to the Global Burden of Disease study (Salomon et al., 2015)
Health state Lay description DW
Chronic, asymptomatic Has suffered a stroke but experiences no symptoms by virtue of, for instance being on treatment or because of the natural course of the condition
0.000
Mild Has some difficulty in moving around and some weakness in one hand, but is able to walk without help.
0.019
Moderate Has some difficulty in moving around, and in using the hands for lifting and holding things, dressing, and grooming.
0.070
Moderate plus cognition problems
Has some difficulty in moving around, in using the hands for lifting and holding things, dressing and grooming, and in speaking. The person is often forgetful and confused.
0.316
Severe Is confined to a bed or a wheelchair, has difficulty speaking, and depends on others for feeding, toileting, and dressing.
0.552
Severe plus cognition problems Is confined to a bed or a wheelchair, depends on others for feeding, toileting, and dressing, and has difficulty speaking, thinking clearly, and remembering things.
0.588
3.2.3 Proportion of patients in the considered health states
Table 2. Proportion of patients in the different health states considered in the acute cerebrovascular disease (stroke) disease model, Belgium.
Health state Parent Proportion Source
Acute CVD N/A 100% Per definition
Mild Acute CVD 34% GBD 2017
Moderate Acute CVD 15% GBD 2017
Moderate plus cognition problems
Acute CVD 18% GBD 2017
Severe Acute CVD 17% GBD 2017
Severe plus cognition problems
Acute CVD 16% GBD 2017
Table 3. Proportion of patients in the different health states considered in the chronic cerebrovascular disease (stroke) disease model, Belgium.
Health state Parent Proportion Source
Chronic CVD N/A 100% Per definition
Asymptomatic Chronic CVD 19% GBD 2017
Mild Chronic CVD 25% GBD 2017

56
Moderate Chronic CVD 15% GBD 2017
Moderate plus cognition problems
Chronic CVD 20% GBD 2017
Severe Chronic CVD 10% GBD 2017
Severe plus cognition problems
Chronic CVD 12% GBD 2017
3.2.4 Discussion
No national data were found on the prevalence of the cases in the different health states.
Therefore, we have used the severity distribution based on the GBD model. The severity
distribution in the GBD model is based exclusively on data from the USA, raising questions
on applicability for the Belgian context. The severity distribution was derived from an
analysis of the Medical Expenditure Panel Surveys (MEPS) in the USA
(https://meps.ahrq.gov/mepsweb/). MEPS is an overlapping continuous panel survey of the
United States non-institutionalized population whose primary purpose is to collect
information on the use and cost of health care. Panels are two years long and are conducted
in five rounds, which are conducted every five to six months. Each panel typically contains
about 30,000 to 35,000 individual respondents. Respondents self-administer the SF-12 twice
per panel, at rounds 2 and 4, typically about a year apart. Only adults 18 years and older
completed the SF-12. MEPS also usually collects information on diagnoses based on self-
report of reasons for encounters with health services. In addition, diagnoses are derived
through additional questions on “problems that bother you” or conditions that led to “disability
days”, i.e., days out of role due to illness. Professional coders translate the verbatim text into
three-digit ICD-9 codes. The main reason for stroke being measured in MEPS relates to
health care contact. For GBD 2017, data were used from 2000-2014.
Since the health states are not defined in terms of clinical grading scales, comparability with
available epidemiological and clinical evidence is hampered.
3.3 Prevalence
3.3.1 Data sources
Different data sources exist for cerebrovascular disease (stroke), each with a specific case
definition:
Hospital discharge data: patient with CVD admitted to the hospital during the reference
year (before 2015: ICD-9 codes 430-434, 436-437; after 2015 ICD-10 codes: I60-I68).
Health insurance data: person with a health-care provided certificate for nomenclature
codes 477724, 477746, 477761 or 477783 during the reference year. Patient with stroke

57
admitted to the hospital during the reference year, for which a diagnosis and a care plan
was established by a neurologist and a multidisciplinary team specialized in stroke care
management.
Health Interview Survey: number of respondents with positive answer to the question
“in the past 12 months, have you had stroke?”.
Sentinel GP network data (Intego): number of individuals with CVD diagnosis ever
recorded by GP (ICPC code K90 or K91) who had a GP contact during the reference
year.
Sentinel GP network data (Sciensano): number of individuals with stroke diagnosis
recorded by a sentinel GP (ICPC-2 code K90 or K91) + GP patients who were
hospitalized for stroke without a preceding contact with GP during the reference year.
Table 4. Potential sources and methods for the computation of cerebrovascular disease (stroke) prevalence in Belgium.
Source Strengths Weaknesses Evaluation
Hospital discharge data
Exhaustive information on all cases hospitalized for CVD
Diagnoses by medical doctor
Official database, organized and managed by public health authorities
National database
No information on CVD patients who were not admitted to hospital during the reference year; this may represent between 5% and 23% of all cases (Devroey et al., 2003)
Although this number is probably low, some mild CVD cases among older people may be treated directly by the GP and are thus not sent to hospital; hospital based data could thus lead to underestimation
HDD is primarily used for administrative purposes, which could result in some problems when data have to be used for epidemiological purposes
Sensitivity: high
Specificity: high
Health insurance data (IMA/EPS)
Case definition based on medication and care
Large, representative sample
Nomenclature codes are only for hospitalized cases of stroke
Sensitivity: low
Specificity: medium
Health Interview Survey
Based on information from a representative sample
Self-reported information; it is assumed that there may
Sensitivity: medium

58
Provides representative results at national and regional levels
be many false positive and false negatives
Not yearly available (+/- every 5 years)
Comparing estimates between subgroups of the sample might lack statistical precision
Specificity: medium
Sentinel GP network data (Intego)
Diagnosis by medical professional
Longitudinal approach
Will not capture patients that bypass the GP (ED, hospitalisation) unless the information is transmitted to the GP; 27% of patients are estimated to bypass the GP (Devroey et al., 2005)
Results are limited to Flanders
At the level of Flanders, the representativeness cannot be 100% guaranteed (the network only includes a sample of GPs using a specific software and interested in registration)
For the PP: not possible to identify the reason for consultation, so might not be related to CVD
Sensitivity: low
Specificity: high
Sentinel GP network data (Sciensano)
Diagnosis by medical professionals
120 GP distributed evenly all over the country
Representativeness of GPs in Belgium (for age and sex)
A distinction is made between ischemic and hemorrhagic stroke
Will not capture patients that bypass the GP (ED, hospitalisation) unless the information is transmitted to the GP; 27% of patients are estimated to bypass the GP (Devroey et al., 2005)
Data available for stroke only, and not for CVD as a whole
Only periodic registration
Sensitivity: medium
Specificity: high
3.3.2 National best estimate
We have selected a combination of two data sources as national best estimate.
It is proposed to use the Hospital Discharge Data as the best national estimate for the acute
CVD incidence. To obtain prevalence estimates, incidence estimates can be multiplied with
the duration of the condition in years, i.e., 28/365. Depending on the availability of the data,

59
we could use an alternative way to obtain the acute stroke incidence using the referring
nomenclature codes from the health insurance data.
Chronic CVD prevalence is estimated by subtracting the HDD cases (i.e., the acute cases)
from the stroke cases reported in the Health Interview Survey.
3.3.3 Discussion
Using the Hospital Discharge Data as national best estimate induces several limitations.
First, patients suffering from CVD who have not been hospitalized will be missed and there
are no recent data on the proportion of those patient treated in the community. However,
data on stroke collected in 2009-2010 by the Sciensano Sentinel GP have shown a high
hospitalization rate of 94.8% (N Boffin, personal communication).
Secondly, data quality depends on both the quality of the medical documentation and of the
expertise of the coder (Aboa-Eboulé et al., 2012). The quality of the documentation in the
medical chart depends on the qualification of the medical practitioner (e.g. neurologist or
intern). Similarly, the coders are not specialists which may lead to coding errors. Miscoding
may induce false positives (e.g. a stroke diagnosis is coded instead of another diagnosis)
and false negatives (e.g. encoding stroke on the second diagnosis instead of the main
diagnosis).
However, the hospital discharge data contain clinical data on CVDs at a national level which
is a strength in estimating the prevalence of these diseases in the whole population.
The Belgian Health interview survey (HIS) has been selected to estimate the prevalence of
chronic stroke. A limitation here is that the case definition is not the same as the one used to
estimate the incidence of acute CVDs, based on the hospital discharge data. In the HIS, a
question is asked about the presence of stroke and not about cerebrovascular diseases as a
whole, leading to a potential underestimation of CVD cases.
The health insurance data are not the best source available since there is no drug
sufficiently specific to the treatment of CVDs. Nomenclature codes exist but they only refer to
acute stroke, which could lead to miss some other CVDs cases.
The Sentinel GP networks are not assumed to be the best source since stroke is usually
managed at the hospital and information of hospitalization may not be transmitted to the GP.
Furthermore, representativeness of the country is not guaranteed in the Intego sentinel GP
network, although a correction factor could be applied using the HIS data. Finally, the
Sciensano GP Network has registered the stroke prevalence but the last data available are
for 2009-2010.

60
3.4 References
Aboa-Eboulé C, Mengue D, Benzenine E, et al. How accurate is the reporting of stroke in hospital
discharge data? A pilot validation study using a population-based stroke registry as control. J
Neurol. 2012;260. doi:10.1007/s00415-012-6686-0
Devroey D, Van Casteren V, Buntinx F. Registration of stroke through the Belgian sentinel network
and factors influencing stroke mortality. Cerebrovasc Dis. 2003;16(3):272-279.
doi:10.1159/000071127
Devroey D, Van Casteren V, Buntinx F. Les accidents vasculaires cérébraux en Belgique :
surveillance par le réseau des médecins vigies en 1998 et 1999. La Rev la Médecine Générale.
2005;(219):17-18. https://www.ssmg.be/images/ssmg/files/RMG/219/RMG219_17-18.pdf.
Ferrer I, Vidal N. Chapter 7 - Neuropathology of cerebrovascular diseases. In: Kovacs GG, Alafuzoff I,
eds. Handbook of Clinical Neurology. Vol 145. Elsevier; 2018:79-114. doi:10.1016/B978-0-12-
802395-2.00007-9
GBD 2017 Disease and Injury Incidence and Prevalence Collaborators, James SL, Abate D, et al.
Global, regional, and national incidence, prevalence, and years lived with disability for 354
Diseases and Injuries for 195 countries and territories, 1990-2017: A systematic analysis for the
Global Burden of Disease Study 2017. Lancet. 2018;392(392):1789-1858. doi:10.1016/S0140-
6736(18)32279-7
Salomon JA, Haagsma JA, Davis A, et al. Disability weights for the Global Burden of Disease 2013
study. Lancet Glob Heal. 2015;3(11):e712-e723. doi:10.1016/S2214-109X(15)00069-8

61
4 DIABETES
4.1 Case definition
Diabetes mellitus is a group of metabolic diseases characterized by hyperglycemia resulting
from defects in insulin secretion, insulin action, or both. The chronic hyperglycemia of
diabetes is associated with long‐term damage, dysfunction, and failure of various organs,
especially the eyes, kidneys, nerves, heart, and blood vessels.
Diabetes is an important cause of morbidity. It is an important risk factor for cardio‐ and
cerebrovascular disease and peripheral arterial disease. It contributes substantially to
mortality, although mainly as a secondary cause, as a result of which the impact of diabetes
on mortality is often underestimated.
4.1.1 Corresponding disease classification codes
ICD-10 codes
E08 Diabetes mellitus due to underlying condition
E09 Drug or chemical induced diabetes mellitus
E10 Insulin‐dependent diabetes mellitus (including brittle, juvenile‐onset, ketosis‐prone,
type I)
E11 Non‐insulin‐dependent diabetes mellitus (including diabetes with adult‐onset,
maturity‐onset, non-ketotic, stable, type II, non‐insulin‐dependent diabetes of the young)
E12 Malnutrition‐related diabetes mellitus (both insulin‐dependent and non‐insulin-
dependent
E13 Other specified diabetes mellitus
E14 Unspecified diabetes mellitus (including diabetes NOS)
E08 (“Diabetes mellitus due to underlying condition”) is considered a garbage code in the
GBD framework, because it refers to an unknown underlying condition. Diabetes due to an
underlying condition (E08) is never used as a primary diagnosis and is reserved for
individuals who develop diabetes as the result of an underlying condition such as
pancreatitis, malnutrition, or malignancy.
E09 (“Drug or chemical induced diabetes mellitus”) codes for diabetes mellitus secondary to
medical treatment, and is therefore attributed to “Adverse effects of medical treatment”
instead of to “diabetes mellitus”. The main ICD-10 codes attributed to diabetes mellitus are
therefore E10-E14.
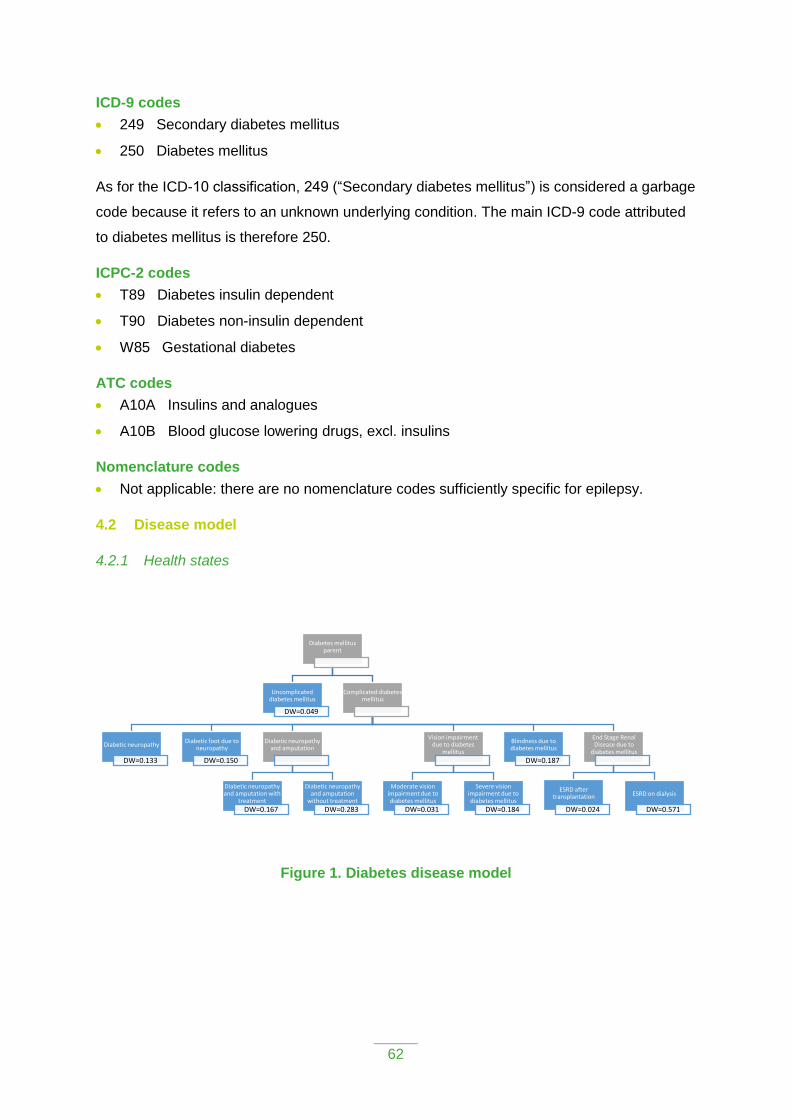
62
ICD-9 codes
249 Secondary diabetes mellitus
250 Diabetes mellitus
As for the ICD-10 classification, 249 (“Secondary diabetes mellitus”) is considered a garbage
code because it refers to an unknown underlying condition. The main ICD-9 code attributed
to diabetes mellitus is therefore 250.
ICPC-2 codes
T89 Diabetes insulin dependent
T90 Diabetes non-insulin dependent
W85 Gestational diabetes
ATC codes
A10A Insulins and analogues
A10B Blood glucose lowering drugs, excl. insulins
Nomenclature codes
Not applicable: there are no nomenclature codes sufficiently specific for epilepsy.
4.2 Disease model
4.2.1 Health states
Figure 1. Diabetes disease model
Diabetes mellitus parent
Uncomplicated diabetes mellitus
DW=0.049
Complicated diabetes mellitus
Diabetic neuropathy
DW=0.133
Diabetic foot due to neuropathy
DW=0.150
Diabetic neuropathy and amputation
Diabetic neuropathy and amputation with
treatment
DW=0.167
Diabetic neuropathy and amputation
without treatment
DW=0.283
Vision impairment due to diabetes
mellitus
Moderate vision impairment due to diabetes mellitus
DW=0.031
Severe vision impairment due to diabetes mellitus
DW=0.184
Blindness due to diabetes mellitus
DW=0.187
End Stage Renal Disease due to
diabetes mellitus
ESRD after transplantation
DW=0.024
ESRD on dialysis
DW=0.571

63
4.2.2 Disability weights
Table 1. Disability weights (DW) by health state for diabetes according to the Global Burden of Disease study (Salomon et al., 2015)
Health state Lay description DW
Uncomplicated diabetes mellitus
Has a chronic disease that requires medication every day and causes some worry, but minimal interference with daily activities
0.049
Diabetic neuropathy Has pain, tingling, and numbness in the arms, legs, hands, and feet. The person sometimes gets cramps and muscle weakness.
0.133
Diabetic neuropathy with diabetic foot
Has a sore on the foot that is swollen and causes some difficulty in walking.
0.150†
Diabetic neuropathy with treated amputation
Has lost part of one leg, leaving pain and tingling in the stump. The person has an artificial leg that helps in moving around.
0.167‡
Diabetic neuropathy with untreated amputation
Has lost part of one leg, leaving pain and tingling in the stump. The person does not have an artificial leg, has frequent sores, and uses crutches.
0.283§
Moderate vision loss due to diabetes mellitus
Has vision problems that make it difficult to recognize faces or objects across a room.
0.031
Severe vision loss due to diabetes mellitus
Has severe vision loss, which causes difficulty in daily activities, some emotional impact (for example worry), and some difficulty going outside the home without assistance
0.184
Blindness due to diabetes mellitus
Is completely blind, which causes great difficulty in some daily activities, worry and anxiety, and great difficulty going outside the home without assistance.
0.187
End-stage renal disease after transplant due to diabetes mellitus
Sometimes feels tired and down, and has some difficulty with daily activities
0.024
End-stage renal disease on dialysis due to diabetes mellitus
Is tired and has itching, cramps, headache, joint pains and shortness of breath. The person needs intensive medical care every other day lasting about half a day.
0.571
†Combined DW of neuropathy (0.133) and diabetic foot (0.020) ‡Combined DW of neuropathy (0.133) and amputation of one leg, long-term, with treatment (0.039)
§Combined DW of neuropathy (0.133) and amputation of one leg, long-term, without treatment (0.173)
4.2.3 Proportion of patients in the considered health states
For most health states, Belgian data from the GUIDANCE study (Stone et al., 2013) were
used to derive the proportion of patients in the respective health states. This study included
patients from both primary and specialist care. A total of 1044 Belgian patients participated,
with a mean age at recruitment of 68.7. The vast majority (96.1%) was recruited from
primary care, and was reported to take any diabetes medication (96.4%), in line with the
definition of the disease model, which only considers individuals taking diabetes medication.

64
For some of the health states Belgian data could not be found:
For end stage renal disease a European study was used instead (Kramer et al., 2018).
For other health states no estimates were available. The assumption was then made that
patients would be equally distributed over the concerned health states (for instance
among the patients with vision impairment, 50% would have moderate impairment and
50% would have severe impairment).
Table 2. Proportion of patients in the different health states considered in the diabetes disease model, Belgium.
Health state Parent Proportion Source
Diabetes mellitus parent
N/A 100% Per definition
Uncomplicated diabetes mellitus
Diabetes mellitus parent
Varying from 72 to 99% in function of age and sex
GUIDANCE study (Stone et al., 2013)
Diabetic neuropathy Diabetes mellitus parent
Varying from 0 to 10% in function of age and sex
GUIDANCE study (Stone et al., 2013)
Diabetic neuropathy with diabetic foot
Diabetes mellitus parent
Varying from 0 to 4% in function of age and sex
GUIDANCE study (Stone et al., 2013)
Diabetic neuropathy with amputation
Diabetes mellitus parent
Varying from 0 to 2% in function of age and sex
GUIDANCE study (Stone et al., 2013)
Diabetic neuropathy with treated amputation
Diabetic neuropathy with amputation
50% Assumption, in absence of data
Diabetic neuropathy with untreated amputation
Diabetic neuropathy with amputation
50% Assumption, in absence of data
Vision loss due to diabetes mellitus
Diabetes mellitus parent
Varying from 1 to 12% in function of age and sex
GUIDANCE study (Stone et al., 2013)
Moderate vision loss due to diabetes mellitus
Vision loss due to diabetes mellitus
50% Assumption, in absence of data
Severe vision loss due to diabetes mellitus
Vision loss due to diabetes mellitus
50% Assumption, in absence of data
Blindness due to diabetes mellitus
Diabetes mellitus parent
Varying from 0 to 1% in function of age and sex
GUIDANCE study (Stone et al., 2013)
End-stage renal disease due to diabetes mellitus
Diabetes mellitus parent
Varying from 0 to 1% in function of age and sex
GUIDANCE study (Stone et al., 2013)

65
End-stage renal disease after transplant due to diabetes mellitus
End-stage renal disease due to diabetes mellitus
28% Kramer et al. (2018)
End-stage renal disease on dialysis due to diabetes mellitus
End-stage renal disease due to diabetes mellitus
72% Kramer et al. (2018)
4.2.4 Discussion
The diabetes disease model does not consider acute complications such as hypo- or
hyperglycemia. Although the impact of these conditions may be severe, the duration is
typically very short, leading to few YLDs. This of course does not exclude death from
hyperglycemia, which would be captured by the YLL component of the DALY metric, but not
by the YLD component.
Diabetes patients are usually not suffering / dying from the disease itself, but rather from its
complications. These complications are included in the model but only for those related to
neurologic and microvascular problems. In line with the GBD study, however, macrovascular
complications such as coronary artery disease, peripheral arterial disease, and stroke, are
not considered here. The main reason for doing so is to avoid that those vascular diseases
are counted twice in the DALY calculation: once with diabetes and a second time with
cardiovascular diseases, since these macrovascular conditions are included in the
cardiovascular disease categories. In an additional step a proportion of these cases may be
attributed to hyperglycemia as risk factor. For instance, Huxley et al. (2006) found that the
relative risk for fatal coronary heart disease in patients with diabetes compared with no
diabetes, was 3.5 in men and 2.1 in women. Given a diabetes prevalence of 6.6% in men
and 6.1% in women, this would result in (p(RR-1))/(p(RR-1)+1)=14% of coronary heart
disease deaths being attributed to diabetes in men, and 6.3% in women.
The disease model may also not fully capture the reduced quality of life patients may
experience due to interference of the disease with daily activities.
Disability weights for the Belgian national burden of disease study are adapted from the
Global Burden of Disease study (Salomon et al., 2015), as these provide an exhaustive set
of internally consistent disability weights.
The severity distribution (proportion of the cases in the different health states) for the
diabetes disease model are largely based on Belgian data (GUIDANCE study). For end
stage renal diseases, a European study was used (Kramer et al., 2018). For the proportion
of treated vs untreated amputation, as well as for the proportion of moderate vs severe

66
vision, no data were available, hence a 50:50 split was assumed. In future iterations of the
Belgian national burden of disease study, new and updated Belgian data should be
incorporated.
The prevalence applied severity distribution of health states represent the national average,
and may therefore hide regional differences. Sufficiently powered studies are needed to
provide valid regional estimates.
4.3 Prevalence
4.3.1 Data sources
Different data sources exist for diabetes, each with a specific case definition:
1. Diabetes registry: diabetic patients diagnosed under the age of 40 who are registered
by their treating diabetologist for the diabetes registry
2. Hospital discharge data: patients admitted to hospital during the reference year with
diabetes (before 2015: ICD-9 code 250; after 2015: ICD-10 code E10-E14) as primary or
secondary diagnosis for the hospital discharge.
3. Health insurance data: person with a prescription for ATC codes A10A or A10B
AND/OR with diabetes referring nomenclature (diabetes convention, diabetes pass,
diabetes care trajectory) during the reference year for health insurance. Women who
gave birth during the year under review are excluded to exclude gestational diabetes.
4. Health Interview Survey: Number of respondents with positive answer to the question
“in the past 12 months, have you had diabetes?”.
5. Sentinel GP network data (Intego): number of individuals with a diabetes diagnosis
ever recorded by the GP (ICPC code T89-T90) who had a GP contact during the
reference year.
6. Sentinel GP network data (Sciensano): number of individuals with diabetes diagnosis
recorded by a sentinel GP during the reference year.
Table 3. Potential sources and methods for the computation of epilepsy prevalence in Belgium.
Source Strengths Weaknesses Evaluation
Diabetes registry
Based on a diagnosis by a diabetologist
National coverage
As the registry only includes patients with diabetes diagnosed under the age of 40, it cannot be used to produce prevalence estimates for diabetic patients at all ages in Belgium
Sensitivity: low
Specificity: high

67
Based on voluntary reporting
No recent data available
Managed by clinicians; no government funding; the future of this database is uncertain
Important geographical differences in the completeness of the results (although studies have been done to correct for this and obtain representative results at the level of the total Belgian population)
Hospital discharge data
Exhaustive information on all cases hospitalized for epilepsy
Diagnoses by medical doctor
Official database, organized and managed by public health authorities
National database
No information on diabetic patients who were not admitted to hospital during the reference year. This is assumed to represent a substantial proportion of all cases.
HDD is primarily used for administrative purposes, which could result in some problems when data have to be used for epidemiological purposes
Sensitivity: low
Specificity: high
Health insurance data (IMA/EPS)
Case definition based on medication and care
Large, representative sample
Longitudinal approach
Case definitions are based on the prescription of medicines, not on a medical diagnosis, which generates false positives and false negatives:
False positives: patients without diabetes, treated with antidiabetics for other reasons, for instance slimming
False negatives: diabetic patients treated with diet only and without any nomenclature codes
People who are not insured (e.g. homeless and illegal people, foreigners with their official residence abroad) are not included
Sensitivity: high
Specificity: high
Health Interview Survey
Based on information from a representative sample
Provides representative results
Self-reported information, which may lead to false positive and false negative results
Sensitivity: high (90%; Vaes et al. (2018))
Specificity: high

68
at national and regional levels.
Not yearly available (+/- every 5 years)
Comparing estimates between subgroups of the sample might lack statistical precision
Sentinel GP network data (Intego)
Diagnosis by medical professional
Longitudinal approach
Will not capture patients that bypass the GP (ED, hospitalisation) unless the information is transmitted to the GP
Results are limited to Flanders
At the level of Flanders, the representativeness cannot be 100% guaranteed (the network only includes a sample of GPs using a specific software and interested in registration)
For the PP: not possible to identify the reason for consultation, so might not be related to diabetes; However, the condition is expected to require continuous treatment. Patients are thus expected to seek regular GP contact.
Sensitivity: low (57%; Vaes et al. (2018))
Specificity: high
Sentinel GP network data (Sciensano)
Diagnosis by medical professionals
120 GP distributed evenly all over the country
Representativeness of GPs in Belgium (for age and sex)
Will not capture patients that bypass the GP (ED, hospitalization) unless the information is transmitted to the GP
Only periodic registration
Last registration: 2010
Sensitivity: low
Specificity: high
4.3.2 National best estimate
Vaes et al. (2018) performed cross-tabulations of different data sources on the prevalence of
diabetes in Belgium–i.e., health insurance data, health interview survey data, and sentinel
GP network data. They concluded that disease prevalence estimates based on dispensed
medications (health insurance data) were higher than disease estimates based on
prescribed medications and self-reported medication use. Furthermore, the sensitivity and
specificity of dispensed medication for self-reported diagnoses was shown to be high.
Based on the results Vaes et al. (2018), and in line with the conclusions of the Morbistat
project (Van der Heyden, 2011), the estimate of the Intermutualistic Agency (IMA), available

69
through the IMA ATLAS (http://atlas.ima-aim.be/databanken), is proposed as “best estimate”
of the prevalence of known (treated) diabetes mellitus in Belgium.
4.3.3 Discussion
Despite showing high sensitivity and specificity, health insurance data remain administrative
data that have to be used with caution for epidemiological purpose (Vaes et al., 2018). In
addition, these data probably underestimate the true total number of diabetes cases as they
do not take into account diabetes patients who do not take medical treatment, but only follow
initial control based on lifestyle changes (in line with the diabetes treatment guidelines). This
definition is however consistent with the disease model, which assigns a disability weight to
diabetes as a “chronic disease that requires medication every day”.
The disability weight for diabetes patients who do not take medical treatment is probably
smaller than that for those taking medication, and is implicitly assumed to be zero.
In addition, according to the Belgian Health Interview Survey 2018, 91.5% of the individuals
aged 15 and over that reported having diabetes, also indicated that they used anti-diabetic
medication (Van der Heyden and Charafeddine, 2019). As a consequence, potentially only
7% of the diabetic patients are missing in the current estimate (and those patients probably
have low disability weights related to diabetes). Furthermore, the Belgian Health
Examination Survey 2018 showed that 10% of the Belgian adults has diabetes, but that one
out of three of them are not aware of their condition (Van der Heyden et al., 2019).
Health insurance data may also yield false positives if patients who have no diabetes take
antidiabetic treatment. For instance, metformin is sometimes used for other indications than
diabetes. The proportion of false positives is however likely to be relatively small.
4.4 References
GBD 2017 Disease and Injury Incidence and Prevalence Collaborators. Global, regional, and national
incidence, prevalence, and years lived with disability for 354 diseases and injuries for 195
countries and territories, 1990-2017: a systematic analysis for the Global Burden of Disease
Study 2017. Lancet 2018 Nov 10;392(10159):1789-858.
Huxley R, Barzi F, Woodward M. Excess risk of fatal coronary heart disease associated with diabetes
in men and women: meta-analysis of 37 prospective cohort studies. BMJ 2006 Jan
14;332(7533):73-8.
Kramer A, Pippias M, Noordzij M, Stel VS, Afentakis N, Ambuhl PM, et al. The European Renal
Association - European Dialysis and Transplant Association (ERA-EDTA) Registry Annual Report
2015: a summary. Clin Kidney J 2018 Feb;11(1):108-22.
Salomon JA, Haagsma JA, Davis A, de Noordhout CM, Polinder S, Havelaar AH, et al. Disability
weights for the Global Burden of Disease 2013 study. Lancet Glob Health 2015 Nov;3(11):e712-
e723.

70
Stone MA, Charpentier G, Doggen K, Kuss O, Lindblad U, Kellner C, et al. Quality of care of people
with type 2 diabetes in eight European countries: findings from the Guideline Adherence to
Enhance Care (GUIDANCE) study. Diabetes Care 2013 Sep;36(9):2628-38.
Vaes B, Ruelens C, Saikali S, Smets A, Henrard S, Renard F, et al. Estimating the prevalence of
diabetes mellitus and thyroid disorders using medication data in Flanders, Belgium. Eur J Public
Health 2018 Feb 1;28(1):193-8.
Van der Heyden J. Eurostat – Pilot Project Diagnosis-specific Morbidity Statistics. Brussels, Belgium:
Scientific Institute of Public Health, Operational Direction Public Health and Surveillance, Unit
Surveys, Lifestyle and Chronic Diseases; 2011.
Van der Heyden J, Charafeddine R. Gezondheidsenquête 2018: Chronische ziekten en
aandoeningen. Rapportnummer: D/2019/14.440/36. Brussel, België: Sciensano; 2019. Available
from: https://his.wiv-isp.be/nl/Gedeelde%20%20documenten/MA_NL_2018.pdf
Van der Heyden J, Nguyen D, Renard F, Scohy A, Demarest S, Drieskens S, Gisle L. Belgisch
gezondheidsonderzoek 2018. Rapportnummer: D/2019/14.440/89. Brussel, België: Sciensano;
2019. Available from https://his.wiv-isp.be/nl/Gedeelde%20%20documenten/HES_NL_2018.pdf

71
5 EPILEPSY
5.1 Case definition
The case definition for epilepsy encompasses:
1. Epilepsy, a condition characterized by recurrent (two or more) epileptic seizures,
unprovoked by any immediate identified cause. An epileptic seizure is defined as “a
transient occurrence of signs and/or symptoms due to abnormal excessive or
synchronous neuronal activity in the brain” (Fisher et al. 2005).
2. Active epilepsy: a prevalent case of active epilepsy is defined as a person with epilepsy
who has had at least one epileptic seizure in the previous five years, regardless of
antiepileptic drug (AED) treatment.
5.1.1 Corresponding disease classification codes
ICD-10 codes
G40 Epilepsy
G41 Status epilepticus
ICD-9 codes
345 Epilepsy and recurrent seizures
ICPC-2 codes
N88 Epilepsy
ATC codes
N03A Antiepileptics
Nomenclature codes
Not applicable: there are no nomenclature codes sufficiently specific for epilepsy.
5.2 Disease model
5.2.1 Health states
Figure 1. Epilepsy disease model
Epilepsy
Severe epilepsy
DW=0.552
Less severe epilepsy
DW=0.263
Epilepsy treated without fits
DW=0.049

72
5.2.2 Disability weights
Table 1. Disability weights (DW) by health state for epilepsy according to the Global Burden of Disease study (Salomon et al., 2015)
Health state Lay description DW
Severe epilepsy (seizures at least once per month)
This person has sudden seizures one or more times each month, with violent muscle contractions and stiffness, loss of consciousness, and loss of urine or bowel control. Between seizures the person has memory loss and difficulty concentrating.
0.552
Less severe epilepsy (seizures less than once per month)
This person has sudden seizures two to five times a year, with violent muscle contractions and stiffness, loss of consciousness, and loss of urine or bowel control.
0.263
Epilepsy treated without fits This person has a chronic disease that requires medication every day and causes some worry but minimal interference with daily activities.
0.049
5.2.3 Proportion of patients in the considered health states
Table 2. Proportion of patients in the different health states considered in the epilepsy disease model, Belgium.
Health state Parent Proportion Source
Epilepsy N/A 100% Per definition
Severe epilepsy Epilepsy 31.1% GBD 2017
Less severe epilepsy Epilepsy 21.5% GBD 2017
Epilepsy treated without fits
Epilepsy 47.3% GBD 2017
5.2.4 Discussion
The severity distribution in the GBD model is based on the calculation of epilepsy
impairment. Impairments in GBD are conditions or specific domains of functional health loss
which are spread across many GBD causes as sequelae and for which there are better data
to estimate the occurrence of the overall impairment than for each sequela based on the
underlying cause.
In the GBD, the severity distribution of epilepsy impairment was calculated as followed: the
proportions with idiopathic and secondary epilepsy as well as for the proportions with severe
and less severe epilepsy were determined using mixed effects regressions. The sparse data
for the proportion of treated epilepsy were pooled in a random effects meta-analysis. Since
data are not specific to Belgium, the question of applicability to the Belgian context is raised.

73
5.3 Prevalence
5.3.1 Data sources
Different data sources exist for epilepsy, each with a specific case definition:
1. Hospital Discharge data: patient with epilepsy admitted to the hospital during the
reference year (before 2015: ICD-9 codes 345; after 2015 ICD-10 codes: G40, G41).
2. Health insurance data: person with a prescription for ATC codes N03 during the
reference year.
3. Health Interview Survey: number of respondents with positive answer to the question
“in the past 12 months, have you had epilepsy?”.
4. Sentinel GP network data (Intego): Number of individuals with epilepsy diagnosis ever
recorded by GP (ICPC-2 code N88) who had a GP contact during the reference year.
Table 3. Potential sources and methods for the computation of epilepsy prevalence in Belgium.
Source Strengths Weaknesses Evaluation
Hospital discharge data
Exhaustive information on all cases hospitalized for epilepsy
Diagnoses by medical doctor
Official database, organized and managed by public health authorities
National database
No information on epileptic patients who were not admitted to hospital during the reference year. This may represent a rather large proportion of all cases since hospitalization in patients with epilepsy is uncommon (Franchi et al., 2013; Jetté et al., 2010; Mitchell et al., 2018)
HDD is primarily used for administrative purposes, which could result in some problems when data have to be used for epidemiological purposes
Evidence has shown a poor detection of the epilepsy cases using HDD (Tu et al., 2014)
Sensitivity: low
Specificity: high
Health insurance data (IMA/EPS)
Large, representative sample
Longitudinal approach
Case definitions are based on the prescription of medicines, not on a medical diagnosis, which generates false positives and false negatives:
False positives: includes patients having received this treatment for another indication (30%-64% of anti-epileptic drugs are
Sensitivity: high
Specificity: low

74
prescribed for another indication) (Hamer et al., 2012; Johannessen et al., 2009; Ettinger et al., 2007)
False negatives: patients with the condition who do not take this treatment (assumption of few false negatives since not taking this treatment is very disabling)
People who are not insured (e.g. homeless and illegal people, foreigners with their official residence abroad) are not included
Health Interview Survey
Based on information from a representative sample
Provides representative results at national and regional levels.
Self-reported information, which may lead to false positive and false negative results
Not yearly available (+/- every 5 years)
Comparing estimates between subgroups of the sample might lack statistical precision
Sensitivity: medium
Specificity: medium
Sentinel GP network data (Intego)
Diagnosis by medical professional
Longitudinal approach
Will not capture patients that bypass the GP (ED, hospitalisation) unless the information is transmitted to the GP
Results are limited to Flanders
At the level of Flanders, the representativeness cannot be 100% guaranteed (the network only includes a sample of GPs using a specific software and interested in registration)
For the PP: not possible to identify the reason for consultation, so might not be related to NP.
Sensitivity: medium
Specificity: high
Sentinel GP network data (Sciensano)
Not applicable. Epilepsy has not been registered by the Sciensano SGPs.

75
5.3.2 National best estimate
The sentinel GP network Intego is assumed to yield the best estimate of epilepsy
prevalence. Patients suffering from this affection are supposed to have close contacts with
the GP as their condition requires regular drug prescriptions. Representativeness for
Belgium could be obtained by applying a correction factor based on the ratio of the
prevalence of epilepsy in Belgium and the prevalence of the disease in Flanders (from the
HIS or the EPS data).
5.3.3 Discussion
Given the potentially high burden of epilepsy, further studies are needed to quantify the
validity (sensitivity/specificity) of the proposed approach for defining the prevalence of
epilepsy.
Hospital discharge data are not recommended to monitor the epilepsy prevalence in the
general population since the hospitalization rate is low in people with epilepsy (Franchi et al.,
2013; Jetté et al., 2010; Mitchell et al., 2018). Furthermore, evidence has shown a poor
detection of the population epilepsy cases using the hospital discharge data (Tu et al.,
2014).
The Health insurance data (pharmaceutical dataset) are not recommended since anti-
epileptic drugs are often prescribed in other conditions, e.g. psychiatry disorders (bipolar
disorder, anxiety disorder), migraine and neuropathic pain (Hamer et al., 2012; Johannessen
et al., 2009; Ettinger et al., 2007), which would generate a lot of false positives.
The HIS data are self-reported, which may lead to false positives since cases are not
diagnosed by a medical practitioner. Furthermore, data are not yearly available.
5.4 References
Ettinger AB, Argoff CE. Use of antiepileptic drugs for nonepileptic conditions: Psychiatric disorders
and chronic pain. Neurotherapeutics. 2007;4(1):75-83. doi:10.1016/j.nurt.2006.10.003
Fisher RS, Boas W van E, Blume W, et al. Epileptic Seizures and Epilepsy: Definitions Proposed by
the International League Against Epilepsy (ILAE) and the International Bureau for Epilepsy (IBE).
Epilepsia. 2005;46(4):470-472. doi:10.1111/j.0013-9580.2005.66104.x
Franchi C, Giussani G, Messina P, et al. Validation of healthcare administrative data for the diagnosis
of epilepsy. J Epidemiol Community Health. 2013;67(12):1019. doi:10.1136/jech-2013-202528
GBD 2017 Disease and Injury Incidence and Prevalence Collaborators. Global, regional, and national
incidence, prevalence, and years lived with disability for 354 diseases and injuries for 195
countries and territories, 1990-2017: a systematic analysis for the Global Burden of Disease
Study 2017. Lancet. 2018;392(10159):1789-1858.

76
Hamer HM, Dodel R, Strzelczyk A, et al. Prevalence, utilization, and costs of antiepileptic drugs for
epilepsy in Germany—a nationwide population-based study in children and adults. Journal of
Neurology. 2012;259(11):2376-2384. doi:10.1007/s00415-012-6509-3
Jetté N, Reid AY, Quan H, Hill MD, Wiebe S. How accurate is ICD coding for epilepsy? Epilepsia.
2010;51(1):62-69. doi:10.1111/j.1528-1167.2009.02201.x
Johannessen Landmark C, Larsson PG, Rytter E, Johannessen SI. Antiepileptic drugs in epilepsy and
other disorders—A population-based study of prescriptions. Epilepsy Research. 2009;87(1):31-
39. doi:10.1016/j.eplepsyres.2009.07.005Mitchell RJ, Herkes G, Nikpour A, et al. Examining
health service utilization, hospital treatment cost, and mortality of individuals with epilepsy and
status epilepticus in New South Wales, Australia 2012–2016. Epilepsy & Behavior. 2018;79:9-16.
doi:10.1016/j.yebeh.2017.11.022
Salomon JA, Haagsma JA, Davis A, de Noordhout CM, Polinder S, Havelaar AH, et al. Disability
weights for the Global Burden of Disease 2013 study. Lancet Glob Health 2015 Nov;3(11):e712-
e723.
Tu K, Wang M, Jaakkimainen RL, et al. Assessing the validity of using administrative data to identify
patients with epilepsy. Epilepsia. 2014;55(2):335-343. doi:10.1111/epi.12506

77
6 PARKINSON’S DISEASE
6.1 Case definition
According to the World Health Organization (WHO 2007), Parkinson’s disease (PD) is a
chronic neurodegenerative disease defined by the progressive loss of dopamine-containing
neurons in a specific zone of the brain called the substantia nigra, and characterized by
motors symptoms (i.e., tremors, muscular rigidity, and bradykinesia) and non-motor
symptomatology (e.g. speech and swallowing difficulties), with late-onset motor symptoms
(e.g., postural instability and falls).
Parkinsonism is a term used to refer to a group of neurological symptoms that are
“Parkinson-like” such as bradykinesia or postural instability, regardless of the cause. Also
called atypical parkinsonism syndrome, its evolution is more aggressive than PD and it has a
poorer response to the treatment. The differential diagnosis can be difficult between those
pathologies, especially in the early stages of the disease (Tsuda et al., 2019).
The case definition of Parkinson’s disease is the presence of at least two of the four primary
symptoms: (1) tremors/trembling, (2) bradykinesia, (3) stiffness of limbs and torso, and (4)
posture instability.
It has to be noticed that the choice was made to include parkinsonism in the case definition,
for several reasons:
Parkinsonism syndrome is responsible for “Parkinson-like” neurological symptoms that
cause alteration of the quality of life that has to be quantified in YLD. Otherwise, disability
linked to parkinsonism would be ignored.
Since the differential diagnosis is difficult to establish between PD and parkinsonism, not
including parkinsonism would exclude a lot of PD cases of the analysis.
The same methodology was used in the GBD studies, allowing international
comparisons.
6.1.1 Corresponding disease classification codes
ICD-10 codes
G20 Parkinson disease (included: hemiparkinsonism, paralysis agitans, parkinsonism
or Parkinson disease: NOS, idiopathic, primary)
G21 Secondary parkinsonism
G22 Parkinsonism in diseases classified elsewhere (included: syphilitic parkinsonism)
ICD-9 codes
332 Parkinson’s disease

78
ICPC-2 codes
N87 Parkinsonism
ATC codes
N04 Anti-Parkinson drugs
N04AB Ethers chemically close to antihistamines
N04AC Ethers of tropine or tropine derivatives
N04B Dopaminergic agents
Nomenclature codes
Not applicable: there are no nomenclature codes sufficiently specific for Parkinson’s
disease.
6.2 Disease model
6.2.1 Health states
Figure 1. Parkinson’s disease disease model
6.2.2 Disability weights
Table 1. Disability weights (DW) by health state for Parkinson’s disease according to the Global Burden of Disease study (Salomon et al., 2015)
Health state Lay description DW
Mild Parkinson’s disease Has mild tremors and moves a little slowly, but is able to walk and do daily activities without assistance.
0.010
Moderate Parkinson’s disease Has moderate tremors and moves slowly, which causes some difficulty in walking and daily activities. The person has some trouble swallowing, talking, sleeping, and remembering things
0.267
Severe Parkinson’s disease Has severe tremors and moves very slowly, which causes great difficulty in walking and daily activities. The person falls easily and has a lot of difficulty talking, swallowing, sleeping, and remembering things.
0.575
Parkinson's disease
Mild Parkinson's disease
DW=0.010
Moderate Parkinson's disease
DW=0.267
Severe Parkinson's disease
DW=0.575

79
6.2.3 Proportion of patients in the considered health states
Table 2. Proportion of patients in the different health states considered in the Parkinson’s disease disease model, Belgium.
Health state Parent Proportion Source Hoehn and Yahr stage
Parkinson’s disease
N/A 100% Per definition N/A
Parkinson’s disease, mild
Parkinson’s disease, parent
52% GBD 2017 ≤2.0
Parkinson’s disease, moderate
Parkinson’s disease, parent
32% GBD 2017 2.5–3.0
Parkinson’s disease, severe
Parkinson’s disease, parent
13% GBD 2017 ≥4
6.2.4 Discussion
The severity distribution in the GBD model is based on data from a systematic review that
covered 1/1/2008 to 11/10/2016 and captured studies reporting the prevalence of PD by
Hoehn and Yahr stage (GBD 2016 Parkinson’s Disease Collaborators, 2018). Thirty unique
sources were used, covering 21 world regions. A score of 2.0 or less on the Hoehn and Yahr
scale equated to mild PD, a score of 2.5–3.0 to moderate PD, and a score of 4.0–5.0 to
severe PD. A meta-analysis was performed on these data to obtain the proportion of PD that
is mild, moderate and severe. Belgian data were not included in the systematic review,
raising questions on the applicability of the severity distributions for the Belgian context.
However, the studies covered several Western European countries (e.g. Netherlands,
Scotland, England, Germany, …), with a high Socio-Demographic Index, allowing
extrapolations to Belgium.
Since health states are defined in terms of clinical grading scale, comparability with available
epidemiological and clinical evidence is allowed.
6.3 Prevalence
6.3.1 Data sources
Different data sources exist for Parkinson’s diseases, each with a specific case definition:
1. Hospital Discharge data: patient with PD admitted to the hospital during the reference
year (before 2015: ICD-9 codes 332; after 2015 ICD-10 codes: G20).
2. Health insurance data: person with a prescription for one of the following ATC codes:
N04B, N04AB, N04AC, during the reference year.

80
3. Health Interview Survey: number of respondents with a positive answer to the question
“in the past 12 months, have you suffered from Parkinson disease?”.
4. Sentinel GP network data (Intego): Number of individuals with PD diagnosis ever
recorded by GP (ICPC-2 code N87) who had a GP contact during the reference year.
Table 3. Potential sources and methods for the computation of Parkinson’s disease prevalence in Belgium.
Source Strengths Weaknesses Evaluation
Hospital discharge data
Exhaustive information on all cases hospitalized for PD
Diagnoses by medical doctor
Official database, organized and managed by public health authorities
National database
No information on PD patients who were not admitted to hospital during the reference year. This may represent a rather large proportion of all cases since only 7 to 30% of all PD patients are hospitalized each year (Hassan et al., 2013; Shahgoli et al., 2017; Gerlach et al., 2011)
HDD is primarily used for administrative purposes, which could result in some problems when data have to be used for epidemiological purposes
Evidence has shown a poor detection of the epilepsy cases using HDD (Tu et al., 2014)
Sensitivity: medium
Specificity: high
Health insurance data (IMA/EPS)
Large, representative sample
Longitudinal approach
Case definitions are based on the prescription of medicines, not on a medical diagnosis, which generates false positives and false negatives:
False positives: includes patients with no PD having received this treatment for another indication
False negatives: patients with the condition who do not take this treatment (assumption of few false negatives since not taking this treatment is very disabling)
People who are not insured (e.g. homeless and illegal people, foreigners with their official residence abroad) are not included
Sensitivity: medium
Specificity: high

81
Health Interview Survey
Based on information from a representative sample
Provides representative results at national and regional levels.
Self-reported information, which may lead to false positive and false negative results
Not yearly available (+/- every 5 years)
Comparing estimates between subgroups of the sample might lack statistical precision
Sensitivity: medium
Specificity: medium
Sentinel GP network data (Intego)
Diagnosis by medical professional
Longitudinal approach
Will not capture patients that bypass the GP (ED, hospitalisation) unless the information is transmitted to the GP
Results are limited to Flanders
At the level of Flanders, the representativeness cannot be 100% guaranteed (the network only includes a sample of GPs using a specific software and interested in registration)
For the PP: not possible to identify the reason for consultation, so might not be related to NP.
ICPC code N87 includes both PD and parkinsonism
Sensitivity: low
Specificity: high
Sentinel GP network data (Sciensano)
Not applicable. PD has not been registered by the Sciensano SGPs.
6.3.2 National best estimate
The health insurance dataset is assumed to be the best estimate since a validated “pseudo-
diagnosis” exists. Data on the delivery of anti-Parkinson drugs in the public pharmacies and
in the hospitals pharmacies are available in the Inter Mutualistic Agency (IMA) database
(Pharmanet and GZSS).
Furthermore, evidence has shown that using a pharmaceutical dataset can provide reliable
estimates of the Parkinson’s disease prevalence in the population (Slobbe et al., 2019; Chini
et al., 2011). However, since the pharmaceutical dataset of the health insurance only
contains reimbursed drugs, prevalence estimates may be underestimated.

82
6.3.3 Discussion
The validity of the ATC codes selected to define PD has been explored in the Project
HISLINK 2013 (Berete et al., 2019), through a linkage between the Health Insurance data
(IMA) and the data from the Health Interview Survey (HIS).
The agreement between the two databases has been assessed by calculating the following
validity measures: the sensitivity, the specificity, the positive and negative predicting values
and the Cohen’s kappa coefficient, using the HIS 2008 data as gold standard (see Section
3.4 for more information on the HISLINK project).
When comparing the PD prevalence from IMA with HIS 2008 (gold standard), the agreement
is good (Kappa coefficient: 0.64), the sensitivity is 56.6%, the specificity is 99.95%, the PPV
is 82.74%, and the NPV is 99.8% (with a cut-off point of ≥90 DDD).
The same analysis has been made in function of different cut-off points of DDD, allowing to
increase the sensitivity, i.e., to identify more cases of the PD cases identified in the HIS,
when using the IMA database.
The results show that setting up a cut-off point of 0 DDD allow to increase the sensitivity
from 57% to 69%, with no variation of the specificity and the NPV. The PPV decreases from
82% to 61%. However, it has to be noticed that the PPV is very sensitive to the prevalence
of a disease. When the prevalence is high, the PPV remains good but when the number of
cases is very low (as in PD), the PPV decreases strongly. Notwithstanding this, we
recommend to use a cut-off point of 0 DDD.
Given the potentially high burden of PD, further studies are needed to quantify the validity
(sensitivity/specificity) of the proposed approach for defining the prevalence of this disease.
The Intego sentinel GP network data is another source to estimate the PD prevalence, since
PD patients are supposed to have close contacts with their GP as the disease prevalence
strongly increases with age, requires regular drug prescriptions, and is often associated with
multimorbidity. However, results are limited to Flanders which can induce a lack of
representativeness of the Belgian population. This limitation could be avoided by applying a
correction factor based on either the HIS or the EPS data.
The HDD may underestimate the PD prevalence by missing the cases that are not
hospitalized, even though studies have shown a hospitalization rate of up to 30% of PD
patients, which could be used to extrapolate the prevalence of the disease in the population.
However, the hospitalization rate is not specific to Belgium, thus extrapolations should be
interpreted with caution.

83
The HIS data are self-reported, which may lead to false positives since cases are not
diagnosed by a medical practitioner.
6.4 References
Berete F, Demarest S, Van der Heyden J, Tafforeau J Projet HISLINK 2013. Couplage des données
de l’enquête de santé 2013 avec les données des organismes assureurs. Etude de validité des
indicateurs de pseudopathologies. Sciensano, 2019. Available from:
https://www.sciensano.be/en/projects/linkage-health-interview-survey-data-health-insurance-data
Chini F, Pezzotti P, Orzella L, Borgia P, Guasticchi G. Can we use the pharmacy data to estimate the
prevalence of chronic conditions? a comparison of multiple data sources. BMC Public Health.
2011;11:688-688. doi:10.1186/1471-2458-11-688
GBD 2016 Parkinson’s Disease Collaborators. Supplement to: GBD 2016 Parkinson’s Disease
Collaborators. Global, regional, and national burden of Parkinson’s disease, 1990–2016: A
systematic analysis for the Global Burden of Disease Study 2016. Lancet Neurol.
2018;17(11):939-953. doi:10.1016/S1474-4422(18)30295-3.
GBD 2017 Disease and Injury Incidence and Prevalence Collaborators. Global, regional, and national
incidence, prevalence, and years lived with disability for 354 diseases and injuries for 195
countries and territories, 1990–2017: a systematic analysis for the Global Burden of Disease
Study 2017. Lancet 2018; 392: 1789–858
GBD 2017 Disease and Injury Incidence and Prevalence Collaborators. Supplement to: GBD 2017
Disease and Injury Incidence and Prevalence Collaborators. Global, regional, and national
incidence, prevalence, and years lived with disability for 354 diseases and injuries for 195
countries and territories, 1990–2017: A systematic analysis for the Global Burden of Disease
Study 2017. Lancet. 2018;(392):1789-1858. https://ars.els-cdn.com/content/image/1-s2.0-
S0140673618322797-mmc1.pdf.
Gerlach OHH, Winogrodzka A, Weber WEJ. Clinical problems in the hospitalized Parkinson’s disease
patient: Systematic review. Mov Disord. 2011;26(2):197-208. doi:10.1002/mds.23449
Hassan A, Wu SS, Schmidt P, et al. High rates and the risk factors for emergency room visits and
hospitalization in Parkinson’s disease. Parkinsonism & Related Disorders. 2013;19(11):949-954.
doi:10.1016/j.parkreldis.2013.06.006
Salomon JA, Haagsma JA, Davis A, et al. Disability weights for the Global Burden of Disease 2013
study. The Lancet Global Health. 2015;3(11):e712-e723. doi:10.1016/S2214-109X(15)00069-8
Shahgholi L, De Jesus S, Wu SS, et al. Hospitalization and rehospitalization in Parkinson disease
patients: Data from the National Parkinson Foundation Centers of Excellence. PLoS One.
2017;12(7):e0180425-e0180425. doi:10.1371/journal.pone.0180425
Slobbe LCJ, Füssenich K, Wong A, et al. Estimating disease prevalence from drug utilization data
using the Random Forest algorithm. European Journal of Public Health. 2019;29(4):615-621.
doi:10.1093/eurpub/cky270
Tsuda M, Asano S, Kato Y, Murai K, Miyazaki M. Differential diagnosis of multiple system atrophy with
predominant parkinsonism and Parkinson’s disease using neural networks. J Neurol Sci.
2019;401:19-26. doi:https://doi.org/10.1016/j.jns.2019.04.014
World Health Organization. Neurological disorders associated with malnutrition. In: Neurological
Disorders: Public Health Challenges. Geneva: WHO Press; 2007:111-175. Available from:
https://www.who.int/mental_health/neurology/chapter_3_b_neuro_disorders_public_h_challenges
.pdf?ua=1

84
7 LOW BACK PAIN (LBP)
7.1 Case definition
Low back pain (LBP) is defined as low back pain (with or without pain referred into one or
both lower limbs) that lasts for at least one day. The low back is defined as the area on the
posterior aspect of the body from the lower margin of the twelfth ribs to the lower gluteal
folds.
7.1.1 Corresponding disease classification codes
ICD-10 codes
M54.3 Sciatica
M54.4 Lumbago with sciatica
M54.5 Low back pain
ICD-9 codes
724 Other and unspecified disorders of back
ICPC-2 codes
L03 Low back symptom/complaint
L84 Back syndrome w/o radiating pain
L86 Back syndrome with radiating pain
ATC codes
Not applicable: there are no drugs sufficiently specific for treatment of LBP.
Nomenclature codes
Not applicable: there are no nomenclature codes sufficiently specific for LBP.
7.2 Disease model
7.2.1 Health states
Figure 1. Low back pain disease model
Low back pain parent
Without leg pain
Mild
DW=0.020
Moderate
DW=0.054
Severe
DW=0.272
Most severe
DW=0.372
With leg pain
Mild
DW=0.020
Moderate
DW=0.054
Severe
DW=0.325
Most severe
DW=0.384

85
7.2.2 Disability weights
Table 1. Disability weights (DW) by health state for low back pain according to the Global Burden of Disease study (Salomon et al., 2015)
Health state Lay description DW
Low back pain, mild This person has mild back pain, which causes some difficulty dressing, standing, and lifting things.
0.020
Low back pain, moderate This person has moderate back pain, which causes difficulty dressing, sitting, standing, walking, and lifting things.
0.054
Low back pain, severe without leg pain
This person has severe back pain, which causes difficulty dressing, sitting, standing, walking, and lifting things. The person sleeps poorly and feels worried.
0.272
Low back pain, severe with leg pain
This person has severe back and leg pain, which causes difficulty dressing, sitting, standing, walking, and lifting things. The person sleeps poorly and feels worried.
0.325
Low back pain, most severe without leg pain
This person has constant back pain, which causes difficulty dressing, sitting, standing, walking, and lifting things. The person sleeps poorly, is worried, and has lost some enjoyment in life.
0.372
Low back pain, most severe with leg pain
This person has constant back and leg pain, which causes difficulty dressing, sitting, standing, walking, and lifting things. The person sleeps poorly, is worried, and has lost some enjoyment in life.
0.384
7.2.3 Proportion of patients in the considered health states
Table 2. Proportion of patients in the different health states considered in the low back pain disease model, Belgium.
Health state Parent Proportion Source
Low back pain parent N/A 100% Per definition
Low back pain with leg pain
Low back pain parent ~age (9.4–37.4%) (Table 3)
GBD 2017 Disease and Injury Incidence and Prevalence Collaborators (2018)
Low back pain without leg pain, mild
Low back pain without leg pain
0.41 GBD 2017 Disease and Injury Incidence and Prevalence Collaborators (2018)
Low back pain without leg pain, moderate
Low back pain without leg pain
0.35 GBD 2017 Disease and Injury Incidence and Prevalence Collaborators (2018)
Low back pain without leg pain, severe
Low back pain without leg pain
0.10 GBD 2017 Disease and Injury Incidence and Prevalence Collaborators (2018)

86
Low back pain without leg pain, most severe
Low back pain without leg pain
0.14 GBD 2017 Disease and Injury Incidence and Prevalence Collaborators (2018)
Low back pain with leg pain, mild
Low back pain with leg pain
0.27 GBD 2017 Disease and Injury Incidence and Prevalence Collaborators (2018)
Low back pain with leg pain, moderate
Low back pain with leg pain
0.36 GBD 2017 Disease and Injury Incidence and Prevalence Collaborators (2018)
Low back pain with leg pain, severe
Low back pain with leg pain
0.14 GBD 2017 Disease and Injury Incidence and Prevalence Collaborators (2018)
Low back pain with leg pain, most severe
Low back pain with leg pain
0.23 GBD 2017 Disease and Injury Incidence and Prevalence Collaborators (2018)
Table 3. Proportion of individuals with low back pain that also suffer from leg pain (GBD 2017 Disease and Injury Incidence and Prevalence Collaborators, 2018)
Age group Proportion with leg pain Age group Proportion with leg pain
5-9 0.094 55-59 0.371
10-14 0.109 60-64 0.374
15-19 0.159 65-69 0.371
20-24 0.232 70-74 0.365
25-29 0.288 75-79 0.350
30-34 0.314 80-84 0.321
35-39 0.331 85-89 0.283
40-44 0.343 90-94 0.237
45-49 0.355 95-100 0.192
50-54 0.364
7.2.4 Discussion
Disability weights for the Belgian national burden of disease study are adapted from the
Global Burden of Disease study (4), as these provide an exhaustive set of internally
consistent disability weights.
The severity distribution in the GBD model is based exclusively on data from the USA,
raising questions on applicability for the Belgian context. The proportion of cases with low
back pain who report leg pain (by age) was derived using USA 2012 claims data. The

87
severity distributions were derived from an analysis of the Medical Expenditure Panel
Surveys (MEPS) in the USA (https://meps.ahrq.gov/mepsweb/). MEPS is an overlapping
continuous panel survey of the United States non-institutionalized population whose primary
purpose is to collect information on the use and cost of health care. Panels are two years
long and are conducted in five rounds, which are conducted every five to six months. Each
panel typically contains about 30,000 to 35,000 individual respondents. Respondents self-
administer the SF-12 twice per panel, at rounds 2 and 4, typically about a year apart. Only
adults 18 years and older completed the SF-12. MEPS also usually collects information on
diagnoses based on self-report of reasons for encounters with health services. In addition,
diagnoses are derived through additional questions on “problems that bother you” or
conditions that led to “disability days”, ie, days out of role due to illness. Professional coders
translate the verbatim text into three-digit ICD-9 codes. The main reason for LBP being
measured in MEPS relates to health care contact. For GBD 2017, data were used from
2000-2014.
Since the health states are not defined in terms of clinical grading scales, comparability with
available epidemiological and clinical evidence is hampered.
7.3 Prevalence
7.3.1 Data sources
Different data sources exist for LBP, each with a specific case definition:
1. Hospital discharge data: patient with low back pain admitted to the hospital during the
reference year (before 2015: ICD-9 code 724; after 2015 ICD-10 codes: M54.3, M54.4
and M54.5).
2. Health insurance data: not applicable; there are no (reimbursed) medications or health
care usages that would allow a sufficiently specific diagnosis of low back pain.
3. Health Interview Survey: number of respondents with positive answer to the question
“in the past 12 months, have you had a low back disorder or other chronic back defect?”.
4. Sentinel GP network data (Intego): number of individuals with low back pain diagnosis
ever recorded by GP (ICPC-2 codes L03, L84 and/or L86) who had a GP contact during
the reference year.
5. Sentinel GP network data (Sciensano): not applicable; low back pain has not been
registered by the Sciensano SGPs.

88
Table 4. Potential sources and methods for the computation of low back pain prevalence in Belgium.
Source Strengths Weaknesses Evaluation
Hospital discharge data
Exhaustive information on all cases hospitalized for low back pain
Diagnoses by medical doctor
Official database, organized and managed by public health authorities
National database
No information on low back pain patients who were not admitted to hospital during the reference year; this is a substantial proportion of the low back pain patients
HDD is primarily used for administrative purposes, which could result in some problems when data have to be used for epidemiological purposes
Sensitivity: low
Specificity: high
Health insurance data (IMA/EPS)
N/A: there are no (reimbursed) medications or health care usages that would allow a sufficiently specific diagnosis of low back pain
Health Interview Survey
Based on information from a representative sample
Provides representative results at national and regional levels.
Self-reported information, which may induce an overestimation of LBP prevalence; integration with information on disability or health-related quality of life may increase specificity
Not yearly available (+/- every 5 years)
Comparing estimates between subgroups of the sample might lack statistical precision
Sensitivity: high
Specificity: high
Sentinel GP network data (Intego)
Diagnosis by medical professional
Longitudinal approach
Will not capture patients that bypass the GP (ED, hospitalisation) unless the information is transmitted to the GP
Results are limited to Flanders
At the level of Flanders, the representativeness cannot be 100% guaranteed (the network only includes a sample of GPs using a specific software and interested in registration)
For the PP: not possible to identify the reason for
Sensitivity: low
Specificity: high

89
consultation, so might not be related to LBP.
Sentinel GP network data (Sciensano)
Not applicable. Low back pain has not been registered by the Sciensano SGPs.
7.3.2 National best estimate
The Health Interview Survey appears to be the most complete source of information on the
prevalence of low back pain in Belgium. To correct the possible overestimation due to the
self-report nature of the survey, cases of low back pain are defined as those individuals
reporting both the presence of low back pain and disability, as measured by the Global
Activity Limitation Indicator (GALI). This combination of indicators closely resembles the lay
descriptions of the health states, which combine the presence of low back pain with the
presence of, at least, problems in mobility.
7.3.3 Discussion
Given the potentially high burden of low back pain, further studies are needed to quantify the
validity (sensitivity/specificity) of the proposed approach for defining the prevalence of low
back pain.
The question on low back pain was introduced in the HIS2013. Therefore, limited information
is available on historical trends.
7.4 References
GBD 2017 Disease and Injury Incidence and Prevalence Collaborators. Global, regional, and national
incidence, prevalence, and years lived with disability for 354 diseases and injuries for 195
countries and territories, 1990-2017: a systematic analysis for the Global Burden of Disease
Study 2017. Lancet. 2018;392(10159):1789-1858.
Salomon JA, Haagsma JA, Davis A, de Noordhout CM, Polinder S, Havelaar AH, et al. Disability
weights for the Global Burden of Disease 2013 study. Lancet Glob Health 2015 Nov;3(11):e712-
e723.

90
8 NECK PAIN (NP)
8.1 Case definition
Neck pain (NP) is defined as neck pain (with or without pain referred into the upper limb(s))
that lasts for at least one day.
8.1.1 Corresponding disease classification codes
ICD-10 codes
M54.2 Cervicalgia
ICD-9 codes
723.1 Cervicalgia
ICPC-2 codes
L01 Neck symptom/complaint
L83 Neck syndrome
ATC codes
Not applicable: there are no drugs sufficiently specific for treatment of NP.
Nomenclature codes
Not applicable: there are no nomenclature codes sufficiently specific for NP.
8.2 Disease model
8.2.1 Health states
Figure 1. Neck pain disease model
Neck pain parent
Mild
DW=0.052
Moderate
DW=0.112
Severe
DW=0.226
Most severe
DW=0.300

91
8.2.2 Disability weights
Table 1. Disability weights (DW) by health state for neck pain according to the Global Burden of Disease study (Salomon et al., 2015)
Health state Lay description DW
Neck pain, mild This person has neck pain, and has difficulty turning the head and lifting things
0.052
Neck pain, moderate This person has constant neck pain, and has difficulty turning the head, holding arms up, and lifting things
0.112
Neck pain, severe This person has severe neck pain, and difficulty turning the head and lifting things. The person gets headaches and arm pain, sleeps poorly, and feels tired and worried
0.226
Neck pain, most severe This person has constant neck pain and arm pain, and difficulty turning the head, holding arms up, and lifting things. The person gets headaches, sleeps poorly, and feels tired and worried
0.300
8.2.3 Proportion of patients in the considered health states
Table 2. Proportion of patients in the different health states considered in the neck pain disease model, Belgium.
Health state Parent Proportion Source
Neck pain parent N/A 100% Per definition
Neck pain, mild Neck pain parent 0.67 GBD 2017 Disease and Injury Incidence and Prevalence Collaborators (2018)
Neck pain, moderate Neck pain parent 0.12 GBD 2017 Disease and Injury Incidence and Prevalence Collaborators (2018)
Neck pain, severe Neck pain parent 0.06 GBD 2017 Disease and Injury Incidence and Prevalence Collaborators (2018)
Neck pain, most severe
Neck pain parent 0.15 GBD 2017 Disease and Injury Incidence and Prevalence Collaborators (2018)
8.2.4 Discussion
Disability weights for the Belgian national burden of disease study are adapted from the
Global Burden of Disease study (4), as these provide an exhaustive set of internally
consistent disability weights.

92
The severity distribution in the GBD model is based exclusively on data from the USA,
raising questions on applicability for the Belgian context. The proportion of cases with low
back pain who report leg pain (by age) was derived using USA 2012 claims data. The
severity distributions were derived from an analysis of the Medical Expenditure Panel
Surveys (MEPS) in the USA (https://meps.ahrq.gov/mepsweb/). MEPS is an overlapping
continuous panel survey of the United States non-institutionalized population whose primary
purpose is to collect information on the use and cost of health care. Panels are two years
long and are conducted in five rounds, which are conducted every five to six months. Each
panel typically contains about 30,000 to 35,000 individual respondents. Respondents self-
administer the SF-12 twice per panel, at rounds 2 and 4, typically about a year apart. Only
adults 18 years and older completed the SF-12. MEPS also usually collects information on
diagnoses based on self-report of reasons for encounters with health services. In addition,
diagnoses are derived through additional questions on “problems that bother you” or
conditions that led to “disability days”, ie, days out of role due to illness. Professional coders
translate the verbatim text into three-digit ICD-9 codes. The main reason for LBP being
measured in MEPS relates to health care contact. For GBD 2017, data were used from
2000-2014.
Since the health states are not defined in terms of clinical grading scales, comparability with
available epidemiological and clinical evidence is hampered.
8.3 Prevalence
8.3.1 Data sources
Different data sources exist for NP, each with a specific case definition:
1. Hospital discharge data: patient with neck pain admitted to the hospital during the
reference year (before 2015: ICD-9 code; after 2015 ICD-10 code M54.2).
2. Health insurance data: not applicable; there are no (reimbursed) medications or health
care usages that would allow a sufficiently specific diagnosis of neck pain.
3. Health Interview Survey: number of respondents with positive answer to the question
“in the past 12 months, have you had a neck disorder or other chronic neck defect?”.
4. Sentinel GP network data (Intego): number of individuals with neck pain diagnosis
ever recorded by GP (ICPC-2 codes L01 and/or L83) who had a GP contact during the
reference year.
5. Sentinel GP network data (Sciensano): not applicable; neck pain has not been
registered by the Sciensano SGPs network.

93
Table 3. Potential sources and methods for the computation of low back pain prevalence in Belgium.
Source Strengths Weaknesses Evaluation
Hospital discharge data
Exhaustive information on all cases hospitalized for neck pain
Diagnoses by medical doctor
Official database, organized and managed by public health authorities
National database
No information on neck pain patients who were not admitted to hospital during the reference year; this is a substantial proportion of the neck pain patients
HDD is primarily used for administrative purposes, which could result in some problems when data have to be used for epidemiological purposes
Sensitivity: low
Specificity: high
Health insurance data (IMA/EPS)
N/A: there are no (reimbursed) medications or health care usages that would allow a sufficiently specific diagnosis of neck pain
Health Interview Survey
Based on information from a representative sample
Provides representative results at national and regional levels.
Self-reported information, which may induce an overestimation of NP prevalence; integration with information on disability or health-related quality of life may increase specificity
Not yearly available (+/- every 5 years)
Comparing estimates between subgroups of the sample might lack statistical precision
Sensitivity: high
Specificity: high
Sentinel GP network data (Intego)
Diagnosis by medical professional
Longitudinal approach
Will not capture patients that bypass the GP (ED, hospitalisation) unless the information is transmitted to the GP
Results are limited to Flanders
At the level of Flanders, the representativeness cannot be 100% guaranteed (the network only includes a sample of GPs using a specific software and interested in registration)
For the PP: not possible to identify the reason for
Sensitivity: low
Specificity: high

94
consultation, so might not be related to NP.
Sentinel GP network data (Sciensano)
Not applicable. Neck pain has not been registered by the Sciensano SGPs.
8.3.2 National best estimate
The Health Interview Survey appears to be the most complete source of information on the
prevalence of neck pain in Belgium. To correct the possible overestimation due to the self-
report nature of the survey, cases of neck pain are defined as those individuals reporting
both the presence of neck pain and disability, as measured by the Global Activity Limitation
Indicator (GALI). This combination of indicators closely resembles the lay descriptions of the
health states, which combine the presence of neck pain with the presence of, at least,
problems in mobility.
8.3.3 Discussion
Given the potentially high burden of neck pain, further studies are needed to quantify the
validity (sensitivity/specificity) of the proposed approach for defining the prevalence of neck
pain.
The question on neck pain was introduced in the HIS2013. Therefore, limited information is
available on historical trends.
8.4 References
GBD 2017 Disease and Injury Incidence and Prevalence Collaborators. Global, regional, and national
incidence, prevalence, and years lived with disability for 354 diseases and injuries for 195
countries and territories, 1990-2017: a systematic analysis for the Global Burden of Disease
Study 2017. Lancet. 2018;392(10159):1789-1858.
Salomon JA, Haagsma JA, Davis A, de Noordhout CM, Polinder S, Havelaar AH, et al. Disability
weights for the Global Burden of Disease 2013 study. Lancet Glob Health 2015 Nov;3(11):e712-
e723.