bell county - academy isd - 2011 texas school survey of drug and alcohol use
TRANSCRIPT

8/3/2019 BELL COUNTY - Academy ISD - 2011 Texas School Survey of Drug and Alcohol Use
http://slidepdf.com/reader/full/bell-county-academy-isd-2011-texas-school-survey-of-drug-and-alcohol-use 1/209
Texas School Survey
of Drug and Alcohol Use
2011
Academy ISD
Secondary Complete Report
• Introduction
• Secondary District Level Executive Summary with Graphics
• Secondary District Level Report
• Statewide Report with Comparative Tables

8/3/2019 BELL COUNTY - Academy ISD - 2011 Texas School Survey of Drug and Alcohol Use
http://slidepdf.com/reader/full/bell-county-academy-isd-2011-texas-school-survey-of-drug-and-alcohol-use 2/209
2011 Texas School Survey of Drug and Alcohol Use
Introduction
The Texas School Survey of Drug and Alcohol Use is sponsored by the Department of State Health
Services (DSHS) and implemented by the Public Policy Research Institute (PPRI) at Texas A&M
University. The Texas School Survey project is conducted in two parts. First, a statewide survey is
administered every two years in a sample of districts throughout the state. The statewide survey
helps inform policymakers about the extent and nature of the substance use problem in Texas
schools. It also gives districts conducting local surveys a standard of comparison for interpreting
their own drug and alcohol survey findings.
The second component of the Texas School Survey makes drug and alcohol surveys available for
administration in individual school districts. The Texas School Survey is offered annually to every
school district in the state. DSHS partially supports these district-level administrations by absorbingthe cost of instrument development, funding the preparation of an executive summary of the local
results, and providing state survey data as a basis for interpreting local findings. A local
administration of the Texas School Survey was conducted in your school district during the spring of
2011. Your local survey results are presented in this report. Findings from the statewide
assessment, which was conducted in the spring of 2010, are also presented in the report.
Organization of the Report
The report is divided into three major sections. Part I, District Results, contains a set of tables and
margins summarizing the secondary and (if applicable) elementary survey data for your district. Part
II, State Results, is bound as a companion volume. It will contain a complete set of tables andmargins presenting state results in a format similar to your local report. Part III, Executive
Summary, will contain a customized written synopsis of the local survey results and a complete set
of corresponding figures comparing those local results to the state survey data.
Prior to presenting the results, there are a number of important points that should be considered with
regard to the data cited in this report. These issues relate both to the 2010 statewide survey as well
as to the district-level data from this year. This section briefly presents some basic information
regarding the development of the report and the limitations of the data.
Background on Local Survey Administration
The Texas School Survey is offered for students in grades four through twelve. Two versions of the
survey instrument have been developed to accommodate both older and younger students. Districts
were asked to limit survey administration to one of a fixed set of grade combinations. Below are
brief descriptions of the elementary and secondary survey instruments and a review of acceptable
grade combinations.
8/3/2019 BELL COUNTY - Academy ISD - 2011 Texas School Survey of Drug and Alcohol Use
http://slidepdf.com/reader/full/bell-county-academy-isd-2011-texas-school-survey-of-drug-and-alcohol-use 3/209
2
The Texas School Survey Instrument
Two versions of the Texas School Survey are available. The first, a six-page questionnaire, is
designed for secondary students in grades seven through twelve. The secondary survey instrument
explores usage patterns of twelve drugs including tobacco and alcohol products, inhalants,
marijuana, powdered cocaine, crack, hallucinogens, uppers, downers, Rohypnol, steroids, ecstasy,
and heroin. Other questions pertain to behavioral and demographic correlates of substance use,problems associated with substance use, and sources of information about help for substance-related
problems.
The secondary survey instrument was revised as part of the 1998 assessment. This revision was
largely a rewording and/or a reformatting of the existing questions in such a manner as to not disrupt
local or statewide over-time analyses. There were, however, a number of additions that were made
as part of this overhaul: Rohypnol and heroin were added to the matrix of illicit substances students
were asked about; a new question was added dealing with parental attitudes toward cigarette; a new
question was added to ascertain the delivery-system methods most commonly used by those students
who smoke marijuana; and several brief questions were added to gauge the gambling habits of the
student population.
A streamlined, three-page instrument is available for students in grades four through six. The
questions in the elementary survey are similar to those found in the secondary version, but they have
been adapted to be more easily understood by younger respondents (i.e., the language has been
simplified wherever possible, students have been asked about fewer drug alternatives, and some
complex questions have been omitted).
Standard Grade Combinations
In order to make state and local comparisons of substance use across all grades, both the state and
local aggregate percentages must be based upon the same combinations of grades. Otherwise, stateand local data is comparable by individual grade, but overall scores can not be compared directly.
Because the 2010 state survey data was run in only a limited number of grade combinations, districts
were encouraged to administer their local surveys in the following grade groupings:
Elementary Secondary
4 through 6 7 through 12
4 through 5 9 through 12
8, 10, and 12
If your district did not survey one of the above grade combinations, be aware that you can only
compare your district results to the state data by individual grade. Where districts chose to do other
combinations of grades, no comparable overall percentages for the state data are available. This will
be an especially critical issue for small districts who only receive aggregate data.

8/3/2019 BELL COUNTY - Academy ISD - 2011 Texas School Survey of Drug and Alcohol Use
http://slidepdf.com/reader/full/bell-county-academy-isd-2011-texas-school-survey-of-drug-and-alcohol-use 4/209
3
Limitations of the Data
A number of subtle factors, such as sampling error and the limitations of self-reported data, can have
a major bearing on the meaning and/or conclusions of the data. In addition, an awareness of the
precise population to which findings can be generalized is also valuable because knowing who was
not included in the survey can be as important as knowing who was included. In the followingparagraphs, some of the most significant caveats relating to both the statewide and local findings are
discussed.
Survey Population
In generalizing the results of the state and local surveys, it should be remembered that the data were
collected in public schools. Neither private school students nor drop-outs were sampled though both
represent significant components of the youthful population of Texas. These limitations should be
kept in mind when considering the implications of the data. The findings do, however, represent
reasonable estimates of drug use among the public school population of Texas and offer a suitable
basis of comparison for public school districts.
Self-Reported Data
The drug and alcohol use data are entirely based on self-reported information. While a number of
studies have established the usefulness of self-reported information for estimating the incidence and
prevalence of drug use, the validity of these data ultimately depends on the truthfulness, recall, and
comprehension of respondents. This study is carefully designed to minimize the impact of these
potential sources of error. For example, students who report impossibly high levels of substance use
or use of non-existent drugs are eliminated from the analysis. Further, differences in recall or
comprehension are assumed to be constant across both the state and local survey samples. Any
reporting bias in the data should therefore be approximately equal in both assessments, andcomparisons between district and state data should be valid. Nonetheless, the limitations of self-
reported information should be considered when drawing conclusions about the data.
Sampling Error
The 2010 statewide survey data is based on a sample of Texas secondary and elementary students.
Because a sample rather than the entire population of students was surveyed, a certain amount of
error is introduced when generalizing findings from the sample to the population. To gauge the size
of this error, confidence intervals for all estimates are ascertained. In general, however, small
differences of a few percentage points are usually not statistically meaningful. Attention should be
focused on large differences of five percentage points or more.
8/3/2019 BELL COUNTY - Academy ISD - 2011 Texas School Survey of Drug and Alcohol Use
http://slidepdf.com/reader/full/bell-county-academy-isd-2011-texas-school-survey-of-drug-and-alcohol-use 5/209
4
Survey Protocols and Administration
Finally, the accuracy of the data is dependent upon whether school staff followed Texas School
Survey protocols for the sampling of students.
Analytic Guidelines
In processing the drug and alcohol survey data, there are a number of analytic issues that should be
addressed. These include questions such as how to identify students who are exaggerating their drug
or alcohol use, how best to calculate average substance use figures, how to handle surveys from
students in grades that are not technically being surveyed, and how to classify data for students who
fail to report their grade level. This section will review some rules established to deal with these
matters.
Handling of Exaggerators
As discussed above, the survey data presented herein is based entirely upon a respondent’sdescription of his or her own behavior. It is inevitable that some students will under- or over-report
their use of drugs or alcohol. To the extent possible, an attempt is made to identify and eliminate
data from those respondents. Two checks have been incorporated into the data analysis program to
identify exaggerators. First, data from students claiming to have used "Oxaril," a non-existent drug,
is considered suspect and dropped from the analyses. Second, students claiming impossibly high
levels of drug or alcohol use are also dropped from the analyses. Unbelievably high substance use
among secondary students is based on the following criteria: (1) students report in that they have
consumed two or more alcoholic beverages every day five or more times; (2) students report that
they have consumed three or more alcoholic beverages every day; or (3) students report that they
have used three or more illicit drugs (other than tobacco, alcohol, inhalants, marijuana, or steroids)
on a daily basis. Elementary students are considered exaggerators, and are excluded, if theyindicated that they have used five or more substances 11 or more times in either their lifetimes or
during the past school year.
Weighted Aggregate Data
In many districts, the percentage of all enrolled students that actually take the survey varies
substantially by grade. Though patterns are different for each district, typically a larger proportion
of younger students complete the survey compared to their older peers. If a simple average is taken
when calculating overall levels of use, older students may not be represented in proportion to their
numbers. Since these are the very students most likely to use drugs or alcohol, their under-
representation in the aggregate scores results in artificially lower overall levels of substance use.
To achieve more representative percentages when calculating overall or aggregate levels of
substance use, a "weighted average" procedure is used. Prior to calculating the averages, scores for

8/3/2019 BELL COUNTY - Academy ISD - 2011 Texas School Survey of Drug and Alcohol Use
http://slidepdf.com/reader/full/bell-county-academy-isd-2011-texas-school-survey-of-drug-and-alcohol-use 6/209
5
each grade surveyed are weighted by the total enrollment for that grade. By weighting averages by
actual enrollment, over- or under-sampling in aggregate scores is partially alleviated.
Surveys from "Out-of-Range" Grades
Occasionally, students from a grade that is not technically being surveyed are included in the districtsample. This is primarily a problem where the survey is administered in a non-contiguous grade
combination (e.g., 8, 10, and 12). In these instances, the final sample often contains a few students
who are in "out of range" grade levels. Generally, data for these students is not thrown out. Rather,
it is re-coded and included with the next contiguous grade level. A conservative approach is used
whereby younger students can be grouped with their older peers, but older students can not be re-
coded to a lower grade. This prevents artificially high levels of reported substance use in lower
grades.
There are two cases in which the "out-of-range" data is dropped from the analyses rather than being
re-coded: (1) if there is no contiguous higher grade with which to combine the data; and (2) if the
number of respondents in "out-of-range" students is greater than ten percent of the grade with whichthey are being grouped. This latter measure is designed to prevent a large number of "out of range"
grades from obscuring the true grade-level values.
Surveys in Which No Grade Level Was Reported
When students failed to report their grade level, it is not possible to determine unequivocally with
what grade these students' data should be analyzed. Where grade level is missing, students' data are
retained in the sample and an estimate of grade is made based on his or her age. Students that are at
age level for beginning a grade are included with that grade. If both grade and age are missing, the
data are dropped from the analyses.
Overview of the Data
The Texas School Survey findings for your school district are summarized in this section. Survey
findings are presented in three formats: figures, tables, and margins. Figures portray both state and
local survey results in a "side-by-side" format, allowing for direct comparisons to be made. There
are a total of six elementary and thirteen secondary figures, although not all of these can be produced
for every school district. All of the figures that can be generated for your district have been
produced.
Two sets of primary and/or secondary tables are available. The first set, the General Substance
Tables, are divided into five groupings---tobacco, alcohol, illicit drugs, inhalants, and miscellaneous.In each of these groupings are tables that illustrate general information about substance use patterns
in the district and include prevalence of use, frequency of use, and age of first use. In addition, these
tables highlight certain perceptions, attitudes and, behaviors from the data such as perceived

8/3/2019 BELL COUNTY - Academy ISD - 2011 Texas School Survey of Drug and Alcohol Use
http://slidepdf.com/reader/full/bell-county-academy-isd-2011-texas-school-survey-of-drug-and-alcohol-use 7/209
6
availability and peer use of various substances, parental attitudes, attending class or operating a
motor vehicle while under the influence of drugs or alcohol, and the use of intoxicants at parties.
The second set, Prevalence Tables, contains fourteen tables showing the percentage of students who
have used specific drugs or alcohol in the past month, past school year, and during their lifetimes.
All tables are available for each participating district. Tables showing the same data for the state are
provided in a companion volume. The only change to these tables made as part of the reformatting,and applicable only with regard to the secondary reports, was to the percentages listed under the
“School Year” heading. Previously, the percentages in this category excluded those found under the
“Past Month” heading. As reformatted, these “School Year” percentages include the “Past Month”
percentages as well.
Additional data are presented in the margins, which contain the raw percentages of students who
gave each response option for all questions. Keep in mind that if your district under-sampled a
particular grade(s), your overall percentages will represent "weighted averages." As a result, the raw
percentages presented in your margins may reflect weighted counts rather than actual raw counts.
Standards of Data Presentation
A wide variety of school districts took part in the Texas School Survey. In order to accommodate the
diversity of participants, guidelines for organizing and presenting the data were established. These
include standards for handling data from small and mid-sized districts and for determining which
tables and figures should be produced for each. These guidelines are reviewed below.
Data Aggregation
In some districts, too few students are surveyed to allow for reliable grade-level analyses to be
performed. Where this occurs, data from several grades are grouped together. Grade groupings are
established so as to (1) maximize the number of valid between-group comparisons possible and (2)protect students' confidentiality. One of three possible data presentation formats is selected for each
district, depending on the number of students per grade. In districts where the number of students
per grade varies widely, a format is selected based on the size of the majority of grades surveyed.
However, if one or more grades fall below a total of thirty students, the next lower level of
aggregation is automatically selected.
The guidelines used for data aggregation are as follows:
Secondary
Small: When there are fewer than thirty students per grade, a singlepercentage is shown representing all students.
Medium: When there are thirty to ninety students per grade, percentages are
aggregated into grade groupings (e.g., combining grades 7 and 8 and
grades 9 - 12).

8/3/2019 BELL COUNTY - Academy ISD - 2011 Texas School Survey of Drug and Alcohol Use
http://slidepdf.com/reader/full/bell-county-academy-isd-2011-texas-school-survey-of-drug-and-alcohol-use 8/209
7
Large: When there are more than ninety students per grade, separate
percentages are shown for each grade level surveyed.
Elementary
Small: When there are fewer than sixty students per grade, a single
percentage is shown for all students.
Large: When there are more than sixty students per grade, separate
percentages are shown for each grade level surveyed.
Availability of Graphics
According to the data aggregation rules outlined above, graphics illustrating data by grade can not be
produced for districts surveying fewer than thirty students per grade. As a consequence, figures that
show grade-level breakdowns are omitted from both the elementary and secondary versions of
reports for small districts. With these exceptions, all other figures and tables are produced for every
district regardless of size.
Conventions Used in Data Presentation
Throughout the report, a number of conventions were adopted to maintain consistency in reporting.
A common terminology is employed and a standard set of symbols is used in each table and figure.
These terms and symbols are described in the following paragraphs, beginning with a set of generaldefinitions and followed by a discussion of specific conventions used in tables and margins.
Definitions
There are several terms used throughout the report that, though seemingly straightforward, may have
some bearing on how the data is understood and interpreted. These definitions are outlined below.
Alcohol. When the category "Alcohol" appears in a figure or table, it represents the combined use of
beer, wine, wine coolers, and liquor. Each of these alcoholic substances may be referenced
individually, as well.
Cocaine or Crack. This reference is found only in the prevalence tables (Tables B1-B14). It refers
to students that report using either cocaine or crack, or both cocaine and crack. Since there is some
overlap between students who have used cocaine and those who have used crack, the percentages of
respondents in the "Cocaine or Crack" category should not be a simple sum of percentages in the
8/3/2019 BELL COUNTY - Academy ISD - 2011 Texas School Survey of Drug and Alcohol Use
http://slidepdf.com/reader/full/bell-county-academy-isd-2011-texas-school-survey-of-drug-and-alcohol-use 9/209
8
individual "Cocaine" and "Crack" categories. It should, however, be at least as great as the larger of
the two individual categories.
Illicit Drugs. These are defined as controlled substances and include marijuana, powdered cocaine,
crack, uppers, downers, Rohypnol, hallucinogens, ecstasy, and heroin.
Inhalants. The overall inhalant use percentages presented in the prevalence tables have beenadjusted to reflect reported use of both specific inhalants and inhalant use generally. Such
adjustments are necessary because some students respond in the positive to specific use (i.e., spray
paint, correction fluid, gasoline, freon, poppers, shoe shine, glue, paint thinner, other sprays, or other
inhalants) without responding in the positive to generic use (i.e., "How many times have you used
inhalants?"), while others respond in the positive to generic use but not to the use of specific
inhalants.
Marijuana Only. This reference is found only in the prevalence tables (Tables B1-B14). It refers to
students who report using marijuana but no other illicit substances. The reference to "Marijuana," in
contrast, includes all students using that substance regardless of whether they used other substances
or not.
Prevalence. The percentage of students who report having used a substance or substances.
Tobacco. The category "tobacco" includes the combined use of cigarettes and smokeless tobacco.
Conventional Symbols and Format
In addition to figures, there are two types of tables in which data may be presented. These include
general substance use tables (Tables T1-T7, A1-A15, D1-D17, I1-I9, X1-X5) and prevalence tables
(Tables B1-B14). Data is also available in its raw form in the margins. What follows are several
conventions of data presentation that apply chiefly to tables and margins.
The Meaning of an Asterisk (*) in Tables. When an asterisk appears in a table, not in the Executive
Summary (See Below), in place of a percentage, it typically means that fewer than ten students
responded to that item. Asterisks may also appear if data is not available for a district. This would
be the case, for instance, if a district does not survey all the grades in one of the standard acceptable
grade combinations (see "Standard Grade Combinations" in the previous section).
The Meaning of an Asterisk (*) in The Executive Summary (Part III). When an asterisk appears
alongside a percentage in the Executive Summary component of the report, it means that the data so
marked are estimated to be statistically significant at the .01 level from the comparable data for the
state as a whole. This means that in only one of a hundred samples would a difference this largehave occurred when there was no difference between the district and state data. Differences in very
small districts will seldom be statistically significant due to the small number of cases. Differences
that are not marked may be important, but should be treated with more caution than those that are so
marked.

8/3/2019 BELL COUNTY - Academy ISD - 2011 Texas School Survey of Drug and Alcohol Use
http://slidepdf.com/reader/full/bell-county-academy-isd-2011-texas-school-survey-of-drug-and-alcohol-use 10/209
9
Never Used/Ever Used Notations. In all prevalence tables, a standard approach is used for
presenting incidence and prevalence information. An "Ever Used" category shows the total
percentage of students who say they have used a substance at all, regardless of when or how many
times. A "Never Used" category shows the total percentage of students who have never used a
substance. The percentages shown in the "Ever Used" and "Never Used" categories always sum to
one hundred percent.
Additional columns then provide further information about those students who say they have "Ever
Used" the substance. This includes information such as when or how often use occurred. These
additional columns, when considered together, do not sum to the total percentage of students in the
"Ever Used" category in the secondary reports due to the inclusion of the “Past Month” percentage
within the “School Year” percentage (See Discussion Above).
Margins. The raw percentage of students who responded to each survey item as found in the tables
that comprise the final section of each report. Frequency and percent are shown for each individual
response option. The frequency shows the absolute number of students who gave the indicated
response. The percent is the frequency converted into a percentage of all students who answered thequestion. Again, bear in mind that if your district under-sampled a particular grade(s), your overall
percentages will represent "weighted averages." As a result, the raw percentages presented in your
margins may reflect weighted counts rather than actual raw counts.
Surveys excluded from analyses as exaggerators are not included in the margins.

8/3/2019 BELL COUNTY - Academy ISD - 2011 Texas School Survey of Drug and Alcohol Use
http://slidepdf.com/reader/full/bell-county-academy-isd-2011-texas-school-survey-of-drug-and-alcohol-use 11/209
Texas School Survey
of Drug and Alcohol Use
2011
Academy ISD
Part III: Executive Summary
Secondary
Executive SummaryGraphics

8/3/2019 BELL COUNTY - Academy ISD - 2011 Texas School Survey of Drug and Alcohol Use
http://slidepdf.com/reader/full/bell-county-academy-isd-2011-texas-school-survey-of-drug-and-alcohol-use 12/209

8/3/2019 BELL COUNTY - Academy ISD - 2011 Texas School Survey of Drug and Alcohol Use
http://slidepdf.com/reader/full/bell-county-academy-isd-2011-texas-school-survey-of-drug-and-alcohol-use 13/209
Texas School Survey
of Drug and Alcohol Use
2011
Part III: Executive Summary
Introduction 5-6
Demographic Overview 7-8
Tobacco Products 9-10
Environmental Factors
Prevalence
Alcohol 11-14
Environmental Factors
Prevalence
Behavioral Aspects
Licit and Illicit Substances 15-18
Environmental Factors
Prevalence
Behavioral Aspects
Inhalants 19-20
Environmental Factors
Prevalence
Substance Use Information/Assistance 21

8/3/2019 BELL COUNTY - Academy ISD - 2011 Texas School Survey of Drug and Alcohol Use
http://slidepdf.com/reader/full/bell-county-academy-isd-2011-texas-school-survey-of-drug-and-alcohol-use 14/209

8/3/2019 BELL COUNTY - Academy ISD - 2011 Texas School Survey of Drug and Alcohol Use
http://slidepdf.com/reader/full/bell-county-academy-isd-2011-texas-school-survey-of-drug-and-alcohol-use 15/209
Page 5 of 21
©Copyright 2011 Texas A&M University
All Rights Reserved
Texas School Survey of Drug and Alcohol Use
Academy ISD
Secondary Executive Summary
Introduction
The Texas School Survey is an annual collection of self-reported tobacco, alcohol, inhalant, and
substance use data from among elementary and/or secondary students in individual districts
throughout the state of Texas. The survey, conducted by the Public Policy Research Institute(PPRI) in conjunction with the Texas Department of State Health Services (DSHS), is also
administered every other year to a representative sample of Texas students in grades 4 through 6
and grades 7 through 12.
Data from the statewide sampling, administered in the spring of 2010, are incorporated into anover-time database maintained by DSHS to track trends in substance use so that policymakers at
the state level have up-to-date information upon which to base decisions and establish preventionstrategies. These data also serve as an overall standard of comparison for use by those at the
district level to interpret and act upon, local survey findings in a similar way.
The executive summary begins with a section containing a general demographic overview of
those who took the survey in the participating district, followed by sections dealing with the
various substances covered by the survey---tobacco, alcohol, inhalants, and illicit drugs. The nextsection explores selected characteristics associated with substance use in the district. The
summary concludes with a section on where students gain knowledge about drugs and alcohol
and to whom they might turn if they thought they were having a problem.
For a contextual viewpoint, each section dealing with substance use will begin with a brief
timeline of the statewide trends over the last decade and a half. The data are subsequently
analyzed using environmental and behavioral factors. Items that are generally recognized ascontributing to the environment in which substance use is most likely to occur include
availability, peer use and parental attitudes. Included in the behavioral category are activities
such as "binge drinking" (the consumption of five or more alcoholic beverages at one time),attending class drunk or stoned, use of alcohol or illicit drugs at parties, or operating a motor
vehicle while under the influence of alcohol or drugs.
As for the actual, self-reported use of each substance, it is important to note the frequency of such use. Is it experimental, a once-in-a-lifetime act or is it casual use, a once-in-a-while
behavior? Alternatively, is it regular use; a monthly, weekly, or---in the case of tobacco products
in particular---a daily habit? Further, data are used to differentiate between those who smokecigarettes from those who use a smokeless tobacco product, those who drink beer from those
who drink wine coolers, those who sniff correction fluid from those who sniff glue, and thosewho smoke marijuana from those who snort powdered cocaine.
8/3/2019 BELL COUNTY - Academy ISD - 2011 Texas School Survey of Drug and Alcohol Use
http://slidepdf.com/reader/full/bell-county-academy-isd-2011-texas-school-survey-of-drug-and-alcohol-use 16/209
Secondary Executive Summary
Page 6 of 21
©Copyright 2011 Texas A&M University
All Rights Reserved
Three final points should be noted about the data. First, due to the differences in roundingprocedures, there may be slight discrepancies between the percentages referred to in the tables
and those reflected in the executive summary and in the corresponding figures. Second, due to
the small number of students surveyed in this district, no between-grade comparisons can bemade---although comparisons between grade groupings (7 and 8; 9 through 12) can be made.
Finally, some data in this report are marked with an asterisk. Data so marked are
estimated to be statistically significant at the .01 level from the comparable data for the
state as a whole. This means that in only one of a hundred samples would a difference this
large have occurred when there was no difference between the district and state data.
Differences in very small districts will seldom be statistically significant due to the small
number of cases. Differences that are not marked may be important, but should be treated
with more caution than those that are statistically significant.
The percentages referred to in the executive summary that follows were taken from the tables
found in "Part I: District Survey Results." Figures referenced throughout this report are included
in "Part III: Executive Summary."
8/3/2019 BELL COUNTY - Academy ISD - 2011 Texas School Survey of Drug and Alcohol Use
http://slidepdf.com/reader/full/bell-county-academy-isd-2011-texas-school-survey-of-drug-and-alcohol-use 17/209
Secondary Executive Summary
Page 7 of 21
©Copyright 2011 Texas A&M University
All Rights Reserved
Demographic Overview
In the spring of 2011, the Texas School Survey was administered to students in grades 7 through12 in the Academy Independent School District. Texas School Survey protocols, formulated to
ensure that the data used in this analysis has an acceptable probability of error, called for the district
to administer the survey to a predetermined, class-specific sampling of secondary students. Inaddition, data accuracy is dependent on the school staff administering the survey using
established protocols.
A total of 402 students completed the questionnaire. Of that number, 28 surveys were excluded
from analysis because students did not indicate their grade or age, or because they were
identified as exaggerators (i.e., claimed to have used a non-existent drug or reported overlyexcessive drug use). The final number of surveys included in the overall district analysis was
374, consisting of:
• 17 percent are 7th graders, 20 percent are 8th graders, 18 percent are 9th graders, 16 percent
are 10th graders, 15 percent are 11th graders, and 14 percent are 12th graders;
• A total of (53 percent) male and (47 percent) female students;
• An ethnic breakdown that is 76 percent White, 2 percent African-American, 16 percentMexican-American, 1 percent Asian-American, 1 percent Native American, and 4 percentother;
• 63 percent say they live in a two-parent home, and 71 percent report they have lived in the
district for three or more years;
• 60 percent say their parent(s) are college graduates, and 23 percent indicate they qualify forfree/reduced lunches at school.

8/3/2019 BELL COUNTY - Academy ISD - 2011 Texas School Survey of Drug and Alcohol Use
http://slidepdf.com/reader/full/bell-county-academy-isd-2011-texas-school-survey-of-drug-and-alcohol-use 18/209
Secondary Executive Summary
Page 8 of 21
©Copyright 2011 Texas A&M University
All Rights Reserved

8/3/2019 BELL COUNTY - Academy ISD - 2011 Texas School Survey of Drug and Alcohol Use
http://slidepdf.com/reader/full/bell-county-academy-isd-2011-texas-school-survey-of-drug-and-alcohol-use 19/209
Secondary Executive Summary
Page 9 of 21
©Copyright 2011 Texas A&M University
All Rights Reserved
Tobacco
General tobacco use includes both cigarettes and smokeless tobacco products.
Statewide Overview
Well over half of secondary students statewide reported experimental use of tobacco productsthroughout the 1990’s. In 2000, however, the number of these students who reported such usedeclined slightly (51 percent). This downward trend continued through the 2002 (45 percent),
2004 (39 percent), 2006 (35 percent), and 2008 (32 percent) statewide assessments. The
prevalence of those secondary students reporting past-month general tobacco use, which hadbeen increasing through 1996, leveled off in 1998, and began a steady, incremental decline in the
2000 (22 percent), 2002 (18 percent), 2004 (17 percent), 2006 (15 percent), and 2008 (13
percent) statewide surveys. In the most recent statewide assessment in 2010, the prevalence of secondary students reporting lifetime tobacco use fell to 30 percent, while past-month use stayed
continuous at 12 percent.
Environment
A total of 38* percent of Academy ISD students reported that cigarettes are somewhat or very
easy to get (50 percent statewide), while 4* percent said most or all of their close friends smokecigarettes (9 percent statewide). A total of 32 percent of district students indicated that smokeless
tobacco products are somewhat or very easy to get (33 percent statewide), and 7 percent said
most or all of their close friends use smokeless tobacco (4 percent statewide).
Students were asked about parental attitudes toward the use of cigarettes by “kids your age.” 81
percent of Academy ISD students said their parents strongly or mildly disapprove of kids
smoking (85 percent statewide), while 13* percent said their parents neither approve nordisapprove (6 percent statewide), and 3 percent of district students said they "don't know" how
their parents feel about kids their age smoking cigarettes (7 percent statewide).
A total of 58 percent of Academy ISD students believe that tobacco use is "very dangerous" (53
percent statewide) (Fig. 11).
Use
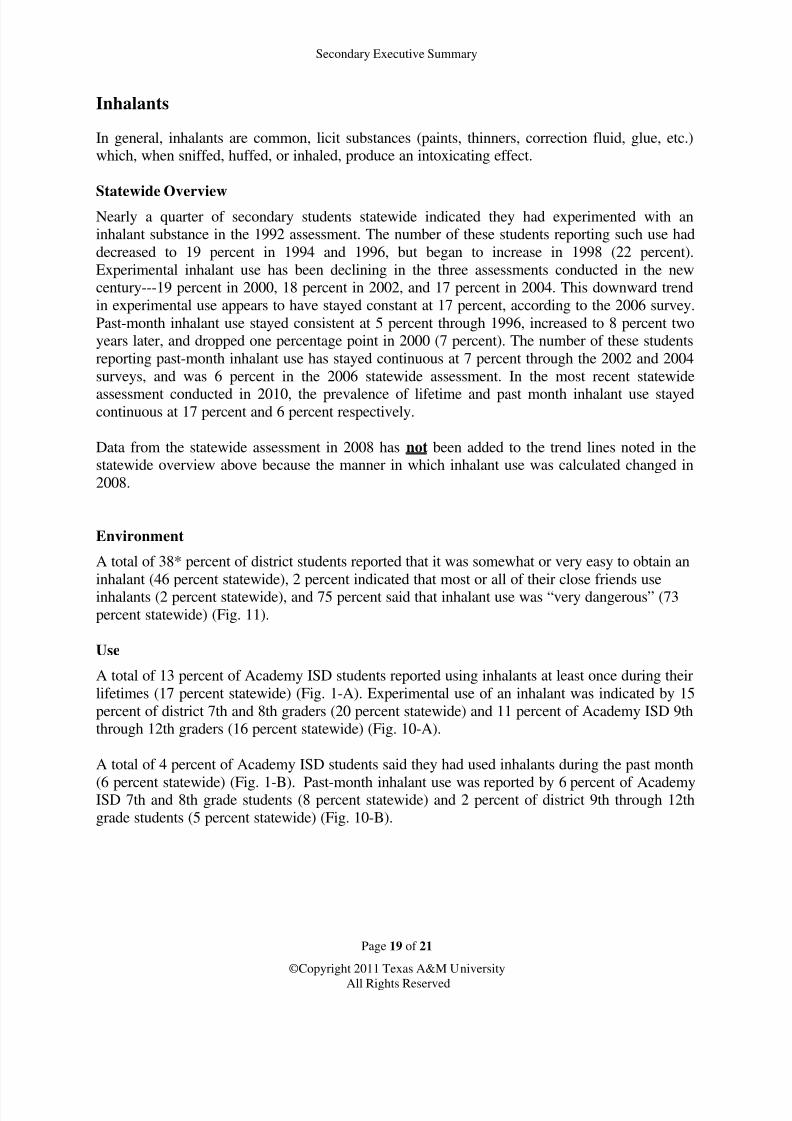
A total of 23* percent of Academy ISD students reported general tobacco use at least once
during their lifetimes (30 percent statewide) (Fig. 1-A). Experimental use of a tobacco product
was reported by 11 percent of district 7th and 8th graders (19 percent statewide) and 32 percent
of Academy ISD 9th through 12th graders (36 percent statewide) (Fig. 2-A).
A total of 13 percent of Academy ISD students said they had used a tobacco product during the
past month (12 percent statewide) (Fig. 1-B). Past-month general tobacco use was reported by 5percent of Academy ISD 7th and 8th grade students (6 percent statewide) and 19 percent of
district 9th through 12th grade students (16 percent statewide) (Fig. 2-B).
8/3/2019 BELL COUNTY - Academy ISD - 2011 Texas School Survey of Drug and Alcohol Use
http://slidepdf.com/reader/full/bell-county-academy-isd-2011-texas-school-survey-of-drug-and-alcohol-use 20/209
Secondary Executive Summary
Page 10 of 21
©Copyright 2011 Texas A&M University
All Rights Reserved
A total of 22* percent of Academy ISD students reported smoking cigarettes at least once duringtheir lifetimes (29 percent statewide), while 10 percent said they had smoked cigarettes during
the past month (11 percent statewide), and 2 percent reported smoking cigarettes on a daily basis
(2 percent statewide). Daily cigarette use was indicated by 2 percent of district 7th and 8thgraders (1 percent statewide) and 2 percent of Academy ISD 9th through 12th graders (3 percent
statewide).
Experimental use of smokeless tobacco products was reported by 12 percent of Academy ISD
students (9 percent statewide), 8* percent said they had used a smokeless tobacco product during
the past month (4 percent statewide), and 3* percent reported using a smokeless tobacco product
on a daily basis (1 percent statewide).

8/3/2019 BELL COUNTY - Academy ISD - 2011 Texas School Survey of Drug and Alcohol Use
http://slidepdf.com/reader/full/bell-county-academy-isd-2011-texas-school-survey-of-drug-and-alcohol-use 21/209
Secondary Executive Summary
Page 11 of 21
©Copyright 2011 Texas A&M University
All Rights Reserved
Alcohol
Alcohol is the most widely used substance among students statewide and in the Academy ISD.
Statewide Overview
As the 1990’s began, 81 percent of secondary students statewide reported experimental alcoholuse and over the decade that followed, the number of these students reporting such use decreasedin each successive statewide assessment. This downward trend in lifetime alcohol use leveled off
at 71 percent in the 2000 and 2002 statewide assessments, but picked up again in the 2004 (68
percent), 2006 (66 percent), and 2008 (63 percent) statewide data. On the other hand, past-monthalcohol use among secondary students statewide has been more varied throughout the same
period, beginning with 43 percent of these students in 1990, dropping to 37 percent in 1992,
increasing to 39 percent in 1994, staying constant in 1996 and 1998 at 38 percent, and decreasingto 36 percent in 2000, 35 percent in 2002, 33 percent in 2004, 32 percent in 2006, and 30 percent
in 2008. In the most recent statewide assessment in 2010, the downward trend continued with
lifetime alcohol use decreasing to 62 percent and past month alcohol use falling to 29 percent.
Environment
A total of 16* percent of district students reported most or all of their close friends drink alcohol(29 percent statewide), and 51* percent said alcohol (beer, wine coolers, wine, and liquor) was
somewhat easy or very easy to obtain (62 percent statewide).
Students who said they consume alcohol were asked where they obtained such a beverage all ormost of the time. A total of 16* percent of district students said they obtain alcohol "at parties"
(29 percent statewide), while 15* percent responded that they get it "from friends" (22 percent
statewide); and 3* percent reported they get alcohol "from the store" (6 percent statewide).
Parental attitudes can be a major factor in whether or not a student uses alcohol. When asked
how their parents feel about kids their age drinking beer, 76 percent of Academy ISD studentssaid their parents strongly or mildly disapprove (79 percent statewide), while 12 percent said
their parents neither approve nor disapprove of such behavior (10 percent statewide), and 5
percent said they "don't know" how their parents feel about kids their age drinking beer (6
percent statewide) (Fig. 13-A).
A total of 51 percent of Academy ISD students feel that it is "very dangerous" to use alcohol (48
percent statewide) (Fig. 11).

8/3/2019 BELL COUNTY - Academy ISD - 2011 Texas School Survey of Drug and Alcohol Use
http://slidepdf.com/reader/full/bell-county-academy-isd-2011-texas-school-survey-of-drug-and-alcohol-use 22/209
Secondary Executive Summary
Page 12 of 21
©Copyright 2011 Texas A&M University
All Rights Reserved
Use
A total of 54* percent of Academy ISD students reported consuming alcohol at least once duringtheir lifetimes (62 percent statewide) (Fig. 1-A). Experimental use of alcohol was reported by 43
percent of district 7th and 8th grade students (49 percent statewide) and 62 percent of Academy
ISD 9th through 12th grade students (69 percent statewide) (Fig. 3-A).
A total of 24 percent of Academy ISD students said they had consumed alcohol during the past
month (29 percent statewide) (Fig. 1-B). Past-month alcohol use was reported by 13 percent of Academy ISD 7th and 8th graders (18 percent statewide) and 31 percent of district 9th through
12th graders (35 percent statewide) (Fig. 3-B).
The alcoholic beverages most often consumed by Academy ISD students are beer (41 percent/46
percent statewide) and wine coolers (34 percent/40 percent statewide). 18 percent of Academy
ISD students said they drink beer on a weekly or monthly basis (25 percent statewide), and 14*
percent said they drink wine coolers weekly or monthly (21 percent statewide).
Behavior Associated With Use
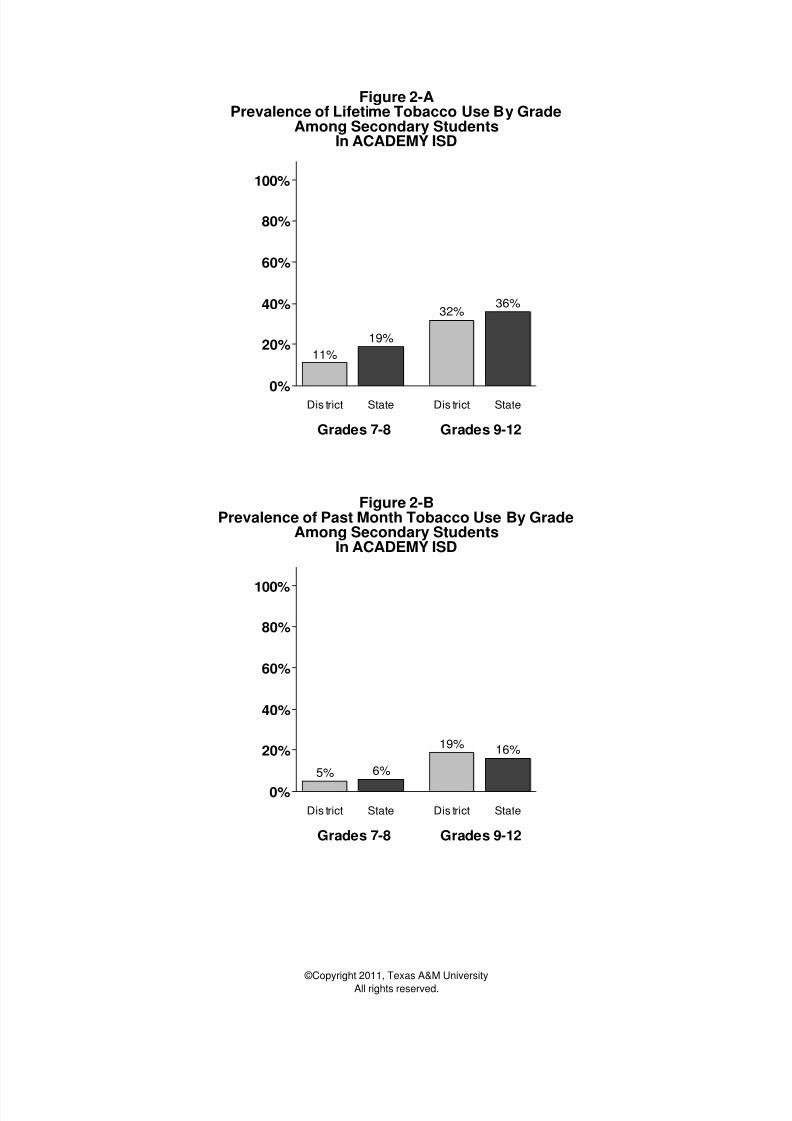
"Binge drinking" is the consumption of five or more beers, wine coolers, servings of wine, or
drinks with liquor at one time. A total of 11 percent said they usually drink five or more beers ata time on average when they drink (12 percent statewide). A total of 8 percent said they usually
drink five or more wine coolers at a time on average when they drink (9 percent statewide) (Fig.
4).
A total of 7 percent of Academy ISD students reported attending at least one class during the
past school year while "drunk" (7 percent statewide). Attending class intoxicated was indicatedby 5 percent of Academy ISD 7th and 8th graders (6 percent statewide) and 8 percent of district
9th through 12th graders (8 percent statewide) (Fig. 5).
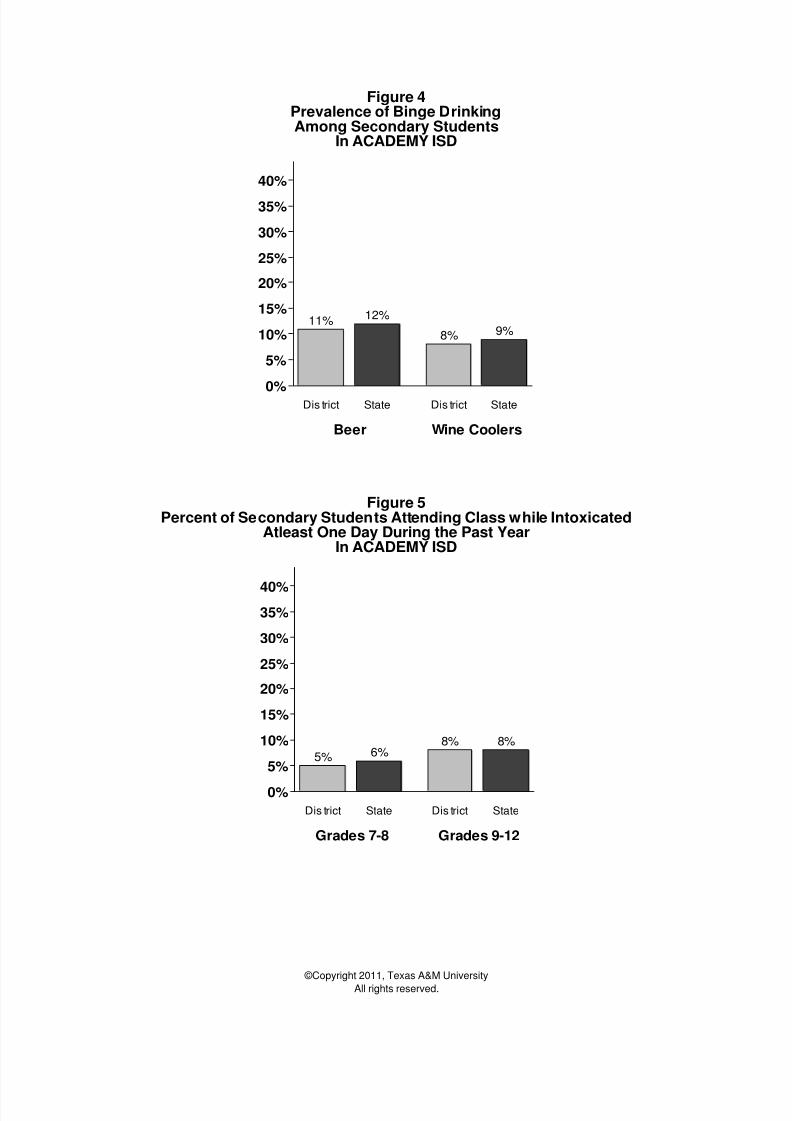
A total of 9 percent of Academy ISD 9th through 12th grade students said that they had driven a
car after having "a good bit to drink" at least once during the past year (9 percent statewide) (Fig.6). Driving while intoxicated four or more times during the past year was reported by 1 percent
of district 9th through 12th graders (2 percent statewide).
A total of 17* percent of Academy ISD students said alcohol was used at most or all of theparties they attended in the past school year (27 percent statewide). Alcohol use at most or all
parties was reported by 7 percent of Academy ISD 7th and 8th grade students (11 percent
statewide) and 24* percent of district 9th through 12th grade students (36 percent statewide)(Fig. 7).
8/3/2019 BELL COUNTY - Academy ISD - 2011 Texas School Survey of Drug and Alcohol Use
http://slidepdf.com/reader/full/bell-county-academy-isd-2011-texas-school-survey-of-drug-and-alcohol-use 23/209
Secondary Executive Summary
Page 13 of 21
©Copyright 2011 Texas A&M University
All Rights Reserved
A total of 1 percent of Academy ISD students said they had gotten into trouble with their teacherbecause of alcohol use at least once during the past school year (1 percent statewide), while 1
percent reported they had gotten in trouble with the police because of their alcohol use during the
past year (3 percent statewide), and 3* percent said they had "difficulties of any kind" withfriends because of one's own drinking (6 percent statewide).

8/3/2019 BELL COUNTY - Academy ISD - 2011 Texas School Survey of Drug and Alcohol Use
http://slidepdf.com/reader/full/bell-county-academy-isd-2011-texas-school-survey-of-drug-and-alcohol-use 24/209
Secondary Executive Summary
Page 14 of 21
©Copyright 2011 Texas A&M University
All Rights Reserved

8/3/2019 BELL COUNTY - Academy ISD - 2011 Texas School Survey of Drug and Alcohol Use
http://slidepdf.com/reader/full/bell-county-academy-isd-2011-texas-school-survey-of-drug-and-alcohol-use 25/209

8/3/2019 BELL COUNTY - Academy ISD - 2011 Texas School Survey of Drug and Alcohol Use
http://slidepdf.com/reader/full/bell-county-academy-isd-2011-texas-school-survey-of-drug-and-alcohol-use 26/209
Secondary Executive Summary
Page 16 of 21
©Copyright 2011 Texas A&M University
All Rights Reserved
statewide). When asked about parental attitudes toward marijuana use, Academy ISD studentsreported a disapproval rate of 90 percent (87 percent statewide). A total of 3* percent of district
students said they "don't know" how their parents feel about kids their age using marijuana (6
percent statewide), while 5 percent said their parents neither approve nor disapprove (5 percentstatewide) (Fig. 13-B).
A total of 69* percent of Academy ISD students believe that marijuana use is "very dangerous"(59 percent statewide) (Fig. 11). As for how Academy ISD students viewed the risks associated
with the use of certain other illicit substances, 82 percent feel that use of ecstasy is "very
dangerous" (77 percent statewide), 86 percent believe that powdered cocaine use is "very
dangerous" (84 percent statewide), 88 percent feel that the use of crack is "very dangerous" (85percent statewide), and 88 percent believe that heroin is “very dangerous” (86 percent statewide).
Use
The following paragraph details percentages of individuals that reported using only marijuanaand no other illicit substances.
In the Academy ISD, 14* percent of students had reported experimental use of an illicit drug (28
percent statewide), and 8* percent of Academy ISD students reported smoking marijuana at leastonce in their lifetimes (14 percent statewide) (Fig. 1-A). Experimental use of marijuana was
reported by 2 percent of district 7th and 8th grade students (7 percent statewide) and 11* percent
of Academy ISD 9th through 12th grade students (18 percent statewide) (Fig. 8-A).
Past-month marijuana use was reported by 3 percent of Academy ISD students (5 percent
statewide) (Fig. 1-B). Smoking marijuana during the past month was indicated by 2 percent of Academy ISD 7th and 8th graders (2 percent statewide) and 4 percent of district 9th through 12th
graders (6 percent statewide) (Fig. 8-B).
A total of 2* percent of district students said they had used downers (6 percent statewide), 1
percent indicated they had used Rohypnol (3 percent statewide), 1 percent indicated they hadused crack (2 percent statewide), and 1 percent reported using heroin (1 percent statewide), and
at least once during their lifetimes.
A total of 1* percent of Academy ISD students said they had used powdered cocaine (5 percentstatewide), 3 percent reported using uppers (5 percent statewide), 3 percent said they had used
hallucinogens (5 percent statewide), 3* percent reported using ecstasy (7 percent statewide), and
4* percent said they had used steroids (1 percent statewide) at least one during their lives.
A total of 2 percent of Academy ISD students reported they had used methamphetamine at leastone time during their lives (3 percent statewide), 1 percent said they had done so during theprevious month (1 percent statewide).
Illicit use of licit substances
Students were asked whether they had used an otherwise legal product (i.e., prescription or over-the-counter drugs) for recreational purposes. A total of 9 percent of district students reported
8/3/2019 BELL COUNTY - Academy ISD - 2011 Texas School Survey of Drug and Alcohol Use
http://slidepdf.com/reader/full/bell-county-academy-isd-2011-texas-school-survey-of-drug-and-alcohol-use 27/209
Secondary Executive Summary
Page 17 of 21
©Copyright 2011 Texas A&M University
All Rights Reserved
using a prescription cough syrup containing Codeine (Lean, Nods, AC/DC) at least once in theirlives to get high (12 percent statewide), 3 percent said they had done so with Oxycontin,
Percodan or Percocet (3 percent statewide), 6 percent indicated they had used Vicodin or
Diazepam (5 percent statewide), 4 percent reported using Valium Diazepam (2 percentstatewide) and 3 percent said they had used Xanax or Alprazolam (5 percent statewide) at least
once for recreational purposes.
A total of 3 percent of district students indicated that they had used the over-the-counter products
DXM or Coricidin (“Triple C’s”, “Skittles”) at least one time to get high (5 percent statewide).
Behavior Associated with Use
A total of 7 percent of Academy ISD students reported attending at least one class in the past
year while "stoned" on marijuana (11 percent statewide). Attending class while stoned was
reported by 4 percent of Academy ISD 7th and 8th graders (6 percent statewide) and 9 percent of
district 9th through 12th graders (13 percent statewide) (Fig. 9).
Driving under the influence of drugs at least once during the past year was reported by 5 percentof Academy ISD 9th through 12th grade students (10 percent statewide). Driving under theinfluence of drugs ten or more times during the past year was reported by 2 percent of district 9th
through 12th graders (2 percent statewide).
A total of 6* percent of the Academy ISD students said that marijuana and/or other drugs were
used at most or all of the parties they attended during the school year (16 percent statewide).
Marijuana and/or other drug use at most or all parties was indicated by 3 percent of Academy
ISD 7th and 8th grade students (6 percent statewide) and 8* percent of district 9th through 12thgrade students (22 percent statewide).
A total of 1 percent of Academy ISD students said they had gotten into trouble with their teacherbecause of illicit drug use at least once during the past school year (2 percent statewide), while 2
percent reported they had gotten in trouble with the police because of their use of illegal drugsduring the past year (2 percent statewide), and 2* percent of district students said they had gotten
into "difficulties of any kind" with their friends during the past year because of their own drug
use (6 percent statewide).

8/3/2019 BELL COUNTY - Academy ISD - 2011 Texas School Survey of Drug and Alcohol Use
http://slidepdf.com/reader/full/bell-county-academy-isd-2011-texas-school-survey-of-drug-and-alcohol-use 28/209
Secondary Executive Summary
Page 18 of 21
©Copyright 2011 Texas A&M University
All Rights Reserved
8/3/2019 BELL COUNTY - Academy ISD - 2011 Texas School Survey of Drug and Alcohol Use
http://slidepdf.com/reader/full/bell-county-academy-isd-2011-texas-school-survey-of-drug-and-alcohol-use 29/209
Secondary Executive Summary
Page 19 of 21
©Copyright 2011 Texas A&M University
All Rights Reserved
Inhalants
In general, inhalants are common, licit substances (paints, thinners, correction fluid, glue, etc.)which, when sniffed, huffed, or inhaled, produce an intoxicating effect.
Statewide OverviewNearly a quarter of secondary students statewide indicated they had experimented with aninhalant substance in the 1992 assessment. The number of these students reporting such use had
decreased to 19 percent in 1994 and 1996, but began to increase in 1998 (22 percent).
Experimental inhalant use has been declining in the three assessments conducted in the newcentury---19 percent in 2000, 18 percent in 2002, and 17 percent in 2004. This downward trend
in experimental use appears to have stayed constant at 17 percent, according to the 2006 survey.
Past-month inhalant use stayed consistent at 5 percent through 1996, increased to 8 percent twoyears later, and dropped one percentage point in 2000 (7 percent). The number of these students
reporting past-month inhalant use has stayed continuous at 7 percent through the 2002 and 2004
surveys, and was 6 percent in the 2006 statewide assessment. In the most recent statewide
assessment conducted in 2010, the prevalence of lifetime and past month inhalant use stayedcontinuous at 17 percent and 6 percent respectively.
Data from the statewide assessment in 2008 has not been added to the trend lines noted in thestatewide overview above because the manner in which inhalant use was calculated changed in
2008.
Environment
A total of 38* percent of district students reported that it was somewhat or very easy to obtain an
inhalant (46 percent statewide), 2 percent indicated that most or all of their close friends useinhalants (2 percent statewide), and 75 percent said that inhalant use was “very dangerous” (73
percent statewide) (Fig. 11).
Use
A total of 13 percent of Academy ISD students reported using inhalants at least once during their
lifetimes (17 percent statewide) (Fig. 1-A). Experimental use of an inhalant was indicated by 15
percent of district 7th and 8th graders (20 percent statewide) and 11 percent of Academy ISD 9ththrough 12th graders (16 percent statewide) (Fig. 10-A).
A total of 4 percent of Academy ISD students said they had used inhalants during the past month
(6 percent statewide) (Fig. 1-B). Past-month inhalant use was reported by 6 percent of AcademyISD 7th and 8th grade students (8 percent statewide) and 2 percent of district 9th through 12th
grade students (5 percent statewide) (Fig. 10-B).

8/3/2019 BELL COUNTY - Academy ISD - 2011 Texas School Survey of Drug and Alcohol Use
http://slidepdf.com/reader/full/bell-county-academy-isd-2011-texas-school-survey-of-drug-and-alcohol-use 30/209
Secondary Executive Summary
Page 20 of 21
©Copyright 2011 Texas A&M University
All Rights Reserved

8/3/2019 BELL COUNTY - Academy ISD - 2011 Texas School Survey of Drug and Alcohol Use
http://slidepdf.com/reader/full/bell-county-academy-isd-2011-texas-school-survey-of-drug-and-alcohol-use 31/209
Secondary Executive Summary
Page 21 of 21
©Copyright 2011 Texas A&M University
All Rights Reserved
Drug and Alcohol Information
The influence of substance use education programs may be reflected in students' attitudes towardthe use of specific substances reported above. To whom a student may feel most comfortable
turning to for assistance with a substance use problem or issue may help gauge the effect these
various messengers are having on those attitudes.
A total of 42* percent of Academy ISD students said they had received information about drugs
and alcohol from any school source since classes began in the fall (61 percent statewide). Of theeight available responses as to the source of such information, two stand out from the pack. A
“health class” was reported by 30* percent of district students as a source for information about
drugs and alcohol (48 percent statewide), while 38* percent said the source for this informationwas “an assembly program” (49 percent statewide).
When asked where they would go for help with a drug or alcohol problem, Academy ISD
students said they would seek help from their friends (67 percent/69 percent statewide), from an
adult friend or relative (68 percent/62 percent statewide), or their parents (76* percent/61 percentstatewide). Academy ISD students would also seek help for a drug or alcohol problem from a
counselor or program in school (43* percent/35 percent statewide), or another adult in school,such as a teacher or nurse (44* percent/35 percent statewide) (Fig. 12).
Since school began in the fall, 4 percent of Academy ISD students reported seeking help for anyproblems connected with alcohol or drug use from someone other than family or friends (8
percent statewide).

8/3/2019 BELL COUNTY - Academy ISD - 2011 Texas School Survey of Drug and Alcohol Use
http://slidepdf.com/reader/full/bell-county-academy-isd-2011-texas-school-survey-of-drug-and-alcohol-use 32/209
Texas School Survey
of Drug and Alcohol Use
2011
Part III: Executive Summary
Secondary Graphics
Figure 1-A Prevalence of Lifetime Substance Use
Figure 1-B Prevalence of Past 30-Day Substance Use
Figure 2-A Prevalence of Lifetime Tobacco Use by Grade
Figure 2-B Prevalence of Past 30-Day Tobacco Use by Grade
Figure 3-A Prevalence of Lifetime Alcohol Use by Grade
Figure 3-B Prevalence of Past 30-Day Alcohol Use by Grade
Figure 4 Prevalence of Binge Drinking
Figure 5 Attending Class While Intoxicated
Figure 6 Driving While Intoxicated (Grades 9-12)
Figure 7 Use of Alcohol at Parties
Figure 8-A Prevalence of Lifetime Marijuana Use by Grade
Figure 8-B Prevalence of Past 30-Day Marijuana Use by Grade
Figure 9 Attending Class While “High”
Figure 10-A Prevalence of Lifetime Inhalant Use by Grade
Figure 10-B Prevalence of Past 30-Day Inhalant Use by Grade
Figure 11 Students Who Think Substances are Very Dangerous
Figure 12 Where Students Would Go for Help
Figure 13-A Parental Attitudes toward Beer
Figure 13-B Parental Attitudes toward Marijuana

8/3/2019 BELL COUNTY - Academy ISD - 2011 Texas School Survey of Drug and Alcohol Use
http://slidepdf.com/reader/full/bell-county-academy-isd-2011-texas-school-survey-of-drug-and-alcohol-use 33/209
©Copyright 2011, Texas A&M University
All rights reserved.
Figure 1-APrevalence of Lifetime Substance Use
Among Secondary StudentsIn ACADEMY ISD
54%
62%
14%
28%
13%17%
8%14%
23%
30%
0%
20%
40%
60%
80%
100%
Alcohol Any Illicit Drug Inhalants Marijuana Only TobaccoDis trict State Dis trict State Dis trict State Dis trict State Dis trict State
Figure 1-BPrevalence of Past Month Substance Use
Among Secondary StudentsIn ACADEMY ISD
24%29%
8%13%
4% 6% 3% 5%
13% 12%
0%
20%
40%
60%
80%
100%
Alcohol Any Illicit Drug Inhalants Marijuana Only Tobacco
Dis trict State Dis trict State Dis trict State Dis trict State Dis trict State
8/3/2019 BELL COUNTY - Academy ISD - 2011 Texas School Survey of Drug and Alcohol Use
http://slidepdf.com/reader/full/bell-county-academy-isd-2011-texas-school-survey-of-drug-and-alcohol-use 34/209
©Copyright 2011, Texas A&M University
All rights reserved.
Figure 2-APrevalence of Lifetime Tobacco Use By Grade
Among Secondary StudentsIn ACADEMY ISD
11%
19%
32%36%
0%
20%
40%
60%
80%
100%
Grades 7-8 Grades 9-12
Dis trict State Dis trict State
Figure 2-BPrevalence of Past Month Tobacco Use By Grade
Among Secondary StudentsIn ACADEMY ISD
5% 6%
19% 16%
0%
20%
40%
60%
80%
100%
Grades 7-8 Grades 9-12
Dis trict State Dis trict State

8/3/2019 BELL COUNTY - Academy ISD - 2011 Texas School Survey of Drug and Alcohol Use
http://slidepdf.com/reader/full/bell-county-academy-isd-2011-texas-school-survey-of-drug-and-alcohol-use 35/209
©Copyright 2011, Texas A&M University
All rights reserved.
Figure 3-APrevalence of Lifetime Alcohol Use By Grade
Among Secondary StudentsIn ACADEMY ISD
43%49%
62%
69%
0%
20%
40%
60%
80%
100%
Grades 7-8 Grades 9-12
Dis trict State Dis trict State
Figure 3-BPrevalence of Past Month Alcohol Use By Grade
Among Secondary StudentsIn ACADEMY ISD
13%18%
31%35%
0%
20%
40%
60%
80%
100%
Grades 7-8 Grades 9-12
Dis trict State Dis trict State
8/3/2019 BELL COUNTY - Academy ISD - 2011 Texas School Survey of Drug and Alcohol Use
http://slidepdf.com/reader/full/bell-county-academy-isd-2011-texas-school-survey-of-drug-and-alcohol-use 36/209
©Copyright 2011, Texas A&M University
All rights reserved.
Figure 4Prevalence of Binge DrinkingAmong Secondary Students
In ACADEMY ISD
11% 12%
8% 9%
0%
5%
10%
15%
20%
25%
30%
35%
40%
Beer Wine Coolers
Dis trict State Dis trict State
Figure 5Percent of Secondary Students Attending Class while Intoxicated
Atleast One Day During the Past YearIn ACADEMY ISD
5% 6%8% 8%
0%
5%
10%
15%
20%
25%
30%
35%
40%
Grades 7-8 Grades 9-12
Dis trict State Dis trict State
8/3/2019 BELL COUNTY - Academy ISD - 2011 Texas School Survey of Drug and Alcohol Use
http://slidepdf.com/reader/full/bell-county-academy-isd-2011-texas-school-survey-of-drug-and-alcohol-use 37/209
©Copyright 2011, Texas A&M University
All rights reserved.
Figure 6Percent of Secondary Students Who Have Driven Drunk
Atleast Once During the Past YearIn ACADEMY ISD
9% 9%
0%
5%
10%
15%
20%
25%
30%
35%
40%
Grades 9-12
District State
Figure 7Alcohol Use at Most/All Parties By Grade
Among Secondary StudentsIn ACADEMY ISD
7%11%
24%
36%
0%
10%
20%
30%
40%
50%
60%
Grades 7-8 Grades 9-12
Dis trict State Dis trict State

8/3/2019 BELL COUNTY - Academy ISD - 2011 Texas School Survey of Drug and Alcohol Use
http://slidepdf.com/reader/full/bell-county-academy-isd-2011-texas-school-survey-of-drug-and-alcohol-use 38/209
©Copyright 2011, Texas A&M University
All rights reserved.
Figure 8-APrevalence of Lifetime Marijuana Use By Grade
Among Secondary StudentsIn ACADEMY ISD
2%
7%11%
18%
0%
10%
20%
30%
40%
50%
60%
Grades 7-8 Grades 9-12
Dis trict State Dis trict State
Figure 8-BPrevalence of Past Month Marijuana Use By Grade
Among Secondary StudentsIn ACADEMY ISD
2% 2%4%
6%
0%
10%
20%
30%
40%
50%
60%
Grades 7-8 Grades 9-12
Dis trict State Dis trict State

8/3/2019 BELL COUNTY - Academy ISD - 2011 Texas School Survey of Drug and Alcohol Use
http://slidepdf.com/reader/full/bell-county-academy-isd-2011-texas-school-survey-of-drug-and-alcohol-use 39/209
©Copyright 2011, Texas A&M University
All rights reserved.
Figure 9Percent of Secondary Students Attending Class while High
Atleast One Day During the Past YearIn ACADEMY ISD
4%6%
9%
13%
0%
5%
10%
15%
20%
25%
30%
35%
40%
Grades 7-8 Grades 9-12
Dis trict State Dis trict State

8/3/2019 BELL COUNTY - Academy ISD - 2011 Texas School Survey of Drug and Alcohol Use
http://slidepdf.com/reader/full/bell-county-academy-isd-2011-texas-school-survey-of-drug-and-alcohol-use 40/209
©Copyright 2011, Texas A&M University
All rights reserved.
Figure 10-APrevalence of Lifetime Inhalant Use By Grade
Among Secondary StudentsIn ACADEMY ISD
15%
20%
11%
16%
0%
10%
20%
30%
40%
50%
60%
Grades 7-8 Grades 9-12
Dis trict State Dis trict State
Figure 10-BPrevalence of Past Month Inhalant Use By Grade
Among Secondary StudentsIn ACADEMY ISD
6%8%
2%5%
0%
10%
20%
30%
40%
50%
60%
Grades 7-8 Grades 9-12
Dis trict State Dis trict State

8/3/2019 BELL COUNTY - Academy ISD - 2011 Texas School Survey of Drug and Alcohol Use
http://slidepdf.com/reader/full/bell-county-academy-isd-2011-texas-school-survey-of-drug-and-alcohol-use 41/209
©Copyright 2011, Texas A&M University
All rights reserved.
Figure 11Percentage of Secondary Students Who Think Various Substances
Are Very Dangerous to UseIn ACADEMY ISD
51%48%
75% 73%69%
59% 58%53%
0%
20%
40%
60%
80%
100%
Alcohol Inhalants Marijuana Tobacco
District State Dis trict State District State District State
Figure 12Where Secondary Students Would Go For Help
With a Substance Abuse ProblemIn ACADEMY ISD
44%
35%
53%
45%
67% 69%
44%
37%
68%62%
76%
61%
43%
35%
0%
20%
40%
60%
80%
100%
Adult in-school Doctor Friends Oth. Counselor Oth. adult Parents School Counselor
District State DistrictState District State District State DistrictState DistrictState District State

8/3/2019 BELL COUNTY - Academy ISD - 2011 Texas School Survey of Drug and Alcohol Use
http://slidepdf.com/reader/full/bell-county-academy-isd-2011-texas-school-survey-of-drug-and-alcohol-use 42/209
©Copyright 2011, Texas A&M University
All rights reserved.
Figure 13-AAttitudes of Parents Toward Adolescent Beer Use
Among Secondary StudentsIn ACADEMY ISD
7%12%
76%
5% 5%10%
79%
6%
0%
20%
40%
60%
80%
100%
District State
Approve Neither Disapprove Dont Know Approve Neither Disapprove Dont Know
Figure 13-BAttitudes of Parents Toward Adolescent Marijuana Use
Among Secondary StudentsIn ACADEMY ISD
3% 5%
90%
3% 3% 5%
87%
6%
0%
20%
40%
60%
80%
100%
District State
Approve Neither Disapprove Dont Know Approve Neither Disapprove Dont Know
8/3/2019 BELL COUNTY - Academy ISD - 2011 Texas School Survey of Drug and Alcohol Use
http://slidepdf.com/reader/full/bell-county-academy-isd-2011-texas-school-survey-of-drug-and-alcohol-use 43/209
Academy
SPRING 2011
©Copyright 2011, Texas A&M University
All rights reserved.Secondary Report-Page 1 of 84
Texas School Survey
of Drug and Alcohol Use
2011
Academy ISDPart I: District Results
Secondary

8/3/2019 BELL COUNTY - Academy ISD - 2011 Texas School Survey of Drug and Alcohol Use
http://slidepdf.com/reader/full/bell-county-academy-isd-2011-texas-school-survey-of-drug-and-alcohol-use 44/209
Academy
SPRING 2011
©Copyright 2011, Texas A&M University
All rights reserved.Secondary Report-Page 2 of 84

8/3/2019 BELL COUNTY - Academy ISD - 2011 Texas School Survey of Drug and Alcohol Use
http://slidepdf.com/reader/full/bell-county-academy-isd-2011-texas-school-survey-of-drug-and-alcohol-use 45/209
Academy
SPRING 2011
©Copyright 2011, Texas A&M University
All rights reserved.Secondary Report-Page 3 of 84
Part I: District ResultsSecondary
Table of Contents
General Substance Tables 5-36
TobaccoAlcoholDrugsInhalantsMiscellaneous
Prevalence Tables 37-66
Selected Substances:
Table B1: All Students
Table B2: Male StudentsTable B3: Female StudentsTable B4: White StudentsTable B5: African/American StudentsTable B6: Mexican/American StudentsTable B7: Students Reporting A GradesTable B8: Students Reporting Grades Lower Than an ATable B9: Students Living With 2 ParentsTable B10: Students Not Living With 2 ParentsTable B11: Students who would seek help from adultsTable B12: Students who wouldn’t seek help from adultsTable B13 Students Living in Town More Than 3 Years
Table B14: Students Living in Town 3 Years or Less
Margin Tables 67-84

8/3/2019 BELL COUNTY - Academy ISD - 2011 Texas School Survey of Drug and Alcohol Use
http://slidepdf.com/reader/full/bell-county-academy-isd-2011-texas-school-survey-of-drug-and-alcohol-use 46/209
Academy
SPRING 2011
©Copyright 2011, Texas A&M University
All rights reserved.Secondary Report-Page 4 of 84
8/3/2019 BELL COUNTY - Academy ISD - 2011 Texas School Survey of Drug and Alcohol Use
http://slidepdf.com/reader/full/bell-county-academy-isd-2011-texas-school-survey-of-drug-and-alcohol-use 47/209

8/3/2019 BELL COUNTY - Academy ISD - 2011 Texas School Survey of Drug and Alcohol Use
http://slidepdf.com/reader/full/bell-county-academy-isd-2011-texas-school-survey-of-drug-and-alcohol-use 48/209
Academy
SPRING 2011
©Copyright 2011, Texas A&M University
All rights reserved.Secondary Report-Page 6 of 84
8/3/2019 BELL COUNTY - Academy ISD - 2011 Texas School Survey of Drug and Alcohol Use
http://slidepdf.com/reader/full/bell-county-academy-isd-2011-texas-school-survey-of-drug-and-alcohol-use 49/209
Academy
SPRING 2011
©Copyright 2011, Texas A&M University
All rights reserved.Secondary Report-Page 7 of 84
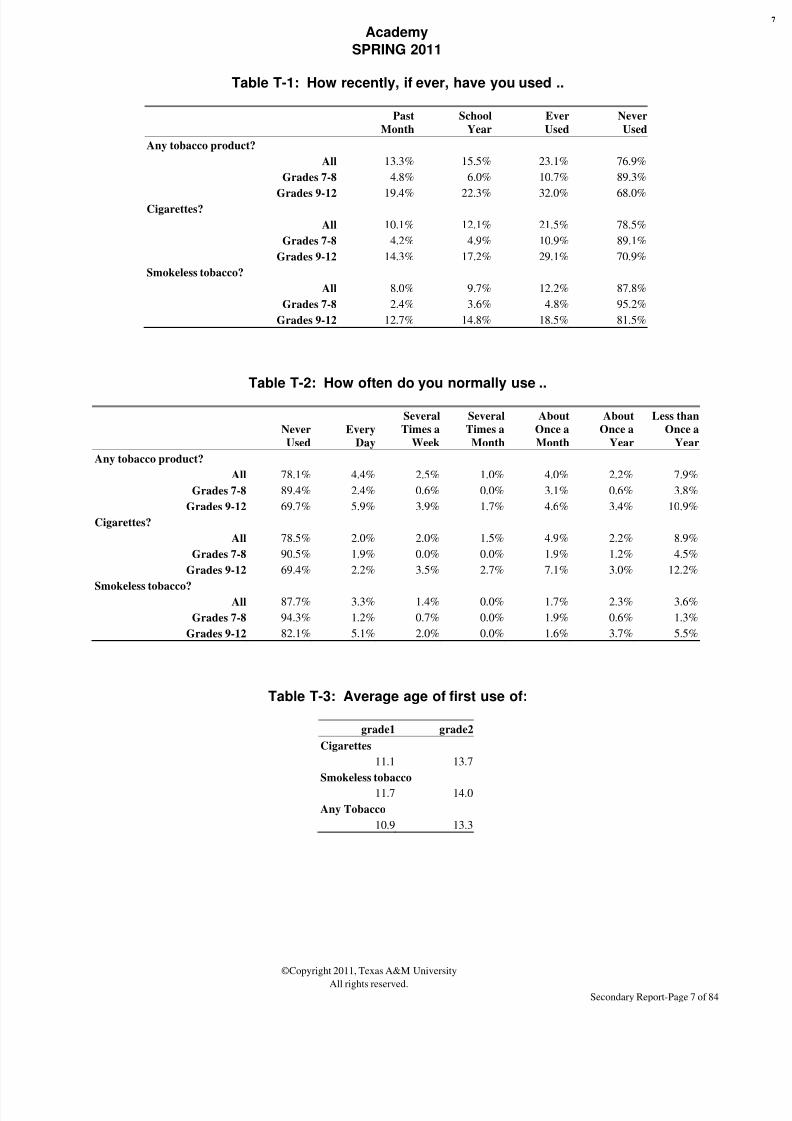
Table T-1: How recently, if ever, have you used ..
Past
Month
School
Year
Ever
Used
Never
Used
Any tobacco product?
All 13.3% 15.5% 23.1% 76.9%
Grades 7-8 4.8% 6.0% 10.7% 89.3%
Grades 9-12 19.4% 22.3% 32.0% 68.0%Cigarettes?
All 10.1% 12.1% 21.5% 78.5%
Grades 7-8 4.2% 4.9% 10.9% 89.1%
Grades 9-12 14.3% 17.2% 29.1% 70.9%
Smokeless tobacco?
All 8.0% 9.7% 12.2% 87.8%
Grades 7-8 2.4% 3.6% 4.8% 95.2%
Grades 9-12 12.7% 14.8% 18.5% 81.5%
Table T-2: How often do you normally use ..
Never
Used
Every
Day
Several
Times a
Week
Several
Times a
Month
About
Once a
Month
About
Once a
Year
Less than
Once a
Year
Any tobacco product?
All 78.1% 4.4% 2.5% 1.0% 4.0% 2.2% 7.9%
Grades 7-8 89.4% 2.4% 0.6% 0.0% 3.1% 0.6% 3.8%
Grades 9-12 69.7% 5.9% 3.9% 1.7% 4.6% 3.4% 10.9%
Cigarettes?
All 78.5% 2.0% 2.0% 1.5% 4.9% 2.2% 8.9%
Grades 7-8 90.5% 1.9% 0.0% 0.0% 1.9% 1.2% 4.5%
Grades 9-12 69.4% 2.2% 3.5% 2.7% 7.1% 3.0% 12.2%
Smokeless tobacco?All 87.7% 3.3% 1.4% 0.0% 1.7% 2.3% 3.6%
Grades 7-8 94.3% 1.2% 0.7% 0.0% 1.9% 0.6% 1.3%
Grades 9-12 82.1% 5.1% 2.0% 0.0% 1.6% 3.7% 5.5%
Table T-3: Average age of first use of:
grade1 grade2
Cigarettes
11.1 13.7
Smokeless tobacco
11.7 14.0
Any Tobacco
10.9 13.3
8/3/2019 BELL COUNTY - Academy ISD - 2011 Texas School Survey of Drug and Alcohol Use
http://slidepdf.com/reader/full/bell-county-academy-isd-2011-texas-school-survey-of-drug-and-alcohol-use 50/209
Academy
SPRING 2011
©Copyright 2011, Texas A&M University
All rights reserved.Secondary Report-Page 8 of 84
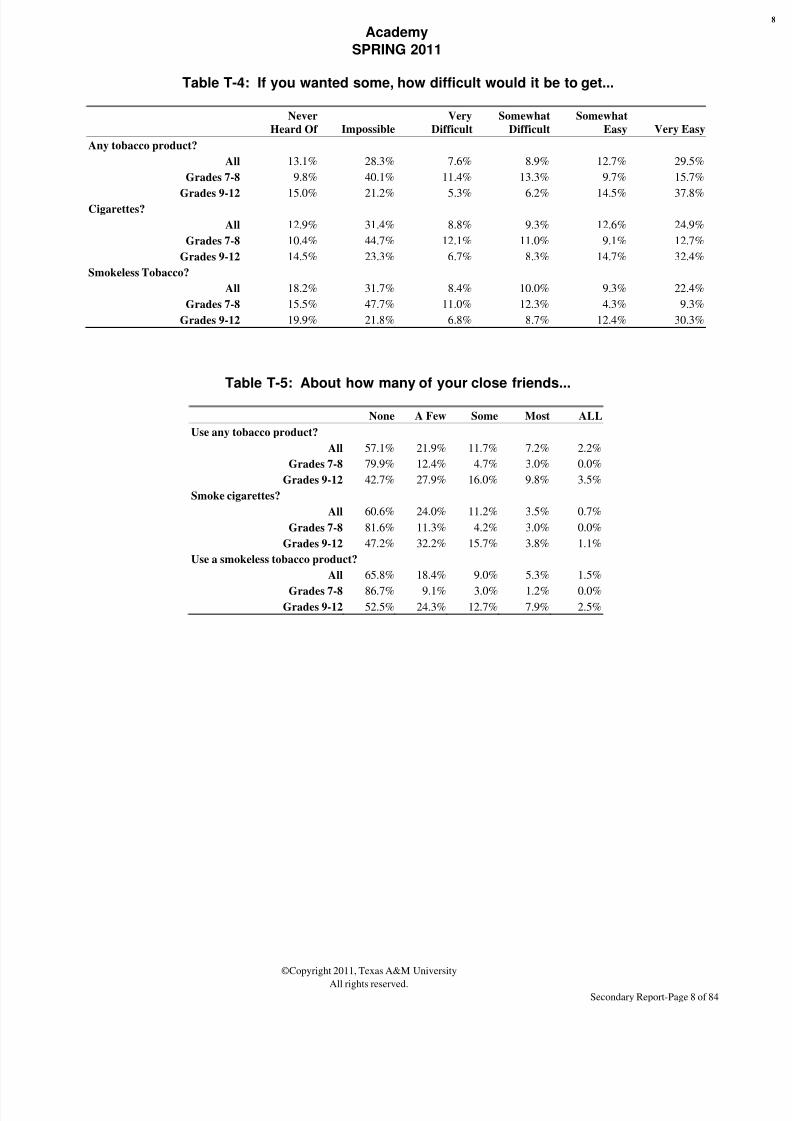
Table T-4: If you wanted some, how difficult would it be to get...
Never
Heard Of Impossible
Very
Difficult
Somewhat
Difficult
Somewhat
Easy Very Easy
Any tobacco product?
All 13.1% 28.3% 7.6% 8.9% 12.7% 29.5%
Grades 7-8 9.8% 40.1% 11.4% 13.3% 9.7% 15.7%
Grades 9-12 15.0% 21.2% 5.3% 6.2% 14.5% 37.8%Cigarettes?
All 12.9% 31.4% 8.8% 9.3% 12.6% 24.9%
Grades 7-8 10.4% 44.7% 12.1% 11.0% 9.1% 12.7%
Grades 9-12 14.5% 23.3% 6.7% 8.3% 14.7% 32.4%
Smokeless Tobacco?
All 18.2% 31.7% 8.4% 10.0% 9.3% 22.4%
Grades 7-8 15.5% 47.7% 11.0% 12.3% 4.3% 9.3%
Grades 9-12 19.9% 21.8% 6.8% 8.7% 12.4% 30.3%
Table T-5: About how many of your close friends...
None A Few Some Most ALL
Use any tobacco product?
All 57.1% 21.9% 11.7% 7.2% 2.2%
Grades 7-8 79.9% 12.4% 4.7% 3.0% 0.0%
Grades 9-12 42.7% 27.9% 16.0% 9.8% 3.5%
Smoke cigarettes?
All 60.6% 24.0% 11.2% 3.5% 0.7%
Grades 7-8 81.6% 11.3% 4.2% 3.0% 0.0%
Grades 9-12 47.2% 32.2% 15.7% 3.8% 1.1%
Use a smokeless tobacco product?
All 65.8% 18.4% 9.0% 5.3% 1.5%
Grades 7-8 86.7% 9.1% 3.0% 1.2% 0.0%Grades 9-12 52.5% 24.3% 12.7% 7.9% 2.5%

8/3/2019 BELL COUNTY - Academy ISD - 2011 Texas School Survey of Drug and Alcohol Use
http://slidepdf.com/reader/full/bell-county-academy-isd-2011-texas-school-survey-of-drug-and-alcohol-use 51/209
Academy
SPRING 2011
©Copyright 2011, Texas A&M University
All rights reserved.Secondary Report-Page 9 of 84
Table T-6: How do your parents feel about kids your age using tobacco?
Strongly
Disapprove
Mildly
Disapprove Neither
Mildly
Approve
Strongly
Approve Don't know
All 75.8% 5.3% 12.7% 2.0% 0.8% 3.4%
Grades 7-8 88.1% 1.3% 5.0% 0.6% 0.0% 5.0%
Grades 9-12 66.0% 8.6% 18.9% 3.0% 1.4% 2.1%
Table T-7: How dangerous do you think it is for kids your age to use tobacco?
Very
Dangerous
Somewhat
Dangerous
Not very
Dangerous
Not at All
Dangerous Do Not Know
All 57.5% 22.1% 11.6% 4.9% 3.9%
Grades 7-8 74.8% 19.7% 3.0% 1.2% 1.3%
Grades 9-12 46.6% 23.6% 17.1% 7.3% 5.5%

8/3/2019 BELL COUNTY - Academy ISD - 2011 Texas School Survey of Drug and Alcohol Use
http://slidepdf.com/reader/full/bell-county-academy-isd-2011-texas-school-survey-of-drug-and-alcohol-use 52/209
Academy
SPRING 2011
©Copyright 2011, Texas A&M University
All rights reserved.Secondary Report-Page 10 of 84
Table A-1: How recently, if ever, have you used...
Past
Month
School
Year
Ever
Used
Never
Used
Any alcohol product?
All 23.8% 36.9% 54.3% 45.7%
Grades 7-8 13.1% 23.4% 42.5% 57.5%
Grades 9-12 31.2% 46.2% 62.5% 37.5%Beer?
All 15.3% 25.5% 42.9% 57.1%
Grades 7-8 3.6% 14.0% 28.0% 72.0%
Grades 9-12 24.9% 35.1% 55.2% 44.8%
Wine coolers?
All 14.1% 23.0% 36.9% 63.1%
Grades 7-8 4.9% 10.4% 25.2% 74.8%
Grades 9-12 21.1% 32.6% 45.9% 54.1%
Wine?
All 10.7% 16.3% 37.0% 63.0%
Grades 7-8 6.9% 12.7% 26.6% 73.4%
Grades 9-12 13.8% 19.2% 45.2% 54.8%
Liquor?
All 14.7% 24.8% 36.4% 63.6%
Grades 7-8 6.7% 12.8% 19.6% 80.4%
Grades 9-12 20.9% 34.2% 49.6% 50.4%

8/3/2019 BELL COUNTY - Academy ISD - 2011 Texas School Survey of Drug and Alcohol Use
http://slidepdf.com/reader/full/bell-county-academy-isd-2011-texas-school-survey-of-drug-and-alcohol-use 53/209
Academy
SPRING 2011
©Copyright 2011, Texas A&M University
All rights reserved.Secondary Report-Page 11 of 84
Table A-2: How often do you normally use...
Never
Used
Every
Day
Several
Times a
Week
Several
Times a
Month
About
Once a
Month
About
Once a
Year
Less than
Once a
Year
Any alcohol product?
All 52.7% 0.0% 1.8% 8.4% 10.8% 15.3% 11.1%
Grades 7-8 66.3% 0.0% 0.0% 3.6% 9.6% 11.5% 9.0%Grades 9-12 43.1% 0.0% 3.0% 11.6% 11.6% 18.0% 12.6%
Beer?
All 58.6% 0.0% 1.7% 7.5% 9.2% 11.9% 11.1%
Grades 7-8 71.2% 0.0% 0.0% 1.9% 5.8% 12.8% 8.3%
Grades 9-12 48.4% 0.0% 3.1% 12.0% 12.1% 11.1% 13.4%
Wine coolers?
All 66.2% 0.0% 0.5% 4.5% 8.8% 12.2% 7.7%
Grades 7-8 76.0% 0.0% 0.0% 2.0% 6.7% 10.0% 5.3%
Grades 9-12 58.7% 0.0% 0.9% 6.5% 10.5% 13.8% 9.6%
Wine?
All 65.5% 0.0% 0.8% 3.1% 6.3% 11.3% 12.9%
Grades 7-8 79.5% 0.0% 0.0% 2.1% 2.0% 8.9% 7.5%
Grades 9-12 55.1% 0.0% 1.5% 3.9% 9.5% 13.1% 16.9%
Liquor?
All 66.2% 0.0% 0.8% 6.4% 6.6% 11.6% 8.4%
Grades 7-8 83.6% 0.0% 0.0% 2.0% 3.9% 7.2% 3.3%
Grades 9-12 52.5% 0.0% 1.5% 9.9% 8.7% 15.0% 12.4%

8/3/2019 BELL COUNTY - Academy ISD - 2011 Texas School Survey of Drug and Alcohol Use
http://slidepdf.com/reader/full/bell-county-academy-isd-2011-texas-school-survey-of-drug-and-alcohol-use 54/209
Academy
SPRING 2011
©Copyright 2011, Texas A&M University
All rights reserved.Secondary Report-Page 12 of 84
Table A-3: When you drink the following alcoholic beverages, how many drinks doyou usually have at one time, on average?
Never Ever Used 5 or More 1 to 4 Less than 1
Beer
All 57.1% 42.9% 11.0% 17.5% 14.4%
Grades 7-8 70.3% 29.7% 2.4% 13.4% 13.8%
Grades 9-12 47.2% 52.8% 17.4% 20.6% 14.8%Wine Coolers
All 64.4% 35.6% 8.0% 19.8% 7.8%
Grades 7-8 75.3% 24.7% 2.4% 14.3% 8.0%
Grades 9-12 56.1% 43.9% 12.3% 23.9% 7.7%
Wine
All 63.3% 36.7% 4.5% 17.4% 14.8%
Grades 7-8 76.1% 23.9% 1.8% 11.0% 11.0%
Grades 9-12 53.4% 46.6% 6.5% 22.3% 17.8%
Liquor
All 63.7% 36.3% 12.0% 19.4% 5.0%
Grades 7-8 80.5% 19.5% 3.0% 9.8% 6.7%
Grades 9-12 50.6% 49.4% 18.9% 26.9% 3.7%
Table A-4: During the past 30 days, on how many days have you had five or moredrinks of alcohol at one time?
Never/None 1 day 2 days 3 to 5 days 6 to 9 days
10 or
more days
Alcohol
All 84.1% 5.6% 3.6% 2.7% 1.7% 2.4%
Grades 7-8 95.3% 2.4% 1.2% 0.6% 0.0% 0.6%
Grades 9-12 75.8% 8.0% 5.3% 4.2% 2.9% 3.7%
Table A-5: Average age of first use of:
grade1 grade2
Beer
10.8 12.5
Wine Coolers
11.5 13.1
Wine
11.0 12.9
Liquor11.4 13.9
Any Alcohol
10.9 12.4

8/3/2019 BELL COUNTY - Academy ISD - 2011 Texas School Survey of Drug and Alcohol Use
http://slidepdf.com/reader/full/bell-county-academy-isd-2011-texas-school-survey-of-drug-and-alcohol-use 55/209
Academy
SPRING 2011
©Copyright 2011, Texas A&M University
All rights reserved.Secondary Report-Page 13 of 84
Table A-6: If you wanted some, how difficult would it be to get...
Never
Heard Of Impossible
Very
Difficult
Somewhat
Difficult
Somewhat
Easy Very Easy
Beer?
All 10.7% 20.7% 10.6% 10.8% 17.1% 30.1%
Grades 7-8 8.7% 28.8% 13.6% 16.0% 15.5% 17.3%
Grades 9-12 12.0% 15.5% 8.6% 7.4% 18.1% 38.4%Wine coolers?
All 13.9% 28.7% 8.8% 11.0% 14.8% 22.8%
Grades 7-8 13.6% 44.3% 9.8% 9.1% 10.3% 12.9%
Grades 9-12 14.1% 18.7% 8.2% 12.2% 17.6% 29.2%
Wine?
All 11.6% 27.5% 10.3% 13.3% 13.0% 24.2%
Grades 7-8 8.7% 41.3% 16.7% 13.0% 8.0% 12.3%
Grades 9-12 13.4% 18.8% 6.3% 13.6% 16.2% 31.7%
Liquor?
All 12.1% 32.7% 8.0% 11.0% 13.9% 22.3%
Grades 7-8 9.3% 52.0% 8.6% 12.3% 7.9% 9.9%
Grades 9-12 13.9% 20.2% 7.7% 10.1% 17.8% 30.3%
Any alcohol product?
All 11.8% 17.9% 9.2% 10.1% 17.8% 33.2%
Grades 7-8 6.6% 26.5% 13.8% 12.5% 19.7% 20.9%
Grades 9-12 14.9% 12.6% 6.4% 8.7% 16.7% 40.7%

8/3/2019 BELL COUNTY - Academy ISD - 2011 Texas School Survey of Drug and Alcohol Use
http://slidepdf.com/reader/full/bell-county-academy-isd-2011-texas-school-survey-of-drug-and-alcohol-use 56/209
Academy
SPRING 2011
©Copyright 2011, Texas A&M University
All rights reserved.Secondary Report-Page 14 of 84
Table A-7: Since school began in the fall, on how many days (if any) have you...
None 1-3 Times 4-9 Times 10+ Times
Attended class while drunk on alcohol?
All 93.2% 4.8% 1.5% 0.5%
Grades 7-8 95.1% 3.6% 1.3% 0.0%
Grades 9-12 91.8% 5.6% 1.7% 0.9%
Gotten into trouble with teachers because of your drinking?All 99.0% 1.0% 0.0% 0.0%
Grades 7-8 100.0% 0.0% 0.0% 0.0%
Grades 9-12 98.3% 1.7% 0.0% 0.0%
Table A-8: School year use of alcohol by absences and conduct problems:
Average days absent due to
illness or other reasons
Alcohol Users: 3.8
Alcohol Non-use 3.7
Average days conduct problems
reported
Alcohol Users: 2.1
Alcohol Non-use 0.5
Table A-9: During the past twelve months, how many times have you...
None 1-3 Times 4-9 Times 10+ Times
Driven a car when you've had a good bit to drink?All 91.1% 7.5% 0.7% 0.8%
Grades 9-12 91.1% 7.5% 0.7% 0.8%
Gotten into trouble with the police because of drinking?
All 98.7% 1.1% 0.0% 0.3%
Grades 7-8 99.4% 0.0% 0.0% 0.6%
Grades 9-12 98.3% 1.7% 0.0% 0.0%

8/3/2019 BELL COUNTY - Academy ISD - 2011 Texas School Survey of Drug and Alcohol Use
http://slidepdf.com/reader/full/bell-county-academy-isd-2011-texas-school-survey-of-drug-and-alcohol-use 57/209
Academy
SPRING 2011
©Copyright 2011, Texas A&M University
All rights reserved.Secondary Report-Page 15 of 84
Table A-10: About how many of your close friends use...
None A Few Some Most ALL
Any alcohol product?
All 40.6% 27.4% 16.1% 13.0% 2.9%
Grades 7-8 57.5% 28.9% 9.5% 4.1% 0.0%
Grades 9-12 30.0% 26.5% 20.2% 18.6% 4.7%
Beer?All 45.0% 24.1% 15.6% 13.1% 2.2%
Grades 7-8 64.9% 23.5% 8.5% 3.1% 0.0%
Grades 9-12 32.2% 24.5% 20.2% 19.5% 3.6%
Wine coolers?
All 58.6% 21.3% 12.2% 6.6% 1.3%
Grades 7-8 77.5% 14.0% 5.5% 3.1% 0.0%
Grades 9-12 46.5% 25.9% 16.5% 8.9% 2.1%
Wine?
All 66.2% 19.5% 10.0% 3.7% 0.6%
Grades 7-8 78.5% 14.1% 4.3% 3.1% 0.0%
Grades 9-12 58.3% 22.9% 13.6% 4.2% 1.0%
Liquor?
All 53.9% 22.0% 14.8% 8.3% 0.9%
Grades 7-8 79.7% 11.7% 4.3% 4.3% 0.0%
Grades 9-12 37.9% 28.5% 21.4% 10.8% 1.4%
Table A-11: During the past twelve months, how many times have you...
None 1-3 Times 4-9 Times 10+ Times
Had difficulties of any kind with your friends because of your drinking?
All 97.5% 2.5% 0.0% 0.0%
Grades 7-8 98.2% 1.8% 0.0% 0.0%
Grades 9-12 97.1% 2.9% 0.0% 0.0%
Been criticized by someone you were dating because of drinking?
All 93.9% 5.1% 0.3% 0.7%
Grades 7-8 98.1% 0.6% 0.6% 0.6%
Grades 9-12 91.0% 8.2% 0.0% 0.8%

8/3/2019 BELL COUNTY - Academy ISD - 2011 Texas School Survey of Drug and Alcohol Use
http://slidepdf.com/reader/full/bell-county-academy-isd-2011-texas-school-survey-of-drug-and-alcohol-use 58/209
Academy
SPRING 2011
©Copyright 2011, Texas A&M University
All rights reserved.Secondary Report-Page 16 of 84
Table A-12: Thinking of parties you attended this school year, how often wasalcohol used?
Never Seldom
Half
the Time
Most
of the Time Always Don't know
Didn't
attend
All 55.7% 8.4% 3.3% 9.0% 7.6% 1.6% 14.5%
Grades 7-8 72.1% 5.6% 1.9% 4.3% 2.5% 1.2% 12.4%
Grades 9-12 44.0% 10.4% 4.3% 12.3% 11.3% 1.8% 16.0%
Table A-13: How often, if ever, do you get alcoholic beverages from..
Do Not Drink Never Seldom
Most of
the Time Always
At home?
All 45.3% 20.1% 25.5% 5.9% 3.1%
Grades 7-8 53.9% 23.5% 16.9% 3.8% 1.8%
Grades 9-12 38.9% 17.6% 31.9% 7.5% 4.0%
From friends?
All 48.3% 24.5% 12.1% 13.0% 2.2%
Grades 7-8 60.1% 27.5% 8.7% 3.1% 0.6%
Grades 9-12 38.2% 21.9% 14.9% 21.3% 3.6%
From a store?
All 47.7% 43.8% 5.8% 1.8% 0.8%
Grades 7-8 56.4% 40.3% 2.7% 0.0% 0.6%
Grades 9-12 40.3% 46.9% 8.5% 3.3% 0.9%
At parties?
All 48.1% 25.9% 9.6% 10.2% 6.2%
Grades 7-8 55.5% 29.9% 8.9% 3.8% 1.9%
Grades 9-12 41.9% 22.5% 10.3% 15.5% 9.8%
Other source?
All 46.8% 28.4% 12.1% 7.9% 4.8%Grades 7-8 56.3% 29.9% 6.3% 5.0% 2.5%
Grades 9-12 39.3% 27.2% 16.7% 10.2% 6.6%
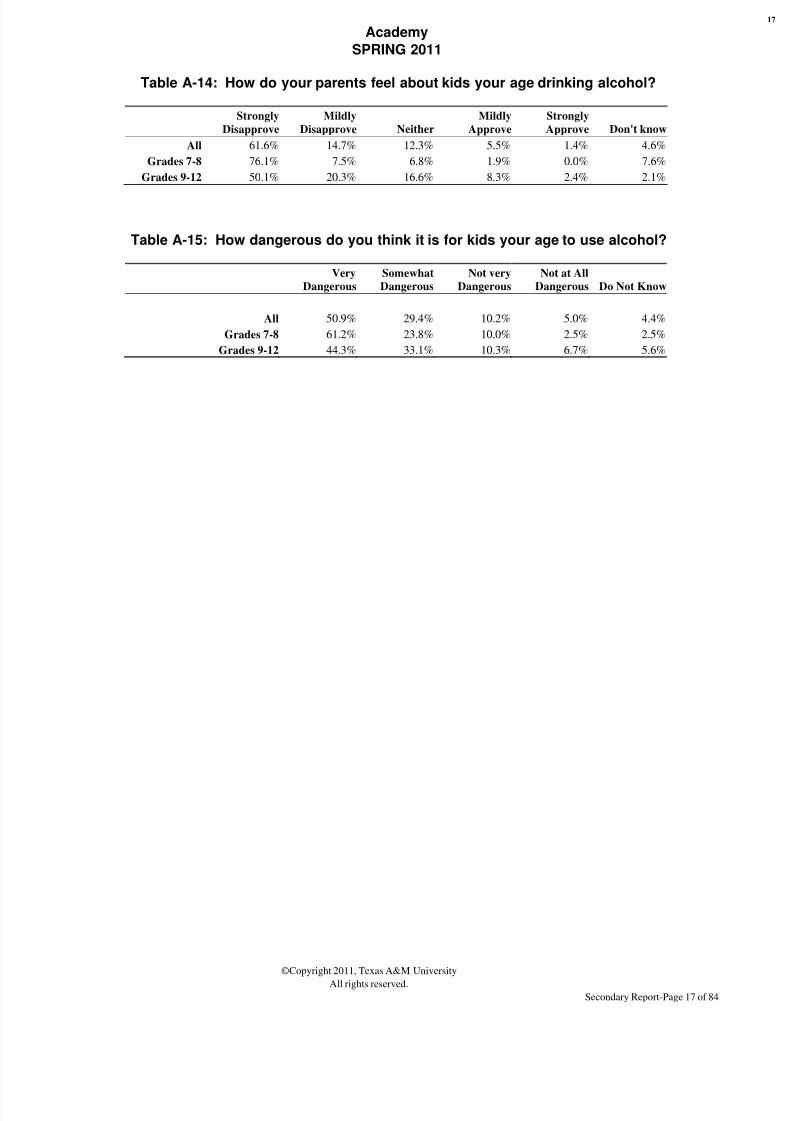
8/3/2019 BELL COUNTY - Academy ISD - 2011 Texas School Survey of Drug and Alcohol Use
http://slidepdf.com/reader/full/bell-county-academy-isd-2011-texas-school-survey-of-drug-and-alcohol-use 59/209
Academy
SPRING 2011
©Copyright 2011, Texas A&M University
All rights reserved.Secondary Report-Page 17 of 84
Table A-14: How do your parents feel about kids your age drinking alcohol?
Strongly
Disapprove
Mildly
Disapprove Neither
Mildly
Approve
Strongly
Approve Don't know
All 61.6% 14.7% 12.3% 5.5% 1.4% 4.6%
Grades 7-8 76.1% 7.5% 6.8% 1.9% 0.0% 7.6%
Grades 9-12 50.1% 20.3% 16.6% 8.3% 2.4% 2.1%
Table A-15: How dangerous do you think it is for kids your age to use alcohol?
Very
Dangerous
Somewhat
Dangerous
Not very
Dangerous
Not at All
Dangerous Do Not Know
All 50.9% 29.4% 10.2% 5.0% 4.4%
Grades 7-8 61.2% 23.8% 10.0% 2.5% 2.5%
Grades 9-12 44.3% 33.1% 10.3% 6.7% 5.6%
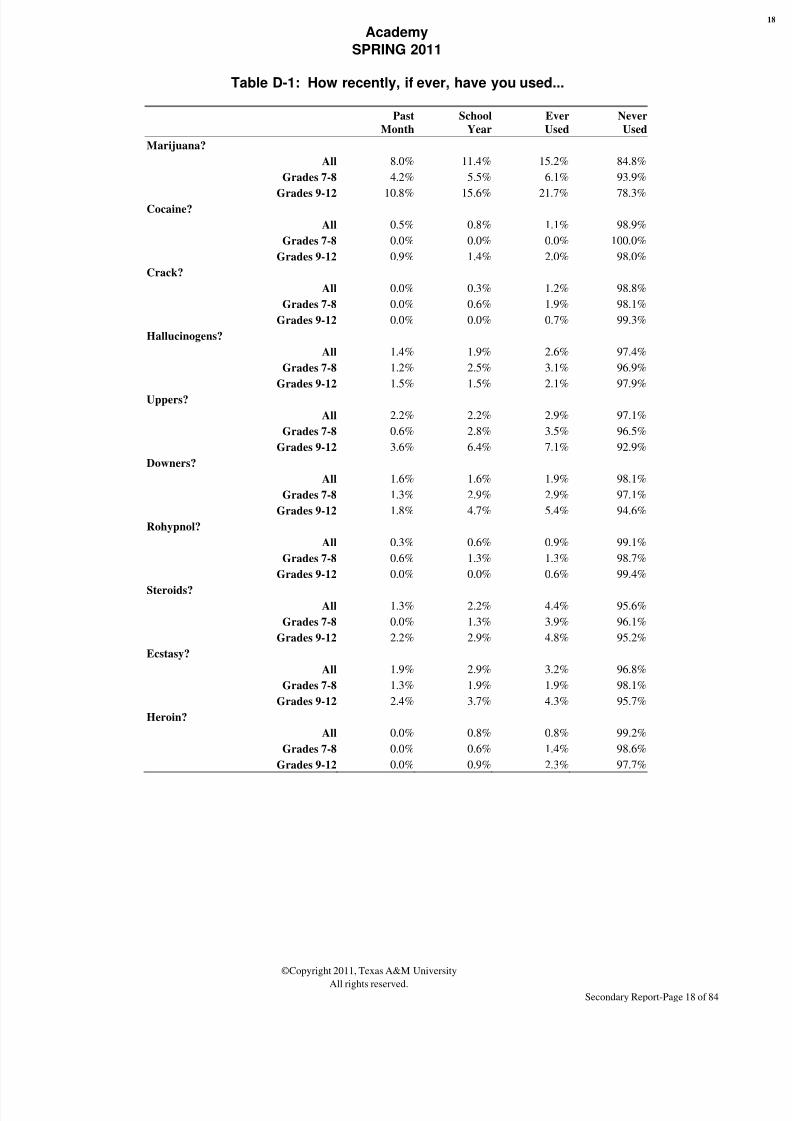
8/3/2019 BELL COUNTY - Academy ISD - 2011 Texas School Survey of Drug and Alcohol Use
http://slidepdf.com/reader/full/bell-county-academy-isd-2011-texas-school-survey-of-drug-and-alcohol-use 60/209
Academy
SPRING 2011
©Copyright 2011, Texas A&M University
All rights reserved.Secondary Report-Page 18 of 84
Table D-1: How recently, if ever, have you used...
Past
Month
School
Year
Ever
Used
Never
Used
Marijuana?
All 8.0% 11.4% 15.2% 84.8%
Grades 7-8 4.2% 5.5% 6.1% 93.9%
Grades 9-12 10.8% 15.6% 21.7% 78.3%Cocaine?
All 0.5% 0.8% 1.1% 98.9%
Grades 7-8 0.0% 0.0% 0.0% 100.0%
Grades 9-12 0.9% 1.4% 2.0% 98.0%
Crack?
All 0.0% 0.3% 1.2% 98.8%
Grades 7-8 0.0% 0.6% 1.9% 98.1%
Grades 9-12 0.0% 0.0% 0.7% 99.3%
Hallucinogens?
All 1.4% 1.9% 2.6% 97.4%
Grades 7-8 1.2% 2.5% 3.1% 96.9%
Grades 9-12 1.5% 1.5% 2.1% 97.9%
Uppers?
All 2.2% 2.2% 2.9% 97.1%
Grades 7-8 0.6% 2.8% 3.5% 96.5%
Grades 9-12 3.6% 6.4% 7.1% 92.9%
Downers?
All 1.6% 1.6% 1.9% 98.1%
Grades 7-8 1.3% 2.9% 2.9% 97.1%
Grades 9-12 1.8% 4.7% 5.4% 94.6%
Rohypnol?
All 0.3% 0.6% 0.9% 99.1%
Grades 7-8 0.6% 1.3% 1.3% 98.7%
Grades 9-12 0.0% 0.0% 0.6% 99.4%
Steroids?All 1.3% 2.2% 4.4% 95.6%
Grades 7-8 0.0% 1.3% 3.9% 96.1%
Grades 9-12 2.2% 2.9% 4.8% 95.2%
Ecstasy?
All 1.9% 2.9% 3.2% 96.8%
Grades 7-8 1.3% 1.9% 1.9% 98.1%
Grades 9-12 2.4% 3.7% 4.3% 95.7%
Heroin?
All 0.0% 0.8% 0.8% 99.2%
Grades 7-8 0.0% 0.6% 1.4% 98.6%
Grades 9-12 0.0% 0.9% 2.3% 97.7%

8/3/2019 BELL COUNTY - Academy ISD - 2011 Texas School Survey of Drug and Alcohol Use
http://slidepdf.com/reader/full/bell-county-academy-isd-2011-texas-school-survey-of-drug-and-alcohol-use 61/209
Academy
SPRING 2011
©Copyright 2011, Texas A&M University
All rights reserved.Secondary Report-Page 19 of 84
Table D-2: How often do you normally use...
Never
Used
Every
Day
Several
Times a
Week
Several
Times a
Month
About
Once a
Month
About
Once a
Year
Less than
Once a
Year
Marijuana?
All 84.8% 2.2% 2.4% 2.9% 2.2% 2.4% 3.1%
Grades 7-8 93.9% 0.7% 0.7% 2.2% 1.5% 0.0% 0.8%Grades 9-12 78.0% 3.3% 3.7% 3.4% 2.7% 4.1% 4.8%
Cocaine?
All 98.5% 0.0% 0.0% 0.4% 0.0% 1.1% 0.0%
Grades 7-8 100.0% 0.0% 0.0% 0.0% 0.0% 0.0% 0.0%
Grades 9-12 97.1% 0.0% 0.0% 0.8% 0.0% 2.1% 0.0%
Crack?
All 98.6% 0.0% 0.0% 0.4% 0.0% 1.0% 0.0%
Grades 7-8 98.5% 0.0% 0.0% 0.8% 0.0% 0.8% 0.0%
Grades 9-12 98.8% 0.0% 0.0% 0.0% 0.0% 1.2% 0.0%
Hallucinogens?
All 97.6% 0.0% 1.0% 0.0% 0.7% 0.0% 0.6%
Grades 7-8 96.4% 0.0% 1.4% 0.0% 0.7% 0.0% 1.4%
Grades 9-12 98.6% 0.0% 0.7% 0.0% 0.7% 0.0% 0.0%
Uppers?
All 96.0% 0.0% 0.3% 1.6% 1.1% 0.6% 0.4%
Grades 7-8 97.9% 0.0% 0.7% 0.0% 1.4% 0.0% 0.0%
Grades 9-12 94.3% 0.0% 0.0% 3.1% 0.8% 1.1% 0.8%
Downers?
All 97.1% 0.0% 0.7% 0.6% 0.7% 1.0% 0.0%
Grades 7-8 98.0% 0.0% 0.7% 0.0% 1.3% 0.0% 0.0%
Grades 9-12 96.2% 0.0% 0.8% 1.1% 0.0% 1.9% 0.0%
Rohypnol?
All 98.6% 0.0% 0.0% 0.6% 0.0% 0.4% 0.4%
Grades 7-8 98.6% 0.0% 0.0% 1.4% 0.0% 0.0% 0.0%
Grades 9-12 98.6% 0.0% 0.0% 0.0% 0.0% 0.7% 0.7%Steroids?
All 96.0% 0.0% 0.4% 0.0% 0.7% 1.2% 1.7%
Grades 7-8 98.0% 0.0% 0.0% 0.0% 0.7% 0.0% 1.3%
Grades 9-12 94.2% 0.0% 0.8% 0.0% 0.8% 2.2% 2.0%
Ecstasy?
All 96.3% 0.0% 1.1% 0.9% 1.3% 0.0% 0.4%
Grades 7-8 98.0% 0.0% 1.3% 0.0% 0.7% 0.0% 0.0%
Grades 9-12 94.6% 0.0% 0.8% 1.8% 2.0% 0.0% 0.8%
Heroin?
All 99.0% 0.0% 0.3% 0.0% 0.6% 0.0% 0.0%
Grades 7-8 99.3% 0.0% 0.0% 0.0% 0.7% 0.0% 0.0%
Grades 9-12 98.8% 0.0% 0.6% 0.0% 0.6% 0.0% 0.0%

8/3/2019 BELL COUNTY - Academy ISD - 2011 Texas School Survey of Drug and Alcohol Use
http://slidepdf.com/reader/full/bell-county-academy-isd-2011-texas-school-survey-of-drug-and-alcohol-use 62/209
Academy
SPRING 2011
©Copyright 2011, Texas A&M University
All rights reserved.Secondary Report-Page 20 of 84
Table D-3: Average age of first use of:
grade1 grade2
Marijuana
11.0 14.7
Cocaine
* *
Crack* *
Hallucinogens
* *
Uppers
* 14.8
Downers
* 14.5
Rohypnol
* *
Steroids
10.6 14.3
Ecstasy
* 14.4
Heroin
* *
Table D-4: Age of first use of marijuana by family situation:
Never 9/Under 10 to 11 12 to 13 14 to 15 16 to 17 Over 17
Two parent family
All 92.0% 0.7% 0.0% 2.4% 2.5% 1.6% 0.7%
Grades 7-8 98.0% 0.0% 0.0% 2.0% 0.0% 0.0% 0.0%
Grades 9-12 87.5% 1.3% 0.0% 2.7% 4.4% 2.8% 1.3%
Other family situation
All 70.8% 0.7% 3.5% 6.2% 9.4% 9.5% 0.0%
Grades 7-8 85.5% 2.0% 10.4% 2.0% 0.0% 0.0% 0.0%
Grades 9-12 63.3% 0.0% 0.0% 8.2% 14.1% 14.3% 0.0%

8/3/2019 BELL COUNTY - Academy ISD - 2011 Texas School Survey of Drug and Alcohol Use
http://slidepdf.com/reader/full/bell-county-academy-isd-2011-texas-school-survey-of-drug-and-alcohol-use 63/209

8/3/2019 BELL COUNTY - Academy ISD - 2011 Texas School Survey of Drug and Alcohol Use
http://slidepdf.com/reader/full/bell-county-academy-isd-2011-texas-school-survey-of-drug-and-alcohol-use 64/209
Academy
SPRING 2011
©Copyright 2011, Texas A&M University
All rights reserved.Secondary Report-Page 22 of 84
Table D-6: Since school began in the fall, on how many days (if any) have you..
None 1-3 Times 4-9 Times 10+ Times
Attended class while high from marijuana use?
All 93.1% 3.4% 2.4% 1.1%
Grades 7-8 95.8% 1.2% 2.4% 0.6%
Grades 9-12 91.0% 5.2% 2.4% 1.4%
Attended class while high from use of some other drug?All 97.4% 2.3% 0.3% 0.0%
Grades 7-8 98.1% 1.9% 0.0% 0.0%
Grades 9-12 96.9% 2.5% 0.6% 0.0%
Gotten into trouble with teachers because of your drug use?
All 99.0% 1.0% 0.0% 0.0%
Grades 7-8 100.0% 0.0% 0.0% 0.0%
Grades 9-12 98.3% 1.7% 0.0% 0.0%
Table D-7: School year use of marijuana by absences and conduct problems:
Average days absent due to
illness or other reasons
Marijuana Users: 3.6
Marijuana Non-use 3.7
Average days conduct problems
reported
Marijuana Users: 4.0
Marijuana Non-use 0.7
Table D-8: During the past twelve months, how many times have you..
None 1-3 Times 4-9 Times 10+ Times
Driven a car when you've felt high from drugs?
All 94.6% 2.4% 0.7% 2.3%
Grades 9-12 94.6% 2.4% 0.7% 2.3%
Gotten into trouble with the police because of drug use?
All 98.4% 1.1% 0.0% 0.5%
Grades 7-8 98.7% 0.0% 0.0% 1.3%
Grades 9-12 98.1% 1.9% 0.0% 0.0%

8/3/2019 BELL COUNTY - Academy ISD - 2011 Texas School Survey of Drug and Alcohol Use
http://slidepdf.com/reader/full/bell-county-academy-isd-2011-texas-school-survey-of-drug-and-alcohol-use 65/209
Academy
SPRING 2011
©Copyright 2011, Texas A&M University
All rights reserved.Secondary Report-Page 23 of 84
Table D-9: About how many of your close friends use marijuana?
None A Few Some Most ALL
All 64.5% 18.9% 9.3% 5.4% 1.9%
Grades 7-8 85.9% 8.0% 3.0% 1.9% 1.2%
Grades 9-12 51.1% 25.8% 13.2% 7.6% 2.4%
Table D-10: During the past twelve months, how many times have you..
None 1-3 Times 4-9 Times 10+ Times
Had difficulties of any kind with your friends because of your drug use?
All 97.9% 1.6% 0.0% 0.5%
Grades 7-8 98.1% 0.6% 0.0% 1.2%
Grades 9-12 97.7% 2.3% 0.0% 0.0%
Been criticized by someone you were dating because of drug use?
All 96.3% 2.9% 0.0% 0.8%
Grades 7-8 99.3% 0.0% 0.0% 0.7%Grades 9-12 94.1% 5.0% 0.0% 0.9%

8/3/2019 BELL COUNTY - Academy ISD - 2011 Texas School Survey of Drug and Alcohol Use
http://slidepdf.com/reader/full/bell-county-academy-isd-2011-texas-school-survey-of-drug-and-alcohol-use 66/209
Academy
SPRING 2011
©Copyright 2011, Texas A&M University
All rights reserved.Secondary Report-Page 24 of 84
Table D-11: Thinking of parties you attended this school year, how often weremarijuana and/or other drugs used?
Never Seldom
Half
the Time
Most
of the Time Always Don't know
Didn't
attend
All 67.4% 5.8% 4.5% 3.5% 2.4% 1.9% 14.4%
Grades 7-8 79.3% 4.3% 0.6% 1.2% 1.8% 0.6% 12.2%
Grades 9-12 58.2% 7.0% 7.5% 5.3% 2.9% 2.9% 16.1%
Table D-12: How often, if ever, do you smoke marijuana in..
CATEGORY Never Seldom
Half
the Time
Most of
the Time Always Don't know
Joints? All 89.6% 2.7% 3.4% 2.3% 2.0% 0.0%
Grades 7-8 93.9% 1.3% 1.2% 2.4% 1.2% 0.0%
Grades 9-12 86.1% 3.9% 5.2% 2.1% 2.6% 0.0%
Blunts? All 89.3% 5.1% 1.6% 3.4% 0.6% 0.0%
Grades 7-8 95.1% 3.1% 0.6% 0.6% 0.6% 0.0%
Grades 9-12 84.6% 6.7% 2.5% 5.6% 0.6% 0.0%
Bongs or water pipes? All 91.1% 3.5% 2.6% 0.8% 1.5% 0.3%
Grades 7-8 96.3% 0.6% 0.6% 0.6% 1.9% 0.0%
Grades 9-12 86.9% 5.9% 4.3% 1.0% 1.3% 0.6%
Pipes? All 90.0% 4.3% 2.2% 1.9% 1.0% 0.5%
Grades 7-8 95.6% 1.9% 0.6% 1.2% 0.6% 0.0%
Grades 9-12 85.1% 6.4% 3.6% 2.5% 1.4% 1.0%
Some other way? All 93.5% 3.7% 1.1% 0.0% 1.4% 0.4%
Grades 7-8 95.0% 2.5% 1.2% 0.0% 1.3% 0.0%
Grades 9-12 92.2% 4.7% 0.9% 0.0% 1.6% 0.7%

8/3/2019 BELL COUNTY - Academy ISD - 2011 Texas School Survey of Drug and Alcohol Use
http://slidepdf.com/reader/full/bell-county-academy-isd-2011-texas-school-survey-of-drug-and-alcohol-use 67/209
Academy
SPRING 2011
©Copyright 2011, Texas A&M University
All rights reserved.Secondary Report-Page 25 of 84
Table D-13: How do your parents feel about kids your age using marijuana?
Strongly
Disapprove
Mildly
Disapprove Neither
Mildly
Approve
Strongly
Approve Don't know
All 84.7% 4.9% 4.8% 0.6% 2.3% 2.7%
Grades 7-8 90.4% 2.6% 1.9% 0.6% 1.3% 3.3%
Grades 9-12 80.2% 6.7% 7.1% 0.6% 3.1% 2.2%
Table D-14: How dangerous do you think it is for kids your age to use...
Very
Dangerous
Somewhat
Dangerous
Not very
Dangerous
Not at All
Dangerous Do Not Know
Marijuana?
All 69.2% 11.4% 6.4% 9.4% 3.6%
Grades 7-8 82.9% 7.9% 2.6% 5.2% 1.4%
Grades 9-12 60.0% 13.8% 8.9% 12.2% 5.1%
Cocaine?
All 86.4% 7.9% 1.0% 0.7% 4.0%
Grades 7-8 90.3% 6.2% 0.0% 0.7% 2.8%
Grades 9-12 83.9% 8.9% 1.6% 0.7% 4.9%
Crack?
All 87.8% 6.8% 1.7% 0.8% 3.0%
Grades 7-8 91.6% 5.6% 0.0% 0.7% 2.1%
Grades 9-12 85.2% 7.6% 2.8% 0.8% 3.6%
Ecstasy?
All 81.8% 8.9% 2.5% 0.7% 6.1%
Grades 7-8 84.4% 6.7% 2.0% 0.7% 6.2%
Grades 9-12 80.0% 10.4% 2.9% 0.8% 6.0%
Steroids?
All 75.0% 14.0% 6.7% 1.0% 3.4%
Grades 7-8 79.8% 11.9% 2.7% 1.4% 4.2%Grades 9-12 72.0% 15.4% 9.1% 0.7% 2.8%
Heroin?
All 88.1% 4.8% 1.3% 0.7% 5.1%
Grades 7-8 92.4% 4.1% 0.0% 0.7% 2.7%
Grades 9-12 85.3% 5.3% 2.1% 0.7% 6.6%
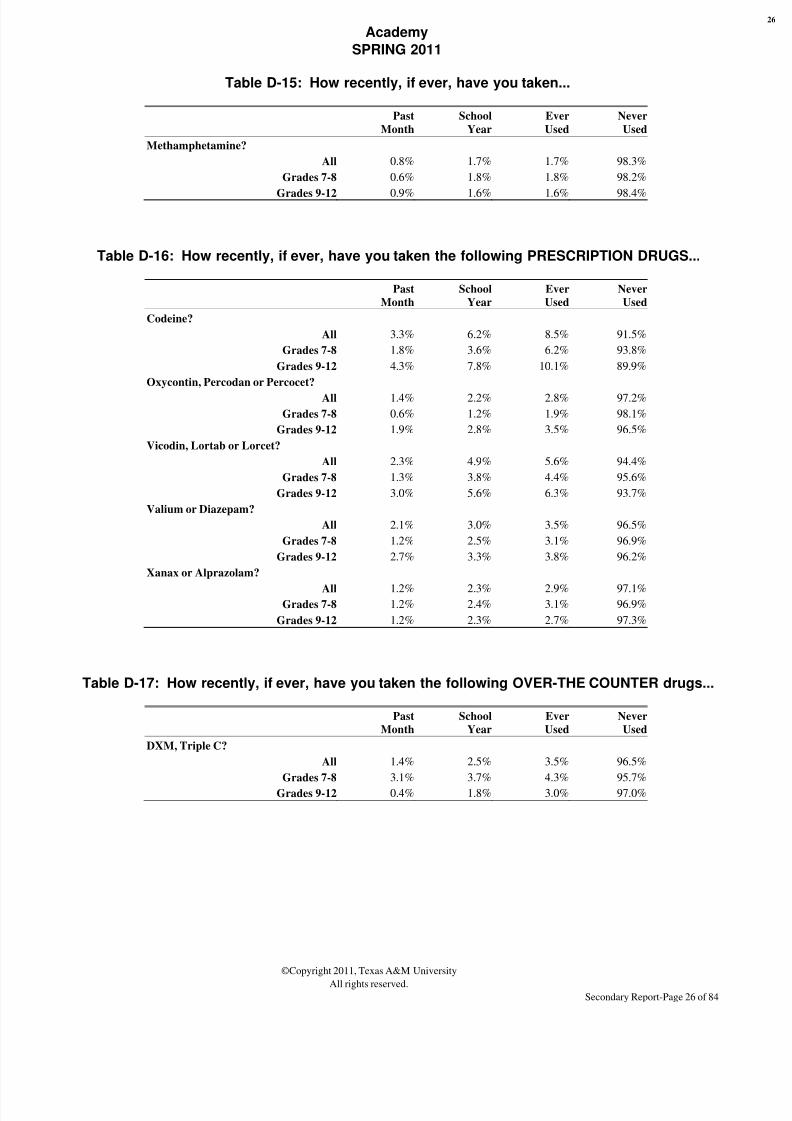
8/3/2019 BELL COUNTY - Academy ISD - 2011 Texas School Survey of Drug and Alcohol Use
http://slidepdf.com/reader/full/bell-county-academy-isd-2011-texas-school-survey-of-drug-and-alcohol-use 68/209
Academy
SPRING 2011
©Copyright 2011, Texas A&M University
All rights reserved.Secondary Report-Page 26 of 84
Table D-15: How recently, if ever, have you taken...
Past
Month
School
Year
Ever
Used
Never
Used
Methamphetamine?
All 0.8% 1.7% 1.7% 98.3%
Grades 7-8 0.6% 1.8% 1.8% 98.2%
Grades 9-12 0.9% 1.6% 1.6% 98.4%
Table D-16: How recently, if ever, have you taken the following PRESCRIPTION DRUGS...
Past
Month
School
Year
Ever
Used
Never
Used
Codeine?
All 3.3% 6.2% 8.5% 91.5%
Grades 7-8 1.8% 3.6% 6.2% 93.8%
Grades 9-12 4.3% 7.8% 10.1% 89.9%
Oxycontin, Percodan or Percocet?
All 1.4% 2.2% 2.8% 97.2%
Grades 7-8 0.6% 1.2% 1.9% 98.1%
Grades 9-12 1.9% 2.8% 3.5% 96.5%
Vicodin, Lortab or Lorcet?
All 2.3% 4.9% 5.6% 94.4%
Grades 7-8 1.3% 3.8% 4.4% 95.6%
Grades 9-12 3.0% 5.6% 6.3% 93.7%
Valium or Diazepam?
All 2.1% 3.0% 3.5% 96.5%
Grades 7-8 1.2% 2.5% 3.1% 96.9%
Grades 9-12 2.7% 3.3% 3.8% 96.2%
Xanax or Alprazolam?
All 1.2% 2.3% 2.9% 97.1%Grades 7-8 1.2% 2.4% 3.1% 96.9%
Grades 9-12 1.2% 2.3% 2.7% 97.3%
Table D-17: How recently, if ever, have you taken the following OVER-THE COUNTER drugs...
Past
Month
School
Year
Ever
Used
Never
Used
DXM, Triple C?
All 1.4% 2.5% 3.5% 96.5%
Grades 7-8 3.1% 3.7% 4.3% 95.7%
Grades 9-12 0.4% 1.8% 3.0% 97.0%
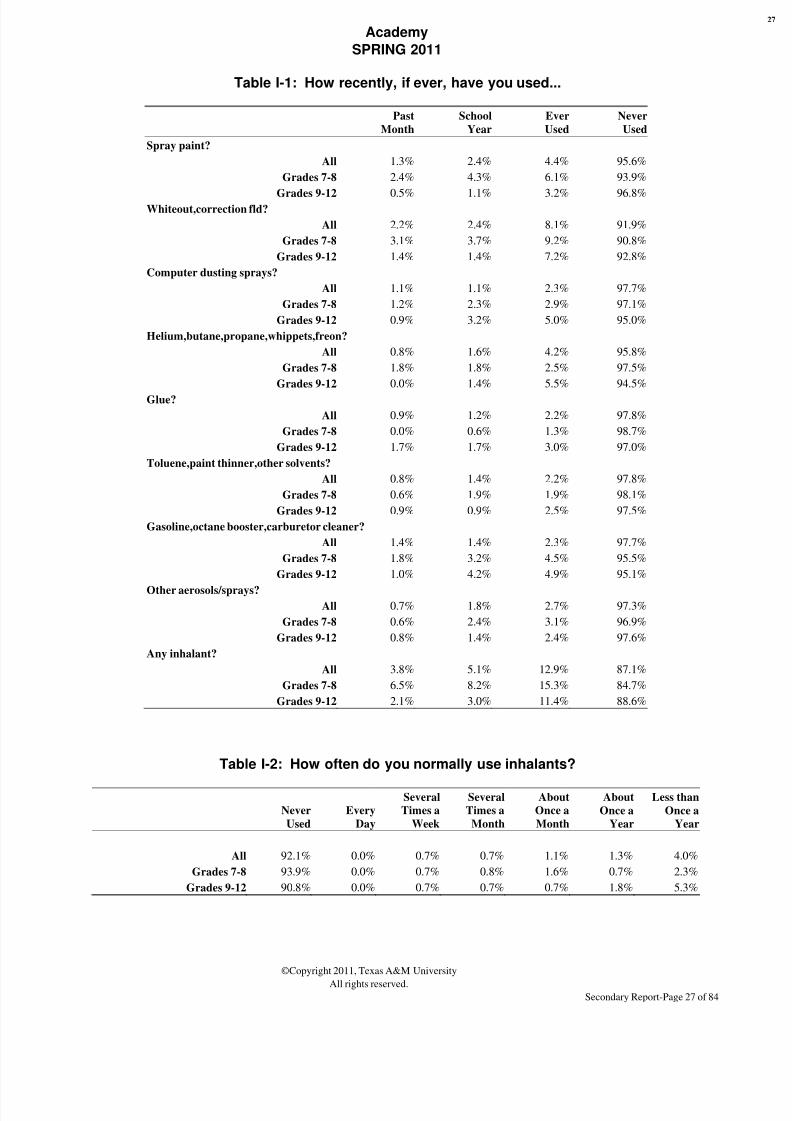
8/3/2019 BELL COUNTY - Academy ISD - 2011 Texas School Survey of Drug and Alcohol Use
http://slidepdf.com/reader/full/bell-county-academy-isd-2011-texas-school-survey-of-drug-and-alcohol-use 69/209
Academy
SPRING 2011
©Copyright 2011, Texas A&M University
All rights reserved.Secondary Report-Page 27 of 84
Table I-1: How recently, if ever, have you used...
Past
Month
School
Year
Ever
Used
Never
Used
Spray paint?
All 1.3% 2.4% 4.4% 95.6%
Grades 7-8 2.4% 4.3% 6.1% 93.9%
Grades 9-12 0.5% 1.1% 3.2% 96.8%Whiteout,correction fld?
All 2.2% 2.4% 8.1% 91.9%
Grades 7-8 3.1% 3.7% 9.2% 90.8%
Grades 9-12 1.4% 1.4% 7.2% 92.8%
Computer dusting sprays?
All 1.1% 1.1% 2.3% 97.7%
Grades 7-8 1.2% 2.3% 2.9% 97.1%
Grades 9-12 0.9% 3.2% 5.0% 95.0%
Helium,butane,propane,whippets,freon?
All 0.8% 1.6% 4.2% 95.8%
Grades 7-8 1.8% 1.8% 2.5% 97.5%
Grades 9-12 0.0% 1.4% 5.5% 94.5%
Glue?
All 0.9% 1.2% 2.2% 97.8%
Grades 7-8 0.0% 0.6% 1.3% 98.7%
Grades 9-12 1.7% 1.7% 3.0% 97.0%
Toluene,paint thinner,other solvents?
All 0.8% 1.4% 2.2% 97.8%
Grades 7-8 0.6% 1.9% 1.9% 98.1%
Grades 9-12 0.9% 0.9% 2.5% 97.5%
Gasoline,octane booster,carburetor cleaner?
All 1.4% 1.4% 2.3% 97.7%
Grades 7-8 1.8% 3.2% 4.5% 95.5%
Grades 9-12 1.0% 4.2% 4.9% 95.1%
Other aerosols/sprays?All 0.7% 1.8% 2.7% 97.3%
Grades 7-8 0.6% 2.4% 3.1% 96.9%
Grades 9-12 0.8% 1.4% 2.4% 97.6%
Any inhalant?
All 3.8% 5.1% 12.9% 87.1%
Grades 7-8 6.5% 8.2% 15.3% 84.7%
Grades 9-12 2.1% 3.0% 11.4% 88.6%
Table I-2: How often do you normally use inhalants?
Never
Used
Every
Day
Several
Times a
Week
Several
Times a
Month
About
Once a
Month
About
Once a
Year
Less than
Once a
Year
All 92.1% 0.0% 0.7% 0.7% 1.1% 1.3% 4.0%
Grades 7-8 93.9% 0.0% 0.7% 0.8% 1.6% 0.7% 2.3%
Grades 9-12 90.8% 0.0% 0.7% 0.7% 0.7% 1.8% 5.3%
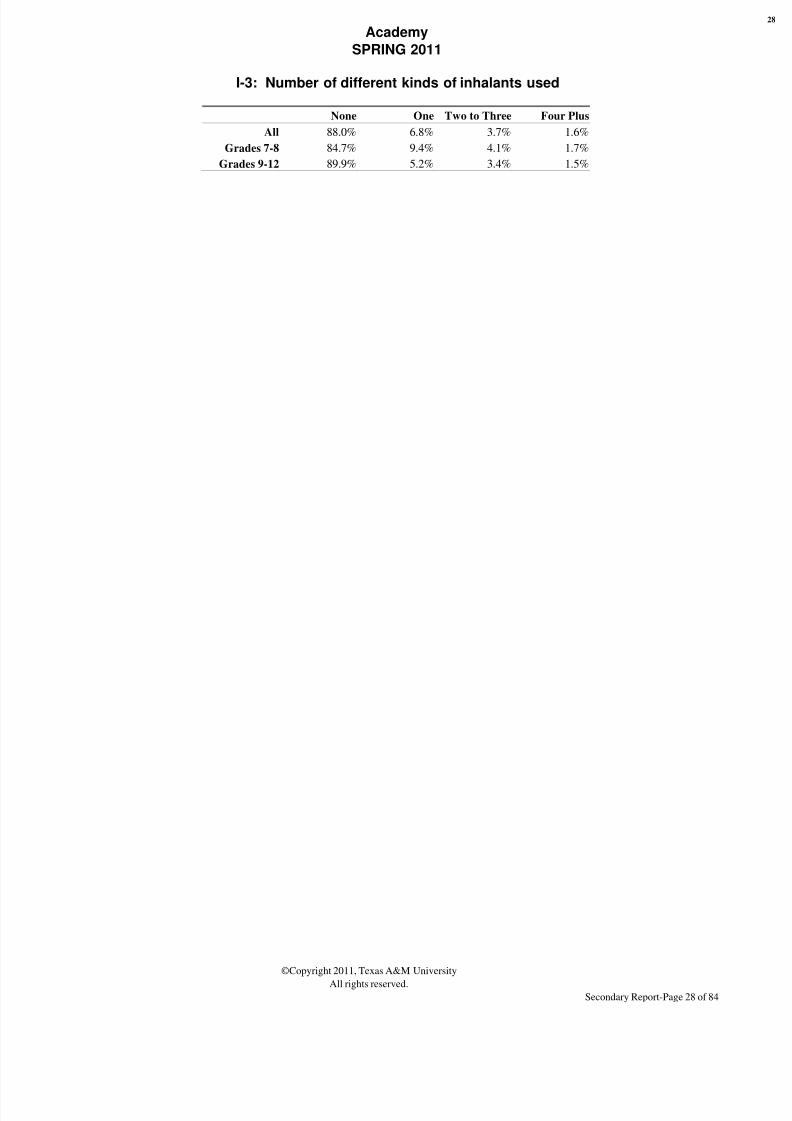
8/3/2019 BELL COUNTY - Academy ISD - 2011 Texas School Survey of Drug and Alcohol Use
http://slidepdf.com/reader/full/bell-county-academy-isd-2011-texas-school-survey-of-drug-and-alcohol-use 70/209
Academy
SPRING 2011
©Copyright 2011, Texas A&M University
All rights reserved.Secondary Report-Page 28 of 84
I-3: Number of different kinds of inhalants used
None One Two to Three Four Plus
All 88.0% 6.8% 3.7% 1.6%
Grades 7-8 84.7% 9.4% 4.1% 1.7%
Grades 9-12 89.9% 5.2% 3.4% 1.5%

8/3/2019 BELL COUNTY - Academy ISD - 2011 Texas School Survey of Drug and Alcohol Use
http://slidepdf.com/reader/full/bell-county-academy-isd-2011-texas-school-survey-of-drug-and-alcohol-use 71/209
Academy
SPRING 2011
©Copyright 2011, Texas A&M University
All rights reserved.Secondary Report-Page 29 of 84
Table I-4: Average age of first use of:
grade1 grade2
Inhalants
11.0 13.6
Table I-5: Since school began in the fall, on how many days (if any) have youattended class while high from inhalant use?
None 1-3 Times 4-9 Times 10+ Times
All 96.9% 2.4% 0.3% 0.3%
Grades 7-8 98.1% 1.3% 0.6% 0.0%
Grades 9-12 95.9% 3.4% 0.0% 0.6%

8/3/2019 BELL COUNTY - Academy ISD - 2011 Texas School Survey of Drug and Alcohol Use
http://slidepdf.com/reader/full/bell-county-academy-isd-2011-texas-school-survey-of-drug-and-alcohol-use 72/209
Academy
SPRING 2011
©Copyright 2011, Texas A&M University
All rights reserved.Secondary Report-Page 30 of 84
Table I-6: School year use of inhalants by absences and conduct problems:
Average days absent due to
illness or other reasons
Inhalants Users: 4.7
Inhalants Non-use 3.7
Average days conduct problems
reported
Inhalants Users: 5.8
Inhalants Non-use 0.8
Table I-7: About how many of your close friends use inhalants?
None A Few Some Most ALL
All 78.7% 14.2% 4.8% 1.7% 0.7%
Grades 7-8 82.8% 11.6% 3.6% 1.9% 0.0%
Grades 9-12 76.1% 15.8% 5.5% 1.6% 1.1%
Table I-8: How dangerous do you think it is for kids your age to use inhalants?
Very
Dangerous
Somewhat
Dangerous
Not very
Dangerous
Not at All
Dangerous Do Not Know
All 74.7% 13.8% 5.2% 1.2% 5.2%
Grades 7-8 80.5% 13.4% 3.4% 0.7% 2.0%
Grades 9-12 70.9% 14.1% 6.3% 1.5% 7.2%

8/3/2019 BELL COUNTY - Academy ISD - 2011 Texas School Survey of Drug and Alcohol Use
http://slidepdf.com/reader/full/bell-county-academy-isd-2011-texas-school-survey-of-drug-and-alcohol-use 73/209
Academy
SPRING 2011
©Copyright 2011, Texas A&M University
All rights reserved.Secondary Report-Page 31 of 84
Table I-9: If you wanted some, how difficult would it be to get..
Never
Heard Of Impossible
Very
Difficult
Somewhat
Difficult
Somewhat
Easy Very Easy
Inhalants?
All 17.4% 30.9% 6.6% 7.4% 10.1% 27.6%
Grades 7-8 13.0% 40.9% 4.4% 6.2% 8.0% 27.6%
Grades 9-12 20.2% 24.5% 8.0% 8.3% 11.5% 27.5%
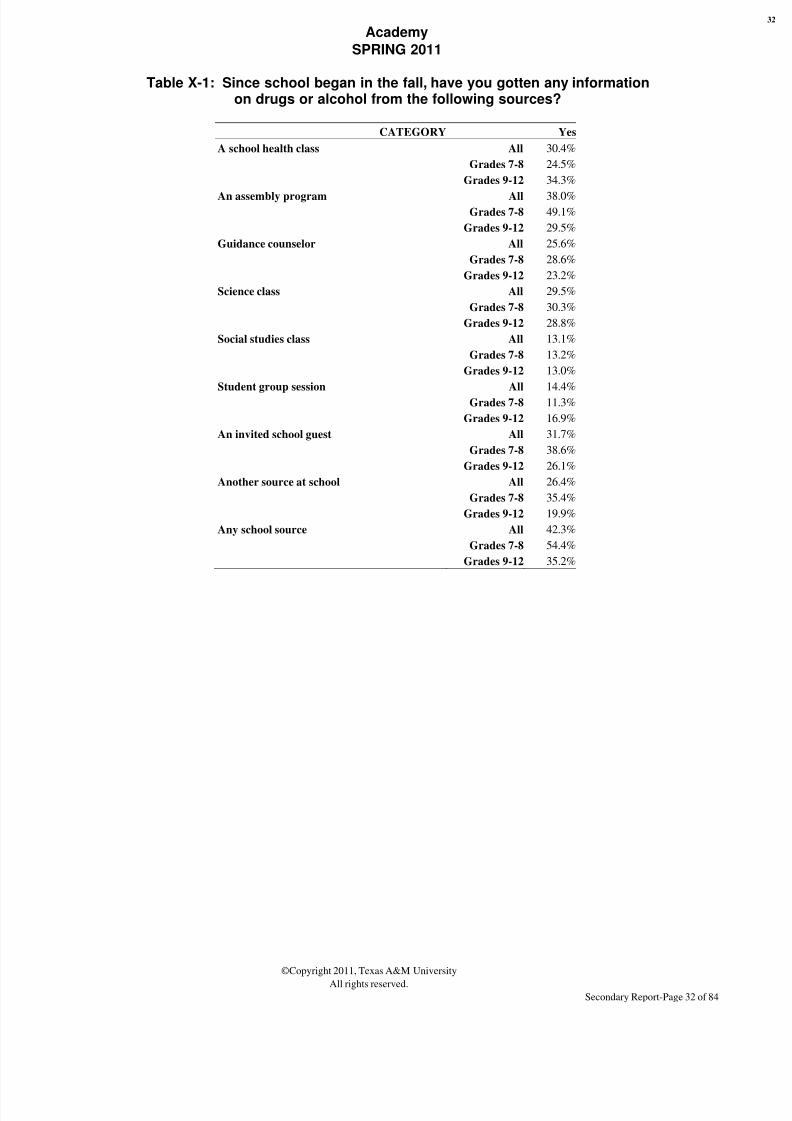
8/3/2019 BELL COUNTY - Academy ISD - 2011 Texas School Survey of Drug and Alcohol Use
http://slidepdf.com/reader/full/bell-county-academy-isd-2011-texas-school-survey-of-drug-and-alcohol-use 74/209
Academy
SPRING 2011
©Copyright 2011, Texas A&M University
All rights reserved.Secondary Report-Page 32 of 84
Table X-1: Since school began in the fall, have you gotten any informationon drugs or alcohol from the following sources?
CATEGORY Yes
A school health class All 30.4%
Grades 7-8 24.5%
Grades 9-12 34.3%
An assembly program All 38.0%Grades 7-8 49.1%
Grades 9-12 29.5%
Guidance counselor All 25.6%
Grades 7-8 28.6%
Grades 9-12 23.2%
Science class All 29.5%
Grades 7-8 30.3%
Grades 9-12 28.8%
Social studies class All 13.1%
Grades 7-8 13.2%
Grades 9-12 13.0%
Student group session All 14.4%
Grades 7-8 11.3%
Grades 9-12 16.9%
An invited school guest All 31.7%
Grades 7-8 38.6%
Grades 9-12 26.1%
Another source at school All 26.4%
Grades 7-8 35.4%
Grades 9-12 19.9%
Any school source All 42.3%
Grades 7-8 54.4%
Grades 9-12 35.2%

8/3/2019 BELL COUNTY - Academy ISD - 2011 Texas School Survey of Drug and Alcohol Use
http://slidepdf.com/reader/full/bell-county-academy-isd-2011-texas-school-survey-of-drug-and-alcohol-use 75/209
Academy
SPRING 2011
©Copyright 2011, Texas A&M University
All rights reserved.Secondary Report-Page 33 of 84
Table X-2: If you had a drug or alcohol problem and needed help, who would you go to?
CATEGORY Yes
Counselor/program in-school All 42.9%
Grades 7-8 45.1%
Grades 9-12 41.2%
Another adult in school All 43.6%
Grades 7-8 41.0%Grades 9-12 45.6%
Counselor/program outside-school All 44.2%
Grades 7-8 43.9%
Grades 9-12 44.5%
Your parents All 75.7%
Grades 7-8 85.5%
Grades 9-12 67.6%
A medical doctor All 53.1%
Grades 7-8 60.4%
Grades 9-12 47.0%
Your friends All 66.9%
Grades 7-8 64.6%
Grades 9-12 68.8%
Another adult All 67.6%
Grades 7-8 70.4%
Grades 9-12 65.3%
Table X-3: Since school began in the fall, have you sought help, other thanfrom family or friends, for problems in any way connected with your use of
alcohol, marijuana, or other drugs?
CATEGORY Yes
Seek Help All 4.4%
Grades 7-8 3.9%
Grades 9-12 4.8%

8/3/2019 BELL COUNTY - Academy ISD - 2011 Texas School Survey of Drug and Alcohol Use
http://slidepdf.com/reader/full/bell-county-academy-isd-2011-texas-school-survey-of-drug-and-alcohol-use 76/209
Academy
SPRING 2011
©Copyright 2011, Texas A&M University
All rights reserved.Secondary Report-Page 34 of 84
Table X-4: About how many of your friends:
None A Few Some Most ALL
Feel close to their parents?
All 3.8% 17.8% 18.3% 47.1% 12.9%
Grades 7-8 6.0% 13.1% 10.0% 57.3% 13.6%
Grades 9-12 2.2% 21.1% 24.2% 40.0% 12.5%
Sometimes carry weapons?All 57.4% 20.3% 11.0% 9.2% 2.2%
Grades 7-8 74.4% 15.8% 8.6% 1.2% 0.0%
Grades 9-12 45.9% 23.3% 12.6% 14.5% 3.7%
Care about making good grades?
All 1.8% 11.4% 16.0% 51.3% 19.6%
Grades 7-8 1.9% 6.8% 14.0% 50.7% 26.6%
Grades 9-12 1.7% 14.5% 17.3% 51.6% 14.9%
Belong/want to belong to a gang?
All 86.4% 10.1% 0.8% 1.5% 1.2%
Grades 7-8 87.3% 9.7% 1.2% 0.6% 1.2%
Grades 9-12 85.7% 10.4% 0.5% 2.1% 1.3%
Wish they could drop out of school?
All 67.4% 21.0% 5.3% 2.5% 3.8%
Grades 7-8 71.0% 22.5% 3.5% 0.6% 2.4%
Grades 9-12 64.7% 20.0% 6.6% 3.8% 4.9%

8/3/2019 BELL COUNTY - Academy ISD - 2011 Texas School Survey of Drug and Alcohol Use
http://slidepdf.com/reader/full/bell-county-academy-isd-2011-texas-school-survey-of-drug-and-alcohol-use 77/209
Academy
SPRING 2011
©Copyright 2011, Texas A&M University
All rights reserved.Secondary Report-Page 35 of 84
Table X-5: How safe do you feel when you are:
Very Safe
Somewhat
Safe
Not Very
Safe
Not Safe at
All
Don't
Know
In your home?
All 85.4% 11.9% 0.8% 0.7% 1.1%
Grades 7-8 84.8% 12.3% 1.2% 0.6% 1.2%
Grades 9-12 86.0% 11.6% 0.5% 0.8% 1.1%Out in your neighborhood?
All 54.7% 37.9% 4.8% 0.7% 1.9%
Grades 7-8 47.3% 44.3% 6.5% 0.0% 1.8%
Grades 9-12 60.4% 32.9% 3.5% 1.3% 1.9%
At school?
All 65.0% 25.7% 2.8% 4.4% 2.2%
Grades 7-8 70.7% 21.5% 2.4% 3.0% 2.4%
Grades 9-12 60.5% 29.0% 3.0% 5.5% 2.0%

8/3/2019 BELL COUNTY - Academy ISD - 2011 Texas School Survey of Drug and Alcohol Use
http://slidepdf.com/reader/full/bell-county-academy-isd-2011-texas-school-survey-of-drug-and-alcohol-use 78/209
Academy
SPRING 2011
©Copyright 2011, Texas A&M University
All rights reserved.Secondary Report-Page 36 of 84

8/3/2019 BELL COUNTY - Academy ISD - 2011 Texas School Survey of Drug and Alcohol Use
http://slidepdf.com/reader/full/bell-county-academy-isd-2011-texas-school-survey-of-drug-and-alcohol-use 79/209
Academy
SPRING 2011
©Copyright 2011, Texas A&M University
All rights reserved.Secondary Report-Page 37 of 84
2. Prevalence Tables

8/3/2019 BELL COUNTY - Academy ISD - 2011 Texas School Survey of Drug and Alcohol Use
http://slidepdf.com/reader/full/bell-county-academy-isd-2011-texas-school-survey-of-drug-and-alcohol-use 80/209

8/3/2019 BELL COUNTY - Academy ISD - 2011 Texas School Survey of Drug and Alcohol Use
http://slidepdf.com/reader/full/bell-county-academy-isd-2011-texas-school-survey-of-drug-and-alcohol-use 81/209
Academy
SPRING 2011
©Copyright 2011, Texas A&M University
All rights reserved.Secondary Report-Page 39 of 84
Table B1: Prevalence and recency of use of selected substances by gradeAll students
Past
Month
School
Year
Ever
Used
Never
Used
Tobacco
All 13.3% 15.5% 23.1% 76.9%
Grades 7-8 4.8% 6.0% 10.7% 89.3%Grades 9-12 19.4% 22.3% 32.0% 68.0%
Alcohol
All 23.8% 36.9% 54.3% 45.7%
Grades 7-8 13.1% 23.4% 42.5% 57.5%
Grades 9-12 31.2% 46.2% 62.5% 37.5%
Inhalants
All 3.8% 5.1% 12.9% 87.1%
Grades 7-8 6.5% 8.2% 15.3% 84.7%
Grades 9-12 2.1% 3.0% 11.4% 88.6%
Any Illicit Drug
All 7.6% 11.3% 14.1% 85.9%
Grades 7-8 4.6% 6.4% 7.0% 93.0%
Grades 9-12 9.4% 14.3% 18.4% 81.6%
Marijuana
All 8.0% 11.4% 15.2% 84.8%
Grades 7-8 4.2% 5.5% 6.1% 93.9%
Grades 9-12 10.8% 15.6% 21.7% 78.3%
Marijuana Only
All 3.3% 4.9% 7.7% 92.3%
Grades 7-8 1.7% 1.7% 2.3% 97.7%
Grades 9-12 4.3% 6.8% 10.9% 89.1%
Cocaine or Crack
All 0.5% 1.1% 1.9% 98.1%
Grades 7-8 0.0% 0.6% 1.9% 98.1%
Grades 9-12 0.9% 1.4% 2.0% 98.0%Cocaine
All 0.5% 0.8% 1.1% 98.9%
Grades 7-8 0.0% 0.0% 0.0% 100.0%
Grades 9-12 0.9% 1.4% 2.0% 98.0%
Crack
All 0.0% 0.3% 1.2% 98.8%
Grades 7-8 0.0% 0.6% 1.9% 98.1%
Grades 9-12 0.0% 0.0% 0.7% 99.3%
Hallucinogens
All 1.4% 1.9% 2.6% 97.4%
Grades 7-8 1.2% 2.5% 3.1% 96.9%
Grades 9-12 1.5% 1.5% 2.1% 97.9%Uppers
All 2.2% 2.2% 2.9% 97.1%
Grades 7-8 0.6% 0.6% 1.3% 98.7%
Grades 9-12 3.6% 3.6% 4.3% 95.7%
Downers
All 1.6% 1.6% 1.9% 98.1%
Grades 7-8 1.3% 1.3% 1.3% 98.7%
Grades 9-12 1.8% 1.8% 2.5% 97.5%
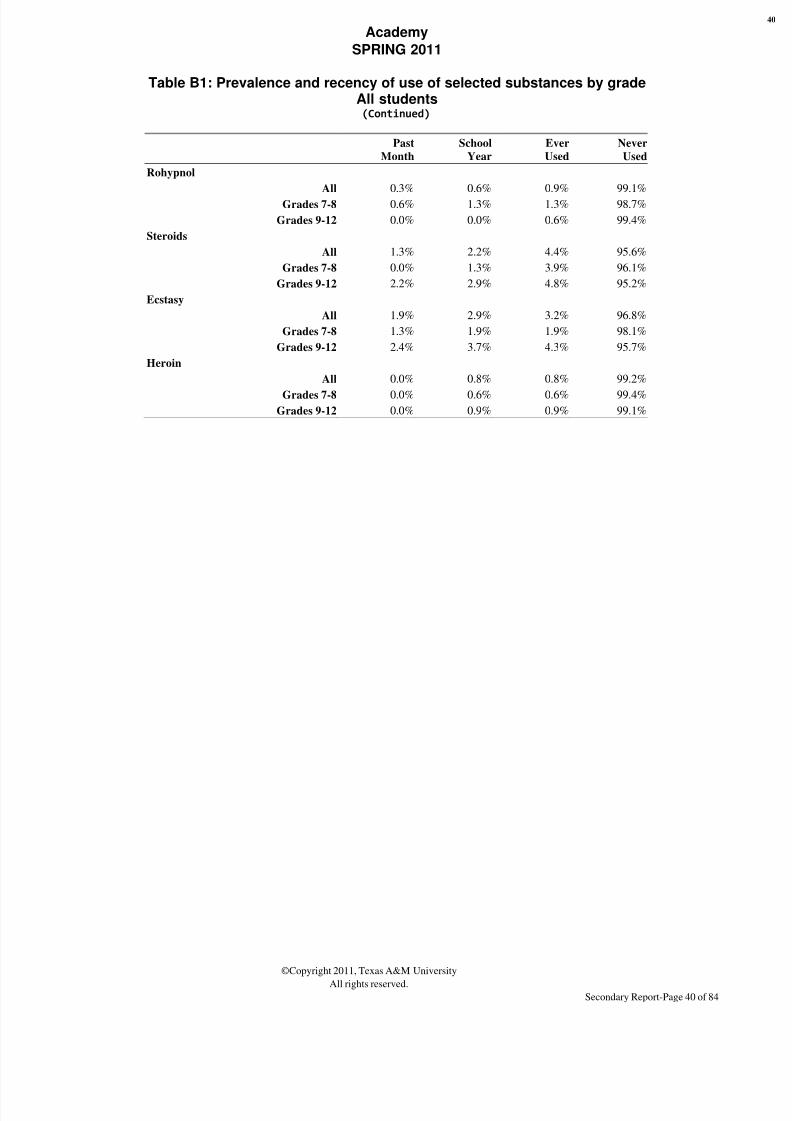
8/3/2019 BELL COUNTY - Academy ISD - 2011 Texas School Survey of Drug and Alcohol Use
http://slidepdf.com/reader/full/bell-county-academy-isd-2011-texas-school-survey-of-drug-and-alcohol-use 82/209
Academy
SPRING 2011
©Copyright 2011, Texas A&M University
All rights reserved.Secondary Report-Page 40 of 84
Table B1: Prevalence and recency of use of selected substances by gradeAll students(Continued)
Past
Month
School
Year
Ever
Used
Never
Used
Rohypnol
All 0.3% 0.6% 0.9% 99.1%
Grades 7-8 0.6% 1.3% 1.3% 98.7%
Grades 9-12 0.0% 0.0% 0.6% 99.4%
Steroids
All 1.3% 2.2% 4.4% 95.6%
Grades 7-8 0.0% 1.3% 3.9% 96.1%
Grades 9-12 2.2% 2.9% 4.8% 95.2%
Ecstasy
All 1.9% 2.9% 3.2% 96.8%
Grades 7-8 1.3% 1.9% 1.9% 98.1%
Grades 9-12 2.4% 3.7% 4.3% 95.7%
Heroin
All 0.0% 0.8% 0.8% 99.2%
Grades 7-8 0.0% 0.6% 0.6% 99.4%
Grades 9-12 0.0% 0.9% 0.9% 99.1%

8/3/2019 BELL COUNTY - Academy ISD - 2011 Texas School Survey of Drug and Alcohol Use
http://slidepdf.com/reader/full/bell-county-academy-isd-2011-texas-school-survey-of-drug-and-alcohol-use 83/209
Academy
SPRING 2011
©Copyright 2011, Texas A&M University
All rights reserved.Secondary Report-Page 41 of 84
Table B2: Prevalence and recency of use of selected substances by gradeMale students
Past
Month
School
Year
Ever
Used
Never
Used
Tobacco
All 16.0% 19.0% 26.6% 73.4%
Grades 7-8 4.1% 5.1% 10.3% 89.7%Grades 9-12 25.5% 29.9% 39.5% 60.5%
Alcohol
All 27.0% 40.9% 58.4% 41.6%
Grades 7-8 12.4% 23.0% 41.7% 58.3%
Grades 9-12 38.0% 54.4% 70.9% 29.1%
Inhalants
All 4.2% 6.0% 13.4% 86.6%
Grades 7-8 7.3% 10.3% 17.6% 82.4%
Grades 9-12 1.9% 2.8% 10.3% 89.7%
Any Illicit Drug
All 7.7% 11.5% 15.1% 84.9%
Grades 7-8 4.0% 5.1% 6.1% 93.9%
Grades 9-12 10.3% 15.9% 21.3% 78.7%
Marijuana
All 8.2% 11.0% 16.1% 83.9%
Grades 7-8 4.2% 5.3% 6.4% 93.6%
Grades 9-12 11.5% 15.7% 23.9% 76.1%
Marijuana Only
All 3.8% 4.8% 8.4% 91.6%
Grades 7-8 2.0% 2.0% 3.1% 96.9%
Grades 9-12 5.0% 6.6% 11.9% 88.1%
Cocaine or Crack
All 0.9% 1.5% 2.6% 97.4%
Grades 7-8 0.0% 0.0% 1.1% 98.9%
Grades 9-12 1.7% 2.7% 3.8% 96.2%Cocaine
All 0.9% 1.5% 2.1% 97.9%
Grades 7-8 0.0% 0.0% 0.0% 100.0%
Grades 9-12 1.7% 2.8% 3.9% 96.1%
Crack
All 0.0% 0.0% 1.2% 98.8%
Grades 7-8 0.0% 0.0% 1.1% 98.9%
Grades 9-12 0.0% 0.0% 1.3% 98.7%
Hallucinogens
All 1.1% 1.1% 1.8% 98.2%
Grades 7-8 1.1% 1.1% 1.1% 98.9%
Grades 9-12 1.2% 1.2% 2.4% 97.6%Uppers
All 1.6% 1.6% 2.2% 97.8%
Grades 7-8 1.1% 1.1% 1.1% 98.9%
Grades 9-12 2.0% 2.0% 3.4% 96.6%
Downers
All 1.1% 1.1% 1.8% 98.2%
Grades 7-8 2.3% 2.3% 2.3% 97.7%
Grades 9-12 0.0% 0.0% 1.3% 98.7%

8/3/2019 BELL COUNTY - Academy ISD - 2011 Texas School Survey of Drug and Alcohol Use
http://slidepdf.com/reader/full/bell-county-academy-isd-2011-texas-school-survey-of-drug-and-alcohol-use 84/209
Academy
SPRING 2011
©Copyright 2011, Texas A&M University
All rights reserved.Secondary Report-Page 42 of 84
Table B2: Prevalence and recency of use of selected substances by gradeMale students(Continued)
Past
Month
School
Year
Ever
Used
Never
Used
Rohypnol
All 0.5% 0.5% 0.5% 99.5%
Grades 7-8 1.1% 1.1% 1.1% 98.9%
Grades 9-12 0.0% 0.0% 0.0% 100.0%
Steroids
All 1.6% 3.3% 5.9% 94.1%
Grades 7-8 0.0% 2.2% 5.6% 94.4%
Grades 9-12 3.1% 4.3% 6.2% 93.8%
Ecstasy
All 2.2% 3.4% 3.4% 96.6%
Grades 7-8 1.1% 1.1% 1.1% 98.9%
Grades 9-12 3.1% 5.6% 5.6% 94.4%
Heroin
All 0.0% 0.9% 0.9% 99.1%
Grades 7-8 0.0% 0.0% 0.0% 100.0%
Grades 9-12 0.0% 1.8% 1.8% 98.2%

8/3/2019 BELL COUNTY - Academy ISD - 2011 Texas School Survey of Drug and Alcohol Use
http://slidepdf.com/reader/full/bell-county-academy-isd-2011-texas-school-survey-of-drug-and-alcohol-use 85/209
Academy
SPRING 2011
©Copyright 2011, Texas A&M University
All rights reserved.Secondary Report-Page 43 of 84
Table B3: Prevalence and recency of use of selected substances by gradeFemale students
Past
Month
School
Year
Ever
Used
Never
Used
Tobacco
All 10.1% 11.3% 19.0% 81.0%
Grades 7-8 5.7% 7.2% 11.4% 88.6%Grades 9-12 12.8% 13.9% 23.8% 76.2%
Alcohol
All 20.1% 32.2% 49.7% 50.3%
Grades 7-8 14.1% 24.1% 43.6% 56.4%
Grades 9-12 23.9% 37.4% 53.5% 46.5%
Inhalants
All 3.5% 4.1% 12.6% 87.4%
Grades 7-8 5.4% 5.4% 12.2% 87.8%
Grades 9-12 2.3% 3.3% 12.9% 87.1%
Any Illicit Drug
All 7.6% 11.4% 13.4% 86.6%
Grades 7-8 5.4% 8.1% 8.1% 91.9%
Grades 9-12 8.8% 13.1% 16.1% 83.9%
Marijuana
All 7.9% 11.8% 14.2% 85.8%
Grades 7-8 4.2% 5.7% 5.7% 94.3%
Grades 9-12 10.2% 15.7% 19.6% 80.4%
Marijuana Only
All 2.9% 5.1% 7.1% 92.9%
Grades 7-8 1.3% 1.3% 1.3% 98.7%
Grades 9-12 3.8% 7.2% 10.2% 89.8%
Cocaine or Crack
All 0.0% 0.6% 1.2% 98.8%
Grades 7-8 0.0% 1.4% 2.9% 97.1%
Grades 9-12 0.0% 0.0% 0.0% 100.0%Cocaine
All 0.0% 0.0% 0.0% 100.0%
Grades 7-8 0.0% 0.0% 0.0% 100.0%
Grades 9-12 0.0% 0.0% 0.0% 100.0%
Crack
All 0.0% 0.6% 1.3% 98.7%
Grades 7-8 0.0% 1.5% 2.9% 97.1%
Grades 9-12 0.0% 0.0% 0.0% 100.0%
Hallucinogens
All 1.6% 2.9% 3.5% 96.5%
Grades 7-8 1.4% 4.5% 5.9% 94.1%
Grades 9-12 1.8% 1.8% 1.8% 98.2%Uppers
All 2.9% 2.9% 3.6% 96.4%
Grades 7-8 0.0% 0.0% 1.5% 98.5%
Grades 9-12 5.3% 5.3% 5.3% 94.7%
Downers
All 2.2% 2.2% 2.2% 97.8%
Grades 7-8 0.0% 0.0% 0.0% 100.0%
Grades 9-12 3.7% 3.7% 3.7% 96.3%

8/3/2019 BELL COUNTY - Academy ISD - 2011 Texas School Survey of Drug and Alcohol Use
http://slidepdf.com/reader/full/bell-county-academy-isd-2011-texas-school-survey-of-drug-and-alcohol-use 86/209
Academy
SPRING 2011
©Copyright 2011, Texas A&M University
All rights reserved.Secondary Report-Page 44 of 84
Table B3: Prevalence and recency of use of selected substances by gradeFemale students
(Continued)
Past
Month
School
Year
Ever
Used
Never
Used
Rohypnol
All 0.0% 0.7% 1.4% 98.6%
Grades 7-8 0.0% 1.5% 1.5% 98.5%
Grades 9-12 0.0% 0.0% 1.3% 98.7%
Steroids
All 0.0% 0.0% 1.9% 98.1%
Grades 7-8 0.0% 0.0% 1.5% 98.5%
Grades 9-12 0.0% 0.0% 2.1% 97.9%
Ecstasy
All 1.6% 2.3% 3.0% 97.0%
Grades 7-8 1.5% 3.0% 3.0% 97.0%
Grades 9-12 1.8% 1.8% 3.0% 97.0%
Heroin
All 0.0% 0.6% 0.6% 99.4%
Grades 7-8 0.0% 1.5% 1.5% 98.5%
Grades 9-12 0.0% 0.0% 0.0% 100.0%

8/3/2019 BELL COUNTY - Academy ISD - 2011 Texas School Survey of Drug and Alcohol Use
http://slidepdf.com/reader/full/bell-county-academy-isd-2011-texas-school-survey-of-drug-and-alcohol-use 87/209
Academy
SPRING 2011
©Copyright 2011, Texas A&M University
All rights reserved.Secondary Report-Page 45 of 84
Table B4: Prevalence and recency of use of selected substances by gradeWhite students
Past
Month
School
Year
Ever
Used
Never
Used
Tobacco
All 14.2% 16.9% 23.4% 76.6%
Grades 7-8 4.4% 5.3% 9.7% 90.3%Grades 9-12 20.7% 24.5% 32.3% 67.7%
Alcohol
All 21.8% 32.8% 51.5% 48.5%
Grades 7-8 10.4% 21.8% 41.7% 58.3%
Grades 9-12 29.2% 40.0% 57.8% 42.2%
Inhalants
All 3.2% 3.9% 9.4% 90.6%
Grades 7-8 6.0% 6.8% 12.8% 87.2%
Grades 9-12 1.5% 2.1% 7.4% 92.6%
Any Illicit Drug
All 6.1% 8.5% 11.5% 88.5%
Grades 7-8 4.2% 5.1% 5.9% 94.1%
Grades 9-12 7.1% 10.3% 14.4% 85.6%
Marijuana
All 6.5% 8.0% 12.2% 87.8%
Grades 7-8 3.6% 3.6% 4.5% 95.5%
Grades 9-12 8.4% 10.8% 17.2% 82.8%
Marijuana Only
All 2.9% 3.7% 6.7% 93.3%
Grades 7-8 0.8% 0.8% 1.7% 98.3%
Grades 9-12 4.0% 5.3% 9.4% 90.6%
Cocaine or Crack
All 0.0% 0.4% 0.8% 99.2%
Grades 7-8 0.0% 0.0% 0.9% 99.1%
Grades 9-12 0.0% 0.7% 0.7% 99.3%Cocaine
All 0.0% 0.4% 0.4% 99.6%
Grades 7-8 0.0% 0.0% 0.0% 100.0%
Grades 9-12 0.0% 0.8% 0.8% 99.2%
Crack
All 0.0% 0.0% 0.4% 99.6%
Grades 7-8 0.0% 0.0% 0.9% 99.1%
Grades 9-12 0.0% 0.0% 0.0% 100.0%
Hallucinogens
All 0.8% 1.2% 1.6% 98.4%
Grades 7-8 0.9% 1.8% 2.7% 97.3%
Grades 9-12 0.8% 0.8% 0.8% 99.2%Uppers
All 0.5% 0.5% 1.4% 98.6%
Grades 7-8 0.0% 0.0% 0.9% 99.1%
Grades 9-12 0.9% 0.9% 1.8% 98.2%
Downers
All 0.4% 0.4% 0.9% 99.1%
Grades 7-8 0.9% 0.9% 0.9% 99.1%
Grades 9-12 0.0% 0.0% 0.9% 99.1%

8/3/2019 BELL COUNTY - Academy ISD - 2011 Texas School Survey of Drug and Alcohol Use
http://slidepdf.com/reader/full/bell-county-academy-isd-2011-texas-school-survey-of-drug-and-alcohol-use 88/209
Academy
SPRING 2011
©Copyright 2011, Texas A&M University
All rights reserved.Secondary Report-Page 46 of 84
Table B4: Prevalence and recency of use of selected substances by gradeWhite students
(Continued)
Past
Month
School
Year
Ever
Used
Never
Used
Rohypnol
All 0.0% 0.0% 0.0% 100.0%
Grades 7-8 0.0% 0.0% 0.0% 100.0%
Grades 9-12 0.0% 0.0% 0.0% 100.0%
Steroids
All 1.7% 2.6% 5.3% 94.7%
Grades 7-8 0.0% 0.9% 3.8% 96.2%
Grades 9-12 3.0% 3.9% 6.5% 93.5%
Ecstasy
All 0.9% 1.3% 1.8% 98.2%
Grades 7-8 0.9% 0.9% 0.9% 99.1%
Grades 9-12 0.8% 1.7% 2.5% 97.5%
Heroin
All 0.0% 0.7% 0.7% 99.3%
Grades 7-8 0.0% 0.0% 0.0% 100.0%
Grades 9-12 0.0% 1.2% 1.2% 98.8%

8/3/2019 BELL COUNTY - Academy ISD - 2011 Texas School Survey of Drug and Alcohol Use
http://slidepdf.com/reader/full/bell-county-academy-isd-2011-texas-school-survey-of-drug-and-alcohol-use 89/209
Academy
SPRING 2011
©Copyright 2011, Texas A&M University
All rights reserved.Secondary Report-Page 47 of 84
Table B5: Prevalence and recency of use of selected substances by gradeBlack students
Table skipped because an insufficient number of cases.

8/3/2019 BELL COUNTY - Academy ISD - 2011 Texas School Survey of Drug and Alcohol Use
http://slidepdf.com/reader/full/bell-county-academy-isd-2011-texas-school-survey-of-drug-and-alcohol-use 90/209
Academy
SPRING 2011
©Copyright 2011, Texas A&M University
All rights reserved.Secondary Report-Page 48 of 84
Table B5: Prevalence and recency of use of selected substances by gradeBlack students
(Continued)
Table skipped because an insufficient number of cases.
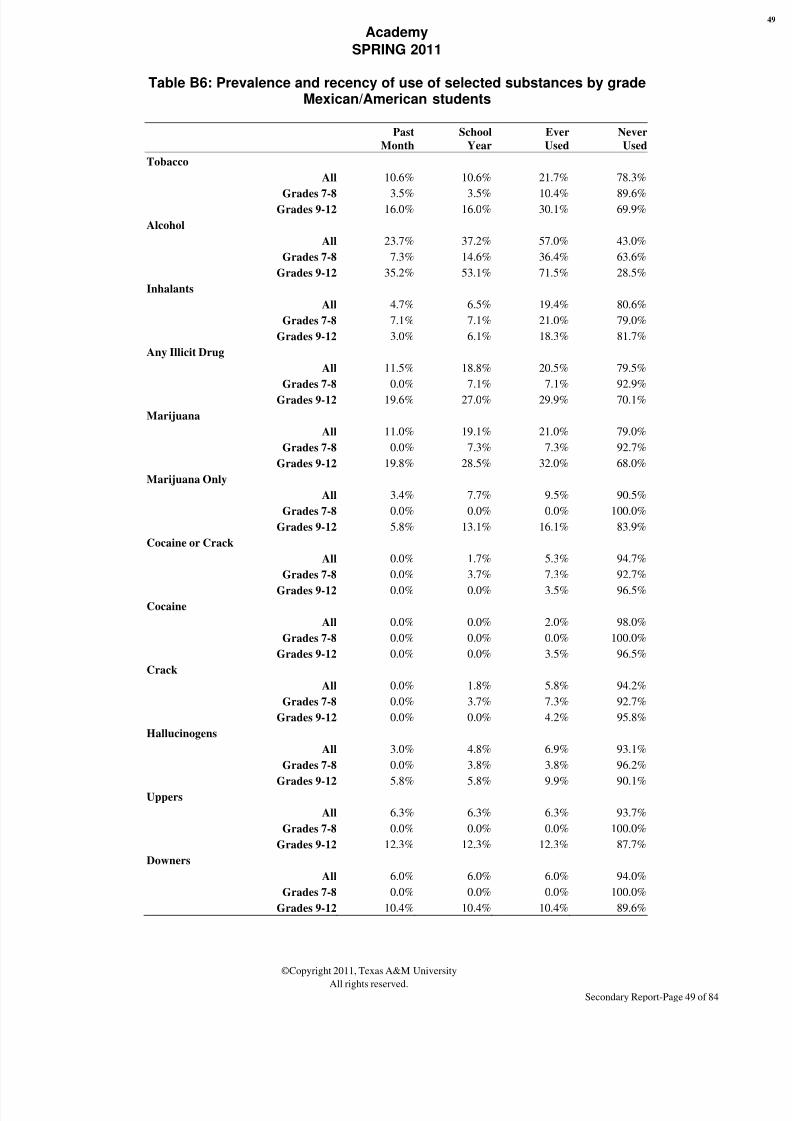
8/3/2019 BELL COUNTY - Academy ISD - 2011 Texas School Survey of Drug and Alcohol Use
http://slidepdf.com/reader/full/bell-county-academy-isd-2011-texas-school-survey-of-drug-and-alcohol-use 91/209
Academy
SPRING 2011
©Copyright 2011, Texas A&M University
All rights reserved.Secondary Report-Page 49 of 84
Table B6: Prevalence and recency of use of selected substances by gradeMexican/American students
Past
Month
School
Year
Ever
Used
Never
Used
Tobacco
All 10.6% 10.6% 21.7% 78.3%
Grades 7-8 3.5% 3.5% 10.4% 89.6%Grades 9-12 16.0% 16.0% 30.1% 69.9%
Alcohol
All 23.7% 37.2% 57.0% 43.0%
Grades 7-8 7.3% 14.6% 36.4% 63.6%
Grades 9-12 35.2% 53.1% 71.5% 28.5%
Inhalants
All 4.7% 6.5% 19.4% 80.6%
Grades 7-8 7.1% 7.1% 21.0% 79.0%
Grades 9-12 3.0% 6.1% 18.3% 81.7%
Any Illicit Drug
All 11.5% 18.8% 20.5% 79.5%
Grades 7-8 0.0% 7.1% 7.1% 92.9%
Grades 9-12 19.6% 27.0% 29.9% 70.1%
Marijuana
All 11.0% 19.1% 21.0% 79.0%
Grades 7-8 0.0% 7.3% 7.3% 92.7%
Grades 9-12 19.8% 28.5% 32.0% 68.0%
Marijuana Only
All 3.4% 7.7% 9.5% 90.5%
Grades 7-8 0.0% 0.0% 0.0% 100.0%
Grades 9-12 5.8% 13.1% 16.1% 83.9%
Cocaine or Crack
All 0.0% 1.7% 5.3% 94.7%
Grades 7-8 0.0% 3.7% 7.3% 92.7%
Grades 9-12 0.0% 0.0% 3.5% 96.5%Cocaine
All 0.0% 0.0% 2.0% 98.0%
Grades 7-8 0.0% 0.0% 0.0% 100.0%
Grades 9-12 0.0% 0.0% 3.5% 96.5%
Crack
All 0.0% 1.8% 5.8% 94.2%
Grades 7-8 0.0% 3.7% 7.3% 92.7%
Grades 9-12 0.0% 0.0% 4.2% 95.8%
Hallucinogens
All 3.0% 4.8% 6.9% 93.1%
Grades 7-8 0.0% 3.8% 3.8% 96.2%
Grades 9-12 5.8% 5.8% 9.9% 90.1%Uppers
All 6.3% 6.3% 6.3% 93.7%
Grades 7-8 0.0% 0.0% 0.0% 100.0%
Grades 9-12 12.3% 12.3% 12.3% 87.7%
Downers
All 6.0% 6.0% 6.0% 94.0%
Grades 7-8 0.0% 0.0% 0.0% 100.0%
Grades 9-12 10.4% 10.4% 10.4% 89.6%

8/3/2019 BELL COUNTY - Academy ISD - 2011 Texas School Survey of Drug and Alcohol Use
http://slidepdf.com/reader/full/bell-county-academy-isd-2011-texas-school-survey-of-drug-and-alcohol-use 92/209
Academy
SPRING 2011
©Copyright 2011, Texas A&M University
All rights reserved.Secondary Report-Page 50 of 84
Table B6: Prevalence and recency of use of selected substances by gradeMexican/American students
(Continued)
Past
Month
School
Year
Ever
Used
Never
Used
Rohypnol
All 0.0% 1.7% 1.7% 98.3%
Grades 7-8 0.0% 3.9% 3.9% 96.1%
Grades 9-12 0.0% 0.0% 0.0% 100.0%
Steroids
All 0.0% 0.0% 0.0% 100.0%
Grades 7-8 0.0% 0.0% 0.0% 100.0%
Grades 9-12 0.0% 0.0% 0.0% 100.0%
Ecstasy
All 2.9% 4.7% 4.7% 95.3%
Grades 7-8 0.0% 4.3% 4.3% 95.7%
Grades 9-12 5.1% 5.1% 5.1% 94.9%
Heroin
All 0.0% 1.8% 1.8% 98.2%
Grades 7-8 0.0% 3.8% 3.8% 96.2%
Grades 9-12 0.0% 0.0% 0.0% 100.0%

8/3/2019 BELL COUNTY - Academy ISD - 2011 Texas School Survey of Drug and Alcohol Use
http://slidepdf.com/reader/full/bell-county-academy-isd-2011-texas-school-survey-of-drug-and-alcohol-use 93/209
Academy
SPRING 2011
©Copyright 2011, Texas A&M University
All rights reserved.Secondary Report-Page 51 of 84
Table B7: Prevalence and recency of use of selected substances by gradeStudents reporting A grades
Past
Month
School
Year
Ever
Used
Never
Used
Tobacco
All 4.8% 5.6% 9.0% 91.0%
Grades 7-8 2.5% 2.5% 3.7% 96.3%Grades 9-12 7.5% 9.2% 15.1% 84.9%
Alcohol
All 6.8% 17.8% 35.9% 64.1%
Grades 7-8 6.2% 13.8% 29.9% 70.1%
Grades 9-12 7.4% 22.3% 42.4% 57.6%
Inhalants
All 2.0% 2.7% 6.8% 93.2%
Grades 7-8 3.8% 3.8% 10.2% 89.8%
Grades 9-12 0.0% 1.6% 3.2% 96.8%
Any Illicit Drug
All 2.0% 3.0% 4.9% 95.1%
Grades 7-8 2.5% 2.5% 2.5% 97.5%
Grades 9-12 1.5% 3.5% 7.2% 92.8%
Marijuana
All 0.7% 1.8% 3.9% 96.1%
Grades 7-8 1.3% 1.3% 1.3% 98.7%
Grades 9-12 0.0% 2.4% 6.9% 93.1%
Marijuana Only
All 0.0% 1.0% 2.9% 97.1%
Grades 7-8 0.0% 0.0% 0.0% 100.0%
Grades 9-12 0.0% 1.9% 5.5% 94.5%
Cocaine or Crack
All 0.0% 0.0% 0.7% 99.3%
Grades 7-8 0.0% 0.0% 1.3% 98.7%
Grades 9-12 0.0% 0.0% 0.0% 100.0%Cocaine
All 0.0% 0.0% 0.0% 100.0%
Grades 7-8 0.0% 0.0% 0.0% 100.0%
Grades 9-12 0.0% 0.0% 0.0% 100.0%
Crack
All 0.0% 0.0% 0.7% 99.3%
Grades 7-8 0.0% 0.0% 1.3% 98.7%
Grades 9-12 0.0% 0.0% 0.0% 100.0%
Hallucinogens
All 0.7% 1.4% 1.4% 98.6%
Grades 7-8 1.3% 2.6% 2.6% 97.4%
Grades 9-12 0.0% 0.0% 0.0% 100.0%Uppers
All 0.0% 0.0% 0.8% 99.2%
Grades 7-8 0.0% 0.0% 1.3% 98.7%
Grades 9-12 0.0% 0.0% 0.0% 100.0%
Downers
All 0.0% 0.0% 0.0% 100.0%
Grades 7-8 0.0% 0.0% 0.0% 100.0%
Grades 9-12 0.0% 0.0% 0.0% 100.0%
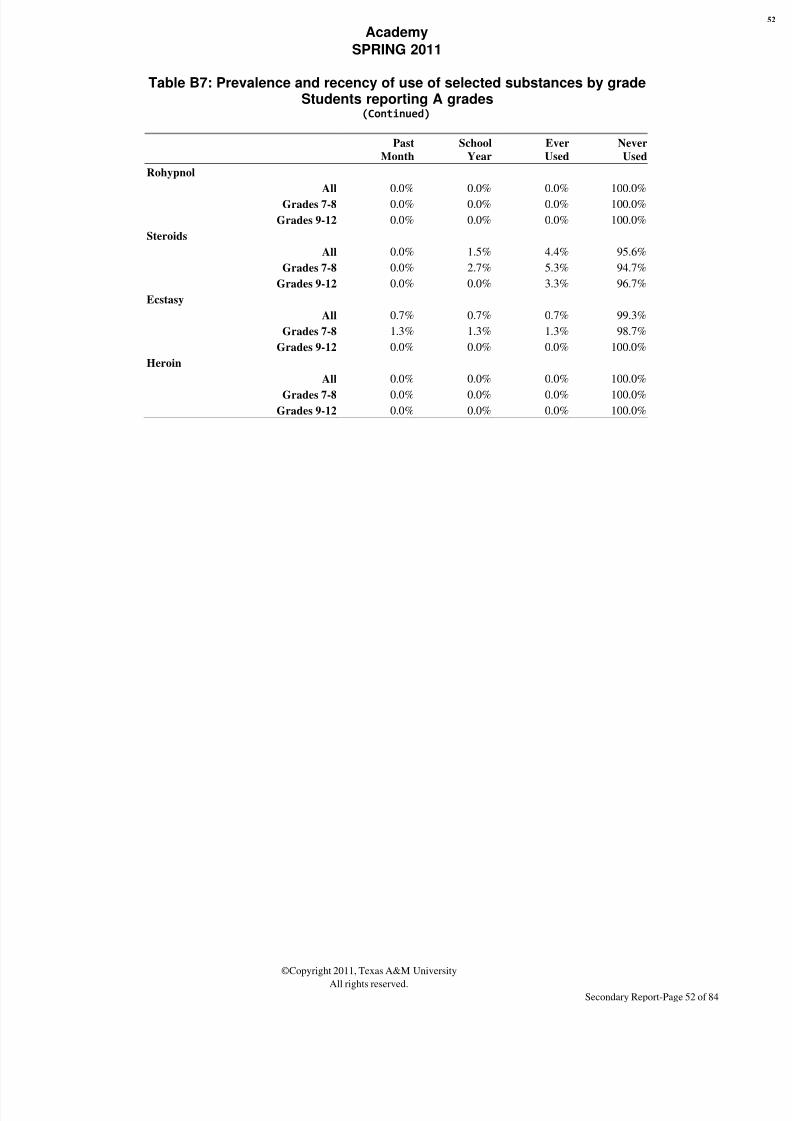
8/3/2019 BELL COUNTY - Academy ISD - 2011 Texas School Survey of Drug and Alcohol Use
http://slidepdf.com/reader/full/bell-county-academy-isd-2011-texas-school-survey-of-drug-and-alcohol-use 94/209
Academy
SPRING 2011
©Copyright 2011, Texas A&M University
All rights reserved.Secondary Report-Page 52 of 84
Table B7: Prevalence and recency of use of selected substances by gradeStudents reporting A grades
(Continued)
Past
Month
School
Year
Ever
Used
Never
Used
Rohypnol
All 0.0% 0.0% 0.0% 100.0%
Grades 7-8 0.0% 0.0% 0.0% 100.0%
Grades 9-12 0.0% 0.0% 0.0% 100.0%
Steroids
All 0.0% 1.5% 4.4% 95.6%
Grades 7-8 0.0% 2.7% 5.3% 94.7%
Grades 9-12 0.0% 0.0% 3.3% 96.7%
Ecstasy
All 0.7% 0.7% 0.7% 99.3%
Grades 7-8 1.3% 1.3% 1.3% 98.7%
Grades 9-12 0.0% 0.0% 0.0% 100.0%
Heroin
All 0.0% 0.0% 0.0% 100.0%
Grades 7-8 0.0% 0.0% 0.0% 100.0%
Grades 9-12 0.0% 0.0% 0.0% 100.0%

8/3/2019 BELL COUNTY - Academy ISD - 2011 Texas School Survey of Drug and Alcohol Use
http://slidepdf.com/reader/full/bell-county-academy-isd-2011-texas-school-survey-of-drug-and-alcohol-use 95/209
Academy
SPRING 2011
©Copyright 2011, Texas A&M University
All rights reserved.Secondary Report-Page 53 of 84
Table B8: Prevalence and recency of use of selected substances by gradeStudents reporting grades lower than A
Past
Month
School
Year
Ever
Used
Never
Used
Tobacco
All 18.3% 21.3% 31.7% 68.3%
Grades 7-8 6.9% 9.2% 17.2% 82.8%Grades 9-12 24.5% 28.0% 39.7% 60.3%
Alcohol
All 34.4% 48.3% 65.6% 34.4%
Grades 7-8 19.4% 32.3% 54.1% 45.9%
Grades 9-12 42.2% 56.7% 71.6% 28.4%
Inhalants
All 5.0% 6.6% 16.4% 83.6%
Grades 7-8 8.9% 12.1% 19.8% 80.2%
Grades 9-12 3.0% 3.7% 14.7% 85.3%
Any Illicit Drug
All 11.1% 16.0% 19.5% 80.5%
Grades 7-8 6.4% 9.8% 11.0% 89.0%
Grades 9-12 13.2% 18.9% 23.5% 76.5%
Marijuana
All 12.8% 17.0% 22.0% 78.0%
Grades 7-8 7.0% 9.4% 10.6% 89.4%
Grades 9-12 16.0% 21.2% 28.3% 71.7%
Marijuana Only
All 5.4% 7.3% 10.8% 89.2%
Grades 7-8 3.2% 3.2% 4.3% 95.7%
Grades 9-12 6.4% 9.3% 13.9% 86.1%
Cocaine or Crack
All 0.8% 1.7% 2.7% 97.3%
Grades 7-8 0.0% 1.2% 2.4% 97.6%
Grades 9-12 1.3% 2.1% 2.9% 97.1%Cocaine
All 0.8% 1.3% 1.9% 98.1%
Grades 7-8 0.0% 0.0% 0.0% 100.0%
Grades 9-12 1.3% 2.1% 2.9% 97.1%
Crack
All 0.0% 0.5% 1.6% 98.4%
Grades 7-8 0.0% 1.2% 2.5% 97.5%
Grades 9-12 0.0% 0.0% 1.0% 99.0%
Hallucinogens
All 1.8% 2.3% 3.3% 96.7%
Grades 7-8 1.2% 2.4% 3.6% 96.4%
Grades 9-12 2.2% 2.2% 3.1% 96.9%Uppers
All 3.7% 3.7% 4.4% 95.6%
Grades 7-8 1.2% 1.2% 1.2% 98.8%
Grades 9-12 5.5% 5.5% 6.5% 93.5%
Downers
All 2.7% 2.7% 3.3% 96.7%
Grades 7-8 2.6% 2.6% 2.6% 97.4%
Grades 9-12 2.8% 2.8% 3.8% 96.2%
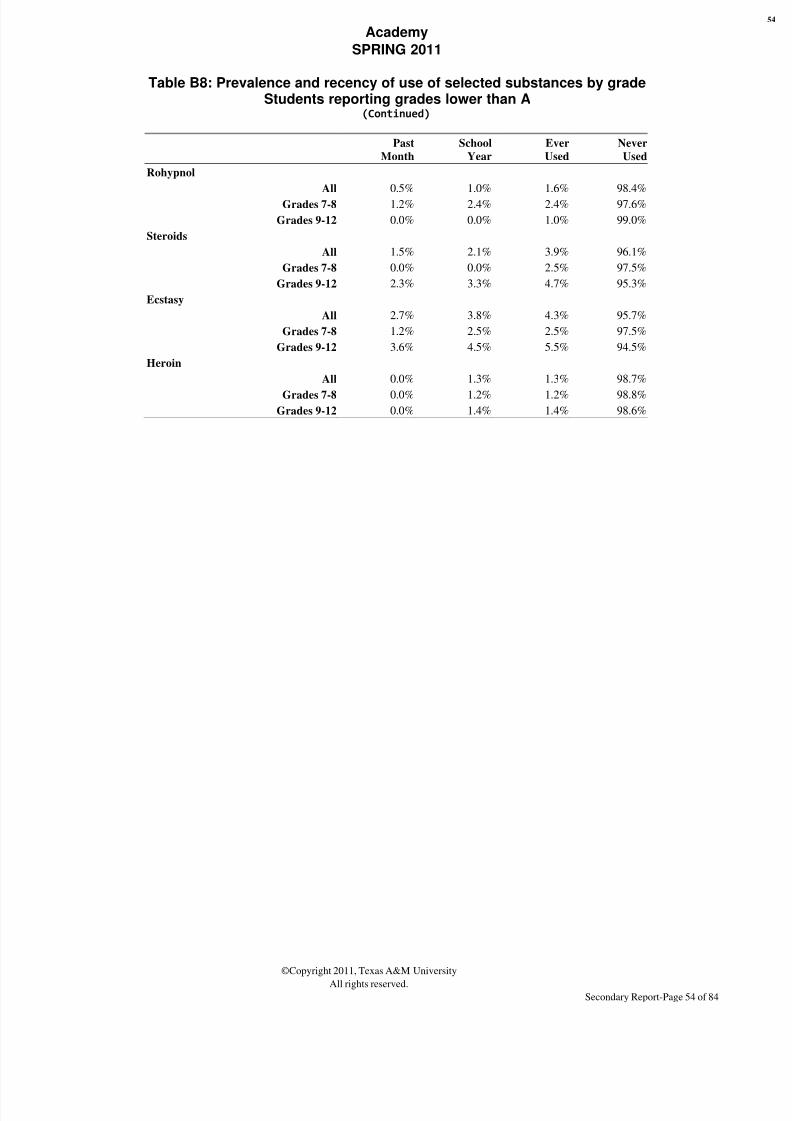
8/3/2019 BELL COUNTY - Academy ISD - 2011 Texas School Survey of Drug and Alcohol Use
http://slidepdf.com/reader/full/bell-county-academy-isd-2011-texas-school-survey-of-drug-and-alcohol-use 96/209
Academy
SPRING 2011
©Copyright 2011, Texas A&M University
All rights reserved.Secondary Report-Page 54 of 84
Table B8: Prevalence and recency of use of selected substances by gradeStudents reporting grades lower than A
(Continued)
Past
Month
School
Year
Ever
Used
Never
Used
Rohypnol
All 0.5% 1.0% 1.6% 98.4%
Grades 7-8 1.2% 2.4% 2.4% 97.6%
Grades 9-12 0.0% 0.0% 1.0% 99.0%
Steroids
All 1.5% 2.1% 3.9% 96.1%
Grades 7-8 0.0% 0.0% 2.5% 97.5%
Grades 9-12 2.3% 3.3% 4.7% 95.3%
Ecstasy
All 2.7% 3.8% 4.3% 95.7%
Grades 7-8 1.2% 2.5% 2.5% 97.5%
Grades 9-12 3.6% 4.5% 5.5% 94.5%
Heroin
All 0.0% 1.3% 1.3% 98.7%
Grades 7-8 0.0% 1.2% 1.2% 98.8%
Grades 9-12 0.0% 1.4% 1.4% 98.6%

8/3/2019 BELL COUNTY - Academy ISD - 2011 Texas School Survey of Drug and Alcohol Use
http://slidepdf.com/reader/full/bell-county-academy-isd-2011-texas-school-survey-of-drug-and-alcohol-use 97/209
Academy
SPRING 2011
©Copyright 2011, Texas A&M University
All rights reserved.Secondary Report-Page 55 of 84
Table B9: Prevalence and recency of use of selected substances by gradeStudents living with two parents
Past
Month
School
Year
Ever
Used
Never
Used
Tobacco
All 8.8% 11.0% 17.0% 83.0%
Grades 7-8 0.9% 1.8% 5.4% 94.6%Grades 9-12 15.5% 18.6% 26.8% 73.2%
Alcohol
All 19.8% 32.5% 49.3% 50.7%
Grades 7-8 7.3% 17.3% 35.2% 64.8%
Grades 9-12 29.9% 44.8% 60.8% 39.2%
Inhalants
All 3.3% 3.8% 11.2% 88.8%
Grades 7-8 5.3% 5.3% 11.4% 88.6%
Grades 9-12 1.9% 2.7% 11.0% 89.0%
Any Illicit Drug
All 3.9% 4.8% 7.6% 92.4%
Grades 7-8 1.7% 1.7% 2.6% 97.4%
Grades 9-12 5.4% 6.9% 11.0% 89.0%
Marijuana
All 3.2% 3.7% 7.1% 92.9%
Grades 7-8 0.9% 0.9% 1.9% 98.1%
Grades 9-12 5.1% 6.0% 11.4% 88.6%
Marijuana Only
All 1.8% 1.8% 4.7% 95.3%
Grades 7-8 0.8% 0.8% 1.7% 98.3%
Grades 9-12 2.5% 2.5% 6.6% 93.4%
Cocaine or Crack
All 0.0% 0.5% 1.4% 98.6%
Grades 7-8 0.0% 0.0% 0.9% 99.1%
Grades 9-12 0.0% 0.9% 1.9% 98.1%Cocaine
All 0.0% 0.5% 1.0% 99.0%
Grades 7-8 0.0% 0.0% 0.0% 100.0%
Grades 9-12 0.0% 0.9% 1.9% 98.1%
Crack
All 0.0% 0.0% 1.0% 99.0%
Grades 7-8 0.0% 0.0% 1.0% 99.0%
Grades 9-12 0.0% 0.0% 1.1% 98.9%
Hallucinogens
All 0.0% 0.4% 1.0% 99.0%
Grades 7-8 0.0% 0.9% 0.9% 99.1%
Grades 9-12 0.0% 0.0% 1.0% 99.0%Uppers
All 0.6% 0.6% 1.1% 98.9%
Grades 7-8 0.0% 0.0% 1.0% 99.0%
Grades 9-12 1.1% 1.1% 1.1% 98.9%
Downers
All 0.0% 0.0% 0.0% 100.0%
Grades 7-8 0.0% 0.0% 0.0% 100.0%
Grades 9-12 0.0% 0.0% 0.0% 100.0%

8/3/2019 BELL COUNTY - Academy ISD - 2011 Texas School Survey of Drug and Alcohol Use
http://slidepdf.com/reader/full/bell-county-academy-isd-2011-texas-school-survey-of-drug-and-alcohol-use 98/209
Academy
SPRING 2011
©Copyright 2011, Texas A&M University
All rights reserved.Secondary Report-Page 56 of 84
Table B9: Prevalence and recency of use of selected substances by gradeStudents living with two parents
(Continued)
Past
Month
School
Year
Ever
Used
Never
Used
Rohypnol
All 0.0% 0.0% 0.6% 99.4%
Grades 7-8 0.0% 0.0% 0.0% 100.0%
Grades 9-12 0.0% 0.0% 1.1% 98.9%
Steroids
All 1.1% 2.6% 5.8% 94.2%
Grades 7-8 0.0% 2.0% 4.9% 95.1%
Grades 9-12 2.2% 3.3% 6.6% 93.4%
Ecstasy
All 0.0% 0.5% 0.5% 99.5%
Grades 7-8 0.0% 0.0% 0.0% 100.0%
Grades 9-12 0.0% 1.0% 1.0% 99.0%
Heroin
All 0.0% 0.0% 0.0% 100.0%
Grades 7-8 0.0% 0.0% 0.0% 100.0%
Grades 9-12 0.0% 0.0% 0.0% 100.0%

8/3/2019 BELL COUNTY - Academy ISD - 2011 Texas School Survey of Drug and Alcohol Use
http://slidepdf.com/reader/full/bell-county-academy-isd-2011-texas-school-survey-of-drug-and-alcohol-use 99/209
Academy
SPRING 2011
©Copyright 2011, Texas A&M University
All rights reserved.Secondary Report-Page 57 of 84
Table B10: Prevalence and recency of use of selected substances by gradeStudents not living with two parents
Past
Month
School
Year
Ever
Used
Never
Used
Tobacco
All 20.8% 23.0% 33.3% 66.7%
Grades 7-8 12.9% 14.8% 22.1% 77.9%Grades 9-12 25.1% 27.5% 39.5% 60.5%
Alcohol
All 30.8% 43.8% 62.6% 37.4%
Grades 7-8 25.2% 36.2% 58.2% 41.8%
Grades 9-12 33.8% 48.0% 65.1% 34.9%
Inhalants
All 4.8% 7.5% 16.2% 83.8%
Grades 7-8 9.2% 14.5% 23.6% 76.4%
Grades 9-12 2.4% 3.6% 12.2% 87.8%
Any Illicit Drug
All 14.1% 22.7% 25.6% 74.4%
Grades 7-8 10.7% 16.3% 16.3% 83.7%
Grades 9-12 15.7% 25.9% 30.2% 69.8%
Marijuana
All 16.3% 24.3% 29.0% 71.0%
Grades 7-8 11.1% 14.9% 14.9% 85.1%
Grades 9-12 19.3% 29.8% 37.2% 62.8%
Marijuana Only
All 6.1% 10.3% 13.2% 86.8%
Grades 7-8 3.6% 3.6% 3.6% 96.4%
Grades 9-12 7.3% 13.6% 18.0% 82.0%
Cocaine or Crack
All 1.3% 2.1% 2.8% 97.2%
Grades 7-8 0.0% 2.0% 4.0% 96.0%
Grades 9-12 2.1% 2.1% 2.1% 97.9%Cocaine
All 1.4% 1.4% 1.4% 98.6%
Grades 7-8 0.0% 0.0% 0.0% 100.0%
Grades 9-12 2.1% 2.1% 2.1% 97.9%
Crack
All 0.0% 0.8% 1.7% 98.3%
Grades 7-8 0.0% 2.0% 4.0% 96.0%
Grades 9-12 0.0% 0.0% 0.0% 100.0%
Hallucinogens
All 4.0% 4.9% 5.7% 94.3%
Grades 7-8 4.0% 6.1% 8.1% 91.9%
Grades 9-12 4.0% 4.0% 4.0% 96.0%Uppers
All 5.1% 5.1% 6.1% 93.9%
Grades 7-8 1.9% 1.9% 1.9% 98.1%
Grades 9-12 7.3% 7.3% 9.1% 90.9%
Downers
All 4.5% 4.5% 5.6% 94.4%
Grades 7-8 4.2% 4.2% 4.2% 95.8%
Grades 9-12 4.8% 4.8% 6.5% 93.5%

8/3/2019 BELL COUNTY - Academy ISD - 2011 Texas School Survey of Drug and Alcohol Use
http://slidepdf.com/reader/full/bell-county-academy-isd-2011-texas-school-survey-of-drug-and-alcohol-use 100/209
Academy
SPRING 2011
©Copyright 2011, Texas A&M University
All rights reserved.Secondary Report-Page 58 of 84
Table B10: Prevalence and recency of use of selected substances by gradeStudents not living with two parents
(Continued)
Past
Month
School
Year
Ever
Used
Never
Used
Rohypnol
All 0.7% 1.5% 1.5% 98.5%
Grades 7-8 1.8% 3.8% 3.8% 96.2%
Grades 9-12 0.0% 0.0% 0.0% 100.0%
Steroids
All 1.5% 1.5% 2.2% 97.8%
Grades 7-8 0.0% 0.0% 2.0% 98.0%
Grades 9-12 2.4% 2.4% 2.4% 97.6%
Ecstasy
All 5.2% 7.0% 7.9% 92.1%
Grades 7-8 3.8% 5.9% 5.9% 94.1%
Grades 9-12 6.1% 7.7% 9.3% 90.7%
Heroin
All 0.0% 2.2% 2.2% 97.8%
Grades 7-8 0.0% 2.0% 2.0% 98.0%
Grades 9-12 0.0% 2.3% 2.3% 97.7%
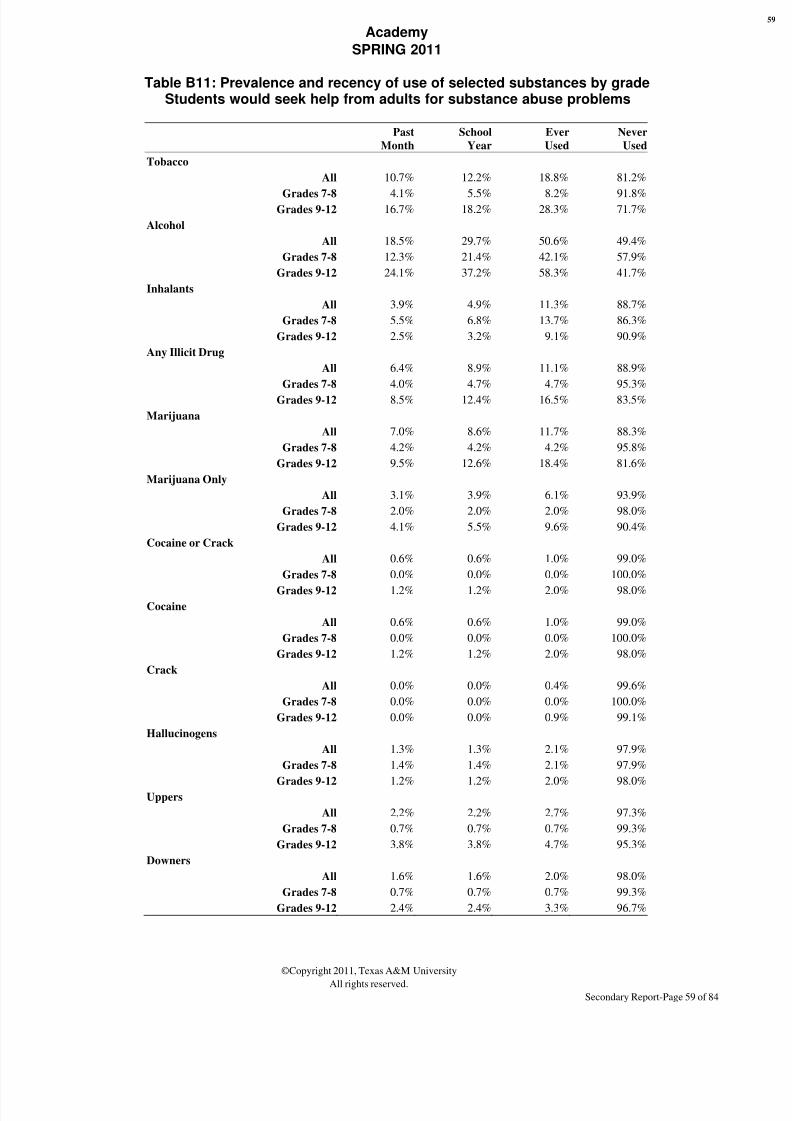
8/3/2019 BELL COUNTY - Academy ISD - 2011 Texas School Survey of Drug and Alcohol Use
http://slidepdf.com/reader/full/bell-county-academy-isd-2011-texas-school-survey-of-drug-and-alcohol-use 101/209
Academy
SPRING 2011
©Copyright 2011, Texas A&M University
All rights reserved.Secondary Report-Page 59 of 84
Table B11: Prevalence and recency of use of selected substances by gradeStudents would seek help from adults for substance abuse problems
Past
Month
School
Year
Ever
Used
Never
Used
Tobacco
All 10.7% 12.2% 18.8% 81.2%
Grades 7-8 4.1% 5.5% 8.2% 91.8%Grades 9-12 16.7% 18.2% 28.3% 71.7%
Alcohol
All 18.5% 29.7% 50.6% 49.4%
Grades 7-8 12.3% 21.4% 42.1% 57.9%
Grades 9-12 24.1% 37.2% 58.3% 41.7%
Inhalants
All 3.9% 4.9% 11.3% 88.7%
Grades 7-8 5.5% 6.8% 13.7% 86.3%
Grades 9-12 2.5% 3.2% 9.1% 90.9%
Any Illicit Drug
All 6.4% 8.9% 11.1% 88.9%
Grades 7-8 4.0% 4.7% 4.7% 95.3%
Grades 9-12 8.5% 12.4% 16.5% 83.5%
Marijuana
All 7.0% 8.6% 11.7% 88.3%
Grades 7-8 4.2% 4.2% 4.2% 95.8%
Grades 9-12 9.5% 12.6% 18.4% 81.6%
Marijuana Only
All 3.1% 3.9% 6.1% 93.9%
Grades 7-8 2.0% 2.0% 2.0% 98.0%
Grades 9-12 4.1% 5.5% 9.6% 90.4%
Cocaine or Crack
All 0.6% 0.6% 1.0% 99.0%
Grades 7-8 0.0% 0.0% 0.0% 100.0%
Grades 9-12 1.2% 1.2% 2.0% 98.0%Cocaine
All 0.6% 0.6% 1.0% 99.0%
Grades 7-8 0.0% 0.0% 0.0% 100.0%
Grades 9-12 1.2% 1.2% 2.0% 98.0%
Crack
All 0.0% 0.0% 0.4% 99.6%
Grades 7-8 0.0% 0.0% 0.0% 100.0%
Grades 9-12 0.0% 0.0% 0.9% 99.1%
Hallucinogens
All 1.3% 1.3% 2.1% 97.9%
Grades 7-8 1.4% 1.4% 2.1% 97.9%
Grades 9-12 1.2% 1.2% 2.0% 98.0%Uppers
All 2.2% 2.2% 2.7% 97.3%
Grades 7-8 0.7% 0.7% 0.7% 99.3%
Grades 9-12 3.8% 3.8% 4.7% 95.3%
Downers
All 1.6% 1.6% 2.0% 98.0%
Grades 7-8 0.7% 0.7% 0.7% 99.3%
Grades 9-12 2.4% 2.4% 3.3% 96.7%

8/3/2019 BELL COUNTY - Academy ISD - 2011 Texas School Survey of Drug and Alcohol Use
http://slidepdf.com/reader/full/bell-county-academy-isd-2011-texas-school-survey-of-drug-and-alcohol-use 102/209
Academy
SPRING 2011
©Copyright 2011, Texas A&M University
All rights reserved.Secondary Report-Page 60 of 84
Table B11: Prevalence and recency of use of selected substances by gradeStudents would seek help from adults for substance abuse problems
(Continued)
Past
Month
School
Year
Ever
Used
Never
Used
Rohypnol
All 0.3% 0.3% 0.8% 99.2%
Grades 7-8 0.7% 0.7% 0.7% 99.3%
Grades 9-12 0.0% 0.0% 0.9% 99.1%
Steroids
All 0.0% 1.2% 2.3% 97.7%
Grades 7-8 0.0% 1.5% 3.7% 96.3%
Grades 9-12 0.0% 0.9% 0.9% 99.1%
Ecstasy
All 2.0% 2.0% 2.5% 97.5%
Grades 7-8 1.4% 1.4% 1.4% 98.6%
Grades 9-12 2.6% 2.6% 3.5% 96.5%
Heroin
All 0.0% 0.7% 0.7% 99.3%
Grades 7-8 0.0% 0.0% 0.0% 100.0%
Grades 9-12 0.0% 1.3% 1.3% 98.7%
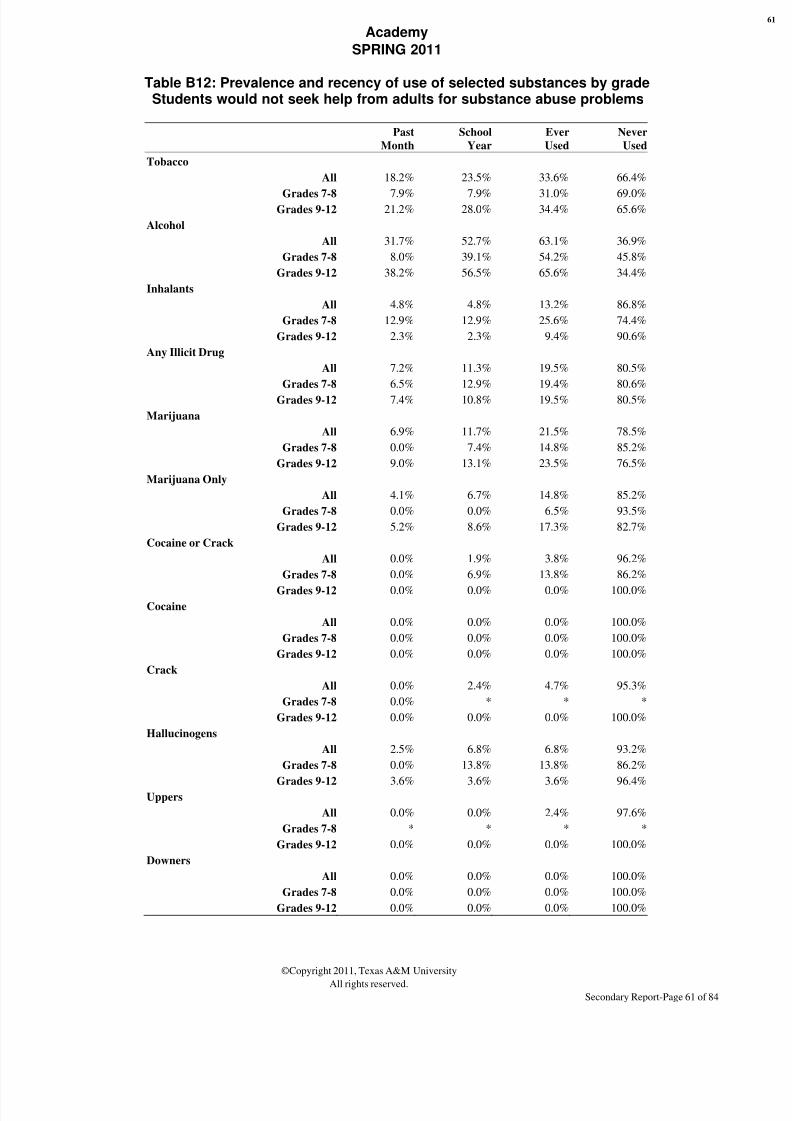
8/3/2019 BELL COUNTY - Academy ISD - 2011 Texas School Survey of Drug and Alcohol Use
http://slidepdf.com/reader/full/bell-county-academy-isd-2011-texas-school-survey-of-drug-and-alcohol-use 103/209
Academy
SPRING 2011
©Copyright 2011, Texas A&M University
All rights reserved.Secondary Report-Page 61 of 84
Table B12: Prevalence and recency of use of selected substances by gradeStudents would not seek help from adults for substance abuse problems
Past
Month
School
Year
Ever
Used
Never
Used
Tobacco
All 18.2% 23.5% 33.6% 66.4%
Grades 7-8 7.9% 7.9% 31.0% 69.0%Grades 9-12 21.2% 28.0% 34.4% 65.6%
Alcohol
All 31.7% 52.7% 63.1% 36.9%
Grades 7-8 8.0% 39.1% 54.2% 45.8%
Grades 9-12 38.2% 56.5% 65.6% 34.4%
Inhalants
All 4.8% 4.8% 13.2% 86.8%
Grades 7-8 12.9% 12.9% 25.6% 74.4%
Grades 9-12 2.3% 2.3% 9.4% 90.6%
Any Illicit Drug
All 7.2% 11.3% 19.5% 80.5%
Grades 7-8 6.5% 12.9% 19.4% 80.6%
Grades 9-12 7.4% 10.8% 19.5% 80.5%
Marijuana
All 6.9% 11.7% 21.5% 78.5%
Grades 7-8 0.0% 7.4% 14.8% 85.2%
Grades 9-12 9.0% 13.1% 23.5% 76.5%
Marijuana Only
All 4.1% 6.7% 14.8% 85.2%
Grades 7-8 0.0% 0.0% 6.5% 93.5%
Grades 9-12 5.2% 8.6% 17.3% 82.7%
Cocaine or Crack
All 0.0% 1.9% 3.8% 96.2%
Grades 7-8 0.0% 6.9% 13.8% 86.2%
Grades 9-12 0.0% 0.0% 0.0% 100.0%Cocaine
All 0.0% 0.0% 0.0% 100.0%
Grades 7-8 0.0% 0.0% 0.0% 100.0%
Grades 9-12 0.0% 0.0% 0.0% 100.0%
Crack
All 0.0% 2.4% 4.7% 95.3%
Grades 7-8 0.0% * * *
Grades 9-12 0.0% 0.0% 0.0% 100.0%
Hallucinogens
All 2.5% 6.8% 6.8% 93.2%
Grades 7-8 0.0% 13.8% 13.8% 86.2%
Grades 9-12 3.6% 3.6% 3.6% 96.4%Uppers
All 0.0% 0.0% 2.4% 97.6%
Grades 7-8 * * * *
Grades 9-12 0.0% 0.0% 0.0% 100.0%
Downers
All 0.0% 0.0% 0.0% 100.0%
Grades 7-8 0.0% 0.0% 0.0% 100.0%
Grades 9-12 0.0% 0.0% 0.0% 100.0%

8/3/2019 BELL COUNTY - Academy ISD - 2011 Texas School Survey of Drug and Alcohol Use
http://slidepdf.com/reader/full/bell-county-academy-isd-2011-texas-school-survey-of-drug-and-alcohol-use 104/209
Academy
SPRING 2011
©Copyright 2011, Texas A&M University
All rights reserved.Secondary Report-Page 62 of 84
Table B12: Prevalence and recency of use of selected substances by gradeStudents would not seek help from adults for substance abuse problems
(Continued)
Past
Month
School
Year
Ever
Used
Never
Used
Rohypnol
All 0.0% 2.1% 2.1% 97.9%
Grades 7-8 0.0% 8.0% 8.0% 92.0%
Grades 9-12 0.0% 0.0% 0.0% 100.0%
Steroids
All 5.0% 5.0% 12.6% 87.4%
Grades 7-8 0.0% 0.0% 0.0% 100.0%
Grades 9-12 6.5% 6.5% 16.3% 83.7%
Ecstasy
All 2.2% 4.1% 4.1% 95.9%
Grades 7-8 * * * *
Grades 9-12 2.8% 2.8% 2.8% 97.2%
Heroin
All 0.0% 1.8% 1.8% 98.2%
Grades 7-8 0.0% 7.4% 7.4% 92.6%
Grades 9-12 0.0% 0.0% 0.0% 100.0%
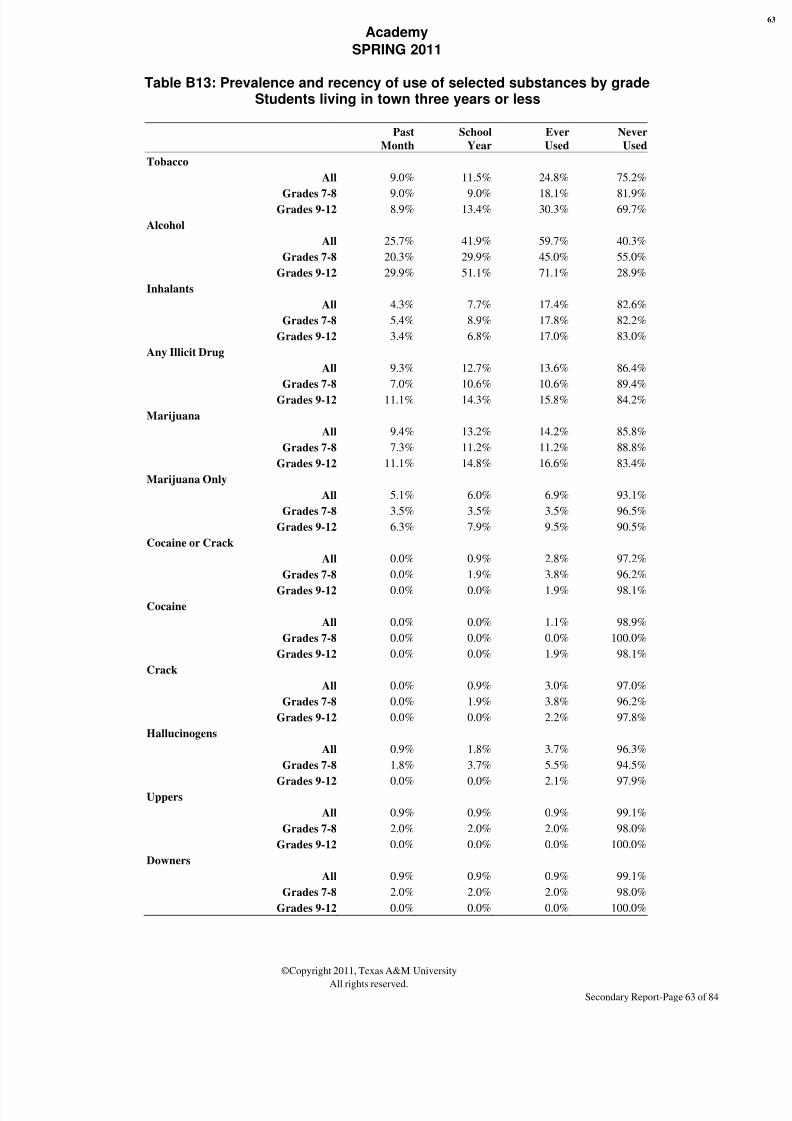
8/3/2019 BELL COUNTY - Academy ISD - 2011 Texas School Survey of Drug and Alcohol Use
http://slidepdf.com/reader/full/bell-county-academy-isd-2011-texas-school-survey-of-drug-and-alcohol-use 105/209
Academy
SPRING 2011
©Copyright 2011, Texas A&M University
All rights reserved.Secondary Report-Page 63 of 84
Table B13: Prevalence and recency of use of selected substances by gradeStudents living in town three years or less
Past
Month
School
Year
Ever
Used
Never
Used
Tobacco
All 9.0% 11.5% 24.8% 75.2%
Grades 7-8 9.0% 9.0% 18.1% 81.9%Grades 9-12 8.9% 13.4% 30.3% 69.7%
Alcohol
All 25.7% 41.9% 59.7% 40.3%
Grades 7-8 20.3% 29.9% 45.0% 55.0%
Grades 9-12 29.9% 51.1% 71.1% 28.9%
Inhalants
All 4.3% 7.7% 17.4% 82.6%
Grades 7-8 5.4% 8.9% 17.8% 82.2%
Grades 9-12 3.4% 6.8% 17.0% 83.0%
Any Illicit Drug
All 9.3% 12.7% 13.6% 86.4%
Grades 7-8 7.0% 10.6% 10.6% 89.4%
Grades 9-12 11.1% 14.3% 15.8% 84.2%
Marijuana
All 9.4% 13.2% 14.2% 85.8%
Grades 7-8 7.3% 11.2% 11.2% 88.8%
Grades 9-12 11.1% 14.8% 16.6% 83.4%
Marijuana Only
All 5.1% 6.0% 6.9% 93.1%
Grades 7-8 3.5% 3.5% 3.5% 96.5%
Grades 9-12 6.3% 7.9% 9.5% 90.5%
Cocaine or Crack
All 0.0% 0.9% 2.8% 97.2%
Grades 7-8 0.0% 1.9% 3.8% 96.2%
Grades 9-12 0.0% 0.0% 1.9% 98.1%Cocaine
All 0.0% 0.0% 1.1% 98.9%
Grades 7-8 0.0% 0.0% 0.0% 100.0%
Grades 9-12 0.0% 0.0% 1.9% 98.1%
Crack
All 0.0% 0.9% 3.0% 97.0%
Grades 7-8 0.0% 1.9% 3.8% 96.2%
Grades 9-12 0.0% 0.0% 2.2% 97.8%
Hallucinogens
All 0.9% 1.8% 3.7% 96.3%
Grades 7-8 1.8% 3.7% 5.5% 94.5%
Grades 9-12 0.0% 0.0% 2.1% 97.9%Uppers
All 0.9% 0.9% 0.9% 99.1%
Grades 7-8 2.0% 2.0% 2.0% 98.0%
Grades 9-12 0.0% 0.0% 0.0% 100.0%
Downers
All 0.9% 0.9% 0.9% 99.1%
Grades 7-8 2.0% 2.0% 2.0% 98.0%
Grades 9-12 0.0% 0.0% 0.0% 100.0%
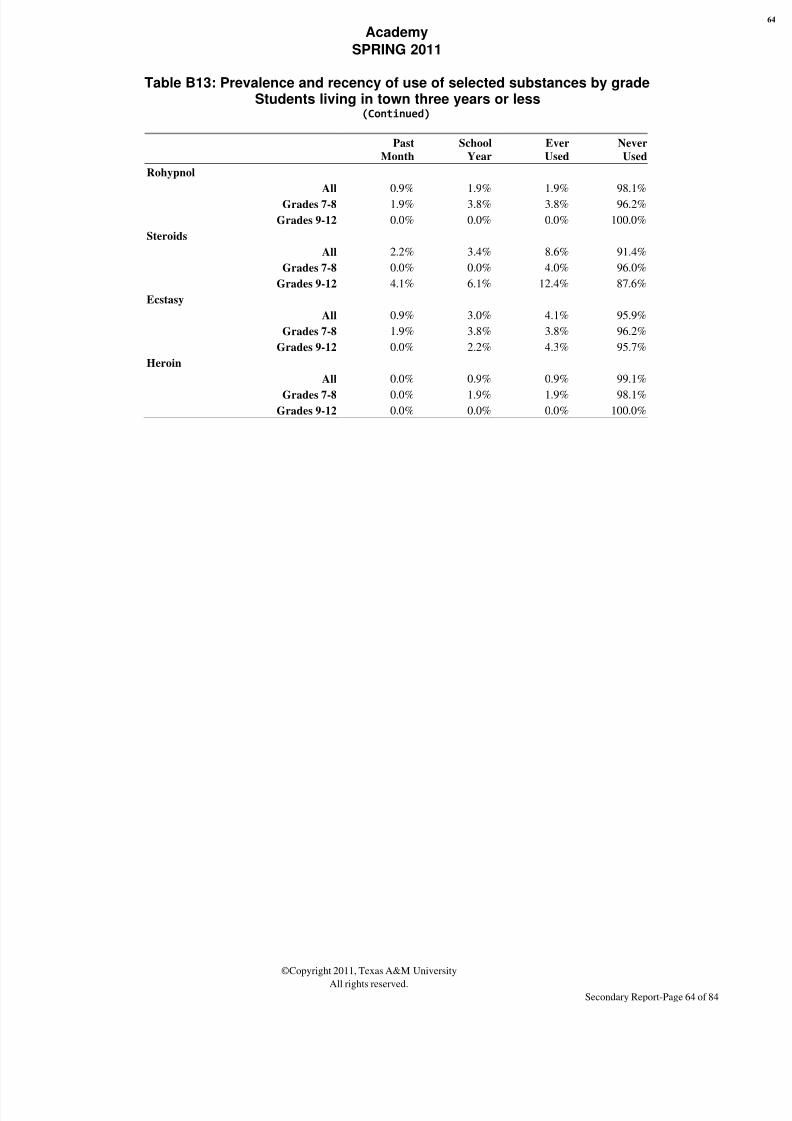
8/3/2019 BELL COUNTY - Academy ISD - 2011 Texas School Survey of Drug and Alcohol Use
http://slidepdf.com/reader/full/bell-county-academy-isd-2011-texas-school-survey-of-drug-and-alcohol-use 106/209
Academy
SPRING 2011
©Copyright 2011, Texas A&M University
All rights reserved.Secondary Report-Page 64 of 84
Table B13: Prevalence and recency of use of selected substances by gradeStudents living in town three years or less
(Continued)
Past
Month
School
Year
Ever
Used
Never
Used
Rohypnol
All 0.9% 1.9% 1.9% 98.1%
Grades 7-8 1.9% 3.8% 3.8% 96.2%
Grades 9-12 0.0% 0.0% 0.0% 100.0%
Steroids
All 2.2% 3.4% 8.6% 91.4%
Grades 7-8 0.0% 0.0% 4.0% 96.0%
Grades 9-12 4.1% 6.1% 12.4% 87.6%
Ecstasy
All 0.9% 3.0% 4.1% 95.9%
Grades 7-8 1.9% 3.8% 3.8% 96.2%
Grades 9-12 0.0% 2.2% 4.3% 95.7%
Heroin
All 0.0% 0.9% 0.9% 99.1%
Grades 7-8 0.0% 1.9% 1.9% 98.1%
Grades 9-12 0.0% 0.0% 0.0% 100.0%

8/3/2019 BELL COUNTY - Academy ISD - 2011 Texas School Survey of Drug and Alcohol Use
http://slidepdf.com/reader/full/bell-county-academy-isd-2011-texas-school-survey-of-drug-and-alcohol-use 107/209
Academy
SPRING 2011
©Copyright 2011, Texas A&M University
All rights reserved.Secondary Report-Page 65 of 84
Table B14: Prevalence and recency of use of selected substances by gradeStudents living in town more than three years
Past
Month
School
Year
Ever
Used
Never
Used
Tobacco
All 14.8% 16.8% 22.0% 78.0%
Grades 7-8 2.7% 4.5% 7.1% 92.9%Grades 9-12 23.1% 25.4% 32.3% 67.7%
Alcohol
All 22.8% 33.6% 51.1% 48.9%
Grades 7-8 9.8% 20.4% 41.4% 58.6%
Grades 9-12 31.6% 42.6% 57.8% 42.2%
Inhalants
All 3.7% 4.0% 10.6% 89.4%
Grades 7-8 7.0% 7.9% 14.1% 85.9%
Grades 9-12 1.6% 1.6% 8.3% 91.7%
Any Illicit Drug
All 6.4% 10.3% 13.9% 86.1%
Grades 7-8 3.4% 4.3% 5.2% 94.8%
Grades 9-12 8.0% 13.6% 18.8% 81.2%
Marijuana
All 6.8% 10.0% 15.1% 84.9%
Grades 7-8 2.7% 2.7% 3.6% 96.4%
Grades 9-12 9.8% 15.1% 23.2% 76.8%
Marijuana Only
All 2.7% 4.5% 8.2% 91.8%
Grades 7-8 0.9% 0.9% 1.7% 98.3%
Grades 9-12 3.7% 6.5% 11.7% 88.3%
Cocaine or Crack
All 0.7% 1.2% 1.5% 98.5%
Grades 7-8 0.0% 0.0% 0.9% 99.1%
Grades 9-12 1.2% 2.0% 2.0% 98.0%Cocaine
All 0.7% 1.2% 1.2% 98.8%
Grades 7-8 0.0% 0.0% 0.0% 100.0%
Grades 9-12 1.2% 2.1% 2.1% 97.9%
Crack
All 0.0% 0.0% 0.4% 99.6%
Grades 7-8 0.0% 0.0% 1.0% 99.0%
Grades 9-12 0.0% 0.0% 0.0% 100.0%
Hallucinogens
All 1.6% 2.0% 2.0% 98.0%
Grades 7-8 0.9% 1.9% 1.9% 98.1%
Grades 9-12 2.1% 2.1% 2.1% 97.9%Uppers
All 2.8% 2.8% 3.7% 96.3%
Grades 7-8 0.0% 0.0% 0.9% 99.1%
Grades 9-12 5.3% 5.3% 6.2% 93.8%
Downers
All 1.9% 1.9% 2.4% 97.6%
Grades 7-8 1.0% 1.0% 1.0% 99.0%
Grades 9-12 2.6% 2.6% 3.6% 96.4%
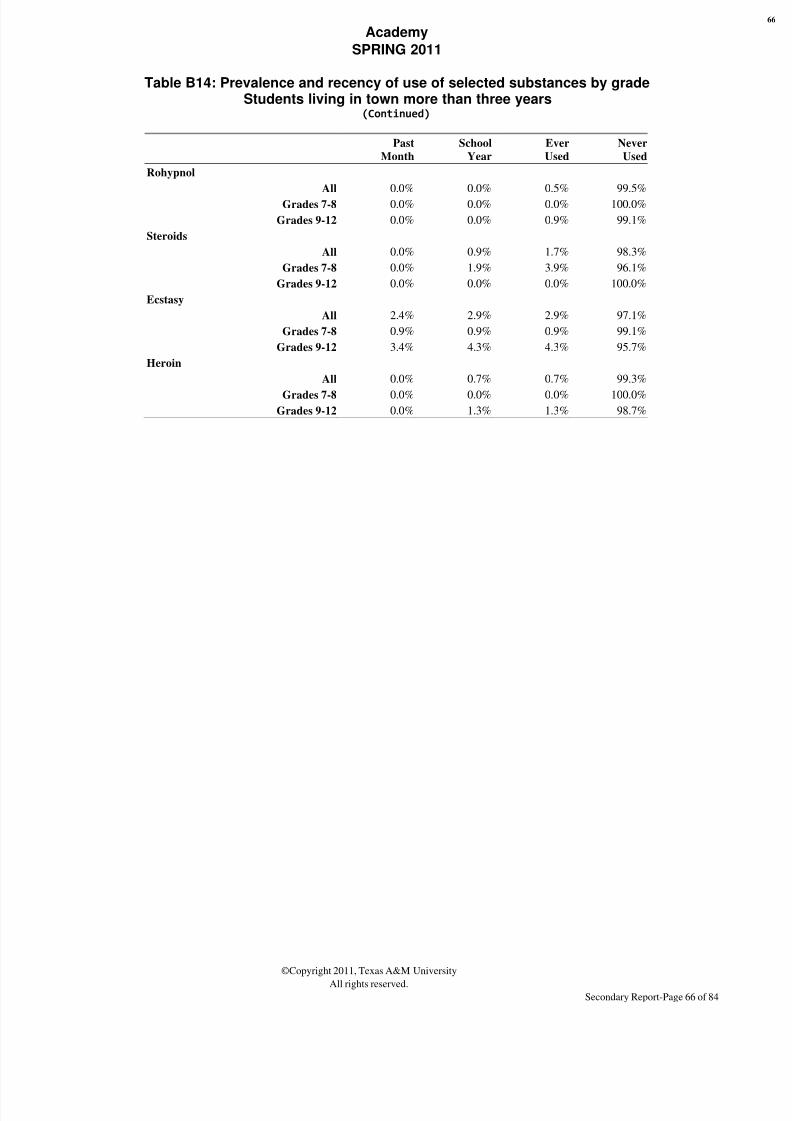
8/3/2019 BELL COUNTY - Academy ISD - 2011 Texas School Survey of Drug and Alcohol Use
http://slidepdf.com/reader/full/bell-county-academy-isd-2011-texas-school-survey-of-drug-and-alcohol-use 108/209
Academy
SPRING 2011
©Copyright 2011, Texas A&M University
All rights reserved.Secondary Report-Page 66 of 84
Table B14: Prevalence and recency of use of selected substances by gradeStudents living in town more than three years
(Continued)
Past
Month
School
Year
Ever
Used
Never
Used
Rohypnol
All 0.0% 0.0% 0.5% 99.5%
Grades 7-8 0.0% 0.0% 0.0% 100.0%
Grades 9-12 0.0% 0.0% 0.9% 99.1%
Steroids
All 0.0% 0.9% 1.7% 98.3%
Grades 7-8 0.0% 1.9% 3.9% 96.1%
Grades 9-12 0.0% 0.0% 0.0% 100.0%
Ecstasy
All 2.4% 2.9% 2.9% 97.1%
Grades 7-8 0.9% 0.9% 0.9% 99.1%
Grades 9-12 3.4% 4.3% 4.3% 95.7%
Heroin
All 0.0% 0.7% 0.7% 99.3%
Grades 7-8 0.0% 0.0% 0.0% 100.0%
Grades 9-12 0.0% 1.3% 1.3% 98.7%

8/3/2019 BELL COUNTY - Academy ISD - 2011 Texas School Survey of Drug and Alcohol Use
http://slidepdf.com/reader/full/bell-county-academy-isd-2011-texas-school-survey-of-drug-and-alcohol-use 109/209
Academy
SPRING 2011
©Copyright 2011, Texas A&M University
All rights reserved.Secondary Report-Page 67 of 84
3. Margin Tables
8/3/2019 BELL COUNTY - Academy ISD - 2011 Texas School Survey of Drug and Alcohol Use
http://slidepdf.com/reader/full/bell-county-academy-isd-2011-texas-school-survey-of-drug-and-alcohol-use 110/209
Academy
SPRING 2011
©Copyright 2011, Texas A&M University
All rights reserved.Secondary Report-Page 68 of 84

8/3/2019 BELL COUNTY - Academy ISD - 2011 Texas School Survey of Drug and Alcohol Use
http://slidepdf.com/reader/full/bell-county-academy-isd-2011-texas-school-survey-of-drug-and-alcohol-use 111/209

8/3/2019 BELL COUNTY - Academy ISD - 2011 Texas School Survey of Drug and Alcohol Use
http://slidepdf.com/reader/full/bell-county-academy-isd-2011-texas-school-survey-of-drug-and-alcohol-use 112/209
Academy
Spring 2011
The frequencies have been weighted so that the analysis reflects
the distribution of students by grade level in the district
©Copyright 2011, Texas A&M University
All rights reserved.
Page 70 of 84
PARTICIPATE IN
DRAMA/SPEECH/ART
CLUBS
q12d Frequency Percent
No 271 86.88
Yes 41 13.12
Frequency Missing = 62.489746632
PARTICIPATE IN DRILL
TEAM/CHEERLEADING
q12e Frequency Percent
No 273 90.01
Yes 30 9.99
Frequency Missing = 70.174809547
PARTICIPATE IN
STUDENT
GOVERNMENT
q12f Frequency Percent
No 284 94.29
Yes 17 5.71
Frequency Missing = 72.444381954
PARTICIPATE IN SCHOOL
NEWSPAPER/YEARBOOK
q12g Frequency Percent
No 291 95.67
Yes 13 4.33
Frequency Missing = 69.859154185
PARTICIPATE IN
ACADEMIC
CLUBS/SOCIETIES
q12h Frequency Percent
No 259 85.42
Yes 44 14.58
Frequency Missing = 70.758603414
PARTICIPATE IN
ACADEMIC
COMPETITION
GROUPS
q12i Frequency Percent
No 231 74.34
Yes 80 25.66
Frequency Missing = 63.18279637
PARTICIPATE IN
SCHOOL SERVICE
CLUBS
q12j Frequency Percent
No 304 96.65
Yes 11 3.35
Frequency Missing = 59.586978959
PARTICIPATE IN
OTHER SCHOOL
CLUBS OR GROUPS
q12k Frequency Percent
No 267 82.59
Yes 56 17.41
Frequency Missing = 50.806714439
PARTICIPATE IN
ATHLETIC TEAMSOUTSIDE OF SCHOOL
q12l Frequency Percent
No 195 58.71
Yes 137 41.29
Frequency Missing = 41.300250228
PARTICIPATE IN
OTHER CLUBS OR
GROUPS OUTSIDE OF
SCHOOL
q12m Frequency Percent
No 214 67.46
Yes 103 32.54
Frequency Missing = 56.859530099
DO YOU FEEL SAFE IN YOU
HOM
q13a Frequency Perce
Very Safe 274 85.
Somewhat Safe 38 11.
Not Very Safe 3 0.
Not Safe At All 2 0.
Don't Know 4 1.
Frequency Missing = 52.9499906
DO YOU FEEL SAFE IN YOU
NEIGHBORHOO
q13b Frequency Perce
Very Safe 173 54.
Somewhat Safe 120 37.
Not Very Safe 15 4.
Not Safe At All 2 0.
Don't Know 6 1.
Frequency Missing = 56.9673131
DO YOU FEEL SAFE A
SCHOO
q13c Frequency Perce
Very Safe 202 64.
Somewhat Safe 80 25.
Not Very Safe 9 2.
Not Safe At All 14 4.
Don't Know 7 2.
Frequency Missing = 62.6611116
FRIENDS FEELING
CLOSE TO THEIR
PARENTS
q14a Frequency Percent
None 13 3.79
A Few 59 17.81
Some 61 18.33
Most 157 47.14All 43 12.94
Frequency Missing = 40.7181093

8/3/2019 BELL COUNTY - Academy ISD - 2011 Texas School Survey of Drug and Alcohol Use
http://slidepdf.com/reader/full/bell-county-academy-isd-2011-texas-school-survey-of-drug-and-alcohol-use 113/209
Academy
Spring 2011
The frequencies have been weighted so that the analysis reflects
the distribution of students by grade level in the district
©Copyright 2011, Texas A&M University
All rights reserved.
Page 71 of 84
HOW MANY FRIENDS
CARRY WEAPONS
q14b Frequency Percent
None 192 57.38
A Few 68 20.26
Some 37 10.99
Most 31 9.17
All 7 2.20
Frequency Missing = 38.857679428
HOW MANY FRIENDS
CARE ABOUT GOOD
GRADES
q14c Frequency Percent
None 6 1.77
A Few 37 11.37
Some 52 15.95
Most 167 51.27
All 64 19.63
Frequency Missing = 47.603093216
HOW MANY FRIENDS
BELONG TO A GANG
q14d Frequency Percent
None 290 86.35
A Few 34 10.12
Some 3 0.77
Most 5 1.51
All 4 1.25
Frequency Missing = 38.067551835
FRIENDS WISHING TO
DROP OUT OF
SCHOOL
q14e Frequency Percent
None 223 67.35
A Few 69 21.02
Some 18 5.32
Most 8 2.47All 13 3.84
Frequency Missing = 43.555884102
PARENTS ATTEND
PTA/SCHOOL OPEN
HOUSES
q15 Frequency Percent
No 127 39.70
Yes 192 60.30
Frequency Missing = 54.875868264
RECENT INHALANT USE - SPRAY
PAINT
Q16A Frequency Percent
Never Heard/Used 302 95.57
In Your Lifetime 6 1.99
Since School Began 3 1.09
In the Past Month 4 1.35
Frequency Missing = 57.905241532
RECENT INHALANT USE -
WHITEOUT, CORRECTION FLUID,
MAGIC MARKERS
Q16B Frequency Percent
Never Heard/Used 280 91.89
In Your Lifetime 17 5.67
Since School Began 1 0.28
In the Past Month 7 2.17
Frequency Missing = 69.062400838
RECENT INHALANT USE -
COMPUTER DUSTING SPRAYS
Q16C Frequency Percent
Never Heard/Used 289 97.68
In Your Lifetime 4 1.27
In the Past Month 3 1.05
Frequency Missing = 78.495829248
RECENT INHALANT USE - HELI
BUTANE, PROPANE, WHIPP
REFRIGERANTS/FR
Q16D Frequency Pe
Never Heard/Used 292
In Your Lifetime 8
Since School Began 2
In the Past Month 2
Frequency Missing = 68.8068982
RECENT INHALANT USE - GL
Q16E Frequency Per
Never Heard/Used 273 9
In Your Lifetime 3
Since School Began 1
In the Past Month 2
Frequency Missing = 94.5480208
RECENT INHALANT U
TOLUENE, PAINT THINN
OTHER SOLVE
Q16F Frequency Per
Never Heard/Used 284 9
In Your Lifetime 2
Since School Began 2
In the Past Month 2
Frequency Missing = 83.5638828
RECENT INHALANT U
GASOLINE, OCTANE BOOST
CARBURETOR CLEAN
Q16G Frequency Per
Never Heard/Used 279 9
In Your Lifetime 3
In the Past Month 4
Frequency Missing = 88.8873535

8/3/2019 BELL COUNTY - Academy ISD - 2011 Texas School Survey of Drug and Alcohol Use
http://slidepdf.com/reader/full/bell-county-academy-isd-2011-texas-school-survey-of-drug-and-alcohol-use 114/209
Academy
Spring 2011
The frequencies have been weighted so that the analysis reflects
the distribution of students by grade level in the district
©Copyright 2011, Texas A&M University
All rights reserved.
Page 72 of 84
RECENT INHALANT USE - OTHER
AEROSOLS/SPRAYS
Q16H Frequency Percent
Never Heard/Used 311 97.30
In Your Lifetime 3 0.89
Since School Began 3 1.08
In the Past Month 2 0.74
Frequency Missing = 54.839056782
RECENT CIGARETTE USE
Q17A Frequency Percent
Never Heard/Used 253 78.46
In Your Lifetime 31 9.45
Since School Began 6 1.94
In the Past Month 33 10.15
Frequency Missing = 51.209676547
RECENT SMOKELESS TOBACCO
USE
Q17B Frequency Percent
Never Heard/Used 259 87.75
In Your Lifetime 7 2.53
Since School Began 5 1.73
In the Past Month 24 7.99
Frequency Missing = 78.452510008
RECENT BEER USE
Q17C Frequency Percent
Never Heard/Used 169 57.12
In Your Lifetime 51 17.34
Since School Began 30 10.25
In the Past Month 45 15.29
Frequency Missing = 78.324953168
RECENT WINE COOLER USE
Q17D Frequency PercentNever Heard/Used 194 63.07
In Your Lifetime 43 13.93
Since School Began 27 8.94
In the Past Month 43 14.07
Frequency Missing = 66.897679106
RECENT WINE USE
Q17E Frequency Percent
Never Heard/Used 183 63.03
In Your Lifetime 60 20.66
Since School Began 16 5.58
In the Past Month 31 10.73
Frequency Missing = 83.673502761
RECENT LIQUOR USE
Q17F Frequency Percent
Never Heard/Used 192 63.61
In Your Lifetime 35 11.58
Since School Began 31 10.15
In the Past Month 44 14.65
Frequency Missing = 71.759616961
RECENT INHALANT USE
Q17G Frequency Percent
Never Heard/Used 286 92.55
In Your Lifetime 13 4.28
Since School Began 3 0.85
In the Past Month 7 2.32
Frequency Missing = 65.492188859
RECENT MARIJUANA USE
Q18A Frequency Percent
Never Heard/Used 268 84.82
In Your Lifetime 12 3.82
Since School Began 10 3.31
In the Past Month 25 8.05
Frequency Missing = 58.445824685
RECENT COCAINE USEQ18B Frequency Percent
Never Heard/Used 301 98.86
In Your Lifetime 1 0.32
Since School Began 1 0.32
In the Past Month 2 0.50
Frequency Missing = 69.6429888
RECENT CRACK
Q18C Frequency Per
Never Heard/Used 277 9
In Your Lifetime 3
Since School Began 1
Frequency Missing = 93.1308084
RECENT HALLUCINOGEN
Q18E Frequency Per
Never Heard/Used 282 9
In Your Lifetime 2
Since School Began 2
In the Past Month 4
Frequency Missing = 84.521283
RECENT UPPER U
Q18F Frequency Per
Never Heard/Used 265 9
In Your Lifetime 2
In the Past Month 6
Frequency Missing = 100.69540
RECENT DOWNER U
Q18G Frequency Per
Never Heard/Used 266 9
In Your Lifetime 1
In the Past Month 4
Frequency Missing = 102.295310
RECENT ROHYPNOL
Q18H Frequency Per
Never Heard/Used 282 9In Your Lifetime 1
Since School Began 1
In the Past Month 1
Frequency Missing = 89.4295761

8/3/2019 BELL COUNTY - Academy ISD - 2011 Texas School Survey of Drug and Alcohol Use
http://slidepdf.com/reader/full/bell-county-academy-isd-2011-texas-school-survey-of-drug-and-alcohol-use 115/209
Academy
Spring 2011
The frequencies have been weighted so that the analysis reflects
the distribution of students by grade level in the district
©Copyright 2011, Texas A&M University
All rights reserved.
Page 73 of 84
RECENT STEROID USE
Q18I Frequency Percent
Never Heard/Used 266 95.58
In Your Lifetime 6 2.23
Since School Began 3 0.93
In the Past Month 3 1.25
Frequency Missing = 95.844553568
RECENT ECSTASY USE
Q18J Frequency Percent
Never Heard/Used 277 96.77
In Your Lifetime 1 0.35
Since School Began 3 0.98
In the Past Month 5 1.90
Frequency Missing = 87.69604496
RECENT HEROIN USE
Q18K Frequency Percent
Never Heard/Used 295 99.21
Since School Began 2 0.79
Frequency Missing = 77.040137641
TOBACCO USE IN PAST MONTH
q19a Frequency Percent
Never Heard/Used 305 85.61
1-2 times 24 6.78
3-10 times 8 2.37
11+ times 19 5.25
Frequency Missing = 17.57369584
ALCOHOL USE IN PAST MONTH
q19b Frequency Percent
Never Heard/Used 258 72.91
1-2 times 56 15.87
3-10 times 29 8.06
11+ times 11 3.15
Frequency Missing = 19.551371313
INHALANT USE IN PAST MONTH
q19c Frequency Percent
Never Heard/Used 344 98.06
1-2 times 4 1.03
3-10 times 2 0.67
11+ times 1 0.24
Frequency Missing = 23.708466218
MARIJUANA USE IN PAST
MONTH
q19d Frequency Percent
Never Heard/Used 306 90.43
1-2 times 11 3.39
3-10 times 10 2.86
11+ times 11 3.32
Frequency Missing = 35.810810373
COCAINE USE IN PAST MONTH
q19e Frequency Percent
Never Heard/Used 334 98.57
1-2 times 5 1.43
Frequency Missing = 35.093604836
CRACK USE IN PAST MONTH
q19f Frequency Percent
Never Heard/Used 346 98.96
1-2 times 2 0.56
3-10 times 2 0.48
Frequency Missing = 23.939021508
CLOSE FRIENDS USE
CIGARETTES
q20a Frequency Percent
Never heard/None 214 60.59
A few 85 24.04
Some 40 11.23Most 12 3.47
All 2 0.67
Frequency Missing = 20.914172241
CLOSE FRIENDS U
SMOKELESS TOBAC
q20b Frequency Perc
Never heard/None 227 6
A few 63 1
Some 31
Most 18
All 5
Frequency Missing = 28.5080726
CLOSE FRIENDS USE BE
q20c Frequency Perc
Never heard/None 155 4
A few 83 24
Some 54 1
Most 45 1
All 7
Frequency Missing = 30.1089409
CLOSE FRIENDS USE WI
COOLE
q20d Frequency Perc
Never heard/None 201 5
A few 73 2
Some 42 1
Most 23
All 4
Frequency Missing = 31.4654041
CLOSE FRIENDS USE WI
q20e Frequency Perc
Never heard/None 225 6
A few 66 1
Some 34
Most 13
All 2 0
Frequency Missing = 34.6796117
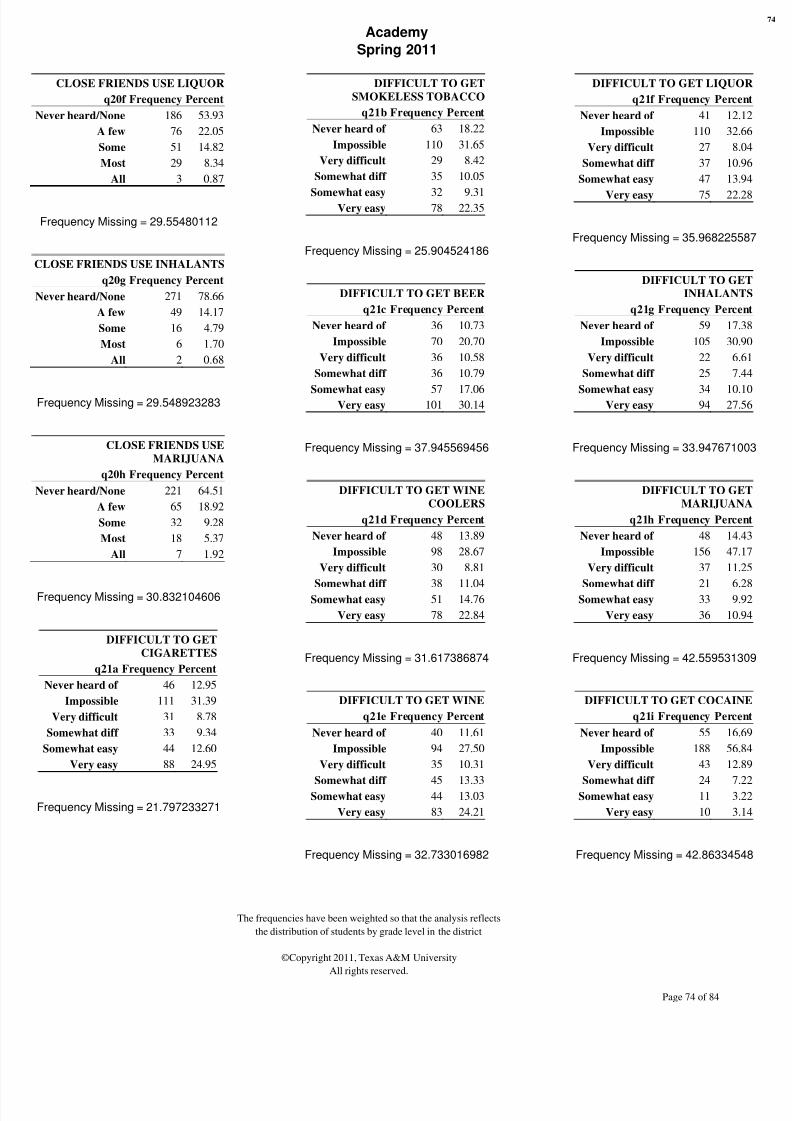
8/3/2019 BELL COUNTY - Academy ISD - 2011 Texas School Survey of Drug and Alcohol Use
http://slidepdf.com/reader/full/bell-county-academy-isd-2011-texas-school-survey-of-drug-and-alcohol-use 116/209
Academy
Spring 2011
The frequencies have been weighted so that the analysis reflects
the distribution of students by grade level in the district
©Copyright 2011, Texas A&M University
All rights reserved.
Page 74 of 84
CLOSE FRIENDS USE LIQUOR
q20f Frequency Percent
Never heard/None 186 53.93
A few 76 22.05
Some 51 14.82
Most 29 8.34
All 3 0.87
Frequency Missing = 29.55480112
CLOSE FRIENDS USE INHALANTS
q20g Frequency Percent
Never heard/None 271 78.66
A few 49 14.17
Some 16 4.79
Most 6 1.70
All 2 0.68
Frequency Missing = 29.548923283
CLOSE FRIENDS USE
MARIJUANA
q20h Frequency Percent
Never heard/None 221 64.51
A few 65 18.92
Some 32 9.28
Most 18 5.37
All 7 1.92
Frequency Missing = 30.832104606
DIFFICULT TO GET
CIGARETTES
q21a Frequency Percent
Never heard of 46 12.95
Impossible 111 31.39
Very difficult 31 8.78
Somewhat diff 33 9.34
Somewhat easy 44 12.60
Very easy 88 24.95
Frequency Missing = 21.797233271
DIFFICULT TO GET
SMOKELESS TOBACCO
q21b Frequency Percent
Never heard of 63 18.22
Impossible 110 31.65
Very difficult 29 8.42
Somewhat diff 35 10.05
Somewhat easy 32 9.31Very easy 78 22.35
Frequency Missing = 25.904524186
DIFFICULT TO GET BEER
q21c Frequency Percent
Never heard of 36 10.73
Impossible 70 20.70
Very difficult 36 10.58
Somewhat diff 36 10.79
Somewhat easy 57 17.06Very easy 101 30.14
Frequency Missing = 37.945569456
DIFFICULT TO GET WINE
COOLERS
q21d Frequency Percent
Never heard of 48 13.89
Impossible 98 28.67
Very difficult 30 8.81
Somewhat diff 38 11.04Somewhat easy 51 14.76
Very easy 78 22.84
Frequency Missing = 31.617386874
DIFFICULT TO GET WINE
q21e Frequency Percent
Never heard of 40 11.61
Impossible 94 27.50
Very difficult 35 10.31
Somewhat diff 45 13.33Somewhat easy 44 13.03
Very easy 83 24.21
Frequency Missing = 32.733016982
DIFFICULT TO GET LIQUO
q21f Frequency Perce
Never heard of 41 12.
Impossible 110 32.
Very difficult 27 8.
Somewhat diff 37 10.
Somewhat easy 47 13.
Very easy 75 22.
Frequency Missing = 35.9682255
DIFFICULT TO GE
INHALANT
q21g Frequency Perce
Never heard of 59 17.
Impossible 105 30.
Very difficult 22 6.
Somewhat diff 25 7.
Somewhat easy 34 10.Very easy 94 27.
Frequency Missing = 33.9476710
DIFFICULT TO GE
MARIJUAN
q21h Frequency Perce
Never heard of 48 14.
Impossible 156 47.
Very difficult 37 11.
Somewhat diff 21 6.Somewhat easy 33 9.
Very easy 36 10.
Frequency Missing = 42.5595313
DIFFICULT TO GET COCAIN
q21i Frequency Perce
Never heard of 55 16.
Impossible 188 56.
Very difficult 43 12.
Somewhat diff 24 7.Somewhat easy 11 3.
Very easy 10 3.
Frequency Missing = 42.863345

8/3/2019 BELL COUNTY - Academy ISD - 2011 Texas School Survey of Drug and Alcohol Use
http://slidepdf.com/reader/full/bell-county-academy-isd-2011-texas-school-survey-of-drug-and-alcohol-use 117/209
Academy
Spring 2011
The frequencies have been weighted so that the analysis reflects
the distribution of students by grade level in the district
©Copyright 2011, Texas A&M University
All rights reserved.
Page 75 of 84
DIFFICULT TO GET CRACK
q21j Frequency Percent
Never heard of 59 18.07
Impossible 185 56.29
Very difficult 40 12.03
Somewhat diff 26 8.04
Somewhat easy 9 2.77
Very easy 9 2.79
Frequency Missing = 45.274324486
DIFFICULT TO GET
HALLUCINOGENS
q21l Frequency Percent
Never heard of 127 38.33
Impossible 131 39.63
Very difficult 32 9.64
Somewhat diff 21 6.38
Somewhat easy 11 3.30Very easy 9 2.72
Frequency Missing = 43.216328499
DIFFICULT TO GET UPPERS
q21m Frequency Percent
Never heard of 131 41.29
Impossible 109 34.34
Very difficult 36 11.35
Somewhat diff 17 5.39
Somewhat easy 10 3.11Very easy 14 4.53
Frequency Missing = 56.542657654
DIFFICULT TO GET DOWNERS
q21n Frequency Percent
Never heard of 133 41.74
Impossible 110 34.41
Very difficult 37 11.62
Somewhat diff 16 4.98
Somewhat easy 9 2.72Very easy 15 4.54
Frequency Missing = 54.132010253
DIFFICULT TO GET
ROHYPNOL
q21o Frequency Percent
Never heard of 133 41.24
Impossible 120 37.38
Very difficult 32 9.83
Somewhat diff 18 5.74
Somewhat easy 8 2.48Very easy 11 3.33
Frequency Missing = 52.660186005
DIFFICULT TO GET STEROIDS
q21p Frequency Percent
Never heard of 52 16.36
Impossible 165 51.68
Very difficult 38 11.97
Somewhat diff 29 9.01
Somewhat easy 18 5.56Very easy 17 5.42
Frequency Missing = 54.69901855
DIFFICULT TO GET ECSTASY
q21q Frequency Percent
Never heard of 97 30.43
Impossible 137 43.10
Very difficult 38 11.94
Somewhat diff 19 5.90
Somewhat easy 13 3.96Very easy 15 4.68
Frequency Missing = 55.3256633
DIFFICULT TO GET HEROIN
q21r Frequency Percent
Never heard of 73 22.30
Impossible 180 55.09
Very difficult 40 12.38
Somewhat diff 16 4.91
Somewhat easy 8 2.50Very easy 9 2.82
Frequency Missing = 47.932876902
AGE WHEN FIRST USED
CIGARETTE
q22a Frequency Percen
9 or younger 12 15.5
10 years old 5 6.0
11 years old 3 4.4
12 years old 9 11.7
13 years old 7 9.414 years old 9 11.6
15 years old 17 21.6
16 years old 8 10.3
17 years old 4 5.4
18 or older 3 3.6
Frequency Missing = 296.174585
AGE WHEN FIRST USED
SMOKELESS TOBACCO
q22b Frequency Percen
9 or younger 2 3.7
10 years old 4 8.9
11 years old 3 6.2
12 years old 4 9.0
13 years old 11 22.2
14 years old 6 12.2
15 years old 7 15.2
16 years old 4 7.9
17 years old 6 12.2
18 or older 1 2.0
Frequency Missing = 325.867870
AGE WHEN FIRST USED
BEER
q22c Frequency Percen
9 or younger 37 23.7
10 years old 14 8.8
11 years old 12 7.6
12 years old 25 16.2
13 years old 24 15.8
14 years old 12 7.9
15 years old 18 11.5
16 years old 9 5.717 years old 4 2.4
Frequency Missing = 219.541749

8/3/2019 BELL COUNTY - Academy ISD - 2011 Texas School Survey of Drug and Alcohol Use
http://slidepdf.com/reader/full/bell-county-academy-isd-2011-texas-school-survey-of-drug-and-alcohol-use 118/209
Academy
Spring 2011
The frequencies have been weighted so that the analysis reflects
the distribution of students by grade level in the district
©Copyright 2011, Texas A&M University
All rights reserved.
Page 76 of 84
AGE WHEN FIRST USED
WINE COOLERS
q22d Frequency Percent
9 or younger 18 15.33
10 years old 10 8.05
11 years old 7 6.16
12 years old 23 19.63
13 years old 15 12.2814 years old 16 13.05
15 years old 14 12.06
16 years old 12 10.33
17 years old 1 1.14
18 or older 2 1.98
Frequency Missing = 254.95225456
AGE WHEN FIRST USED
WINE
q22e Frequency Percent
9 or younger 18 16.53
10 years old 10 8.57
11 years old 12 10.56
12 years old 22 19.45
13 years old 13 11.37
14 years old 12 11.07
15 years old 9 8.18
16 years old 10 9.13
17 years old 6 5.14
Frequency Missing = 262.49735529
AGE WHEN FIRST USED
LIQUOR
q22f Frequency Percent
9 or younger 14 11.53
10 years old 7 5.83
11 years old 6 5.01
12 years old 14 11.70
13 years old 14 12.26
14 years old 14 11.47
15 years old 26 22.19
16 years old 17 14.44
17 years old 4 3.5818 or older 2 1.99
Frequency Missing = 255.95725946
AGE WHEN FIRST USED
INHALANTS
q22g Frequency Percent
9 or younger 2 7.10
10 years old 2 6.92
11 years old 4 16.39
12 years old 3 10.89
13 years old 6 23.5514 years old 4 18.89
15 years old 4 16.26
Frequency Missing = 350.35306522
AGE WHEN FIRST USED
MARIJUANA
q22h Frequency Percent
9 or younger 2 4.35
10 years old 3 6.62
11 years old 1 1.61
12 years old 2 4.00
13 years old 10 19.93
14 years old 8 15.50
15 years old 8 16.53
16 years old 10 20.17
17 years old 4 8.54
18 or older 1 2.74
Frequency Missing = 324.54184361
AGE WHEN FIRST USED
COCAINE
q22i Frequency Percent
11 years old 1 16.22
12 years old 1 13.90
13 years old 3 44.90
17 years old 2 24.98
Frequency Missing = 367.95828186
AGE WHEN FIRST USED
CRACK
q22j Frequency Percent
9 or younger 1 50.00
11 years old 1 50.00
Frequency Missing = 372.32051642
AGE WHEN FIRST USED
HALLUCINOGENS
q22l Frequency Percen
11 years old 2 50.66
13 years old 1 24.67
15 years old 1 24.67
Frequency Missing = 370.768334
AGE WHEN FIRST USED
UPPER
q22m Frequency Percen
9 or younger 1 6.8
11 years old 1 11.0
12 years old 2 14.5
13 years old 1 7.9
14 years old 1 7.9
15 years old 2 17.4
17 years old 3 23.2
18 or older 1 11.0
Frequency Missing = 361.672978
AGE WHEN FIRST USED
DOWNERS
q22n Frequency Percen
11 years old 1 15.42
12 years old 1 9.06
13 years old 1 11.14
14 years old 2 18.13
15 years old 3 30.84
18 or older 1 15.42
Frequency Missing = 365.202353
AGE WHEN FIRST USED
ROHYPNOL
q22o Frequency Percen
11 years old 1 31.87
14 years old 1 37.87
15 years old 1 30.26
Frequency Missing = 371.364973

8/3/2019 BELL COUNTY - Academy ISD - 2011 Texas School Survey of Drug and Alcohol Use
http://slidepdf.com/reader/full/bell-county-academy-isd-2011-texas-school-survey-of-drug-and-alcohol-use 119/209
Academy
Spring 2011
The frequencies have been weighted so that the analysis reflects
the distribution of students by grade level in the district
©Copyright 2011, Texas A&M University
All rights reserved.
Page 77 of 84
AGE WHEN FIRST USED
STEROIDS
q22p Frequency Percent
9 or younger 3 29.39
12 years old 2 20.11
14 years old 1 6.95
15 years old 1 8.70
16 years old 2 21.7017 years old 2 13.16
Frequency Missing = 362.52828867
AGE WHEN FIRST USED
ECSTASY
q22q Frequency Percent
12 years old 3 27.40
13 years old 3 22.21
14 years old 1 8.61
15 years old 2 17.06
16 years old 1 11.70
17 years old 2 13.02
Frequency Missing = 362.40831486
AGE WHEN FIRST USED
HEROIN
q22r Frequency Percent
11 years old 1 100.00
Frequency Missing = 373.16025821
HOW OFTEN NORMALLY USE
CIGARETTES
q23a Frequency Percent
Every day 6 2.05
Several times/wk 6 1.96
Several times/mo 4 1.51
About once/month 14 4.87
About once/year 7 2.22
< once/year 26 8.87
Never used 234 78.53
Frequency Missing = 76.469614847
HOW OFTEN NORMALLY USE
SMOKELESS TOBACCO
q23b Frequency Percent
Every day 9 3.35
Several times/wk 4 1.36
About once/month 5 1.73
About once/year 6 2.27
< once/year 10 3.55Never used 244 87.74
Frequency Missing = 96.445517809
HOW OFTEN NORMALLY USE
BEER
q23c Frequency Percent
Several times/wk 5 1.71
Several times/mo 21 7.47
About once/month 26 9.23
About once/year 34 11.85
< once/year 31 11.10
Never used 166 58.64
Frequency Missing = 90.268943591
HOW OFTEN NORMALLY USE
WINE COOLERS
q23d Frequency Percent
Several times/wk 1 0.49
Several times/mo 13 4.53
About once/month 25 8.84
About once/year 34 12.16
< once/year 22 7.74
Never used 185 66.24
Frequency Missing = 95.23574143
HOW OFTEN NORMALLY USE
WINE
q23e Frequency Percent
Several times/wk 2 0.84
Several times/mo 9 3.13
About once/month 17 6.30
About once/year 31 11.30
< once/year 36 12.89
Never used 182 65.54
Frequency Missing = 96.424554373
HOW OFTEN NORMALLY U
LIQU
q23f Frequency Per
Several times/wk 2
Several times/mo 18
About once/month 18
About once/year 32 1
< once/year 24
Never used 186 6
Frequency Missing = 93.5507450
HOW OFTEN NORMALLY U
INHALAN
q23g Frequency Per
Several times/wk 2
Several times/mo 2
About once/month 3
About once/year 3
< once/year 10
Never used 228 9
Frequency Missing = 127.000038
HOW OFTEN NORMALLY U
MARIJUA
q23h Frequency Per
Every day 6
Several times/wk 6
Several times/mo 7
About once/month 5
About once/year 6
< once/year 8
Never used 213 8
Frequency Missing = 122.845241
HOW OFTEN NORMALLY U
COCAI
q23i Frequency PercSeveral times/mo 1 0
About once/year 2 1
Never used 228 98
Frequency Missing = 142.157659
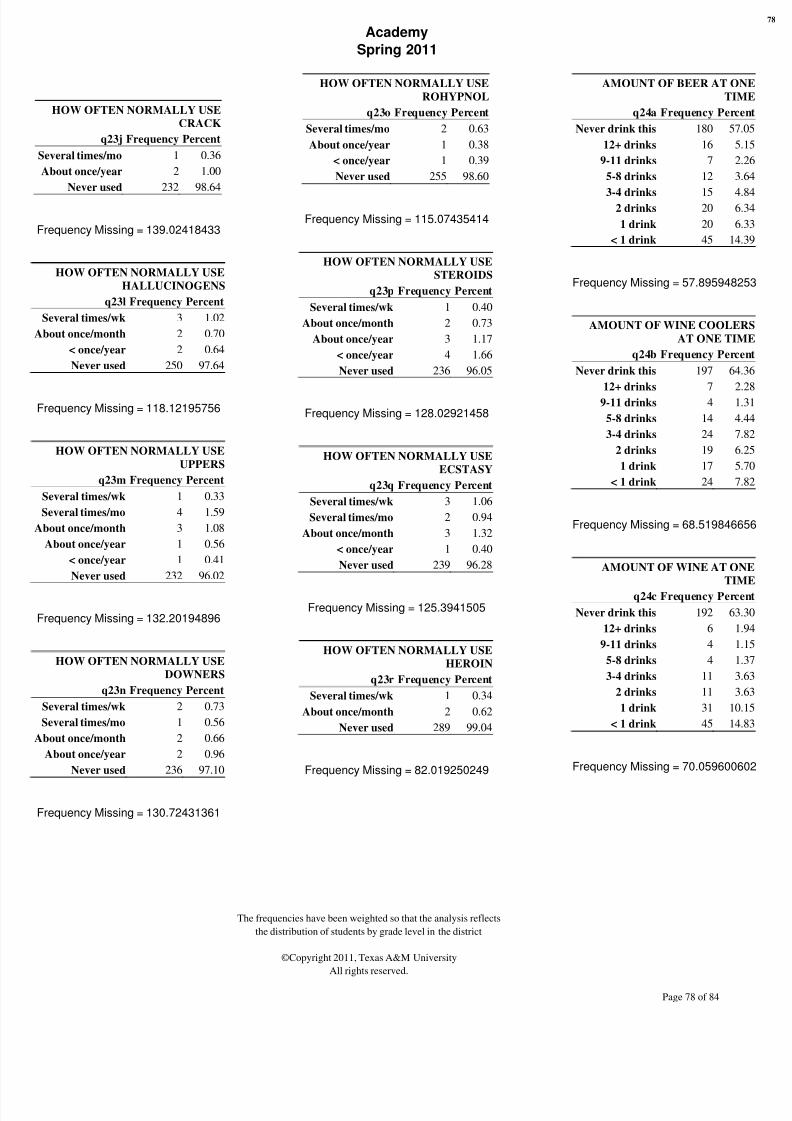
8/3/2019 BELL COUNTY - Academy ISD - 2011 Texas School Survey of Drug and Alcohol Use
http://slidepdf.com/reader/full/bell-county-academy-isd-2011-texas-school-survey-of-drug-and-alcohol-use 120/209
Academy
Spring 2011
The frequencies have been weighted so that the analysis reflects
the distribution of students by grade level in the district
©Copyright 2011, Texas A&M University
All rights reserved.
Page 78 of 84
HOW OFTEN NORMALLY USE
CRACK
q23j Frequency Percent
Several times/mo 1 0.36
About once/year 2 1.00
Never used 232 98.64
Frequency Missing = 139.02418433
HOW OFTEN NORMALLY USE
HALLUCINOGENS
q23l Frequency Percent
Several times/wk 3 1.02
About once/month 2 0.70
< once/year 2 0.64
Never used 250 97.64
Frequency Missing = 118.12195756
HOW OFTEN NORMALLY USE
UPPERS
q23m Frequency Percent
Several times/wk 1 0.33
Several times/mo 4 1.59
About once/month 3 1.08
About once/year 1 0.56
< once/year 1 0.41
Never used 232 96.02
Frequency Missing = 132.20194896
HOW OFTEN NORMALLY USE
DOWNERS
q23n Frequency Percent
Several times/wk 2 0.73
Several times/mo 1 0.56
About once/month 2 0.66
About once/year 2 0.96
Never used 236 97.10
Frequency Missing = 130.72431361
HOW OFTEN NORMALLY USE
ROHYPNOL
q23o Frequency Percent
Several times/mo 2 0.63
About once/year 1 0.38
< once/year 1 0.39
Never used 255 98.60
Frequency Missing = 115.07435414
HOW OFTEN NORMALLY USE
STEROIDS
q23p Frequency Percent
Several times/wk 1 0.40
About once/month 2 0.73
About once/year 3 1.17
< once/year 4 1.66
Never used 236 96.05
Frequency Missing = 128.02921458
HOW OFTEN NORMALLY USE
ECSTASY
q23q Frequency Percent
Several times/wk 3 1.06
Several times/mo 2 0.94
About once/month 3 1.32
< once/year 1 0.40
Never used 239 96.28
Frequency Missing = 125.3941505
HOW OFTEN NORMALLY USE
HEROIN
q23r Frequency Percent
Several times/wk 1 0.34
About once/month 2 0.62
Never used 289 99.04
Frequency Missing = 82.019250249
AMOUNT OF BEER AT ON
TIM
q24a Frequency Perc
Never drink this 180 57
12+ drinks 16 5
9-11 drinks 7 2
5-8 drinks 12 3
3-4 drinks 15 42 drinks 20 6
1 drink 20 6
< 1 drink 45 14
Frequency Missing = 57.8959482
AMOUNT OF WINE COOLE
AT ONE TIM
q24b Frequency Perc
Never drink this 197 64
12+ drinks 7 2
9-11 drinks 4 1
5-8 drinks 14 4
3-4 drinks 24 7
2 drinks 19 6
1 drink 17 5
< 1 drink 24 7
Frequency Missing = 68.5198466
AMOUNT OF WINE AT ON
TIM
q24c Frequency Perc
Never drink this 192 63
12+ drinks 6 1
9-11 drinks 4 1
5-8 drinks 4 1
3-4 drinks 11 3
2 drinks 11 3
1 drink 31 10
< 1 drink 45 14
Frequency Missing = 70.0596006
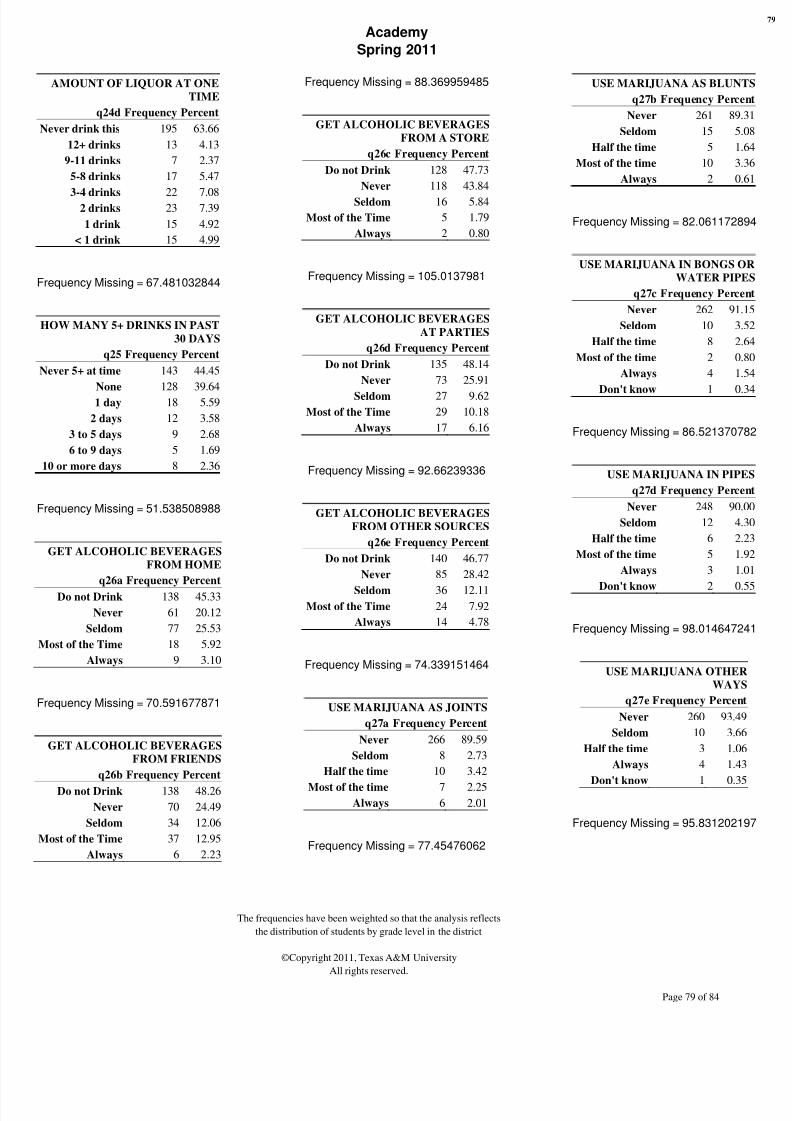
8/3/2019 BELL COUNTY - Academy ISD - 2011 Texas School Survey of Drug and Alcohol Use
http://slidepdf.com/reader/full/bell-county-academy-isd-2011-texas-school-survey-of-drug-and-alcohol-use 121/209
Academy
Spring 2011
The frequencies have been weighted so that the analysis reflects
the distribution of students by grade level in the district
©Copyright 2011, Texas A&M University
All rights reserved.
Page 79 of 84
AMOUNT OF LIQUOR AT ONE
TIME
q24d Frequency Percent
Never drink this 195 63.66
12+ drinks 13 4.13
9-11 drinks 7 2.37
5-8 drinks 17 5.47
3-4 drinks 22 7.082 drinks 23 7.39
1 drink 15 4.92
< 1 drink 15 4.99
Frequency Missing = 67.481032844
HOW MANY 5+ DRINKS IN PAST
30 DAYS
q25 Frequency Percent
Never 5+ at time 143 44.45
None 128 39.64
1 day 18 5.59
2 days 12 3.58
3 to 5 days 9 2.68
6 to 9 days 5 1.69
10 or more days 8 2.36
Frequency Missing = 51.538508988
GET ALCOHOLIC BEVERAGES
FROM HOME
q26a Frequency Percent
Do not Drink 138 45.33
Never 61 20.12
Seldom 77 25.53
Most of the Time 18 5.92
Always 9 3.10
Frequency Missing = 70.591677871
GET ALCOHOLIC BEVERAGES
FROM FRIENDS
q26b Frequency Percent
Do not Drink 138 48.26
Never 70 24.49
Seldom 34 12.06
Most of the Time 37 12.95
Always 6 2.23
Frequency Missing = 88.369959485
GET ALCOHOLIC BEVERAGES
FROM A STORE
q26c Frequency Percent
Do not Drink 128 47.73
Never 118 43.84
Seldom 16 5.84
Most of the Time 5 1.79
Always 2 0.80
Frequency Missing = 105.0137981
GET ALCOHOLIC BEVERAGES
AT PARTIES
q26d Frequency Percent
Do not Drink 135 48.14
Never 73 25.91
Seldom 27 9.62
Most of the Time 29 10.18
Always 17 6.16
Frequency Missing = 92.66239336
GET ALCOHOLIC BEVERAGES
FROM OTHER SOURCES
q26e Frequency Percent
Do not Drink 140 46.77
Never 85 28.42
Seldom 36 12.11Most of the Time 24 7.92
Always 14 4.78
Frequency Missing = 74.339151464
USE MARIJUANA AS JOINTS
q27a Frequency Percent
Never 266 89.59
Seldom 8 2.73
Half the time 10 3.42
Most of the time 7 2.25Always 6 2.01
Frequency Missing = 77.45476062
USE MARIJUANA AS BLUN
q27b Frequency Perc
Never 261 89
Seldom 15 5
Half the time 5 1
Most of the time 10 3
Always 2 0
Frequency Missing = 82.0611728
USE MARIJUANA IN BONGS O
WATER PIP
q27c Frequency Perc
Never 262 91
Seldom 10 3
Half the time 8 2
Most of the time 2 0
Always 4 1
Don't know 1 0
Frequency Missing = 86.5213707
USE MARIJUANA IN PIP
q27d Frequency Perc
Never 248 90
Seldom 12 4
Half the time 6 2
Most of the time 5 1
Always 3 1
Don't know 2 0
Frequency Missing = 98.0146472
USE MARIJUANA OTHER
WAY
q27e Frequency Percen
Never 260 93.4
Seldom 10 3.6
Half the time 3 1.0
Always 4 1.4
Don't know 1 0.3
Frequency Missing = 95.8312021

8/3/2019 BELL COUNTY - Academy ISD - 2011 Texas School Survey of Drug and Alcohol Use
http://slidepdf.com/reader/full/bell-county-academy-isd-2011-texas-school-survey-of-drug-and-alcohol-use 122/209

8/3/2019 BELL COUNTY - Academy ISD - 2011 Texas School Survey of Drug and Alcohol Use
http://slidepdf.com/reader/full/bell-county-academy-isd-2011-texas-school-survey-of-drug-and-alcohol-use 123/209

8/3/2019 BELL COUNTY - Academy ISD - 2011 Texas School Survey of Drug and Alcohol Use
http://slidepdf.com/reader/full/bell-county-academy-isd-2011-texas-school-survey-of-drug-and-alcohol-use 124/209
Academy
Spring 2011
The frequencies have been weighted so that the analysis reflects
the distribution of students by grade level in the district
©Copyright 2011, Texas A&M University
All rights reserved.
Page 82 of 84
Frequency Missing = 30.424993668
DRIVEN A CAR AFTER A
GOOD BIT TO DRINK
q33b Frequency Percent
None 306 94.14
1-3 times 16 4.98
4-9 times 1 0.42
10+ times 2 0.47
Frequency Missing = 49.440318557
CRITICIZED BY DATE
BECAUSE OF DRINKING
q33c Frequency Percent
None 294 93.88
1-3 times 16 5.12
4-9 times 1 0.25
10+ times 2 0.74
Frequency Missing = 61.14232962
TROUBLE WITH POLICE
BECAUSE OF DRINKING
q33d Frequency Percent
None 313 98.70
1-3 times 3 1.05
10+ times 1 0.25
Frequency Missing = 57.187163244
TROUBLE WITH FRIENDS
BECAUSE OF DRUG USE
q33e Frequency Percent
None 305 97.85
1-3 times 5 1.64
10+ times 2 0.51
Frequency Missing = 62.53029063
DRIVEN A CAR WHILE
HIGH FROM DRUGS
q33f Frequency Percent
None 296 96.46
1-3 times 4 1.46
4-9 times 1 0.44
10+ times 5 1.64
Frequency Missing = 67.436215183
CRITICIZED BY DATE
BECAUSE OF DRUG USE
q33g Frequency Percent
None 282 96.29
1-3 times 9 2.92
10+ times 2 0.79
Frequency Missing = 81.632415561
TROUBLE WITH POLICE
BECAUSE OF DRUG USE
q33h Frequency Percent
None 295 98.36
1-3 times 3 1.11
10+ times 2 0.53
Frequency Missing = 73.684309803
CLASS DAYS DRUNK ONALCOHOL SINCE SEPT
q34a Frequency Percent
None 288 93.25
1-3 days 15 4.75
4-9 days 5 1.51
10+ days 2 0.49
Frequency Missing = 65.600875355
CLASS DAYS HIGH ON
MARIJUANA SINCE SEPT
q34b Frequency Percent
None 279 93.11
1-3 days 10 3.43
4-9 days 7 2.41
10+ days 3 1.05
Frequency Missing = 74.4004931
CLASS DAYS HIGH ON
INHALANTS SINCE SEPT
q34c Frequency Percent
None 273 96.92
1-3 days 7 2.45
4-9 days 1 0.28
10+ days 1 0.35
Frequency Missing = 91.9805121
CLASS DAYS HIGH ON
OTHER DRUG(S)
q34d Frequency Percent
None 287 97.39
1-3 days 7 2.27
4-9 days 1 0.33
Frequency Missing = 79.3167434
ALCOHOL USE AT PARTI
THIS SCHOOL YEA
q35a Frequency Perc
Never 175 55
Seldom 26 8
Half the time 10 3
Most of the time 28 8
Always 24 7
Don't know 5 1Didn't attend 46 14
Frequency Missing = 59.4917813
DRUG USE AT PARTIES TH
SCHOOL YEA
q35b Frequency Perc
Never 206 67
Seldom 18 5
Half the time 14 4
Most of the time 11 3Always 7 2
Don't know 6 1
Didn't attend 44 14
Frequency Missing = 67.8042660

8/3/2019 BELL COUNTY - Academy ISD - 2011 Texas School Survey of Drug and Alcohol Use
http://slidepdf.com/reader/full/bell-county-academy-isd-2011-texas-school-survey-of-drug-and-alcohol-use 125/209
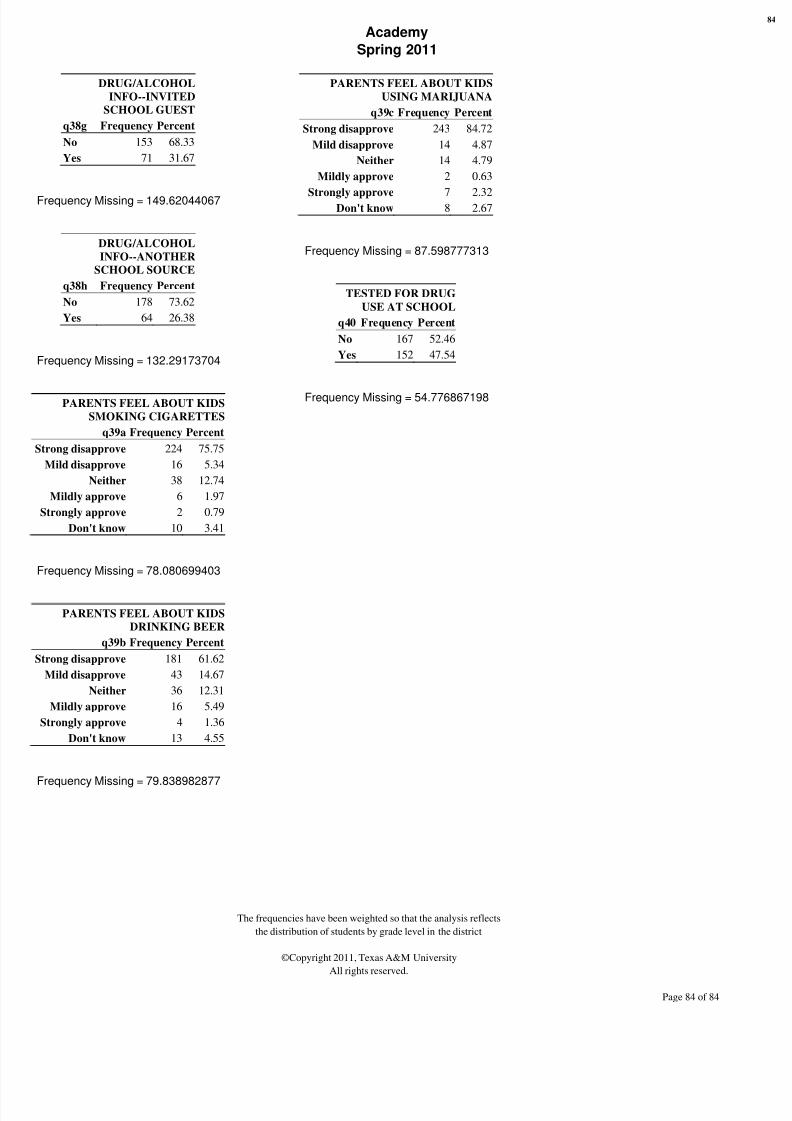
8/3/2019 BELL COUNTY - Academy ISD - 2011 Texas School Survey of Drug and Alcohol Use
http://slidepdf.com/reader/full/bell-county-academy-isd-2011-texas-school-survey-of-drug-and-alcohol-use 126/209
Academy
Spring 2011
The frequencies have been weighted so that the analysis reflects
the distribution of students by grade level in the district
©Copyright 2011, Texas A&M University
All rights reserved.
Page 84 of 84
DRUG/ALCOHOL
INFO--INVITED
SCHOOL GUEST
q38g Frequency Percent
No 153 68.33
Yes 71 31.67
Frequency Missing = 149.62044067
DRUG/ALCOHOL
INFO--ANOTHER
SCHOOL SOURCE
q38h Frequency Percent
No 178 73.62
Yes 64 26.38
Frequency Missing = 132.29173704
PARENTS FEEL ABOUT KIDS
SMOKING CIGARETTES
q39a Frequency Percent
Strong disapprove 224 75.75
Mild disapprove 16 5.34
Neither 38 12.74
Mildly approve 6 1.97
Strongly approve 2 0.79
Don't know 10 3.41
Frequency Missing = 78.080699403
PARENTS FEEL ABOUT KIDS
DRINKING BEER
q39b Frequency Percent
Strong disapprove 181 61.62
Mild disapprove 43 14.67
Neither 36 12.31
Mildly approve 16 5.49
Strongly approve 4 1.36
Don't know 13 4.55
Frequency Missing = 79.838982877
PARENTS FEEL ABOUT KIDS
USING MARIJUANA
q39c Frequency Percent
Strong disapprove 243 84.72
Mild disapprove 14 4.87
Neither 14 4.79
Mildly approve 2 0.63
Strongly approve 7 2.32Don't know 8 2.67
Frequency Missing = 87.598777313
TESTED FOR DRUG
USE AT SCHOOL
q40 Frequency Percent
No 167 52.46
Yes 152 47.54
Frequency Missing = 54.776867198

8/3/2019 BELL COUNTY - Academy ISD - 2011 Texas School Survey of Drug and Alcohol Use
http://slidepdf.com/reader/full/bell-county-academy-isd-2011-texas-school-survey-of-drug-and-alcohol-use 127/209
State: Grades 7-12 Medium
SPRING 2010
©Copyright 2010, Texas A&M University
All rights reserved.Secondary Report-Page 1 of 83
Texas School Survey
of Drug and Alcohol Use
2010
Part II: State Results

8/3/2019 BELL COUNTY - Academy ISD - 2011 Texas School Survey of Drug and Alcohol Use
http://slidepdf.com/reader/full/bell-county-academy-isd-2011-texas-school-survey-of-drug-and-alcohol-use 128/209
State: Grades 7-12 Medium
SPRING 2010
©Copyright 2010, Texas A&M University
All rights reserved.Secondary Report-Page 2 of 83

8/3/2019 BELL COUNTY - Academy ISD - 2011 Texas School Survey of Drug and Alcohol Use
http://slidepdf.com/reader/full/bell-county-academy-isd-2011-texas-school-survey-of-drug-and-alcohol-use 129/209
State: Grades 7-12 Medium
SPRING 2010
©Copyright 2010, Texas A&M University
All rights reserved.Secondary Report-Page 3 of 83
1. General Substance Tables

8/3/2019 BELL COUNTY - Academy ISD - 2011 Texas School Survey of Drug and Alcohol Use
http://slidepdf.com/reader/full/bell-county-academy-isd-2011-texas-school-survey-of-drug-and-alcohol-use 130/209
State: Grades 7-12 Medium
SPRING 2010
©Copyright 2010, Texas A&M University
All rights reserved.Secondary Report-Page 4 of 83

8/3/2019 BELL COUNTY - Academy ISD - 2011 Texas School Survey of Drug and Alcohol Use
http://slidepdf.com/reader/full/bell-county-academy-isd-2011-texas-school-survey-of-drug-and-alcohol-use 131/209
State: Grades 7-12 Medium
SPRING 2010
©Copyright 2010, Texas A&M University
All rights reserved.Secondary Report-Page 5 of 83
Table T-1: How recently, if ever, have you used ..
Past
Month
School
Year
Ever
Used
Never
Used
Any tobacco product?
All 12.5% 17.6% 30.5% 69.5%
Grades 7-8 6.1% 8.9% 19.1% 80.9%Grades 9-12 15.9% 22.2% 36.5% 63.5%
Cigarettes?
All 11.2% 16.0% 28.7% 71.3%
Grades 7-8 5.4% 8.0% 17.9% 82.1%
Grades 9-12 14.3% 20.2% 34.4% 65.6%
Smokeless tobacco?
All 3.7% 5.5% 9.5% 90.5%
Grades 7-8 1.8% 2.6% 5.1% 94.9%
Grades 9-12 4.7% 7.0% 11.8% 88.2%
Table T-2: How often do you normally use ..
Never
Used
Every
Day
Several
Times a
Week
Several
Times a
Month
About
Once a
Month
About
Once a
Year
Less than
Once a
Year
Any tobacco product?
All 72.5% 2.9% 2.7% 3.7% 5.3% 4.7% 8.1%
Grades 7-8 83.1% 0.6% 1.4% 2.1% 3.6% 3.4% 5.8%
Grades 9-12 66.9% 4.1% 3.4% 4.5% 6.3% 5.5% 9.3%
Cigarettes?
All 74.0% 2.3% 2.4% 3.5% 5.2% 4.5% 8.0%
Grades 7-8 84.1% 0.5% 1.2% 2.0% 3.4% 3.2% 5.6%
Grades 9-12 68.6% 3.3% 3.1% 4.3% 6.2% 5.2% 9.3%Smokeless tobacco?
All 91.4% 0.8% 0.7% 0.9% 1.5% 1.6% 3.0%
Grades 7-8 95.7% 0.1% 0.4% 0.5% 0.9% 0.9% 1.5%
Grades 9-12 89.2% 1.2% 0.9% 1.1% 1.8% 2.0% 3.8%
Table T-3: Average age of first use of:
grade1 grade2
Cigarettes
11.3 13.5
Smokeless tobacco
11.6 14.1
Any Tobacco
11.2 13.4
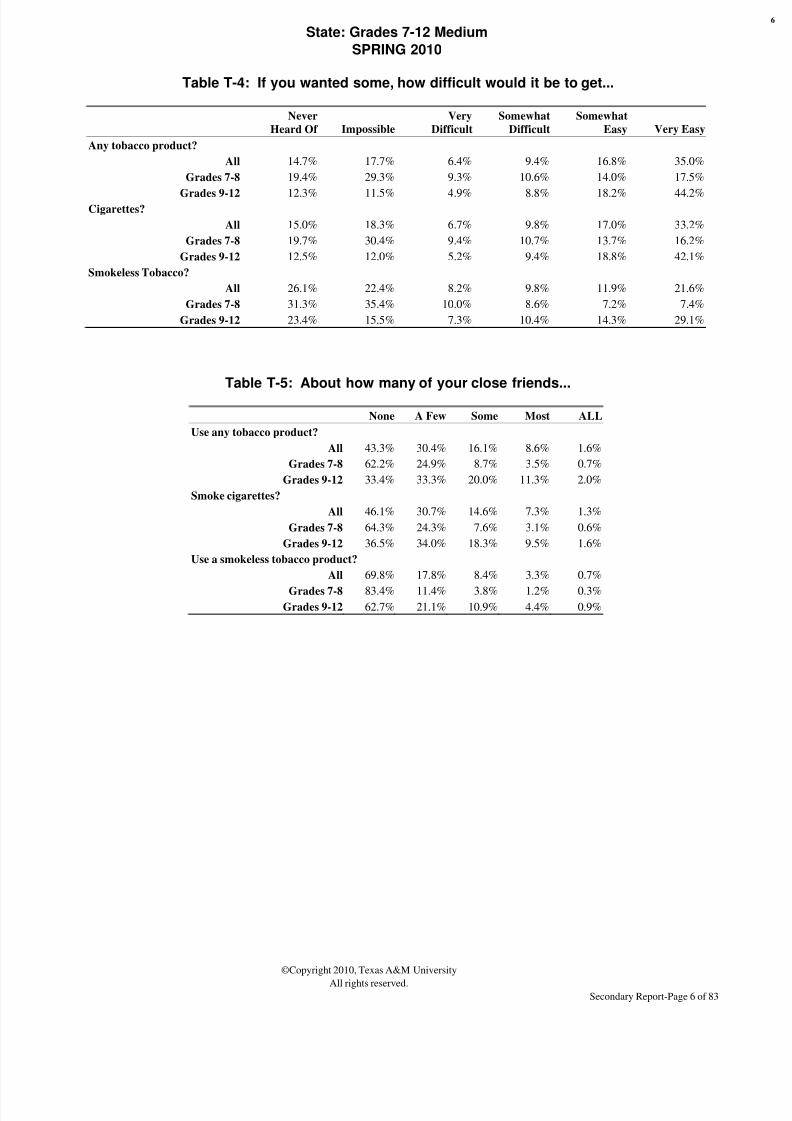
8/3/2019 BELL COUNTY - Academy ISD - 2011 Texas School Survey of Drug and Alcohol Use
http://slidepdf.com/reader/full/bell-county-academy-isd-2011-texas-school-survey-of-drug-and-alcohol-use 132/209
State: Grades 7-12 Medium
SPRING 2010
©Copyright 2010, Texas A&M University
All rights reserved.Secondary Report-Page 6 of 83
Table T-4: If you wanted some, how difficult would it be to get...
Never
Heard Of Impossible
Very
Difficult
Somewhat
Difficult
Somewhat
Easy Very Easy
Any tobacco product?
All 14.7% 17.7% 6.4% 9.4% 16.8% 35.0%
Grades 7-8 19.4% 29.3% 9.3% 10.6% 14.0% 17.5%
Grades 9-12 12.3% 11.5% 4.9% 8.8% 18.2% 44.2%Cigarettes?
All 15.0% 18.3% 6.7% 9.8% 17.0% 33.2%
Grades 7-8 19.7% 30.4% 9.4% 10.7% 13.7% 16.2%
Grades 9-12 12.5% 12.0% 5.2% 9.4% 18.8% 42.1%
Smokeless Tobacco?
All 26.1% 22.4% 8.2% 9.8% 11.9% 21.6%
Grades 7-8 31.3% 35.4% 10.0% 8.6% 7.2% 7.4%
Grades 9-12 23.4% 15.5% 7.3% 10.4% 14.3% 29.1%
Table T-5: About how many of your close friends...
None A Few Some Most ALL
Use any tobacco product?
All 43.3% 30.4% 16.1% 8.6% 1.6%
Grades 7-8 62.2% 24.9% 8.7% 3.5% 0.7%
Grades 9-12 33.4% 33.3% 20.0% 11.3% 2.0%
Smoke cigarettes?
All 46.1% 30.7% 14.6% 7.3% 1.3%
Grades 7-8 64.3% 24.3% 7.6% 3.1% 0.6%
Grades 9-12 36.5% 34.0% 18.3% 9.5% 1.6%
Use a smokeless tobacco product?
All 69.8% 17.8% 8.4% 3.3% 0.7%
Grades 7-8 83.4% 11.4% 3.8% 1.2% 0.3%Grades 9-12 62.7% 21.1% 10.9% 4.4% 0.9%
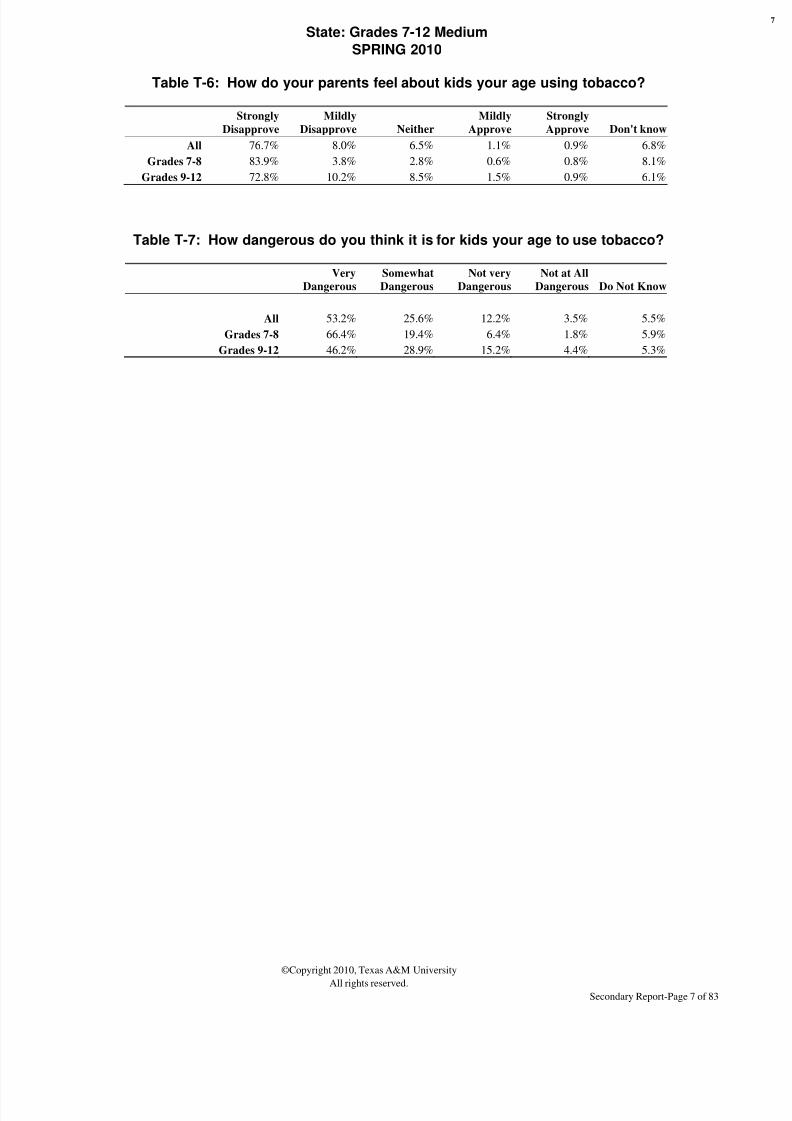
8/3/2019 BELL COUNTY - Academy ISD - 2011 Texas School Survey of Drug and Alcohol Use
http://slidepdf.com/reader/full/bell-county-academy-isd-2011-texas-school-survey-of-drug-and-alcohol-use 133/209
State: Grades 7-12 Medium
SPRING 2010
©Copyright 2010, Texas A&M University
All rights reserved.Secondary Report-Page 7 of 83
Table T-6: How do your parents feel about kids your age using tobacco?
Strongly
Disapprove
Mildly
Disapprove Neither
Mildly
Approve
Strongly
Approve Don't know
All 76.7% 8.0% 6.5% 1.1% 0.9% 6.8%
Grades 7-8 83.9% 3.8% 2.8% 0.6% 0.8% 8.1%
Grades 9-12 72.8% 10.2% 8.5% 1.5% 0.9% 6.1%
Table T-7: How dangerous do you think it is for kids your age to use tobacco?
Very
Dangerous
Somewhat
Dangerous
Not very
Dangerous
Not at All
Dangerous Do Not Know
All 53.2% 25.6% 12.2% 3.5% 5.5%
Grades 7-8 66.4% 19.4% 6.4% 1.8% 5.9%
Grades 9-12 46.2% 28.9% 15.2% 4.4% 5.3%

8/3/2019 BELL COUNTY - Academy ISD - 2011 Texas School Survey of Drug and Alcohol Use
http://slidepdf.com/reader/full/bell-county-academy-isd-2011-texas-school-survey-of-drug-and-alcohol-use 134/209
State: Grades 7-12 Medium
SPRING 2010
©Copyright 2010, Texas A&M University
All rights reserved.Secondary Report-Page 8 of 83
Table A-1: How recently, if ever, have you used...
Past
Month
School
Year
Ever
Used
Never
Used
Any alcohol product?
All 29.0% 40.2% 61.8% 38.2%
Grades 7-8 18.4% 25.4% 48.5% 51.5%
Grades 9-12 34.7% 48.0% 68.8% 31.2%Beer?
All 19.9% 29.2% 48.2% 51.8%
Grades 7-8 11.1% 16.6% 35.9% 64.1%
Grades 9-12 24.5% 35.9% 54.8% 45.2%
Wine coolers?
All 17.5% 26.6% 43.7% 56.3%
Grades 7-8 10.8% 15.9% 30.6% 69.4%
Grades 9-12 21.0% 32.3% 50.6% 49.4%
Wine?
All 12.4% 20.6% 40.4% 59.6%
Grades 7-8 8.4% 13.1% 29.5% 70.5%
Grades 9-12 14.5% 24.5% 46.1% 53.9%
Liquor?
All 18.8% 28.6% 43.5% 56.5%
Grades 7-8 9.0% 14.0% 26.1% 73.9%
Grades 9-12 24.0% 36.3% 52.8% 47.2%

8/3/2019 BELL COUNTY - Academy ISD - 2011 Texas School Survey of Drug and Alcohol Use
http://slidepdf.com/reader/full/bell-county-academy-isd-2011-texas-school-survey-of-drug-and-alcohol-use 135/209
State: Grades 7-12 Medium
SPRING 2010
©Copyright 2010, Texas A&M University
All rights reserved.Secondary Report-Page 9 of 83
Table A-2: How often do you normally use...
Never
Used
Every
Day
Several
Times a
Week
Several
Times a
Month
About
Once a
Month
About
Once a
Year
Less than
Once a
Year
Any alcohol product?
All 44.4% 0.6% 4.2% 12.4% 14.4% 13.5% 10.5%
Grades 7-8 59.2% 0.5% 2.8% 6.3% 9.6% 11.1% 10.6%Grades 9-12 36.6% 0.7% 5.0% 15.6% 17.0% 14.8% 10.4%
Beer?
All 54.3% 0.3% 3.3% 9.6% 11.9% 10.5% 10.2%
Grades 7-8 67.7% 0.2% 2.0% 4.5% 7.6% 8.4% 9.6%
Grades 9-12 47.2% 0.3% 3.9% 12.3% 14.1% 11.7% 10.5%
Wine coolers?
All 59.9% 0.2% 2.1% 7.3% 11.0% 11.0% 8.6%
Grades 7-8 74.7% 0.2% 1.5% 3.5% 6.2% 7.3% 6.6%
Grades 9-12 52.0% 0.2% 2.4% 9.3% 13.5% 13.0% 9.6%
Wine?
All 61.9% 0.1% 1.4% 5.1% 8.2% 12.5% 10.9%
Grades 7-8 74.1% 0.1% 1.1% 2.9% 5.3% 8.3% 8.2%
Grades 9-12 55.3% 0.1% 1.5% 6.2% 9.8% 14.7% 12.4%
Liquor?
All 59.0% 0.2% 2.5% 8.7% 11.4% 10.7% 7.5%
Grades 7-8 76.8% 0.1% 1.3% 3.5% 5.8% 6.7% 5.8%
Grades 9-12 49.5% 0.2% 3.1% 11.5% 14.4% 12.8% 8.4%

8/3/2019 BELL COUNTY - Academy ISD - 2011 Texas School Survey of Drug and Alcohol Use
http://slidepdf.com/reader/full/bell-county-academy-isd-2011-texas-school-survey-of-drug-and-alcohol-use 136/209

8/3/2019 BELL COUNTY - Academy ISD - 2011 Texas School Survey of Drug and Alcohol Use
http://slidepdf.com/reader/full/bell-county-academy-isd-2011-texas-school-survey-of-drug-and-alcohol-use 137/209
State: Grades 7-12 Medium
SPRING 2010
©Copyright 2010, Texas A&M University
All rights reserved.Secondary Report-Page 11 of 83
Table A-6: If you wanted some, how difficult would it be to get...
Never
Heard Of Impossible
Very
Difficult
Somewhat
Difficult
Somewhat
Easy Very Easy
Beer?
All 12.8% 13.6% 6.1% 11.5% 20.6% 35.4%
Grades 7-8 17.4% 22.6% 8.5% 11.7% 15.8% 24.1%
Grades 9-12 10.4% 8.9% 4.9% 11.5% 23.0% 41.3%Wine coolers?
All 17.4% 15.7% 7.2% 12.1% 18.7% 28.9%
Grades 7-8 25.2% 25.9% 9.2% 11.0% 12.2% 16.5%
Grades 9-12 13.3% 10.3% 6.1% 12.7% 22.2% 35.4%
Wine?
All 15.0% 16.3% 8.0% 12.9% 18.2% 29.5%
Grades 7-8 20.0% 27.1% 10.3% 11.7% 12.8% 18.2%
Grades 9-12 12.5% 10.7% 6.8% 13.5% 21.1% 35.4%
Liquor?
All 14.6% 18.2% 8.5% 11.7% 17.3% 29.7%
Grades 7-8 20.7% 30.8% 10.4% 10.0% 11.5% 16.6%
Grades 9-12 11.4% 11.6% 7.5% 12.6% 20.3% 36.6%
Any alcohol product?
All 11.6% 11.2% 5.0% 10.0% 19.9% 42.3%
Grades 7-8 15.8% 18.9% 7.6% 11.2% 16.8% 29.7%
Grades 9-12 9.3% 7.1% 3.6% 9.4% 21.6% 48.9%

8/3/2019 BELL COUNTY - Academy ISD - 2011 Texas School Survey of Drug and Alcohol Use
http://slidepdf.com/reader/full/bell-county-academy-isd-2011-texas-school-survey-of-drug-and-alcohol-use 138/209
State: Grades 7-12 Medium
SPRING 2010
©Copyright 2010, Texas A&M University
All rights reserved.Secondary Report-Page 12 of 83
Table A-7: Since school began in the fall, on how many days (if any) have you...
None 1-3 Times 4-9 Times 10+ Times
Attended class while drunk on alcohol?
All 92.5% 5.7% 0.9% 0.8%
Grades 7-8 93.6% 5.0% 0.7% 0.7%
Grades 9-12 91.9% 6.1% 1.1% 0.9%
Gotten into trouble with teachers because of your drinking?All 98.9% 0.7% 0.1% 0.3%
Grades 7-8 98.9% 0.7% 0.1% 0.3%
Grades 9-12 98.8% 0.8% 0.1% 0.3%
Table A-8: School year use of alcohol by absences and conduct problems:
Average days absent due to
illness or other reasons
Alcohol Users: 4.6
Alcohol Non-use 3.6
Average days conduct problems
reported
Alcohol Users: 3.2
Alcohol Non-use 1.1
Table A-9: During the past twelve months, how many times have you...
None 1-3 Times 4-9 Times 10+ Times
Driven a car when you've had a good bit to drink?All 90.8% 6.9% 1.2% 1.0%
Grades 9-12 90.8% 6.9% 1.2% 1.0%
Gotten into trouble with the police because of drinking?
All 97.3% 2.2% 0.3% 0.2%
Grades 7-8 98.5% 1.1% 0.2% 0.2%
Grades 9-12 96.6% 2.8% 0.3% 0.2%
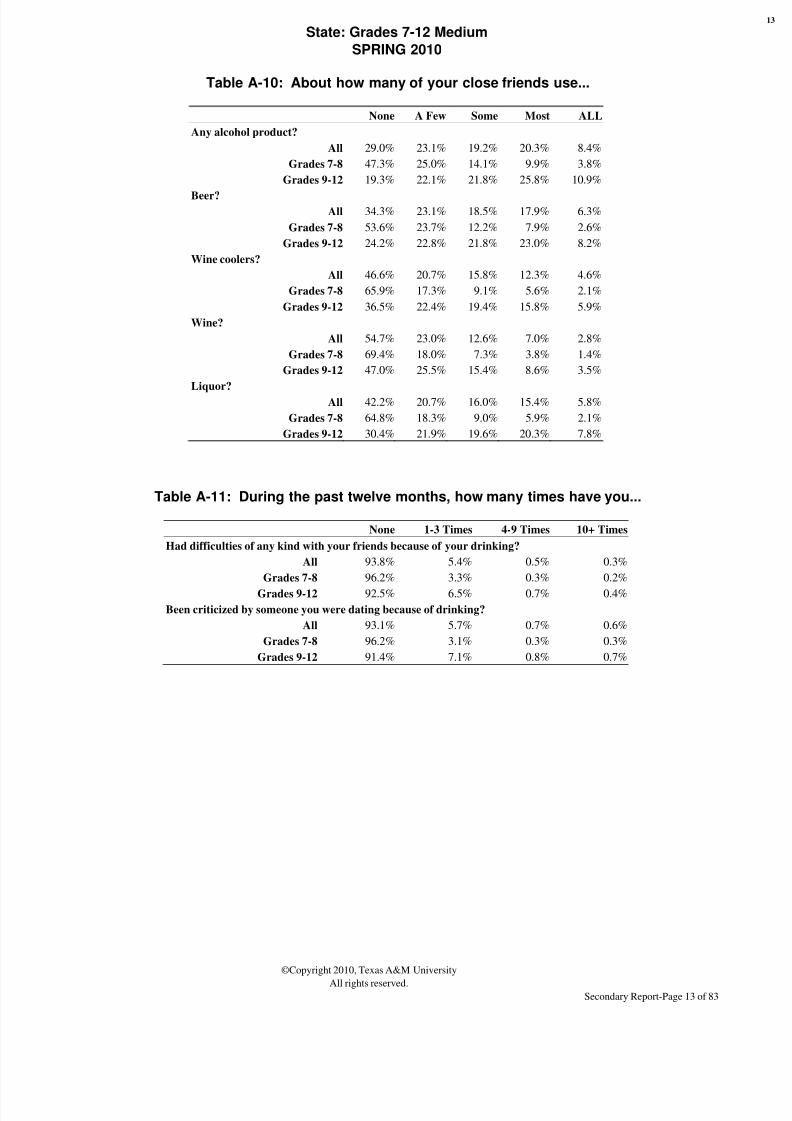
8/3/2019 BELL COUNTY - Academy ISD - 2011 Texas School Survey of Drug and Alcohol Use
http://slidepdf.com/reader/full/bell-county-academy-isd-2011-texas-school-survey-of-drug-and-alcohol-use 139/209
State: Grades 7-12 Medium
SPRING 2010
©Copyright 2010, Texas A&M University
All rights reserved.Secondary Report-Page 13 of 83
Table A-10: About how many of your close friends use...
None A Few Some Most ALL
Any alcohol product?
All 29.0% 23.1% 19.2% 20.3% 8.4%
Grades 7-8 47.3% 25.0% 14.1% 9.9% 3.8%
Grades 9-12 19.3% 22.1% 21.8% 25.8% 10.9%
Beer?All 34.3% 23.1% 18.5% 17.9% 6.3%
Grades 7-8 53.6% 23.7% 12.2% 7.9% 2.6%
Grades 9-12 24.2% 22.8% 21.8% 23.0% 8.2%
Wine coolers?
All 46.6% 20.7% 15.8% 12.3% 4.6%
Grades 7-8 65.9% 17.3% 9.1% 5.6% 2.1%
Grades 9-12 36.5% 22.4% 19.4% 15.8% 5.9%
Wine?
All 54.7% 23.0% 12.6% 7.0% 2.8%
Grades 7-8 69.4% 18.0% 7.3% 3.8% 1.4%
Grades 9-12 47.0% 25.5% 15.4% 8.6% 3.5%
Liquor?
All 42.2% 20.7% 16.0% 15.4% 5.8%
Grades 7-8 64.8% 18.3% 9.0% 5.9% 2.1%
Grades 9-12 30.4% 21.9% 19.6% 20.3% 7.8%
Table A-11: During the past twelve months, how many times have you...
None 1-3 Times 4-9 Times 10+ Times
Had difficulties of any kind with your friends because of your drinking?
All 93.8% 5.4% 0.5% 0.3%
Grades 7-8 96.2% 3.3% 0.3% 0.2%
Grades 9-12 92.5% 6.5% 0.7% 0.4%
Been criticized by someone you were dating because of drinking?
All 93.1% 5.7% 0.7% 0.6%
Grades 7-8 96.2% 3.1% 0.3% 0.3%
Grades 9-12 91.4% 7.1% 0.8% 0.7%

8/3/2019 BELL COUNTY - Academy ISD - 2011 Texas School Survey of Drug and Alcohol Use
http://slidepdf.com/reader/full/bell-county-academy-isd-2011-texas-school-survey-of-drug-and-alcohol-use 140/209
State: Grades 7-12 Medium
SPRING 2010
©Copyright 2010, Texas A&M University
All rights reserved.Secondary Report-Page 14 of 83
Table A-12: Thinking of parties you attended this school year, how often wasalcohol used?
Never Seldom
Half
the Time
Most
of the Time Always Don't know
Didn't
attend
All 42.8% 9.9% 7.0% 11.4% 15.8% 1.9% 11.1%
Grades 7-8 61.9% 10.3% 6.0% 6.0% 4.5% 2.3% 9.0%
Grades 9-12 32.7% 9.7% 7.6% 14.3% 21.7% 1.7% 12.3%
Table A-13: How often, if ever, do you get alcoholic beverages from..
Do Not Drink Never Seldom
Most of
the Time Always
At home?
All 45.7% 25.2% 20.2% 6.2% 2.7%
Grades 7-8 54.5% 23.1% 15.9% 4.8% 1.7%
Grades 9-12 41.0% 26.4% 22.5% 7.0% 3.2%
From friends?
All 42.9% 19.5% 16.0% 15.6% 6.0%
Grades 7-8 54.9% 25.0% 10.7% 7.3% 2.1%
Grades 9-12 36.5% 16.5% 18.8% 20.0% 8.2%
From a store?
All 45.0% 41.4% 7.2% 4.2% 2.2%
Grades 7-8 56.1% 38.1% 3.6% 1.4% 0.8%
Grades 9-12 39.1% 43.1% 9.2% 5.7% 3.0%
At parties?
All 41.1% 16.8% 13.0% 14.9% 14.3%
Grades 7-8 51.8% 20.4% 11.8% 9.8% 6.3%
Grades 9-12 35.4% 14.8% 13.6% 17.6% 18.5%
Other source?
All 45.3% 26.9% 13.1% 7.9% 6.8%Grades 7-8 54.9% 26.1% 9.6% 5.3% 4.0%
Grades 9-12 40.1% 27.3% 15.0% 9.2% 8.3%
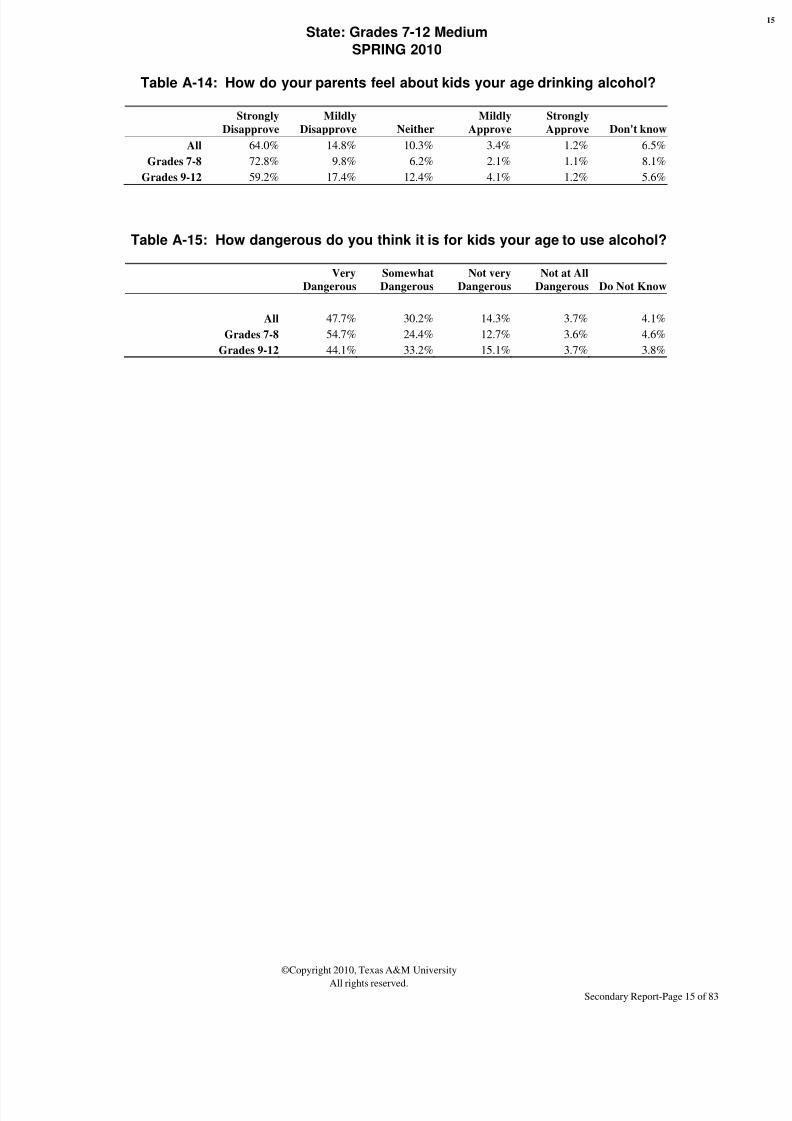
8/3/2019 BELL COUNTY - Academy ISD - 2011 Texas School Survey of Drug and Alcohol Use
http://slidepdf.com/reader/full/bell-county-academy-isd-2011-texas-school-survey-of-drug-and-alcohol-use 141/209
State: Grades 7-12 Medium
SPRING 2010
©Copyright 2010, Texas A&M University
All rights reserved.Secondary Report-Page 15 of 83
Table A-14: How do your parents feel about kids your age drinking alcohol?
Strongly
Disapprove
Mildly
Disapprove Neither
Mildly
Approve
Strongly
Approve Don't know
All 64.0% 14.8% 10.3% 3.4% 1.2% 6.5%
Grades 7-8 72.8% 9.8% 6.2% 2.1% 1.1% 8.1%
Grades 9-12 59.2% 17.4% 12.4% 4.1% 1.2% 5.6%
Table A-15: How dangerous do you think it is for kids your age to use alcohol?
Very
Dangerous
Somewhat
Dangerous
Not very
Dangerous
Not at All
Dangerous Do Not Know
All 47.7% 30.2% 14.3% 3.7% 4.1%
Grades 7-8 54.7% 24.4% 12.7% 3.6% 4.6%
Grades 9-12 44.1% 33.2% 15.1% 3.7% 3.8%

8/3/2019 BELL COUNTY - Academy ISD - 2011 Texas School Survey of Drug and Alcohol Use
http://slidepdf.com/reader/full/bell-county-academy-isd-2011-texas-school-survey-of-drug-and-alcohol-use 142/209
State: Grades 7-12 Medium
SPRING 2010
©Copyright 2010, Texas A&M University
All rights reserved.Secondary Report-Page 16 of 83
Table D-1: How recently, if ever, have you used...
Past
Month
School
Year
Ever
Used
Never
Used
Marijuana?
All 11.4% 16.9% 26.2% 73.8%
Grades 7-8 5.3% 7.7% 13.0% 87.0%
Grades 9-12 14.6% 21.7% 33.2% 66.8%Cocaine?
All 1.5% 2.5% 5.0% 95.0%
Grades 7-8 0.8% 1.3% 2.3% 97.7%
Grades 9-12 1.8% 3.2% 6.4% 93.6%
Crack?
All 0.5% 0.7% 1.6% 98.4%
Grades 7-8 0.6% 0.8% 1.6% 98.4%
Grades 9-12 0.4% 0.7% 1.6% 98.4%
Hallucinogens?
All 1.5% 2.5% 4.6% 95.4%
Grades 7-8 0.8% 1.2% 2.3% 97.7%
Grades 9-12 1.9% 3.2% 5.9% 94.1%
Uppers?
All 2.2% 3.4% 5.3% 94.7%
Grades 7-8 0.9% 1.2% 1.9% 98.1%
Grades 9-12 2.9% 4.5% 7.0% 93.0%
Downers?
All 2.4% 3.6% 5.7% 94.3%
Grades 7-8 0.9% 1.3% 2.0% 98.0%
Grades 9-12 3.2% 4.8% 7.6% 92.4%
Rohypnol?
All 1.0% 1.5% 2.6% 97.4%
Grades 7-8 0.8% 1.2% 2.0% 98.0%
Grades 9-12 1.2% 1.7% 3.0% 97.0%
Steroids?All 0.5% 0.7% 1.4% 98.6%
Grades 7-8 0.4% 0.6% 1.4% 98.6%
Grades 9-12 0.5% 0.7% 1.4% 98.6%
Ecstasy?
All 2.5% 4.0% 6.8% 93.2%
Grades 7-8 1.3% 1.9% 3.4% 96.6%
Grades 9-12 3.2% 5.1% 8.6% 91.4%
Heroin?
All 0.5% 0.8% 1.4% 98.6%
Grades 7-8 0.6% 0.8% 1.6% 98.4%
Grades 9-12 0.5% 0.7% 1.3% 98.7%

8/3/2019 BELL COUNTY - Academy ISD - 2011 Texas School Survey of Drug and Alcohol Use
http://slidepdf.com/reader/full/bell-county-academy-isd-2011-texas-school-survey-of-drug-and-alcohol-use 143/209
State: Grades 7-12 Medium
SPRING 2010
©Copyright 2010, Texas A&M University
All rights reserved.Secondary Report-Page 17 of 83
Table D-2: How often do you normally use...
Never
Used
Every
Day
Several
Times a
Week
Several
Times a
Month
About
Once a
Month
About
Once a
Year
Less than
Once a
Year
Marijuana?
All 76.2% 2.8% 3.2% 4.3% 4.5% 4.1% 5.0%
Grades 7-8 88.2% 1.1% 1.8% 2.4% 2.3% 2.0% 2.2%Grades 9-12 69.8% 3.7% 3.9% 5.3% 5.7% 5.2% 6.4%
Cocaine?
All 96.1% 0.1% 0.3% 0.5% 0.7% 1.0% 1.4%
Grades 7-8 98.3% 0.0% 0.2% 0.2% 0.3% 0.5% 0.5%
Grades 9-12 95.0% 0.1% 0.3% 0.6% 0.9% 1.2% 1.9%
Crack?
All 98.7% 0.0% 0.1% 0.2% 0.2% 0.3% 0.5%
Grades 7-8 98.7% 0.0% 0.1% 0.2% 0.3% 0.3% 0.3%
Grades 9-12 98.7% 0.1% 0.1% 0.1% 0.2% 0.2% 0.5%
Hallucinogens?
All 96.2% 0.1% 0.1% 0.3% 0.8% 1.3% 1.2%
Grades 7-8 98.2% 0.0% 0.1% 0.3% 0.4% 0.5% 0.5%
Grades 9-12 95.2% 0.1% 0.1% 0.4% 1.0% 1.7% 1.6%
Uppers?
All 95.0% 0.1% 0.4% 0.8% 1.2% 1.2% 1.2%
Grades 7-8 98.1% 0.1% 0.2% 0.4% 0.4% 0.4% 0.5%
Grades 9-12 93.3% 0.2% 0.5% 1.1% 1.6% 1.7% 1.7%
Downers?
All 94.8% 0.2% 0.4% 0.9% 1.3% 1.1% 1.2%
Grades 7-8 98.1% 0.2% 0.2% 0.3% 0.5% 0.3% 0.4%
Grades 9-12 93.1% 0.2% 0.5% 1.2% 1.7% 1.6% 1.7%
Rohypnol?
All 97.9% 0.0% 0.2% 0.3% 0.4% 0.5% 0.5%
Grades 7-8 98.5% 0.0% 0.2% 0.3% 0.4% 0.4% 0.3%
Grades 9-12 97.7% 0.0% 0.2% 0.4% 0.4% 0.6% 0.7%Steroids?
All 98.9% 0.1% 0.1% 0.1% 0.1% 0.2% 0.4%
Grades 7-8 99.0% 0.1% 0.1% 0.1% 0.1% 0.2% 0.4%
Grades 9-12 98.9% 0.1% 0.1% 0.1% 0.1% 0.2% 0.5%
Ecstasy?
All 93.8% 0.1% 0.4% 0.9% 1.4% 1.7% 1.7%
Grades 7-8 97.1% 0.1% 0.3% 0.5% 0.6% 0.8% 0.7%
Grades 9-12 92.1% 0.1% 0.5% 1.0% 1.8% 2.3% 2.3%
Heroin?
All 98.9% 0.1% 0.1% 0.1% 0.2% 0.3% 0.4%
Grades 7-8 98.9% 0.1% 0.1% 0.1% 0.2% 0.3% 0.4%
Grades 9-12 98.9% 0.1% 0.1% 0.1% 0.1% 0.2% 0.4%
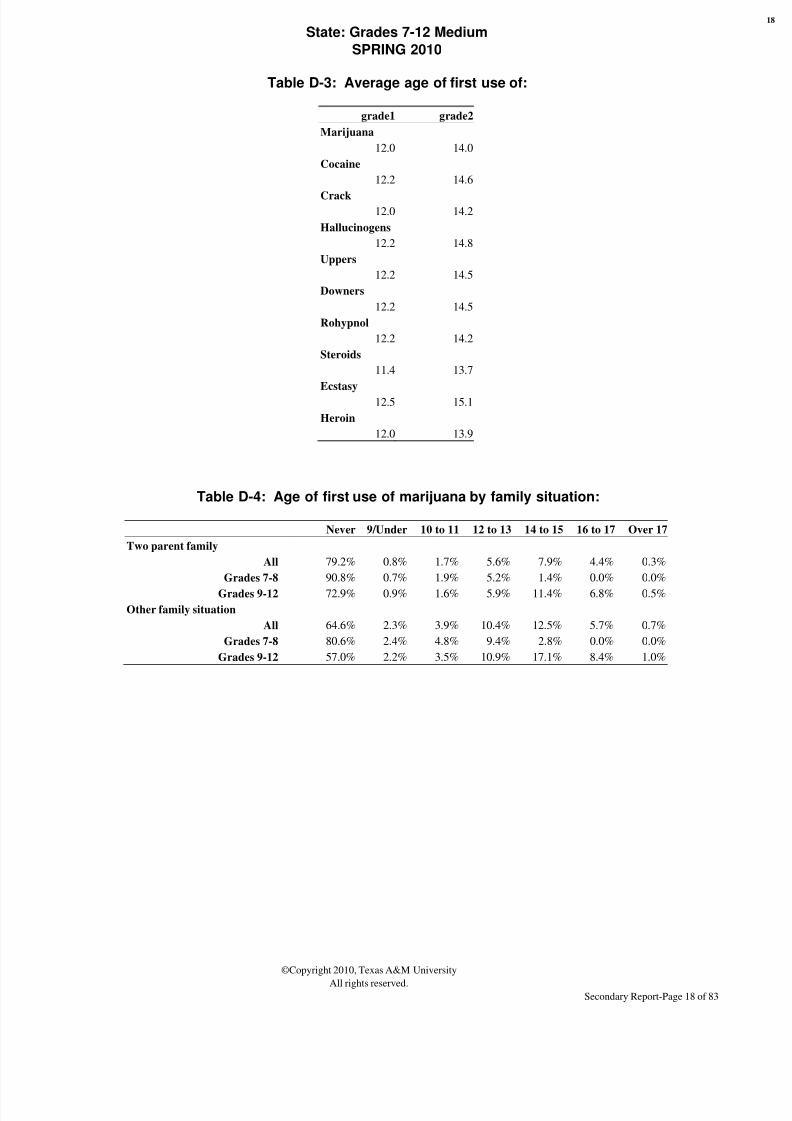
8/3/2019 BELL COUNTY - Academy ISD - 2011 Texas School Survey of Drug and Alcohol Use
http://slidepdf.com/reader/full/bell-county-academy-isd-2011-texas-school-survey-of-drug-and-alcohol-use 144/209
State: Grades 7-12 Medium
SPRING 2010
©Copyright 2010, Texas A&M University
All rights reserved.Secondary Report-Page 18 of 83
Table D-3: Average age of first use of:
grade1 grade2
Marijuana
12.0 14.0
Cocaine
12.2 14.6
Crack12.0 14.2
Hallucinogens
12.2 14.8
Uppers
12.2 14.5
Downers
12.2 14.5
Rohypnol
12.2 14.2
Steroids
11.4 13.7
Ecstasy
12.5 15.1
Heroin
12.0 13.9
Table D-4: Age of first use of marijuana by family situation:
Never 9/Under 10 to 11 12 to 13 14 to 15 16 to 17 Over 17
Two parent family
All 79.2% 0.8% 1.7% 5.6% 7.9% 4.4% 0.3%
Grades 7-8 90.8% 0.7% 1.9% 5.2% 1.4% 0.0% 0.0%
Grades 9-12 72.9% 0.9% 1.6% 5.9% 11.4% 6.8% 0.5%
Other family situation
All 64.6% 2.3% 3.9% 10.4% 12.5% 5.7% 0.7%
Grades 7-8 80.6% 2.4% 4.8% 9.4% 2.8% 0.0% 0.0%
Grades 9-12 57.0% 2.2% 3.5% 10.9% 17.1% 8.4% 1.0%

8/3/2019 BELL COUNTY - Academy ISD - 2011 Texas School Survey of Drug and Alcohol Use
http://slidepdf.com/reader/full/bell-county-academy-isd-2011-texas-school-survey-of-drug-and-alcohol-use 145/209
State: Grades 7-12 Medium
SPRING 2010
©Copyright 2010, Texas A&M University
All rights reserved.Secondary Report-Page 19 of 83
Table D-5: If you wanted some, how difficult would it be to get..
Never
Heard Of Impossible
Very
Difficult
Somewhat
Difficult
Somewhat
Easy Very Easy
Marijuana?
All 17.0% 27.3% 8.2% 9.1% 12.6% 25.8%
Grades 7-8 22.8% 43.3% 8.5% 6.9% 7.0% 11.5%
Grades 9-12 13.9% 19.0% 8.0% 10.2% 15.5% 33.4%Cocaine?
All 22.6% 36.6% 14.0% 10.9% 7.1% 8.7%
Grades 7-8 26.7% 49.7% 10.5% 5.7% 3.5% 4.0%
Grades 9-12 20.5% 29.8% 15.9% 13.6% 9.0% 11.2%
Crack?
All 24.4% 37.5% 14.6% 10.6% 6.0% 6.9%
Grades 7-8 27.9% 49.5% 10.3% 5.6% 3.1% 3.6%
Grades 9-12 22.5% 31.1% 16.9% 13.2% 7.5% 8.7%
Hallucinogens?
All 38.4% 27.7% 11.5% 9.1% 6.3% 7.0%
Grades 7-8 50.0% 32.7% 7.4% 4.3% 2.6% 2.9%
Grades 9-12 32.3% 25.0% 13.6% 11.7% 8.3% 9.1%
Uppers?
All 49.6% 21.2% 8.1% 7.0% 5.9% 8.2%
Grades 7-8 60.0% 26.1% 5.4% 3.3% 2.3% 3.0%
Grades 9-12 44.1% 18.6% 9.6% 9.0% 7.9% 10.9%
Downers?
All 49.5% 21.1% 8.1% 6.9% 5.9% 8.4%
Grades 7-8 60.2% 25.9% 5.4% 3.2% 2.2% 3.1%
Grades 9-12 43.8% 18.6% 9.6% 8.9% 7.8% 11.2%
Rohypnol?
All 46.5% 25.3% 10.2% 7.1% 4.6% 6.3%
Grades 7-8 56.1% 29.5% 6.0% 3.5% 2.0% 2.9%
Grades 9-12 41.4% 23.1% 12.4% 9.0% 6.0% 8.0%
Steroids?All 27.2% 38.0% 13.3% 9.7% 5.5% 6.3%
Grades 7-8 30.8% 48.5% 9.4% 5.3% 2.7% 3.2%
Grades 9-12 25.3% 32.5% 15.3% 12.1% 7.0% 7.9%
Ecstasy?
All 33.4% 28.8% 10.5% 8.5% 7.5% 11.2%
Grades 7-8 47.5% 33.9% 6.9% 4.3% 3.1% 4.4%
Grades 9-12 26.0% 26.2% 12.4% 10.8% 9.9% 14.7%
Heroin?
All 32.0% 37.4% 13.2% 7.6% 4.1% 5.7%
Grades 7-8 38.1% 44.3% 8.3% 4.0% 2.3% 3.1%
Grades 9-12 28.8% 33.8% 15.8% 9.5% 5.0% 7.1%

8/3/2019 BELL COUNTY - Academy ISD - 2011 Texas School Survey of Drug and Alcohol Use
http://slidepdf.com/reader/full/bell-county-academy-isd-2011-texas-school-survey-of-drug-and-alcohol-use 146/209
State: Grades 7-12 Medium
SPRING 2010
©Copyright 2010, Texas A&M University
All rights reserved.Secondary Report-Page 20 of 83
Table D-6: Since school began in the fall, on how many days (if any) have you..
None 1-3 Times 4-9 Times 10+ Times
Attended class while high from marijuana use?
All 89.1% 5.8% 2.0% 3.1%
Grades 7-8 93.7% 3.9% 1.1% 1.4%
Grades 9-12 86.6% 6.9% 2.5% 4.0%
Attended class while high from use of some other drug?All 94.2% 3.7% 1.0% 1.1%
Grades 7-8 96.1% 2.6% 0.5% 0.7%
Grades 9-12 93.2% 4.3% 1.2% 1.3%
Gotten into trouble with teachers because of your drug use?
All 98.4% 1.1% 0.2% 0.3%
Grades 7-8 98.6% 0.9% 0.2% 0.3%
Grades 9-12 98.3% 1.2% 0.2% 0.3%
Table D-7: School year use of marijuana by absences and conduct problems:
Average days absent due to
illness or other reasons
Marijuana Users: 4.9
Marijuana Non-use 3.8
Average days conduct problems
reported
Marijuana Users: 4.8
Marijuana Non-use 1.4
Table D-8: During the past twelve months, how many times have you..
None 1-3 Times 4-9 Times 10+ Times
Driven a car when you've felt high from drugs?
All 90.5% 5.9% 1.4% 2.2%
Grades 9-12 90.5% 5.9% 1.4% 2.2%
Gotten into trouble with the police because of drug use?
All 97.5% 1.9% 0.2% 0.3%
Grades 7-8 98.1% 1.3% 0.3% 0.3%
Grades 9-12 97.3% 2.2% 0.2% 0.3%

8/3/2019 BELL COUNTY - Academy ISD - 2011 Texas School Survey of Drug and Alcohol Use
http://slidepdf.com/reader/full/bell-county-academy-isd-2011-texas-school-survey-of-drug-and-alcohol-use 147/209
State: Grades 7-12 Medium
SPRING 2010
©Copyright 2010, Texas A&M University
All rights reserved.Secondary Report-Page 21 of 83
Table D-9: About how many of your close friends use marijuana?
None A Few Some Most ALL
All 48.4% 18.6% 14.3% 13.3% 5.4%
Grades 7-8 68.1% 14.3% 8.0% 6.8% 2.7%
Grades 9-12 38.1% 20.9% 17.5% 16.7% 6.7%
Table D-10: During the past twelve months, how many times have you..
None 1-3 Times 4-9 Times 10+ Times
Had difficulties of any kind with your friends because of your drug use?
All 94.2% 4.7% 0.7% 0.4%
Grades 7-8 96.0% 3.3% 0.4% 0.3%
Grades 9-12 93.3% 5.5% 0.8% 0.4%
Been criticized by someone you were dating because of drug use?
All 93.4% 5.1% 0.8% 0.7%
Grades 7-8 96.3% 2.9% 0.4% 0.4%Grades 9-12 91.9% 6.3% 1.0% 0.9%

8/3/2019 BELL COUNTY - Academy ISD - 2011 Texas School Survey of Drug and Alcohol Use
http://slidepdf.com/reader/full/bell-county-academy-isd-2011-texas-school-survey-of-drug-and-alcohol-use 148/209
State: Grades 7-12 Medium
SPRING 2010
©Copyright 2010, Texas A&M University
All rights reserved.Secondary Report-Page 22 of 83
Table D-11: Thinking of parties you attended this school year, how often weremarijuana and/or other drugs used?
Never Seldom
Half
the Time
Most
of the Time Always Don't know
Didn't
attend
All 53.8% 9.2% 6.6% 7.6% 8.8% 2.7% 11.2%
Grades 7-8 73.2% 6.1% 3.4% 3.3% 2.9% 2.2% 9.0%
Grades 9-12 43.5% 10.9% 8.2% 9.9% 12.0% 3.0% 12.4%
Table D-12: How often, if ever, do you smoke marijuana in..
CATEGORY Never Seldom
Half
the Time
Most of
the Time Always Don't know
Joints? All 79.6% 8.1% 4.6% 4.0% 2.9% 0.8%
Grades 7-8 88.4% 3.8% 2.7% 2.5% 1.8% 0.7%
Grades 9-12 74.9% 10.4% 5.6% 4.8% 3.4% 0.9%
Blunts? All 79.6% 6.6% 4.1% 4.5% 4.4% 0.8%
Grades 7-8 89.0% 3.1% 2.6% 2.4% 2.1% 0.8%
Grades 9-12 74.6% 8.4% 4.9% 5.6% 5.6% 0.9%
Bongs or water pipes? All 84.7% 5.8% 3.2% 3.1% 2.5% 0.6%
Grades 7-8 93.0% 2.4% 1.5% 1.4% 1.1% 0.6%
Grades 9-12 80.3% 7.7% 4.1% 4.1% 3.3% 0.6%
Pipes? All 83.6% 5.2% 3.2% 4.3% 3.2% 0.6%
Grades 7-8 92.2% 2.4% 1.7% 1.7% 1.4% 0.6%
Grades 9-12 79.0% 6.6% 4.0% 5.6% 4.1% 0.7%
Some other way? All 87.6% 5.2% 1.7% 1.6% 2.0% 1.8%
Grades 7-8 93.3% 2.1% 1.2% 1.1% 1.2% 1.2%
Grades 9-12 84.6% 7.0% 2.0% 1.9% 2.5% 2.1%

8/3/2019 BELL COUNTY - Academy ISD - 2011 Texas School Survey of Drug and Alcohol Use
http://slidepdf.com/reader/full/bell-county-academy-isd-2011-texas-school-survey-of-drug-and-alcohol-use 149/209

8/3/2019 BELL COUNTY - Academy ISD - 2011 Texas School Survey of Drug and Alcohol Use
http://slidepdf.com/reader/full/bell-county-academy-isd-2011-texas-school-survey-of-drug-and-alcohol-use 150/209
State: Grades 7-12 Medium
SPRING 2010
©Copyright 2010, Texas A&M University
All rights reserved.Secondary Report-Page 24 of 83
Table D-15: How recently, if ever, have you taken...
Past
Month
School
Year
Ever
Used
Never
Used
Methamphetamine?
All 0.8% 1.3% 3.0% 97.0%
Grades 7-8 0.8% 1.2% 2.4% 97.6%
Grades 9-12 0.8% 1.4% 3.3% 96.7%
Table D-16: How recently, if ever, have you taken the following PRESCRIPTION DRUGS...
Past
Month
School
Year
Ever
Used
Never
Used
Codeine?
All 4.8% 8.2% 12.3% 87.7%
Grades 7-8 3.8% 5.7% 8.6% 91.4%
Grades 9-12 5.4% 9.4% 14.3% 85.7%
Oxycontin, Percodan or Percocet?
All 1.0% 1.8% 3.1% 96.9%
Grades 7-8 0.5% 0.8% 1.4% 98.6%
Grades 9-12 1.2% 2.4% 4.0% 96.0%
Vicodin, Lortab or Lorcet?
All 1.8% 3.5% 5.3% 94.7%
Grades 7-8 0.6% 1.0% 1.6% 98.4%
Grades 9-12 2.5% 4.7% 7.2% 92.8%
Valium or Diazepam?
All 0.7% 1.4% 2.4% 97.6%
Grades 7-8 0.5% 0.7% 1.1% 98.9%
Grades 9-12 0.9% 1.7% 3.0% 97.0%
Xanax or Alprazolam?
All 1.7% 3.0% 4.5% 95.5%Grades 7-8 0.8% 1.1% 1.7% 98.3%
Grades 9-12 2.2% 4.0% 6.0% 94.0%
Table D-17: How recently, if ever, have you taken the following OVER-THE COUNTER drugs...
Past
Month
School
Year
Ever
Used
Never
Used
DXM, Triple C?
All 1.9% 3.1% 5.4% 94.6%
Grades 7-8 1.9% 2.7% 4.4% 95.6%
Grades 9-12 2.0% 3.4% 5.9% 94.1%

8/3/2019 BELL COUNTY - Academy ISD - 2011 Texas School Survey of Drug and Alcohol Use
http://slidepdf.com/reader/full/bell-county-academy-isd-2011-texas-school-survey-of-drug-and-alcohol-use 151/209
State: Grades 7-12 Medium
SPRING 2010
©Copyright 2010, Texas A&M University
All rights reserved.Secondary Report-Page 25 of 83
Table I-1: How recently, if ever, have you used...
Past
Month
School
Year
Ever
Used
Never
Used
Spray paint?
All 1.0% 1.7% 5.0% 95.0%
Grades 7-8 1.3% 2.1% 5.8% 94.2%
Grades 9-12 0.9% 1.4% 4.5% 95.5%Whiteout,correction fld?
All 2.6% 4.2% 10.0% 90.0%
Grades 7-8 4.4% 6.6% 13.5% 86.5%
Grades 9-12 1.7% 2.9% 8.1% 91.9%
Computer dusting sprays?
All 0.9% 1.6% 3.3% 96.7%
Grades 7-8 0.8% 1.3% 2.4% 97.6%
Grades 9-12 0.9% 1.7% 3.8% 96.2%
Helium,butane,propane,whippets,freon?
All 2.2% 3.8% 7.8% 92.2%
Grades 7-8 2.5% 4.0% 7.8% 92.2%
Grades 9-12 2.1% 3.7% 7.9% 92.1%
Glue?
All 0.6% 1.0% 2.4% 97.6%
Grades 7-8 0.9% 1.5% 3.2% 96.8%
Grades 9-12 0.4% 0.7% 2.0% 98.0%
Toluene,paint thinner,other solvents?
All 0.6% 1.1% 2.4% 97.6%
Grades 7-8 0.9% 1.4% 2.6% 97.4%
Grades 9-12 0.5% 0.9% 2.3% 97.7%
Gasoline,octane booster,carburetor cleaner?
All 1.1% 1.6% 3.5% 96.5%
Grades 7-8 1.5% 2.2% 4.3% 95.7%
Grades 9-12 0.8% 1.3% 3.1% 96.9%
Other aerosols/sprays?All 1.1% 1.8% 4.0% 96.0%
Grades 7-8 1.7% 2.7% 5.2% 94.8%
Grades 9-12 0.8% 1.3% 3.4% 96.6%
Any inhalant?
All 6.1% 8.9% 17.2% 82.8%
Grades 7-8 8.5% 11.5% 20.2% 79.8%
Grades 9-12 4.8% 7.6% 15.6% 84.4%
Table I-2: How often do you normally use inhalants?
Never
Used
Every
Day
Several
Times a
Week
Several
Times a
Month
About
Once a
Month
About
Once a
Year
Less than
Once a
Year
All 92.9% 0.2% 0.4% 0.7% 1.2% 1.6% 3.0%
Grades 7-8 91.2% 0.3% 0.7% 1.2% 1.8% 2.0% 2.9%
Grades 9-12 93.8% 0.1% 0.2% 0.5% 0.9% 1.4% 3.1%

8/3/2019 BELL COUNTY - Academy ISD - 2011 Texas School Survey of Drug and Alcohol Use
http://slidepdf.com/reader/full/bell-county-academy-isd-2011-texas-school-survey-of-drug-and-alcohol-use 152/209
State: Grades 7-12 Medium
SPRING 2010
©Copyright 2010, Texas A&M University
All rights reserved.Secondary Report-Page 26 of 83
I-3: Number of different kinds of inhalants used
None One Two to Three Four Plus
All 83.1% 8.1% 6.0% 2.8%
Grades 7-8 80.0% 9.3% 7.4% 3.3%
Grades 9-12 84.7% 7.5% 5.2% 2.6%
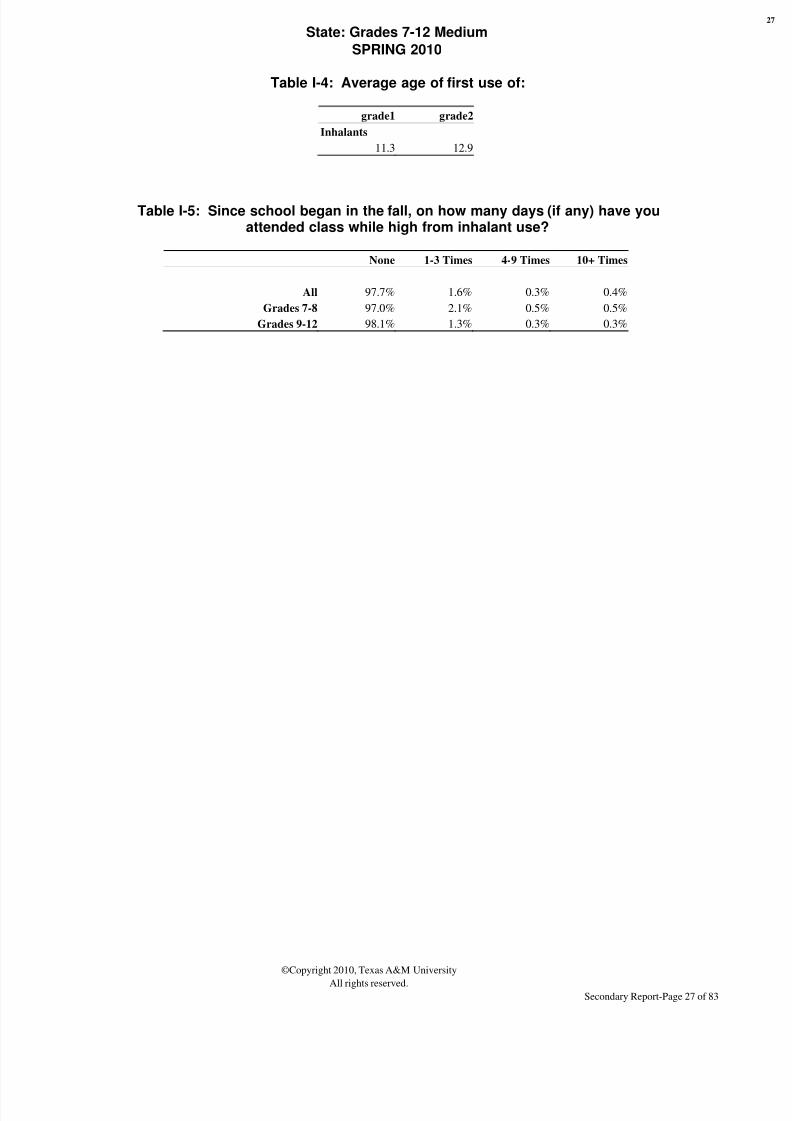
8/3/2019 BELL COUNTY - Academy ISD - 2011 Texas School Survey of Drug and Alcohol Use
http://slidepdf.com/reader/full/bell-county-academy-isd-2011-texas-school-survey-of-drug-and-alcohol-use 153/209
State: Grades 7-12 Medium
SPRING 2010
©Copyright 2010, Texas A&M University
All rights reserved.Secondary Report-Page 27 of 83
Table I-4: Average age of first use of:
grade1 grade2
Inhalants
11.3 12.9
Table I-5: Since school began in the fall, on how many days (if any) have youattended class while high from inhalant use?
None 1-3 Times 4-9 Times 10+ Times
All 97.7% 1.6% 0.3% 0.4%
Grades 7-8 97.0% 2.1% 0.5% 0.5%
Grades 9-12 98.1% 1.3% 0.3% 0.3%

8/3/2019 BELL COUNTY - Academy ISD - 2011 Texas School Survey of Drug and Alcohol Use
http://slidepdf.com/reader/full/bell-county-academy-isd-2011-texas-school-survey-of-drug-and-alcohol-use 154/209
State: Grades 7-12 Medium
SPRING 2010
©Copyright 2010, Texas A&M University
All rights reserved.Secondary Report-Page 28 of 83
Table I-6: School year use of inhalants by absences and conduct problems:
Average days absent due to
illness or other reasons
Inhalants Users: 4.8
Inhalants Non-use 3.9
Average days conduct problems
reported
Inhalants Users: 4.4
Inhalants Non-use 1.7
Table I-7: About how many of your close friends use inhalants?
None A Few Some Most ALL
All 80.8% 12.7% 4.4% 1.6% 0.5%
Grades 7-8 80.2% 12.2% 5.0% 2.0% 0.7%
Grades 9-12 81.1% 12.9% 4.1% 1.4% 0.5%
Table I-8: How dangerous do you think it is for kids your age to use inhalants?
Very
Dangerous
Somewhat
Dangerous
Not very
Dangerous
Not at All
Dangerous Do Not Know
All 72.8% 14.9% 4.7% 1.7% 6.0%
Grades 7-8 72.8% 13.6% 5.5% 2.0% 6.1%
Grades 9-12 72.7% 15.6% 4.3% 1.5% 5.9%

8/3/2019 BELL COUNTY - Academy ISD - 2011 Texas School Survey of Drug and Alcohol Use
http://slidepdf.com/reader/full/bell-county-academy-isd-2011-texas-school-survey-of-drug-and-alcohol-use 155/209
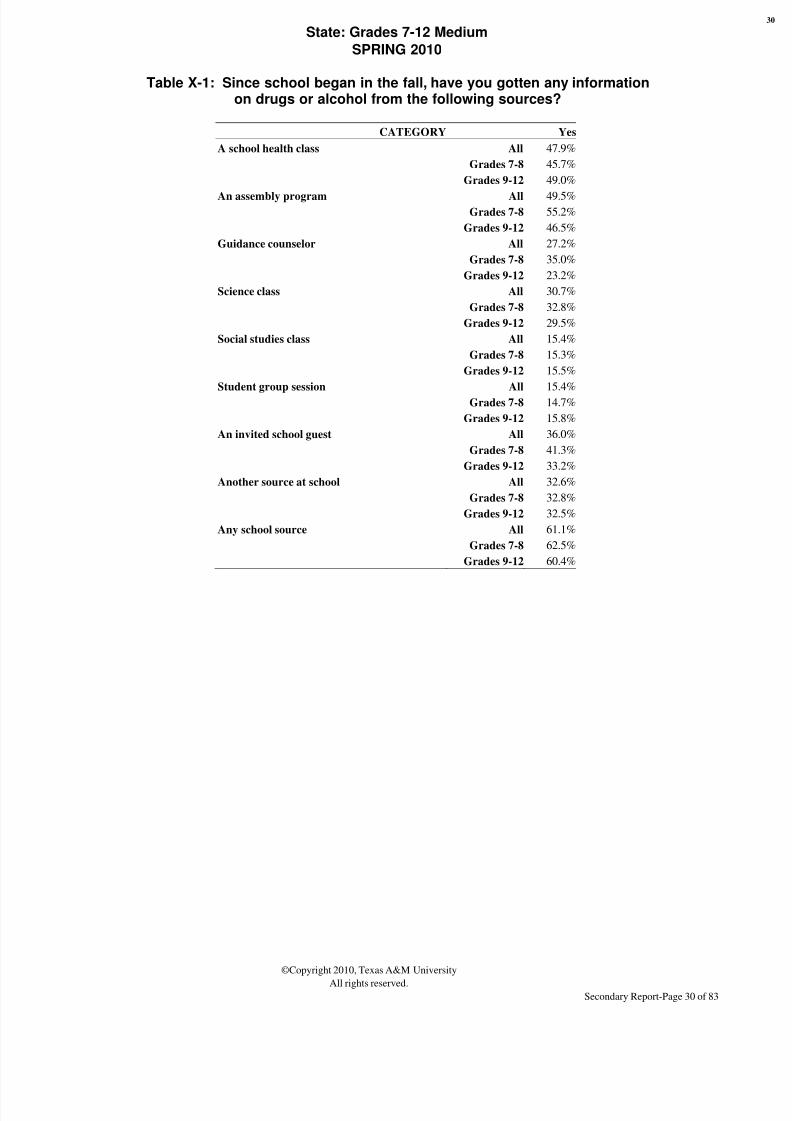
8/3/2019 BELL COUNTY - Academy ISD - 2011 Texas School Survey of Drug and Alcohol Use
http://slidepdf.com/reader/full/bell-county-academy-isd-2011-texas-school-survey-of-drug-and-alcohol-use 156/209
State: Grades 7-12 Medium
SPRING 2010
©Copyright 2010, Texas A&M University
All rights reserved.Secondary Report-Page 30 of 83
Table X-1: Since school began in the fall, have you gotten any informationon drugs or alcohol from the following sources?
CATEGORY Yes
A school health class All 47.9%
Grades 7-8 45.7%
Grades 9-12 49.0%
An assembly program All 49.5%Grades 7-8 55.2%
Grades 9-12 46.5%
Guidance counselor All 27.2%
Grades 7-8 35.0%
Grades 9-12 23.2%
Science class All 30.7%
Grades 7-8 32.8%
Grades 9-12 29.5%
Social studies class All 15.4%
Grades 7-8 15.3%
Grades 9-12 15.5%
Student group session All 15.4%
Grades 7-8 14.7%
Grades 9-12 15.8%
An invited school guest All 36.0%
Grades 7-8 41.3%
Grades 9-12 33.2%
Another source at school All 32.6%
Grades 7-8 32.8%
Grades 9-12 32.5%
Any school source All 61.1%
Grades 7-8 62.5%
Grades 9-12 60.4%

8/3/2019 BELL COUNTY - Academy ISD - 2011 Texas School Survey of Drug and Alcohol Use
http://slidepdf.com/reader/full/bell-county-academy-isd-2011-texas-school-survey-of-drug-and-alcohol-use 157/209
State: Grades 7-12 Medium
SPRING 2010
©Copyright 2010, Texas A&M University
All rights reserved.Secondary Report-Page 31 of 83
Table X-2: If you had a drug or alcohol problem and needed help, who would you go to?
CATEGORY Yes
Counselor/program in-school All 35.0%
Grades 7-8 43.4%
Grades 9-12 30.5%
Another adult in school All 34.7%
Grades 7-8 39.7%Grades 9-12 32.1%
Counselor/program outside-school All 37.0%
Grades 7-8 38.9%
Grades 9-12 36.0%
Your parents All 60.7%
Grades 7-8 64.5%
Grades 9-12 58.6%
A medical doctor All 45.4%
Grades 7-8 49.8%
Grades 9-12 43.0%
Your friends All 69.3%
Grades 7-8 63.3%
Grades 9-12 72.6%
Another adult All 61.7%
Grades 7-8 61.2%
Grades 9-12 61.9%
Table X-3: Since school began in the fall, have you sought help, other thanfrom family or friends, for problems in any way connected with your use of
alcohol, marijuana, or other drugs?
CATEGORY Yes
Seek Help All 8.0%
Grades 7-8 8.3%
Grades 9-12 7.9%

8/3/2019 BELL COUNTY - Academy ISD - 2011 Texas School Survey of Drug and Alcohol Use
http://slidepdf.com/reader/full/bell-county-academy-isd-2011-texas-school-survey-of-drug-and-alcohol-use 158/209

8/3/2019 BELL COUNTY - Academy ISD - 2011 Texas School Survey of Drug and Alcohol Use
http://slidepdf.com/reader/full/bell-county-academy-isd-2011-texas-school-survey-of-drug-and-alcohol-use 159/209
State: Grades 7-12 Medium
SPRING 2010
©Copyright 2010, Texas A&M University
All rights reserved.Secondary Report-Page 33 of 83
Table X-5: How safe do you feel when you are:
Very Safe
Somewhat
Safe
Not Very
Safe
Not Safe at
All
Don't
Know
In your home?
All 81.4% 16.1% 1.2% 0.4% 1.0%
Grades 7-8 79.8% 17.3% 1.3% 0.4% 1.2%
Grades 9-12 82.2% 15.4% 1.1% 0.4% 0.9%Out in your neighborhood?
All 41.2% 46.8% 7.8% 2.1% 2.1%
Grades 7-8 37.2% 48.6% 9.0% 2.3% 2.9%
Grades 9-12 43.3% 45.9% 7.1% 2.0% 1.7%
At school?
All 42.3% 44.3% 7.1% 3.4% 2.9%
Grades 7-8 46.6% 40.4% 6.6% 3.2% 3.3%
Grades 9-12 40.1% 46.4% 7.4% 3.5% 2.7%

8/3/2019 BELL COUNTY - Academy ISD - 2011 Texas School Survey of Drug and Alcohol Use
http://slidepdf.com/reader/full/bell-county-academy-isd-2011-texas-school-survey-of-drug-and-alcohol-use 160/209
State: Grades 7-12 Medium
SPRING 2010
©Copyright 2010, Texas A&M University
All rights reserved.Secondary Report-Page 34 of 83

8/3/2019 BELL COUNTY - Academy ISD - 2011 Texas School Survey of Drug and Alcohol Use
http://slidepdf.com/reader/full/bell-county-academy-isd-2011-texas-school-survey-of-drug-and-alcohol-use 161/209
State: Grades 7-12 Medium
SPRING 2010
©Copyright 2010, Texas A&M University
All rights reserved.Secondary Report-Page 35 of 83
2. Prevalence Tables

8/3/2019 BELL COUNTY - Academy ISD - 2011 Texas School Survey of Drug and Alcohol Use
http://slidepdf.com/reader/full/bell-county-academy-isd-2011-texas-school-survey-of-drug-and-alcohol-use 162/209
State: Grades 7-12 Medium
SPRING 2010
©Copyright 2010, Texas A&M University
All rights reserved.Secondary Report-Page 36 of 83

8/3/2019 BELL COUNTY - Academy ISD - 2011 Texas School Survey of Drug and Alcohol Use
http://slidepdf.com/reader/full/bell-county-academy-isd-2011-texas-school-survey-of-drug-and-alcohol-use 163/209
State: Grades 7-12 Medium
SPRING 2010
©Copyright 2010, Texas A&M University
All rights reserved.Secondary Report-Page 37 of 83
Table B1: Prevalence and recency of use of selected substances by gradeAll students
Past
Month
School
Year
Ever
Used
Never
Used
Tobacco
All 12.5% 17.6% 30.5% 69.5%
Grades 7-8 6.1% 8.9% 19.1% 80.9%Grades 9-12 15.9% 22.2% 36.5% 63.5%
Alcohol
All 29.0% 40.2% 61.8% 38.2%
Grades 7-8 18.4% 25.4% 48.5% 51.5%
Grades 9-12 34.7% 48.0% 68.8% 31.2%
Inhalants
All 6.1% 8.9% 17.2% 82.8%
Grades 7-8 8.5% 11.5% 20.2% 79.8%
Grades 9-12 4.8% 7.6% 15.6% 84.4%
Any Illicit Drug
All 13.1% 18.5% 27.9% 72.1%
Grades 7-8 7.0% 9.5% 15.2% 84.8%
Grades 9-12 16.3% 23.2% 34.6% 65.4%
Marijuana
All 11.4% 16.9% 26.2% 73.8%
Grades 7-8 5.3% 7.7% 13.0% 87.0%
Grades 9-12 14.6% 21.7% 33.2% 66.8%
Marijuana Only
All 4.7% 7.7% 13.9% 86.1%
Grades 7-8 2.3% 3.5% 7.0% 93.0%
Grades 9-12 6.0% 9.9% 17.6% 82.4%
Cocaine or Crack
All 1.7% 2.7% 5.4% 94.6%
Grades 7-8 1.1% 1.6% 2.9% 97.1%
Grades 9-12 2.0% 3.3% 6.7% 93.3%Cocaine
All 1.5% 2.5% 5.0% 95.0%
Grades 7-8 0.8% 1.3% 2.3% 97.7%
Grades 9-12 1.8% 3.2% 6.4% 93.6%
Crack
All 0.5% 0.7% 1.6% 98.4%
Grades 7-8 0.6% 0.8% 1.6% 98.4%
Grades 9-12 0.4% 0.7% 1.6% 98.4%
Hallucinogens
All 1.5% 2.5% 4.6% 95.4%
Grades 7-8 0.8% 1.2% 2.3% 97.7%
Grades 9-12 1.9% 3.2% 5.9% 94.1%Uppers
All 2.2% 3.4% 5.3% 94.7%
Grades 7-8 0.9% 1.2% 1.9% 98.1%
Grades 9-12 2.9% 4.5% 7.0% 93.0%
Downers
All 2.4% 3.6% 5.7% 94.3%
Grades 7-8 0.9% 1.3% 2.0% 98.0%
Grades 9-12 3.2% 4.8% 7.6% 92.4%

8/3/2019 BELL COUNTY - Academy ISD - 2011 Texas School Survey of Drug and Alcohol Use
http://slidepdf.com/reader/full/bell-county-academy-isd-2011-texas-school-survey-of-drug-and-alcohol-use 164/209
State: Grades 7-12 Medium
SPRING 2010
©Copyright 2010, Texas A&M University
All rights reserved.Secondary Report-Page 38 of 83
Table B1: Prevalence and recency of use of selected substances by gradeAll students(Continued)
Past
Month
School
Year
Ever
Used
Never
Used
Rohypnol
All 1.0% 1.5% 2.6% 97.4%
Grades 7-8 0.8% 1.2% 2.0% 98.0%
Grades 9-12 1.2% 1.7% 3.0% 97.0%
Steroids
All 0.5% 0.7% 1.4% 98.6%
Grades 7-8 0.4% 0.6% 1.4% 98.6%
Grades 9-12 0.5% 0.7% 1.4% 98.6%
Ecstasy
All 2.5% 4.0% 6.8% 93.2%
Grades 7-8 1.3% 1.9% 3.4% 96.6%
Grades 9-12 3.2% 5.1% 8.6% 91.4%
Heroin
All 0.5% 0.8% 1.4% 98.6%
Grades 7-8 0.6% 0.8% 1.6% 98.4%
Grades 9-12 0.5% 0.7% 1.3% 98.7%

8/3/2019 BELL COUNTY - Academy ISD - 2011 Texas School Survey of Drug and Alcohol Use
http://slidepdf.com/reader/full/bell-county-academy-isd-2011-texas-school-survey-of-drug-and-alcohol-use 165/209
State: Grades 7-12 Medium
SPRING 2010
©Copyright 2010, Texas A&M University
All rights reserved.Secondary Report-Page 39 of 83
Table B2: Prevalence and recency of use of selected substances by gradeMale students
Past
Month
School
Year
Ever
Used
Never
Used
Tobacco
All 15.2% 20.6% 33.7% 66.3%
Grades 7-8 7.0% 10.0% 21.0% 79.0%Grades 9-12 19.5% 26.2% 40.5% 59.5%
Alcohol
All 29.1% 39.8% 60.9% 39.1%
Grades 7-8 17.9% 25.1% 48.3% 51.7%
Grades 9-12 35.1% 47.5% 67.6% 32.4%
Inhalants
All 6.0% 8.8% 16.7% 83.3%
Grades 7-8 7.6% 10.5% 18.6% 81.4%
Grades 9-12 5.1% 7.9% 15.7% 84.3%
Any Illicit Drug
All 14.9% 20.6% 30.8% 69.2%
Grades 7-8 7.3% 10.1% 16.6% 83.4%
Grades 9-12 18.9% 26.2% 38.3% 61.7%
Marijuana
All 13.2% 19.1% 29.6% 70.4%
Grades 7-8 5.9% 8.5% 14.9% 85.1%
Grades 9-12 17.0% 24.6% 37.3% 62.7%
Marijuana Only
All 5.4% 8.7% 15.8% 84.2%
Grades 7-8 2.8% 4.1% 8.5% 91.5%
Grades 9-12 6.7% 11.2% 19.6% 80.4%
Cocaine or Crack
All 1.9% 3.1% 6.0% 94.0%
Grades 7-8 1.0% 1.5% 2.7% 97.3%
Grades 9-12 2.4% 4.0% 7.8% 92.2%Cocaine
All 1.7% 2.9% 5.7% 94.3%
Grades 7-8 0.8% 1.2% 2.2% 97.8%
Grades 9-12 2.3% 3.8% 7.5% 92.5%
Crack
All 0.4% 0.7% 1.6% 98.4%
Grades 7-8 0.4% 0.6% 1.3% 98.7%
Grades 9-12 0.4% 0.7% 1.8% 98.2%
Hallucinogens
All 2.0% 3.4% 6.0% 94.0%
Grades 7-8 0.9% 1.4% 2.7% 97.3%
Grades 9-12 2.6% 4.4% 7.7% 92.3%Uppers
All 2.5% 3.6% 5.6% 94.4%
Grades 7-8 0.9% 1.2% 1.9% 98.1%
Grades 9-12 3.3% 4.9% 7.6% 92.4%
Downers
All 2.7% 4.0% 6.3% 93.7%
Grades 7-8 0.9% 1.3% 1.9% 98.1%
Grades 9-12 3.7% 5.5% 8.6% 91.4%

8/3/2019 BELL COUNTY - Academy ISD - 2011 Texas School Survey of Drug and Alcohol Use
http://slidepdf.com/reader/full/bell-county-academy-isd-2011-texas-school-survey-of-drug-and-alcohol-use 166/209
State: Grades 7-12 Medium
SPRING 2010
©Copyright 2010, Texas A&M University
All rights reserved.Secondary Report-Page 40 of 83
Table B2: Prevalence and recency of use of selected substances by gradeMale students(Continued)
Past
Month
School
Year
Ever
Used
Never
Used
Rohypnol
All 1.1% 1.6% 2.7% 97.3%
Grades 7-8 0.9% 1.2% 2.1% 97.9%
Grades 9-12 1.3% 1.8% 3.0% 97.0%
Steroids
All 0.7% 1.0% 1.8% 98.2%
Grades 7-8 0.4% 0.7% 1.6% 98.4%
Grades 9-12 0.8% 1.1% 2.0% 98.0%
Ecstasy
All 2.8% 4.3% 7.2% 92.8%
Grades 7-8 1.2% 1.9% 3.5% 96.5%
Grades 9-12 3.7% 5.6% 9.1% 90.9%
Heroin
All 0.5% 0.7% 1.4% 98.6%
Grades 7-8 0.4% 0.7% 1.4% 98.6%
Grades 9-12 0.6% 0.8% 1.5% 98.5%

8/3/2019 BELL COUNTY - Academy ISD - 2011 Texas School Survey of Drug and Alcohol Use
http://slidepdf.com/reader/full/bell-county-academy-isd-2011-texas-school-survey-of-drug-and-alcohol-use 167/209

8/3/2019 BELL COUNTY - Academy ISD - 2011 Texas School Survey of Drug and Alcohol Use
http://slidepdf.com/reader/full/bell-county-academy-isd-2011-texas-school-survey-of-drug-and-alcohol-use 168/209
State: Grades 7-12 Medium
SPRING 2010
©Copyright 2010, Texas A&M University
All rights reserved.Secondary Report-Page 42 of 83
Table B3: Prevalence and recency of use of selected substances by gradeFemale students
(Continued) Past
Month
School
Year
Ever
Used
Never
Used
Rohypnol
All 1.0% 1.4% 2.6% 97.4%
Grades 7-8 0.8% 1.1% 1.9% 98.1%
Grades 9-12 1.1% 1.6% 2.9% 97.1%
Steroids
All 0.3% 0.5% 1.0% 99.0%
Grades 7-8 0.4% 0.6% 1.3% 98.7%
Grades 9-12 0.2% 0.4% 0.9% 99.1%
Ecstasy
All 2.3% 3.7% 6.5% 93.5%
Grades 7-8 1.4% 2.0% 3.3% 96.7%
Grades 9-12 2.7% 4.6% 8.1% 91.9%
Heroin
All 0.5% 0.8% 1.4% 98.6%
Grades 7-8 0.8% 1.0% 1.8% 98.2%
Grades 9-12 0.4% 0.6% 1.2% 98.8%

8/3/2019 BELL COUNTY - Academy ISD - 2011 Texas School Survey of Drug and Alcohol Use
http://slidepdf.com/reader/full/bell-county-academy-isd-2011-texas-school-survey-of-drug-and-alcohol-use 169/209
State: Grades 7-12 Medium
SPRING 2010
©Copyright 2010, Texas A&M University
All rights reserved.Secondary Report-Page 43 of 83
Table B4: Prevalence and recency of use of selected substances by gradeWhite students
Past
Month
School
Year
Ever
Used
Never
Used
Tobacco
All 14.1% 19.1% 30.3% 69.7%
Grades 7-8 5.0% 7.2% 15.9% 84.1%Grades 9-12 18.8% 25.2% 37.5% 62.5%
Alcohol
All 26.4% 38.1% 58.5% 41.5%
Grades 7-8 12.2% 19.4% 41.1% 58.9%
Grades 9-12 33.5% 47.5% 67.3% 32.7%
Inhalants
All 5.3% 8.1% 16.2% 83.8%
Grades 7-8 6.7% 9.4% 16.9% 83.1%
Grades 9-12 4.5% 7.4% 15.9% 84.1%
Any Illicit Drug
All 11.0% 16.1% 23.6% 76.4%
Grades 7-8 3.6% 5.7% 9.4% 90.6%
Grades 9-12 14.8% 21.3% 30.7% 69.3%
Marijuana
All 9.9% 15.1% 22.4% 77.6%
Grades 7-8 2.7% 4.5% 7.6% 92.4%
Grades 9-12 13.5% 20.4% 29.9% 70.1%
Marijuana Only
All 3.7% 6.5% 11.5% 88.5%
Grades 7-8 1.1% 2.0% 4.2% 95.8%
Grades 9-12 5.1% 8.8% 15.2% 84.8%
Cocaine or Crack
All 0.9% 1.7% 3.6% 96.4%
Grades 7-8 0.3% 0.6% 1.4% 98.6%
Grades 9-12 1.2% 2.3% 4.7% 95.3%Cocaine
All 0.8% 1.6% 3.2% 96.8%
Grades 7-8 0.2% 0.3% 0.8% 99.2%
Grades 9-12 1.1% 2.2% 4.4% 95.6%
Crack
All 0.2% 0.4% 1.2% 98.8%
Grades 7-8 0.2% 0.3% 0.9% 99.1%
Grades 9-12 0.3% 0.5% 1.3% 98.7%
Hallucinogens
All 1.7% 3.0% 5.5% 94.5%
Grades 7-8 0.6% 1.0% 2.1% 97.9%
Grades 9-12 2.3% 4.0% 7.2% 92.8%Uppers
All 2.5% 4.0% 6.2% 93.8%
Grades 7-8 0.5% 0.8% 1.5% 98.5%
Grades 9-12 3.5% 5.6% 8.6% 91.4%
Downers
All 2.5% 3.9% 6.1% 93.9%
Grades 7-8 0.5% 0.9% 1.4% 98.6%
Grades 9-12 3.6% 5.4% 8.6% 91.4%

8/3/2019 BELL COUNTY - Academy ISD - 2011 Texas School Survey of Drug and Alcohol Use
http://slidepdf.com/reader/full/bell-county-academy-isd-2011-texas-school-survey-of-drug-and-alcohol-use 170/209
State: Grades 7-12 Medium
SPRING 2010
©Copyright 2010, Texas A&M University
All rights reserved.Secondary Report-Page 44 of 83
Table B4: Prevalence and recency of use of selected substances by gradeWhite students
(Continued) Past
Month
School
Year
Ever
Used
Never
Used
Rohypnol
All 0.5% 0.8% 1.6% 98.4%
Grades 7-8 0.2% 0.4% 0.9% 99.1%
Grades 9-12 0.7% 1.0% 1.9% 98.1%
Steroids
All 0.5% 0.8% 1.7% 98.3%
Grades 7-8 0.3% 0.7% 1.7% 98.3%
Grades 9-12 0.6% 0.9% 1.7% 98.3%
Ecstasy
All 1.9% 3.2% 5.8% 94.2%
Grades 7-8 0.7% 1.1% 2.1% 97.9%
Grades 9-12 2.5% 4.3% 7.6% 92.4%
Heroin
All 0.4% 0.6% 1.2% 98.8%
Grades 7-8 0.3% 0.5% 1.1% 98.9%
Grades 9-12 0.4% 0.6% 1.3% 98.7%

8/3/2019 BELL COUNTY - Academy ISD - 2011 Texas School Survey of Drug and Alcohol Use
http://slidepdf.com/reader/full/bell-county-academy-isd-2011-texas-school-survey-of-drug-and-alcohol-use 171/209
State: Grades 7-12 Medium
SPRING 2010
©Copyright 2010, Texas A&M University
All rights reserved.Secondary Report-Page 45 of 83
Table B5: Prevalence and recency of use of selected substances by gradeBlack students
Past
Month
School
Year
Ever
Used
Never
Used
Tobacco
All 6.9% 11.5% 23.8% 76.2%
Grades 7-8 4.9% 7.4% 17.8% 82.2%Grades 9-12 7.9% 13.6% 26.8% 73.2%
Alcohol
All 25.3% 36.6% 59.5% 40.5%
Grades 7-8 18.7% 24.9% 50.0% 50.0%
Grades 9-12 28.6% 42.6% 64.4% 35.6%
Inhalants
All 5.5% 7.4% 13.3% 86.7%
Grades 7-8 8.2% 10.2% 17.6% 82.4%
Grades 9-12 4.1% 5.9% 11.1% 88.9%
Any Illicit Drug
All 13.1% 19.1% 30.7% 69.3%
Grades 7-8 7.8% 10.2% 17.6% 82.4%
Grades 9-12 15.8% 23.6% 37.4% 62.6%
Marijuana
All 11.7% 18.0% 29.8% 70.2%
Grades 7-8 6.2% 8.4% 15.8% 84.2%
Grades 9-12 14.5% 22.8% 36.9% 63.1%
Marijuana Only
All 7.3% 12.2% 21.7% 78.3%
Grades 7-8 3.7% 5.4% 11.3% 88.7%
Grades 9-12 9.1% 15.6% 27.0% 73.0%
Cocaine or Crack
All 0.6% 1.0% 1.7% 98.3%
Grades 7-8 0.6% 1.0% 1.9% 98.1%
Grades 9-12 0.6% 0.9% 1.7% 98.3%Cocaine
All 0.6% 0.9% 1.6% 98.4%
Grades 7-8 0.5% 1.0% 1.8% 98.2%
Grades 9-12 0.6% 0.8% 1.5% 98.5%
Crack
All 0.3% 0.4% 0.7% 99.3%
Grades 7-8 0.5% 0.5% 0.9% 99.1%
Grades 9-12 0.3% 0.4% 0.6% 99.4%
Hallucinogens
All 0.8% 1.2% 2.2% 97.8%
Grades 7-8 1.0% 1.2% 1.6% 98.4%
Grades 9-12 0.7% 1.2% 2.5% 97.5%Uppers
All 1.2% 1.7% 2.6% 97.4%
Grades 7-8 0.9% 1.2% 1.8% 98.2%
Grades 9-12 1.3% 2.0% 2.9% 97.1%
Downers
All 1.5% 2.0% 3.1% 96.9%
Grades 7-8 1.0% 1.2% 1.7% 98.3%
Grades 9-12 1.7% 2.4% 3.8% 96.2%

8/3/2019 BELL COUNTY - Academy ISD - 2011 Texas School Survey of Drug and Alcohol Use
http://slidepdf.com/reader/full/bell-county-academy-isd-2011-texas-school-survey-of-drug-and-alcohol-use 172/209
State: Grades 7-12 Medium
SPRING 2010
©Copyright 2010, Texas A&M University
All rights reserved.Secondary Report-Page 46 of 83
Table B5: Prevalence and recency of use of selected substances by gradeBlack students
(Continued) Past
Month
School
Year
Ever
Used
Never
Used
Rohypnol
All 0.5% 0.8% 1.1% 98.9%
Grades 7-8 0.5% 0.6% 1.1% 98.9%
Grades 9-12 0.5% 0.8% 1.1% 98.9%
Steroids
All 0.5% 0.8% 1.5% 98.5%
Grades 7-8 0.6% 0.7% 1.4% 98.6%
Grades 9-12 0.5% 0.8% 1.5% 98.5%
Ecstasy
All 1.7% 2.8% 4.6% 95.4%
Grades 7-8 1.0% 2.0% 3.1% 96.9%
Grades 9-12 2.1% 3.2% 5.3% 94.7%
Heroin
All 0.4% 0.6% 0.9% 99.1%
Grades 7-8 0.4% 0.7% 1.2% 98.8%
Grades 9-12 0.4% 0.6% 0.8% 99.2%
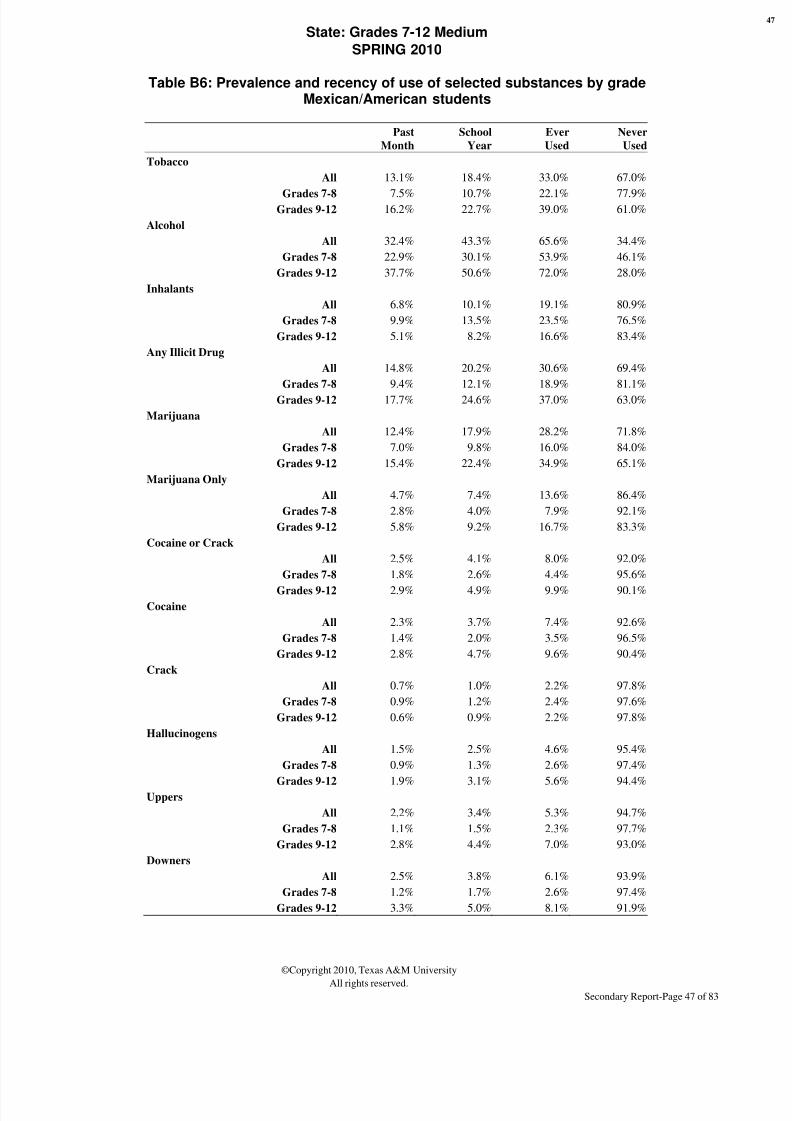
8/3/2019 BELL COUNTY - Academy ISD - 2011 Texas School Survey of Drug and Alcohol Use
http://slidepdf.com/reader/full/bell-county-academy-isd-2011-texas-school-survey-of-drug-and-alcohol-use 173/209
State: Grades 7-12 Medium
SPRING 2010
©Copyright 2010, Texas A&M University
All rights reserved.Secondary Report-Page 47 of 83
Table B6: Prevalence and recency of use of selected substances by gradeMexican/American students
Past
Month
School
Year
Ever
Used
Never
Used
Tobacco
All 13.1% 18.4% 33.0% 67.0%
Grades 7-8 7.5% 10.7% 22.1% 77.9%Grades 9-12 16.2% 22.7% 39.0% 61.0%
Alcohol
All 32.4% 43.3% 65.6% 34.4%
Grades 7-8 22.9% 30.1% 53.9% 46.1%
Grades 9-12 37.7% 50.6% 72.0% 28.0%
Inhalants
All 6.8% 10.1% 19.1% 80.9%
Grades 7-8 9.9% 13.5% 23.5% 76.5%
Grades 9-12 5.1% 8.2% 16.6% 83.4%
Any Illicit Drug
All 14.8% 20.2% 30.6% 69.4%
Grades 7-8 9.4% 12.1% 18.9% 81.1%
Grades 9-12 17.7% 24.6% 37.0% 63.0%
Marijuana
All 12.4% 17.9% 28.2% 71.8%
Grades 7-8 7.0% 9.8% 16.0% 84.0%
Grades 9-12 15.4% 22.4% 34.9% 65.1%
Marijuana Only
All 4.7% 7.4% 13.6% 86.4%
Grades 7-8 2.8% 4.0% 7.9% 92.1%
Grades 9-12 5.8% 9.2% 16.7% 83.3%
Cocaine or Crack
All 2.5% 4.1% 8.0% 92.0%
Grades 7-8 1.8% 2.6% 4.4% 95.6%
Grades 9-12 2.9% 4.9% 9.9% 90.1%Cocaine
All 2.3% 3.7% 7.4% 92.6%
Grades 7-8 1.4% 2.0% 3.5% 96.5%
Grades 9-12 2.8% 4.7% 9.6% 90.4%
Crack
All 0.7% 1.0% 2.2% 97.8%
Grades 7-8 0.9% 1.2% 2.4% 97.6%
Grades 9-12 0.6% 0.9% 2.2% 97.8%
Hallucinogens
All 1.5% 2.5% 4.6% 95.4%
Grades 7-8 0.9% 1.3% 2.6% 97.4%
Grades 9-12 1.9% 3.1% 5.6% 94.4%Uppers
All 2.2% 3.4% 5.3% 94.7%
Grades 7-8 1.1% 1.5% 2.3% 97.7%
Grades 9-12 2.8% 4.4% 7.0% 93.0%
Downers
All 2.5% 3.8% 6.1% 93.9%
Grades 7-8 1.2% 1.7% 2.6% 97.4%
Grades 9-12 3.3% 5.0% 8.1% 91.9%

8/3/2019 BELL COUNTY - Academy ISD - 2011 Texas School Survey of Drug and Alcohol Use
http://slidepdf.com/reader/full/bell-county-academy-isd-2011-texas-school-survey-of-drug-and-alcohol-use 174/209
State: Grades 7-12 Medium
SPRING 2010
©Copyright 2010, Texas A&M University
All rights reserved.Secondary Report-Page 48 of 83
Table B6: Prevalence and recency of use of selected substances by gradeMexican/American students
(Continued) Past
Month
School
Year
Ever
Used
Never
Used
Rohypnol
All 1.6% 2.3% 3.9% 96.1%
Grades 7-8 1.4% 1.9% 3.1% 96.9%
Grades 9-12 1.7% 2.5% 4.4% 95.6%
Steroids
All 0.4% 0.5% 1.1% 98.9%
Grades 7-8 0.4% 0.5% 1.1% 98.9%
Grades 9-12 0.4% 0.6% 1.1% 98.9%
Ecstasy
All 3.3% 4.9% 8.2% 91.8%
Grades 7-8 1.8% 2.5% 4.3% 95.7%
Grades 9-12 4.1% 6.2% 10.3% 89.7%
Heroin
All 0.7% 0.9% 1.7% 98.3%
Grades 7-8 0.9% 1.2% 2.1% 97.9%
Grades 9-12 0.6% 0.8% 1.5% 98.5%

8/3/2019 BELL COUNTY - Academy ISD - 2011 Texas School Survey of Drug and Alcohol Use
http://slidepdf.com/reader/full/bell-county-academy-isd-2011-texas-school-survey-of-drug-and-alcohol-use 175/209
State: Grades 7-12 Medium
SPRING 2010
©Copyright 2010, Texas A&M University
All rights reserved.Secondary Report-Page 49 of 83
Table B7: Prevalence and recency of use of selected substances by gradeStudents reporting A grades
Past
Month
School
Year
Ever
Used
Never
Used
Tobacco
All 6.7% 10.0% 18.7% 81.3%
Grades 7-8 2.2% 3.5% 9.3% 90.7%Grades 9-12 9.3% 13.9% 24.3% 75.7%
Alcohol
All 20.4% 30.7% 51.8% 48.2%
Grades 7-8 10.4% 16.1% 37.5% 62.5%
Grades 9-12 26.3% 39.2% 60.2% 39.8%
Inhalants
All 3.7% 5.9% 11.8% 88.2%
Grades 7-8 5.1% 7.6% 13.6% 86.4%
Grades 9-12 2.9% 4.9% 10.7% 89.3%
Any Illicit Drug
All 6.8% 10.2% 16.1% 83.9%
Grades 7-8 2.6% 3.8% 6.5% 93.5%
Grades 9-12 9.2% 14.0% 21.7% 78.3%
Marijuana
All 5.7% 9.2% 15.0% 85.0%
Grades 7-8 1.7% 2.8% 5.2% 94.8%
Grades 9-12 8.1% 13.0% 20.7% 79.3%
Marijuana Only
All 2.5% 4.7% 8.7% 91.3%
Grades 7-8 0.7% 1.3% 3.0% 97.0%
Grades 9-12 3.6% 6.6% 12.0% 88.0%
Cocaine or Crack
All 0.6% 1.0% 2.2% 97.8%
Grades 7-8 0.4% 0.5% 0.9% 99.1%
Grades 9-12 0.7% 1.4% 2.9% 97.1%Cocaine
All 0.5% 0.9% 1.9% 98.1%
Grades 7-8 0.2% 0.4% 0.7% 99.3%
Grades 9-12 0.7% 1.3% 2.7% 97.3%
Crack
All 0.2% 0.3% 0.8% 99.2%
Grades 7-8 0.3% 0.3% 0.6% 99.4%
Grades 9-12 0.2% 0.3% 0.9% 99.1%
Hallucinogens
All 0.9% 1.4% 2.7% 97.3%
Grades 7-8 0.5% 0.6% 1.2% 98.8%
Grades 9-12 1.2% 1.9% 3.6% 96.4%Uppers
All 1.2% 1.9% 3.0% 97.0%
Grades 7-8 0.5% 0.6% 1.0% 99.0%
Grades 9-12 1.6% 2.7% 4.2% 95.8%
Downers
All 1.2% 1.9% 3.1% 96.9%
Grades 7-8 0.5% 0.6% 1.0% 99.0%
Grades 9-12 1.7% 2.6% 4.3% 95.7%

8/3/2019 BELL COUNTY - Academy ISD - 2011 Texas School Survey of Drug and Alcohol Use
http://slidepdf.com/reader/full/bell-county-academy-isd-2011-texas-school-survey-of-drug-and-alcohol-use 176/209
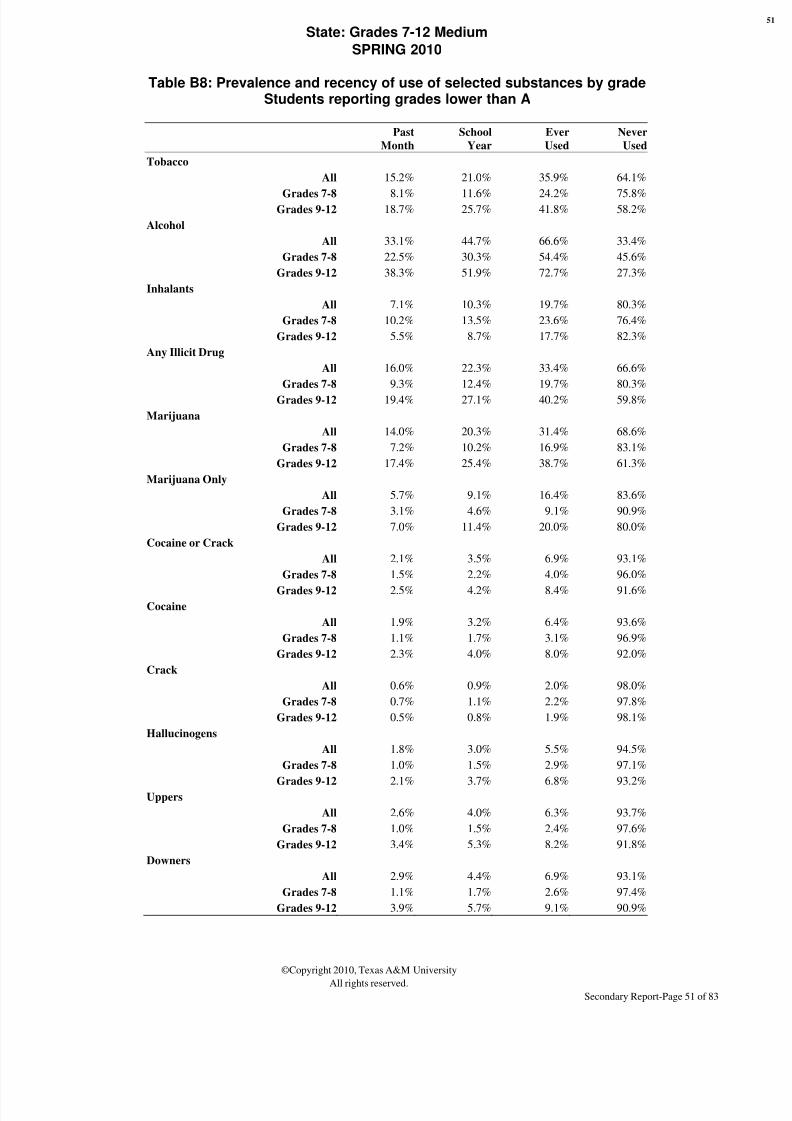
8/3/2019 BELL COUNTY - Academy ISD - 2011 Texas School Survey of Drug and Alcohol Use
http://slidepdf.com/reader/full/bell-county-academy-isd-2011-texas-school-survey-of-drug-and-alcohol-use 177/209
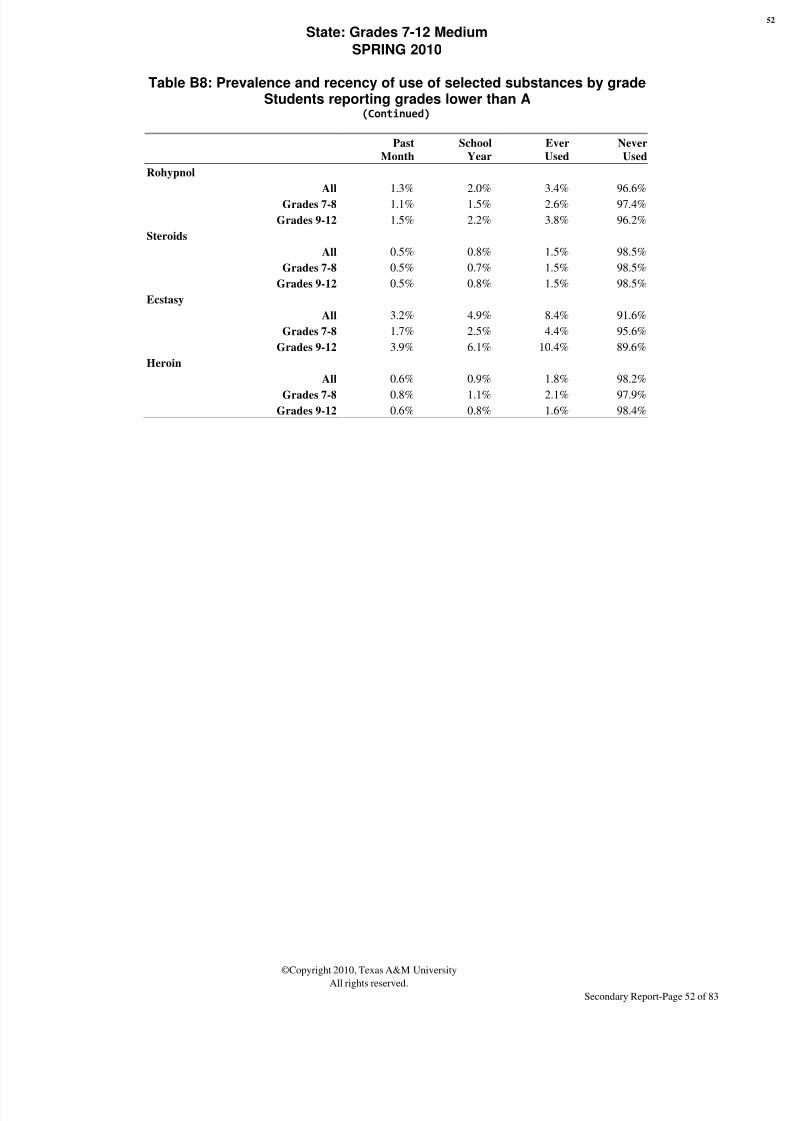
8/3/2019 BELL COUNTY - Academy ISD - 2011 Texas School Survey of Drug and Alcohol Use
http://slidepdf.com/reader/full/bell-county-academy-isd-2011-texas-school-survey-of-drug-and-alcohol-use 178/209
State: Grades 7-12 Medium
SPRING 2010
©Copyright 2010, Texas A&M University
All rights reserved.Secondary Report-Page 52 of 83
Table B8: Prevalence and recency of use of selected substances by gradeStudents reporting grades lower than A
(Continued) Past
Month
School
Year
Ever
Used
Never
Used
Rohypnol
All 1.3% 2.0% 3.4% 96.6%
Grades 7-8 1.1% 1.5% 2.6% 97.4%
Grades 9-12 1.5% 2.2% 3.8% 96.2%
Steroids
All 0.5% 0.8% 1.5% 98.5%
Grades 7-8 0.5% 0.7% 1.5% 98.5%
Grades 9-12 0.5% 0.8% 1.5% 98.5%
Ecstasy
All 3.2% 4.9% 8.4% 91.6%
Grades 7-8 1.7% 2.5% 4.4% 95.6%
Grades 9-12 3.9% 6.1% 10.4% 89.6%
Heroin
All 0.6% 0.9% 1.8% 98.2%
Grades 7-8 0.8% 1.1% 2.1% 97.9%
Grades 9-12 0.6% 0.8% 1.6% 98.4%

8/3/2019 BELL COUNTY - Academy ISD - 2011 Texas School Survey of Drug and Alcohol Use
http://slidepdf.com/reader/full/bell-county-academy-isd-2011-texas-school-survey-of-drug-and-alcohol-use 179/209
State: Grades 7-12 Medium
SPRING 2010
©Copyright 2010, Texas A&M University
All rights reserved.Secondary Report-Page 53 of 83
Table B9: Prevalence and recency of use of selected substances by gradeStudents living with two parents
Past
Month
School
Year
Ever
Used
Never
Used
Tobacco
All 10.4% 14.7% 25.7% 74.3%
Grades 7-8 4.7% 6.6% 14.9% 85.1%Grades 9-12 13.6% 19.1% 31.7% 68.3%
Alcohol
All 26.3% 36.2% 57.0% 43.0%
Grades 7-8 16.1% 22.0% 43.2% 56.8%
Grades 9-12 32.0% 44.2% 64.7% 35.3%
Inhalants
All 5.4% 7.9% 15.3% 84.7%
Grades 7-8 7.4% 10.1% 18.1% 81.9%
Grades 9-12 4.2% 6.6% 13.7% 86.3%
Any Illicit Drug
All 10.4% 14.8% 22.4% 77.6%
Grades 7-8 5.3% 7.1% 11.5% 88.5%
Grades 9-12 13.3% 19.0% 28.4% 71.6%
Marijuana
All 8.8% 13.2% 20.6% 79.4%
Grades 7-8 3.7% 5.4% 9.2% 90.8%
Grades 9-12 11.6% 17.5% 26.9% 73.1%
Marijuana Only
All 3.7% 6.1% 10.9% 89.1%
Grades 7-8 1.5% 2.3% 4.8% 95.2%
Grades 9-12 4.9% 8.2% 14.3% 85.7%
Cocaine or Crack
All 1.4% 2.3% 4.6% 95.4%
Grades 7-8 0.9% 1.3% 2.4% 97.6%
Grades 9-12 1.6% 2.9% 5.9% 94.1%Cocaine
All 1.2% 2.1% 4.2% 95.8%
Grades 7-8 0.6% 1.0% 1.8% 98.2%
Grades 9-12 1.5% 2.7% 5.6% 94.4%
Crack
All 0.4% 0.7% 1.5% 98.5%
Grades 7-8 0.5% 0.7% 1.4% 98.6%
Grades 9-12 0.4% 0.6% 1.5% 98.5%
Hallucinogens
All 1.2% 2.0% 3.7% 96.3%
Grades 7-8 0.6% 0.9% 1.8% 98.2%
Grades 9-12 1.5% 2.6% 4.8% 95.2%Uppers
All 1.6% 2.4% 3.9% 96.1%
Grades 7-8 0.6% 0.7% 1.3% 98.7%
Grades 9-12 2.2% 3.4% 5.3% 94.7%
Downers
All 1.7% 2.6% 4.3% 95.7%
Grades 7-8 0.7% 1.0% 1.5% 98.5%
Grades 9-12 2.3% 3.6% 5.8% 94.2%
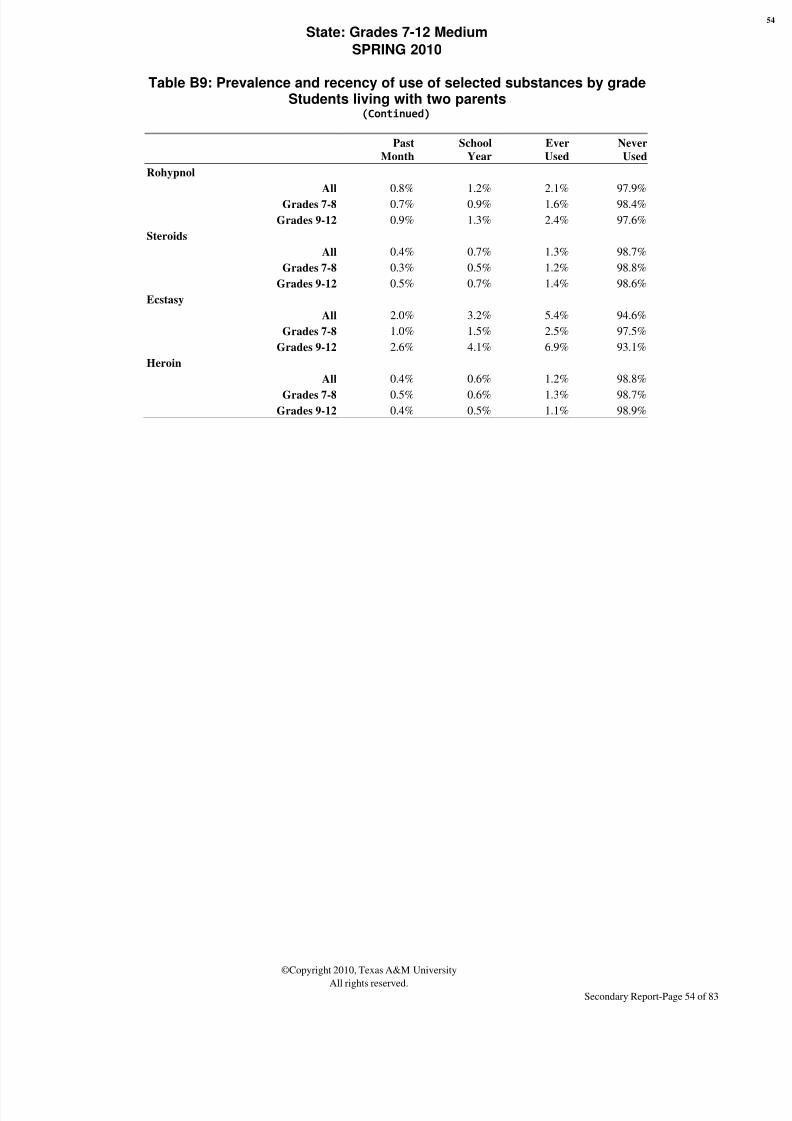
8/3/2019 BELL COUNTY - Academy ISD - 2011 Texas School Survey of Drug and Alcohol Use
http://slidepdf.com/reader/full/bell-county-academy-isd-2011-texas-school-survey-of-drug-and-alcohol-use 180/209
State: Grades 7-12 Medium
SPRING 2010
©Copyright 2010, Texas A&M University
All rights reserved.Secondary Report-Page 54 of 83
Table B9: Prevalence and recency of use of selected substances by gradeStudents living with two parents
(Continued) Past
Month
School
Year
Ever
Used
Never
Used
Rohypnol
All 0.8% 1.2% 2.1% 97.9%
Grades 7-8 0.7% 0.9% 1.6% 98.4%
Grades 9-12 0.9% 1.3% 2.4% 97.6%
Steroids
All 0.4% 0.7% 1.3% 98.7%
Grades 7-8 0.3% 0.5% 1.2% 98.8%
Grades 9-12 0.5% 0.7% 1.4% 98.6%
Ecstasy
All 2.0% 3.2% 5.4% 94.6%
Grades 7-8 1.0% 1.5% 2.5% 97.5%
Grades 9-12 2.6% 4.1% 6.9% 93.1%
Heroin
All 0.4% 0.6% 1.2% 98.8%
Grades 7-8 0.5% 0.6% 1.3% 98.7%
Grades 9-12 0.4% 0.5% 1.1% 98.9%

8/3/2019 BELL COUNTY - Academy ISD - 2011 Texas School Survey of Drug and Alcohol Use
http://slidepdf.com/reader/full/bell-county-academy-isd-2011-texas-school-survey-of-drug-and-alcohol-use 181/209
State: Grades 7-12 Medium
SPRING 2010
©Copyright 2010, Texas A&M University
All rights reserved.Secondary Report-Page 55 of 83
Table B10: Prevalence and recency of use of selected substances by gradeStudents not living with two parents
Past
Month
School
Year
Ever
Used
Never
Used
Tobacco
All 15.7% 22.1% 37.9% 62.1%
Grades 7-8 8.5% 12.6% 26.3% 73.7%Grades 9-12 19.2% 26.6% 43.5% 56.5%
Alcohol
All 33.4% 46.6% 69.6% 30.4%
Grades 7-8 22.3% 31.3% 57.7% 42.3%
Grades 9-12 38.8% 53.9% 75.3% 24.7%
Inhalants
All 7.1% 10.6% 20.3% 79.7%
Grades 7-8 10.3% 14.0% 24.0% 76.0%
Grades 9-12 5.6% 9.0% 18.5% 81.5%
Any Illicit Drug
All 17.4% 24.3% 36.8% 63.2%
Grades 7-8 10.0% 13.5% 21.6% 78.4%
Grades 9-12 21.0% 29.5% 44.0% 56.0%
Marijuana
All 15.6% 22.7% 35.2% 64.8%
Grades 7-8 8.1% 11.6% 19.4% 80.6%
Grades 9-12 19.2% 28.0% 42.9% 57.1%
Marijuana Only
All 6.4% 10.3% 18.7% 81.3%
Grades 7-8 3.7% 5.5% 10.9% 89.1%
Grades 9-12 7.7% 12.6% 22.5% 77.5%
Cocaine or Crack
All 2.1% 3.4% 6.6% 93.4%
Grades 7-8 1.5% 2.2% 3.9% 96.1%
Grades 9-12 2.4% 4.0% 7.9% 92.1%Cocaine
All 1.9% 3.2% 6.2% 93.8%
Grades 7-8 1.2% 1.8% 3.1% 96.9%
Grades 9-12 2.3% 3.8% 7.6% 92.4%
Crack
All 0.6% 0.8% 1.8% 98.2%
Grades 7-8 0.7% 1.0% 2.0% 98.0%
Grades 9-12 0.5% 0.7% 1.8% 98.2%
Hallucinogens
All 2.0% 3.4% 6.1% 93.9%
Grades 7-8 1.2% 1.8% 3.3% 96.7%
Grades 9-12 2.4% 4.1% 7.4% 92.6%Uppers
All 3.1% 4.8% 7.5% 92.5%
Grades 7-8 1.3% 2.0% 3.1% 96.9%
Grades 9-12 3.9% 6.2% 9.6% 90.4%
Downers
All 3.5% 5.1% 7.9% 92.1%
Grades 7-8 1.3% 1.9% 2.9% 97.1%
Grades 9-12 4.5% 6.6% 10.4% 89.6%

8/3/2019 BELL COUNTY - Academy ISD - 2011 Texas School Survey of Drug and Alcohol Use
http://slidepdf.com/reader/full/bell-county-academy-isd-2011-texas-school-survey-of-drug-and-alcohol-use 182/209
State: Grades 7-12 Medium
SPRING 2010
©Copyright 2010, Texas A&M University
All rights reserved.Secondary Report-Page 56 of 83
Table B10: Prevalence and recency of use of selected substances by gradeStudents not living with two parents
(Continued) Past
Month
School
Year
Ever
Used
Never
Used
Rohypnol
All 1.4% 2.1% 3.5% 96.5%
Grades 7-8 1.1% 1.6% 2.7% 97.3%
Grades 9-12 1.5% 2.3% 3.9% 96.1%
Steroids
All 0.5% 0.8% 1.5% 98.5%
Grades 7-8 0.6% 0.9% 1.7% 98.3%
Grades 9-12 0.5% 0.8% 1.4% 98.6%
Ecstasy
All 3.4% 5.3% 9.1% 90.9%
Grades 7-8 1.9% 2.8% 4.8% 95.2%
Grades 9-12 4.1% 6.5% 11.2% 88.8%
Heroin
All 0.7% 1.0% 1.8% 98.2%
Grades 7-8 0.8% 1.1% 2.1% 97.9%
Grades 9-12 0.6% 0.9% 1.6% 98.4%

8/3/2019 BELL COUNTY - Academy ISD - 2011 Texas School Survey of Drug and Alcohol Use
http://slidepdf.com/reader/full/bell-county-academy-isd-2011-texas-school-survey-of-drug-and-alcohol-use 183/209
State: Grades 7-12 Medium
SPRING 2010
©Copyright 2010, Texas A&M University
All rights reserved.Secondary Report-Page 57 of 83
Table B11: Prevalence and recency of use of selected substances by gradeStudents would seek help from adults for substance abuse problems
Past
Month
School
Year
Ever
Used
Never
Used
Tobacco
All 10.8% 15.3% 27.7% 72.3%
Grades 7-8 4.5% 6.8% 15.9% 84.1%Grades 9-12 14.2% 19.9% 34.2% 65.8%
Alcohol
All 26.8% 37.7% 59.6% 40.4%
Grades 7-8 15.8% 22.1% 44.9% 55.1%
Grades 9-12 32.9% 46.2% 67.6% 32.4%
Inhalants
All 5.0% 7.6% 15.1% 84.9%
Grades 7-8 6.8% 9.4% 17.3% 82.7%
Grades 9-12 4.0% 6.6% 14.0% 86.0%
Any Illicit Drug
All 11.1% 15.9% 24.7% 75.3%
Grades 7-8 5.4% 7.4% 12.2% 87.8%
Grades 9-12 14.2% 20.5% 31.6% 68.4%
Marijuana
All 9.6% 14.6% 23.2% 76.8%
Grades 7-8 4.1% 6.0% 10.4% 89.6%
Grades 9-12 12.7% 19.3% 30.2% 69.8%
Marijuana Only
All 4.1% 6.9% 13.0% 87.0%
Grades 7-8 1.9% 2.9% 6.0% 94.0%
Grades 9-12 5.3% 9.1% 16.7% 83.3%
Cocaine or Crack
All 1.2% 2.1% 4.3% 95.7%
Grades 7-8 0.7% 1.1% 2.1% 97.9%
Grades 9-12 1.5% 2.6% 5.5% 94.5%Cocaine
All 1.1% 1.9% 4.0% 96.0%
Grades 7-8 0.6% 0.9% 1.7% 98.3%
Grades 9-12 1.4% 2.5% 5.2% 94.8%
Crack
All 0.3% 0.5% 1.1% 98.9%
Grades 7-8 0.4% 0.5% 1.1% 98.9%
Grades 9-12 0.3% 0.5% 1.2% 98.8%
Hallucinogens
All 1.1% 1.9% 3.7% 96.3%
Grades 7-8 0.6% 0.8% 1.6% 98.4%
Grades 9-12 1.4% 2.6% 4.9% 95.1%Uppers
All 1.7% 2.7% 4.4% 95.6%
Grades 7-8 0.6% 0.8% 1.3% 98.7%
Grades 9-12 2.2% 3.8% 6.1% 93.9%
Downers
All 1.9% 2.9% 4.7% 95.3%
Grades 7-8 0.6% 1.0% 1.4% 98.6%
Grades 9-12 2.5% 3.9% 6.4% 93.6%

8/3/2019 BELL COUNTY - Academy ISD - 2011 Texas School Survey of Drug and Alcohol Use
http://slidepdf.com/reader/full/bell-county-academy-isd-2011-texas-school-survey-of-drug-and-alcohol-use 184/209

8/3/2019 BELL COUNTY - Academy ISD - 2011 Texas School Survey of Drug and Alcohol Use
http://slidepdf.com/reader/full/bell-county-academy-isd-2011-texas-school-survey-of-drug-and-alcohol-use 185/209
State: Grades 7-12 Medium
SPRING 2010
©Copyright 2010, Texas A&M University
All rights reserved.Secondary Report-Page 59 of 83
Table B12: Prevalence and recency of use of selected substances by gradeStudents would not seek help from adults for substance abuse problems
Past
Month
School
Year
Ever
Used
Never
Used
Tobacco
All 18.6% 25.7% 40.1% 59.9%
Grades 7-8 12.1% 17.1% 31.3% 68.7%Grades 9-12 21.6% 29.9% 44.4% 55.6%
Alcohol
All 37.4% 49.8% 69.9% 30.1%
Grades 7-8 29.3% 39.6% 63.4% 36.6%
Grades 9-12 41.2% 54.6% 73.0% 27.0%
Inhalants
All 9.7% 13.8% 24.4% 75.6%
Grades 7-8 15.0% 20.3% 31.6% 68.4%
Grades 9-12 7.2% 10.6% 21.0% 79.0%
Any Illicit Drug
All 20.5% 27.8% 39.2% 60.8%
Grades 7-8 13.2% 17.9% 27.2% 72.8%
Grades 9-12 24.0% 32.5% 44.9% 55.1%
Marijuana
All 17.7% 25.1% 36.9% 63.1%
Grades 7-8 10.0% 14.2% 22.9% 77.1%
Grades 9-12 21.4% 30.3% 43.5% 56.5%
Marijuana Only
All 6.9% 11.0% 17.9% 82.1%
Grades 7-8 3.5% 5.7% 11.1% 88.9%
Grades 9-12 8.5% 13.4% 21.2% 78.8%
Cocaine or Crack
All 3.1% 4.9% 8.9% 91.1%
Grades 7-8 2.3% 3.4% 5.7% 94.3%
Grades 9-12 3.5% 5.7% 10.4% 89.6%Cocaine
All 2.7% 4.4% 8.1% 91.9%
Grades 7-8 1.6% 2.3% 4.2% 95.8%
Grades 9-12 3.3% 5.4% 10.0% 90.0%
Crack
All 1.1% 1.5% 3.3% 96.7%
Grades 7-8 1.4% 2.0% 3.8% 96.2%
Grades 9-12 0.9% 1.3% 3.0% 97.0%
Hallucinogens
All 2.9% 4.7% 7.9% 92.1%
Grades 7-8 2.0% 2.8% 4.9% 95.1%
Grades 9-12 3.4% 5.6% 9.4% 90.6%Uppers
All 4.0% 5.8% 8.4% 91.6%
Grades 7-8 1.8% 2.7% 4.2% 95.8%
Grades 9-12 5.1% 7.3% 10.5% 89.5%
Downers
All 4.3% 6.0% 9.1% 90.9%
Grades 7-8 1.8% 2.5% 4.1% 95.9%
Grades 9-12 5.5% 7.8% 11.6% 88.4%

8/3/2019 BELL COUNTY - Academy ISD - 2011 Texas School Survey of Drug and Alcohol Use
http://slidepdf.com/reader/full/bell-county-academy-isd-2011-texas-school-survey-of-drug-and-alcohol-use 186/209

8/3/2019 BELL COUNTY - Academy ISD - 2011 Texas School Survey of Drug and Alcohol Use
http://slidepdf.com/reader/full/bell-county-academy-isd-2011-texas-school-survey-of-drug-and-alcohol-use 187/209

8/3/2019 BELL COUNTY - Academy ISD - 2011 Texas School Survey of Drug and Alcohol Use
http://slidepdf.com/reader/full/bell-county-academy-isd-2011-texas-school-survey-of-drug-and-alcohol-use 188/209
State: Grades 7-12 Medium
SPRING 2010
©Copyright 2010, Texas A&M University
All rights reserved.Secondary Report-Page 62 of 83
Table B13: Prevalence and recency of use of selected substances by gradeStudents living in town three years or less
(Continued) Past
Month
School
Year
Ever
Used
Never
Used
Rohypnol
All 1.3% 1.8% 3.1% 96.9%
Grades 7-8 1.0% 1.4% 2.4% 97.6%
Grades 9-12 1.5% 2.1% 3.5% 96.5%
Steroids
All 0.5% 0.8% 1.5% 98.5%
Grades 7-8 0.5% 0.8% 1.6% 98.4%
Grades 9-12 0.5% 0.7% 1.4% 98.6%
Ecstasy
All 2.9% 4.4% 7.6% 92.4%
Grades 7-8 1.4% 2.2% 4.0% 96.0%
Grades 9-12 3.7% 5.8% 9.8% 90.2%
Heroin
All 0.7% 1.0% 1.8% 98.2%
Grades 7-8 0.8% 1.1% 2.0% 98.0%
Grades 9-12 0.6% 1.0% 1.7% 98.3%
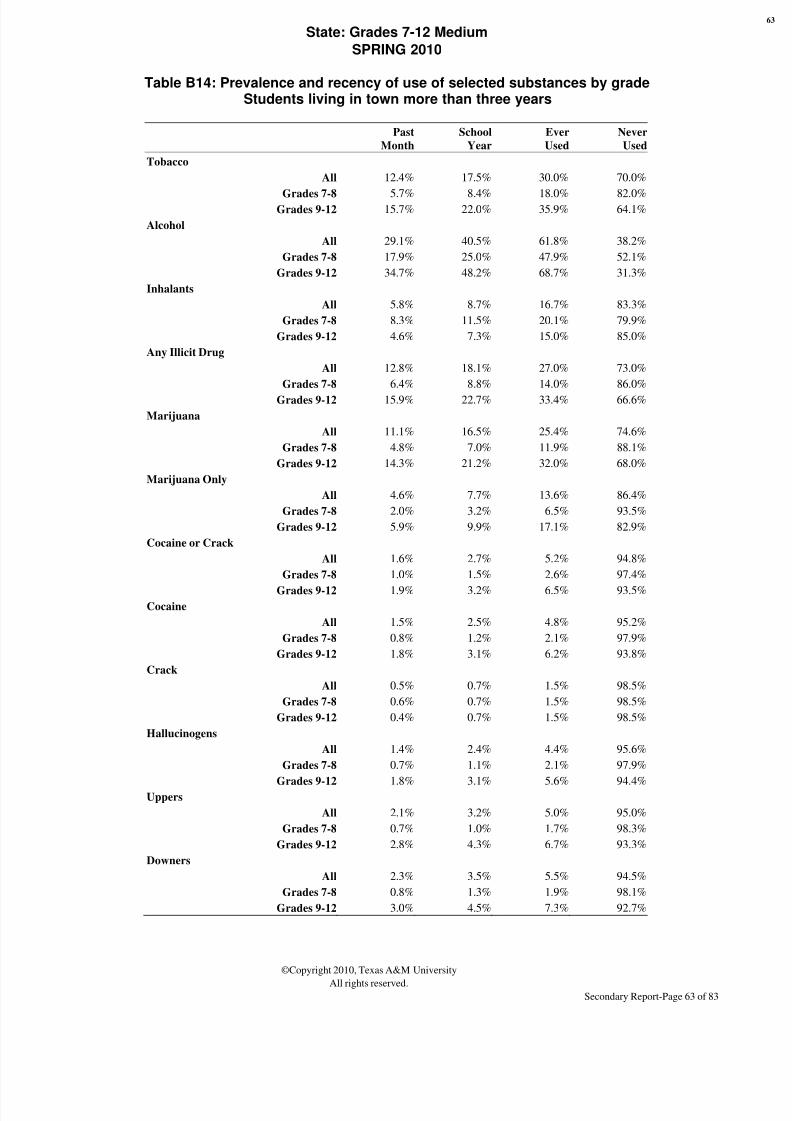
8/3/2019 BELL COUNTY - Academy ISD - 2011 Texas School Survey of Drug and Alcohol Use
http://slidepdf.com/reader/full/bell-county-academy-isd-2011-texas-school-survey-of-drug-and-alcohol-use 189/209
State: Grades 7-12 Medium
SPRING 2010
©Copyright 2010, Texas A&M University
All rights reserved.Secondary Report-Page 63 of 83
Table B14: Prevalence and recency of use of selected substances by gradeStudents living in town more than three years
Past
Month
School
Year
Ever
Used
Never
Used
Tobacco
All 12.4% 17.5% 30.0% 70.0%
Grades 7-8 5.7% 8.4% 18.0% 82.0%Grades 9-12 15.7% 22.0% 35.9% 64.1%
Alcohol
All 29.1% 40.5% 61.8% 38.2%
Grades 7-8 17.9% 25.0% 47.9% 52.1%
Grades 9-12 34.7% 48.2% 68.7% 31.3%
Inhalants
All 5.8% 8.7% 16.7% 83.3%
Grades 7-8 8.3% 11.5% 20.1% 79.9%
Grades 9-12 4.6% 7.3% 15.0% 85.0%
Any Illicit Drug
All 12.8% 18.1% 27.0% 73.0%
Grades 7-8 6.4% 8.8% 14.0% 86.0%
Grades 9-12 15.9% 22.7% 33.4% 66.6%
Marijuana
All 11.1% 16.5% 25.4% 74.6%
Grades 7-8 4.8% 7.0% 11.9% 88.1%
Grades 9-12 14.3% 21.2% 32.0% 68.0%
Marijuana Only
All 4.6% 7.7% 13.6% 86.4%
Grades 7-8 2.0% 3.2% 6.5% 93.5%
Grades 9-12 5.9% 9.9% 17.1% 82.9%
Cocaine or Crack
All 1.6% 2.7% 5.2% 94.8%
Grades 7-8 1.0% 1.5% 2.6% 97.4%
Grades 9-12 1.9% 3.2% 6.5% 93.5%Cocaine
All 1.5% 2.5% 4.8% 95.2%
Grades 7-8 0.8% 1.2% 2.1% 97.9%
Grades 9-12 1.8% 3.1% 6.2% 93.8%
Crack
All 0.5% 0.7% 1.5% 98.5%
Grades 7-8 0.6% 0.7% 1.5% 98.5%
Grades 9-12 0.4% 0.7% 1.5% 98.5%
Hallucinogens
All 1.4% 2.4% 4.4% 95.6%
Grades 7-8 0.7% 1.1% 2.1% 97.9%
Grades 9-12 1.8% 3.1% 5.6% 94.4%Uppers
All 2.1% 3.2% 5.0% 95.0%
Grades 7-8 0.7% 1.0% 1.7% 98.3%
Grades 9-12 2.8% 4.3% 6.7% 93.3%
Downers
All 2.3% 3.5% 5.5% 94.5%
Grades 7-8 0.8% 1.3% 1.9% 98.1%
Grades 9-12 3.0% 4.5% 7.3% 92.7%

8/3/2019 BELL COUNTY - Academy ISD - 2011 Texas School Survey of Drug and Alcohol Use
http://slidepdf.com/reader/full/bell-county-academy-isd-2011-texas-school-survey-of-drug-and-alcohol-use 190/209

8/3/2019 BELL COUNTY - Academy ISD - 2011 Texas School Survey of Drug and Alcohol Use
http://slidepdf.com/reader/full/bell-county-academy-isd-2011-texas-school-survey-of-drug-and-alcohol-use 191/209
State: Grades 7-12 Medium
Spring 2010
The frequencies have been weighted so that the analysis reflects
the distribution of students by grade level in the district
©Copyright 2010, Texas A&M University
All rights reserved.
Page 65 of 83
3. Margin Tables

8/3/2019 BELL COUNTY - Academy ISD - 2011 Texas School Survey of Drug and Alcohol Use
http://slidepdf.com/reader/full/bell-county-academy-isd-2011-texas-school-survey-of-drug-and-alcohol-use 192/209
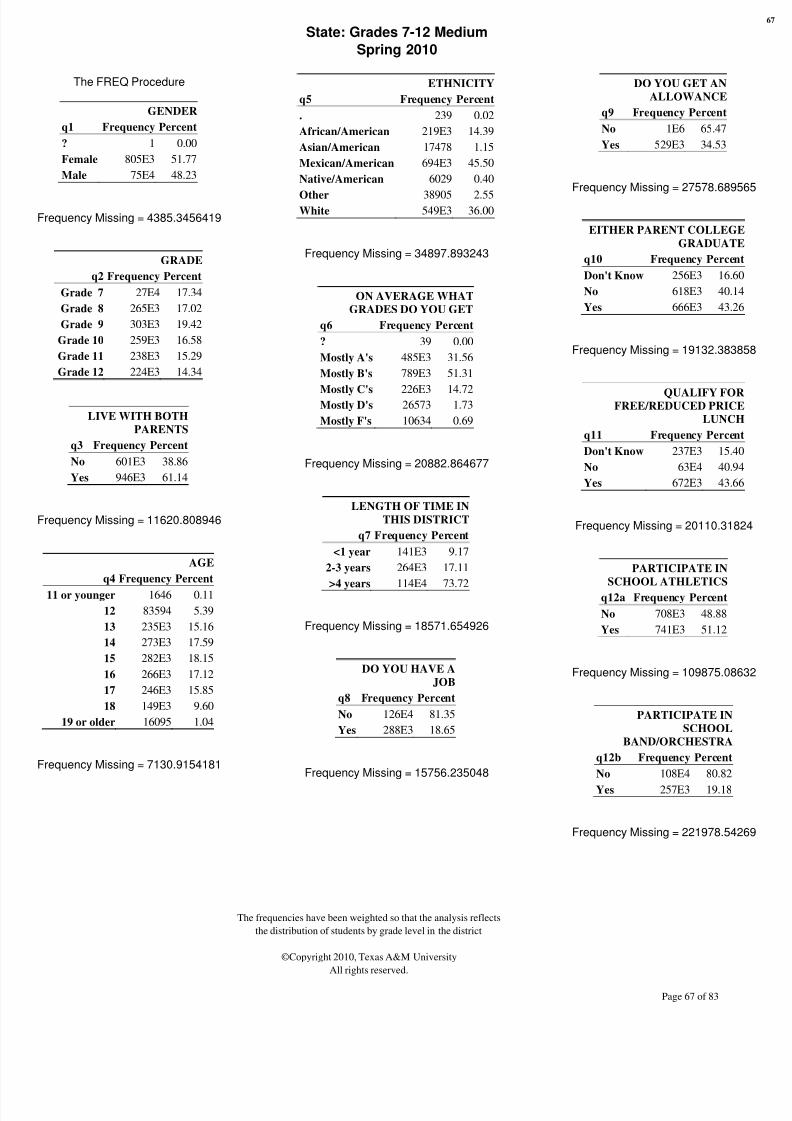
8/3/2019 BELL COUNTY - Academy ISD - 2011 Texas School Survey of Drug and Alcohol Use
http://slidepdf.com/reader/full/bell-county-academy-isd-2011-texas-school-survey-of-drug-and-alcohol-use 193/209

8/3/2019 BELL COUNTY - Academy ISD - 2011 Texas School Survey of Drug and Alcohol Use
http://slidepdf.com/reader/full/bell-county-academy-isd-2011-texas-school-survey-of-drug-and-alcohol-use 194/209
State: Grades 7-12 Medium
Spring 2010
The frequencies have been weighted so that the analysis reflects
the distribution of students by grade level in the district
©Copyright 2010, Texas A&M University
All rights reserved.
Page 68 of 83
PARTICIPATE IN
SCHOOL CHOIR
q12c Frequency Percent
No 115E4 88.57
Yes 149E3 11.43
Frequency Missing = 258714.44499
PARTICIPATE IN
DRAMA/SPEECH/ART
CLUBS
q12d Frequency Percent
No 107E4 81.97
Yes 236E3 18.03
Frequency Missing = 251809.41216
PARTICIPATE IN DRILLTEAM/CHEERLEADING
q12e Frequency Percent
No 119E4 91.25
Yes 114E3 8.75
Frequency Missing = 260075.59495
PARTICIPATE IN
STUDENT
GOVERNMENT
q12f Frequency Percent
No 123E4 95.55
Yes 57411 4.45
Frequency Missing = 269920.99002
PARTICIPATE IN SCHOOL
NEWSPAPER/YEARBOOK
q12g Frequency Percent
No 123E4 95.05
Yes 63968 4.95
Frequency Missing = 268124.27647
PARTICIPATE IN
ACADEMIC
CLUBS/SOCIETIES
q12h Frequency Percent
No 107E4 81.10
Yes 25E4 18.90
Frequency Missing = 238631.38024
PARTICIPATE IN
ACADEMIC
COMPETITION
GROUPS
q12i Frequency Percent
No 111E4 84.19
Yes 209E3 15.81
Frequency Missing = 237979.18949
PARTICIPATE IN
SCHOOL SERVICE
CLUBS
q12j Frequency Percent
? 6 0.00
No 119E4 91.00
Yes 118E3 9.00
Frequency Missing = 249088.10579
PARTICIPATE INOTHER SCHOOL
CLUBS OR GROUPS
q12k Frequency Percent
No 103E4 78.09
Yes 288E3 21.91
Frequency Missing = 242916.17171
PARTICIPATE IN
ATHLETIC TEAMS
OUTSIDE OF SCHOOL
q12l Frequency Percent
No 875E3 64.29
Yes 486E3 35.71
Frequency Missing = 198447.78536
PARTICIPATE IN
OTHER CLUBS OR
GROUPS OUTSIDE OF
SCHOOL
q12m Frequency Percent
No 967E3 72.20
Yes 372E3 27.80
Frequency Missing = 220313.438
DO YOU FEEL SAFE IN YOU
HOM
q13a Frequency Perce
Very Safe 125E4 81.
Somewhat Safe 247E3 16.
Not Very Safe 18055 1.
Not Safe At All 6160 0.
Don't Know 15228 0.
Frequency Missing = 24649.7039
DO YOU FEEL SAFE IN YOU
NEIGHBORHOO
q13b Frequency Perce
Very Safe 628E3 41.
Somewhat Safe 714E3 46.
Not Very Safe 118E3 7.
Not Safe At All 32045 2.
Don't Know 31914 2.
Frequency Missing = 34398.8547
DO YOU FEEL SAFE A
SCHOO
q13c Frequency Perce
Very Safe 644E3 42.
Somewhat Safe 674E3 44.
Not Very Safe 108E3 7.
Not Safe At All 51665 3.
Don't Know 43812 2.
Frequency Missing = 37240.7629

8/3/2019 BELL COUNTY - Academy ISD - 2011 Texas School Survey of Drug and Alcohol Use
http://slidepdf.com/reader/full/bell-county-academy-isd-2011-texas-school-survey-of-drug-and-alcohol-use 195/209
State: Grades 7-12 Medium
Spring 2010
The frequencies have been weighted so that the analysis reflects
the distribution of students by grade level in the district
©Copyright 2010, Texas A&M University
All rights reserved.
Page 69 of 83
FRIENDS FEELING
CLOSE TO THEIR
PARENTS
q14a Frequency Percent
None 81041 5.31
A Few 391E3 25.64
Some 4E5 26.21
Most 516E3 33.82
All 138E3 9.03
Frequency Missing = 33934.014363
HOW MANY FRIENDS
CARRY WEAPONS
q14b Frequency Percent
None 991E3 66.23
A Few 306E3 20.44
Some 132E3 8.81
Most 48469 3.24
All 19335 1.29
Frequency Missing = 62181.111234
HOW MANY FRIENDS
CARE ABOUT GOOD
GRADES
q14c Frequency Percent
None 45244 3.05
A Few 206E3 13.87
Some 335E3 22.56
Most 635E3 42.82
All 262E3 17.70
Frequency Missing = 76116.464011
HOW MANY FRIENDS
BELONG TO A GANG
q14d Frequency Percent
None 105E4 69.57
A Few 258E3 17.02
Some 122E3 8.08
Most 59296 3.91All 21521 1.42
Frequency Missing = 43213.01321
FRIENDS WISHING TO
DROP OUT OF
SCHOOL
q14e Frequency Percent
None 884E3 58.46
A Few 411E3 27.21
Some 139E3 9.21
Most 51570 3.41
All 25901 1.71
Frequency Missing = 47680.471497
PARENTS ATTEND
PTA/SCHOOL OPEN
HOUSES
q15 Frequency Percent
No 807E3 59.12
Yes 558E3 40.88
Frequency Missing = 194378.99518
RECENT INHALANT USE - SPRAY
PAINT
Q16A Frequency Percent
Never Heard/Used 144E4 95.05
In Your Lifetime 49661 3.29
Since School Began 9573 0.63
In the Past Month 15617 1.03
Frequency Missing = 48070.470763
RECENT INHALANT USE -
WHITEOUT, CORRECTION FLUID,
MAGIC MARKERS
Q16B Frequency Percent
Never Heard/Used 135E4 90.03
In Your Lifetime 86802 5.80
Since School Began 23057 1.54
In the Past Month 39316 2.63
Frequency Missing = 63667.63187
RECENT INHALANT U
COMPUTER DUSTING SPRA
Q16C Frequency Per
Never Heard/Used 143E4 9
In Your Lifetime 26158
Since School Began 10117
In the Past Month 12866
Frequency Missing = 80637.5263
RECENT INHALANT USE - HELI
BUTANE, PROPANE, WHIPP
REFRIGERANTS/FR
Q16D Frequency Pe
Never Heard/Used 137E4
In Your Lifetime 60941
Since School Began 23072
In the Past Month 32989
Frequency Missing = 67561.438
RECENT INHALANT USE - GL
Q16E Frequency Per
Never Heard/Used 143E4 9
In Your Lifetime 20560
Since School Began 6109
In the Past Month 8442
Frequency Missing = 91070.5419
RECENT INHALANT U
TOLUENE, PAINT THINN
OTHER SOLVE
Q16F Frequency Per
Never Heard/Used 143E4 9
In Your Lifetime 18742
Since School Began 6489
In the Past Month 9507
Frequency Missing = 90655.8817
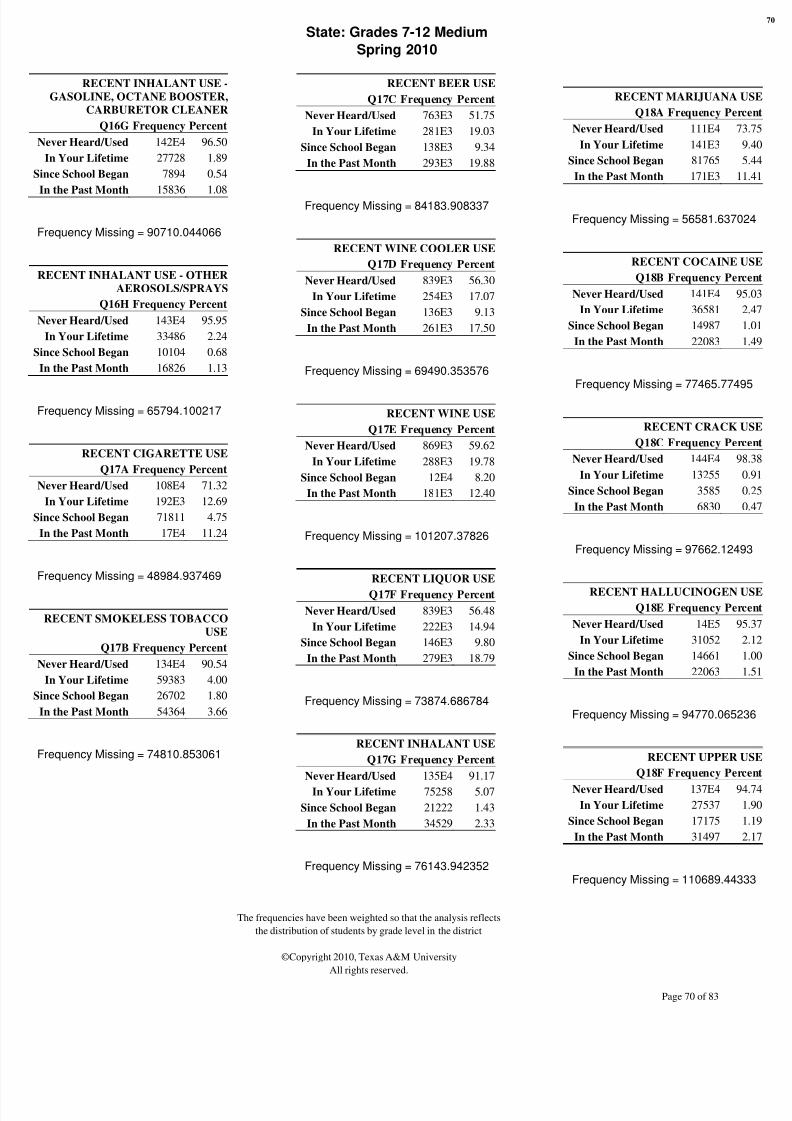
8/3/2019 BELL COUNTY - Academy ISD - 2011 Texas School Survey of Drug and Alcohol Use
http://slidepdf.com/reader/full/bell-county-academy-isd-2011-texas-school-survey-of-drug-and-alcohol-use 196/209
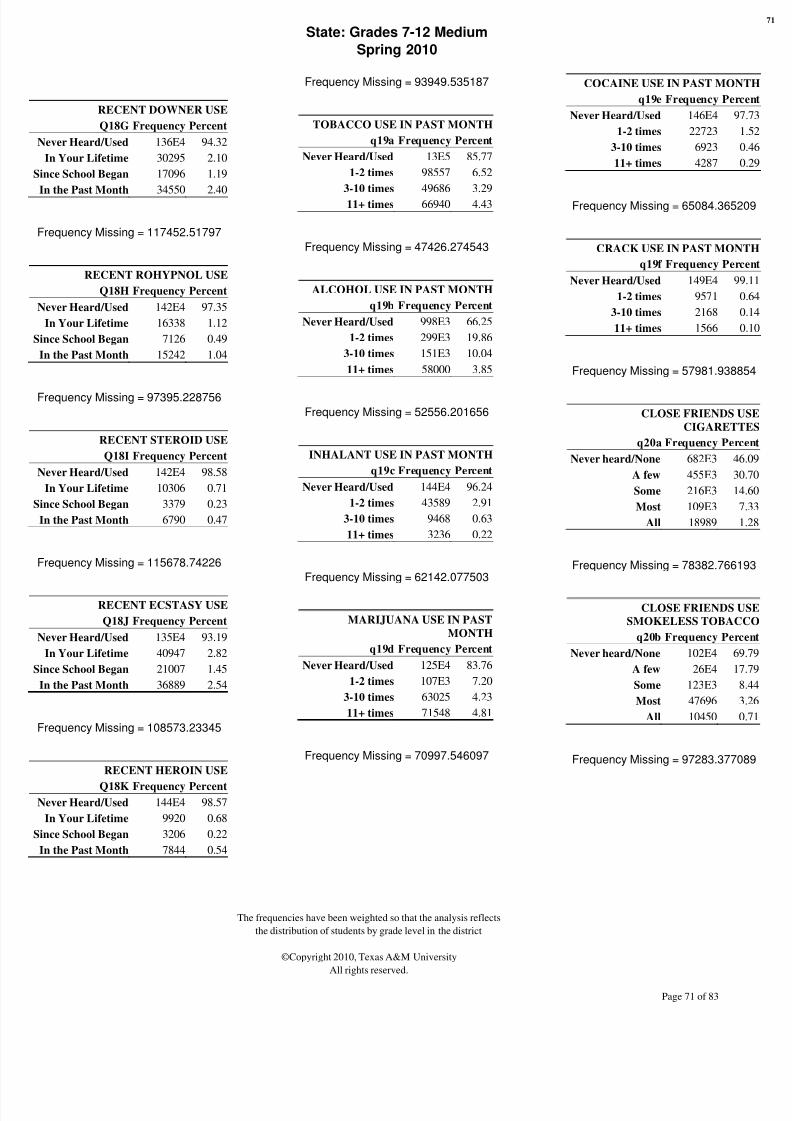
8/3/2019 BELL COUNTY - Academy ISD - 2011 Texas School Survey of Drug and Alcohol Use
http://slidepdf.com/reader/full/bell-county-academy-isd-2011-texas-school-survey-of-drug-and-alcohol-use 197/209
State: Grades 7-12 Medium
Spring 2010
The frequencies have been weighted so that the analysis reflects
the distribution of students by grade level in the district
©Copyright 2010, Texas A&M University
All rights reserved.
Page 71 of 83
RECENT DOWNER USE
Q18G Frequency Percent
Never Heard/Used 136E4 94.32
In Your Lifetime 30295 2.10
Since School Began 17096 1.19
In the Past Month 34550 2.40
Frequency Missing = 117452.51797
RECENT ROHYPNOL USE
Q18H Frequency Percent
Never Heard/Used 142E4 97.35
In Your Lifetime 16338 1.12
Since School Began 7126 0.49
In the Past Month 15242 1.04
Frequency Missing = 97395.228756
RECENT STEROID USE
Q18I Frequency Percent
Never Heard/Used 142E4 98.58
In Your Lifetime 10306 0.71
Since School Began 3379 0.23
In the Past Month 6790 0.47
Frequency Missing = 115678.74226
RECENT ECSTASY USE
Q18J Frequency Percent
Never Heard/Used 135E4 93.19
In Your Lifetime 40947 2.82
Since School Began 21007 1.45
In the Past Month 36889 2.54
Frequency Missing = 108573.23345
RECENT HEROIN USE
Q18K Frequency PercentNever Heard/Used 144E4 98.57
In Your Lifetime 9920 0.68
Since School Began 3206 0.22
In the Past Month 7844 0.54
Frequency Missing = 93949.535187
TOBACCO USE IN PAST MONTH
q19a Frequency Percent
Never Heard/Used 13E5 85.77
1-2 times 98557 6.52
3-10 times 49686 3.29
11+ times 66940 4.43
Frequency Missing = 47426.274543
ALCOHOL USE IN PAST MONTH
q19b Frequency Percent
Never Heard/Used 998E3 66.25
1-2 times 299E3 19.86
3-10 times 151E3 10.04
11+ times 58000 3.85
Frequency Missing = 52556.201656
INHALANT USE IN PAST MONTH
q19c Frequency Percent
Never Heard/Used 144E4 96.24
1-2 times 43589 2.91
3-10 times 9468 0.63
11+ times 3236 0.22
Frequency Missing = 62142.077503
MARIJUANA USE IN PAST
MONTH
q19d Frequency Percent
Never Heard/Used 125E4 83.76
1-2 times 107E3 7.20
3-10 times 63025 4.23
11+ times 71548 4.81
Frequency Missing = 70997.546097
COCAINE USE IN PAST MON
q19e Frequency Perc
Never Heard/Used 146E4 9
1-2 times 22723
3-10 times 6923
11+ times 4287
Frequency Missing = 65084.3652
CRACK USE IN PAST MON
q19f Frequency Perc
Never Heard/Used 149E4 9
1-2 times 9571
3-10 times 2168
11+ times 1566
Frequency Missing = 57981.9388
CLOSE FRIENDS U
CIGARETT
q20a Frequency Perc
Never heard/None 682E3 46
A few 455E3 30
Some 216E3 14
Most 109E3 7
All 18989
Frequency Missing = 78382.7661
CLOSE FRIENDS U
SMOKELESS TOBAC
q20b Frequency Perc
Never heard/None 102E4 69
A few 26E4 17
Some 123E3 8
Most 47696 3
All 10450 0
Frequency Missing = 97283.3770

8/3/2019 BELL COUNTY - Academy ISD - 2011 Texas School Survey of Drug and Alcohol Use
http://slidepdf.com/reader/full/bell-county-academy-isd-2011-texas-school-survey-of-drug-and-alcohol-use 198/209
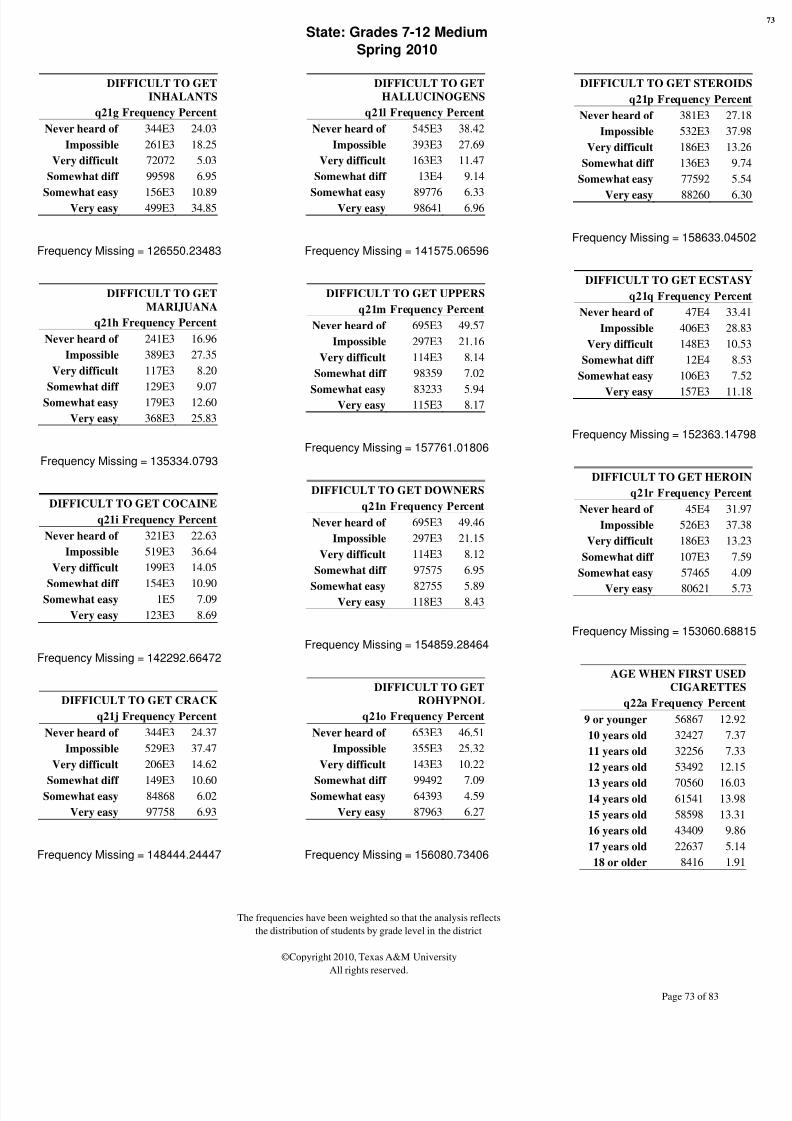
8/3/2019 BELL COUNTY - Academy ISD - 2011 Texas School Survey of Drug and Alcohol Use
http://slidepdf.com/reader/full/bell-county-academy-isd-2011-texas-school-survey-of-drug-and-alcohol-use 199/209
State: Grades 7-12 Medium
Spring 2010
The frequencies have been weighted so that the analysis reflects
the distribution of students by grade level in the district
©Copyright 2010, Texas A&M University
All rights reserved.
Page 73 of 83
DIFFICULT TO GET
INHALANTS
q21g Frequency Percent
Never heard of 344E3 24.03
Impossible 261E3 18.25
Very difficult 72072 5.03
Somewhat diff 99598 6.95
Somewhat easy 156E3 10.89Very easy 499E3 34.85
Frequency Missing = 126550.23483
DIFFICULT TO GET
MARIJUANA
q21h Frequency Percent
Never heard of 241E3 16.96
Impossible 389E3 27.35
Very difficult 117E3 8.20
Somewhat diff 129E3 9.07
Somewhat easy 179E3 12.60
Very easy 368E3 25.83
Frequency Missing = 135334.0793
DIFFICULT TO GET COCAINE
q21i Frequency Percent
Never heard of 321E3 22.63
Impossible 519E3 36.64
Very difficult 199E3 14.05
Somewhat diff 154E3 10.90Somewhat easy 1E5 7.09
Very easy 123E3 8.69
Frequency Missing = 142292.66472
DIFFICULT TO GET CRACK
q21j Frequency Percent
Never heard of 344E3 24.37
Impossible 529E3 37.47
Very difficult 206E3 14.62
Somewhat diff 149E3 10.60Somewhat easy 84868 6.02
Very easy 97758 6.93
Frequency Missing = 148444.24447
DIFFICULT TO GET
HALLUCINOGENS
q21l Frequency Percent
Never heard of 545E3 38.42
Impossible 393E3 27.69
Very difficult 163E3 11.47
Somewhat diff 13E4 9.14
Somewhat easy 89776 6.33Very easy 98641 6.96
Frequency Missing = 141575.06596
DIFFICULT TO GET UPPERS
q21m Frequency Percent
Never heard of 695E3 49.57
Impossible 297E3 21.16
Very difficult 114E3 8.14
Somewhat diff 98359 7.02
Somewhat easy 83233 5.94Very easy 115E3 8.17
Frequency Missing = 157761.01806
DIFFICULT TO GET DOWNERS
q21n Frequency Percent
Never heard of 695E3 49.46
Impossible 297E3 21.15
Very difficult 114E3 8.12
Somewhat diff 97575 6.95
Somewhat easy 82755 5.89Very easy 118E3 8.43
Frequency Missing = 154859.28464
DIFFICULT TO GET
ROHYPNOL
q21o Frequency Percent
Never heard of 653E3 46.51
Impossible 355E3 25.32
Very difficult 143E3 10.22
Somewhat diff 99492 7.09Somewhat easy 64393 4.59
Very easy 87963 6.27
Frequency Missing = 156080.73406
DIFFICULT TO GET STEROID
q21p Frequency Perce
Never heard of 381E3 27.
Impossible 532E3 37.
Very difficult 186E3 13.
Somewhat diff 136E3 9.
Somewhat easy 77592 5.
Very easy 88260 6.
Frequency Missing = 158633.045
DIFFICULT TO GET ECSTAS
q21q Frequency Perce
Never heard of 47E4 33.
Impossible 406E3 28.
Very difficult 148E3 10.
Somewhat diff 12E4 8.
Somewhat easy 106E3 7.
Very easy 157E3 11.
Frequency Missing = 152363.147
DIFFICULT TO GET HEROI
q21r Frequency Perce
Never heard of 45E4 31.
Impossible 526E3 37.
Very difficult 186E3 13.
Somewhat diff 107E3 7.
Somewhat easy 57465 4.
Very easy 80621 5.
Frequency Missing = 153060.688
AGE WHEN FIRST USED
CIGARETTES
q22a Frequency Percen
9 or younger 56867 12.9
10 years old 32427 7.3
11 years old 32256 7.3
12 years old 53492 12.1
13 years old 70560 16.014 years old 61541 13.9
15 years old 58598 13.3
16 years old 43409 9.8
17 years old 22637 5.1
18 or older 8416 1.9
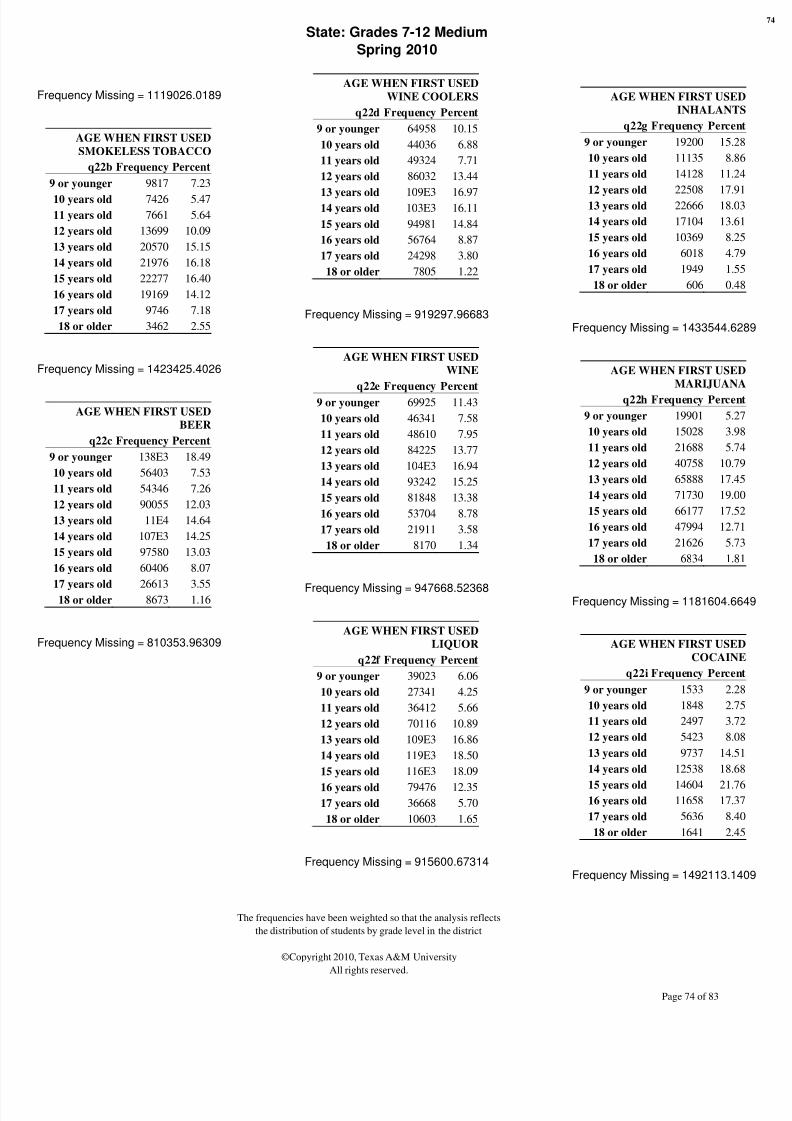
8/3/2019 BELL COUNTY - Academy ISD - 2011 Texas School Survey of Drug and Alcohol Use
http://slidepdf.com/reader/full/bell-county-academy-isd-2011-texas-school-survey-of-drug-and-alcohol-use 200/209

8/3/2019 BELL COUNTY - Academy ISD - 2011 Texas School Survey of Drug and Alcohol Use
http://slidepdf.com/reader/full/bell-county-academy-isd-2011-texas-school-survey-of-drug-and-alcohol-use 201/209
State: Grades 7-12 Medium
Spring 2010
The frequencies have been weighted so that the analysis reflects
the distribution of students by grade level in the district
©Copyright 2010, Texas A&M University
All rights reserved.
Page 75 of 83
AGE WHEN FIRST USED
CRACK
q22j Frequency Percent
9 or younger 1176 5.92
10 years old 1053 5.30
11 years old 1145 5.76
12 years old 2269 11.42
13 years old 3954 19.89
14 years old 3732 18.78
15 years old 3078 15.49
16 years old 2173 10.93
17 years old 1116 5.61
18 or older 180 0.91
Frequency Missing = 1539352.2339
AGE WHEN FIRST USED
HALLUCINOGENS
q22l Frequency Percent
9 or younger 1965 3.28
10 years old 1247 2.08
11 years old 1773 2.96
12 years old 4229 7.05
13 years old 7962 13.28
14 years old 10917 18.21
15 years old 12967 21.63
16 years old 11334 18.90
17 years old 5730 9.55
18 or older 1840 3.07
Frequency Missing = 1499263.9809
AGE WHEN FIRST USED
UPPERS
q22m Frequency Percent
9 or younger 2283 2.98
10 years old 1817 2.37
11 years old 2754 3.59
12 years old 5160 6.73
13 years old 11443 14.93
14 years old 14581 19.0315 years old 17609 22.98
16 years old 13472 17.58
17 years old 6277 8.19
18 or older 1229 1.60
Frequency Missing = 1482604.4269
AGE WHEN FIRST USED
DOWNERS
q22n Frequency Percent
9 or younger 2199 2.75
10 years old 1763 2.21
11 years old 2689 3.37
12 years old 5256 6.58
13 years old 11682 14.63
14 years old 16751 20.98
15 years old 18319 22.94
16 years old 13499 16.90
17 years old 6335 7.93
18 or older 1367 1.71
Frequency Missing = 1479367.7625
AGE WHEN FIRST USED
ROHYPNOL
q22o Frequency Percent
9 or younger 1308 4.07
10 years old 1373 4.27
11 years old 2126 6.62
12 years old 3190 9.93
13 years old 5093 15.86
14 years old 6554 20.41
15 years old 6530 20.33
16 years old 3839 11.95
17 years old 1619 5.04
18 or older 483 1.50
Frequency Missing = 1527114.4451
AGE WHEN FIRST USED
STEROIDS
q22p Frequency Percent
9 or younger 3333 18.46
10 years old 1067 5.91
11 years old 1284 7.11
12 years old 1872 10.37
13 years old 2180 12.0714 years old 2269 12.57
15 years old 2244 12.43
16 years old 2141 11.86
17 years old 1322 7.32
18 or older 344 1.90
Frequency Missing = 1541173.01
AGE WHEN FIRST USED
ECSTASY
q22q Frequency Percen
9 or younger 1454 1.5
10 years old 1906 2.0
11 years old 2787 2.9
12 years old 6478 6.8
13 years old 11690 12.3
14 years old 16085 16.9
15 years old 20000 21.1
16 years old 18817 19.8
17 years old 12189 12.8
18 or older 3361 3.5
Frequency Missing = 1464461.69
AGE WHEN FIRST USED
HEROIN
q22r Frequency Percen
9 or younger 1394 8.4
10 years old 1021 6.2
11 years old 1328 8.0
12 years old 2086 12.6
13 years old 2707 16.4
14 years old 2667 16.2
15 years old 2595 15.7
16 years old 1391 8.4
17 years old 927 5.618 or older 336 2.0
Frequency Missing = 1542775.88
HOW OFTEN NORMALLY U
CIGARETT
q23a Frequency Perc
Every day 34074
Several times/wk 35175
Several times/mo 50660
About once/month 75492
About once/year 65710 4
< once/year 116E3
Never used 107E4 7
Frequency Missing = 108868.698

8/3/2019 BELL COUNTY - Academy ISD - 2011 Texas School Survey of Drug and Alcohol Use
http://slidepdf.com/reader/full/bell-county-academy-isd-2011-texas-school-survey-of-drug-and-alcohol-use 202/209
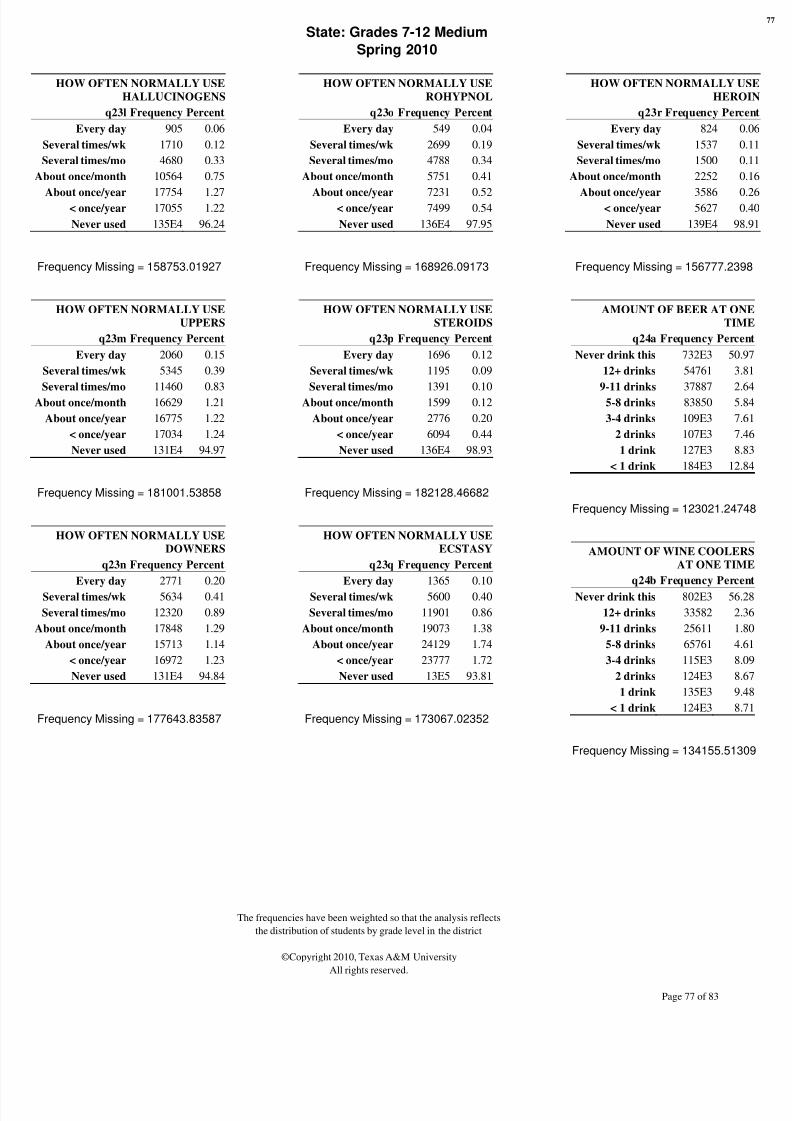
8/3/2019 BELL COUNTY - Academy ISD - 2011 Texas School Survey of Drug and Alcohol Use
http://slidepdf.com/reader/full/bell-county-academy-isd-2011-texas-school-survey-of-drug-and-alcohol-use 203/209
State: Grades 7-12 Medium
Spring 2010
The frequencies have been weighted so that the analysis reflects
the distribution of students by grade level in the district
©Copyright 2010, Texas A&M University
All rights reserved.
Page 77 of 83
HOW OFTEN NORMALLY USE
HALLUCINOGENS
q23l Frequency Percent
Every day 905 0.06
Several times/wk 1710 0.12
Several times/mo 4680 0.33
About once/month 10564 0.75
About once/year 17754 1.27< once/year 17055 1.22
Never used 135E4 96.24
Frequency Missing = 158753.01927
HOW OFTEN NORMALLY USE
UPPERS
q23m Frequency Percent
Every day 2060 0.15
Several times/wk 5345 0.39
Several times/mo 11460 0.83
About once/month 16629 1.21
About once/year 16775 1.22
< once/year 17034 1.24
Never used 131E4 94.97
Frequency Missing = 181001.53858
HOW OFTEN NORMALLY USE
DOWNERS
q23n Frequency Percent
Every day 2771 0.20
Several times/wk 5634 0.41
Several times/mo 12320 0.89
About once/month 17848 1.29
About once/year 15713 1.14
< once/year 16972 1.23
Never used 131E4 94.84
Frequency Missing = 177643.83587
HOW OFTEN NORMALLY USE
ROHYPNOL
q23o Frequency Percent
Every day 549 0.04
Several times/wk 2699 0.19
Several times/mo 4788 0.34
About once/month 5751 0.41
About once/year 7231 0.52< once/year 7499 0.54
Never used 136E4 97.95
Frequency Missing = 168926.09173
HOW OFTEN NORMALLY USE
STEROIDS
q23p Frequency Percent
Every day 1696 0.12
Several times/wk 1195 0.09
Several times/mo 1391 0.10
About once/month 1599 0.12
About once/year 2776 0.20
< once/year 6094 0.44
Never used 136E4 98.93
Frequency Missing = 182128.46682
HOW OFTEN NORMALLY USE
ECSTASY
q23q Frequency Percent
Every day 1365 0.10
Several times/wk 5600 0.40
Several times/mo 11901 0.86
About once/month 19073 1.38
About once/year 24129 1.74
< once/year 23777 1.72
Never used 13E5 93.81
Frequency Missing = 173067.02352
HOW OFTEN NORMALLY U
HERO
q23r Frequency Perc
Every day 824 0
Several times/wk 1537 0
Several times/mo 1500 0
About once/month 2252 0
About once/year 3586 0< once/year 5627 0
Never used 139E4 9
Frequency Missing = 156777.23
AMOUNT OF BEER AT ON
TIM
q24a Frequency Perc
Never drink this 732E3 50
12+ drinks 54761 3
9-11 drinks 37887 2
5-8 drinks 83850 5
3-4 drinks 109E3 7
2 drinks 107E3 7
1 drink 127E3 8
< 1 drink 184E3 12
Frequency Missing = 123021.247
AMOUNT OF WINE COOLER
AT ONE TIM
q24b Frequency Perc
Never drink this 802E3 56
12+ drinks 33582 2
9-11 drinks 25611 1
5-8 drinks 65761 4
3-4 drinks 115E3 8
2 drinks 124E3 8
1 drink 135E3 9
< 1 drink 124E3 8
Frequency Missing = 134155.513

8/3/2019 BELL COUNTY - Academy ISD - 2011 Texas School Survey of Drug and Alcohol Use
http://slidepdf.com/reader/full/bell-county-academy-isd-2011-texas-school-survey-of-drug-and-alcohol-use 204/209
State: Grades 7-12 Medium
Spring 2010
The frequencies have been weighted so that the analysis reflects
the distribution of students by grade level in the district
©Copyright 2010, Texas A&M University
All rights reserved.
Page 78 of 83
AMOUNT OF WINE AT ONE
TIME
q24c Frequency Percent
Never drink this 833E3 58.91
12+ drinks 16567 1.17
9-11 drinks 9965 0.70
5-8 drinks 24559 1.74
3-4 drinks 53813 3.802 drinks 85266 6.03
1 drink 17E4 12.01
< 1 drink 221E3 15.63
Frequency Missing = 144929.50662
AMOUNT OF LIQUOR AT ONE
TIME
q24d Frequency Percent
Never drink this 786E3 55.37
12+ drinks 46930 3.30
9-11 drinks 35491 2.50
5-8 drinks 81675 5.75
3-4 drinks 125E3 8.83
2 drinks 104E3 7.31
1 drink 112E3 7.90
< 1 drink 128E3 9.03
Frequency Missing = 139090.07528
HOW MANY 5+ DRINKS IN PAST
30 DAYS
q25 Frequency Percent
Never 5+ at time 648E3 44.35
None 515E3 35.30
1 day 1E5 6.88
2 days 65660 4.50
3 to 5 days 67657 4.63
6 to 9 days 29624 2.03
10 or more days 33606 2.30
Frequency Missing = 99060.43003
GET ALCOHOLIC BEVERAGES
FROM HOME
q26a Frequency Percent
Do not Drink 654E3 45.66
Never 361E3 25.21
Seldom 289E3 20.20
Most of the Time 89533 6.25
Always 38399 2.68
Frequency Missing = 126578.84853
GET ALCOHOLIC BEVERAGES
FROM FRIENDS
q26b Frequency Percent
Do not Drink 606E3 42.92
Never 275E3 19.50
Seldom 226E3 15.98
Most of the Time 22E4 15.57
Always 85170 6.03
Frequency Missing = 147016.15438
GET ALCOHOLIC BEVERAGES
FROM A STORE
q26c Frequency Percent
Do not Drink 633E3 45.00
Never 582E3 41.37
Seldom 102E3 7.22
Most of the Time 58992 4.19
Always 31303 2.22
Frequency Missing = 151791.92917
GET ALCOHOLIC BEVERAGES
AT PARTIES
q26d Frequency Percent
Do not Drink 581E3 41.14
Never 237E3 16.77
Seldom 183E3 12.96
Most of the Time 21E4 14.86
Always 201E3 14.27
Frequency Missing = 147176.29675
GET ALCOHOLIC BEVERAG
FROM OTHER SOURC
q26e Frequency Perc
Do not Drink 637E3 45
Never 379E3 26
Seldom 184E3 13
Most of the Time 111E3 7
Always 95997 6
Frequency Missing = 152430.762
USE MARIJUANA AS JOIN
q27a Frequency Perc
Never 113E4 79
Seldom 116E3 8
Half the time 65092 4
Most of the time 57158 4
Always 40816 2
Don't know 11492 0
Frequency Missing = 134614.914
USE MARIJUANA AS BLUN
q27b Frequency Perc
Never 113E4 79
Seldom 92685 6
Half the time 58617 4
Most of the time 63293 4
Always 62347 4
Don't know 11691 0
Frequency Missing = 144944.277
USE MARIJUANA IN BONGS O
WATER PIP
q27c Frequency Perc
Never 119E4 84
Seldom 81593 5
Half the time 44558 3
Most of the time 43928 3
Always 35353 2Don't know 8575 0
Frequency Missing = 159774.963

8/3/2019 BELL COUNTY - Academy ISD - 2011 Texas School Survey of Drug and Alcohol Use
http://slidepdf.com/reader/full/bell-county-academy-isd-2011-texas-school-survey-of-drug-and-alcohol-use 205/209

8/3/2019 BELL COUNTY - Academy ISD - 2011 Texas School Survey of Drug and Alcohol Use
http://slidepdf.com/reader/full/bell-county-academy-isd-2011-texas-school-survey-of-drug-and-alcohol-use 206/209

8/3/2019 BELL COUNTY - Academy ISD - 2011 Texas School Survey of Drug and Alcohol Use
http://slidepdf.com/reader/full/bell-county-academy-isd-2011-texas-school-survey-of-drug-and-alcohol-use 207/209
State: Grades 7-12 Medium
Spring 2010
The frequencies have been weighted so that the analysis reflects
the distribution of students by grade level in the district
©Copyright 2010, Texas A&M University
All rights reserved.
Page 81 of 83
IN TROUBLE FOR
DRINKING SINCE
SEPTEMBER
q32f Frequency Percent
None 139E4 98.86
1-3 days 10402 0.74
4-9 days 2069 0.15
10+ days 3591 0.26
Frequency Missing = 155357.62896
IN TROUBLE FOR DRUG
USE SINCE SEPTEMBER
q32g Frequency Percent
None 138E4 98.43
1-3 days 15642 1.11
4-9 days 2389 0.17
10+ days 4077 0.29
Frequency Missing = 152858.21391
TROUBLE WITH FRIENDS
BECAUSE OF DRINKING
q33a Frequency Percent
None 133E4 93.78
1-3 times 76225 5.39
4-9 times 7365 0.52
10+ times 4456 0.31
Frequency Missing = 144424.20025
DRIVEN A CAR AFTER A
GOOD BIT TO DRINK
q33b Frequency Percent
None 13E5 93.22
1-3 times 71655 5.14
4-9 times 12311 0.88
10+ times 10574 0.76
Frequency Missing = 164348.14929
CRITICIZED BY DATE
BECAUSE OF DRINKING
q33c Frequency Percent
None 129E4 93.07
1-3 times 79224 5.72
4-9 times 9088 0.66
10+ times 7676 0.55
Frequency Missing = 174518.20679
TROUBLE WITH POLICE
BECAUSE OF DRINKING
q33d Frequency Percent
None 134E4 97.27
1-3 times 30729 2.24
4-9 times 3459 0.25
10+ times 3276 0.24
Frequency Missing = 185981.9222
TROUBLE WITH FRIENDS
BECAUSE OF DRUG USE
q33e Frequency Percent
None 129E4 94.21
1-3 times 65045 4.73
4-9 times 9081 0.66
10+ times 5445 0.40
Frequency Missing = 184726.40775
DRIVEN A CAR WHILE
HIGH FROM DRUGS
q33f Frequency Percent
None 126E4 93.13
1-3 times 58704 4.33
4-9 times 13733 1.01
10+ times 20825 1.53
Frequency Missing = 202435.0097
CRITICIZED BY DATE
BECAUSE OF DRUG USE
q33g Frequency Percent
None 126E4 93.39
1-3 times 69002 5.12
4-9 times 10448 0.78
10+ times 9547 0.71
Frequency Missing = 211946.44
TROUBLE WITH POLICE
BECAUSE OF DRUG USE
q33h Frequency Percent
None 132E4 97.55
1-3 times 25845 1.91
4-9 times 3361 0.25
10+ times 4026 0.30
Frequency Missing = 204181.88
CLASS DAYS DRUNK ON
ALCOHOL SINCE SEPT
q34a Frequency Percent
None 131E4 92.52
1-3 days 81183 5.72
4-9 days 13106 0.92
10+ days 11853 0.84
Frequency Missing = 140210.283
CLASS DAYS HIGH ON
MARIJUANA SINCE SEPT
q34b Frequency Percent
None 126E4 89.08
1-3 days 82344 5.84
4-9 days 28281 2.01
10+ days 43294 3.07
Frequency Missing = 149165.177
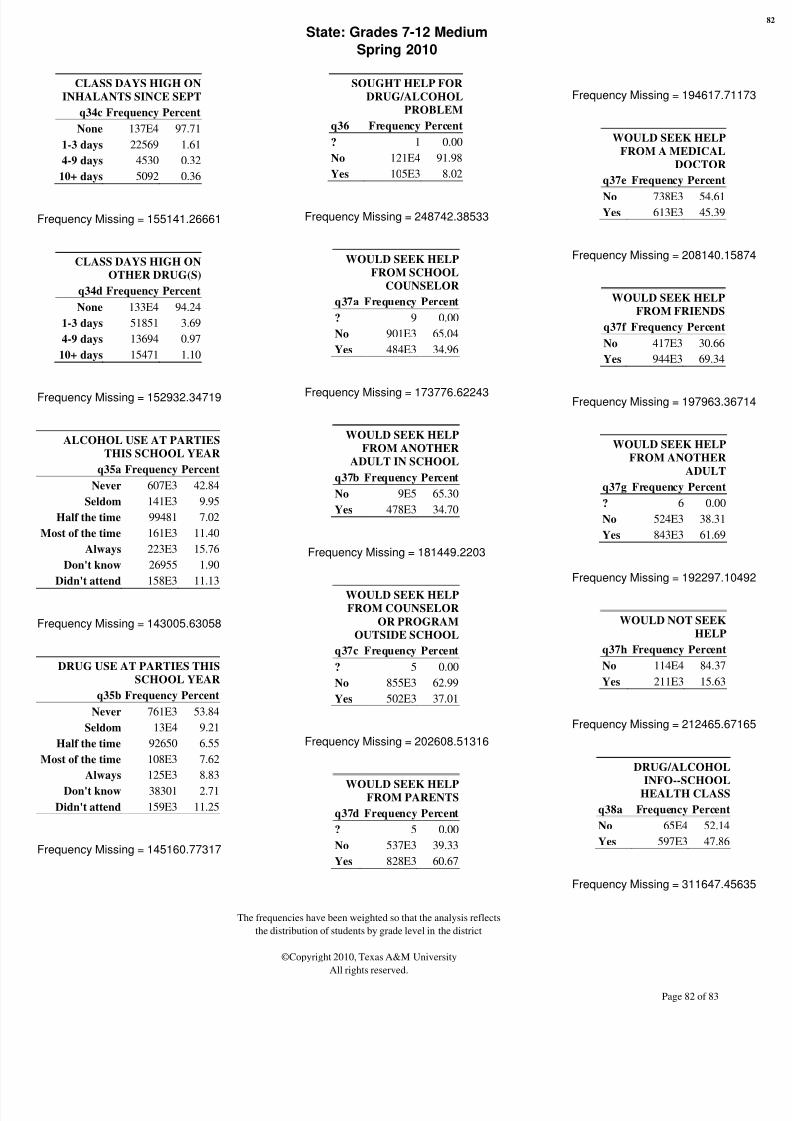
8/3/2019 BELL COUNTY - Academy ISD - 2011 Texas School Survey of Drug and Alcohol Use
http://slidepdf.com/reader/full/bell-county-academy-isd-2011-texas-school-survey-of-drug-and-alcohol-use 208/209
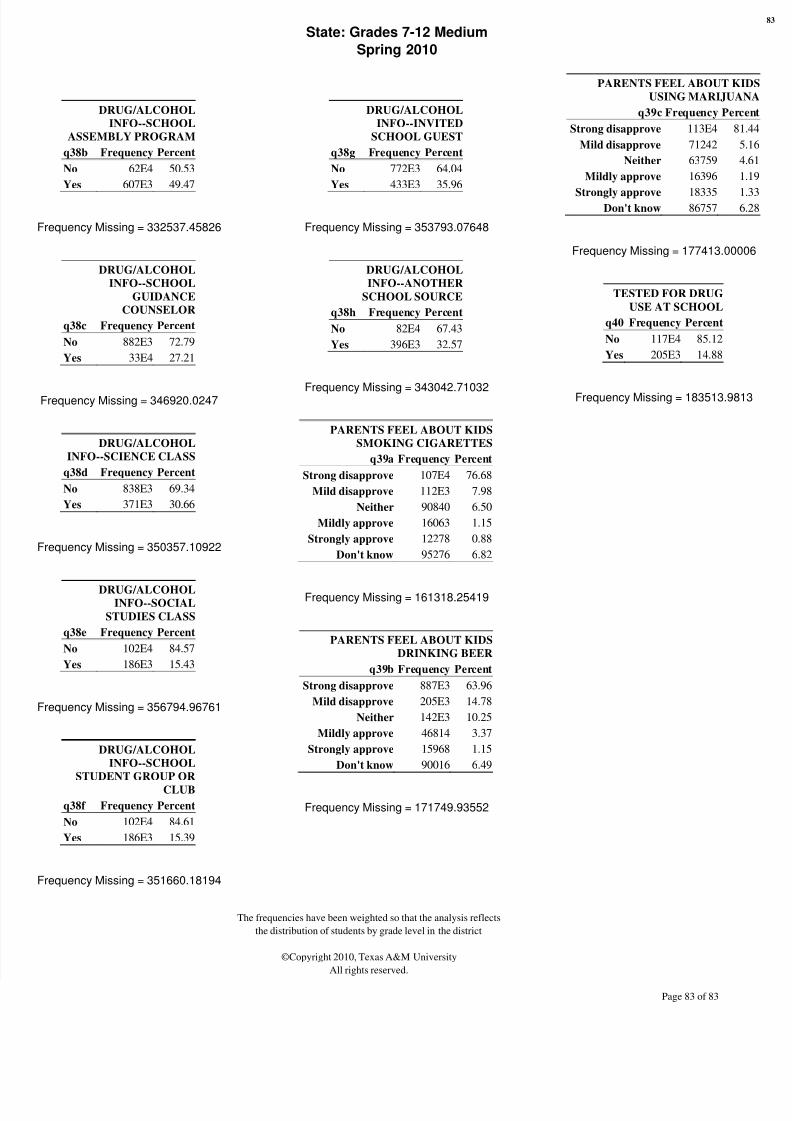
8/3/2019 BELL COUNTY - Academy ISD - 2011 Texas School Survey of Drug and Alcohol Use
http://slidepdf.com/reader/full/bell-county-academy-isd-2011-texas-school-survey-of-drug-and-alcohol-use 209/209
State: Grades 7-12 Medium
Spring 2010
DRUG/ALCOHOL
INFO--SCHOOL
ASSEMBLY PROGRAM
q38b Frequency Percent
No 62E4 50.53
Yes 607E3 49.47
Frequency Missing = 332537.45826
DRUG/ALCOHOL
INFO--SCHOOL
GUIDANCE
COUNSELOR
q38c Frequency Percent
No 882E3 72.79
Yes 33E4 27 21
DRUG/ALCOHOL
INFO--INVITED
SCHOOL GUEST
q38g Frequency Percent
No 772E3 64.04
Yes 433E3 35.96
Frequency Missing = 353793.07648
DRUG/ALCOHOL
INFO--ANOTHER
SCHOOL SOURCE
q38h Frequency Percent
No 82E4 67.43
Yes 396E3 32.57
PARENTS FEEL ABOUT K
USING MARIJUA
q39c Frequency Perc
Strong disapprove 113E4 8
Mild disapprove 71242
Neither 63759 4
Mildly approve 16396
Strongly approve 18335Don't know 86757
Frequency Missing = 177413.000
TESTED FOR DRUG
USE AT SCHOOL
q40 Frequency Percent
No 117E4 85.12
Yes 205E3 14.88