belonging to a group gives people control of their life
TRANSCRIPT

Belonging to a group gives people control of their life.
Remedios Rodriguez Barcelona
Submitted in partial fulfilment of the requirements of the BA Hons in Psychology at Dublin
Business School, School of Arts, Dublin.
Supervisor: Dr. Garry Prentice
Programme Leader: Dr. Rosie Reid
March 2016
Department of Psychology
Dublin Business School

2
TABLE OF CONTENTS
ACKNOWLEDGEMENTS…………………………………………………………………4
ABSTRACT…………………………………………………………………………………5
INTRODUCTION…………………………………………………………………………...6
Belonging…………………………………………………………………………………….7
Belonging to a group and control…………………………………………………………….9
Belonging to a group and satisfaction with life……………………………………………..11
Belonging to a group and self-esteem……………………………………………………….13
Belonging to a group and gender............................................................................................15
Role of Personality…………………………………………………………………………..17
Rationale for the present study………………………………………………………………20
Hypotheses…………………………………………………………………………………...20
METHODS…………………………………………………………………………………..22
Design………………………………………………………………………………………..22
Participants…………………………………………………………………………………..22
Materials……………………………………………………………………………………..23
Procedure…………………………………………………………………………………….25
RESULTS……………………………………………………………………………………27
Descriptive Statistics…………………………………………………………………………27

3
DISCUSSION………………………………………………………………………………38
Strengths and Limitations…………………………………………………………………..40
Conclusion………………………………………………………………………………….40
REFERENCES……………………………………………………………………………..42
Appendix A Cover Sheet…………………………………………………………………...48
Appendix B Questionnaire…………………………………………………………………50
Appendix C Bar charts……………………………………………………………………..51

4
ACKNOWLEDGEMENTS
Thank you to all those who gave the gift of their time to participate in this research, in
particular to my children, Aram, Eoghan and Ciara, for their patience and understanding and
to my extended family and friends for their support at all times.
A special thank you to my supervisor D. Garry Prentice for his guidance and support and to
D. Patricia Frazer for her patience and teaching.
A final thank you to all the lecturers in the Department of Psychology in the School of Arts in
the Dublin Business School who have made the four years of the degree a highly enriching
experience.

5
ABSTRACT
The purpose of this quasi experiment and quantitative study is to investigate whether there is
a difference in control, satisfaction with life and self- esteem with people belonging to a
group and people not belonging to group. Additionally we are exploring if personality is a
factor in belonging to a group and if there is a relationship between being introvert or
extrovert and belonging to a group. Four questionnaires were distributed: the Pearlin Mastery
scale, the Satisfaction with Life scale, the Rosenberg Self-Esteem scale and the Eysenck
Personality Questionnaire-Revised Short Form, to a sample size of (n=116) participants
requiring them to fill out a questionnaire. Results showed no significant difference between
belonging to a group and having control, however a significant difference in control was
found between Males and Females belonging to a group as well as extravert personality being
associated more with the membership of the group, thus stating the importance of personality
in belonging to a group.

6
INTRODUCTION
Does the fact of belonging to a group gives you a better control of your life? The
answer could lie in the power of the human need to belong. It seems that social connection to
another person or group in a performance domain increases motivation by creating socially
shared goals around a performance task, (Walton, G. M., Cohen, G. L., Cwir, D., & Spencer,
S. J. 2012). We can say that belonging is a fundamental human need, deemed essential for
optimal psychological functioning and the Optimal Distinctiveness theory (Brewer 1991) has
linked group membership to feelings of belonging (Easterbrook, M.,&Vignoles,V.L. 2013).
The present study was motivated by the film “Into the Wild” (2007) the true story of
Christopher McCandless in search for radical independence culminating in a solitary
existence in Alaska: “to feel you control your life stand alone”. This statement is being
contrasted with an article by Katherine Greenaway (2015) “Why it’s a mistake to seek control
of your life through solitude” in which the opposite statement is made: “to feel control, stand
together”.
The focus of this study is to determine if there is a statistically significant relationship
between belonging to a group and a better quality of life in terms of control, satisfaction with
life and self-esteem. Simultaneously, the study investigates the possible impact of the
introvert/extrovert personality types on taking up a group membership. The rationale for this
questionnaire study is outlined with the hypothesis that there is a relationship between
belonging to a group and being in control of your life, in terms of satisfaction with life and
self-esteem.

7
Belonging
Human beings are fundamentally, extensively social. Being part of a group is
important and its absence may lead to social exclusion which has powerful effects on people,
(Ozeki, M. 2015) and (Greenaway, K. H., Haslam, S. A., Cruwys, T., Branscombe, N. R.,
Ysseldyk, R., & Heldreth, C. 2015).
The sense of belonging is defined as the experience of personal involvement in a
system or environment so that persons feel themselves to be an integral part of that system or
environment and it appears that sense of belonging is a useful concept pertinent to
exploration of social and psychological functioning. (Hagerty, B. M., Lynch-Sauer, J.,
Patusky, K. L., Bouwsema, M., & Collier, P. 1992). It seems that the roots of the human need
to belong are deep, maybe even deeper than those of other social animals. We get our food,
shelter, partners, friends and more from the social network. The way people think, act, feel
and want is deeply linked to this goal of connecting and as modern humans we tend to be
dependent on each other. It is only a very rare individual who could live for any time without
the significant support of others, i.e. Christopher Mc Candless.
As Elspeth Probyn has highlighted (1996), the term “belonging” shows an affective
dimension- not just be-ing but longing. According to Guibernau i Berdun, M. M. (2013), it is
commonly assumed that we live in an age of individualism but it is argued that the need to
belong to a group or community, the longing to belong, is a pervasive and enduring feature of
modern social life. Human lives are rendered meaningful by the specifics activities in which
they are always involved and the contexts of identification to which they belong, by the
existence of specific worlds that take shape in their own way, not simply as produced by
individual human choice (Hoff, S. 2014).
8
When was the last time we might have experienced authentic connection with others?
Truly felt that we belonged, and were surrounded by people who really understood us? Even
though many of us experience the power of deep connection much less often than we would
like, this sense of true belonging is always available to us, regardless of our outside
circumstances. We can reduce feelings of alienation, isolation, and loneliness by simply
choosing to nourish feelings of unity and connectedness, by participating in groups with
common interests. Brantley, J., & Millstine, W. (2011), in their book “True Belonging” offer
over thirty reflective practices that help explore our interdependence with all living things,
treating ourselves more kindly, and creating richer connections with others. Each practice
helps build a deeper-felt sense of belonging in all of our relationships with the use of, for
instance, mindfulness and meditation.
In his book “Skepticism and Belonging in Shakespeare's Comedy”, Gottlieb, D.
(2016), argues that exposure or vulnerability to others is the source of both human happiness
and human misery, a statement that will be confirmed or refuted in our analysis of the levels
of satisfaction with life and self-esteem.
And what about not belonging? Ndi, B. F., Ankumah, A. T., & Fishkin, B. H. (2014)
in their book “Fears, Doubts and Joys of Not Belonging “discuss the notion that the outsider
suffers by being alone but that the insider suffers even more by being forever known as a
hypocrite who perpetuates dystopia (coined by John Stuart-Mill- 1806-1873), an imaginary
world or place where everything is as bad as possible.
However, despite being told that we now live in a cosmopolitan world, more and
more people have started to assert their identities in ways that are deeply rooted in the local
which assert the primordial right to belong and are often employed in politically charged
attempts to exclude outsiders. In “The Perils of Belonging”, Peter Geschiere (2009), explores

9
the idea in two very different contexts: Cameroon and the Netherlands. In both countries the
question of who belongs where rises in political struggles between different tribes in
Cameroon while the Dutch invoke autochthony over the integration of immigrants. Does the
fact of belonging to a place, a group, threatens that integration?
Furthermore, contemporary debate has been created: what does it mean to 'belong' to
an online community? What happens to the body in cyberspace? Ferreday, D (2009) proposes
that the Internet can be re-read as a space of fantasy in relation to belonging. The author
examines the ways in which bodies, subjects and communities are produced and reproduced
through the stories we tell about online belongings.
Belonging to a group and control
Does the fact of belonging to a group improves the control of our lives? There is
growing recognition that identification with social groups can protect and enhance health and
well-being, thus constituting a kind of “social cure.” Research by Greenaway, K. H., Haslam,
S. A., Cruwys, T., Branscombe, N. R., Ysseldyk, R., & Heldreth, C. (2015), explores the role
of control as a new mediator of the relationship between shared group identity and well-
being. Five studies provide evidence for this process: group identification predicted
significantly greater perceived personal control across 47 countries (Study 1), and in groups
that had experienced success and failure (Study 2). The relationship was observed
longitudinally (Study 3) and experimentally (Study 4). Manipulated group identification also
indicated a loss of personal control (Study 5). Across the studies, perceived personal control
provided social cure effects in political, academic, community, and national groups. The
findings reveal that the personal benefits of social groups come not only from their ability to
make people feel good, but also from their ability to make people feel capable and in control
of their lives.

10
People interact and perform in group settings in all areas of life. Organizations and
businesses are increasingly structuring work around groups and teams. Every day, we work in
groups such as families, friendship groups, societies and sports teams as well as workplace
affiliation in order to make decisions and plans, solve problems, perform physical tasks and
generate creative ideas (Nijstad, B. A. 2009).
There are different types of group membership and we can see that belonging to a
group can be related to Health (Davison, K. P., Pennebaker, J. W., & Dickerson, S. S. 2000),
where studies have shown that mutual support groups, involving little or no cost to
participants, have a powerful effect on mental and physical health. In the sport area, Wann,
D. L. (2006) predicts that team identification facilitates well-being by increasing social
connections for the fan. In the academic ground, Turner, I., Reynolds, K. J., Lee, E., Subasic,
E., & Bromhead, D. (2014) argue that school-based intervention programs may benefit social
identity with the school, and promote individual psychological well-being, while Maurizi, L.
K., Ceballo, R., Epstein‐Ngo, Q., & Cortina, K. S. (2013) indicate that school belonging has
been linked to several positive outcomes among adolescents, including academic success and
psychological well-being. Research has shown that the way we learn is very much affected
by our personality and practitioners have claimed that perception of personality type can help
teachers to understand the reason why students perform differently in class activities (Wilz,
2000).
In relation to the work place, Kirkhaug, R. (2010) hypothesizes that group belonging,
in its capacity to socially and professionally support employees, is better suited to explain
employee work effect than leadership charisma.

11
Finally, Widman, D. R., Corcoran, K. E., & Nagy, R. E. (2009), suggest that religion
evolved because it enhanced group cooperation; those individuals who professed a common
religious belief cooperated better and therefore enhanced their individual fitness.
The Pearlin Mastery Scale (PM) measures an individual’s level of mastery, which is a
psychological resource that has been defined as “the extent to which one regards one’s life-
chances as being under one’s own control in contrast to being fatalistically ruled” (Pearlin &
Schooler, 1978, p.5). Control, has been shown to provide a protective envelop for
individuals’ mental and physical health and well-being, when facing persistent life stresses,
such as economic and occupational hardships (e.g., Pearlin & Schooler, 1978; Pudrovska,
Schieman, Pearlin & Nguyen, 2005).
Researchers have shown that belonging to a group has many benefits which span over
different areas such as health, sport, education, the work place and religion. In the current
study, the researcher seeks to determine if there is a statistically significant relationship
between belonging to a group and control, satisfaction with life and self-esteem. In addition,
the role of personality, whereas you are Introvert or Extrovert, will be examined as a potential
factor in belonging or not to a group.
Belonging to a group and satisfaction with life
Whisman, M. A., & Judd, C. M. (2016) suggest that life satisfaction is viewed as a cognitive
and global evaluation of the quality of one’s life as a whole. Understanding differences in life
satisfaction is important because life satisfaction is associated with social, occupational,
mental and physical health outcomes and Diener (2000) argues that life satisfaction has been
identified as a way of assessing the quality of life of societies. In a study by Civitci, A.
(2015) the changes in life satisfaction in terms of college belonging, major belonging, and the
participation in extracurricular activities was examined. The participants were 477

12
undergraduate students at a public university in Turkey. To collect the data, The Satisfaction
with Life Scale and a personal information form were used. The results of MANCOVA
indicated that the students having a high college and major belonging had high life
satisfaction. In addition, life satisfaction did not change significantly based on whether the
students participated in extracurricular activities. The results indicated that only college
belonging played a moderator role in the relationship between perceived stress (the other
variable explored) and life satisfaction. In conclusion, this study reveals that especially
college belonging is important in terms of stress and life satisfaction in college students.
Furthermore, identifying with one’s ethnic group can contribute to the well-being of
racial/ethnic minorities; however, little research has investigated the mechanisms that account
for this relationship. Using a sample of South Asian Canadians participants, two individual
coping options and two intergroup coping options were experimented. The two intergroup
coping options included appraisals about one’s ethnic group working together to better their
status (collective action). Participants who highly identified with their ethnic group reported
greater satisfaction with their lives. Of the four coping options, collective action and social
creativity were simple mediators of the relationship between ethnic identification and life
satisfaction. The results provided further evidence that group identification promotes well-
being for racial/ethnic minorities, in part, because it encourages beliefs about one’s group
effectively responding to discrimination, (Outten, H. R., & Schmitt, M. T. 2015).
Further research conducted by John Wiley & Sons, Inc. (2001) explored the
relationships between sense of community and various factors with respect to a fairly broad
area (town, city, or large quarter of a metropolis). Degree of neighbouring, life satisfaction,
loneliness, and area of residence were also considered. Subjects included 630 men and
women, aged 20-65 years, with different educational levels. They were individually
administered the Satisfaction with Life Scale questionnaire. They were divided into six

13
groups as follows: one group living in a quarter of Rome, three groups living in three
different areas near Rome and two groups living in two areas in the Umbria region. Multiple
regression analysis revealed the following: neighbourhood relations are stronger for women,
for members of large families, for those living in the community for many years and for
members of groups or associations. The strongest predictor of sense of community is
neighbourhood relations, although years of residence, being married, group participation, and
area of residence are also significant factors. Sense of community was related to life
satisfaction and loneliness in both the large and small town and in the city.
The Satisfaction with Life Scale (SWLS; Diener, Emmnos, Larsen, & Griffin, 1985)
was developed as a measure of the judgmental component of subjective well-being (SWB).
Two studies designed to validate further the SWLS are reported. Peer reports, a memory
measure, and clinical ratings are used as external criteria for validation. Evidence for the
reliability and predictive validity of the SWLS is presented, and its performance is compared
to other related scales. The SWLS is shown to be a valid and reliable measure of life
satisfaction, suited for use with a wide range of age groups and applications, which makes
possible the savings of interview time and resources compared to many measures of life
satisfaction. In addition, the high convergence of self- and peer-reported measures of
subjective well-being and life satisfaction provide strong evidence that subjective well-being
is a relatively global and stable phenomenon, not simply a momentary judgment based on
passing influences. Pavot, W. G., & Diener, E. (1993).
Belonging to a group and self-esteem
We can define "self-esteem" as being more than an innate sense of self-worth that is
possibly a human birth right. Self-esteem is individuals' experience that they are appropriate
to life and to the requirements of life. More specifically, self-esteem is confidence in the

14
ability to think; confidence in the ability to cope with the challenges of life; and confidence in
the right to be happy, the feeling of being worthy, deserving, entitled to assert one's needs and
wants and to enjoy the fruits of one's efforts. Persons possessing a decent level of self-esteem
are needed economically in large numbers and the virtues that self-esteem asks of individuals
are also ones that life asks of individuals (Branden, N. 1990).
A Study by Jetten, J., Branscombe, N. R., Haslam, S. A., Haslam, C., Cruwys, T.,
Jones, J. M., & ... Zhang, A. (2015) shows that membership in important social groups can
promote a positive identity and the researchers proposed and test an identity resource model
in which personal self-esteem was boosted by membership . Belonging to multiple important
group memberships predicted personal self-esteem in children (Study 1a), older adults (Study
1b), and former residents of a homeless shelter (Study 1c). Study 2 showed that the effects of
multiple important group memberships on personal self-esteem were not reducible to number
of interpersonal ties. Studies 3a and 3b provided longitudinal evidence that multiple
important group memberships predicted personal self-esteem over time. Studies 4 and 5
showed that collective self-esteem mediated this effect, suggesting that membership in
multiple important groups, boosted personal self-esteem because people take pride in, and
derived meaning from, important group memberships.
Further research in the area by Sacco, D. F., & Bernstein, M. J. (2015) shows that
much is known about how social exclusion influences affiliation interest; however, little
research has explored how social inclusion affects individuals’ affiliation tendencies. They
hypothesized that, because socially included individuals’ self-esteem and belongingness
needs have been met, these individuals might display a reduced tendency to derive self-
esteem benefits from negative (but not positive) groups to which they belong. It is shown as
well that they have reduced interest in joining lower status groups compared to individuals in
a social exclusion or control condition. Social inclusion participants reported reduced

15
collective self-esteem, specifically public collective self-esteem, from negative group
memberships, compared to control and social exclusion. However. Dr Travis Bradberry
(2016), in his article “Incredible Things That Happen Once You Learn to Love Being Alone”
argues that being alone boosts your self-esteem. Dr. Bradberry claims that enjoying your
own company is a huge confidence booster and that learning to enjoy time alone boosts your
self-esteem by confirming that” you are enough”.
The Rosenberg General Self-Esteem Scale (RGSE, Rosenberg, 1965) has been one of
the most widely used measures of global self-esteem. The purpose of the 10 item RSE scale is
to measure self-esteem. Originally the measure was designed to measure the self-esteem of
high school students. However, since its development, the scale has been used with a variety
of groups including adults, with norms available for many of those groups. An important
notion is Reliability: The RSE demonstrates a Guttman scale coefficient of reproducibility of
.92, indicating excellent internal consistency and test-retest reliability over a period of 2
weeks reveals correlations of .85 and .88, indicating excellent stability. In addition, Validity
demonstrates concurrent, predictive and construct validity using known groups and the RSE
correlates significantly with other measures of self-esteem, including the Coopersmith Self-
Esteem Inventory.
Belonging to a group and gender
Barker, V. (2009) assessed motives for social network site (SNS) use, group
belonging, collective self-esteem, and gender effects among older adolescents. Females were
more likely to report high positive collective self-esteem, greater overall use, and SNS use to
communicate with peers. Females also posted higher means for group-in-self, passing time,
and entertainment. Males were more likely than females to report negative collective self-
esteem and SNS use for social compensation and social identity gratifications. Another study

16
was designed to examine one aspect of the context of peer relations and the social networks
of males and females. Fourth- and fifth-grade children were asked to rate their peers using
friendship and play rating scales and to describe their same-sex peers in open-ended
interviews. Although males and females did not differ in the number of best friends they
reported, males were found to have larger social networks than females. For males, position
in a social network was more highly linked with acceptance by the peer group. Finally, males
were concerned with attributes that could be construed as important for status in the peer
group, and females were concerned with attributes that appeared essential to relationships
with a few friends (Benenson, J. F. 1990).
In the field of education a study by Tonso, K. L. (1999), describes women's places in
an engineering campus culture. In spite of the vast majority of student engineers and faculty
adhering to progressive ideals for women's full inclusion and for treating women with
respect, women's places at Public Engineering School were severely restricted. Women's
experiences on student teams varied in direct relation to the extent to which their male
teammates engaged high-status (academic-science-affiliated) cultural identities.
Furthermore, women's under-representation in many STEM fields (Science,
Technology, Engineering, and Mathematics), is due to a combination of individual and socio-
cultural factors. Among these, the peer group is one potentially powerful force reviewed in
this article from Leaper, C. (2015) who describes key processes associated with group
belonging. How the social identities associated with group belonging can shape individuals'
task and interpersonal values. Leaper considers how the values reinforced in many girls' and
women's peer groups may conflict with their perceptions of STEM. In addition, girls and
women may experience rejection and hostility from their male peers regarding STEM
achievement but when peer groups value and support STEM, they may validate girls' and
women's sense of belongingness in STEM fields.

17
And how does group membership in adolescence affects boys and girls? In a study by
Newman, B. M., Lohman, B. J., & Newman, P. R. (2007), participants included an ethnically
and socioeconomically diverse sample of 733 adolescents ranging in age from 11 to 18 years.
Girls reported more internalizing problems and boys reported more externalizing problems.
Girls also reported a higher sense of peer group belonging than boys. When controlling for
adolescent age, gender, ethnicity, parent's educational level, and family structure, a sense of
peer group belonging was negatively related to internalizing and externalizing behaviour
problems.
However, many project-based organizations within the IT sector suffer from an
underrepresentation of women (Chasserio & Legault, 2010) and although this
underrepresentation has primarily been studied in light of undesirable consequences for
women (cf. Lindgren & Packendorff, 2006), it is argued that this skewed gender distribution
is directly hurting both women and men. As individuals within project-based organizations
are often required to work together in project teams, women and men are increasingly
dependent on each other and individuals’ team identification is an important predictor of
individuals’ commitment and satisfaction (Johnson, Morgeson, & Hekman, 2012). The
results of the study suggested that men identify less with their team when one of the project
members is a woman, and that this negative influence is stronger when teams are smaller.
(Doornenbal, B. M., & Havermans, L. A. 2015).
Role of Personality
Is being part of a group dependent on Personality? Bishop, P. (2014) says that Carl
Jung popularized the notion that people fall into two attitude types: introversion and
extroversion and the world seems to be divided into two different types of people, the
extrovert and the introvert. Could this difference have an influence on people taking a group

18
membership? In a world that promotes the outgoing, successful extrovert, being an introvert
can be difficult and could this be a reason why an introvert would take a membership? In
addition, may the kind of membership be a factor drawing the Introvert or Extrovert to take
part in the group?
What is the thing we call personality? "Personality is the dynamic organization within
the individual of those psychophysical systems that determine his characteristics behaviour
and thought" (Allport, 1961, p. 28) and “The characteristics or blend of characteristics that
make a person unique” (Weinberg & Gould, 1999). Both definitions emphasize the
uniqueness of the individual. We have to consider also the influence and interaction of nature
(biology, genetics etc.) and nurture (the environment, upbringing) with respect to personality
development. They are several personality theories starting with Eysenck’s Personality
Theory (1952, 1967 and1982) who developed a very influential model of personality. Based
on the results of factor analyses of responses on personality questionnaires, Eysenck
identified two dimensions of personality: introversion-extroversion which combined to form
a variety of personality characteristics. Extraverts are sociable and crave excitement and
change, and thus can become bored easily, whereas introverts are reserved, plan their actions
and control their emotions as well as tending to be serious, reliable and pessimistic. But it is
often assumed that personality is largely fixed, like your height or shoe size and this idea is
endorsed by the Trait theories of personality which suggest that personality is biologically
based. However, state theories such as Bandura's (1977) Social Learning Theory point to the
role of nurture and environmental influence.
Mund, M., & Neyer, F. (2015) at the Institute of Psychology at Friedrich Schiller
University, Jena in Germany explored two factors – loneliness and feelings of health – that
influence the way people's personality shifts in early to mid-life, and in turn how their
personality affects those very same factors. In short, it appears our personality affects the

19
likelihood that we'll become more lonely and not being part of a group, (and feel less well) as
we get older, but also that being lonely and not taking part in group activities, shapes our
personality, potentially setting up a vicious circle of isolation.
How might loneliness, or not being part of a group, shape the way a person's
personality develops? Mund and Neyer speculate that perhaps it is through physical and
social inactivity. Who we are is based partly on who we mix with and the part we play in our
social relationships and people who lack this connection (and those with an initial anxious
and introvert personality are more vulnerable to this situation) are likely to miss out on these
experiences. This, will further shape their personality in directions that lead to more isolation.
However, this study has some serious limitations: a lot of the initial participants dropped out;
there were only two time points; and we know nothing of the participants' experiences in the
fifteen year span of the study. Nonetheless, this is largely unexplored terrain and the study
offers some glimpses of the dynamic two-way interactions between personality and
loneliness and health.
We can say that our achievements as a species is influence by our willingness to
cooperate and whether in any given situation we choose to favour self-interest or cooperation.
This issue has long interested researchers, who have been testing people’s choices in
hypothetical setups involving, for instance, prisoners’ loyalty to each other or the sharing of
community resources. But these situations are struggling to give us a clear picture of how
personality tips people one way or another: for example, are extraverts more cooperative by
instinct than introverts? Schroeder, K., Nettle, D., & McElreath, R. (2015).

20
Rationale for the present study
The notion of individualism is actually quite a recent development for humanity. Do we, like
Christopher McCandless, believe “to feel you control your life, stand alone” or as Katharine
Greenaway and her team suggest” to feel control, stand together”?
A life alone on the Alaskan wilderness may offer many things, but can we find our
own forms of freedom right here in our everyday life? And if committing to a group feels like
surrendering control, we might expect some impact on wellbeing. Greenaway’s team
predicted that group membership is strongly associated with life satisfaction and it is argued
that identifying with a group actually makes people feel more in control.
The present study therefore, seeks to draw together these concepts by investigating
the relationship between belonging to a group and being in control of your life, in terms of
satisfaction with life and self-esteem, as well as exploring the impact of personality type in
that relationship.
Hypotheses
Hypothesis 1: there will be a significant relationship between being part of a group and
control.
Hypothesis 2: There will be a significant relationship between being part of a group and
satisfaction with life.
Hypothesis 3: there will be a significant relationship between being part of a group and self-
esteem.
Hypothesis 4: there will be a significant relationship between being part of a group and
personality (Extrovert/Introvert).

21
Hypothesis 5: belonging to a group and having control will significantly predict satisfaction
with life.
Hypothesis 6: belonging to a group and having control will significantly predict self-esteem.
Hypothesis 7: There will be a significant difference in control between male and female
belonging to a group.

22
Methods
Design
This research study was conducted as a quasi-experiment using a cross-sectional
quantitative questionnaire, descriptive and correlational design. The predictor variables were:
Belonging to a Group, Nature of Group membership and Influence of Personality on group
membership. The criterion variables were Control, Satisfaction with life and Self- esteem.
Additional variables such as gender, age, length and nature of membership were also
considered as predictors.
Participants
Non-probability sampling methods were used combining convenience and snowball
sampling providing a total sample size of (n=116) participants. Participants (n=78) 67 %
obtained through convenience sampling consisted of part time and full time undergraduate
students over 18 years of age attending the BA (Hons) in Psychology course at Dublin
Business School. An email was sent to lecturers requesting permission to attend the lectures
and distribute questionnaires to students for completion in class. Participants (n=38) 33 %
obtained through snowball sampling consisted of friends and family who were provided an
email link. The email requested onward distribution to potential participants who fit the
inclusion criteria. Total participants (n=116) ranged in age from 18 to 63 years, (M=31.01,
SD=13.686), gender split consisted of Males (n=33) 28 %, Females (n=83) 72 %, Member of
a social group (n= 66) 57 %, Males (n=17) 15 %, Females (n=49) 42 %. Participants were
advised of the inclusion criteria on the introduction sheet. Inclusion criteria anyone over 18
years of age and exclusion criteria was anyone who did not wish to give informed consent.

23
Materials
A Google doc. Link was created for the online questionnaires. The questionnaires
were developed using four existing validated questionnaires - Pearlin Mastery Scale (PM)
(Pearlin, L.I., & Schooler, C. 1978), Satisfaction with Life scale (Diener, E., Emmons, R. A.,
Larsen, R. J., & Griffin, S. 1985), Self-Esteem scale (Rosenberg, M. 1965) and Eysenck
Personality Questionnaire-Revised Short Form (EPQR-S; Eysenck, Eysenck, & Barrett,
1985).
The Pearlin Mastery Scale (PM) (Pearlin, L.I., & Schooler, C. 1978) measures an
individual’s level of mastery, which is a psychological resource that has been defined as “the
extent to which one regards one’s life-chances as being under one’s own control in contrast to
being fatalistically ruled” (Pearlin & Schooler, 1978, p.5). The 7-item scale comprises five
negatively worded items and two positively worded items, presented with the following
response options: (1) Strongly Disagree (2) Disagree (3) Agree (4) Strongly agree. The
negatively worded items require reverse coding prior to scoring, resulting in a score range of
7 to 28, with higher scores indicating greater levels of mastery. The original method of
scoring these questions was to use a 1-4 scale for the responses (reverse coding where
appropriate) and then summing. This is the approach of “Classical Test Theory” (CTT),
which used to dominate the psychometrics of scaling. CTT imposes the very strong
restriction that a “1” means the same thing for all questions, and third, that going from a “1”
to a “2” likewise is equally informative about mastery for all questions.
The Satisfaction with Life Scale (Diener, E., Emmons, R. A., Larsen, R. J., & Griffin,
S. 1985) is a 5-item scale designed to measure global cognitive judgments of one’s life
satisfaction (not a measure of either positive or negative affect). Participants indicate how
much they agree or disagree with each of the 5 items using a 7-point scale that ranges from 7

24
strongly agree to 1 strongly disagree. The structure of subjective well-being has been
conceptualized as consisting of two major components: the emotional or affective component
and the judgmental or cognitive component (Diener, 1984; Veenhoven, 1984). The
judgmental component has also been conceptualized as life satisfaction (Andrews & Withey,
1976). Although the affective component of subjective well-being has received considerable
attention from researchers, the judgmental component has been relatively neglected.
The Rosenberg Self-Esteem Scale (Rosenberg, M. 1965), a widely used self-report
instrument for evaluating individual self-esteem, is a 10-item scale that measures global self-
worth by measuring both positive and negative feelings about the self. The scale is believed
to be uni-dimensional. All items are answered using a 4-point Likert scale format ranging
from strongly agree to strongly disagree. Five of the items have positively worded statements
and five have negatively worded ones. The scale measures state self-esteem by asking the
respondents to reflect on their current feelings. The original sample for which the scale was
developed consisted of 5,024 high-school juniors and seniors from 10 randomly selected
schools in New York State. The Rosenberg self-esteem scale is considered a reliable and
valid quantitative tool for self-esteem assessment.
Personality is conceptualized as two, biologically-based categories of temperament:
Extraversion/Introversion. One of these shorter personality scales is the Eysenck Personality
Questionnaire Revised - Short Form (EPQR-S; Eysenck et al., 1985). EPQR-S includes 12
items for Extraversion. Eysenck et al. (1985) reported reliabilities for males and females
respectively of 0.84 for extraversion. Extraversion is characterized by being outgoing,
talkative, high on positive affect (feeling good), and in need of external stimulation.
Extraverts, according to Eysenck's theory, are chronically under-aroused and bored and are
therefore in need of external stimulation to bring them up to an optimal level of performance.

25
Introverts, on the other hand, are chronically over-aroused and are therefore in need of peace
and quiet to bring them up to an optimal level of performance.
Three additional questions on 1.Membership of a social group, 2. Length of
Membership and 3.Nature of Membership were developed in relation to belonging. For 1.
Membership of a social group, participants were asked if they were a member of a social
group (Yes/No). For 2.Length of membership they were asked how long they had been a
member of the group with a scale of 1” (0 to 6 months)-2 (7 months to 1 year)-3 (1 to 5
years)-4 (6 to 10 years)-(over 10 years)”. For 3. Nature of membership they were asked to
indicate the kind of membership with a scale of 1”Voluntary-2 Paid-3 Social-4 Compulsory-5
Professional. Questions on demographic information were included Age and Gender. See
Appendix A and B for cover sheet and copy questionnaires.
Procedure
The researcher used both convenience and snowball sampling methods. The researcher used
convenience sampling through attendance at lectures and distribution of hard copy
questionnaires to students. Students were advised that the study was about belonging to a
group and control of your life, time period of approximately 10mn to complete along with a
verbal invitation to participate. Once completed, the questionnaires were collected and
participants were verbally thanked for their participation. The researcher used snowball
sampling method by distribution of a questionnaire via email sent to family and friends with a
request to forward to other potential participants who fit within inclusion criteria – over 18
years of age. An outline and instructions were contained within the questionnaire. The
questionnaire included an introduction sheet outlining the nature of the study, an invitation to
voluntary participate and a clear statement of consent. See Appendix A and B for cover sheet
and questionnaires.

26
As the data was anonymous, participants were advised that they are unable to
withdraw from the study once the questionnaire was submitted. Confidentiality was assured
and no information was sought on location of the social group. A separate sheet providing
helpline information for AWARE and Samaritans was included in the event that participants
were negatively affected by the topic in question.
Data was analysed using the Statistical Package for Social Sciences Version 22 (SPSS
22). Data from hard copy questionnaires and emails was manually input into SPSS 22 to
complete the data sample. All data was recoded and computed in line with the requirements
for each questionnaires.

27
RESULTS
A number of statistical analysis were conducted to carry out data analysis collected
from the sample of 116 study respondents. The results of descriptive statistics are presented
in term of respondent gender, membership of the group, length of membership in the group
and nature of membership. In addition, a more details analysis results are also reported which
started with independent t-test, correlation analysis, ANCOVA and ANOVA.
Descriptive Statistics
Figure 1: Gender of the respondents
Female participants accounted for 71.55% (n = 83) while male constituted 28.45% (n
= 83).
Table 1 Age of the respondent
N Minimum Maximum Mean Std. Deviation
age of respondent 115 18 63 31.01 13.686
The mean age of the respondents is 31.01± 13.686 with the youngest respondents
being aged 18 years and the eldest 63 years.

28
Figure 2: Membership in the social group
Majority of the participants were the members of the social group with 59.48% (n =
69) while 40.52% participants were not members of the social group as shown by the pie
chart above.
Figure 3: Length in the membership group
Most of the respondents have been the member of the social group for over 10 years
with 35.82%, followed by those who have been members for 1 to 5 years (28.36%), 6 to 10

29
years (19.40%), 7 months to 1 year (8.96%), and 0 to 6 months with 7.46% as shown by bar
chart above.
Figure 4: Nature of membership
When it comes to the nature of the membership of the group, most of the respondents
had paid membership with 36.92%, followed by those who had voluntary membership and
social membership with 30.77% (each) and only 1 member had professional membership
with 1.54% as shown by bar chart above.
Table 2 Independent t-test between membership in the social group and control variables
t-test for Equality of Means
_________________________________________________________________
t df Sig. (2-tailed) Mean Difference Std. Error
Difference
95%
Confidence
Interval of the
Difference
Lower Upper
Control -.462 114 .645 -.17 .37 -.91 .56
From the independent t-test there is no significant difference between being or not
being a member of the social group and the control variables with t (114) = -0.462, p>0.05

30
(0.645). Therefore membership in social group does not affect the control variables. This is
also shown by the bar chart below.
Figure 5: Membership in social group by control
Table 3
Gender by control variables
sex of respondent Mean N Std. Deviation
Male 19.09 33 1.84
female 18.05 83 1.93
Total 18.35 116 1.66
Male participants had higher mean (19.09 ±1.84) as compared to female counterparts with a
mean of 18.05 ±1.93
Table 4 Independent t-test between membership in the social group and satisfaction
variables
t-test for Equality of Means
t df Sig. (2-
tailed)
Mean
Difference
Std. Error
Difference
95% Confidence Interval
of the Difference
Lower Upper
Satisfaction 1.459 113 .147 1.71 1.17 -.61 4.03
_____________________________________________________________________

31
From the independent t-test there is no significant difference between being or not
being a member of the social group and the satisfaction variables at t (113) = 1.459, p>0.05
(0.147). Therefore although members in the social group have higher mean when it comes to
the satisfaction variables, the difference is not significant as shown above.
Table 5 Independent t-test between membership in the social group and self-esteem variables
t-test for Equality of Means
t df Sig. (2-
tailed)
Mean
Difference
Std. Error
Difference
95% Confidence Interval
of the Difference
Lower Upper
Self
esteem
-
1.666 114 .098 -1.11 .66 -2.40 .21
_____________________________________________________________________
The table above shows the independent-test analysis. It is found that there is
insignificant difference between being and not being in a social group with self-esteem
variables with t (114) = -1.666, p<0.05 (0.098).
Table 6 Independent t-test between membership in the social group and personality
variables
t-test for Equality of Means
t df Sig. (2-
tailed)
Mean
Difference
Std. Error
Difference
95% Confidence
Interval of the
Difference
Lower Upper
Personality
(extravert/introvert)
-
3.862 105 .000*** -1.77 .46 -2.68 -.86
Note. *** = p < .001.
There is a significant difference between being or not being part of the group and
personality (extravert/introvert) with t (114) = -3.862, p<.001. Therefore being extravert is
associated more with the membership of the group.

32
Figure 6: Membership in the social group by personality
Table 7 One Way ANCOVA between membership, control and satisfaction with life
Source Type III Sum of Squares df Mean Square F Sig.
control 56.880 1 56.880 1.499 .223
membership 87.273 1 87.273 2.301 .132
Note. = p < .01.
The ANCOVA test shows that being in a social group and having control predicts
satisfaction with life with 3.1% variance. There is no significant relationship between being
in a social group and having control with satisfaction with life p>0.05.
Table 8 One Way ANCOVA between membership control and self esteem
Source Type III Sum of Squares df Mean Square F Sig.
Control 3.738 1 3.738 .306 .581
membership 32.702 1 32.702 2.674 .105
33
The ANCOVA test shows that being in a social group and having control predicts
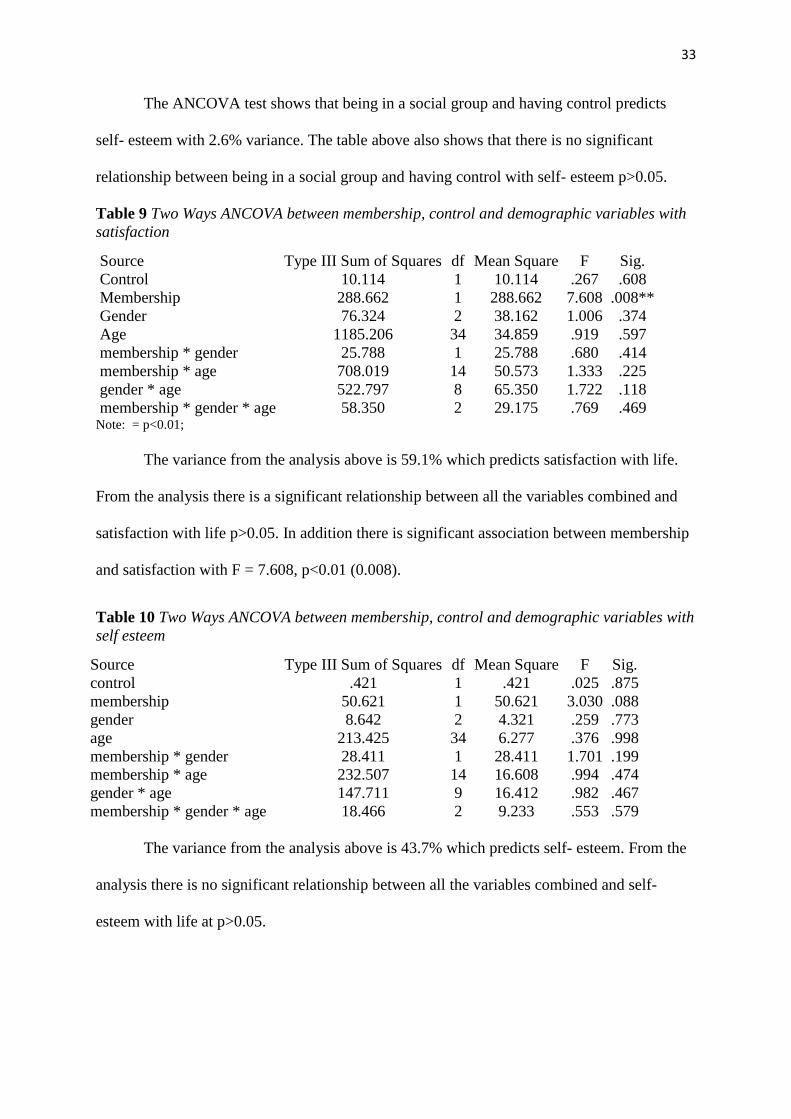
self- esteem with 2.6% variance. The table above also shows that there is no significant
relationship between being in a social group and having control with self- esteem p>0.05.
Table 9 Two Ways ANCOVA between membership, control and demographic variables with
satisfaction
Source Type III Sum of Squares df Mean Square F Sig.
Control 10.114 1 10.114 .267 .608
Membership 288.662 1 288.662 7.608 .008**
Gender 76.324 2 38.162 1.006 .374
Age 1185.206 34 34.859 .919 .597
membership * gender 25.788 1 25.788 .680 .414
membership * age 708.019 14 50.573 1.333 .225
gender * age 522.797 8 65.350 1.722 .118
membership * gender * age 58.350 2 29.175 .769 .469 Note: = p<0.01;
The variance from the analysis above is 59.1% which predicts satisfaction with life.
From the analysis there is a significant relationship between all the variables combined and
satisfaction with life p>0.05. In addition there is significant association between membership
and satisfaction with F = 7.608, p<0.01 (0.008).
Table 10 Two Ways ANCOVA between membership, control and demographic variables with
self esteem
Source Type III Sum of Squares df Mean Square F Sig.
control .421 1 .421 .025 .875
membership 50.621 1 50.621 3.030 .088
gender 8.642 2 4.321 .259 .773
age 213.425 34 6.277 .376 .998
membership * gender 28.411 1 28.411 1.701 .199
membership * age 232.507 14 16.608 .994 .474
gender * age 147.711 9 16.412 .982 .467
membership * gender * age 18.466 2 9.233 .553 .579
The variance from the analysis above is 43.7% which predicts self- esteem. From the
analysis there is no significant relationship between all the variables combined and self-
esteem with life at p>0.05.

34
Table 11 Two Ways ANCOVA between membership, control and demographic variables with
personality
Source Type III Sum of Squares df Mean Square F Sig.
control 5.841 1 5.841 1.188 .282
membership 32.346 1 32.346 6.581 .014*
Gender 18.433 2 9.217 1.875 .166
Age 152.809 33 4.631 .942 .566
membership * gender 1.742 1 1.742 .355 .555
membership * age 51.511 12 4.293 .873 .579
gender * age 64.531 9 7.170 1.459 .196
membership * gender * age 23.160 2 11.580 2.356 .108
Note: p<0.05;
The variance from the analysis above is 67.9% which predicts personality. From the
analysis there is no significant relationship between all the variables combined and
personality at (F = 48.145, p = 0.000, p<0.001). In addition there is significant association
between membership and personality with F = 6.581, p<0.05 (0.014). Therefore being
extravert is associated more with the membership of the group.
Table 12 ANOVA between nature of membership and other variables
Sum of Squares df Mean Square F Sig.
Control
Between Groups 7.958 4 1.990 .571 .685
Within Groups 212.708 61 3.487
Total 220.667 65
Satisfaction
Between Groups 47.412 4 11.853 .385 .818
Within Groups 1845.726 60 30.762
Total 1893.138 64
Self esteem
Between Groups 60.738 4 15.184 1.225 .309
Within Groups 755.883 61 12.392
Total 816.621 65
Personality
Between Groups 10.620 4 2.655 .569 .686
Within Groups 261.314 56 4.666
Total 271.934 60
The ANOVA analysis shows the significant association between nature of
membership and control (F (4, 61) = 0.571, p = 0.685); satisfaction (F (4, 60) = 0.385, p =
0.818); self- esteem (F (4, 61) = 1.225, p = 0.309); and personality of the respondents (F (4,
56) = 0.569, p = 0.686). From the analysis there is no significant association between nature
of membership and other variables with the p>0.05.

35
Table 13 Correlation analysis between length of membership and other variables
Length of
membership Personality Control Satisfaction
Self
esteem
Length of
membership 1 -.154 .119 .235 -.205
Personality -.154 1 -.192* -.147 .173
Control .119 -.192* 1 .108 .058
Satisfaction .235 -.147 .108 1 -.318**
Self esteem -.205 .173 .058 -.318** 1
Note: *= p<0.05; ** = p<0.01;
From the Pearson bivariate analysis there is no significant association between length of
membership, personality, control, satisfaction, self-esteem with p>0.05 as shown by the table
above.
36
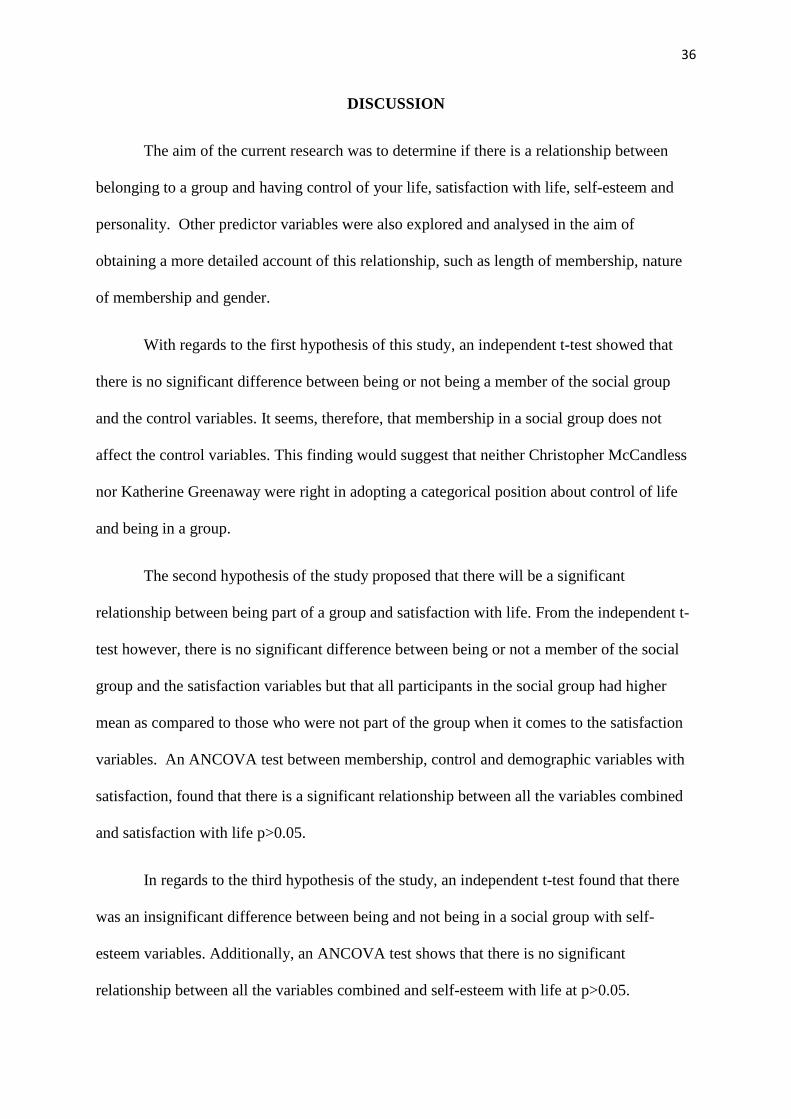
DISCUSSION
The aim of the current research was to determine if there is a relationship between
belonging to a group and having control of your life, satisfaction with life, self-esteem and
personality. Other predictor variables were also explored and analysed in the aim of
obtaining a more detailed account of this relationship, such as length of membership, nature
of membership and gender.
With regards to the first hypothesis of this study, an independent t-test showed that
there is no significant difference between being or not being a member of the social group
and the control variables. It seems, therefore, that membership in a social group does not
affect the control variables. This finding would suggest that neither Christopher McCandless
nor Katherine Greenaway were right in adopting a categorical position about control of life
and being in a group.
The second hypothesis of the study proposed that there will be a significant
relationship between being part of a group and satisfaction with life. From the independent t-
test however, there is no significant difference between being or not a member of the social
group and the satisfaction variables but that all participants in the social group had higher
mean as compared to those who were not part of the group when it comes to the satisfaction
variables. An ANCOVA test between membership, control and demographic variables with
satisfaction, found that there is a significant relationship between all the variables combined
and satisfaction with life p>0.05.
In regards to the third hypothesis of the study, an independent t-test found that there
was an insignificant difference between being and not being in a social group with self-
esteem variables. Additionally, an ANCOVA test shows that there is no significant
relationship between all the variables combined and self-esteem with life at p>0.05.

37
The fourth hypothesis was explored with an independent t-test that found that there is
a significant difference between being or not, part of the group and personality type
(extravert/introvert) and therefore, being extravert is associated more with the membership of
the group. This result is giving an answer to the question formulated in the study in the
paragraph on Personality:” In a world that promotes the outgoing, successful extrovert, being
an introvert can be difficult and could this be a reason why an introvert would take a
membership?” As per the result here we can say that this is not the case.
With hypothesis five, the ANCOVA test shows that being in a social group and
having control predicts satisfaction with life with 3.1% variance but that there is no
significant relationship between being in a social group and having control with satisfaction
with life p>0.05.
The sixth hypothesis is explored with another ANCOVA test which shows that being
in a social group and having control predicts self- esteem with 2.6% variance and that
equally, there is no significant relationship between being in a social group and having
control with self- esteem at p>0.05 . Furthermore, ANCOVA between membership, control
and demographic variables with self-esteem, showed that there is no significant relationship
between all the variables combined and self-esteem with life at p>0.05.
Finally, hypothesis seventh regarding gender and control found that Male participants
had a higher mean as compared to Female counterparts. From the analysis it is evident that
there is a significant association between gender and control. Therefore we can conclude that
gender affects the control variables.

38
Strengths and limitations
While previous studies have focused on specific aspects of belonging to a group, this
research draws together the concepts of belonging to a group and control, satisfaction with
life, self-esteem and personality factor. Some limitations can be found in the disproportion in
the gender balance and in the somewhat small sample of participants. Further studies could
look at the nature and length of membership specifically as factors of satisfaction with life
and self-esteem, rather than factors of control of your life.
Conclusion
Are we getting a definite answer in relation to the statements expressed by
Christopher McCandless “to feel you control your life stand alone” and by Katherine
Greenaway “Why it’s a mistake to seek control of your life through solitude”? Conflicting
evidence between our results and the two authors, suggests that there is not an easy and clear
answer to both statements. Furthermore, the argument that “exposure or vulnerability to
others is the source of both human happiness and human misery” (Gottlieb, D. 2016) seems
to be reflected in the insignificant differences between level of control, satisfaction with life
and self-esteem.
Nonetheless, this study seeks to contribute to the area of research by investigating the
impact of belonging to a group and the wellbeing of individuals in terms of control,
satisfaction with life and self-esteem even if the results show insignificant statistical
difference in the relationship of these variables.
In conclusion, and independently of the results of the present study, we can say that most of
the people agree that feeling that you belong in a group is an important and powerful need
and it seems that the ability to foster a sense of belonging can also determine whether groups

39
survive. This is a powerful reason why, the majority of organizational features of groups
cultivate feelings of belonging.

40
REFERENCES
Allport, G. W. (1961). Pattern and growth in personality.
Bandura, A. (1977). Social learning theory.
Barker, V. (2009). Older adolescents' motivations for social network site use: The influence
of gender, group identity, and collective self-esteem. CyberPsychology & Behavior,
12(2), 209-213.
Benenson, J. F. (1990). Gender differences in social networks. The Journal of Early
Adolescence, 10(4), 472-495.
Bishop, P. (2014). Carl Jung. London: Reaktion Books
Branden, N. (1990). What Is Self-Esteem?
Brantley, J., & Millstine, W. (2011). True Belonging : Mindful Practices to Help You
Overcome Loneliness, Connect with Others & Cultivate Happiness. Oakland, Calif:
New Harbinger Publications
Civitci, A. (2015). Perceived Stress and Life Satisfaction in College Students: Belonging and
Extracurricular Participation as Moderators. Procedia - Social And Behavioral
Sciences, 205(6th World Conference on Psychology, Counseling and Guidance
(WCPCG-2015), 271-281. doi:10.1016/j.sbspro.2015.09.077
Davison, K. P., Pennebaker, J. W., & Dickerson, S. S. (2000). Who talks? The social
psychology of illness support groups. American Psychologist, 55(2), 205-217.
doi:10.1037/0003-066X.55.2.205.
Diener, E., Emmons, R. A., Larsen, R. J., & Griffin, S. (1985). The Satisfaction with Life
Scale. Journal of Personality Assessment, 49, 71-75.

41
Doornenbal, B. M., & Havermans, L. A. (2015). Gender Diversity and Team Identification.
Procedia - Social And Behavioral Sciences, 194(Proceedings of the 2014 IPMA
World Congress (Sept 29-Oct 1 - Rotterdam, Netherlands), 65-73.
doi:10.1016/j.sbspro.2015.06.120
Easterbrook, M., & Vignoles, V. L. (2013). What does it mean to belong? Interpersonal
bonds and intragroup similarities as predictors of felt belonging in different types of
groups. European Journal Of Social Psychology, 43(6), 455-462.
doi:10.1002/ejsp.1972.
Eysenck, H. J. (1991). Dimensions of personality: 16, 5 or 3?—Criteria for a taxonomic
paradigm. Personality and individual differences, 12(8), 773-790.
Ferreday, D. (2009). Online Belongings : Fantasy, Affect and Web Communities. Oxford:
Peter Lang AG.
Fradera, A. (2015). Why it's a mistake to seek control of your life through solitude.
Geschiere, P. (2009). The Perils of Belonging : Autochthony, Citizenship, and Exclusion in
Africa and Europe. Chicago: University of Chicago Press.
Gottlieb, D. (2016). Skepticism and Belonging in Shakespeare's Comedy. New York:
Routledge
Greenaway, K. H., Haslam, S. A., Cruwys, T., Branscombe, N. R., Ysseldyk, R., & Heldreth,
C. (2015). From 'we' to 'me': Group identification enhances perceived personal control
with consequences for health and well-being. Journal of Personality And Social
Psychology, 109(1), 53-74. doi:10.1037/pspi0000019.
Guibernau i Berdun, M. M. (2013). Belonging : Solidarity and Division in Modern Societies.
Cambridge, UK: Polity

42
Hagerty, B. M., Lynch-Sauer, J., Patusky, K. L., Bouwsema, M., & Collier, P. (1992). Sense
of belonging: A vital mental health concept. Archives of psychiatric nursing, 6(3),
172-177.
Hoff, S. (2014). Rights and Worlds: On the Political Significance of Belonging. Philosophical
Forum, 45(4), 355-373. doi:10.1111/phil.12045.
Incredible Things That Happen Once You Learn to Love Being Alone- Jan 17, 2016 412,718
views 6,686 Likes892 Comments Share on Linked In Share on Facebook Share on
Twitter.
Into the Wild (2007) movie directed by Sean Penn.
Journal of Community Psychology, January 2001(from degree of neighbouring). © 2001
John Wiley & Sons, Inc.
Jetten, J., Branscombe, N. R., Haslam, S. A., Haslam, C., Cruwys, T., Jones, J. M., & ...
Zhang, A. (2015). Having a Lot of a Good Thing: Multiple Important Group
Memberships as a Source of Self-Esteem. Plos ONE, 10(5), 1-29.
doi:10.1371/journal.pone.0124609
Kirkhaug, R. (2010). Charisma or group belonging as antecedents of employee work effort?
Journal Of Business Ethics, 96(4), 647-656. doi:10.1007/s10551-010-0490-5.
Leaper, C. (2015). Do I Belong?: Gender, Peer Groups, and STEM Achievement.
International Journal Of Gender, Science & Technology, 7(2), 166.
Maurizi, L. K., Ceballo, R., Epstein‐Ngo, Q., & Cortina, K. S. (2013). Does neighborhood
belonging matter? Examining school and neighborhood belonging as protective
factors for Latino adolescents. American Journal Of Orthopsychiatry, 83(2-3), 323-
334. doi:10.1111/ajop.12017

43
Mund, M., & Neyer, F. (2015). The Winding Paths of the Lonesome Cowboy: Evidence for
Mutual Influences between Personality, Subjective Health, and Loneliness Journal of
Personality DOI: 10.1111/jopy.12188.
Ndi, B. F., Ankumah, A. T., & Fishkin, B. H. (2014). Fears, Doubts and Joys of Not
Belonging. Bamenda, Cameroon: Langaa RPCIG
Newman, B. M., Lohman, B. J., & Newman, P. R. (2007). PEER GROUP MEMBERSHIP
AND A SENSE OF BELONGING: THEIR RELATIONSHIP TO ADOLESCENT
BEHAVIOR PROBLEMS. Adolescence, 42(166), 241-263.
Nijstad, B. A. (2009). Group performance. Hove Psychology Press 2009.
Outten, H. R., & Schmitt, M. T. (2015). The more 'intergroup' the merrier? The relationship
between ethnic identification, coping options, and life satisfaction among South Asian
Canadians. Canadian Journal Of Behavioural Science / Revue Canadienne Des
Sciences Du Comportement, 47(1), 12-20. doi:10.1037/a0035907
Ozeki, M. (2015). Group-level group identity as a basis of a group. Group Dynamics: Theory,
Research, And Practice, 19(3), 166-180. doi:10.1037/gdn0000030.
Pavot, W. G., & Diener, E. (1993). Review of the Satisfaction with Life Scale. Psychological
Assessment, 5, 164-172.
Pearlin, L.I., & Schooler, C. (1978). The structure of coping. Journal of Health and Social
Behavior, 19, 2-21.
Probyn, E. (1996). Outside belongings / Elspeth Probyn. New York : Routledge, 1996.
Rosenberg, M. (1965). Rosenberg self-esteem scale (RSE). Acceptance and commitment
therapy. Measures package, 61.

44
Rosenberg, M. (1979). Conceiving the Self. New York: Basic Books.
Sacco, D. F., & Bernstein, M. J. (2015). Social inclusion leads individuals to devalue groups
of perceived inferior quality. Group Dynamics: Theory, Research, And Practice,
19(4), 211-224. doi:10.1037/gdn0000035
Schroeder, K., Nettle, D., & McElreath, R. (2015). Interactions between personality and
institutions in cooperative behaviour in humans Philosophical Transactions of the
Royal Society B: Biological Sciences, 370 (1683) DOI: 10.1098/rstb.2015.0011
Tonso, K. L. (1999). ENGINEERING GENDER− GENDERING ENGINEERING: A
CULTURAL MODEL FOR BELONGING. Journal of Women and Minorities in
Science and Engineering, 5(4).
Turner, I., Reynolds, K. J., Lee, E., Subasic, E., & Bromhead, D. (2014). Well-being, school
climate, and the social identity process: A latent growth model study of bullying
perpetration and peer victimization. School Psychology Quarterly, 29(3), 320-335.
doi:10.1037/spq0000074
Walton, G. M., Cohen, G. L., Cwir, D., & Spencer, S. J. (2012). Mere belonging: The power
of social connections. Journal Of Personality And Social Psychology, 102(3), 513-
532. doi:10.1037/a0025731.
Wann, D. L. (2006). Understanding the positive social psychological benefits of sport team
identification: The team identification-social psychological health model. Group
Dynamics: Theory, Research, And Practice, 10(4), 272-296. doi:10.1037/1089-
2699.10.4.272.
Weinberg,R.S.,&Gould,D.(1999). Foundations of sport and exercise psychology (2nd ed.).
Champaign,IL:HumanKinetics.

45
Widman, D. R., Corcoran, K. E., & Nagy, R. E. (2009). Belonging to the same religion
enhances the opinion of others' kindness and morality. Journal Of Social,
Evolutionary, And Cultural Psychology, 3(4), 281-289. doi:10.1037/h0099316

46
APPENDICES
Appendix A Cover Sheet
My name is Remedios Rodriguez and as partial fulfilment of my Honours Degree in
Psychology I am undertaking a research project which investigates the relationship between
belonging to a group and having control of your life.
I would like to invite you to participate in this research. To take part you must be over 18
years of age. There are four questionnaires attached, each with instructions to be followed at
the top. If you decide to take part please follow the instructions carefully and answer all
questions. The survey should only take about 10 minutes to complete. You are not obliged to
take part in this study but if you do take part you can withdraw at any time before you hand
over your completed questionnaire.
The completed questionnaires are anonymous and will in no way be identifiable. All
questionnaires and data pulled from them will be held safely in a locked cabinet and
password protected laptop. The information will be dealt sensitively by the researcher and
can only be accessed by the researcher and project supervisor Dr Garry Prentice
(xxxx@xxxxx).
Helpline numbers for AWARE and SAMARITAINS are provided on a separate sheet for
easy detachment.
I would like to take this opportunity to thank you for taking part in this research. If you have
any questions about the research, please do not hesitate to contact me by email. (You may
take this sheet away with you if you like).
Remedios Rodriguez
xxxxx@xxxxx

47
Aware National Office
72 Lower Leeson Street, Dublin 2.
tel. 01 661 7211
fax. 01 661 7217
Contact Samaritans' Ireland office:
Samaritans Ireland
4-5 Usher's Court
Usher's Quay
Dublin 8
Tel: +353 1 6710071
The quickest way to contact us and get a response is by phone on 116 123, this number is
FREE to call.

48
Appendix B Questionnaire
AGE :_________
GENDER:______Male/Female ( tick please)
1.-Instructions:
Below are seven statements that you may agree or disagree with. Using the 1 - 4 scale below,
indicate your agreement with each item by placing the appropriate number on the line
preceding that item. Please be open and honest in your responding.
(1) Strongly Disagree (2) Disagree (3) Agree (4) Strongly Agree.
----------- There is really no way I can solve some of the problems I have.
----------- Sometimes I feel that I’m being pushed around in life.
----------- I have little control over the things that happen to me.
----------- I can do just about anything I really set my mind to.
----------- I often feel helpless in dealing with the problems of life.
----------- What happens to me in the future mostly depends on me.
----------- There is little I can do to change many of the important things in my life.
2.-Instructions:
Below are five statements that you may agree or disagree with. Using the 1 - 7 scale below,
indicate your agreement with each item by placing the appropriate number on the line
preceding that item. Please be open and honest in your responding.
• 7 - Strongly agree
• 6 - Agree
• 5 - Slightly agree
• 4 - Neither agree nor disagree
• 3 - Slightly disagree
• 2 - Disagree
• 1 - Strongly disagree
---------------- In most ways my life is close to my ideal.

49
---------------- The conditions of my life are excellent.
----------------I am satisfied with my life.
----------------So far I have gotten the important things I want in life.
---------------- If I could live my life over, I would change almost nothing.
3.-Instructions: Below is a list of statements dealing with your general feelings about
yourself. If you strongly agree, tick SA. If you agree with the statement, tick A. If you
disagree, tick D. If you strongly disagree, tick SD.
STATEMENT Strongly
Agree Agree Disagree
Strongly
Disagree
1. I feel that I am a person of worth, at
least on an equal plane with others.
2. I feel that I have a number of good
qualities..
3. All in all, I am inclined to feel that I
am a failure.
4. I am able to do things as well as most
other people.
5. I feel I do not have much to be proud
of.
6. I take a positive attitude toward
myself.
7. On the whole, I am satisfied with
myself.
8. I wish I could have more respect for
myself.
9. I certainly feel useless at times.
10. At times I think I am no good at all.

50
4.-Instructions:
Below are 12 statements related to personality (introversion/extraversion). Please tick Yes or
No.
1. Are you a talkative person?------------------------------------------------- Yes/No
2.-Are you rather lively?------------------------------------------------------- Yes/No
3.-Do you enjoy meeting new people?--------------------------------------- Yes/No
4.-Can you usually let yourself go and enjoy yourself at a lively party? Yes/No
5.-Do you usually take the initiative in making new friends?------------ Yes/No
6.-Can you easily get some life into a rather dull party?------------------ Yes/No
7.-Do you tend to keep in the background in social occasions?--------- Yes/No
8.-Do you like mixing with people?----------------------------------------- Yes/No
9.-Do you like plenty of bustle and excitement around you?------------ Yes/No
10.-Are you mostly quiet when you are with other people?------------- Yes/No
11.-Do other people think of you as being very lively?------------------ Yes/No
12.-Can you get a party going?----------------------------------------------- Yes/No
I.-Indicate if you are a member of a social group (i.e. sport, dance, bridge, golf etc.) club (i.e.
seasonal ticket holder, club membership, player of club etc. or association: YES/NO
II.-Indicate how long you have been a member of a social group, club or association:
1.- (0 to 6months), 2.- (7 months to1year), 3.- (1 to 5 years), 4.- (6 to 10 years), 5.- (over 10
years).
III.- Indicate the nature of your membership: (tick the option ).
1.- Voluntary membership
2.- Paid membership
3.- Social membership
4.- Compulsory membership
5.- Professional membership

51
Appendix C Bar charts
Figure 6: Membership in social group by satisfaction
Figure 7: Membership in the social group by self esteem