bench-scale development of a transformational graphene
TRANSCRIPT

Bench-scale Development of a Transformational
Graphene Oxide-based Membrane Process for
Post-combustion CO2 Capture
DOE Contract No. DE-FE0031598
Shiguang Li, Gas Technology Institute (GTI)
Miao Yu, Rensselaer Polytechnic Institute (RPI), University at Buffalo (UB, SUNY)
U.S. Department of Energy
National Energy Technology Laboratory
Carbon Management and Natural Gas & Oil Research Project Review Meeting
Virtual Meetings, August 16, 2021

2
▪ Performance period: June 1, 2018 – September 30, 2022
▪ Funding: $2,914,074 from DOE; $728,738 cost share
▪ Objective: Develop a transformational graphene oxide (GO)-based membrane process
(GO2) for CO2 capture with 95% CO2 purity and a cost of electricity (COE) at least 30% lower
than DOE amine reference baseline SC PC plant case
▪ Team:Member Roles
• Project management and planning
• Quality control
• CO2 capture performance tests
• GO membrane development and scale-up
• Process design and optimization
• Site host
▪ Technical & economic study
Project overview
GO = graphene oxide

3
GO membrane technology based on our work published in Science,
Nature Communications, and Journal of Membrane Science
300 nm
0
0.5
1
1.5
2
0 250 500 750 10000 250 500 750
1.5
1.0
0.5
x, nm
h, n
m
A
B 500 nm
▪ Contribution:
▪ Single-layered GO flake
prepared as thin as 1 nm
▪ Structural defects on GO
flakes can be controlled
as transport pathway for
selective gas separations

4
▪ 50–70% removal from coal flue gas: single stage
▪ 70–90% removal from coal or natural gas flue gases: a proprietary GO2 process integrates a
high-selectivity GO-1 membrane and a high-flux GO-2 membrane for optimal performance
GO-1Flue
gasTreated
flue gas
CO2 captured
(95% purity of CO2)
Process description
GO-1 GO-2
CO2 captured
(95% purity of CO2)
Flue
gasTreated
flue gas
GO = graphene oxide

5
Scalable procedures developed for fabricating GO membranes
GO membrane
on hollow fiber
Vacuum
Hollow fiber
support
GO-based
coating solution
flows inside the
hollow fiber
Substrate: PES (polyethersulfone)
Hollow fiber
membranes:
Vacuum filtration
Flat sheet
membranes:
Spray coating

6
An innovative membrane structure: GO nanochannels
intercalated by single-walled carbon nanotubes ▪ What does this structure look like?
PES hollow fiber substrate SWCNT framework
N-GOQD vacuum coatingN-GOQD/SWCNT membrane
Drying and heating
Coated with SWCNT
Re-coated with N-GOQD
N-GOQD
SWCNT
▪ Why this structure?
▪ SWCNTs narrow surface
pore size below GOQD size
▪ Infiltrated GOQDs pack
densely with SWCNTs to
form a carbon-based hybrid
membrane
SWCNT = single-walled carbon nanotube; N-GOQD = nitrogen-doped graphene oxide quantum dot

7
Hollow fiber
inner diameter:
1 mm
Surface of the
substrate: skin
layer with pore
size of 50-200
nm
500 μm 500 nm
400 nm 500 nm
220 nm
300 nm
Surface and cross
section of the N-
GOQD/SWCNT/
DETA membrane
Surface and cross
section of the
SWCNT layer
High-quality GO-based membranes prepared on the
commercial available PES hollow fiber substrates
PES = polyether sulfone; SWCNT = single-walled carbon nanotube;
N-GOQD = nitrogen-doped graphene oxide quantum dot; DETA = diethylenetriamine

8
GO-1 membrane showed CO2/N2 selectivity of 300 with
CO2 permeance of 1,100 GPU at 80°C during 50-h testing
0
200
400
600
800
1000
0
400
800
1200
1600
2000
0 10 20 30 40 50
Time (h)
Sele
cti
vit
y
CO
2p
erm
ean
ce (
GP
U)▪ Flat sheet membrane
▪ Membrane:
GO/PEI/DETA
▪ Testing conditions:
▪ Feed mixture: 8.0 vol%
CO2, 45.2 vol% N2, and
46.8 vol% H2O
▪ Temperature: 80°C
▪ Feed pressure: ~1.0 bara
▪ Permeate side pressure:
0.40 bara
GO = graphene oxide; PEI = polyethylenimine; DETA = diethylenetriamine
GPU = Gas Permeation Unit (1 GPU = 3.348 x 10⁻¹⁰ mol/m2/s/Pa)
9
10 20 30 40 50 60 70 80 90 1000
400
800
1200
1600
2000
2400
2800
CO
2/N
2 s
ele
ctivity
CO
2 p
erm
ea
nce
(G
PU
)
Time (h)
CO2 permeance
100
200
300
CO2/N
2 selectivity
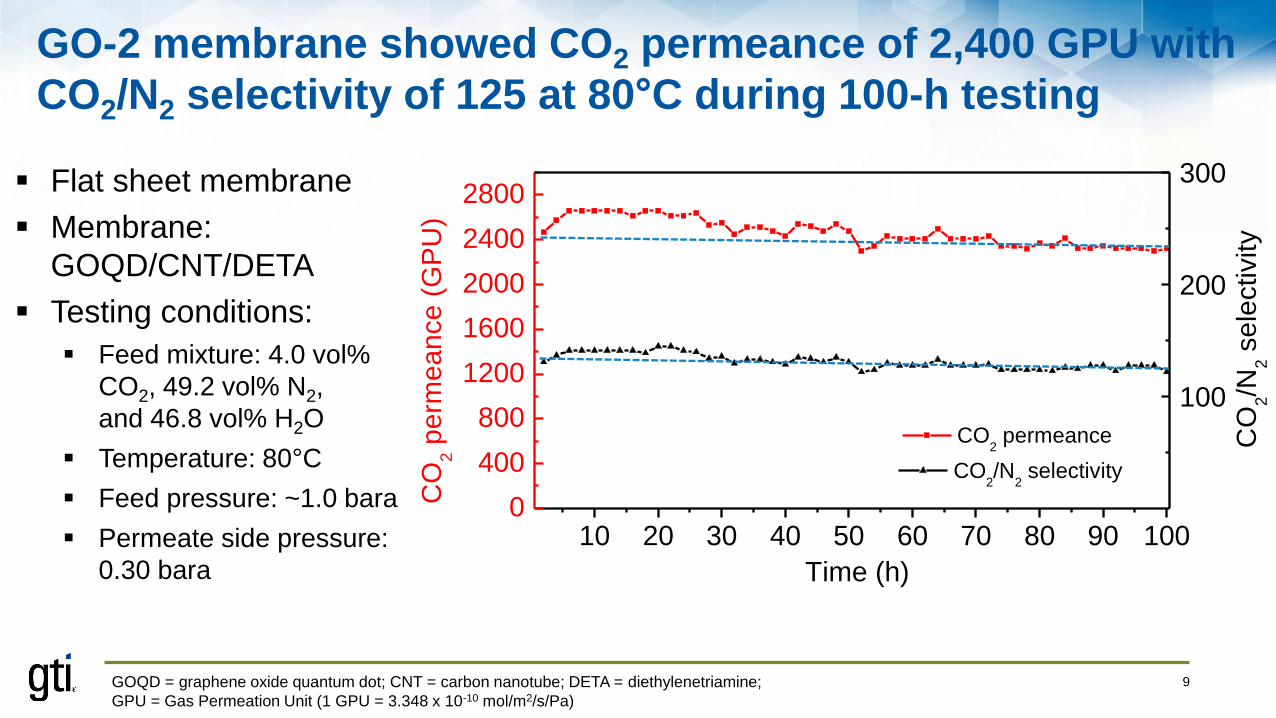
▪ Flat sheet membrane
▪ Membrane:
GOQD/CNT/DETA
▪ Testing conditions:
▪ Feed mixture: 4.0 vol%
CO2, 49.2 vol% N2,
and 46.8 vol% H2O
▪ Temperature: 80°C
▪ Feed pressure: ~1.0 bara
▪ Permeate side pressure:
0.30 bara
GO-2 membrane showed CO2 permeance of 2,400 GPU with
CO2/N2 selectivity of 125 at 80°C during 100-h testing
GOQD = graphene oxide quantum dot; CNT = carbon nanotube; DETA = diethylenetriamine;
GPU = Gas Permeation Unit (1 GPU = 3.348 x 10⁻¹⁰ mol/m2/s/Pa)

10
Scaleup of GO-based membranes on commercially available 1,000 cm2 hollow fiber substrates
MaterialFiber ID
(mm)
Module
Length (cm)
Effective
Length (cm)
Number
of Fibers
Effective
surface Area
(cm2)
PES 1.00 47 41.5 78 1,000

11
1,000 cm2 membrane showed CO2 permeance of 984 GPU with CO2/N2 selectivity of 330 during a stage-cut testing
• Membrane: GOQD/CNT/DETA
• Testing condition:
• Feed mixture: CO2 9.1 vol%; N2 50.8 vol%; H2O 40.1 vol%
• Temperature: 80°C
• Feed pressure: ~1 bara
• Permeate side pressure: 0.40 bara
• CO2 capture performance:
CO2 permeance
(GPU)
CO2/N2
selectivity
Permeate side CO2
purity (dry base)
CO2 capture
rate
984 330 96.6 vol% 40.3%
GOQD = graphene oxide quantum dot; CNT = carbon nanotube; DETA = diethylenetriamine

12
#1
#2 #3
#4
#5
#6 #7
145 cm2 (14.5 cm x 10 cm) coated
Scaleup of GO-based flat sheet membranes by spray coating• Membrane: GOQD/CNT/PSS/DETA
• Testing condition: • Feed mixture: 15 vol%CO2/85
vol%N2 (saturated with H2O)• 80°C• Feed pressure: ~ 1 bara• Permeate pressure: 0.40 bara
• CO2 capture performance
Sample CO2 permeance,
GPU
αCO2/N2
#1 997 240
#2 1,310 240
#3 998 120
#4 1,020 300
#5 1,030 310
#6 1,240 360
#7 1,130 340
Average 1,100 ± 127 272 ± 81
13
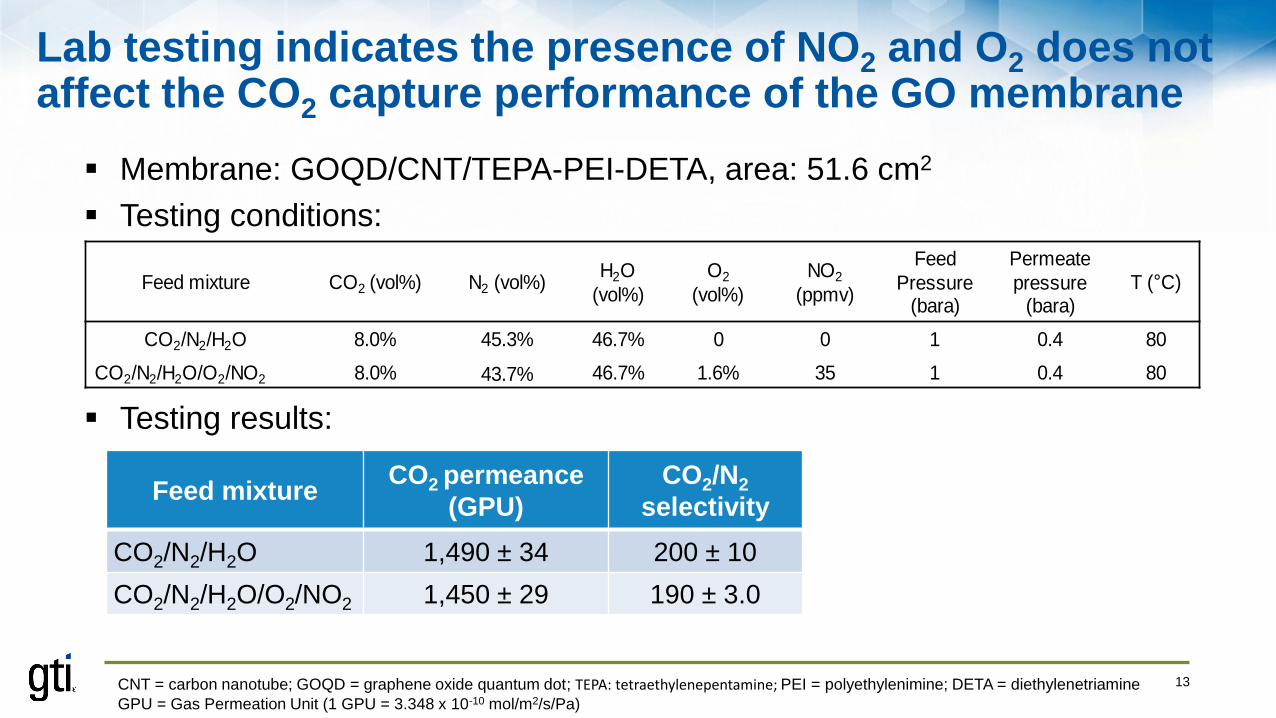
Lab testing indicates the presence of NO2 and O2 does not affect the CO2 capture performance of the GO membrane
Feed mixture CO2 (vol%) N2 (vol%)H2O
(vol%)
O2
(vol%)
NO2
(ppmv)
Feed
Pressure (bara)
Permeate
pressure (bara)
T (°C)
CO2/N2/H2O 8.0% 45.3% 46.7% 0 0 1 0.4 80
CO2/N2/H2O/O2/NO2 8.0% 43.7% 46.7% 1.6% 35 1 0.4 80
Feed mixtureCO2 permeance
(GPU)
CO2/N2
selectivity
CO2/N2/H2O 1,490 ± 34 200 ± 10
CO2/N2/H2O/O2/NO2 1,450 ± 29 190 ± 3.0
▪ Membrane: GOQD/CNT/TEPA-PEI-DETA, area: 51.6 cm2
▪ Testing conditions:
▪ Testing results:
CNT = carbon nanotube; GOQD = graphene oxide quantum dot; TEPA: tetraethylenepentamine; PEI = polyethylenimine; DETA = diethylenetriamine
GPU = Gas Permeation Unit (1 GPU = 3.348 x 10⁻¹⁰ mol/m2/s/Pa)

14
▪ Tests conducted with two fresh membranes: one with SO2 in feed, another without SO2 in feed
▪ Feed mixture: CO2 : N2: O2: H2O = 12.8 %: 38.9%: 1.6%: 46.7% in vol%; SO2: 46 ppm
▪ Temperature: 80°C; Feed pressure: ~1 bara; Permeate side pressure: 0.44 bara
▪ Similar transient permeation behavior: membrane performance reached steady state in ~2 h
after vacuum was introduced to the permeate
▪ Taking into account of membrane variations and testing error bar (±10%), CO2 permeances
and CO2/N2 selectivities calculated from two tests (with and without SO2) were identical
▪ Steady-state stability (≥100 h) will be further investigated under Task 6 with scaled
membranes (500-1,000 cm2)
Test condition CO2 permeance
(GPU)
N2 permeance
(GPU)
CO2/N2
selectivity
Without SO2 961 4.68 205
With SO2 1060 5.19 204
Preliminary testing data indicate membrane performance
not affected by SO2
GPU = Gas Permeation Unit (1 GPU = 3.348 x 10⁻¹⁰ mol/m2/s/Pa)

15
Where do our membranes fall on the Robeson plots?
1000
100
10
1
Note: Polymer data points (red): 100 nm membrane thickness assumed
GO-2 flat sheet membrane at 80°C
CO2 permeance (GPU)
0.1 10 103 105
a(C
O2/N
2)
Robeson, J. Membrane Sci. 2008, Vol. 320, p390
GO-1 flat sheet membrane at 80°C
GO-1 hollow fiber membrane (1,000 cm2) at 80°C

16
Future work of this project
We are here
BP1
Task 2 – Development of GO membrane with
area of 50-100 cm2
Task 8 – Testing of the GO2 system using NG flue gas
Task 5 – Scale-up of GO membrane modules
to effective areas of 1000 cm2
Task 6 – 100-h stability tests for GO
membranes developed under Task 5
Task 4 – Stability testing of membranes at
near realistic flue gas conditions
Task 7 – Design and
construction of a GO2
system
Task 3 – Improvement of 50-100 cm2
membranes towards higher selectivities
Task 10 – TEA
Process DevelopmentMembrane Development
BP2
Task 9 – Testing of the GO2 system using coal flue gas
Task 1: Project management and planning (throughout the project))
6/1/18-
3/31/20
4/1/20-
9/30/22

17
Technology development path
Year
Sc
ale
2015 2017 2019 2021 2023 2025 2027 2029 2031 2033
Commercial Membrane
Manufacturer (TPD)
Commercial Membrane
Manufacturer (TPD)
Commercial Membrane
Manufacturer (TPD)TRL Duration
2–3 500 h
TRL Duration
5 500 h
TRL Duration
6 >1,500 h
TRL Duration
7 Months
TRL Duration
8–9 Years
TRL Duration
3-4 100-200 h
Current project

18
Summary▪ We are developing a transformational graphene oxide-based membrane
process for post-combustion CO2 capture
▪ Single stage for 50–70% removal from coal flue gas
▪ GO2 process integrating a high-selectivity GO-1 membrane and a high-flux GO-2
membrane for 70–90% removal from coal or natural gas flue gases
▪ An innovative membrane structure was developed and showed high CO2
capture performance and good stability
▪ Preliminary lab tests indicated GO-based membranes stable in the
presence of O2, NO2 and SO2
▪ Membranes scaled to 1,000 cm2 surface area. The performance of the
scaled membranes achieved technical goals
▪ A bench-scale system is under design and will be tested at NCCC
NCCC = National Carbon Capture Center

19
Acknowledgements
▪ Financial and technical support
CO2 Capture Project - Phase 4
▪ DOE NETL: Dustin Brown, Andrew O'Palko, José Figueroa, Dan Hancu
and Lynn Brickett
▪ The CCP4: Betty Pun and Mark Crombie
▪ NCCC: Frank Morton and Tony Wu
DE-FE0031598

20
Appendix – Organization Chart
Department of Energy
Project Oversight
GTI
Dr. Shiguang Li- PI
• Coordinate project
activities
• Project management
• Project QA/QC
GTI
Ms. Kate Jauridez
Contract administrator
GTI
Mr. Howard Meyer
Senior institute engineer
• Internal consultant
RPI, UB
Prof. Miao Yu
• GO membrane
development
GTI
Mr. Travis Pyrzynski
• System integration
and testing
Trimeric
Dr. Andrew Sexton
• TEA
GTI
Mr. John Marion
Senior Program Director
Internal consultant
NCCC
Mr. Tony Wu
• Supporting
testing at NCCC

21
Appendix – Gantt ChartBP1 BP2

22
Disclaimer
This presentation was prepared by GTI as an account of work sponsored by an agency of the United
States Government. Neither GTI, the United States Government nor any agency thereof, nor any of
their employees, makes any warranty, express or implied, or assumes any legal liability or
responsibility for the accuracy, completeness, or usefulness of any information, apparatus, product,
or process disclosed, or represents that its use would not infringe privately owned rights. Reference
herein to any specific commercial product, process, or service by trade name, trademark,
manufacturer, or otherwise does not necessarily constitute or imply its endorsement,
recommendation, or favoring by the United States Government or any agency thereof. The views
and opinions of authors herein do not necessarily state or reflect those of the United States
Government or any agency thereof.