bench-scale propane reformer archive/files/merge/vol-47... · bench-scale propane reformer ......
TRANSCRIPT

BENCH-SCALE PROPANE REFORMER Water: Deionized water was filtered to remove micron-size particulates that might impair the long term operation of the process water pump.
Dylan Mason, Kyle Taylor, and Daniel G. Löffler
IdaTech, LLC Apparatus PO Box 5339 The equipment is conventional. Both the pre-reformer and
reformer reactors were made of 16-inch length of stainless steel pipe with an internal diameter of 0.824 inch. The axial temperature profile in the catalyst bed was measured using a 3/16” diameter profile thermocouple placed in the reactor center axis. Thermocouples welded to the external reactor wall were used to measure reactor skin temperature. The reactors were placed in two identical 3-inch diameter electrically heated furnaces. The pre-reformer and reformer reactor contained approximately 30 g of catalyst, enough to fill a 5- inch length of reactor. Alumina spheres were used to fill the remainder of reactor upstream and downstream the catalyst bed. Deionized and filtered water was fed through a HPLC pump to an electrically heated steam generator. A backpressure regulator kept the pressure at 180 – 200 psig in all tests. After condensation of the steam, samples of the effluent gas were analyzed in two gas chromatographs. One GC used nitrogen as the carrier gas and measured the concentration of light products: hydrogen, methane, and carbon oxides. The second GC used helium as the carrier gas and measured the concentration of heavier (C2+) hydrocarbons. A 450-gm propane canister was submerged in a 42°C water bath to raise the pressure to 205 psig. Sulfur-containing odorants were removed by passing the propane stream through a bed of copper impregnated activated carbon containing 12 wt% CuO.
Bend, OR 97708
Introduction Propane is a fuel commonly used in homes removed from
natural gas grids and in camping applications. This fuel has a high energy density, can be transported easily, and can be stored in liquid form in light pressure vessels with typical contents ranging from one pound for small canisters up to a few gallons for portable uses. Propane is easily reformed; thus, as a feedstock for hydrogen production it is potentially an inexpensive fuel for fuel cells.
Steam reforming is a well understood technology producing a reformate product containing an equilibrium composition of water, hydrogen, methane, and carbon oxides. Current PEM fuel cells have a very low tolerance for CO, hence a thorough cleanup of the reformate product is required. The common route to hydrogen with low levels of CO processes reformate in a water-gas shift unit followed by selective oxidation of the residual CO. This route requires three catalytic reactor units in series: reformer, water-gas shift, and selective oxidation. A simpler technology, requiring no reaction steps beyond reforming, uses a hydrogen-permeable membrane to obtain pure hydrogen, but because the efficiency of membrane separation increases with the partial pressure of hydrogen in the reformate, those systems operate at relatively high pressures, typically 10-15 bar.
Procedure Commercial propane is a mixture of over 95% mass propane, the balance consisting of C2-C4 paraffins and olefins, and small amounts (ppm levels) of sulfur-containing odorants. This mixture tends to form coke when exposed to reforming temperatures. This drawback is countered by utilizing a pre-reformer to convert the heavier hydrocarbons to a mixture composed of methane, hydrogen, CO, and CO2. Because sulfur tends to be a poison to pre-reforming
In a typical run, the reactors were heated under steam flow until the reaction temperatures (approximately 500°C in the pre-reformer, 800°C in the reformer) were achieved. Then, a stream of propane was mixed with the steam flow near the reactor inlet. Gas samples were taken for analysis at time intervals after the reactor temperatures reached a steady state.
and reforming catalysts, an upstream desulfurization unit is needed to Results and discussion reduce the sulfur in the feed to trace amounts (<1 ppm).
Typical temperature profiles for the pre-reformer and reformer reactors are shown in Figure 1. The experimental conditions are detailed in Table I while the compositions of the pre-reformer and reformer inlet and outlet streams are shown in Table II. The reactors are nearly isothermal in the absence of reaction as shown by the steam-only temperature profile. Temperatures in the reactors dropped at the inlet of the catalyst packing because of the strong endothermicity of the reforming reaction. The pre-reformer reactor achieved complete conversion of propane and heavier hydrocarbons. The outlet composition of both reactors was close to thermodynamic equilibrium at the reactor outlet temperature. The experimental system is being used for long-term durability catalyst testing.
Our strategy was to implement a two-stage steam reforming process followed by membrane separation of hydrogen. Commercial propane was drawn at pressure from the gas phase of a small container and desulfurized in a bed of copper-impregnated carbon. The desulfurized stream was fed to the pre-reformer, which in turn fed the reformer. The reformate stream was cooled to condense unreacted water and periodically sampled for analysis in a gas chromatograph.
In the present communication we present a bench-scale system built to test the desulfurizer - pre-reformer – reformer concept and to evaluate catalysts provided by different manufacturers. Activity and long-term durability data obtained with this system were used to design commercial fuel processor prototypes.
Materials
Propane: Sufficient numbers of disposable propane canisters (450 gm each) to complete testing were purchased from a single manufacturer’s lot. This was done in order to minimize feedstock variability during the tests. The composition of the contents was 95% propane, 4% ethane and lower amounts of C2-C4 olefins and paraffins. The sulfur concentration was approximately 40 ppm, and consisted primarily of ethyl mercaptan. Catalysts: Testing was limited to samples of precious metal-based materials provided by commercial manufacturers.
Fuel Chemistry Division Preprints 2002, 47(2), 558
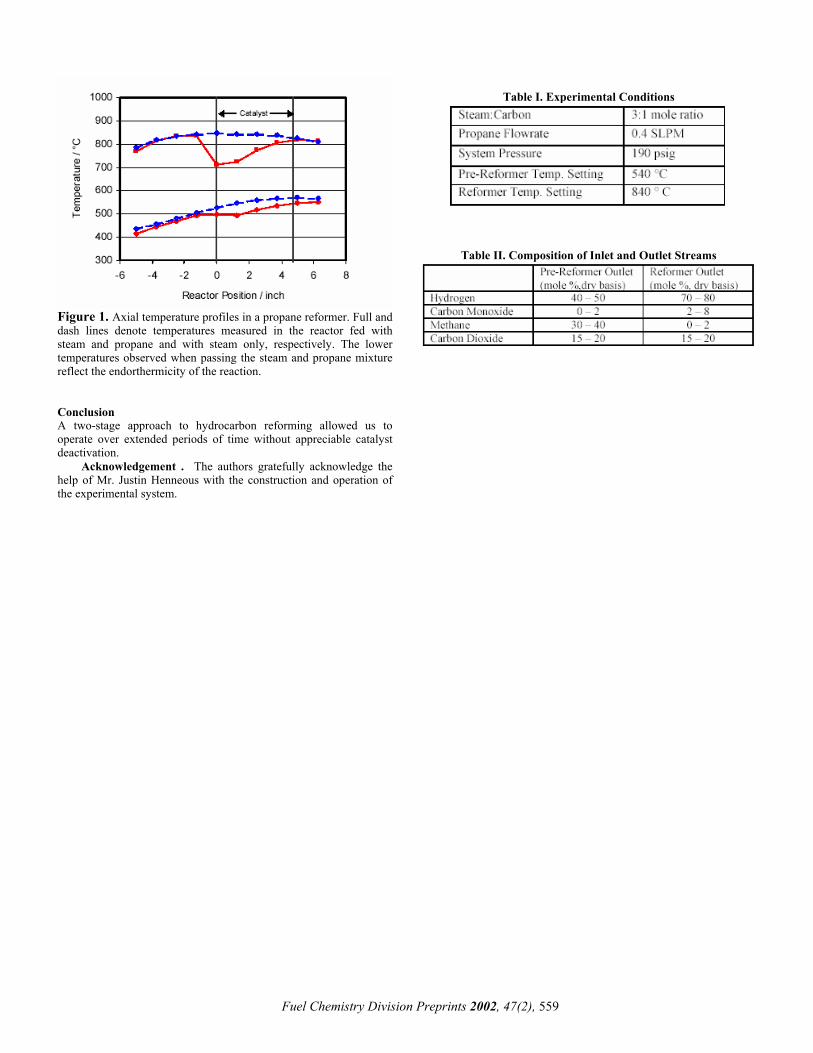
Figure 1. Axial temperature profiles in a propane reformer. Full and dash lines denote temperatures measured in the reactor fed with steam and propane and with steam only, respectively. The lower temperatures observed when passing the steam and propane mixture reflect the endorthermicity of the reaction.
Table I. Experimental Conditions
Table II. Composition of Inlet and Outlet Streams
Conclusion A two-stage approach to hydrocarbon reforming allowed us to operate over extended periods of time without appreciable catalyst deactivation.
Acknowledgement . The authors gratefully acknowledge the help of Mr. Justin Henneous with the construction and operation of the experimental system.
Fuel Chemistry Division Preprints 2002, 47(2), 559
Catalytic Autothermal Reforming of Hydrocarbon Fuels for Fuel Cell Systems
Theodore Krause, John Kopasz, Cecile Rossignol, J. David Carter,
and Michael Krumpelt
Electrochemical Technology Program Chemical Technology Division Argonne National Laboratory
9700 S. Cass Ave Argonne, IL 60439
Introduction
Fuel cell development has seen remarkable progress in the past decade because of an increasing need to improve energy efficiency as well as to address concerns about the environmental consequences of using fossil fuel for the propulsion of vehicles.1 The lack of an infrastructure for producing and distributing H2 has led to a research effort to develop on-board fuel processing technology for reforming hydrocarbon fuels to generate H2.2 The primary focus is on reforming gasoline, because a production and distribution infrastructure for gasoline already exists to supply internal combustion engines.3 Existing reforming technology for the production of H2 from hydrocarbon feedstocks used in large-scale manufacturing processes, such as ammonia synthesis, is cost prohibitive when scaled down to the size of the fuel processor required for transportation applications (50-80 kWe) nor is it designed to meet the varying power demands and frequent shutoffs and restarts that will be experienced during normal drive cycles. New reforming reactor technology will be required to meet the volume, weight, and cost targets, and operational characteristics required of a fuel processor for transportation applications. New reforming catalysts will be required that exhibit a higher activity and better thermal and mechanical stability than reforming catalysts currently used in the production of H2 for large-scale manufacturing processes.
Hydrocarbon fuels can be reformed to produce H2 by several reaction processes, including steam reforming, partial oxidation, and autothermal reforming. Steam reforming (Eq. 1) involves the reaction of steam with the fuel in the presence of a catalyst to produce H2 and a mixture of CO and CO2.
CnHmOp + H2O ⇒ H2 + CO/CO2, ∆H°298 >>0 (Eq. 1) Steam reforming is highly endothermic with the heat required for the reaction being quite significant to sustain acceptable reaction rates. The heat is generated by oxidizing part of the fuel external to the reformer where it is then transferred to the reformer via a heat exchanger. Reaction rates are generally limited by heat and mass transfer to the reactor and not by reaction kinetics. Partial oxidation (Eq. 2) involves the reaction of a substoichiometric amount of oxygen relative to complete combustion, usually supplied as air, to produce H2, and a mixture of CO and CO2.
CnHmOp + O2 ⇒ H2 + CO/CO2, ∆H°298 < 0 (Eq. 2) The oxidation reaction is highly exothermic and reaction rates are generally very rapid. Unlike steam reforming, partial oxidation can be conducted with or without a catalyst. In the absence of a catalyst, the oxidation occurs in the gas phase and high temperatures (>1000ºC) are required to achieve rapid reaction rates. Coking is a problem for gas phase oxidation. In the presence of a catalyst, rapid reaction rates can be achieved at considerably lower temperatures. Autothermal reforming (Eq. 3) involves the reaction of fuel, steam,
and oxygen and utilizes the heat generated in the partial oxidation reactions to drive the endothermic steam reforming reactions.
CnHmOp + O2 + H2O ⇒ H2 + CO/CO2, ∆H°298 < 0 (Eq. 3) As written in Eq. 3, the reaction can be either endothermic or exothermic depending on the relative ratios of O2:C and H2O:C. For autothermal reforming the ratios are selected such that the reaction is slightly exothermic. As discussed for partial oxidation, the oxidation reactions can be conducted with or without a catalyst. The use of a catalyst for the oxidation reactions is preferred to allow for a lower reaction temperature. The choice of the reaction process for on-board reforming depends on the operating characteristics (e.g., varying power demand, rapid startup, frequent shutdowns) for transportation applications. Steam reforming results in the highest yield of H2 but has heat transfer limitations. Autothermal reforming and partial oxidation may be self-sustaining but result in lower H2 yields due to the N2 dilution because air and not pure oxygen is used. Because steam reforming is heat and mass transfer limited, it does not respond rapidly to changes in the power demand (i.e., “load following”), which would be frequently experienced during a normal driving cycle. When power demand rapidly decreases, the catalyst can overheat, causing sintering, which in turn results in a loss of activity. Autothermal reforming can overcome the load following limitations of steam reforming since the heat required for the endothermic reactions is generated within the catalyst bed, a property that allows for more rapid response to changing power demands and faster startup.4 The lower operating temperature of catalytic autothermal reforming has several advantages including less complicated reactor design, wider choice of materials of construction, and lower fuel requirements during startup over the higher operating temperature of partial oxidation or the endothermic steam reforming for transportation applications.5
At Argonne National Laboratory, we are developing new catalysts for autothermal reforming.6 Our catalysts are derived from solid oxide fuel cell materials, where a transition metal is supported an oxide-ion-conducting substrate, such as ceria, zirconia, or lanthanum gallate that has been doped with a small amount of a non-reducible element, such as gadolinium, samarium, or zirconium. Ceria-based materials are being investigated as potential catalysts for CO and hydrocarbon oxidation reactions because of the redox and oxygen storage/release properties of ceria.7 The catalytic activity of ceria can be further enhanced by the addition of dopants, such as Gd3+ or Sm3+, which have been shown to increase the number of oxygen vacancies, improve the oxygen mobility and oxygen ion conductivity, and enhance the redox and oxygen storage/release properties of ceria. The role of defect chemistry and the surface oxygen vacancies in determining the catalytic behavior of these metal/mixed oxide systems is well known.8 Experimental
A mixed metal oxide substrate consisting of CeO2 and Gd2O3 (referred to as CGO) at a ratio of 4:1 Ce:Gd was synthesized by either a glycine-nitrate process or coprecipitation of metal salt precursors followed by calcination at 600-1000ºC. A Group VIII transition metal selected from the noble metals (Pt, Ru, or Rh) or non-noble metals (Co or Ni) was loaded onto the CGO substrate using the incipient wetness technique. Metal loadings ranged from 0.1 to 1 wt%.
These materials were tested for autothermal reforming of isooctane (2,2,4-trimethylpentane), which is used as a single component surrogate for gasoline. These tests were conducted using ~1-2 g of material in a microreactor system equipped with an on-line
Fuel Chemistry Division Preprints 2002, 47(2), 542
gas chromatograph. Thermocouples were located at the top and the bottom of the catalyst bed. The temperature at the bottom of the catalyst is reported for these experiments.
These materials were also tested for autothermal reforming of isobutane using a temperature-programmed reaction procedure. In this procedure, ~50 mg of material was contacted with a gas mixture consisting of 0.2 mL/min of isobutane, 0.4 mL/min O2, 0.8 mL/min H2O, and 48.6 mL/min He. The catalyst was heated from 100 to 800°C at a rate of 2°C/min. The reaction products were determined by mass spectroscopy. These experiments were conduct using a Zeton Altamira AMI-100 Chemisorption Unit. Results and Discussion
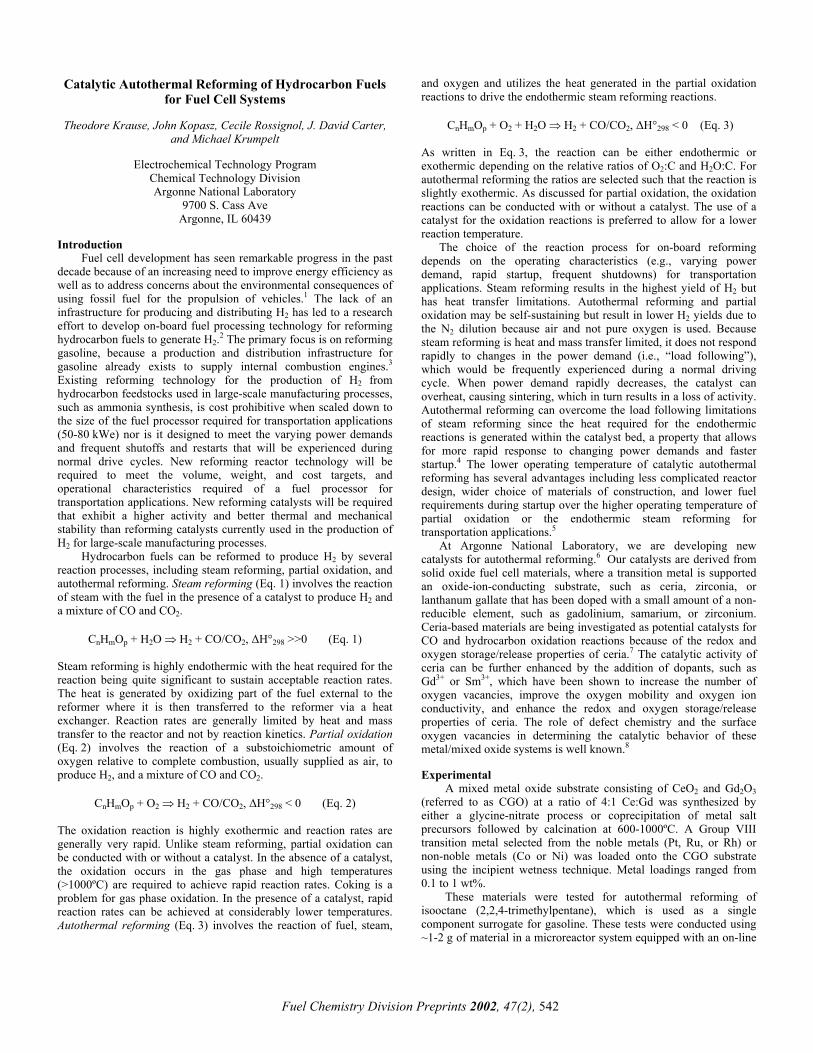
For autothermal reforming of isooctane with a feed ratio O2:C=0.5 for oxygen and H2O:C=1.1 for water, a maximum yield of 12.2 moles of H2 per mole of isooctane in the feed is predicted at a temperature of ~700°C based on thermodynamic equilibrium. Figure 1 shows the H2 yield produced from autothermal reforming of isooctane over the temperature range of 500-800ºC in the presence of the various transition metals supported on CGO. Near equilibrium yields of H2 are observed for all five metals supported on CGO at ~700°. The H2 yields for three noble metals (Pt-11.4 moles of H2 per mole of isooctane in the feed, Ru-11.4 moles of H2 per mole of isooctane in the feed, Rh-10.9 moles of H2 per mole of isooctane in the feed) were slightly higher than the H2 yield for the non-noble metals (Ni - 10.3 moles of H2 per mole of isooctane in the feed and Co - 10.3 moles of H2 per mole of isooctane in the feed). Although the H2 yields for the non-noble metals were slightly less than the H2 yields for the noble metals, there is considerable interest in a non-noble metal catalyst from a cost viewpoint. For all metals, the conversion of isooctane was >99% at temperatures above 700ºC. At temperatures below 600°C, the H2 yields for Ru, Rh, and Ni were significantly higher than the H2 yields for Pt or Co. Generally, Rh, Ru, and Ni are considered to be more active than Pt or Co for steam reforming.9
0
2
4
6
8
10
12
14
500 600 700 800
Temperature, oC
H2 Y
ield
, mol
es/m
ole i -
C8
RhRu
NiPt
Figure 1. H2 yield (moles of H2/mole of i-C8 in the feed) as a function of temperature for autothermal reforming of isooctane (O2:C=0.5, H2O:C=1.1) catalyzed by various transition metals supported on CGO. The gas-hourly space velocities ranged from 5,000-19,000 h-1.
0
2
4
6
8
10
12
14
400 500 600 700 800
Temperature, oC
Yiel
d, m
oles
/mol
es -C
8
0
20
40
60
80
100
Con
vers
ion,
%
H2
CO
CO2
CH4
Conversion
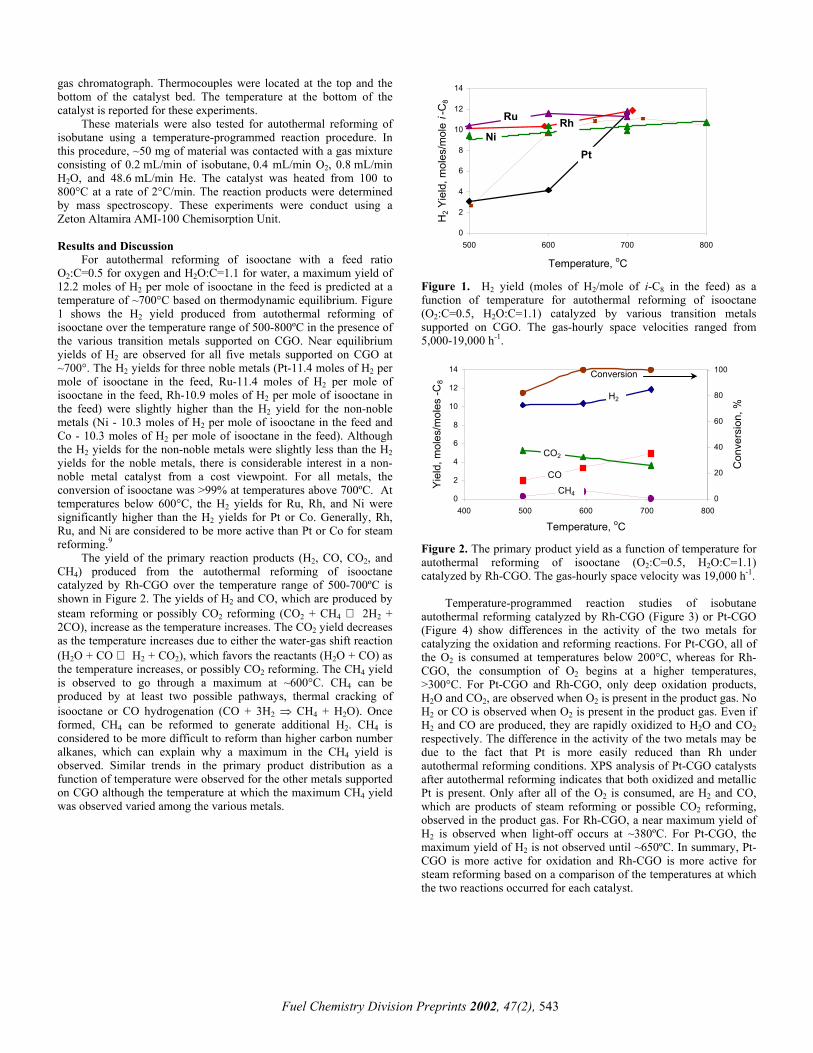
Figure 2. The primary product yield as a function of temperature for autothermal reforming of isooctane (O2:C=0.5, H2O:C=1.1) catalyzed by Rh-CGO. The gas-hourly space velocity was 19,000 h-1.
The yield of the primary reaction products (H2, CO, CO2, and CH4) produced from the autothermal reforming of isooctane catalyzed by Rh-CGO over the temperature range of 500-700ºC is shown in Figure 2. The yields of H2 and CO, which are produced by steam reforming or possibly CO2 reforming (CO2 + CH4 ⇔ 2H2 + 2CO), increase as the temperature increases. The CO2 yield decreases as the temperature increases due to either the water-gas shift reaction (H2O + CO ⇔ H2 + CO2), which favors the reactants (H2O + CO) as the temperature increases, or possibly CO2 reforming. The CH4 yield is observed to go through a maximum at ~600°C. CH4 can be produced by at least two possible pathways, thermal cracking of isooctane or CO hydrogenation (CO + 3H2 ⇒ CH4 + H2O). Once formed, CH4 can be reformed to generate additional H2. CH4 is considered to be more difficult to reform than higher carbon number alkanes, which can explain why a maximum in the CH4 yield is observed. Similar trends in the primary product distribution as a function of temperature were observed for the other metals supported on CGO although the temperature at which the maximum CH4 yield was observed varied among the various metals.
Temperature-programmed reaction studies of isobutane
autothermal reforming catalyzed by Rh-CGO (Figure 3) or Pt-CGO (Figure 4) show differences in the activity of the two metals for catalyzing the oxidation and reforming reactions. For Pt-CGO, all of the O2 is consumed at temperatures below 200°C, whereas for Rh-CGO, the consumption of O2 begins at a higher temperatures, >300°C. For Pt-CGO and Rh-CGO, only deep oxidation products, H2O and CO2, are observed when O2 is present in the product gas. No H2 or CO is observed when O2 is present in the product gas. Even if H2 and CO are produced, they are rapidly oxidized to H2O and CO2 respectively. The difference in the activity of the two metals may be due to the fact that Pt is more easily reduced than Rh under autothermal reforming conditions. XPS analysis of Pt-CGO catalysts after autothermal reforming indicates that both oxidized and metallic Pt is present. Only after all of the O2 is consumed, are H2 and CO, which are products of steam reforming or possible CO2 reforming, observed in the product gas. For Rh-CGO, a near maximum yield of H2 is observed when light-off occurs at ~380ºC. For Pt-CGO, the maximum yield of H2 is not observed until ~650ºC. In summary, Pt-CGO is more active for oxidation and Rh-CGO is more active for steam reforming based on a comparison of the temperatures at which the two reactions occurred for each catalyst.
Fuel Chemistry Division Preprints 2002, 47(2), 543

(6) Krumpelt, M.; Ahmed, S.; Kumar, R.; Doshi, R. 2000, U.S. Patent 6,110,861.
0.0
0.2
0.4
0.6
0.8
1.0
1.2
100 200 300 400 500 600 700 800
Temperature (oC)
Prod
uct Y
ield
, mL/
min
H2O
CO
CO2
H2O2
C4H10
(7) Trovarelli, A. Catal. Rev.-Sci. Eng., 1996, 38(4), 439. (8) Ilett, D. J.; Islam, M.S. Chem. Soc., Faraday Trans., 1993, 89(20),
3833. (9) Farrauto, R. J.; Bartholomew, C. H., In Fundamentals of Industrial
Catalytic Processes; Blackie Academic & Professional Publishers: London, 1997, pp. 348-349.
Figure 3. Primary product yield for autothermal reforming of isobutane (O2:C=0.5, H2O:C=1.0) catalyzed by Rh-CGO using temperature-programmed reaction. The temperature ramp rate is 2°C/min.
0.0
0.2
0.4
0.6
0.8
1.0
1.2
1.4
100 200 300 400 500 600 700 800
Temperature (oC)
Prod
uct Y
ield
, mL/
min H2O
COCO2
H2O2
C4H10
Figure 4. Primary product yield for autothermal reforming of isobutane (O2:C=0.5, H2O:C=1.0) catalyzed by Pt-CGO using temperature-programmed reaction. The temperature ramp rate is 2°C/min. Conclusions Catalysts consisting of a Group VIII transition metal, (Ni, Co, Rh, Ru, or Pt) supported on CGO were shown to produce near equilibrium yields of H2 at ~700ºC for the autothermal reforming of isooctane under the reaction conditions investigated. Temperature-programmed reaction studies of the autothermal reforming of isobutane catalyzed by these materials showed that the metals exhibited different activities for the oxidation and steam reforming reactions. Oxidation reactions were observed to occur at a lower temperature on Pt-CGO compared to Rh-CGO; however, steam reforming reactions were observed to occur at lower temperature on Rh-CGO compared to Pt-CGO.
Acknowledgement. This work was supported by the U.S. Department of Energy, Office of Transportation Technologies Office of Advanced Automotive Technologies under Contract W-31-109-ENG-38. References (1) Carrette, L.; Friedrich, K. A.; Stimming, U. Fuel Cells, 2001, 1(1), 5. (2) Ranabm, V. Chem. Ind. 1997, 771. (3) Arthur D. Little, Inc., Multifuel Reformers for Fuel Cells Used in
Transportation - Assessment of Hydrogen Storage Technologies, U.S. Department of Energy, DOE/CE/50343-1, 1994.
(4) Kumar, R.; Ahmed, S.; Krumpelt, M.; Myles, K. M., 1993, U.S. Patent 5,248,566.
(5) Ahmed, S.; Krumpelt, M. Int. J. of Hydrogen Energy, 2001, 26(4), 291.
Fuel Chemistry Division Preprints 2002, 47(2), 544

CATALYTIC REFORMING OF HYDROCARBONS FOR FUEL CELL APPLICATIONS
Yanlong Shi, Carlo Cioffi, Senquan Gao, Craig Thompson,
Prashant Chintawar, and James Cross III
Nuvera Fuel Cells, Inc. Acorn Park, Cambridge, MA 02140
Introduction Fuel processing is a conversion of primary fuel supplied to the system into a hydrogen-rich gas (reformate) required by the fuel cell stack. Most commonly used fuel processing technologies include steam reforming (SR), partial oxidation (POX), or autothermal reforming (ATR).
The key challenge in steam reforming is that heat must be transferred from an external source through the reactor walls and throughout the catalyst bed to provide energy for the strongly endothermic reaction. To achieve complete conversion, reforming temperatures of 700 °C or higher are required. In addition, another challenge of steam reforming of liquid hydrocarbon fuels is carbon formation. Molar steam-to-carbon ratios (S/C) of 3 - 4 or sometimes higher are typical for conventional steam reformers.
Since POX is exothermic it doesn’t require external heat input, therefore it is a simpler process than steam reforming. However, compared to steam reforming there is less hydrogen produced per mole of fuel in a POX reactor.
Autothermal reforming (ATR) offers an advantageous alternative to steam reforming and POX for H2 production for fuel cell applications because ATR has the advantages of both partial oxidation and steam reforming without most of the disadvantages.
Nuvera Fuel Cells has been developing both catalytic ATR and SR technologies for use in fuel processing for fuel cell applications. The major effort on ATR technology development is for transportation applications, and SR technologies have been developed for stationary use. The investigated parameters include catalyst formulation, catalyst substrate, fuel type, fuel/air for ATR, steam/carbon, sulfur deactivation, pressure and space velocity, and preheat and reactor temperature. The tested fuels include natural gas, propane, S-free gasoline and S-containing gasoline (California Phase II), naphtha and alcohols.
Experimental The experiments were carried out in a specifically designed micro-reactor system, in which the reactor was heated by an electrically heated furnace and maintained at the desired temperature (400 - 900 oC) and suitably insulated to reduce heat losses. The thermocouples located above and below the catalyst measured the temperature at the catalyst inlet and outlet, respectively. In ATR of fuels, the water and air were preheated together, and the gasoline was preheated separately. Then the preheated air, water and fuel were mixed before contacting the catalyst. In SR of fuels, the fuel and water were first vaporized, then mixed and preheated. The amounts of steam, air and fuels introduced to either ATR or SR process were controlled either by mass flow controllers for gas feedstock or HPLC pumps for liquid feedstock to provide a selected molar ratio of H2O to C. Equivalence Ratio, Φ, was varied by changing the fuel/air ratio (Φ = (fuel/oxygen)real/(fuel /oxygen)stoichiometric). All of the oxygen introduced with the air was consumed completely. The catalysts were tested under the wet gas hour space velocities (WGHSV) of 3,000 h-1 - 80,000 h-1. The
temperature difference between catalyst inlet and outlet varied, depending on the WGHSV and the catalyst bed temperature. The higher catalyst inlet temperature is due to the dominating effect of oxidation at the top part of the catalyst, which is an exothermic process. The temperature decrease along the length of the catalyst is due to the endothermic steam reforming reaction. The product gas was cooled and the un-reacted water (and some un-reacted hydrocarbons at lower reaction temperature) was condensed. The dry gas compositions were measured by GC. An un-cooled slip stream of product was introduced simultaneously to a GC/MS for residual fuel and by-product analyses.
Results and Discussion ATR and SR of Methane and Natural Gas. In order to explore
the best ATR catalyst for the fuel processor for transportation applications, ten catalysts from different sources were tested. The parameters for the optimization included catalyst formulation, support substrate (varying substrate composition, structures and cell density), preheat temperature, sulfur concentration in the fuels, WGHSV (10,000 - 80,000 h-1) and catalyst temperature. The kinetics, thermal stability, and transient behavior were also studied. Some results of the catalyst screening of methane ATR are summarized in Figure 1.
70
75
80
85
90
95
100
600 650 700 750 800 850 900Catalyst Outlet Temperature, oC
Con
vers
ion,
%
A B C
D E F
G
WGHSV: 20,000 h-1
Φ = 3.9S/C = 1.8pure CH4
Figure 1. Comparison of ATR of methane with different catalysts
The product gas composition from ATR of methane using an ATR catalyst developed by Nuvera Fuel Cells at WGHSV = 10,000 h-1 is shown in Figure 2, in which N2 from air was a GC marker, and the concentrations have been normalized without N2.
Methane ATR is a complicated reaction system involving many reactions, including partial oxidation, complete oxidation, steam reforming, CO2 reforming of methane, reversible steam reforming, and reversible Water Gas Shift reactions. The empirical kinetic equations determined for the steps of complete oxidation and steam reforming, respectively, using a precious metal, metallic monolith-based ATR catalyst are expressed as follows:
r = A e-15,500/T CCH40.63 CO2
0.13 CH2O-0.17 [mol/hr.in3] (for oxidation)
r = A e-7,817/T CCH40.17 CH2O
0.28 (a -106 CCO) / (b + c CH2)7.0 (d + e CCO2)0.35 [mol/hr.in3] (for steam reforming, a, b, c, d and e are constants).
ATR of Gasoline. We have extensively investigated the ATR of gasoline by varying the process parameters mentioned earlier to meet
Fuel Chemistry Division Preprints 2002, 47(2), 545
01020304050607080
450 550 650 750 850
Average Temperature of Catalyst Inlet and Outlet, oC
Prod
uct v
ol.%
, (D
ry-b
ased
& N
2
free
)
H2
CO
CO2
ATR of Methane
Φ = 3.9 WGHSV = 10,000 hr-1
S/C = 1.8 (representative) 3
CH4
Equilibrum
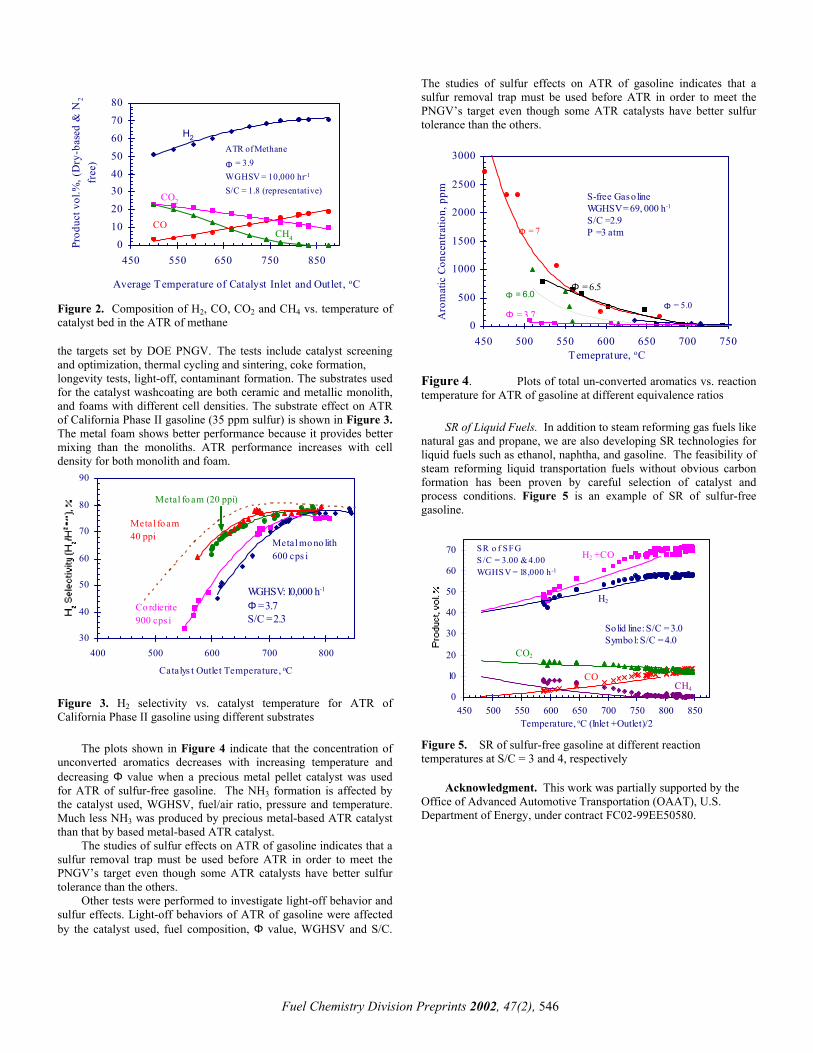
Figure 2. Composition of H2, CO, CO2 and CH4 vs. temperature of catalyst bed in the ATR of methane the targets set by DOE PNGV.. The tests include catalyst screening and optimization, thermal cycling and sintering, coke formation, longevity tests, light-off, contaminant formation. The substrates used for the catalyst washcoating are both ceramic and metallic monolith, and foams with different cell densities. The substrate effect on ATR of California Phase II gasoline (35 ppm sulfur) is shown in Figure 3. The metal foam shows better performance because it provides better mixing than the monoliths. ATR performance increases with cell density for both monolith and foam.
30
40
50
60
70
80
90
400 500 600 700 800
Catalys t Outlet Temperature, oC
Co rdierite900 cps i
WGHSV: 10,000 h-1
Φ = 3.7S/C = 2.3
Metal fo am (20 ppi)
Metal fo am40 ppi
Metal mo no lith600 cps i
Figure 3. H2 selectivity vs. catalyst temperature for ATR of California Phase II gasoline using different substrates
The plots shown in Figure 4 indicate that the concentration of unconverted aromatics decreases with increasing temperature and decreasing Φ value when a precious metal pellet catalyst was used for ATR of sulfur-free gasoline. The NH3 formation is affected by the catalyst used, WGHSV, fuel/air ratio, pressure and temperature. Much less NH3 was produced by precious metal-based ATR catalyst than that by based metal-based ATR catalyst.
The studies of sulfur effects on ATR of gasoline indicates that a sulfur removal trap must be used before ATR in order to meet the PNGV’s target even though some ATR catalysts have better sulfur tolerance than the others.
Other tests were performed to investigate light-off behavior and sulfur effects. Light-off behaviors of ATR of gasoline were affected by the catalyst used, fuel composition, Φ value, WGHSV and S/C.
The studies of sulfur effects on ATR of gasoline indicates that a sulfur removal trap must be used before ATR in order to meet the PNGV’s target even though some ATR catalysts have better sulfur tolerance than the others.
0
500
1000
1500
2000
2500
3000
450 500 550 600 650 700 750Temeprature, oC
Aro
mat
ic C
once
ntra
tion,
ppm
Φ = 7
Φ = 6.5
Φ = 3.7Φ = 5.0
S-free GasolineWGHSV = 69, 000 h-1
S/C =2.9P =3 atm
Φ = 6.0
Figure 4. Plots of total un-converted aromatics vs. reaction temperature for ATR of gasoline at different equivalence ratios SR of Liquid Fuels. In addition to steam reforming gas fuels like natural gas and propane, we are also developing SR technologies for liquid fuels such as ethanol, naphtha, and gasoline. The feasibility of steam reforming liquid transportation fuels without obvious carbon formation has been proven by careful selection of catalyst and process conditions. Figure 5 is an example of SR of sulfur-free gasoline.
0
10
20
30
40
50
60
70
450 500 550 600 650 700 750 800 850Temperature, oC (Inlet + Outlet)/2
H2 + CO
H2
CO2
COCH4
SR o f SFG S/C = 3.00 & 4.00WGHSV = 18,000 h-1
Solid line: S/C = 3.0Symbol: S/C = 4.0
Figure 5. SR of sulfur-free gasoline at different reaction temperatures at S/C = 3 and 4, respectively
Acknowledgment. This work was partially supported by the
Office of Advanced Automotive Transportation (OAAT), U.S. Department of Energy, under contract FC02-99EE50580.
Fuel Chemistry Division Preprints 2002, 47(2), 546
CATHODE MATERIALS FOR INTERMEDIATE TEMPERATURE SOLID OXIDE FUEL CELLS
Results and Discussion Initial experiments focused on the synthesis and electrical
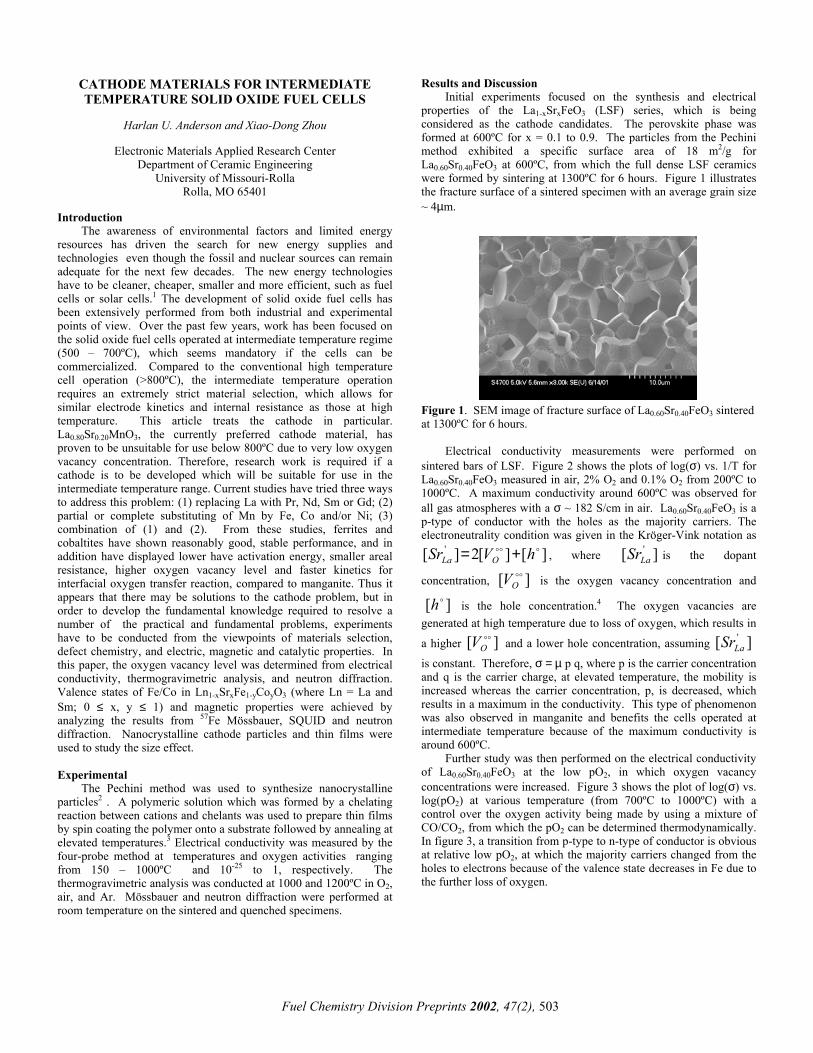
properties of the La1-xSrxFeO3 (LSF) series, which is being considered as the cathode candidates. The perovskite phase was formed at 600ºC for x = 0.1 to 0.9. The particles from the Pechini method exhibited a specific surface area of 18 m2/g for La0.60Sr0.40FeO3 at 600ºC, from which the full dense LSF ceramics were formed by sintering at 1300ºC for 6 hours. Figure 1 illustrates the fracture surface of a sintered specimen with an average grain size ~ 4µm.
Harlan U. Anderson and Xiao-Dong Zhou
Electronic Materials Applied Research Center
Department of Ceramic Engineering University of Missouri-Rolla
Rolla, MO 65401 Introduction
The awareness of environmental factors and limited energy resources has driven the search for new energy supplies and technologies even though the fossil and nuclear sources can remain adequate for the next few decades. The new energy technologies have to be cleaner, cheaper, smaller and more efficient, such as fuel cells or solar cells.1 The development of solid oxide fuel cells has been extensively performed from both industrial and experimental points of view. Over the past few years, work has been focused on the solid oxide fuel cells operated at intermediate temperature regime (500 – 700ºC), which seems mandatory if the cells can be commercialized. Compared to the conventional high temperature cell operation (>800ºC), the intermediate temperature operation requires an extremely strict material selection, which allows for similar electrode kinetics and internal resistance as those at high temperature. This article treats the cathode in particular. La0.80Sr0.20MnO3, the currently preferred cathode material, has proven to be unsuitable for use below 800ºC due to very low oxygen vacancy concentration. Therefore, research work is required if a cathode is to be developed which will be suitable for use in the intermediate temperature range. Current studies have tried three ways to address this problem: (1) replacing La with Pr, Nd, Sm or Gd; (2) partial or complete substituting of Mn by Fe, Co and/or Ni; (3) combination of (1) and (2). From these studies, ferrites and cobaltites have shown reasonably good, stable performance, and in addition have displayed lower have activation energy, smaller areal resistance, higher oxygen vacancy level and faster kinetics for interfacial oxygen transfer reaction, compared to manganite. Thus it appears that there may be solutions to the cathode problem, but in order to develop the fundamental knowledge required to resolve a number of the practical and fundamental problems, experiments have to be conducted from the viewpoints of materials selection, defect chemistry, and electric, magnetic and catalytic properties. In this paper, the oxygen vacancy level was determined from electrical conductivity, thermogravimetric analysis, and neutron diffraction. Valence states of Fe/Co in Ln1-xSrxFe1-yCoyO3 (where Ln = La and Sm; 0 ≤ x, y ≤ 1) and magnetic properties were achieved by analyzing the results from 57Fe Mössbauer, SQUID and neutron diffraction. Nanocrystalline cathode particles and thin films were used to study the size effect.
Figure 1. SEM image of fracture surface of La0.60Sr0.40FeO3 sintered at 1300ºC for 6 hours.
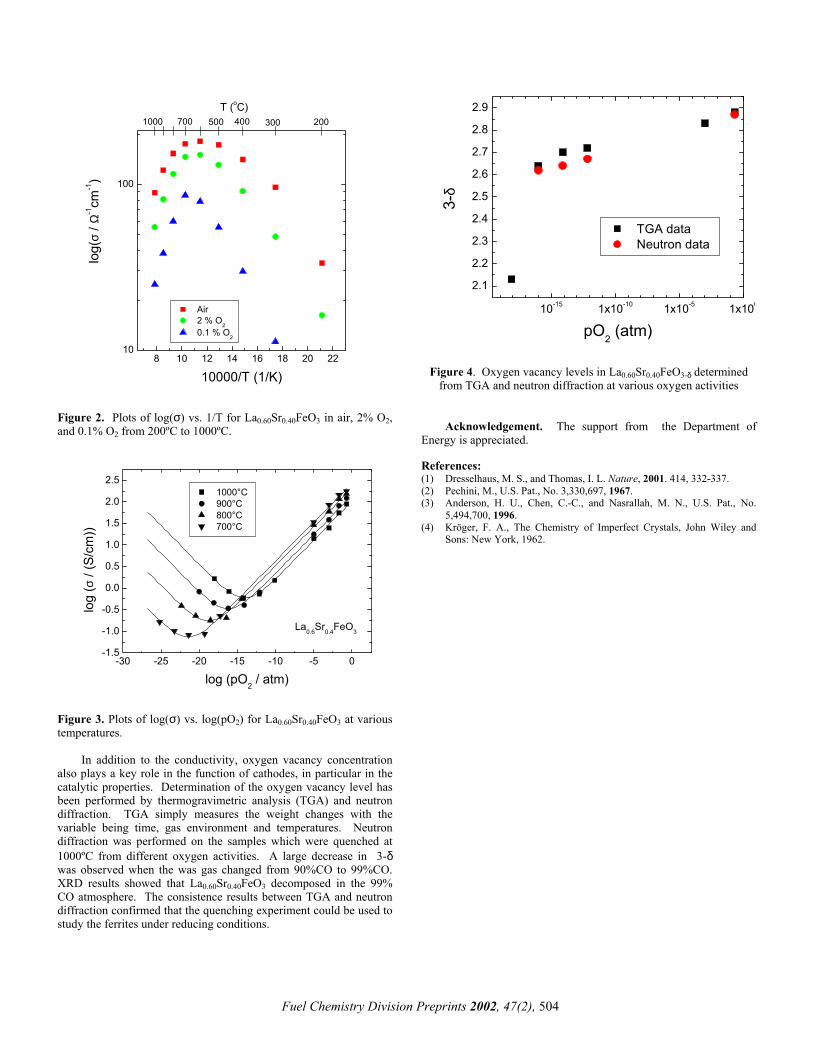
Electrical conductivity measurements were performed on sintered bars of LSF. Figure 2 shows the plots of log(σ) vs. 1/T for La0.60Sr0.40FeO3 measured in air, 2% O2 and 0.1% O2 from 200ºC to 1000ºC. A maximum conductivity around 600ºC was observed for all gas atmospheres with a σ ~ 182 S/cm in air. La0.60Sr0.40FeO3 is a p-type of conductor with the holes as the majority carriers. The electroneutrality condition was given in the Kröger-Vink notation as
, where [ is the dopant
concentration, is the oxygen vacancy concentration and
is the hole concentration.
][][2][ ' ooo hVSr OLa +=][ oo
OV][ oh
]ooOV
]'LaSr
4 The oxygen vacancies are generated at high temperature due to loss of oxygen, which results in
a higher [ and a lower hole concentration, assuming [
is constant. Therefore, σ = µ p q, where p is the carrier concentration and q is the carrier charge, at elevated temperature, the mobility is increased whereas the carrier concentration, p, is decreased, which results in a maximum in the conductivity. This type of phenomenon was also observed in manganite and benefits the cells operated at intermediate temperature because of the maximum conductivity is around 600ºC.
]'LaSr
Further study was then performed on the electrical conductivity of La0.60Sr0.40FeO3 at the low pO2, in which oxygen vacancy concentrations were increased. Figure 3 shows the plot of log(σ) vs. log(pO2) at various temperature (from 700ºC to 1000ºC) with a control over the oxygen activity being made by using a mixture of CO/CO2, from which the pO2 can be determined thermodynamically. In figure 3, a transition from p-type to n-type of conductor is obvious at relative low pO2, at which the majority carriers changed from the holes to electrons because of the valence state decreases in Fe due to the further loss of oxygen.
Experimental
The Pechini method was used to synthesize nanocrystalline particles2 . A polymeric solution which was formed by a chelating reaction between cations and chelants was used to prepare thin films by spin coating the polymer onto a substrate followed by annealing at elevated temperatures.3 Electrical conductivity was measured by the four-probe method at temperatures and oxygen activities ranging from 150 – 1000ºC and 10-25 to 1, respectively. The thermogravimetric analysis was conducted at 1000 and 1200ºC in O2, air, and Ar. Mössbauer and neutron diffraction were performed at room temperature on the sintered and quenched specimens.
Fuel Chemistry Division Preprints 2002, 47(2), 503
Fuel Chemistry Division Preprints 2002, 47(2), 504
Figure 2. Plots of log(σ) vs. 1/T for La0.60Sr0.40FeO3 in air, 2% O2, and 0.1% O2 from 200ºC to 1000ºC.
8 10 12 14 16 18 20 2210
100
T (oC)1000 700 500 400 300 200
log(
σ / Ω
-1cm
-1)
10000/T (1/K)
Air 2 % O2 0.1 % O2
10-15 1x10⁻¹⁰ 1x10⁻⁵ 1x100
2.1
2.2
2.3
2.4
2.5
2.6
2.7
2.8
2.9
3-δ
pO2 (atm)
TGA data Neutron data
Figure 4. Oxygen vacancy levels in La0.60Sr0.40FeO3-δ determined
from TGA and neutron diffraction at various oxygen activities
Acknowledgement. The support from the Department of Energy is appreciated.
Figure 3. Plots of log(σ) vs. log(pO2) for La0.60Sr0.40FeO3 at various temperatures.
-30 -25 -20 -15 -10 -5 0-1.5
-1.0
-0.5
0.0
0.5
1.0
1.5
2.0
2.5
La0.6Sr0.4FeO3
log
(σ /
(S/c
m))
log (pO2 / atm)
1000°C 900°C 800°C 700°C
References: (1) Dresselhaus, M. S., and Thomas, I. L. Nature, 2001. 414, 332-337. (2) Pechini, M., U.S. Pat., No. 3,330,697, 1967. (3) Anderson, H. U., Chen, C.-C., and Nasrallah, M. N., U.S. Pat., No.
5,494,700, 1996. (4) Kröger, F. A., The Chemistry of Imperfect Crystals, John Wiley and
Sons: New York, 1962.
In addition to the conductivity, oxygen vacancy concentration
also plays a key role in the function of cathodes, in particular in the catalytic properties. Determination of the oxygen vacancy level has been performed by thermogravimetric analysis (TGA) and neutron diffraction. TGA simply measures the weight changes with the variable being time, gas environment and temperatures. Neutron diffraction was performed on the samples which were quenched at 1000ºC from different oxygen activities. A large decrease in 3-δ was observed when the was gas changed from 90%CO to 99%CO. XRD results showed that La0.60Sr0.40FeO3 decomposed in the 99% CO atmosphere. The consistence results between TGA and neutron diffraction confirmed that the quenching experiment could be used to study the ferrites under reducing conditions.
Design Optimization and Simplification of PEM Fuel Cell Systems for Back Up Power Applications
Bhaskar Balasubramanian, Frano Barbir, Bob Byron, Spyros
Nomikos, and Matthew Stone
Proton Energy Systems 50 Inwood Road
Rocky Hill, CT 06067 Introduction
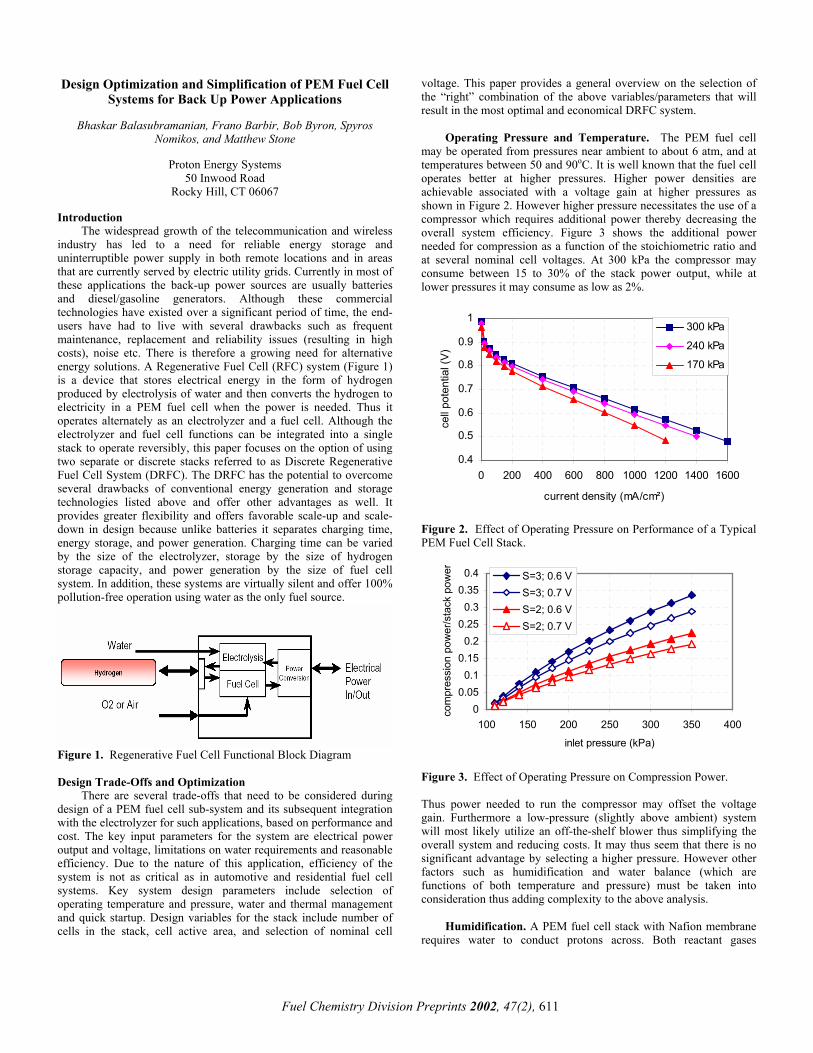
The widespread growth of the telecommunication and wireless industry has led to a need for reliable energy storage and uninterruptible power supply in both remote locations and in areas that are currently served by electric utility grids. Currently in most of these applications the back-up power sources are usually batteries and diesel/gasoline generators. Although these commercial technologies have existed over a significant period of time, the end-users have had to live with several drawbacks such as frequent maintenance, replacement and reliability issues (resulting in high costs), noise etc. There is therefore a growing need for alternative energy solutions. A Regenerative Fuel Cell (RFC) system (Figure 1) is a device that stores electrical energy in the form of hydrogen produced by electrolysis of water and then converts the hydrogen to electricity in a PEM fuel cell when the power is needed. Thus it operates alternately as an electrolyzer and a fuel cell. Although the electrolyzer and fuel cell functions can be integrated into a single stack to operate reversibly, this paper focuses on the option of using two separate or discrete stacks referred to as Discrete Regenerative Fuel Cell System (DRFC). The DRFC has the potential to overcome several drawbacks of conventional energy generation and storage technologies listed above and offer other advantages as well. It provides greater flexibility and offers favorable scale-up and scale-down in design because unlike batteries it separates charging time, energy storage, and power generation. Charging time can be varied by the size of the electrolyzer, storage by the size of hydrogen storage capacity, and power generation by the size of fuel cell system. In addition, these systems are virtually silent and offer 100% pollution-free operation using water as the only fuel source.
Figure 1. Regenerative Fuel Cell Functional Block Diagram Design Trade-Offs and Optimization
There are several trade-offs that need to be considered during design of a PEM fuel cell sub-system and its subsequent integration with the electrolyzer for such applications, based on performance and cost. The key input parameters for the system are electrical power output and voltage, limitations on water requirements and reasonable efficiency. Due to the nature of this application, efficiency of the system is not as critical as in automotive and residential fuel cell systems. Key system design parameters include selection of operating temperature and pressure, water and thermal management and quick startup. Design variables for the stack include number of cells in the stack, cell active area, and selection of nominal cell
voltage. This paper provides a general overview on the selection of the “right” combination of the above variables/parameters that will result in the most optimal and economical DRFC system.
Operating Pressure and Temperature. The PEM fuel cell
may be operated from pressures near ambient to about 6 atm, and at temperatures between 50 and 90oC. It is well known that the fuel cell operates better at higher pressures. Higher power densities are achievable associated with a voltage gain at higher pressures as shown in Figure 2. However higher pressure necessitates the use of a compressor which requires additional power thereby decreasing the overall system efficiency. Figure 3 shows the additional power needed for compression as a function of the stoichiometric ratio and at several nominal cell voltages. At 300 kPa the compressor may consume between 15 to 30% of the stack power output, while at lower pressures it may consume as low as 2%.
0.4
0.5
0.6
0.7
0.8
0.9
1
0 200 400 600 800 1000 1200 1400 1600
current density (mA/cm²)
cell
pote
ntia
l (V)
300 kPa
240 kPa
170 kPa
Figure 2. Effect of Operating Pressure on Performance of a Typical PEM Fuel Cell Stack.
00.050.1
0.150.2
0.250.3
0.350.4
100 150 200 250 300 350 400
inlet pressure (kPa)
com
pres
sion
pow
er/s
tack
pow
er S=3; 0.6 VS=3; 0.7 VS=2; 0.6 VS=2; 0.7 V
Figure 3. Effect of Operating Pressure on Compression Power. Thus power needed to run the compressor may offset the voltage gain. Furthermore a low-pressure (slightly above ambient) system will most likely utilize an off-the-shelf blower thus simplifying the overall system and reducing costs. It may thus seem that there is no significant advantage by selecting a higher pressure. However other factors such as humidification and water balance (which are functions of both temperature and pressure) must be taken into consideration thus adding complexity to the above analysis.
Humidification. A PEM fuel cell stack with Nafion membrane requires water to conduct protons across. Both reactant gases
Fuel Chemistry Division Preprints 2002, 47(2), 611

(hydrogen and air) typically need to be humidified at the inlet in order to prevent the membrane from drying out. The vapor pressure of water in gas is an exponentially increasing function of temperature. Also the amount of water and heat required for humidification is higher at lower pressures. Therefore water management in the system might pose a significant challenge particularly under these conditions. However with a clever stack design and wise selection of operating temperature and pressure humidification requirements might be relaxed or even eliminated. Figure 4 shows the minimum level of humidification needed of the cathode inlet air in order to maintain at least a saturated gas at the cathode exit. Percent wetness is defined as the ratio of the amount of liquid water to the total water content in the cathode exhaust gas. It can thus be seen that at temperatures at or below 60oC theoretically no humidification of air is required; the product water is sufficient to completely saturate the exhaust gas. Higher temperatures require some amount of humidification, for example, for a stack operating at 65oC the inlet air must be humidified to at least 70% RH in order to maintain a minimal amount of wetness in the cathode exhaust. Thus a wise selection of operating temperature and pressure may relax humidification requirements and simplify the overall system.
0
5
10
15
20
25
30
35
40
45
50
10 20 30 40 50 60 70 80 90 100
% Relative Humidity of Air at Cathode Inlet
% W
etnes
s in
Cat
hode
Outlet
(Li
quid
Wat
er/T
ota
l W
ater
)
50 C
55 C
60 C
65 C
70 C
Figure 4. Effect of Humidification of Air at Cathode Inlet on the Wetness of Gas at Cathode Outlet at various fuel cell temperatures. Although this may seem straightforward the water balance in the stack is further complicated by water crossover: from anode to cathode due to the electro-osmotic drag, and from cathode to anode due to back-diffusion caused by concentration gradients. With thin membranes this can be overcome, but this is also a function of cell design, temperature distribution in the fuel cell, and properties of gas diffusion layer and MEA.
Water Management. Water is consumed in the electrolysis process for hydrogen production. The hydrogen and oxygen gases generated during electrolysis are fully saturated with water vapor. Prior to storage hydrogen is dried and water is recovered. Since oxygen is a by-product it is simply vented and therefore a small amount of water is lost during this purge. The same amount of water that was consumed in the electrolysis process is theoretically produced in the fuel cell. The fuel cell also needs water for humidification of reactant gases. Depending on the operating conditions of the fuel cell water may exit the stack as vapor only or as a mixture of vapor and liquid. Water that exits the fuel cell as liquid can directly be separated and recovered from the cathode exhaust gas in simple knock-out water separators. However depending on the cathode exhaust gas conditions, a significant
amount of water may escape in the form of vapor and a condenser might be required to cool the exhaust gas and recover the water. Although neutral water balance is not as critical for backup power applications as compared to automotive it is essential to minimize water losses so as to have sufficient water available for the complete duration of operation of the DRFC system. A typical duration of a 2 kW DRFC system is about 200 hours a year with annual maintenance.
Figure 5 shows the effect of the fuel cell operating temperature on the water balance of the fuel cell subsystem and the overall DRFC subsystem. It can be seen that at temperatures at or below 55oC there is a positive water balance maintained in the fuel cell subsystem. This is because at this low temperature most of the product water in the fuel cell exists as liquid droplets and can be directly recovered without additional cooling. At higher temperatures the cathode exhaust gas has greater capacity of retaining moisture and carries greater amounts of water vapor as it exits the fuel cell stack resulting in a negative water balance in the system. It can also be seen that water balance worsens with higher humidification requirements particularly at higher temperatures and an exhaust gas condenser may be needed to minimize the water loss. It is important to note however that there is always some water loss in the overall DRFC system even at the low temperatures that may not be completely recovered even with an exhaust condenser. However as mentioned before water balance requirements for backup power applications are not as critical as compared to automotive systems, and can be minimized by proper sizing of the water reservoir and by operating the system at relatively lower temperatures or by cooling the exhaust gas.
-0.6
-0.5
-0.4
-0.3
-0.2
-0.1
0
0.1
50 55 60 65 70 75 80 85
Fuel Cell Temperature, deg C
Figure 5. Effect of Fuel Cell Temperature on System Water Balance at Different Humidification Levels, Without Using An Exhaust Gas Condenser.
Fuel Cell Subsystem
50% RH DRFC System
60% 70% 80%
90%
100%
Nominal Cell Voltage and Stack Size. The selection of
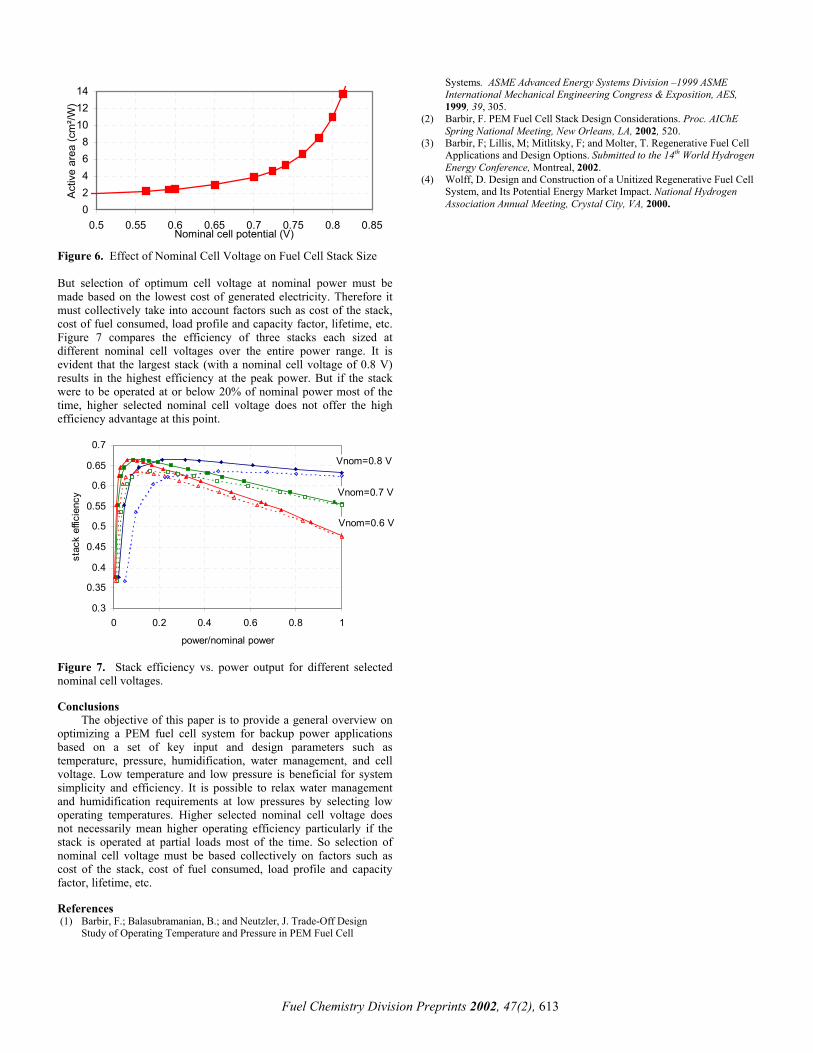
nominal operating point has a direct impact on the fuel cell stack and efficiency. It can be selected on any point along the polarization curve of Figure 2. The power density (which is the product of cell voltage and current density) is higher at lower cell voltages resulting in a smaller stack size and vice versa at higher cell voltages. Figure 6 shows the effect of nominal cell voltage on the size of the stack. It is evident from above that a stack designed to operate at a nominal cell voltage of 0.7 V would require twice the active area as that sized to operate at 0.5 V per cell thus increasing the equipment cost. However a higher cell voltage results in a higher efficiency and decreases fuel consumption.
Fuel Chemistry Division Preprints 2002, 47(2), 612
02468
101214
0.5 0.55 0.6 0.65 0.7 0.75 0.8 0.85Nominal cell potential (V)
Activ
e ar
ea (c
m²/W
)
Figure 6. Effect of Nominal Cell Voltage on Fuel Cell Stack Size
Fuel Chemistry Division Preprints 2002, 47(2), 613
But selection of optimum cell voltage at nominal power must be made based on the lowest cost of generated electricity. Therefore it must collectively take into account factors such as cost of the stack, cost of fuel consumed, load profile and capacity factor, lifetime, etc. Figure 7 compares the efficiency of three stacks each sized at different nominal cell voltages over the entire power range. It is evident that the largest stack (with a nominal cell voltage of 0.8 V) results in the highest efficiency at the peak power. But if the stack were to be operated at or below 20% of nominal power most of the time, higher selected nominal cell voltage does not offer the high efficiency advantage at this point.
0.3
0.35
0.4
0.45
0.5
0.55
0.6
0.65
0.7
0 0.2 0.4 0.6 0.8 1
power/nominal power
stac
k ef
ficie
ncy
Vnom=0.8 V
Vnom=0.7 V
Vnom=0.6 V
Figure 7. Stack efficiency vs. power output for different selected nominal cell voltages. Conclusions
The objective of this paper is to provide a general overview on optimizing a PEM fuel cell system for backup power applications based on a set of key input and design parameters such as temperature, pressure, humidification, water management, and cell voltage. Low temperature and low pressure is beneficial for system simplicity and efficiency. It is possible to relax water management and humidification requirements at low pressures by selecting low operating temperatures. Higher selected nominal cell voltage does not necessarily mean higher operating efficiency particularly if the stack is operated at partial loads most of the time. So selection of nominal cell voltage must be based collectively on factors such as cost of the stack, cost of fuel consumed, load profile and capacity factor, lifetime, etc. References (1) Barbir, F.; Balasubramanian, B.; and Neutzler, J. Trade-Off Design
Study of Operating Temperature and Pressure in PEM Fuel Cell
Systems. ASME Advanced Energy Systems Division –1999 ASME International Mechanical Engineering Congress & Exposition, AES, 1999, 39, 305.
(2) Barbir, F. PEM Fuel Cell Stack Design Considerations. Proc. AIChE Spring National Meeting, New Orleans, LA, 2002, 520.
(3) Barbir, F; Lillis, M; Mitlitsky, F; and Molter, T. Regenerative Fuel Cell Applications and Design Options. Submitted to the 14th World Hydrogen Energy Conference, Montreal, 2002.
(4) Wolff, D. Design and Construction of a Unitized Regenerative Fuel Cell System, and Its Potential Energy Market Impact. National Hydrogen Association Annual Meeting, Crystal City, VA, 2000.
Direct Conversion of Hydrocarbons in Solid Oxide Fuel Cells: A review.
Mogens Mogensen Materials Research Department, Risoe National Laboratory, DK-
4000 Roskilde e-mail: [email protected]
Extended abstract Recently sensational papers about direct oxidation of methane and hydrocarbon in solid oxide fuel cells (SOFC) at relative low temperatures about 700°C were published [i,ii]. Even though the conversion of almost dry CH4 on ceramic anodes were demonstrated more than 10 years ago [iii -v] at 1000°C the reports about high current densities for methane oxidation at such low temperatures are indeed surprising. In both papers in Nature a catalytic effect (due to the mixed ionic and electronic conductivity) of CeO2-x is given as part of the explanation behind these results. However, this seems to be in contradiction to previous reports, and thus, this issue deserves further analysis. Murray and Barnett [i,vi] reported a power density of 0.37 W/cm2 at 650°C for an SOFC using a 2µm Ni-YSZ cermet on top of a 0.5µm functional layer of (Y2O3)0.15(CeO2)0.85 (YDC) between the cermet and the YSZ electrolyte. It was also shown [vi] that the polarisation resistance of the YSZ cermet without the YDC-layer was about 6 times higher. The result was interpreted as a direct electrochemical oxidation of CH4 facilitated by the YDC. This interpretation is in contrast to the findings that doped ceria in itself is about inert to direct oxidation of CH4 [vii].
-0,2
-0,1
0
0,1
0,2
0,3
0,4
-0,2 0 0,2 0,4 0,6 0,8 1 1,2
Overpotential (V)
-1 -0,8 -0,6 -0,4 -0,2 0 0,2 0,4
Potential vs. Pt/air (V)
Cur
rent
den
sity
(A/c
m2 )
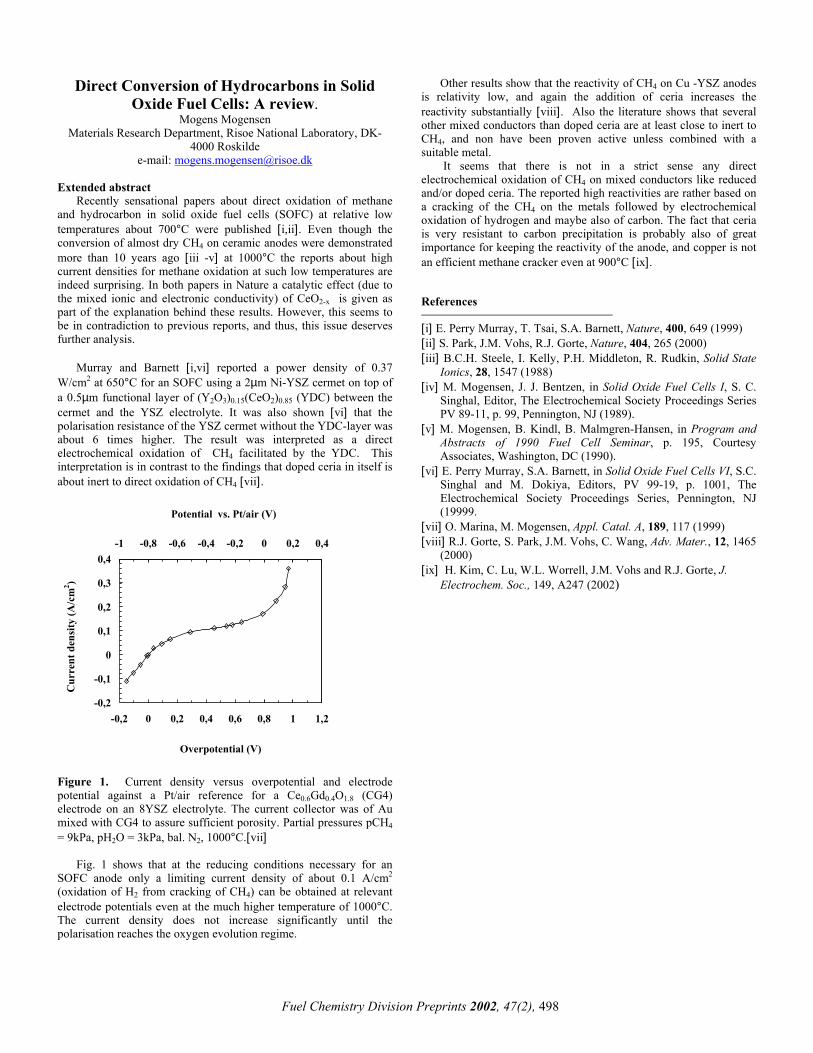
Figure 1. Current density versus overpotential and electrode potential against a Pt/air reference for a Ce0.6Gd0.4O1.8 (CG4) electrode on an 8YSZ electrolyte. The current collector was of Au mixed with CG4 to assure sufficient porosity. Partial pressures pCH4 = 9kPa, pH2O = 3kPa, bal. N2, 1000°C.[vii] Fig. 1 shows that at the reducing conditions necessary for an SOFC anode only a limiting current density of about 0.1 A/cm2 (oxidation of H2 from cracking of CH4) can be obtained at relevant electrode potentials even at the much higher temperature of 1000°C. The current density does not increase significantly until the polarisation reaches the oxygen evolution regime.
Other results show that the reactivity of CH4 on Cu -YSZ anodes is relativity low, and again the addition of ceria increases the reactivity substantially [viii]. Also the literature shows that several other mixed conductors than doped ceria are at least close to inert to CH4, and non have been proven active unless combined with a suitable metal. It seems that there is not in a strict sense any direct electrochemical oxidation of CH4 on mixed conductors like reduced and/or doped ceria. The reported high reactivities are rather based on a cracking of the CH4 on the metals followed by electrochemical oxidation of hydrogen and maybe also of carbon. The fact that ceria is very resistant to carbon precipitation is probably also of great importance for keeping the reactivity of the anode, and copper is not an efficient methane cracker even at 900°C [ix].
References
[i] E. Perry Murray, T. Tsai, S.A. Barnett, Nature, 400, 649 (1999) [ii] S. Park, J.M. Vohs, R.J. Gorte, Nature, 404, 265 (2000) [iii] B.C.H. Steele, I. Kelly, P.H. Middleton, R. Rudkin, Solid State
Ionics, 28, 1547 (1988) [iv] M. Mogensen, J. J. Bentzen, in Solid Oxide Fuel Cells I, S. C.
Singhal, Editor, The Electrochemical Society Proceedings Series PV 89-11, p. 99, Pennington, NJ (1989).
[v] M. Mogensen, B. Kindl, B. Malmgren-Hansen, in Program and Abstracts of 1990 Fuel Cell Seminar, p. 195, Courtesy Associates, Washington, DC (1990).
[vi] E. Perry Murray, S.A. Barnett, in Solid Oxide Fuel Cells VI, S.C. Singhal and M. Dokiya, Editors, PV 99-19, p. 1001, The Electrochemical Society Proceedings Series, Pennington, NJ (19999.
[vii] O. Marina, M. Mogensen, Appl. Catal. A, 189, 117 (1999) [viii] R.J. Gorte, S. Park, J.M. Vohs, C. Wang, Adv. Mater., 12, 1465
(2000) [ix] H. Kim, C. Lu, W.L. Worrell, J.M. Vohs and R.J. Gorte, J.
Electrochem. Soc., 149, A247 (2002)
Fuel Chemistry Division Preprints 2002, 47(2), 498
Direct Oxidation of Hydrocarbon Fuels that Contain Sulfur in a Solid Oxide Fuel Cell
H. Kim, R.M. Ferrizz, R.J. Gorte, and J.M. Vohs
Department of Chemical Engineering
University of Pennsylvania Philadelphia, PA 19104
Introduction
In previous studies we have demonstrated that hydrocarbon fuels can be directly utilized in solid oxide fuel cells that have anodes composed of mixtures of Cu, CeO2, and yttria-stabilized zirconia (YSZ)1-4. In this anode design the Cu is used exclusively as a current collector and the CeO2 provides the necessary catalytic activity for oxidation of the hydrocarbons. The YSZ is in the form of a porous matrix in which the Cu and CeO2 are supported and provides structural rigidity. Unlike conventional Ni-based anodes, this anode design has been shown to be highly resistant to carbon deposition while using dry hydrocarbon fuels.
Almost all hydrocarbon fuels contain some sulfur impurities. Since sulfur is known to poison many catalysts including ceria, it is important to know how small amounts of sulfur impurities in the fuel will affect the performance of direct oxidation SOFCs with Cu/CeO2/YSZ anodes. In this study we have, therefore, evaluated the effect of sulfur on the performance of direct oxidation SOFCs. A more detailed description of this work can be found in reference [5]5.
Experimental
Model fuel cells were prepared using a dual tape-casting method in which a green tape with graphite pore formers is cast over a green tape without pore formers1. Calcination in air to 1800 K produces a YSZ wafer having a dense layer, ~60 µm thick, supported by a porous layer, ~400 µm thick. A 50:50 mixture of YSZ and LSM (La0.8Sr0.2MnO3) powders was pasted onto the dense side of the wafer, then calcined to 1400 K, to form the cathode. Cu and ceria were then added to the porous side of the YSZ wafer, in separate steps, using wet impregnation of aqueous nitrate solutions to a final concentration of 10 wt% ceria and 20 wt% Cu, followed by heating in air at 750 K to form the oxides. The electronic contact at the cathode was achieved using a Pt mesh and Pt paste. For the anode, electrical contact was formed by pasting two Au wires onto the Cu cermet. Finally, the cell, with an active surface area of 0.25 cm2, was sealed onto a 1.2-cm alumina tube using a zirconia-based adhesive.
As described in a previous paper, room-temperature liquids were introduced into the anode compartment using a syringe pump, and the liquids were vaporized in the oven used to maintain the temperature of the cell at 973 K4 Model sulfur-containing fuels were used in this study and consisted of n-decane, to which thiophene was added to achieve the desired level of sulfur. The sulfur contents are reported as weight percent S in ppm.
Results and Discussion
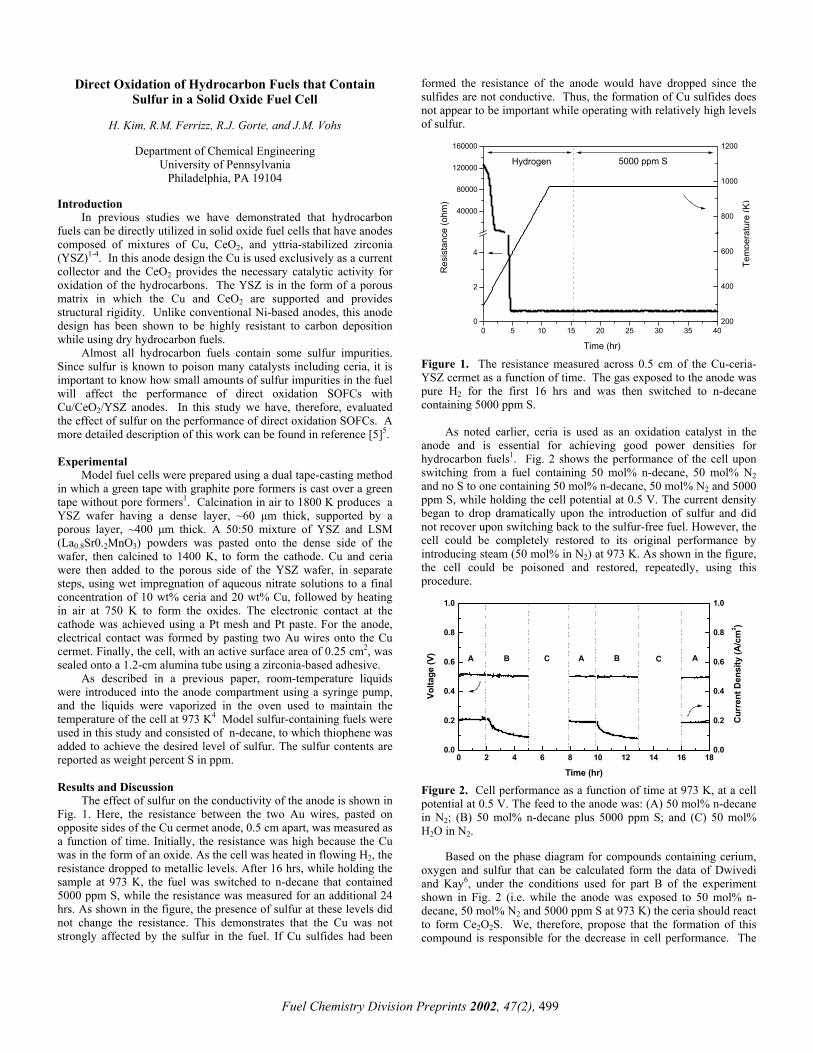
The effect of sulfur on the conductivity of the anode is shown in Fig. 1. Here, the resistance between the two Au wires, pasted on opposite sides of the Cu cermet anode, 0.5 cm apart, was measured as a function of time. Initially, the resistance was high because the Cu was in the form of an oxide. As the cell was heated in flowing H2, the resistance dropped to metallic levels. After 16 hrs, while holding the sample at 973 K, the fuel was switched to n-decane that contained 5000 ppm S, while the resistance was measured for an additional 24 hrs. As shown in the figure, the presence of sulfur at these levels did not change the resistance. This demonstrates that the Cu was not strongly affected by the sulfur in the fuel. If Cu sulfides had been
formed the resistance of the anode would have dropped since the sulfides are not conductive. Thus, the formation of Cu sulfides does not appear to be important while operating with relatively high levels of sulfur.
0 5 10 15 20 25 30 35 400
2
4
40000
80000
120000
160000
Res
ista
nce
(ohm
)
Time (hr)
200
400
600
800
1000
1200
5000 ppm SHydrogen
Tem
pera
ture
(K)
Figure 1. The resistance measured across 0.5 cm of the Cu-ceria-YSZ cermet as a function of time. The gas exposed to the anode was pure H2 for the first 16 hrs and was then switched to n-decane containing 5000 ppm S.
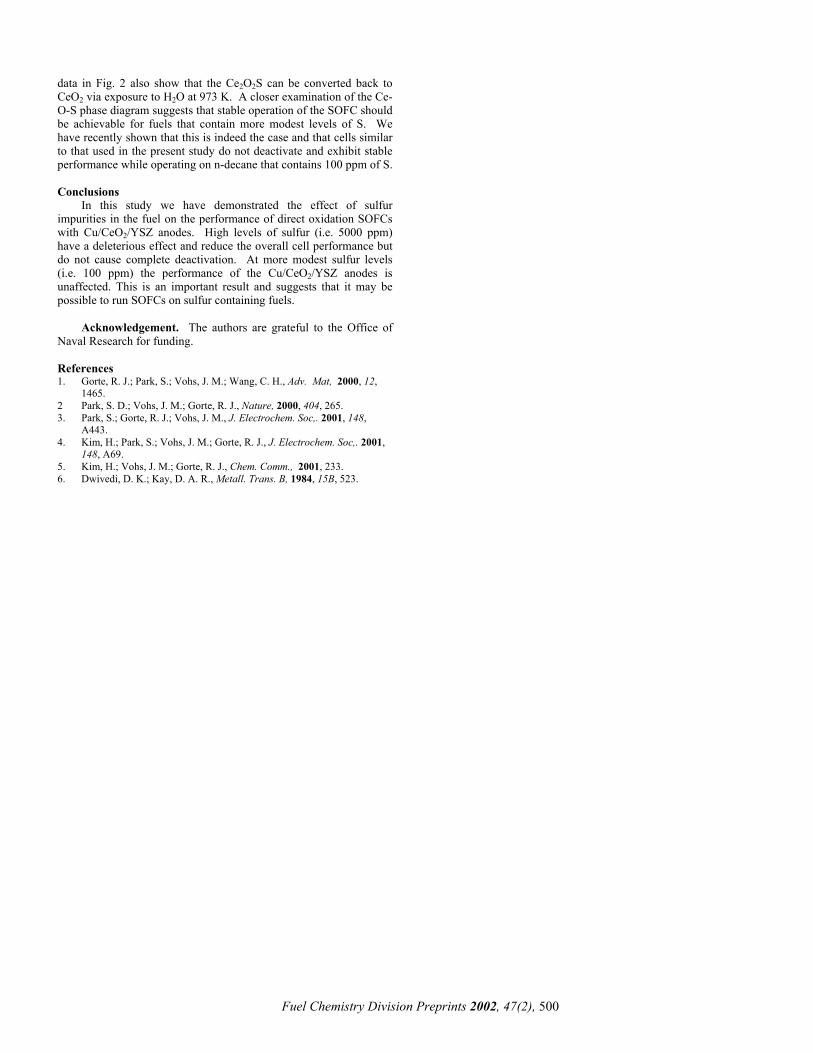
As noted earlier, ceria is used as an oxidation catalyst in the
anode and is essential for achieving good power densities for hydrocarbon fuels1. Fig. 2 shows the performance of the cell upon switching from a fuel containing 50 mol% n-decane, 50 mol% N2 and no S to one containing 50 mol% n-decane, 50 mol% N2 and 5000 ppm S, while holding the cell potential at 0.5 V. The current density began to drop dramatically upon the introduction of sulfur and did not recover upon switching back to the sulfur-free fuel. However, the cell could be completely restored to its original performance by introducing steam (50 mol% in N2) at 973 K. As shown in the figure, the cell could be poisoned and restored, repeatedly, using this procedure.
0 2 4 6 8 10 12 14 16 180.0
0.2
0.4
0.6
0.8
1.0
0.0
0.2
0.4
0.6
0.8
1.0
Curr
ent D
ensi
ty (A
/cm
2 )
CC ABB AA
Volta
ge (V
)
Time (hr) Figure 2. Cell performance as a function of time at 973 K, at a cell potential at 0.5 V. The feed to the anode was: (A) 50 mol% n-decane in N2; (B) 50 mol% n-decane plus 5000 ppm S; and (C) 50 mol% H2O in N2.
Based on the phase diagram for compounds containing cerium, oxygen and sulfur that can be calculated form the data of Dwivedi and Kay6, under the conditions used for part B of the experiment shown in Fig. 2 (i.e. while the anode was exposed to 50 mol% n-decane, 50 mol% N2 and 5000 ppm S at 973 K) the ceria should react to form Ce2O2S. We, therefore, propose that the formation of this compound is responsible for the decrease in cell performance. The
Fuel Chemistry Division Preprints 2002, 47(2), 499
Fuel Chemistry Division Preprints 2002, 47(2), 500
data in Fig. 2 also show that the Ce2O2S can be converted back to CeO2 via exposure to H2O at 973 K. A closer examination of the Ce-O-S phase diagram suggests that stable operation of the SOFC should be achievable for fuels that contain more modest levels of S. We have recently shown that this is indeed the case and that cells similar to that used in the present study do not deactivate and exhibit stable performance while operating on n-decane that contains 100 ppm of S. Conclusions
In this study we have demonstrated the effect of sulfur impurities in the fuel on the performance of direct oxidation SOFCs with Cu/CeO2/YSZ anodes. High levels of sulfur (i.e. 5000 ppm) have a deleterious effect and reduce the overall cell performance but do not cause complete deactivation. At more modest sulfur levels (i.e. 100 ppm) the performance of the Cu/CeO2/YSZ anodes is unaffected. This is an important result and suggests that it may be possible to run SOFCs on sulfur containing fuels.
Acknowledgement. The authors are grateful to the Office of Naval Research for funding. References 1. Gorte, R. J.; Park, S.; Vohs, J. M.; Wang, C. H., Adv. Mat, 2000, 12,
1465. 2 Park, S. D.; Vohs, J. M.; Gorte, R. J., Nature, 2000, 404, 265. 3. Park, S.; Gorte, R. J.; Vohs, J. M., J. Electrochem. Soc,. 2001, 148,
A443. 4. Kim, H.; Park, S.; Vohs, J. M.; Gorte, R. J., J. Electrochem. Soc,. 2001,
148, A69. 5. Kim, H.; Vohs, J. M.; Gorte, R. J., Chem. Comm., 2001, 233. 6. Dwivedi, D. K.; Kay, D. A. R., Metall. Trans. B, 1984, 15B, 523.
A Feasible Hybrid Fuel Cell Vehicle for the Hydrogen Economy
Jamie A. Weston, Mike Sprague, Hui Long, Ramya Venkataraman,
Patrick Flynn, Eric Wolfe, Alan W. Scaroni, André Boehman, Sarma V. Pisupati
Department of Energy and Geo-Environmental Engineering, The
Pennsylvania State University, 110 Hosler Building, University Park, PA 16802
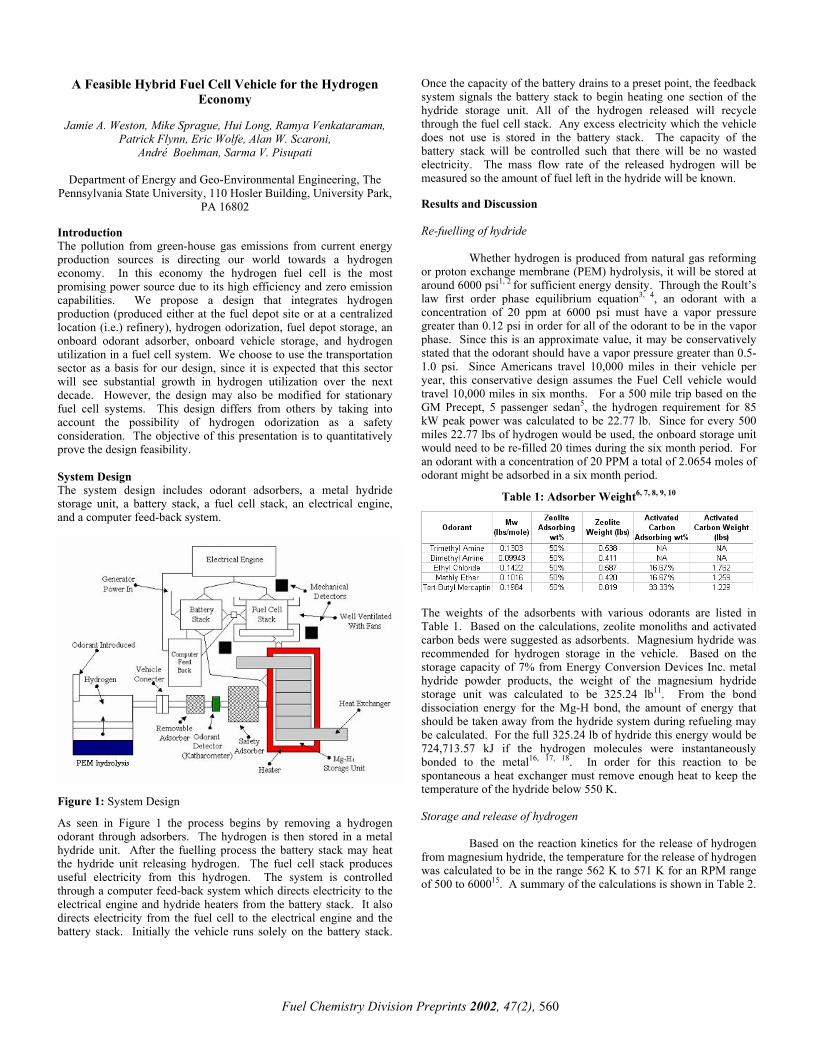
Introduction The pollution from green-house gas emissions from current energy production sources is directing our world towards a hydrogen economy. In this economy the hydrogen fuel cell is the most promising power source due to its high efficiency and zero emission capabilities. We propose a design that integrates hydrogen production (produced either at the fuel depot site or at a centralized location (i.e.) refinery), hydrogen odorization, fuel depot storage, an onboard odorant adsorber, onboard vehicle storage, and hydrogen utilization in a fuel cell system. We choose to use the transportation sector as a basis for our design, since it is expected that this sector will see substantial growth in hydrogen utilization over the next decade. However, the design may also be modified for stationary fuel cell systems. This design differs from others by taking into account the possibility of hydrogen odorization as a safety consideration. The objective of this presentation is to quantitatively prove the design feasibility. System Design The system design includes odorant adsorbers, a metal hydride storage unit, a battery stack, a fuel cell stack, an electrical engine, and a computer feed-back system.
Figure 1: System Design
As seen in Figure 1 the process begins by removing a hydrogen odorant through adsorbers. The hydrogen is then stored in a metal hydride unit. After the fuelling process the battery stack may heat the hydride unit releasing hydrogen. The fuel cell stack produces useful electricity from this hydrogen. The system is controlled through a computer feed-back system which directs electricity to the electrical engine and hydride heaters from the battery stack. It also directs electricity from the fuel cell to the electrical engine and the battery stack. Initially the vehicle runs solely on the battery stack.
Once the capacity of the battery drains to a preset point, the feedback system signals the battery stack to begin heating one section of the hydride storage unit. All of the hydrogen released will recycle through the fuel cell stack. Any excess electricity which the vehicle does not use is stored in the battery stack. The capacity of the battery stack will be controlled such that there will be no wasted electricity. The mass flow rate of the released hydrogen will be measured so the amount of fuel left in the hydride will be known. Results and Discussion Re-fuelling of hydride Whether hydrogen is produced from natural gas reforming or proton exchange membrane (PEM) hydrolysis, it will be stored at around 6000 psi1, 2 for sufficient energy density. Through the Roult’s law first order phase equilibrium equation3, 4, an odorant with a concentration of 20 ppm at 6000 psi must have a vapor pressure greater than 0.12 psi in order for all of the odorant to be in the vapor phase. Since this is an approximate value, it may be conservatively stated that the odorant should have a vapor pressure greater than 0.5-1.0 psi. Since Americans travel 10,000 miles in their vehicle per year, this conservative design assumes the Fuel Cell vehicle would travel 10,000 miles in six months. For a 500 mile trip based on the GM Precept, 5 passenger sedan5, the hydrogen requirement for 85 kW peak power was calculated to be 22.77 lb. Since for every 500 miles 22.77 lbs of hydrogen would be used, the onboard storage unit would need to be re-filled 20 times during the six month period. For an odorant with a concentration of 20 PPM a total of 2.0654 moles of odorant might be adsorbed in a six month period.
Table 1: Adsorber Weight6, 7, 8, 9, 10
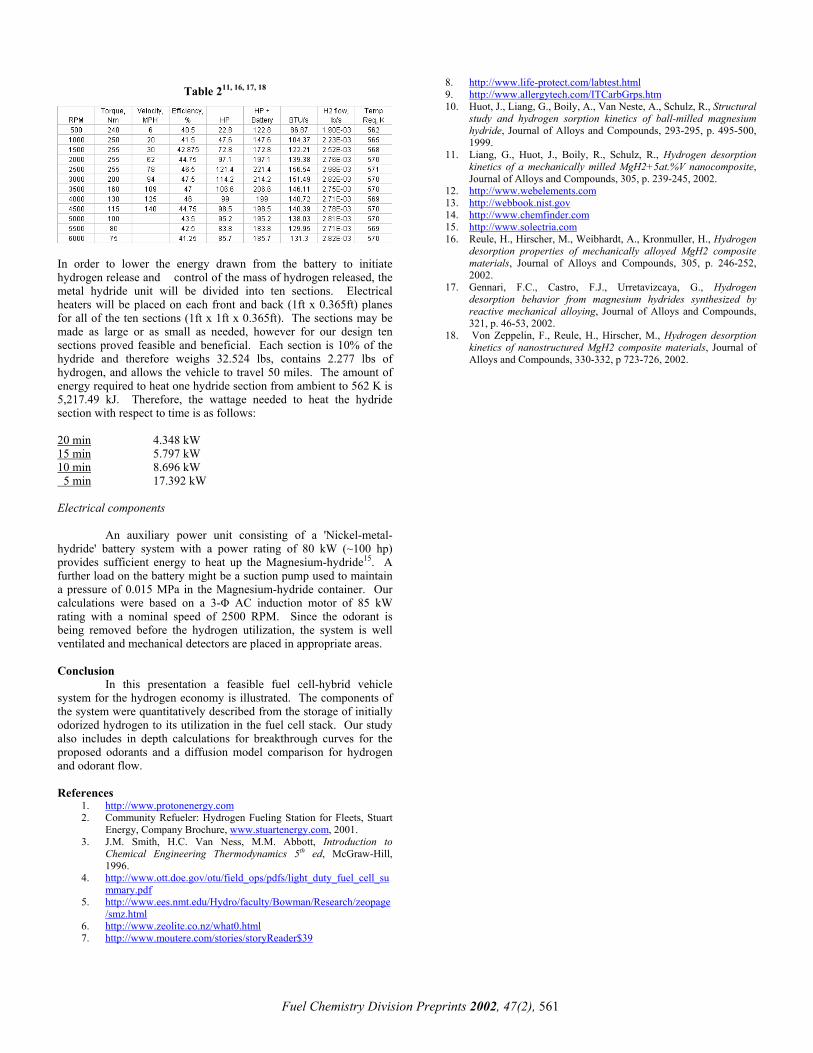
The weights of the adsorbents with various odorants are listed in Table 1. Based on the calculations, zeolite monoliths and activated carbon beds were suggested as adsorbents. Magnesium hydride was recommended for hydrogen storage in the vehicle. Based on the storage capacity of 7% from Energy Conversion Devices Inc. metal hydride powder products, the weight of the magnesium hydride storage unit was calculated to be 325.24 lb11. From the bond dissociation energy for the Mg-H bond, the amount of energy that should be taken away from the hydride system during refueling may be calculated. For the full 325.24 lb of hydride this energy would be 724,713.57 kJ if the hydrogen molecules were instantaneously bonded to the metal16, 17, 18. In order for this reaction to be spontaneous a heat exchanger must remove enough heat to keep the temperature of the hydride below 550 K. Storage and release of hydrogen Based on the reaction kinetics for the release of hydrogen from magnesium hydride, the temperature for the release of hydrogen was calculated to be in the range 562 K to 571 K for an RPM range of 500 to 600015. A summary of the calculations is shown in Table 2.
Fuel Chemistry Division Preprints 2002, 47(2), 560
8. http://www.life-protect.com/labtest.html Table 211, 16, 17, 18 9. http://www.allergytech.com/ITCarbGrps.htm
10. Huot, J., Liang, G., Boily, A., Van Neste, A., Schulz, R., Structural study and hydrogen sorption kinetics of ball-milled magnesium hydride, Journal of Alloys and Compounds, 293-295, p. 495-500, 1999.
11. Liang, G., Huot, J., Boily, R., Schulz, R., Hydrogen desorption kinetics of a mechanically milled MgH2+5at.%V nanocomposite, Journal of Alloys and Compounds, 305, p. 239-245, 2002.
12. http://www.webelements.com 13. http://webbook.nist.gov 14. http://www.chemfinder.com 15. http://www.solectria.com 16. Reule, H., Hirscher, M., Weibhardt, A., Kronmuller, H., Hydrogen
desorption properties of mechanically alloyed MgH2 composite materials, Journal of Alloys and Compounds, 305, p. 246-252, 2002.
In order to lower the energy drawn from the battery to initiate hydrogen release and control of the mass of hydrogen released, the metal hydride unit will be divided into ten sections. Electrical heaters will be placed on each front and back (1ft x 0.365ft) planes for all of the ten sections (1ft x 1ft x 0.365ft). The sections may be made as large or as small as needed, however for our design ten sections proved feasible and beneficial. Each section is 10% of the hydride and therefore weighs 32.524 lbs, contains 2.277 lbs of hydrogen, and allows the vehicle to travel 50 miles. The amount of energy required to heat one hydride section from ambient to 562 K is 5,217.49 kJ. Therefore, the wattage needed to heat the hydride section with respect to time is as follows:
17. Gennari, F.C., Castro, F.J., Urretavizcaya, G., Hydrogen desorption behavior from magnesium hydrides synthesized by reactive mechanical alloying, Journal of Alloys and Compounds, 321, p. 46-53, 2002.
18. Von Zeppelin, F., Reule, H., Hirscher, M., Hydrogen desorption kinetics of nanostructured MgH2 composite materials, Journal of Alloys and Compounds, 330-332, p 723-726, 2002.
20 min 4.348 kW 15 min 5.797 kW 10 min 8.696 kW 5 min 17.392 kW Electrical components An auxiliary power unit consisting of a 'Nickel-metal-hydride' battery system with a power rating of 80 kW (~100 hp) provides sufficient energy to heat up the Magnesium-hydride15. A further load on the battery might be a suction pump used to maintain a pressure of 0.015 MPa in the Magnesium-hydride container. Our calculations were based on a 3-Φ AC induction motor of 85 kW rating with a nominal speed of 2500 RPM. Since the odorant is being removed before the hydrogen utilization, the system is well ventilated and mechanical detectors are placed in appropriate areas. Conclusion
In this presentation a feasible fuel cell-hybrid vehicle system for the hydrogen economy is illustrated. The components of the system were quantitatively described from the storage of initially odorized hydrogen to its utilization in the fuel cell stack. Our study also includes in depth calculations for breakthrough curves for the proposed odorants and a diffusion model comparison for hydrogen and odorant flow.
References
1. http://www.protonenergy.com 2. Community Refueler: Hydrogen Fueling Station for Fleets, Stuart
Energy, Company Brochure, www.stuartenergy.com, 2001. 3. J.M. Smith, H.C. Van Ness, M.M. Abbott, Introduction to
Chemical Engineering Thermodynamics 5th ed, McGraw-Hill, 1996.
4. http://www.ott.doe.gov/otu/field_ops/pdfs/light_duty_fuel_cell_summary.pdf
5. http://www.ees.nmt.edu/Hydro/faculty/Bowman/Research/zeopage/smz.html
6. http://www.zeolite.co.nz/what0.html 7. http://www.moutere.com/stories/storyReader$39
Fuel Chemistry Division Preprints 2002, 47(2), 561

FUEL CELL TESTING AT ARGONNE NATIONAL LABORATORY
0
20
40
60
80
100
0 100 200 300 400
Time, s
%Fu
ll po
wer
Ira Bloom, Edward G. Polzin and William M. Swift
Electrochemical Technology Program
Argonne National Laboratory 9700 South Cass Avenue Argonne, IL 60439 USA
Fuel cells are devices that convert chemical energy into electricity with high efficiency. These are rugged, solid-state devices that emit very little pollution, making them appealing for automotive applications. Fuel cell developers, fuel cell users, automakers, and government and private agencies need an independent test and evaluation laboratory to provide an unbiased assessment of fuel cell technologies being developed for transportation applications. This is the objective of the Fuel Cell Test Facility (FCTF), which was established at Argonne National Laboratory by the US Department of Energy, Office of Advanced Automotive Technologies.
Fig. 1. Fuel-cell-compatible DST profile.
0
10
20
30
40
50
60
70
80
90
100
0 200 400 600 800 1000 1200 1400
Time, s
% R
ated
pow
er
The FCTF draws on Argonne's extensive experience in the electrochemical evaluation of batteries and battery test equipment. This provides the same high-quality testing for fuel cells as has been provided in the evaluation of batteries. The FCTF is designed for the testing and evaluation of fuel cell stacks and systems capable of powering a car. The evaluations performed will rely on standardized tests and test conditions to provide sponsors with comparative data on the performance and durability of their technology as well as a measure of progress being made by the developer. Since the evaluations are independent as well as standardized, the test results will help validate the capabilities of a given fuel cell technology and will provide common bases for the direct comparison of the performance of competing fuel cell technologies and strategies for power source systems.
The brain of the FCTF is a computer-controlled electronic load system that can handle DC loads from 100 W up to 250 kW (500 V at 500 A). The computer monitors all analog input signals with 16-bit analog-to-digital converters and can produce control outputs using 16-bit digital-to-analog converters. The computer samples and controls at 10 points per second. Since the hardware and software were created in-house, we can customize them to fit the needs of a given test article.
Fig. 2. Fuel-cell-compatible FUDS profile. Analysis of transient response, such as that in a driving
profile, gives useful information on the performance of the system under test. In the hypothetical case represented in Fig. 3, the amount of overshoot and equilibration time can be determined. The hypothetical system overshot by about 10 V and took about 4 seconds to equilibrate after both transients.
With this system, we perform relatively simple tests, such as polarization curves, efficiency measurements and start-up times for complete systems, as well as the more-complex driving simulations. For driving simulations, we use two power profiles that are based on the standard profiles used for electric vehicle testing [1]: the Dynamic Stress Test (DST) and Federal Urban Driving Schedule (FUDS). Both profiles place demands on the fuel cell system that are similar to those of a car. There are mild and steep accelerations as well as constant power intervals and stops. The difference between the two is the complexity of the pattern. The FUDS cycle contains many more intermediate power demands than does the DST. The profiles have been modified from the battery standards. The fuel-cell-compatible profiles contain no regenerative breaking peaks. Plots of the fuel-cell-compatible DST and FUDS power profiles are shown in Figs. 1 and 2, respectively. The computer can easily use other profiles.
0
20
40
60
80
100
120
0 10 20 30 40 50 60Time, s
Volta
ge, V
0
5
10
15
20
25
30
Curr
ent,
A
Voltage
Current
Fig. 3. Hypothetical response of a fuel cell system to driving-profile transients.
In addition to using versatile test equipment, the FCTF uses
a custom-designed, state-of-the-art fuel and gas management system. A photograph of the gas management system is shown in Fig. 4. The
Fuel Chemistry Division Preprints 2002, 47(2), 603
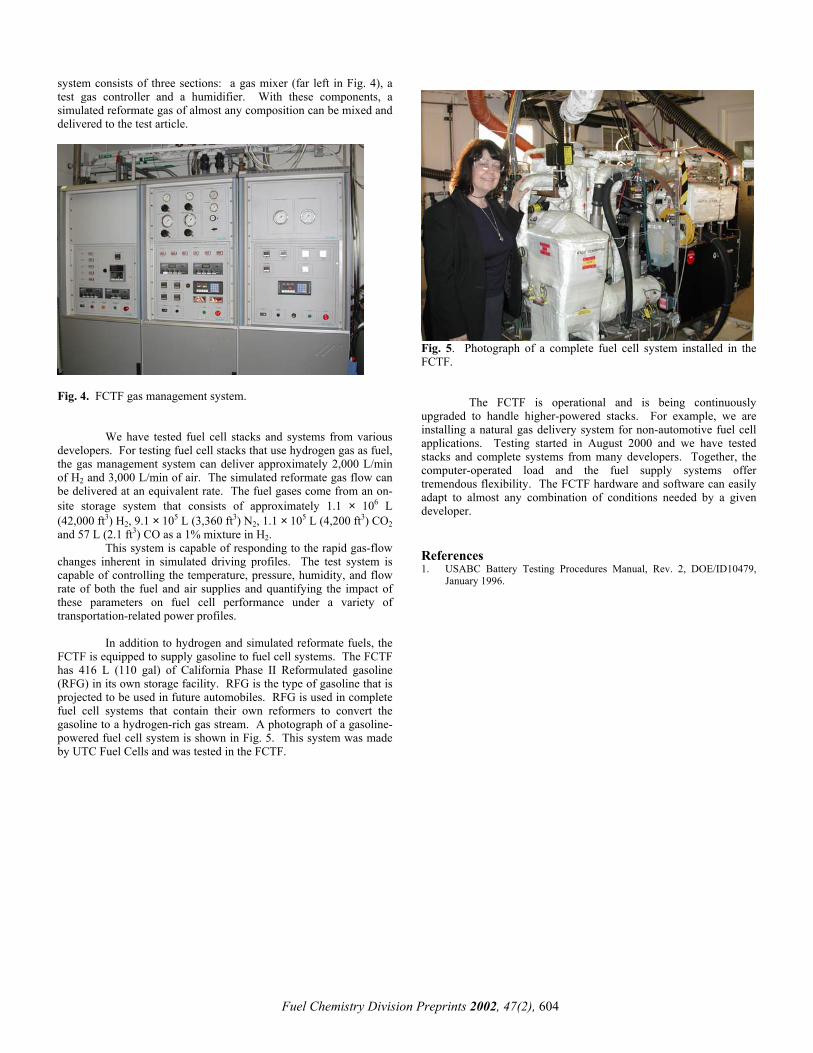
system consists of three sections: a gas mixer (far left in Fig. 4), a test gas controller and a humidifier. With these components, a simulated reformate gas of almost any composition can be mixed and delivered to the test article.
Fig. 5. Photograph of a complete fuel cell system installed in the FCTF. Fig. 4. FCTF gas management system. The FCTF is operational and is being continuously upgraded to handle higher-powered stacks. For example, we are installing a natural gas delivery system for non-automotive fuel cell applications. Testing started in August 2000 and we have tested stacks and complete systems from many developers. Together, the computer-operated load and the fuel supply systems offer tremendous flexibility. The FCTF hardware and software can easily adapt to almost any combination of conditions needed by a given developer.
We have tested fuel cell stacks and systems from various developers. For testing fuel cell stacks that use hydrogen gas as fuel, the gas management system can deliver approximately 2,000 L/min of H2 and 3,000 L/min of air. The simulated reformate gas flow can be delivered at an equivalent rate. The fuel gases come from an on-site storage system that consists of approximately 1.1 × 10⁶ L (42,000 ft3) H2, 9.1 × 10⁵ L (3,360 ft3) N2, 1.1 × 10⁵ L (4,200 ft3) CO2 and 57 L (2.1 ft3) CO as a 1% mixture in H2.
This system is capable of responding to the rapid gas-flow
changes inherent in simulated driving profiles. The test system is capable of controlling the temperature, pressure, humidity, and flow rate of both the fuel and air supplies and quantifying the impact of these parameters on fuel cell performance under a variety of transportation-related power profiles.
References 1. USABC Battery Testing Procedures Manual, Rev. 2, DOE/ID10479,
January 1996.
In addition to hydrogen and simulated reformate fuels, the FCTF is equipped to supply gasoline to fuel cell systems. The FCTF has 416 L (110 gal) of California Phase II Reformulated gasoline (RFG) in its own storage facility. RFG is the type of gasoline that is projected to be used in future automobiles. RFG is used in complete fuel cell systems that contain their own reformers to convert the gasoline to a hydrogen-rich gas stream. A photograph of a gasoline-powered fuel cell system is shown in Fig. 5. This system was made by UTC Fuel Cells and was tested in the FCTF.
Fuel Chemistry Division Preprints 2002, 47(2), 604

Fuel Processing for Fuel Cells: Fuel Effects on Fuel
Processor Durability and Carbon Formation
Rod Borup, Lee Perry, Michael Inbody, and Jose Tafoya
ESA-EPE, MS J580 P.O. Box 1663
Los Alamos National Laboratory Los Alamos, NM 87545
(505) 667-2823 fax: (505) 665-6173; e-mail: [email protected] Introduction
On-board production of hydrogen for fuel cells for automotive applications is a challenging developmental task. The fuel processor must show long term durability and do so under challenging conditions. For the commercialization of fuel processors, the delineation of fuel effects on catalyst activity and durability are required.
We are studying the effects of fuels and fuel constituents on the fuel processor system as part of the DOE Fuel Cells for Transportation program. Pure fuel components are tested to delineate the fuel component effect on the fuel processor and fuel processor catalysts. Component blends are used to simulate ‘real fuels’, with various fuel mixtures being examined such as reformulated gasoline and naptha. The aliphatic, napthenic, olefin and aromatic content are simulated to represent the chemical kinetics of possible detrimental reactions, such as carbon formation, during fuel testing.
Testing has examined the fuel processing performance of different fuel components to elucidate the fuel constituent effects on fuel processing performance and upon catalyst durability. Experiments have been conducted using high-purity compounds to observe the fuel processing properties of the individual components and to document individual fuel component performance. The relative carbon formation tendency of different fuel constituents have been measured by monitoring carbon via in situ laser optics, and by monitoring carbon buildup on the catalyst surface. The fuel processing performance of the individual components is compared with the fuel processing performance of blended fuel components and the reformulated gasoline to examine synergistic or detrimental effects the fuel components have in a real fuel blend.
The goal of this research is to explore various effects on fuel processor performance and durability. Various catalysts, catalyst supports, fuel constituents and fuel impurities on the performance of on-board hydrogen generation devices and consequently on the overall performance of a PEM fuel cell system utilizing a hydrocarbon fuel is examined. A main emphasis is placed on the catalyst and fuel constituent effect on carbon formation in the fuel processor. Experimental
To examine the fuels’ effects on hydrogen production devices, various fuel components and real fuels have been tested in fuel reformers. These fuels have been tested in catalytic partial oxidation and steam reforming reactors, and in non-catalytic (homogeneous) partial oxidation/steam reformers. Homogeneous partial oxidation has a potential advantage for meeting DOE start-up targets, as homogeneous partial oxidation does not require preheating before light-off of the reactor. The reactor operating conditions simulate expected operating conditions for transportation applications. The reactor uses preheated fuel/steam/air mixtures, catalysts on automotive supports such as monoliths, and operates under adiabatic conditions. The operating range of the system is from 10 kW (LHV
Fuel in) to 60 kW. O/C and S/C ratios are varied to explore the operating condition effects in the system which maybe observed during fuel processor start-up and transient operation. The outlet gas compositions are measured by HP 6890 gas chromatograph, Shimadzu 12a gas chromatograph, California Analytical CO and CO2 NDIRs, and a California Analytical Paramagnetic oxygen analyzer.
Expected outlet concentrations of the fuel reformer, and the relative fuel component effects on the fuel reformer outlet have been modeled. In particular, modeling of equilibrium carbon formation has been used to predict the operating conditions for the onset of carbon formation for various fuel blends. The thermodynamic properties of fuel components have been calculated and modeled to create blends of pure fuel components that simulate gasoline with a minimal number of chemical components.
In situ laser measurement of the effluent reformate and visual observation of the reactor catalyst during operation have been developed and used in this work to monitor carbon formation during operation. The relative distribution of the catalytic conversion has been observed with various fuel components with different catalyst substrates (monoliths and reticulated foams). Mapping of the onset of carbon formation for different fuel components as a function of operating conditions has been initiated with these techniques. The reactor with catalyst observation windows, laser extinction, and scattering facilities is shown in Figure 1.
Figure 1. Catalytic partial oxidation with facilities for laser extinction, scattering measurements and catalyst observation. Reactor supports automotive catalytic supports for oxidation and steam reforming. Carbon formation has been measured by the laser extinction signal just after the oxidation portion of the fuel processor. The laser transmission is given by eqn 1 below, and the relative carbon flowrate is given by eqn. 2 where m2 is the complex index of refraction and can be calculated by Refs 1 or 2.
Eqn 1: ( )τπλ
πλ ln
2~1~
Im62~
1~Im
6 2
2
2
2
⋅
+−−=⋅
+−−=
mm
LK
mmf extv
Eqn 2: ( )LKII
extt ⋅−== exp0
τ :
Fuel Chemistry Division Preprints 2002, 47(2), 547

Carbon Formation Modeling
Modeling has been used to predict expected outlet concentrations of the fuel reformer, and the relative fuel component effects on the fuel reformer outlet. In particular, carbon formation modeling has been examined to help determine the operating conditions under which carbon formation is expected for various fuel blends. The thermodynamic properties of fuel components have been calculated and modeled to create blends of pure fuel components that simulate gasoline with a minimal number of chemical components. A sample of these results in shown below in Figure 2.
Figure 2. Modeling of carbon formation for operation with gasoline, O/C = 0.6. Above and to the right is an area free of equilibrium carbon formation, to the bottom left, carbon formation is expected by chemical equilibrium.
Experimental Results
Fuel effects on the relative rates of the catalytic partial oxidation reaction for different fuels have been measured. These measurements were conducted at various operating conditions varying O/C ratios, and S/C ratios. Chemical components of gasoline were used in mixtures to observe fuel composition effects and the chemical component effects on carbon formation. Figure 3 shows relative oxygen conversion as a function of residence time at an O/C = 0.7 for iso-octane, iso-octane/xylene, reformulate gasoline, and hydro-treated naptha.
As the reactor residence time decreases the relative conversion decreases for all of the different fuels tested; however, the addition of aromatic compounds to iso-octane decreases the relative conversion at all residence times. At higher relative oxygen content, O/C = 1.0, - and subsequently higher temperatures, the fuel component effect on conversion is decreased due to the increased kinetics and mass transfer induced by the higher temperatures. Thus at higher O/C ratio, conversion differences for different fuel compositions are decreased and the fuel composition effect is minimized.
Similar fuel mixtures have been examined to observe the relative tendency for carbon formation by in situ laser scattering. An example of this result is shown for iso-octane/20% xylene in Figure 4. Carbon formation is not observed for fuel components which do not contain aromatic components, while carbon formation is
observed when aromatic compounds are present, but only at relatively low S/C ratios.
96
96.5
97
97.5
98
98.5
99
99.5
100
0 2 4 6 8 10 12 14 16
Residence Time / msec
Oxyg
en U
tiliz
aito
n / %
Iso-Octane
Iso-Octane/Xylene
Naptha
Ca Reformulated
O/C = 0.7S/C = 1.0
Figure 3. Catalytic partial oxidation fuel effects at O/C = 0.7 with varying residence times. Fuels tested include: iso-octane (diamonds), iso-octane/20% xylene (squares), hydro-treated naptha (triangles – fuel provided by Phillips Petroleum), and Reformulated gasoline (circles)
Carbon-Free
Carbon
Figure 4. In Situ Carbon formation measurements of iso-octane/20% xylene mixture for O/C = 0.9 (squares), O/C = 0.65 (circles) and O/C – 0.5 (triangles). Conclusions
Various fuel components and fuels have been tested with various O/C and S/C ratios in catalytic partial oxidation reactors with in situ measurement of carbon formation. The addition of aromatics slows the overall reaction rate for catalytic oxidation, and greatly increases the tendency for carbon formation. At short residence times in partial oxidation, carbon formation is not observed in fuels without aromatic even in regimes where carbon formation is favored by chemical equilibrium.
Acknowledgment. This work was supported by the U.S. Department of Energy, Office of Transportation Technology, Program Managers Peter Devlin and JoAnn Milliken. References 1 Dobbins, Mullholand, and Bryner, Atmos. Env., 28 (1994) 889 2 Koylu and Sapmaz, 3rd Int. Symp on Rad. Transfer, Turkey, June 17-
21, 2001
Fuel Chemistry Division Preprints 2002, 47(2), 548
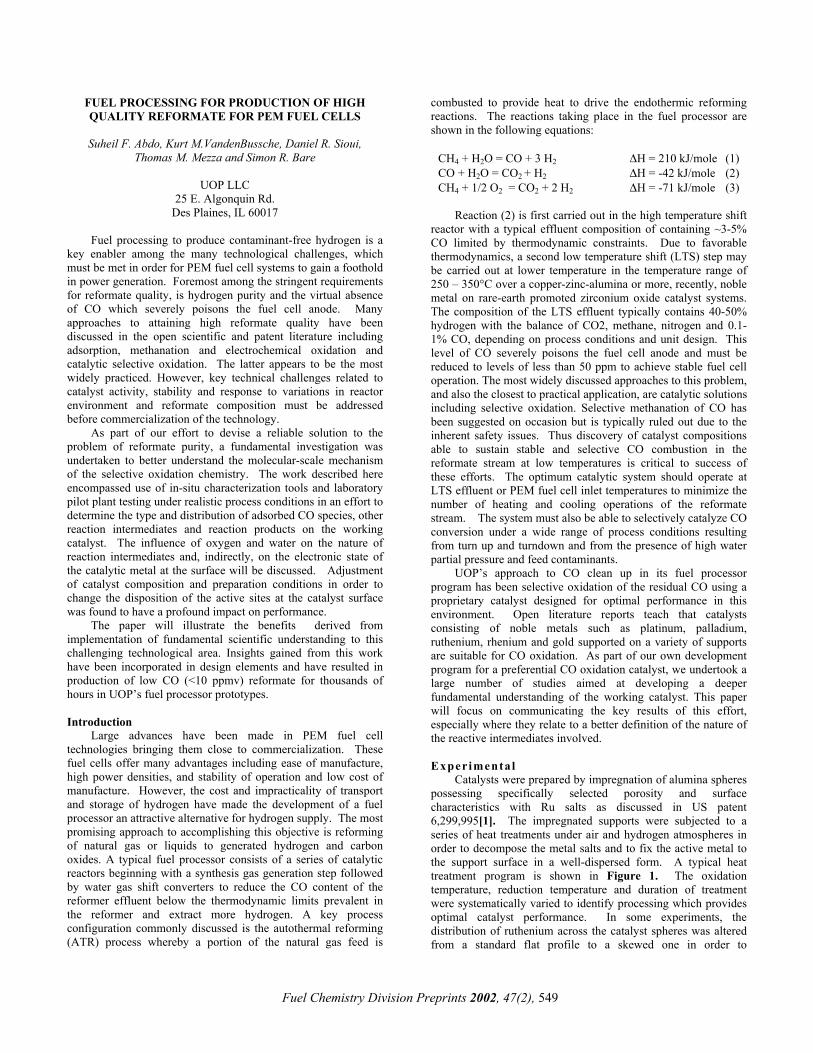
FUEL PROCESSING FOR PRODUCTION OF HIGH QUALITY REFORMATE FOR PEM FUEL CELLS
Suheil F. Abdo, Kurt M.VandenBussche, Daniel R. Sioui,
Thomas M. Mezza and Simon R. Bare
UOP LLC 25 E. Algonquin Rd.
Des Plaines, IL 60017
Fuel processing to produce contaminant-free hydrogen is a key enabler among the many technological challenges, which must be met in order for PEM fuel cell systems to gain a foothold in power generation. Foremost among the stringent requirements for reformate quality, is hydrogen purity and the virtual absence of CO which severely poisons the fuel cell anode. Many approaches to attaining high reformate quality have been discussed in the open scientific and patent literature including adsorption, methanation and electrochemical oxidation and catalytic selective oxidation. The latter appears to be the most widely practiced. However, key technical challenges related to catalyst activity, stability and response to variations in reactor environment and reformate composition must be addressed before commercialization of the technology.
As part of our effort to devise a reliable solution to the problem of reformate purity, a fundamental investigation was undertaken to better understand the molecular-scale mechanism of the selective oxidation chemistry. The work described here encompassed use of in-situ characterization tools and laboratory pilot plant testing under realistic process conditions in an effort to determine the type and distribution of adsorbed CO species, other reaction intermediates and reaction products on the working catalyst. The influence of oxygen and water on the nature of reaction intermediates and, indirectly, on the electronic state of the catalytic metal at the surface will be discussed. Adjustment of catalyst composition and preparation conditions in order to change the disposition of the active sites at the catalyst surface was found to have a profound impact on performance.
The paper will illustrate the benefits derived from implementation of fundamental scientific understanding to this challenging technological area. Insights gained from this work have been incorporated in design elements and have resulted in production of low CO (<10 ppmv) reformate for thousands of hours in UOP’s fuel processor prototypes. Introduction
Large advances have been made in PEM fuel cell technologies bringing them close to commercialization. These fuel cells offer many advantages including ease of manufacture, high power densities, and stability of operation and low cost of manufacture. However, the cost and impracticality of transport and storage of hydrogen have made the development of a fuel processor an attractive alternative for hydrogen supply. The most promising approach to accomplishing this objective is reforming of natural gas or liquids to generated hydrogen and carbon oxides. A typical fuel processor consists of a series of catalytic reactors beginning with a synthesis gas generation step followed by water gas shift converters to reduce the CO content of the reformer effluent below the thermodynamic limits prevalent in the reformer and extract more hydrogen. A key process configuration commonly discussed is the autothermal reforming (ATR) process whereby a portion of the natural gas feed is
combusted to provide heat to drive the endothermic reforming reactions. The reactions taking place in the fuel processor are shown in the following equations:
CH4 + H2O = CO + 3 H2 ∆H = 210 kJ/mole (1) CO + H2O = CO2 + H2 ∆H = -42 kJ/mole (2) CH4 + 1/2 O2 = CO2 + 2 H2 ∆H = -71 kJ/mole (3)
Reaction (2) is first carried out in the high temperature shift
reactor with a typical effluent composition of containing ~3-5% CO limited by thermodynamic constraints. Due to favorable thermodynamics, a second low temperature shift (LTS) step may be carried out at lower temperature in the temperature range of 250 – 350°C over a copper-zinc-alumina or more, recently, noble metal on rare-earth promoted zirconium oxide catalyst systems. The composition of the LTS effluent typically contains 40-50% hydrogen with the balance of CO2, methane, nitrogen and 0.1- 1% CO, depending on process conditions and unit design. This level of CO severely poisons the fuel cell anode and must be reduced to levels of less than 50 ppm to achieve stable fuel cell operation. The most widely discussed approaches to this problem, and also the closest to practical application, are catalytic solutions including selective oxidation. Selective methanation of CO has been suggested on occasion but is typically ruled out due to the inherent safety issues. Thus discovery of catalyst compositions able to sustain stable and selective CO combustion in the reformate stream at low temperatures is critical to success of these efforts. The optimum catalytic system should operate at LTS effluent or PEM fuel cell inlet temperatures to minimize the number of heating and cooling operations of the reformate stream. The system must also be able to selectively catalyze CO conversion under a wide range of process conditions resulting from turn up and turndown and from the presence of high water partial pressure and feed contaminants.
UOP’s approach to CO clean up in its fuel processor program has been selective oxidation of the residual CO using a proprietary catalyst designed for optimal performance in this environment. Open literature reports teach that catalysts consisting of noble metals such as platinum, palladium, ruthenium, rhenium and gold supported on a variety of supports are suitable for CO oxidation. As part of our own development program for a preferential CO oxidation catalyst, we undertook a large number of studies aimed at developing a deeper fundamental understanding of the working catalyst. This paper will focus on communicating the key results of this effort, especially where they relate to a better definition of the nature of the reactive intermediates involved. Experimental
Catalysts were prepared by impregnation of alumina spheres possessing specifically selected porosity and surface characteristics with Ru salts as discussed in US patent 6,299,995[1]. The impregnated supports were subjected to a series of heat treatments under air and hydrogen atmospheres in order to decompose the metal salts and to fix the active metal to the support surface in a well-dispersed form. A typical heat treatment program is shown in Figure 1. The oxidation temperature, reduction temperature and duration of treatment were systematically varied to identify processing which provides optimal catalyst performance. In some experiments, the distribution of ruthenium across the catalyst spheres was altered from a standard flat profile to a skewed one in order to
Fuel Chemistry Division Preprints 2002, 47(2), 549

investigate the impact of this parameter on catalyst performance. Resulting catalysts displayed “eggshell” profiles of varying shell thicknesses as shown in Figure 2.
Catalyst evaluation for CO conversion was conducted in a laboratory test unit using feed compositions representing expected low temperature shift (LTS) effluent compositions. Conditions employed in catalyst testing as well as the feed composition are summarized in Table 1. Temperature, space velocity, water content and air-to-fuel ratios were varied depending on the desired objective of specific experiments. CO and CO2 analysis of the reactor effluent were carried out using an infrared analyzer and O2 analysis was carried out using a paramagnetic analyzer. Feed and air flow rates were metered with Brooks mass flow controllers and water was introduced using an Isco pump and entered the reactor after passing through a vaporization zone. The total reactor effluent passed through a dry ice-propylene glycol trap for water removal and subsequently sent to the analyzers.
The catalyst sample to be tested is introduced into the reactor after mixing with an inert diluent in a 3:1 diluent to catalyst ratio in an attempt to maintain an as close to an isothermal bed temperature profile as possible. The degree to which this succeeded varied with catalyst sample activity and a descending temperature profile from top to bottom of the bed was almost always observed. Thermocouples were placed at the reactor inlet and outlets as well as at the top, middle and bottom of the 9-inch catalyst bed.
Catalyst characterization was carried out employing a variety of specialized techniques such as XPS, XANES, and Fourier-transform infrared (FTIR). Experiments were occasionally carried under in-situ or near-in-situ conditions as described below. The XPS analysis was performed in a Quantum 2000 Scanning ESCA Microprobe. The catalyst spheres were ground to a powder and lightly pressed onto Scotch tape held with a Mo sample holder. The spectra were charge referenced by setting the binding energy of the Al 2p = 74.0 eV. The XANES experiments were conducted at beamline X19A at NSLS. The Ru L3-edge XANES were collected in fluorescence yield mode using a cell designed for in situ x-ray absorption spectroscopy measurements.
Infrared experiments were carried out using a Nicolet 60 SXB spectrometer equipped with a cell designed to permit flow of feed gases over a self-supporting catalyst wafer at temperatures ranging up to 800°C. A specially constructed manifold was employed to flow the dry feed gas shown in Table 1. Air was metered in at the desired ratio and the total gas flow was humidified by flowing it through a water saturator. All spectra were normalized to constant catalyst weight. Results and Discussion
Results of experiment carried out to investigate the impact of catalyst preparation variables on performance are illustrated in Figure 3. In a typical run of this type the catalyst is brought on stream at inlet temperature T1 and a GHSV of 5000 hr –1 and feed flow rate is adjusted in steps up to a nominal value of 15,000 hr –1
while holding the temperature constant. In some experiments, the space velocity is reduced to the starting value again to determine whether the observed loss of conversion reversible. The data presented in this figure illustrate the very important role the support and the metal distribution profile play in determining catalyst CO conversion activity. Traces 1 & 2 show CO conversion results from standard preparations on two different
alumina supports illustrating the profound impact of support properties on performance.
However, adjustment of the ruthenium profile, to give the distribution shown in Figure 2, yields significant improvements in performance seen by comparing traces 2, 3 and 4. These variables are exploited to in our program to achieve optimal performance.
Figure 4 presents a plot of CO conversion as a function of gas hourly space velocity and O2/CO ratio collected over an experimental catalyst early in our program. These results are consistent with expectation of diminished conversion at high space velocity and low O2/CO ratio except for the apparent drop in conversion on raising the O2/CO from 3 to 4.
A plausible explanation for this unexpected behavior may be the oxidation of ruthenium at the surface in the presence of excessively high levels of oxygen.
In attempting to define the behavior of the system at high temperatures, we encountered an interesting observation shown in Figure 5. This figure shows a plot of CO and CO2 in the reactor effluent as a function of reactor inlet temperature in the presence of high (30%) and low (1%) water content in the feed. As a temperature of about 200°C is reached, a trend of rising CO and falling CO2 were observed. This trend accelerated as an inlet temperature of ~300°C was reached. A decreasing CO2 trend under these conditions may be interpreted in terms of the onset of reverse water-gas shift reaction whereby CO2 reacts with hydrogen to form CO and water according to the following reaction
CO2 + H2 = CO + H2O ∆H = +42 kJ/mole (4)
This reaction may be considered an intermediate reaction along the pathway of CO2 methanation, which takes place at higher temperatures. Here CO2 and CO, react with hydrogen to form methane in a reversal of the steam reforming reaction (1). However, the observed effect of water in accelerating the evolution of CO at these high temperatures is not, consistent with the reverse WGS hypothesis. Another reaction pathway must be invoked to explain the role of water. Water might indeed act as a poison to inhibit the CO oxidation reaction. However, it is difficult to reconcile the increase in this inhibition effect would increase at higher temperature where water adsorption is expected to diminish in strength. Of course, the influence of water in modifying the catalyst surface through surface reconstruction or oxidation of Ru sites must be considered in explaining this observation as well as others. Thus, understanding of the molecular-scale events underlying this behavior is, of course, critical to proper design of the catalyst and process combination for optimum performance in CO clean up in fuel processors. To this end we undertook basic characterization work in order to probe the specific changes taking place in the catalyst or at the catalyst surface after exposure to a variety of environments it is likely to encounter in service.
XPS and XANES
As part of the effort to determine the optimum reduction temperature of the catalysts XANES-TPR experiments were carried out to follow the evolution of the Ru oxidation states with temperature in flowing hydrogen. This work was based on an
Fuel Chemistry Division Preprints 2002, 47(2), 550
observation made earlier in a standard TPR experiment of a maximum uptake of hydrogen around 250°C. Figure 6 shows the evolution of the Ru-L3 edge band position as a function of temperature. The shift in this band to lower energy indicates reduction to lower oxidation state. This shift is well illustrated in Figure 7, which shows a plot of the peak maximum energy as a function of temperature. These data clearly indicate that complete reduction of ruthenium takes place at temperatures exceeding 300°C.
A comparison of the “eggshell” preparation described above (see Figure 2), to the standard preparation was carried out by XPS. One can expect significant differences in the intimacy of interaction of the Ru with the support between catalysts possessing such differences in Ru profiles and, consequently, in the electronic nature of the surface ruthenium. A cursory consideration of the impact of such differences in spatial Ru distribution suggests that the “eggshell” catalysts should be prone to less intimate interaction with the surface and, consequently, to being more metallic in nature. It is well established in the literature that the electronic nature of supported metals is strongly influenced by the intimacy of interaction with the support surface.
Thus, it is expected that a comparison of the ruthenium 3d binding energies in XPS spectra of flat and “eggshell” preparations should reveal some key differences between them. These XPS spectra of the two catalysts are shown in Figure 8. The binding energies of the sample with a Ru “eggshell” profile are clearly shifted to lower energy than are those of the sample with the flat profile. These shifts are consistent with the ruthenium having a significantly more metallic character in the “eggshell” catalyst than in the sample with the more highly dispersed ruthenium. Thus, the superior performance of the “eggshell” catalysts may in part be attributable to factors related to the electron density at the active metal sites. The strong correlation to performance along with the ease of transformation of Ru 0 to Ru n+ illustrated in this work suggest a need for characterization in-situ or under conditions closely mimicking those of the process.
A proposed model of the working catalyst consistent with these observations is shown schematically in Figure 9. Clearly, the presence of and need for an underlying reservoir of reduced Ru metal is suggested by the better performance of the “eggshell” catalysts and by the strong influence of catalyst reduction conditions on performance. However, the presence of oxygen under normal conditions of use, coupled with apparent ease of inter-conversion between Ru oxidation states, suggests an important role for Ru n+ species in the catalysis. It further reinforces the need to investigate the exact nature of the surface layers, or islands, containing Ru n+ sites in the working catalyst in-situ. For example, RuOx sites have been previously proposed as active sites for CO conversion on model Ru catalysts [2].
Fourier Transform Infrared
Fourier-Transform infrared spectroscopy (FT-IR) is ideally suited for this purpose as it allows the monitoring of adsorbed CO which is frequently employed to probe the dispersion, electronic nature and coordination of supported metals at catalyst surfaces. The fact that it is also a reactant in selective oxidation chemistry presented a unique opportunity to probe the reaction in-situ. The nature of the adsorbed CO on a reduced catalyst was initially investigated by introducing CO in a stream of flowing
hydrogen at various temperatures. Figure 10 shows infrared spectra of samples treated in hydrogen at 108°C and subsequently exposed to CO at 30 and 108°C and after subsequent CO desorption at 100 and 125°C. A strong band at ~ 2040 cm-1 and a shoulder around 1970 cm-1 can be seen in the spectra after CO adsorption which have been assigned to CO at Ru (0) and Ru∗+ , respectively [3] . A slight coverage dependence of the frequency of the 2040 band is observed as it shifted to ~ 2025 cm-1 in the desorption spectra. Variations in catalyst preparation to effect various levels of Ru dispersion led to large changes in spectral intensity of these bands consistent with expectations of lower intensity for less dispersed samples.
The impact of the reaction environment on the CO spectrum can be seen in Figure 11 displaying a spectrum of the catalyst after exposure to flowing feed at 108°C. Here, a spectral envelope of at least four CO bands can be seen which we attributed to CO- Run+ species where 0<n<1 based on literature assignments summarized by Che et. al. [3]. Spectra collected upon flowing feed gas with the composition shown in Table 1 shows a shift of the 2040 cm-1 to around 2060 cm-1 and of the 1970 cm-1 to around 1990 cm-1 along with the appearance of a band around 1580 cm-1 . Such shifts to higher energies are consistent with depletion of the adsorption sites of electron density and are strongly indicative of some ruthenium oxidation in the presence of feed. The 1580 cm-1 band is consistent with a formate-type species present at the surface. A weak band in this location could be observed albeit with much weaker intensity on exposure of the catalyst to CO and hydrogen only. However, its intensity increases upon exposure to the oxygen- containing feed. Treatment of the catalyst with the wet feed on the other hand, results in significantly lower intensity for this band.
Figure 12 shows a comparison of the infrared spectra of the catalyst in flowing feed at 150°C with and without oxygen present. The spectrum measured in the absence of oxygen shows the influence of higher temperature on the CO spectral profile with a broad band in the lower frequency range of the envelope becoming the most prominent than it had been in the 110°C spectra. A shoulder around 2040 cm-1 can also be discerned in this spectrum. The dramatic effect of oxygen introduction on this spectral envelope can be clearly seen in this figure where the spectrum is completely transformed into one primarily displaying the 2040 cm-1 and 1990 cm-1 bands observed in the 110°C spectra. Introduction of oxygen also results in a loss of intensity of the 1580 cm-1 band and the appearance of a weak band around 1850 cm-1 . This effect appears reversible as demonstrated in Figure 13 where the impact of cycling oxygen in and out of the feed mixture on the IR spectrum can be seen. In addition to the reproducible changes in the CO stretching region, the inverse relationship between the formate band and oxygen can also be seen in these spectra.
The loss of intensity of in the lower energy band of the spectral envelop and the position of the remaining bands indicate that CO-Ru species formed at reduced, electron rich, Ru sites are most reactive. This interpretation relies on the assumption that the lower frequency CO bands can be assigned to species adsorbed at reduced metal sites. Many alternative and conflicting literature assignments of some of the CO bands observed on ruthenium catalysts have been proposed [3]. Some of these assignments are consistent with our observations. For example, bands observed in the 2060 – 2100 cm-1 have been assigned to di or multi-carbonyl species coordinated to partially oxidized Ru. Their assignment to positively charged ruthenium is of course
Fuel Chemistry Division Preprints 2002, 47(2), 551
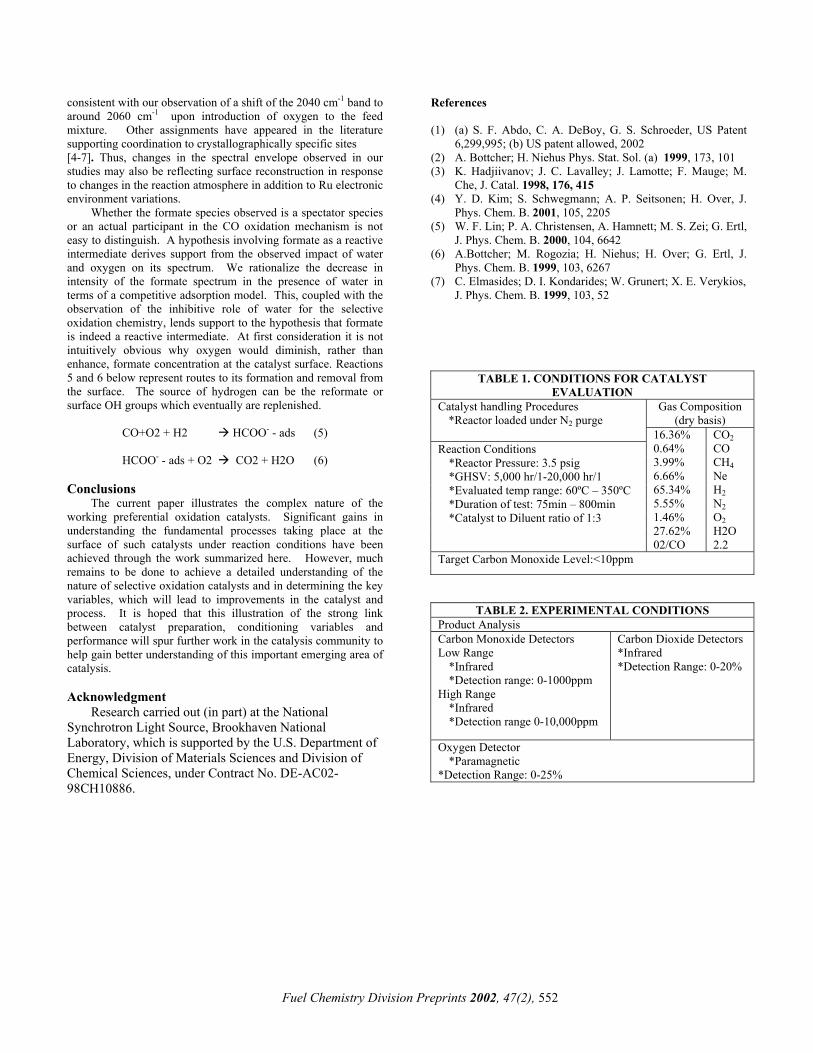
consistent with our observation of a shift of the 2040 cm-1 band to around 2060 cm-1 upon introduction of oxygen to the feed mixture. Other assignments have appeared in the literature supporting coordination to crystallographically specific sites [4-7]. Thus, changes in the spectral envelope observed in our studies may also be reflecting surface reconstruction in response to changes in the reaction atmosphere in addition to Ru electronic environment variations.
Whether the formate species observed is a spectator species or an actual participant in the CO oxidation mechanism is not easy to distinguish. A hypothesis involving formate as a reactive intermediate derives support from the observed impact of water and oxygen on its spectrum. We rationalize the decrease in intensity of the formate spectrum in the presence of water in terms of a competitive adsorption model. This, coupled with the observation of the inhibitive role of water for the selective oxidation chemistry, lends support to the hypothesis that formate is indeed a reactive intermediate. At first consideration it is not intuitively obvious why oxygen would diminish, rather than enhance, formate concentration at the catalyst surface. Reactions 5 and 6 below represent routes to its formation and removal from the surface. The source of hydrogen can be the reformate or surface OH groups which eventually are replenished.
CO+O2 + H2 HCOO- - ads (5)
HCOO- - ads + O2 CO2 + H2O (6)
Conclusions The current paper illustrates the complex nature of the
working preferential oxidation catalysts. Significant gains in understanding the fundamental processes taking place at the surface of such catalysts under reaction conditions have been achieved through the work summarized here. However, much remains to be done to achieve a detailed understanding of the nature of selective oxidation catalysts and in determining the key variables, which will lead to improvements in the catalyst and process. It is hoped that this illustration of the strong link between catalyst preparation, conditioning variables and performance will spur further work in the catalysis community to help gain better understanding of this important emerging area of catalysis.
Acknowledgment
Research carried out (in part) at the National Synchrotron Light Source, Brookhaven National Laboratory, which is supported by the U.S. Department of Energy, Division of Materials Sciences and Division of Chemical Sciences, under Contract No. DE-AC02-98CH10886.
References (1) (a) S. F. Abdo, C. A. DeBoy, G. S. Schroeder, US Patent
6,299,995; (b) US patent allowed, 2002 (2) A. Bottcher; H. Niehus Phys. Stat. Sol. (a) 1999, 173, 101 (3) K. Hadjiivanov; J. C. Lavalley; J. Lamotte; F. Mauge; M.
Che, J. Catal. 1998, 176, 415 (4) Y. D. Kim; S. Schwegmann; A. P. Seitsonen; H. Over, J.
Phys. Chem. B. 2001, 105, 2205 (5) W. F. Lin; P. A. Christensen, A. Hamnett; M. S. Zei; G. Ertl,
J. Phys. Chem. B. 2000, 104, 6642 (6) A.Bottcher; M. Rogozia; H. Niehus; H. Over; G. Ertl, J.
Phys. Chem. B. 1999, 103, 6267 (7) C. Elmasides; D. I. Kondarides; W. Grunert; X. E. Verykios,
J. Phys. Chem. B. 1999, 103, 52
TABLE 1. CONDITIONS FOR CATALYST EVALUATION
Gas Composition (dry basis)
Catalyst handling Procedures *Reactor loaded under N2 purge
Reaction Conditions *Reactor Pressure: 3.5 psig *GHSV: 5,000 hr/1-20,000 hr/1 *Evaluated temp range: 60ºC – 350ºC *Duration of test: 75min – 800min *Catalyst to Diluent ratio of 1:3
16.36% 0.64% 3.99% 6.66% 65.34% 5.55% 1.46% 27.62% 02/CO
CO2 CO CH4 Ne H2 N2 O2 H2O 2.2
Target Carbon Monoxide Level:<10ppm
TABLE 2. EXPERIMENTAL CONDITIONS Product Analysis Carbon Monoxide Detectors Low Range
*Infrared *Detection range: 0-1000ppm
High Range *Infrared *Detection range 0-10,000ppm
Carbon Dioxide Detectors *Infrared *Detection Range: 0-20%
Oxygen Detector *Paramagnetic
*Detection Range: 0-25%
Fuel Chemistry Division Preprints 2002, 47(2), 552

N2
H2 N2
Air
5°/min
30 min 5°/min
60
120
300°C
110°C
30°C
Figure 1. Typical Catalyst Activation Procedure
Figure 2. Micrographs of various eggshell profiles
4
1
3
2 Skewed Ru/Supp 3
Standard Ru/supp 2 Standard Ru/supp 1
Eggshell Ru/Supp 4
100
80
CO
Con
vers
ion
(%)
60
40
20
0 5000hr-1;T1 10000hr-1; T1 15000hr-1; T1 5000hr-1; T1
Test Condition
Figure 3. Impact of Support and Ruthenium Profile on CO Conversion, Inlet Temperature T1
Fuel Chemistry Division Preprints 2002, 47(2), 553
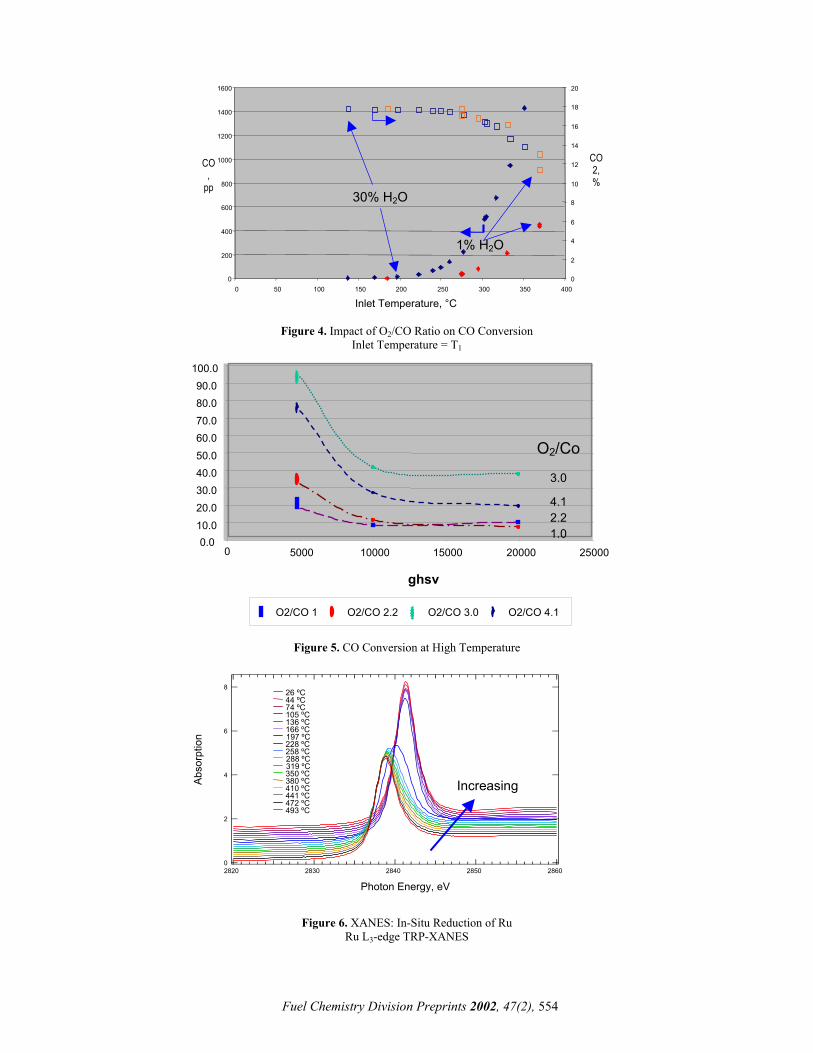
30% H2O
1% H2O
400 0
350 300 150 200 250 Inlet Temperature, °C
100 50
1600
1400
1200
1000
800
600
400
200
0 0
20 18 16 14
CO2, %
12 CO,
pp 10 8 6 4 2
Figure 4. Impact of O2/CO Ratio on CO Conversion
Inlet Temperature = T1
100.0
O2/Co
3.0
1.02.2 4.1
O2/CO 4.1 O2/CO 3.0O2/CO 2.2O2/CO 1 ghsv
2500020000 15000 100005000 0
90.0 80.0 70.0
60.0 50.0 40.0
30.0
0.0 20.0
10.0
Figure 5. CO Conversion at High Temperature
8
6
4
2
0 28602850 284028302820
Increasing
26 ºC 44 ºC 74 ºC 105 ºC 136 ºC 166 ºC 197 ºC 228 ºC 258 ºC 288 ºC 319 ºC 350 ºC 380 ºC 410 ºC 441 ºC 472 ºC 493 ºC
Abso
rptio
n
Photon Energy, eV
Figure 6. XANES: In-Situ Reduction of Ru
Ru L3-edge TRP-XANES
Fuel Chemistry Division Preprints 2002, 47(2), 554

2841.5
2841.0
Peak
Max
imum
Ene
rgy,
eV
2840.5
2840.0
2839.5
2839.0
100 200 300 400L3_tprmax Temperature, ºC
Figure 7. XANES: In-Situ Reduction of Ru
2-flat
1- “eggshell
Nor
mal
ized
Inte
nsity
10504601.s1
0.
0.0.
0.0.0.
0.0.
0.
290
29 28 28 27
Ru 3d
Figure 8. XPS Comparison of Exterior of “Eggshell” and Flat Catalyst Preparations
H2,
CO, O2
Ru0RuOx
Al2O3
Figure 9. Model of Selective Oxidation Catalyst
Fuel Chemistry Division Preprints 2002, 47(2), 555
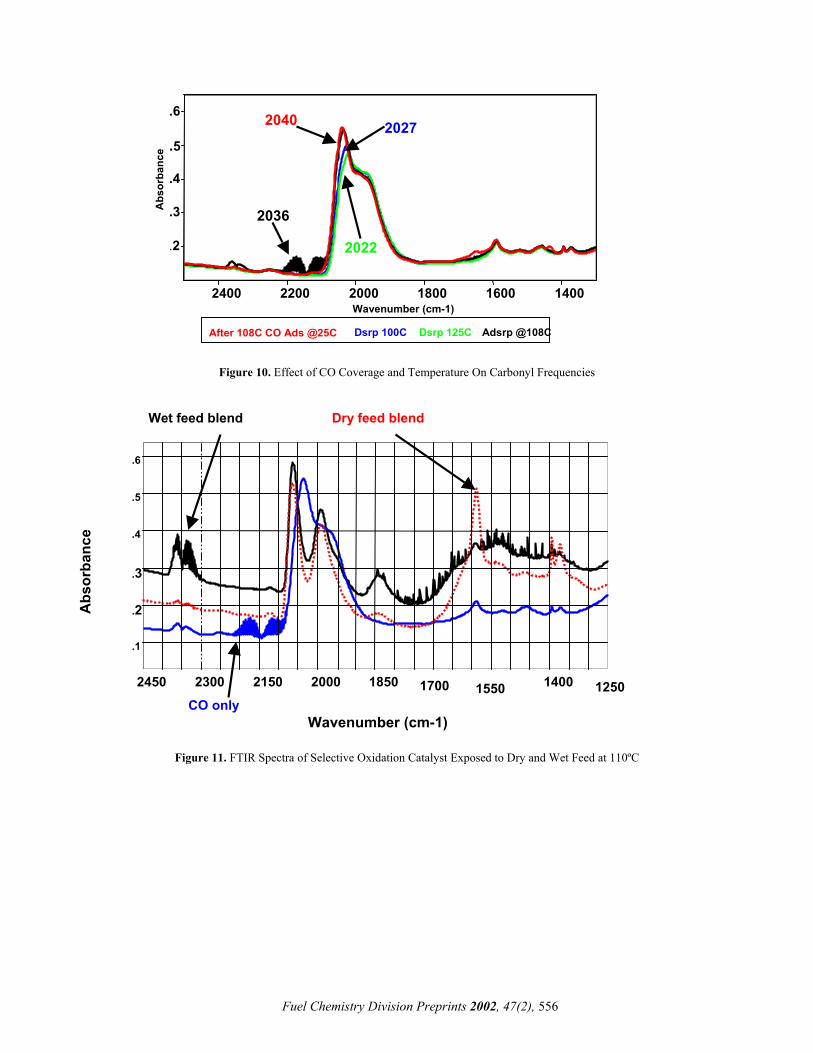
2022
2036
20272040
Adsrp @108CDsrp 125CDsrp 100C After 108C CO Ads @25C
1400 1600 2000 1800 Wavenumber (cm-1)
2200 2400
.6
5
.3
.4
.A
bsor
banc
e
.2
Figure 10. Effect of CO Coverage and Temperature On Carbonyl Frequencies
Wet feed blend
Dry feed blend
CO only Wavenumber (cm-1)
1250 1400
1550 1700 1850 2000 2150 2300 2450
.6
.5
.4
.3
.1
.2Abs
orba
nce
Figure 11. FTIR Spectra of Selective Oxidation Catalyst Exposed to Dry and Wet Feed at 110ºC
Fuel Chemistry Division Preprints 2002, 47(2), 556
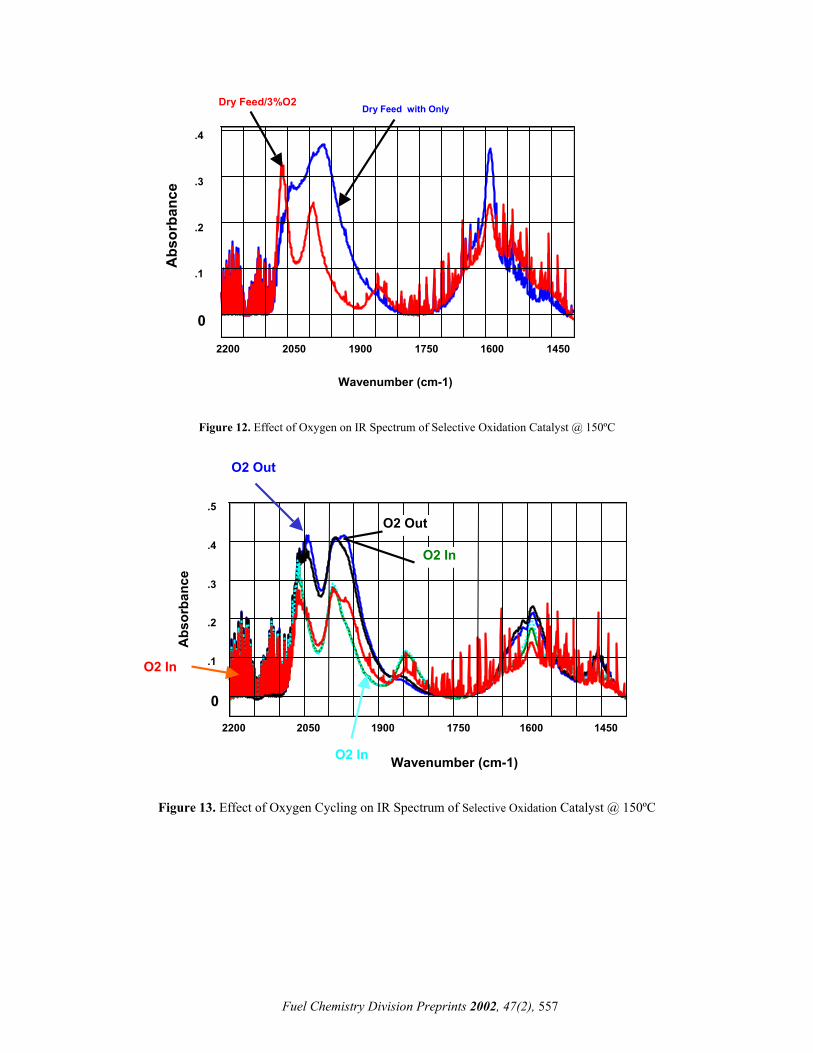
Dry Feed with OnlyDry Feed/3%O2
.4
.3 A
bsor
banc
e
.2
.1
0
2200 2050 1900 1600 1450 1750 Wavenumber (cm-1)
Figure 12. Effect of Oxygen on IR Spectrum of Selective Oxidation Catalyst @ 150ºC
O2 Out
O2 Out
O2 In
1450 1600 1750 1900 2050 2200
Abs
orba
nce
.5
.4
.3
.2
.1
0
O2 In
O2 In
Wavenumber (cm-1)
Figure 13. Effect of Oxygen Cycling on IR Spectrum of Selective Oxidation Catalyst @ 150ºC
Fuel Chemistry Division Preprints 2002, 47(2), 557

FUEL REFORMING FOR SOLID OXIDE FUEL CELLS
Amar Anumakonda*, Robin Wang, Estela Ong, Rajiv Doshi, Jie Guan, Simon Huss, Kurt Montgomery, and Nguyen Minh
General Electric Company
Fuel Processing Team 50 East Algonquin Road Des Plaines, IL 60563
*Formerly with Honeywell and currently with HyRadix Inc
Solid oxide fuel cell (SOFC) is one of the most promising power generation technologies. The main advantages of SOFC are the ability to utilize syngas (both hydrogen carbon monoxide) as feed, solid-state construction, and high operating temperature. One of the critical components of an SOFC system is the fuel processor that can convert hydrocarbon feed into syngas. A lightweight, compact, and robust fuel processor has been developed for converting fuels such as logistic fuel (JP-8) or diesel (DF-2) to syngas as feed for SOFC. In this paper, a fuel processing technology using catalytic partial oxidation (CPOX) is described. Several scale-up issues will be discussed in this presentation. One of the key issues is carbon deposition. The other issue is sulfur poisoning on catalyst. Some performance factors such as carbon to oxygen ratio and yields will also be discussed. Other issues such as thermal management will also be addressed. Heavy hydrocarbons tend to increase the potential problem of carbon formation in the conversion process. Carbon formation arises from the thermal cracking of hydrocarbons that can produce carbon-rich compounds (i.e., carbonaceous polymers) and, ultimately, coke. Thereby, system degradation can occur by deposition of carbon on catalysts. In turn, the carbon deposition can lead to plugging. The problem of carbon formation has been extensively addressed in the literature. In addition to carbon formation, the presence of sulfur can cause degradation of fuel processor performance. In both light and heavy hydrocarbon fuels, sulfur is present in varying amounts (ranging from a few ppm to 0.3 wt%, typically 0.05-0.07%). As with carbon formation, sulfur can poison the catalyst and do so to a point where the catalyst becomes completely deactivated. Catalysts based upon nickel or platinum have appeared to be particularly susceptible to poisoning. It has been postulated that sulfur forms surface stable compounds with the catalyst. Thereby, catalyst active sites for oxidation are depleted and efficient production of hydrogen and carbon monoxide through catalytic partial oxidation is hindered. One potential solution has been to remove the sulfur prior to processing. Nickel or other transition metals, such as iron, have been known to remove sulfur bearing organic compounds. One of the advantages of partial oxidation is system simplicity since only fuel and oxidizer are needed for reaction. The process can run without water addition, but still achieve high efficiency. This feature could be very attractive in applications where water is not easily available such as military operations. In the CPOX process to be discussed in this paper, the JP-8 is used as an example fuel and air is used as oxidizer. A common parameter used to describe the ratio of fuel to oxidizer is carbon to oxygen ratio (C/O). The C/O ratio can affect various aspects of a CPOX process, including hydrogen and carbon monoxide yields and carbon
formation. The effect of C/O ration on the performance will be briefly discussed. Since the partial oxidation process is exothermic, thermal management could be an issue, especially, for large-scale processes. Significant progress has been achieved in enabling the CPOX fuel processor to operate in a self-sustaining mode for smaller scale reactor system. However, proper design on thermal management for large-scale reactor system is critical in order to achieve high system efficiency. Finally, some applications of catalytic partial oxidation, especially in SOFC, will be discussed. The advantages and disadvantages of these applications will be addressed.
Fuel Chemistry Division Preprints 2002, 47(2), 505

ISSUES IN HYDROCARBON FUEL PROCESSING
K. Durai-Swamy, Daniel G. Loffler, Dylan Mason, Kyle Taylor & David Edlund,
IDATECH, P.O. Box 5339, Bend, OR, 97701
Abstract: Fuel cell applications require fuel processors for hydrogen production that are small, lightweight, and durable. In addition, they must operate with commercial-quality fuels under different load schedules. Finally, economic restrictions on hardware cost and fuel efficiency must be satisfied. The present communication describes our approach to design a commercially viable fuel processor addressing all those problems. In particular, we discuss issues related to thermal management (heat recovery, supplying heat to a small reactor), fuel variability (seasonal composition changes, contaminants such as sulfur content), balance of plant (fuel delivery, controls, power management), and load-following. This paper will present test results obtained with a fuel processor prototype confirming the design assumptions. Introduction:
IdaTech is committed to developing and marketing cutting-edge fuel cell products that will accelerate the transformation of the industry from infancy to maturity. IdaTech’s attractive and compact fuel cell system is being put through its paces by federal and private utilities. Our core technology is our patented methanol fuel processor, remarkable both for its small size and for the purity of the hydrogen it produces.
Since a widespread hydrogen fuel distribution infrastructure does not exist in any substantial capacity, and it is not likely to be introduced in the near term due to prohibitively high costs; a fuel processor (or reformer) is often considered to be an enabling component to a practical commercial fuel cell system. For instance, the PC-25 family of 200 kW fuel cell systems (commercially available from International Fuel Cells) utilizes a fuel processor that generates hydrogen from the feedstock, typically natural gas, propane, landfill gas, or digester gas. And Ballard's 250 kW stationary fuel cell system likewise incorporates a natural gas fuel processor to generate a hydrogen fuel stream. Practical fuel-cell systems rated <10 kW for the stationary and portable markets, and that use conventional fuels (feedstocks), have not yet been commercialized. In many cases, the preferred fuel for these applications will be a liquid hydrocarbon fuel. Liquid fuels offer the advantage of ease of transport and storage. Sulfur compounds and carbon monoxide, if present in the product hydrogen stream, will also poison the electrocatalysts used in the fuel cell. CONVENTIONAL FUEL PROCESSOR The fuel processor comprises a device for generating a hydrogen-rich product gas from a conventional fuel such as alcohols and hydrocarbons. The hydrogen-rich reformate stream produced by the fuel processor must be purified prior to feeding the hydrogen to the fuel cell. Both the fuel processor and the fuel cell are supported by a balance of plant (BOP) that includes pumps, fans, sensors, plumbing, heat exchangers, and at least one controller. A conventional fuel processor (see Figure 1) typically is based on either steam reforming or autothermal reforming and utilizes a series of unit operations to purify the hydrogen- rich reformate. However,
the purification methods (high- and low-temperature shift reactors followed by selective oxidation of carbon monoxide) only partially purify the product hydrogen[2-4]--common impurities such as sulfur compounds, unsaturated hydrocarbons, and amines, are not removed by the conventional purification methods. IDATECH™ FUEL PROCESSOR
In contrast, IdaTech is developing a unified fuel processor that incorporates a universal hydrogen purifier as an integral part of the device (see Figure 2). The concept behind our methanol fuel processor is as follows:
A fuel, such as a 67-33 mixture of methanol and water, is vaporized and fed into a reaction zone heated to 350 degrees centigrade. The methanol and water molecules in the vapor split into their component hydrogen, oxygen, and carbon atoms. This is the steam reformation process.
The gas then enters the purification chamber. There, the hydrogen molecules pass through a palladium-membrane complex developed by Dr. David Edlund. The membrane diverts unwanted molecules from the product hydrogen stream. The hydrogen is further purified in a catalytic bed and sent to the fuel cell.
The diverted molecules, including CO and CO2, are sent back into the combustion chamber, where they fuel the steam reformation process. After the initial start-up period, the fuel processor is entirely self-powered.
The hydrogen that exits the reformer has less than one part per million (ppm) carbon monoxide and less than five ppm carbon dioxide. And all this happens in a cylinder roughly twice the size of a breadbox. As small as it is, the processor is shrinking. IdaTech is developing an even more compact unit, about half the size of our current version.
Our fuel processor is also attractive to industries needing on-site hydrogen production. In addition, the purification chamber that uses the palladium alloy membrane is useful to industries needing to purify hydrogen.
This universal purifier is based on a palladium-alloy membrane (hydrogen selective) that rejects all impurities in the hydrogen-rich reformate stream, essentially passing only hydrogen[5]. Hydrogen-rich reformate is produced by steam reforming, but the product hydrogen is very pure (typically >99.95% hydrogen with <1 ppm CO). More importantly, trace contaminants such as sulfur compounds, unsaturated hydrocarbons, and amines, are rejected by the hydrogen purifier to yield a product hydrogen stream of superior quality. The high purity of the product hydrogen has been verified by analysis. Using a hydrocarbon feedstock containing about 3 ppm alkyl thiols (commercial natural gas) the product hydrogen stream was found to be >99.95% hydrogen with <1 ppm CO and <1 ppb total sulfur compounds. Hydrogen of this quality exceeds typical specifications for PEM fuel cells, typically given as <10 ppm CO and <50 ppb total sulfur. The hydrogen-selective membrane also yields the fuel-gas stream that supplies heat necessary to vaporize the feedstock and satisfy the endothermic enthalpy of the steam reforming reactions. This fuel-gas stream consists of the impurities that are rejected at the membrane along with some of the hydrogen produced by reforming.
Fuel Chemistry Division Preprints 2002, 47(2), 540

Fuel Composition: The IdaTech™ unified fuel processor for commonly available gaseous and liquid hydrocarbons (Natural gas, LPG, gasoline, naphtha, kerosene and diesel) has been carefully designed to take into consideration of fuel composition variability.
ProductHydrogen(40 - 60%)
SelectiveOxidationReactor
AIR
High-Temperature ShiftReactor
-
AutothermalReformer
HeatExchanger Heat
Exchanger
Water
Water
Feedstock
Low-Temperature ShiftReactor
Figure 2. The conventional fuel processing- autothermal reforming with multiple reactors and heat exchangers.
Seasonal variations in the composition of the commercial hydrocarbon fuels are large. These variations include types and quantities of sulfur compounds, olefins and other unsaturates’ levels and the presence of non-combustibles such as air, N2, CO2, H2O. Fuel processor must be designed to handle such variations. Thermal Management: In steam reforming hydrocarbons, the endothermic heat of reaction must be supplied externally. Process steam needs to be generated by vaporizing water. The raffinate (waste gas) from the purification membrane module and/or the anode off-gas contains heat value that could be used to supply the process heat. It is necessary to balance the available heat to the thermal needs of the process to achieve high thermal efficiency. The IdaTech™ unified fuel processor is designed with high degree of thermal integration achieving high thermal efficiency.
ProductHydrogen
(>99.95%)
SteamReformer
MembranePurifier
Feedstockand Water
Air
Balance of Plant: The balance of plant in steam reformer based fuel processor includes feed delivery systems, control systems for fast startup and fast response in load following. Since the IdaTech™ unified fuel processor has essentially one catalytic reactor, namely, the steam reformer, its load following ability is much greater than other fuel processors having multiple reactors in series such as the high- and low- temperature shift reactors and PROX reactors.
Figure 3. The IdaTech™ unified fuel processor REFERENCES
1. Wang, M.Q., GREET 1.5 - Transportation Fuel-Cycle Model, Vol. 1 and Vol. 2, (Aug. 1999), http://www.ipd.anl.gov/anlpubs/1999/10/34035.pdf Conclusion:
The IdaTech™ unified fuel processor has been tested with different hydrocarbon fuels and offers a compact hydrogen generator to get high purity hydrogen for PEM fuel cells.
2. Stell, S., and J. Cuzens “Fuel-flexible, fuel processing technology” Fuel Cells Bulletin, 7 (April 1999) 9-12
3. McNicol, B. “The oil industry response to the challenge of fuel cells” Fuel Cells Bulletin, 9 (June 1999) 6-11 Acknowledgement. The authors gratefully acknowledge the
help of Travis Bizjak, Jay Castino and Russ Zinner with the construction and operation of the unified fuel processor system.
4. Ahmed, S., R. Kumar, and M. Krumpelt “Fuel processing for fuel cell power plants”, Fuel Cells Bulletin, 12 (September 1999) 4-7
5. Edlund, D. “Versatile, low-cost and compact fuel processor for low-temperature fuel cells” Fuel Cells Bulletin, 14 (November 1999) 8-11
Fuel Chemistry Division Preprints 2002, 47(2), 541
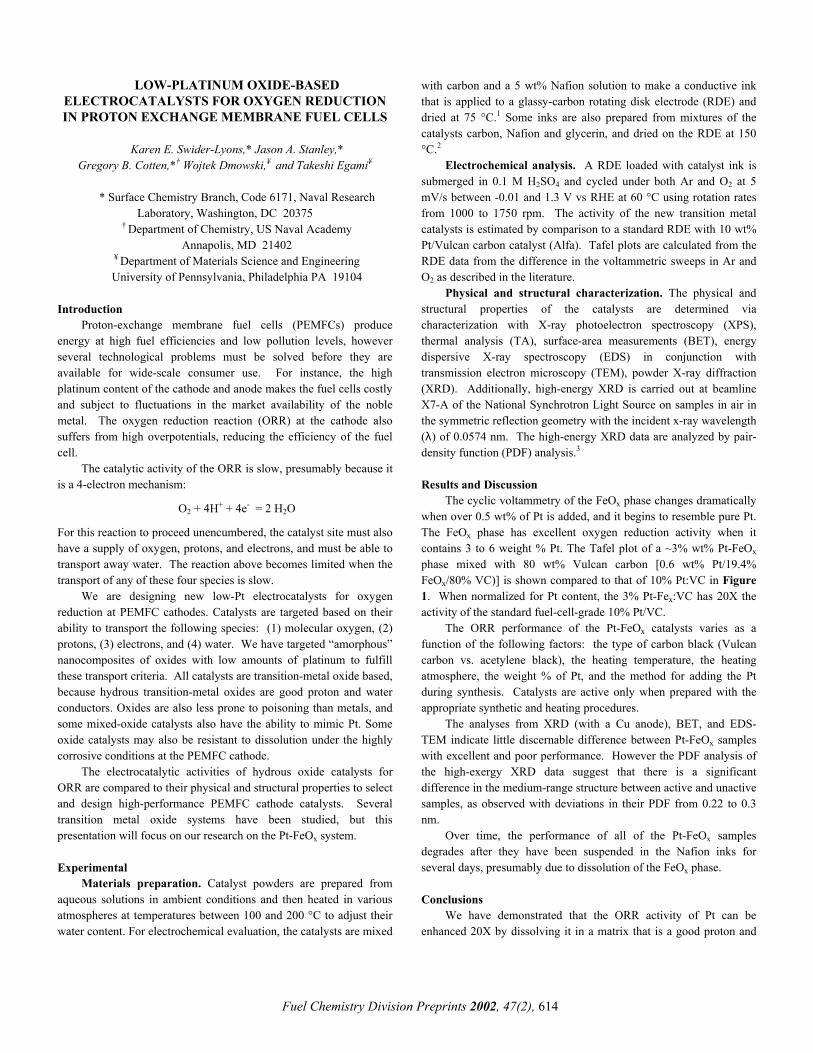
LOW-PLATINUM OXIDE-BASED ELECTROCATALYSTS FOR OXYGEN REDUCTION IN PROTON EXCHANGE MEMBRANE FUEL CELLS
Karen E. Swider-Lyons,* Jason A. Stanley,*
Gregory B. Cotten,*† Wojtek Dmowski,¥ and Takeshi Egami¥
* Surface Chemistry Branch, Code 6171, Naval Research Laboratory, Washington, DC 20375
† Department of Chemistry, US Naval Academy Annapolis, MD 21402
¥ Department of Materials Science and Engineering University of Pennsylvania, Philadelphia PA 19104
Introduction
Proton-exchange membrane fuel cells (PEMFCs) produce energy at high fuel efficiencies and low pollution levels, however several technological problems must be solved before they are available for wide-scale consumer use. For instance, the high platinum content of the cathode and anode makes the fuel cells costly and subject to fluctuations in the market availability of the noble metal. The oxygen reduction reaction (ORR) at the cathode also suffers from high overpotentials, reducing the efficiency of the fuel cell.
The catalytic activity of the ORR is slow, presumably because it is a 4-electron mechanism:
O2 + 4H+ + 4e- = 2 H2O
For this reaction to proceed unencumbered, the catalyst site must also have a supply of oxygen, protons, and electrons, and must be able to transport away water. The reaction above becomes limited when the transport of any of these four species is slow.
We are designing new low-Pt electrocatalysts for oxygen reduction at PEMFC cathodes. Catalysts are targeted based on their ability to transport the following species: (1) molecular oxygen, (2) protons, (3) electrons, and (4) water. We have targeted “amorphous” nanocomposites of oxides with low amounts of platinum to fulfill these transport criteria. All catalysts are transition-metal oxide based, because hydrous transition-metal oxides are good proton and water conductors. Oxides are also less prone to poisoning than metals, and some mixed-oxide catalysts also have the ability to mimic Pt. Some oxide catalysts may also be resistant to dissolution under the highly corrosive conditions at the PEMFC cathode.
The electrocatalytic activities of hydrous oxide catalysts for ORR are compared to their physical and structural properties to select and design high-performance PEMFC cathode catalysts. Several transition metal oxide systems have been studied, but this presentation will focus on our research on the Pt-FeOx system. Experimental
Materials preparation. Catalyst powders are prepared from aqueous solutions in ambient conditions and then heated in various atmospheres at temperatures between 100 and 200 °C to adjust their water content. For electrochemical evaluation, the catalysts are mixed
with carbon and a 5 wt% Nafion solution to make a conductive ink that is applied to a glassy-carbon rotating disk electrode (RDE) and dried at 75 °C.1 Some inks are also prepared from mixtures of the catalysts carbon, Nafion and glycerin, and dried on the RDE at 150 °C.2
Electrochemical analysis. A RDE loaded with catalyst ink is submerged in 0.1 M H2SO4 and cycled under both Ar and O2 at 5 mV/s between -0.01 and 1.3 V vs RHE at 60 °C using rotation rates from 1000 to 1750 rpm. The activity of the new transition metal catalysts is estimated by comparison to a standard RDE with 10 wt% Pt/Vulcan carbon catalyst (Alfa). Tafel plots are calculated from the RDE data from the difference in the voltammetric sweeps in Ar and O2 as described in the literature.
Physical and structural characterization. The physical and structural properties of the catalysts are determined via characterization with X-ray photoelectron spectroscopy (XPS), thermal analysis (TA), surface-area measurements (BET), energy dispersive X-ray spectroscopy (EDS) in conjunction with transmission electron microscopy (TEM), powder X-ray diffraction (XRD). Additionally, high-energy XRD is carried out at beamline X7-A of the National Synchrotron Light Source on samples in air in the symmetric reflection geometry with the incident x-ray wavelength (λ) of 0.0574 nm. The high-energy XRD data are analyzed by pair-density function (PDF) analysis.3
Results and Discussion
The cyclic voltammetry of the FeOx phase changes dramatically when over 0.5 wt% of Pt is added, and it begins to resemble pure Pt. The FeOx phase has excellent oxygen reduction activity when it contains 3 to 6 weight % Pt. The Tafel plot of a ~3% wt% Pt-FeOx phase mixed with 80 wt% Vulcan carbon [0.6 wt% Pt/19.4% FeOx/80% VC)] is shown compared to that of 10% Pt:VC in Figure 1. When normalized for Pt content, the 3% Pt-Fex:VC has 20X the activity of the standard fuel-cell-grade 10% Pt/VC.
The ORR performance of the Pt-FeOx catalysts varies as a function of the following factors: the type of carbon black (Vulcan carbon vs. acetylene black), the heating temperature, the heating atmosphere, the weight % of Pt, and the method for adding the Pt during synthesis. Catalysts are active only when prepared with the appropriate synthetic and heating procedures.
The analyses from XRD (with a Cu anode), BET, and EDS-TEM indicate little discernable difference between Pt-FeOx samples with excellent and poor performance. However the PDF analysis of the high-exergy XRD data suggest that there is a significant difference in the medium-range structure between active and unactive samples, as observed with deviations in their PDF from 0.22 to 0.3 nm.
Over time, the performance of all of the Pt-FeOx samples degrades after they have been suspended in the Nafion inks for several days, presumably due to dissolution of the FeOx phase.
Conclusions
We have demonstrated that the ORR activity of Pt can be enhanced 20X by dissolving it in a matrix that is a good proton and
Fuel Chemistry Division Preprints 20 02, 47(2), 614
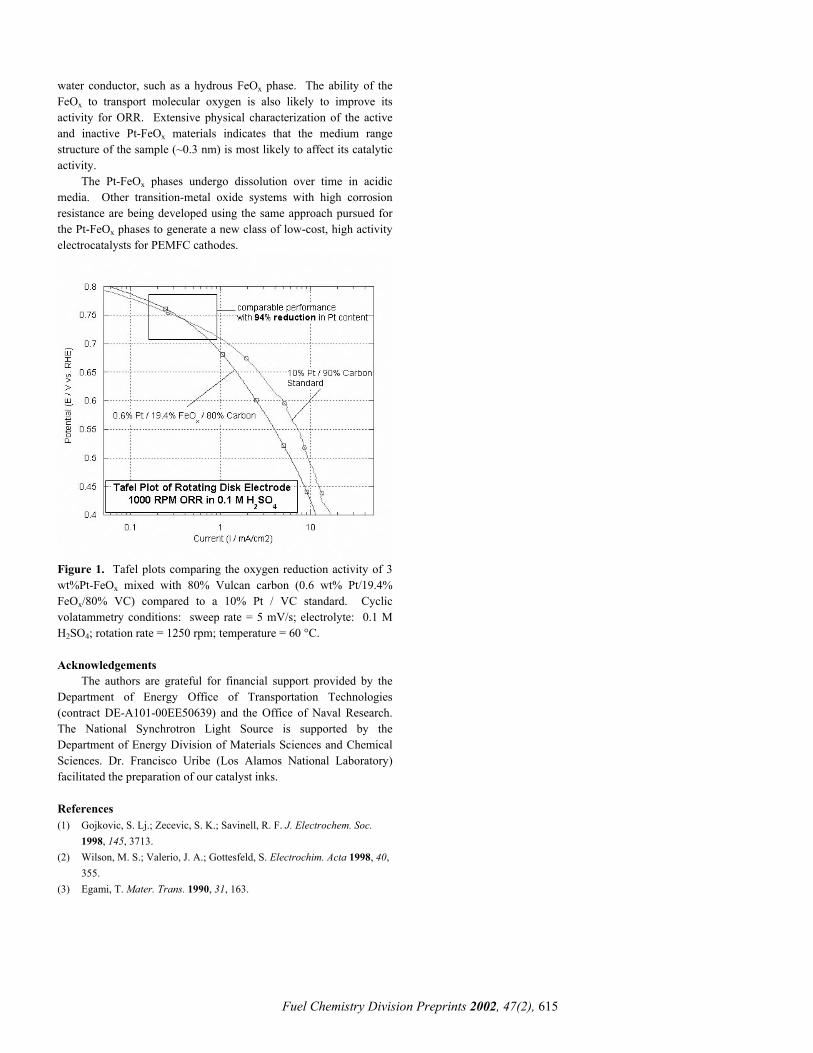
Fuel Chemistry Division Preprints 20 02, 47(2), 615
water conductor, such as a hydrous FeOx phase. The ability of the FeOx to transport molecular oxygen is also likely to improve its activity for ORR. Extensive physical characterization of the active and inactive Pt-FeOx materials indicates that the medium range structure of the sample (~0.3 nm) is most likely to affect its catalytic activity.
The Pt-FeOx phases undergo dissolution over time in acidic media. Other transition-metal oxide systems with high corrosion resistance are being developed using the same approach pursued for the Pt-FeOx phases to generate a new class of low-cost, high activity electrocatalysts for PEMFC cathodes.
Figure 1. Tafel plots comparing the oxygen reduction activity of 3 wt%Pt-FeOx mixed with 80% Vulcan carbon (0.6 wt% Pt/19.4% FeOx/80% VC) compared to a 10% Pt / VC standard. Cyclic volatammetry conditions: sweep rate = 5 mV/s; electrolyte: 0.1 M H2SO4; rotation rate = 1250 rpm; temperature = 60 °C. Acknowledgements
The authors are grateful for financial support provided by the Department of Energy Office of Transportation Technologies (contract DE-A101-00EE50639) and the Office of Naval Research. The National Synchrotron Light Source is supported by the Department of Energy Division of Materials Sciences and Chemical Sciences. Dr. Francisco Uribe (Los Alamos National Laboratory) facilitated the preparation of our catalyst inks. References (1) Gojkovic, S. Lj.; Zecevic, S. K.; Savinell, R. F. J. Electrochem. Soc.
1998, 145, 3713. (2) Wilson, M. S.; Valerio, J. A.; Gottesfeld, S. Electrochim. Acta 1998, 40,
355. (3) Egami, T. Mater. Trans. 1990, 31, 163.

Fuel Chemistry Division Preprints 2002, 47(2), 616
MONOPOLAR DIRECT METHANOL FUEL CELLS:HOW SIMPLE CAN YOU GET?
Alan Cisar, Chris Boyer, and James Evans
Lynntech, Inc.7610 Eastmark Dr.
College Station, TX 77840
IntroductionDirect methanol fuel cells (DMFC’s) are unique among fuel
cells in that they directly oxidize a carbon based fuel, methanol, atrelatively low temperatures (< 100 °C), and realize most of the storedchemical energy directly as electricity. Monopolar fuel cellsrepresent the simplest possible type of fuel cell, with all of thecathodes in a stack open to the atmosphere, with no flow fields.
Conventional fuel cell electrodes and gas diffusion structures donot have sufficient internal conductivity for use in an edge collectedmode, with all of the current flowing through the electrode structureto one edge. Adding an internal conductor to the electrode structurecan alleviate this problem. In this electrode design a metal gridserves the support role normally filled by the carbon cloth as well asadding in-plane conductivity to the electrode. The grid is coated witha gas diffusion matrix consisting of a mixture of conductive carbonpowder and conductive carbon fibers bonded with a polymer, such asPTFE. The entire assembly is bonded to a thin film electrode thathas been deposited on the surface of the membrane. Since the metalgrid is quite close to the membrane, it is imperative that the metalnot corrode, since corrosion will not only increase the contactresistance between the active portion of the electrode and the currentcollecting frame, but mobile metal ions coming in contact with themembrane will replace protons in the membrane. Replacing even asmall fraction of the protons in the membrane with far less mobilemetal ions will lead to a significant drop in membrane conductivity.
Adhesive Bond Gas Barrier
Anodes
Cathodes
Common Grid
Figure 1. Cross section view through two cells of a monopolar fuelcell stack showing how they are interconnected by sharing a commonconductive element within two of the electrodes.
ExperimentalWe have developed a stand alone DMFC power supply based on
a monopolar DMFC stack. The key to this power supply is aspecialized electrode structure.
Metal Grids for Use in Electrodes. Metal grids are used fortheir low sheet resistance when compared to traditional carboncloths. The metal grids used are selected so that they have a largepercentage of open space for delivering reactants to the catalyst. Atthe same time it is critical that electrical resistance within the grid beas low as possible. This means that if the grid is to have a largefraction of open area, it will need to be thicker to maintain anadequate cross section of metal to support the required electricalconductivity.
In general, expanded metal has been found to be an excellentmaterial for this application. The metal substrate can be selected tohave a combination of thickness and open area that yields the desiredbalance of fluid (gas or liquid) access and electrical conductivity.This material is commercially available in a wide combination of
thicknesses and open areas and from a variety of alloys. The basicstructure of expanded metal and the terminology used to describe itare illustrated in Figure 2. The metal grids are cut to the correct size,allowing for the predetermined cell size along with the needed areafor bonding around the perimeter of the cells.
A B
Figure 2. The basic structure of expanded metal. (A) indicates theterminology used to specify the material and (B) illustrates itsappearance.
Gas Diffusion Layer The gas diffusion layer is built around themetal grid, which serves as a support for the diffusion layer. It is aconductive paste that is applied to the metal grid, and upon curingremains porous permitting the reactants to flow to the catalyst and forthe byproducts (water, CO2) to exit the membrane surface. The gasdiffusion layer also has to be strong enough to resist the swellingforces produced by the membrane as it changes size due to hydrationand dehydration and to have sufficient internal cohesion to maintaingood physical stability. It must have sufficient adhesion to theelectrode to keep in good contact with the surface without anyexternal forces being applied.
A typical metal cored gas diffusion matrix consists of at leastthree components, conductive carbon powder, conductive carbonfibers, and a bonding agent to hold these components together and tobond them to the metal core. The bonding agent may be waterrepellant, such as the PTFE commonly used in all-carbon as diffusionstructures, or a separate water repellant agent may be included in theformulation. Water balance is especially important in the case ofcathodes in monopolar systems, where it is important that the waterproduced by the fuel cell reaction is evaporated and removed fromthe electrode so that it does not block the surface and prevent airaccess to the active electrocatalyst.
Results and DiscussionThe components for the fuel cell position of a 15 Watt power
supply were assembled. Figure 3 shows one of the substacks for thisforty cell fuel cell stack.
Figure 3. This figure shows a single leaf viewed from the cathodeface.
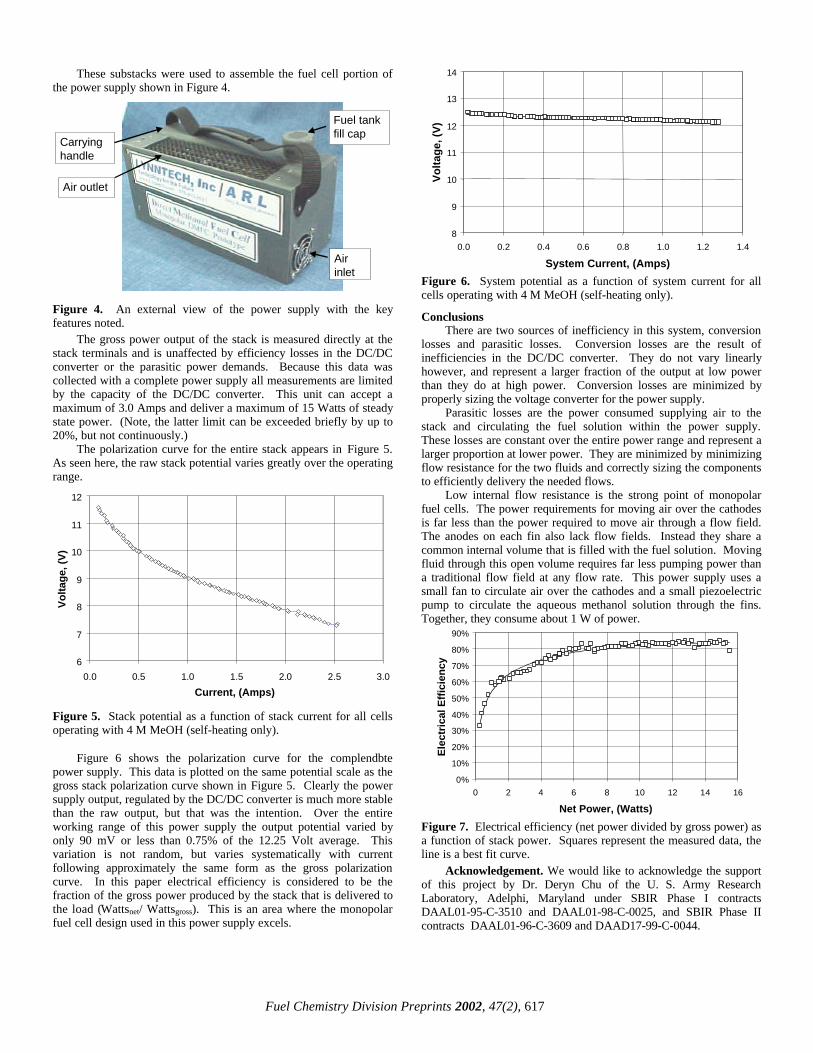
Fuel Chemistry Division Preprints 2002, 47(2), 617
These substacks were used to assemble the fuel cell portion ofthe power supply shown in Figure 4.
Airinlet
Fuel tankfill cap
Air outlet
Carryinghandle
Figure 4. An external view of the power supply with the keyfeatures noted.
The gross power output of the stack is measured directly at thestack terminals and is unaffected by efficiency losses in the DC/DCconverter or the parasitic power demands. Because this data wascollected with a complete power supply all measurements are limitedby the capacity of the DC/DC converter. This unit can accept amaximum of 3.0 Amps and deliver a maximum of 15 Watts of steadystate power. (Note, the latter limit can be exceeded briefly by up to20%, but not continuously.)
The polarization curve for the entire stack appears in Figure 5.As seen here, the raw stack potential varies greatly over the operatingrange.
6
7
8
9
10
11
12
0.0 0.5 1.0 1.5 2.0 2.5 3.0
Current, (Amps)
Vo
ltag
e, (V
)
Figure 5. Stack potential as a function of stack current for all cellsoperating with 4 M MeOH (self-heating only).
Figure 6 shows the polarization curve for the complendbtepower supply. This data is plotted on the same potential scale as thegross stack polarization curve shown in Figure 5. Clearly the powersupply output, regulated by the DC/DC converter is much more stablethan the raw output, but that was the intention. Over the entireworking range of this power supply the output potential varied byonly 90 mV or less than 0.75% of the 12.25 Volt average. Thisvariation is not random, but varies systematically with currentfollowing approximately the same form as the gross polarizationcurve. In this paper electrical efficiency is considered to be thefraction of the gross power produced by the stack that is delivered tothe load (Wattsnet/ Wattsgross). This is an area where the monopolarfuel cell design used in this power supply excels.
8
9
10
11
12
13
14
0.0 0.2 0.4 0.6 0.8 1.0 1.2 1.4
System Current, (Amps)
Vo
ltag
e, (V
)
Figure 6. System potential as a function of system current for allcells operating with 4 M MeOH (self-heating only).
ConclusionsThere are two sources of inefficiency in this system, conversion
losses and parasitic losses. Conversion losses are the result ofinefficiencies in the DC/DC converter. They do not vary linearlyhowever, and represent a larger fraction of the output at low powerthan they do at high power. Conversion losses are minimized byproperly sizing the voltage converter for the power supply.
Parasitic losses are the power consumed supplying air to thestack and circulating the fuel solution within the power supply.These losses are constant over the entire power range and represent alarger proportion at lower power. They are minimized by minimizingflow resistance for the two fluids and correctly sizing the componentsto efficiently delivery the needed flows.
Low internal flow resistance is the strong point of monopolarfuel cells. The power requirements for moving air over the cathodesis far less than the power required to move air through a flow field.The anodes on each fin also lack flow fields. Instead they share acommon internal volume that is filled with the fuel solution. Movingfluid through this open volume requires far less pumping power thana traditional flow field at any flow rate. This power supply uses asmall fan to circulate air over the cathodes and a small piezoelectricpump to circulate the aqueous methanol solution through the fins.Together, they consume about 1 W of power.
0%
10%
20%
30%
40%
50%
60%
70%
80%
90%
0 2 4 6 8 10 12 14 16
Net Power, (Watts)
Ele
ctri
cal E
ffic
ien
cy
Figure 7. Electrical efficiency (net power divided by gross power) asa function of stack power. Squares represent the measured data, theline is a best fit curve.
Acknowledgement. We would like to acknowledge the supportof this project by Dr. Deryn Chu of the U. S. Army ResearchLaboratory, Adelphi, Maryland under SBIR Phase I contractsDAAL01-95-C-3510 and DAAL01-98-C-0025, and SBIR Phase IIcontracts DAAL01-96-C-3609 and DAAD17-99-C-0044.

Fuel Chemistry Division Preprints 2002, 47(2), 605
Nanocrystalline Ceria-based Catalysts for Water-gas ShiftQi Fu, Steven Fiore, Howard Saltsburg, Xiaomei Qi,
Maria Flytzani-StephanopoulosDepartment of Chemical and Biological Engineering
Tufts University4 Colby Street, Medford, MA 02155, USA
Introduction: Water-gas-shift is a mature industrial process, which is applied inthe production of hydrogen for ammonia synthesis and for adjustingthe CO/H2 ratio for the subsequent synthesis of methanol. Presently,there is a renewed interest in the water gas shift reaction because ofits potential use in conjunction with fuel cell power generation.Advanced catalysts for the water-gas shift reaction are being activelysought by the developers of fuel cells. From the review of the water-gas shift reaction literature, ceriumoxide-based catalysts are singled out as very promising for both low-and high-temperature application. Cerium oxide can supply itssurface oxygen, thus catalyzing a variety of oxidation reactions,including WGS. Nanocrystalline ceria is much more reducible thanwell-crystallized materials [1]. The addition of platinum metals, goldand base metal oxides, such as copper oxide, can significantlyenhance the reducibility and WGS activity of ceria [2-5]. Dopantssuch as La or Zr oxides are added to ceria to suppress its crystalgrowth at high temperatures, and to also increase its reducibility. Preparation, characterization, and catalytic properties of CuxO- orAu- ceria catalysts prepared as nanostructured materials are reportedin this paper. Catalysts were characterized by XRD, XPS,STEM/EDS, HREM, TPR, and oxygen storage capacity (OSC)measurements.
Experimental:Catalyst preparation Bulk doped or undoped ceria and CuxO-
ceria were synthesized by the urea gelation/coprecipitation method(UGC), as described in detail elsewhere [3]. The cerium salt used inUGC is (NH4)2Ce(NO3)6. In brief, aqueous metal nitrate solutionswere mixed with urea and heated to 100 oC under vigorous stirringand addition of deionized water. The resulting gel was aged for 8hours at 100 oC; after aging, the precipitate was filtered and washed.Further, the precipitate was dried at 100-120 oC and calcined in staticair at 400 oC for 10 h or 650 oC for 4 h. A slow heating rate, 2oC/min, was used to reach the desired calcination temperature. In allpreparation methods used in this work, the same heat treatmentprocedure was followed.
Gold-ceria samples were prepared by coprecipitation (CP) andby deposition precipitation (DP) of gold on ceria made by the aboveUGC method. The CP method involves mixing an aqueous solutionof HAuCl4, cerium (III) nitrate and lanthanum nitrate with(NH4)2CO3 at 60-70 oC, keeping a constant pH value of 8 and agingthe precipitate at 60-70 oC for 1h. Deposition-precipitation took placeby adding the desired amount of HAuCl4 dropwise into an aqueousslurry of the prepared ceria. The pH of the aqueous slurry had alreadybeen adjusted to the value of 8 using (NH4)2CO3. The resultingprecipitate was aged at room temperature for 1h. A few gold-ceriasamples were prepared by UGC, following the procedure describedabove.
Catalyst characterization The total sample surface area wasmeasured by single-point BET N2 adsorption/desorption on aMicromeritics Pulse ChemiSorb 2705.
X-ray powder diffraction (XRD) analysis of the samples wasperformed on a Rigaku 300 X-ray Diffractometer with RotatingAnode Generators and a monochromatic detector. Copper Karadiation was used. High-resolution transmission electron microscopy(HREM) performed on a JEOL 2010 instrument with an ultimate
point-to-point resolution of 1.9 Å and lattice resolution of 1.4 Å. AKratos AXIS Ultra Imaging X-ray Photoelectron Spectrometer with aresolution of 0.1 eV was used to determine the atomic metal ratios ofthe surface region and the metal oxidation state of selected catalysts.
Activity tests Water-gas shift reaction tests were performed in aquartz-tube flow reactor. A simulated reformate feed gas mixture wasused containing 11% CO, 11% CO2, 26 % H2, and 26 % H2O inhelium. The reactant and product gas streams were analyzed using aHP-6890 gas chromatograph equipped with a thermal conductivitydetector (TCD).
Temperature-programmed reduction (TPR) Temperature-programmed reduction (TPR) of the as-prepared catalysts in finepowder form was carried out in a Micromeritics Pulse ChemiSorb2705 instrument. The gas streams were monitored by TCD for H2-TPR, while a mass-spectrometer (MKS-model RS-1) is used in CO-TPR. A 20% H2/N2 or 10%CO/He gas mixture (50 cm3/min (NTP))was used as reducing gas. The sample was heated at a rate of 5°C/min from room temperature to 900 °C.
Oxygen storage capacity (OSC) measurements Oxygenstorage capacity measurements were carried out in a flow reactorsystem, equipped with a switching valve for rapid introduction ofstep changes in gas streams of CO/He, He, and O2/He. A total gasflow rate of 50 cm3/min (NTP) was used. The sample was exposed to10% CO/He and 10% O2/He step changes at the desired testtemperature. The steady-state signals of CO, CO2 and O2 weredetected by mass spectrometry.
Results and Discussion: The backbone of the catalyst is ceria, while the metal or metaloxide is the minor phase. The amount of La or Zr oxide used asdopant in ceria, was varied from 10 to 30 at. %. Physical propertiesof some materials are listed in Table 1. As shown in Table 1, the ceria lattice parameter α increaseswith La content, while it decreases when Zr is used as dopant. Theaddition of copper oxide also decreased the lattice parameter ofceria.
Table 1. Physical properties of as-prepared materials
(Prepared by urea coprecipitation/gelation method, calcined at 400 oC)
BET S. A.
(m2/g)
CeO2 lattice
parameters α (Å)
CeO2 particle size
(nm)Sample
<111> <200>
CeO2 140.5 5.417 6.2 5.5
Ce(10La)Ox 161.6 5.435 5.1 4.8Ce(30La)Ox 175.0 5.461 4.3 3.9
Ce(30Zr)Ox 169.1 5.364 4.1 3.7
10CuCeOx 177.7 5.417 4.8 4.5
10CuCe(10La)Ox 200.3 5.419 4.0 3.5
10CuCe(30La)Ox 176.1 5.422 4.3 3.3
10CuCe(30Zr)Ox 168.0 5.352 4.2 3.9
0.5AuCe(10La)Ox -- 5.432 4.2 3.8
5AuCe(10La)Ox -- 5.438 4.5 4.1
10AuCe(10La)Ox 158.1 5.439 4.5 4.4
The surface oxygen of ceria is substantially weakened bygold or copper oxide as found by H2-TPR, Figure 1. OSCmeasurements using step pulses of CO were in agreement with theTPR results; the presence of gold or copper oxide greatly enhancesthe OSC of ceria, Figure 2. Carbon-containing species left on the

Fuel Chemistry Division Preprints 2002, 47(2), 606
surface after the CO step, can be fully removed with O2 or partiallyremoved with H2O [5].
Figure 1. (a) CL (UGC) (b) 5Cu-CL (UGC); (c) 10Cu-CL (UGC);(d) 8Au-CL (UGC); (e) 4.5Au-CL(DP); all materials calcined at 400oC, 10 h
0
200
400
600
800
1000
8AuCL(UGC) 4.5AuCL(DP) 10CuCL(UGC) 5CuCL(UGC) CL (UGC)
First CO step 350200100
µmol
CO
2
prod
uced
/gca
t
Figure 2. OSC of ceria-based catalysts at three differenttemperatures 350 oC, 200 oC and 100 oC; 10%CO/He, 10%O2/He,50cm3/min (NTP), all materials calcined at 400 oC, 10 h;CL: Ce(10La)Ox The amount of CO2 produced during the CO and O2 steps inOSC is a strong function of the type of dopant used in ceria. This isshown in Figure 3.
0
1
2
3
4
5
10CuC
eO2
10CuC
e(30
Zr)O
10CuC
e(10
La)O
10CuC
e(30
La)O
CO 2 p
rodu
ced
mol
/m2
O2 Step0
12
3
4
56
7
CO 2 p
rodu
ced
mo
l/m2 CO Step
Figure 3. OSC of ceria-based catalysts with different dopants at 350oC; 10%CO/He, 10%O2/He, 50cm3/min (NTP), all materials calcinedat 400 oC, 10 h.
WGS rate measurements were conducted with simulatedreformate gas mixtures. In 11%CO-7%CO2-26%H2O-26%H2-He gas
mixture, at 250 oC, the rate over 5-8%Au-ceria(La)Ox catalysts is 6-9µmol/gcat*sec, while that over 10%CuCe(La)Ox is 3.2 µmol/gcat*sec. At 350 oC, the WGS reaction rate over the same gold andcopper-ceria catalysts is 22-47.5 and 31 µmol/gcat*sec, respectively,Figure4.
• 8Au-CL (UGC) 4.5Au-CL(DP) * 10Cu-Ce(10La)Ox (UGC)
º 10Cu-Ce(30La)Ox(UGC) ♦ 10Cu-Ce(30Zr)Ox (UGC)
Figure 4 WGS rate over various ceria-based materials calcined at400 oC, 10h; Simulated reformate gas mixture: 11% CO /7% CO2/26% H2 /26% H2O /He
Conclusions: Nanocrystalline ceria-based materials are active water-gasshift catalysts. Activity and reducibility greatly depend on thestructural properties of these materials.
Acknowledgement: The financial support of this work by NSF/EPA, Grant # CTS-9985305, and by the DOE/ Univ. Coal Res. Program, Grant # DE-FG2600-NT40819, is gratefully acknowledged.
References:1. Chiang, Y. M.; Lavik, E.B.; Kosacki, I.; Tuller, H. L.; and Ying,
J.Y.; J. Electroceramics, 1997, 1, 7.2. T. Bunluesin, R.J. Gorte, Appl. Catal. B 15 (1998) 107.3. Li, Y.; Fu, Q.; Flytzani-Stephanopoulos, M.; Appl. Catal. B:,
2000, 27, 179.4. Fu, Q.; Weber, A.; Flytzani-Stephanopoulos, M.; Catal. Letters,
2001, 77 (1/3) 87.5. Fu, Q.; Kudriavtseva, S.; Saltsburg, H.; Flytzani-Stephanopoulos,
M.; Chem. Eng. J., in press.
250 oC350 oC 300 oC0.1
1
10
100
1.5 1.6 1.7 1.8 1.9 2
1000/T, 1/K
Rate,
m
ol/g
cat*
sec
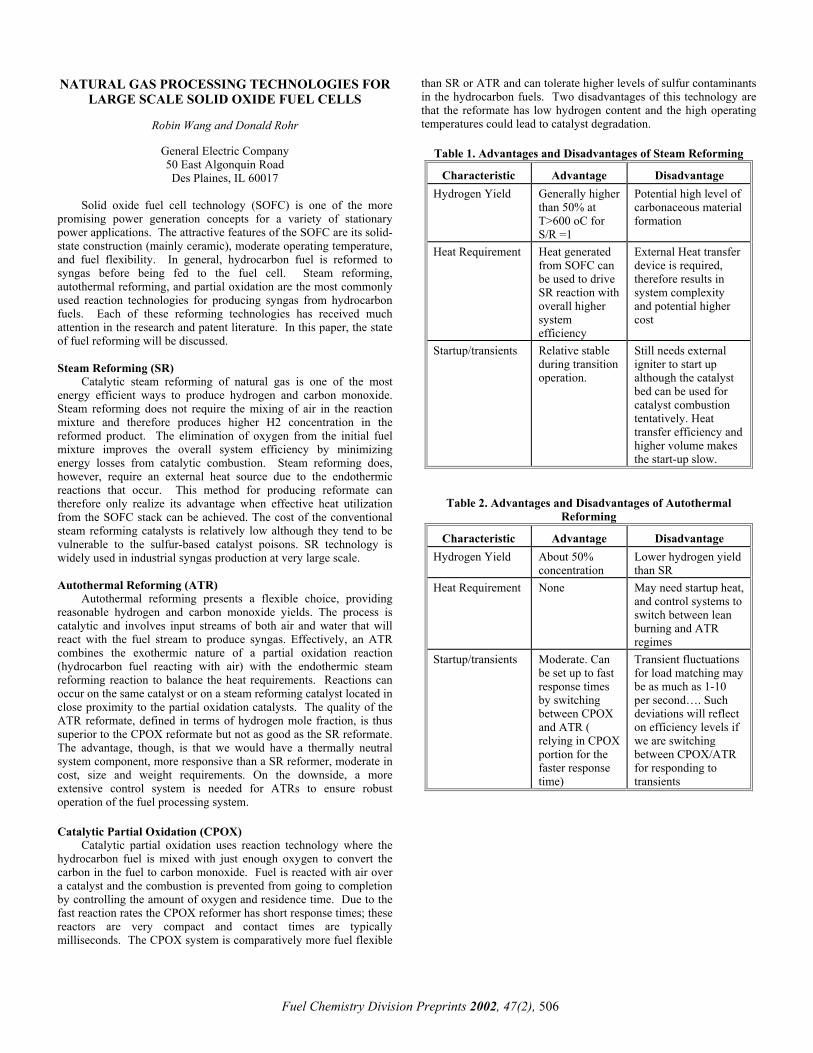
NATURAL GAS PROCESSING TECHNOLOGIES FOR LARGE SCALE SOLID OXIDE FUEL CELLS
Robin Wang and Donald Rohr
General Electric Company 50 East Algonquin Road Des Plaines, IL 60017
Solid oxide fuel cell technology (SOFC) is one of the more
promising power generation concepts for a variety of stationary power applications. The attractive features of the SOFC are its solid-state construction (mainly ceramic), moderate operating temperature, and fuel flexibility. In general, hydrocarbon fuel is reformed to syngas before being fed to the fuel cell. Steam reforming, autothermal reforming, and partial oxidation are the most commonly used reaction technologies for producing syngas from hydrocarbon fuels. Each of these reforming technologies has received much attention in the research and patent literature. In this paper, the state of fuel reforming will be discussed. Steam Reforming (SR)
Catalytic steam reforming of natural gas is one of the most energy efficient ways to produce hydrogen and carbon monoxide. Steam reforming does not require the mixing of air in the reaction mixture and therefore produces higher H2 concentration in the reformed product. The elimination of oxygen from the initial fuel mixture improves the overall system efficiency by minimizing energy losses from catalytic combustion. Steam reforming does, however, require an external heat source due to the endothermic reactions that occur. This method for producing reformate can therefore only realize its advantage when effective heat utilization from the SOFC stack can be achieved. The cost of the conventional steam reforming catalysts is relatively low although they tend to be vulnerable to the sulfur-based catalyst poisons. SR technology is widely used in industrial syngas production at very large scale. Autothermal Reforming (ATR)
Autothermal reforming presents a flexible choice, providing reasonable hydrogen and carbon monoxide yields. The process is catalytic and involves input streams of both air and water that will react with the fuel stream to produce syngas. Effectively, an ATR combines the exothermic nature of a partial oxidation reaction (hydrocarbon fuel reacting with air) with the endothermic steam reforming reaction to balance the heat requirements. Reactions can occur on the same catalyst or on a steam reforming catalyst located in close proximity to the partial oxidation catalysts. The quality of the ATR reformate, defined in terms of hydrogen mole fraction, is thus superior to the CPOX reformate but not as good as the SR reformate. The advantage, though, is that we would have a thermally neutral system component, more responsive than a SR reformer, moderate in cost, size and weight requirements. On the downside, a more extensive control system is needed for ATRs to ensure robust operation of the fuel processing system.
Catalytic Partial Oxidation (CPOX) Catalytic partial oxidation uses reaction technology where the
hydrocarbon fuel is mixed with just enough oxygen to convert the carbon in the fuel to carbon monoxide. Fuel is reacted with air over a catalyst and the combustion is prevented from going to completion by controlling the amount of oxygen and residence time. Due to the fast reaction rates the CPOX reformer has short response times; these reactors are very compact and contact times are typically milliseconds. The CPOX system is comparatively more fuel flexible
than SR or ATR and can tolerate higher levels of sulfur contaminants in the hydrocarbon fuels. Two disadvantages of this technology are that the reformate has low hydrogen content and the high operating temperatures could lead to catalyst degradation.
Table 1. Advantages and Disadvantages of Steam Reforming
Characteristic Advantage Disadvantage Hydrogen Yield Generally higher
than 50% at T>600 oC for S/R =1
Potential high level of carbonaceous material formation
Heat Requirement Heat generated from SOFC can be used to drive SR reaction with overall higher system efficiency
External Heat transfer device is required, therefore results in system complexity and potential higher cost
Startup/transients Relative stable during transition operation.
Still needs external igniter to start up although the catalyst bed can be used for catalyst combustion tentatively. Heat transfer efficiency and higher volume makes the start-up slow.
Table 2. Advantages and Disadvantages of Autothermal
Reforming
Characteristic Advantage Disadvantage Hydrogen Yield About 50%
concentration Lower hydrogen yield than SR
Heat Requirement None May need startup heat, and control systems to switch between lean burning and ATR regimes
Startup/transients Moderate. Can be set up to fast response times by switching between CPOX and ATR ( relying in CPOX portion for the faster response time)
Transient fluctuations for load matching may be as much as 1-10 per second…. Such deviations will reflect on efficiency levels if we are switching between CPOX/ATR for responding to transients
Fuel Chemistry Division Preprints 2002, 47(2), 506

Fuel Chemistry Division Preprints 2002, 47(2), 507
Table 3. Advantages and Disadvantages of Catalytic Partial Oxidation
Characteristic Advantage Disadvantage Hydrogen Yield Relatively low yield
can be tuned by improving catalyst and convert some CO back to H2.
Heat Requirement No external heat required. The system id exothermic
The heat generated from the reaction needs to removed or utilized in the system.
Startup/Transients Startup is fast. Transient test is relatively easy to control.
High temperature startup/shutdowns may cause catalyst degradation.
Additional Startup is fast. Transient test is relatively easy to control.
High temperature startup/shutdowns may cause catalyst degradation.

Fuel Chemistry Division Preprints 2002, 47(2), 538
RECENT DEVELOPMENT OF AUTOMOTIVE FUELPROCESSOR TECHNOLOGIES
Nancy L. Garland, Patrick Davis, and Donna Lee Ho
Office of Advanced Automotive TechnologiesU.S. Department of Energy
1000 Independence Avenue, SWWashington DC 20375-0121
IntroductionThe goal of the Fuel Cells for Transportation Program at the
Department of Energy (DOE) is to develop materials, components, andenabling technologies for highly efficient, low or zero-emission, cost-competitive automotive fuel cell power systems. For light-duty vehicleapplications, most of the R&D efforts are concentrated on polymerelectrolyte membrane (PEM) fuel cells, which operate at lowtemperature (80 - 90°C) and have minimal start-up and transientresponse times compared to other types of fuel cells. PEM fuel cellsoperate on direct hydrogen provided from an on-board hydrogen storagevessel or on hydrogen-rich fuel produced by an on-board fuel processorusing hydrocarbon fuels. DOE is pursuing a dual fuel-pathway strategy. For near-term implementation of fuel cell vehicles, on-board fuel-flexible fuel processing is the focus of R&D efforts, taking advantage ofthe existing infrastructure of hydrocarbon fuels. Fuels from diverseenergy sources (methanol, ethanol, natural gas, and gasoline) can bereformed in a fuel-flexible fuel processor to produce hydrogen on-board. In the long term, fuel cell vehicles will operate on hydrogen supplied byan off-board hydrogen infrastructure and which is stored on board thevehicle.
On-Board Fuel Processing ChallengesA number of critical barriers exist which prevent the commercial
introduction of fuel cell vehicles into the marketplace today. Thetechnical barriers include: cost, reliability and durability of componentsand systems; thermal, air and water management of systems; and asuitable hydrogen fuel infrastructure. For fuel cell vehicles with on-board fuel processors, additional issues arise which include reactor sizeand weight as well as fuel processor start-up and transient response time.Current fuel processors are too heavy and bulky which not only makespackaging into a passenger vehicle difficult if not impossible butsignificantly impacts start-up and transient operation. Current start-uptimes for fuel processors vary between several minutes and half an hour.A start-up time of less than 30 seconds will be needed eventually.Another issue for on-board fuel-flexible fuel processors is contaminationof fuel processor catalysts by sulfur in the fuel. Sulfur levels will belowered in the future. In 2004, EPA Tier 2 gasoline (30 ppm sulfur, 80ppm maximum) will be introduced to reduce light-duty vehicleemissions. Even with the lower sulfur levels, some fuel processorcatalysts will be irreversibly poisoned by sulfur compounds. Sulfur-tolerant fuel processor components will need to be developed foroperation on the Tier 2 gasoline. Design considerations will includesulfur level in the fuel and fuel processor design, i.e., location of thedesulfurizer in the chain of reactors, which make up the fuel processor.
New DOE Projects Address Fuel Processor Start-Up Issue:To address the issues described above, DOE recently began new
R&D efforts emphasizing rapid-start fuel processing technologies. These new approaches include: development of a low thermal-mass fuelprocessor with a novel balance-of-plant design; development of a platereactor fuel processor to minimize reactor size and provide optimumtemperature control; and optimization of microchannel reactors withmicrocombustor and microvaporizer components.
To achieve high efficiency and quick-start, Nuvera Fuel Cells Inc.will combine their existing low thermal-mass catalytic fuel processorwith an advanced, integrated balance-of-plant. Nuvera will optimizetheir Substrate based Transportation application AutothermalReformer (STAR, see Figure 1) which is expected to generate 161kW of H2 output at 80% efficiency and which will incorporate ahighly efficient liquid desulfurizer. Nuvera will also redesign thefuel cell system, integrating and eliminating fuel cell and fuelprocessor balance-of-plant components; the combination of theseR&D efforts is expected to produce <10 s start-up time and >750W/L power density.
Figure 1. Nuvera's Substrate-Based Transportation ApplicationAutothermal Reformer (STAR) Fuel Processor
Catalytica Energy Systems, Inc. will develop an innovative fuelprocessor system that optimizes plate-based methane steam reformingtechnology. In the plate-based reactor, catalytic oxidation and catalyticsteam reforming are integrated within the reactor and carried out oneither side of a plate. After scale-up, the fuel processor will provideseveral advantages including high efficiency, efficient heat transferthrough the plate from the oxidation side to the reforming side, a powerdensity of 6 kW/L, and a specific power of 2 kW/g. Since the heatexchange occurs across a single plate, the catalyst temperature can be
1.E-09
1.E-08
1.E-07
1.E-06
0 1 2 3 4
Transient time (min)
ion
curr
ent
0
2
4
6
8
10
12
14
16
H2
COCO2
CH4
CH4 f low (50% reduction)
Figure 2. Transient response of Catalytica's sub-scale 1-kWeprototype methane reformer

Fuel Chemistry Division Preprints 2002, 47(2), 539
closely controlled. Other components in the fuel processor systeminclude sulfur removal, water-gas shift, and preferential CO oxidationreactors. Figure 2 demonstrates the transient response of a sub-scale 1kWe unit.
The University of Michigan plans to integrate low-costmicrochannel systems, high activity catalysts, and high efficiencymicrocombustors/microvaporizers into a fuel processor. Themicrochannel design will allow efficient thermal integration of the fuelprocessor components leading to minimization or elimination of heatexchangers. Optimization of temperature profiles will lead to minimalcatalyst bed size and reduced start-up and transient response times.
Acknowledgment. The authors of this paper would like to thankPrashant Chintawar of Nuvera Fuel Cells, Inc., Ralph Dalla Betta andBrian Engleman of Catalytica Energy Systems, Inc., and LeviThompson of the University of Michigan for their contributions tothis paper.

ROLES OF CERIA IN SOFC ELECTRODE REACTIONS
Harumi Yokokawa, Natsuko Sakai, Teruhisa Horita,
Katsuhiko Yamaji, and Yu-ping Xiong
Energy Electronics Institute, National Institute of Advanced Industrial Science and Technology
(AIST) Higashi 1-1-1, AIST Central No.5 Tsukuba, Ibaraki 305-8565, Japan
Introduction
The first generation of solid oxide fuel cell with oxide interconnect has successfully been developed. This encourages the development of those second generation SOFCs with metal interconnect which could be established after many technological brake-through in reducing operational temperature and improving the fuel flexibility. Here, we will focus on the possible roles of ceria-based materials in the intermediate temperature solid oxide fuel cells. Emphasis will be made on the cathode and anode reactions.
Characteristic features of Ceria-based oxides
Thermodynamic and other defect features. Although zirconia has a stable fluorite phase only at high temperature, ceria can be stable as the fluorite-type oxides even at room temperature. This difference leads to significant different features in defect chemistry associated with the oxide ion vacancies. Grimes and coworkers1,2 discussed the atomistic configuration features of the oxide ion vacancies in the ceria-based and zirconia-based fluorite oxides doped with the rare earth oxides. The important point of their results is that the oxide vacancies in YSZ are formed in the next nearest neighbors of Y ions, whereas they are formed in the nearest neighbor position of Y ions in Y doped ceria. These features exhibit the dopant dependence, which can explain the dopant dependence of the ionic conductivity. The predicted ionic configuration have recently been confirmed by Yoshida et al.3 with EXAFS experiments. In addition to the ionic conductivity, this behavior is also consistent with the proton solubility and hole conductivities in rare earth doped ceria and yttria-doped zirconia-ceria solid solutions.4,5 This correlation can be explained in terms of the chemical potential of rare earth oxide. When the stabilization of rare earth oxide in the fluorite
structure is large like in YSZ, the dopant ions and the oxide ion vacancies are well separated and this makes more negative the chemical potential of YO1.5 which consists of substituted Y ions in Zr sites, oxide ions and oxide ion vacancies. Furthermore, the holes in the rare earth doped zirconia or ceria can be attributed to the formation of hypothetical species, YO2. This formation reaction can be written as
YO1.5[in fluorite] + 0.25O2(g) = YO2[in fluorite] (1) When the concentration of holes, in other wards, YO2 species, is small, the Henri low can be applied and therefore, their concentration can be directly correlated with the chemical potential of YO1.5. In a similar manner, the proton solubility can be discussed by the following chemical reaction:
YO1.5[in fluorite] + 0.5H2O(g) = YOOH[in fluorite] (2) The concentration of protons in rare earth doped ceria is in the order of 10-5 to 10-3 mol/mol of ceria. This makes it also possible to apply the Henri’s low for the proton concentration. This consideration leads to the plausible correlation among the proton solubility, holes concentration and the chemical potentials of rare earth oxide. This is shown in Figure 1. Since the hole concentration is not available, the hole conductivity is plotted instead.
Oxygen isotope exchange reaction rate. Since the proton solubility is high in ceria, there seems to be some effects on cathode reactions in the presence of ceria. Since the electrode reactions are very much correlated with the surface reaction rate of the electrolyte materials, we have investigated the effects of water vapors on the oxygen isotope exchange reactions. In the zirconia-ceria solid solutions, the exchange reaction rate enhances on the addition of small amount of ceria in YSZ as shown in Figure 2. This is the common features in the oxidative and reductive atmospheres. This can be correlated with the concentration dependence of the electron conductivity, which exhibits a significant enhancement on ceria addition. In the composition region of x>0.2, the surface reaction rate gradually decreases with increasing the content of ceria. The surface reaction rates are determined from many factors; even so, Figure 2 suggests that electrons, not holes, play important roles. Cathode reactions
For the YSZ electrolytes, the effect of the presence of the water vapors on cathode reactions can be well recognized in enhancement as well as degradation. The former enhancement seems to be originated from the extension of the reaction sites to the electrolyte/gas interface realized with the enhanced incorporation
0.0 0.2 0.4 0.6 0.8 1.0-7
-6
-5
-4
-3
-2
-1
0
-8
-7
-6
-5
-4
-3
-2
-1
log(
σ e /
S cm
-1)
log(
CH
/ m
ole
per 1
mol
e ox
ide)
log
a(Y
O1.
5)
x in (CexZr1-x)0.8Y0.2O1.9
a(YO1.5) calc
1073 K
σhole
CH
Figure 1. The correlation between thermodynamic activity of YO1.5, a(YO1.5), hole conductivity, σ(hole) and proton solubility, c(H), in the YO1.5 doped zirconia –ceria solid solutions at 1073 K.
0.0 0.1 0.2 0.3 0.4 0.5 0.6 0.7 0.8 0.9 1.0-5
-4
-3
-2
-1
0
-5
-4
-3
-2
-1
0
k
n
σ(obs)p(O2) = 10-8 atm
lo
g (k
/ µm
s-1)
T = 1273 K
log
n[C
e3+]n
[Ce4+
]lo
g (σ
/ S
cm-1
)
x in (ZrO2)1-x(CeO2)x0.8(YO1.5)0.2
Figure 2. The concentration dependence of surface exchange reaction rate, the electron conductivity and the evaluated concentration of cerium trivalent and tetravalent ions.
Fuel Chemistry Division Preprints 2002, 47(2), 501

Fuel Chemistry Division Preprints 2002, 47(2), 502
reaction of water vapors and the diffusion path of protons to the three phase boundaries. The latter degradation may come from chemical reactions between metal electrodes and water vapors, although it is still difficult to specify the proper reasons. For the case of the ceria-based electrolyte, the effects of water vapor were hardly detected. This is probably because the dry system is difficult to be realized for ceria case; note that only a small amount of the water vapor may affect on the surface reaction rate and that in ceria, the proton solubility is high so that it is difficult to prepare dry samples or to keep samples from being wetted.
More pronounced effect of using ceria-based electrolyte was observed by Matsuzaki et al.5 They tested the degradation effect due to the chromium vapors from INCONELL 600 alloys by changing the combination of electrolytes (YSZ and YSC) and of the cathode (lanthanum strontium manganite, LSM, and lanthanum strontium cobaltite ferrite, LSCF). The severest case is the YSZ/LSM combination and the best is the YDC/LSCF case; the latter did not show any degradation during about 50 h. This phenomena can be well interpreted in terms of the relation between the overpotential and the degradation rate found by Taniguchi et al.6 The key point is that the driving force of depositing chromium oxide is originated from the oxygen potential gradient along the gas channel in cathodes. In such a case, the three phase boundaries become to have most reducing oxygen potential, providing the driving force for the deposition of chromium oxide from hexavalent chromium oxide vapor. When LSCF is uses as cathode, the overpotential appears only on the surface of the top of the cathode as illustrated in Figure 3. This difference in oxygen potential distribution can explain reasonably the chromium poisoning observed. Interestingly, Matsuzaki et al. observed also the difference between the YSZ/LSM and the YDC/LSM combinations. The YDC/LSM shows less degradation. Since the same cathode is used for the both cases, the difference should be come from the feature of the electrolyte. This suggests that the oxygen potential distribution in the electrolyte/electrode/gas interface vicinity is different for two cases. The most plausible explanation may come from the water vapor or the dissolved proton in YDC. Anode Reactions
Ceria has attracted many interests also in anode materials. Some people expect that the mixed conductive nature may assist the anode reactions. To make it clear, we investigated the effect of coating YDC thin film on YSZ single crystals by setting up the simplest configuration of anode, that is, the point electrode system7
as illustrated in Figure 4. The anode performance of Pt electrode is enhanced in the anodic polarization but did not change in the cathodic polarization. This is contradicted with the expectation that the effect of electrons should appears in a more drastic manner in the cathodic polarization. During the anodic polarization, the vapor pressure of water vapor increases and the hole concentration also increases with increasing the polarization. This suggests that protons or holes may play some roles in anode reactions.
log p(O2),log p(H2O)
log p(H2)
electron proton
conc
entra
tion
H2O
h, H+
O2-
H2
log p(O2),log p(H2O)
log p(H2)
electron proton
conc
entra
tion
H2O
h, H+
O2-
H2
Figure 4 Schematic illustration of mass transfer for the YDC coated YSZ with Pt point electrode.6
YSZ
LSMη
O2
O2-
CrO3(g)
SDC
LSCF
η O2
O2-
CrO3(g)
Diffusion limited Surface Reaction limited
YSZ
LSMη
O2
O2-
CrO3(g)
SDC
LSCF
η O2
O2-
CrO3(g)
Diffusion limited Surface Reaction limited Figure 3 Schematic mass transfer related with chromium poisoning in cathodes. The overpotential associated LSM (lanthanum strontium manganite) can be attributed to the oxygen potential gradient appearing on the surface of LSM along the electrode thickness direction, whereas the overpotential of LSCF(lanthanum strontium cobaltite ferrite) appears only on the outer surface of electrodes.
Another important feature of using ceria in anode materials is that ceria can avoid the carbon deposition on anode materials. When carbonaceous fuel is used, there occur many complicated electrochemical and chemical reactions in the anode area. From the mechanism point of view, it is far from the full understanding. From the experimental points of view, however, there are many efforts to obtain good anode performance in the direct oxidation of hydrocarbons. Acknowledgement
A part of this work was made with financial supports from the NEDO international project on FLEXSYS. References (1) M.O. Zacate et al. Solid State Ionics 2000, 128, 243-254. L.M.
Minervini et al. Solid State Ionics 2000, 116, 339-349.H. Yoshida et al. In Solid Oxide Fuel Cells, VII, H. Yokokawa and S. C. Singhal Ed., The Electrochemical Society, Inc. Pennington, New Jersey, PV-2001-16, pp. 384-392.
(4) H. Yokoakwa et al. In Solid Oxide Fuel Cells, VII, H. Yokokawa and S. C. Singhal Ed., The Electrochemical Society, Inc. Pennington, PV-2001-16, pp. 339-348.
(5) H. Yokokawa et al. In High Temeprature Materials, S. C.Singhal Ed., The Electrochemical Soc. Inc.,PV 2002, pp. 26-37.
(6) Y. Matsuzaki, I. Yasuda, J. Electrochem. Soc. 2001, 148 A126. (7) S. Taniguchi et al. J. Power Sources1995,55, 73-79. (8) T. Horita, et al. Ionics 1997,3, 67-74.

Selective Catalytic Oxidation of CO for Fuel Cell Application
Laiyuan Chen, Bong-Kyu Chang, Yong Lu, Weiguo Yang, and
Bruce J. Tatarchuk
Center for Microfibrous Materials Manufacturing Department of Chemical Engineering, Auburn University, Auburn,
AL 36849 Introduction
During the last several decades, there has been a significant increase in the research on fuel cells since it can offer a cleaner alternative for conventional internal combustion engines. The hydrogen-rich gas mixture obtained by the partial oxidation or steam reforming of a hydrocarbon fuel usually contains byproducts, mainly carbon monoxide, in the range of concentrations of 1-2 vol% even after the water-gas shift reaction (CO + H2O CO2 + H2). Unfortunately this small amount of CO present in the reformed gas mixture poisons the electrodes of fuel cell. Among the many approaches to reduce CO concentration in the reformed gas mixture, selective catalytic oxidation of CO to CO2 has been found to be the most effective way to remove the trace amount of CO from hydrogen. An extensive number of catalysts has been proposed and investigated by many researchers for the preferential oxidation of carbon monoxide in hydrogen. They are gold-based catalysts like Au/MnOx
1, Au/γ-Al2O32, Au/α-Fe2O3
3, Au/TiO24, platinum-based
catalysts Pt/Al2O35, Pt/zeolite 6-7, Ce promoted Pt/γ-Al2O3
8, CuO-CeO2
9, Ir/CoOx-Al2O3/ Carbon10, Co/Cu/Al2O3, Ni/Co/Fe/Al2O3, Cr/Al2O3, Fe/Al2O3, and Mn/SiO2
11, Rh/Al2O3 and Ru/Al2O312. In
this study, over 50 catalysts have been evaluated for selective oxidation of CO in a H2-rich gas in the temperature range of from room temperature to 250 °C. It is found that some of the Au, Pt and Cu containing catalysts showed high activities and selectivities toward CO oxidation.
Experimental Catalyst preparation All Au-containing catalysts were prepared by coprecipitation at 60 °C from an aqueous solution of tetrachloroauric acid and a transition metal nitrate with 0.5 M sodium carbonate. For example, 5at%Au/α-Fe2O3 was prepared by the following steps. Aqueous solutions of Fe(NO3)2•9H2O containing HAuCl4•3H2O were added over 30 min to 300ml water at 60 °C and at a constant pH value controlled with 0.5M Na2CO3 solution. Stirring was continued for 30 min before the suspension was cooled to room temperature. The resulting precipitate was filtered and then washed with warm water for at least 3 times in order to eliminate chlorine residual. Finally, the samples were dried in air at 120 °C and calcined at 400 °C for 4 hours.
Cuo-CeO2 catalysts were prepared by co-precipitation, washing and drying, and finally clacination at 650°C. All other catalysts were prepared by impregnation method.
Evaluation of catalysts CO selective oxidation was carried out by using a fixed bed glass reactor with a diameter of 4 mm. The reaction gas containing 1.1% CO, 20.6% CO2, 40% H2, and balance N2 was mixed with air before fed to the PROX reactor in controlled flow rates using mass flow controllers. Water condensor was used to prevent water vapor from entering the gas chromatograph. Stoichiometric O2 (CO/O2 =
2/1) and excess O2 (CO/O2 = 1/1 and 1/2) were used to compare activity and selectivity of catalysts as a function of CO/O2 ratio. The reaction products were analyzed with gas chromatograph (TCD-GC). Data shown here were obtained after stabilization of the reactions for 20 min. Conversion of CO to CO2 %= (CCO
in – CCOout) / CCO
in × 100% Selectivity for CO oxidation over H2 oxidation % = O2 consumption by CO oxidation / Total O2 consumption × 100% = ½(CCO
in – CCOout) / (CO2
in – CO2out) × 100%
Results and Discussion
In the present study, over 50 catalysts have been evaluated for selective oxidation of CO in a H2-rich gas in the temperature range of from room temperature to 250 °C. The tested catalysts include Au-, Pt-, Cu-, Pd- based and some other transitional metal containing catalysts prepared by conventional impregnation or co-precipitation methods. Based on the amount of catalyst used, the Au, Pt and Cu containing catalysts showed high activities and selectivities toward CO oxidation. Some catalysts like hopcalite, Pt-Ru/Hopcalite, Co/Al2O3, Ru/Al2O3, Pd/CeO2-TiO2, Pt/SnO2 and Ag/Co3O4 that were reported active for CO oxidation or selective oxidation showed little activity under our experimental conditions.
For Au containing catalysts, the catalyst support and Au loading play a very important role in CO selective oxidation. It has been shown that α-Fe2O3 supported Au catalysts are more active than TiO2, ZnO, Al2O3, and Y-zeolite supported Au. For Au/α-Fe2O3, the catalyst activity increased with the increase of Au loading while the CO oxidation selectivity only slightly changed (Figure 1). It is also observed that a low catalyst calcination temperature is advantageous to the CO oxidation activity at low temperature. The 150°C dried catalyst showed the highest CO oxidation activity at the lower temperature range (below 50°C). The best catalyst, 5at% Au/α-Fe2O3, has been further investigated for CO oxidation with different CO/O2 ratios. With the decrease of CO/O2 ratio, CO conversion increased. The catalyst life test shows that the catalyst is rather stable. The CO conversion decreased from 100% to 95% after reaction on time for over 40 hours (Figure 2). We also attempted to load the Au/α-Fe2O3 catalyst onto a catalyst support like alumina, silica, zeolites and activated carbon. Reaction results show that these secondary supported catalysts have poor activities.
Another group of catalysts we studied extensively is promoted Pt/Al2O3 and Pt/SiO2 catalysts. The catalyst activity decreased in the following order: Pt/Co2O3/Al2O3 > Pt/Fe2O3/Al2O3 > Pt/Mn2O3/Al2O3 > Pt/CeO2/Al2O3 > Pt/Cr2O3/Al2O3. The Pt/Fe2O3/Al2O3 catalyst showed a very high activity at low temperature. However, its activity dropped significantly with the increase of reaction temperature from about 50°C. Cobalt oxide modified Pt/Al2O3 exhibited 100% CO conversion at temperatures below 100°C. Other modified catalysts showed little activity below 50°C. When silica is used as a support, only Fe2O3 modified catalyst showed 100% CO conversion below 50°C.
Fuel Chemistry Division Preprints 20 02, 47(2), 609
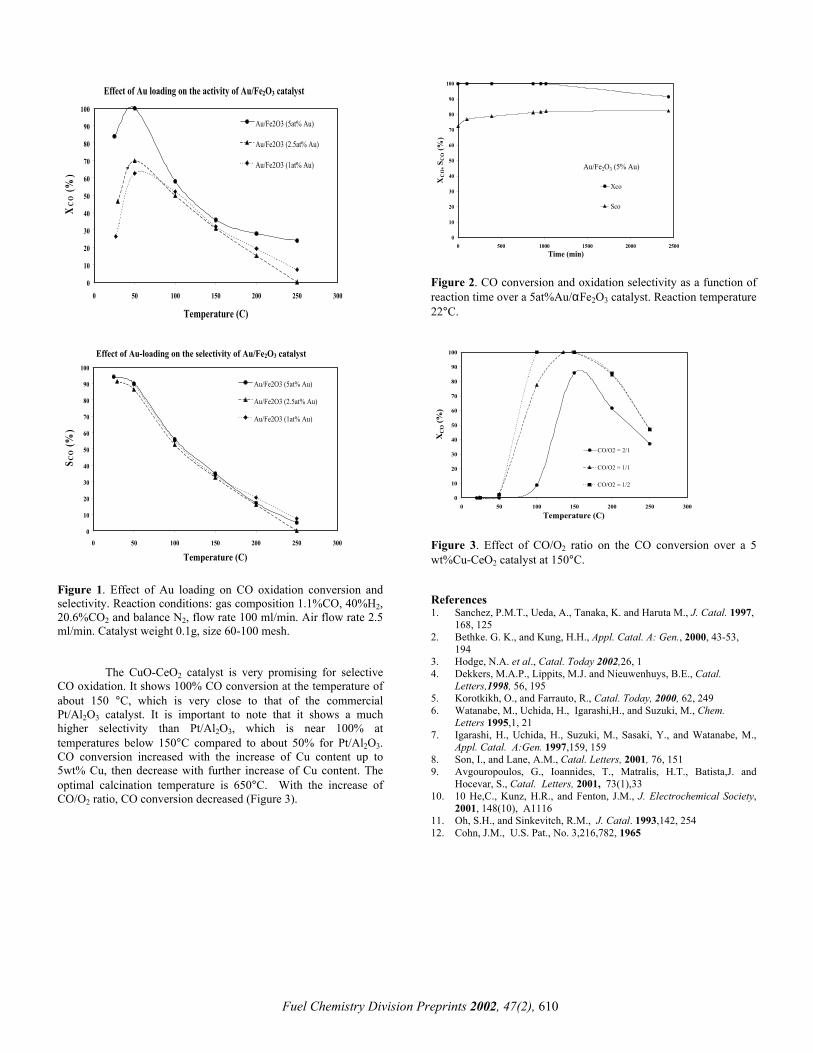
0
10
20
30
40
50
60
70
80
90
100
0 500 1000 1500 2000 2500Time (min)
XC
O, S
CO
(%)
Xco
Sco
Au/Fe2O3 (5% Au)
Effect of Au loading on the activity of Au/Fe2O3 catalyst
0
10
20
30
40
50
60
70
80
90
100
0 50 100 150 200 250 300
Temperature (C)
XC
O (%
)
Au/Fe2O3 (5at% Au)
Au/Fe2O3 (2.5at% Au)
Au/Fe2O3 (1at% Au)
Figure 2. CO conversion and oxidation selectivity as a function of reaction time over a 5at%Au/αFe2O3 catalyst. Reaction temperature 22°C.
Effect of Au-loading on the selectivity of Au/Fe2O3 catalyst
0
10
20
30
40
50
60
70
80
90
100
0 50 100 150 200 250 300
Temperature (C)
S CO
(%)
Au/Fe2O3 (5at% Au)
Au/Fe2O3 (2.5at% Au)
Au/Fe2O3 (1at% Au)
0
10
20
30
40
50
60
70
80
90
100
0 50 100 150 200 250 300
Temperature (C)
XC
O (%
)CO/O2 = 2/1
CO/O2 = 1/1
CO/O2 = 1/2
Figure 3. Effect of CO/O2 ratio on the CO conversion over a 5 wt%Cu-CeO2 catalyst at 150°C. Figure 1. Effect of Au loading on CO oxidation conversion and
selectivity. Reaction conditions: gas composition 1.1%CO, 40%H2, 20.6%CO2 and balance N2, flow rate 100 ml/min. Air flow rate 2.5 ml/min. Catalyst weight 0.1g, size 60-100 mesh.
References 1. Sanchez, P.M.T., Ueda, A., Tanaka, K. and Haruta M., J. Catal. 1997,
168, 125 2. Bethke. G. K., and Kung, H.H., Appl. Catal. A: Gen., 2000, 43-53,
194 3. Hodge, N.A. et al., Catal. Today 2002,26, 1 The CuO-CeO2 catalyst is very promising for selective
CO oxidation. It shows 100% CO conversion at the temperature of about 150 °C, which is very close to that of the commercial Pt/Al2O3 catalyst. It is important to note that it shows a much higher selectivity than Pt/Al2O3, which is near 100% at temperatures below 150°C compared to about 50% for Pt/Al2O3. CO conversion increased with the increase of Cu content up to 5wt% Cu, then decrease with further increase of Cu content. The optimal calcination temperature is 650°C. With the increase of CO/O2 ratio, CO conversion decreased (Figure 3).
4. Dekkers, M.A.P., Lippits, M.J. and Nieuwenhuys, B.E., Catal. Letters,1998, 56, 195
5. Korotkikh, O., and Farrauto, R., Catal. Today, 2000, 62, 249 6. Watanabe, M., Uchida, H., Igarashi,H., and Suzuki, M., Chem.
Letters 1995,1, 21 7. Igarashi, H., Uchida, H., Suzuki, M., Sasaki, Y., and Watanabe, M.,
Appl. Catal. A:Gen. 1997,159, 159 8. Son, I., and Lane, A.M., Catal. Letters, 2001, 76, 151 9. Avgouropoulos, G., Ioannides, T., Matralis, H.T., Batista,J. and
Hocevar, S., Catal. Letters, 2001, 73(1),33 10. 10 He,C., Kunz, H.R., and Fenton, J.M., J. Electrochemical Society,
2001, 148(10), A1116 11. Oh, S.H., and Sinkevitch, R.M., J. Catal. 1993,142, 254 12. Cohn, J.M., U.S. Pat., No. 3,216,782, 1965
Fuel Chemistry Division Preprints 20 02, 47(2), 610
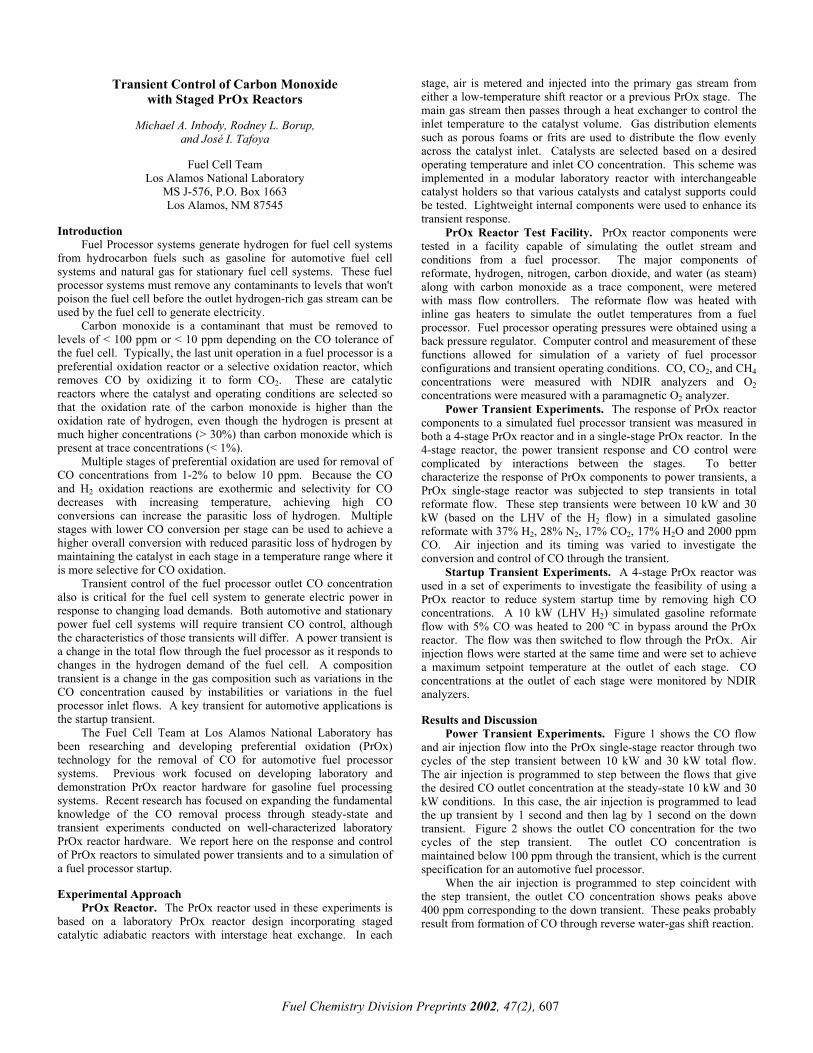
Transient Control of Carbon Monoxide with Staged PrOx Reactors
Michael A. Inbody, Rodney L. Borup,
and José I. Tafoya
Fuel Cell Team Los Alamos National Laboratory
MS J-576, P.O. Box 1663 Los Alamos, NM 87545
Introduction
Fuel Processor systems generate hydrogen for fuel cell systems from hydrocarbon fuels such as gasoline for automotive fuel cell systems and natural gas for stationary fuel cell systems. These fuel processor systems must remove any contaminants to levels that won't poison the fuel cell before the outlet hydrogen-rich gas stream can be used by the fuel cell to generate electricity.
Carbon monoxide is a contaminant that must be removed to levels of < 100 ppm or < 10 ppm depending on the CO tolerance of the fuel cell. Typically, the last unit operation in a fuel processor is a preferential oxidation reactor or a selective oxidation reactor, which removes CO by oxidizing it to form CO2. These are catalytic reactors where the catalyst and operating conditions are selected so that the oxidation rate of the carbon monoxide is higher than the oxidation rate of hydrogen, even though the hydrogen is present at much higher concentrations (> 30%) than carbon monoxide which is present at trace concentrations (< 1%).
Multiple stages of preferential oxidation are used for removal of CO concentrations from 1-2% to below 10 ppm. Because the CO and H2 oxidation reactions are exothermic and selectivity for CO decreases with increasing temperature, achieving high CO conversions can increase the parasitic loss of hydrogen. Multiple stages with lower CO conversion per stage can be used to achieve a higher overall conversion with reduced parasitic loss of hydrogen by maintaining the catalyst in each stage in a temperature range where it is more selective for CO oxidation.
Transient control of the fuel processor outlet CO concentration also is critical for the fuel cell system to generate electric power in response to changing load demands. Both automotive and stationary power fuel cell systems will require transient CO control, although the characteristics of those transients will differ. A power transient is a change in the total flow through the fuel processor as it responds to changes in the hydrogen demand of the fuel cell. A composition transient is a change in the gas composition such as variations in the CO concentration caused by instabilities or variations in the fuel processor inlet flows. A key transient for automotive applications is the startup transient.
The Fuel Cell Team at Los Alamos National Laboratory has been researching and developing preferential oxidation (PrOx) technology for the removal of CO for automotive fuel processor systems. Previous work focused on developing laboratory and demonstration PrOx reactor hardware for gasoline fuel processing systems. Recent research has focused on expanding the fundamental knowledge of the CO removal process through steady-state and transient experiments conducted on well-characterized laboratory PrOx reactor hardware. We report here on the response and control of PrOx reactors to simulated power transients and to a simulation of a fuel processor startup. Experimental Approach
PrOx Reactor. The PrOx reactor used in these experiments is based on a laboratory PrOx reactor design incorporating staged catalytic adiabatic reactors with interstage heat exchange. In each
stage, air is metered and injected into the primary gas stream from either a low-temperature shift reactor or a previous PrOx stage. The main gas stream then passes through a heat exchanger to control the inlet temperature to the catalyst volume. Gas distribution elements such as porous foams or frits are used to distribute the flow evenly across the catalyst inlet. Catalysts are selected based on a desired operating temperature and inlet CO concentration. This scheme was implemented in a modular laboratory reactor with interchangeable catalyst holders so that various catalysts and catalyst supports could be tested. Lightweight internal components were used to enhance its transient response.
PrOx Reactor Test Facility. PrOx reactor components were tested in a facility capable of simulating the outlet stream and conditions from a fuel processor. The major components of reformate, hydrogen, nitrogen, carbon dioxide, and water (as steam) along with carbon monoxide as a trace component, were metered with mass flow controllers. The reformate flow was heated with inline gas heaters to simulate the outlet temperatures from a fuel processor. Fuel processor operating pressures were obtained using a back pressure regulator. Computer control and measurement of these functions allowed for simulation of a variety of fuel processor configurations and transient operating conditions. CO, CO2, and CH4 concentrations were measured with NDIR analyzers and O2 concentrations were measured with a paramagnetic O2 analyzer.
Power Transient Experiments. The response of PrOx reactor components to a simulated fuel processor transient was measured in both a 4-stage PrOx reactor and in a single-stage PrOx reactor. In the 4-stage reactor, the power transient response and CO control were complicated by interactions between the stages. To better characterize the response of PrOx components to power transients, a PrOx single-stage reactor was subjected to step transients in total reformate flow. These step transients were between 10 kW and 30 kW (based on the LHV of the H2 flow) in a simulated gasoline reformate with 37% H2, 28% N2, 17% CO2, 17% H2O and 2000 ppm CO. Air injection and its timing was varied to investigate the conversion and control of CO through the transient.
Startup Transient Experiments. A 4-stage PrOx reactor was used in a set of experiments to investigate the feasibility of using a PrOx reactor to reduce system startup time by removing high CO concentrations. A 10 kW (LHV H2) simulated gasoline reformate flow with 5% CO was heated to 200 ºC in bypass around the PrOx reactor. The flow was then switched to flow through the PrOx. Air injection flows were started at the same time and were set to achieve a maximum setpoint temperature at the outlet of each stage. CO concentrations at the outlet of each stage were monitored by NDIR analyzers. Results and Discussion
Power Transient Experiments. Figure 1 shows the CO flow and air injection flow into the PrOx single-stage reactor through two cycles of the step transient between 10 kW and 30 kW total flow. The air injection is programmed to step between the flows that give the desired CO outlet concentration at the steady-state 10 kW and 30 kW conditions. In this case, the air injection is programmed to lead the up transient by 1 second and then lag by 1 second on the down transient. Figure 2 shows the outlet CO concentration for the two cycles of the step transient. The outlet CO concentration is maintained below 100 ppm through the transient, which is the current specification for an automotive fuel processor.
When the air injection is programmed to step coincident with the step transient, the outlet CO concentration shows peaks above 400 ppm corresponding to the down transient. These peaks probably result from formation of CO through reverse water-gas shift reaction.
Fuel Chemistry Division Preprints 2002, 47(2), 607
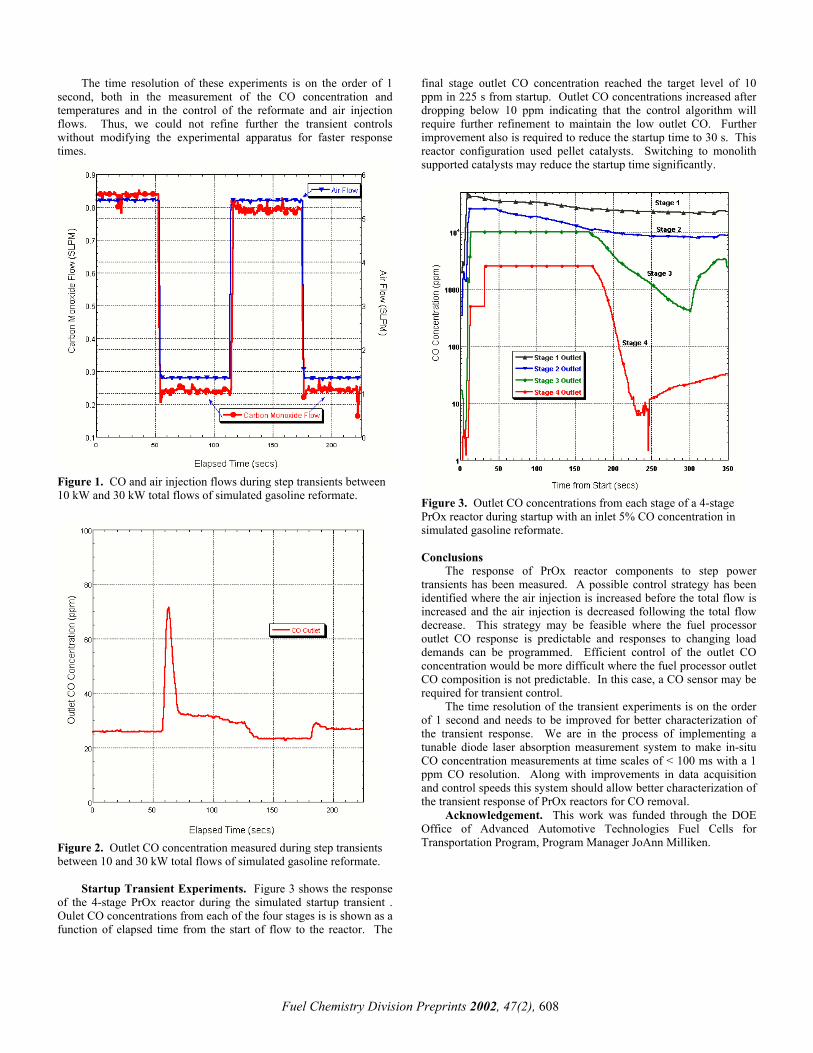
The time resolution of these experiments is on the order of 1 second, both in the measurement of the CO concentration and temperatures and in the control of the reformate and air injection flows. Thus, we could not refine further the transient controls without modifying the experimental apparatus for faster response times.
Fuel Chemistry Division Preprints 2002, 47(2), 608
Figure 1. CO and air injection flows during step transients between 10 kW and 30 kW total flows of simulated gasoline reformate.
Figure 2. Outlet CO concentration measured during step transients between 10 and 30 kW total flows of simulated gasoline reformate.
Startup Transient Experiments. Figure 3 shows the response
of the 4-stage PrOx reactor during the simulated startup transient . Oulet CO concentrations from each of the four stages is is shown as a function of elapsed time from the start of flow to the reactor. The
final stage outlet CO concentration reached the target level of 10 ppm in 225 s from startup. Outlet CO concentrations increased after dropping below 10 ppm indicating that the control algorithm will require further refinement to maintain the low outlet CO. Further improvement also is required to reduce the startup time to 30 s. This reactor configuration used pellet catalysts. Switching to monolith supported catalysts may reduce the startup time significantly.
Figure 3. Outlet CO concentrations from each stage of a 4-stage PrOx reactor during startup with an inlet 5% CO concentration in simulated gasoline reformate.
Conclusions
The response of PrOx reactor components to step power transients has been measured. A possible control strategy has been identified where the air injection is increased before the total flow is increased and the air injection is decreased following the total flow decrease. This strategy may be feasible where the fuel processor outlet CO response is predictable and responses to changing load demands can be programmed. Efficient control of the outlet CO concentration would be more difficult where the fuel processor outlet CO composition is not predictable. In this case, a CO sensor may be required for transient control.
The time resolution of the transient experiments is on the order of 1 second and needs to be improved for better characterization of the transient response. We are in the process of implementing a tunable diode laser absorption measurement system to make in-situ CO concentration measurements at time scales of < 100 ms with a 1 ppm CO resolution. Along with improvements in data acquisition and control speeds this system should allow better characterization of the transient response of PrOx reactors for CO removal.
Acknowledgement. This work was funded through the DOE Office of Advanced Automotive Technologies Fuel Cells for Transportation Program, Program Manager JoAnn Milliken.