benchmark finite element simulations of postbuckling...
TRANSCRIPT
Benchmark Finite Element Simulations of Postbuckling Composite Stiffened Panels
Orifici, A. C. 1, Thomson, R. S. 2, Gunnion, A. J. 3, Degenhardt, R. 4, Abramovich, H. 5,
Bayandor, J. 3
1 School of Aerospace, Mechanical & Manufacturing Engineering, Royal Melbourne Institute of Technology, GPO Box 2476V, Melbourne, Victoria, 3001, Australia
2 Cooperative Research Centre for Advanced Composite Structures Limited, 506 Lorimer Street, Fishermans Bend, Victoria, 3207, Australia
3 Sir Lawrence Wackett Centre for Aerospace Design Technology, Royal Melbourne Institute of Technology, GPO Box 2476V, Melbourne, Victoria, 3001, Australia
4 Institute of Structural Mechanics, DLR- German Aerospace Centre, Lilienthalplatz 7, 38108 Braunschweig, Germany
5 Faculty of Aerospace Engineering, Technion - Israel Institute of Technology, Technion City, 32000 Haifa, Israel
Summary: This paper outlines the CRC-ACS contribution to a software code benchmarking exercise as part of the European Commission Project COCOMAT investigating composite postbuckling stiffened panels. Analysis was carried out using MSC.Nastran (Nastran) solution sequences SOL 106 and SOL 600, Abaqus/Standard (Abaqus) and LS-Dyna, and compared to experimental data generated previously at the Technion, Israel and DLR, Germany. The finite element (FE) analyses generally gave very good comparison up to initial postbuckling, with excellent predictions of stiffness, and mostly accurate representations of the initial postbuckling mode shape, leading to fair comparison in deep postbuckling. Accurate modelling of boundary conditions and panel imperfections were crucial to achieve accurate results, with boundary conditions in particular presenting the most critical problem. Comparatively, SOL 106, SOL 600 and Abaqus gave almost identical results, whilst LS-Dyna produced less accurate results in postbuckling. The work in this paper will be compared to parallel FE analyses from other project partners, and conclusions will be made on the efficacy of various software codes for fuselage-representative composite structures. Keywords: Composite, postbuckling, stiffened panels, finite element, COCOMAT
Introduction COCOMAT, or “Improved MATerial Exploitation at Safe Design of COmposite Airframe Structures by Accurate Simulation of COllapse”, is a research project under the European Commission’s Sixth Framework Program. The 4-year project aims to exploit the large strength reserves of postbuckling composite stiffened panels through more accurate prediction of collapse. The goal of the first COCOMAT Work Package is to compare the capabilities of various existing approaches for the collapse analysis of postbuckling stiffened panels. All COCOMAT partners were given a common set of benchmark cases to analyse, the results of which will be collated and compared to assess the merits of each approach. This paper details CRC-ACS work in two benchmark cases, which both involve the analysis of stiffened panels without any pre-existing damage. This work will be extended in a later task to panels containing damage, in the form of delaminations and skin/stiffener debonds.
Benchmark 1
Problem Description Benchmark 1 (B1) was taken from tests performed by the Israel Institute of Technology (Technion) together with Israel Aircraft Industries. Though a brief summary is presented here, a complete description of the panel manufacture and testing can be found in [1]. The particular panel selected was a fuselage-representative, 5-blade stiffened, curved panel. A summary of the panel specifications is given in Table 1, where the 0° direction is parallel to the stiffeners. The stiffener and skin are joined using a flange, where the stiffener plies are continued over the web, half on each side, and the flange outer plies are sequentially terminated 4 layers at a time, at increments of 10 mm.
Table 1: B1 panel specifications Panel radius 1000 mm Panel length 720 mm Arc length 680 mm
Number of stiffeners 5 Stiffener height 15 mm
Stiffener web lay-up [±45, 02]3S
Skin lay-up [0,±45, 90]S Ply thickness 0.125 mm
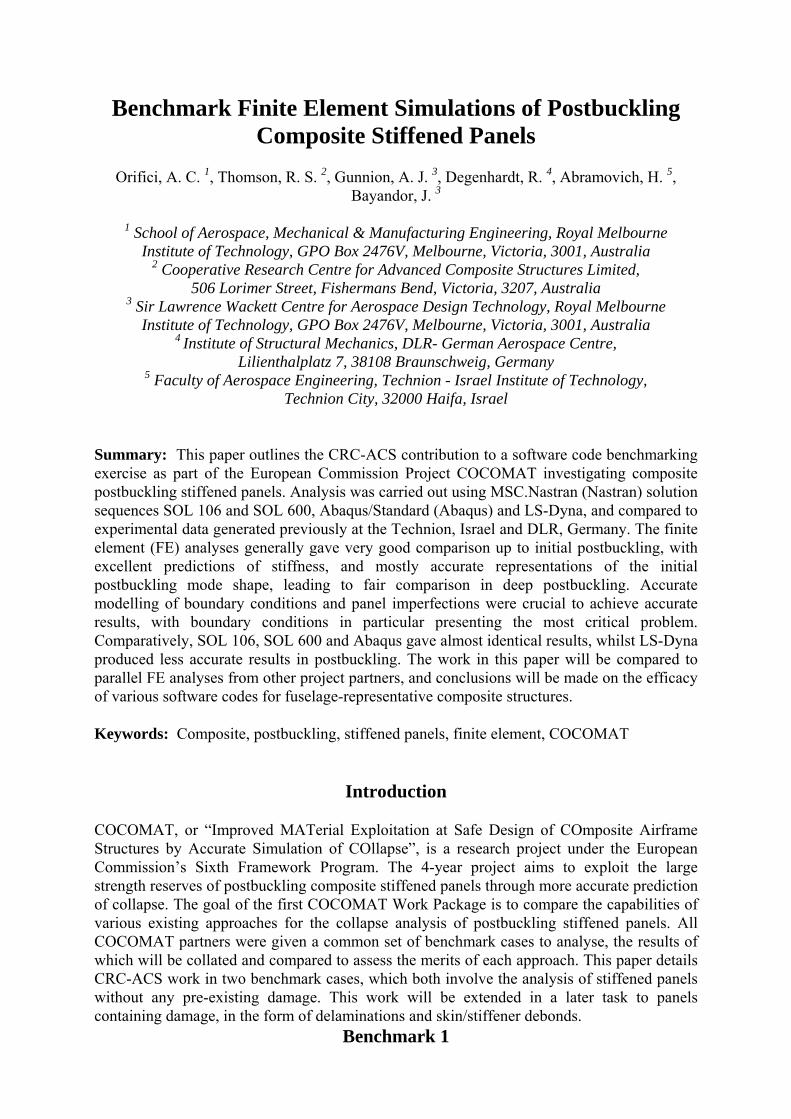
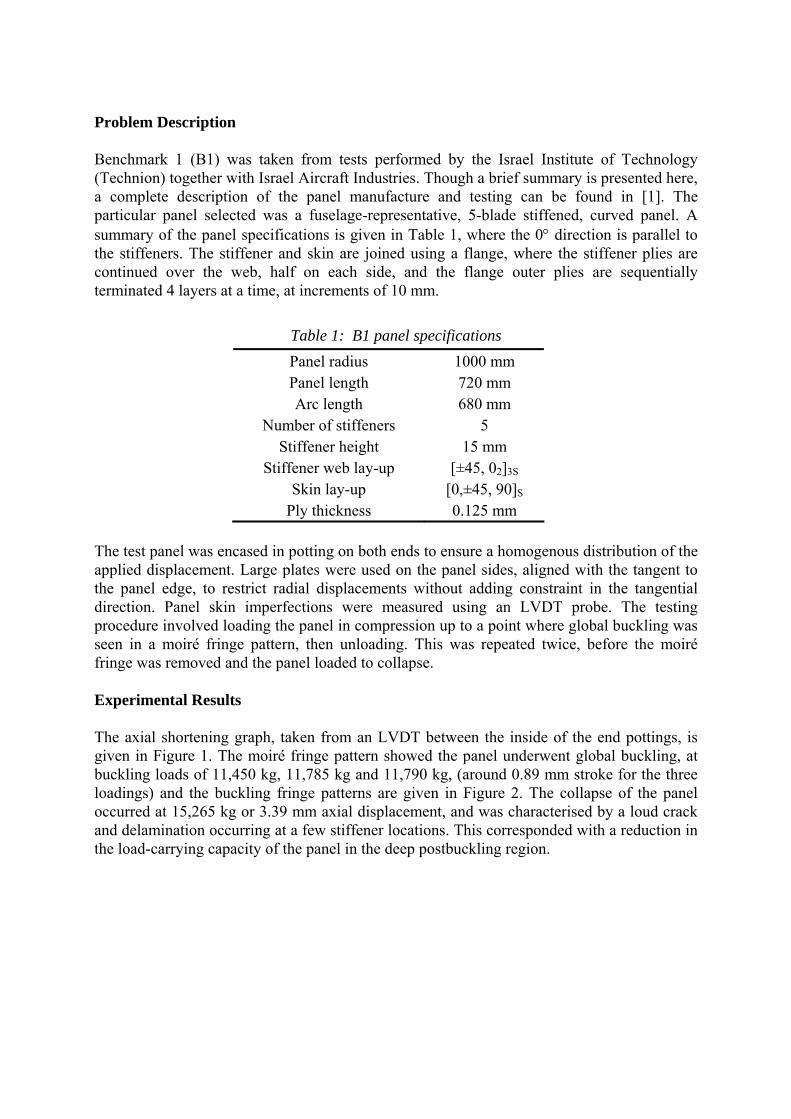
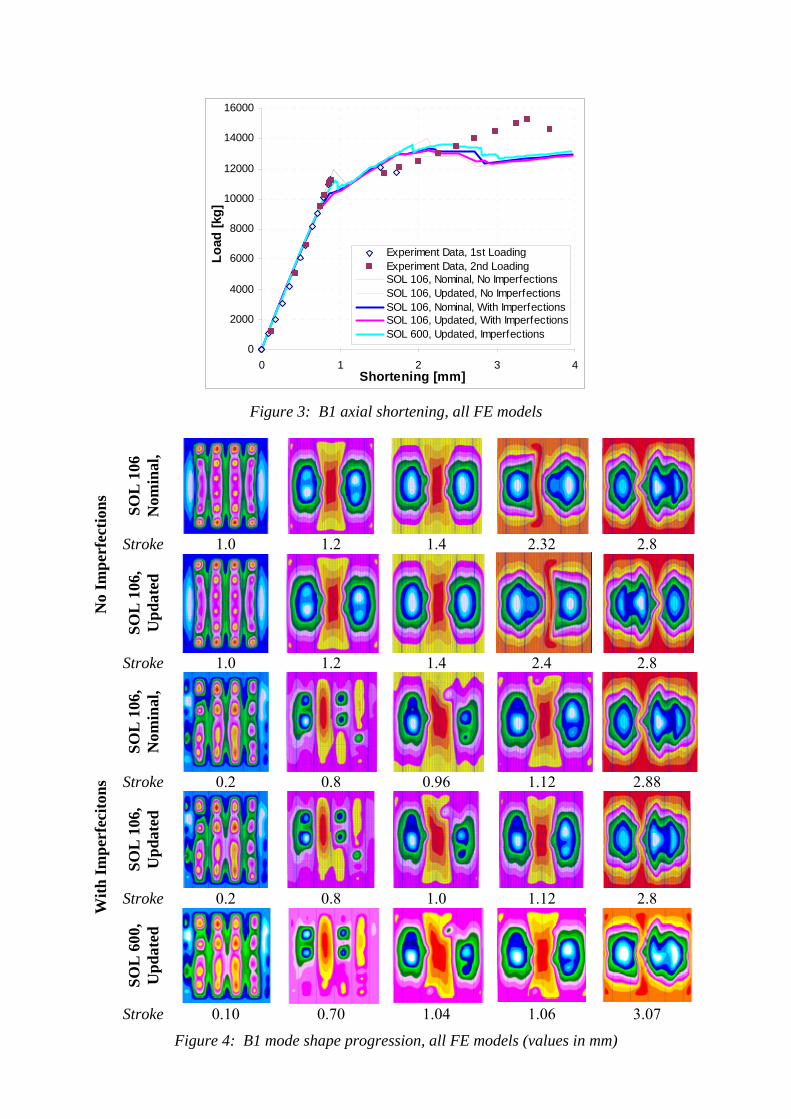
The test panel was encased in potting on both ends to ensure a homogenous distribution of the applied displacement. Large plates were used on the panel sides, aligned with the tangent to the panel edge, to restrict radial displacements without adding constraint in the tangential direction. Panel skin imperfections were measured using an LVDT probe. The testing procedure involved loading the panel in compression up to a point where global buckling was seen in a moiré fringe pattern, then unloading. This was repeated twice, before the moiré fringe was removed and the panel loaded to collapse. Experimental Results The axial shortening graph, taken from an LVDT between the inside of the end pottings, is given in Figure 1. The moiré fringe pattern showed the panel underwent global buckling, at buckling loads of 11,450 kg, 11,785 kg and 11,790 kg, (around 0.89 mm stroke for the three loadings) and the buckling fringe patterns are given in Figure 2. The collapse of the panel occurred at 15,265 kg or 3.39 mm axial displacement, and was characterised by a loud crack and delamination occurring at a few stiffener locations. This corresponded with a reduction in the load-carrying capacity of the panel in the deep postbuckling region.
0
2000
4000
6000
8000
10000
12000
14000
16000
0 1 2 3 4Shortening [mm]
Load
[kg]
Experiment Data, 1st LoadingExperiment Data, 2nd Loading
Figure 1: B1 load-shortening graph, from LVDT #81
Load = 11,450 kg Load = 11,785 kg Load = 11,790
(a) (b) (c)
Figure 2: B1 moiré fringe pattern for global buckling, (a) first loading (b) second loading (c) third loading
FE Analysis A nominal model was generated by Technion in Nastran based on panel specifications. A number of modelling modifications were then applied to increase the accuracy of the nominal model. These modifications included increasing the number of elements in the web, using dummy plies instead of offsets to define the flange region midplane, and correctly representing the asymmetry in the flange material that occurs due to the layup technique. Following this, the skin imperfection data measured by the LVDT was applied to both the nominal and updated models. The four model variations are summarised in Table 2.
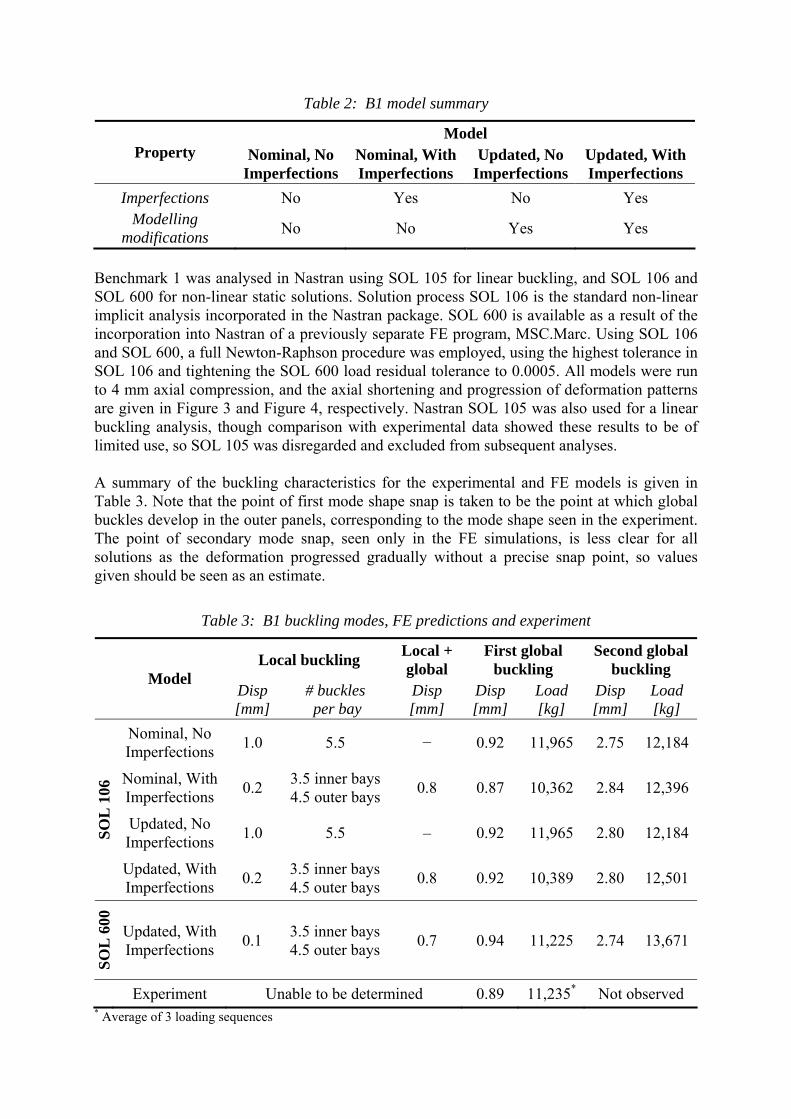
Table 2: B1 model summary
Model Property Nominal, No
ImperfectionsNominal, With Imperfections
Updated, No Imperfections
Updated, With Imperfections
Imperfections No Yes No Yes Modelling
modifications No No Yes Yes
Benchmark 1 was analysed in Nastran using SOL 105 for linear buckling, and SOL 106 and SOL 600 for non-linear static solutions. Solution process SOL 106 is the standard non-linear implicit analysis incorporated in the Nastran package. SOL 600 is available as a result of the incorporation into Nastran of a previously separate FE program, MSC.Marc. Using SOL 106 and SOL 600, a full Newton-Raphson procedure was employed, using the highest tolerance in SOL 106 and tightening the SOL 600 load residual tolerance to 0.0005. All models were run to 4 mm axial compression, and the axial shortening and progression of deformation patterns are given in Figure 3 and Figure 4, respectively. Nastran SOL 105 was also used for a linear buckling analysis, though comparison with experimental data showed these results to be of limited use, so SOL 105 was disregarded and excluded from subsequent analyses. A summary of the buckling characteristics for the experimental and FE models is given in Table 3. Note that the point of first mode shape snap is taken to be the point at which global buckles develop in the outer panels, corresponding to the mode shape seen in the experiment. The point of secondary mode snap, seen only in the FE simulations, is less clear for all solutions as the deformation progressed gradually without a precise snap point, so values given should be seen as an estimate.
Table 3: B1 buckling modes, FE predictions and experiment
Local buckling Local + global
First global buckling
Second global buckling Model
Disp [mm]
# buckles per bay
Disp [mm]
Disp [mm]
Load [kg]
Disp [mm]
Load [kg]
Nominal, No Imperfections 1.0 5.5 − 0.92 11,965 2.75 12,184
Nominal, With Imperfections 0.2 3.5 inner bays
4.5 outer bays 0.8 0.87 10,362 2.84 12,396
Updated, No Imperfections 1.0 5.5 – 0.92 11,965 2.80 12,184 SO
L 1
06
Updated, With Imperfections 0.2 3.5 inner bays
4.5 outer bays 0.8 0.92 10,389 2.80 12,501
SOL
600
Updated, With Imperfections 0.1 3.5 inner bays
4.5 outer bays 0.7 0.94 11,225 2.74 13,671
Experiment Unable to be determined 0.89 11,235* Not observed * Average of 3 loading sequences
0
2000
4000
6000
8000
10000
12000
14000
16000
0 1 2 3 4Shortening [mm]
Load
[kg]
Experiment Data, 1st LoadingExperiment Data, 2nd LoadingSOL 106, Nominal, No ImperfectionsSOL 106, Updated, No ImperfectionsSOL 106, Nominal, With ImperfectionsSOL 106, Updated, With ImperfectionsSOL 600, Updated, Imperfections
Figure 3: B1 axial shortening, all FE models
SOL
106
N
omin
al,
Stroke 1.0 1.2 1.4 2.32 2.8
SOL
106
, U
pdat
ed
No
Impe
rfec
tions
Stroke 1.0 1.2 1.4 2.4 2.8
SOL
106
, N
omin
al,
Stroke 0.2 0.8 0.96 1.12 2.88
SOL
106
, U
pdat
ed
Stroke 0.2 0.8 1.0 1.12 2.8
SOL
600
, U
pdat
ed
With
Impe
rfec
itons
Stroke 0.10 0.70 1.04 1.06 3.07
Figure 4: B1 mode shape progression, all FE models (values in mm)
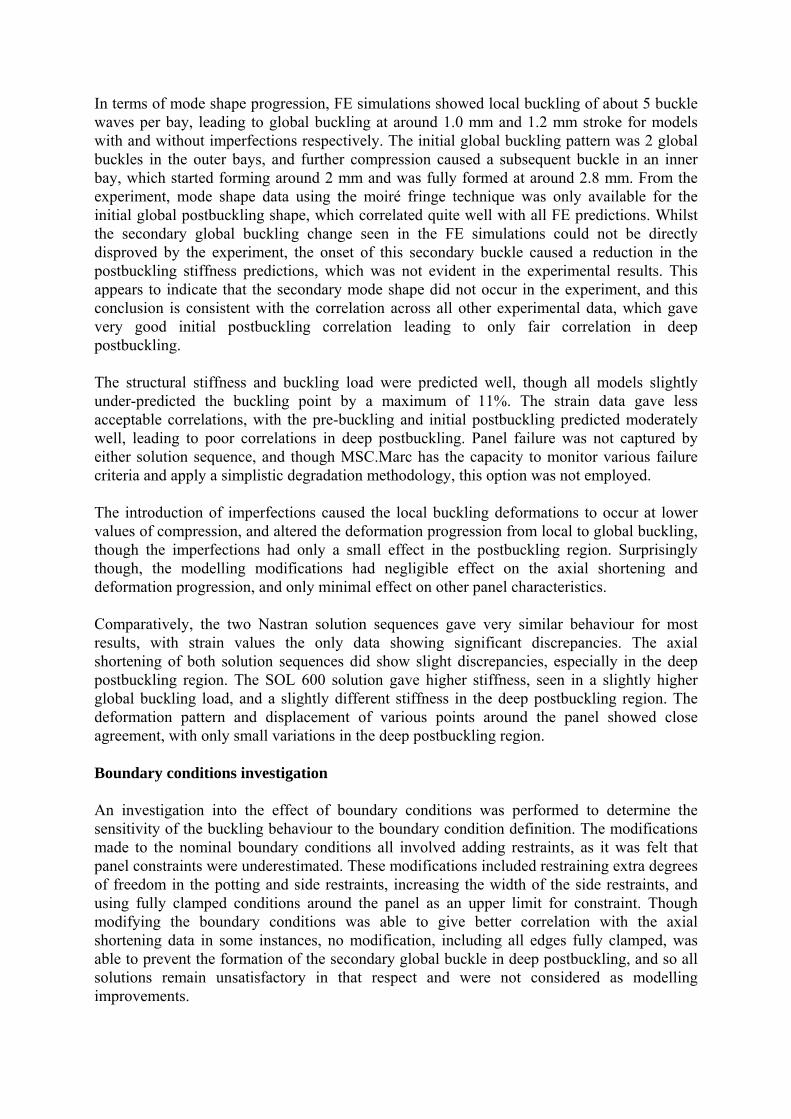
In terms of mode shape progression, FE simulations showed local buckling of about 5 buckle waves per bay, leading to global buckling at around 1.0 mm and 1.2 mm stroke for models with and without imperfections respectively. The initial global buckling pattern was 2 global buckles in the outer bays, and further compression caused a subsequent buckle in an inner bay, which started forming around 2 mm and was fully formed at around 2.8 mm. From the experiment, mode shape data using the moiré fringe technique was only available for the initial global postbuckling shape, which correlated quite well with all FE predictions. Whilst the secondary global buckling change seen in the FE simulations could not be directly disproved by the experiment, the onset of this secondary buckle caused a reduction in the postbuckling stiffness predictions, which was not evident in the experimental results. This appears to indicate that the secondary mode shape did not occur in the experiment, and this conclusion is consistent with the correlation across all other experimental data, which gave very good initial postbuckling correlation leading to only fair correlation in deep postbuckling. The structural stiffness and buckling load were predicted well, though all models slightly under-predicted the buckling point by a maximum of 11%. The strain data gave less acceptable correlations, with the pre-buckling and initial postbuckling predicted moderately well, leading to poor correlations in deep postbuckling. Panel failure was not captured by either solution sequence, and though MSC.Marc has the capacity to monitor various failure criteria and apply a simplistic degradation methodology, this option was not employed. The introduction of imperfections caused the local buckling deformations to occur at lower values of compression, and altered the deformation progression from local to global buckling, though the imperfections had only a small effect in the postbuckling region. Surprisingly though, the modelling modifications had negligible effect on the axial shortening and deformation progression, and only minimal effect on other panel characteristics. Comparatively, the two Nastran solution sequences gave very similar behaviour for most results, with strain values the only data showing significant discrepancies. The axial shortening of both solution sequences did show slight discrepancies, especially in the deep postbuckling region. The SOL 600 solution gave higher stiffness, seen in a slightly higher global buckling load, and a slightly different stiffness in the deep postbuckling region. The deformation pattern and displacement of various points around the panel showed close agreement, with only small variations in the deep postbuckling region. Boundary conditions investigation An investigation into the effect of boundary conditions was performed to determine the sensitivity of the buckling behaviour to the boundary condition definition. The modifications made to the nominal boundary conditions all involved adding restraints, as it was felt that panel constraints were underestimated. These modifications included restraining extra degrees of freedom in the potting and side restraints, increasing the width of the side restraints, and using fully clamped conditions around the panel as an upper limit for constraint. Though modifying the boundary conditions was able to give better correlation with the axial shortening data in some instances, no modification, including all edges fully clamped, was able to prevent the formation of the secondary global buckle in deep postbuckling, and so all solutions remain unsatisfactory in that respect and were not considered as modelling improvements.
Benchmark 2 Problem Description Benchmark 2 (B2) was taken from a series of tests performed by the German Aerospace Centre (DLR). A more complete description of the test series can be found in [2]. The particular panel selected was a fuselage representative, 4-blade stiffened, curved panel. Similar to the B1 panel, the stiffener and skin are joined using a flange, with half the stiffener plies on each side, though the B2 panel has flange plies terminated two at a time, at increments of 5.5 mm, except for the innermost drop-off increment of 1.45 mm. A summary of panel specifications is given in Table 4, where the 0° direction is parallel with the stiffeners.
Table 4: B2 panel specifications
Panel radius 1000 mm Panel length 780 mm Arc length 419 mm
Number of stiffeners 4 Stiffener height 13.25 mm
Stiffener web lay-up [(45,-45)3, 06]S
Skin lay-up [0, ±45, 90]S Ply thickness 0.125 mm
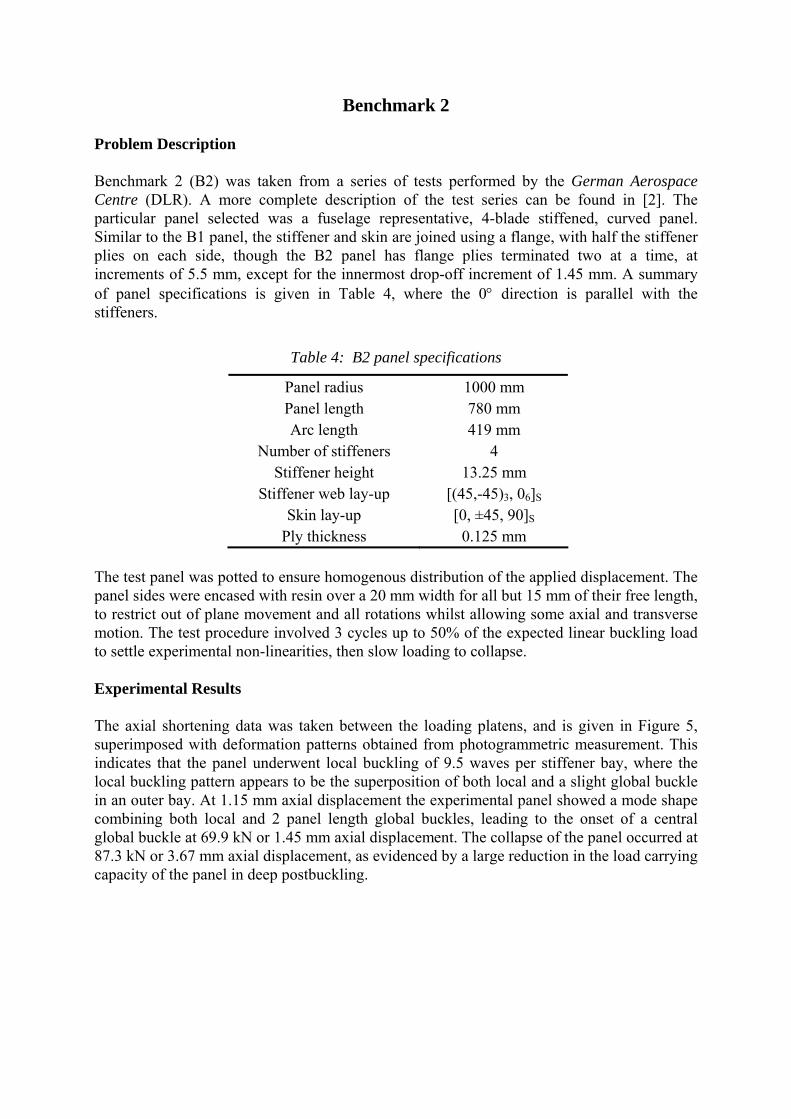
The test panel was potted to ensure homogenous distribution of the applied displacement. The panel sides were encased with resin over a 20 mm width for all but 15 mm of their free length, to restrict out of plane movement and all rotations whilst allowing some axial and transverse motion. The test procedure involved 3 cycles up to 50% of the expected linear buckling load to settle experimental non-linearities, then slow loading to collapse. Experimental Results The axial shortening data was taken between the loading platens, and is given in Figure 5, superimposed with deformation patterns obtained from photogrammetric measurement. This indicates that the panel underwent local buckling of 9.5 waves per stiffener bay, where the local buckling pattern appears to be the superposition of both local and a slight global buckle in an outer bay. At 1.15 mm axial displacement the experimental panel showed a mode shape combining both local and 2 panel length global buckles, leading to the onset of a central global buckle at 69.9 kN or 1.45 mm axial displacement. The collapse of the panel occurred at 87.3 kN or 3.67 mm axial displacement, as evidenced by a large reduction in the load carrying capacity of the panel in deep postbuckling.
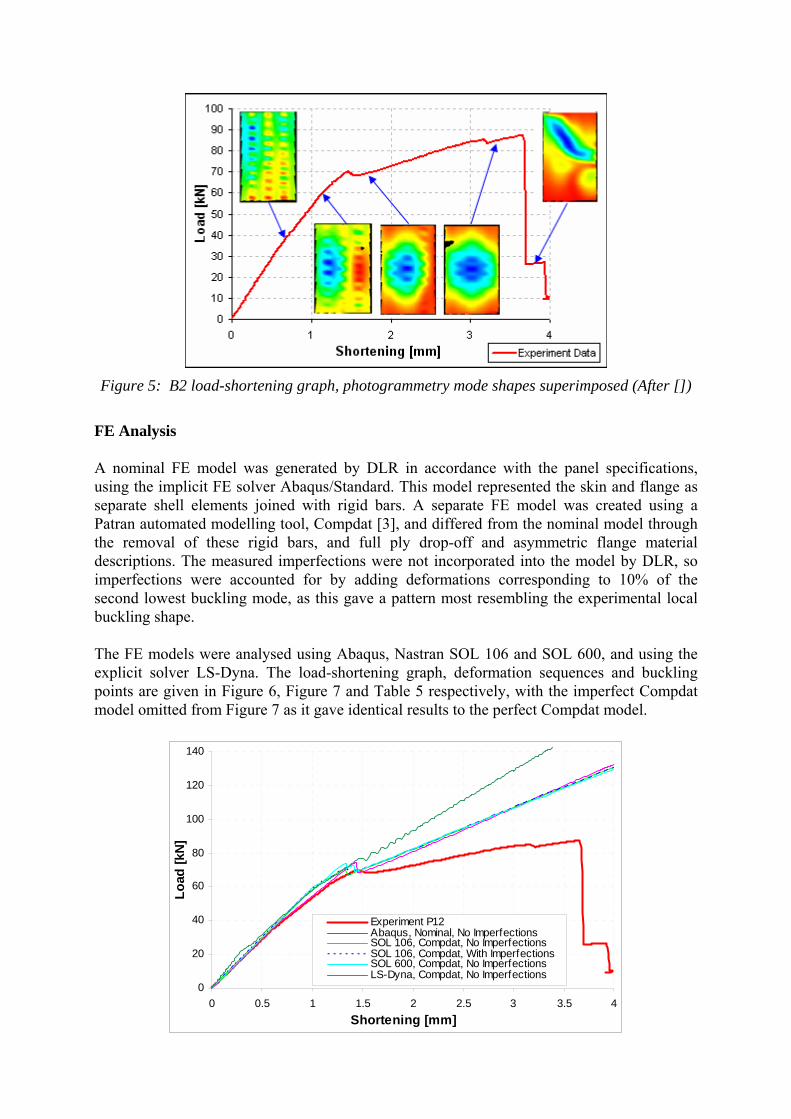
Figure 5: B2 load-shortening graph, photogrammetry mode shapes superimposed (After [])
FE Analysis A nominal FE model was generated by DLR in accordance with the panel specifications, using the implicit FE solver Abaqus/Standard. This model represented the skin and flange as separate shell elements joined with rigid bars. A separate FE model was created using a Patran automated modelling tool, Compdat [3], and differed from the nominal model through the removal of these rigid bars, and full ply drop-off and asymmetric flange material descriptions. The measured imperfections were not incorporated into the model by DLR, so imperfections were accounted for by adding deformations corresponding to 10% of the second lowest buckling mode, as this gave a pattern most resembling the experimental local buckling shape. The FE models were analysed using Abaqus, Nastran SOL 106 and SOL 600, and using the explicit solver LS-Dyna. The load-shortening graph, deformation sequences and buckling points are given in Figure 6, Figure 7 and Table 5 respectively, with the imperfect Compdat model omitted from Figure 7 as it gave identical results to the perfect Compdat model.
0
20
40
60
80
100
120
140
0 0.5 1 1.5 2 2.5 3 3.5 4Shortening [mm]
Load
[kN]
Experiment P12Abaqus, Nominal, No ImperfectionsSOL 106, Compdat, No ImperfectionsSOL 106, Compdat, With ImperfectionsSOL 600, Compdat, No ImperfectionsLS-Dyna, Compdat, No Imperfections
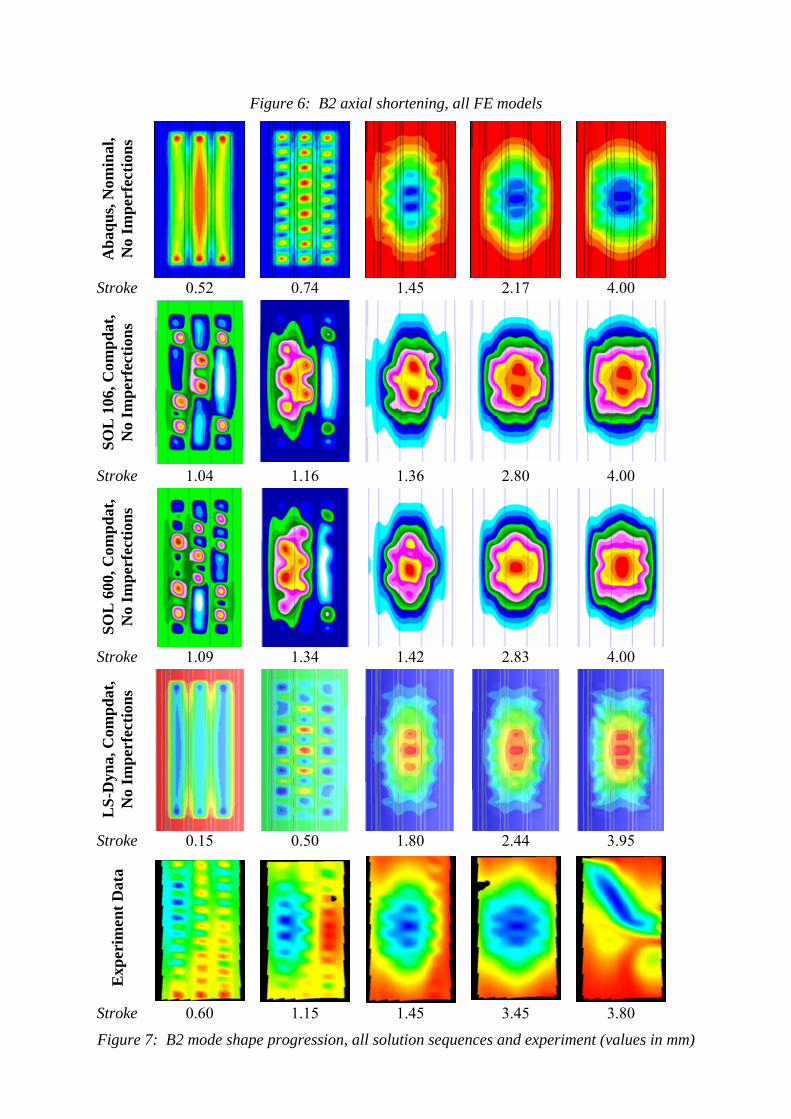
Figure 6: B2 axial shortening, all FE models A
baqu
s, N
omin
al,
No
Impe
rfec
tions
Stroke 0.52 0.74 1.45 2.17 4.00
SOL
106
, Com
pdat
, N
o Im
perf
ectio
ns
Stroke 1.04 1.16 1.36 2.80 4.00
SOL
600
, Com
pdat
, N
o Im
perf
ectio
ns
Stroke 1.09 1.34 1.42 2.83 4.00
LS-
Dyn
a, C
ompd
at,
No
Impe
rfec
tions
Stroke 0.15 0.50 1.80 2.44 3.95
Exp
erim
ent D
ata
Stroke 0.60 1.15 1.45 3.45 3.80
Figure 7: B2 mode shape progression, all solution sequences and experiment (values in mm)

Table 5: B2 buckling modes, FE predictions and experiment
Local buckling Local + Global Global buckling Model Disp
[mm] # buckles per bay
Disp [mm]
Disp [mm]
Load [kN]
Abaqus Nominal, No Imperfections 0.735 8.5 − 1.45 70.1
Compdat, No Imperfections 1.04 2 or 3
Irregular 1.16 1.32 70.4 SOL 106
Compdat, With Imperfections 1.04 2 or 3
Irregular 1.2 1.34 70.9
SOL 600 Compdat, No Imperfections 1.09 3 or 4
Irregular 1.33 1.41 72.8
LS-Dyna Compdat, No Imperfections 0.5 7.5 inside
6.5 outside − 1.48 77.1
Experiment 0.6 9.5 1.15 1.45 69.9 From the axial shortening graph, the Abaqus, SOL 106 and SOL 600 solutions all gave very similar results, with both the perfect and imperfect SOL 106 and SOL 600 solutions giving almost identical results, which differed from the Abaqus solutions only around the onset of global buckling. These solutions all gave excellent to very good predictions of stiffness compared to the experimental panel prior to global buckling, fair comparison up to failure with all solutions overestimating the postbuckling stiffness to a degree, and very good predictions of both the load and displacement at the onset of global buckling. By comparison, the LS-Dyna results also gave very good predictions for stiffness prior to global buckling, and buckling displacement and load, though this led to fairly poor comparison in postbuckling, with the stiffness significantly overestimated. In terms of mode shape progression, all models and solution sequences captured panel pre-buckling mode shapes with varying levels of success, whilst postbuckling predictions were similar across all results. Prior to global buckling, the experimental panel showed both local buckling and an intermediate buckling pattern combining local and global buckles. Whilst no solution sequence was capable of predicting both of these patterns, good representations of the local pattern were given by the Abaqus model, and to a lesser extent the SOL 600 and LS-Dyna solutions. In contrast the SOL 106 solutions predicted the intermediate pattern quite well, though gave less satisfactory correlation with the local buckling pattern. In postbuckling, all models gave similar predictions of a central global buckle, which gave reasonable agreement with experiment, where the Abaqus model gave the most accurate representation of all solutions. The results demonstrate that the imperfection data had a negligible effect on the SOL 106 results. Similarly, the results suggest that the modelling differences between the nominal and Compdat models also had a mostly negligible effect on panel behaviour, though all Compdat models do show a degree of asymmetry in deformation patterns, which is likely to be the result of the asymmetric material definition for these models. Also, though not presented, experimental and FE strain data gave mostly poor comparison, both in a qualitative and

quantitative sense. Finally, panel collapse was not captured by any solution sequence within the applied 4 mm stroke, though LS-Dyna predicted significant matrix failure in the skin
Discussion Comparing results across codes, the implicit non-linear solvers SOL 106, SOL 600 and Abaqus all gave very similar results, which is not surprising considering they follow the same solution process. In general, SOL 106 and Abaqus contained slightly more robust and efficient algorithms for handling convergence problems due to non-linearity effects, using the ITER approach and the STABILIZE option in SOL 106 and Abaqus respectively. As a contrast, LS-Dyna required significantly more computational time, with run times commonly approaching a week, compared to a maximum of 8 hours for the implicit solvers. However, LS-Dyna analysis demonstrated that explicit solvers could be used to simulate postbuckling stiffened structures, though for the particular case analysed here LS-Dyna gave poor predictions of the global buckling behaviour. In spite of the poor simulation using LS-Dyna for this benchmark case, and in consideration of successful work by other authors [4-6], it is expected that more accurate results are possible using LS-Dyna. Investigations into the effects of loading rate, element formulation and boundary conditions were performed prior to the benchmark analysis, and work is continuing in an effort to improve the LS-Dyna simulation. Preliminary results indicate that significant improvements may be possible, especially with modifications to boundary conditions. In terms of the goals of the COCOMAT project, the results for this benchmark exercise suggest that current software codes may not be adequate for the prediction of deep postbuckling behaviour, leading to panel collapse. All analyses over-predicted the panel stiffness in global buckling, which indicates that the experimental panel may have been undergoing material degradation. Many software codes have procedures available for predicting and handling material degradation, including SOL 600, Abaqus and LS-Dyna, and involve monitoring one or more failure criteria, and adjusting material properties once certain damage threshold limits are reached. Though further work is required, it appears that accurate representation of composite material degradation is required in order to accurately simulate postbuckling behaviour up to the point of collapse. Throughout all analyses, the importance of maintaining a high level of accuracy in model definition and convergence tolerance was also evident. For SOL 106 and SOL 600, it was necessary to significantly increase the convergence tolerance from the software defaults in order to generate accurate results. Additionally, the panel mode shape development was also dependent on the stiffness update method, so that a full Newton-Raphson method with a stiffness update at every iteration was necessary to capture the correct mode shapes. Similarly in LS-Dyna, though it was possible to reduce run times from approaching a week to only a few days using mass scaling and increasing the load rate, these methods were not applied due to requirements for accuracy and the unknown inertia effects. The benchmarking exercise also reinforced the critical nature of accurately capturing both panel imperfections and boundary conditions, with correct representation of boundary conditions seen to be the most critical. The boundary conditions for postbuckling panels are not only difficult to define in both the experiment and the FE modelling, but variations in boundary conditions can result in significant changes in panel stiffness and buckling mode shape progression. The analysis in the context of the highly non-linear benchmark cases has demonstrated that the accuracy of the solution is very dependant on accurate description of
these effects, and that even with a concerted attempt at accuracy in the experiment and FE models, the panel behaviour is still likely to be misrepresented to some extent. There are a number of recommendations that are pertinent to further study of postbuckling stiffened panels, especially considering that the analysis in this report consists of only the first half of a comprehensive benchmarking exercise. These include recommendations to: collate comparison with other COCOMAT partners for a more comprehensive analysis of these benchmark cases; continue using SOL 106, SOL 600, Abaqus and LS-Dyna for the next benchmarking exercise, which involves the incorporation of delaminations and stiffener debonds, and; continue using the most accurate modelling representations possible.
Conclusion A benchmarking exercise was conducted to compare the efficacy of various software codes for the analysis of composite postbuckling stiffened structures. Two benchmark cases were described, and analysis was conducted using the implicit solvers Nastran SOL 106, Nastran SOL 600 (an adoption of MSC.Marc) and Abaqus, and the explicit solver in LS-Dyna. Comparison with experimental data for the benchmark cases demonstrated that all software codes could generate reasonably accurate predictions across most panel characteristics. Typically, FE predictions provided very good to excellent predictions of structural stiffness, especially prior to global buckling, and the buckling load and displacement. Predictions of buckling shape varied, though generally gave fair comparison to experiment data, whilst strain data showed mostly poor comparison across all software codes. Comparing the software codes, the implicit solvers all gave very similar results, though Abaqus and SOL 106 use a more robust and efficient approach to handle convergence difficulties. LS-Dyna predictions showed very good comparison prior to global buckling, leading to significant overestimation of stiffness in deep postbuckling. All codes though overestimated panel postbuckling stiffness to some degree, which suggests that the effects of material degradation should be considered. This work was carried out as one of many parallel investigations as part of a larger benchmarking exercise, which will extend the benchmark cases analysed to include panels with delaminations and debonds. The work in this report will be compared to the other parallel investigations, and the extended benchmark cases, to further conclude on the capacity of various software codes to accurately analyse composite postbuckling stiffened panels.
Acknowledgments The authors would like to acknowledge the experimental results produced by Technion in Israel, and German Aerospace Centre (DLR) in Germany. The authors would also like to thank Dr Andrew Currie of MSC.Software Australia for assistance with the SOL 600 analysis. Finally, the authors would like to acknowledge both the financial support of the Australian Research Council and the computing resources provided by the Victorian Partnership for Advanced Computing.
References 1. Abramovich, H., Pevsner, P., Weller, T., Pekker, N. and Ghilai, G., “Axial Buckling of
Laminated Composite Stringer Stiffened Curved Panels − Tests vs FE Predictions”, in
Proc. International Conference on Buckling and Postbuckling Behaviour of Composite Laminated Shell Structures, Eilat, Israel, March 1-2, 2004.
2. Klein, H., Zimmerman, R. and Kling, A., “Buckling and Postbuckling of Stringer Stiffened Fibre Composite Curved Panels − Tests and Computations”, in Proc. International Conference on Buckling and Postbuckling Behaviour of Composite Laminated Shell Structures, Eilat, Israel, March 1-2, 2004.
3. Yap, J.W.H., Scott, M.L, Thomson, R.S. and Hachenberg, D., “The Analysis of Skin-to-Stiffener Debonding in Composite Aerospace Structures”, Composite Structures, Vol. 57, 2002, pp. 425 − 435.
4. Scott, M.L., Nguyen, M.Q., Elder, D.E., Bayandor, J., Rajbhandari, S.P. and Thomson, R.S., “Explicit Finite Element Modelling of Impact Events on Composite Aerospace Structures”, in Proc. Coupling of Fluids, Structures and Waves in Aeronautics, A French-Australian Workshop, Melbourne, Australia, 3-6 December, 2001, pp. 101-114.
5. Korjakin, A., Ivahskov, A. and Kovalev, A., “Optimization of Stiffened Laminated Composite Cylindrical Panels in the Buckling and Postbuckling Analysis”, in Proc. 3rd European LS-Dyna Conference, Paris, France, June 18-21, 2001.
6. Tanov, R. and Tabiei, A., “Static and Dynamic Buckling of Laminated Composite Shells,” 5th International LS-DYNA Users Conference, Southfield, Michigan, September 21-22, 1998
7. Degenhardt, R., Rolfes, R., R. Zimmermann, Rohwer K., “COCOMAT - Improved MATerial Exploitation at Safe Design of COmposite Airframe Structures by Accurate Simulation of COllapse”, in Proc. International Conference on Buckling and Postbuckling Behaviour of Composite Laminated Shell Structures, Eilat, Israel, March 1-2, 2004