benchmark survey of horticulture crops in uttar pradesh
TRANSCRIPT

Benchmark Survey of Horticulture Crops in Uttar Pradesh
Area and Production Estimation
REPORT
Sponsored by:
Directorate of Economics and Statistics, Department of Planning,
Government of Uttar Pradesh
Submitted by:
Nomita P. Kumar
&
Kavita Baliyan
GIRI INSTITUTE OF DEVELOPMENT STUDIES
(An Autonomous Institute Funded by ICSSR and Govt. Of UttarPradesh)
Sector - O, Aliganj Housing Scheme
LUCKNOW - 226024, U.P.
INDIA
April 2020


PREFACE
Horticulture is an important component of agriculture having significant role in the economy
of the country. India's varied agro-climatic conditions provides an additional advantage in
favour of growing of a wide variety of horticultural crops such as fruits & vegetables, tuber
crops, plantation crops, flowers, spices & condiments etc. Commercial importance of
horticulture crops has also been increasing gaining all over the world as these crops
contribute significantly to the country's economy. Various horticulture crops also play an
important role in human nutrition, preventing diseases and contributing to the nation‟s
development and prosperity. In particular, the horticulture crops such as fruits and vegetables
are rich source of vitamins, minerals, proteins and carbohydrates that are essential in human
diet. Similarly, other crops like flowers and ornamental crops enhance aesthetic value of our
environment while medicinal crops yield pharmaceutical constituents. Thus, horticulture
assumes a great importance in food and nutritional security, general health and well -being of
our population. Horticulture crops form a vital part in the Indian agricultural production.
India is the second largest producer of fruits and vegetables in the world. Cultivation,
marketing and processing of these crops generate significant employment and livelihood
opportunities in many parts of the country.
India is the second largest producer of fruits as well as vegetables after China. The country
ranks first in the world in the production of mango, banana, sapota and acid lime. Over the
years, the country has achieved highest productivity in grapes as well. Still, the country has
huge untapped potential to improve the productivity and production of fruits, vegetables and
flowers with the help of already available technological advancement in the field of
agriculture. The importance of the expansion of horticulture has been increased substantially
owing to its vast export potential in the WTO regime.
In detail, the present study has attempted to examine the implementation pattern, status of
completion and kinds of deficiencies and gaps emerging in case of Uttar Pradesh, where
horticulture is one of the critical sectors in the economy. The horticulture crops are grown in
around 30 lakh hectares area which accounts 12 precent of the total cultivated area of the
State (State Horticultural Mission Report, 2013). Expansion of area horticulture can promote
economic diversification and thus create additional employment opportunities in the state.

The area under horticulture crops can be increased by utilization of available cultivable
wastelands, fallow lands and the land belonging to non-resident landowners in villages.
Horticulture crops cover a wide variety of fruits, vegetables, tuber crops, mushrooms,
floriculture, medicinal and aromatic plants, spices, food processing and bee keeping. U.P.'s
varied agro-climate permits growing of a large number of these crops throughout the year
enabling their availability on a regular basis. The state holds a vast potential for the
development of various horticulture crops as it has diver‟s climatic conditions for growing
different categories of fruits and off -season vegetables in its different agro zones. Therefore,
horticulture has emerged as one of the major agricultural activities as there has been a
substantial increase in both area and production of horticulture crops. As has been well
recognised that the horticulture crops have the inherent advantage of providing higher
productivity per unit area of land as compared to other crops, resulting in higher income and
employment generation in rural areas. Fruits and vegetables have been shown to earn 20-30
times more foreign exchange per unit area than cereals due to higher yields and higher prices
available in the national/international markets. Primary survey provides us insight into
problems experienced in different stages of the plantation of horticulture crops.
However, a little initiative has been undertaken in favor of promoting horticulture sector
despite various agro climatic regions have been possessing certain area specific advantages
for growing different horticultural crops during different agricultural seasons over the years.
Non availability of accurate data and other information on the status and pattern of growing
different fruits, vegetables and other horticulture crops at district, regional and agro zone
levels has generally been cited as the main constraints by planners and policy makers for
planning development of horticulture in the state. Keeping into account these facts into
consideration the present study to propose for carrying out a detail study on issues related to
the present status of horticulture sector across the districts and agro- zones of the state.
The main objectives with which this study was conducted was: firstly, to estimate land use
pattern under various agriculture and horticultural crops and its changing pattern across
different geographical and agro- climatic conditions and at state level; secondly, pattern and
emerging changes in productivity/yield rates of different agriculture and horticultural crops;
thirdly, pattern and emerging changes in output of different agriculture and horticultural
crops; fourthly, input use, cost of production, profitability of using land under different
options and factors implicating variations in opting cultivation of different horticulture and
other crops across the regions of the state; fifthly, area specific emerging constraints in opting
cultivation of different horticulture crops and measures to be initiated to overcome from these

constraints; sixthly, contribution of horticulture to GDP at district, region and state level;
seventhly, to suggest about the types of measures to be initiated for maximizing land under
the cultivation of horticulture crops and finally recommends about the kinds of measures to
be initiated for achieving more successful results from the implementation of such package in
context of horticulture crops in the future.
The authors are grateful to the Directorate of Economics and Statistics, Department of
Planning, Government of Uttar Pradesh for providing financial support to undertake this
study “Survey for estimation of area and production of selected vegetable/ floriculture
crops in State- a limited survey will be undertaken to assess area and production of
select flower/ vegetable crops and emerging crop like mushroom production” which was
later titled as „Benchmark Survey of Horticulture Crops in Uttar Pradesh: Area and
Production Estimation”. We wish to record our sincere thanks to Mr, A. K. Pandey,
Director, Department of Economic and Statistics, Government of Uttar Pradesh for asking us
to conduct such an important study and providing valuable support in conducting this study.
Sincere thanks are also due to the officials of different line departments of State Government
who are responsible for successful implementation of this study and provided necessary data
and other inputs as required by us.
We would also like to extend gratitude to our Director, Prof B. K. Bajpai for extending every
possible support to us at various stages of the project. We are thankful to all the support
obtained by administrative and library staff for extending the required support. We also wish
to thank our research team comprising Mr. Bindra Prasad, Mr Iltafat Khan, Mr. Nitin Mishra
and Mr Dinesh Kumar for their valuable assistance in collection of data from different
sources/ districts. Thanks are due to Dr Sandeep Kumar Baliyan, Consultant for doing the
tedious job of analysis of primary and secondary data. We are indebted to Dr Achala
Srivastava, Senior Research Associate and Dr Swapnil Gupta, Senior Research Assistant, for
helping in preparing this draft report and Mr. Nishchal Singh Bisht, Research Investigator for
continuous help in data feeding and its analysis. We are also thankful to all the respondents
from nine districts covered in our study without whose support we could not have been able
to complete this study.
April, 2020
Nomita P. Kumar
Kavita Baliyan
Project Director

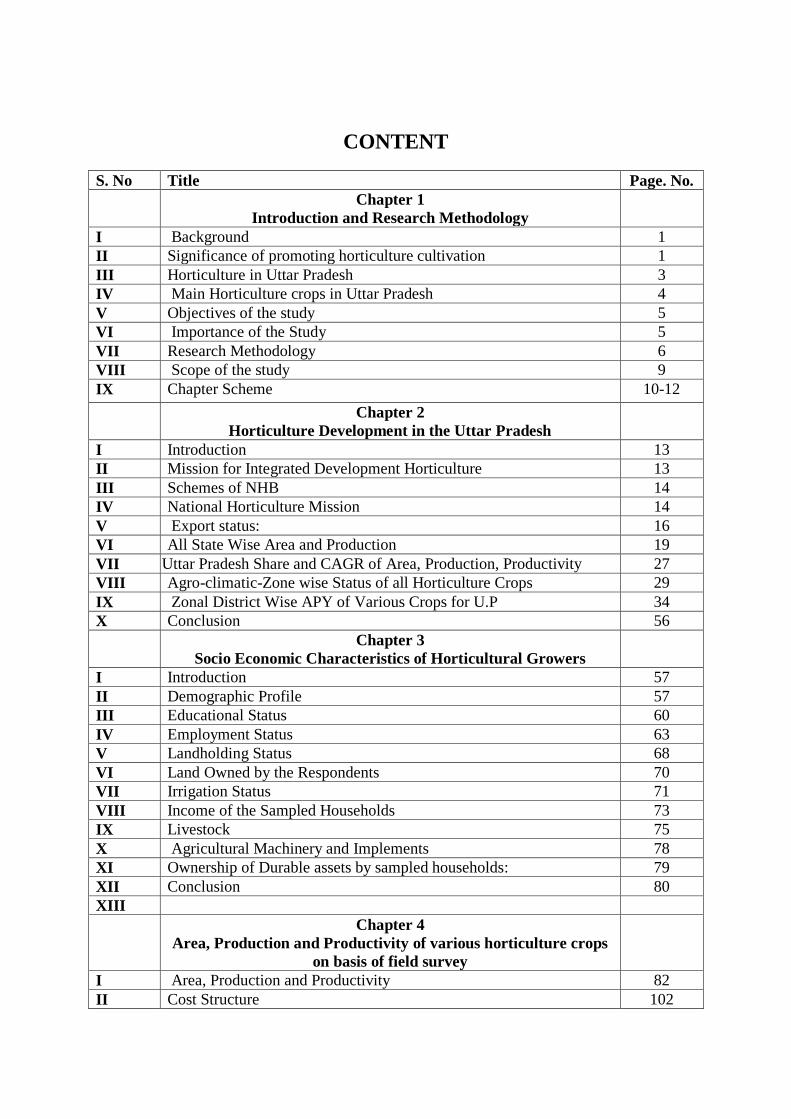
CONTENT
S. No Title Page. No.
Chapter 1
Introduction and Research Methodology
I Background 1
II Significance of promoting horticulture cultivation 1
III Horticulture in Uttar Pradesh 3
IV Main Horticulture crops in Uttar Pradesh 4
V Objectives of the study 5
VI Importance of the Study 5
VII Research Methodology 6
VIII Scope of the study 9
IX Chapter Scheme 10-12
Chapter 2
Horticulture Development in the Uttar Pradesh
I Introduction 13
II Mission for Integrated Development Horticulture 13
III Schemes of NHB 14
IV National Horticulture Mission 14
V Export status: 16
VI All State Wise Area and Production 19
VII Uttar Pradesh Share and CAGR of Area, Production, Productivity 27
VIII Agro-climatic-Zone wise Status of all Horticulture Crops 29
IX Zonal District Wise APY of Various Crops for U.P 34
X Conclusion 56
Chapter 3
Socio Economic Characteristics of Horticultural Growers
I Introduction 57
II Demographic Profile 57
III Educational Status 60
IV Employment Status 63
V Landholding Status 68
VI Land Owned by the Respondents 70
VII Irrigation Status 71
VIII Income of the Sampled Households 73
IX Livestock 75
X Agricultural Machinery and Implements 78
XI Ownership of Durable assets by sampled households: 79
XII Conclusion 80
XIII
Chapter 4
Area, Production and Productivity of various horticulture crops
on basis of field survey
I Area, Production and Productivity 82
II Cost Structure 102
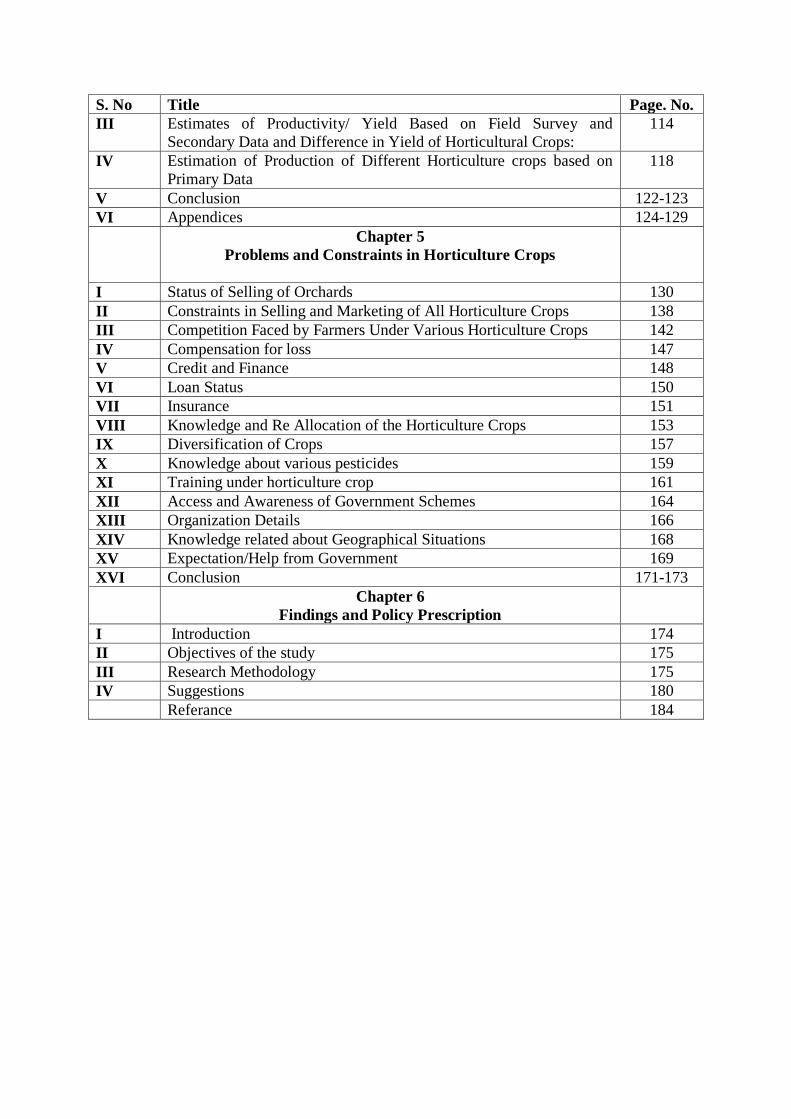
S. No Title Page. No.
III Estimates of Productivity/ Yield Based on Field Survey and
Secondary Data and Difference in Yield of Horticultural Crops:
114
IV Estimation of Production of Different Horticulture crops based on
Primary Data
118
V Conclusion 122-123
VI Appendices 124-129
Chapter 5
Problems and Constraints in Horticulture Crops
I Status of Selling of Orchards 130
II Constraints in Selling and Marketing of All Horticulture Crops 138
III Competition Faced by Farmers Under Various Horticulture Crops 142
IV Compensation for loss 147
V Credit and Finance 148
VI Loan Status 150
VII Insurance 151
VIII Knowledge and Re Allocation of the Horticulture Crops 153
IX Diversification of Crops 157
X Knowledge about various pesticides 159
XI Training under horticulture crop 161
XII Access and Awareness of Government Schemes 164
XIII Organization Details 166
XIV Knowledge related about Geographical Situations 168
XV Expectation/Help from Government 169
XVI Conclusion 171-173
Chapter 6
Findings and Policy Prescription
I Introduction 174
II Objectives of the study 175
III Research Methodology 175
IV Suggestions 180
Referance 184
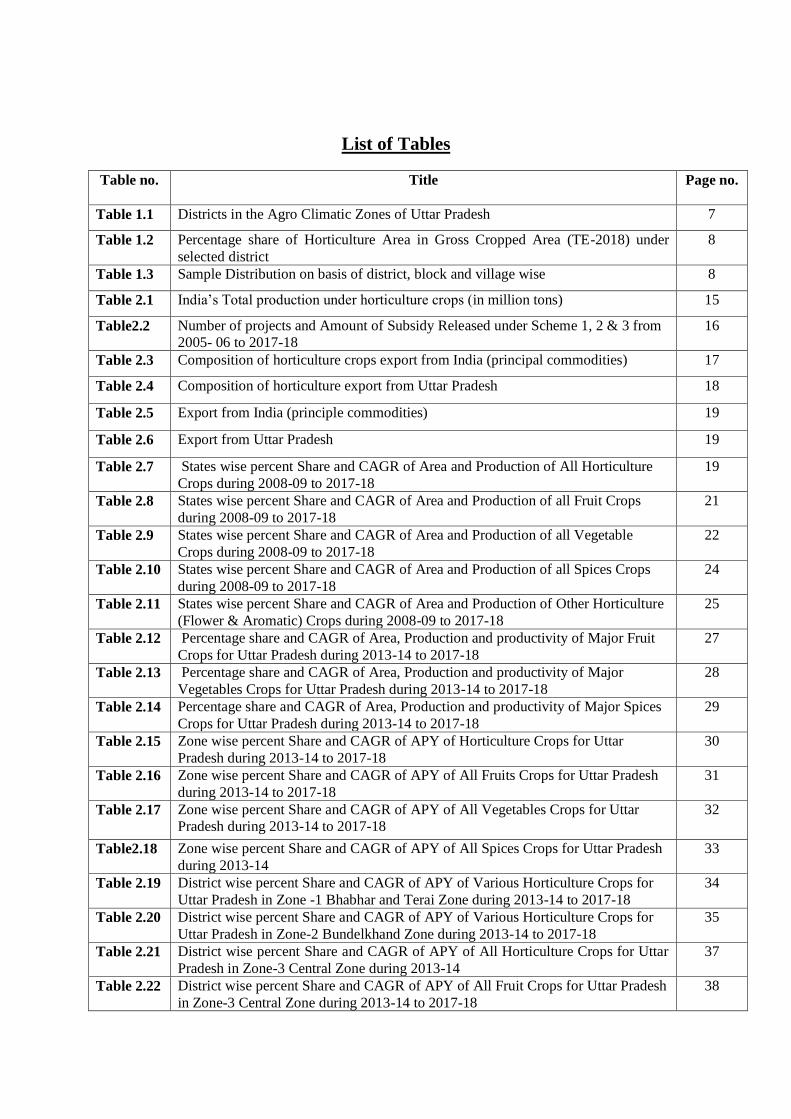
List of Tables
Table no. Title
Page no.
Table 1.1 Districts in the Agro Climatic Zones of Uttar Pradesh 7
Table 1.2 Percentage share of Horticulture Area in Gross Cropped Area (TE-2018) under
selected district
8
Table 1.3 Sample Distribution on basis of district, block and village wise 8
Table 2.1 India‟s Total production under horticulture crops (in million tons) 15
Table2.2 Number of projects and Amount of Subsidy Released under Scheme 1, 2 & 3 from
2005- 06 to 2017-18
16
Table 2.3 Composition of horticulture crops export from India (principal commodities) 17
Table 2.4 Composition of horticulture export from Uttar Pradesh 18
Table 2.5 Export from India (principle commodities) 19
Table 2.6 Export from Uttar Pradesh 19
Table 2.7 States wise percent Share and CAGR of Area and Production of All Horticulture
Crops during 2008-09 to 2017-18
19
Table 2.8 States wise percent Share and CAGR of Area and Production of all Fruit Crops
during 2008-09 to 2017-18
21
Table 2.9 States wise percent Share and CAGR of Area and Production of all Vegetable
Crops during 2008-09 to 2017-18
22
Table 2.10 States wise percent Share and CAGR of Area and Production of all Spices Crops
during 2008-09 to 2017-18
24
Table 2.11 States wise percent Share and CAGR of Area and Production of Other Horticulture
(Flower & Aromatic) Crops during 2008-09 to 2017-18
25
Table 2.12 Percentage share and CAGR of Area, Production and productivity of Major Fruit
Crops for Uttar Pradesh during 2013-14 to 2017-18
27
Table 2.13 Percentage share and CAGR of Area, Production and productivity of Major
Vegetables Crops for Uttar Pradesh during 2013-14 to 2017-18
28
Table 2.14 Percentage share and CAGR of Area, Production and productivity of Major Spices
Crops for Uttar Pradesh during 2013-14 to 2017-18
29
Table 2.15 Zone wise percent Share and CAGR of APY of Horticulture Crops for Uttar
Pradesh during 2013-14 to 2017-18
30
Table 2.16 Zone wise percent Share and CAGR of APY of All Fruits Crops for Uttar Pradesh
during 2013-14 to 2017-18
31
Table 2.17 Zone wise percent Share and CAGR of APY of All Vegetables Crops for Uttar
Pradesh during 2013-14 to 2017-18
32
Table2.18 Zone wise percent Share and CAGR of APY of All Spices Crops for Uttar Pradesh
during 2013-14
33
Table 2.19 District wise percent Share and CAGR of APY of Various Horticulture Crops for
Uttar Pradesh in Zone -1 Bhabhar and Terai Zone during 2013-14 to 2017-18
34
Table 2.20 District wise percent Share and CAGR of APY of Various Horticulture Crops for
Uttar Pradesh in Zone-2 Bundelkhand Zone during 2013-14 to 2017-18
35
Table 2.21 District wise percent Share and CAGR of APY of All Horticulture Crops for Uttar
Pradesh in Zone-3 Central Zone during 2013-14
37
Table 2.22 District wise percent Share and CAGR of APY of All Fruit Crops for Uttar Pradesh
in Zone-3 Central Zone during 2013-14 to 2017-18
38
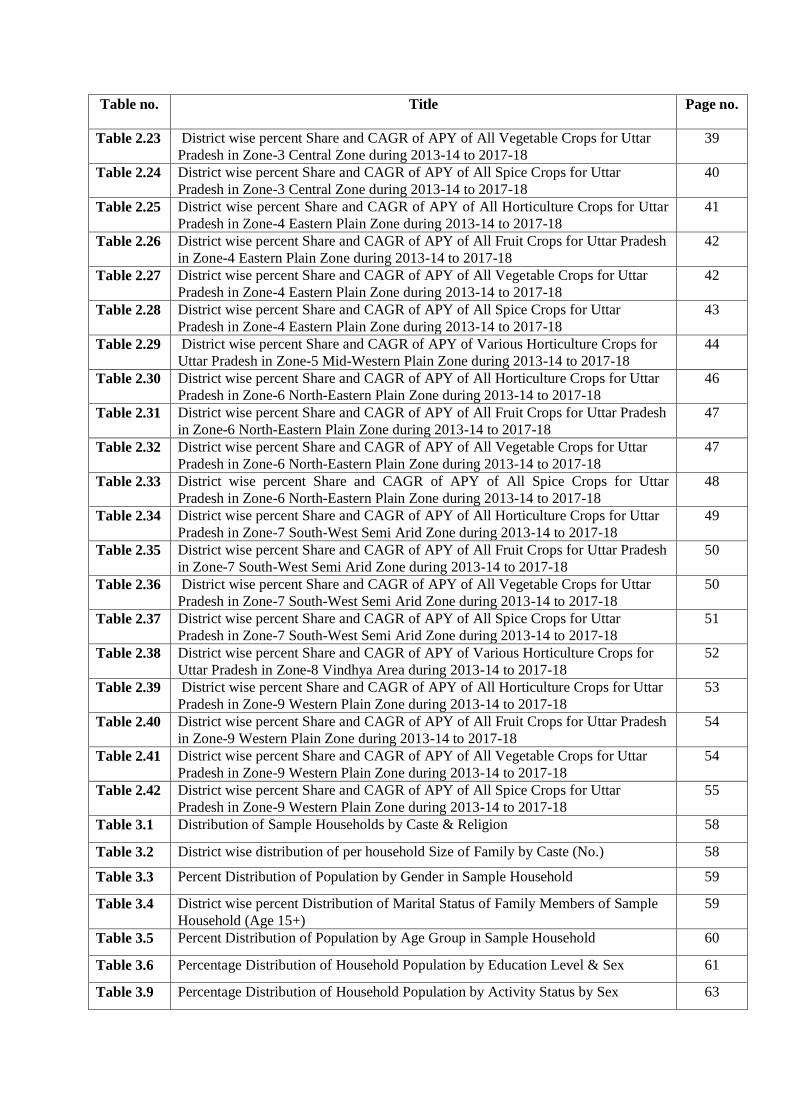
Table no. Title
Page no.
Table 2.23 District wise percent Share and CAGR of APY of All Vegetable Crops for Uttar
Pradesh in Zone-3 Central Zone during 2013-14 to 2017-18
39
Table 2.24 District wise percent Share and CAGR of APY of All Spice Crops for Uttar
Pradesh in Zone-3 Central Zone during 2013-14 to 2017-18
40
Table 2.25 District wise percent Share and CAGR of APY of All Horticulture Crops for Uttar
Pradesh in Zone-4 Eastern Plain Zone during 2013-14 to 2017-18
41
Table 2.26 District wise percent Share and CAGR of APY of All Fruit Crops for Uttar Pradesh
in Zone-4 Eastern Plain Zone during 2013-14 to 2017-18
42
Table 2.27 District wise percent Share and CAGR of APY of All Vegetable Crops for Uttar
Pradesh in Zone-4 Eastern Plain Zone during 2013-14 to 2017-18
42
Table 2.28 District wise percent Share and CAGR of APY of All Spice Crops for Uttar
Pradesh in Zone-4 Eastern Plain Zone during 2013-14 to 2017-18
43
Table 2.29 District wise percent Share and CAGR of APY of Various Horticulture Crops for
Uttar Pradesh in Zone-5 Mid-Western Plain Zone during 2013-14 to 2017-18
44
Table 2.30 District wise percent Share and CAGR of APY of All Horticulture Crops for Uttar
Pradesh in Zone-6 North-Eastern Plain Zone during 2013-14 to 2017-18
46
Table 2.31 District wise percent Share and CAGR of APY of All Fruit Crops for Uttar Pradesh
in Zone-6 North-Eastern Plain Zone during 2013-14 to 2017-18
47
Table 2.32 District wise percent Share and CAGR of APY of All Vegetable Crops for Uttar
Pradesh in Zone-6 North-Eastern Plain Zone during 2013-14 to 2017-18
47
Table 2.33 District wise percent Share and CAGR of APY of All Spice Crops for Uttar
Pradesh in Zone-6 North-Eastern Plain Zone during 2013-14 to 2017-18
48
Table 2.34 District wise percent Share and CAGR of APY of All Horticulture Crops for Uttar
Pradesh in Zone-7 South-West Semi Arid Zone during 2013-14 to 2017-18
49
Table 2.35 District wise percent Share and CAGR of APY of All Fruit Crops for Uttar Pradesh
in Zone-7 South-West Semi Arid Zone during 2013-14 to 2017-18
50
Table 2.36 District wise percent Share and CAGR of APY of All Vegetable Crops for Uttar
Pradesh in Zone-7 South-West Semi Arid Zone during 2013-14 to 2017-18
50
Table 2.37 District wise percent Share and CAGR of APY of All Spice Crops for Uttar
Pradesh in Zone-7 South-West Semi Arid Zone during 2013-14 to 2017-18
51
Table 2.38 District wise percent Share and CAGR of APY of Various Horticulture Crops for
Uttar Pradesh in Zone-8 Vindhya Area during 2013-14 to 2017-18
52
Table 2.39 District wise percent Share and CAGR of APY of All Horticulture Crops for Uttar
Pradesh in Zone-9 Western Plain Zone during 2013-14 to 2017-18
53
Table 2.40 District wise percent Share and CAGR of APY of All Fruit Crops for Uttar Pradesh
in Zone-9 Western Plain Zone during 2013-14 to 2017-18
54
Table 2.41 District wise percent Share and CAGR of APY of All Vegetable Crops for Uttar
Pradesh in Zone-9 Western Plain Zone during 2013-14 to 2017-18
54
Table 2.42 District wise percent Share and CAGR of APY of All Spice Crops for Uttar
Pradesh in Zone-9 Western Plain Zone during 2013-14 to 2017-18
55
Table 3.1 Distribution of Sample Households by Caste & Religion 58
Table 3.2 District wise distribution of per household Size of Family by Caste (No.) 58
Table 3.3 Percent Distribution of Population by Gender in Sample Household 59
Table 3.4 District wise percent Distribution of Marital Status of Family Members of Sample
Household (Age 15+)
59
Table 3.5 Percent Distribution of Population by Age Group in Sample Household 60
Table 3.6 Percentage Distribution of Household Population by Education Level & Sex 61
Table 3.9 Percentage Distribution of Household Population by Activity Status by Sex 63

Table no. Title
Page no.
Table 3.10 Percentage Distribution of Household Population by Type of Employment Status &
Sex
64
Table 3.11 Percentage Distribution of Household Population by Type of Employment Status
(Primary Occupation) by Sex (No.)
65
Table 3.12 Percentage Distribution of Household Population by Type of Employment Status
(Secondary Occupation) by Sex (No.)
67
Table 3.13 District wise percent Share of Household by Land group 68
Table 3.14 District wise percent Share and Area (acre) by Land group 69
Table 3.15 District wise Details of Land per Household 70
Table 3.16 District wise Details of Land of Sample Households 71
Table 3.17 District wise Distribution of Irrigated Area 72
Table 3.18 District wise Distribution of sampled households by different source of irrigation 72
Table 3.19 Irrigated area by source on sample farm as percent of Total irrigated area 73
Table 3.20 District wise distribution of Current Year income of sampled households by its
source
74
Table 3.21 Distribution of Previous year Income of sampled households by its source 75
Table 3.22 District wise Animal status of household 76
Table 3.23 District wise Average No of Animal per Households 77
Table 3.24 Average Value of animal (in Rs.) per households 77
Table 3.25 District wise Distribution of Agricultural Equipment on sampled households
reporting yes
78
Table 3.26 Household reporting Durable items: (percent YES) 79
Table 3.27 Households reporting ownership of financial assets 80
Table 4.1 District wise Area under Different Horticulture Crops on Sampled Farms in
Selected Districts of Uttar Pradesh
83
Table 4.2 District wise Area, Production and Yield of Different Crops on Sampled farms in
Selected Districts of Uttar Pradesh
84
Table 4.3 Area, Production and Productivity of Individual Crops in Foodgrain on Sample
Farms
86
Table 4.4 Area, Production and Productivity of Individual Crops in Fruits on Sample Farms 89
Table 4.5 Area, Production and Productivity of Individual Vegetable Crops on Sample
Farms in Uttar Pradesh
91
Table 4.6 Area, Production and Productivity of Individual Crops in Spice-crop on Sample
Farms
93
Table 4.7 Area, Production and Productivity of Individual Crops in Flowers on Sample Farms 96
Table 4.8 Area, Production and Productivity of Individual Crops in Cash-crop on Sample
Farms
98
Table 4.9 Area, Production and Productivity of Individual Crops in Other crops on Sample
Farms
100
Table 4.10 District wise details of Cost Structure in Foodgrain Crops (Rs. per Hectare) 103
Table 4.11 District wise details of Cost Structure in Fruit Crops (Rs. per Hectare) 104
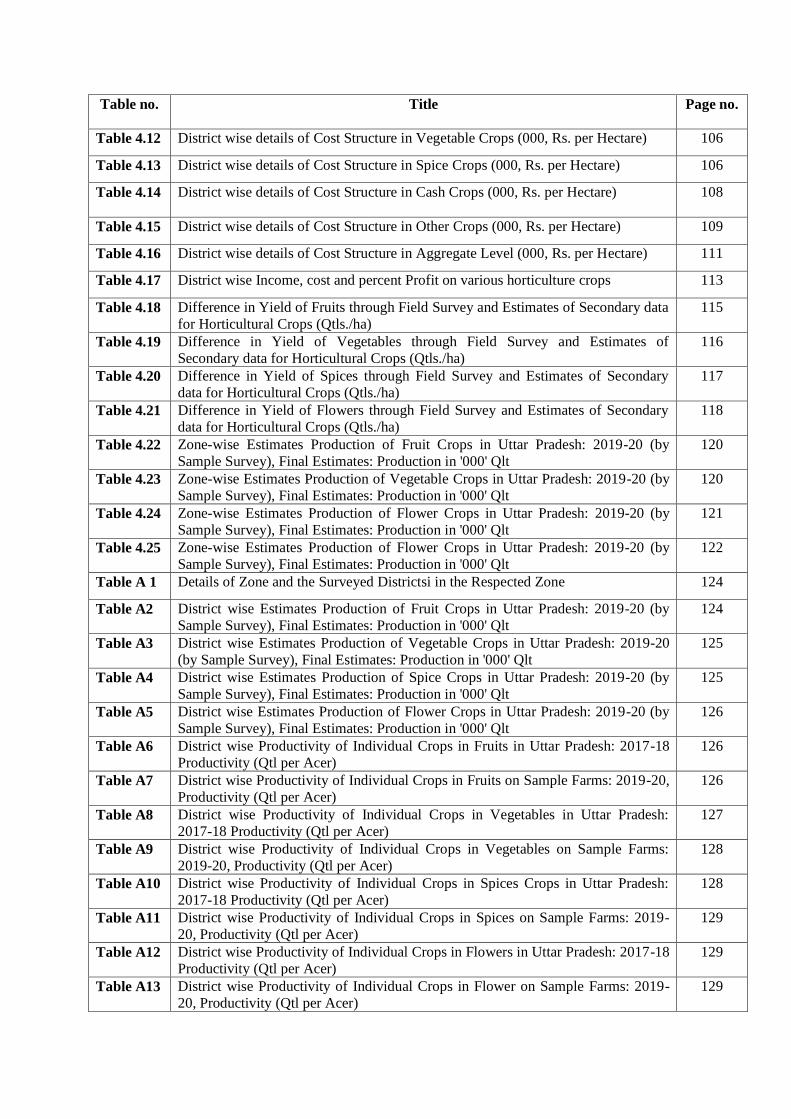
Table no. Title
Page no.
Table 4.12 District wise details of Cost Structure in Vegetable Crops (000, Rs. per Hectare) 106
Table 4.13 District wise details of Cost Structure in Spice Crops (000, Rs. per Hectare) 106
Table 4.14 District wise details of Cost Structure in Cash Crops (000, Rs. per Hectare)
108
Table 4.15 District wise details of Cost Structure in Other Crops (000, Rs. per Hectare) 109
Table 4.16 District wise details of Cost Structure in Aggregate Level (000, Rs. per Hectare) 111
Table 4.17 District wise Income, cost and percent Profit on various horticulture crops 113
Table 4.18 Difference in Yield of Fruits through Field Survey and Estimates of Secondary data
for Horticultural Crops (Qtls./ha)
115
Table 4.19 Difference in Yield of Vegetables through Field Survey and Estimates of
Secondary data for Horticultural Crops (Qtls./ha)
116
Table 4.20 Difference in Yield of Spices through Field Survey and Estimates of Secondary
data for Horticultural Crops (Qtls./ha)
117
Table 4.21 Difference in Yield of Flowers through Field Survey and Estimates of Secondary
data for Horticultural Crops (Qtls./ha)
118
Table 4.22 Zone-wise Estimates Production of Fruit Crops in Uttar Pradesh: 2019-20 (by
Sample Survey), Final Estimates: Production in '000' Qlt
120
Table 4.23 Zone-wise Estimates Production of Vegetable Crops in Uttar Pradesh: 2019-20 (by
Sample Survey), Final Estimates: Production in '000' Qlt
120
Table 4.24 Zone-wise Estimates Production of Flower Crops in Uttar Pradesh: 2019-20 (by
Sample Survey), Final Estimates: Production in '000' Qlt
121
Table 4.25 Zone-wise Estimates Production of Flower Crops in Uttar Pradesh: 2019-20 (by
Sample Survey), Final Estimates: Production in '000' Qlt
122
Table A 1 Details of Zone and the Surveyed Districtsi in the Respected Zone 124
Table A2 District wise Estimates Production of Fruit Crops in Uttar Pradesh: 2019-20 (by
Sample Survey), Final Estimates: Production in '000' Qlt
124
Table A3 District wise Estimates Production of Vegetable Crops in Uttar Pradesh: 2019-20
(by Sample Survey), Final Estimates: Production in '000' Qlt
125
Table A4 District wise Estimates Production of Spice Crops in Uttar Pradesh: 2019-20 (by
Sample Survey), Final Estimates: Production in '000' Qlt
125
Table A5 District wise Estimates Production of Flower Crops in Uttar Pradesh: 2019-20 (by
Sample Survey), Final Estimates: Production in '000' Qlt
126
Table A6 District wise Productivity of Individual Crops in Fruits in Uttar Pradesh: 2017-18
Productivity (Qtl per Acer)
126
Table A7 District wise Productivity of Individual Crops in Fruits on Sample Farms: 2019-20,
Productivity (Qtl per Acer)
126
Table A8 District wise Productivity of Individual Crops in Vegetables in Uttar Pradesh:
2017-18 Productivity (Qtl per Acer)
127
Table A9 District wise Productivity of Individual Crops in Vegetables on Sample Farms:
2019-20, Productivity (Qtl per Acer)
128
Table A10 District wise Productivity of Individual Crops in Spices Crops in Uttar Pradesh:
2017-18 Productivity (Qtl per Acer)
128
Table A11 District wise Productivity of Individual Crops in Spices on Sample Farms: 2019-
20, Productivity (Qtl per Acer)
129
Table A12 District wise Productivity of Individual Crops in Flowers in Uttar Pradesh: 2017-18
Productivity (Qtl per Acer)
129
Table A13 District wise Productivity of Individual Crops in Flower on Sample Farms: 2019-
20, Productivity (Qtl per Acer)
129

Table no. Title
Page no.
Table 5.1 Distribution of Sample Farms Reporting of Selling of Orchards (percent) 130
Table 5.2 Distribution of sample farms on basis of time of sale of orchard (in percent) 132
Table 5.3 Distribution of sample reporting of taking care of orchard after sale 133
Table 5.4 Duration of selling orchards 134
Table 5.5 Type of Problems faced during selling and marketing of Orchards 134
Table 5.6 Sampled farms reporting of having Deals between them and the trader 135
Table 5.7 Type of Reasons given by sampled respondent for having deals between traders 136
Table 5.8 Distribution of sampled population who reported of benefits of selling crops before
harvesting
136
Table 5.9 Type of benefits explained by sampled population due to selling crops before
harvesting
137
Table 5.10 Distribution of Sample farms facing problem while selling the crops (in percent) 138
Table 5.11 Type of Problem Faced while selling the Food grain crops (in percent) 139
Table 5.12 Type of Problem faced by farmers while selling the Fruits crops (in percent) 140
Table 5.13 Type of Problem faced by farmers while selling the Vegetables crops (in percent) 140
Table 5.14 Type of Problem faced by farmers while selling Flowers crops (in percent) 141
Table 5.15 Type of Problem faced by farmers while selling Spices crops 142
Table 5.16 Type of Competition faced by Growers under Food grain crops 143
Table 5.17 Type of Competition faced by farmers under Fruits crops 144
Table 5.18 Type of Competition faced by farmers under Vegetables crops 145
Table 5.19 Type of Competition faced by farmers under Flowers crops 146
Table 5.20 Type of Competition faced by farmers under Spices crops 146
Table 5.21 No. of Sample Farms getting Compensation for Loss of Crops from any
Government Organisation
147
Table 5.22 Name of crop for which compensation received 147
Table 5.23 Organization by which compensation received 148
Table 5.24 Sampled farms reporting of Credit taken for gardening and source of credit taken
(in percent)
149
Table 5.25 Percentage of respondent who reported of giving crops to lenders/ selling crops in
order to pay off loan and the reasons given in order to pay off loan
149
Table 5.26 Sample farms reporting of taking loan or not (in percent) 150
Table 5.27 Purpose of taking loan 150
Table 5.28 Sample farm reporting of insurance any crop under Horticulture farming 151
Table 5.29 Name of Organization of insurance 152
Table 5.30 Amount of Insured crop taken by sample farms (in Rs.) 152
Table 5.31 Did you take the insurance money ever and respondent reported of getting money 152

Table no. Title
Page no.
Table 5.32 Source of getting information regarding horticulture Farming (in percent) 153
Table 5.33 Reasons of Inspiration for land use under horticulture farming 154
Table 5.34 Sample farms reported of ever re-allocation of cropping area for production: 155
Table 5.35 Area wise re-allocation of cropping area for production (Mean) 156
Table 5.36 Type of Problem in Horticulture in re-allocation 157
Table 5.37 Sample farms reporting of planning to make changes to a species of a crop in
coming years
158
Table 5.38 Name of crops for diversification under Horticulture Farming 158
Table 5.39 Reasons given by the growers for Diversification of Crops 159
Table 5.40 Sample size reported of having knowledge about the restricted pesticides 160
Table 5.41 Sample size reported of using restricted pesticides despite the knowledge 161
Table 5.42 Type of Reasons given by the growers for using restricted pesticides 161
Table 5.43 Sampled size reported of getting any kind of training for good crop yield 162
Table 5.44 Name of Training given 162
Table 5.45 Name of the trainer 163
Table 5.46 Duration of training given 164
Table 5.47 Do you have knowledge about the govt. schemes under horticulture farming 164
Table 5.48 Knowledge about name of schemes 165
Table 5.49 Type of help received by Horticulture department for farming 166
Table 5.50 Are you a member for any Organization 167
Table 5.51 Type of Profit received from organization 167
Table 5.52 Do you have any knowledge about geographical situations related to horticulture
farming?
168
Table 5.53 Do you have any knowledge about registered horticulture farming types under
geographical indicators (G.I.)
169
Table 5.54 Help expected from govt. related to production/export under Horticulture farming
170

List of Figures
Figure No. Title Page no.
Figure 3.1 District wise distribution of per household Size of Family by Caste
category (No.) 76
Figure 4.1 District wise Area under Different Horticulture Crops in Selected
Districts of Uttar Pradesh 84
Figure 4.2 Area under of Individual Foodgrain Crops on Sample Farms (in
percent) 87
Figure 4.3 Yield of Individual Foodgrain Crops on Sample Farms (in percent) 88
Figure 4.4 Percent Area under individual Fruit crops in Selected Districts of
Uttar Pradesh 90
Figure 4.5 Yield of individual Fruit crops in Selected Districts of Uttar Pradesh
(in qtl. Per hect) 90
Figure 4.6 Area under Individual Vegetable Crops in Selected Districts of Uttar
Pradesh (in percent) 92
Figure 4.7 Yield of Individual Vegetable Crops in Selected Districts of Uttar
Pradesh (in Qtl. Per hec) 93
Figure 4.8 Area under Individual Spice Crops in Selected Districts of Uttar
Pradesh (in percent) 94
Figure 4.9 Yield of Individual Spice Crops in Selected Districts of Uttar Pradesh
(in percent) 95
Figure 4.10 Area under Individual Flowers on Sampled Farms in Selected
Districts of Uttar Pradesh (in percent) 97
Figure 4.11 Figure 4.11: Yield of Individual Flowers on Sampled Farms in
Selected Districts of Uttar Pradesh (in Qtl. Per Hec)
97
Figure 4.12 Area Under Individual Cash Crops on Sample farms in Selected
Districts of Uttar Pradesh (in percent) 99
Figure 4.13 Yield of Individual Cash Crops on Sample farms in Selected
Districts of Uttar Pradesh (in Qtl. Per Hect.) 99
Figure 4.14 Area under Individual Other Crops on Sampled Farms (in percent) 101
Figure 4.15 Yield of Individual Other Crops on Sampled Farms (in Qtl. Per
Hect.) 101
Figure 4.16 Details of Cost Structure in Food Grains Crops (In percent) in
Sampled Farms 103
Figure 4.17 Details of Cost Structure in Fruit Cultivation (in percent) 105
Figure 4.18 Details of Cost Structure in Spices (in percent) 107
Figure 4.19 Details of Cost Structure in Cash Crops (in percent) 109
Figure 4.20 Details of Cost Structure in Others Crops (in percent) 110
Figure 4.21 Details of Cost Structure in Aggregate Level (in percent) 112

Figure No. Title Page no.
Figure 4.22 Net Income per Acre of Different Horticulture Crops in Sample
Farms 114
Figure 5.1 Distribution of sampled grower reporting of selling of orchards
before Plantation 131
Figure 5.2 Distribution of Sample Farms Reporting of Selling of Orchards to
Different Person 131
Figure 5.3 Distribution of sampled farms on basis of Amount received against
sale of orchard 133
Figure 5.4 Type of Problems Faced During Selling and Marketing of Orchards
(in percent) 135
Figure 5.5 Type of Competition faced by Growers of Food grain crops 143
Figure 5.6 Type of Competition faced by Growers under Fruits Crops 144
Figure 5.7 Type of Competition faced by Growers of Vegetables Crops 145
Figure 5.8 Source of information regarding horticulture Farming (in percent) 154
Figure 5.9 Reasons of Inspiration for Putting Land under Horticulture Farming 155
Figure 5.10 Reasons given by Farmers for Diversification of Crops 159
Figure 5.11 Help expected from Government by the Farms 171
1
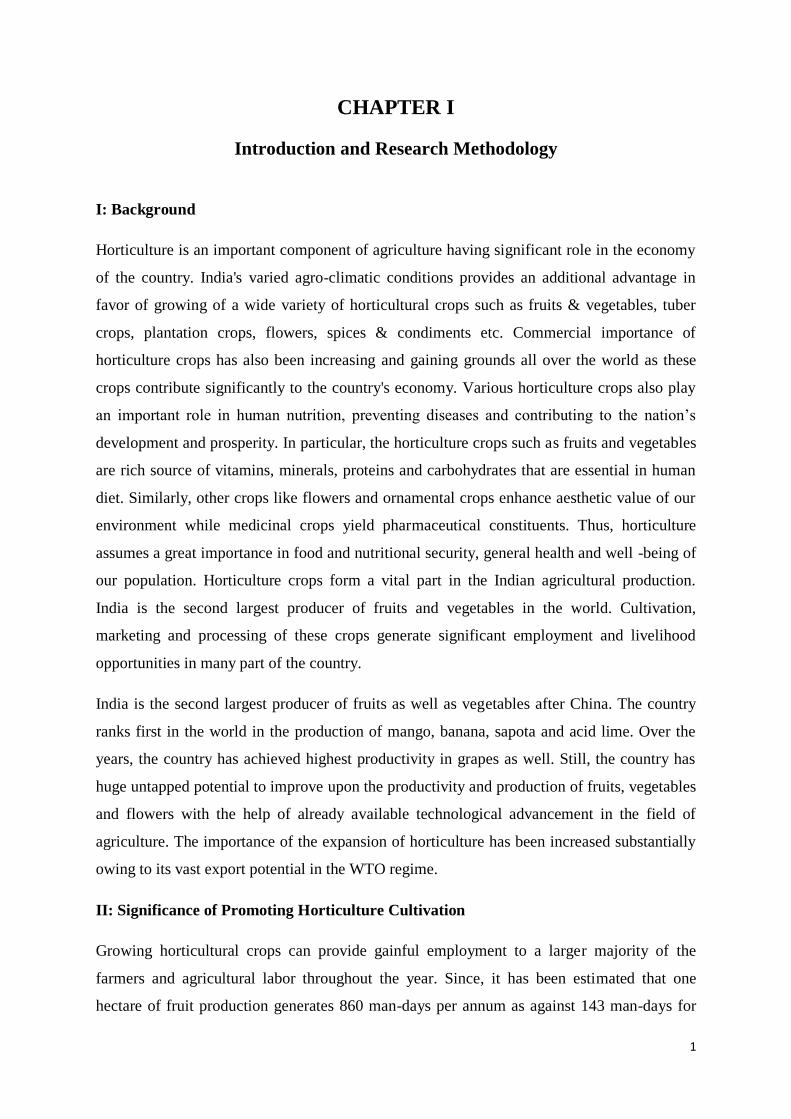
CHAPTER I
Introduction and Research Methodology
I: Background
Horticulture is an important component of agriculture having significant role in the economy
of the country. India's varied agro-climatic conditions provides an additional advantage in
favor of growing of a wide variety of horticultural crops such as fruits & vegetables, tuber
crops, plantation crops, flowers, spices & condiments etc. Commercial importance of
horticulture crops has also been increasing and gaining grounds all over the world as these
crops contribute significantly to the country's economy. Various horticulture crops also play
an important role in human nutrition, preventing diseases and contributing to the nation‟s
development and prosperity. In particular, the horticulture crops such as fruits and vegetables
are rich source of vitamins, minerals, proteins and carbohydrates that are essential in human
diet. Similarly, other crops like flowers and ornamental crops enhance aesthetic value of our
environment while medicinal crops yield pharmaceutical constituents. Thus, horticulture
assumes a great importance in food and nutritional security, general health and well -being of
our population. Horticulture crops form a vital part in the Indian agricultural production.
India is the second largest producer of fruits and vegetables in the world. Cultivation,
marketing and processing of these crops generate significant employment and livelihood
opportunities in many part of the country.
India is the second largest producer of fruits as well as vegetables after China. The country
ranks first in the world in the production of mango, banana, sapota and acid lime. Over the
years, the country has achieved highest productivity in grapes as well. Still, the country has
huge untapped potential to improve upon the productivity and production of fruits, vegetables
and flowers with the help of already available technological advancement in the field of
agriculture. The importance of the expansion of horticulture has been increased substantially
owing to its vast export potential in the WTO regime.
II: Significance of Promoting Horticulture Cultivation
Growing horticultural crops can provide gainful employment to a larger majority of the
farmers and agricultural labor throughout the year. Since, it has been estimated that one
hectare of fruit production generates 860 man-days per annum as against 143 man-days for
2
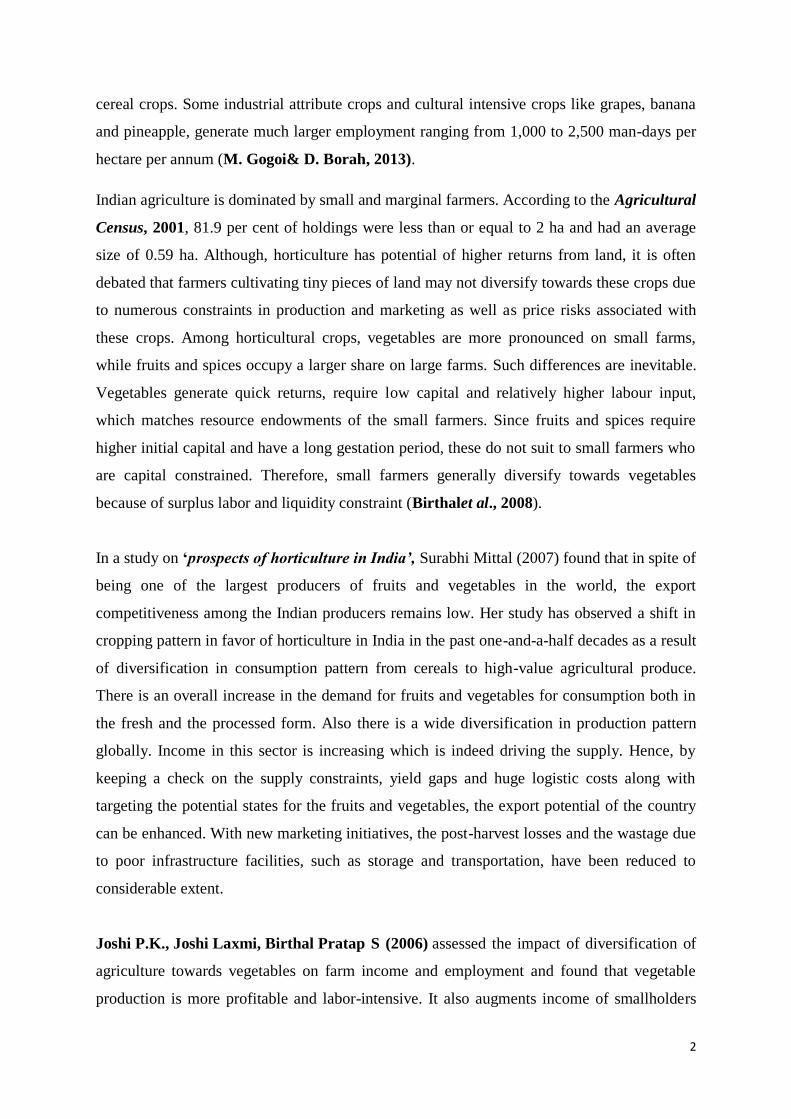
cereal crops. Some industrial attribute crops and cultural intensive crops like grapes, banana
and pineapple, generate much larger employment ranging from 1,000 to 2,500 man-days per
hectare per annum (M. Gogoi& D. Borah, 2013).
Indian agriculture is dominated by small and marginal farmers. According to the Agricultural
Census, 2001, 81.9 per cent of holdings were less than or equal to 2 ha and had an average
size of 0.59 ha. Although, horticulture has potential of higher returns from land, it is often
debated that farmers cultivating tiny pieces of land may not diversify towards these crops due
to numerous constraints in production and marketing as well as price risks associated with
these crops. Among horticultural crops, vegetables are more pronounced on small farms,
while fruits and spices occupy a larger share on large farms. Such differences are inevitable.
Vegetables generate quick returns, require low capital and relatively higher labour input,
which matches resource endowments of the small farmers. Since fruits and spices require
higher initial capital and have a long gestation period, these do not suit to small farmers who
are capital constrained. Therefore, small farmers generally diversify towards vegetables
because of surplus labor and liquidity constraint (Birthalet al., 2008).
In a study on ‘prospects of horticulture in India’, Surabhi Mittal (2007) found that in spite of
being one of the largest producers of fruits and vegetables in the world, the export
competitiveness among the Indian producers remains low. Her study has observed a shift in
cropping pattern in favor of horticulture in India in the past one-and-a-half decades as a result
of diversification in consumption pattern from cereals to high-value agricultural produce.
There is an overall increase in the demand for fruits and vegetables for consumption both in
the fresh and the processed form. Also there is a wide diversification in production pattern
globally. Income in this sector is increasing which is indeed driving the supply. Hence, by
keeping a check on the supply constraints, yield gaps and huge logistic costs along with
targeting the potential states for the fruits and vegetables, the export potential of the country
can be enhanced. With new marketing initiatives, the post-harvest losses and the wastage due
to poor infrastructure facilities, such as storage and transportation, have been reduced to
considerable extent.
Joshi P.K., Joshi Laxmi, Birthal Pratap S (2006) assessed the impact of diversification of
agriculture towards vegetables on farm income and employment and found that vegetable
production is more profitable and labor-intensive. It also augments income of smallholders

3
and generates employment opportunities in rural areas especially for women. But, there are
major constraints as well, like lack of assured markets and a well-developed seed sector; lack
of efficient marketing system & lack of appropriate infrastructure causes huge post-harvest
losses. To check these constraints, contract farming is suggested.
It is contended that viability of small farms can be improved through diversification of
agriculture into higher-value crops like fruits and vegetables. However, there are some
challenges like access to land and resources, maintaining the cold chain, & market
development viz. a viz. bureaucracy and transaction costs. The relative prices of cereal crops
such as rice and wheat have decreased over recent decades, eroding their farming
profitability. The on-going „No-till or Reduced-till Revolution‟, a silent multi-stakeholders‟
movement funded primarily through private investments and driven by an urge to produce
more food at less cost, conserve land and water resources and improve environmental quality,
is benefiting all farmers & civil society and enhancing the prospects for
diversification/expanding horticulture and its gains to both growers and consumers (M.L.Jat,
& at.al. 2006). For estimating the growth, for carrying out analysis to assess the demand and
supply trend, to identify problems and constraints, for evolving adaptive policies and
exploring growth prospects, availability of district/cluster/component wise data reliable &
detailed data is crucial (Gogoi & Borah 2013). For this purpose, the farmers/ Panchayat
members should be involved to get better & accurate results. Further, there should be a nodal
agency in every state to handle all kinds of data generated by different agencies/Departments.
Also, there should be a Data Consortium as well with representation from all concerned
formed by a group of technical experts.
III: Horticulture in Uttar Pradesh
In case of Uttar Pradesh, horticulture is one of the critical sectors in the economy. The
horticulture crops are grown in around 30 lakh hectares area which accounts 12 present of the
total cultivated area of the State (State Horticultural Mission Report, 2013). Expansion of
area horticulture can promote economic diversification and thus create additional
employment opportunities in the state. The area under horticulture crops can be increased by
utilization of available cultivable wastelands, fallow lands and the land belonging to non-
resident landowners in villages. Horticulture crops cover a wide variety of fruits, vegetables,
tuber crops, mushrooms, floriculture, medicinal and aromatic plants, spices, food processing
4
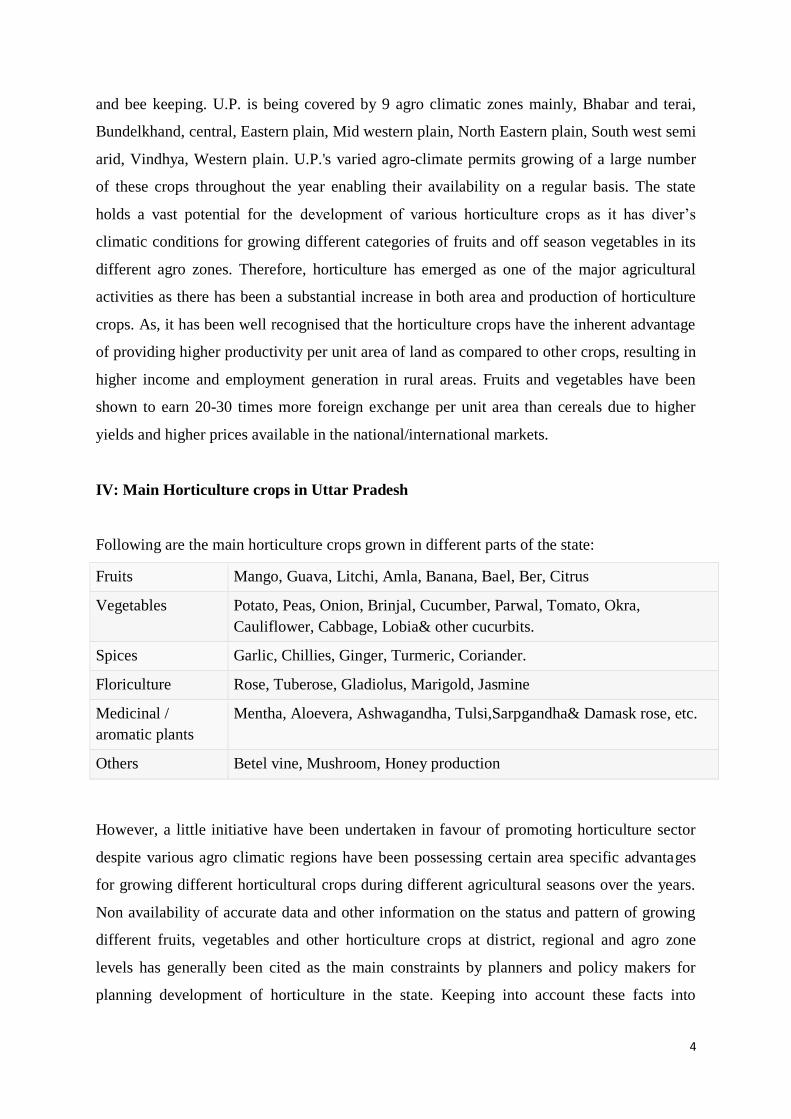
and bee keeping. U.P. is being covered by 9 agro climatic zones mainly, Bhabar and terai,
Bundelkhand, central, Eastern plain, Mid western plain, North Eastern plain, South west semi
arid, Vindhya, Western plain. U.P.'s varied agro-climate permits growing of a large number
of these crops throughout the year enabling their availability on a regular basis. The state
holds a vast potential for the development of various horticulture crops as it has diver‟s
climatic conditions for growing different categories of fruits and off season vegetables in its
different agro zones. Therefore, horticulture has emerged as one of the major agricultural
activities as there has been a substantial increase in both area and production of horticulture
crops. As, it has been well recognised that the horticulture crops have the inherent advantage
of providing higher productivity per unit area of land as compared to other crops, resulting in
higher income and employment generation in rural areas. Fruits and vegetables have been
shown to earn 20-30 times more foreign exchange per unit area than cereals due to higher
yields and higher prices available in the national/international markets.
IV: Main Horticulture crops in Uttar Pradesh
Following are the main horticulture crops grown in different parts of the state:
Fruits Mango, Guava, Litchi, Amla, Banana, Bael, Ber, Citrus
Vegetables Potato, Peas, Onion, Brinjal, Cucumber, Parwal, Tomato, Okra,
Cauliflower, Cabbage, Lobia& other cucurbits.
Spices Garlic, Chillies, Ginger, Turmeric, Coriander.
Floriculture Rose, Tuberose, Gladiolus, Marigold, Jasmine
Medicinal /
aromatic plants
Mentha, Aloevera, Ashwagandha, Tulsi,Sarpgandha& Damask rose, etc.
Others Betel vine, Mushroom, Honey production
However, a little initiative have been undertaken in favour of promoting horticulture sector
despite various agro climatic regions have been possessing certain area specific advantages
for growing different horticultural crops during different agricultural seasons over the years.
Non availability of accurate data and other information on the status and pattern of growing
different fruits, vegetables and other horticulture crops at district, regional and agro zone
levels has generally been cited as the main constraints by planners and policy makers for
planning development of horticulture in the state. Keeping into account these facts into

5
consideration the present study to propose for carrying out a detail study on issues related to
the present status of horticulture sector across the districts and agro- zones of the state and its
area and production.
V: Objectives of the Study
In detail, the main objectives of the present study are as follows:
1. To estimate land use pattern under various agriculture and horticultural crops and its
changing pattern across different geographical and agro- climatic conditions and at
state level.
2. Pattern and emerging changes in productivity/yield rates of different agriculture and
horticultural crops.
3. Pattern and emerging changes in output of different agriculture and horticultural
crops.
4. Input use, cost of production, profitability of using land under different options and
factors implicating variations in opting cultivation of different horticulture and other
crops across the regions of the state.
5. Area specific emerging constraints in opting cultivation of different horticulture crops
and measures to be initiated to overcome from these constraints.
6. Contribution of horticulture to GDP at district, region and state level.
7. To suggest about the types of measures to be initiated for maximizing land under the
cultivation of horticulture crops.
VI: Importance of the Study
This research study was helpful in understanding the economic conditions of horticulture
growers and the constraints faced by them in production, marketing and export of their
produce. The study also brought out the impact and limitations of government policy to
promote diversification and export of horticultural crops. It also gave policy suggestions for
promoting horticulture crops in the different agro-climatic zone of the state. Thus, the study is
an contribution both from methodological and policy viewpoints.

6
VII: Research Methodology
The study was confined to state of Uttar Pradesh. Both secondary and primary data were
collected to achieve the objective specified above. The already collected secondary data such
as area, production and yield of some of horticultural crops grown in Uttar Pradesh has been
obtained from the Directorate of Horticulture, Directorate of Agriculture, Uttar Pradesh and
other secondary sources. Data related to land use statistics is collected from the Directorate of
Economics and Statistics, Uttar Pradesh. General information on selected districts and other
aspects has been obtained from various issues of the Statistical Diary, Statistical Abstract of
Uttar Pradesh published by the Directorate of Economics and Statistics of the state.
In addition to farmers‟ survey, we did visit all the district horticulture department in
the selected districts. Interviews were held with the District horticulture officers (DHO) and
other members of the horticulture department to understand their problems as well as
problems of the farmers. After collecting information from the secondary sources, all the
farmers growing horticultural crops in selected villages were canvassed a household level
schedule to collect detailed information about the various aspects related to the horticultural
crops grown by them.
The scope of the study was confined to growing of fruits, vegetables, spices, flowers and
Medicinal / aromatic plants though it was proposed to cover mushrooms growers as well but
our survey team could not found farmers growing mushrooms for commercial purposes. The
study proposed to select one district from each agro-climatic zone on the basis of highest area
under horticulture crops for field survey. Thereafter, two or three blocks, with the
consultation of District Horticulture officer (DHO) to cover the different horticulture crops
i.e. vegetables, fruits, flower and spices grown in the area has been selected from each
district. Further, with the consultation of DHO, four villages from the selected blocks based
on the same criteria have been chosen for detail study. Finally, 25 households from each
village were selected on the basis of growing different horticulture crops in different size of
land holdings for field survey. Thus, our total sample was 9 districts, 22 blocks, 36 villages
and 900 households.
7
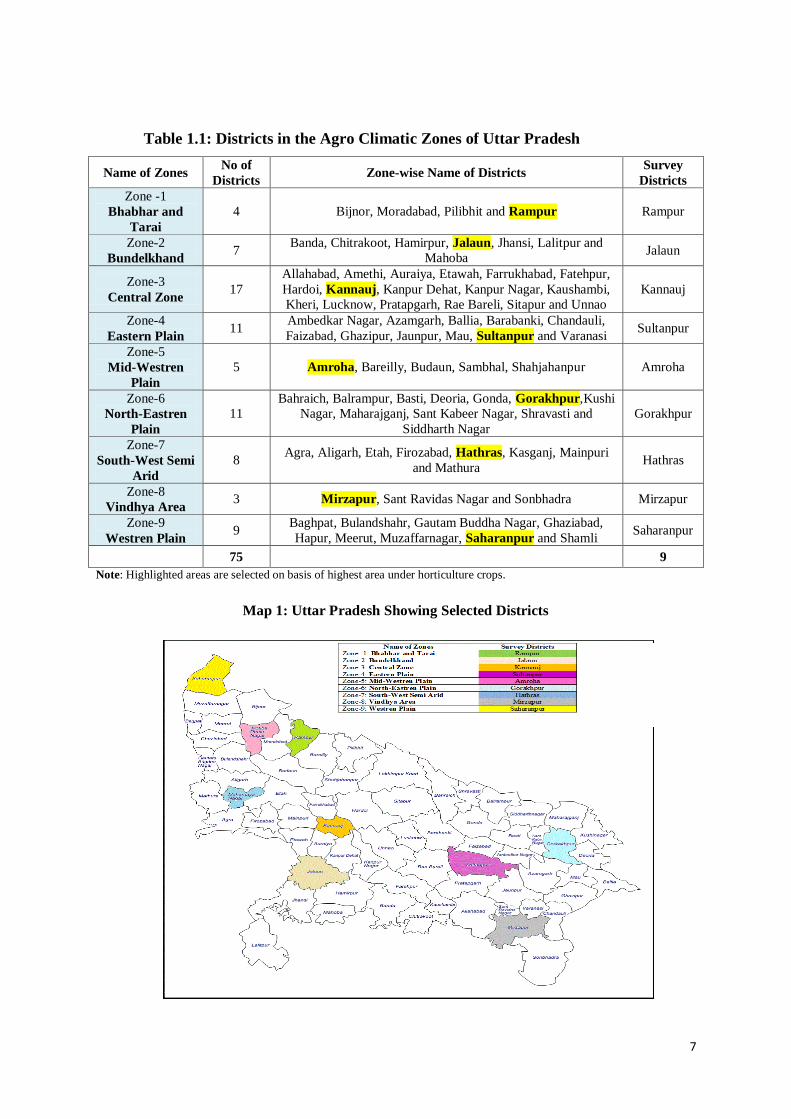
Table 1.1: Districts in the Agro Climatic Zones of Uttar Pradesh
Name of Zones No of
Districts Zone-wise Name of Districts
Survey
Districts
Zone -1
Bhabhar and
Tarai
4 Bijnor, Moradabad, Pilibhit and Rampur Rampur
Zone-2
Bundelkhand 7
Banda, Chitrakoot, Hamirpur, Jalaun, Jhansi, Lalitpur and
Mahoba Jalaun
Zone-3
Central Zone 17
Allahabad, Amethi, Auraiya, Etawah, Farrukhabad, Fatehpur,
Hardoi, Kannauj, Kanpur Dehat, Kanpur Nagar, Kaushambi,
Kheri, Lucknow, Pratapgarh, Rae Bareli, Sitapur and Unnao
Kannauj
Zone-4
Eastern Plain 11
Ambedkar Nagar, Azamgarh, Ballia, Barabanki, Chandauli,
Faizabad, Ghazipur, Jaunpur, Mau, Sultanpur and Varanasi Sultanpur
Zone-5
Mid-Westren
Plain
5 Amroha, Bareilly, Budaun, Sambhal, Shahjahanpur Amroha
Zone-6
North-Eastren
Plain
11
Bahraich, Balrampur, Basti, Deoria, Gonda, Gorakhpur,Kushi
Nagar, Maharajganj, Sant Kabeer Nagar, Shravasti and
Siddharth Nagar
Gorakhpur
Zone-7
South-West Semi
Arid
8 Agra, Aligarh, Etah, Firozabad, Hathras, Kasganj, Mainpuri
and Mathura Hathras
Zone-8
Vindhya Area 3 Mirzapur, Sant Ravidas Nagar and Sonbhadra Mirzapur
Zone-9
Westren Plain 9
Baghpat, Bulandshahr, Gautam Buddha Nagar, Ghaziabad,
Hapur, Meerut, Muzaffarnagar, Saharanpur and Shamli Saharanpur
75
9
Note: Highlighted areas are selected on basis of highest area under horticulture crops.
Map 1: Uttar Pradesh Showing Selected Districts

8
Table 1.2: Percentage Share of Horticulture Area in Gross Cropped Area
(TE-2018) under selected District Agro climatic zone Selected District under agro
climatic zone
percent share of horticulture
area in Gross Cropped Area
(TE-2018)
Zone 1 Rampur 4.36
Zone 2 Jalaun 13.08
Zone 3 Kannauj 28.13
Zone 4 Sultanpur 9.89
Zone 5 Shahjahanpur 4.42
Zone 6 Gorakhpur 9.25
Zone 7 Hathras 25.54
Zone 8 Mirzapur 4.68
Zone 9 Saharanpur 9.33
Source: secondary data. Shown in appendix 1
Above table explains the Percentage share of area under horticulture as percent to gross
cropped area (TE-2018) under selected district of agro climatic zones of Uttar Pradesh which
clearly favors the methodology as the selected districts were taken for field survey on basis of
highest area under horticulture crops.
Thereafter two or three blocks in consultation with District Horticulture officer (DHO) to
cover the different horticulture crops i.e. vegetables, fruits, flower and spices grown in the
selected areas were selected from each district. Further, with the consultation of DHO, four
villages from the selected blocks based on the same criteria were taken up for detailed study.
In all 25 households from each village were selected on the basis of growing different
horticulture crops belonging to different size of land holdings for field survey.
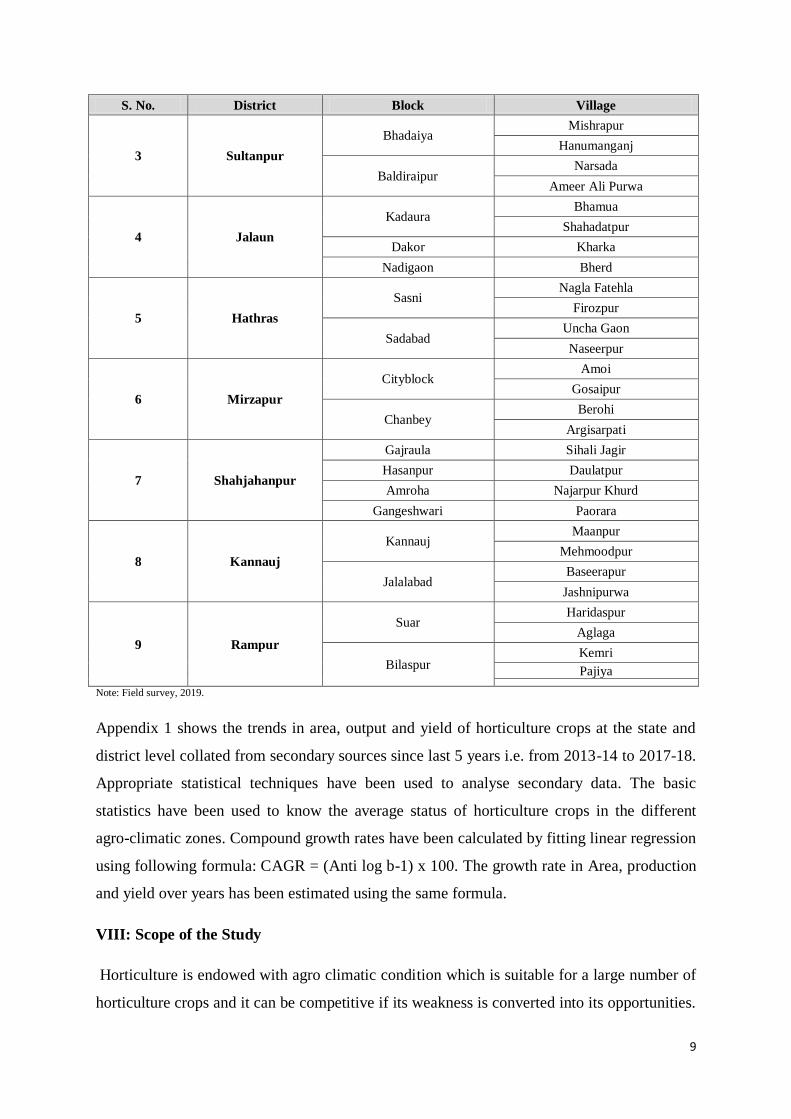
Table 1.3: Sample Distribution on Basis of District, Block and Village Wise:
S. No. District Block Village
1 Saharanpur
Punwarka Khatauli
Lakhnauti Kalan
Nakur Saroorpur Taga
Sidhauli Marwa
2 Gorakhpur
Bhathat Raghunathpur
Jangalpur
Khorawar Raiganj
Ramlakhana
9
S. No. District Block Village
3 Sultanpur
Bhadaiya Mishrapur
Hanumanganj
Baldiraipur Narsada
Ameer Ali Purwa
4 Jalaun
Kadaura Bhamua
Shahadatpur
Dakor Kharka
Nadigaon Bherd
5 Hathras
Sasni Nagla Fatehla
Firozpur
Sadabad Uncha Gaon
Naseerpur
6 Mirzapur
Cityblock Amoi
Gosaipur
Chanbey Berohi
Argisarpati
7 Shahjahanpur
Gajraula Sihali Jagir
Hasanpur Daulatpur
Amroha Najarpur Khurd
Gangeshwari Paorara
8 Kannauj
Kannauj Maanpur
Mehmoodpur
Jalalabad Baseerapur
Jashnipurwa
9 Rampur
Suar Haridaspur
Aglaga
Bilaspur Kemri
Pajiya
Note: Field survey, 2019.
Appendix 1 shows the trends in area, output and yield of horticulture crops at the state and
district level collated from secondary sources since last 5 years i.e. from 2013-14 to 2017-18.
Appropriate statistical techniques have been used to analyse secondary data. The basic
statistics have been used to know the average status of horticulture crops in the different
agro-climatic zones. Compound growth rates have been calculated by fitting linear regression
using following formula: CAGR = (Anti log b-1) x 100. The growth rate in Area, production
and yield over years has been estimated using the same formula.
VIII: Scope of the Study
Horticulture is endowed with agro climatic condition which is suitable for a large number of
horticulture crops and it can be competitive if its weakness is converted into its opportunities.
10
Since, it can be observed that there is increase in its area, production and productivity which
can be further improved upon if gaps such as lack of adequate and efficient technology, lack
of awareness etc. are taken care off by providing proper suggestions based on the empirical
musings from this study. Hence, the present study takes into account the detail significance of
the horticulture crops in different agro climatic zones of Uttar Pradesh. It explains the present
status of horticulture sector across the districts and agro climatic zones of the State. The
scope of the study focuses on the socio- economic condition of the horticulture growers and
deals with the major problems they confront in growing of horticulture crops in selected
districts and also provide various findings and suggestion to improve the condition of
growers. Thus, the study would be important both from methodological and policy
viewpoints.
IX: Chapter Scheme
The report has been presented in 5 chapters. Chapter 1 presents the Introduction, review of
literature, research problem, objectives and research methodology of the study. In Chapter II
we have analyzed the secondary data to show the Horticulture Development in the State of
Uttar Pradesh. Chapter III presents the socio- economic characteristics of horticultural
growers. Chapter IV discussed the major constraints in the horticulture crops in the selected
districts and critically examines the Government policy to deal with these problems and to
promote Horticulture production in different agro-climatic areas. The final Chapter
summarizes the main findings of the study and gives suggestions for improving the condition
of horticulture crop growers and steps to promote horticulture export from the country.
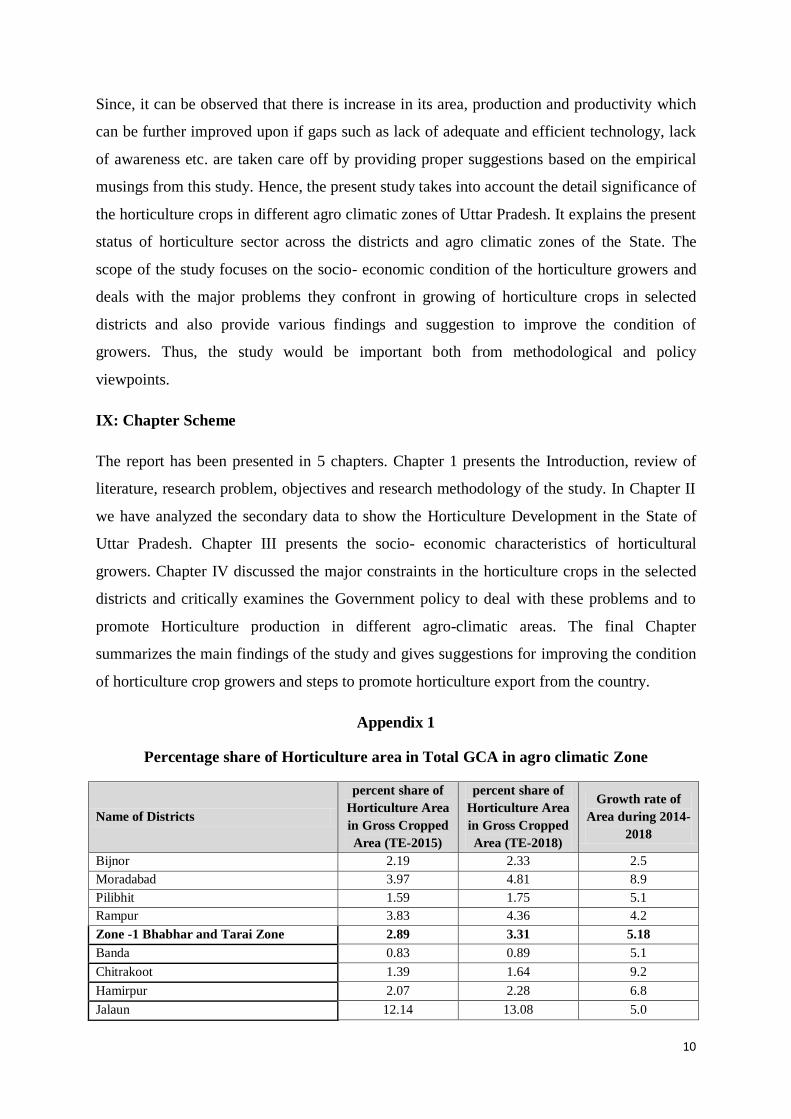
Appendix 1
Percentage share of Horticulture area in Total GCA in agro climatic Zone
Name of Districts
percent share of
Horticulture Area
in Gross Cropped
Area (TE-2015)
percent share of
Horticulture Area
in Gross Cropped
Area (TE-2018)
Growth rate of
Area during 2014-
2018
Bijnor 2.19 2.33 2.5
Moradabad 3.97 4.81 8.9
Pilibhit 1.59 1.75 5.1
Rampur 3.83 4.36 4.2
Zone -1 Bhabhar and Tarai Zone 2.89 3.31 5.18
Banda 0.83 0.89 5.1
Chitrakoot 1.39 1.64 9.2
Hamirpur 2.07 2.28 6.8
Jalaun 12.14 13.08 5.0

11
Name of Districts
percent share of
Horticulture Area
in Gross Cropped
Area (TE-2015)
percent share of
Horticulture Area
in Gross Cropped
Area (TE-2018)
Growth rate of
Area during 2014-
2018
Jhansi 6.19 6.59 5.0
Lalitpur 6.27 6.63 4.6
Mahoba 4.45 4.70 4.5
Zone-2 Bundelkhand Zone 4.76 5.12 5.74
Allahabad 5.87 6.15 3.6
Amethi 5.94 6.99 4.3
Auraiya 4.56 4.76 3.3
Etawah 9.97 10.44 3.2
Farrukhabad 26.01 27.31 3.3
Fatehpur 7.34 9.37 13.0
Hardoi 4.02 4.55 6.0
Kannauj 26.66 28.13 3.2
Kanpur Dehat 3.76 4.21 5.9
Kanpur Nagar 10.46 12.65 9.2
Kaushambi 9.45 11.23 10.0
Kheri 1.66 2.01 9.0
Lucknow 20.89 23.46 4.6
Pratapgarh 9.80 9.78 2.5
Rae Bareli 4.17 4.42 7.0
Sitapur 3.88 4.29 3.9
Unnao 8.43 9.59 6.2
Zone-3 Central Zone 9.58 10.55 5.77
Ambedkar Nagar 5.88 6.37 4.1
Azamgarh 3.10 3.32 3.3
Ballia 5.75 6.26 3.9
Barabanki 4.99 5.63 4.6
Chandauli 1.13 1.20 3.7
Faizabad 7.14 8.23 6.8
Ghazipur 4.64 5.04 4.6
Jaunpur 4.05 4.32 3.3
Mau 1.83 1.97 3.9
Sultanpur 9.38 9.89 3.2
Varanasi 6.95 8.15 8.3
Zone-4 Eastern Plain Zone 4.99 5.49 4.52
Amroha 7.34 8.28 6.4
Bareilly 3.25 3.52 4.1
Budaun 5.63 6.11 3.6
Sambhal 4.04 4.55 5.0
Shahjahanpur 3.97 4.42 4.0
Zone-5 Mid-Western Plain Zone 4.85 5.37 4.63
Bahraich 2.61 3.09 9.9
Balrampur 1.87 2.04 3.7
Basti 4.36 4.85 5.0
Deoria 2.54 2.69 3.1
Gonda 2.78 3.47 10.5

12
Name of Districts
percent share of
Horticulture Area
in Gross Cropped
Area (TE-2015)
percent share of
Horticulture Area
in Gross Cropped
Area (TE-2018)
Growth rate of
Area during 2014-
2018
Gorakhpur 7.57 9.25 10.3
Kushi Nagar 6.50 8.12 11.1
Maharajganj 4.01 4.66 7.6
Sant Kabeer Ngr 5.36 5.99 4.8
Shravasti 1.77 1.94 5.1
Siddharth Nagar 2.25 2.35 3.0
Zone-6 North-Eastern Plain Zone 3.78 4.40 6.74
Agra 18.91 20.32 3.9
Aligarh 9.59 8.15 -8.3
Etah 10.51 11.41 4.6
Firozabad 20.82 22.76 4.8
Hathras 24.73 25.54 2.6
Kasganj 11.00 11.77 4.9
Mainpuri 10.72 11.61 6.1
Mathura 4.44 4.80 4.4
Zone-7 South-West Semi Arid Zone 13.84 14.54 2.86
Mirzapur 4.06 4.68 9.5
Sant Ravidas Ngr. 5.09 5.28 2.7
Sonbhadra 3.03 3.27 5.4
Zone-8 Vindhya Area 4.06 4.41 5.86
Baghpat 3.41 3.72 4.4
Bulandshahr 6.79 7.29 3.9
G B Nagar 0.93 1.03 3.8
Ghaziabad 7.88 9.01 5.7
Hapur 7.16 7.99 5.4
Meerut 7.99 8.83 5.0
Muzaffarnagar 4.07 4.41 3.4
Saharanpur 8.91 9.33 2.4
Shamli 3.72 4.20 5.8
Zone-9 Westren Plain Zone 5.65 6.20 4.41
13
CHAPTER II
Horticulture Development in the Uttar Pradesh
I INTRODUCTION
In recent years, horticulture sector has emerged as an important component of the Indian
economy because of its contribution in the gross domestic production of the agricultural
sector. Horticulture crops not only provide nutrition but also generate cash income to the
growers. It covers a wide range of fruits, vegetables, spices, medicinal plants etc. and requires
a suitable climate. U.P.‟s varied agro climatic zones is suitable for producing all kinds of
horticulture crops. The total production of horticulture in Uttar Pradesh was estimated 392.48
million tonnes from a total area of 2477.04 million hectare. The major horticulture crops
comprise of vegetables with total production of 28316.45 million tonnes and fruits 10539.775
million tonnes in the year 2017-18 which shows that U.P. holds vast potential for its
development of horticulture (MIDH Report, 2018-19). In spite of so many positive factors,
horticulture sector of Uttar Pradesh is still far from realization of its actual potential. For the
commercialization of horticultural crops and diversification of agriculture in the state, various
programmes are being implemented within the state by state government like expansion of
area, rejuvenation of old mango, guava and orchards, production of quality planting material
and post-harvest management etc.
II: Mission for Integrated Development Horticulture
Mission for Integrated Development of Horticulture (MIDH) is a Centrally Sponsored
Scheme implemented in 2014-15 for the holistic growth of horticulture sector covering fruits,
vegetables, root & tuber crops, mushrooms, spices, flowers, aromatic plants, coconut,
cashew, cocoa and bamboo. MIDH also provides technical advice and administrative support
to State Governments/ State Horticulture Missions (SHMs). The schemes under MIDH
includes: National Horticulture Mission (NHM), Horticulture Mission for north East and
Himalayan states (HMNEH), National Horticulture board (NHB), Central institute for
Horticulture (CIH), Coconut Development Board (CDB).
Under MIDH, Government of India (GOI) contributes 60percent of total outlay for
developmental programmes in all the states except states in North East and Himalayas and
40percent share is contributed by State Governments. In the case of North Eastern States and

14
Himalayan States, GOI contributes 90percent. In case of National Horticulture Board (NHB),
Coconut Development Board (CDB), Central Institute for Horticulture (CIH), Nagaland and
the National Level Agencies (NLA), GOI contributes 100percent.
National Horticulture Board (NHB) was set up by the Government of India in April 1984
as a commercial horticulture on the basis of recommendation of the “group on perishable
agriculture commodities”. The NHB is registered as an autonomous society under the
society‟s registration act 1860, with its headquarter at Gurgaon. NHB is implementing
various schemes under MIDH in all states and UTs where GOI contributes 100percent.
National Horticulture board was set up with a vision to accelerate the process of the
development of commercial horticulture in potential cluster by organizing the producer
farmers for better utilization of resources and technology. There are various schemes
developed by the horticulture board to fulfill an objective of providing training and education
to farmers, to promote research and development programmes in order to encourage
technology, to strengthen the market information system, and to develop high quality
horticulture farms and promote horticulture activity in identified belts.
III: Schemes of NHB
1: Promotion of commercial horticulture scheme
2: Creation of cold storage Capacity and Scheme.
3: Technology Development and transfer for promotion of horticulture.
4: Market Information Services scheme for horticulture crops.
5: Horticulture promotion service.
IV: National Horticulture Mission
National Horticulture Mission (NHM) was developed as one of the sub schemes of MIDH
and as a mission to give direction and to promote development of horticulture in selected
states .It is being implemented by State Horticulture Mission in selected districts of 18 states
and four union territories .It was promoted by Government of India in the year 2005-06 with
a key objective to provide holistic growth of the horticulture sector in the country and to
develop it to the maximum potential available in the state and to augment production of all
horticultural products (fruits, vegetables, flowers, crops, spices, medicinal aromatic plants) in

15
the state.The Government of India contributes 85percent of share and 15percent of share is
contributed by the state government. Other objectives of NHM include enhancing of
horticulture production, to promote and develop disperse technology and to create
opportunities for employment generation.
After the launch of National Horticulture Mission (NHM) in 2005-06, significant progress
has been made in area expansion under horticulture crops resulting in higher production.
Over the last decade, India‟s total production of horticulture crops is estimated to be 311.7
million tonnes from an area of 25.43 million hectares, where it was observed that the
production of vegetables has increased from 178.172 million tonnes to 184.40 million tonnes
during 2016-2017 to 2017-18. The production of fruits also showed a significant increase
from 90.2. Million tonnes to 97.4 million tonnes (Area and Production of Horticulture Crops
(Agriculture Coopereation and Farmers Welfare, Horticulture report 2017-18).
Table 2.1: India’s Total Production under Horticulture Crops (in million tons)
(Source: http://agricoop.nic.in/statistics/state-level
National Horticulture Board has implemented various schemes under the Ministry of
Integrated Development of Horticulture in all the States and Union territories .The table 2.2
indicates the total number of projects and the amount of subsidy released under various
schemes of NHB between 2005-06 to 2017-18.It shows that Maharashtra is at the top with
48.2 percent in terms of projects with 23.7 percent of total subsidy released, followed by
Karnataka at second position (projects undertaken). these two states dominate all other states
in terms of projects allocation. Uttar Pradesh has a share of mere 2.7 percent under project
allocation but has a good share in subsidy allocation (13.1 percent).
Year Total horticulture
production
Total fruits production Total Vegetables
production
2015-16 286.2 90.2 169.1
2016-17 300.6 92.9 178.172
2017-18 311.74 97.4 184.40

16
Table2.2: Number of Projects and Amount of Subsidy Released under Scheme 1, 2 & 3
from 2005- 06 to 2017-18 Programmers Scheme 1* Scheme 2$ Scheme 3$ Total
States
Pro
ject
s
(No.)
All
oca
ti
on (
Rs.
Lak
h)
Pro
ject
s
(No.)
All
oca
ti
on (
Rs.
Lak
h)
Pro
ject
s
(No.)
All
oca
ti
on (
Rs.
Lak
h)
No o
f
Tota
l
Pro
ject
s per
cent
Shar
e in
All
India
T
ota
l
All
oca
ti
on (
Rs.
Lak
h)
per
cent
Shar
e in
All
India
Maharashtra 49.6 30.6 5.6 5.3 7.7 9.4 22609 48.2 44936 23.7
Uttar Pradesh 2.2 2.2 50.6 43.4 7.5 10.0 1275 2.7 24929 13.1
Karnataka 13.6 14.7 1.1 1.4 4.3 8.3 6221 13.3 21087 11.1
Gujarat 5.4 9.5 2.0 3.1 1.1 0.8 2472 5.3 14632 7.7
Tamil Nadu 3.1 9.0 0.8 0.6 1.5 2.1 1416 3 12677 6.7
Haryana 0.7 3.8 10.1 10.7 1.5 0.5 361 0.8 10530 5.5
Madhya Pradesh 3.8 5.0 2.8 3.0 1.6 2.7 1756 3.7 8370 4.4
Punjab 1.0 2.8 5.3 7.3 1.9 2.4 490 1 7545 4
Rajasthan 2.3 3.6 4.7 4.2 4.1 4.5 1089 2.3 7192 3.8
Himachal Pradesh 1.3 2.9 1.4 3.7 0.8 4.6 582 1.2 5891 3.1
Uttarakhand 2.3 3.2 0.8 0.5 10.8 1.3 1165 2.5 4664 2.5
Jammu & Kashmir 0.5 0.7 1.7 5.9 21.1 3.0 496 1.1 3945 2.1
Telangana 4.8 2.6 0.0 0.0 1.0 0.2 2183 4.7 3601 1.9
Andhra Pradesh 1.8 1.1 4.5 3.6 1.8 2.8 868 1.8 3377 1.8
Orissa 1.1 2.2 0.3 0.4 4.8 2.7 554 1.2 3347 1.8
Chhattisgarh 0.7 1.3 2.5 2.1 1.5 1.1 329 0.7 2941 1.5
Kerala 1.4 2.0 0.6 0.2 0.3 0.3 646 1.4 2899 1.5
Assam 0.3 0.2 2.0 3.0 3.0 3.1 163 0.3 1774 0.9
West Bengal 1.5 0.7 1.4 0.5 3.3 1.7 714 1.5 1306 0.7
Jharkhand 0.1 0.1 0.3 0.5 0.4 0.9 37 0.1 451 0.2
Bihar 1.2 0.2 0.0 0.0 3.2 4.1 567 1.2 397 0.2
Sikkim 0.3 0.1 0.0 0.0 4.3 9.6 178 0.4 395 0.2
All India 100.0 100.0 100.0 100.0 100.0 100.0 46920 99.7 189854 99.2
Source: National Horticulture Board, Ministry of Agriculture and Farmers Welfare Government of India Note: * During 2005-06 to 2017-18 and $ during 2010-11 to 2017-18, Scheme 1*= Promotion of Commercial Horticulture, Scheme 2$ = Creation of Cold Storage Capacity and Scheme
http://nhb.gov.in/PDFViwer.aspx?enc=3ZOO8K5CzcdC/Yq6HcdIxMvJ0RY/w0FTznMeREnr5ok=e 3$ = Technology
Development & Transfer for Promotion of Horticulture.
V: Export status: The table 2.3 explains the composition of horticulture crops export
from India. It was found that percentage share of quantity in the triennium year has increased
for Spices crops i.e. from 22.1 percent quantity in TE 2009-12 to 24 percent in TE 2015-18.
Further, the table reveals that after spices export, cashew and vegetable crops has shown
much improvement in terms of export i.e. 14.7 percent and 13.3 percent respectively.
Processed fruits and fresh fruits also showed improvement in terms of export i.e. to 9.5
percent. Hence, it can be said that the percentage share of various horticulture crops in
various trennium year have shown much improvement in terms of export of various crops
from India.

17
Table 2.3: Composition of Horticulture Crops Export from India (Principal Commodities)
Product Name
TE-2009-12 TE-2012-15 TE-2015-18
Absolute percentshare Absolute percentshare Absolute percentshare
Qty Value Qty Value Qty Value Qty Value Qty Value Qty Value
Spices 715995 8979 22.1 44.0 917452 15055 24.0 45.0 305833 5048 24.0 45.0
Cashew 102547 3337 3.2 16.3 119799 4909 3.1 14.7 39935 1647 3.1 14.7
Fresh
Vegetables 1911033 2886 58.9 14.1
221832
5 4468 57.9 13.3 739481 1498 57.9 13.3
Processed
fruits & Juices 0 2014 0.0 9.9 0 3178 0.0 9.5 0 1066 0.0 9.5
Fresh Fruits 470173 1606 14.5 7.9 514732 3160 13.4 9.4 171587 1059 13.4 9.4
Processed
Vegetables 0 845 0.0 4.1 0 1372 0.0 4.1 0 460 0.0 4.1
Vegetable Oils 19376 189 0.6 0.9 33547 458 0.9 1.4 11183 153 0.9 1.4
Floriculture 0 319 0.0 1.6 0 447 0.0 1.3 0 150 0.0 1.3
Fruits /
Vegetable
Seeds
11754 206 0.4 1.0 16335 396 0.4 1.2 5445 133 0.4 1.2
Cashew Nut
Shell Liquid 12110 40 0.4 0.2 9870 41 0.3 0.1 3290 14 0.3 0.1
Total 3242989 20420 100.0 100.0 383006
0 33484 100.0 100.0 1276753 11228
100.
0 100.0
Percentage 15 17 0.0 0.1 10 14 0.0 0.0 3 5 0.00 0.04
Source: https://agriexchange.apeda.gov.in/indexp/reportlist.aspx
Note: Qty in MT; Value in Rs. Crore
Table 2.4 explains the composition of horticulture export from Uttar Pradesh. It shows that
maximum export from Uttar Pradesh is of fresh vegetable crops which constitutes about 45.2
percent of quantity with share of 29.2 percent of export in terms of Rs. Crore. In TE 2012-15,
the proportion of percentage share of export of vegetables was 51.7 percent of quantity.
Further, the production of export for fruits and vegetables seeds was recorded as 14.3 percent
under quantity of export in T.E 2012-15 which increased to 16.9 percent in T.E 2015-18 with
22.7 Rs crore of export. The percentage share (in quantity) of onion, one of the important
crops of Uttar Pradesh, got increased from 16.2 percent in T.E 2009-12 to 21.1 percent in
T.E. 2015-18. Thus, it can be said that horticulture crops have an important share agricultural
exports in Uttar Pradesh.

18
Table 2.4: Composition of Horticulture Export from Uttar Pradesh
TE-2009-12 TE-2012-15 TE-2015-18
Product
Name
Absolute percentshare Absolute percentshare Absolute percentshare
Qty Value Qty Value Qty Value Qty Value Qty Value Qty Value
Other Fresh
Vegetables 83993 48 47.8 29.6 88212 116 51.7 31.0 149906 167 45.2 29.2
Fruits &
Vegetables
Seeds 34967 35 19.9 21.3 24473 76 14.3 20.4 56154 130 16.9 22.7
Fresh
Onions 28492 24 16.2 14.7 32034 60 18.8 16.0 69896 112 21.1 19.7
Processed
Vegetables 6688 30 3.8 18.5 6309 70 3.7 18.6 4352 72 1.3 12.6
Other Fresh
Fruits 15168 14 8.6 8.5 14876 30 8.7 8.1 45480 56 13.7 9.8
Processed
Fruits,
Juices &
Nuts 802 4 0.5 2.2 616 6 0.4 1.6 1216 14 0.4 2.4
Others
(Betel
Leaves &
Nuts) 102 0 0.1 0.3 134 1 0.1 0.4 262 5 0.1 0.9
Walnuts 124 1 0.1 0.4 67 2 0.0 0.4 154 4 0.0 0.8
Fresh
Grapes 3568 4 2.0 2.7 2177 7 1.3 1.8 1986 4 0.6 0.8
Fresh
Mangoes 1339 1 0.8 0.8 1259 3 0.7 0.8 1658 3 0.5 0.6
Mango Pulp 309 1 0.2 0.8 469 3 0.3 0.8 366 3 0.1 0.5
Floriculture 73 1 0.0 0.4 32 0 0.0 0.1 37 1 0.0 0.1
Cucumber
And
Gherkins
(Prepd. &
Presvd) 2 0 0.0 0.0 1 0 0.0 0.0 9 0 0.0 0.0
Total 175627 163 100.0 100.0 170657 374 100.0 100.0 331477 570 100.0 100.0 Source: https://agriexchange.apeda.gov.in/indexp/reportlist.aspx Note: Qty in MT; Value in Rs. Crore
Table 2.5 shows the comparison of export of principal commodities from agriculture and
horticulture and percentage change in export. It shows that in agriculture, 86.2 percent export
(in quantity) was estimated in T.E 2009-12 which increased to 90.4 percent in year 2012-15
but it declined to 84.3 perecent in year 2015-18. Horticulture sector emerged as an important
sector for the development of India as the percentage share of export of horticulture crops
increased from 13.8 percent to 16.4 percent in year 2009-12 to 2018-19.

19
Table 2.5: Export from India (Principle Commodities)
2009-12 2012-15 2015-18
2018-19 (April-
August)
Quantity Value Quantity Value Quantity Value Quantity Value
Agriculture 20230879 104742 36117378 206535 26387280 185639 20572546 150906
(86.2) (83.7) (90.4) (86.0) (84.3) (81.9) (83.6) (81.7)
Horticulture 3242989 20420 3830060 33484 4924733 41158 4039165 33832
(13.8) (16.3) (9.6) (14.0) (15.7) (18.1) (16.4) (18.3)
Total 23473868 125162 39947438 240019 31312013 226797 24611711 184738
percent change in export 41.24 47.85 -27.58 -5.83 -27.22 -22.77
Source: https://agriexchange.apeda.gov.in/indexp/reportlist.aspx Note: Qty in MT; Value in Rs. Crore
Table 2.6 explains the percentage share of export of agriculture and horticulture crops from
Uttar Pradesh. It explains that in 2009-12, 79 percent of agriculture products in terms of
quantity & 96.5 percent in terms of value were exported from U.P. which increased to 91.9 &
97.9 percent in year 2012-15 respectively. But in recent years i.e. 2018-19 it declined to 78.3
percent in quantity terms and 97.2 percent in value terms. It shows that export of horticulture
products in Uttar Pradesh has was very law however it increased slightly in the recent years.
Table 2.6: Export from Uttar Pradesh (Principle Commodities)
Item/Year
2009-12 2012-15 2015-18
2018-19 (April-
May)
Quantity Value Quantity Value Quantity Value Quantity Value
Agriculture
667518 4514 1932804 17857 1593671 16758 790688 10008
(79.2) (96.5) (91.9) (97.9) (82.8) (96.7) (78.3) (97.2)
Horticultur
e
175627 163 170657 374 331477 570 219564 288
(20.8) (3.5) (8.1) (2.1) (17.2) (3.3) (21.7) (2.8)
Total
843145 4677 2103461 18231 1925148 17328 1010252 10296
percent change
in export 59.92 74.34 -9.26 -5.21 -90.56
-
68.30 Source: https://agriexchange.apeda.gov.in/indexp/reportlist.aspx Note: Qty in MT; Value in Rs. Crore
VI: STATE WISE AREA AND PRODUCTION
Table 2.7: State Wise percent Share and CAGR of Area and Production of all
Horticulture Crops during 2008-09 to 2017-18
Major States
Area Production
TE -
2011
TE -
2018
CAGR
2009-13
CAGR
2014-18
TE -
2011
TE -
2018
CAGR
2009-13
CAGR
2014-18
Andhra Pradesh 9.1 5.7 4.48 -0.70 9.3 7.4 10.87 7.82
Arunachal Pradesh 0.4 0.3 5.51 -14.89 0.1 0.1 27.64 -24.44
Assam 2.4 2.7 7.57 1.51 2.4 2.0 3.40 -0.38
Bihar 5.4 4.7 1.58 0.02 7.8 6.5 5.12 1.98
Chhattisgarh 2.4 3.0 8.89 4.66 2.2 3.1 13.67 7.05

20
Major States
Area Production
TE -
2011
TE -
2018
CAGR
2009-13
CAGR
2014-18
TE -
2011
TE -
2018
CAGR
2009-13
CAGR
2014-18
Goa 0.5 0.1 0.79 -40.09 0.1 0.1 4.31 -15.14
Gujarat 5.5 6.6 11.24 1.02 6.7 7.7 11.54 2.44
Haryana 1.8 2.0 6.44 4.75 2.0 2.5 8.79 6.70
Himachal Pradesh 1.4 1.3 2.71 1.25 0.9 0.8 3.21 -0.84
Jammu & Kashmir 1.5 1.7 15.90 2.05 1.4 1.2 6.75 2.30
Jharkhand 1.5 1.6 9.34 -1.07 2.0 1.5 6.44 -3.93
Karnataka 8.5 8.3 3.79 2.36 7.1 6.9 8.10 3.11
Kerala 8.1 6.3 -2.05 0.69 4.5 3.4 0.21 2.16
Madhya Pradesh 3.1 7.0 20.76 13.09 3.1 8.5 32.87 8.23
Maharashtra 11.1 7.0 2.23 -8.12 7.8 7.5 2.05 1.21
Manipur 0.4 0.4 6.27 5.07 0.2 0.3 7.72 0.97
Meghalaya 0.5 0.5 1.66 1.20 0.3 0.3 0.50 0.13
Mizoram 0.4 0.6 13.66 1.32 0.2 0.2 18.46 -8.93
Nagaland 0.2 0.4 20.41 2.86 0.1 0.3 21.46 2.39
Orissa 6.1 5.5 1.17 0.47 4.7 3.9 3.93 -0.92
Punjab 1.3 1.5 2.87 6.04 2.2 2.2 2.96 5.51
Rajasthan 4.7 6.5 9.37 6.67 1.0 1.4 10.18 14.42
Sikkim 0.3 0.3 1.94 5.90 0.1 0.1 10.43 13.85
Tamilnadu 6.1 5.3 2.80 -3.49 8.0 6.0 11.47 -5.25
Tripura 0.4 0.5 13.67 -3.71 0.5 0.5 15.59 -4.09
Uttar Pradesh 7.1 8.9 -2.38 13.55 11.0 12.8 -0.14 10.23
Uttrakhand 1.3 1.2 3.76 0.78 0.8 0.6 1.96 -2.08
West Bengal 8.1 7.4 0.79 1.18 12.0 9.9 3.03 3.84
All India 100.0 100.0 4.08 1.60 100.0 100.0 6.13 3.04 Source: National Horticulture Board, Ministry of Agriculture and Farmers Welfare Government of India
http://nhb.gov.in/Statistics.aspx?enc=WkegdyuHokljEtehnJoq0KWLU79sOQCy+W4MfOk01GFOWQSEvtp9tNHHoiv3p49g
Table 2.7 presents the state wise share and CAGR of area and production of all horticulture
crops during 2008-09 to 2017-18 which shows a mixed result. Triennium estimate (of area)in
Uttar Pradesh reported a negative CAGR of 2.38 percent during 2009-13 and CAGR of
13.55percent during 2014-18. Similar trend is examined for CAGR of production in Uttar
Pradesh during 2009-13 and 2014-18. State wise data shows that the best performance in
terms of CAGR for 2014-18 in area and production under horticulture crops was reported in
Madhya Pradesh followed by other states. Negative CAGR was reported by Arunachal
Pradesh, Assam, Bihar, Goa, Jharkhand, Mizoram, Orissa, Tripura and Uttarakhand.

21
Table 2.8: States wise percent Share and CAGR of Area and Production of all Fruit
Crops during 2008-09 to 2017-18
Major States
Area Production
TE -
2011
TE -
2018
CAGR
2009-13
CAGR
2014-18
TE -
2011
TE -
2018
CAGR
2009-13
CAGR
2014-18
Andhra Pradesh 13.3 9.6 -3.01 1.44 15.7 13.9 1.30 12.08
Arunachal Pradesh 1.1 0.9 10.39 -16.85 0.2 0.2 37.37 -24.85
Assam 1.9 2.3 9.59 0.19 2.3 2.2 7.38 1.10
Bihar 4.7 4.7 0.92 -0.14 5.2 4.8 4.02 5.60
Chhattisgarh 2.2 3.4 16.31 2.96 1.7 2.7 15.19 8.62
Goa 0.2 0.2 -1.23 0.32 0.1 0.1 5.22 0.46
Gujarat 5.4 6.4 3.81 3.34 9.3 9.4 8.44 3.13
Haryana 0.7 1.0 6.99 5.02 0.4 0.8 19.62 8.40
Himachal Pradesh 3.3 3.6 2.74 1.12 0.9 0.8 -2.57 -10.06
Jammu & Kashmir 3.9 5.0 20.07 -1.55 2.5 2.4 6.89 4.97
Jharkhand 1.0 1.6 14.01 2.79 0.8 1.1 22.21 5.59
Karnataka 5.6 6.6 4.84 2.19 8.0 7.6 5.91 2.01
Kerala 4.9 4.2 -0.41 -1.38 3.5 2.5 0.32 -6.84
Madhya Pradesh 1.8 5.1 20.23 17.04 4.0 7.2 20.11 6.75
Maharashtra 24.0 11.4 1.71 -14.05 14.4 11.4 -2.05 -3.12
Manipur 0.8 0.8 6.81 -3.43 0.4 0.5 9.11 -3.28
Meghalaya 0.5 0.6 -0.06 -1.18 0.4 0.4 1.63 -0.66
Mizoram 0.5 0.9 13.11 2.27 0.3 0.4 16.88 -0.54
Nagaland 0.4 0.6 16.49 -0.87 0.2 0.4 17.86 -2.08
Orissa 4.8 5.3 3.76 1.30 2.5 2.6 9.28 3.50
Punjab 1.1 1.4 3.51 4.55 1.8 2.0 5.31 5.42
Rajasthan 0.6 0.8 13.38 13.06 0.9 0.9 7.10 8.79
Sikkim 0.2 0.3 7.90 102.29 0.0 0.0 11.05 129.13
Tamilnadu 5.0 4.7 0.75 -0.81 7.8 6.6 74.63 -4.73
Tripura 0.6 1.0 14.88 -6.73 0.8 0.7 9.16 -10.46
Uttar Pradesh 5.5 7.4 -1.75 7.27 7.1 11.1 3.89 12.31
Uttrakhand 2.9 2.8 3.55 -0.64 1.0 0.7 3.18 -1.94
West Bengal 3.3 4.0 2.05 4.22 4.0 3.9 3.39 6.60
All India 100.0 100.0 3.33 -1.64 100.0 100.0 4.18 2.54
Source: National Horticulture Board, Ministry of Agriculture and Farmers Welfare, Government of India
(http://nhb.gov.in/Statistics.aspx?enc=WkegdyuHokljEtehnJoq0KWLU79sOQCy+W4MfOk01GFOWQSEvtp9tNHHoiv3p4
9g)
Table 2.8 depicts percent share and CAGR of area and production of all fruit crops in
different states of India. The triennium estimates for area and production calculated for year
2011 and 2018 shows that Maharashtra ranks first with 24percent and 11.4 percent (in terms
of area) in T.E respectively. Andhra Pradesh ranks second followed by Uttar Pradesh at 3rd
position in term of area of total fruits crops with 5.5percent and 7.4percent respectively.
Similarly, the triennium estimates of 2011 and 2018 in terms of total fruit crops production
reveals Andhra Pradesh at the top with 15.7percent and 13.9percent respectively followed by
Maharashtra with 14.4percent & 11.4percent .Thus, it shows that Maharashtra holds first
position in terms of all total fruit crops area and Andhra Pradesh has 1st position in terms of

22
all total fruit crops production in TE estimates whereas the position of Uttar Pradesh is third
in both area and production of total fruit crops .
In terms of CAGR (production and area) of fruit crops, it was found that M.P. (20.23percent)
has highest CAGR in term of area of total fruit crops in year 2009-13 followed by Jammu
Kashmir and Sikkim .Though Uttar Pradesh recorded a negative CAGR of -1.75percent but
its position was much better in 2014-18 in total area of fruit crops as it recorded a growth rate
of 7.27percent. Sikkim recorded a highest rate of growth (102.29percent) but here it is
significant as area under horticulture crops is very meager. In terms of total production of all
fruit crops, the rate of growth of Sikkim was 129.13 in 2014-15 followed by Uttar Pradesh
(12.31percent) which is much higher than India‟s rate of growth (2.54percent) which is very
encouraging.
Table 2.9: States wise percent Share and CAGR of Area and Production of all
Vegetable Crops during 2008-09 to 2017-18
Major States
Area Production
TE -
2011
TE -
2018
CAGR
2009-13
CAGR
2014-18
TE -
2011
TE -
2018
CAGR
2009-13
CAGR
2014-18
Andhra Pradesh 5.3 2.3 24.46 -11.97 5.5 3.8 27.89 2.30
Arunachal Pradesh 0.1 0.0 -39.89 13.33 0.0 0.0 -12.85 -22.43
Assam 3.1 3.0 3.46 1.70 2.5 2.0 -0.90 -1.29
Bihar 10.2 8.2 1.08 0.36 10.2 8.4 5.22 1.03
Chhattisgarh 3.9 4.8 5.84 5.84 2.7 3.8 13.12 6.63
Goa 0.1 0.1 4.48 0.52 0.0 0.0 10.21 0.52
Gujarat 5.4 6.4 8.96 1.70 5.7 7.3 12.71 2.21
Haryana 3.9 4.1 5.63 5.08 3.1 3.7 7.73 6.76
Himachal Pradesh 1.0 0.9 1.96 1.69 1.0 1.0 4.98 3.27
Jammu & Kashmir 0.8 0.6 -0.24 -2.95 1.0 0.8 6.56 -2.45
Jharkhand 3.0 2.8 7.24 -2.35 2.8 1.9 4.15 -6.16
Karnataka 5.5 4.7 -0.21 2.97 5.8 4.6 1.09 1.48
Kerala 1.9 1.3 -2.41 -5.91 2.5 1.2 -0.06 -5.31
Madhya Pradesh 3.4 8.4 24.47 10.61 2.7 9.6 40.69 8.65
Maharashtra 6.2 7.0 3.64 1.82 4.9 6.1 8.17 5.80
Manipur 0.2 0.5 6.00 20.68 0.2 0.2 3.69 8.20
Meghalaya 0.5 0.5 -2.92 3.48 0.3 0.3 -1.37 -0.03
Mizoram 0.2 0.4 38.62 -4.16 0.1 0.1 18.12 -11.42
Nagaland 0.1 0.4 34.89 5.81 0.1 0.3 34.93 4.08
Orissa 7.8 6.3 0.40 -1.58 6.2 4.9 2.87 -2.16
Punjab 2.2 2.3 0.35 6.22 2.6 2.6 2.53 5.52
Rajasthan 1.6 1.7 15.97 2.67 0.7 1.0 5.38 10.96

23
Major States
Area Production
TE -
2011
TE -
2018
CAGR
2009-13
CAGR
2014-18
TE -
2011
TE -
2018
CAGR
2009-13
CAGR
2014-18
Sikkim 0.3 0.3 2.13 6.61 0.1 0.1 4.67 15.58
Tamilnadu 3.4 2.5 0.91 -5.28 6.0 3.7 -0.19 -7.20
Tripura 0.4 0.5 12.58 -0.72 0.3 0.5 23.26 0.47
Uttar Pradesh 11.6 14.0 -3.33 13.53 14.4 15.6 -1.24 9.67
Uttarakhand 1.0 0.9 2.27 1.53 0.8 0.5 0.34 -2.13
West Bengal 16.2 13.7 0.58 0.29 17.4 14.3 3.01 3.41
All India 100.0 100.0 4.09 2.49 100.0 100.0 6.29 3.02 Source: National Horticulture Board, Ministry of Agriculture and Farmers Welfare Government of India
http://nhb.gov.in/Statistics.aspx?enc=WkegdyuHokljEtehnJoq0KWLU79sOQCy+W4MfOk01GFOWQSEvtp9tNHHoiv3p4
9g
Table 2.9 depicts percent share and CAGR of area and production of all vegetables crops in
different states of India. The triennium estimates for area of all vegetable crops in 2018
shows that Uttar Pradesh ranks first with 14.0percent followed by West Bengal(13.7percent)
and Bihar as compared to T.E 2011 which depicts that U.P has put an excellent performance
in terms of area of all vegetable crops in given period. The triennium estimates for
production of all vegetables crops in T.E 2018 indicates that Uttar Pradesh has highest
production with 15.6percent in all vegetables crops than all other states followed by West
Bengal and Bihar. Hence, the given table explains that U.P ranks first position in terms of
both area and production of total vegetable crops in India in TE 2011-2018.
In terms of CAGR of area and production of Total vegetable crops in 2009-2013 reveals
though the Mizoram (38.62percent) and Nagaland (34.89percent) has reported the best
figures but their area under vegetable crops is not much as expected. The state of Uttar
Pradesh has reported a negative growth (-3.3percent) in India as a whole but it showed much
improvement in 2014-2018 with 13.53percent after Manipur. In terms of total production of
all vegetable crops, the CAGR has been highest in Madhya Pradesh (40.69percent) followed
by Nagaland (34.93percent) while U.P. showed a dismal performance by reporting a negative
growth rate of -1.24percent as against all India CAGR (2009-13) of 6.29percent .However, it
showed improvement during 2014-2018 by registering a growth of 9.67percent .

24
Table 2.10: State wise percent Share and CAGR of Area and Production of all Spices
Crops during 2008-09 to 2017-18
State
Area Production
TE -
2011
TE -
2018
CAGR
2009-13
CAGR
2014-18
TE -
2011
TE -
2018
CAGR
2009-13
CAGR
2014-18
Andhra Pradesh 11.5 6.4 -1.01 10.03 25.6 12.8 -0.89 9.18
Arunachal Pradesh 0.3 0.3 8.92 3.59 1.1 0.9 12.07 2.03
Assam 1.8 2.9 45.44 3.77 1.9 4.0 125.41 0.60
Bihar 0.4 0.3 4.36 -12.11 0.3 0.1 0.43 -5.18
Chhattisgarh 0.4 0.3 1.32 -0.53 0.2 0.1 18.17 1.87
Goa 0.0 0.0 3.56 -39.22 0.0 0.0 9.68 -12.16
Gujarat 13.1 14.3 20.93 -1.01 12.0 12.6 25.13 1.29
Haryana 0.3 0.5 37.62 1.69 0.9 1.0 39.89 -1.86
Himachal Pradesh 0.2 0.2 11.23 0.75 0.4 0.3 -10.94 12.19
Jammu & Kashmir 0.1 0.1 1.92 0.53 0.0 0.0 5.05 -2.21
Jharkhand 0.0 0.0 0.0 0.0 0.0 0.0 0.0 0.0
Karnataka 8.8 6.2 0.20 5.98 8.2 5.5 6.86 9.99
Kerala 10.0 4.6 -11.14 0.19 2.8 2.0 -1.44 12.55
Madhya Pradesh 8.5 13.0 13.43 18.71 6.7 12.8 20.80 26.65
Maharashtra 4.3 1.9 1.48 -30.19 2.2 5.0 3.46 41.87
Manipur 0.4 0.3 4.71 0.00 0.3 0.3 40.13 -1.26
Meghalaya 0.6 0.5 -0.02 1.92 1.6 1.2 1.75 2.83
Mizoram 0.8 0.7 -1.10 4.90 2.0 1.1 -2.45 15.54
Nagaland 0.3 0.4 9.49 5.04 0.9 1.2 0.42 22.08
Orissa 5.2 3.8 -4.94 5.33 4.2 2.5 -2.29 3.26
Punjab 0.5 0.9 29.34 14.68 1.1 1.3 23.82 7.70
Rajasthan 20.6 26.7 9.18 3.83 11.7 15.5 20.84 20.53
Sikkim 1.0 0.9 -0.88 -0.43 1.0 0.9 10.46 4.48
Tamilnadu 4.8 2.5 2.21 -19.19 6.0 2.5 9.88 -20.66
Tripura 0.2 0.2 8.55 2.98 0.3 0.3 16.42 12.45
Uttar Pradesh 2.1 4.6 1.90 45.00 4.0 3.0 6.80 0.63
Uttrakhand 0.1 0.4 50.38 19.37 0.5 0.5 40.21 -3.41
West Bengal 3.6 3.2 0.48 6.31 4.2 4.3 2.97 15.35
All India 100.0 100.0 5.96 5.22 100.0 100.0 11.02 9.66 Source: National Horticulture Board, Ministry of Agriculture and Farmers Welfare Government of India
http://nhb.gov.in/Statistics.aspx?enc=WkegdyuHokljEtehnJoq0KWLU79sOQCy+W4MfOk01GFOWQSEvtp9tNHHoiv3p4
9g
Table 2.10 indicates the percent share and CAGR of area and production of all spices crops in
different states of India. The triennium estimates for area of all spices crops in 2018 indicate
that Rajasthan (26.7percent) has been the top performer followed by Gujarat (14.3percent)

25
and Andhra Pradesh (6.4percent) where U.P.‟s performance was not found satisfactory as it
was just 4.6 percent .In terms of C.A.G.R in year 2009-13, Assam recorded the highest
growth rate of 45.44percent followed by Haryana .Further, it was found that U.P.‟s growth
rate was not satisfactory during 2009-13 but it has shown much improvement during 2014-18
with an increase of 45.00percent followed by Uttarakhand (19.37percent) and Madhya
Pradesh (18.71percent) as against an all India average of 5.22percent.
In terms of total spices production within all states in triennium year 2011, Andhra Pradesh
(25.6percent) was the top performer followed by Gujarat (12percent) and Rajasthan
(11percent) whereas U.P.‟s share was just 4percent (which decline with 1percent in T.E
2018) which is not at all satisfactory.
On basis of CAGR (production) during 2009-13 of all spices crops in all the states, Assam
recorded 1st position followed by Uttarakhand (40.21percent) and Manipur (40.13percent).
Uttar Pradesh‟s CAGR was 6.80percent as against all India average of 11.02percent which
decline during 2014-18 to 0.63percent as against all India CAGR of 9.66percent. Maharashtra
(41.87percent) was the top performer followed by Madhya Pradesh (26.65percent) and
Nagaland (22.08percent) during 2014-18.
Hence, it can be said that in terms of both area and production of total spices production,
U.P.‟s growth was not found satisfactory as compared to other states.
Table 2.11: States wise percent Share and CAGR of Area and Production of Other
Horticulture (Flower & Aromatic) Crops during 2008-09 to 2017-18
Major States
Area Production
TE -
2011
TE -
2018
CAGR
2009-13
CAGR
2014-18
TE -
2011
TE -
2018
CAGR
2009-13
CAGR
2014-18
Andhra Pradesh 0.2 0.1 2.16 10.90 0.1 0.1 9.10 37.90
Arunachal Pradesh 0.0 0.0 104.26 -56.98 0.0 0.0 307.61 -83.04
Assam 0.0 0.0 39.97 7.17 0.0 0.0 0.0 15.51
Bihar 0.0 0.0 157.96 -3.26 0.0 0.0 56.01 -9.06
Chhattisgarh 0.1 0.1 10.82 4.12 0.0 0.0 11.28 2.86
Goa 0.0 0.0 0.0 158.49 0.0 0.0 0.0 81.44
Gujarat 0.1 0.1 15.00 4.36 0.0 0.1 37.91 -0.47
Haryana 0.0 0.0 6.07 -7.41 0.0 0.0 3.41 -3.15
Himachal Pradesh 0.0 0.0 11.05 -2.10 0.0 0.0 143.19 -17.77
Jammu & Kashmir 0.0 0.2 77.16 277.16 0.0 0.0 142.69 265.79
Jharkhand 0.0 0.0 0.00 -16.54 0.0 0.0 0.00 -30.87
Karnataka 0.1 0.2 3.71 4.23 0.1 0.1 1.19 1.90
Kerala 0.0 0.1 0.0 0.0 0.0 0.0 0.0 0.0
Madhya Pradesh 0.2 0.3 32.39 -3.49 0.1 0.2 39.31 -10.69

26
Major States
Area Production
TE -
2011
TE -
2018
CAGR
2009-13
CAGR
2014-18
TE -
2011
TE -
2018
CAGR
2009-13
CAGR
2014-18
Maharashtra 0.1 0.0 6.34 -24.81 0.0 0.0 7.30 -25.51
Manipur 0.0 0.0 0.0 -30.83 0.0 0.0 0.0 32.91
Meghalaya 0.0 0.0 0.0 -39.58 0.0 0.0 0.0 0.0
Mizoram 0.0 0.0 -23.46 -6.53 0.0 0.0 20.59 -78.98
Nagaland 0.0 0.0 0.0 126.11 0.0 0.0 0.0 0.0
Orissa 0.0 0.0 6.25 -2.83 0.0 0.0 2.85 -8.04
Punjab 0.0 0.1 32.24 -1.55 0.0 0.0 -44.47 1.59
Rajasthan 1.3 1.7 5.85 15.58 0.1 0.1 8.58 31.10
Sikkim 0.0 0.0 8.28 0.25 0.0 0.0 0.0 0.62
Tamilnadu 0.2 0.2 3.86 -11.66 0.1 0.2 16.74 7.60
Tripura 0.0 0.0 0.0 0.0 0.0 0.0 0.0 0.0
Uttar Pradesh 0.7 0.6 0.64 1.12 0.0 0.0 6.33 8.00
Uttarakhand 0.0 0.0 14.89 1.00 0.0 0.0 32.06 4.56
West Bengal 0.1 0.1 3.90 1.79 0.0 0.0 6.15 2.86
All India 3.2 3.9 6.76 7.62 0.7 0.9 17.12 1.36 Source: National Horticulture Board, Ministry of Agriculture and Farmers Welfare Government of India http://nhb.gov.in/Statistics.aspx?enc=WkegdyuHokljEtehnJoq0KWLU79sOQCy+W4MfOk01GFOWQSEvtp9tNHHoiv3p4
9g
Table 2.11 explains the percent share and CAGR of area and production of all other
horticulture (flowers and aromatic) crops in different states of India .It depicts that in terms of
percentage of area in both triennium year 2011 and 2018, Rajasthan (1.3percent and
1.7percent) is at top position followed by U.P. (0.7percent and 0.6percent) as against all India
percentage of 3.2 and 3.9. CAGR (area) 2009-13 indicates that Bihar (157.96) registered the
highest growth in area of all other horticulture crops followed by Arunachal Pradesh
(104.26).
In terms of CAGR (area) 2014-18, Jammu & Kashmir led the way with 277.16percent growth
followed by Goa (158.49percent). U.P performed poorly with 0.64percent and 1.12percent
growth during 2009-13 and 2014-18 as against all India average growth of 6.76percent and
7.62percent during the same period.
In terms of production of all other horticulture crops within all other states, it was found that
TE-2011 and TE-2018 production figures does not yield any significant trend across the
States. Arunachal Pradesh (307.61percent) led the way followed by Himachal Pradesh
(143.19percent) and Jammu & Kashmir (142.69percent) in terms of CAGR (Production)
2009-13 where U.P. recorded a CAGR of 6.33percent as against All India average of 17.12
during the same period. The CAGR (production) during 2014-18 indicates that Jammu &
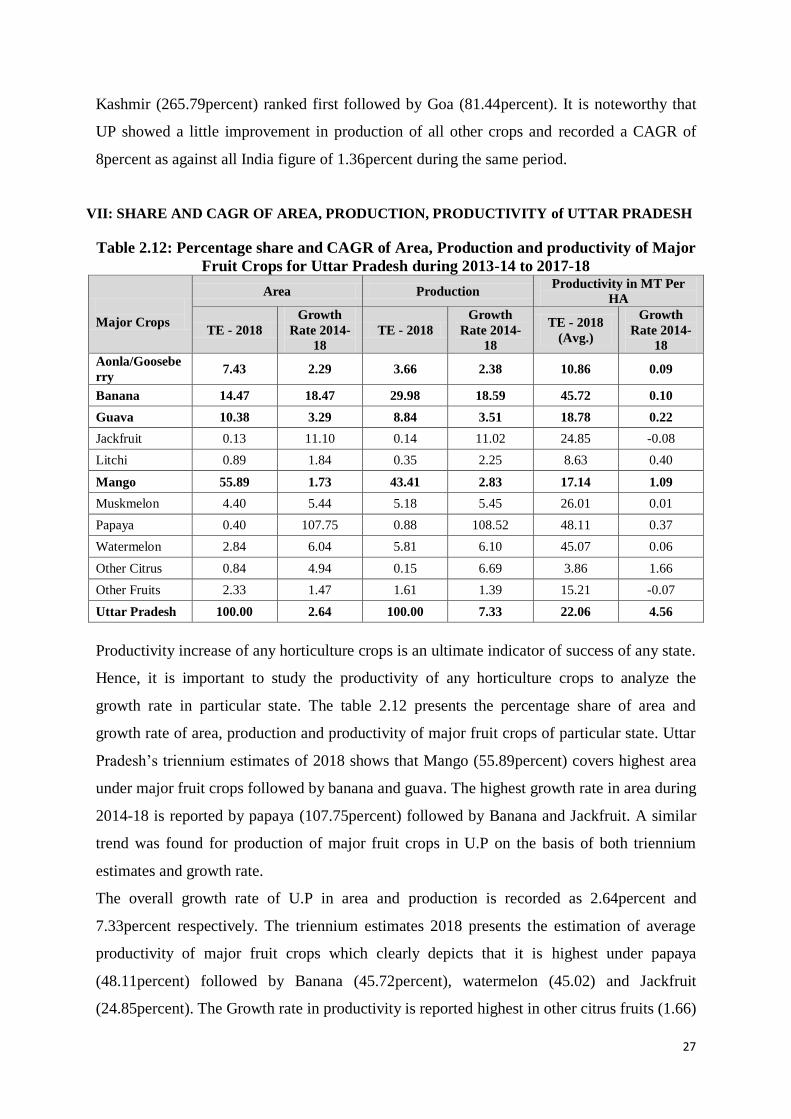
27
Kashmir (265.79percent) ranked first followed by Goa (81.44percent). It is noteworthy that
UP showed a little improvement in production of all other crops and recorded a CAGR of
8percent as against all India figure of 1.36percent during the same period.
VII: SHARE AND CAGR OF AREA, PRODUCTION, PRODUCTIVITY of UTTAR PRADESH
Table 2.12: Percentage share and CAGR of Area, Production and productivity of Major
Fruit Crops for Uttar Pradesh during 2013-14 to 2017-18
Major Crops
Area Production Productivity in MT Per
HA
TE - 2018
Growth
Rate 2014-
18
TE - 2018
Growth
Rate 2014-
18
TE - 2018
(Avg.)
Growth
Rate 2014-
18
Aonla/Goosebe
rry 7.43 2.29 3.66 2.38 10.86 0.09
Banana 14.47 18.47 29.98 18.59 45.72 0.10
Guava 10.38 3.29 8.84 3.51 18.78 0.22
Jackfruit 0.13 11.10 0.14 11.02 24.85 -0.08
Litchi 0.89 1.84 0.35 2.25 8.63 0.40
Mango 55.89 1.73 43.41 2.83 17.14 1.09
Muskmelon 4.40 5.44 5.18 5.45 26.01 0.01
Papaya 0.40 107.75 0.88 108.52 48.11 0.37
Watermelon 2.84 6.04 5.81 6.10 45.07 0.06
Other Citrus 0.84 4.94 0.15 6.69 3.86 1.66
Other Fruits 2.33 1.47 1.61 1.39 15.21 -0.07
Uttar Pradesh 100.00 2.64 100.00 7.33 22.06 4.56
Productivity increase of any horticulture crops is an ultimate indicator of success of any state.
Hence, it is important to study the productivity of any horticulture crops to analyze the
growth rate in particular state. The table 2.12 presents the percentage share of area and
growth rate of area, production and productivity of major fruit crops of particular state. Uttar
Pradesh‟s triennium estimates of 2018 shows that Mango (55.89percent) covers highest area
under major fruit crops followed by banana and guava. The highest growth rate in area during
2014-18 is reported by papaya (107.75percent) followed by Banana and Jackfruit. A similar
trend was found for production of major fruit crops in U.P on the basis of both triennium
estimates and growth rate.
The overall growth rate of U.P in area and production is recorded as 2.64percent and
7.33percent respectively. The triennium estimates 2018 presents the estimation of average
productivity of major fruit crops which clearly depicts that it is highest under papaya
(48.11percent) followed by Banana (45.72percent), watermelon (45.02) and Jackfruit
(24.85percent). The Growth rate in productivity is reported highest in other citrus fruits (1.66)

28
and water melon (1.09percent). The overall growth rate under productivity was 4.56percent
in the state of U.P.
Table 2.13: Percentage share and CAGR of Area, Production and productivity of Major
Vegetables Crops for Uttar Pradesh during 2013-14 to 2017-18
Major Crops
Area Production Productivity in MT Per
HA
TE - 2018
Growth
Rate 2014-
18
TE - 2018
Growth
Rate 2014-
18
TE - 2018
Growth
Rate 2014-
18
Bitter Gourd 0.23 21.57 0.19 23.63 12.46 1.69
Bottle Gourd 0.78 16.41 1.05 16.67 19.67 0.22
Brinjal 0.43 16.56 0.67 18.46 22.91 1.63
Cabbage 0.47 36.44 0.74 37.08 22.80 0.46
Carrot 0.34 14.59 0.39 15.62 16.70 0.90
Cauliflower 1.42 18.92 1.48 20.87 22.85 1.64
Kaddu/Pumpkin 0.78 19.46 1.36 20.11 38.20 0.54
Okra /Ladies
Finger 1.85 16.61 1.13 18.63 13.40 1.73
Onion 2.12 2.45 1.60 1.59 16.56 -0.84
Peas (Green) 17.93 4.63 9.30 6.28 11.36 1.58
Pointed Gourd
/Parwal 0.17 15.56 0.21 17.51 26.72 1.69
Potato 49.86 1.65 55.75 6.91 24.47 5.18
Radish 0.47 23.24 0.55 23.59 25.74 0.29
Sweet Potato 1.40 1.60 0.85 1.67 13.24 0.07
Tomato 1.71 30.54 3.09 30.70 39.58 0.12
Other Vegetables 18.06 9.88 19.46 7.41 23.73 -2.25
Uttar Pradesh 100.00 5.23 100.00 8.35 21.88 2.96
Table 2.13 explains the percentage share and CAGR of area, production and productivity of
Major Vegetable Crops for Uttar Pradesh during 2013-14 to 2017-18. The Triennium
estimate of area 2018 indicates that highest area is under potato (49.86percent) followed by
other vegetables (18.06percent) and peas (green 17.93percent). The growth in area during
2014-18 has been found very significant under cabbage (36.44percent) followed by Tomato
(30.54percent), Radish (23.24percent) and bitter gourd (21.57percent) whereas the growth
rate of area under all vegetable crops in the state was found to be 5.23percent.
In terms of TE- 2018, the production is very significant under potato (55.75percent) followed
by other vegetables (19.46percent) and peas green (9.30percent) where the growth rate in
production during 2014-18 is highest of cabbage (37.08percent) followed by tomato
(30.70percent), bitter gourd (23.63percent) and Radish (23.59percent). The state of U.P. as a
whole production under all vegetable crops reported growth rate of only 8.35percent.
The Triennium estimate 2018 of average productivity per hectare is found significant under
tomato (39.58percent). The state as a whole has reported and observed a good increase in

29
productivity (21.88percent) in TE estimates 2018 while the state of U.P. reported productivity
growth rate of 2.96percent. It was found that the growth in productivity per hectare 2014-18
was found significant in case of potato while it is negative (-0.84) for onions.
Table 2.14: Percentage share and CAGR of Area, Production and productivity of Major
Spices Crops for Uttar Pradesh during 2013-14 to 2017-18
Major Crops
Area Production Productivity in MT Per HA
TE - 2018 Growth Rate
2014-18 TE - 2018
Growth
Rate 2014-
18
TE - 2018
Growth
Rate 2014-
18
Coriander 9.11 1.27 1.49 1.37 0.55 0.09
Fennel 0.98 1.48 0.27 1.51 0.93 0.03
Fenugreek 0.52 1.89 0.08 2.66 0.54 0.76
Garlic 48.90 0.53 85.65 0.45 5.86 -0.08
Ginger 1.10 1.53 1.69 1.55 5.15 0.02
Red Chilly 37.42 25.13 9.06 25.26 0.81 0.11
Turmeric 2.44 0.76 2.12 1.34 2.91 0.57
Uttar Pradesh 100.00 7.11 100.00 1.79 3.35 -4.96
The table 2.14 depicts the percentage share and CAGR of area, production and productivity
of major spices crops during 2013-14 to 2017-18 in U.P. The triennium estimate 2018 shows
highest area under garlic cultivation (48.90percent) followed by red chilly (37.48percent).
The red chilly is the only spice crop which reported very significant growth in area under
cultivation during 2014-18 with 25.13percent. The state average of growth is 7.11percent. A
similar trend was seen for production of all spices crops as the Triennium estimate 2018
reported highest production of garlic (85.66percent) followed by red chilly cultivation with
9.6percent. The production growth rate 2014-18 is very significant only in red chilly
(25.13percent) while growth rate in U.P. is only 1.79percent during the same period. Further
table explains the Triennium estimate of productivity in 2018 which is highest for Garlic
(5.86percent) and Ginger (5.15percent). The state average of major spice productivity is
recorded at 3.35percent. The growth rate of productivity per hectare 2014-18 is not very
encouraging whereas it is found to be highest 0.76percent in fenugreek followed by Turmeric
(0.57percent) the productivity growth rate is found negative for garlic -0.08percent. The State
average productivity is reported to be negative (-4.96percent), that can be due to variety of
factors such as low fertility of soil, ultimate rain in major spices growing area, etc. Thus,
various suggestions are required to improve the productivity in the given state.
VIII: Agro-climatic-Zone wise Status of all Horticulture Crops
The table 2.15 explains the share and growth rate of area, production and productivity of all
horticulture crops on basis of agro climatic zone of Uttar Pradesh. The area of TE-2018
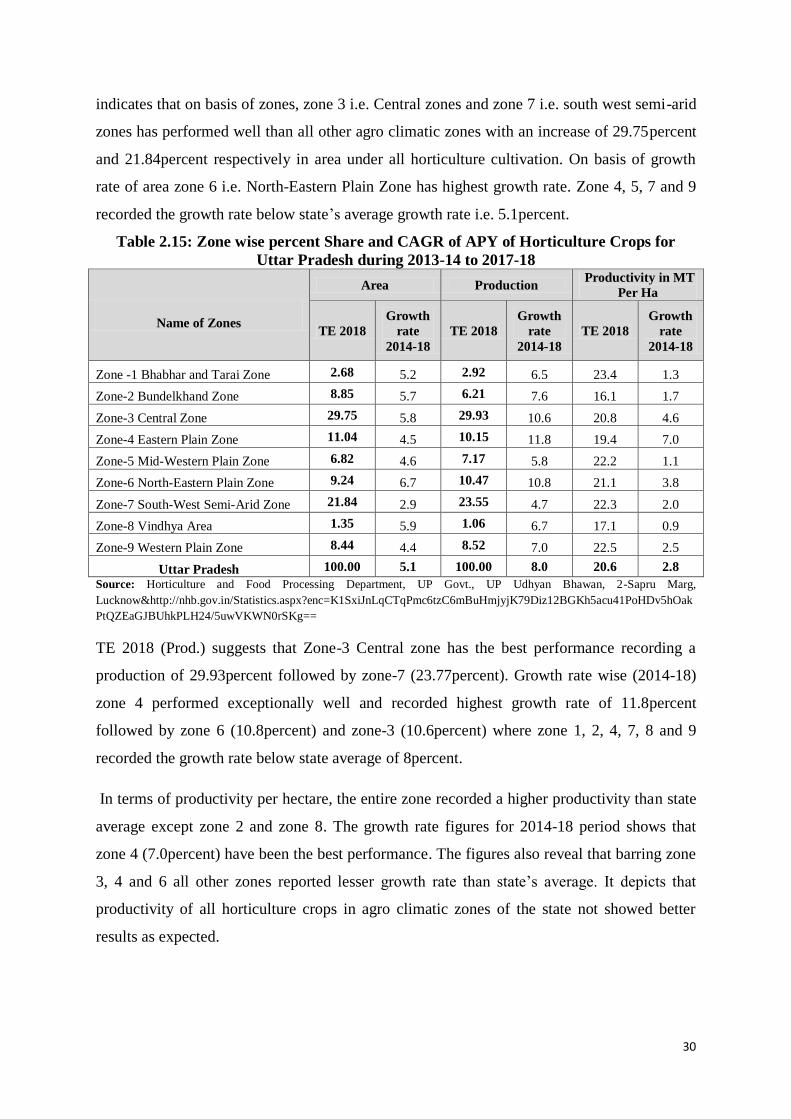
30
indicates that on basis of zones, zone 3 i.e. Central zones and zone 7 i.e. south west semi-arid
zones has performed well than all other agro climatic zones with an increase of 29.75percent
and 21.84percent respectively in area under all horticulture cultivation. On basis of growth
rate of area zone 6 i.e. North-Eastern Plain Zone has highest growth rate. Zone 4, 5, 7 and 9
recorded the growth rate below state‟s average growth rate i.e. 5.1percent.
Table 2.15: Zone wise percent Share and CAGR of APY of Horticulture Crops for
Uttar Pradesh during 2013-14 to 2017-18
Name of Zones
Area Production Productivity in MT
Per Ha
TE 2018
Growth
rate
2014-18
TE 2018
Growth
rate
2014-18
TE 2018
Growth
rate
2014-18
Zone -1 Bhabhar and Tarai Zone 2.68 5.2 2.92 6.5 23.4 1.3
Zone-2 Bundelkhand Zone 8.85 5.7 6.21 7.6 16.1 1.7
Zone-3 Central Zone 29.75 5.8 29.93 10.6 20.8 4.6
Zone-4 Eastern Plain Zone 11.04 4.5 10.15 11.8 19.4 7.0
Zone-5 Mid-Western Plain Zone 6.82 4.6 7.17 5.8 22.2 1.1
Zone-6 North-Eastern Plain Zone 9.24 6.7 10.47 10.8 21.1 3.8
Zone-7 South-West Semi-Arid Zone 21.84 2.9 23.55 4.7 22.3 2.0
Zone-8 Vindhya Area 1.35 5.9 1.06 6.7 17.1 0.9
Zone-9 Western Plain Zone 8.44 4.4 8.52 7.0 22.5 2.5
Uttar Pradesh 100.00 5.1 100.00 8.0 20.6 2.8
Source: Horticulture and Food Processing Department, UP Govt., UP Udhyan Bhawan, 2-Sapru Marg,
Lucknow&http://nhb.gov.in/Statistics.aspx?enc=K1SxiJnLqCTqPmc6tzC6mBuHmjyjK79Diz12BGKh5acu41PoHDv5hOak
PtQZEaGJBUhkPLH24/5uwVKWN0rSKg==
TE 2018 (Prod.) suggests that Zone-3 Central zone has the best performance recording a
production of 29.93percent followed by zone-7 (23.77percent). Growth rate wise (2014-18)
zone 4 performed exceptionally well and recorded highest growth rate of 11.8percent
followed by zone 6 (10.8percent) and zone-3 (10.6percent) where zone 1, 2, 4, 7, 8 and 9
recorded the growth rate below state average of 8percent.
In terms of productivity per hectare, the entire zone recorded a higher productivity than state
average except zone 2 and zone 8. The growth rate figures for 2014-18 period shows that
zone 4 (7.0percent) have been the best performance. The figures also reveal that barring zone
3, 4 and 6 all other zones reported lesser growth rate than state‟s average. It depicts that
productivity of all horticulture crops in agro climatic zones of the state not showed better
results as expected.

31
Table 2.16: Zone wise percent Share and CAGR of APY of All Fruits Crops for Uttar
Pradesh during 2013-14 to 2017-18
Name of Zones
Area Production Productivity in
MT Per Ha
TE
2018
Growth
rate 2014-
18
TE
2018
Growth
rate 2014-
18
TE
2018
Growth
rate
2014-18
Zone -1 Bhabhar and Tarai Zone 3.9 4.0 4.03 6.2 23.5 2.1
Zone-2 Bundelkhand Zone 0.8 4.9 0.50 8.1 14.5 2.9
Zone-3 Central Zone 32.2 5.1 31.9 7.0 24.1 1.8
Zone-4 Eastern Plain Zone 10.2 3.3 8.19 6.1 17.3 2.7
Zone-5 Mid-Western Plain Zone 6.07 2.7 5.59 3.8 20.0 1.0
Zone-6 North-Eastern Plain Zone 18.3 5.9 24.2 9.1 22.5 3.0
Zone-7 South-West Semi Arid Zone 10.8 1.0 10.9 5.1 23.4 5.0
Zone-8 Vindhya Area 0.83 4.1 0.65 4.6 17.4 0.4
Zone-9 Western Plain Zone 16.9 3.0 13.9 4.4 18.0 1.3
Uttar Pradesh 100.0 3.8 100.0 6.0 20.1 2.3
Source: Horticulture and Food Processing Department, UP Govt., UP Udhyan Bhawan, 2-Sapru Marg,
Lucknow&http://nhb.gov.in/Statistics.aspx?enc=K1SxiJnLqCTqPmc6tzC6mBuHmjyjK79Diz12BGKh5acu41PoHDv5hOak
PtQZEaGJBUhkPLH24/5uwVKWN0rSKg==
The above table 2.16 explains the zone wise percent share and growth rate of APY of all fruit
crops for the state which clearly depicts that on basis of TE 2018 (area), central zone
constitutes a major chunk of all fruit crops share(32.2percent) followed by zone 6 north
Eastern Plain(18.3percent) and zone 9 i.e. western plain zone (16.9percent).The growth rate
in area (2014-18) shows that except zone-4, zone-5, zone-7 and zone-9 ,the growth rate in all
other zones was higher than state‟s average (3.8percent).
TE (Production) 2018 reported highest percentage share in zone-3 central zone (31.9percent)
followed by zone-6 North Easter Plain Zone (24.2percent). The share of zone 4 and zone 8 is
not much significant. The growth rate (2014-18) is highest in zone-6 (24.2percent) followed
by zone-9 (13.9percent) The growth rate in production of all fruit crops in agro climatic zones
where zone-5, zone-7, zone-8 and zone9- are below state average which is 6percent.
TE 2018 (Productivity per hector) is highest (24.1percent) in zone-3 central zone followed by
23.5percent in zone 1 i.e. Bhabhar and Terai zone. The productivity in zone-2, zone-4, zone-
5, zone-8 and zone-9 is less than state average i.e. 2.3percent. The growth rate in productivity
(2014-18) is found to be highest in zone-7 South West Semi-Arid Zone (5.0percent). The
growth rate in zone-8 Vindhya Zone was recorded lowest in the state in all fruit crops.

32
Table 2.17: Zone wise percent Share and CAGR of APY of All Vegetables Crops for
Uttar Pradesh during 2013-14 to 2017-18
Name of Zones
Area Production Productivity in
MT Per Ha
TE
2018
Growth
rate 2014-
18
TE
2018
Growth
rate
2014-18
TE
2018
Growth
rate
2014-18
Zone-1 Bhabhar and Tarai Zone 2.20 5.5 2.51 7.1 25.3 1.5
Zone-2 Bundelkhand Zone 12.4 5.9 8.5 7.8 17.0 1.7
Zone-3 Central Zone 28.1 6.5 29.1 12.5 22.0 5.8
Zone-4 Eastern Plain Zone 11.7 4.9 10.9 13.6 20.4 8.4
Zone-5 Mid-Western Plain Zone 7.28 5.9 7.83 7.0 23.1 1.1
Zone-6 North-Eastern Plain Zone 6.09 6.4 5.20 10.7 18.7 4.1
Zone-7 South-West Semi Arid Zone 25.5 5.0 28.2 4.8 24.0 -0.1
Zone-8 Vindhya Area 1.51 5.9 1.23 7.6 18.3 1.6
Zone-9 Western Plain Zone 5.56 6.5 6.49 10.3 25.4 3.5
Uttar Pradesh 100.0 5.8 100.0 9.0 21.6 3.1
Source: Horticulture and Food Processing Department, UP Govt., UP Udhyan Bhawan, 2-Sapru Marg,
Lucknow&http://nhb.gov.in/Statistics.aspx?enc=K1SxiJnLqCTqPmc6tzC6mBuHmjyjK79Diz12BGKh5acu41PoHDv5hOak
PtQZEaGJBUhkPLH24/5uwVKWN0rSKg==
TE-2018 indicate that Zone-3 Central Zone (28.1percent) followed by zone-7 South West
Semi-Arid Zone constituted more than 50percent of area under vegetable crops in the state.
The lowest share of area under vegetables in found in zone-8 Vindhya Zone. The growth rate
in area under vegetable cultivation is higher than state average in all zones barring zone-1,
zone-4 and zone-7.
TE 2018 (Production) reported highest production share in zone-3 central zone (29.1percent)
followed by zone-7 South West Semi Arid Zone (28.2percent).The growth rate in production
suggests that it is higher than state average in zone-3 Central zone, zone-4 Eastern plain zone,
zone-6 North Eastern plain zone and zone-9 Western plain zone.
The productivity (TE-2018) is higher in all the zones than state average except zone-2
Bundelkhand zone, zone-6 North Eastern Plain zone and zone-8 Vindhya zone. The
productivity growth rate (2014-18) has been highest in zone-4 Eastern plain zone (8.4percent)
followed by zone-3 central zone (5.8percent). The zone-7 South west Semi-Arid zone
reported a negative growth rate of 0.1percent. Hence, above table 2.17 depicts that zonal wise
area and production of vegetable crops is much better in the state.

33
Table2.18: Zone wise percent Share and CAGR of APY of All Spices Crops for Uttar
Pradesh during 2013-14
Name of Zones
Area Production Productivity in
MT Per Ha
TE
2018
Growth
rate
2014-18
TE
2018
Growth
rate 2014-
18
TE
2018
Growth
rate 2014-
18
Zone-1Bhabhar and Tarai Zone 2.41 23.6 1.15 13.6 0.7 16.8
Zone-2 Bundelkhand Zone 2.38 11.9 1.88 11.8 0.4 11.3
Zone-3 Central Zone 40.91 10.0 34.07 5.6 2.1 6.9
Zone-4 Eastern Plain Zone 5.60 7.4 2.87 5.0 1.0 3.7
Zone-5 Mid-Western Plain Zone 4.13 9.4 3.56 6.0 1.6 1.8
Zone-6 North-Eastern Plain Zone 3.71 3.3 2.40 0.8 1.0 2.0
Zone-7 South-West Semi Arid Zone 36.64 8.2 52.23 5.6 4.1 5.1
Zone-8 Vindhya Area 1.93 18.1 0.51 16.7 0.5 18.1
Zone-9 Western Plain Zone 2.30 14.7 1.33 12.1 0.3 9.8
Uttar Pradesh 100.0 11.8 100.0 8.6 1.3 8.4
Source: Horticulture and Food Processing Department, UP Govt., UP Udhyan Bhawan, 2-Sapru Marg,
Lucknow&http://nhb.gov.in/Statistics.aspx?enc=K1SxiJnLqCTqPmc6tzC6mBuHmjyjK79Diz12BGKh5acu41PoHDv5hOak
PtQZEaGJBUhkPLH24/5uwVKWN0rSKg==
Table 2.18 explains the APY of all spices crops in agro climatic zones which explains that
according to the area under triennium estimate 2018 shows that major chunk of share in area
is claimed by zone-3 central zone (40.91percent) and zone-7 South West semi-Arid zone
(36.64percent) where as growth rate 2014-18 (area) is highest in zone-1 Bhabhar and Terai
zone (23.6percent) followed by zone-8 Vindhya Zone (18.1percent). Further, the table
explains the TE-2018 (Production) of all spices crops which indicate the highest production
share of zone-7 i.e. South west semi- Arid zone (52.23percent) followed by zone-3 central
zone (34.07percent). The Highest growth rate in production (2014-18) is reported in zone-1
Bhabhar and Terai Zone (13.6percent) followed by zone-9 Western Plain zone (12.1percent).
The Productivity (TE-2018) is found highest in zone-7 South West Semi Arid zone
(4.1percent). Growth rate in productivity 2014-18 has been highest in zone-8 Vindhya zone
(18.1percent) followed by zone-1 Bhabhar and Terai Zone (16.8percent). The growth rate is
lowest in zone-5 Mid Western Main zone (1.8percent) as against state‟s average of
8.4percent.

34
IX: ZONAL DISTRICT WISE APY OF VARIOUS CROPS FOR U.P.
Table 2.19: District wise percent Share and CAGR of APY of Various Horticulture
Crops for Uttar Pradesh in Zone -1 Bhabhar and Terai Zone during 2013-14 to 2017-18
Districts
Total Horticulture
Area Production Productivity in MT Per
Ha
TE 2018
Growth
rate 2014-
18
TE 2018
Growth
rate 2014-
18
TE 2018
Growth
rate 2014-
18
Bijnor 20.90 2.5 20.49 4.6 22.57 2.1
Moradabad 32.25 8.9 29.93 7.7 21.39 -1.1
Pilibhit 14.40 5.1 16.39 7.9 26.19 2.6
Rampur 32.46 4.2 33.19 6.1 23.53 1.8
Zone -1 Bhabhar and
Terai Zone 100.00 5.2 100.00 6.5 23.4 1.3
Total Fruits
Bijnor 34.70 1.8 31.50 2.9 20.31 1.0
Moradabad 25.99 2.6 24.46 4.0 21.06 1.4
Pilibhit 12.65 8.4 16.83 13.1 29.78 4.4
Rampur 26.66 3.3 27.20 5.0 22.83 1.6
Zone -1 Bhabhar and
Terai Zone 100.00 4.0 100.00 6.2 23.5 2.1
Total Vegetables
Bijnor 12.69 3.7 13.69 7.2 26.93 3.4
Moradabad 34.08 11.1 33.31 9.5 24.52 -1.4
Pilibhit 16.10 2.9 16.10 4.9 24.96 1.9
Rampur 37.13 4.4 36.90 6.6 24.80 2.1
Zone -1 Bhabhar and
Terai Zone 100.00 5.5 100.00 7.1 25.3 1.5
Total Spices
Bijnor 0.53 16.6 0.27 4.1 0.80 -10.7
Moradabad 68.44 24.2 37.85 21.4 1.29 24.2
Pilibhit 7.47 42.8 17.87 25.8 0.14 42.8
Rampur 23.57 10.8 44.01 3.0 0.45 10.8
Zone -1 Bhabhar and
Terai Zone 100.00 23.6 100.00 13.6 0.7 16.8
Source: Horticulture and Food Processing Department, UP Govt., UP Udhyan Bhawan, 2-Sapru Marg, Lucknow.
The table 2.19 explains the districts wise percent share and growth rate of APY of various
horticulture crops for U.P in zone 1-Bhabhar and Terai zone. It explains the area, production
and productivity of total horticulture crops in districts of zone 1 .It shows that Rampur and
Moradabad claimed more than 64percent area of total horticulture((total area under TE-2018
in zone 1). The growth rate in area is found to be highest in Moradabad (8.9percent). TE 2018
(Production) indicates that Rampur is a major contributor (33.19percent) followed by
Moradabad (29.93percent). The Growth rate of production is most significant in Pilibhit
(7.9percent) followed by Moradabad (7.7percent). TE-2018 (Productivity) shows Pilibhit

35
(26.19percent) as the major contributor of productivity in the zone 1 while the growth rate
during 2014-18 recorded a negative growth rate of -1.1percent in Moradabad.
The table also explains the District wise percent Share and CAGR of APY of All Fruit,
vegetables and total spices Crops for Uttar Pradesh in Zone-1 during 2013-14 to 2017-18.It
was found that Bijnor claimed highest (34.70percent) share while Pilibhit claimed highest
growth rate of 8.4percent in area under total fruits. Pilibhit claimed highest (31.50percent)
share in production while growth rate is highest (13.1percent) during 2014-18. The
productivity (TE-2018) and growth rate during 2014-18 has been highest in Pilibhit.
TE 2018 (area) and growth rate (2014-18) is found to be highest in Moradabad (34.8percent
and 11.1percent respectively) under total vegetables. TE-2018 (Production) is highest in
Rampur (36.9percent) while growth rate 2014-18 is found to be highest in Moradabad
(9.5percent). TE 2018 (Production) and productivity per hectare is found to be highest in
Bijnor which is 26.93percent and 3.4percent respectively.
TE-2018 (area) has been found to be highest in Moradabad (68.44percent) under total spices
crops while growth rate 2014-18 has been highest in Pilibhit with 42.8percent. TE 2018
(Production) is found to be highest in Rampur (44.01percent) while growth rate (2014-2018)
was highest in Pilibhit (25.8percent). TE-2018 (productivity MT per hectare) for total spices
in zone 1 districts was recorded highest in Moradabad (1.29) and growth rate is found to be
highest in Pilibhit (42.8percent) where Bijnor reported a negative growth rate in productivity
(-10.7percent).
Table 2.20: District wise percent Share and CAGR of APY of Various Horticulture
Crops for Uttar Pradesh in Zone-2 Bundelkhand Zone during 2013-14 to 2017-18
Districts
Total Horticulture
Area Production Productivity in MT Per Ha
TE 2018 Growth rate
2014-18 TE 2018
Growth rate
2014-18 TE 2018
Growth rate
2014-18
Banda 2.52 5.1 3.49 7.6 20.56 2.4
Chitrakoot 1.94 9.2 2.71 11.1 20.70 1.7
Hamirpur 5.25 6.8 5.47 8.3 15.45 1.4
Jalaun 35.21 5.0 35.70 7.1 15.04 2.0
Jhansi 22.70 5.0 23.36 7.2 15.24 2.1
Lalitpur 22.62 4.6 21.43 6.2 14.05 1.6
Mahoba 9.75 4.5 7.85 5.6 11.93 1.1
Zone-2 Bundelkhand
Zone 100.00 5.7 100.00 7.6 16.1 1.7
Total Fruits
Banda 14.49 3.2 13.57 4.8 13.69 1.5
Chitrakoot 16.05 3.4 9.99 3.7 9.11 0.3
Hamirpur 8.16 3.2 6.42 3.8 11.50 0.6
Jalaun 5.95 11.8 8.18 28.1 20.10 14.5
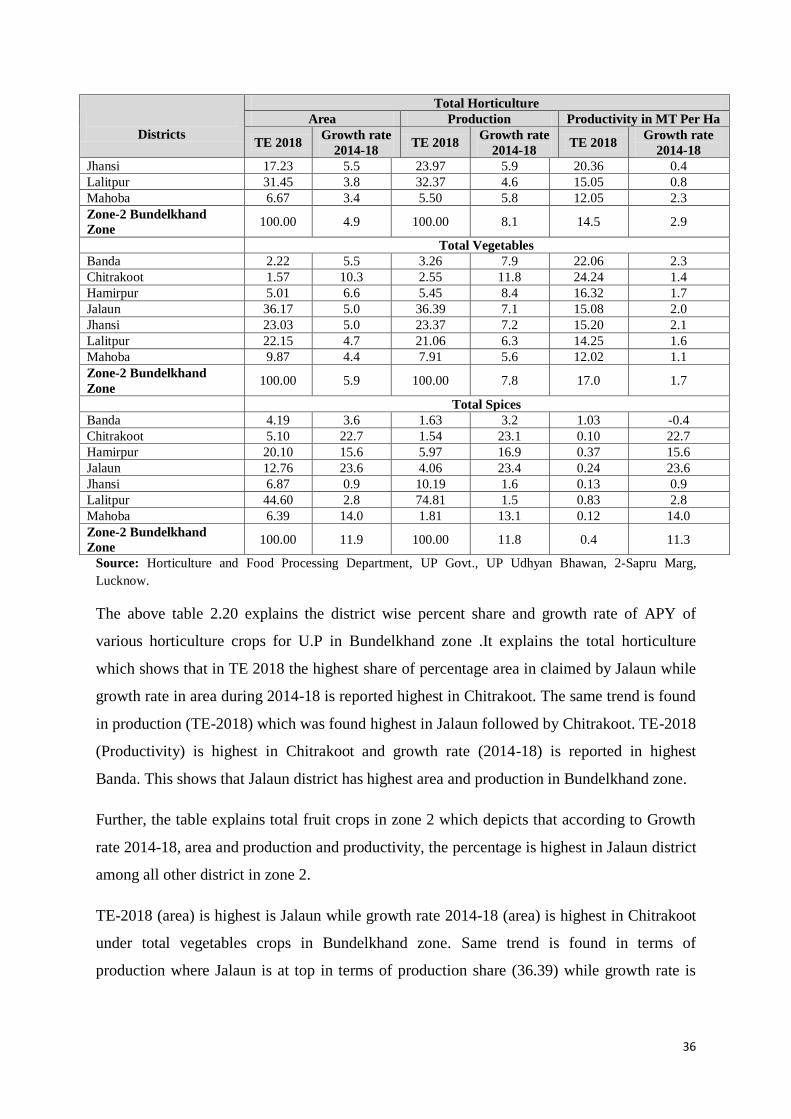
36
Districts
Total Horticulture
Area Production Productivity in MT Per Ha
TE 2018 Growth rate
2014-18 TE 2018
Growth rate
2014-18 TE 2018
Growth rate
2014-18
Jhansi 17.23 5.5 23.97 5.9 20.36 0.4
Lalitpur 31.45 3.8 32.37 4.6 15.05 0.8
Mahoba 6.67 3.4 5.50 5.8 12.05 2.3
Zone-2 Bundelkhand
Zone 100.00 4.9 100.00 8.1 14.5 2.9
Total Vegetables
Banda 2.22 5.5 3.26 7.9 22.06 2.3
Chitrakoot 1.57 10.3 2.55 11.8 24.24 1.4
Hamirpur 5.01 6.6 5.45 8.4 16.32 1.7
Jalaun 36.17 5.0 36.39 7.1 15.08 2.0
Jhansi 23.03 5.0 23.37 7.2 15.20 2.1
Lalitpur 22.15 4.7 21.06 6.3 14.25 1.6
Mahoba 9.87 4.4 7.91 5.6 12.02 1.1
Zone-2 Bundelkhand
Zone 100.00 5.9 100.00 7.8 17.0 1.7
Total Spices
Banda 4.19 3.6 1.63 3.2 1.03 -0.4
Chitrakoot 5.10 22.7 1.54 23.1 0.10 22.7
Hamirpur 20.10 15.6 5.97 16.9 0.37 15.6
Jalaun 12.76 23.6 4.06 23.4 0.24 23.6
Jhansi 6.87 0.9 10.19 1.6 0.13 0.9
Lalitpur 44.60 2.8 74.81 1.5 0.83 2.8
Mahoba 6.39 14.0 1.81 13.1 0.12 14.0
Zone-2 Bundelkhand
Zone 100.00 11.9 100.00 11.8 0.4 11.3
Source: Horticulture and Food Processing Department, UP Govt., UP Udhyan Bhawan, 2-Sapru Marg,
Lucknow.
The above table 2.20 explains the district wise percent share and growth rate of APY of
various horticulture crops for U.P in Bundelkhand zone .It explains the total horticulture
which shows that in TE 2018 the highest share of percentage area in claimed by Jalaun while
growth rate in area during 2014-18 is reported highest in Chitrakoot. The same trend is found
in production (TE-2018) which was found highest in Jalaun followed by Chitrakoot. TE-2018
(Productivity) is highest in Chitrakoot and growth rate (2014-18) is reported in highest
Banda. This shows that Jalaun district has highest area and production in Bundelkhand zone.
Further, the table explains total fruit crops in zone 2 which depicts that according to Growth
rate 2014-18, area and production and productivity, the percentage is highest in Jalaun district
among all other district in zone 2.
TE-2018 (area) is highest is Jalaun while growth rate 2014-18 (area) is highest in Chitrakoot
under total vegetables crops in Bundelkhand zone. Same trend is found in terms of
production where Jalaun is at top in terms of production share (36.39) while growth rate is

37
highest in Chitrakoot (11.1percent). In terms of productivity Chitrakoot tops the zone while
Jhansi led the way in growth rate (2.1percent).
Further the table depicts that Lalitpur reported highest percent (44.60percent) of area while
Jalaun (23.6percent) claimed highest rate of growth in the zone. Production wise Lalitpur
(74.81percent) recorded highest percentage while Jalaun (23.4percent) led the way in terms
of growth. Productivity per hectare) is highest in Lalitpur (0.83percent) and productivity
growth was most significant in Chitrakoot. Hence, the above table explains that Jalaun
district led the way in all aspects of various horticulture crops.
Table 2.21: District wise percent Share and CAGR of APY of All Horticulture Crops
for Uttar Pradesh in Zone-3 Central Zone during 2013-14 to 2017-18
Districts
Total Horticulture
Area Production Productivity in MT Per
Ha
TE 2018 Growth rate
2014-18 TE 2018
Growth rate
2014-18 TE 2018
Growth rate
2014-18
Allahabad 5.70 3.6 4.89 16.5 18.18 12.5
Amethi 3.38 4.3 3.12 8.5 19.58 3.9
Auraiya 2.18 3.3 2.18 3.8 21.19 0.5
Etawah 4.94 3.2 5.15 7.6 22.14 4.2
Farrukhabad 11.06 3.3 13.19 6.9 25.33 3.6
Fatehpur 7.48 13.0 7.19 13.1 20.48 0.1
Hardoi 5.69 6.0 5.64 10.5 21.01 4.2
Kannauj 12.34 3.2 14.26 9.0 24.54 5.7
Kanpur Dehat 2.33 5.9 2.15 9.1 19.61 3.1
Kanpur Nagar 6.26 9.2 5.42 17.9 18.30 7.9
Kaushambi 3.82 10.0 4.83 16.6 26.86 6.0
Kheri 2.66 9.0 2.90 11.2 23.17 2.0
Lucknow 9.06 4.6 9.07 8.1 21.26 3.4
Pratapgarh 5.80 2.5 3.70 7.2 13.56 4.6
Rae Bareli 2.83 7.0 2.63 18.3 19.69 10.5
Sitapur 5.47 3.9 4.07 7.6 15.79 3.6
Unnao 8.98 6.2 9.62 9.0 22.73 2.6
Zone-3 Central Zone 100.00 5.8 100.00 10.6 20.8 4.6
Source: Horticulture and Food Processing Department, UP Govt., UP Udhyan Bhawan, 2-Sapru Marg,
Lucknow
The above table 2.21 explains the percent share and growth rate of APY of total horticulture
crops in Central zone. It exhibits that the percentage area (TE-2018) is highest in Kannauj
(12.34percent) followed by Farukhabad (11.06percent) while Fatehpur ranked first and
Kaushambi second in terms of growth in area (2014-18). Percent wise production (TE-2018)
is highest in Kannauj (14.26percent) and growth rate (2014-18) in production is significantly
higher in Raebareli (18.3percent), Kanpur Nagar (17.9), Kaushambi (16.6percent) and
Allahabad (16.5) than the State average of 10.6percent. The productivity per hectare (TE-
2018) is significantly higher in Kaushambi (20.8percent), Farukhabad (25.33percent),

38
Kaunnaj (24.54percent) and Kheri (23.17) than state average (20.8percent). The growth rate
in productivity has been very impressive in Allahabad (12.5percent), Raebareli, Kanpur
Nagar (7.9percent) and Kaushambi (6percent). Thus, area, production and its productivity of
total horticulture crops in zone 3, Central Zone is better.
Table 2.22: District wise percent Share and CAGR of APY of All Fruit Crops for Uttar
Pradesh in Zone-3 Central Zone during 2013-14 to 2017-18
Districts
Total Fruit Crops
Area Production Productivity in MT Per
Ha
TE 2018 Growth rate
2014-18 TE 2018
Growth rate
2014-18 TE 2018
Growth rate
2014-18
Allahabad 3.63 3.9 2.84 6.7 17.13 2.7
Amethi 3.01 2.1 2.41 3.3 17.52 1.2
Auraiya 0.35 3.6 0.39 3.9 24.48 0.3
Etawah 0.59 4.5 0.81 4.7 29.87 0.2
Farrukhabad 6.03 4.5 7.24 6.0 26.27 1.4
Fatehpur 6.60 13.7 11.90 16.9 39.46 2.8
Hardoi 4.67 2.4 4.00 3.9 18.76 1.5
Kannauj 1.43 4.8 2.01 5.3 30.63 0.5
Kanpur Dehat 0.53 6.5 0.59 8.0 24.32 1.4
Kanpur Nagar 2.27 3.6 2.38 4.1 22.86 0.5
Kaushambi 7.40 12.0 11.89 16.3 35.14 3.9
Kheri 4.25 5.5 5.00 9.8 25.72 4.0
Lucknow 20.91 2.3 20.11 4.1 21.03 1.7
Pratapgarh 12.35 2.2 6.41 2.5 11.34 0.3
Rae Bareli 0.85 10.7 1.19 15.5 30.50 4.4
Sitapur 11.59 2.2 6.94 4.6 13.09 2.3
Unnao 13.56 2.4 13.90 3.7 22.40 1.3
Zone-3 Central Zone 100.00 5.1 100.00 7.0 24.1 1.8
Source: Horticulture and Food Processing Department, UP Govt., UP Udhyan Bhawan, 2-Sapru Marg,
Lucknow
The above table 2.22 indicates that Lucknow (20.91percent) has a highest percentage area
(TE-2018) followed by Unnao (13.56). The highest growth rate in area (2014-18) is seen in
Fatehpur (13.7percent) followed by Kaushambi (12.0percent). The highest production share
(TE-2018) is claimed by Lucknow (22.11percent) while growth rate in production (2014-18)
is highest in Fatehpur (16.9percent) followed by Kaushambi (16.3percent) and Raebareli
(15.5percent). Productivity per hectare (TE 2018) is very significant in Fatehpur
(39.46percent), Kaushami (35.14), Kannuj (30.63percent) and Rae Bareli (30.50percent). Rae

39
Bareli (4.4percent) and Kheri performed extremely well in terms of growthrate in
productivity during 2014-18.
Table 2.23: District wise percent Share and CAGR of APY of All Vegetable Crops for
Uttar Pradesh in Zone-3 Central Zone during 2013-14 to 2017-18
Districts
Total Vegetable Crops
Area Production Productivity in MT Per
Ha
TE 2018
Growth
rate 2014-
18
TE 2018
Growth
rate 2014-
18
TE 2018
Growth
rate 2014-
18
Allahabad 7.07 3.3 5.81 18.8 18.62 15.0
Amethi 3.80 5.1 3.45 10.2 20.56 4.9
Auraiya 2.29 4.2 2.74 4.1 27.15 -0.1
Etawah 5.98 3.6 6.72 8.1 25.50 4.3
Farrukhabad 13.78 3.0 15.77 7.2 25.96 4.0
Fatehpur 6.49 12.0 5.13 10.1 18.09 -1.7
Hardoi 6.27 6.8 6.37 12.4 22.99 5.3
Kannauj 17.76 3.1 19.52 9.3 24.92 5.9
Kanpur Dehat 2.81 6.2 2.82 9.3 22.76 2.9
Kanpur Nagar 7.58 8.9 6.74 20.4 20.01 10.6
Kaushambi 2.32 6.8 1.87 17.3 18.14 9.9
Kheri 1.92 11.9 2.02 12.7 23.95 0.7
Lucknow 4.54 9.7 4.46 17.3 22.16 6.9
Pratapgarh 3.42 2.9 2.58 12.8 17.14 9.6
Rae Bareli 3.55 6.2 3.25 18.8 20.66 11.9
Sitapur 3.08 6.9 2.88 10.9 21.18 3.8
Unnao 7.34 9.2 7.88 13.5 24.33 4.0
Zone-3 Central Zone 100.00 6.5 100.00 12.5 22.0 5.8
Source: Horticulture and Food Processing Department, UP Govt., UP Udhyan Bhawan, 2-Sapru Marg,
Lucknow
The above table 2.23 explains that Kannauj (17.76percent) and Farukhabad (13.78percent)
shared the major chunk in percentage area (TE 2018) in zone 3 while in terms of growth rate
in area (2014-18), Fatehpur (12.0percent) and Kheri (11.19percent) did extremely well.
Further, Kannauj (19.52percent) followed by Farukhabad commanded the higher percentage
in its production (TE-2018). Production growth rate (2014-18) is highest in Kanpur Nagar
(20.4percent) followed by Allahabad (18.8percent) and Rae Bareli (18.8percent).
Productivity per hectare TE-2018 is seen highest in Allahabad followed by Rae Bareli
(11.9percent) and Kanpur Nagar (10.6percent). The overall percentage area of total vegetable
crops is 6.5percent and the growth rate of production is 12.5percent.
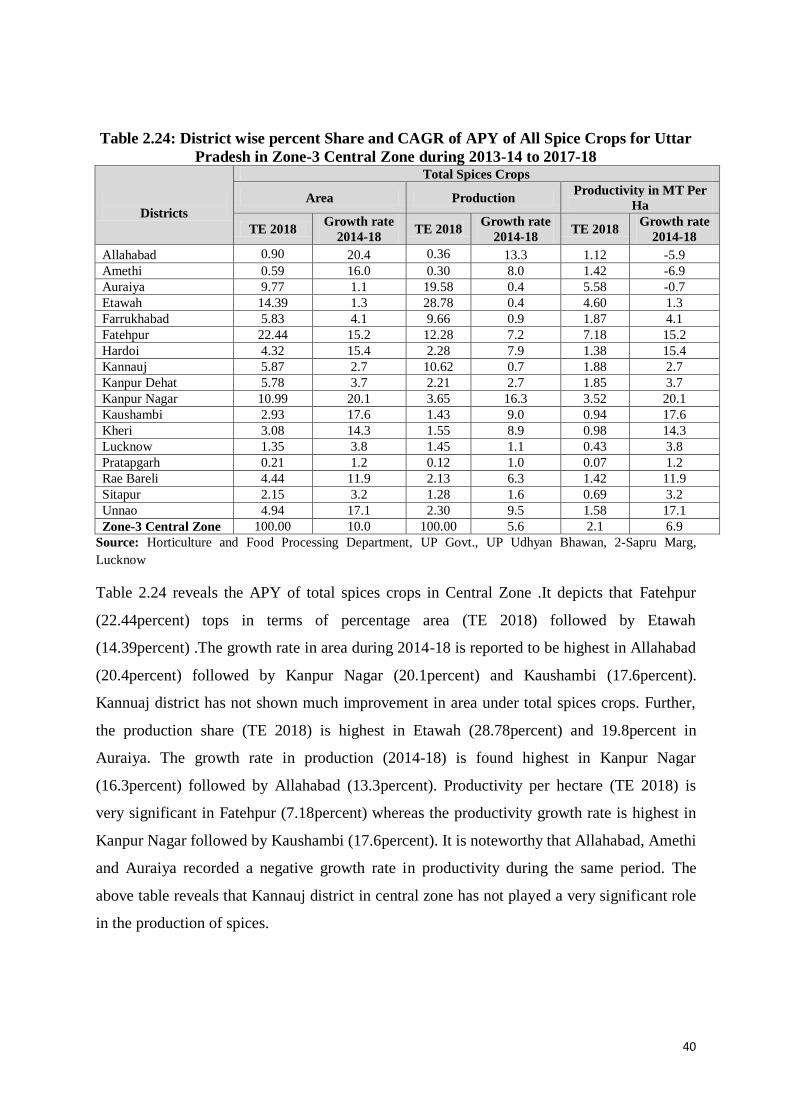
40
Table 2.24: District wise percent Share and CAGR of APY of All Spice Crops for Uttar
Pradesh in Zone-3 Central Zone during 2013-14 to 2017-18
Districts
Total Spices Crops
Area Production Productivity in MT Per
Ha
TE 2018 Growth rate
2014-18 TE 2018
Growth rate
2014-18 TE 2018
Growth rate
2014-18
Allahabad 0.90 20.4 0.36 13.3 1.12 -5.9
Amethi 0.59 16.0 0.30 8.0 1.42 -6.9
Auraiya 9.77 1.1 19.58 0.4 5.58 -0.7
Etawah 14.39 1.3 28.78 0.4 4.60 1.3
Farrukhabad 5.83 4.1 9.66 0.9 1.87 4.1
Fatehpur 22.44 15.2 12.28 7.2 7.18 15.2
Hardoi 4.32 15.4 2.28 7.9 1.38 15.4
Kannauj 5.87 2.7 10.62 0.7 1.88 2.7
Kanpur Dehat 5.78 3.7 2.21 2.7 1.85 3.7
Kanpur Nagar 10.99 20.1 3.65 16.3 3.52 20.1
Kaushambi 2.93 17.6 1.43 9.0 0.94 17.6
Kheri 3.08 14.3 1.55 8.9 0.98 14.3
Lucknow 1.35 3.8 1.45 1.1 0.43 3.8
Pratapgarh 0.21 1.2 0.12 1.0 0.07 1.2
Rae Bareli 4.44 11.9 2.13 6.3 1.42 11.9
Sitapur 2.15 3.2 1.28 1.6 0.69 3.2
Unnao 4.94 17.1 2.30 9.5 1.58 17.1
Zone-3 Central Zone 100.00 10.0 100.00 5.6 2.1 6.9
Source: Horticulture and Food Processing Department, UP Govt., UP Udhyan Bhawan, 2-Sapru Marg,
Lucknow
Table 2.24 reveals the APY of total spices crops in Central Zone .It depicts that Fatehpur
(22.44percent) tops in terms of percentage area (TE 2018) followed by Etawah
(14.39percent) .The growth rate in area during 2014-18 is reported to be highest in Allahabad
(20.4percent) followed by Kanpur Nagar (20.1percent) and Kaushambi (17.6percent).
Kannuaj district has not shown much improvement in area under total spices crops. Further,
the production share (TE 2018) is highest in Etawah (28.78percent) and 19.8percent in
Auraiya. The growth rate in production (2014-18) is found highest in Kanpur Nagar
(16.3percent) followed by Allahabad (13.3percent). Productivity per hectare (TE 2018) is
very significant in Fatehpur (7.18percent) whereas the productivity growth rate is highest in
Kanpur Nagar followed by Kaushambi (17.6percent). It is noteworthy that Allahabad, Amethi
and Auraiya recorded a negative growth rate in productivity during the same period. The
above table reveals that Kannauj district in central zone has not played a very significant role
in the production of spices.

41
Table 2.25: District wise percent Share and CAGR of APY of All Horticulture Crops
for Uttar Pradesh in Zone-4 Eastern Plain Zone during 2013-14 to 2017-18
Districts
Total Horticulture
Area Production Productivity in MT Per
Ha
TE 2018 Growth rate
2014-18 TE 2018
Growth rate
2014-18 TE 2018
Growth rate
2014-18
Ambedkar Nagar 9.18 4.1 9.26 8.7 19.58 4.4
Azamgarh 8.55 3.3 6.59 15.8 14.95 12.0
Ballia 10.94 3.9 9.74 17.3 17.25 12.9
Barabanki 15.09 4.6 15.25 9.0 19.61 4.2
Chandauli 1.48 3.7 1.72 7.8 22.56 3.9
Faizabad 11.50 6.8 13.52 11.3 22.81 4.3
Ghazipur 10.56 4.6 11.85 8.6 21.77 3.8
Jaunpur 10.34 3.3 10.24 19.9 19.19 16.0
Mau 2.05 3.9 1.69 15.7 16.03 11.4
Sultanpur 13.80 3.2 13.01 6.7 18.30 3.4
Varanasi 6.51 8.3 7.15 8.8 21.33 0.5
Zone-4 Eastern Plain
Zone 100.00 4.5 100.00 11.8 19.4 7.0
Source: Horticulture and Food Processing Department, UP Govt., UP Udhyan Bhawan, 2-Sapru Marg,
Lucknow
Above table 2.25 explains the district wise percent share and CAGR of APY of all
horticulture crops in Eastern Plain Zone where it is clear from the table cited that highest
percentage share of area (TE 2018) of all horticulture crops is highest in Barabanki followed
by Sultanpur while the highest growth rate in area is found in Varanasi. Production share (TE
2018) is most significant in Barabanki followed by Faizabad (13.52percent) and Sultanpur
(13.01percent). Growth rate in production (2014-18) is highest in Jaunpur and 17.3percent in
Ballia. Productivity per hectare 2014-18 is higher in Faizabad (22.81percent), Chandauli
(22.56percent), Ghazipur (21.77percent), Ambedkar Nagar (19.58percent), Barabanki
(19.6percent) and Jaunpur (19.19percent) than zone average of 19.4. Growth rate in
productivity (2014-18) is most significant in Jaunpur (11.4percent).

42
Table 2.26: District wise percent Share and CAGR of APY of All Fruit Crops for Uttar
Pradesh in Zone-4 Eastern Plain Zone during 2013-14 to 2017-18
Districts
Total Fruit Crops
Area Production Productivity in MT Per
Ha
TE 2018 Growth rate
2014-18 TE 2018
Growth rate
2014-18 TE 2018
Growth rate
2014-18
Ambedkar Nagar 11.23 2.0 10.97 3.4 17.33 1.4
Azamgarh 6.50 2.5 4.94 3.7 13.47 1.2
Ballia 11.58 3.1 11.16 5.4 17.11 2.3
Barabanki 11.17 3.1 10.95 6.1 17.40 3.0
Chandauli 0.40 2.9 0.35 3.9 15.30 0.9
Faizabad 17.93 2.8 22.04 4.7 21.83 1.9
Ghazipur 6.64 2.3 6.26 3.4 16.72 1.1
Jaunpur 5.94 2.1 5.52 3.5 16.49 1.3
Mau 1.26 3.0 1.15 5.7 16.24 2.6
Sultanpur 22.12 2.3 20.09 4.0 16.12 1.7
Varanasi 5.22 10.1 6.57 23.1 22.33 11.8
Zone-4 Eastern Plain
Zone 100.00 3.3 100.00 6.1 17.3 2.7
Source: Horticulture and Food Processing Department, UP Govt., UP Udhyan Bhawan, 2-Sapru Marg,
Lucknow
The above table 2.26 explains the percentage share in area (TE 2018) which is most
convincing in Sultanpur (22.12percent) and Faizabad (17.93percent) while Varanasi has done
extremely well in terms of growth in area during 2014-18 in all total fruit crops in Eastern
Plain Zone. This reveals that Sultanpur has abundant area for fruit crops. Further, production
(TE 2018) is highest in Faizabad (22.04percent) followed by Sultanpur (20.9percent) while
Varanasi (23.01percent) led the way in terms of growth rate during 2004-18. The productivity
per hectare is found to be higher in Faizabad, Barabanki and Ambedkar than the total zone
average. Sultanpur has 16.12percent productivity than the total zone average productivity.
The growth rate in productivity is highest in Varanasi (11.8percent) during 2014-18.
Table 2.27: District wise percent Share and CAGR of APY of All Vegetable Crops for
Uttar Pradesh in Zone-4 Eastern Plain Zone during 2013-14 to 2017-18
Districts
Total Vegetable Crops
Area Production Productivity in MT Per
Ha
TE 2018 Growth rate
2014-18 TE 2018
Growth rate
2014-18 TE 2018
Growth rate
2014-18
Ambedkar Nagar 8.56 5.0 8.76 10.8 20.99 5.5
Azamgarh 9.43 3.5 7.08 18.7 15.38 14.7
Ballia 10.80 4.0 9.32 22.4 17.66 17.7
Barabanki 15.67 4.7 16.43 9.6 21.50 4.7
Chandauli 1.89 3.8 2.12 8.0 23.08 4.1
Faizabad 9.52 9.7 11.04 15.9 23.76 5.6
Ghazipur 11.77 4.7 13.48 9.4 23.46 4.5
Jaunpur 12.09 3.5 11.63 22.8 19.68 18.6
Mau 2.36 4.1 1.85 17.8 16.05 13.2
Sultanpur 11.31 3.8 10.98 8.2 19.91 4.3
Varanasi 6.60 7.0 7.31 6.1 22.75 -0.9
Zone-4 Eastern Plain
Zone 100.00 4.9 100.00 13.6 20.4 8.4

43
Source: Horticulture and Food Processing Department, UP Govt., UP Udhyan Bhawan, 2-Sapru Marg,
Lucknow
The above table 2.27 reveals that area (TE-2018) is highest in Barabanki (15.67percent)
followed by Jaunpur (12.09percent) and Sultanpur. The growth rate in area under total
vegetable crops in Zone 4 is highest in Faizabad (9.7percent) followed by Varanasi (7percent)
and Ambedkar Nagar (5percent) during 2014-18. The production share (TE-2018) is highest
in Barabanki (16.43percent) while growth rate in production is highest in Jaunpur
(22.8percent) followed by Ballia (22.4percent) during 2004-18. The productivity per hectare
TE-2018 is almost same in three districts namely Faizabad (23.76), Ghazipur (23.46percent)
and Chandauli (23.08percent). The productivity growth rate is highest in Jaunpur
(18.6percent) followed by Ballia (17.7percent) but Varanasi reported a negative growth rate
(-0.9percent) during 2014-18. The productivity of Sultanpur district in selected zone has not
shown much improvement in total vegetable crops.
Table 2.28: District wise percent Share and CAGR of APY of All Spice Crops for Uttar
Pradesh in Zone-4 Eastern Plain Zone during 2013-14 to 2017-18
Districts
Total Spices Crops
Area Production Productivity in MT Per
Ha
TE 2018
Growth
rate 2014-
18
TE 2018
Growth
rate 2014-
18
TE 2018
Growth
rate 2014-
18
Ambedkar Nagar 6.98 4.2 9.27 1.7 2.28 -2.4
Azamgarh 2.40 2.3 3.43 1.4 2.45 -0.9
Ballia 8.55 11.2 11.04 3.7 2.21 -6.8
Barabanki 39.44 8.5 41.39 3.8 1.80 -4.3
Chandauli 0.00 0.00 0.00 0.00 0.00 0.00
Faizabad 5.62 1.4 13.44 0.4 0.25 1.4
Ghazipur 13.66 22.8 7.75 16.9 0.60 22.8
Jaunpur 1.25 0.9 1.36 0.8 0.06 0.9
Mau 0.30 0.0 0.16 0.0 0.01 0.0
Sultanpur 4.12 6.6 3.61 3.1 0.18 6.6
Varanasi 17.69 23.7 8.56 22.8 0.78 23.7
Zone-4 Eastern Plain
Zone 100.00 7.4 100.00 5.0 1.0 3.7
Source: Horticulture and Food Processing Department, UP Govt., UP Udhyan Bhawan, 2-Sapru Marg,
Lucknow
As is evident from the table 2.28 that the percentage area (TE 2018) is highest in Barabanki
(39.44percent) followed by Varanasi (17.69percent) while growth rate in area (2014-18) is
highest in Varanasi (23.7percent) followed by Ghazipur (22.8percent) with a growth rate of
7.4percent of total spices crops area in Eastern Plain Zone . Similar trend has been found in
production share (TE 2018) which is highest for Barabanki (41.39percent) while the growth
rate (2014-18) is highest in Varanasi (22.8percent). The productivity per hectare (TE 2018) is

44
highest in Azamgarh (2.45percent) followed by Ambedkar Nagar (2.28percent). Productivity
Growth rate (2014-18) is highest in Varanasi (23.7percent) followed by Ghazipur
(22.8percent).It is to be noted that Ambedkar Nagar, Azamgarh, Ballia and Azamgarh
recorded negative growth rate in productivity during the same period. The overall
productivity of total spices crops in eastern plain zone is just 3.7percent from an area of
7.4percent in the state.
Table 2.29: District wise percent Share and CAGR of APY of Various Horticulture
Crops for Uttar Pradesh in Zone-5 Mid-Western Plain Zone during 2013-14 to 2017-18
Districts
Total Horticulture
Area Production Productivity in MT Per
Ha
TE 2018
Growth
rate 2014-
18
TE 2018
Growth
rate 2014-
18
TE 2018
Growth
rate 2014-
18
Amroha 17.83 6.4 17.12 5.8 21.34 -0.6
Bareilly 15.58 4.1 14.68 4.2 20.94 0.1
Budaun 31.12 3.6 30.07 7.8 21.46 4.1
Sambhal 13.91 5.0 13.75 12.0 21.88 6.7
Shahjahanpur 21.56 4.0 24.38 -1.0 25.20 -4.8
Zone-5 Mid-Western
Plain Zone 100.00 4.6 100.00 5.8 22.2 1.1
Total Fruits
Amroha 36.75 1.9 39.18 3.0 21.67 1.0
Bareilly 18.96 2.5 17.38 3.5 18.63 1.0
Budaun 23.98 4.2 23.66 5.6 20.06 1.4
Sambhal 9.96 2.7 11.69 3.6 23.85 0.9
Shahjahanpur 10.34 2.2 8.10 3.1 15.93 1.0
Zone-5 Mid-Western
Plain Zone 100.00 2.7 100.00 3.8 20.0 1.0
Total Vegetables
Amroha 12.30 11.5 11.07 8.9 21.19 -2.3
Bareilly 14.67 4.8 13.96 4.4 22.39 -0.3
Budaun 32.77 3.5 31.73 8.4 22.75 4.8
Sambhal 14.93 5.3 14.29 14.3 22.40 8.5
Shahjahanpur 25.33 4.2 28.96 -1.3 27.00 -5.3
Zone-5 Mid-Western
Plain Zone 100.00 5.9 100.00 7.0 23.1 1.1
Total Spices
Amroha 2.45 23.6 0.68 23.7 0.80 0.1
Bareilly 10.69 3.9 8.93 -0.1 2.41 -3.9
Badaun 48.94 3.2 58.40 -0.5 3.45 -3.6
Sambhal 20.92 10.6 21.62 4.0 0.68 10.6
Shahjahanpur 17.01 6.0 10.38 2.7 0.55 6.0
Zone-5 Mid-Western
Plain Zone 100.00 9.4 100.00 6.0 1.6 1.8
Source: Horticulture and Food Processing Department, UP Govt., UP Udyan Bhawan, 2-Sapru Marg, Lucknow.

45
The table 2.29 explains the district wise percent share and growth rate of various horticulture
crops in Mid-Western Plain Zone where firstly it indicate the total percentage of horticulture
crops area (TE 2018) which is found highest for Badaun (31.12percent) while growth rate
(2014-18) is above zone average in Amroha (6.4percent) and Sambhal (5.0percent). The
Production share (TE 2018) is found to be highest in Badaun. The growth rate (2014-18) is
highest in Sambhal. Productivity per hectare (TE-2018) is highest in Shahjahanpur
(25.20percent) while growth rate in productivity is highest in Sambhal (6.7percent) during
2014-18 for total horticulture crops in zone 5.
Further, it explains the Total Fruit crops in zone 5 where it was depicted that Amroha
(36.75percent) recorded highest share in area (TE 2018) while growth rate is found highest in
Badaun (4.2percent) during 2014-18 under total fruit crops. Shahjahanpur has shown much
improvement in production as percentage of fruit crop is very near to total fruit crop
production in Mid-Western Plain Zone zone.
In terms of production share (TE 2018) Amroha (39.18percent) topped the zone while
Badaun recorded highest rate of growth (5.6percent) during 2014-18. The productivity per
hectare (TE-2018) is found to be highest in Sambhal (23.85percent) while growth rate is
found highest in Badaun (1.4percent) during 2014-18.
Further, the figures given in table indicates that share of area (TE 2018) under total vegetable
crops is highest in Badaun (32.77percent) while growth rate in area is higher only in Amroha
(11.5percent) than zone average of 5.9percent during 2014-18. The production share (TE-
2018) is highest in Badaun (31.73percent) followed by Shahjahanpur (28.96percent). The
growth rate in production is highest in Sambhal (14.3percent) and negative in Shahjahanpur
(-1.3percent) which shows that production of vegetable crops in particular district has not
shown much improvement in the selected zone. The productivity growth rate is highest in
Sambhal (8.5percent) under total vegetable crops during 2014-18 while Amroha, Barelly and
Shahjahanpur recorded negative growth in productivity during the same period.
Further, the share of area (TE 2018) and production (TE 2018) of total spice crops in zone 5
is highest in Badaun (48.94percent and 58.40percent respectively) while growth rate in area
and production highest in Amroha during the same period. Productivity per hectare is highest
in Badaun (3.45percent) and growth rate (2014-18) is highest in Sambhal (10.6percent) where
Shahjahanpur shows highest percentage in spice crops (6.0percent) than overall total zonal
percentage of spice crops.
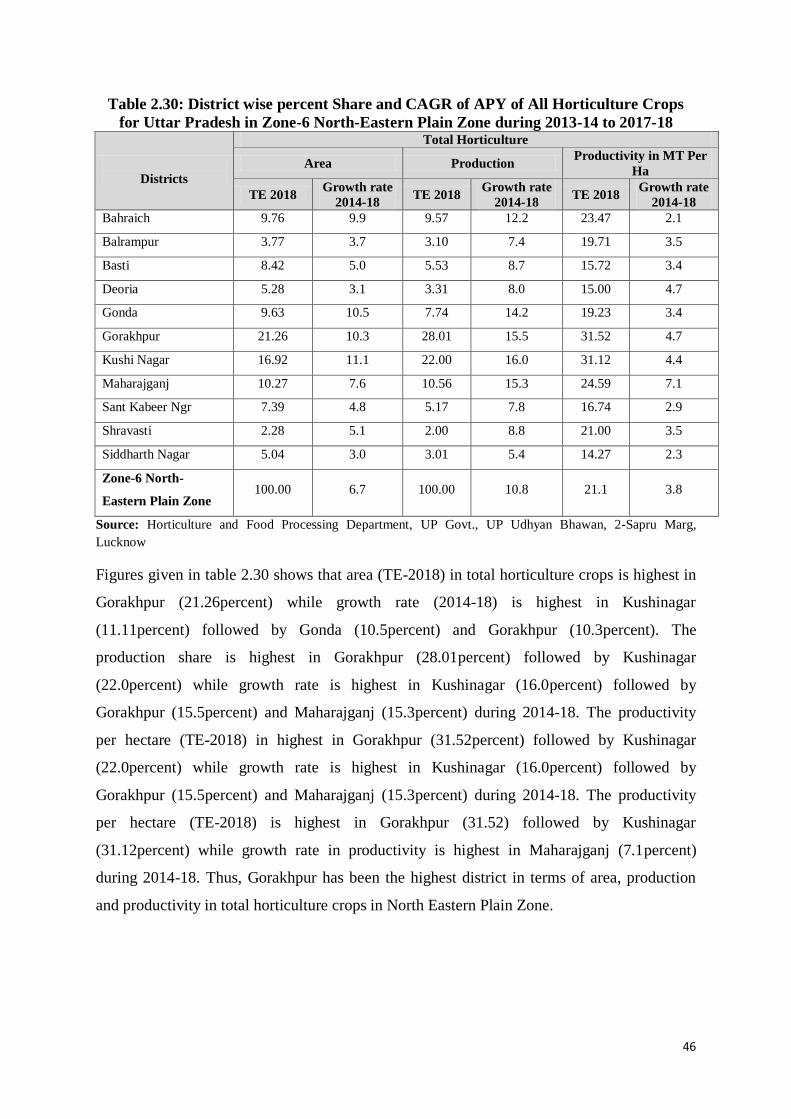
46
Table 2.30: District wise percent Share and CAGR of APY of All Horticulture Crops
for Uttar Pradesh in Zone-6 North-Eastern Plain Zone during 2013-14 to 2017-18
Districts
Total Horticulture
Area Production Productivity in MT Per
Ha
TE 2018 Growth rate
2014-18 TE 2018
Growth rate
2014-18 TE 2018
Growth rate
2014-18
Bahraich 9.76 9.9 9.57 12.2 23.47 2.1
Balrampur 3.77 3.7 3.10 7.4 19.71 3.5
Basti 8.42 5.0 5.53 8.7 15.72 3.4
Deoria 5.28 3.1 3.31 8.0 15.00 4.7
Gonda 9.63 10.5 7.74 14.2 19.23 3.4
Gorakhpur 21.26 10.3 28.01 15.5 31.52 4.7
Kushi Nagar 16.92 11.1 22.00 16.0 31.12 4.4
Maharajganj 10.27 7.6 10.56 15.3 24.59 7.1
Sant Kabeer Ngr 7.39 4.8 5.17 7.8 16.74 2.9
Shravasti 2.28 5.1 2.00 8.8 21.00 3.5
Siddharth Nagar 5.04 3.0 3.01 5.4 14.27 2.3
Zone-6 North-
Eastern Plain Zone 100.00 6.7 100.00 10.8 21.1 3.8
Source: Horticulture and Food Processing Department, UP Govt., UP Udhyan Bhawan, 2-Sapru Marg,
Lucknow
Figures given in table 2.30 shows that area (TE-2018) in total horticulture crops is highest in
Gorakhpur (21.26percent) while growth rate (2014-18) is highest in Kushinagar
(11.11percent) followed by Gonda (10.5percent) and Gorakhpur (10.3percent). The
production share is highest in Gorakhpur (28.01percent) followed by Kushinagar
(22.0percent) while growth rate is highest in Kushinagar (16.0percent) followed by
Gorakhpur (15.5percent) and Maharajganj (15.3percent) during 2014-18. The productivity
per hectare (TE-2018) in highest in Gorakhpur (31.52percent) followed by Kushinagar
(22.0percent) while growth rate is highest in Kushinagar (16.0percent) followed by
Gorakhpur (15.5percent) and Maharajganj (15.3percent) during 2014-18. The productivity
per hectare (TE-2018) is highest in Gorakhpur (31.52) followed by Kushinagar
(31.12percent) while growth rate in productivity is highest in Maharajganj (7.1percent)
during 2014-18. Thus, Gorakhpur has been the highest district in terms of area, production
and productivity in total horticulture crops in North Eastern Plain Zone.

47
Table 2.31: District wise percent Share and CAGR of APY of All Fruit Crops for Uttar
Pradesh in Zone-6 North-Eastern Plain Zone during 2013-14 to 2017-18
Districts
Total Fruit Crops
Area Production Productivity in MT Per
Ha
TE 2018 Growth rate
2014-18 TE 2018
Growth rate
2014-18 TE 2018
Growth rate
2014-18
Bahraich 7.92 8.3 8.34 12.3 30.74 3.7
Balrampur 2.72 3.8 1.94 7.1 20.84 3.2
Basti 6.28 2.5 3.18 4.1 14.79 1.6
Deoria 4.71 2.0 1.74 3.5 10.78 1.4
Gonda 2.99 2.4 1.54 4.6 14.99 2.1
Gorakhpur 28.28 13.3 35.52 17.0 36.65 3.2
Kushi Nagar 23.95 12.6 29.22 16.8 35.59 3.8
Maharajganj 11.76 9.5 11.28 15.7 27.98 5.6
Sant Kabir Nagar 6.42 4.2 4.37 8.1 19.85 3.8
Shravasti 1.89 3.5 1.30 7.0 20.09 3.3
Siddharth Nagar 3.09 2.2 1.58 4.0 14.94 1.8
Zone-6 North-
Eastern Plain Zone 100.00 5.9 100.00 9.1 22.5 3.0
Source: Horticulture and Food Processing Department, UP Govt., UP Udhyan Bhawan, 2-Sapru Marg,
Lucknow
Figures in table 2.31 indicates that percentage area (TE-2018) and growth rate (2014-18) is
most significant in Gorakhpur. Gorakhpur and Kushingar constitutes more than 64percent
share in production (TE-2018). The growth rate in production is also most significant in the
same two districts of the zone. Productivity per hectare (TE 2018) is seen most significant in
the same two districts of Gorakhpur and Kushinagar. The growth rate in productivity in
highest in Maharajganj (5.6percent) during 2014-18. This reveals that Gorakhpur district has
maximum area and production in total fruit crops in zone 6.
Table 2.32: District wise percent Share and CAGR of APY of All Vegetable Crops for
Uttar Pradesh in Zone-6 North-Eastern Plain Zone during 2013-14 to 2017-18
Districts
Total Vegetable Crops
Area Production Productivity in MT Per
Ha
TE 2018 Growth rate
2014-18 TE 2018
Growth rate
2014-18 TE 2018
Growth rate
2014-18
Bahraich 10.85 11.3 11.69 12.3 20.15 0.9
Balrampur 5.05 3.8 5.21 7.6 19.24 3.7
Basti 11.10 6.9 9.80 11.7 16.48 4.5
Deoria 6.14 4.2 6.17 10.5 18.77 6.1
Gonda 17.49 12.5 18.99 15.9 20.27 3.0

48
Districts
Total Vegetable Crops
Area Production Productivity in MT Per
Ha
TE 2018 Growth rate
2014-18 TE 2018
Growth rate
2014-18 TE 2018
Growth rate
2014-18
Gorakhpur 13.92 4.3 14.52 10.0 19.47 5.5
Kushi Nagar 8.32 8.2 8.87 12.0 19.93 3.5
Maharajganj 8.90 4.9 9.29 14.5 19.49 9.1
Sant Kabeer Ngr 8.43 4.9 6.63 7.5 14.68 2.5
Shravasti 2.77 6.5 3.27 10.2 22.06 3.5
Siddharth Nagar 7.03 3.5 5.56 6.1 14.77 2.5
Zone-6 North-
Eastern Plain Zone 100.00 6.4 100.00 10.7 18.7 4.1
Source: Horticulture and Food Processing Department, UP Govt., UP Udhyan Bhawan, 2-Sapru Marg,
Lucknow
The table 2.32 shows that percentage area (TE-2018) is highest in Gonda (17.49percent) and
growth rate in area (2014-18) is also highest in Gonda (12.5percent) followed by Gorakhpur
(13.92percent) in the zone. The position of production share (TE 2018) and growth rate
(2014-18) is again highest in Gonda (18.99percent and 15.9percent respectively). The
productivity per hectare (TE-2018) is highest in Shravasti (22.06percent) while growth rate is
highest in Maharajganj (9.1percent) during 2014-18. The growth rate productivity of total
vegetable crops in Gorakhpur is seen higher than the overall productivity in the zone.
Table 2.33: District wise percent Share and CAGR of APY of All Spice Crops for Uttar
Pradesh in Zone-6 North-Eastern Plain Zone during 2013-14 to 2017-18
Districts
Total Spices Crops
Area Production Productivity in MT Per
Ha
TE 2018 Growth rate
2014-18 TE 2018
Growth rate
2014-18 TE 2018
Growth rate
2014-18
Bahraich 36.69 9.5 33.11 3.0 1.95 -6.0
Balrampur 2.00 0.0 4.05 0.2 4.39 0.2
Basti 3.21 -0.1 4.41 0.3 2.98 0.4
Deoria 0.31 0.0 0.62 0.0 0.01 0.0
Gonda 5.45 2.1 7.28 0.6 0.16 2.1
Gorakhpur 0.34 -7.6 0.19 -16.6 0.01 -7.6
Kushi Nagar 28.29 1.4 35.77 1.5 0.82 1.4
Maharajganj 1.00 7.2 0.43 6.3 0.03 7.2
Sant Kabeer Ngr 9.61 17.2 4.84 12.8 0.28 17.2
Shravasti 1.28 5.9 1.08 0.7 0.04 5.9
Siddharth Nagar 11.83 1.1 8.21 0.5 0.34 1.1
Zone-6 North-
Eastern Plain Zone 100.00 3.3 100.00 0.8 1.0 2.0
Source: Horticulture and Food Processing Department, UP Govt., UP Udhyan Bhawan, 2-Sapru Marg,
Lucknow
Table 2.33 indicates that percentage area (TE 2018) is highest in Baharaich (36.69percent)
followed by Kushi Nagar (28.29percent). These two districts contribute more than 64percent
area under all spice crops in the zone. The growth rate in area is highest in Sant Kabirnagar
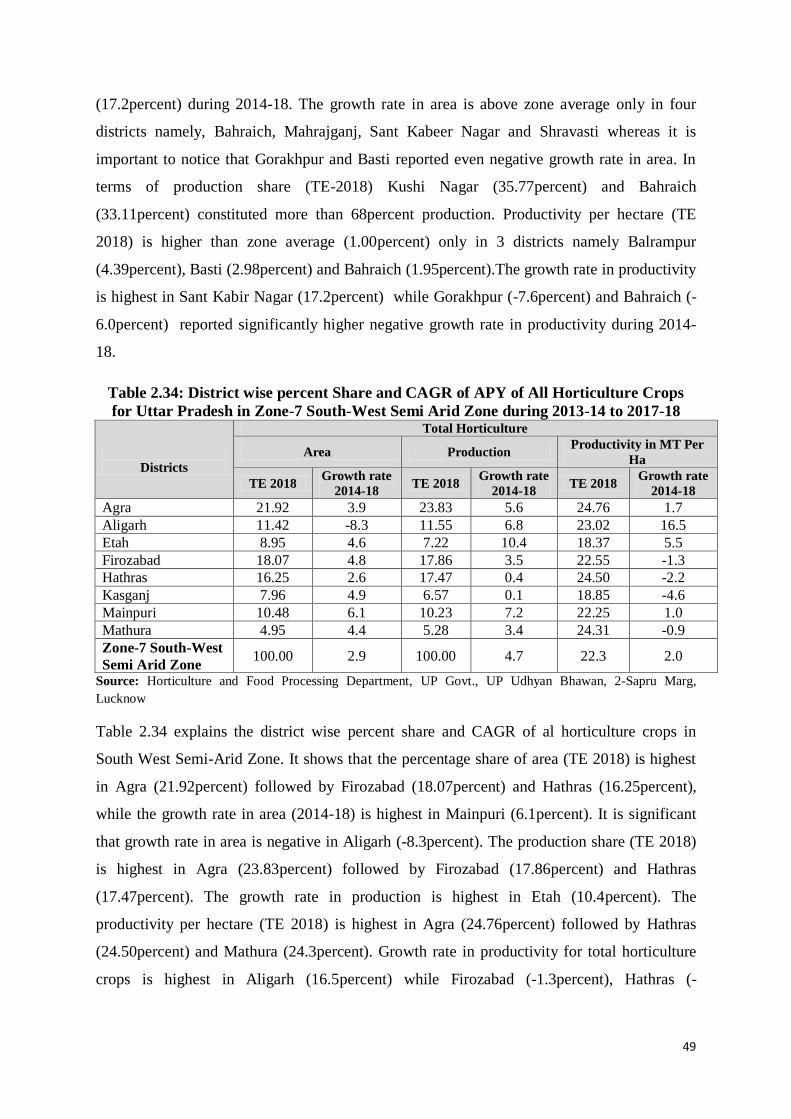
49
(17.2percent) during 2014-18. The growth rate in area is above zone average only in four
districts namely, Bahraich, Mahrajganj, Sant Kabeer Nagar and Shravasti whereas it is
important to notice that Gorakhpur and Basti reported even negative growth rate in area. In
terms of production share (TE-2018) Kushi Nagar (35.77percent) and Bahraich
(33.11percent) constituted more than 68percent production. Productivity per hectare (TE
2018) is higher than zone average (1.00percent) only in 3 districts namely Balrampur
(4.39percent), Basti (2.98percent) and Bahraich (1.95percent).The growth rate in productivity
is highest in Sant Kabir Nagar (17.2percent) while Gorakhpur (-7.6percent) and Bahraich (-
6.0percent) reported significantly higher negative growth rate in productivity during 2014-
18.
Table 2.34: District wise percent Share and CAGR of APY of All Horticulture Crops
for Uttar Pradesh in Zone-7 South-West Semi Arid Zone during 2013-14 to 2017-18
Districts
Total Horticulture
Area Production Productivity in MT Per
Ha
TE 2018 Growth rate
2014-18 TE 2018
Growth rate
2014-18 TE 2018
Growth rate
2014-18
Agra 21.92 3.9 23.83 5.6 24.76 1.7
Aligarh 11.42 -8.3 11.55 6.8 23.02 16.5
Etah 8.95 4.6 7.22 10.4 18.37 5.5
Firozabad 18.07 4.8 17.86 3.5 22.55 -1.3
Hathras 16.25 2.6 17.47 0.4 24.50 -2.2
Kasganj 7.96 4.9 6.57 0.1 18.85 -4.6
Mainpuri 10.48 6.1 10.23 7.2 22.25 1.0
Mathura 4.95 4.4 5.28 3.4 24.31 -0.9
Zone-7 South-West
Semi Arid Zone 100.00 2.9 100.00 4.7 22.3 2.0
Source: Horticulture and Food Processing Department, UP Govt., UP Udhyan Bhawan, 2-Sapru Marg,
Lucknow
Table 2.34 explains the district wise percent share and CAGR of al horticulture crops in
South West Semi-Arid Zone. It shows that the percentage share of area (TE 2018) is highest
in Agra (21.92percent) followed by Firozabad (18.07percent) and Hathras (16.25percent),
while the growth rate in area (2014-18) is highest in Mainpuri (6.1percent). It is significant
that growth rate in area is negative in Aligarh (-8.3percent). The production share (TE 2018)
is highest in Agra (23.83percent) followed by Firozabad (17.86percent) and Hathras
(17.47percent). The growth rate in production is highest in Etah (10.4percent). The
productivity per hectare (TE 2018) is highest in Agra (24.76percent) followed by Hathras
(24.50percent) and Mathura (24.3percent). Growth rate in productivity for total horticulture
crops is highest in Aligarh (16.5percent) while Firozabad (-1.3percent), Hathras (-
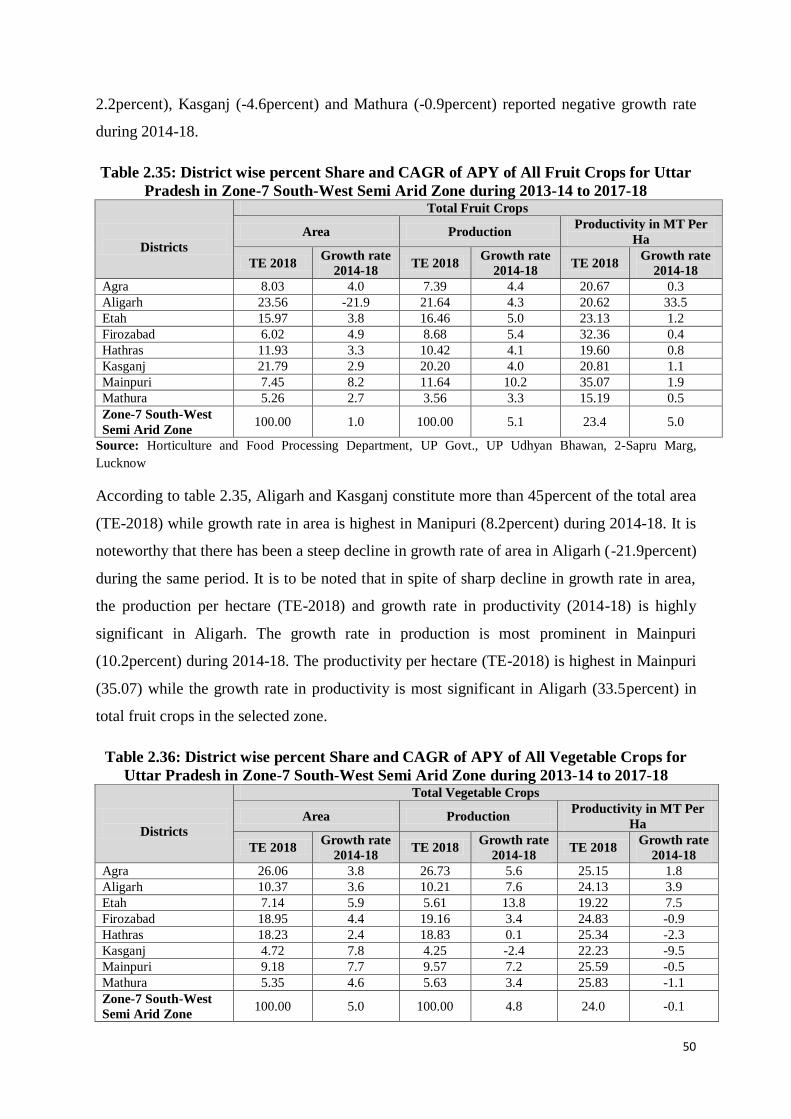
50
2.2percent), Kasganj (-4.6percent) and Mathura (-0.9percent) reported negative growth rate
during 2014-18.
Table 2.35: District wise percent Share and CAGR of APY of All Fruit Crops for Uttar
Pradesh in Zone-7 South-West Semi Arid Zone during 2013-14 to 2017-18
Districts
Total Fruit Crops
Area Production Productivity in MT Per
Ha
TE 2018 Growth rate
2014-18 TE 2018
Growth rate
2014-18 TE 2018
Growth rate
2014-18
Agra 8.03 4.0 7.39 4.4 20.67 0.3
Aligarh 23.56 -21.9 21.64 4.3 20.62 33.5
Etah 15.97 3.8 16.46 5.0 23.13 1.2
Firozabad 6.02 4.9 8.68 5.4 32.36 0.4
Hathras 11.93 3.3 10.42 4.1 19.60 0.8
Kasganj 21.79 2.9 20.20 4.0 20.81 1.1
Mainpuri 7.45 8.2 11.64 10.2 35.07 1.9
Mathura 5.26 2.7 3.56 3.3 15.19 0.5
Zone-7 South-West
Semi Arid Zone 100.00 1.0 100.00 5.1 23.4 5.0
Source: Horticulture and Food Processing Department, UP Govt., UP Udhyan Bhawan, 2-Sapru Marg,
Lucknow
According to table 2.35, Aligarh and Kasganj constitute more than 45percent of the total area
(TE-2018) while growth rate in area is highest in Manipuri (8.2percent) during 2014-18. It is
noteworthy that there has been a steep decline in growth rate of area in Aligarh (-21.9percent)
during the same period. It is to be noted that in spite of sharp decline in growth rate in area,
the production per hectare (TE-2018) and growth rate in productivity (2014-18) is highly
significant in Aligarh. The growth rate in production is most prominent in Mainpuri
(10.2percent) during 2014-18. The productivity per hectare (TE-2018) is highest in Mainpuri
(35.07) while the growth rate in productivity is most significant in Aligarh (33.5percent) in
total fruit crops in the selected zone.
Table 2.36: District wise percent Share and CAGR of APY of All Vegetable Crops for
Uttar Pradesh in Zone-7 South-West Semi Arid Zone during 2013-14 to 2017-18
Districts
Total Vegetable Crops
Area Production Productivity in MT Per
Ha
TE 2018 Growth rate
2014-18 TE 2018
Growth rate
2014-18 TE 2018
Growth rate
2014-18
Agra 26.06 3.8 26.73 5.6 25.15 1.8
Aligarh 10.37 3.6 10.21 7.6 24.13 3.9
Etah 7.14 5.9 5.61 13.8 19.22 7.5
Firozabad 18.95 4.4 19.16 3.4 24.83 -0.9
Hathras 18.23 2.4 18.83 0.1 25.34 -2.3
Kasganj 4.72 7.8 4.25 -2.4 22.23 -9.5
Mainpuri 9.18 7.7 9.57 7.2 25.59 -0.5
Mathura 5.35 4.6 5.63 3.4 25.83 -1.1
Zone-7 South-West
Semi Arid Zone 100.00 5.0 100.00 4.8 24.0 -0.1

51
Source: Horticulture and Food Processing Department, UP Govt., UP Udhyan Bhawan, 2-Sapru Marg,
Lucknow
The above figures in table 2.36 shows that percentage share of area (TE-2018) is highest in
Agra (26.06percent) followed by Hathras (18.23percent) while growth rate in area is most
significant in Kasganj (7.8percent) and Mainpuri (7.7percent) during 2014-18. The
production share (TE-2018) of Agra (26.73) is highest while the growth rate in production is
highest in Etah during 2014-18. The productivity per hectare (TE-2018) is lower than zone
average in Etah and Kasganj districts. Though highest growth rate in productivity is reported
in Etah (7.5percent), the zone as a whole reported negative growth rate in productivity during
2014-18 which shows that it has not shown much improvement in productivity in total
vegetable crops in the selected zone.
Table 2.37: District wise percent Share and CAGR of APY of All Spice Crops for Uttar Pradesh
in Zone-7 South-West Semi-Arid Zone during 2013-14 to 2017-18
Districts
Total Spices Crops
Area Production Productivity in MT Per
Ha
TE 2018 Growth rate
2014-18 TE 2018
Growth rate
2014-18 TE 2018
Growth rate
2014-18
Agra 2.09 16.4 0.44 12.3 1.01 -3.5
Aligarh 1.20 3.0 1.00 0.9 3.97 -2.0
Etah 15.93 0.5 19.23 0.3 4.56 0.5
Firozabad 30.01 8.2 22.79 1.9 8.60 8.2
Hathras 2.63 12.4 0.87 5.8 0.75 12.4
Kasganj 18.15 1.4 20.84 0.4 5.20 1.4
Mainpuri 29.87 0.6 34.80 0.3 8.56 0.6
Mathura 0.11 23.1 0.02 23.1 0.03 23.1
Zone-7 South-West
Semi Arid Zone 100.00 8.2 100.00 5.6 4.1 5.1
Source: Horticulture and Food Processing Department, UP Govt., UP Udyan Bhawan, 2-Sapru Marg, Lucknow
The figures indicate that share of area (TE-2018) under total spice crops in zone 7 was
highest in Firozabad (30.06percent) followed by Manipuri (29.87percent). These Two
districts constitute more than 59percent share in area. The growth rate in area is highest in
Mathura (23.1percent) followed by Agra (16.4percent) during 2014-18. Production share
(TE-2018) is highest in Mainpuri (34.80percent) followed by Firozabad (22.74percent). The
growth rate in production is exceptionally high in Mathura (23.1percent) followed by Agra
(12.3percent) during 2014-18. The productivity per hectare (TE-2018) is most impressive in
Firozabad (8.60percent) and Mainpuri (8.56percent) whereas the growth rate in productivity
is most prominent in Mathura (23.1percent) followed by Hathras (12.4percent). Also, Agra
and Aligarh reported a negative growth rate in productivity during 2014-18.

52
Table 2.38: District wise percent Share and CAGR of APY of Various Horticulture
Crops for Uttar Pradesh in Zone-8 Vindhya Area during 2013-14 to 2017-18
Districts
Total Horticulture
Area Production Productivity in MT Per
Ha
TE 2018
Growth
rate 2014-
18
TE 2018
Growth
rate 2014-
18
TE 2018
Growth
rate 2014-
18
Mirzapur 52.26 9.5 48.97 7.0 15.66 -2.3
Sant Ravidas Ngr. 22.00 2.7 24.63 4.9 18.67 2.2
Sonbhadra 25.74 5.4 26.39 8.3 17.10 2.8
Zone-8 Vindhya Area 100.00 5.9 100.00 6.7 17.1 0.9
Total Fruits
Mirzapur 40.13 3.2 40.61 1.8 17.53 -1.3
Sant Ravidas Ngr. 58.39 1.7 57.90 2.7 17.17 0.9
Sonbhadra 1.48 7.4 1.49 9.2 17.38 1.7
Zone-8 Vindhya Area 100.00 4.1 100.00 4.6 17.4 0.4
Total Vegetables
Mirzapur 51.58 9.0 50.57 7.8 17.54 -1.1
Sant Ravidas Ngr. 15.82 3.3 17.82 6.5 20.08 3.1
Sonbhadra 32.59 5.4 31.61 8.3 17.29 2.8
Zone-8 Vindhya Area 100.00 5.9 100.00 7.6 18.3 1.6
Total Spices
Mirzapur 92.24 24.7 83.40 24.5 1.39 24.7
Sant Ravidas Ngr. 2.52 23.1 2.23 23.1 0.04 23.1
Sonbhadra 5.24 6.5 14.36 2.3 0.08 6.5
Zone-8 Vindhya Area 100.00 18.1 100.00 16.7 0.5 18.1
Source: Horticulture and Food Processing Department, UP Govt., UP Udhyan Bhawan, 2-Sapru Marg,
Lucknow.
Table 2.38 explains the district wise percent share and CAGR of APY of various horticulture
crops in Vindhya area zone which reveals that according to TE-2018 figures Mirzapur
dominates the Zone with 52.26percent area in total horticulture crops. The same trend is seen
in terms of growth rate in area during 2014-18. The production share (TE-2018) is also
highest in Mirzapur (48.97percent) while growth rate of production is most significant in
Sonbhadra (8.31percent) during 2014-18. The productivity per hectare (TE-2018) is highest
in Sant Ravidas Nagar (18.67). Though growth rate of productivity is highest in Sonbhadra
(2.8percent) whereas it is found negative in Mirzapur (-2.3percent) during 2014-18. This
reveals that in Vindhya zone, Mirzapur district has shown much improvement in total
horticulture crops.
Further, it was found that Sant Ravidas Nagar leads the zone in terms of share of area (TE
2018) but the growth rate in area is highest in Sonbhadra (7.4percent) during 2014-18 for the
total fruit crops in selected zone. In terms of production share also Sant Ravidas Nagar led
the way (TE 2018) whereas growth rate in production (2014-18) is highest in Sonbhadra. It is

53
interesting to note that productivity per hectare (TE 2018) is almost same in all three districts
of the zone. The growth rate in productivity is negative in Mirzapur during 2014-18.
The figures in the table yields the more or less the same results for total vegetable crops in
zone 8 as above wherein share of area (TE 2018) growth rate in area (2014-18) and
production share (TE 2018) is highest in Mirzapur while growth rate in production (2014-18)
is highest in Sonbhadra (8.3percent). The productivity per hectare (TE 2018) is highest in
Santi Ravidas Nagar. The growth rate in productivity per hectare is highest in Sant Ravidas
Nagar (3.1percent) while it is negative in Mirzapur during 2014-18. In term of total spices
crops, Mirzapur dominates the zone in all aspects whether be the area, production or
productivity.
Table 2.39: District wise percent Share and CAGR of APY of All Horticulture Crops
for Uttar Pradesh in Zone-9 Western Plain Zone during 2013-14 to 2017-18
Districts
Total Horticulture
Area Production Productivity in MT Per
Ha
TE 2018
Growth
rate 2014-
18
TE 2018
Growth
rate 2014-
18
TE 2018
Growth
rate 2014-
18
Baghpat 4.31 4.4 5.07 5.7 25.14 1.3
Bulandshahr 25.55 3.9 25.01 6.8 20.88 2.8
G B Nagar 0.64 3.8 0.74 10.0 24.70 6.0
Ghaziabad 4.80 5.7 6.45 6.5 28.66 0.7
Hapur 7.55 5.4 7.47 9.2 21.12 3.6
Meerut 17.50 5.0 17.98 7.3 21.93 2.2
Muzaffarnagar 9.47 3.4 8.65 6.5 19.48 3.0
Saharanpur 25.68 2.4 24.24 3.9 20.15 1.5
Shamli 4.51 5.8 4.39 7.1 20.81 1.3
Zone-9 Western
Plain Zone 100.00 4.4 100.00 7.0 22.5 2.5
Source: Horticulture and Food Processing Department, UP Govt., UP Udhyan Bhawan, 2-Sapru Marg,
Lucknow
The above table explains the share of all horticulture crops in western plain zone where
figures in table indicates that more than 50percent area (TE 2018) is claimed by two districts
namely, Saharanpur and Bulandshahar while growth rate in area (2014-18) is highest in
Sharmli (5.8percent) followed by Ghaziabad (5.7percent) and Hapur (5.4percent). The
production share (TE 2018) is highest in Bulandshahar (25.1percent) followed by Saharanpur
(24.24percent). The growth rate in production (2014-18) is highest in GB Nagar
(10.0percent) followed by Hapur (9.2percent). The productivity per hectare (TE 2018) is
found to be highest in Ghaziabad followed by Baghpat, while growth rate in productivity per
hectare (2014-18) is highest in G.B Nagar followed by Muzaffarnagar.

54
Table 2.40: District wise percent Share and CAGR of APY of All Fruit Crops for Uttar
Pradesh in Zone-9 Western Plain Zone during 2013-14 to 2017-18
Districts
Total Fruit Crops
Area Production Productivity in MT Per
Ha
TE 2018 Growth rate
2014-18 TE 2018
Growth rate
2014-18 TE 2018
Growth rate
2014-18
Baghpat 2.68 2.5 2.58 3.7 17.50 1.1
Bulandshahr 23.10 2.0 22.28 3.1 17.55 1.1
G B Nagar 0.12 7.1 0.12 8.4 18.05 1.2
Ghaziabad 0.56 3.8 0.55 6.5 17.76 2.6
Hapur 4.97 1.9 4.55 3.5 16.67 1.6
Meerut 12.96 2.1 11.87 3.2 16.66 1.1
Muzaffarnagar 10.12 2.4 9.33 4.2 16.77 1.8
Saharanpur 39.15 1.8 41.24 2.8 19.18 1.0
Shamli 6.33 3.3 7.50 3.9 21.58 0.5
Zone-9 Western
Plain Zone 100.00 3.0 100.00 4.4 18.0 1.3
Source: Horticulture and Food Processing Department, UP Govt., UP Udhyan Bhawan, 2-Sapru Marg,
Lucknow
The figures in table 2.40 shows that highest percentage of area (TE 2018) is reported in
Saharanpur (39.15percent) followed by Bulandshahr (23.10percent). These two districts
constitute more than 62percent area under total fruit crops in zone 9. The growth rate in area
is most significant in G.B. Nagar (7.1percent) through on a smaller base during TE-2014-18.
The same trend is found in terms of production where Saharanpur (41.24percent) and
Bulandshar (22.28percent) taken together constitute more than 63percent production share in
the zone (TE 2018). Growth rate in production is highest in GB Nagar (8.4percent) followed
by Ghaziabad (6.5percent) during 2014-18. The productivity per hectare (TE 2018) is most
significant in Shamli (21.58percent) and Saharanpur (19.18percent). The growth rate in
productivity is highest in Ghaziabad (2.6percent) during 2014-18.
Table 2.41: District wise percent Share and CAGR of APY of All Vegetable Crops for
Uttar Pradesh in Zone-9 Western Plain Zone during 2013-14 to 2017-18
Districts
Total Vegetable Crops
Area Production Productivity in MT Per
Ha
TE 2018 Growth rate
2014-18 TE 2018
Growth rate
2014-18 TE 2018
Growth rate
2014-18
Baghpat 6.28 5.3 7.17 6.4 29.16 1.0
Bulandshahr 28.07 5.3 27.29 9.6 24.80 4.1
G B Nagar 1.25 3.5 1.25 10.1 25.70 6.4
Ghaziabad 9.57 5.5 11.38 6.5 30.36 0.9
Hapur 10.45 7.7 9.86 11.8 24.05 3.8
Meerut 23.02 6.9 23.12 9.2 25.63 2.2
Muzaffarnagar 8.73 4.5 8.08 8.9 23.60 4.2
Saharanpur 10.46 5.1 10.07 7.9 24.59 2.7
Shamli 2.18 14.9 1.78 22.5 20.78 6.6
Zone-9 Western
Plain Zone 100.00 6.5 100.00 10.3 25.4 3.5
Source: Horticulture and Food Processing Department, UP Govt., UP Udhyan Bhawan, 2-Sapru Marg,
Lucknow

55
The table 2.41 depicts that the area and growth rate of total vegetable crops in Western plain
zone where it reveals that maximum area under total vegetable crops falls under Bulandsahar
(28.07percent) in T.E-2018 whereas growth rate area is highest for Shamli followed by other
districts. Same trend is seen for production as it is found highest for Bulandshahr and growth
rate for production 2014-18 is highest in Shamli followed by Hapur. The growth rate of
productivity in all vegetable crops is found highest in Shamli (6.6percent) than total zone
productivity of 3.5percent whereas in T.E-2018, the productivity for vegetable crops was
much closer for Saharanpur (24.59percent).
Table 2.42: District wise percent Share and CAGR of APY of All Spice Crops for Uttar Pradesh
in Zone-9 Western Plain Zone during 2013-14 to 2017-18
Districts
Total Spices Crops
Area Production Productivity in MT Per
Ha
TE 2018
Growth
rate 2014-
18
TE 2018
Growth
rate 2014-
18
TE 2018
Growth
rate 2014-
18
Baghpat 1.84 16.2 0.89 12.4 0.94 -3.3
Bulandshahar 38.84 23.2 20.42 21.7 1.02 -1.3
G B Nagar 0.50 0.0 0.14 0.0 0.01 0.0
Ghaziabad 12.45 20.3 5.11 21.8 0.22 20.3
Hapur 11.99 1.5 35.64 0.8 0.22 1.5
Meerut 9.28 16.5 4.52 9.6 0.17 16.5
Muzaffarnagar 8.87 14.5 12.54 7.5 0.16 14.5
Saharanpur 4.23 27.3 5.36 31.5 0.08 27.3
Shamli 12.01 12.4 15.37 3.8 0.22 12.4
Zone-9 Western
Plain Zone 100.00 14.7 100.00 12.1 0.3 9.8
Source: Horticulture and Food Processing Department, UP Govt., UP Udhyan Bhawan, 2-Sapru Marg,
Lucknow
The above table 2.42 indicates the percentage share and CAGR of total spices crops in
Western Zone. The above figure reveals that Bulandsahar (38.84percent) occupies first place
in terms of area (TE-2018) under total spices crops while growth rate in area is highest in
Saharanpur (27.3percent) during 2014-18. The share of production in particular zone (TE-
2018) is highest in Hapur (35.64percent) whereas the growth rate in production is highest in
Saharanpur (31.5percent) during 2014-18. The productivity per hectare (TE-2018) is higher
than zone average in only two districts namely Bulandsahar and Baghpat. The growth rate in
productivity is highest in Saharanpur (27.3percent) while Baghpat and Bulandsahar recorded
a negative productivity growth during 2014-18. Thus, in zone 9, Saharanpur play an
important role in total spice crops production.

56
X: CONCLUSION:
The foregoing analysis of data in the given chapter concludes that in terms of no. of projects,
percent of share of project, subsidy allocation amount and percent share of subsidy, Uttar
Pradesh is only behind Maharashtra.The State of Uttar Pradesh has performed convincingly
better during 2014-18 than proceeding period at all India basis as is evident from the fact that
growth in area and production of all horticulture crops in State did exceptionally well than
2009-13 .It holds first rank in terms of CAGR in area, third in terms of CAGR in production
among all other States of India during 2014-18. The State has maximum area and production
under total horticulture crops. Further, in terms of CAGR (area and production) of all fruit
crops, the state ranked third and record respectively at all India level during 2014-18. In
terms of CAGR of area and production of all vegetable crops, U.P. ranked first and third
respectively at all India basis during 2014-18. Further, in case of CAGR of area of all spices
crops, U.P. rank first but performed poorly in terms of CAGR (production) at all India level
during 2014-18. U. P‟s growth was not found satisfactory against all other states in total spice
crops. In case of CAGR of area and production of other Horticulture (Flower and Aromatic),
Uttar Pradesh put up a poor performance at all India level during 2014-18. Though, it must be
remembered that it did not performed much poorly in terms of production than area.
The chapter also explains the major share of various horticulture crops in the state which
concludes that though the mango constituted major share in area and production (TE-2018).
Papaya led the way in terms of growth rate in area, production and productivity per hectare
for all major fruit crop in the State. Potato constituted major share in area, production and
productivity per hectare in the State for Major vegetable crops while Garlic shared major
area, production and productivity of Major spices crops in the state. The zone wise share and
growth rate of various horticulture crops shows that in terms of area and production of total
Horticulture crops, Central Zone and South West Semi-Arid Zone dominated the State. The
share of area and production for all fruit crops is most significant in Central Zone of the State.
The share of area and production for All Vegetable Crops is most significant in Central Zone
and South West Semi-Arid Zone in the State. In terms of area and production of all spices
crops, South West Semi-Arid Zone and Central Zone Dominated the State. Hence, it can be
concluded that Uttar Pradesh holds a vast potential for development of horticulture sector, but
it is still far from the realization of its actual potential. Hence, various suggestive measures by
the government and the state should be taken for the commercialization and diversification of
horticulture sector in the state, in order to improve the socio-economic conditions of
horticulture growers.

57
CHAPTER III
Socio-Economic Characteristics of Horticultural Growers
I: Introduction
Socio-economic status (SES) is an important determinant of standard of living and health
status as it influences the incidence and prevalence of various indicators on livelihoods. It is
the total measure of person‟s work experience in relation to others and is determined by the
individual‟s education, income, housing condition, occupation besides other important
indicators.
Throughout the history of Indian agriculture, horticulture sector plays an important role in the
development of an economy. U.P.‟s horticulture also plays an important role in its economy
by providing employment to a large section of the growers. It has emerged as one of the
major agricultural activities, as there has been a substantial increase in both area and
production of horticulture crops.
The present chapter analyzes the socio-economic status of various horticulture crop growers
in nine selected districts of agro-climatic zones of Uttar Pradesh. The study tries to develop
significant insights into the socio-economic conditions of growers engaged in horticulture
sector. The study takes into consideration the sex, caste, age, social status, marital status,
education level, employment status and size of landholdings of the growers of horticulture
crops in selected districts of Uttar Pradesh.
II: Demographic Profile:
Demographic pattern is one of the most important factor of farming community as it is the
primary source of labor for crop cultivation. Hence, a proper appraisal of its size and
demography is needed to be studied. The below table explains the demographic profile of the
household.
The table 3.1 shows the district wise distribution of sample households by caste and religion.
Out of total 900 households, 73 percent households are from Other Backward Caste (OBC)
category and 14 percent are from the scheduled caste (caste). Only 13 percent growers were
from general category engaged in horticulture cropping. Out of total sampled households
only around 8 percent were from Muslim religion and rest of Hindus. From these 8 percent

58
Muslims, most were those who are engaged in cultivation of horticulture crops from last 40 to
50 years.
Table 3.1: Distribution of Sample Households by Caste & Religion
District Caste Religion
General OBC SC Hindu Muslim Total
Saharanpur 42 50 8 92 8 100
Gorakhpur 4 76 20 93 7 100
Sultanpur 10 82 8 88 12 100
Jalaun 3 91 6 95 5 100
Hathras 3 93 4 99 1 100
Mirzapur 15 69 16 100 0 100
Amroha 16 72 12 80 20 100
Kannauj 19 40 41 95 5 100
Rampur 1 84 15 88 12 100
Total
113
(12.56)
657
(73.00)
130
(14.44)
830
(92.22)
70
(7.78)
900
(100.00)
Source: Primary Survey, 2019.
The other important factor of the demographic indicators if size of the family. The table 3.2
shows the caste wise average size of family of the surveyed households. It depicts that size
of family in general category is higher as compared to other caste i.e. 5.6 member per family
as compared to 5.2 in OBC and 5.1 in SC category. It is because in general category
household, most of the family were joint family while in OBC and SC most of family were
nuclear.
Table 3.2: District wise Distribution of Household as per Size of Family by Caste (No.)
District Category of Castes
General OBC SC Total
Saharanpur 4.5 4.5 5.8 4.6
Gorakhpur 7.3 5.5 4.9 5.4
Sultanpur 5.1 5.6 4.0 5.4
Jalaun 4.3 5.2 4.8 5.2
Hathras 6.7 5.5 5.0 5.5
Mirzapur 5.1 5.2 4.8 5.1
Amroha 4.0 4.7 6.1 4.8
Kannauj 5.1 5.0 5.4 5.2
Rampur 8.0 4.9 4.5 4.9
Total 5.6 5.2 5.1 5.1
Source: Primary Survey, 2019.
The table 3.3 shows that percent distribution of total population by gender in sampled
households. It reveals from the table that share of female population is around 45 percent.

59
Percentage share of female population was highest in Gorakhpur (47 percent) followed by
Saharanpur and Rampur. Saharanpur has lowest population in no. as compared to other
districts.
Table 3.3: Percentage Distribution of Population by Gender in Sampled Household
District Gender
Male Female Total
Saharanpur
247
(53.93)
211
(46.07)
458
(100.00)
Gorakhpur
289
(53.13)
255
(46.88)
544
(100.00)
Sultanpur
308
(56.72)
235
(43.28)
543
(100.00)
Jalaun
282
(54.34)
237
(45.66)
519
(100.00)
Hathras
311
(56.34)
241
(43.66)
552
(100.00)
Mirzapur
289
(56.56)
222
(43.44)
511
(100.00)
Amroha
264
(55.35)
213
(44.65)
477
(100.00)
Kannauj
287
(55.41)
231
(44.59)
518
(100.00)
Rampur
264
(53.99)
225
(46.01)
489
(100.00)
Total 2541
(55.11)
2070
(44.89)
4611
(100.00)
Source: Primary Survey, 2019.
Table 3.4: District wise Percentage Distribution of Family Members by their Marital
Status in Sampled Household (Age 15+)
District Marital status
Married Unmarried Widow/Widower Total
Saharanpur 55.6 42.7 1.7 100.0
Gorakhpur 50.0 49.0 1.0 100.0
Sultanpur 47.7 49.9 2.4 100.0
Jalaun 61.0 38.0 1.0 100.0
Hathras 42.5 55.5 2.0 100.0
Mirzapur 53.5 44.9 1.6 100.0
Amroha 51.4 47.2 1.4 100.0
Kannauj 54.4 44.5 1.0 100.0
Rampur 42.2 54.7 3.1 100.0
Total 50.9 47.4 1.7 100.0 Source: Primary Survey, 2019.
Table 3.4 depicts the district wise percent distribution of marital status of the family members
of sampled household .It shows that 50.9percent of the total population are married whereas
47.4percent are found to be unmarried with 1.7percent are widow/widower. 61.0percent

60
married are from Jalaun district followed by Saharanpur (55percent) followed by Kannauj.
The overall percentage of married are found to be higher than unmarried in sampled
population.
Classification of population by age group gives an idea of the composition of the family by
size and availability of labour force as well as dependency ratio. Table 3.5 shows the percent
distribution of population by age group in selected district which reveals that maximum
member in a family belongs to age group of 16-30 years i.e. 33.4percent where 19.6percent
belongs to 31-45 years of age group. It is to be pointed out that combined 25.5 percent
population were found below 15 year of age as they were considered to be children and
ignorant about the economic activities of the households. Further, the table reveals that out of
total 33.4percent population from age group 16-30 , maximum households are from Sultanpur
(36.5percent) followed by Rampur ( 35.9percent) and Hathras (35.5percent) and other
districts. It is to be noticed that only 5.4percent of the total population comes under age group
of above 60 years.
Table 3.5: Percentage Distribution of Population by Age Group in Sampled Household
District Age Groups
Below 6 7 to 15 16 to 30 31 to 45 46 to 60 Above to 60 Total
Saharanpur 7.2 14.8 30.3 23.1 17.7 6.6 100.0
Gorakhpur 6.6 20.2 32.0 18.0 15.8 7.4 100.0
Sultanpur 7.6 16.2 36.5 20.6 14.9 4.2 100.0
Jalaun 7.7 16.2 30.6 21.2 18.3 6.0 100.0
Hathras 8.2 19.6 35.5 16.5 15.4 4.9 100.0
Mirzapur 7.6 19.2 31.7 20.2 15.3 6.1 100.0
Amroha 8.2 16.8 34.8 17.4 16.6 6.3 100.0
Kannauj 10.6 15.1 32.8 19.1 18.0 4.4 100.0
Rampur 8.6 19.1 35.9 21.1 12.5 2.7 100.0
Total 8.0 17.5 33.4 19.6 16.0 5.4 100.0
Source: Primary Survey, 2019.
III: EDUCATIONAL STATUS:
Education is one of the important indicators of the socio-economic wellbeing of the family
which shows the standard of living of the family. It is considered as one of the basic elements
which determine the quality of manpower. The standard of education plays an important role
on quality of human resources engaged in productive activities. Educational level of the
growers influences not only their perceptions but also their expectations and work behavior.

61
Since education plays an important role in providing skills to the unskilled, it is important to
discuss the educational status of the sampled households.
Table 3.6 provides the details of educational status of household population by sex in
different districts .It indicates that total 21.7percent household population are found to be
uneducated which comprises of 15.6percent male and 29.1percent female. In all the districts,
it was found that only 8.9percent are educated where 6.7percent male and 11.5percent female
found to be educated. Very low percentage of total population in all districts i.e. 2.1percent is
found to have higher education. This indicates a deplorable way of education and it is clear
from above table that many people do not get proper education in their formation age.
However, there is a wide variation in the level of education.
Table 3.6: Percentage Distribution of Household Population by Education Level & Sex
Gender District
Education Level
Total
Un
edu
cate
d
Ed
uca
ted
Pri
mary
Hig
h s
chool
Inte
rmed
iate
Gra
du
ate
Post
Gra
du
ate
Tec
hn
ical
Ed
uca
tion
Male
Saharanpur 11.4 6.5 10.2 30.5 23.2 9.8 4.5 4.1 100.0
Gorakhpur 15.2 5.5 15.6 45.3 11.4 4.5 1.0 1.4 100.0
Sultanpur 13.0 4.9 9.4 37.7 16.9 12.7 3.9 1.6 100.0
Jalaun 11.0 5.7 12.1 36.8 14.2 15.2 2.5 2.5 100.0
Hathras 13.2 7.7 14.8 28 26.0 6.8 1.6 1.9 100.0
Mirzapur 17.1 8.4 12.5 34.5 12.2 10.5 3.5 1.4 100.0
Amroha 17.0 5.3 14.8 37.5 13.3 7.6 3.8 0.8 100.0
Kannauj 19.1 8.3 13.9 34.1 10.8 11.8 2.1 0.0 100.0
Rampur 23.9 8.3 14.0 31.8 7.6 9.5 3.0 1.9 100.0
Total 15.6 6.7 13.0 35.2 15.1 9.8 2.8 1.7 900.0
Female
Saharanpur 14.2 10.9 18.0 30.8 12.8 8.5 3.8 0.9 100.0
Gorakhpur 34.9 9.8 12.9 30.6 7.5 3.9 0.0 0.4 100.0
Sultanpur 26.8 9.4 15.3 22.5 12.8 11.1 0.4 1.7 100.0
Jalaun 28.4 6.4 19.9 29.2 7.2 8.1 0.4 0.4 100.0
Hathras 24.1 17.0 17.0 24.9 9.1 5.4 1.7 0.8 100.0
Mirzapur 29.9 10.4 14.0 24.9 13.6 5.0 1.4 0.9 100.0
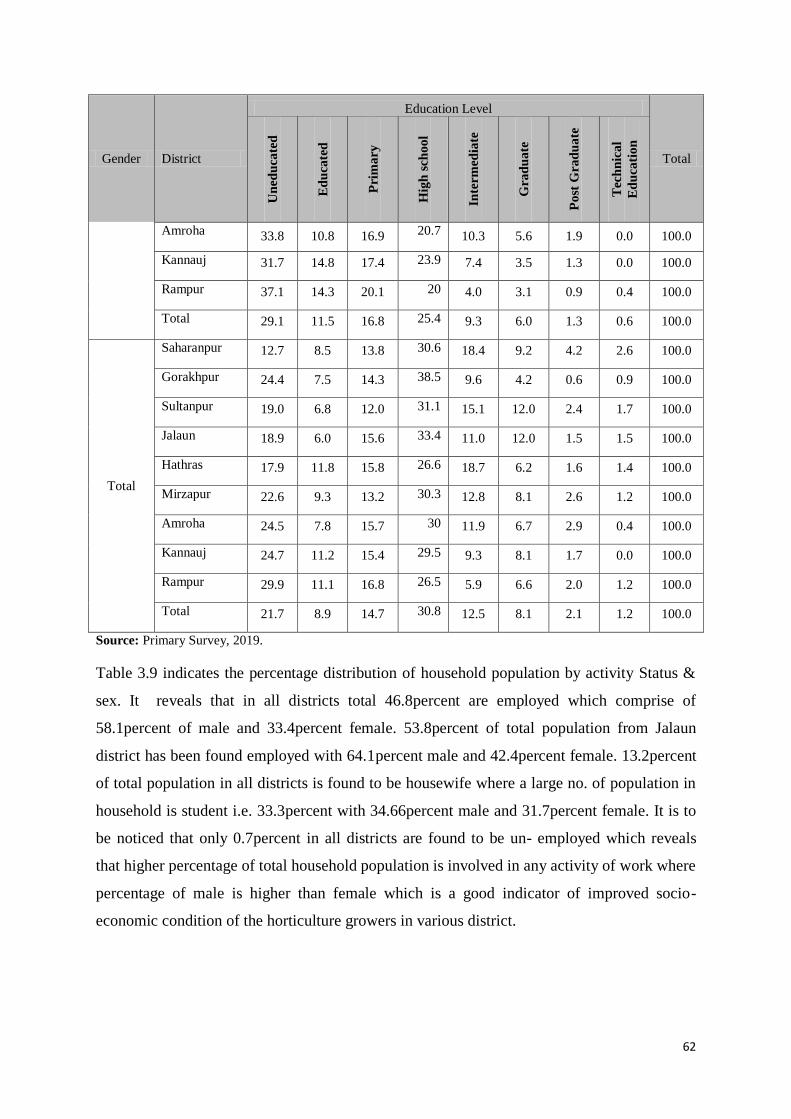
62
Gender District
Education Level
Total
Un
edu
cate
d
Ed
uca
ted
Pri
mary
Hig
h s
chool
Inte
rmed
iate
Gra
du
ate
Post
Gra
du
ate
Tec
hn
ical
Ed
uca
tion
Amroha 33.8 10.8 16.9 20.7 10.3 5.6 1.9 0.0 100.0
Kannauj 31.7 14.8 17.4 23.9 7.4 3.5 1.3 0.0 100.0
Rampur 37.1 14.3 20.1 20 4.0 3.1 0.9 0.4 100.0
Total 29.1 11.5 16.8 25.4 9.3 6.0 1.3 0.6 100.0
Total
Saharanpur 12.7 8.5 13.8 30.6 18.4 9.2 4.2 2.6 100.0
Gorakhpur 24.4 7.5 14.3 38.5 9.6 4.2 0.6 0.9 100.0
Sultanpur 19.0 6.8 12.0 31.1 15.1 12.0 2.4 1.7 100.0
Jalaun 18.9 6.0 15.6 33.4 11.0 12.0 1.5 1.5 100.0
Hathras 17.9 11.8 15.8 26.6 18.7 6.2 1.6 1.4 100.0
Mirzapur 22.6 9.3 13.2 30.3 12.8 8.1 2.6 1.2 100.0
Amroha 24.5 7.8 15.7 30 11.9 6.7 2.9 0.4 100.0
Kannauj 24.7 11.2 15.4 29.5 9.3 8.1 1.7 0.0 100.0
Rampur 29.9 11.1 16.8 26.5 5.9 6.6 2.0 1.2 100.0
Total 21.7 8.9 14.7 30.8 12.5 8.1 2.1 1.2 100.0
Source: Primary Survey, 2019.
Table 3.9 indicates the percentage distribution of household population by activity Status &
sex. It reveals that in all districts total 46.8percent are employed which comprise of
58.1percent of male and 33.4percent female. 53.8percent of total population from Jalaun
district has been found employed with 64.1percent male and 42.4percent female. 13.2percent
of total population in all districts is found to be housewife where a large no. of population in
household is student i.e. 33.3percent with 34.66percent male and 31.7percent female. It is to
be noticed that only 0.7percent in all districts are found to be un- employed which reveals
that higher percentage of total household population is involved in any activity of work where
percentage of male is higher than female which is a good indicator of improved socio-
economic condition of the horticulture growers in various district.

63
Table 3.9: Percentage Distribution of Household Population by Activity Status & Sex
Gender District
Activity Status
Total
Em
plo
yed
Un
emp
loyed
Hou
sew
ife
Stu
den
t
Ch
ild
ren
Sen
ior
Cit
izen
Male
Saharanpur 59.3 1.2 1.2 30.3 5.4 2.5 100.0
Gorakhpur 60.0 0.0 0.0 35.6 2.4 2.0 100.0
Sultanpur 52.3 0.4 0.4 39.3 6.0 1.8 100.0
Jalaun 64.1 0.0 0.4 29.7 4.7 1.2 100.0
Hathras 57.2 0.0 0.0 37.3 4.2 1.3 100.0
Mirzapur 49.6 0.4 0.4 41.1 4.9 3.7 100.0
Amroha 56.5 1.9 1.2 33.8 5.4 1.2 100.0
Kannauj 63.5 0.0 0.7 30.1 4.6 1.1 100.0
Rampur 60.5 1.9 0.0 33.7 3.1 0.8 100.0
Total 58.1 0.6 0.5 34.6 4.5 1.7 100.0
Female
Saharanpur 20.1 2.0 45.1 27.0 2.5 3.4 100.0
Gorakhpur 28.3 0.4 30.3 34.0 6.1 0.8 100.0
Sultanpur 35.7 0.0 26.4 31.7 5.3 0.9 100.0
Jalaun 42.4 0.0 22.1 28.6 6.1 0.9 100.0
Hathras 34.4 2.1 23.7 34.0 5.0 0.8 100.0
Mirzapur 32.3 0.9 28.1 33.6 3.7 1.4 100.0
Amroha 28.2 0.0 31.0 35.7 4.2 0.9 100.0
Kannauj 41.7 0.4 23.3 28.7 5.8 0.0 100.0
Rampur 36.0 0.9 26.1 31.1 5.4 0.5 100.0
Total 33.4 0.7 28.2 31.7 4.9 1.0 100.0
Total
Saharanpur 41.3 1.6 21.3 28.8 4.0 2.9 100.0
Gorakhpur 44.3 0.2 15.0 34.8 4.3 1.4 100.0
Sultanpur 44.9 0.2 11.9 35.9 5.7 1.4 100.0
Jalaun 53.8 0.0 10.7 29.2 5.3 1.0 100.0
Hathras 47.3 0.9 10.3 35.9 4.5 1.1 100.0
Mirzapur 41.5 0.6 13.4 37.6 4.3 2.6 100.0
Amroha 43.8 1.1 14.6 34.7 4.9 1.1 100.0
Kannauj 53.9 0.2 10.7 29.5 5.1 0.6 100.0
Rampur 49.3 1.4 12.0 32.5 4.1 0.6 100.0
Total 46.8 0.7 13.2 33.3 4.7 1.4 100.0
Source: Primary Survey, 2019.
IV: EMPLOYMENT STATUS - It is important to analyze the type of employment status
of the household population in order to know the socio-economic condition of the growers
involved in horticulture production. Hence, the below table 3.10 explains the percentage
distribution of household population by type of employment status & gender which reveals
that maximum number of household population i.e. 78.8percent are self-employed in all

64
district with 74.3percent male and 88.1percent female. Further, the table depicts that
13.1percent are having permanent work with 16.3percent male and 6.6percent female and
8.1percent are having temporary work with 9.4percent male and 5.3percent female. Thus, it is
clear from the below table that higher percent of household population is involved in their
own work and are self-employed.
Table 3.10: Percentage Distribution of Household Population by Type of Employment
Status & Sex
Gender District Type of Employment
Total Self Employed Permanent Temporary
Male
Saharanpur 79.2 9.0 11.8 100.0
Gorakhpur 77.1 16.3 6.5 100.0
Sultanpur 76.0 11.3 12.7 100.0
Jalaun 79.9 13.0 7.1 100.0
Hathras 69.7 16.3 14.0 100.0
Mirzapur 74.2 14.5 11.3 100.0
Amroha 70.3 20.9 8.8 100.0
Kannauj 70.1 24.9 5.1 100.0
Rampur 73.4 18.4 8.2 100.0
Total 74.3 16.3 9.4 100.0
Female
Saharanpur 80.5 4.9 14.6 100.0
Gorakhpur 88.0 2.7 9.3 100.0
Sultanpur 92.7 2.4 4.9 100.0
Jalaun 87.9 4.0 8.1 100.0
Hathras 83.1 15.7 1.2 100.0
Mirzapur 87.1 5.7 7.1 100.0
Amroha 85.2 13.1 1.6 100.0
Kannauj 92.2 4.4 3.3 100.0
Rampur 91.4 7.4 1.2 100.0
Total 88.1 6.6 5.3 100.0
Total
Saharanpur 79.5 8.1 12.4 100.0
Gorakhpur 80.7 11.8 7.5 100.0
Sultanpur 81.9 8.2 9.9 100.0
Jalaun 82.8 9.7 7.5 100.0
Hathras 73.9 16.1 10.0 100.0
Mirzapur 78.9 11.3 9.8 100.0
Amroha 74.6 18.7 6.7 100.0
Kannauj 77.5 18.0 4.5 100.0
Rampur 79.5 14.6 5.9 100.0
Total 78.8 13.1 8.1 100.0
Source: Primary Survey, 2019.
Further, the employment status can be further divided on basis of primary and secondary
occupation. Hence, it is important to analyze the household population on basis of their
occupation which is explained in below Table 3.11 which reveals that overall 69.5percent

65
population is involved in agriculture where 68.8percent are male and 71.1percent are female.
It is important to notice that females are much involved in agriculture than males. Further, it
suggests that 10.3percent population is involved in non-agricultural activities with 6.3percent
male and 19.1percent females. In all the districts only 2percent male and 1.6percent female
are found to be getting govt. jobs with just 1.9percent of total household population. Further,
it is seen from the table that 7.0percent are having private jobs with 9.3percent male and
1.9percent female. Overall 11.3percent are involved in agricultural and non- agricultural
labour in all districts. Thus, it is clear from the table that a small portion of people are
involved in govt. and private jobs whereas a large no. of population is involved in agricultural
and non-agricultural activities and hence cannot do much for the development of the
horticulture sector.
Table 3.11: Percentage Distribution of Household Population by Type of Employment
Status (Primary Occupation) & Sex
Gender District
Primary Occupation
Total
Agri
cult
ure
Non
agri
cult
ura
l
Gover
nm
ent
job
Pri
vate
job
Agri
cult
ura
l
lab
ou
r
Non
-
agri
cult
ura
l
lab
ou
r
Male Saharanpur 74.1 6.3 1.4 13.3 0.7 4.2 100.0
Gorakhpur 66.5 10.8 1.1 13.6 2.8 5.1 100.0
Sultanpur 72.4 5.3 6.5 8.8 0.6 6.5 100.0
Jalaun 73.0 4.9 1.6 9.2 1.1 10.3 100.0
Hathras 64.0 5.1 2.8 12.9 1.1 14.0 100.0
Mirzapur 73.5 7.4 3.1 6.2 3.1 6.8 100.0
Amroha 65.5 8.8 0.7 5.4 2.0 17.6 100.0
Kannauj 62.4 2.8 0.6 8.4 5.6 20.2 100.0
Rampur 68.6 6.3 0.0 5.7 11.3 8.2 100.0
Total 68.8 6.3 2.0 9.3 3.1 10.4 100.0
Female Saharanpur 85.0 5.0 2.5 2.5 5.0 0.0 100.0
Gorakhpur 81.1 12.2 1.4 2.7 1.4 1.4 100.0
Sultanpur 59.0 36.1 1.2 3.6 0.0 0.0 100.0
Jalaun 64.3 27.6 3.1 2.0 2.0 1.0 100.0
Hathras 68.7 13.3 2.4 4.8 10.8 0.0 100.0
Mirzapur 59.7 33.3 1.4 1.4 1.4 2.8 100.0
Amroha 65.6 23.0 0.0 0.0 11.5 0.0 100.0
Kannauj 83.9 6.5 2.2 0.0 6.5 1.1 100.0
Rampur 77.8 9.9 0.0 0.0 7.4 4.9 100.0
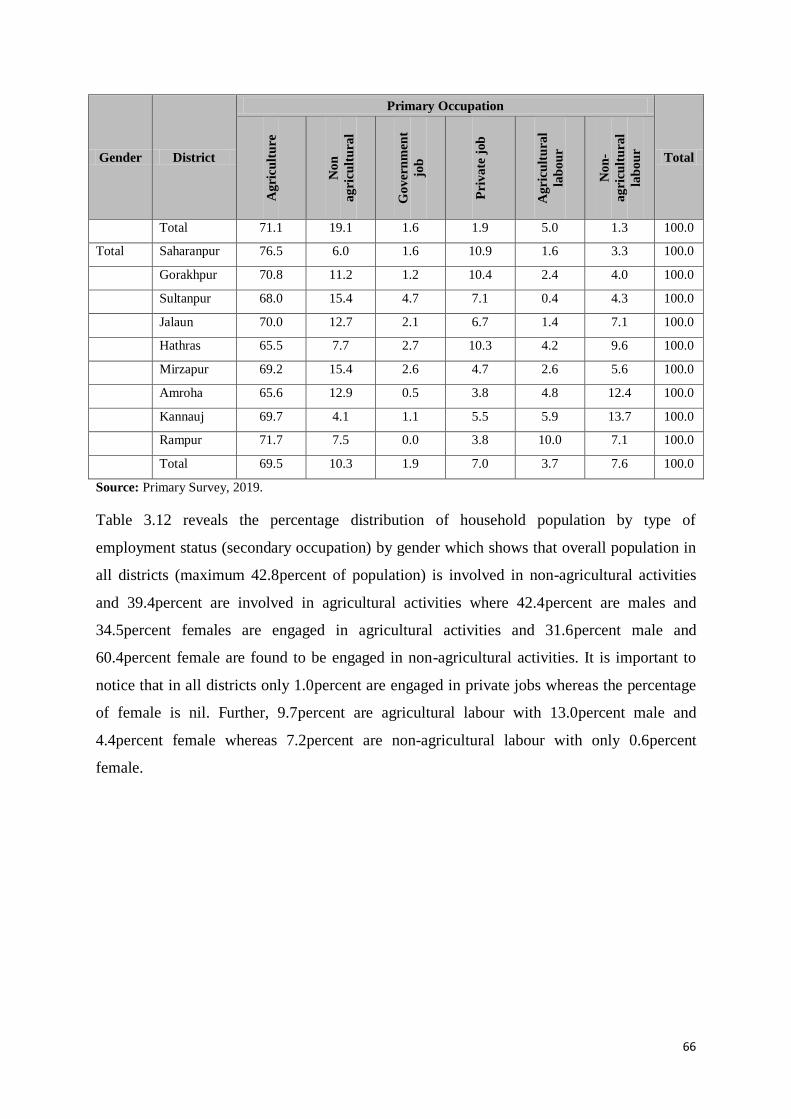
66
Gender District
Primary Occupation
Total
Agri
cult
ure
Non
agri
cult
ura
l
Gover
nm
ent
job
Pri
vate
job
Agri
cult
ura
l
lab
ou
r
Non
-
agri
cult
ura
l
lab
ou
r
Total 71.1 19.1 1.6 1.9 5.0 1.3 100.0
Total Saharanpur 76.5 6.0 1.6 10.9 1.6 3.3 100.0
Gorakhpur 70.8 11.2 1.2 10.4 2.4 4.0 100.0
Sultanpur 68.0 15.4 4.7 7.1 0.4 4.3 100.0
Jalaun 70.0 12.7 2.1 6.7 1.4 7.1 100.0
Hathras 65.5 7.7 2.7 10.3 4.2 9.6 100.0
Mirzapur 69.2 15.4 2.6 4.7 2.6 5.6 100.0
Amroha 65.6 12.9 0.5 3.8 4.8 12.4 100.0
Kannauj 69.7 4.1 1.1 5.5 5.9 13.7 100.0
Rampur 71.7 7.5 0.0 3.8 10.0 7.1 100.0
Total 69.5 10.3 1.9 7.0 3.7 7.6 100.0
Source: Primary Survey, 2019.
Table 3.12 reveals the percentage distribution of household population by type of
employment status (secondary occupation) by gender which shows that overall population in
all districts (maximum 42.8percent of population) is involved in non-agricultural activities
and 39.4percent are involved in agricultural activities where 42.4percent are males and
34.5percent females are engaged in agricultural activities and 31.6percent male and
60.4percent female are found to be engaged in non-agricultural activities. It is important to
notice that in all districts only 1.0percent are engaged in private jobs whereas the percentage
of female is nil. Further, 9.7percent are agricultural labour with 13.0percent male and
4.4percent female whereas 7.2percent are non-agricultural labour with only 0.6percent
female.

67
Table 3.12: Percentage Distribution of Household Population by Type of Employment Status
(Secondary Occupation) & Sex
Gender District
Secondary Occupation
Total
Agri
cult
ure
Non
_A
gri
cu
ltu
re
Pri
vate
job
Agri
cult
irall
ab
ou
r
Non
-
agri
cult
ura
l
lab
ou
r
Male
Saharanpur 81.8 4.5 0.0 13.6 0.0 100.0
Gorakhpur 50.0 18.4 0.0 10.5 21.1 100.0
Sultanpur 31.2 48.1 1.3 6.5 13.0 100.0
Jalaun 33.7 47.7 1.2 12.8 4.7 100.0
Hathras 40.5 32.9 1.3 17.7 7.6 100.0
Mirzapur 24.3 37.8 2.7 20.3 14.9 100.0
Amroha 69.8 25.6 0.0 0.0 4.7 100.0
Kannauj 42.7 20.7 3.7 13.4 19.5 100.0
Rampur 55.0 15.0 1.7 16.7 11.7 100.0
Total 42.4 31.6 1.6 13.0 11.4 100.0
Female
Saharanpur 10.5 78.9 0.0 5.3 5.3 100.0
Gorakhpur 16.2 81.1 0.0 2.7 0.0 100.0
Sultanpur 37.8 62.2 0.0 0.0 0.0 100.0
Jalaun 42.6 55.9 0.0 1.5 0.0 100.0
Hathras 43.5 54.3 0.0 2.2 0.0 100.0
Mirzapur 35.2 57.4 0.0 7.4 0.0 100.0
Amroha 46.4 53.6 0.0 0.0 0.0 100.0
Kannauj 28.1 56.3 0.0 15.6 0.0 100.0
Rampur 31.3 56.3 0.0 9.4 3.1 100.0
Total 34.6 60.4 0.0 4.4 0.6 100.0
Total
Saharanpur 48.8 39.0 0.0 9.8 2.4 100.0
Gorakhpur 33.3 49.3 0.0 6.7 10.7 100.0
Sultanpur 33.6 53.3 0.8 4.1 8.2 100.0
Jalaun 37.7 51.3 0.6 7.8 2.6 100.0
Hathras 41.6 40.8 0.8 12.0 4.8 100.0
Mirzapur 28.9 46.1 1.6 14.8 8.6 100.0
Amroha 60.6 36.6 0.0 0.0 2.8 100.0
Kannauj 38.6 30.7 2.6 14.0 14.0 100.0
Rampur 46.7 29.3 1.1 14.1 8.7 100.0
Total 39.4 42.8 1.0 9.7 7.2 100.0
Source: Primary Survey, 2019.

68
V: LAND HOLDING STATUS
The land details of the respondents are important because it indicates the economic and social
status of the households. Generally the size of land affects the crop pattern, agricultural
income, output and adoption of improved technology and other initiatives.
Table 3.13 shows district wise distribution of percent share of household by land group. It
reveals that out of total 900 households selected for study, around 73.7 percent were marginal
farmers, 16.0 percent small farmers, 5.4 percent were medium farmers and 1.9percent were
large farmers and 3 percent were found to be landless. It was found that among all district,
the proportion of marginal farmers was higher for all district where Kannauj hold 93percent
of marginal land holding with only 3 percent of small landholding where 4percent found to
be landless. No household was found in kannauj district to hold large holding. Further, the
table reveals that the proportion of small farmer was highest for Saharanpur with 25 percent
and 22 percent medium and 8 percent large farmers. 5 percent were found to be landless. It
was found that in Saharanpur district, the proportion of large farmers was highest (8percent)
as compared to other districts. In district Amroha, no landless workers were found.
Table 3.14 explains the district wise percent share and area by land group which reveals that
out of total area of land i.e. 2892.6 acre, Saharanpur holds 614.9 acre of area where highest
percentage is of medium size of land holding with 30 percent and 24.5percent is of large size
land holding followed by small and marginal size of land group with 21.6percent and
16.5percent. Out of total area, 7.4percent of area is found to be landless in Saharanpur
district.
Table 3.13: District wise percent Share of Household by Land group
District Landless Marginal Small Medium Large Total
Saharanpur 5
(5.0)
40
(40.0)
25
(25.0)
22
(22.0)
8
(8.0) 100
Gorakhpur 4
(4.0)
89
(89.0)
5
(5.0)
0
(0.0)
2
(2.0) 100
Sultanpur 1
(1.0)
86
(86.0)
13
(13.0)
0
(0.0)
0
(0.0) 100
Jalaun 1
(1.0)
52
(52.0)
31
(31.0)
12
(12.0)
4
(4.0) 100
Hathras 4
(4.0)
76
(76.0)
19
(19.0)
1
(1.0)
0
(0.0) 100
Mirzapur 2
(2.0)
75
(75.0)
13
(13.0)
8
(8.0)
2
(2.0) 100
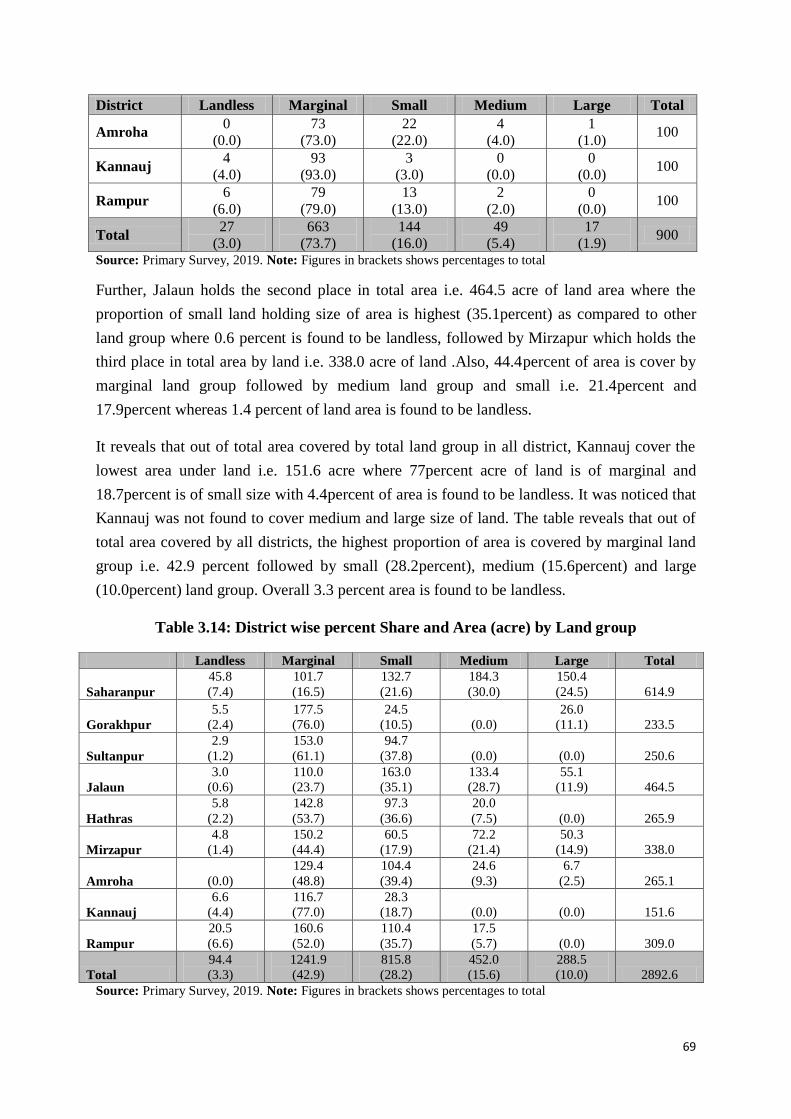
69
District Landless Marginal Small Medium Large Total
Amroha 0
(0.0)
73
(73.0)
22
(22.0)
4
(4.0)
1
(1.0) 100
Kannauj 4
(4.0)
93
(93.0)
3
(3.0)
0
(0.0)
0
(0.0) 100
Rampur 6
(6.0)
79
(79.0)
13
(13.0)
2
(2.0)
0
(0.0) 100
Total 27
(3.0)
663
(73.7)
144
(16.0)
49
(5.4)
17
(1.9) 900
Source: Primary Survey, 2019. Note: Figures in brackets shows percentages to total
Further, Jalaun holds the second place in total area i.e. 464.5 acre of land area where the
proportion of small land holding size of area is highest (35.1percent) as compared to other
land group where 0.6 percent is found to be landless, followed by Mirzapur which holds the
third place in total area by land i.e. 338.0 acre of land .Also, 44.4percent of area is cover by
marginal land group followed by medium land group and small i.e. 21.4percent and
17.9percent whereas 1.4 percent of land area is found to be landless.
It reveals that out of total area covered by total land group in all district, Kannauj cover the
lowest area under land i.e. 151.6 acre where 77percent acre of land is of marginal and
18.7percent is of small size with 4.4percent of area is found to be landless. It was noticed that
Kannauj was not found to cover medium and large size of land. The table reveals that out of
total area covered by all districts, the highest proportion of area is covered by marginal land
group i.e. 42.9 percent followed by small (28.2percent), medium (15.6percent) and large
(10.0percent) land group. Overall 3.3 percent area is found to be landless.
Table 3.14: District wise percent Share and Area (acre) by Land group
Landless Marginal Small Medium Large Total
Saharanpur
45.8
(7.4)
101.7
(16.5)
132.7
(21.6)
184.3
(30.0)
150.4
(24.5) 614.9
Gorakhpur
5.5
(2.4)
177.5
(76.0)
24.5
(10.5)
(0.0)
26.0
(11.1) 233.5
Sultanpur
2.9
(1.2)
153.0
(61.1)
94.7
(37.8)
(0.0)
(0.0) 250.6
Jalaun
3.0
(0.6)
110.0
(23.7)
163.0
(35.1)
133.4
(28.7)
55.1
(11.9) 464.5
Hathras
5.8
(2.2)
142.8
(53.7)
97.3
(36.6)
20.0
(7.5)
(0.0) 265.9
Mirzapur
4.8
(1.4)
150.2
(44.4)
60.5
(17.9)
72.2
(21.4)
50.3
(14.9) 338.0
Amroha
(0.0)
129.4
(48.8)
104.4
(39.4)
24.6
(9.3)
6.7
(2.5) 265.1
Kannauj
6.6
(4.4)
116.7
(77.0)
28.3
(18.7)
(0.0)
(0.0) 151.6
Rampur
20.5
(6.6)
160.6
(52.0)
110.4
(35.7)
17.5
(5.7)
(0.0) 309.0
Total
94.4
(3.3)
1241.9
(42.9)
815.8
(28.2)
452.0
(15.6)
288.5
(10.0) 2892.6
Source: Primary Survey, 2019. Note: Figures in brackets shows percentages to total
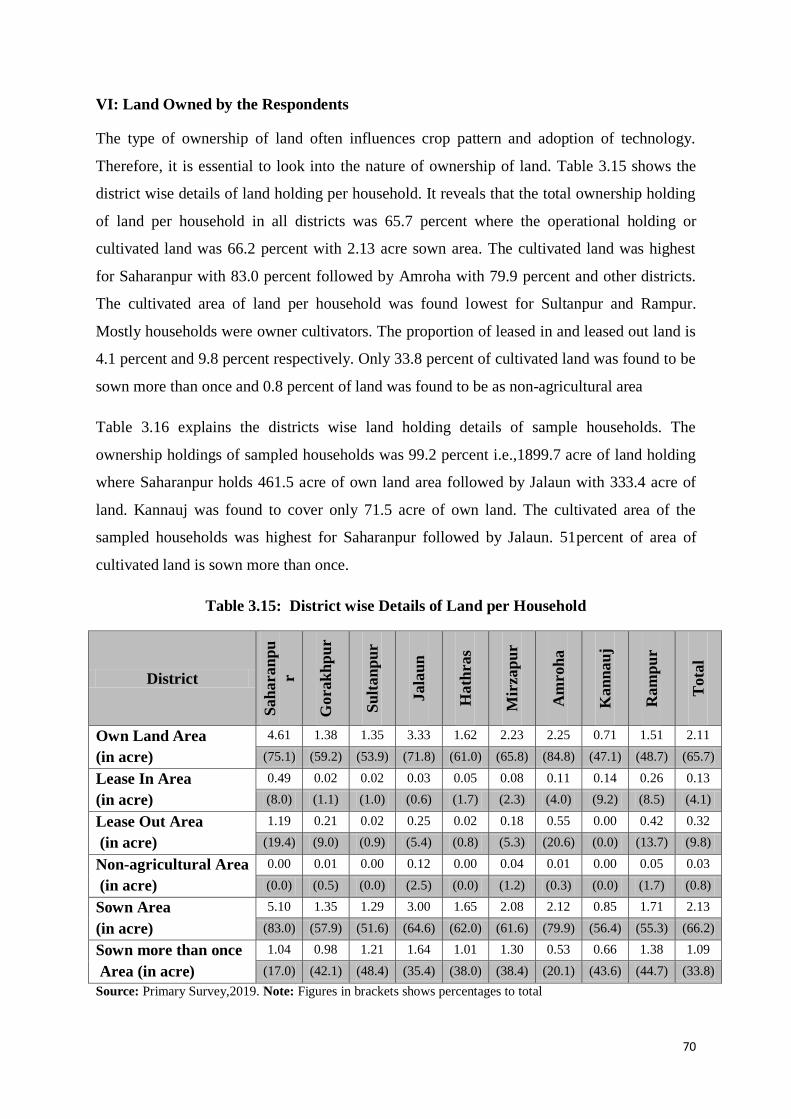
70
VI: Land Owned by the Respondents
The type of ownership of land often influences crop pattern and adoption of technology.
Therefore, it is essential to look into the nature of ownership of land. Table 3.15 shows the
district wise details of land holding per household. It reveals that the total ownership holding
of land per household in all districts was 65.7 percent where the operational holding or
cultivated land was 66.2 percent with 2.13 acre sown area. The cultivated land was highest
for Saharanpur with 83.0 percent followed by Amroha with 79.9 percent and other districts.
The cultivated area of land per household was found lowest for Sultanpur and Rampur.
Mostly households were owner cultivators. The proportion of leased in and leased out land is
4.1 percent and 9.8 percent respectively. Only 33.8 percent of cultivated land was found to be
sown more than once and 0.8 percent of land was found to be as non-agricultural area
Table 3.16 explains the districts wise land holding details of sample households. The
ownership holdings of sampled households was 99.2 percent i.e.,1899.7 acre of land holding
where Saharanpur holds 461.5 acre of own land area followed by Jalaun with 333.4 acre of
land. Kannauj was found to cover only 71.5 acre of own land. The cultivated area of the
sampled households was highest for Saharanpur followed by Jalaun. 51percent of area of
cultivated land is sown more than once.
Table 3.15: District wise Details of Land per Household
District
Sah
aran
pu
r
Gorak
hp
ur
Su
ltan
pu
r
Jala
un
Hath
ras
Mir
zap
ur
Am
roh
a
Kan
nau
j
Ram
pu
r
Tota
l
Own Land Area
(in acre)
4.61 1.38 1.35 3.33 1.62 2.23 2.25 0.71 1.51 2.11
(75.1) (59.2) (53.9) (71.8) (61.0) (65.8) (84.8) (47.1) (48.7) (65.7)
Lease In Area
(in acre)
0.49 0.02 0.02 0.03 0.05 0.08 0.11 0.14 0.26 0.13
(8.0) (1.1) (1.0) (0.6) (1.7) (2.3) (4.0) (9.2) (8.5) (4.1)
Lease Out Area
(in acre)
1.19 0.21 0.02 0.25 0.02 0.18 0.55 0.00 0.42 0.32
(19.4) (9.0) (0.9) (5.4) (0.8) (5.3) (20.6) (0.0) (13.7) (9.8)
Non-agricultural Area
(in acre)
0.00 0.01 0.00 0.12 0.00 0.04 0.01 0.00 0.05 0.03
(0.0) (0.5) (0.0) (2.5) (0.0) (1.2) (0.3) (0.0) (1.7) (0.8)
Sown Area
(in acre)
5.10 1.35 1.29 3.00 1.65 2.08 2.12 0.85 1.71 2.13
(83.0) (57.9) (51.6) (64.6) (62.0) (61.6) (79.9) (56.4) (55.3) (66.2)
Sown more than once
Area (in acre)
1.04 0.98 1.21 1.64 1.01 1.30 0.53 0.66 1.38 1.09
(17.0) (42.1) (48.4) (35.4) (38.0) (38.4) (20.1) (43.6) (44.7) (33.8)
Source: Primary Survey,2019. Note: Figures in brackets shows percentages to total
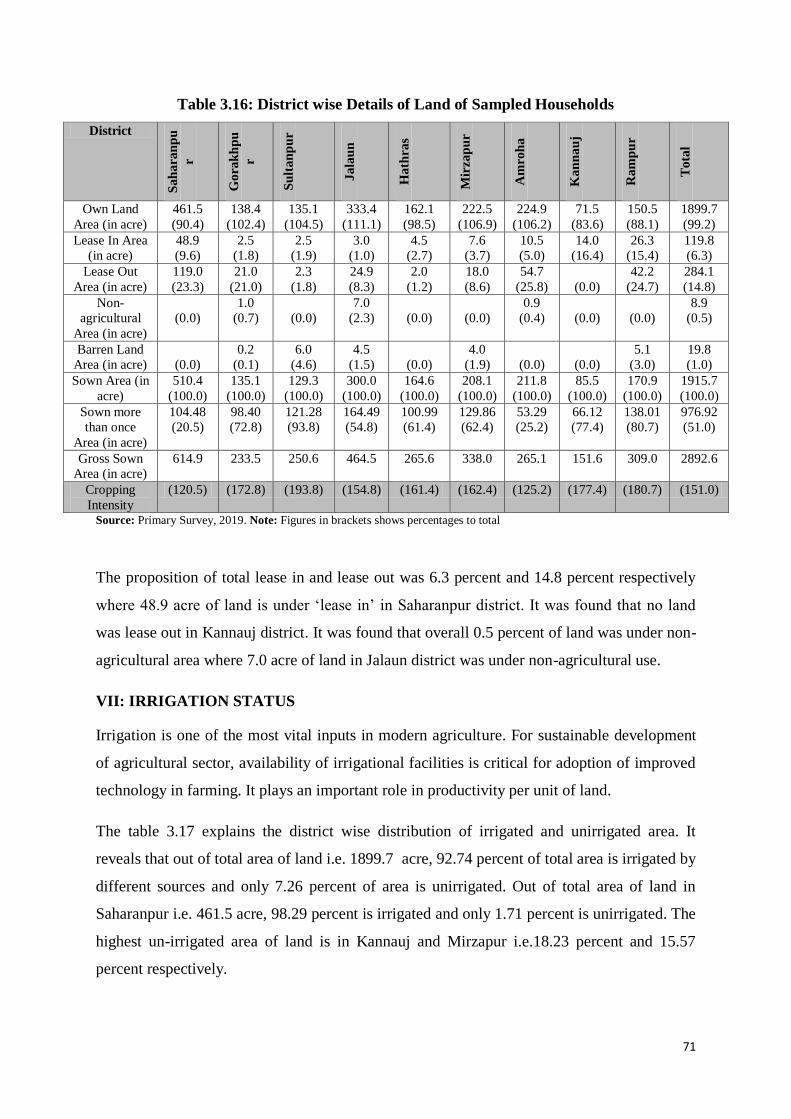
71
Table 3.16: District wise Details of Land of Sampled Households
District
Sah
ara
np
u
r
Gora
kh
pu
r
Su
ltan
pu
r
Jala
un
Hath
ras
Mir
zap
ur
Am
roh
a
Kan
nau
j
Ram
pu
r
Tota
l
Own Land
Area (in acre)
461.5
(90.4)
138.4
(102.4)
135.1
(104.5)
333.4
(111.1)
162.1
(98.5)
222.5
(106.9)
224.9
(106.2)
71.5
(83.6)
150.5
(88.1)
1899.7
(99.2)
Lease In Area
(in acre)
48.9
(9.6)
2.5
(1.8)
2.5
(1.9)
3.0
(1.0)
4.5
(2.7)
7.6
(3.7)
10.5
(5.0)
14.0
(16.4)
26.3
(15.4)
119.8
(6.3)
Lease Out
Area (in acre)
119.0
(23.3)
21.0
(21.0)
2.3
(1.8)
24.9
(8.3)
2.0
(1.2)
18.0
(8.6)
54.7
(25.8)
(0.0)
42.2
(24.7)
284.1
(14.8)
Non-
agricultural
Area (in acre)
(0.0)
1.0
(0.7)
(0.0)
7.0
(2.3)
(0.0)
(0.0)
0.9
(0.4)
(0.0)
(0.0)
8.9
(0.5)
Barren Land
Area (in acre)
(0.0)
0.2
(0.1)
6.0
(4.6)
4.5
(1.5)
(0.0)
4.0
(1.9)
(0.0)
(0.0)
5.1
(3.0)
19.8
(1.0)
Sown Area (in
acre)
510.4
(100.0)
135.1
(100.0)
129.3
(100.0)
300.0
(100.0)
164.6
(100.0)
208.1
(100.0)
211.8
(100.0)
85.5
(100.0)
170.9
(100.0)
1915.7
(100.0)
Sown more
than once
Area (in acre)
104.48
(20.5)
98.40
(72.8)
121.28
(93.8)
164.49
(54.8)
100.99
(61.4)
129.86
(62.4)
53.29
(25.2)
66.12
(77.4)
138.01
(80.7)
976.92
(51.0)
Gross Sown
Area (in acre)
614.9 233.5 250.6 464.5 265.6 338.0 265.1 151.6 309.0 2892.6
Cropping
Intensity
(120.5) (172.8) (193.8) (154.8) (161.4) (162.4) (125.2) (177.4) (180.7) (151.0)
Source: Primary Survey, 2019. Note: Figures in brackets shows percentages to total
The proposition of total lease in and lease out was 6.3 percent and 14.8 percent respectively
where 48.9 acre of land is under „lease in‟ in Saharanpur district. It was found that no land
was lease out in Kannauj district. It was found that overall 0.5 percent of land was under non-
agricultural area where 7.0 acre of land in Jalaun district was under non-agricultural use.
VII: IRRIGATION STATUS
Irrigation is one of the most vital inputs in modern agriculture. For sustainable development
of agricultural sector, availability of irrigational facilities is critical for adoption of improved
technology in farming. It plays an important role in productivity per unit of land.
The table 3.17 explains the district wise distribution of irrigated and unirrigated area. It
reveals that out of total area of land i.e. 1899.7 acre, 92.74 percent of total area is irrigated by
different sources and only 7.26 percent of area is unirrigated. Out of total area of land in
Saharanpur i.e. 461.5 acre, 98.29 percent is irrigated and only 1.71 percent is unirrigated. The
highest un-irrigated area of land is in Kannauj and Mirzapur i.e.18.23 percent and 15.57
percent respectively.

72
Table 3.17: District wise Distribution of Irrigated Area:
Districts Total Area percent of Total
Irrigated Area
percent of Unirrigated
Saharanpur 461.5 98.29 1.71
Gorakhpur 138.4 90.85 9.15
Sultanpur 135.1 90.43 9.57
Jalaun 333.4 97.29 2.71
Hathras 162.1 98.32 1.68
Mirzapur 222.5 84.43 15.57
Amroha 224.9 94.42 5.58
Kannauj 71.5 81.77 18.23
Rampur 150.5 86.12 13.88
Total 1899.7 92.74 7.26 Source: Primary Survey, 2019.
Table 3.18 explains the district wise distribution of sampled households by different source of
irrigation i.e. through canals, tube wells, pump sets or wells. It was found that Pump sets &
Tube wells are the major source of irrigation of sampled households. In Saharanpur &
Gorakhpur cannel are also a source of irrigation.
Table 3.18: District wise Distribution of Sampled Households by Different Source of Irrigation
Multiple response
Districts
Source of Irrigation
Canals Tube well Pump sets Lake/Wells Total
Saharanpur 12 76 17 - 100
Gorakhpur 12 6 86 1 100
Sultanpur - 40 65 0 100
Jalaun 8 33 66 1 100
Hathras - 73 30 - 100
Mirzapur 1 45 47 1 100
Amroha 1 74 24 - 100
Kannauj 1 56 44 - 100
Rampur 1 10 89 1 100
Total 36 413 468 4 900
percent share 4.00 45.89 52.00 0.44 900 (100.0) Source: Primary Survey,2019. Note: Figures in brackets shows percentages to total
Table 3.19 explains the area under irrigation by different sources in sampled households. It
reveals that out of total irrigated area in Saharanpur, 82.41 percent was found to be irrigated
by tube wells and nearly about 18 percent of area is irrigated by canal and pump sets whereas
no land was found to be irrigated by lake/wells. Further, in Gorakhpur district, most of the
irrigated area was irrigated by pump sets i.e. 48.46 percent and 36.82 percent was irrigated by

73
tube wells while around 15 percent of irrigated land was found to be irrigated through canals
and lakes/wells.
Table 3.19: Irrigated area by Source on Sample Farm as Percent of Total Irrigated Area
Multiple response
District Canal Irrigated Tube well
Irrigated
Pumping set
Irrigated
Lake/well
Irrigated
Saharanpur 8.40 82.41 9.20 0.00
Gorakhpur 11.14 36.82 48.46 3.58
Sultanpur 0.00 55.44 43.38 1.18
Jalaun 2.35 48.46 48.58 0.61
Hathras 0.00 80.47 19.53 0.00
Mirzapur 0.63 69.46 25.51 4.40
Amroha 0.34 89.52 10.14 0.00
Kannauj 0.48 44.95 54.57 0.00
Rampur 0.34 42.45 56.86 0.34
Total 3.37 64.38 31.26 1.00 Source: Primary Survey, 2019.
In Sultanpur district, tube wells and pump sets are major source of irrigation while no
irrigated land was found to be irrigated through canals. Tube well was found to be major
source of irrigation in Hathras where it was noticed that no land was irrigated through canals
and lakes. In a nutshell, tube wells and pump sets were the major source of irrigation in
sampled farms.
VIII: INCOME OF THE SAMPLED HOUSEHOLDS
Income plays a vital role in the socio-economic condition of any person. Hence, it is
important to study the income of sampled households by its source (table 3.20). Average
household income of the sampled houses is Rs. 227753. It was found that 37.9 percent of
income was contributed through Horticulture whereas just 15.1 percent of household income
was contributed through agriculture, while animal husbandry contributed about 9.7 percent of
household income. 9.6 percent of income was derived from other sectors whereas remaining
27 percent of income was derived from various sources such as govt. job, non-agricultural
labour, remittances, pension etc.

74
Table 3.20: District wise Distribution of Current Year Income of Sampled Households
by its Source
District
Sah
ara
np
ur
Gora
kh
pu
r
Su
ltan
pu
r
Jala
un
Hath
ras
Mir
zap
ur
Am
roh
a
Kan
nau
j
Ram
pu
r
Tota
l
Agriculture 22.8 13.5 10.9 17.3 8.1 11.5 19.1 8.5 15.8 15.1
Horticulture 62.8 37.0 22.7 32.9 35.1 30.2 25.5 28.1 44.3 37.9
Animal husbandry 2.1 9.0 13.0 9.3 10.6 12.4 23.7 6.8 6.0 9.7
Fishery bee keeping 0.0 1.1 0.0 0.0 0.1 0.4 0.0 0.3 0.5 0.2
Graminartisans 0.3 2.7 0.0 1.0 0.0 1.1 0.3 0.4 0.8 0.7
Agriculture Labour 0.7 2.4 1.9 2.1 3.7 2.7 2.0 7.4 5.6 2.8
Non-Ag labour 0.9 8.6 5.6 6.3 11.6 6.4 8.1 23.8 10.6 7.9
Govt job 1.6 7.4 24.2 3.8 10.6 13.8 1.7 4.9 2.1 7.5
Self-Employment 3.2 6.3 6.3 9.1 11.2 3.6 4.2 6.4 2.7 5.6
Rent installments 0.5 0.0 0.0 0.3 0.0 0.0 0.0 0.0 0.0 0.1
Remittances 0.9 3.8 1.7 1.1 1.5 0.8 0.0 1.9 0.0 1.2
Pension 1.2 2.4 6.1 0.3 0.9 3.0 0.5 0.1 0.5 1.7
Others Sector 2.9 5.8 7.4 16.5 6.6 13.9 14.8 11.3 11.0 9.6
Total Income (Rs.) 100 100 100 100 100 100 100 100 100 100
HH Income (Rs.) 439462 164657 220171 223361 199630 251880 209718 159521 198360 227753
Source: Primary Survey, 2019.
Across districts, its range is Rs. 159221in Kannauj to Rs. 439462 in Saharanpur. Further, the
table reveals that out of total household income of Saharanpur district, 62.8 percent of income
was contributed through Horticulture while 22.8 percent of income is contributed by
agriculture while remaining 15 percent of income was derived from other sources. Further in
the below table it was seen that Rampur derived 44.3 percent of income through horticulture
and 15.8 percent through agriculture.10.6 percent of income in same district was derived
through non- agricultural labour and 6.0 percent through animal husbandry. Fishery, bee
keeping, rural artisans and remittances are not of much significance in the district. The
proportion of income derived by horticulture was much more than income derived through
agriculture in all sampled households which shows that horticulture is one of the main source
of income in the district.
Table 3.21 shows the distribution of previous year income of sampled households by its
source. It explains that in the previous year, the total income of sampled households was
derived through horticulture i.e. 35.8 percent of total household income which shows
improvement in the current year as source of income derived through horticulture was
improved in the current year i.e. 37.9 percent.

75
Table 3.21: Distribution of Previous year Income of Sampled Households by its Source
District
Sah
ara
np
ur
Gora
kh
pu
r
Su
ltan
pu
r
Jala
un
Hath
ras
Mir
zap
ur
Am
roh
a
Kan
nau
j
Ram
pu
r
Tota
l
Agriculture 27.1 12.3 10.4 16.7 7.9 11.7 19.0 9.3 16.7 15.5
Horticulture 55.6 41.1 24.5 31.3 34.5 29.3 26.0 27.0 43.2 35.8
Animal husbandry 3.0 8.9 12.7 9.2 10.5 12.6 23.9 6.3 5.9 10.1
Fishery bee keeping 0.0 1.0 0.0 0.0 0.4 0.5 0.0 0.3 0.6 0.3
Graminartisans 0.3 2.9 0.0 1.0 0.0 1.1 0.2 0.4 0.8 0.7
Agriculture Labour 0.8 2.1 2.0 1.9 3.9 2.8 1.9 7.7 5.7 2.9
Non-Ag labour 1.1 7.6 5.7 5.7 12.3 6.4 8.3 24.6 10.9 8.2
Govt job 1.6 7.1 24.1 6.4 11.0 14.0 1.8 4.8 2.0 8.0
Self Employment 3.9 6.4 6.2 9.2 11.5 3.5 4.2 6.3 2.6 5.8
Rent installments 0.7 0.0 0.0 0.2 0.0 0.0 0.0 0.0 0.0 0.1
Remittances 0.9 3.3 1.8 0.9 0.5 0.6 0.0 1.5 0.0 1.0
Pension 1.5 2.5 6.0 0.4 1.0 3.2 0.5 0.1 0.5 1.8
Others Sector 3.5 4.8 6.4 17.1 6.6 14.3 14.3 11.7 11.1 9.8
Total Income (Rs.) 100 100 100 100 100 100 100 100 100 100
HH Income (Rs.) 314437 158194 206193 214314 186765 240434 205296 152706 190558 207873
Source: Primary Survey, 2019.
It was noticed that there was not much improvement in the source of income derived through
agriculture and it was almost the same in current and previous year of all districts. Fishery,
bee keeping, gramin artisans, rent installments and remittances are not of much significance
in the district. It is clear from the table that the proportion of income derived through
horticulture has shown considerable improvement in the current year than in previous year in
all the districts.
IX: Livestock Status
Animal husbandry is an important allied activity of the farmers in the district. Almost all of
the families keep milch and draft animals. The table 3.22 reveals that out of total sampled
households, mostly 52.4 percent of household are having she-buffalo and 32.2 percent
reporting caw. Sultanpur has highest no of buffalos followed by Jalaun and other district.
Further, the table reveals that 32.2 percent of total household are having cow with Saharanpur
at its highest followed by Mirzapur, Gorakhpur Sultanpur. 7.6 percent of household revealed
of having bull whereas 10.6 percent of household revealed of keeping goat. However, most of
the households maintained a milch animal.

76
Table 3.22: District Wise Distribution of Households Reporting Different Animals
District Cow Bull Buffalo Male buffalo Goat No. of HH
Saharanpur 55 5 56 13 6 100
Gorakhpur 37 6 36 4 4 100
Sultanpur 35 13 66 18 8 100
Jalaun 31 6 63 15 21 100
Hathras 31 9 58 18 6 100
Mirzapur 49 13 49 16 9 100
Amroha 34 9 62 17 9 100
Kannauj 9 3 41 7 21 100
Rampur 9 4 41 10 11 100
Total absolute no. 290 68 472 118 95 900
percent Share (YES) (32.2) (7.6) (52.4) (13.1) (10.6) (100.0)
Source: Primary Survey, 2019.
Table 3.23 reveals about the district wise average number of animals per households. It
shows that on average per household in all the districts keep at least one or two milch and
draft animals whereas in Mirzapur district, each household is having at least 4 animals and at
least one cow on average basis. In Jalaun district, each household is having at least 3 animals
and the percentage of she buffalo is higher than other animals. Thus, the table reveals that on
average each household is keeping about 1 milch animal that are mostly she buffalos.
Figure 3.1: District wise Average Number of Animals per Households

77
Table 3.25: District wise Average No of Animal per Households
District Cow Bull Buffalo Male buffalo Goat Total
Saharanpur 0.9 0.1 0.9 0.2 0.1 2.1
Gorakhpur 0.6 0.1 0.7 0.1 0.1 1.6
Sultanpur 0.6 0.2 1.3 0.3 0.3 2.7
Jalaun 0.5 0.1 1.3 0.2 1.3 3.3
Hathras 0.6 0.1 1.4 0.3 0.2 2.6
Mirzapur 1.1 0.2 1.1 0.3 1.6 4.3
Amroha 0.9 0.1 1.1 0.2 0.2 2.5
Kannauj 0.4 0.1 0.7 0.1 0.5 1.7
Rampur 0.1 0.1 0.7 0.1 0.4 1.4
Total 0.6 0.1 1.0 0.2 0.5 2.5
Source: Primary Survey, 2019.
Table 3.24 explains the average value of animal per households which clearly reveals about
their economic condition. On same context, the table given below reveals that almost all the
districts were having she buffalos with an average value of Rs. 34460 whereas it was seen
that in Amroha district every household was having buffalo with an average value of Rs.
42000. Further, it was found that total average value of cow in all districts was Rs. 12978,
where in Saharanpur every household was having cow with an average value of Rs.15000
and lowest value of cow was for Kannauj i.e. Rs.4978. It was also seen that every district was
keeping Goat with an average value of Rs.3128 where Sultanpur takes the lead where every
household was keeping at least one or two goats with an average value of Rs.9750. Hence,
the table reveals that economically in all district every household was keeping at least one
milch animal with an average value of Rs.34000.
Table 3.24: Average Value of Animal (in Rs.) per Households District Cow Bull Buffalo Male buffalo Goat Total
Saharanpur 15049 22144 39529 30111 3545 25909
Gorakhpur 11508 2455 32121 27400 2500 19145
Sultanpur 11186 11429 32854 8048 9750 21264
Jalaun 11878 5556 36676 2524 2630 16886
Hathras 10362 6077 26978 17984 2706 19510
Mirzapur 14856 2023 33250 5225 2184 13618
Amroha 16319 12291 42000 19583 3490 26300
Kannauj 4978 3000 34338 2389 2784 15316
Rampur 12923 15714 34739 24583 4529 23004
Total 12978 7933 34460 13874 3128 19447
Source: Primary Survey, 2019.
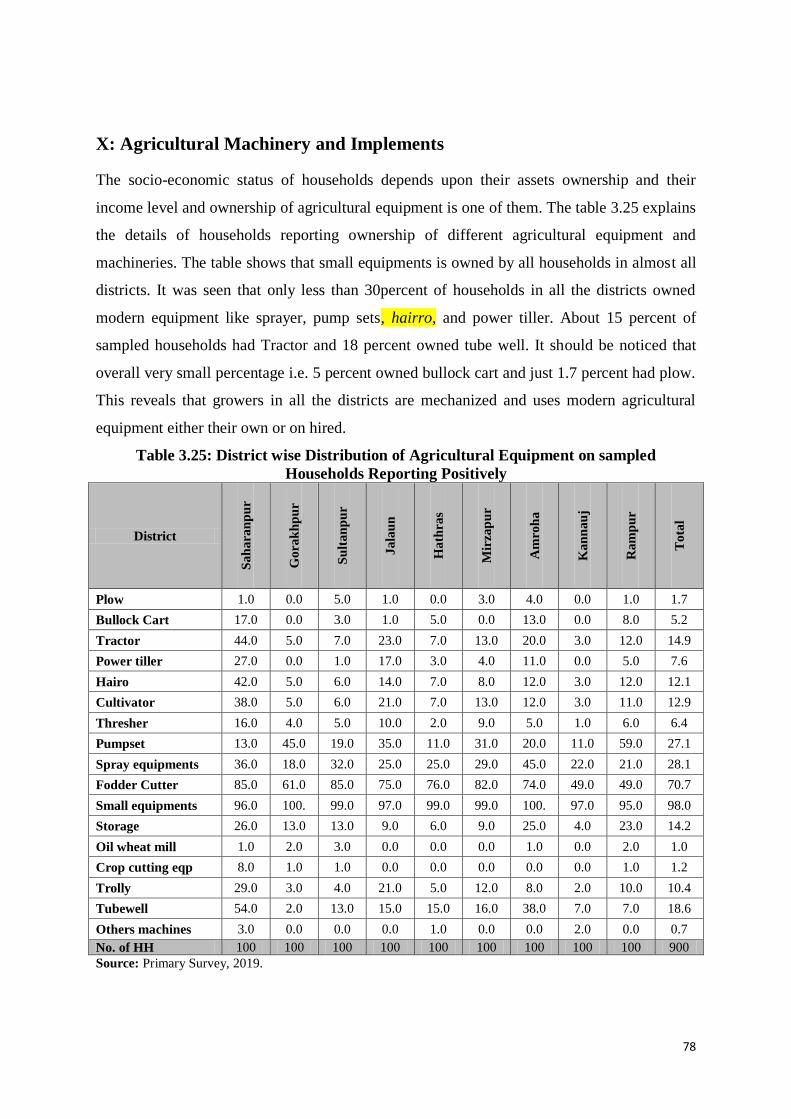
78
X: Agricultural Machinery and Implements
The socio-economic status of households depends upon their assets ownership and their
income level and ownership of agricultural equipment is one of them. The table 3.25 explains
the details of households reporting ownership of different agricultural equipment and
machineries. The table shows that small equipments is owned by all households in almost all
districts. It was seen that only less than 30percent of households in all the districts owned
modern equipment like sprayer, pump sets, hairro, and power tiller. About 15 percent of
sampled households had Tractor and 18 percent owned tube well. It should be noticed that
overall very small percentage i.e. 5 percent owned bullock cart and just 1.7 percent had plow.
This reveals that growers in all the districts are mechanized and uses modern agricultural
equipment either their own or on hired.
Table 3.25: District wise Distribution of Agricultural Equipment on sampled
Households Reporting Positively
District
Sah
ara
np
ur
Gora
kh
pu
r
Su
ltan
pu
r
Jala
un
Hath
ras
Mir
zap
ur
Am
roh
a
Kan
nau
j
Ram
pu
r
Tota
l
Plow 1.0 0.0 5.0 1.0 0.0 3.0 4.0 0.0 1.0 1.7
Bullock Cart 17.0 0.0 3.0 1.0 5.0 0.0 13.0 0.0 8.0 5.2
Tractor 44.0 5.0 7.0 23.0 7.0 13.0 20.0 3.0 12.0 14.9
Power tiller 27.0 0.0 1.0 17.0 3.0 4.0 11.0 0.0 5.0 7.6
Hairo 42.0 5.0 6.0 14.0 7.0 8.0 12.0 3.0 12.0 12.1
Cultivator 38.0 5.0 6.0 21.0 7.0 13.0 12.0 3.0 11.0 12.9
Thresher 16.0 4.0 5.0 10.0 2.0 9.0 5.0 1.0 6.0 6.4
Pumpset 13.0 45.0 19.0 35.0 11.0 31.0 20.0 11.0 59.0 27.1
Spray equipments 36.0 18.0 32.0 25.0 25.0 29.0 45.0 22.0 21.0 28.1
Fodder Cutter 85.0 61.0 85.0 75.0 76.0 82.0 74.0 49.0 49.0 70.7
Small equipments 96.0 100. 99.0 97.0 99.0 99.0 100. 97.0 95.0 98.0
Storage 26.0 13.0 13.0 9.0 6.0 9.0 25.0 4.0 23.0 14.2
Oil wheat mill 1.0 2.0 3.0 0.0 0.0 0.0 1.0 0.0 2.0 1.0
Crop cutting eqp 8.0 1.0 1.0 0.0 0.0 0.0 0.0 0.0 1.0 1.2
Trolly 29.0 3.0 4.0 21.0 5.0 12.0 8.0 2.0 10.0 10.4
Tubewell 54.0 2.0 13.0 15.0 15.0 16.0 38.0 7.0 7.0 18.6
Others machines 3.0 0.0 0.0 0.0 1.0 0.0 0.0 2.0 0.0 0.7
No. of HH 100 100 100 100 100 100 100 100 100 900
Source: Primary Survey, 2019.

79
XI: Ownership of Durable Assets by Sampled Households:
The economic status of the households can be judged from the ownership of assets. Table
3.26 explains the households reported ownership of different durable items. It shows that
maximum households in all the districts have most of the durable items such as cycle, mobile
phones, utensils, etc. Ownership of T.V sets was also found to be quite common with 64.7
percent households owning a T.V sets. It was found that very low percent of households i.e.
4 percent of households own four wheeler in all the districts but most of households reported
two wheelers. In terms of ownership of different durables position of Saharanpur was much
better than all other districts.
Table 3.26: Households Reporting Durable Items: (percent YES)
District
Sah
ara
np
ur
Gora
kh
pu
r
Su
ltan
pu
r
Jala
un
Hath
ras
Mir
zap
ur
Am
roh
a
Kan
nau
j
Ram
pu
r
Tota
l
Jeep/Car 11.0 2.0 4.0 2.0 1.0 7.0 4.0 2.0 3.0 4.0
Scooter/Motorcycle 77.0 54.0 56.0 78.0 70.0 59.0 66.0 54.0 45.0 62.1
Cycle 88.0 95.0 100.0 99.0 95.0 97.0 92.0 98.0 94.0 95.3
Fan/Cooler 96.0 88.0 93.0 88.0 95.0 85.0 98.0 86.0 86.0 90.6
T.V./ Fridge/
Washing machine 89.0 46.0 66.0 68.0 63.0 67.0 68.0 57.0 58.0 64.7
Mobile / Computer 100.0 98.0 98.0 100 100.0 95.0 96.0 95.0 97.0 97.7
Furniture 100 74.0 86.0 100 98.0 79.0 100 98.0 99.0 92.8
Utensils 99.0 100 99.0 99.0 100 99.0 98.0 100 100 99.3
Other Assets 42.0 59.0 63.0 86.0 99.0 68.0 45.0 79.0 70.0 67.9
No. of HH 100 100 100 100 100 100 100 100 100 100
Source: Primary Survey, 2019.
Table 3.27 shows the financial assets owned by sampled households. Around 93.3 percent of
the households have their savings in bank which shows that the main form of holding
financial assets is in form of bank savings followed by gold/ silver jewelry. It was found that
a very low percent of total households is saving in form of Kisan Vikas Patra and post
offices.
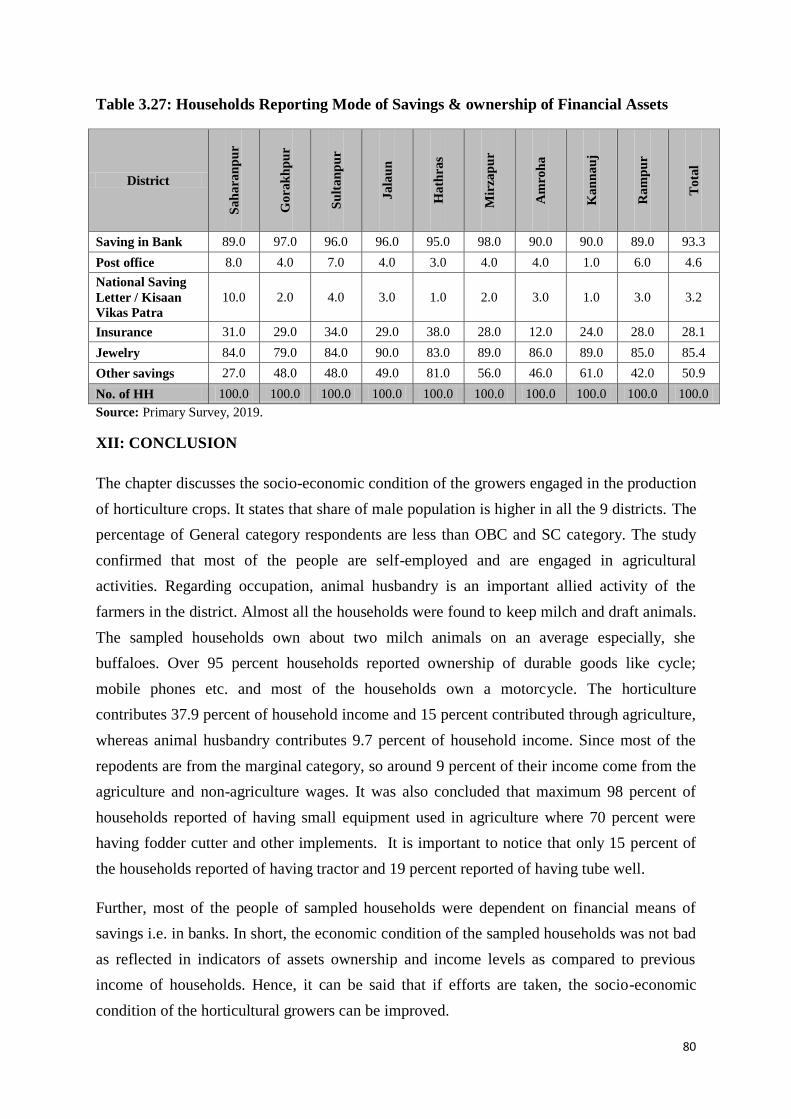
80
Table 3.27: Households Reporting Mode of Savings & ownership of Financial Assets
District
Sah
ara
np
ur
Gora
kh
pu
r
Su
ltan
pu
r
Jala
un
Hath
ras
Mir
zap
ur
Am
roh
a
Kan
nau
j
Ram
pu
r
Tota
l
Saving in Bank 89.0 97.0 96.0 96.0 95.0 98.0 90.0 90.0 89.0 93.3
Post office 8.0 4.0 7.0 4.0 3.0 4.0 4.0 1.0 6.0 4.6
National Saving
Letter / Kisaan
Vikas Patra
10.0 2.0 4.0 3.0 1.0 2.0 3.0 1.0 3.0 3.2
Insurance 31.0 29.0 34.0 29.0 38.0 28.0 12.0 24.0 28.0 28.1
Jewelry 84.0 79.0 84.0 90.0 83.0 89.0 86.0 89.0 85.0 85.4
Other savings 27.0 48.0 48.0 49.0 81.0 56.0 46.0 61.0 42.0 50.9
No. of HH 100.0 100.0 100.0 100.0 100.0 100.0 100.0 100.0 100.0 100.0
Source: Primary Survey, 2019.
XII: CONCLUSION
The chapter discusses the socio-economic condition of the growers engaged in the production
of horticulture crops. It states that share of male population is higher in all the 9 districts. The
percentage of General category respondents are less than OBC and SC category. The study
confirmed that most of the people are self-employed and are engaged in agricultural
activities. Regarding occupation, animal husbandry is an important allied activity of the
farmers in the district. Almost all the households were found to keep milch and draft animals.
The sampled households own about two milch animals on an average especially, she
buffaloes. Over 95 percent households reported ownership of durable goods like cycle;
mobile phones etc. and most of the households own a motorcycle. The horticulture
contributes 37.9 percent of household income and 15 percent contributed through agriculture,
whereas animal husbandry contributes 9.7 percent of household income. Since most of the
repodents are from the marginal category, so around 9 percent of their income come from the
agriculture and non-agriculture wages. It was also concluded that maximum 98 percent of
households reported of having small equipment used in agriculture where 70 percent were
having fodder cutter and other implements. It is important to notice that only 15 percent of
the households reported of having tractor and 19 percent reported of having tube well.
Further, most of the people of sampled households were dependent on financial means of
savings i.e. in banks. In short, the economic condition of the sampled households was not bad
as reflected in indicators of assets ownership and income levels as compared to previous
income of households. Hence, it can be said that if efforts are taken, the socio-economic
condition of the horticultural growers can be improved.

81
Chapter 4
Area, Production and Productivity of Various Horticulture Crops - An
Empirical Investigation
It is no doubt that the diverse climate of Uttar Pradesh is suitable for producing all kinds of
horticultural crops. In fact, Uttar Pradesh holds a leading position in total production of
horticultural crops in the India as for more than 92 percent of small holding farmers,
horticultural crops are the main source of higher income, employment and nutrition per unit
area (uphorticulture.gov.in). With the increasing importance of horticultural crops its
producers are aware and are improving economic status by adopting the horticultural crops
by optimum utilization of the available resources. Horticultural crops are diverse in nature be
it all kinds of fruits, vegetables, flowers, medicinal and aromatic crops, root and tuber crops,
spices and bee-keeping as well as mushroom cultivation as a subsidiary enterprise along with
their processing and value addition.
Horticulture crops have an important contribution in the State‟s gross domestic production of
the agricultural sector. Due to the increasing demand and important contribution in
agricultural sector, horticultural crops are understood to have become an area of priority. For
the commercialisation of horticultural crops and diversification of agriculture in the state,
various programmes are being implemented within the state by the State government like
expansion of area, rejuvenation of old mango, guava and aonla orchards, production of
quality planting material and post harvest management etc (uphorticulture.gov.in).
Department of Horticulture and Food Processing of the State Government, Uttar Pradesh is
making efforts for the continuous development of the horticulture crops by implementing
various schemes for fruits, vegetables, potato, flowers, spices, medicinal and aromatic plants,
betel-vine development along with subsidiary enterprises like bee-keeping, mushroom
production, food processing and cultivation of betel-vine. Presently, various schemes are
being implemented viz. Integrated Mission for Development of Horticulture, establishment of
drip/sprinkler irrigation system, National Mission on Medicinal Plants, development of
horticulture in schedule caste/tribe areas, Rashtriya Krishi Vikas Yojana and food processing
development schemes in various districts. In the year 2015-16 in Bundelkhandand and
Vidhya region, beneficiary farmers were given Rs.3,000 per hectare for three years per month
as an incentive for establishing orchards in 0.2 hectare to 1 hectare with fencing to be done by

82
the beneficiary himself to establish new orchard in their own field and also to ensure the
longevity in established orchards. Besides this, under Bundelkhand Special Package various
programs were also implemented. At various departmental production unit grafted, seedling
and ornamental plants are produced and are being made available to the takers at no profit-
loss basis. Along with this, training programmes for bee keeping, betel development and
mushroom production etc. are also being promulgated in various districts. Moreover, to
promote the ensured development of food processing within the state, the Uttar Pradesh Food
Processing Industry Policy -2012 has also been propagated by state government through
interest subsidies, Quality & Certification Market Development, Research and Development
and exports is promoted along with provision of various subsidies and concession for
establishment of industries within the state. Furthermore, through promulgation of Uttar
Pradesh Potato Development Policy-2014 various subsidy and concession are promoted for
the planned development of main and important potato crop in the state. Evidently, by
promulgation and implementation of such policies value addition could be ensured and which
also results into the benefits to the producers and consumers, and hence forth the overall
development of the state.
I: Area, Production and Productivity:
Horticulture has emerged as one of the major agricultural activities as there has been a
substantial increase in both area and production of horticulture crops in the State of Uttar
Pradesh. It is well recognized that the horticulture crops have the inherent advantage of
providing higher productivity per unit area of land as compared to other crops, resulting in
higher income and employment generation in rural areas. Thus, it is imperative to study the
area, production and productivity of various horticulture crops in the State. In this context,
the present chapter deals in detail the area and production of various horticulture crops on
basis of the field survey in 9 selceted districts of 9 agro climatic zones of uttar Pradesh.
Table 4.1 shows district wise area under various horticulture crops as percent to total Gross
Cropped area i.e. 1157 hectares. Food grains constitute nearly about 49.1 percent of area
whereas total fruits crop constitute about 19.3 percent of area followed by about 16.3 percent
of area by total vegetable crops in all districts. It is important to notice that total cash crops
cover 10 percent of total gross cropped area where as the area covered by spices, flowers and
other crops is much less in all the selected districts. This shows that food grains, fruits and
vegetables dominate in selected districts as compared to flowers, spices and other crops.

83
Further, the table explains that out of total gross cropped area in Saharanpur, the maximum
area is covered by fruits crop cultivation i.e. 46.6 percent followed by food grain cultivation
i.e. 42.8 percent of total area. This shows that Saharanpur is purely a fruit belt area as
percentage of total area under vegetable cultivation is very low i.e. only 6 percent. It is worth
noting the the percentage of area under spices crop is merely zero. Further, among all the
districts specialization in foodgrains cultivation is relatively higher than other crop
cultivation. Gorakhpur is found to be specialized under food-grains followed by cash crops,
vegetables and fruit crops. Kannauj nearly contributed 28.3 percent of total area under cash
crops after food grain and the area under fruit crop is nil. Rampur is found to be a vegetable
belt after food grain cultivation with no area to be found under flower cultivation.
Table 4.1: District wise Area under Different Horticulture Crops on Sampled Farms in
Selected Districts of Uttar Pradesh
(Area in Hectare)
Sa
ha
ran
pu
r
Go
rak
hp
ur
Su
lta
np
ur
Ja
lau
n
Ha
thra
s
Mir
zap
ur
Am
roh
a
Ka
nn
au
j
Ram
pu
r
To
tal
Foodgrains
105.20 48.40 64.40 84.80 49.60 86.00 46.40 25.60 58.00 568.00
(42.8) (51.7) (64.1) (45.5) (46.5) (63.6) (43.6) (42.5) (47.0) (49.1)
Fruits
114.40 12.40 5.20 6.80 22.40 21.20 22.40 0.00 18.00 222.80
(46.6) (13.4) (5.3) (3.6) (21.0) (15.7) (21.1) (0.0) (14.5) (19.3)
Vegetables
14.80 14.00 22.80 59.60 10.00 14.00 13.60 7.60 32.40 188.40
(6.0) (15.0) (22.6) (32.0) (9.4) (10.4) (12.8) (12.6) (26.1) (16.3)
Spices
0.08 0.16 0.80 3.32 0.48 2.32 0.16 0.60 9.36 17.28
(0.0) (0.2) (0.8) (1.8) (0.5) (1.7) (0.1) (1.0) (7.6) (1.5)
Flowers
0.00 0.00 0.00 7.72 0.00 5.76 0.00 9.08 0.00 22.56
(0.0) (0.0) (0.0) (4.2) (0.0) (4.3) (0.0) (14.9) (0.0) (1.9)
Cash Crops
8.92 16.52 6.32 20.76 23.76 1.68 19.40 17.16 3.32 117.84
(3.6) (17.7) (6.3) (11.2) (22.4) (1.3) (18.3) (28.3) (2.7) (10.2)
Other Crops
2.24 1.88 0.88 3.28 0.36 4.12 4.32 0.44 2.64 20.16
(0.9) (2.0) (0.9) (1.8) (0.3) (3.1) (4.1) (0.7) (2.1) (1.7)
Total Gross Cropped Area*
246 94 100 186 106 135 106 61 124 1157
(100) (100) (100) (100) (100) (100) (100) (100) (100) (100)
Source: Primary Survey, 2019.
Note: Figures in brackets shows percentages to *Total Gross Cropped Area in hectare

84
Figure 4.1: District wise Area under Different Horticulture Crops in
Selected Districts of Uttar Pradesh
(Area in Hectare)
The below table 4.2 explains the area, production and productivity of different horticulture
crops on the basis of field survey of selected districts which shows that out of total gross
cropped area, the food grain cultivation dominates amongst all horticulture crops followed by
fruits, vegetables and cash crops. To our dismay we found that the area under spices and
flower cultivation have very low proportion in total gross cropped area in selected districts. In
the table given below, it is clear that maximum area is under foodgrain cultivation and is
covered by Mirzapur and Sultanpur, whereas area under foodgrain is least in Saharanpur
district. It also reveals that area under fruit cultivation is highest in Saharanpur whereas
proportion of area under fruit crops is less for Sultanpur and Jalaun districts. The reason for
such differences could be the agro-climatic conditions whici promote fruit crops and hinder
thw cultivation of various vegetable crops. For vegetable crops it was found that the area was
highest for Jalaun and lowest for Saharanpur.
Table 4.2: District wise Area, Production and Yield of Different Crops on Sampled
farms in Selected Districts of Uttar Pradesh
Sa
ha
ran
pu
r
Go
rak
hp
ur
Su
lta
np
ur
Ja
lau
n
Ha
thra
s
Mir
zap
ur
Am
roh
a
Ka
nn
au
j
Ram
pu
r
To
tal
Foodgrains
A 105.2 48.4 64.4 84.8 49.6 86.0 46.4 25.6 58.0 568.0
P 4593.0 1721.0 1942.0 2386.0 1529.0 2437.0 2125.0 1469.0 2691.0 20892.0
Y 43.8 35.8 30.3 28.3 31.0 28.3 46.0 57.0 46.3 36.8
Fruits
A 114.4 12.4 5.2 6.8 22.4 21.2 22.4 0.0 18.0 222.8
P 4940.0 1789.0 906.0 1002.0 2652.0 1086.0 62.0 0.0 0.0 12437.0
Y 43.0 142.5 169.8 151.8 119.0 51.0 2.8 0.0 0.0 55.8

85
Sa
ha
ran
pu
r
Go
rak
hp
ur
Su
lta
np
ur
Ja
lau
n
Ha
thra
s
Mir
zap
ur
Am
roh
a
Ka
nn
au
j
Ram
pu
r
To
tal
Vegetables
A 14.8 14.0 22.8 59.6 10.0 14.0 13.6 7.6 32.4 188.4
P 3185.0 2048.0 3902.0 6130.0 1692.0 2388.0 3736.0 1347.0 9387.0 33814.0
Y 214.5 146.0 172.0 103.0 170.3 170.5 275.0 176.8 291.5 179.5
Spices
A 0.1 0.2 0.8 3.3 0.5 2.3 0.2 0.6 9.4 17.3
P 6.0 13.0 57.5 187.0 42.0 93.5 10.0 34.5 852.0 1295.5
Y 75.0 81.3 70.5 56.8 87.5 40.0 69.5 59.5 90.8 75.0
Flowers
A 0.0 0.0 0.0 7.7 0.0 5.8 0.0 9.1 0.0 22.6
P 0.0 0.0 0.0 708.0 0.0 1392.0 0.0 669.5 0.0 2770.0
Y 0.0 0.0 0.0 91.8 0.0 241.3 0.0 74.0 0.0 122.8
Cash Crops
A 8.9 16.5 6.3 20.8 23.8 1.7 19.4 17.2 3.3 117.8
P 3962.5 2249.5 1527.6 3307.0 5263.0 385.0 10701.0 4472.0 1730.0 33597.0
Y 444.3 136.3 241.8 159.5 221.5 227.5 551.3 260.5 521.0 285.3
Other Crops
A 2.2 1.9 0.9 3.3 0.4 4.1 4.3 0.4 2.6 20.2
P 310.0 256.0 102.3 408.0 45.0 554.0 1255.0 128.0 609.0 3667.3
Y 138.5 136.0 117.3 125.3 125.0 134.0 290.8 291.0 231.0 182.0
Total
A 246.0 93.6 100.4 185.6 106.4 135.2 106.0 60.8 123.6 1157.2
P 16996.0 8077.0 8436.0 14128.0 11223.0 8335.0 17889.0 8120.0 15269.0 108473.0
Y 69.0 86.5 84.3 76.0 105.8 61.8 168.8 134.0 123.5 93.8
Source: Primary Survey, 2019.
Note: A= Area (in Hectare), Production (in Qtl) and Productivity or Yield (in Qtl per Hectare)
Further, the given table also explains the production and productivity of different crops as it
is important to analyze the productivity of various horticulture crops to determine the growth
rate in particular district as productivity increase of any crops is an ultimate indicator of
success of any district. In case of foodgrains crops, it is clear from the table that total
productivity was highest in Kannauj i.e. 57 Qntl. per hectare followed by Rampur, Amroha
and Saharanpur due to higher productivity of wheat, mustard and other pulses in selected
district. The lowest yield for foodgrains crop was found in Sultanpur district due to less
irrigation facility. Similarly, if productivity of fruit crops is seen it was found that Kannauj
and Rampur do not contribute to the fruit crops whereas yield for fruit crop was highest in
Sultanpur and Jalaun district. Further, under total vegetable crops, the yield was highest for
Rampur and Kannauj and it was lowest for Jalaun. The reason for low productivity may be
due to less irrigation facility in jalaun district.
Further, the table reveals that under spices crops the yield was highest in Rampur district
followed by Gorakhpur where Garlic and Chilli was major spice crops. The productivity

86
under spice crop was least under Mirzapur. It is important to notice that yield under flower
crops was highest only for Mirzapur i.e. 241.25 quintal Per hectare followed by Jalaun,
Kannauj and yield was found to be nil for Saharanpur, Gorakhpur, Sultanpur, Hathras and
Amroha. Under cash crop, the productivity was highest for cash crops in Amroha and lowest
for Gorakhpur.
Table 4.3 shows area, production and productivity of different crops on sample farms and
reveals that the proportion of total area under wheat and paddy cultivation is dominant in
almost every district. The cultivation of wheat is highest in Jalaun followed by Saharanpur
and Mirzapur whereas the proportion of area is lowest in Hathras and Jalaun. In Hathras, the
area per hectare of other crops (pulses) cover almost 30.68 hectares area which comprises of
jowar and bajara. In kannauj, the area of 15.48 hectare is covered by maize whereas
chickpeas and mustard cover a very low area in Gorakhpur and Mirzapur respectively.
Further, if productivity of individual crops is compared to total food grain is observed, it was
found that the productivity of wheat was highest in Amroha with 47.75 qntl per hectare
followed by Rampur, Kannauj and Hathras. Further, it shows that highest area for paddy
cultivation is for Saharanpur where the productivity from given area is 46.25 quintal per
hecatre. It is important to notice that Kannauj has shown much improvement in paddy
cultivation with 53.5 qntl per hectare with just 1.6 hecare of area under it. Area under Maize
cultivation is highest in Kannauj which has productivity of 64.75 qntl per hecatre of yield. It
worth noticing that area under pulses is highest for Hathras but productivity has not shown
much improvement as it is seen that Amroha recorded low area has large productivity.
Table 4.3: Area, Production and Productivity of Individual Crops in Foodgrain on
Sample Farms
Crops
Sah
ara
np
u
r
Gora
kh
pu
r
Su
ltan
pu
r
Jala
un
Hath
ras
Mir
zap
ur
Am
roh
a
Kan
na
uj
Ram
pu
r
Tota
l
Wheat
A
51.6 26.4 28.4 54.8 16.4 43.6 22.8 8.4 29.2 282.0
P
2108.0 878.0 808.0 2118.0 679.0 1162.0 1096.0 378.0 1379.0 10605.0
Y
41.0 33.3 28.3 38.5 41.3 26.8 47.8 44.8 47.3 37.8
Paddy
A
53.6 20.8 32.0 0.4 1.3 34.7 20.8 1.6 28.8 194.0
P
2485.0 795.0 1036.0 6.0 60.0 1143.0 925.0 75.0 1311.0 7836.0
Y
46.3 38.0 32.3 15.0 45.5 33.0 44.8 53.5 45.5 40.5

87
Crops
Sah
ara
np
u
r
Gora
kh
pu
r
Su
ltan
pu
r
Jala
un
Hath
ras
Mir
zap
ur
Am
roh
a
Kan
nau
j
Ram
pu
r
Tota
l
Chick Peas
A 0.0 0.5 0.1 0.0 0.0 0.0 0.0 0.1 0.0 0.8
P 0.0 36.0 5.0 0.0 0.0 0.0 0.0 10.0 0.0 51.0
Y 0.0 75.0 35.8 0.0 0.0 0.0 0.0 125.0 0.0 72.8
Maize
A 0.0 0.2 1.7 0.6 0.9 0.2 0.1 15.5 0.0 19.2
P 0.0 7.0 55.0 12.0 28.0 4.0 3.0 1002.8 0.0 1112.0
Y 0.0 29.3 32.8 20.0 30.5 25.0 37.5 64.8 0.0 58.0
Mustard
A 0.0 0.2 0.3 2.0 0.0 0.4 0.2 0.0 0.1 3.2
P 0.0 4.5 7.5 29.0 0.0 4.0 4.0 1.5 2.0 53.0
Y 0.0 28.3 23.5 14.3 0.0 10.0 21.8 37.5 25.0 16.3
Other
(Pulses)
A 0.0 0.2 1.5 27.7 30.7 7.2 2.4 0.3 0.0 70.0
P 0.0 2.0 30.3 227.0 761.5 124.0 96.8 2.0 0.0 1243.6
Y 0.0 12.5 20.5 8.3 24.8 17.0 40.5 6.3 0.0 17.8
Total
A 105.2 48.4 64.4 84.8 49.6 86.0 46.4 25.6 58.0 568.0
P 4593.0 1721.0 1942.0 2386.0 1529.0 2437.0 2125.0 1469.0 2691.0 20892.0
Y 43.8 35.8 30.3 28.3 31.0 28.3 46.0 57.0 46.3 36.8
Source: Primary data
Note: A= Area (In hectare), Production (In Qtl) and Productivity or Yield (In Qtl per hectare)
Figure 4.2: Area under of Individual Foodgrain Crops on Sample Farms (in percent)
Source: Primary Survey, 2019.
Note: others include arhar, moong, masoor, gram, seasame, urad, jowar, bajara.

88
Figure 4.3: Yield of Individual Foodgrain Crops on Sample Farms (in percent)
Table 4.4 shows area, production and productivity of Individual fruit crops on sample farms.
The table highlights that the sample farms in Saharanpur, Gorakhpur and Amroha district
cultivated mango as their major fruit as around 34 percent of the area was devoted to this
fruit. The yield per hectare was estimated around 82.3 quintal per hectare in Saharanpur
followed by 46.0 qntl per hectare in Gorakhpur and Jalaun with 44.5 qntl per hectare
respectively. No doubt, favorable climatic conditions can be responsible for the growth of
fruits in these districts. District Hathras has no area under Mango cultivation due to

89
unfavorable climatic conditions and major fruit in the same district was Guava as 39.2
percent of total area with productivity of 119.75 quintal per hectare was under its cultivation.
In addition to the above fruits mentioned, it was found that the Sultanpur cultivated banana
and other fruits such as muskmelon, sugar apple, etc. The estimated yield was 252.5 quintal
per hectare for others fruits in Sultanpur followed by Mirzapur where the area under 10.2
hectares was under other frouits and the yield was 82.3 qtl per hectares. Hence, the table
reveals that yield of all fruit cultivation is much better in Sultanpur, Jalaun and Hathrus
districts as compared to other sample district.
Table 4.4: Area, Production and Productivity of Individual Crops in Fruits on Sample Farms
Fruit Crops
Sah
aran
p
ur
Gorak
hp
ur
Su
ltan
pu
r
Jala
un
Hath
ras
Mir
zap
ur
Am
roh
a
Ram
pu
r
Tota
l
Mango
A 97.2 11.0 0.6 1.8 0.0 6.0 21.6 10.6 148.8
P 4476.0 910.0 20.0 80.0 0.0 0.0 20.0 0.0 5506.0
Y 46.0 82.3 31.3 44.5 0.0 0.0 1.0 0.0 37.0
Guava
A 4.0 0.0 0.3 0.6 22.0 4.0 0.6 7.4 38.8
P 80.0 0.0 67.0 6.0 2640.0 245.0 30.0 0.0 3068.0
Y 20.0 0.0 223.3 10.0 119.8 61.3 50.0 0.0 78.8
Banana
A 0.0 1.4 2.6 1.6 0.0 1.1 0.0 0.0 6.8
P 0.0 875.0 652.0 770.0 0.0 0.0 0.0 0.0 2297.0
Y 0.0 625.0 250.8 481.3 0.0 0.0 0.0 0.0 344.5
Others
A 13.4 0.1 3.6 2.6 0.2 10.2 0.2 0.0 30.2
P 384.0 4.0 902.0 146.0 12.0 840.9 12.0 0.0 2300.9
Y 28.8 40.0 253.3 56.3 50.0 82.3 62.5 0.0 76.0
Total
A 114.4 12.4 7.2 6.8 22.4 21.2 22.4 18.0 222.8
P 4940.0 1789.0 906.0 1002.0 2652.0 1086.0 62.0 0.0 12437.0
Y 43.0 142.5 169.8 151.8 119.0 51.0 2.8 0.0 55.8 Source: Primary data
Note: A= Area (In Hectare), Production (In Qtl) and Productivity or Yield (In Qtl per Hectare)

90
Figure 4.4: Percent Area under individual Fruit crops in Selected Districts of Uttar Pradesh
Source: Primary data
Note: other fruits include litchi, watermelon, muskmelon, papaya, sugarapple, lemone, pomengrate, apple, raspberry, peach.
Figure 4.5: Yield of individual Fruit crops in Selected Districts of Uttar Pradesh (in qtl. Per hect)
Table 4.6 examines the area, production and productivity of individual vegetable crops on
sample farms where it was found that in Saharanpur district, cauliflower was the major
vegetable cultivated as it covered maximum 37.04 percent hectare of area with its

91
productivity of 203 quintal per hectare which was followed by cabbage with 1.95 hectare of
area and productivity of 383.0 quintal per hectare.
Further, in Jalaun district, it was found that area under other crops (green peas, beans, arbi,
spinach etc) was maximum i.e. 30.63 hectare of area as it mainly covered green pea
production with productivity of 72.75 qntl per hectare. It is important to notice that the
maximum yield was for other crops in Kannauj with its productivity of 416.75 qntl per
hectare from 0.12 hectares area under it. Tomato was found to be major crop cultivated in
Kannauj as it covered almost 35.36 hectares of area with 181.0 quintal per hectare of
productivity.
Lady finger was the major vegetable crop in Hathras as area covered was 5.32 hectare with
yield of 112.0 quintal per hectare. The maximum productivity of lady finger was highest in
Saharanpur i.e. 227.25 quintal per hectare from just 0.12 hectare of land under its cultivation.
Overall, the table states that the total yield under vegetable crops was much better in Rampur
and Amroha districts.
Table 4.5: Area, Production and Productivity of Individual Vegetable Crops on
Sample Farms in Uttar Pradesh
Vegetable
Crops
Sa
ha
ran
pu
r
Go
rak
hp
ur
Su
lta
np
ur
Ja
lau
n
Ha
thra
s
Mir
zap
ur
Am
roh
a
Ka
nn
au
j
Ra
mp
ur
To
tal
Gourd
(lauki)
A 0.04 2.04 3.16 2.64 0.68 1.16 2.24 0.00 2.80 14.80
P 15.00 358.00 668.00 363.00 285.00 115.00 767.00 0.00 1596.00 4167.00
Y 375.00 175.25 212.75 138.50 419.00 100.50 343.00 0.00 573.25 283.75
Cucumber
A 0.32 0.44 0.00 0.20 0.00 0.00 0.04 0.00 0.20 1.20
P 98.00 150.00 0.00 30.00 0.00 0.00 15.00 0.00 40.00 333.00
Y 295.25 341.00 0.00 150.00 0.00 0.00 375.00 0.00 200.00 274.75
Cauliflower
(phul gobhi)
A 13.64 0.96 4.64 0.00 1.92 2.32 0.60 0.32 11.88 36.40
P 2767.00 160.00 876.00 0.00 537.00 367.00 75.00 33.00 3630.00 8445.00
Y 203.00 170.25 189.50 0.00 282.75 157.50 125.00 103.25 305.50 233.25
Cabbage
(band gobhi)
A 0.72 0.06 1.36 0.00 0.00 0.00 0.04 0.00 0.00 2.00
P 275.00 16.00 353.00 0.00 0.00 0.00 25.00 0.00 0.00 669.00
Y 382.00 266.75 256.50 0.00 0.00 0.00 781.25 0.00 0.00 305.75
Lady finger
A 0.12 3.56 1.00 0.00 5.32 0.08 0.00 0.00 0.08 10.00
P 30.00 381.20 96.50 0.00 596.00 10.00 0.00 0.00 7.00 1121.00
Y 227.25 106.75 95.75 0.00 112.00 125.00 0.00 0.00 87.50
110.00

92
Ridge gourd
(turai)
A 0.00 3.96 1.68 0.48 0.20 0.12 2.08 0.24 0.72 9.60
P 0.00 651.00 238.00 101.00 8.00 15.00 458.00 19.50 214.00 1705.00
Y 0.00 164.00 142.75 219.50 40.00 125.00 221.50 88.75 290.75 180.50
Bitter gourd
(karela)
A 0.00 0.96 0.00 0.00 0.20 0.16 0.00 0.00 0.84 2.00
P 0.00 127.00 0.00 0.00 5.00 8.00 0.00 0.00 45.50 186.00
Y 0.00 130.75 0.00 0.00 25.00 50.00 0.00 0.00 54.75 85.75
Tomato
A 0.00 0.76 6.92 7.00 0.24 7.80 6.84 6.72 0.20 36.40
P 0.00 95.00 1134.00 1353.00 36.00 1614.00 2147.00 1216.00 70.00 7665.00
Y 0.00 128.50 163.75 193.25 150.00 207.50 314.50 181.00 350.00 210.50
Brinjal
A 0.00 0.88 1.88 3.64 1.32 1.52 0.24 0.24 7.60 17.20
P 0.00 70.00 261.00 962.00 223.00 201.00 50.00 28.00 2112.00 3907.00
Y 0.00 81.50 140.25 264.25 169.00 133.00 208.25 116.75 277.50 226.00
Others
A 0.00 0.44 2.84 45.64 0.08 0.88 1.56 0.12 8.12 59.68
P 0.00 40.00 328.00 3321.00 2.00 58.00 199.20 50.00 1702.00 5700.00
Y 0.00 91.00 114.75 72.75 25.00 66.00 129.00 416.75 209.25 95.50
Total
A 14.80 14.00 22.80 59.60 10.00 14.00 13.60 7.60 32.40 188.40
P 3185.00 2048.00 3902.00 6130.00 1692.00 2388.00 3736.00 1347.00 9387.00 33814.0
0
Y 214.50 146.00 172.00 103.00 170.25 170.50 275.00 176.75 291.50 179.50
Source: Primary Survey, 2019.
Note: A= Area (In hectare), Production (In Qtl) and Productivity or Yield (In Qtl per hectare)
Figure 4.6: Area under Individual Vegetable Crops in Selected Districts of Uttar Pradesh (inpercent)
Source: Primary data
Note: Other crops include green peas, arbi, beans, spinach, raddish, pumpkin, soya, mint, gawar, carrot, capsicum.

93
Figure 4.7: Yield of Individual VegetableCrops in Selected Districts of Uttar Pradesh (in Qtl. Per hec)
Source: Primary data
Note: Other crops include green peas, arbi, beans, spinach, raddish, pumpkin, soya, mint, gawar, carrot, capsicum.
Table 4.6: Area, Production and Productivity of Individual Crops in Spice-Crop on
Sample Farms
Spice Crops
Sa
ha
ran
pu
r
Go
rak
hp
ur
Su
lta
np
ur
Ja
lau
n
Ha
thra
s
Mir
zap
ur
Am
roh
a
Ka
nn
au
j
Ra
mp
ur
To
tal
Chillies
A 0.08 0.08 0.08 3.32 0.48 2.32 0.16 0.28 7.00 13.60
P 6.00 6.00 12.00 187.00 42.00 93.50 10.00 17.00 696.00 1070.00
Y 75.00 75.00 150.00 56.75 87.50 40.00 69.50 65.50 99.50 77.75
Garlic
A 0.00 0.08 0.36 0.00 0.00 0.00 0.00 0.12 2.40 2.80
P 0.00 7.00 25.50 0.00 0.00 0.00 0.00 4.50 156.00 193.00
Y 0.00 87.50 74.25 0.00 0.00 0.00 0.00 37.50 65.25 65.75
Corriander
A 0.00 0.00 0.24 0.00 0.00 0.00 0.00 0.20 0.00 0.40
P 0.00 0.00 7.00 0.00 0.00 0.00 0.00 13.00 0.00 20.00
Y 0.00 0.00 31.75 0.00 0.00 0.00 0.00 65.00 0.00 47.50
Turmeric
A 0.00 0.00 0.12 0.00 0.00 0.00 0.00 0.00 0.00 0.00
P 0.00 0.00 12.00 0.00 0.00 0.00 0.00 0.00 0.00 12.00
Y 0.00 0.00 107.25 0.00 0.00 0.00 0.00 0.00 0.00 107.25
Sauf
A 0.00 0.00 0.08 0.00 0.00 0.00 0.00 0.00 0.00 0.00
P 0.00 0.00 1.00 0.00 0.00 0.00 0.00 0.00 0.00 1.00
Y 0.00 0.00 16.75 0.00 0.00 0.00 0.00 0.00 0.00 16.75
Total
A 0.08 0.16 0.88 3.32 0.48 2.32 0.16 0.60 9.36 17.28
P 6.00 13.00 57.50 187.00 42.00 93.50 10.00 34.50 852.00 1295.00
Y 75.00 81.25 70.50 56.75 87.50 40.00 69.50 59.50 90.75 75.00
Source: Primary data
Note: A= Area (In hectare), Production (In Qtl) and Productivity or Yield (In Qtl per hectare)

94
Examination of table 4.6 shows the area and its productivity of total individual spice crops on
sample farms in selected districts of Uttar Pradesh. The table reveals that chilli was the major
spice crop in almost most of the selected districts as it covered almost 13.60 hectare of total
area under total spice crops of 17.28 hectares. Further, table reveals that chilli was the major
spice crop in Rampur, Jalaun and Mirzapur districts. 2.80 hectare of area is covered by Garlic
with highest productivity in Gorakhpur district followed by Sultanpur and Kannauj.
Cultivation of turmeric covered very low area and is found only in Sultanpur district with its
yield of 107.25 quintal per hectare. Sauf and Coriander contributes to very low area of
cultivation with less than 0.4 hectare of land and its productivity is nearly 47.5 quintal per
hectare on average. Hence the above table reveals that chilli and garlic was the major spice
crops in selected sample district as compared to Coriander, Turmeric and Sauf.
Figure 4.8: Area under Individual Spice Crops in Selected Districts of Uttar Pradesh
(in percent)
Source: Primary data
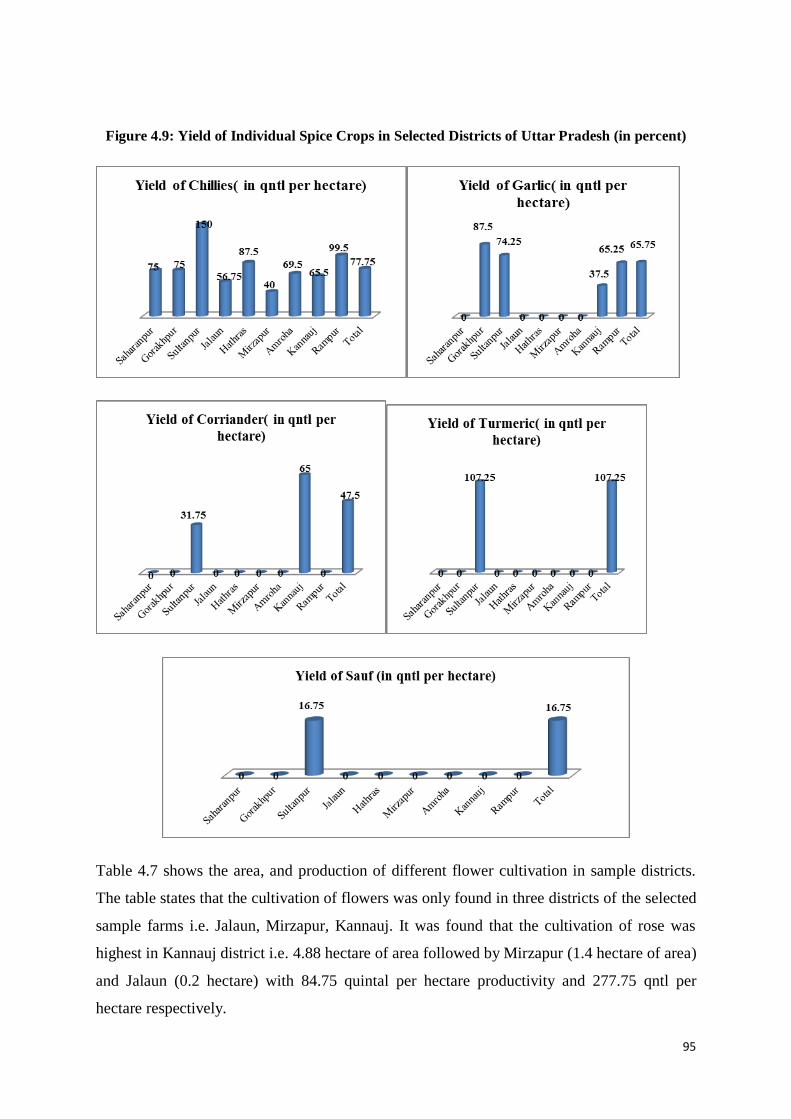
95
Figure 4.9: Yield of Individual Spice Crops in Selected Districts of Uttar Pradesh (in percent)
Table 4.7 shows the area, and production of different flower cultivation in sample districts.
The table states that the cultivation of flowers was only found in three districts of the selected
sample farms i.e. Jalaun, Mirzapur, Kannauj. It was found that the cultivation of rose was
highest in Kannauj district i.e. 4.88 hectare of area followed by Mirzapur (1.4 hectare of area)
and Jalaun (0.2 hectare) with 84.75 quintal per hectare productivity and 277.75 qntl per
hectare respectively.

96
Among all the flower cultivation, the area of marigold cultivation was highest with its
productivity at 122.5 quintal per hectare whereas, it was seen that kannauj has no role in
marigold cultivation whereas the area was highest in Jalaun followed by Mirzapur. Jasmine
flower cultivation was major flower crop in Kannauj district with 63.25 quintal per hectare
yield. Other than this flower cultivation, many other flowers such as gladiolus, Rajnikantha
etc has very low proportion of area and yield in selected sample farm. This reveals that rose,
marigold and jasmine was the major flower crop in the selected sample farms. However, an
effort should be made to raise the yield of popular flowers in the district by making all
efforts.
Table 4.7: Area, Production and Productivity of Individual Crops in Flowers on Sample Farms
Flowers APY Jalaun Mirzapur Kannauj Total
Rose
A 0.20 1.40 4.88 6.40
P 7.00 391.00 414.00 812.00
Y 35.00 277.75 84.75 125.25
Marigold
A 6.40 3.32 0.00 9.60
P 545.00 646.00 0.00 1191.00
Y 85.25 194.25 0.00 122.50
Gladiolus
A 0.32 0.00 0.00 0.40
P 33.00 0.00 0.00 33.00
Y 281.25 0.00 0.00 281.25
Rajnigandha
A 0.64 0.00 0.00 0.80
P 78.00 0.00 0.00 78.00
Y 122.00 0.00 0.00 122.00
Guldaudi
A 0.16 0.00 0.00 0.00
P 45.00 0.00 0.00 45.00
Y 281.25 0.00 0.00 281.25
Mehendi
A 0.00 0.00 0.80 0.80
P 0.00 0.00 42.00 42.00
Y 0.00 0.00 52.50 52.50
Jasmine
A 0.00 0.00 3.40 3.20
P 0.00 0.00 213.50 214.00
Y 0.00 0.00 63.25 63.25
Udahul
A 0.00 0.64 0.00 0.80
P 0.00 238.00 0.00 238.00
Y 0.00 372.00 0.00 372.00
Tagarh
A 0.00 0.40 0.00 0.40
P 0.00 117.00 0.00 117.00
Y 0.00 292.50 0.00 292.50
Total
A 7.72 5.76 9.08 22.56
P 708.00 1392.00 669.50 2769.50
Y 91.75 241.25 74.00 122.75
Source: Primary Survey, 2019.
Note: A= Area (In hectare), Production (In Qtl) and Productivity or Yield (In Qtl per hectare)

97
Figure 4.10: Area under Individual Flowers on Sampled Farms in Selected Districts
of Uttar Pradesh (in percent)
Figure 4.11: Yield of Individual Flowers on Sampled Farms in Selected Districts
of Uttar Pradesh (in Qtl. Per Hec)
Table 4.8 explains the area, production and its yield of individual crops in cash crops on
sample farms which shows that potato was the major cultivation in Hathras and Mirzapur
followed by Sultanpur and Kannauj. The yield per hectare of potato was 221.5 quintal per
hectare and 238.75 quintal per hectare in Hathras and Mirzapur districts. It was further seen
that Sugarcane was the major cash crop in Saharanpur district followed by Amroha and
Rampur. It was found that in same district, the yield per hectare was 456 quintal per hectare
which may be due to favorable climatic condition required for production of sugarcane.
Peanuts was only found to cover by Gorakhpur and Onion was found to be major cash crop in
Jalaun district which cover maximum area under onion cultivation with yield of 133.5 quintal
per hectare. This table reveals that cash crop cultivation was highest for potato crop followed
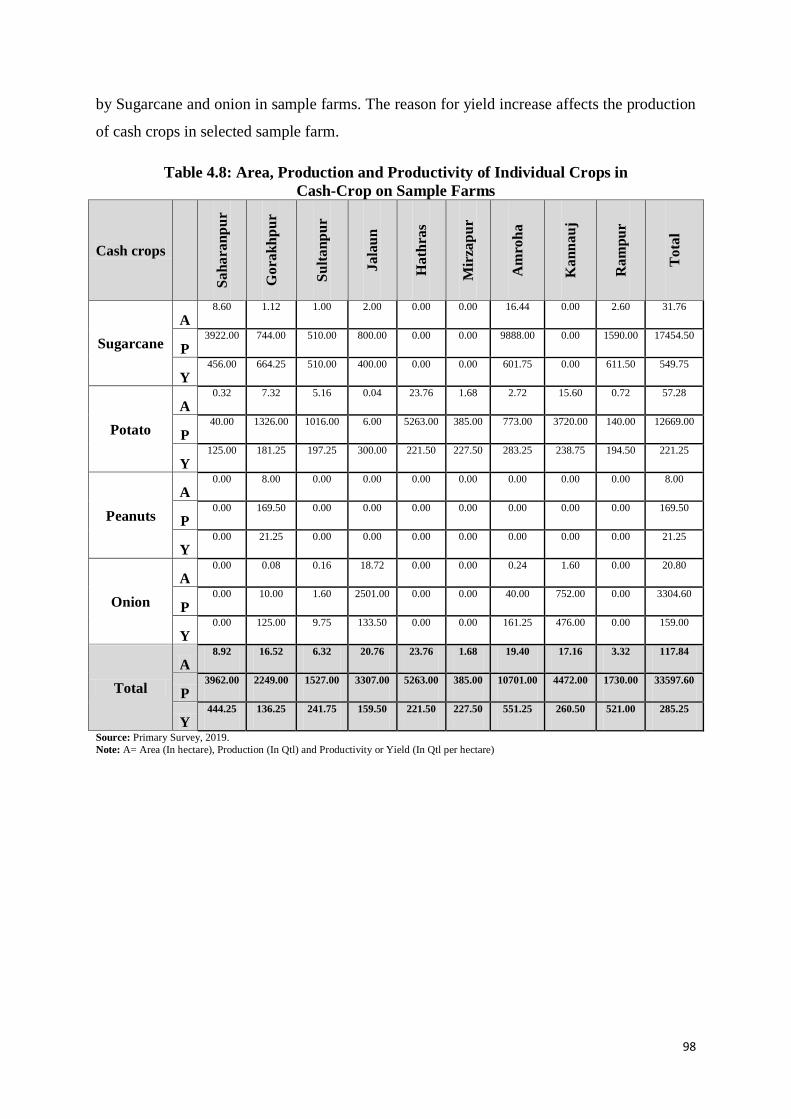
98
by Sugarcane and onion in sample farms. The reason for yield increase affects the production
of cash crops in selected sample farm.
Table 4.8: Area, Production and Productivity of Individual Crops in
Cash-Crop on Sample Farms
Cash crops
Sa
ha
ran
pu
r
Go
rak
hp
ur
Su
lta
np
ur
Ja
lau
n
Ha
thra
s
Mir
zap
ur
Am
roh
a
Ka
nn
au
j
Ra
mp
ur
To
tal
Sugarcane
A 8.60 1.12 1.00 2.00 0.00 0.00 16.44 0.00 2.60 31.76
P 3922.00 744.00 510.00 800.00 0.00 0.00 9888.00 0.00 1590.00 17454.50
Y 456.00 664.25 510.00 400.00 0.00 0.00 601.75 0.00 611.50 549.75
Potato
A 0.32 7.32 5.16 0.04 23.76 1.68 2.72 15.60 0.72 57.28
P 40.00 1326.00 1016.00 6.00 5263.00 385.00 773.00 3720.00 140.00 12669.00
Y 125.00 181.25 197.25 300.00 221.50 227.50 283.25 238.75 194.50 221.25
Peanuts
A 0.00 8.00 0.00 0.00 0.00 0.00 0.00 0.00 0.00 8.00
P 0.00 169.50 0.00 0.00 0.00 0.00 0.00 0.00 0.00 169.50
Y 0.00 21.25 0.00 0.00 0.00 0.00 0.00 0.00 0.00 21.25
Onion
A 0.00 0.08 0.16 18.72 0.00 0.00 0.24 1.60 0.00 20.80
P 0.00 10.00 1.60 2501.00 0.00 0.00 40.00 752.00 0.00 3304.60
Y 0.00 125.00 9.75 133.50 0.00 0.00 161.25 476.00 0.00 159.00
Total
A 8.92 16.52 6.32 20.76 23.76 1.68 19.40 17.16 3.32 117.84
P 3962.00 2249.00 1527.00 3307.00 5263.00 385.00 10701.00 4472.00 1730.00 33597.60
Y 444.25 136.25 241.75 159.50 221.50 227.50 551.25 260.50 521.00 285.25
Source: Primary Survey, 2019.
Note: A= Area (In hectare), Production (In Qtl) and Productivity or Yield (In Qtl per hectare)
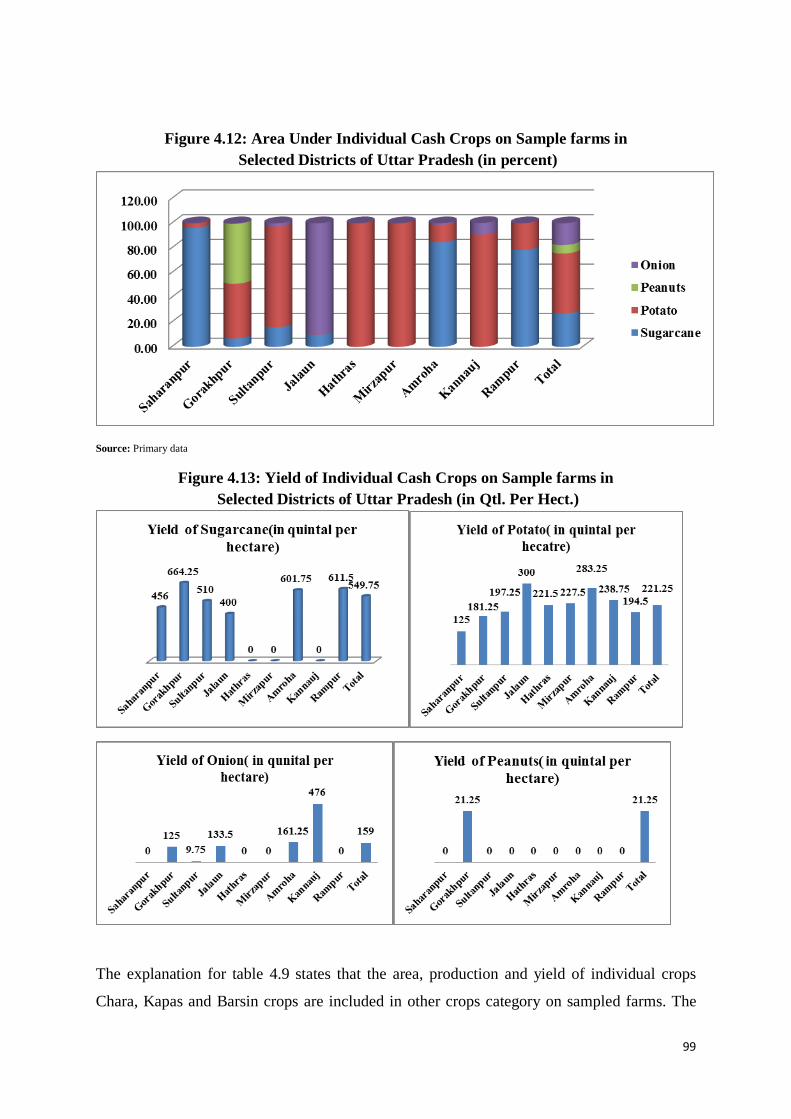
99
Figure 4.12: Area Under Individual Cash Crops on Sample farms in
Selected Districts of Uttar Pradesh (in percent)
Source: Primary data
Figure 4.13: Yield of Individual Cash Crops on Sample farms in
Selected Districts of Uttar Pradesh (in Qtl. Per Hect.)
The explanation for table 4.9 states that the area, production and yield of individual crops
Chara, Kapas and Barsin crops are included in other crops category on sampled farms. The

100
graph 4.10 and 4.11 shows area under different categories of Other Crops and also yield
thereof. It shows that the maximum area is contributed by Chara in almost all selected
sampled farms but in Hathras, the proportion of area of Kapas was found to be higher as
compared to area under Chara. Mirzapur, Gorakhpur and Rampur fully contribute towards
Chara. The area of barsin is much better in Sultanpur district. Hence, the table reveals that
overall proportion of Chara is higher than Kapas and Barsin in almost most of the selected
sampled farms. It shows the total area under other crops contribute to 20.16 hectare of area
with productivity of 182.00 quintal per hectare.
Table 4.9: Area, Production and Productivity of Individual Crops in Other crops on Sample
Farms
Other
Crops
Sa
ha
ran
p
ur
Go
rak
hp
u
r
Su
lta
np
ur
Ja
lau
n
Ha
thra
s
Mir
zap
ur
Am
roh
a
Ka
nn
au
j
Ra
mp
ur
To
tal
Chara
A 1.84 1.88 0.60 2.72 0.16 4.12 3.92 0.44 2.24 17.88
P 220.00 256.00 85.80 350.00 42.00 554.00 1195.00 128.00 569.00 3399.80
Y 119.50 135.75 148.00 129.75 262.50 134.00 305.00 291.00 254.50 190.00
Kapas
A 0.00 0.00 0.00 0.00 0.20 0.00 0.00 0.00 0.00 0.20
P 0.00 0.00 0.00 0.00 3.00 0.00 0.00 0.00 0.00 3.00
Y 0.00 0.00 0.00 0.00 15.00 0.00 0.00 0.00 0.00 15.00
Barsin
A 0.40 0.00 0.28 0.56 0.00 0.00 0.40 0.00 0.40 2.04
P 90.00 0.00 16.50 58.00 0.00 0.00 60.00 0.00 40.00 264.50
Y 225.00 0.00 56.50 103.50 0.00 0.00 150.00 0.00 100.00 129.00
Total
A 2.24 1.88 0.88 3.28 0.36 4.12 4.32 0.44 2.64 20.16
P 310.00 256.00 102.30 408.00 45.00 554.00 1255.00 128.00 609.00 3667.30
Y 138.50 136.00 117.25 125.25 125.00 134.00 290.75 291.00 231.00 182.00
Source: Primary Survey, 2019. Note: A= Area (In hectare), Production (In Qtl) and Productivity or Yield (In Qtl per hectare)

101
Figure 4.14: Area under Individual Other Crops on Sampled Farms (in percent):
Source: Primary data
Figure 4.15: Yield of Individual Other Crops on Sampled Farms (in Qtl. Per Hect.)

102
II: Cost Structure:
This section presents economics of cost structure involved in horticulture crops in sampled
farms from selected districts of our study. The primary survey incorporated 900 beneficiary
farmers in Uttar Pradesh. The nine selected districts from nine agro-climatic zones formed the
universe of our study. The cost incurred consists of two components, fixed cost and variable
cost. The fixed cost of perennial crops consists of initial planting and gestation period cost.
The variable cost is the running cost every year at the time of plant bearing fruit2. The major
components of variable costs in grapes were topping and pruning, manure and fertilizer and
harvesting and collection. Out of total cost,To study the cost structure the following items
have been taken into account: total cost of seeds, cost on land preparation, cost of plantation,
irrigation charges, cost on soil fertilizer, expenses on pesticides, value of hired human labour,
cost on wash brand packaging, transportation cost, govt. revenue, cost on cold storage, cost of
middlemen and others.
Table 4.10 highlights district wise details of cost structure involved in production of
foodgrains crops. It shows that labour cost i.e. hired human labour accounts for 18.4 percent
of total cost followed by the expenses on land preparation which was reported to be highest
for foodgrain cultivation and account for 17.8 percent of the total cost. Expenses on soil
fertilizers and irrigation charges were 15.0 percent of total cost. It was found that
transportation and packaging cost was fairly enough at 3 percent of the total cost. The
proportion of hired human labour cost was relatively higher for Saharanpur, Gorakhpur,
Sultanpur and Jalaun districts than cost incurred on other items. The proportion of cost
incurred on land prepration and fertilizers was higher than labour cost in Hathras and
Mirzapur. In Amroha, the cost for Irrigation was highest due to unavailability of irrigation
facility in the district. Similary the cost for land preparation was found to be highest than
labour cost and other costs. Thus, it reveals that the in all districts the proportion of labour
cost, expenditure on land preparation, and irrigation was relatively higher than the cost
incurred on transportation, cost on plantation and other cost in cultivating foodgrains crops.
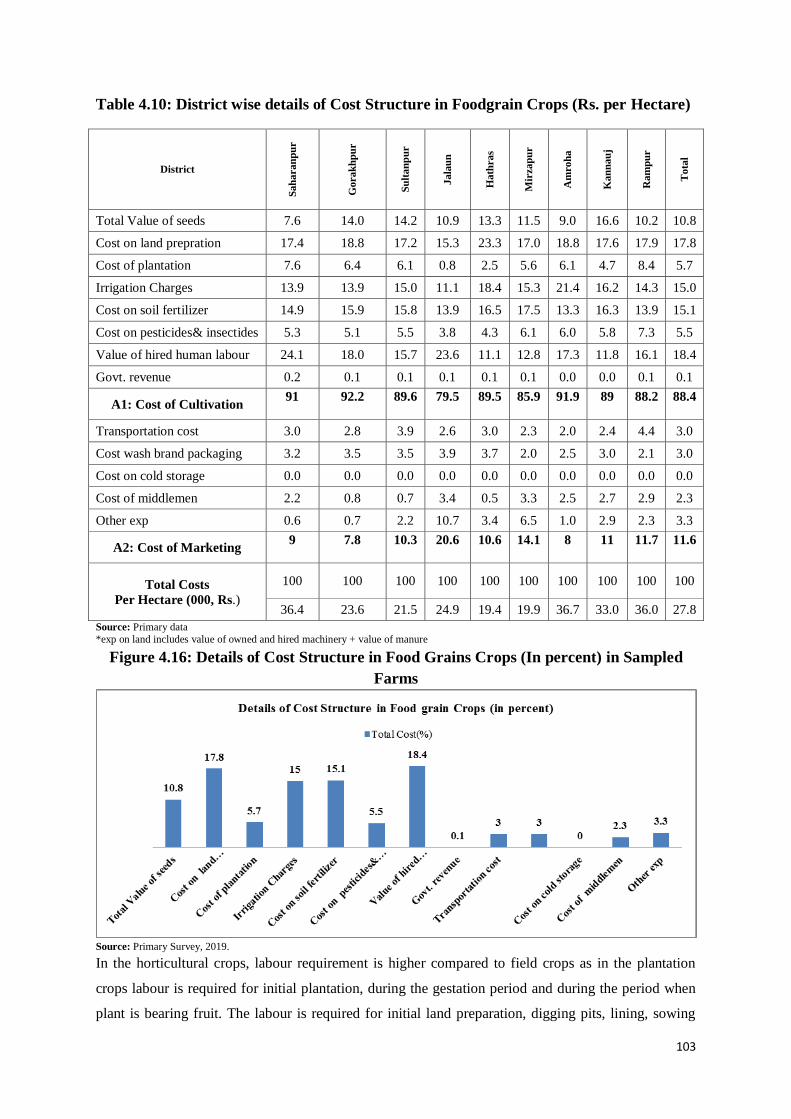
103
Table 4.10: District wise details of Cost Structure in Foodgrain Crops (Rs. per Hectare)
District
Sah
aran
pu
r
Gora
kh
pu
r
Su
ltan
pu
r
Jala
un
Hath
ras
Mir
zap
ur
Am
roh
a
Kan
nau
j
Ram
pu
r
Tota
l
Total Value of seeds 7.6 14.0 14.2 10.9 13.3 11.5 9.0 16.6 10.2 10.8
Cost on land prepration 17.4 18.8 17.2 15.3 23.3 17.0 18.8 17.6 17.9 17.8
Cost of plantation 7.6 6.4 6.1 0.8 2.5 5.6 6.1 4.7 8.4 5.7
Irrigation Charges 13.9 13.9 15.0 11.1 18.4 15.3 21.4 16.2 14.3 15.0
Cost on soil fertilizer 14.9 15.9 15.8 13.9 16.5 17.5 13.3 16.3 13.9 15.1
Cost on pesticides& insectides 5.3 5.1 5.5 3.8 4.3 6.1 6.0 5.8 7.3 5.5
Value of hired human labour 24.1 18.0 15.7 23.6 11.1 12.8 17.3 11.8 16.1 18.4
Govt. revenue 0.2 0.1 0.1 0.1 0.1 0.1 0.0 0.0 0.1 0.1
A1: Cost of Cultivation 91 92.2 89.6 79.5 89.5 85.9 91.9 89 88.2 88.4
Transportation cost 3.0 2.8 3.9 2.6 3.0 2.3 2.0 2.4 4.4 3.0
Cost wash brand packaging 3.2 3.5 3.5 3.9 3.7 2.0 2.5 3.0 2.1 3.0
Cost on cold storage 0.0 0.0 0.0 0.0 0.0 0.0 0.0 0.0 0.0 0.0
Cost of middlemen 2.2 0.8 0.7 3.4 0.5 3.3 2.5 2.7 2.9 2.3
Other exp 0.6 0.7 2.2 10.7 3.4 6.5 1.0 2.9 2.3 3.3
A2: Cost of Marketing 9 7.8 10.3 20.6 10.6 14.1 8 11 11.7 11.6
Total Costs
Per Hectare (000, Rs.)
100 100 100 100 100 100 100 100 100 100
36.4 23.6 21.5 24.9 19.4 19.9 36.7 33.0 36.0 27.8
Source: Primary data
*exp on land includes value of owned and hired machinery + value of manure
Figure 4.16: Details of Cost Structure in Food Grains Crops (In percent) in Sampled
Farms
Source: Primary Survey, 2019.
In the horticultural crops, labour requirement is higher compared to field crops as in the plantation
crops labour is required for initial plantation, during the gestation period and during the period when
plant is bearing fruit. The labour is required for initial land preparation, digging pits, lining, sowing

104
nursery, refilling top soil, planting nursery and other miscellaneous activities. During the gestation
period labour uses include inter-culture operations, manure and fertilizers,' insecticides, weeding,
irrigation, mulching, shading and other miscellaneous activities. The manpower requirement at the
time of fruit bearing includes topping and pruning, manure and fertilizers, weeding, harvesting and
collection, grading, storage and marketing. Table 4.11 explains the district wise detailed cost structure
in cultivation of Fruit crops and shows that labour cost accounts for 31.8 percent of total cost in
Sultanpur. The cost of labour is highest with 36.3 percent followed by cost of seeds i.e. 19.5 percent
as compared to irrigation, fertilizers and transportation cost which is very low in Sultanpur District.
For Fruit crops, packaging and branding is very important. Hence, it is important to analyze the cost
spent on packaging where it was found that 13.8 percent of total cost was spent on brand pack of
fruits, where the highest cost is spent by Gorakhpur district i.e. 25.1 percent of total cost spent on
other items followed by labour cost. Gorakhpur was specialized in Mango cultivation which requires
special packaging hence the brand pack cost was highest. It was found that the cost of irrigation and
labour cost was highest in Hathras as the area specializes in Guava fruit cultivation which require
better irrigation. Further, it is to be noticed that cost of middlemen was highest in Mirzapur and
transportation cost was highest in Gorakhpur as it was specialized in growing of fruits like mango etc
which require transporting of fruit after its cultivation.
Table 4.11: District wise details of Cost Structure in Fruit Crops (Rs. per Hectare):
District
Sah
ara
np
u
r
Gora
kh
pu
r
Su
ltan
pu
r
Jala
un
Hath
ras
Mir
zap
ur
Am
roh
a
Kan
nau
j
Ram
pu
r
Tota
l Value of seeds 0.0 5.1 19.5 15.2 0.2 0.2 7.7 0.0 0.0 2.2
Exp land prep 6.6 6.8 5.0 10.6 2.5 6.0 14.3 0.0 0.0 6.3
Cost of plantation 0.4 1.2 4.1 8.2 0.4 0.0 6.4 0.0 0.0 1.0
Exp Irrigation 5.7 4.4 12.1 11.5 21.5 9.8 22.1 0.0 0.0 8.5
Exp soil fertilizer 9.1 4.8 8.3 12.9 14.0 7.6 10.7 0.0 0.0 9.3
Exp pesticides&
insectides 7.7 8.9 4.1 10.4 11.9 5.6 9.2 0.0 0.0 8.0
Value of hired human
labour 34.3 22.7 36.3 16.0 29.0 32.7 13.9 0.0 0.0 31.8
Govt. revenue 0.1 0.0 0.0 0.0 0.0 0.0 0.0 0.0 0.0 0.1
A1: Cost of
Cultivation 63.9 53.9 89.4 84.8 79.5 61.9 84.3 0 0 67.2
Transportation cost 7.7 18.5 3.6 5.2 8.2 5.4 5.7 0.0 0.0 8.2
Cost wash brand pack 15.8 25.1 1.9 6.5 5.4 7.7 6.7 0.0 0.0 13.8
Cost cold storage 1.5 0.0 0.0 0.0 0.0 0.0 0.0 0.0 0.0 1.0
Cost middlemen 9.8 2.0 4.8 3.6 6.0 21.9 1.6 0.0 0.0 8.7
Other exp 1.4 0.6 0.3 0.0 0.9 3.0 1.6 0.0 0.0 1.2
A2: Cost of
Marketing 36.2 46.2 10.6 15.3 20.5 38 15.6 0 0 32.9
Total Costs
Per Hectare (000, Rs.)
100 100 100 100 100 100 100 100 100 100
76.95 101 151.95 61.8 64.95 35.15 7.7 0.00 0.00 61.57 Source: Primary Survey, 2019.
*exp on land includes value of owned and hired machinery + value of manure.

105
Figure 4.17: Details of Cost Structure in Fruit Cultivation (in percent)
Source: Primary Survey, 2019.
One of the objectives of promotion of Horticultunal is to create opportunities for employment
generation for skilled and unskilled persons, especially unemployed youth in the villages in
addition to enhancing horticultural production, improving nutritional security and providing
income support to farm households. Table 4.12 reveals about the district wise details of cost
structure involved in growing Vegetable crops. The table presents that the labour cost is
highest for all districts for vegetable cultivation but after labour cost the highest cost is
covered by total cost of seeds i.e. 10.6 percent followed by irrigation cost and cost on land
preparation. Expenditure of 9.1 percent of the total cost was covered for brand packaging for
vegetable crops. It is important to notice that cost of middlemen and transportation cost is
relatively higher than other cost.
If district wise cost is examined, maximum cost of 22.5 percent account towards brand
packaging followed by labour cost and fertilizers. A high amount of cost is also incurred on
expenditure on land preparation. Major specialization in vegetable crop is in Saharanpur
district which cultivated cauliflower due to which cost of brand packaging is higher than
other costs. In Kannauj, the labor cost is highest followed by costs of seeds and irrigation
costs. As tomato was the major specialized vegetable crop in Kannauj, which needs proper
packaging and storage in cold storage, hence the cost of both inputs was also accounted by
the farms. 2.0 percent of Cost on storage of total cost also account by Jalaun district as it
specialized in other crops which needed to be stored after its cultivation, packaging and
transportation. Hence, the table reveals that the labour cost is highest in all districts for
vegetable crops followed by cost incurred by farms on seeds and farm preparation. The

106
proportion of cost by middlemen and packaging is also relatively high than other costs.
Considerable differences in the cost structure for vegetable crops on different items are
observed in the given table.
Table 4.12: District wise details of Cost Structure in Vegetable Crops (000, Rs. per Hectare)
District
Sah
aran
pu
r
Gorak
hp
ur
Su
ltan
pu
r
Jala
un
Hath
ras
Mir
zap
ur
Am
roh
a
Kan
nau
j
Ram
pu
r
Tota
l
Value of seeds 4.7 12.4 8.1 10.1 16.4 7.7 11.2 11.6 13.0 10.6
Exp land prep 13.2 13.0 9.4 10.6 14.0 8.2 8.7 7.6 5.9 9.2
Cost of plantation 7.3 6.0 5.9 4.3 3.1 6.5 5.2 4.0 6.3 5.6
Exp Irrigation 9.8 12.6 10.7 11.8 15.0 12.2 10.0 10.5 5.7 9.9
Exp soil fertilizer 15.7 10.1 11.5 9.4 9.9 8.8 7.9 9.1 3.9 8.6
Exp pesticides 5.0 8.7 6.6 6.6 6.0 6.6 6.1 5.2 4.0 5.8
Value of hired human labour 18.7 18.1 19.4 24.4 17.8 24.5 24.2 28.8 33.5 25.1
Govt. revenue 0.0 0.0 0.0 0.0 0.1 0.0 0.0 0.0 0.0 0.0
A1: Cost of Cultivation 74.4 80.9 71.6 77.2 82.3 74.5 73.3 76.8 72.3 74.8
Transportation 1.3 5.1 10.3 4.9 9.5 6.1 7.0 6.8 4.3 5.7
Cost wash brand pack 22.5 6.8 9.4 7.1 3.1 9.0 8.6 5.2 8.9 9.1
Cost cold storage 0.0 0.0 0.0 2.0 0.0 0.0 0.0 1.3 0.0 0.5
Cost middlemen 0.5 6.7 7.9 7.5 3.8 9.8 9.6 7.8 14.2 8.9
Other exp 1.1 0.5 0.8 1.4 1.3 0.6 1.4 2.1 0.4 1.0
A2: Cost of Marketing 25.4 19.1 28.4 22.9 17.7 25.5 26.6 23.2 27.8 25.2
Total Costs Per Hectare (000, Rs.) 100 100 100 100 100 100 100 100 100 100
70.27 56.37 62.25 41.57 53.1 65.45 115.1 81.72 95.55 65.95
Source: Primary Survey, 2019.
Table 4.13: District wise details of Cost Structure in Spice Crops (000, Rs. per Hectare):
District
Sah
aran
pu
r
Gorak
hp
ur
Su
ltan
pu
r
Jala
un
Hath
ras
Mir
zap
ur
Am
roh
a
Kan
nau
j
Ram
pu
r
Tota
l
Value of seeds 20.8 16.1 24.1 13.4 5.4 15.3 6.4 14.8 17.5 16.4
Exp land prep 16.7 10.3 15.0 12.7 8.8 10.8 8.0 14.5 11.4 11.6
Cost of plantation 12.5 8.0 9.6 9.4 2.6 6.4 21.7 2.0 7.8 7.7
Exp Irrigation 6.3 11.9 17.0 14.2 22.0 15.4 12.6 16.1 12.2 13.3
Exp soil fertilizer 4.2 17.1 10.7 10.9 21.0 8.6 10.3 11.4 9.6 10.2
Exp pesticides 8.3 5.6 7.3 8.8 8.3 7.4 10.3 9.2 7.4 7.6
Value of hired human labour 0.0 17.2 3.5 13.8 17.9 14.6 14.8 16.6 17.8 16.6
Govt. revenue 0.0 0.0 0.0 0.0 0.0 0.0 0.0 0.0 0.0 0.0
A1: Cost of Cultivation 68.8 86.2 87.2 83.2 86 78.5 84.1 84.6 83.7 83.4
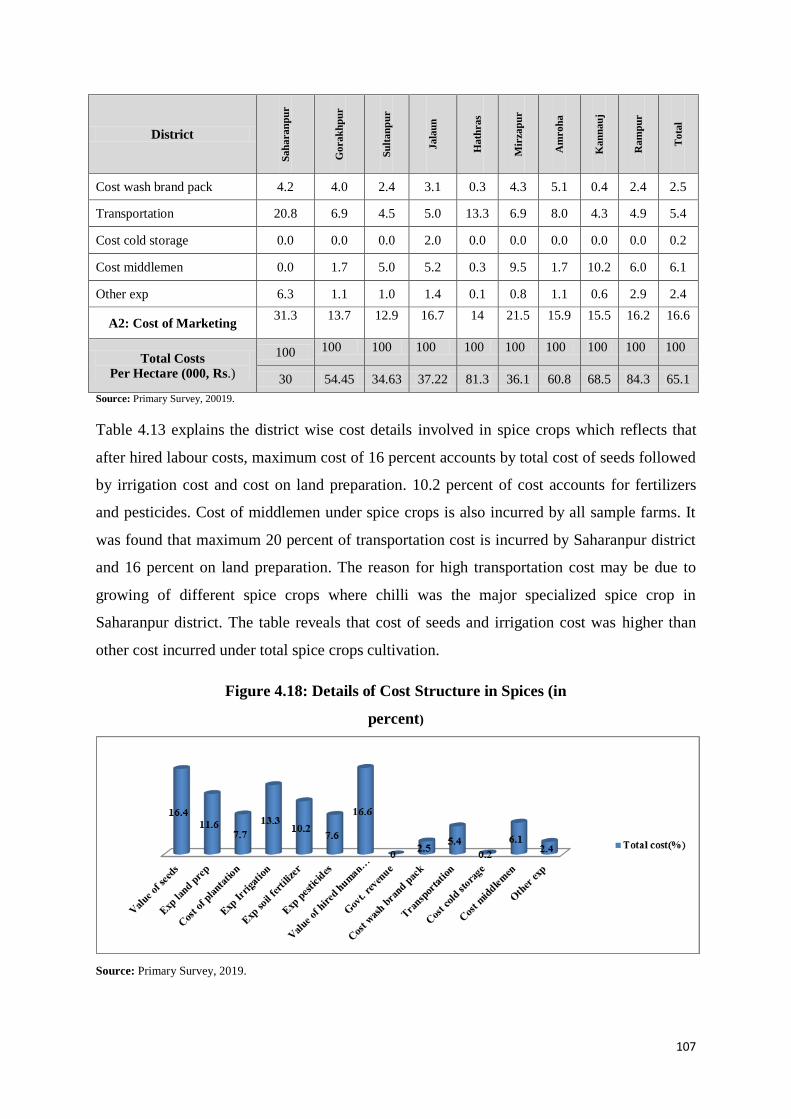
107
District
Sah
aran
pu
r
Gorak
hp
ur
Su
ltan
pu
r
Jala
un
Hath
ras
Mir
zap
ur
Am
roh
a
Kan
nau
j
Ram
pu
r
Tota
l
Cost wash brand pack 4.2 4.0 2.4 3.1 0.3 4.3 5.1 0.4 2.4 2.5
Transportation 20.8 6.9 4.5 5.0 13.3 6.9 8.0 4.3 4.9 5.4
Cost cold storage 0.0 0.0 0.0 2.0 0.0 0.0 0.0 0.0 0.0 0.2
Cost middlemen 0.0 1.7 5.0 5.2 0.3 9.5 1.7 10.2 6.0 6.1
Other exp 6.3 1.1 1.0 1.4 0.1 0.8 1.1 0.6 2.9 2.4
A2: Cost of Marketing 31.3 13.7 12.9 16.7 14 21.5 15.9 15.5 16.2 16.6
Total Costs
Per Hectare (000, Rs.)
100 100 100 100 100 100 100 100 100 100
30 54.45 34.63 37.22 81.3 36.1 60.8 68.5 84.3 65.1
Source: Primary Survey, 20019.
Table 4.13 explains the district wise cost details involved in spice crops which reflects that
after hired labour costs, maximum cost of 16 percent accounts by total cost of seeds followed
by irrigation cost and cost on land preparation. 10.2 percent of cost accounts for fertilizers
and pesticides. Cost of middlemen under spice crops is also incurred by all sample farms. It
was found that maximum 20 percent of transportation cost is incurred by Saharanpur district
and 16 percent on land preparation. The reason for high transportation cost may be due to
growing of different spice crops where chilli was the major specialized spice crop in
Saharanpur district. The table reveals that cost of seeds and irrigation cost was higher than
other cost incurred under total spice crops cultivation.
Figure 4.18: Details of Cost Structure in Spices (in
percent)
Source: Primary Survey, 2019.

108
Table 4.14: District wise details of Cost Structure in Cash Crops (000, Rs. per Hectare)
District
Sah
aran
pu
r
Gorak
hp
ur
Su
ltan
pu
r
Jala
un
Hath
ras
Mir
zap
ur
Am
roh
a
Kan
nau
j
Ram
pu
r
Tota
l
Value of seeds 18.1 21.2 18.7 14.8 33.7 15.1 19.2 23.2 18.2 21.7
Exp land prep 7.7 12.7 10.1 7.2 9.6 9.3 9.9 10.2 12.4 9.6
Cost of plantation 3.8 9.1 7.9 2.4 4.3 10.3 5.8 4.5 9.1 5.3
Exp Irrigation 16.1 9.1 10.3 9.0 8.9 9.6 13.9 10.7 8.0 11.1
Exp soil fertilizer 8.0 13.2 14.5 9.4 8.7 14.5 10.8 9.4 11.0 10.3
Exp pesticides 6.5 6.9 7.7 4.3 4.8 7.3 6.3 5.8 6.2 5.9
Value of hired human labour 24.3 15.2 15.6 31.7 6.0 12.3 22.6 16.3 10.1 18.5
Govt. revenue 0.2 0.0 0.0 0.0 0.1 0.0 0.1 0.0 0.1 0.1
A1: Cost of Cultivation 84.7 87.4 84.8 78.8 76.1 78.4 88.6 80.1 75.1 82.5
Cost wash brand pack 0.1 5.7 4.2 6.7 3.6 5.5 3.1 4.4 0.8 3.9
Transportation 11.0 3.8 3.9 3.4 3.9 7.5 5.7 4.0 14.6 5.4
Cost cold storage 0.0 0.5 1.6 0.7 12.5 2.8 0.7 4.3 0.5 3.3
Cost middlemen 0.0 1.6 4.0 9.6 2.8 5.4 1.0 5.5 5.6 3.6
Other exp 1.1 0.9 1.4 0.9 1.0 0.6 0.8 1.6 3.5 1.1
A2: Cost of Marketing 12.2 12.5 15.1 21.3 23.8 21.8 11.3 19.8 25 17.3
Total Costs Per Hectare (000, Rs.) 100 100 100 100 100 100 100 100 100 100
81.35 41.25 69.5 49.92 52.92 68.75 83.72 67.6 75.05 61.85
Source: Primary Survey, 2019.
Table 4.14 reveals details of cost structure of cash crops which explains that 21.7 percent of
total cost accounts for total cost of seeds followed by labour cost i.e. 18.5 percent. Near about
10 to 11 percent of total cost is also found to be incurred on irrigation and fertilizers. Cash
crops include potato, onion, sugarcane and peanuts which need proper storage after its
cultivation. Hence, 3.6 percent of the cost is also found to be incurred for its successful
storage. 5.4 percent of the total cost accounts for its transportation facilities. Sugarcane was
the major crop in Saharanpur where it was found that labour cost is much higher where 11
percent was found for transportation cost. Hathras, Mirzapur and Rampur specializes in
Potato cultivation, hence it was found that the total cost of seeds was more than other
expenses. Jalaun specializes in growing of Onion. The table reveals that under cash crops
apart from labor cost, expenses on seeds and irrigation is higher as compared to other
expenses.
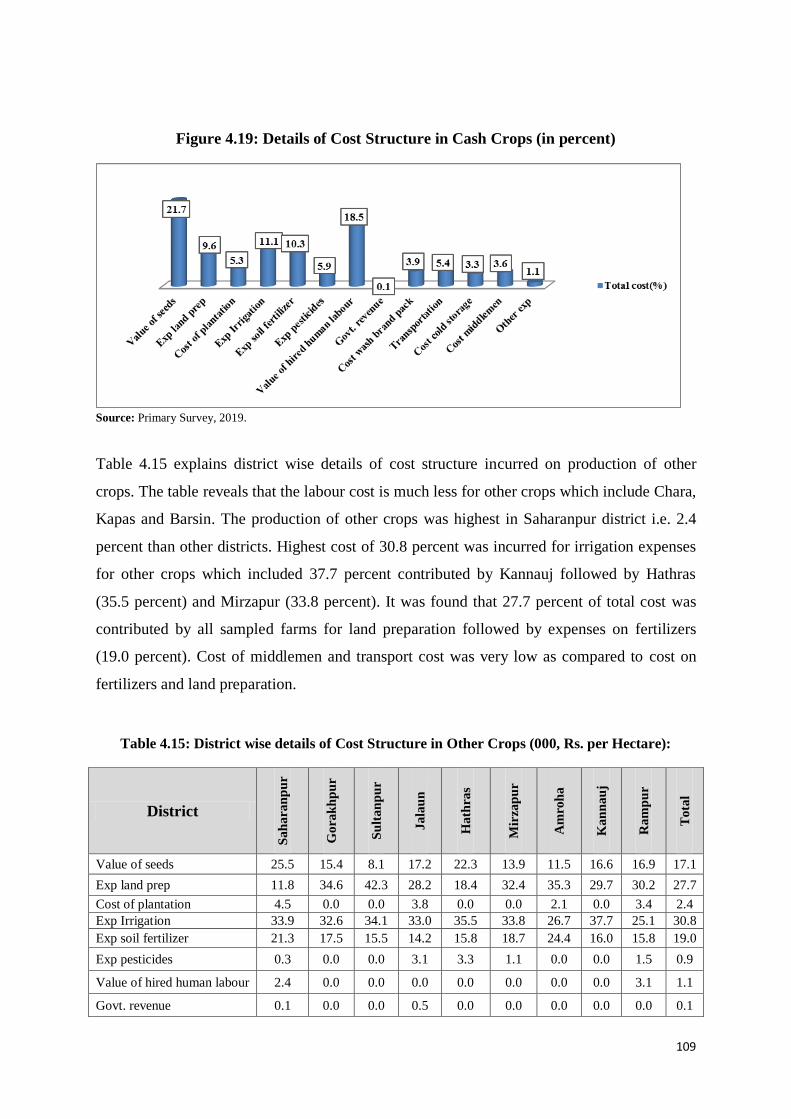
109
Figure 4.19: Details of Cost Structure in Cash Crops (in percent)
Source: Primary Survey, 2019.
Table 4.15 explains district wise details of cost structure incurred on production of other
crops. The table reveals that the labour cost is much less for other crops which include Chara,
Kapas and Barsin. The production of other crops was highest in Saharanpur district i.e. 2.4
percent than other districts. Highest cost of 30.8 percent was incurred for irrigation expenses
for other crops which included 37.7 percent contributed by Kannauj followed by Hathras
(35.5 percent) and Mirzapur (33.8 percent). It was found that 27.7 percent of total cost was
contributed by all sampled farms for land preparation followed by expenses on fertilizers
(19.0 percent). Cost of middlemen and transport cost was very low as compared to cost on
fertilizers and land preparation.
Table 4.15: District wise details of Cost Structure in Other Crops (000, Rs. per Hectare):
District
Sah
ara
np
ur
Gora
kh
pu
r
Su
ltan
pu
r
Jala
un
Hath
ras
Mir
zap
ur
Am
roh
a
Kan
nau
j
Ram
pu
r
Tota
l
Value of seeds 25.5 15.4 8.1 17.2 22.3 13.9 11.5 16.6 16.9 17.1
Exp land prep 11.8 34.6 42.3 28.2 18.4 32.4 35.3 29.7 30.2 27.7
Cost of plantation 4.5 0.0 0.0 3.8 0.0 0.0 2.1 0.0 3.4 2.4
Exp Irrigation 33.9 32.6 34.1 33.0 35.5 33.8 26.7 37.7 25.1 30.8
Exp soil fertilizer 21.3 17.5 15.5 14.2 15.8 18.7 24.4 16.0 15.8 19.0
Exp pesticides 0.3 0.0 0.0 3.1 3.3 1.1 0.0 0.0 1.5 0.9
Value of hired human labour 2.4 0.0 0.0 0.0 0.0 0.0 0.0 0.0 3.1 1.1
Govt. revenue 0.1 0.0 0.0 0.5 0.0 0.0 0.0 0.0 0.0 0.1
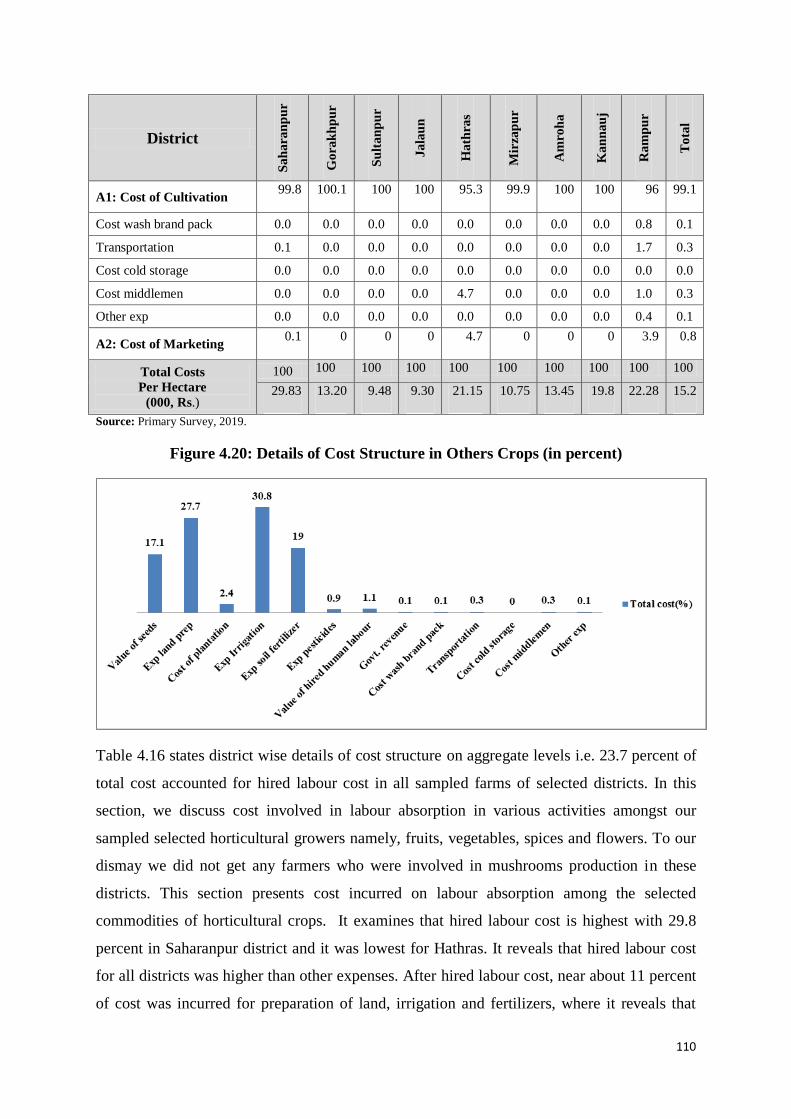
110
District
Sah
ara
np
ur
Gora
kh
pu
r
Su
ltan
pu
r
Jala
un
Hath
ras
Mir
zap
ur
Am
roh
a
Kan
nau
j
Ram
pu
r
Tota
l
A1: Cost of Cultivation 99.8 100.1 100 100 95.3 99.9 100 100 96 99.1
Cost wash brand pack 0.0 0.0 0.0 0.0 0.0 0.0 0.0 0.0 0.8 0.1
Transportation 0.1 0.0 0.0 0.0 0.0 0.0 0.0 0.0 1.7 0.3
Cost cold storage 0.0 0.0 0.0 0.0 0.0 0.0 0.0 0.0 0.0 0.0
Cost middlemen 0.0 0.0 0.0 0.0 4.7 0.0 0.0 0.0 1.0 0.3
Other exp 0.0 0.0 0.0 0.0 0.0 0.0 0.0 0.0 0.4 0.1
A2: Cost of Marketing 0.1 0 0 0 4.7 0 0 0 3.9 0.8
Total Costs
Per Hectare
(000, Rs.)
100 100 100 100 100 100 100 100 100 100
29.83 13.20 9.48 9.30 21.15 10.75 13.45 19.8 22.28 15.2
Source: Primary Survey, 2019.
Figure 4.20: Details of Cost Structure in Others Crops (in percent)
Table 4.16 states district wise details of cost structure on aggregate levels i.e. 23.7 percent of
total cost accounted for hired labour cost in all sampled farms of selected districts. In this
section, we discuss cost involved in labour absorption in various activities amongst our
sampled selected horticultural growers namely, fruits, vegetables, spices and flowers. To our
dismay we did not get any farmers who were involved in mushrooms production in these
districts. This section presents cost incurred on labour absorption among the selected
commodities of horticultural crops. It examines that hired labour cost is highest with 29.8
percent in Saharanpur district and it was lowest for Hathras. It reveals that hired labour cost
for all districts was higher than other expenses. After hired labour cost, near about 11 percent
of cost was incurred for preparation of land, irrigation and fertilizers, where it reveals that

111
proportion of irrigation cost was relatively higher for Amroha, Hathras as compared to other
sampled district. 10.1 percent of cost contributed towards the total cost for seeds where it
highest for Kannauj and Hathras. 7.4 percent of total cost is also found to be incurred by
farms on brand pack and transportation. It reveals that the overall cost related to middlemen,
storage cost and other expenses were much lower than other costs. Hence, the efforts should
be taken to overcome the labour cost in order to overcome the problems in growing of
different horticulture crops.
Table 4.16: District wise details of Cost Structure in Aggregate Level (000, Rs. per Hectare)
District
Sah
ara
np
ur
Gora
kh
pu
r
Su
ltan
pu
r
Jala
un
Hath
ras
Mir
zap
ur
Am
roh
a
Kan
nau
j
Ram
pu
r
Tota
l
Value of seeds 3.4 12.0 13.7 12.4 15.2 8.0 12.9 15.5 12.8 10.1
Exp land prep 10.0 12.7 11.3 11.5 10.9 11.1 12.9 11.1 11.0 11.1
Cost of plantation 3.0 5.1 5.9 3.5 2.4 5.0 5.7 4.3 7.2 4.4
Exp Irrigation 8.8 9.8 12.5 11.2 16.3 13.6 15.6 14.3 10.2 11.7
Exp soil fertilizer 11.1 10.7 12.6 11.0 12.5 13.3 10.9 12.6 8.5 11.2
Exp pesticides 6.8 7.3 5.9 5.5 7.3 6.2 6.2 6.3 5.6 6.4
Value of hired human labour 29.8 19.0 20.9 24.1 16.6 22.0 20.8 20.7 24.3 23.7
Govt. revenue 0.1 0.0 0.0 0.0 0.1 0.1 0.1 0.0 0.1 0.1
A1: Cost of Cultivation 73 76.6 82.8 79.2 81.3 79.3 85.1 84.8 79.7 78.7
Cost wash brand pack 12.1 11.5 5.3 5.8 4.1 5.0 4.7 3.5 5.4 7.4
Transportation 6.1 8.5 6.0 3.8 5.9 4.3 4.8 3.3 4.7 5.4
Cost cold storage 0.9 0.1 0.2 0.9 3.7 0.1 0.2 1.7 0.0 0.8
Cost middlemen 6.6 2.5 4.4 6.0 3.5 7.9 4.1 4.8 8.9 5.8
Other exp 1.1 0.6 1.3 4.1 1.5 3.4 1.1 2.0 1.5 1.8
A2: Cost of Marketing 26.8 23.2 17.2 20.6 18.7 20.7 14.9 15.3 20.5 21.2
Total Costs Per Hectare (000, Rs.)
100 100 100 100 100 100 100 100 100 100
58.9 41.9 40.7 35.9 39.9 31.45 48.35 57.75 51.2 45.47
Source: Primary Survey, 2019.

112
Figure 4.21: Details of Cost Structure in Aggregate Level (in percent)
Further, the income, cost and profit per acre for major crops groups has been shown in table
4.17. In Saharanpur district, the profit percent per acre was highest for spices i.e. 80.0 percent
and fruits (65.3) followed by food grains (59.3) and vegetables (49.1). The percent profit per
acre was much lower for other crops (i.e. 7.8percent). Thus, in terms of profit percent per
acre, cultivation of spices, fruits and vegetables was much profitable as compared to other
crops and flowers in Saharanpur District.
Such derivations from the field data reflects on the scope for high potential of crop
diversification and thereafter income enhancement. Diversification towards horticulture (fruit
and vegetables plus condiments and spices) was seen from area share, growth in production
and production shares. Further, in Gorakhpur district, percent profit per acre was 68.5 percent
out of total income per acre of 44.5 percent, where the proportion of vegetables and other
crops was higher as compared to other cash crops. Hence, it was more profitable to grow
vegetable crops and other crops as compared to cash crops. Similarly, in Sultanpur district,
the proportion of profit percent per acre was higher for fruits and vegetables than foodgrain
cultivation. 71.0 percent of profit percent was found from 26 percent of cost incurred from
other horticulture crop groups thus revealing that it is more profitable to grow fruits and
vegetables than other group of crops in Hathras district.
The proportion of percent profit per acre was highest for flowers in Kannauj. Therefore, it
can be said that it was more profitable to grow flowers as compared to other crops. Rampur
and Kannauj district do not have cultivation of fruits. the highest profit in Rampur district is
seen in vegetables crops. Hence, it is more profitable to grow vegetables as compared to other
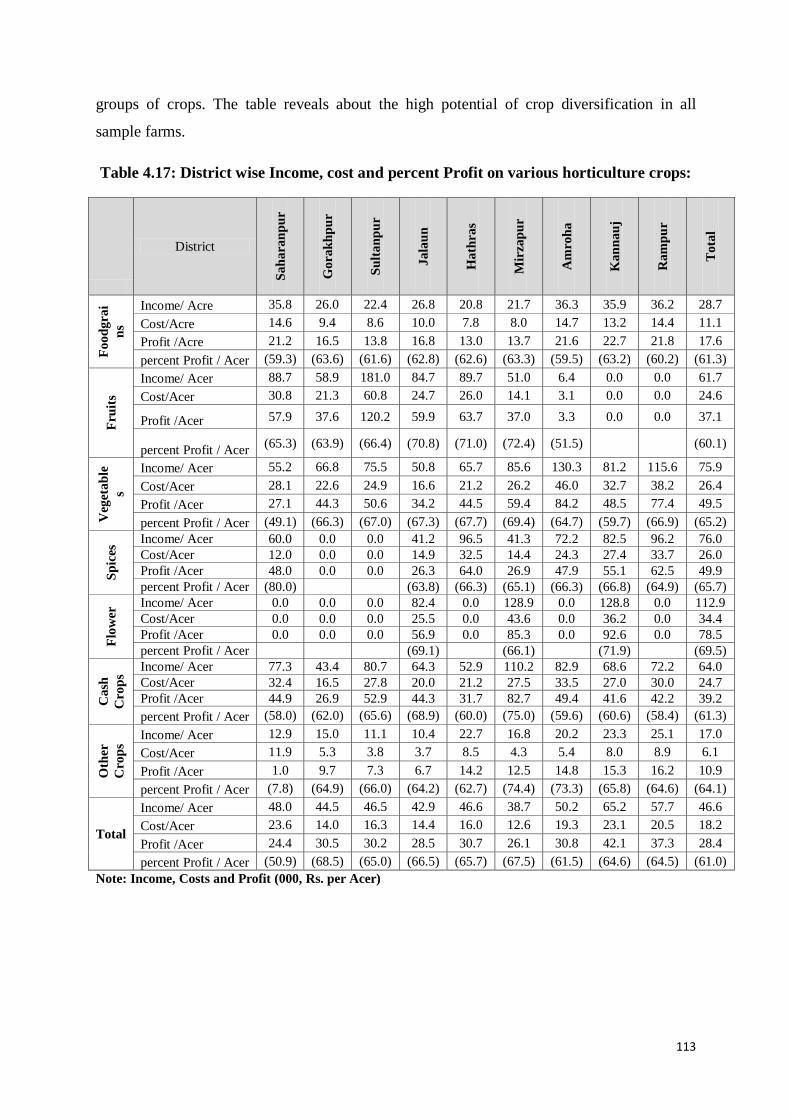
113
groups of crops. The table reveals about the high potential of crop diversification in all
sample farms.
Table 4.17: District wise Income, cost and percent Profit on various horticulture crops:
District
Sah
ara
np
ur
Gora
kh
pu
r
Su
ltan
pu
r
Jala
un
Hath
ras
Mir
zap
ur
Am
roh
a
Kan
nau
j
Ram
pu
r
Tota
l
Food
gra
i
ns
Income/ Acre 35.8 26.0 22.4 26.8 20.8 21.7 36.3 35.9 36.2 28.7
Cost/Acre 14.6 9.4 8.6 10.0 7.8 8.0 14.7 13.2 14.4 11.1
Profit /Acre 21.2 16.5 13.8 16.8 13.0 13.7 21.6 22.7 21.8 17.6
percent Profit / Acer (59.3) (63.6) (61.6) (62.8) (62.6) (63.3) (59.5) (63.2) (60.2) (61.3)
Fru
its
Income/ Acer 88.7 58.9 181.0 84.7 89.7 51.0 6.4 0.0 0.0 61.7
Cost/Acer 30.8 21.3 60.8 24.7 26.0 14.1 3.1 0.0 0.0 24.6
Profit /Acer 57.9 37.6 120.2 59.9 63.7 37.0 3.3 0.0 0.0 37.1
percent Profit / Acer (65.3) (63.9) (66.4) (70.8) (71.0) (72.4) (51.5) (60.1)
Veg
etab
le
s
Income/ Acer 55.2 66.8 75.5 50.8 65.7 85.6 130.3 81.2 115.6 75.9
Cost/Acer 28.1 22.6 24.9 16.6 21.2 26.2 46.0 32.7 38.2 26.4
Profit /Acer 27.1 44.3 50.6 34.2 44.5 59.4 84.2 48.5 77.4 49.5
percent Profit / Acer (49.1) (66.3) (67.0) (67.3) (67.7) (69.4) (64.7) (59.7) (66.9) (65.2)
Sp
ices
Income/ Acer 60.0 0.0 0.0 41.2 96.5 41.3 72.2 82.5 96.2 76.0
Cost/Acer 12.0 0.0 0.0 14.9 32.5 14.4 24.3 27.4 33.7 26.0
Profit /Acer 48.0 0.0 0.0 26.3 64.0 26.9 47.9 55.1 62.5 49.9
percent Profit / Acer (80.0) (63.8) (66.3) (65.1) (66.3) (66.8) (64.9) (65.7)
Flo
wer
Income/ Acer 0.0 0.0 0.0 82.4 0.0 128.9 0.0 128.8 0.0 112.9
Cost/Acer 0.0 0.0 0.0 25.5 0.0 43.6 0.0 36.2 0.0 34.4
Profit /Acer 0.0 0.0 0.0 56.9 0.0 85.3 0.0 92.6 0.0 78.5
percent Profit / Acer (69.1) (66.1) (71.9) (69.5)
Cash
Cro
ps
Income/ Acer 77.3 43.4 80.7 64.3 52.9 110.2 82.9 68.6 72.2 64.0
Cost/Acer 32.4 16.5 27.8 20.0 21.2 27.5 33.5 27.0 30.0 24.7
Profit /Acer 44.9 26.9 52.9 44.3 31.7 82.7 49.4 41.6 42.2 39.2
percent Profit / Acer (58.0) (62.0) (65.6) (68.9) (60.0) (75.0) (59.6) (60.6) (58.4) (61.3)
Oth
er
Cro
ps
Income/ Acer 12.9 15.0 11.1 10.4 22.7 16.8 20.2 23.3 25.1 17.0
Cost/Acer 11.9 5.3 3.8 3.7 8.5 4.3 5.4 8.0 8.9 6.1
Profit /Acer 1.0 9.7 7.3 6.7 14.2 12.5 14.8 15.3 16.2 10.9
percent Profit / Acer (7.8) (64.9) (66.0) (64.2) (62.7) (74.4) (73.3) (65.8) (64.6) (64.1)
Total
Income/ Acer 48.0 44.5 46.5 42.9 46.6 38.7 50.2 65.2 57.7 46.6
Cost/Acer 23.6 14.0 16.3 14.4 16.0 12.6 19.3 23.1 20.5 18.2
Profit /Acer 24.4 30.5 30.2 28.5 30.7 26.1 30.8 42.1 37.3 28.4
percent Profit / Acer (50.9) (68.5) (65.0) (66.5) (65.7) (67.5) (61.5) (64.6) (64.5) (61.0)
Note: Income, Costs and Profit (000, Rs. per Acer)

114
Figure 4.22: Net Income per Acre of Different Horticulture Crops in Sample Farms
Source: Primary data
III. Estimates of Productivity/ Yield Based on Field Survey and Secondary
Data and Difference in Yield of Horticultural Crops:
As also mentioned in the chapter 2, despite the horticulture sector's impressive growth in
recent years, there has been substantial discrepancies emerging in terms of data-base (area,
production and yield) of horticultural crops, and inclusion of individual crops in the broader
category of horticulture crops in the country. This poses a serious problem in understanding
the real development and contribution of horticulture sector in the national economy. Besides,
there is no systematic data- base for the marginal and minor horticultural crops. The present
section is an attempt to cross-check the variation of the yields of horticulture crops estimated
by the Government agencies and the primary field survey conducted by this study. Also, in
terms of the inclusion of individual crops under the broader horticulture crops (e.g. fruit,
vegetable, spices, flowers etc.), it was found that a huge variation could be perceived in the
yield of different crops from the survey data and the data provided by horticulture
department/website.
To circumvent and control this variation, we usually use the average of three years in
agriculture sector i.e. „triennium ending averages‟. In our study it was not a longitudinal
survey but to capture the scenario we did survey of nine districts from nine agro-climatic
zones of Uttar Pradesh. Hence, we have data for field survey only at a point of time i.e. for
2018-19, the year when the survey was conducted and hence forth the variation reported
through our empirical finding is understood to be very byouyant. However we have given an
estimate of production to see the situation of horticulture production as well and also have
tried to assess the difference in the yield of various horticultural crops grown by the

115
respondents based on our survey results and secondary data obtained from the Department of
Horticulture, Government of Uttar Pradesh, Lucknow.
Besides, during the survey, we have identified some crops on which separate data on area,
production and yield are not collected by the Department of Horticulture, Uttar Pradesh and
some of the crops which are in DES data - could not be captured through our survey due to
random selection of growers and that too from high producing blocks/ villages from selected
districts/ agro-climatic zones in Uttar Pradesh.
From tables below we can see the difference of yield level of different crops between the
survey and government data of the individual horticulture crops in Uttar Pradesh. Yield data
reported here in this section was collected by the Department of Horticulture, Government of
Uttar Pradesh (DoH, hereafter in this section) in 2017-18 and a comparison, if not exact, was
made with the sample survey conducted by this present study in 2018-19. Under the fruit
crops, anola; banana, guava, litchi, muskmelon, papaya, water- melon are the common fruits
in both; the survey agency as well as the field survey. But, yield level of all the fruits crop
included in this section were found to have been over-estimated by the agency. Some fruits
which we have found during the survey as pomegranate, peach, raspberry and lemon was not
in the secondary data while jackfruits and some other citrus fruits which are given by the
secondary data, we couldn‟t capture in the field survey.
Table 4.18: Difference in Yield of Fruits through Field Survey and Estimates of
Secondary data for Horticultural Crops (Qtls./ha)
Name of Crops Survey Yield
2018-19
Yield based on Secondary
2017-18
Difference*
Anola 85.0 110 -25.0
Banana 344.5 452.5 -108.0
Guava 78.8 185 -106.3
Litchi 28.8 85 -56.3
Mango# 75.8 182.5 -106.8
Musk melon 89.3 260 -170.8
Papaya 417.5 507.5 -90.0
Water melon (1 sample) 40.0 450 -410.0
Lemon (Mirzapur-18) 79.3
Peach (in Amroha-1) 62.5
Pomegranate (Jalaun-3) 55.8
Raspberry (Hathras-1) 50.0
Jackfruit
252.5
Other Citrus
37.5
Other Fruits 76.0 157.5 -81.5
Total 114.1 242.5 -128.4
Source: primary survey 2018-19 and Department of Horticulture. *Difference is
estimated by subtracting Agency data from the Primary survey Data collected by the Department of

116
Horticulture, Govt. of Uttar Pradesh. #, Most of mango growing households have new orchards of mango
(age of mango orchards was only 3-5 years). So the yield of mango was very low.
In the case of vegetables, 28 individual crops have been included for comparison (Table
4.19). Out of 28, three vegetables i.e. turnip, pointed guard and sweet potato was in the
agency data but could not be captured during field survey. Besides, 5 vegetables namely
spinach, capsicum, cucumber, gwar and soya which were not in the secondary data were
found in our field data.
One more crop i.e. mushroom, which is neither found in the secondary data nor did we
find during our field survey, though when we initiated the study, we proposed to cover this
crop as well. We would have loved to know the status of mushroom in the state but in our
sample, we did not find any single household who is growing it. Two farmers in
Saharanpur district reported that they were growing mushrooms but as a kitchen
gardening and only for self-consumption.
Hence in the vegetables crops we can compare the yield of only 18 crops. The yield level of
Arbi/ Colacasia, green chili, Cauliflower and onion estimated by the agency was found lower
to the estimates generated by field survey. While, yield level of remaining 14 crops were
found to have been over-estimated by the agency. It means yield level found in the survey
data was lower to the secondary data.
Table 4.19: Difference in Yield of Vegetables through Field Survey and Estimates of
Secondary data for Horticultural Crops (Qtls./ha)
Name of Crops Survey Yield
2018-19
Yield based on Secondary
2017-18
Difference*
Arbi/ Colacasia 168.3 167.5 0.75
Ash Gourd/Petha 141.8 360.0 -218.25
Beans 35.0 147.5 -112.50
Bitter Gourd 85.8 187.5 -101.75
Bottle Gourd 283.8 305.0 -21.25
Brinjal 226.0 342.5 -116.50
Cabbage 305.8 335.0 -29.25
Carrot 132.8 252.5 -119.75
Cauliflower 233.3 227.5 5.75
Green Chili 77.8 25.0 52.75
Green peas 73.3 127.5 -54.25
Okra /Ladies Finger 110.0 135.0 -25.00
Onion 159.0 157.5 1.50
Potato 221.3 252.5 -31.25
Pumpkin 220.0 387.5 -167.50
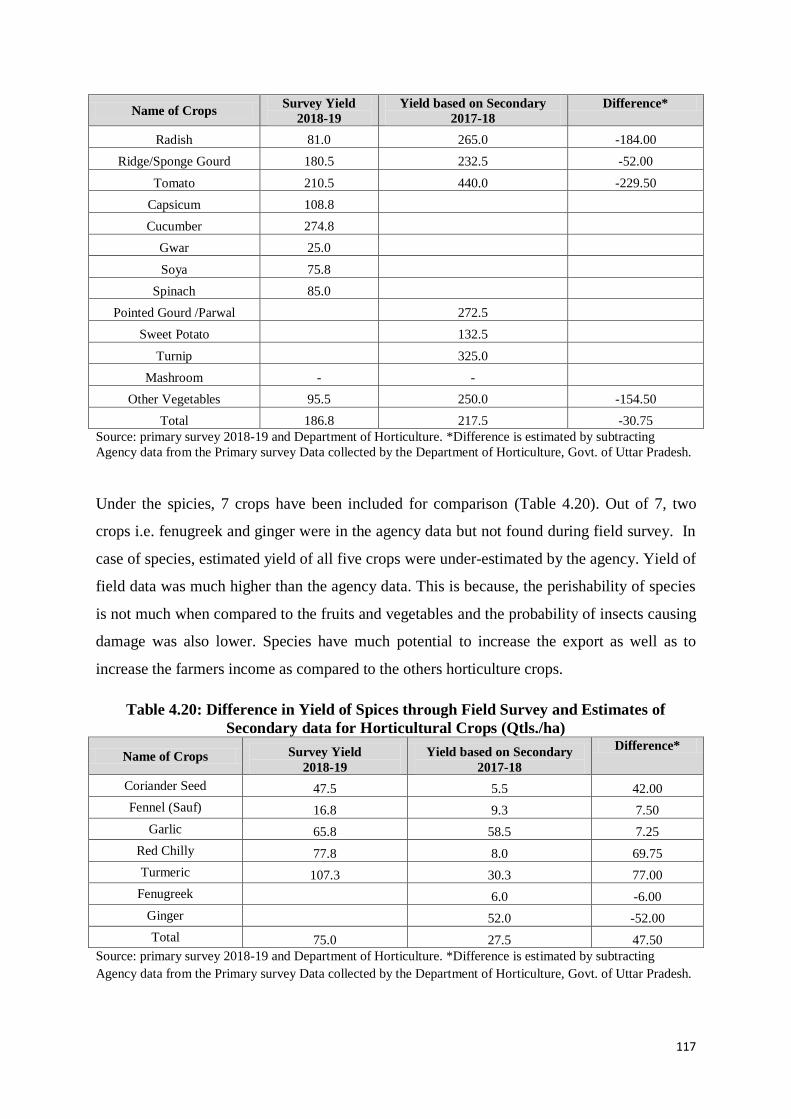
117
Name of Crops Survey Yield
2018-19
Yield based on Secondary
2017-18
Difference*
Radish 81.0 265.0 -184.00
Ridge/Sponge Gourd 180.5 232.5 -52.00
Tomato 210.5 440.0 -229.50
Capsicum 108.8
Cucumber 274.8
Gwar 25.0
Soya 75.8
Spinach 85.0
Pointed Gourd /Parwal 272.5
Sweet Potato 132.5
Turnip 325.0
Mashroom - -
Other Vegetables 95.5 250.0 -154.50
Total 186.8 217.5 -30.75
Source: primary survey 2018-19 and Department of Horticulture. *Difference is estimated by subtracting
Agency data from the Primary survey Data collected by the Department of Horticulture, Govt. of Uttar Pradesh.
Under the spicies, 7 crops have been included for comparison (Table 4.20). Out of 7, two
crops i.e. fenugreek and ginger were in the agency data but not found during field survey. In
case of species, estimated yield of all five crops were under-estimated by the agency. Yield of
field data was much higher than the agency data. This is because, the perishability of species
is not much when compared to the fruits and vegetables and the probability of insects causing
damage was also lower. Species have much potential to increase the export as well as to
increase the farmers income as compared to the others horticulture crops.
Table 4.20: Difference in Yield of Spices through Field Survey and Estimates of
Secondary data for Horticultural Crops (Qtls./ha)
Name of Crops Survey Yield
2018-19
Yield based on Secondary
2017-18
Difference*
Coriander Seed 47.5 5.5 42.00
Fennel (Sauf) 16.8 9.3 7.50
Garlic 65.8 58.5 7.25
Red Chilly 77.8 8.0 69.75
Turmeric 107.3 30.3 77.00
Fenugreek 6.0 -6.00
Ginger 52.0 -52.00
Total 75.0 27.5 47.50
Source: primary survey 2018-19 and Department of Horticulture. *Difference is estimated by subtracting
Agency data from the Primary survey Data collected by the Department of Horticulture, Govt. of Uttar Pradesh.
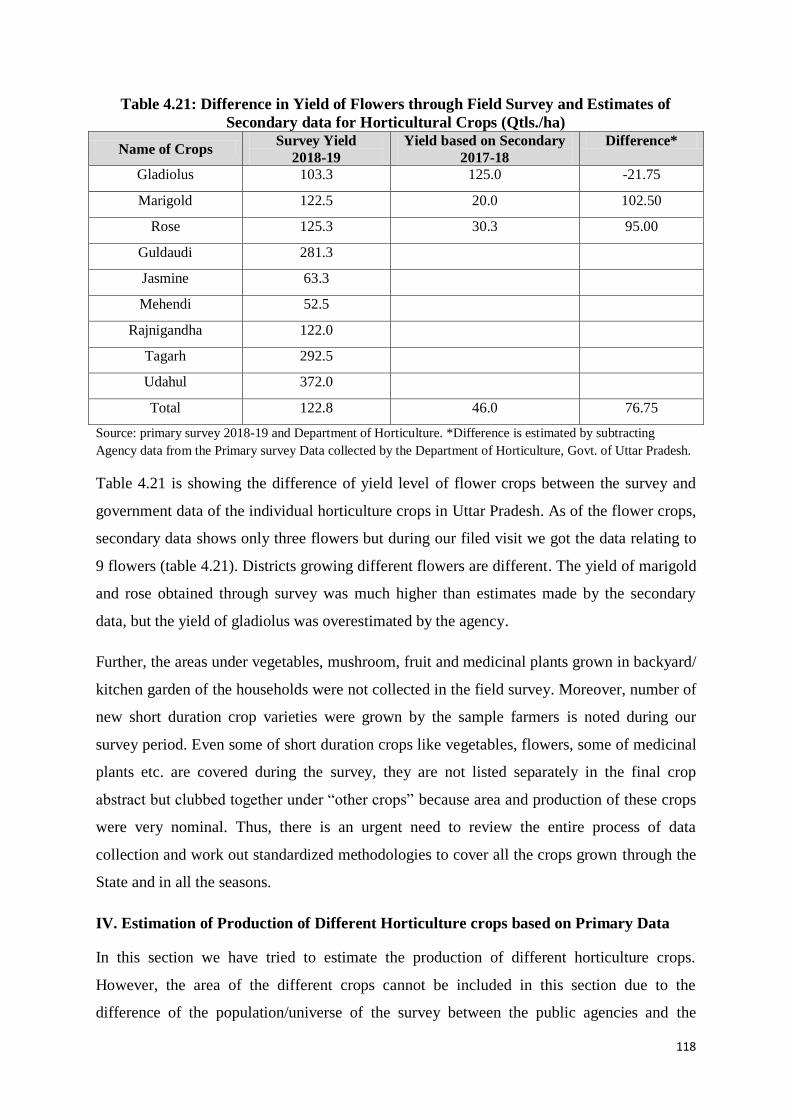
118
Table 4.21: Difference in Yield of Flowers through Field Survey and Estimates of
Secondary data for Horticultural Crops (Qtls./ha)
Name of Crops Survey Yield
2018-19
Yield based on Secondary
2017-18
Difference*
Gladiolus 103.3 125.0 -21.75
Marigold 122.5 20.0 102.50
Rose 125.3 30.3 95.00
Guldaudi 281.3
Jasmine 63.3
Mehendi 52.5
Rajnigandha 122.0
Tagarh 292.5
Udahul 372.0
Total 122.8 46.0 76.75
Source: primary survey 2018-19 and Department of Horticulture. *Difference is estimated by subtracting
Agency data from the Primary survey Data collected by the Department of Horticulture, Govt. of Uttar Pradesh.
Table 4.21 is showing the difference of yield level of flower crops between the survey and
government data of the individual horticulture crops in Uttar Pradesh. As of the flower crops,
secondary data shows only three flowers but during our filed visit we got the data relating to
9 flowers (table 4.21). Districts growing different flowers are different. The yield of marigold
and rose obtained through survey was much higher than estimates made by the secondary
data, but the yield of gladiolus was overestimated by the agency.
Further, the areas under vegetables, mushroom, fruit and medicinal plants grown in backyard/
kitchen garden of the households were not collected in the field survey. Moreover, number of
new short duration crop varieties were grown by the sample farmers is noted during our
survey period. Even some of short duration crops like vegetables, flowers, some of medicinal
plants etc. are covered during the survey, they are not listed separately in the final crop
abstract but clubbed together under “other crops” because area and production of these crops
were very nominal. Thus, there is an urgent need to review the entire process of data
collection and work out standardized methodologies to cover all the crops grown through the
State and in all the seasons.
IV. Estimation of Production of Different Horticulture crops based on Primary Data
In this section we have tried to estimate the production of different horticulture crops.
However, the area of the different crops cannot be included in this section due to the
difference of the population/universe of the survey between the public agencies and the

119
present study. For instance, public agencies (DES, DHO, etc) surveyed entire State and
country, while, this present study covered a few sample villages from 9 agro-climatic zones
of the State of Uttar Pradesh for the study.
So, we tried to estimate the production of the different horticulture crops at agro-climatic
zone-wise as well as at state level. For estimation, we have taken the final area of different
horticulture crops given by the DoH (Department of Horticulture) and productivity estimated
through the primary survey. But this estimation based on empirical investigation might
project lower estimates at the state level because of much byouncy/ fluctuation in the
productivity of different crops on the annual basis due to natural or other calamities. To
control this variation, we computed the average for three years i.e. triennium ending
averages. Here we have only one year‟s data so variation will be so high. However, we have
given an estimate of production to see the situation of horticulture production at district as
well as state level. To estimate the zone –wise production, we have taken the sum of area of
different district belonging to the respective zone and for yield, we assumed the average yield
of surveyed district as same for the zone. Further, to estimate the state level production, we
added the zone-wise production and thus projected for the state level.
Table 4.22 shows the estimated production of different fruits for the agro-climatic zone-wise
as well as state level. Among the fruits, banana production is highest followed by mango. But
here, there is a need to clear one thing that, during the survey year, in Rampur we did not
found any production of mango because some of growers reported that in their orchards,
mango production being alternative years. Last year mango production was good but in the
current year he production of mango was very law. On the other hand, in and Amroha, and
Saharanpur, some of surveyed household have new mango orchards, so yield of mango was
very law. Age of the tree affect the mango production. So, banana production is higher than
the mango at state level. The production of litchi, we only found in Saharanpur and
muskmelon & papaya only in Sultanpur. The growers of zone three, growing many kind of
fruits as compared to others zones.

120
Table 4.22: Zone-wise Estimates Production of Fruit Crops in Uttar Pradesh: 2019-20
(by Sample Survey), Final Estimates: Production in '000' Qlt
Name of
Crops Zone 1 Zone 2 Zone 3
Zone
4
Zone
5 Zone 6
Zone
7
Zone
8
Zone
9 UP
Surveyed
district
Saharanp
ur
Gorakhp
ur
Sultanp
ur Jalaun
Hathra
s
Mirzap
ur
Amroh
a
Kanna
uj
Rampu
r Total
Anola 0.0 0.0 0.0 251.0 0.0 0.0 0.0 0.0 0.0 2952.7
Banana 0.0 19.8 4937.1 1009.
4 0.0 0.0 0.0 0.0 0.0
23612.
6
Guava 61.2 0.0 2353.3 28.3 907.7 92.7 814.7 0.0 0.0 3859.3
Litchi 5.3 0.0 0.0 0.0 0.0 0.0 0.0 0.0 0.0 120.2
Mango 1157.3 8.8 8675.3 3455.
0 0.0 0.0
1043.
6 0.0 0.0
19901.
4
Musk melon 0.0 0.0 636.5 0.0 0.0 0.0 0.0 0.0 0.0 1861.1
Papaya 0.0 0.0 316.1 0.0 0.0 0.0 0.0 0.0 0.0 831.0
Water- melon 0.0 5.8 0.0 0.0 0.0 0.0 0.0 0.0 0.0 543.2
Others 14.6 12.1 807.3 66.0 47.7 36.4 113.2 0.0 0.0 840.5
Total 807.5 514.5 25693.
7
7273.
2
3399.
2 4411.4 140.8 0.0 0.0
26265.
2
Source: Estimated by the author.
Table 4.23 shows the estimated production of different vegetables at the agro-climatic zone-
wise as well as state level. Under the major vegetables, production of potato is highest
followed by green peas, onion, tomato and bottle guard. But here, there is a need to clear one
thing that, growers reported that they faces maximum losses in the vegetables due to different
kind of diseases and insects. Besides, prices of vegetables also fluctuate whole years. The
production of beans, bitter guard, sitafal was very law. Very few farmer grow these crops
because of lack of demand.
Table 4.23: Zone-wise Estimates Production of Vegetable Crops in Uttar Pradesh: 2019-
20 (by Sample Survey), Final Estimates: Production in '000' Qlt
Name of Crops Zone 1 Zone 2 Zone 3 Zone 4 Zone 5 Zone 6 Zone 7 Zone 8 Zone 9 UP
Arbi (taro root) 0.0 30.5 347.2 0.0 0.0 0.0 488.1 0.0 30.5 1665.5
Beans 0.0 4.5 0.0 0.0 0.0 0.0 0.0 0.0 0.0 343.0
Bitter gourd (karela) 0.0 28.8 0.0 0.0 5.1 53.8 0.0 0.0 15.3 359.2
Bottle Gourd (lauki) 153.4 48.8 610.8 247.6 439.3 107.3 1569.1 0.0 1301.6 4069.6
Brinjal 0.0 46.5 265.2 218.6 52.4 117.0 403.8 13.1 75.4 1788.2
Cabbage (band gobhi) 0.0 41.9 757.3 0.0 0.0 0.0 2568.8 0.0 0.0 2735.7
Carrot 0.0 0.0 0.0 0.0 0.0 0.0 0.0 0.0 270.6 840.6
Cauliflower (phul
gobhi) 133.0 33.0 691.5 0.0 528.3 505.0 370.1 9.6 826.3 4038.9
Green Chilly 114.1 57.4 2171.7 134.7 102.8 34.7 366.9 95.5 118.8 2265.2
Green peas 0.0 15690.8 0.0 1957.6 0.0 779.4 1588.0 0.0 158.8 15990.0
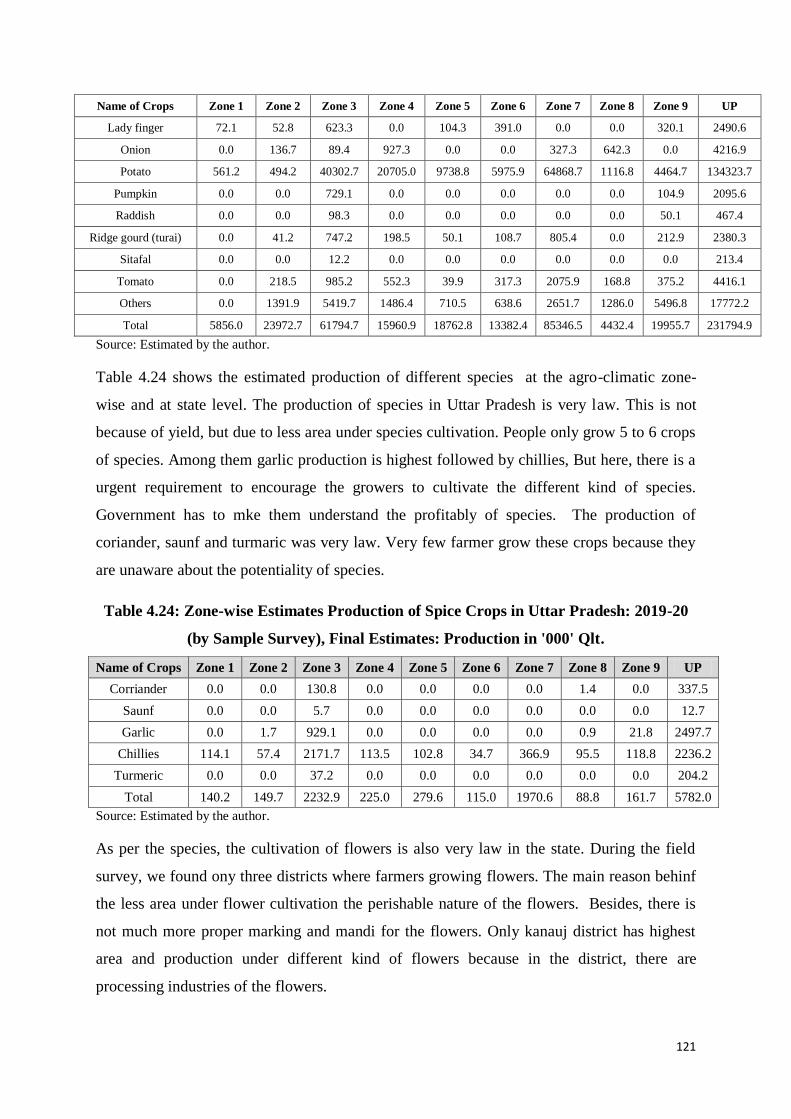
121
Name of Crops Zone 1 Zone 2 Zone 3 Zone 4 Zone 5 Zone 6 Zone 7 Zone 8 Zone 9 UP
Lady finger 72.1 52.8 623.3 0.0 104.3 391.0 0.0 0.0 320.1 2490.6
Onion 0.0 136.7 89.4 927.3 0.0 0.0 327.3 642.3 0.0 4216.9
Potato 561.2 494.2 40302.7 20705.0 9738.8 5975.9 64868.7 1116.8 4464.7 134323.7
Pumpkin 0.0 0.0 729.1 0.0 0.0 0.0 0.0 0.0 104.9 2095.6
Raddish 0.0 0.0 98.3 0.0 0.0 0.0 0.0 0.0 50.1 467.4
Ridge gourd (turai) 0.0 41.2 747.2 198.5 50.1 108.7 805.4 0.0 212.9 2380.3
Sitafal 0.0 0.0 12.2 0.0 0.0 0.0 0.0 0.0 0.0 213.4
Tomato 0.0 218.5 985.2 552.3 39.9 317.3 2075.9 168.8 375.2 4416.1
Others 0.0 1391.9 5419.7 1486.4 710.5 638.6 2651.7 1286.0 5496.8 17772.2
Total 5856.0 23972.7 61794.7 15960.9 18762.8 13382.4 85346.5 4432.4 19955.7 231794.9
Source: Estimated by the author.
Table 4.24 shows the estimated production of different species at the agro-climatic zone-
wise and at state level. The production of species in Uttar Pradesh is very law. This is not
because of yield, but due to less area under species cultivation. People only grow 5 to 6 crops
of species. Among them garlic production is highest followed by chillies, But here, there is a
urgent requirement to encourage the growers to cultivate the different kind of species.
Government has to mke them understand the profitably of species. The production of
coriander, saunf and turmaric was very law. Very few farmer grow these crops because they
are unaware about the potentiality of species.
Table 4.24: Zone-wise Estimates Production of Spice Crops in Uttar Pradesh: 2019-20
(by Sample Survey), Final Estimates: Production in '000' Qlt.
Name of Crops Zone 1 Zone 2 Zone 3 Zone 4 Zone 5 Zone 6 Zone 7 Zone 8 Zone 9 UP
Corriander 0.0 0.0 130.8 0.0 0.0 0.0 0.0 1.4 0.0 337.5
Saunf 0.0 0.0 5.7 0.0 0.0 0.0 0.0 0.0 0.0 12.7
Garlic 0.0 1.7 929.1 0.0 0.0 0.0 0.0 0.9 21.8 2497.7
Chillies 114.1 57.4 2171.7 113.5 102.8 34.7 366.9 95.5 118.8 2236.2
Turmeric 0.0 0.0 37.2 0.0 0.0 0.0 0.0 0.0 0.0 204.2
Total 140.2 149.7 2232.9 225.0 279.6 115.0 1970.6 88.8 161.7 5782.0
Source: Estimated by the author.
As per the species, the cultivation of flowers is also very law in the state. During the field
survey, we found ony three districts where farmers growing flowers. The main reason behinf
the less area under flower cultivation the perishable nature of the flowers. Besides, there is
not much more proper marking and mandi for the flowers. Only kanauj district has highest
area and production under different kind of flowers because in the district, there are
processing industries of the flowers.

122
Table 4.25: Zone-wise Estimates Production of Flower Crops in Uttar Pradesh: 2019-20
(by Sample Survey), Final Estimates: Production in '000' Qlt
Name of
Crops
Zone
1
Zone
2
Zone
3
Zone
4
Zone
5
Zone
6
Zone
7
Zone
8
Zone
9 UP
Gladiolus 0.0 0.0 0.0 6.1 0.0 0.0 0.0 0.0 0.0 354.2
Marigold 0.0 0.0 0.0 38.0 0.0 24.8 0.0 0.0 0.0 488.2
Rose 0.0 0.0 0.0 10.8 0.0 39.5 0.0 1.0 0.0 1695.
6
Total 0.0 0.0 0.0 74.8 0.0 87.0 0.0 0.9 0.0 2575.
0
Source: Estimated by the author.
Besides, Jalaun and Mirzapur also growing the flowers. Among the flowers, the production of
Rose is highest followed by the marigold and gladious. In the field survey, we also found the
other flowers also growing the farmers. Since, we do not have the secondary data of these
crops, we could not estimate the production of those flowers.
The district-wise details of estimated production have been given in the appendix tables.
V: CONCLUSION:
Our study has clearly demonstrated that the benchmark survey of all the horticulture crops in
the sampled farms was very pertinently carried out by determining the area, production and
yield on basis of primary survey. The study conducted district wise detailed analysis of cost
incurred on various horticulture groups of crops and also explains about the percent profit per
acre of all horticulture crops enjoyed by the farming community of our sampled farms. It can
be concluded that out of total gross cropped area, the food grain cultivation constituted
maximum area under cultivation and different horticulture crop followed by fruits, vegetables
and cash crops. It was found that area under spices and flower cultivation are in very low
proportion in the selected districts. It also reflects upon the fact that overall, the yield per acre
was highest for cash crops. Potato cultivation had an upper hand in terms of districts
specializing in its growing in almost maximum district. Overall Yield was also highest for
other crops followed by total vegetables, spices and fruits. Mango was the most important
fruit crops of the state accounting for maximum proportion of the area. Other main fruits
were banana, guava, papaya muskmelom, sitafal etc. A wide variety of vegetables are also
grown all over the state including potato, tomato, and cauliflower, etc. Overall, the findings
are that the total yield under vegetable crops was much better in Rampur and Amroha
districts. Further, it can be concluded that chilli and garlic was the major spice crops in
selected sampled district as compared to coriander, turmeric and sauf. Rose, marigold and
jasmine were the major flower crops grown in the selected sampled farms. However, an effort

123
should be made to raise the yield of popular flowers in the districts by making all efforts.
There has been a sharp increase in the area and output of horticulture crops in selected sample
district thereby giving scope for further diversification and increasing income in the future.
Further, our study reveals about the there is high potential of crop diversification for income
enhancement of farmers. The study also elaborates and explains about the cost structure
thorugh examining total cost spent on seeds, expenditure on land preparation, cost of
plantation, expenditure on irrigation, expenditure on soil fertilizer, expenditure on pesticides,
labor cost, cost incurred on washing branding and packaging, sowing to transplanting,
transportation cost, Govt. revenue, cost on cold storage, cost on middlemen and other cost. It
can be perceived that the proportion of labor cost for all crops was highest followed by other
costs such as cost of seeds, irrigation and land preparation. The percent profit per acre was
28.4 percent from 46.6 percent per acre income. Hence, it can be concluded that if farmers
shift their area to horticulture crops, income can be increased, and it can be more profitable to
the farmers to grow more crops in the district. As, it has been well recognized that the
horticulture crops have the inherent advantage of providing higher productivity per unit area
of land as compared to other crops, resulting in higher income and employment generation in
rural areas.

124
Appendices
Table A1: Details of Zone and the Surveyed Districtsi in the Respected Zone.
agro-climatic
zone
Zone-
1
Bhabh
ar and
Tarai
Zone
Zone-2
Bundelkha
nd Zone
Zone-
3
Centr
al
Zone
Zone-
4
Easte
rn
Plain
Zone
Zone-
5 Mid-
Weste
rn
Plain
Zone
Zone-
6
North
-
Easte
rn
Plain
Zone
Zone
-7
Sout
h-
West
Semi
Arid
Zone
Zone-
8
Vindh
ya
Area
Zone-
9
Weste
rn
Plain
Zone
Uttar
Prade
sh
surveyed
districts
Sah
aran
pu
r
Gora
khpur
Sult
anpur
Jala
un
Hat
hra
s
Mir
zapur
Am
roha
Kan
nau
j
Ram
pur
Tota
l
Table A2: District wise Estimates Production of Fruit Crops in Uttar Pradesh: 2019-20
(by Sample Survey), Final Estimates: Production in '000' Qlt
Name of Crops
Sah
ara
np
ur
Gora
kh
pu
r
Su
ltan
pu
r
Jala
un
Hath
ras
Mir
zap
ur
Am
roh
a
Kan
nau
j
Ram
pu
r
Tota
l
Aonla/Gooseberry 0.0 0.0 0.0 10.0 0.0 0.0 0.0 0.0 0.0 196.4
Banana 0.0 11655.6 98.1 0.0 0.0 0.0 0.0 0.0 0.0 6583.4
Guava 21.8 0.0 10.7 0.2 352.9 42.4 28.9 0.0 0.0 600.1
Litchi 0.8 0.0 0.0 0.0 0.0 0.0 0.0 0.0 0.0 6.8
Mango 2861.2 373.0 990.6 1.3 0.0 0.0 707.5 0.0 0.0 4331.2
Muskmelon 0.0 0.0 6.0 0.0 0.0 0.0 0.0 0.0 0.0 233.8
Papaya 0.0 0.0 0.0 0.0 0.0 0.0 0.0 0.0 0.0 59.3
Watermelon 0.0 0.8 0.0 0.0 0.0 0.0 0.0 0.0 0.0 65.4
Other Fruits 12.1 1.5 20.8 1.3 6.0 6.8 11.4 0.0 0.0 113.1
Total 1355.4 3530.5 1817.1 35.2 729.5 81.5 29.4 0.0 0.0 5175.0

125
Table A3: District wise Estimates Production of Vegetable Crops in Uttar Pradesh:
2019-20 (by Sample Survey), Final Estimates: Production in '000' Qlt
Name of Crops S
ah
ara
np
ur
Gora
kh
pu
r
Su
ltan
pu
r
Jala
un
Hath
ras
Mir
zap
ur
Am
roh
a
Kan
nau
j
Ram
pu
r
Tota
l
Arbi/ Colacasia 0.0 4.1 10.9 0.0 0.0 0.0 66.7 0.0 11.0 117.3
Beans (All Including
Lab- lab (Sem)) 0.0 0.3 0.0 0.0 0.0 0.0 0.0 0.0 0.0 52.0
Bitter Gourd 0.0 3.3 0.0 0.0 0.4 0.0 0.0 0.0 1.8 37.0
Bottle Gourd 49.9 9.3 14.3 3.6 174.4 0.4 79.2 0.0 44.7 406.0
Brinjal 0.0 6.2 10.0 7.1 19.3 8.1 0.0 53.4 91.8 267.4
Cabbage 7.3 42.9 6.2 0.0 0.0 0.0 0.0 0.0 0.0 233.0
Carrot 0.0 0.0 0.0 0.0 0.0 0.0 0.0 0.0 5.2 45.0
Cauliflower 112.3 73.5 44.2 0.0 29.1 8.7 11.6 25.1 70.0 455.9
Green Chilly 1.1 0.4 8.6 13.3 41.0 56.4 5.6 17.5 23.7 216.0
Peas (Green) 0.0 204.9 0.0 3649.1 0.0 162.9 5.9 0.0 148.6 4597.2
Okra /Ladies Finger 79.5 39.3 24.8 0.0 48.3 1.1 0.0 0.0 3.2 217.8
Onion 0.0 28.0 6.5 32.3 0.0 0.0 3.5 591.1 0.0 491.7
Potato 63.8 888.1 1100.0 199.2 11140.7 452.1 1199.7 12688.4 306.1 27175.1
Kaddu/Pumpkin 0.0 0.0 26.9 0.0 0.0 0.0 0.0 459.6 0.0 296.9
Radish 0.0 0.0 2.7 0.0 0.0 0.0 0.0 0.0 5.3 31.9
Ridge/Sponge
Gourd (Torai) 0.0 4.3 0.0 7.7 5.4 0.0 39.9 58.7 22.4 206.0
Tomato 0.0 11.8 21.5 183.0 34.8 91.7 3.1 124.5 0.0 553.5
Ash Gourd/Petha 0.0 0.0 0.4 0.0 0.0 0.0 0.0 0.0 0.0 4.8
Other Vegetables 0.0 207.0 376.0 204.2 84.8 136.4 642.7 530.0 1185.0 2933.7
Total 1528.3 1657.2 2885.5 6105.9 11715.2 1775.6 3189.6 14559.2 2946.2 44841.9
Table A4: District wise Estimates Production of Spice Crops in Uttar Pradesh: 2019-20
(by Sample Survey), Final Estimates: Production in '000' Qlt
Name of Crops
Sah
ara
np
ur
Gora
kh
pu
r
Su
ltan
pu
r
Jala
un
Hath
ras
Mir
zap
ur
Am
roh
a
Kan
nau
j
Ram
pu
r
Tota
l
Coriander Seed 0.0 0.0 2.9 0.0 0.0 0.0 0.0 1.8 0.0 14.1
Fennel (Sauf) 0.0 0.0 0.1 0.0 0.0 0.0 0.0 0.0 0.0 0.5
Garlic 0.0 0.2 2.3 0.0 0.0 0.0 0.0 59.5 12.3 127.0
Red Chilly 1.1 0.4 8.6 13.3 41.0 56.4 5.6 17.5 23.7 216.0
Turmeric 0.0 0.0 0.0 0.0 0.0 0.0 0.0 0.0 0.0 7.4
Total 5.7 0.8 12.8 13.5 66.2 55.8 5.5 112.1 40.5 379.8
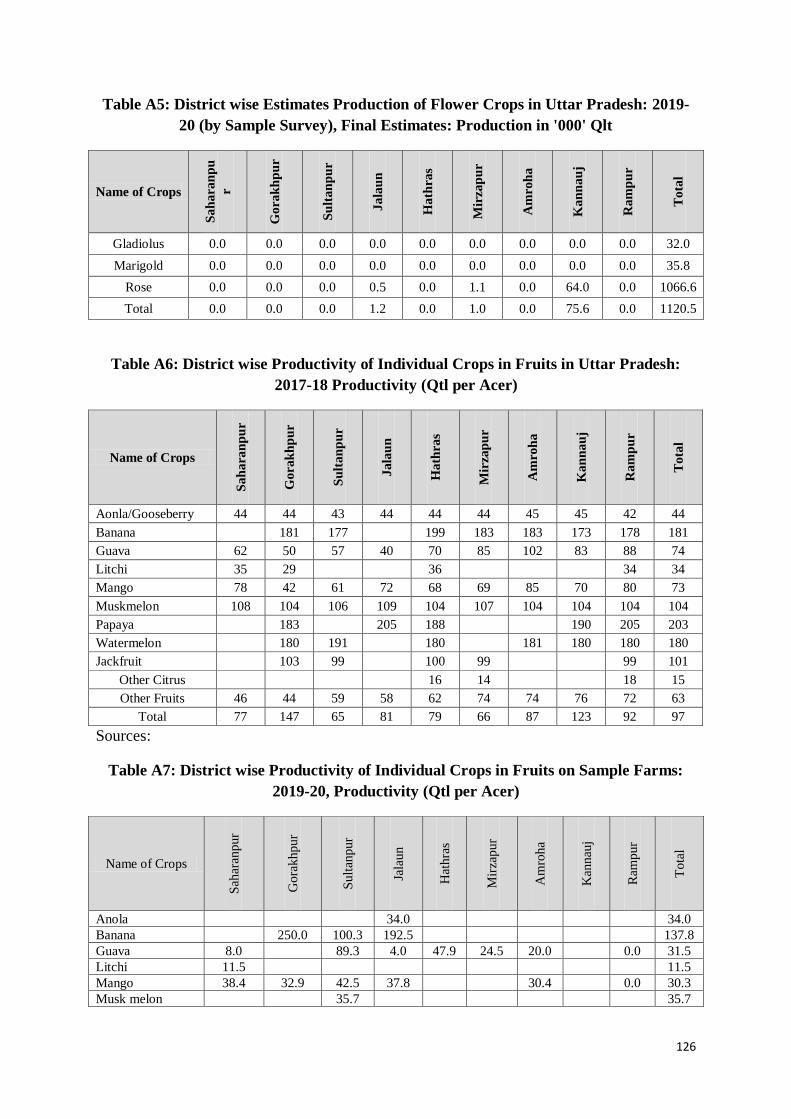
126
Table A5: District wise Estimates Production of Flower Crops in Uttar Pradesh: 2019-
20 (by Sample Survey), Final Estimates: Production in '000' Qlt
Name of Crops
Sah
ara
np
u
r
Gora
kh
pu
r
Su
ltan
pu
r
Jala
un
Hath
ras
Mir
zap
ur
Am
roh
a
Kan
nau
j
Ram
pu
r
Tota
l
Gladiolus 0.0 0.0 0.0 0.0 0.0 0.0 0.0 0.0 0.0 32.0
Marigold 0.0 0.0 0.0 0.0 0.0 0.0 0.0 0.0 0.0 35.8
Rose 0.0 0.0 0.0 0.5 0.0 1.1 0.0 64.0 0.0 1066.6
Total 0.0 0.0 0.0 1.2 0.0 1.0 0.0 75.6 0.0 1120.5
Table A6: District wise Productivity of Individual Crops in Fruits in Uttar Pradesh:
2017-18 Productivity (Qtl per Acer)
Name of Crops
Sah
ara
np
ur
Gora
kh
pu
r
Su
ltan
pu
r
Jala
un
Hath
ras
Mir
zap
ur
Am
roh
a
Kan
nau
j
Ram
pu
r
Tota
l
Aonla/Gooseberry 44 44 43 44 44 44 45 45 42 44
Banana 181 177 199 183 183 173 178 181
Guava 62 50 57 40 70 85 102 83 88 74
Litchi 35 29 36 34 34
Mango 78 42 61 72 68 69 85 70 80 73
Muskmelon 108 104 106 109 104 107 104 104 104 104
Papaya 183 205 188 190 205 203
Watermelon 180 191 180 181 180 180 180
Jackfruit 103 99 100 99 99 101
Other Citrus 16 14 18 15
Other Fruits 46 44 59 58 62 74 74 76 72 63
Total 77 147 65 81 79 66 87 123 92 97
Sources:
Table A7: District wise Productivity of Individual Crops in Fruits on Sample Farms:
2019-20, Productivity (Qtl per Acer)
Name of Crops
Sah
aran
pur
Gora
khpur
Sult
anpur
Jala
un
Hat
hra
s
Mir
zapur
Am
roha
Kan
nau
j
Ram
pur
Tota
l
Anola 34.0 34.0
Banana 250.0 100.3 192.5 137.8
Guava 8.0 89.3 4.0 47.9 24.5 20.0 0.0 31.5
Litchi 11.5 11.5
Mango 38.4 32.9 42.5 37.8 30.4 0.0 30.3
Musk melon 35.7 35.7

127
Name of Crops
Sah
aran
pur
Gora
khpur
Sult
anpur
Jala
un
Hat
hra
s
Mir
zapur
Am
roha
Kan
nau
j
Ram
pur
Tota
l
Papaya 167.0 167.0
Water- melon 16.0 16.0
Lemon 32.9 31.7
Peach 25.0 25.0
Pomegranate 22.3 22.3
Raspberry 20.0 20.0
Others 11.5 16.0 101.3 22.5 20.0 32.9 25.0 0.0 30.4
Total 17.2 57.0 67.9 60.7 47.6 20.4 1.1 0.0 22.3
Sources: Primary Survey, 2019.
Table A8: District wise Productivity of Individual Crops in Vegetables in Uttar
Pradesh: 2017-18 Productivity (Qtl per Acer)
Name of Crops
Sah
aran
pur
Gora
khpur
Sult
anpur
Jala
un
Hat
hra
s
Mir
zapur
Am
roha
Kan
nau
j
Ram
pur
Total
Arbi/ Colacasia 74 69 67 68 70 66 66 66 67
Ash Gourd/Petha 143 144 144
Beans 57 60 61 61 59 56 56 59
Bitter Gourd 73 69 82 84 80 72 82 81 75
Bottle Gourd 117 118 125 131 116 88 147 117 119 122
Brinjal 140 136 151 121 137 140 135 136 137
Cabbage 145 131 144 138 132 134 134
Carrot 103 100 140 102 83 101 102 101
Cauliflower 91 92 90 117 90 89 91 92 91 91
Green Chilly 10 10 10 10 10 10 10 10 10 10
Green Peas 44 41 40 54 63 42 39 54 41 51
Okra /Ladies Finger 57 55 50 50 54 85 51 55 53 54
Onion 62 57 55 64 72 73 79 63 76 63
Potato 92 97 91 101 100 101 97 104 104 101
Pumpkin 135 145 149 145 166 155 155
Radish 96 114 90 108 107 116 107 112 106
Ridge/Sponge Gourd
(Torai) 85 90 91 98 97 91 98 93
Tomato 171 121 171 196 180 131 222 184 176
Pointed Gourd
/Parwal 160 109 87 125 147 128 109
Sweet Potato 55 56 53 54 53 53 53 53
Turnip 138 136 120 120 116 128 136 130
Other Vegetables 105 68 132 127 62 103 77 114 118 100
Total 100 81 82 60 97 68 84 103 100 87
Sources: Primary Survey, 2019.
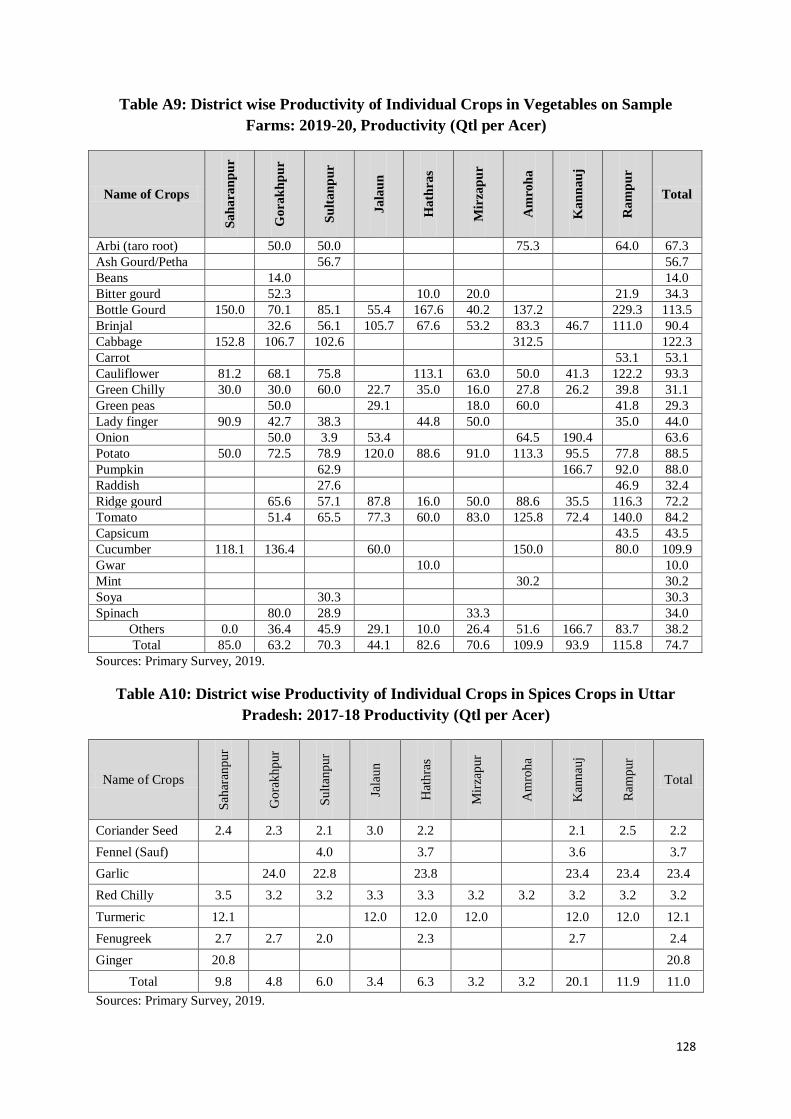
128
Table A9: District wise Productivity of Individual Crops in Vegetables on Sample
Farms: 2019-20, Productivity (Qtl per Acer)
Name of Crops
Sah
ara
np
ur
Gora
kh
pu
r
Su
ltan
pu
r
Jala
un
Hath
ras
Mir
zap
ur
Am
roh
a
Kan
nau
j
Ram
pu
r
Total
Arbi (taro root) 50.0 50.0 75.3 64.0 67.3
Ash Gourd/Petha 56.7 56.7
Beans 14.0 14.0
Bitter gourd 52.3 10.0 20.0 21.9 34.3
Bottle Gourd 150.0 70.1 85.1 55.4 167.6 40.2 137.2 229.3 113.5
Brinjal 32.6 56.1 105.7 67.6 53.2 83.3 46.7 111.0 90.4
Cabbage 152.8 106.7 102.6 312.5 122.3
Carrot 53.1 53.1
Cauliflower 81.2 68.1 75.8 113.1 63.0 50.0 41.3 122.2 93.3
Green Chilly 30.0 30.0 60.0 22.7 35.0 16.0 27.8 26.2 39.8 31.1
Green peas 50.0 29.1 18.0 60.0 41.8 29.3
Lady finger 90.9 42.7 38.3 44.8 50.0 35.0 44.0
Onion 50.0 3.9 53.4 64.5 190.4 63.6
Potato 50.0 72.5 78.9 120.0 88.6 91.0 113.3 95.5 77.8 88.5
Pumpkin 62.9 166.7 92.0 88.0
Raddish 27.6 46.9 32.4
Ridge gourd 65.6 57.1 87.8 16.0 50.0 88.6 35.5 116.3 72.2
Tomato 51.4 65.5 77.3 60.0 83.0 125.8 72.4 140.0 84.2
Capsicum 43.5 43.5
Cucumber 118.1 136.4 60.0 150.0 80.0 109.9
Gwar 10.0 10.0
Mint 30.2 30.2
Soya 30.3 30.3
Spinach 80.0 28.9 33.3 34.0
Others 0.0 36.4 45.9 29.1 10.0 26.4 51.6 166.7 83.7 38.2
Total 85.0 63.2 70.3 44.1 82.6 70.6 109.9 93.9 115.8 74.7
Sources: Primary Survey, 2019.
Table A10: District wise Productivity of Individual Crops in Spices Crops in Uttar
Pradesh: 2017-18 Productivity (Qtl per Acer)
Name of Crops
Sah
aran
pur
Gora
khpur
Sult
anpur
Jala
un
Hat
hra
s
Mir
zapur
Am
roha
Kan
nau
j
Ram
pur
Total
Coriander Seed 2.4 2.3 2.1 3.0 2.2 2.1 2.5 2.2
Fennel (Sauf) 4.0 3.7 3.6 3.7
Garlic 24.0 22.8 23.8 23.4 23.4 23.4
Red Chilly 3.5 3.2 3.2 3.3 3.3 3.2 3.2 3.2 3.2 3.2
Turmeric 12.1 12.0 12.0 12.0 12.0 12.0 12.1
Fenugreek 2.7 2.7 2.0 2.3 2.7 2.4
Ginger 20.8 20.8
Total 9.8 4.8 6.0 3.4 6.3 3.2 3.2 20.1 11.9 11.0
Sources: Primary Survey, 2019.

129
Table A11: District wise Productivity of Individual Crops in Spices on Sample Farms:
2019-20, Productivity (Qtl per Acer)
Name of Crops
Sah
aran
pur
Gora
khpur
Sult
anpur
Jala
un
Hat
hra
s
Mir
zapur
Am
roha
Kan
nau
j
Ram
pur
Total
Corriander 12.7 26.0 19.0
Sauf 6.7 6.7
Garlic 35.0 29.7 15.0 26.1 26.3
Chillies 30.0 30.0 60.0 22.7 35.0 16.0 27.8 26.2 39.8 31.1
Turmeric 42.9 42.9
Total 30.0 32.5 28.2 22.7 35.0 16.0 27.8 23.8 36.3 30.0
Sources: Primary Survey, 2019.
Table A12: District wise Productivity of Individual Crops in Flowers in Uttar Pradesh:
2017-18 Productivity (Qtl per Acer)
Name of
Crops
Sah
aran
pur
Gora
khpur
Sult
anpur
Jala
un
Hat
hra
s
Mir
zapur
Am
roha
Kan
nau
j
Ram
pur
Total
Gladiolus 50.0 50.0 50.0
Marigold 8.0 8.0 8.0 8.0
Rose 8.6 1.3 11.1 12.0 12.0 14.6 12.1
Total 39.8 27.9 11.1 17.6 12.0 18.6 18.4
Sources: Primary Survey, 2019.
Table A13: District wise Productivity of Individual Crops in Flower on Sample Farms:
2019-20, Productivity (Qtl per Acer)
Name of Crops
Sah
ara
np
ur
Gora
kh
pu
r
Su
ltan
pu
r
Jala
un
Hath
ras
Mir
zap
ur
Am
roh
a
Kan
nau
j
Ram
pu
r
Total
Gladiolus 41.3 41.3
Marigold 34.1 77.7 49.0
Rose 14.0 111.1 33.9 50.1
Guldaudi 112.5 112.5
Jasmine 25.3 25.3
Mehendi 21.0 21.0
Rajnigandha 48.8 48.8
Tagarh 117.0 117.0
Udahul 148.8 148.8
Total 36.7 96.5 29.6 49.1
Sources: Primary Survey, 2019.

130

130
Chapter 5
Problems and Constraints Confronted by Growers
of Horticulture Crops
Over the years the horticulture sector has emerged as a potential for the development of the
agricultural sector. It offers a wide range of options to the farmers for crop diversification. It
is clear from the foregoing analysis that there has been a substantial increase in area,
production and productivity in major horticulture crops since last few years. However, the
gaps in the horticulture development, in the State have been identified in this chapter. It is
evident that horticulture sector would be competitive provided weaknesses are converted into
opportunities. It was seen that in spite of all the efforts, the horticulture farmers or growers of
the study district are facing lot of constraints in different areas which hamper the working
environment of horticulture farming. The key difficulties are related to farmers in selling of
the crops, finance, marketing, labour, storage, maintenance, knowledge and so on, which are
elaborated below.
I: Status of Selling of Orchards
Table 5.1 reveals about the district wise distribution of selling of orchards before planting
crops thus revealing that overall 21.9 percent of total respondents reported positively of
selling their orchards before planting while 78.1 percent reported in denial. Further, the table
states that out of total, highest proportion of (65 percent) sampled respondent accepted of
selling of orchards before planting crops in Saharanpur District followed by Amroha (42
percent), Rampur (29 percent) and Gorakhpur (25 percent). Further, in all other districts it
was found that maximum proportion of respondent reported of not selling their orchards
before planting of the crops. This can be reported as good indicator for the sample farms.
Table 5.1: Distribution of Sample Farms Reporting of Selling of Orchards (percent)
District
Sale of the Orchard
before Plantation To whom the Orchard was Sold
Total
YES NO Big farmers Trader
Money
lenders
Saharanpur 65.0 35.0 7.69 90.77 1.54 100
Gorakhpur 25.0 75.0 24.00 64.00 12.00 100
Sultanpur 7.0 93.0 28.57 57.14 14.29 100
Jalaun 1.0 99.0 0.00 100.00 0.00 100

131
District
Sale of the Orchard
before Plantation To whom the Orchard was Sold
Total
YES NO Big farmers Trader
Money
lenders
Hathras 6.0 94.0 33.33 50.00 16.67 100
Mirzapur 14.0 86.0 21.43 78.57 0.00 100
Amroha 42.0 58.0 7.14 92.86 0.00 100
Kannauj 8.0 92.0 0.00 87.50 12.50 100
Rampur 29.0 71.0 10.34 79.31 13.79 100
Total 21.9 78.1 12.18 82.74 5.58 900
Source: Primary Survey, 2019.
Figure 5.1: Distribution of sampled grower reporting of selling of orchards before Plantation
Source: Primary Survey, 209.
Further, the Table 5.1 also reveals about the district wise distribution of sample farms
reporting of selling orchards to different person such as to big farmers, traders or money
lenders. The table shows that out of 21.9 percent revealed of selling their orchards and
maximum number of respondents told of selling their orchards to traders i.e. 18.1 percent
followed by big farmers (2.7percent) and money lenders (1.1percent). This shows that most
of the respondent sells their orchards to traders.
Figure 5.2: Distribution of Sample Farms Reporting of Selling of Orchards to Different Person
Source: Primary Survey, 2019.
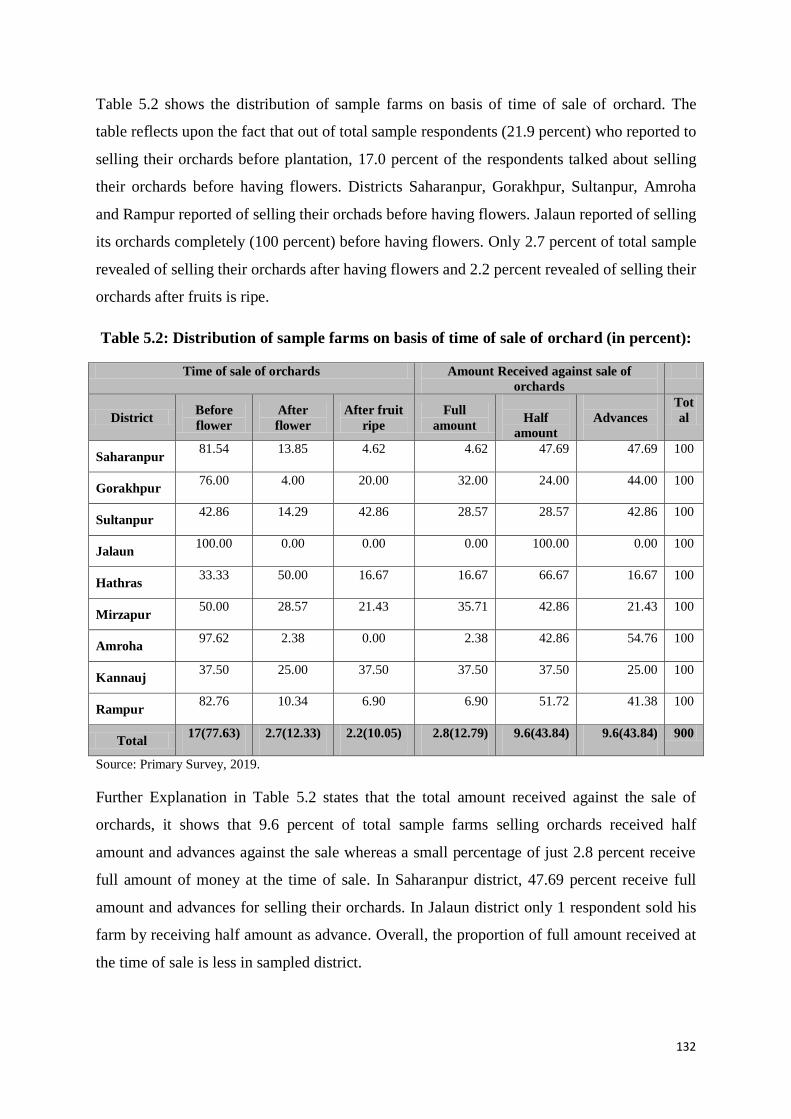
132
Table 5.2 shows the distribution of sample farms on basis of time of sale of orchard. The
table reflects upon the fact that out of total sample respondents (21.9 percent) who reported to
selling their orchards before plantation, 17.0 percent of the respondents talked about selling
their orchards before having flowers. Districts Saharanpur, Gorakhpur, Sultanpur, Amroha
and Rampur reported of selling their orchads before having flowers. Jalaun reported of selling
its orchards completely (100 percent) before having flowers. Only 2.7 percent of total sample
revealed of selling their orchards after having flowers and 2.2 percent revealed of selling their
orchards after fruits is ripe.
Table 5.2: Distribution of sample farms on basis of time of sale of orchard (in percent):
Time of sale of orchards Amount Received against sale of
orchards
District Before
flower
After
flower
After fruit
ripe
Full
amount
Half
amount
Advances
Tot
al
Saharanpur 81.54 13.85 4.62 4.62 47.69 47.69 100
Gorakhpur 76.00 4.00 20.00 32.00 24.00 44.00 100
Sultanpur 42.86 14.29 42.86 28.57 28.57 42.86 100
Jalaun 100.00 0.00 0.00 0.00 100.00 0.00 100
Hathras 33.33 50.00 16.67 16.67 66.67 16.67 100
Mirzapur 50.00 28.57 21.43 35.71 42.86 21.43 100
Amroha 97.62 2.38 0.00 2.38 42.86 54.76 100
Kannauj 37.50 25.00 37.50 37.50 37.50 25.00 100
Rampur 82.76 10.34 6.90 6.90 51.72 41.38 100
Total 17(77.63) 2.7(12.33) 2.2(10.05) 2.8(12.79) 9.6(43.84) 9.6(43.84) 900
Source: Primary Survey, 2019.
Further Explanation in Table 5.2 states that the total amount received against the sale of
orchards, it shows that 9.6 percent of total sample farms selling orchards received half
amount and advances against the sale whereas a small percentage of just 2.8 percent receive
full amount of money at the time of sale. In Saharanpur district, 47.69 percent receive full
amount and advances for selling their orchards. In Jalaun district only 1 respondent sold his
farm by receiving half amount as advance. Overall, the proportion of full amount received at
the time of sale is less in sampled district.

133
Figure 5.3: Distribution of sampled farms on basis of Amount received against sale of orchard:
Source: Primary Survey, 2019.
Table 5.3 explains about the distribution of sample farms who reported of taking care of
orchards after sale. Maximum 18.2 percent of total reported of traders who take care of the
orchards after purchasing these orchards. Only 2.8 percent of farm owners who take care of
the farms themselves even after its sale. It is to be noticed that 0.9 percent reported of
keeping servants for taking care of the orchards after the sale.
Table 5.3: Distribution of Sample reporting of Taking Care of Orchard after Sale:
District Farm owner Trader Servant Total No. of HH
Saharanpur 2.0 61.0 2.0 65.0 100
Gorakhpur 6.0 16.0 3.0 25.0 100
Sultanpur 2.0 5.0 0.0 7.0 100
Jalaun 0.0 1.0 0.0 1.0 100
Hathras 0.0 6.0 0.0 6.0 100
Mirzapur 1.0 13.0 0.0 14.0 100
Amroha 7.0 33.0 2.0 42.0 100
Kannauj 4.0 4.0 0.0 8.0 100
Rampur 3.0 25.0 1.0 29.0 100
Total 2.8 18.2 0.9 21.9 900
Source: Primary Survey, 2019.
Table 5.4 explains the duration of selling orchards and shows that most of the respondent i.e.
12.1 percent sell their land for maximum period of two years. Only 9.0 percent of total
percent selling their land reveals of selling for maximum period of 1 year. Only 0.8 percent
owners reported of selling their orchards for less than 6 months.

134
Table 5.4: Duration of Selling of Orchards:
District For 6 months For 1 year For 2 years Total No. of HH
Saharanpur 3.0 11.0 51.0 65.0 100
Gorakhpur 3.0 18.0 4.0 25.0 100
Sultanpur 0.0 3.0 4.0 7.0 100
Jalaun 0.0 1.0 0.0 1.0 100
Hathras 0.0 4.0 2.0 6.0 100
Mirzapur 1.0 11.0 2.0 14.0 100
Amroha 0.0 11.0 31.0 42.0 100
Kannauj 0.0 7.0 1.0 8.0 100
Rampur 0.0 15.0 14.0 29.0 100
Total 0.8 9.0 12.1 21.9 900
Source: Primary Survey, 2019.
Table 5.5 reveals about the problems faced by the farmers during the sale of the orchards. It
shows that 34.9 percent reported problem of delayed payment which was highest in Amroha
(53.5 percent) district followed by Saharanpur (50 percent), Jalaun (35.7 percent) and
Rampur (33.3 percent). Only 10 percent reported of delayed payment in Sultanpur District.
Further to congregate the problem 23.9 percent of total sampled farms stated about the
problem of unreasonable prices being charged by traders and 13 percent reported about the
problem that their farms which they sell are not taken proper care. Nearly 11.0 percent
revealed about using of harmful pesticides and incomplete payment. 0.4 percent of farms
revealed about facing problem of growing another crop. Hence this can be said that almost all
the sampled respondent in selected district reported of facing some problem pr the other
during the time of sale of orchards.
Table 5.5: Type of Problems Faced During Selling and Marketing of Orchards
Problems
Sah
ara
np
ur
Gora
kh
pu
r
Su
ltan
pu
r
Jala
un
Hath
ras
Mir
zap
ur
Am
roh
a
Kan
nau
j
Ram
pu
r
Tota
l
Incomplete/No
payment 14.3 13.3 0.0 14.3 50.0 21.1 2.3 5.3 7.7 11.3
Delay in payment 50.0 16.7 10.0 35.7 12.5 15.8 53.5 21.1 33.3 34.9
No care taken of
farm/trees 14.3 20.0 0.0 21.4 0.0 21.1 18.6 0.0 5.1 13.0
Use of harmful
pesticides 10.7 20.0 0.0 0.0 25.0 10.5 18.6 0.0 7.7 11.3
Grow another crop 0.0 3.3 0.0 0.0 0.0 0.0 0.0 0.0 0.0 0.4
Remind traders
about the payment 1.8 3.3 10.0 21.4 0.0 15.8 0.0 5.3 5.1 5.0
Unreasonable price
by traders 8.9 23.3 80.0 7.1 12.5 15.8 7.0 68.4 41.0 23.9
Total 100.0 100.0 100.0 100.0 100.0 100.0 100.0 100.0 100.0 100.0
Source: Primary Survey, 2019.
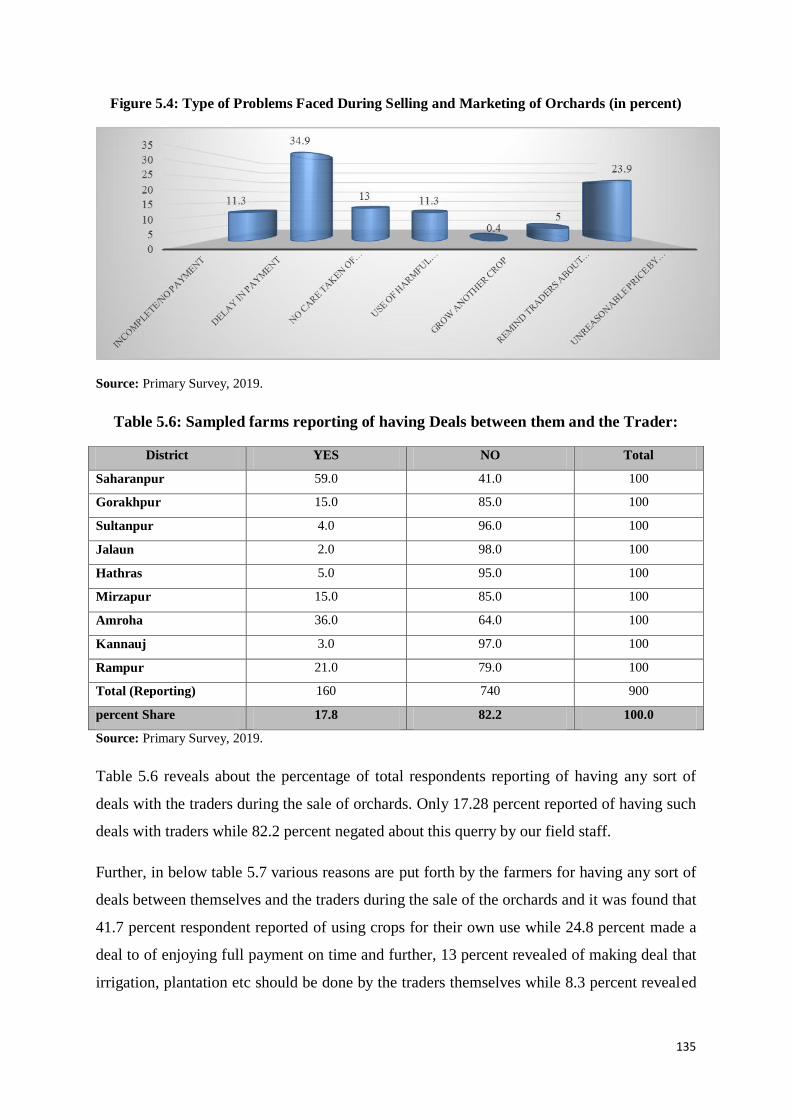
135
Figure 5.4: Type of Problems Faced During Selling and Marketing of Orchards (in percent)
Source: Primary Survey, 2019.
Table 5.6: Sampled farms reporting of having Deals between them and the Trader:
District YES NO Total
Saharanpur 59.0 41.0 100
Gorakhpur 15.0 85.0 100
Sultanpur 4.0 96.0 100
Jalaun 2.0 98.0 100
Hathras 5.0 95.0 100
Mirzapur 15.0 85.0 100
Amroha 36.0 64.0 100
Kannauj 3.0 97.0 100
Rampur 21.0 79.0 100
Total (Reporting) 160 740 900
percent Share 17.8 82.2 100.0
Source: Primary Survey, 2019.
Table 5.6 reveals about the percentage of total respondents reporting of having any sort of
deals with the traders during the sale of orchards. Only 17.28 percent reported of having such
deals with traders while 82.2 percent negated about this querry by our field staff.
Further, in below table 5.7 various reasons are put forth by the farmers for having any sort of
deals between themselves and the traders during the sale of the orchards and it was found that
41.7 percent respondent reported of using crops for their own use while 24.8 percent made a
deal to of enjoying full payment on time and further, 13 percent revealed of making deal that
irrigation, plantation etc should be done by the traders themselves while 8.3 percent revealed

136
of making promise of having payment before cutting of the crops. Hence, more or less every
respondent revealed of facing problem in regard of sale of orchards.
Table 5.7: Type of Reasons given by sampled Respondent for having Deals between Traders
Sah
ara
np
ur
Gora
kh
pu
r
Su
ltan
pu
r
Jala
un
Hath
ras
Mir
zap
ur
Am
roh
a
Kan
nau
j
Ram
pu
r
Tota
l
Payment before
crop cutting 12.5 0.0 0.0 0.0 22.2 11.1 3.4 0.0 6.5 8.3
Irrigation,
soiling,
plantation etc
should be done
by the trader
16.1 34.6 20.0 50.0 11.1 5.6 1.7 0.0 12.9 13.9
Full payment on
time 25.9 19.2 40.0 25.0 11.1 22.2 31.0 0.0 19.4 24.8
crops for self use 33.9 38.5 40.0 25.0 55.6 55.6 48.3 0.0 54.8 41.7
Use of
appropriate of
pesticides 9.8 3.8 0.0 0.0 0.0 0.0 13.8 0.0 0.0 7.5
No harm to
crops/trees 1.8 3.8 0.0 0.0 0.0 5.6 1.7 100.0 6.5 3.8
Total 100.0 100.0 100.0 100.0 100.0 100.0 100.0 100.0 100.0 100.0
Source: Primary Survey, 2019.
Most of the sampled population revealed of selling their crops before harvesting. Hence, it is
important to analyze the status of respondent who stated of its beneficiality in selling crops
before harvesting. Table 5.8 captures the responses put forth by the growers, nearly 78
percent reported of not having any beneficial experience from selling crops before harvesting
while 21.6 percent revealed of having benefits from selling their crops before harvesting. It is
thus, clear from the table that most of respondents in all districts do not find any type of
benefits from selling crops before harvesting.
Table 5.8: Distribution of Sampled Population who reported of Benefits of selling Crops
before Harvesting:
District YES No No. of HH
Saharanpur 52.0 48.0 100
Gorakhpur 37.0 63.0 100
Sultanpur 19.0 81.0 100
Jalaun 4.0 96.0 100
Hathras 7.0 93.0 100

137
District YES No No. of HH
Mirzapur 16.0 84.0 100
Amroha 37.0 63.0 100
Kannauj 2.0 98.0 100
Rampur 20.0 80.0 100
Total 21.6 78.4 900
Source: Primary Survey, 2019.
There are different reasons given by sampled farms while reported of having benefits from
selling their crops before harvesting where 31.4 percent revealed of saying that they have
nothing much to do with the crops, whereas, 9.3 percent reported of having good profit and
getting reasonable prices by selling crops before harvesting. 18 percent stated of having no
fear of loss by selling their crops. It is to be noticed that 19.0 percent revealed of selling their
crops before harvesting as they said that their personal demands are fulfilled after the
payment is received. Thus, the table 5.9 reveals of different type of benefits enjoyed by
sampled farms by selling their crops before harvesting.
Table 5.9: Type of Benefits Explained by Sampled Population Due to Selling Crops before Harvesting:
District
Sah
ara
np
ur
Gora
kh
pu
r
Su
ltan
pu
r
Jala
un
Hath
ras
Mir
zap
ur
Am
roh
a
Kan
nau
j
Ram
pu
r
Tota
l
Farming expenses
reduces 7.7 0.0 5.3 0.0 14.3 0.0 2.7 0.0 0.0 3.6
Nothing much left
to do 38.5 18.9 10.5 75.0 42.9 56.3 35.1 0.0 20.0 31.4
Helps in taking
care of other crops 7.7 10.8 0.0 0.0 0.0 18.8 2.7 0.0 10.0 7.2
Good
profit/reasonable
amount
15.4 5.4 0.0 0.0 28.6 0.0 2.7 0.0 25.0 9.3
Full payment is
made, no use of
labor force 21.2 5.4 0.0 0.0 14.3 0.0 2.7 0.0 5.0 8.2
No fear of loss 5.8 8.1 10.5 0.0 0.0 6.3 21.6 0.0 35.0 12.4
No investment
required 3.8 5.4 5.3 0.0 0.0 0.0 27.0 0.0 5.0 8.2
Personal demands
are fulfilled after
payment is
received
0.0 45.9 68.4 25.0 0.0 18.8 5.4 100.0 0.0 19.6
Total 100.0 100.0 100.0 100.0 100.0 100.0 100.0 100.0 100.0 100.0
Source: Primary Survey, 2019.

138
II: Constraints in Selling and Marketing of All Horticulture Crops
The selling and market related challenges are the main problem in improving the economic
status of horticulture producers from small growers to large. These challenges are being faced
by growers of horticulture crops in world wide. Most of the farmers in the selected district
have faced the problems related to selling of their horticulture products. The growers of
horticulture crops basically find it very hard to selloff their produce to the ultimate customers
and as a result sell the crops to the traders leave them with lesser profits. Due to absence of a
proper marketing and selling policy and channels to assist the farmers of the district, the
productivity of the crops is being affected. The selling and marketing problems arise mainly
due to various reasons. Therefore, the marketing and selling of horticulture produce lack the
modern technique of selling off the products in a systematized way. Hence it is important to
solve the problems of the growers which are being faced by them while selling the crops. On
the same context, Table 5.10 explains the problem faced by the sample farms while selling
the crops where maximum 88.8 percent of total respondents accepted of facing the problem
in selling the crops where more than 90 percent of respondent from Jalaun, Hathras, Kannauj,
Rampur and Sultanpur accepted of having problem while selling the crops. This table gives
surety by all district of facing problem while selling the crops of various horticulture crops
either it be foodgrains, fruits, vegetables, spices or other crops.
Table 5.10: Distribution of Sample farms facing Problem while selling the Crops (in percent):
District YES No Total
Saharanpur 82.0 18.0 100.0
Gorakhpur 89.0 11.0 100.0
Sultanpur 92.0 8.0 100.0
Jalaun 96.0 4.0 100.0
Hathras 96.0 4.0 100.0
Mirzapur 83.0 17.0 100.0
Amroha 79.0 21.0 100.0
Kannauj 92.0 8.0 100.0
Rampur 90.0 10.0 100.0
Total 88.8 11.2 100.0
Source: Primary Survey, 2019.
Table 5.11 explains the problems faced by the farmers while selling of the food grains where
it shows that maximum 12.9 percent of total sample size face problem regarding prices
measurement information in selling of food grain crops, while nearly 11 percent face problem
of low market availability and bad behavior of traders. Most of the farmers revealed of selling

139
their crops to traders that too unwillingly. Transportation and irrigation problems are also
found to be faced by farmers in selling of the foodgrains crops. 9 percent revealed about the
lack of availability of labour for selling the crops and 3.4 percent also accepted problem of
cold storage for foodgrains crops. In all districts, the major problem was selling of their
crops to traders that too unwillingly.
Table 5.11: Type of Problem Faced while selling the Food grain crops (in percent):
District
Sah
ara
np
ur
Gora
kh
pu
r
Su
ltan
pu
r
Jala
un
Hath
ras
Mir
zap
ur
Am
roh
a
Kan
nau
j
Ram
pu
r
Tota
l
Agriculturable land 5.2 6.9 6.6 8.1 8.3 9.0 4.9 7.8 8.2 7.4
Irrigation prob. 10.7 9.7 10.3 11.4 12.0 11.7 10.3 11.7 10.4 10.9
Prob. in getting loan 5.8 8.4 7.2 8.9 7.0 9.2 5.4 7.3 7.5 7.6
Prob. in paying loan 4.5 6.7 7.0 6.9 7.0 7.8 4.0 7.3 7.0 6.6
Lack of labour 7.9 8.0 8.7 10.6 9.9 9.4 8.9 10.9 9.2 9.4
Transportation prob. 8.2 9.9 11.3 10.0 10.4 9.6 8.9 11.3 10.4 10.1
Coldstorage prob. 3.1 4.3 2.6 3.7 3.6 2.7 3.4 2.7 4.1 3.4
Loading prob. 5.8 9.0 10.1 8.4 8.5 8.0 5.2 8.0 6.8 8.0
Traders behavior
prob. 15.1 12.2 11.1 10.3 10.8 10.1 16.0 10.5 12.1 11.7
Prices measurement
info 17.5 12.7 12.7 11.3 11.6 11.9 17.2 11.7 12.6 12.9
Market availability
prob. 16.2 12.2 12.3 10.5 10.8 10.5 15.8 10.7 11.6 11.9
Total 100.0 100.0 100.0 100.0 100.0 100.0 100.0 100.0 100.0 100
Source: Primary Survey, 2019.
Table 5.12 explains the major constraints faced by the farmers in selling fruits crops and
shows that most of the farmers reported of lack of proper information/ awraeness regarding
prices prevailing/measurement, while 10.0 percent reported of problem of irrigation,
marketing, and problem derived due to poor behavior of the traders while selling the fruits
crops. Fruits crops are perishable in nature hence, cold storage problem also emerged as the
next important issue closely followed by the problem of transportation of products.

140
Table 5.12: Type of Problem faced by farmers while selling the Fruits crops (in percent):
District
Sah
ara
np
ur
Gora
kh
pu
r
Su
ltan
pu
r
Jala
un
Hath
ras
Mir
zap
ur
Am
roh
a
Kan
nau
j
Ram
pu
r
Tota
l
Agriculturable
land 5.6 10.4 4.9 9.5 6.1 8.8 7.5 0.0 8.2 7.4
Irrigation prob. 9.7 10.0 7.8 11.9 11.2 12.0 9.4 0.0 9.8 10.4
Prob. in getting
loan 6.0 8.5 7.8 7.1 6.5 7.9 7.5 0.0 8.2 7.2
Prob. in paying
loan 3.6 8.5 3.9 7.1 6.5 5.1 7.5 0.0 8.2 5.9
Lack of labour 10.5 9.5 10.7 9.5 10.5 7.9 7.5 0.0 9.8 9.7
Transportation
prob. 8.5 8.5 12.6 7.1 11.6 9.7 9.4 0.0 8.2 9.8
Coldstorage prob. 9.7 9.0 8.7 7.1 6.8 6.5 5.7 0.0 9.8 8.0
Loading prob. 6.9 8.5 6.8 9.5 8.2 7.9 7.5 0.0 8.2 7.8
Traders behavior
prob. 12.5 9.0 10.7 7.1 10.5 9.7 13.2 0.0 9.8 10.5
Prices
measurement info 15.3 9.5 14.6 11.9 11.2 12.5 13.2 0.0 9.8 12.3
Market availability
prob. 11.7 8.5 11.7 11.9 10.9 12.0 11.3 0.0 9.8 10.9
Total 100.0 100.0 100.0 100.0 100.0 100.0 100.0 0.0 100.0 100.0
Source: Primary Survey, 2019.
Table 5.13 shows the problems faced by the farmers while selling of the vegetable crops. It
can be derived that the most acutely felt constraints is the irrigation problem and lack of
information regarding prices measurements. The constraints of irrigation also affected some
cultivators particularly to those districts with less irrigation facility. 11.1 percent of farmers
also complain about the lack of market availability while selling of the vegetable crops.
Transportation and lack of labour availability in Vegetable production and selling of the
produce was also mentioned as a problem by a good number of vegetable crops. Hence, this
can be said that most of the farmers face problem in selling of the produce of vegetable crops.
Table 5.13: Type of Problem faced by farmers while selling the Vegetables crops (in percent):
District
Sah
ara
np
ur
Gora
kh
pu
r
Su
ltan
pu
r
Jala
un
Hath
ras
Mir
zap
ur
Am
roh
a
Kan
nau
j
Ram
pu
r
Tota
l
Agriculturable land 5.5 6.8 7.1 7.6 7.7 8.6 5.4 7.4 7.8 7.3
Irrigation prob. 12.1 10.1 10.3 11.8 11.5 11.5 11.1 12.1 10.4 11.1
Prob. in getting loan 2.2 8.5 9.1 7.7 5.8 7.7 7.0 6.3 9.7 7.6
Prob. in paying loan 3.3 6.0 5.9 5.7 5.8 6.2 4.3 6.3 6.2 5.8
Lack of labour 8.8 8.0 7.7 9.7 10.6 9.4 11.4 10.0 10.4 9.5

141
District
Sah
ara
np
ur
Gora
kh
pu
r
Su
ltan
pu
r
Jala
un
Hath
ras
Mir
zap
ur
Am
roh
a
Kan
nau
j
Ram
pu
r
Tota
l
Transportation prob. 8.8 8.9 10.2 9.1 10.3 8.6 10.0 10.4 9.2 9.6
Coldstorage prob. 11.0 8.2 8.2 9.4 9.1 7.4 7.6 7.4 9.2 8.5
Loading prob. 4.4 7.5 8.0 6.9 8.4 7.4 5.4 7.6 6.2 7.2
Traders behavior prob. 12.1 11.6 10.3 9.9 9.3 10.0 12.5 10.2 10.4 10.5
Prices measurement info 14.3 12.6 11.8 11.5 11.2 12.1 13.0 11.9 10.4 11.8
Market availability prob. 17.6 11.9 11.4 10.8 10.3 11.2 12.2 10.4 10.1 11.1
Total 100.0 100.0 100.0 100.0 100.0 100.0 100.0 100.0 100.0 100.0
Source: Primary Survey, 2019.
In case of Flower crops, lack of Irrigation facility, lack of labour, lack of information
regarding price measurement and lack of market availability emerge as a major constraint in
selling of the flower crops. Flower cultivation was mainly found in Gorakhpur, Jalaun,
Mirzapur, Kannauj and Rampur district of the selected sampled district. The problem of cold
storage facilities was felt strongly as the flower need proper storage after the produce is ready
after harvesting. 9 percent of the respondent also reveals of facing the transportation problem.
Hence, it can be said that all the districts under flower cultivation face more or less problem
in selling of the produce. Hence, proper measures should be taken in order to solve the
problems facing by farmers in flower production.
Table 5.14: Type of Problem faced by farmers while selling Flowers crops (in percent):
District Gorakhpur Jalaun Mirzapur Kannauj Rampur Total
Agriculturable land 4.8 5.7 9.6 7.3 0.0 7.5
Irrigation prob. 8.4 12.5 13.0 12.1 15.4 12.5
Prob. in getting loan 4.0 8.0 6.2 6.9 0.0 6.8
Prob. in paying loan 4.0 5.7 6.2 7.3 0.0 6.6
Lack of labour 9.7 11.4 11.6 11.8 15.4 11.7
Transportation prob. 9.3 11.4 8.2 8.5 15.4 9.0
Coldstorage prob. 10.6 5.7 4.8 5.7 0.0 5.4
Loading prob. 7.5 5.7 6.2 7.9 7.7 7.1
Traders behavior prob. 12.3 11.4 9.6 10.0 15.4 10.2
Prices measurement info 16.7 11.4 12.3 12.1 15.4 12.0
Market availability prob. 12.8 11.4 12.3 10.6 15.4 11.2
Total 100.0 100.0 100.0 100.0 100.0 100.0
Source: Primary Survey, 2019.

142
Table 5.15 explains the constraints faced by farmers while selling of the spice crops in the
selected districts where it was found that most of the farmers face problem of information
regarding price measurements. In order to sell spice crops, maximum farmers also reveal of
facing marketing problem and lack of availability of proper market. Irrigation problem was
also faced by farmers under spice cultivation. Hence, to sum up, the foremost constraints
before farmers in selling of the various horticulture crops, most of the farmers face problem
of information regarding prices and irrigation problem followed by less availability of
market. Significantly, the problem of availability of credit and loan repayment was not felt as
serious constraints by most of our respondents. The problem of cold storage facilities was
also felt very strongly as the farmers prefer to sell their produce at the time of harvesting to
receive ready money.
Table 5.15: Type of Problem faced by farmers while selling Spices crops:
District
Sah
ara
np
ur
Gora
kh
pu
r
Su
ltan
pu
r
Jala
un
Hath
ras
Mir
zap
ur
Am
roh
a
Kan
nau
j
Ram
pu
r
Tota
l
Agriculturable land 9.7 8.6 8.0 8.2 8.3 6.6 6.7 9.0 8.3 8.1
Irrigation prob. 12.9 11.4 11.0 11.3 12.5 10.5 12.6 13.5 10.5 11.4
Prob. in getting loan 6.5 11.4 9.0 8.2 4.2 7.9 9.2 5.4 7.0 7.7
Prob. in paying loan 6.5 5.7 8.0 5.6 4.2 5.3 5.9 5.4 4.4 5.5
Lack of labour 9.7 8.6 10.0 9.7 12.5 10.5 9.2 9.9 10.5 10.0
Transportation prob. 12.9 8.6 11.0 8.7 12.5 10.5 8.4 10.8 9.8 9.8
Coldstorage prob. 0.0 2.9 2.0 9.7 0.0 6.6 5.0 6.3 6.0 5.9
Loading prob. 9.7 8.6 8.0 5.6 12.5 9.2 7.6 5.4 5.1 6.6
Traders behavior prob. 6.5 11.4 11.0 9.7 8.3 10.5 10.1 9.9 12.1 10.6
Prices measurement info 12.9 11.4 11.0 11.8 12.5 11.8 13.4 13.5 13.3 12.6
Market availability prob. 12.9 11.4 11.0 11.3 12.5 10.5 11.8 10.8 13.0 11.8
Total 100.0 100.0 100.0 100.0 100.0 100.0 100.0 100.0 100.0 100.0
Source: Primary Survey, 2019.
III: Competition Faced by Farmers Under Various Horticulture Crops:
Farmers producing various horticulture crop are confronted with tough competitions
regarding different prevailing prices, quality and its variety. Hence, it is important to analyze
and reflect upon the competition faced by them in context of price, quality and variety
involved in production and marketing horticulture crops.

143
Keeping track of the situation the table 5.16 below, explains the competition faced by farmers
under foodgrain crops in selected districts of the sample. It shows that maximum competition
is faced by Gorakhpur district where major competition under production of foodgrain crop is
regarding its variety followed by its quality and price. Nearly 12.5 percent of farmers
reported of competition faced by them in Sulatanpur and Jalaun district, where the major
competition is of its variety and quality. Near about 10 percent of farmers proclaimed of
facing competition regarding price, quality and its variety in Hathras, Mirzapur, Amroha,
Kannauj, Rampur and Saharanpur districts. Hence, it can be said that more or less all the
farmers in selected districts face some form of competition or the other under Food grains
crops.
Table 5.16: Type of Competition faced by Growers under Food grain crops:
District Price Quality Variety Total
Saharanpur 10.6 9.8 8.1 9.5
Gorakhpur 14.5 14.8 15.0 14.7
Sultanpur 12.0 12.2 12.4 12.2
Jalaun 12.3 12.6 12.6 12.5
Hathras 10.6 10.7 11.1 10.8
Mirzapur 10.0 9.7 10.4 10.0
Amroha 10.9 10.6 10.9 10.8
Kannauj 9.8 10.2 10.4 10.1
Rampur 9.3 9.5 9.2 9.3
Total 100.0 100.0 100.0 100.0
Source: Primary Survey, 2019.
Figure 5.5: Type of Competition faced by Growers of Food grain crops
Source: Primary Survey, 2019.

144
Table 5.17 state about the competition faced by the farmers under Fruit crops where 25.6
percent of total sampled farms face competition in Saharanpur district and the major
competition relates to its quality and its variety. Further, Hathras and Mirzapur districts
revealed of having competition under fruit crops in relation to its variety and its quality.
Lowest competition was faced by Rampur and Jalaun district and Kannauj has no cultivation
of fruit crops hence, the percentage is nil there. This shows that other than Kannuaj most of
the districts faces competition in regards to the variety of fruit cultivation. Hence, proper
measures should be suggested so as to improve the quality and variety of different fruits
crops.
Table 5.17: Type of Competition Faced by Growers under Fruits crops:
District Price Quality Variety Total
Saharanpur 26.3 26.2 24.3 25.6
Gorakhpur 13.2 13.8 13.9 13.6
Sultanpur 6.6 6.9 6.9 6.8
Jalaun 3.9 4.1 4.2 4.1
Hathras 21.7 21.4 21.5 21.5
Mirzapur 18.4 17.9 19.4 18.6
Amroha 5.3 5.5 5.6 5.4
Kannauj 0.0 0.0 0.0 0.0
Rampur 3.9 4.1 4.2 4.1
Total 100.0 100.0 100.0 100.0
Source: Primary Survey, 2019.
Figure 5.6: Type of Competition faced by Growers under Fruits Crops:
Source: Primary Survey, 2019.

145
Similar exercise has been done for vegetable grower as well and Table 5.18 explains the
competition faced by the farmers under vegetable crops. It was found that maximum
competition was reported by vegetable growers of Jalaun district i.e. 16.4 percent where the
major competition is of variety of the vegetable products followed by its quality and its price.
Further, Gorakhpur, Sultanpur and Hathras districts reported of facing competition in regard
price, quality and variety of vegetable production. Saharanpur growers revealed of facing
least competition under vegetable crops. To sum up, maximum districts were examined of
having huge competition in relation to its variety and quality, hence proper efforts should be
made to improve the condition of vegetable growers in the State.
Table 5.18: Type of Competition Faced by Growers under Vegetables crops:
District Price Quality Variety Total
Saharanpur 3.6 3.9 2.4 3.3
Gorakhpur 14.3 14.5 14.8 14.5
Sultanpur 14.1 14.3 14.6 14.3
Jalaun 16.2 16.2 16.8 16.4
Hathras 14.5 13.7 13.0 13.8
Mirzapur 8.6 8.5 8.9 8.7
Amroha 8.8 8.7 9.1 8.8
Kannauj 10.9 10.8 11.2 11.0
Rampur 9.1 9.3 9.3 9.2
Total 100.0 100.0 100.0 100.0
Source: Primary Survey, 2019.
Figure 5.7: Type of Competition faced by Growers of Vegetables Crops:
Source: Primary Survey, 2019.
Major competition under flower crops is faced by Kannauj district where 53.5 percent
revealed of facing competition regarding its price followed by quality and variety. Further,

146
Mirzapur and Gorakhpur districts face competition mainly of variety of flowers. Thus, the
table 5.19 reveals about the competition faced by the growers of flowers in relation to its
price, quality and mainly variety of flowers.
Table 5.19: Type of Competition faced by Growers under Flowers Crops:
District Price Quality Variety Total
Gorakhpur 16.9 23.1 29.4 23.0
Jalaun 12.7 13.8 13.2 13.2
Mirzapur 28.2 27.7 29.4 28.4
Kannauj 53.5 52.3 51.5 52.5
Rampur 18.3 16.9 13.2 16.2
Total 100.0 100.0 100.0 100.0
Source: Primary Survey, 2019.
Table 5.20: Type of Competition Faced by Growers under Spices Crops:
District Price Quality Variety Total
Saharanpur 3.1 3.2 3.1 3.1
Gorakhpur 3.1 3.2 3.1 3.1
Sultanpur 8.5 8.9 8.6 8.7
Jalaun 17.8 17.7 18.0 17.8
Hathras 2.3 2.4 2.3 2.4
Mirzapur 7.8 8.1 7.8 7.9
Amroha 14.0 13.7 14.1 13.9
Kannauj 11.6 10.5 10.9 11.0
Rampur 31.8 32.3 32.0 32.0
Total 100.0 100.0 100.0 100.0
Source: Primary Survey, 2019.
Similarly, the competition faced under spices crops are examined in table 5.20 where in
Jalaun district 18 percent of spice growers revealed of struggling under stiff competition in
regard to its variety and nearly 17 percent revealed about its price and quality with regard to
spice crops cultivation. Major growers in Amroha district also face competition in regard of
its price. On the whole, it can be said that maximum number of growers of different
horticulture crops experienced stiff competition regarding its variety, quality and its prices.
Hence, efforts should be taken in order to control the price of the crops, and to improve the
quality of the various horticulture crops and also to increase different variety of the crops so
as to improve the condition of the growers of horticulture crops and provide support in the
development of agriculture sector.

147
IV: Compensation for loss:
To help producers of horticulture crops government is known for its efforts to compensate
them in times of heavy losses that they face in times of mis-happening whether climatic
turmoil or natural clamaity. We also enquired about the losses that are respondents
experienced and whether they were able to convince the government organization to receive
compensation in case loss occurrence. Table 5.21 explains about the no. of sample farms who
reported of getting compensation for the loss of crops from any government organization. Out
of total sample size, maximum 98.1 percent of farmers reported of not receiving any type of
compensation for losses in crop production from any type of government organization. Only
1.9 percent reported about receiving compensation for loss of their crops.
Table 5.21: No. of Sample Farms getting Compensation for Loss of Crops
from any Government Organisation
District YES NO Total
Saharanpur 4.0 96.0 100
Gorakhpur 3.0 97.0 100
Sultanpur 1.0 99.0 100
Jalaun 6.0 94.0 100
Hathras 3.0 97.0 100
Mirzapur 0.0 100.0 100
Amroha 0.0 100.0 100
Kannauj 0.0 100.0 100
Rampur 0.0 100.0 100
Total 1.9 98.1 900
Source: Primary Survey, 2019.
Further, the table 5.22 explains about the crops for which the compensation received for loss
where in Saharanpur district, maximum loss is covered for crop named mango and Litchi.
Maximum loss is covered for wheat in Gorakhpur, Jalaun and Hathras district. Thus, it can be
concluded that only a small number of crops are covered for compensation for any loss by
any government organization.
Table 5.22: Name of Crop for which Compensation Received
District Saharanpur Gorakhpur Sultanpur Jalaun Hathras Total
Mango 3 0 0 0 0 3
Sugarcane 0 0 0 0 1 1
Wheat 0 2 0 1 2 5
Paddy 0 0 1 0 0 1
Peanuts 0 1 0 0 0 1
Tomato 0 0 0 3 0 3
Green peas 0 0 0 1 0 1
Gladiolus 0 0 0 1 0 1
Litchi 1 0 0 0 0 1
Total 4 3 1 6 3 17
Source: Primary Survey, 2019.

148
Table 5.23 reveals about the name of organization by which the compensation is received for
loss of the crops and it can be seen that the maximum help was given by the Agriculture/
Horticulture department followed by Jila Udhyan Kendras and Government. It can be seen
that RajashyaVibagh has also provided compensation to selected districts for loss of the
crops. PM Kisaan SamaanYojana has shown no role in providing compensation for loss of
the crops in the selected districts.
Table 5.23: Organization by which Compensation Received:
District Saharanpur Gorakhpur Sultanpur Jalaun Hathras Total
JilaUdhyan Kendra 3 0 0 0 1 4
PM KisaanSamaanYojna 0 0 0 0 0 0
RajasyaVibhag 0 2 0 0 0 2
Government 0 1 1 1 2 5
Agriculture/Horticulture
department 1 0 0 5 0 6
Total 4 3 1 6 3 17
Source: Primary Survey, 2019.
V: Credit and Finance:
Finance is one of the major problems faced by the growers or farmers of horticulture crops in
the selected districts. It was observed that the finance is the main factor which decides the
ability to take up horticulture farming as one‟s occupation. In the same context, Table 5.24
elaborates about the percentage of respondents those who have taken loan for growing such
crops and highlights that nearly, about 49 percent growers reported of taking loan while about
50.8 percent reported of not taking any loan. It was seen that out of total who have taken loan
maximum 74 percent of respondents in Amroha district reported taking laons and only 26
percent said „No they have not taken any loan‟. In Mirzapur district, the proportion of
respondents taking loan for crop growing is lower compared to other districts. Near about
half of the respondent i.e. 49.2 percent revealed of taking credit from different sources.
Further it is pertinent also to enquire or examine the sources from where the credit have been
sort. Table 5.24 states that maximum 83.1 percent respondents reported of taking credit from
financial institutions (Banks) which can be regarded as a good indicator of living. Further, 2.7
percent revealed of taking credit from Businessmen followed by Middlemen. 12.9 percent
stated of taking loan from other sources which may be through relatives and friends.
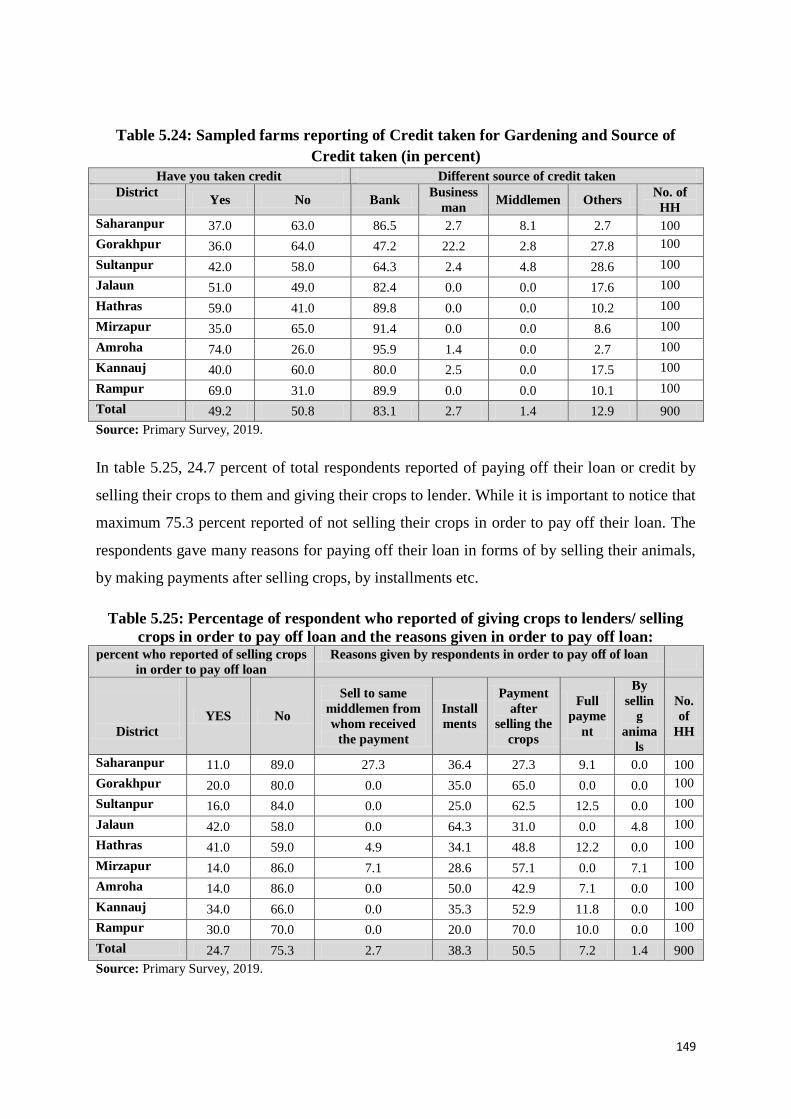
149
Table 5.24: Sampled farms reporting of Credit taken for Gardening and Source of
Credit taken (in percent)
Have you taken credit Different source of credit taken
District Yes No Bank
Business
man Middlemen Others
No. of
HH
Saharanpur 37.0 63.0 86.5 2.7 8.1 2.7 100
Gorakhpur 36.0 64.0 47.2 22.2 2.8 27.8 100
Sultanpur 42.0 58.0 64.3 2.4 4.8 28.6 100
Jalaun 51.0 49.0 82.4 0.0 0.0 17.6 100
Hathras 59.0 41.0 89.8 0.0 0.0 10.2 100
Mirzapur 35.0 65.0 91.4 0.0 0.0 8.6 100
Amroha 74.0 26.0 95.9 1.4 0.0 2.7 100
Kannauj 40.0 60.0 80.0 2.5 0.0 17.5 100
Rampur 69.0 31.0 89.9 0.0 0.0 10.1 100
Total 49.2 50.8 83.1 2.7 1.4 12.9 900
Source: Primary Survey, 2019.
In table 5.25, 24.7 percent of total respondents reported of paying off their loan or credit by
selling their crops to them and giving their crops to lender. While it is important to notice that
maximum 75.3 percent reported of not selling their crops in order to pay off their loan. The
respondents gave many reasons for paying off their loan in forms of by selling their animals,
by making payments after selling crops, by installments etc.
Table 5.25: Percentage of respondent who reported of giving crops to lenders/ selling
crops in order to pay off loan and the reasons given in order to pay off loan: percent who reported of selling crops
in order to pay off loan
Reasons given by respondents in order to pay off of loan
District
YES No
Sell to same
middlemen from
whom received
the payment
Install
ments
Payment
after
selling the
crops
Full
payme
nt
By
sellin
g
anima
ls
No.
of
HH
Saharanpur 11.0 89.0 27.3 36.4 27.3 9.1 0.0 100
Gorakhpur 20.0 80.0 0.0 35.0 65.0 0.0 0.0 100
Sultanpur 16.0 84.0 0.0 25.0 62.5 12.5 0.0 100
Jalaun 42.0 58.0 0.0 64.3 31.0 0.0 4.8 100
Hathras 41.0 59.0 4.9 34.1 48.8 12.2 0.0 100
Mirzapur 14.0 86.0 7.1 28.6 57.1 0.0 7.1 100
Amroha 14.0 86.0 0.0 50.0 42.9 7.1 0.0 100
Kannauj 34.0 66.0 0.0 35.3 52.9 11.8 0.0 100
Rampur 30.0 70.0 0.0 20.0 70.0 10.0 0.0 100
Total 24.7 75.3 2.7 38.3 50.5 7.2 1.4 900
Source: Primary Survey, 2019.
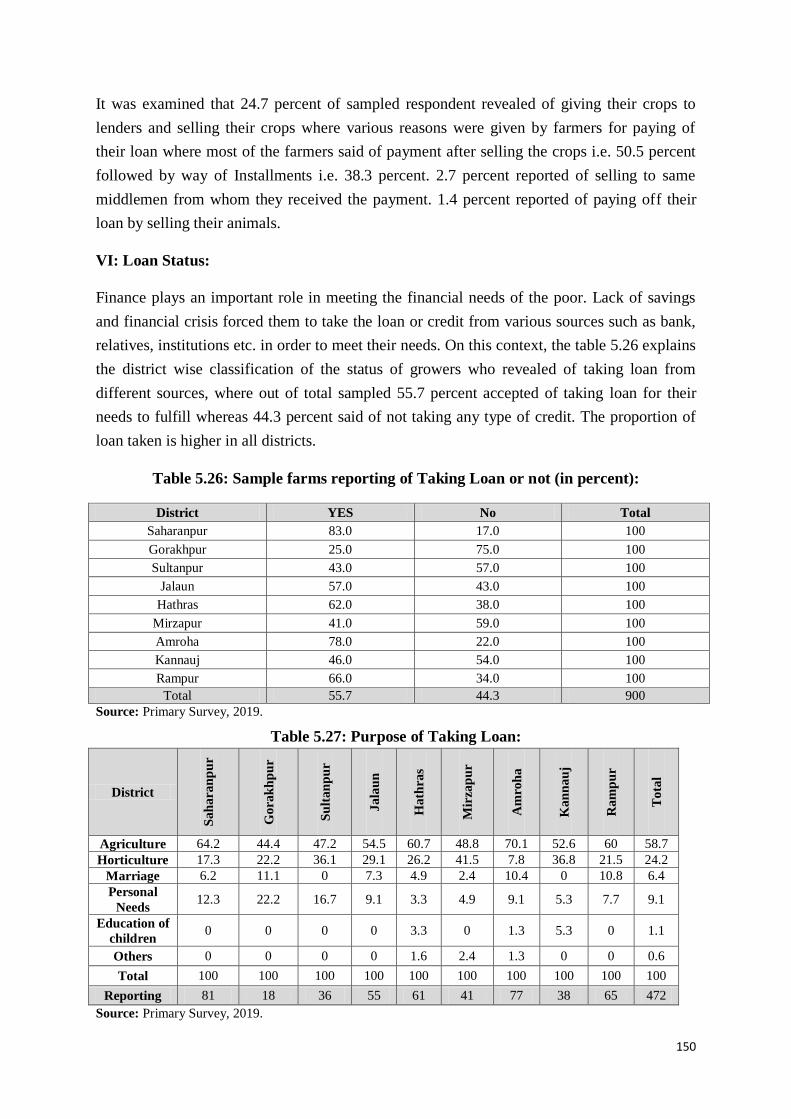
150
It was examined that 24.7 percent of sampled respondent revealed of giving their crops to
lenders and selling their crops where various reasons were given by farmers for paying of
their loan where most of the farmers said of payment after selling the crops i.e. 50.5 percent
followed by way of Installments i.e. 38.3 percent. 2.7 percent reported of selling to same
middlemen from whom they received the payment. 1.4 percent reported of paying off their
loan by selling their animals.
VI: Loan Status:
Finance plays an important role in meeting the financial needs of the poor. Lack of savings
and financial crisis forced them to take the loan or credit from various sources such as bank,
relatives, institutions etc. in order to meet their needs. On this context, the table 5.26 explains
the district wise classification of the status of growers who revealed of taking loan from
different sources, where out of total sampled 55.7 percent accepted of taking loan for their
needs to fulfill whereas 44.3 percent said of not taking any type of credit. The proportion of
loan taken is higher in all districts.
Table 5.26: Sample farms reporting of Taking Loan or not (in percent):
District YES No Total
Saharanpur 83.0 17.0 100
Gorakhpur 25.0 75.0 100
Sultanpur 43.0 57.0 100
Jalaun 57.0 43.0 100
Hathras 62.0 38.0 100
Mirzapur 41.0 59.0 100
Amroha 78.0 22.0 100
Kannauj 46.0 54.0 100
Rampur 66.0 34.0 100
Total 55.7 44.3 900
Source: Primary Survey, 2019.
Table 5.27: Purpose of Taking Loan:
District
Sah
ara
np
ur
Gora
kh
pu
r
Su
ltan
pu
r
Jala
un
Hath
ras
Mir
zap
ur
Am
roh
a
Kan
nau
j
Ram
pu
r
Tota
l
Agriculture 64.2 44.4 47.2 54.5 60.7 48.8 70.1 52.6 60 58.7
Horticulture 17.3 22.2 36.1 29.1 26.2 41.5 7.8 36.8 21.5 24.2
Marriage 6.2 11.1 0 7.3 4.9 2.4 10.4 0 10.8 6.4
Personal
Needs 12.3 22.2 16.7 9.1 3.3 4.9 9.1 5.3 7.7 9.1
Education of
children 0 0 0 0 3.3 0 1.3 5.3 0 1.1
Others 0 0 0 0 1.6 2.4 1.3 0 0 0.6
Total 100 100 100 100 100 100 100 100 100 100
Reporting 81 18 36 55 61 41 77 38 65 472
Source: Primary Survey, 2019.

151
Table 5.27 states about the purpose for which the growers revealed of taking loan where for
agriculture purpose is the major reason explained by the farmers i.e. 58.7 percent and 24.2
percent reveals of taking loan for Horticulture purpose. Near about 9.0 percent said that they
have taken loan for their personal needs and others needs. Hence, it reveals that major reason
for taking loan is for farming purposes. Hence, government and other institute may come up
with various suggestions in order to overcome the problem of finance in horticulture farming
and to improve the condition of farmers.
VII: Insurance:
Insurance is a means of protection from risk and uncertainties involved in the life of an
individual. It is a form of risk management primarily used to hedge against the risk of certain
loss. Hence, in farmer‟s life, it is important to get insured the crops in order to provide
security and protection against risk and uncertainty involved in their life. Table 5.28 revealed
about the sample farms who reported of having insured of any type of crop under
Horticulture farming where maximum 98.6 percent reported of not having any type of
insurance for their crops. A small percentage of total farmers revealed of having insured their
crops under Horticulture farming. This can be said that sample farms are far away from the
financial source and are not getting any type of help from government and financial
institution.
Table 5.28: Sample farm reporting of Insurance Any Crop under Horticulture
Farming: District YES NO Total
Saharanpur 1.0 99.0 100
Gorakhpur 4.0 96.0 100
Sultanpur 0.0 100.0 100
Jalaun 1.0 99.0 100
Hathras 6.0 94.0 100
Mirzapur 1.0 99.0 100
Amroha 0.0 100.0 100
Kannauj 0.0 100.0 100
Rampur 0.0 100.0 100
Total 1.4 98.6 900
Source: Primary Survey, 2019.
It was seen that out of total sample size, only 1.4 percent that is 13 farmers revealed of having
insurance for their crop under horticulture farming where 9 farmers revealed of getting
insurance for their crops from financial source i.e. Bank and further 2 reported of getting
insured from Krishi Sanstha Ikai. Only 1 farmer each reported of Reliance and Jila Adhanik

152
Kendra as source of getting insurance done. Crop insurance helps farmers to cover their risk
in their life. Hence, proper measures and proper knowledge should be providing by financial
institutions in order to promote the advantage of crop insurance.
Table 5.29: Name of Organization of Insurance:
District Saharanpur Gorakhpur Jalaun Hathras Mirzapur Total
Bank 1 1 1 6 0 9
Reliance 0 1 0 0 0 1
Jila Adhanik Kendra 0 1 0 0 0 1
Krishi Sanstha Ikai 0 1 0 0 1 2
Total 1 4 1 6 1 13
Source: Primary Survey, 2019.
It is important to analyze the amount for which the insurance is taken for different
horticulture crops which is shown in the table 5.30 which reveals that maximum 4 farmers
revealed of very low amount i.e. Rs. 9000. And 2 farmers revealed that they have taken
insurance for their crop of Rs. 50000. Hence, it can be said that a very few farmers have
taken insurance for their crop and that too of very low amount.
Table 5.30: Amount of Insured Crop taken by Sample Farms (in Rs.):
Amount Saharanpur Gorakhpur Jalaun Hathras Mirzapur Total
5500 0 1 0 0 0 1
6650 0 1 0 0 0 1
8000 0 0 0 1 0 1
9000 0 0 1 3 0 4
10940 0 1 0 1 0 2
11000 0 0 0 1 1 2
50000 1 1 0 0 0 2
Total 1 4 1 6 1 13
Source: Primary Survey, 2019.
Table 5.31: Did you take the insurance money ever and respondent reported of getting money:
percent reported of taking
insurance money
percent reported of getting
the insurance amount
District Yes No Yes No Total
Saharanpur 1.0 99.0 1.0 99.0 100
Gorakhpur 3.0 97.0 1.0 99.0 100
Sultanpur 0.0 100.0 0.0 100.0 100
Jalaun 0.0 100.0 0.0 100.0 100
Hathras 5.0 90.0 1.0 99.0 100
Mirzapur 0.0 95.0 0.0 100.0 100
Amroha 0.0 100.0 0.0 100.0 100
Kannauj 0.0 100.0 0.0 100.0 100
Rampur 0.0 100.0 0.0 100.0 100
Total 1.0 96.9 0.3 99.7 900
Source: Primary Survey, 2019.

153
Table 5.31 explains about the sample farms who reported of importance of getting insurance
done for their crops. Only 1 percent said „yes‟ and it is surprisingly that 96.9 percent of
farmers reported of not feeling comfortable in taking insurance. Further, only 0.3 percent
reported of getting insurance money and 99.7 percent revealed about not getting any amount.
VIII: Knowledge and Re Allocation of the Horticulture Crops:
The major problem found in horticulture farming is lack of proper information and
knowledge regarding the methods and techniques for planting various horticulture crops. It is
important for farmers to have interaction regarding horticulture farming which will help them
to acquire knowledge and skills as well as to share their ideas and experiences on their
horticultural practices.
Hence, it is important to analyze the source from where the sampled respondent got
information regarding horticulture farming which is explained in table 5.32. The table reflects
that most of the farmers revealed of getting information through their farmers friend (26
percent), whereas 23.6 percent revealed of getting information through private organization
and nearly about 20 percent through government organizations. Also, 18 percent revealed of
getting information through print media such as newspaper and others. Thus, it can be said
that most of the information is generated through Government and private organization so
that farmer can resolve their issues or problems related to horticulture farming by obtaining
information through interactions with Government officials, training and visits for better
understanding and motivation.
Table 5.32: Source of Getting Information regarding Horticulture Farming (in
percent):
District Farmer
friends
Govt.
Organization
Pvt.
Organization Print media
Mobile radio
others
Saharanpur 24.3 22.0 19.1 19.4 15.2
Gorakhpur 25.3 20.4 26.4 19.3 8.7
Sultanpur 24.4 20.4 23.9 18.8 12.6
Jalaun 28.5 21.0 24.2 17.9 8.4
Hathras 26.1 16.7 25.1 19.3 12.8
Mirzapur 28.9 21.8 20.9 16.5 11.8
Amroha 24.8 18.4 23.8 19.7 13.3
Kannauj 27.1 19.8 25.2 15.7 12.2
Rampur 25.5 17.0 23.7 20.6 13.1
Total 26.0 19.7 23.6 18.6 12.1
Source: Primary Survey, 2019.
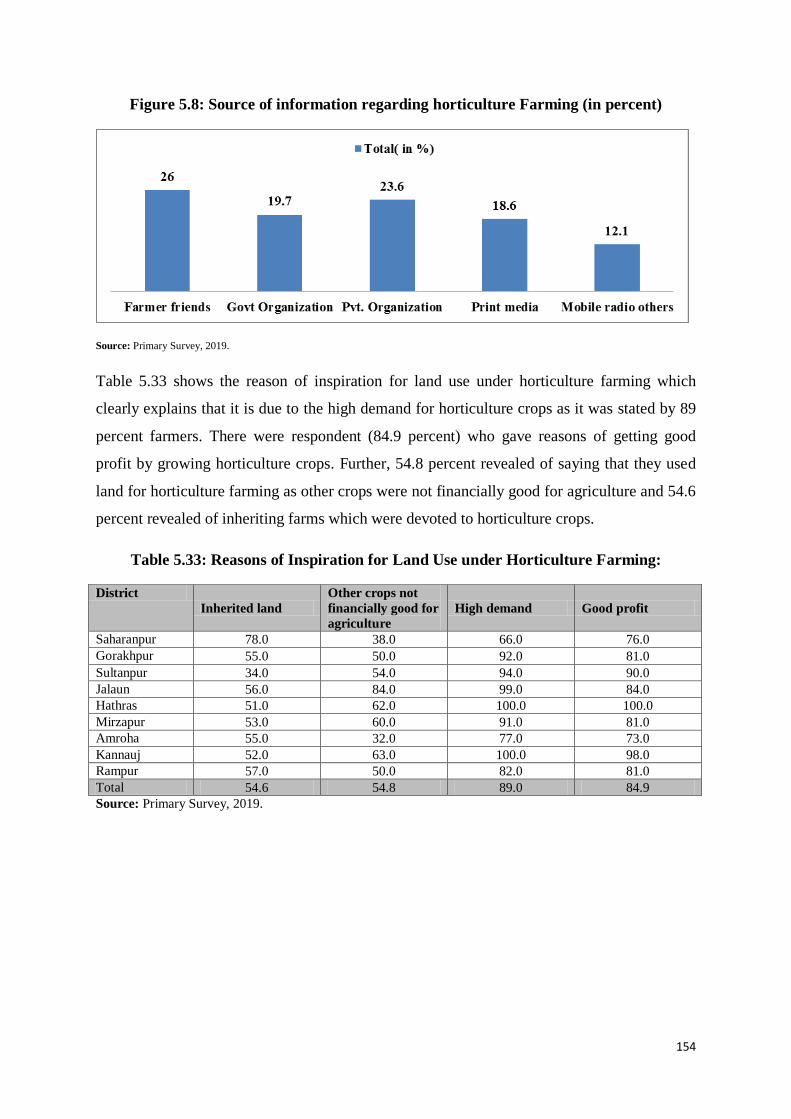
154
Figure 5.8: Source of information regarding horticulture Farming (in percent)
Source: Primary Survey, 2019.
Table 5.33 shows the reason of inspiration for land use under horticulture farming which
clearly explains that it is due to the high demand for horticulture crops as it was stated by 89
percent farmers. There were respondent (84.9 percent) who gave reasons of getting good
profit by growing horticulture crops. Further, 54.8 percent revealed of saying that they used
land for horticulture farming as other crops were not financially good for agriculture and 54.6
percent revealed of inheriting farms which were devoted to horticulture crops.
Table 5.33: Reasons of Inspiration for Land Use under Horticulture Farming:
District
Inherited land
Other crops not
financially good for
agriculture
High demand Good profit
Saharanpur 78.0 38.0 66.0 76.0
Gorakhpur 55.0 50.0 92.0 81.0
Sultanpur 34.0 54.0 94.0 90.0
Jalaun 56.0 84.0 99.0 84.0
Hathras 51.0 62.0 100.0 100.0
Mirzapur 53.0 60.0 91.0 81.0
Amroha 55.0 32.0 77.0 73.0
Kannauj 52.0 63.0 100.0 98.0
Rampur 57.0 50.0 82.0 81.0
Total 54.6 54.8 89.0 84.9
Source: Primary Survey, 2019.
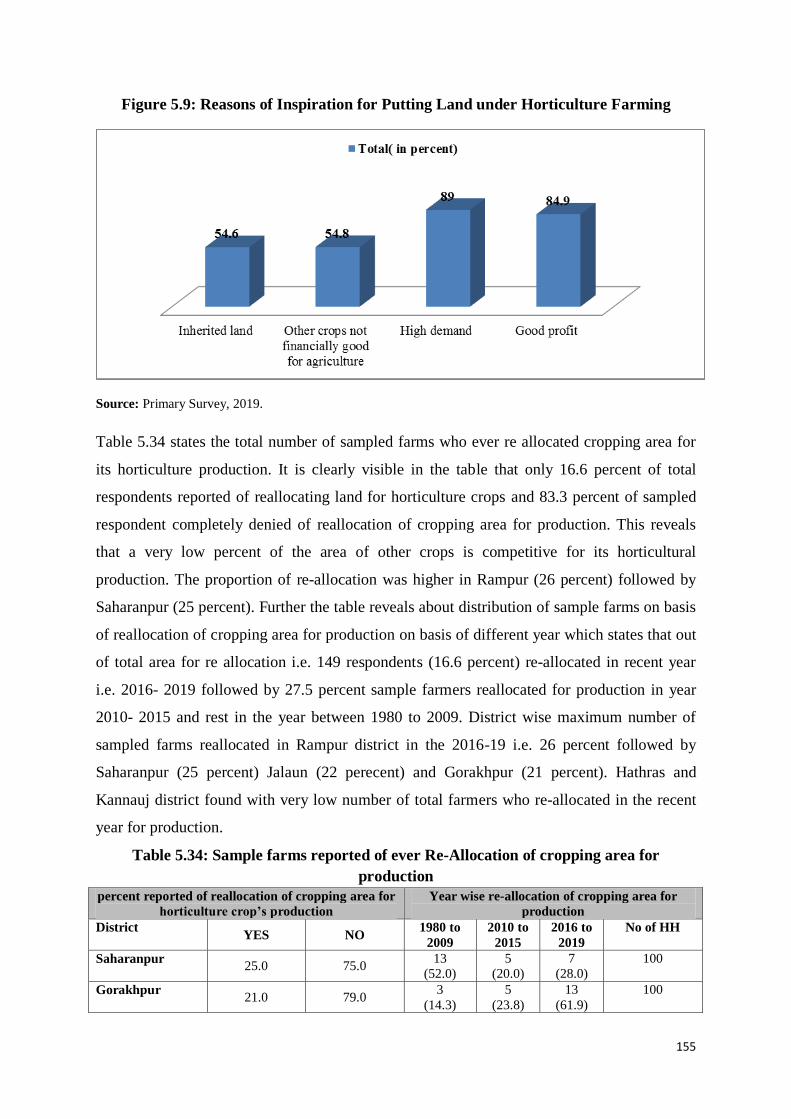
155
Figure 5.9: Reasons of Inspiration for Putting Land under Horticulture Farming
Source: Primary Survey, 2019.
Table 5.34 states the total number of sampled farms who ever re allocated cropping area for
its horticulture production. It is clearly visible in the table that only 16.6 percent of total
respondents reported of reallocating land for horticulture crops and 83.3 percent of sampled
respondent completely denied of reallocation of cropping area for production. This reveals
that a very low percent of the area of other crops is competitive for its horticultural
production. The proportion of re-allocation was higher in Rampur (26 percent) followed by
Saharanpur (25 percent). Further the table reveals about distribution of sample farms on basis
of reallocation of cropping area for production on basis of different year which states that out
of total area for re allocation i.e. 149 respondents (16.6 percent) re-allocated in recent year
i.e. 2016- 2019 followed by 27.5 percent sample farmers reallocated for production in year
2010- 2015 and rest in the year between 1980 to 2009. District wise maximum number of
sampled farms reallocated in Rampur district in the 2016-19 i.e. 26 percent followed by
Saharanpur (25 percent) Jalaun (22 perecent) and Gorakhpur (21 percent). Hathras and
Kannauj district found with very low number of total farmers who re-allocated in the recent
year for production.
Table 5.34: Sample farms reported of ever Re-Allocation of cropping area for
production
percent reported of reallocation of cropping area for
horticulture crop’s production
Year wise re-allocation of cropping area for
production
District YES NO
1980 to
2009
2010 to
2015
2016 to
2019
No of HH
Saharanpur 25.0 75.0
13
(52.0)
5
(20.0)
7
(28.0)
100
Gorakhpur 21.0 79.0
3
(14.3)
5
(23.8)
13
(61.9)
100
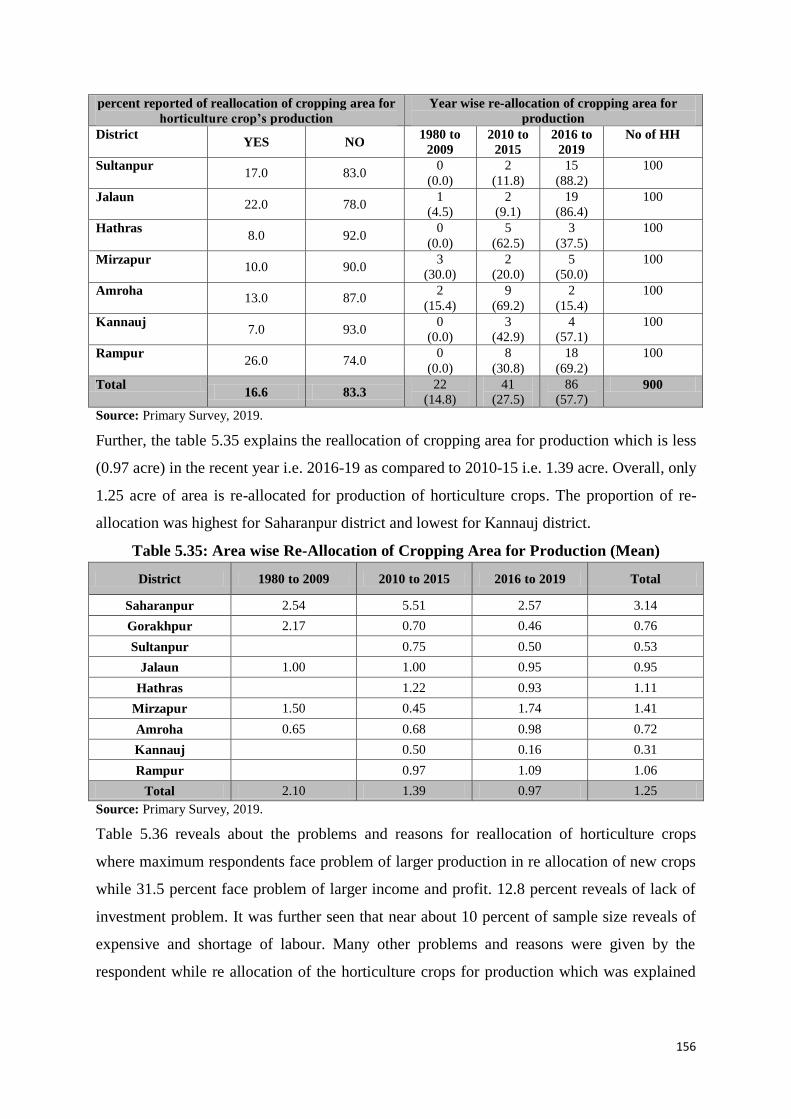
156
percent reported of reallocation of cropping area for
horticulture crop’s production
Year wise re-allocation of cropping area for
production
District YES NO
1980 to
2009
2010 to
2015
2016 to
2019
No of HH
Sultanpur 17.0 83.0
0
(0.0)
2
(11.8)
15
(88.2)
100
Jalaun 22.0 78.0
1
(4.5)
2
(9.1)
19
(86.4)
100
Hathras 8.0 92.0
0
(0.0)
5
(62.5)
3
(37.5)
100
Mirzapur 10.0 90.0
3
(30.0)
2
(20.0)
5
(50.0)
100
Amroha 13.0 87.0
2
(15.4)
9
(69.2)
2
(15.4)
100
Kannauj 7.0 93.0
0
(0.0)
3
(42.9)
4
(57.1)
100
Rampur 26.0 74.0
0
(0.0)
8
(30.8)
18
(69.2)
100
Total 16.6 83.3
22
(14.8)
41
(27.5)
86
(57.7) 900
Source: Primary Survey, 2019.
Further, the table 5.35 explains the reallocation of cropping area for production which is less
(0.97 acre) in the recent year i.e. 2016-19 as compared to 2010-15 i.e. 1.39 acre. Overall, only
1.25 acre of area is re-allocated for production of horticulture crops. The proportion of re-
allocation was highest for Saharanpur district and lowest for Kannauj district.
Table 5.35: Area wise Re-Allocation of Cropping Area for Production (Mean)
District 1980 to 2009 2010 to 2015 2016 to 2019 Total
Saharanpur 2.54 5.51 2.57 3.14
Gorakhpur 2.17 0.70 0.46 0.76
Sultanpur
0.75 0.50 0.53
Jalaun 1.00 1.00 0.95 0.95
Hathras
1.22 0.93 1.11
Mirzapur 1.50 0.45 1.74 1.41
Amroha 0.65 0.68 0.98 0.72
Kannauj
0.50 0.16 0.31
Rampur
0.97 1.09 1.06
Total 2.10 1.39 0.97 1.25
Source: Primary Survey, 2019.
Table 5.36 reveals about the problems and reasons for reallocation of horticulture crops
where maximum respondents face problem of larger production in re allocation of new crops
while 31.5 percent face problem of larger income and profit. 12.8 percent reveals of lack of
investment problem. It was further seen that near about 10 percent of sample size reveals of
expensive and shortage of labour. Many other problems and reasons were given by the
respondent while re allocation of the horticulture crops for production which was explained

157
in table 3.6. This shows that overall, all the sampled district face problem by one or other way
in re allocation of the horticulture crops.
Table 5.36: Type of Problem in Horticulture in Re-Allocation
District
Sah
ara
np
ur
Gora
kh
pu
r
Su
ltan
pu
r
Jala
un
Hath
ras
Mir
zap
ur
Am
roh
a
Kan
nau
j
Ram
pu
r
Tota
l
Lack of investment 24.0 4.8 11.8 9.1 0.0 20.0 23.1 0.0 11.5 12.8
Large income/profit 20.0 19.0 58.8 31.8 62.5 30.0 46.2 57.1 11.5 31.5
Less production 8.0 14.3 0.0 0.0 0.0 0.0 0.0 0.0 15.4 6.0
Shortage/expensive
labour 16.0 4.8 5.9 4.5 12.5 10.0 0.0 0.0 19.2 9.4
Large production 16.0 14.3 17.6 27.3 25.0 10.0 0.0 28.6 30.8 19.5
High demand 4.0 4.8 0.0 9.1 0.0 10.0 0.0 0.0 3.8 4.0
low quality crops 4.0 4.8 0.0 0.0 0.0 10.0 7.7 0.0 3.8 3.4
Less loss 8.0 4.8 0.0 0.0 0.0 10.0 0.0 0.0 3.8 3.4
Farm was far from
home 0.0 9.5 0.0 4.5 0.0 0.0 15.4 0.0 0.0 3.4
Poor quality soil 0.0 19.0 5.9 0.0 0.0 0.0 7.7 14.3 0.0 4.7
Motivated by other
farmers 0.0 0.0 0.0 13.6 0.0 0.0 0.0 0.0 0.0 2.0
Total 100 100 100 100 100 100 100 100 100 100
Source: Primary Survey, 2019.
IX: Diversification of Crops:
The profitability of horticultural crops can be extended if diversification in crops is adopted.
Diversification offers an attractive option and a major source of pushing up growth of
agricultural sector. Technological up-gradation and institutional changes are identified as
thrust areas for future development of the horticulture sector. Technology plays a major role
in growth and development of all sectors of a nation. Hence, it is important to analyze the
number of sample farms who planned to make changes to a species of a crop in coming years
which is explained in Table 5.37 where 12.1 percent accepted of making changes to a species
of a crop in coming years, while 87.9 percent reported of not planning to make any changes
to a species of a crop in coming recent year.

158
Table 5.37: Sample farms reporting of planning to make changes to Species of a crop in
coming years
District YES NO Total
Saharanpur 15.0 85.0 100
Gorakhpur 10.0 90.0 100
Sultanpur 15.0 85.0 100
Jalaun 20.0 80.0 100
Hathras 4.0 96.0 100
Mirzapur 16.0 84.0 100
Amroha 8.0 92.0 100
Kannauj 11.0 89.0 100
Rampur 10.0 90.0 100
Total 12.1 87.9 900
Source: Primary Survey, 2019.
Out of total sample size, only 109 farmers revealed of making changes to a species in crop
where 20 farmers in Jalaun district stated about crop diversification mainly in Fruits. Further,
Mirzapur, Sultanpur and Saharanpur district, farmer reveals of making changes in the species
of crops mainly in Fruits and vegetables. Only 1 respondent out of total reported of making
changes in Spices. This state that they want crop diversification under different horticulture
crops so as to improve the quality and variety in crops.
Table 5.38: Name of crops for Diversification under Horticulture Farming:
District Foodgrains Fruits Vegetables Spices Flowers Cash
Crops
Other
Crops Total
Saharanpur 0 12 2 0 0 1 0 15
Gorakhpur 0 3 7 0 0 0 0 10
Sultanpur 0 8 4 0 2 1 0 15
Jalaun 0 8 5 0 4 3 0 20
Hathras 0 3 0 1 0 0 0 4
Mirzapur 0 11 0 0 4 1 0 16
Amroha 0 4 2 0 1 1 0 8
Kannauj 0 1 2 0 6 1 1 11
Rampur 0 1 9 0 0 0 0 10
Total 0 51 31 1 17 8 1 109
Source: Primary Survey, 2019.
Reasons given by the farmers for adoption of crop diversification is explained in table 5.39
where maximum farmer i.e. 41.3 percent revealed of higher profit earned by making changes
in species of crops. 27.5 percent farmer also suggested of extra consumption due to which
crop diversification is done which is beneficial to them. 11.9 percent also stated about
receiving good and reasonable amount by diversification of crops. Near about 4 percent also
revealed about high demand of diversified produce in various horticulture crops. Farmer also
reported of having fewer diseases in the crops while making changes in the species of crops
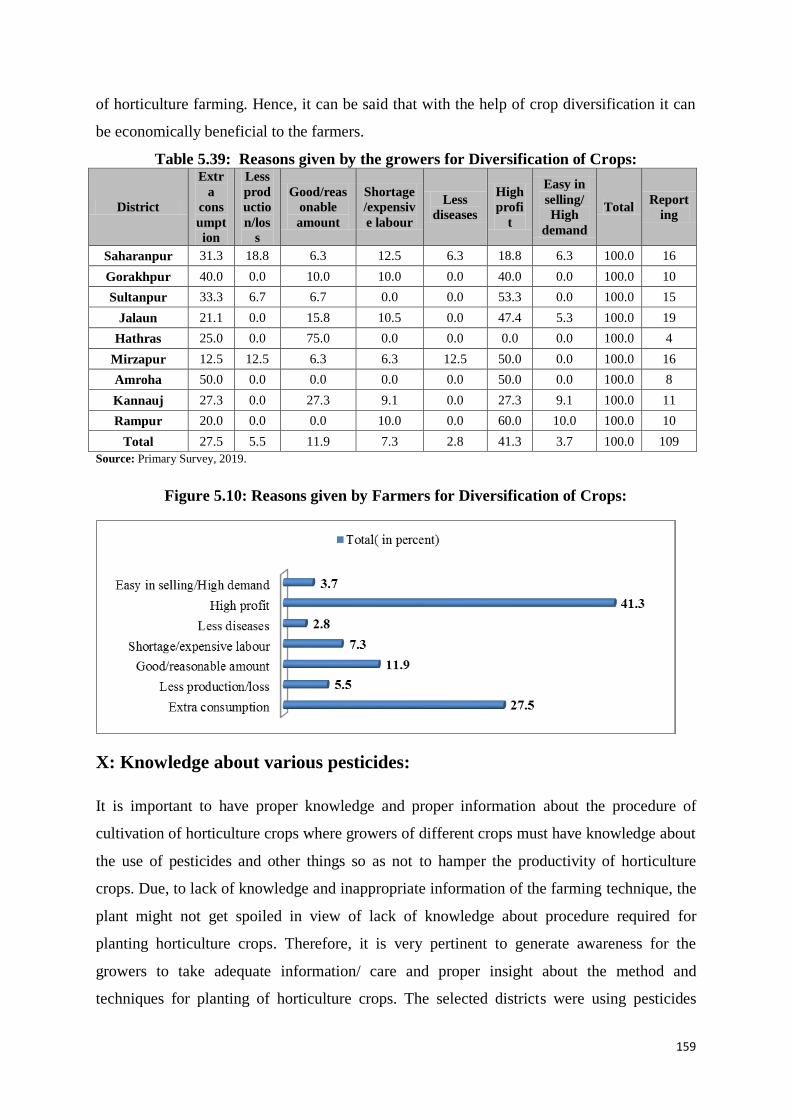
159
of horticulture farming. Hence, it can be said that with the help of crop diversification it can
be economically beneficial to the farmers.
Table 5.39: Reasons given by the growers for Diversification of Crops:
District
Extr
a
cons
umpt
ion
Less
prod
uctio
n/los
s
Good/reas
onable
amount
Shortage
/expensiv
e labour
Less
diseases
High
profi
t
Easy in
selling/
High
demand
Total Report
ing
Saharanpur 31.3 18.8 6.3 12.5 6.3 18.8 6.3 100.0 16
Gorakhpur 40.0 0.0 10.0 10.0 0.0 40.0 0.0 100.0 10
Sultanpur 33.3 6.7 6.7 0.0 0.0 53.3 0.0 100.0 15
Jalaun 21.1 0.0 15.8 10.5 0.0 47.4 5.3 100.0 19
Hathras 25.0 0.0 75.0 0.0 0.0 0.0 0.0 100.0 4
Mirzapur 12.5 12.5 6.3 6.3 12.5 50.0 0.0 100.0 16
Amroha 50.0 0.0 0.0 0.0 0.0 50.0 0.0 100.0 8
Kannauj 27.3 0.0 27.3 9.1 0.0 27.3 9.1 100.0 11
Rampur 20.0 0.0 0.0 10.0 0.0 60.0 10.0 100.0 10
Total 27.5 5.5 11.9 7.3 2.8 41.3 3.7 100.0 109
Source: Primary Survey, 2019.
Figure 5.10: Reasons given by Farmers for Diversification of Crops:
X: Knowledge about various pesticides:
It is important to have proper knowledge and proper information about the procedure of
cultivation of horticulture crops where growers of different crops must have knowledge about
the use of pesticides and other things so as not to hamper the productivity of horticulture
crops. Due, to lack of knowledge and inappropriate information of the farming technique, the
plant might not get spoiled in view of lack of knowledge about procedure required for
planting horticulture crops. Therefore, it is very pertinent to generate awareness for the
growers to take adequate information/ care and proper insight about the method and
techniques for planting of horticulture crops. The selected districts were using pesticides
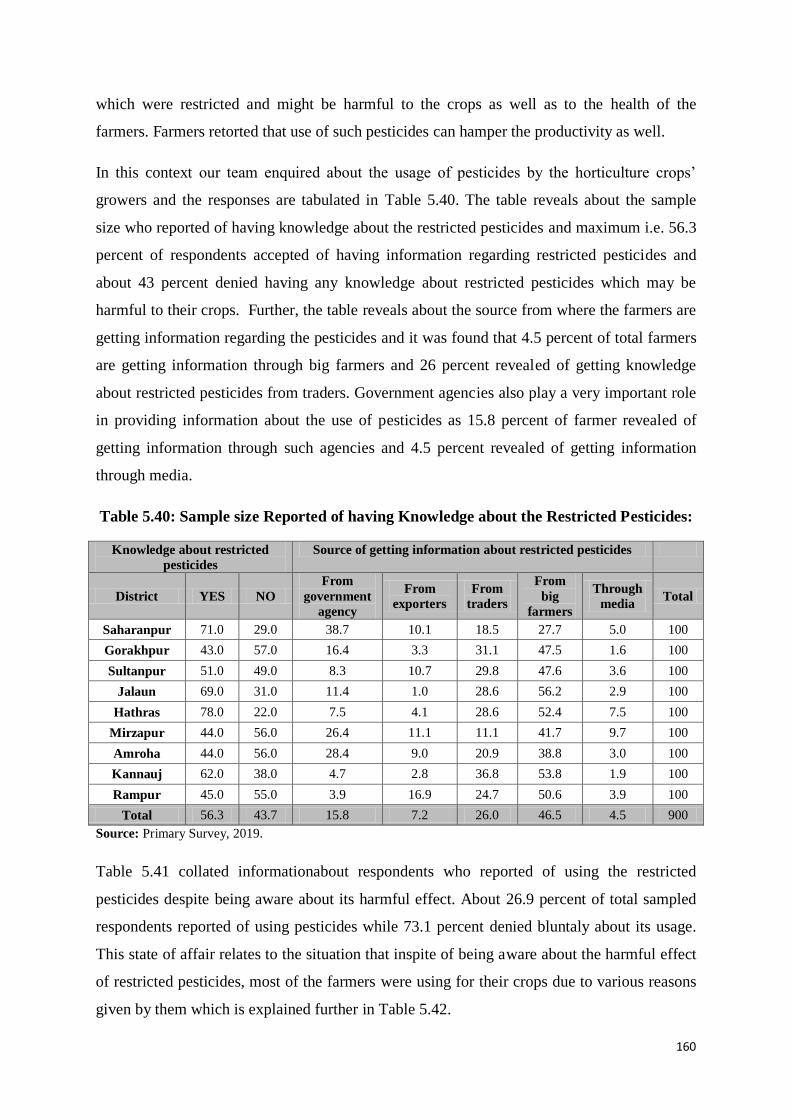
160
which were restricted and might be harmful to the crops as well as to the health of the
farmers. Farmers retorted that use of such pesticides can hamper the productivity as well.
In this context our team enquired about the usage of pesticides by the horticulture crops‟
growers and the responses are tabulated in Table 5.40. The table reveals about the sample
size who reported of having knowledge about the restricted pesticides and maximum i.e. 56.3
percent of respondents accepted of having information regarding restricted pesticides and
about 43 percent denied having any knowledge about restricted pesticides which may be
harmful to their crops. Further, the table reveals about the source from where the farmers are
getting information regarding the pesticides and it was found that 4.5 percent of total farmers
are getting information through big farmers and 26 percent revealed of getting knowledge
about restricted pesticides from traders. Government agencies also play a very important role
in providing information about the use of pesticides as 15.8 percent of farmer revealed of
getting information through such agencies and 4.5 percent revealed of getting information
through media.
Table 5.40: Sample size Reported of having Knowledge about the Restricted Pesticides:
Knowledge about restricted
pesticides
Source of getting information about restricted pesticides
District YES NO
From
government
agency
From
exporters
From
traders
From
big
farmers
Through
media Total
Saharanpur 71.0 29.0 38.7 10.1 18.5 27.7 5.0 100
Gorakhpur 43.0 57.0 16.4 3.3 31.1 47.5 1.6 100
Sultanpur 51.0 49.0 8.3 10.7 29.8 47.6 3.6 100
Jalaun 69.0 31.0 11.4 1.0 28.6 56.2 2.9 100
Hathras 78.0 22.0 7.5 4.1 28.6 52.4 7.5 100
Mirzapur 44.0 56.0 26.4 11.1 11.1 41.7 9.7 100
Amroha 44.0 56.0 28.4 9.0 20.9 38.8 3.0 100
Kannauj 62.0 38.0 4.7 2.8 36.8 53.8 1.9 100
Rampur 45.0 55.0 3.9 16.9 24.7 50.6 3.9 100
Total 56.3 43.7 15.8 7.2 26.0 46.5 4.5 900
Source: Primary Survey, 2019.
Table 5.41 collated informationabout respondents who reported of using the restricted
pesticides despite being aware about its harmful effect. About 26.9 percent of total sampled
respondents reported of using pesticides while 73.1 percent denied bluntaly about its usage.
This state of affair relates to the situation that inspite of being aware about the harmful effect
of restricted pesticides, most of the farmers were using for their crops due to various reasons
given by them which is explained further in Table 5.42.

161
Table 5.41: Sample size reported of using restricted Pesticides despite the knowledge:
District YES NO Total
Saharanpur 25.0 75.0 100
Gorakhpur 37.0 63.0 100
Sultanpur 39.0 61.0 100
Jalaun 22.0 78.0 100
Hathras 23.0 77.0 100
Mirzapur 21.0 79.0 100
Amroha 20.0 80.0 100
Kannauj 17.0 83.0 100
Rampur 38.0 62.0 100
Total 26.9 73.1 900
Source: Primary Survey, 2019.
There are various reasons given by the farmers in order consolidate the information extended
by our respondents regarding using the restricted pesticides. We find that 31.8 percent
respondents revealed of using these restricted pesticides for the safety of the crops, and 27.3
percent said that they used it in order to prevent the crops from the diseases. It is surprising to
find that in order to have larger production and to earn higher profits, 24.8 percent revealed of
using the restricted pesticides for their crops. Only 13.2 percent stated of using it for healthy
crops and growth of good crops.
Table 5.42: Type of Reasons given by the Growers for using restricted Pesticides:
District Safety of
crops
Large
producti
on
Crop's
growth
Protecti
on from
animals
Good/he
althy
crops
Prevent
from
diseases
Total Reportin
g
Saharanpur 52.0 24.0 8.0 4.0 8.0 4.0 100.0 25
Gorakhpur 2.7 24.3 0.0 0.0 29.7 43.2 100.0 37
Sultanpur 33.3 15.4 0.0 0.0 30.8 20.5 100.0 39
Jalaun 9.1 36.4 4.5 0.0 0.0 50.0 100.0 22
Hathras 52.2 30.4 0.0 0.0 13.0 4.3 100.0 23
Mirzapur 47.6 9.5 9.5 0.0 9.5 23.8 100.0 21
Amroha 15.0 35.0 5.0 0.0 5.0 40.0 100.0 20
Kannauj 76.5 17.6 0.0 0.0 0.0 5.9 100.0 17
Rampur 26.3 31.6 0.0 0.0 2.6 39.5 100.0 38
Total 31.8 24.8 2.5 0.4 13.2 27.3 100.0 242
Source: Primary Survey, 2019.
XI: Training related to Horticulture Crop:
In order to improve the production of various horticulture crops, proper training must be
provided to the farmers. Table 5.43 explains about the sample farmers who reported of

162
getting any kind of training for good crop yield and 24.6 percent of respondents accepted of
getting training in cultivation of horticulture crops and on the other hand 75.4 percent
reported of not getting any type of training from any source for the production of good crop.
This revealed that very low percentage of total sampled districts ontained any training for
good crop yield. Hence, efforts should be taken in order to provide proper training to farmers
who willingly opt for horticulture crops growing in the State.
Table 5.43: Sampled Farmers reported of getting Training for good Crop Yield
District YES NO Total
Saharanpur 8.0 92.0 100
Gorakhpur 18.0 82.0 100
Sultanpur 18.0 82.0 100
Jalaun 53.0 47.0 100
Hathras 26.0 74.0 100
Mirzapur 36.0 64.0 100
Amroha 10.0 90.0 100
Kannauj 28.0 72.0 100
Rampur 24.0 76.0 100
Total 24.6 75.4 900
Source: Primary Survey, 2019.
Table 5.44 states about the training provided to the sample farmers where, out of total
sampled farmers, 224 reported of getting training and where 25.9 percent revealed of getting
trained through Kisaan mela, 17 percent received it by Days training. Horticulture department
also play an important role in providing training to the farmers. There are other organization
which also helps in providing training to the farmers such as PM Krishi Sichai Yojana, PM
kisaan Yojana and others. It was found that many other institutions also came up in order to
provide training to the farmers regarding restricted use of pesticides, providing training
regarding increasing production, irrigation etc which may be helpful to farmers.
Table 5.44: Name of Training given
District
Sah
ara
np
ur
Gora
kh
pu
r
Su
ltan
pu
r
Jala
un
Hath
ras
Mir
zap
ur
Am
roh
a
Kan
nau
j
Ram
pu
r
Tota
l
Horticulture department 22.2 33.3 11.1 7.5 7.7 18.9 12.5 3.6 4.2 12.1
Vegetable production 44.4 9.5 0.0 7.5 7.7 5.4 0.0 0.0 8.3 7.1
Pesticide 11.1 0.0 5.6 1.9 0.0 2.7 0.0 0.0 4.2 2.2
PM kisaan yojna 11.1 4.8 0.0 1.9 0.0 21.6 0.0 0.0 25.0 7.6
Days training 0.0 47.6 5.6 45.3 0.0 0.0 0.0 10.7 0.0 17.0
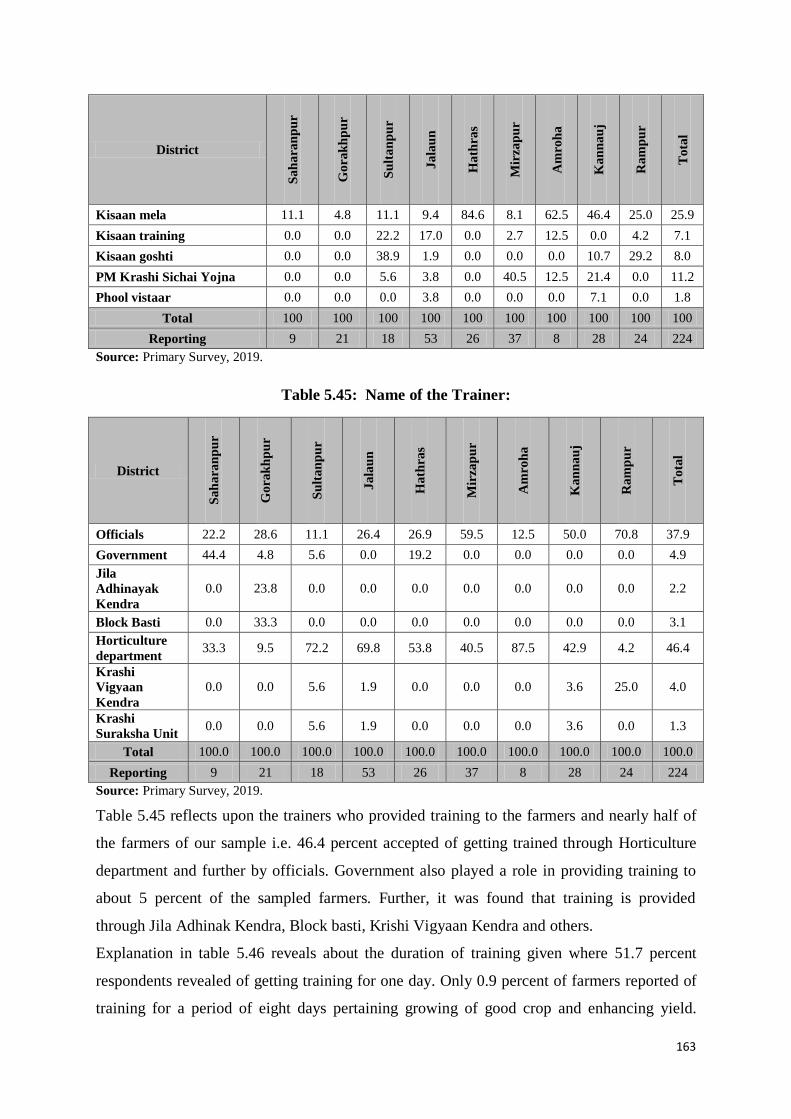
163
District
Sah
ara
np
ur
Gora
kh
pu
r
Su
ltan
pu
r
Jala
un
Hath
ras
Mir
zap
ur
Am
roh
a
Kan
nau
j
Ram
pu
r
Tota
l
Kisaan mela 11.1 4.8 11.1 9.4 84.6 8.1 62.5 46.4 25.0 25.9
Kisaan training 0.0 0.0 22.2 17.0 0.0 2.7 12.5 0.0 4.2 7.1
Kisaan goshti 0.0 0.0 38.9 1.9 0.0 0.0 0.0 10.7 29.2 8.0
PM Krashi Sichai Yojna 0.0 0.0 5.6 3.8 0.0 40.5 12.5 21.4 0.0 11.2
Phool vistaar 0.0 0.0 0.0 3.8 0.0 0.0 0.0 7.1 0.0 1.8
Total 100 100 100 100 100 100 100 100 100 100
Reporting 9 21 18 53 26 37 8 28 24 224
Source: Primary Survey, 2019.
Table 5.45: Name of the Trainer:
District
Sah
ara
np
ur
Gora
kh
pu
r
Su
ltan
pu
r
Jala
un
Hath
ras
Mir
zap
ur
Am
roh
a
Kan
nau
j
Ram
pu
r
Tota
l
Officials 22.2 28.6 11.1 26.4 26.9 59.5 12.5 50.0 70.8 37.9
Government 44.4 4.8 5.6 0.0 19.2 0.0 0.0 0.0 0.0 4.9
Jila
Adhinayak
Kendra
0.0 23.8 0.0 0.0 0.0 0.0 0.0 0.0 0.0 2.2
Block Basti 0.0 33.3 0.0 0.0 0.0 0.0 0.0 0.0 0.0 3.1
Horticulture
department 33.3 9.5 72.2 69.8 53.8 40.5 87.5 42.9 4.2 46.4
Krashi
Vigyaan
Kendra
0.0 0.0 5.6 1.9 0.0 0.0 0.0 3.6 25.0 4.0
Krashi
Suraksha Unit 0.0 0.0 5.6 1.9 0.0 0.0 0.0 3.6 0.0 1.3
Total 100.0 100.0 100.0 100.0 100.0 100.0 100.0 100.0 100.0 100.0
Reporting 9 21 18 53 26 37 8 28 24 224
Source: Primary Survey, 2019.
Table 5.45 reflects upon the trainers who provided training to the farmers and nearly half of
the farmers of our sample i.e. 46.4 percent accepted of getting trained through Horticulture
department and further by officials. Government also played a role in providing training to
about 5 percent of the sampled farmers. Further, it was found that training is provided
through Jila Adhinak Kendra, Block basti, Krishi Vigyaan Kendra and others.
Explanation in table 5.46 reveals about the duration of training given where 51.7 percent
respondents revealed of getting training for one day. Only 0.9 percent of farmers reported of
training for a period of eight days pertaining growing of good crop and enhancing yield.

164
Hence, it can be said that government and other financial and training institutes must be
encouraged so as to develop horticulture farming and improve the condition of the growers.
Table 5.46: Duration of Training Given:
Duration S
ah
ara
np
ur
Gora
kh
pu
r
Su
ltan
pu
r
Jala
un
Hath
ras
Mir
zap
ur
Am
roh
a
Kan
nau
j
Ram
pu
r
Tota
l
One Day 16.7 4.8 88.9 29.6 50.0 62.2 75.0 78.6 65.2 51.1
Two Days 0.0 14.3 5.6 40.7 42.3 24.3 25.0 17.9 30.4 27.1
Three Days 50.0 42.9 5.6 29.6 3.8 13.5 0.0 3.6 0.0 16.3
Hour Days 16.7 0.0 0.0 0.0 0.0 0.0 0.0 0.0 0.0 0.5
Five Days 16.7 19.0 0.0 0.0 0.0 0.0 0.0 0.0 0.0 2.3
Seven Days 0.0 14.3 0.0 0.0 3.8 0.0 0.0 0.0 0.0 1.8
Eight Days 0.0 4.8 0.0 0.0 0.0 0.0 0.0 0.0 4.3 0.9
Total 100.0 100.0 100.0 100.0 100.0 100.0 100.0 100.0 100.0 100.0
Total 6 21 18 54 26 37 8 28 23 221
Source: Primary Survey, 2019.
XII: Access and Awareness of Government Schemes:
Knowledge or awareness about the government schemes related to horticulture farming is
showed in Table 5.47. It was found that maximum respondents i.e.76.3 percent have
knowledge about the schemes and only 23.7 percent of the total respondents revealed of not
having any type of awareness about the schemes related to horticulture cop growing. This can
be taken as a positive impact on the life of farmers as they have access and awareness about
the financial schemes related to their field of operation which may be beneficial to them.
Table 5.47: Do you have knowledge about the Govt. Schemes under Horticulture
Farming:
District YES NO Total
Saharanpur 31.0 69.0 100
Gorakhpur 85.0 15.0 100
Sultanpur 83.0 17.0 100
Jalaun 83.0 17.0 100
Hathras 86.0 14.0 100
Mirzapur 87.0 13.0 100
Amroha 83.0 17.0 100
Kannauj 84.0 16.0 100
Rampur 65.0 35.0 100
Total 76.3 23.7 900
Source: Primary Survey, 2019.
Explanation in below table stated about having knowledge about the different schemes
related to horticulture farming. 75.4 percent of overall farmers reported of having awareness
about different schemes mainly Kisaan Samaan Yojana in all selected districts. 11.0 percent

165
revealed of having information about K.K.C. Further, many other schemes were explained by
the sampled farmers which reported of having information about the schemes related to their
area of operations namely, PM Kisaan Yojana, crop insurance and others.
Table 5.48: Knowledge about Name of Schemes
Schemes
Sah
ara
np
ur
Gora
kh
pu
r
Su
ltan
pu
r
Jala
un
Hath
ras
Mir
zap
ur
Am
roh
a
Kan
nau
j
Ram
pu
r
Tota
l
PM Kisaan Yojna 19.4 3.5 0.0 0.0 2.3 0.0 0.0 0.0 0.0 1.6
Kisaan samaan yojna 51.6 92.9 94.0 43.4 57.0 70.1 98.8 65.5 95.4 75.4
Krashak Vrakshya
Dhan yojna 16.1 0.0 0.0 0.0 1.2 0.0 0.0 0.0 1.5 1.0
Beekeeping 3.2 0.0 0.0 0.0 0.0 1.1 0.0 0.0 0.0 0.3
Fisheries 0.0 0.0 1.2 0.0 0.0 0.0 0.0 0.0 0.0 0.1
Establishing news
farms for many years 3.2 0.0 0.0 0.0 0.0 0.0 0.0 0.0 0.0 0.1
Flower farm
extension 0.0 0.0 0.0 10.8 1.2 4.6 0.0 6.0 0.0 2.8
Spice farming
extension 0.0 0.0 0.0 0.0 0.0 1.1 0.0 0.0 0.0 0.1
Replace old trees
with new ones 0.0 1.2 0.0 0.0 0.0 0.0 0.0 0.0 0.0 0.1
Boond-boond sichai
jojna 3.2 0.0 0.0 0.0 0.0 0.0 0.0 0.0 0.0 0.1
Ultra high-tech city 3.2 0.0 0.0 0.0 0.0 0.0 0.0 0.0 0.0 0.1
K.K.C. 0.0 0.0 3.6 30.1 19.8 18.4 0.0 23.8 0.0 11.8
Crop insurance 0.0 0.0 0.0 0.0 0.0 0.0 0.0 0.0 1.5 0.1
drip sichai yojna 0.0 1.2 1.2 1.2 0.0 0.0 0.0 0.0 0.0 0.4
Ujjwala yojna 0.0 0.0 0.0 0.0 0.0 0.0 0.0 1.2 0.0 0.1
Drump vidhi yojna 0.0 0.0 0.0 0.0 1.2 1.1 0.0 0.0 0.0 0.3
Horticulture
mechanisation karya
kram
0.0 0.0 0.0 0.0 4.7 2.3 0.0 0.0 0.0 0.9
Cold storage 0.0 0.0 0.0 1.2 1.2 0.0 0.0 0.0 1.5 0.4
Atma yojna 0.0 1.2 0.0 1.2 0.0 0.0 1.2 0.0 0.0 0.4
Mushroom
production yojna 0.0 0.0 0.0 1.2 0.0 0.0 0.0 0.0 0.0 0.1
Horticulture
extension yojna 0.0 0.0 0.0 2.4 2.3 0.0 0.0 0.0 0.0 0.6
PM kisaan sichai
yojna 0.0 0.0 0.0 3.6 9.3 1.1 0.0 3.6 0.0 2.2
Shak bhaji vistaar
yojna 0.0 0.0 0.0 4.8 0.0 0.0 0.0 0.0 0.0 0.6
Total 100.0 100.0 100.0 100.0 100.0 100.0 100.0 100.0 100.0 100.
Reporting 31 85 83 83 86 87 83 84 65 687
Source: Primary Survey, 2019.

166
Table 5.49 revealed about the type of help received by the horticulture department for
farming operations in the form of training, seeds, soil, irrigation and plantation, and
maximum 25.25 percent of respondents i.e. 103 in number reported of getting help in form of
seeds. Further 77 respondents reported of getting help in form of soil and farmers also
accepted of getting support from department in form of training and plantation. Hence, in this
context it can be said that by one or other way most of the respondents in the selected districts
received help from various departments for horticulture farming which could be beneficial to
them.
Table 5.49: Type of Help Received by Horticulture Department for Farming:
District Training Seeds Soil others Irrigation Plantation Total
Saharanpur 2.7 0.0 0.0 0.0 0.0 0.0 0.5
Gorakhpur 16.2 21.4 24.7 24.7 8.3 0.0 18.1
Sultanpur 13.5 34.0 41.6 41.6 4.2 9.4 28.2
Jalaun 44.6 17.5 6.5 6.5 33.3 47.2 23.0
Hathras 13.5 1.0 1.3 1.3 0.0 1.9 3.4
Mirzapur 2.7 13.6 13.0 13.0 41.7 11.3 12.7
Amroha 0.0 4.9 3.9 3.9 0.0 0.0 2.7
Kannauj 6.8 5.8 7.8 7.8 12.5 20.8 9.1
Rampur 1.4 1.9 1.3 1.3 0.0 9.4 2.5
Total 100.0 100.0 100.0 100.0 100.0 100.0 100.0
Reporting 74 103 77 77 24 53 408
Source: Primary Survey, 2019.
XIII: Organization Details:
It was important to enquire the respondents of the selected districts as to whether they were
the member of any organization or not and it was found that out of total sample, 94.1 percent
revealed of being a member of organization whereas only 5.9 percent denied of not being a
member of any organization under horticulture farming. This shows that maximum
respondents depend upon financial sources.
The explanation in table 5.50 revealed about the organizations to which these respondents
were affiliated. 88.2 percent stated that they were mainly member of Co-operative society
mainly in in Jalaun, Sultanpur, Mirzapur, Amroha and Rampur districts. Some 5.9 percent
said that they were member of farmer‟s cooperative service committee. Only 2 percent were
member of Sugarcane society. In Saharanpur district 89 percent reported to be memberof
some organization or the other. 20 percent respondents from Gorakhpur district were member
of Mango krishi Association

167
Table 5.50: Are you a Member for any Organization:
percent reporting
of having
member for any
Organization
Name of Organization
District YES No
Co-
operati
ve
society
Farmers
co-
operative
service
committee
Sugarcan
e society
Mango
pack
house
Mango
krishi
association
Total
Saharanpur 89.0 11.0 72.7 9.1 9.1 9.1 0.0 100
Gorakhpur 94.0 6.0 80.0 0.0 0.0 0.0 20.0 100
Sultanpur 98.0 2.0 100.0 0.0 0.0 0.0 0.0 100
Jalaun 83.0 17.0 100.0 0.0 0.0 0.0 0.0 100
Hathras 96.0 4.0 75.0 25.0 0.0 0.0 0.0 100
Mirzapur 97.0 3.0 100.0 0.0 0.0 0.0 0.0 100
Amroha 97.0 3.0 100.0 0.0 0.0 0.0 0.0 100
Kannauj 98.0 2.0 50.0 50.0 0.0 0.0 0.0 100
Rampur 95.0 5.0 100.0 0.0 0.0 0.0 0.0 100
Total 94.1 5.9 88.2 5.9 2.0 2.0 2.0 900
Source: Primary Survey, 2019.
Table 5.51 states about the profit received from organizations and it can be seen clearly that
78.4 percent of the growers received profit regarding seeds and fertilizers and 9.8 percent
received in terms of machinery. Nearly about 4 percent profit is also to be found regarding
loan, in packaging, and in marketing.
Table 5.51: Type of Facility/ Profit Received from Organization
District Loan Seeds/Fertilizer Help in
packing Marketing Machinery Total
Saharanpur 9.1 45.5 18.2 18.2 9.1 100.0
Gorakhpur 0.0 80.0 0.0 0.0 20.0 100.0
Sultanpur 0.0 100.0 0.0 0.0 0.0 100.0
Jalaun 0.0 100.0 0.0 0.0 0.0 100.0
Hathras 0.0 50.0 0.0 0.0 50.0 100.0
Mirzapur 0.0 100.0 0.0 0.0 0.0 100.0
Amroha 0.0 66.7 0.0 0.0 33.3 100.0
Kannauj 0.0 100.0 0.0 0.0 0.0 100.0
Rampur 20.0 80.0 0.0 0.0 0.0 100.0
Total 3.9 78.4 3.9 3.9 9.8 100.0
Source: Primary Survey, 2019.

168
XIV: Knowledge related about Geographical Situations:
Geographical indications have emerged as one of the important rights in order to provide
protection of certain products which are in geographical specific area. In order to double the
farmers income, geographical indication has played an important role in providing protection
to number of fruits, vegetables, spices and flower varieties which have been registered.
Hence, it is important to know that our sampled farmers have knowledge about geographical
situations which are related to horticulture farming and scenario is reflected in table 5.52
stating that 65.6 percent of the total sample don‟t have any type of knowledge about this
whereas 34.4 percent revealed of having knowledge which is better sign from farmers point
of view.
Most of the farmers accepted of having knowledge about the geographical situation related to
horticulture farming and 35 percent accepted of having knowledge about Seasonal Farming
followed by 17.8 percent accepted that due to uncertainty in weather conditions crops gets
destroyed and 16.8 percent accepted of having knowledge about wind direction and
knowledge about soil. This situation of having knowledge about the geographical conditions
may be regarded as a positive indicator which helps the farmers in getting higher productivity
and there by higher profit.
Table 5.52: Do you have any knowledge about geographical situations related to
horticulture farming? knowledge about
geographical situations
related to horticulture
farming
If yes, What kind of Knowledge
District YES NO Rain Seasonal
Farming
Crops get
destroyed
due to
uncertain
weather
Crop
related
Wind
direction Production soil
Saharanpur 13.0 87.0 15.4 7.7 46.2 7.7 23.1 0.0 0.0
Gorakhpur 38.0 62.0 13.2 26.3 13.2 0.0 23.7 2.6 21.1
Sultanpur 56.0 44.0 12.5 28.6 8.9 0.0 14.3 1.8 33.9
Jalaun 38.0 62.0 2.6 44.7 18.4 0.0 18.4 0.0 15.8
Hathras 48.5 51.5 29.2 29.2 10.4 2.1 8.3 0.0 20.8
Mirzapur 43.0 57.0 16.3 53.5 7.0 0.0 16.3 0.0 7.0
Amroha 13.0 87.0 0.0 23.1 0.0 0.0 53.8 0.0 23.1
Kannauj 43.0 57.0 2.3 48.8 32.6 0.0 11.6 2.3 2.3
Rampur 17.0 83.0 11.8 17.6 58.8 0.0 11.8 0.0 0.0
Total 34.4 65.6 12.6 35.0 17.8 0.6 16.8 1.0 16.2
Source: Primary Survey, 2019.

169
Sampled districts were asked about having knowledge about registered horticulture farming
types under Geographical Indications and it was surprisingly found that most of the farmers
i.e. 91.8 revealed of not having any knowledge regarding the same and only 8.2 percent
revealed of having knowledge. Hence, such a scenario call for the initiative by the
Government to provide proper information to improve growers‟ conditions engaged in
horticulture farming.
Table 5.53: Do you have any knowledge about registered horticulture farming types
under geographical indicators (G.I.):
percent reported of having Knowledge about
registration of horticulture farming under G.I
Have you benefited
under G.I
District Yes No Yes No Total
Saharanpur 13.0 87.0 0.0 100.0 100
Gorakhpur 9.0 91.0 2.0 98.0 100
Sultanpur 8.0 92.0 0.0 100.0 100
Jalaun 11.0 89.0 3.0 97.0 100
Hathras 6.0 94.0 1.0 99.0 100
Mirzapur 10.0 90.0 0.0 100.0 100
Amroha 4.0 96.0 0.0 100.0 100
Kannauj 5.0 95.0 1.0 99.0 100
Rampur 8.0 92.0 1.0 99.0 100
Total 8.2 91.8 0.9 99.1 900
Source: Primary Survey, 2019.
Further, it was found that only 8.2 percent of the sampled farmers were registered under
Geographical Indications and only 0.9 percent are found to be benefited under GI scheme -
where only 2 percent in Gorakhpur district, 3 percent in Jalaun district and 1 percent each out
of total in Hathras, Kannauj and Rampur districts accepted of benefiting under geographical
indications. Hence, it is important to provide them proper information regarding benefits by
registering their crops under geographical indications.
XV: Expectation/ Help from Government:
In Table 5.54 shows that the expectation of the growers of various horticulture crops from the
government in selected districts where the maximum growers i.e. 23.8 percent want help
related to water and irrigation facility and 16.1 percent revealed of wanting help in terms of
subsidy from government. Many growers reported of getting their crops damaged by wild
animals hence, 8.6 percent of growers wanted help in seeking protection from wild animals.
Farming tools also play an important role in farming activity and it was found that most of
the farmers in selected district don‟t have proper tools for production and cultivation of crops
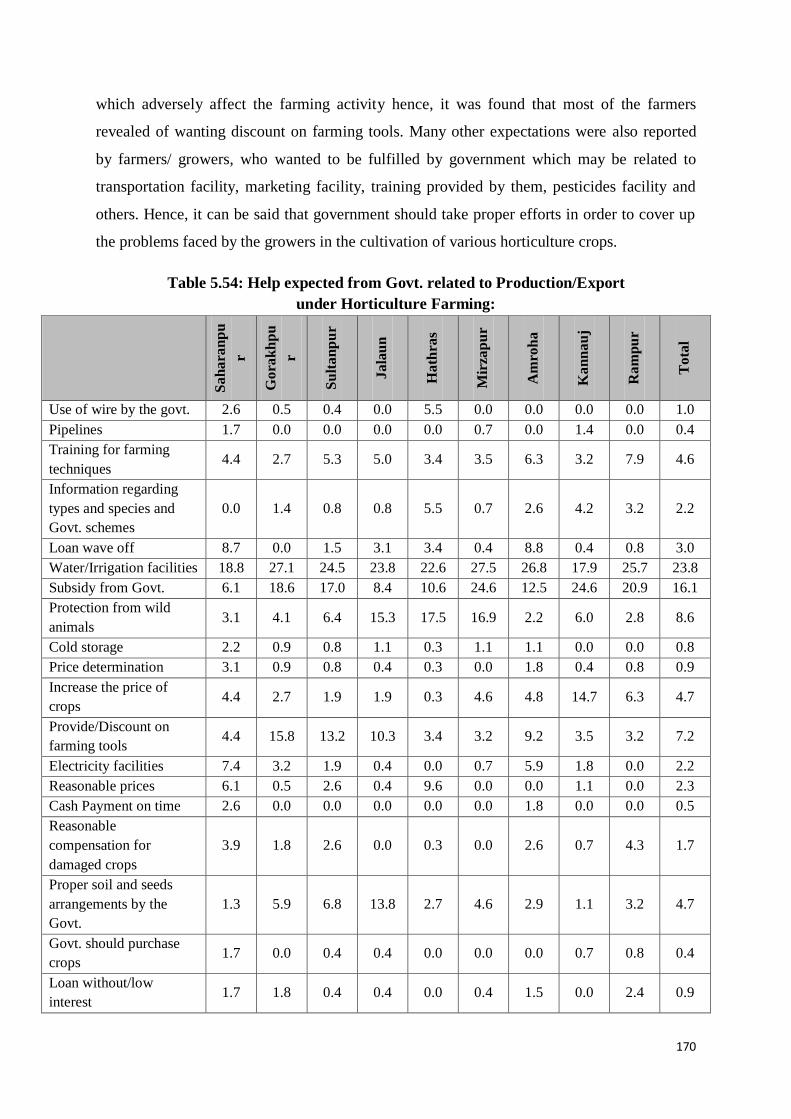
170
which adversely affect the farming activity hence, it was found that most of the farmers
revealed of wanting discount on farming tools. Many other expectations were also reported
by farmers/ growers, who wanted to be fulfilled by government which may be related to
transportation facility, marketing facility, training provided by them, pesticides facility and
others. Hence, it can be said that government should take proper efforts in order to cover up
the problems faced by the growers in the cultivation of various horticulture crops.
Table 5.54: Help expected from Govt. related to Production/Export
under Horticulture Farming:
Sa
ha
ran
pu
r
Go
rak
hp
u
r
Su
lta
np
ur
Ja
lau
n
Ha
thra
s
Mir
zap
ur
Am
roh
a
Ka
nn
au
j
Ra
mp
ur
To
tal
Use of wire by the govt. 2.6 0.5 0.4 0.0 5.5 0.0 0.0 0.0 0.0 1.0
Pipelines 1.7 0.0 0.0 0.0 0.0 0.7 0.0 1.4 0.0 0.4
Training for farming
techniques 4.4 2.7 5.3 5.0 3.4 3.5 6.3 3.2 7.9 4.6
Information regarding
types and species and
Govt. schemes
0.0 1.4 0.8 0.8 5.5 0.7 2.6 4.2 3.2 2.2
Loan wave off 8.7 0.0 1.5 3.1 3.4 0.4 8.8 0.4 0.8 3.0
Water/Irrigation facilities 18.8 27.1 24.5 23.8 22.6 27.5 26.8 17.9 25.7 23.8
Subsidy from Govt. 6.1 18.6 17.0 8.4 10.6 24.6 12.5 24.6 20.9 16.1
Protection from wild
animals 3.1 4.1 6.4 15.3 17.5 16.9 2.2 6.0 2.8 8.6
Cold storage 2.2 0.9 0.8 1.1 0.3 1.1 1.1 0.0 0.0 0.8
Price determination 3.1 0.9 0.8 0.4 0.3 0.0 1.8 0.4 0.8 0.9
Increase the price of
crops 4.4 2.7 1.9 1.9 0.3 4.6 4.8 14.7 6.3 4.7
Provide/Discount on
farming tools 4.4 15.8 13.2 10.3 3.4 3.2 9.2 3.5 3.2 7.2
Electricity facilities 7.4 3.2 1.9 0.4 0.0 0.7 5.9 1.8 0.0 2.2
Reasonable prices 6.1 0.5 2.6 0.4 9.6 0.0 0.0 1.1 0.0 2.3
Cash Payment on time 2.6 0.0 0.0 0.0 0.0 0.0 1.8 0.0 0.0 0.5
Reasonable
compensation for
damaged crops
3.9 1.8 2.6 0.0 0.3 0.0 2.6 0.7 4.3 1.7
Proper soil and seeds
arrangements by the
Govt.
1.3 5.9 6.8 13.8 2.7 4.6 2.9 1.1 3.2 4.7
Govt. should purchase
crops 1.7 0.0 0.4 0.4 0.0 0.0 0.0 0.7 0.8 0.4
Loan without/low
interest 1.7 1.8 0.4 0.4 0.0 0.4 1.5 0.0 2.4 0.9
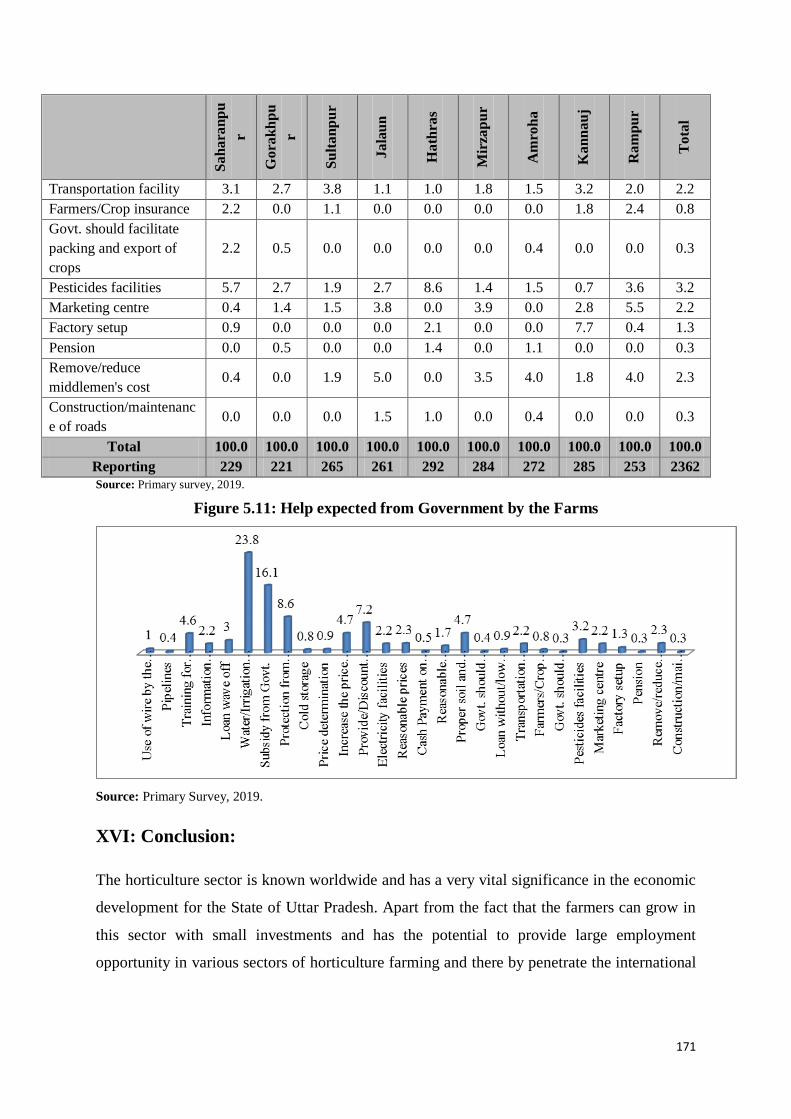
171
Sa
ha
ran
pu
r
Go
rak
hp
u
r
Su
lta
np
ur
Ja
lau
n
Ha
thra
s
Mir
zap
ur
Am
roh
a
Ka
nn
au
j
Ra
mp
ur
To
tal
Transportation facility 3.1 2.7 3.8 1.1 1.0 1.8 1.5 3.2 2.0 2.2
Farmers/Crop insurance 2.2 0.0 1.1 0.0 0.0 0.0 0.0 1.8 2.4 0.8
Govt. should facilitate
packing and export of
crops
2.2 0.5 0.0 0.0 0.0 0.0 0.4 0.0 0.0 0.3
Pesticides facilities 5.7 2.7 1.9 2.7 8.6 1.4 1.5 0.7 3.6 3.2
Marketing centre 0.4 1.4 1.5 3.8 0.0 3.9 0.0 2.8 5.5 2.2
Factory setup 0.9 0.0 0.0 0.0 2.1 0.0 0.0 7.7 0.4 1.3
Pension 0.0 0.5 0.0 0.0 1.4 0.0 1.1 0.0 0.0 0.3
Remove/reduce
middlemen's cost 0.4 0.0 1.9 5.0 0.0 3.5 4.0 1.8 4.0 2.3
Construction/maintenanc
e of roads 0.0 0.0 0.0 1.5 1.0 0.0 0.4 0.0 0.0 0.3
Total 100.0 100.0 100.0 100.0 100.0 100.0 100.0 100.0 100.0 100.0
Reporting 229 221 265 261 292 284 272 285 253 2362
Source: Primary survey, 2019.
Figure 5.11: Help expected from Government by the Farms
Source: Primary Survey, 2019.
XVI: Conclusion:
The horticulture sector is known worldwide and has a very vital significance in the economic
development for the State of Uttar Pradesh. Apart from the fact that the farmers can grow in
this sector with small investments and has the potential to provide large employment
opportunity in various sectors of horticulture farming and there by penetrate the international

172
market. Beside this, the farming sector and growers involved in this activity are facing severe
problems which were analyzed in the chapter.
The chapter contains the important findings of the study which explains about the problems
of the growers engaged in the horticulture farming. The study presents the factors and
problems leading to its decline. At the very outset, the chapter highlights the issue that
horticulture farming is not a pleasant work for these growers as most of the respondent sells
their orchards to traders and that too unwillingly and maximum respondents are selling their
orchards before getting flowers by receiving half amount. As most of the respondent revealed
of delayed payment as the major reason for their distress. Growers also proclaimed of having
a deal between themselves and the traders. The chapter further highlights that most of the
growers have taken loan for the growing of the crops and in order to pay off the loan amount,
they faced many problems as they had to pay installments and sometimes also have to sell
their animals to meet their liability.
Further, the chapter concludes that most of the farmer gets information about the horticulture
farming from farmer‟s friend and very low percent of the area of the other crops is found to
be competitive for its horticulture production. Problem in reallocation of the various
horticulture crops are faced by the growers. The selling and market related challenges are the
main problem in improving the economic status of horticulture producers. The growers of the
crops basically find it very difficult to sell off their produce to the ultimate customers. 88.8
percent of farmers were found to face problem in selling their crops. Various competitions
are faced by the growers in relation to its variety, price and its quality. Very few farmers
revealed of receiving compensation for the loss of their crops from any government
institution. Only 1.4 percent growers found to have insured their crops and to have benefitted
in wake of any crop loss .
Technological up-gradation and institutional changes are identified as thrust areas for future
development of the horticulture sector. 41.3 percent growers wanted to diversify the crops in
order to have higher profit. Further, the chapter highlights that despite of having information
about restricted pesticides most of the farmers revealed of using it for the safety of their crops
and to earn higher production and profit. Training may also help the growers to improve their
economic conditions. In the study it can be concluded that very low percentage of the
growers were trained by various organizations. Hence, Government and other financial and
training institutions must be encouraged to develop horticulture farming and improve the

173
condition of the growers. Major reason for taking loans is for farming purposes. Hence,
government and other institute may come up with various suggestions in order to overcome
the problem of finance in horticulture farming and to improve the condition of farmers.
Further the study concludes that almost all the sampled farmerss were not registered under
Geographical Indications i.e. 99.1 percent. Hence, it is important to provide them proper
information regarding benefits by registering their crops under geographical indications. At
the end farmers revealed of having their expectation from the government in order to
overcome the problems faced by them where the major problem faced by them was due to
lack of irrigation facility. The analysis shows that in spite of their strategic importance in
terms of employment creation, the horticulture sector in selected districts play an important
role since this sector is facing severe problem from many many angle and needs various
strategies, suggestions and intervention to improve the quality of life of growers in the sector.

174
Chapter 6
Findings and Policy Prescription
I: Introduction:
Indian agriculture has been witnessing a gradual change mainly in the cropping system, land
use pattern, marketing system, utilization of inputs for farming, and in financial behavior of
the farmers. On one hand, there is seen a huge shrinkage in the land area available for the
agriculture due to expansion in the urbanization, while on the other hand, it was found that
the demand for higher productivity and returns from the cultivated land is increasing rapidly.
It was found that due to serious problems faced in the agriculture sector; most of the growers
tend to shift mostly in favor to produce various horticultural crops such as fruits, vegetables,
spices, flowers and other crops.
Horticulture is an important component of agriculture having significant role in the economy
of the country. India's varied agro-climatic condition provides additional advantages in favor
of growing of a wide variety of horticultural crops. India is blessed with various types of soils
and varied agro-climatic conditions as a result of which the country has the advantages of
growing a variety of horticultural crops in particular and other crops in general.
U.P.'s varied agro-climate permits growing of a large number of these crops throughout the
year enabling their availability on a regular basis. The state holds a vast potential for the
development of various horticulture crops as it has diver‟s climatic conditions for growing
different categories of fruits and off season vegetables in its different agro zones. Therefore,
horticulture has emerged as one of the major agricultural activities as there has been a
substantial increase in both area and production of horticulture crops. Though horticulture
sector plays an important role in providing employment opportunities to the farm population
engaged in production, transportation, processing and marketing operation ,the horticulture
sector and the growers engaged in the sector still revealed of facing various problems related
to the various activity involved in the production of the crops.
Keeping into account these facts into consideration the present study was proposed for
carrying out a detail study on issues related to the present status of horticulture sector across
the districts of agro- zones of the state and its area and production. In this chapter an attempt
175
has been made to present briefly the major findings of the study undertaken in nine districts
of the agro climatic zone in the state of Uttar Pradesh and to provide various suggestions
related to the issues.
Since from the available literature in the Introductory chapter which explains that horticulture
has potential of higher returns from land, it is often debated that farmers cultivating tiny
pieces of land may not diversify towards these crops due to numerous constraints in
production and marketing as well as price risks associated with these crops. It may be stated
that, horticulture sector supply better food, higher income and yields higher returns from the
land and create better purchasing power among the people. The Introductory chapter explains
the objectives and methodology and Chapter Plan related to the study.
II: Objectives of the study
In detail, the study has following research objectives:
1. To estimate land use pattern under various agriculture and horticultural crops and its
changing pattern across different geographical and agro- climatic conditions and at
state level.
2. Pattern and emerging changes in productivity/yield rates of different agriculture and
horticultural crops.
3. Pattern and emerging changes in output of different agriculture and horticultural
crops.
4. Input use, cost of production, profitability of using land under different options and
factors implicating variations in opting cultivation of different horticulture and other
crops across the regions of the state.
5. Area specific emerging constraints in opting cultivation of different horticulture crops
and measures to be initiated to overcome from these constraints.
6. Contribution of horticulture to GDP at district, region and state level.
7. To suggest about the types of measures to be initiated for maximizing land under the
cultivation of horticulture crops.
III: Research Methodology
The study is confined to state of Uttar Pradesh. To fulfill the objectives of the study, both
primary and secondary data have been used. The scope of the study was confined to growing
of foodgrains, fruits, vegetables, spices, flowers and Medicinal / aromatic plants. The study
proposed to select one district from each agro-climatic zone on the basis of highest area under

176
horticulture crops for field survey. Thereafter, two or three blocks, with the consultation of
District Horticulture officer (DHO) has been taken to cover the different horticulture crops
i.e. vegetables, fruits, flower and spices grown in the area has been selected from each
district. Further, with the consultation of DHO, four villages from the selected blocks based
on the same criteria have been chosen for detail study. Finally, 25 households from each
village were selected on the basis of growing different horticulture crops in different size of
land holdings for field survey. Thus, our total sample was 9 districts, 22 blocks, 36 villages
and 900 households.
The study has been presented in 6 chapters. Chapter 1 presents the Introduction, review of
literature, research problem, objectives and research methodology of the study. Chapter II
presents the analysis of the secondary data to show the Horticulture Development in the Uttar
Pradesh. Chapter III presents the socio- economic characteristics of horticultural growers.
Chapter IV discussed about the area, production and productivity of various crops on basis of
primary data. Chapter V explains the major constraints in the horticulture crops in the
selected districts. The final Chapter summarizes the main findings of the study and gives
suggestions for improving the condition of growers and to promote horticulture crops export
from the country.
The foregoing analysis of the secondary data is explained in chapter II where area, production
and productivity of various horticulture crops in state of Uttar Pradesh is explained which
concludes that in terms of no. of projects, percent of share of project, subsidy allocation
amount and percent share of subsidy, Uttar Pradesh is only behind Maharashtra. State of
Uttar Pradesh has performed convincingly better during 2014-18 than proceeding period at all
India basis as is evident from the fact that growth in area and production of all horticulture
crops in State did exceptionally well during 2014-18 than 2009-13 and rank first in terms of
CAGR in area, third in terms of CAGR in production among all other States of India during
2014-18. State has maximum area and production under total horticulture crops. Further, it
concludes that in terms of CAGR (area and production) of all fruit crops, the state rank third
and record respectively at all India level during 2014-18. In terms of CAGR of area and
production of all vegetable crops, U.P. ranked first and third respectively at all India basis
during 2014-18. Further, it concludes that in case of CAGR of area of all spices crops U.P.
rank first but performed poorly in terms of CAGR (production) at all India level during 2014-
18. U.P growth was not found satisfactory against all other states in total spice crops. In case
of CAGR of area and production of other Horticulture (Flower and Aromatic), Uttar Pradesh

177
put up a poor performance at all India level during 2014-18. Though, it must be remembered
that it did not performed much poorly in terms of production than area.
The major share of various horticulture crops in the state which concludes that though the
mango constituted major share in area and production (TE-2018). Papaya led the way in
terms of growth rate in area, production and productivity per hectare for all Major fruit crop
in the State. The Potato constituted major share in area, production and productivity per
hectare in the State for Major vegetable crops. The Garlic shared major area, production and
productivity of Major spices crops in the state. Further, it explains the zone wise share and
growth rate of various horticulture crops which results that in terms of area and production of
total Horticulture crops, Central Zone and South West Semi Arid Zone dominated the State.
The share of area and production for all fruit crops is most significant in Central Zone of the
State. The share of area and production for All Vegetable Crops is most significant in Central
Zone and South West Semi Arid Zone in the State. In terms of area and production of all
spices crops, South West Semi Arid Zone and Central Zone Dominated the State. Hence, it
can be concluded that Uttar Pradesh holds a vast potential for development of the sector, but
it is still far from the realization of its actual potential. Hence, various suggestive measures by
the government and the state should be taken for the commercialization of various
horticulture crops and diversification of the horticulture sector in the state, in order to
improve the socio economic characteristics of horticulture growers and to increase the
productivity of the crops in the selected state.
The socio economic condition of the growers engaged in horticulture crops production is also
analyzed which states that male population is larger than the female counterpart in all 9
districts which can prove to be boon for horticultural activities. Hence, this can be a
significant factor that can be responsible for the growth of the horticulture sector. Further, in
all 9 districts it reported that overall percentage of General category respondents are less than
OBC and SC category which shows the socio economic condition of the growers and their
family. Hence, it can be concluded that if efforts are taken, the economic condition and their
livelihood of the family can be improved. The study confirmed that most of the people are
self employed and taking agricultural activities as their primary occupation. So people have
been on a look out for more rewarding activities like horticultural activities in all nine
districts. The figures in the study confirmed that horticulture sector evolved to be the lifeline
for these people. Since, they have tremendous land, potentiality and viability for growing of
all kinds of horticulture crops. Animal husbandry is an important allied activity of the farmers
in the district. Almost all the households were found to keep milch and draft animals. The

178
sampled household were found to keep about two milch animals on an average especially,
she buffaloes. Over 95 percent households reported ownership of durable goods like cycle;
mobile phones etc and most of the households own a motorcycle. The horticulture contributes
37.9 percent of household income and 15 percent contributed through agriculture, whereas
animal husbandry contributes 9.7 percent of household income. It was also concluded that
maximum 98 percent of households reported of having small equipments used in agriculture
where 70 percent were having chaffs and other implements. It is important to notice that only
15 percent of households reported of having tractor and 19 percent reported of having tube
well. It was also reported that most of the people were dependent on financial means of
savings i.e. in banks. In short, the economic condition of the sampled households was fairly
good as reflected in indicators of assets ownership and income levels as compared to previous
income of households. Hence, it can be said that if efforts are taken the socio- economic
condition of the growers of horticulture crops can be improved.
The study clearly demonstrated the benchmark survey of all the horticulture crops in the
sample farms by determining the area, production and its yield on basis of primary survey.
The study concluded the districts wise detailed analysis of cost incurred on various
horticulture groups of crops. It also explains about the percent profit per acre of all
horticulture crops on sample farms. It can be concluded that out of total gross cropped area,
the food grain cultivation constituted maximum area under different horticulture crop
followed by fruits, vegetables and cash crops where it was found that area under spices and
flower cultivation have very low proportion in selected district. It also concludes that overall
the yield per acre was highest for cash crops as potato was major specialization of growing of
crops in maximum district. Overall Yield was also highest for other crops followed by total
vegetables, spices and fruits. Mango was the most important fruit crops of the state
accounting for over maximum proportion of the percentage. Other main fruits were banana,
guava, papaya muskmelon, sitafal etc. A wide variety of vegetables are grown all over the
state including potato, tomato, and cauliflower, Etc. Overall the table states that the total yield
under vegetable crops was much better in Rampur and Amroha district. Further it concludes
that chilli and garlic was the major spice crops in selected sample district than Coriander,
Turmeric and Sauf. Rose, marigold and jasmine was the major flower crop in the selected
sample farms. However, an effort should be made to raise the yield of popular flowers in the
district by making all efforts. There has been a sharp increase in the area and output of
horticulture crops in selected sample district. Further, our study reveals about the high
potential of crop diversification for income enhancement of farmers. The study concludes and
179
explains about the cost structure for which the following items have been taken into account:
Total cost of seeds, exp land prep, Cost of plantation, Exp Irrigation, Exp soil fertilizer, Exp
pesticides, Labor cost, Cost wash brand pack, Sowing to transplanting transportation, Govt.
revenue, Cost cold storage, Cost middlemen and others. It comes to conclusion that the
proportion of labor cost for all crops was higher than other cost followed by cost of seeds,
irrigation and land preparation. The percent profit per acre was 28.4 percent from 46.6 percent
per acre income. Hence, it can be concluded that if farmers shift their area to horticulture crops,
income can be increased and it can be more profitable to the farmers to grow more crops in the
district. As, it has been well recognized that the horticulture crops have the inherent advantage
of providing higher productivity per unit area of land as compared to other crops, resulting in
higher income and employment generation in rural areas.
The views of farmers about different types of problems faced by them were also solicited
during the survey. At the very outset, the chapter highlighted the issue that horticulture
farming is not a pleasant work for these growers as most of the respondent sells their orchards
to Traders and that too unwillingly and maximum respondents are selling their orchards
before getting flowers by receiving half amount as most of the respondent reveals of delayed
payment as the major reason for sale of their orchards. Problem in reallocation of the various
horticulture crops are faced by the growers. The selling and market related challenges are the
main problem which creates hindrance in improving the economic status of horticulture
producers. The growers of the crops basically find it very difficult to sell off their produce to
the ultimate customers. 88.8 percent of farmers were found to face problem in selling of their
crops. Various competitions are faced by the growers in relation to its variety, price and its
quality. Very low farmers reveals of receiving compensation for the loss of their crops from
any government institution. Only 1.4 percent growers found to have insured of their crops.
Technological up-gradation and institutional changes are identified as thrust areas for future
development of the horticulture sector. 41.3 percent growers wanted to diversify the crops in
order to have higher profit. Further, the chapter highlights that despite of having information
about restricted pesticides most of the farmers revealed of using it for the safety of their crops
and to earn higher production and profit. Training may also help the growers to improve the
economic condition. In the study it concludes that very low percentage of the growers was
trained by various organizations. Hence, Government and other financial and training
institute must be encouraged so as to develop horticulture farming and improve the condition
of the growers. Major reason for taking loan is for farming purposes. Hence, government and
other institute may come up with various suggestions in order to overcome the problem of

180
finance in horticulture farming and to improve the condition of farmers. Further the study
concludes almost all the sampled farms were not registered under Geographical Indications
i.e. 99.1 percent. Hence, it is important to provide them proper information regarding benefits
by registering their crops under geographical indications. At the end farmers reveals of
having their expectation by the government in order to overcome the problems faced by them
where the major problem faced by them was due to lack of irrigation facility, hence,
government should take proper efforts in order to cover up the problems faced by the growers
in the cultivation of various horticulture crops.
In brief, the analysis shows that in spite of their strategic importance in terms of employment
creation, the horticulture sector in selected districts play important role since it is facing
severe problem from many point of view which need various strategies, suggestions and
intervention to improve the quality of life of growers and the sector. The various government
schemes and programmes introduced for the benefits of farmers were not effectively reaching
the majority of the farmers. Hence, there is clear need of revamping these programmes at the
gross root level.
IV: Suggestions:
The state like U.P. enjoys comparative advantage in horticulture crops because of its
favorable agro-climatic factors suitable for growing a large variety of horticulture crops.
Horticultural output has increased at a fairly encouraging rate in the recent years due to the
impetus provided by growing demand for these products. This market led process is still too
small to have a large impact on the agricultural economy of the state and needs to be
supported through public policy in a systematic manner.
These are the various recommendations suggested in order to improve the productivity of the
crops and also to help in increasing the income of the farmers engaged in cultivation of
various horticulture crops. It can be said that if efforts are made in proper and effective way,
its weakness can be converted into its opportunities and also help in improving the socio-
economic condition of the growers involved in the farming. It can be concluded that if
farmers shift their area to horticulture crops, income can be increased and can be more
profitable to the farmers to grow various type of crops in the districts. The policy package to
promote the process of crop diversification should include among other things the following:
Improvement in the rural infrastructure particularly in the field of storage, transport
and marketing of these crops: It has been reported that more than 20-30 per cent of the
produce is lost in the post-harvest operations. This is mainly because of factors like non-

181
availability of proper infrastructure in terms of facilities for handling the produce, poor
transport & road condition and lack of storage and ware- house facilities discourage the
farmer to diversify their crop. Government would have to invest on public transport, roads
and most important on cold storages and warehouses to motivate the growers to diversify
their crops and increase the area under horticulture crops. Irrigation was the major problem
revealed by the farmers in the districts. Hence, adequate and regular irrigation facility should
be provided by the government.
Strengthen the Marketing System: The study revealed that middlemen are considered as a
necessary evil in the marketing system. Two types of measures need to be directed for
controlling the activities of middlemen. These are (i) regulating the marketing system, and
(ii) creating alternative channels of trade for marketing of horticultural crops.
Organization of farmers on cooperative and group basis to take up production, processing and
marketing of horticultural produce and other high value crops. The main features of the
organizations may include establishment of collection centers in growing regions and
regulation of all buying/selling activities through the organizations at the market yards.
Further, registration of all growers of the region with the organizations, advancement of loans
at lower rate of interest, distribution of inputs on subsidized rate through collection centers,
etc. are other features desired for. The Department of Horticulture (DoH) can be closely
associated with the organization and some responsibility of collection centers can be
entrusted to their field staff.
Minimum Support price System for Horticulture Crops also: The horticulture growers
faces the problem related to the prices of different crops. Government must interfere to
decide the minimum price of all horticulture crops as the price of wheat and rice. It will give
a kind of security to the growers specially vegetables growers.
Encouragement to agro-processing industries in the rural areas on a widespread basis:
Fruit processing industries have enough potential to grow in the future. Government should
invest on the processing industries in the different pockets of horticulture growing regions
especially in the fruit growing pockets. It will increase the prices of the produce as well as
increase the employment in the sector which would lead to increase the demand. It will also
be helpful to increase the export of the fruits in terms of different processesed products and
increase the self-life of the fruits.

182
Availability of Adequate Institutional Credit: Credit Support is required during the period
when farmers are not able to sell their produce. Credit is required for crop establishment and
maintenance, installation of on farm infrastructure, such as drip irrigation, processing units,
export credit, etc. As most of the growers are from the marginal and small farmer groups,
banks may provide them adequate credit on lower rate of interest. In the process the
middlemen get the major share of benefit from the investment of the primary producer. Thus,
there is an urgent requirement to reorganization the rural credit delivery system to support the
higher credit requirements of high value crops.
Adequate Provision of Improved Varieties of Seeds and Planting Material to the
Farmers. Farms inputs and credit availability to the farmers should be easily available and
must be provided at lower costs. Cost of seeds was highest in almost all districts. Hence,
proper arrangements should be made for timely supply of good quality of seeds at lower cost.
Besides, growers use harmful chemical and pesticides to save their crops from insects and to
improve the productivity. Government should ban these chemicals and pesticides and provide
them the harmless chemicals & others fertilizer on subsidized rate and should also motivate
them to adopt organic farming.
Data and information: One of the major problem was non availability of proper and
authentic data at the district level. Block wise data related to various horticulture crops are
also not available at the district level. Hence proper measure should be taken by the
government and Horticulture department in order to collect authentic data at the block level
and village level. It is suggested that data on area, production and yield also need to be
streamlined after conducting proper survey. Data generated by the Department and other
agencies at the field level vary to a large extent. Similarly, there is a need to streamline the
data and put in place a system to update and publish the data on market arrival and prices of
different horticulture crop-wise.
Undoubtedly, the area, production of horticulture crops has improved to some level, but yield
was not up to the mark as expected. Therefore, serious policy efforts are needed to increase
the potential and improve the productivity of various crops at state and district level.
Strengthening of the Research and Extension Services: Strengthening of the Research and
Extension Services oriented towards horticulture crops in the different agro-climatic zones of
the State is the need of the hour. Field studies observe that there is lack of training and
awareness generation on various cultivation practices for producing different type of
horticulture crops especially flowers, medicinal plants and others. Growers have inadequate

183
knowledge regarding the proper operation, maintenance and about new techniques of the
farming system of horticulture crops particularly in case of fruits and flowers. Hence, time to
time training programme related to the new techniques in order to improve the pre and post-
harvest management should be organized for the growers at district level. Majority of the
growers are not aware about the schemes related to horticulture as well as diversification of
crops. So, government and other agencies should organize awareness programmes related to
such schemes at the places where growers are residing. Government should come up with
proper training centers and soil testing centers at the block level to increases the productivity
of different crops.
Improve the staff at District level: Horticultural departments are sufferings from the lack of
staff at the district level for providing the required extension services. The Horticulture
Department of the State Government has been facing shortage of staff. There is inadequate
awareness on post-harvest needs and its technology among the mango growers and traders.
Branding and Registration for Geographical Identity of different crops: There are
several varieties, which need to be identified and given a geographical identity. Such varieties
are dependent on specific soil and climatic conditions. The Department of Horticulture may
identify and make efforts to enlist the places linked with a particular variety of mango and
thereafter attempt for registration of geographical identity of such local varieties, branding
mango in such a way that it would lead to integrated growth of that crop. Mango is one
example other crops too reiterate such efforts under GI scheme to enhance its coverage and
income of the horticulture crop growers in the State.
In this endeavor there is ample scope for cooperative action by the public and private sectors.
While in many areas like research, extension, development of rural infrastructure and
organization farmer‟s group direct initiative may have to be taken by the government, public
policy should aim at involving the private sector in its initiatives and should play a
promotional role to encourage the private sector to come forward in a big way to exploit the
potential of agricultural diversification.

184
Reference
Gogoi, M., and Borah, D. (2013), “Baseline data on area, production and productivity of
horticulture crops in North East and Himalayan states - A study in Assam, Jorhat”, Study No.
142 , Agro-Economic Research Centre for North-East India Assam Agricultural University
Jorhat – 785013, Assam 2013 , pp. 16-67.
Jat, M. L., Gupta, R. K., Erenstein, O., & Ortiz, R. (2006) “Diversifying the intensive cereal
cropping systems of the Indo-Ganges through horticulture”, Chronica horticulturae, 46(3),
27-31.
Joshi, P. K., Joshi, L., & Birthal, P. S. (2006), “Diversification and its impact on
smallholders: Evidence from a study on vegetable production”,. Agricultural Economics
Research Review, 19(347-2016-16776), 219-236.
Mittal, S. (2007). Can horticulture be a success story for India?, Working paper, No. 197,
Indian Council For Research On International Economic Relations, New Delhi.
Mittal, Surabhi (2009), “Feasibility Check for Diversification towards Horticultural
Production,” Agricultural Economics Research Review, Vol. 22 (1), January-June.
Pradhan, N. S. (2005), “Study on technological gap and constraints in adoption of flower
crops in Delhi”, Ph. D. Thesis (Unpublished), C.C.S.U., Meerut, UP.
Pratap Birthal, S., P. K. Joshi, Sonia Chauhan and Harvinder Singh (2008), “Can Horticulture
Revitalize Agricultural Growth,” Indian Journal of Agricultural Economics, Vol. 63 (3),
July-September.
Some data extract from the Websites of Different Government Department as:
Mission for Integrated Development of Horticulture (MIDH), Report, 2018-
19), ,http://nhb.gov.in/
National Horticulture Board, Ministry of Agriculture and Farmers Welfare Government of
India
http://nhb.gov.in/Statistics.aspx?enc=WkegdyuHokljEtehnJoq0KWLU79sOQCy+W4MfOk0
1GFOWQSEvtp9tNHHoiv3p49g, http://agricoop.nic.in/statistics/state-level

185
Horticulture and Food Processing Department, UP Govt., UP Udhyan Bhawan, 2-Sapru
Marg, Lucknow,http://uphorticulture.gov.in/
Agricultural and Processed Food Products Export Development Authority (APEDA),
https://agriexchange.apeda.gov.in/indexp/reportlist.aspx
Agricultural Census of India, 2001 & 2005, http://agcensus.dacnet.nic.in/
State Horticultural Mission Report, 2013, http://agricoop.nic.in/statistics/state-level)