benchmarking hospital performance: an … - an...benchmarking hospital performance: an analytics...
TRANSCRIPT

Page 1 of 32
BENCHMARKING HOSPITAL PERFORMANCE: AN ANALYTICS APPROACH
W & V Raghupathi
Page 2 of 32
BENCHMARKING HOSPITAL PERFORMANCE: AN ANALYTICS APPROACH
ABSTRACT
Objective: We investigate hospital performance with a view to understanding the areas that need
improvement so as to comprehend and improve healthcare.
Design: We deploy an analytics approach to study indicators of hospital performance such as
hospital cost, in-hospital death rate, length of hospital stay, and the number of discharges from
the hospital. We look for trends in these indicators.
Setting: Data is extracted from the National Statistics Database of the Healthcare Cost and
Utilization Project (HCUP.net), and Cognos and Tableau were used as visualization and analysis
tools.
Results: Our central finding is that over the 10-year analysis period, U.S. hospitals improved in
several areas, including reduction in length of stay in hospitals, reduction in number of in-
hospital deaths, and increase in number of discharges from hospitals. Despite these
improvements, however, the cost of healthcare rose significantly.
Conclusions: We show how healthcare administrators can learn from past performance in
determining where to focus attention and improve outcomes. We also present a global
perspective of healthcare and propose how critical it is for the U.S. to focus on major reduction
in healthcare costs, beginning with hospital charges.
Keywords: Hospital Performance, Healthcare, In-hospital death, Length of Stay, Discharge,
Analytics, OECD
Page 3 of 32
1. INTRODUCTION
Prior studies make it clear that analyzing hospital performance is critical to healthcare at
national and global levels for lowering costs, improving patient outcomes, and improving overall
quality of care. On a global level, the Organization for Economic and Cooperative Development
(OECD) has determined that 20 to 40% of a country’s total health expenditure should be on
hospital care. On a national level, the general expectation is that efficiency of hospitals in terms
of patient treatment and care improves over time [1]. Meanwhile, a study of healthcare across the
U.S. shows a range of quality, inviting more analysis of internal performance factors to help
professionals address these quality discrepancies [2].
Hospital care accounts for the largest share (32%) of the U.S. healthcare expenditures,
followed by physician/clinical services (21%), prescription drugs (10%), nursing home care
(6%), home and healthcare (2%) [3]. Given that this is a large segment of healthcare spending, it
is essential that hospital performance be measured over time to determine whether and where a)
there is room for improvement in some of its critical success factors, and b) there are savings to
be found.
Of industrialized nations worldwide, the U.S spends the most on healthcare and the most
on healthcare per capita, even though the quality of healthcare by specific measurements remains
relatively low. In 2010, the U.S. spent one and half times as much as any other country on
healthcare and twice the average of the Organization for Economic and Cooperative
Development [4]. Continuing this trend, in 2011, aggregate U.S. hospital spending was $387.3
billion, a 63% increase from 1997; and the average cost of hospital stay per person was $10,000,
a 47% increase from 1997 [5]. The overall healthcare spending was $2.8 trillion, a 3.7% increase
from the previous year and constituting 17.9% of the Gross Domestic Product [6].

Page 4 of 32
Over the past years, the U.S has seen an increase in life expectancy and a decrease in
most types of mortality. Nevertheless, compared to other OECD high-income countries that have
demonstrated a similar trend, U.S. has not moved up the rankings for critical health care
indicators such as cost, death occurrence, length of stay, and total number of discharges.
A 2013 survey of 11 countries conducted by the Commonwealth Fund showed that,
compared to other countries, adults in the U.S. were more likely to forego healthcare due to the
high cost [7]. The United States Health Data for 2013 shows that the spending on health per
capita for 2011 was $8508, about two and a half times the OECD average of $3339 and twice
that of such wealthy European countries as France and Sweden. The healthcare cost for the U.S
is more than that of Norway, the country in the OECD with the second highest-income. The total
spending on healthcare in the U.S for the years 2000 to 2009 showed a yearly average increase of
4.4%, while the growth rate declined by almost half to 2.1% [4]. Among OECD countries, the
Commonwealth Fund ranked the U.S. lowest in terms of healthcare quality and at the top of the
list in terms of cost [5].
In this research, we use an analytics framework to analyze changes in hospital
performance over time in four key areas: cost of hospital stay, length of hospital stay, the number
of hospital discharges, and the number of in-hospital deaths. All individuals are directly or
indirectly impacted by health services, making the cost of healthcare a significant societal factor.
We identified several key indicators for hospital performance, including reduction in hospital
length of stays, reduction in in-hospital deaths, reduction in or prevention of an increase in the
cost of healthcare, and optimization of the rates of admittance in emergency departments/other
hospitals/long term care. For each of these key performance indicators, benchmarks were
developed for the sake of comparison. The length of stays and in-hospital deaths are compared
Page 5 of 32
for conditions or procedures that require similar stay or have similar deaths rates. The cost of
healthcare is compared across various conditions or procedures. The growth trend in cost is
rationalized and compared to the overall growth in cost and change in macroeconomic
conditions. Admittance rates for various conditions and/or procedures are compared, and
optimization rates established. We looked for combinations of indicators that generate
meaningful results and offer insight on hospital performance. The expectation is that hospitals
will become more efficient, providing appropriate patient services without a dramatic increase in
costs over time.
In the domain of healthcare, analytics is an excellent decision support technology. It
enables physicians, nurses, health officials, health policy makers, and other healthcare entities to
make better and faster health decisions [8]. We show in a trend analysis how the indicators of
hospital performance function. The data are extensively analyzed using the business intelligence
and visualization tools of Tableau and Cognos Insight. Relationships between indicators are
established using the advanced statistical modeling technique of linear regression. Through our
analysis, we offer empirical and conceptual insights to hospitals in maximizing their operational
efficiency.
The rest of the paper is organized as follows: Section 2 contains the research background
and Section 3 describes the analytics framework used in the research. Section 4 contains a
discussion of the results, and Section 5 discusses the scope and limitations. Section 6 lists the
contributions and policy implications, and Section 7 concludes the paper.
2. RESEARCH BACKGROUND
According to the national study on in-patient hospital stays by the Agency for Healthcare
Research and Quality, there were 38.6 million hospital stays in 2011, an 11% increase from

Page 6 of 32
1997. During this time frame, total hospital costs rose to $387.3 billion, a 63% increase. The
mean charges per stay - the amount a patient pays to the hospital for all charges relating to the
stay, including room, nursing and tests - was $35,400 in 2011, more than twice the amount in
1997. Meanwhile, the number of discharges against medical advice increased 41% over the years
from 1997 to 2011 [5].
Since the passage of the Patient Protection and Affordable Care Act in 2010, more
attention has been given to efficient delivery of healthcare by healthcare administrators,
continuous improvement in quality of care and patient safety, promotion of health information
technology (electronic medical records), and reduction of per capita spending on healthcare. A
report by HealthGrades Inc. on hospital performance in over 4500 U.S. hospitals (relating to 31
of the most common inpatient procedures and conditions during the years 2010 through 2012)
shows that there are quality disparities within hospitals among different procedures/conditions,
as well as between hospitals within local services [9]. The report also suggests the impact that
patient mortality (in-hospital deaths) and patient complications have on healthcare cost, and it
advances the theory that the root causes of cost in terms of mortality and complications can be
reduced through the use of minimally invasive surgical techniques [9].
At a global level, healthcare expenditures show considerable variation across countries in
terms of per capital spending and other trends. (Note that except for Mexico and the U.S., all
OECD countries have universal or quasi-universal health coverage [4]. Between 2009 and 2011,
many countries reduced spending in an effort to cut the budget deficit or government debt.
Canada and the U.S., however, increased healthcare spending during this period. That said, the
overall health of a population is influenced by many factors, but the most important of these is
the performance of its healthcare system, not the costs associated with it.
Page 7 of 32
3. ANALYTICS FRAMEWORK
Our research involves the use of analytics in the healthcare domain and adopts a
framework of health analytics that is based on the general framework of business intelligence
and data warehousing [10]. The framework is generic enough to be applied to any healthcare
context in which analytics is deployed. It includes the components of data collection, data
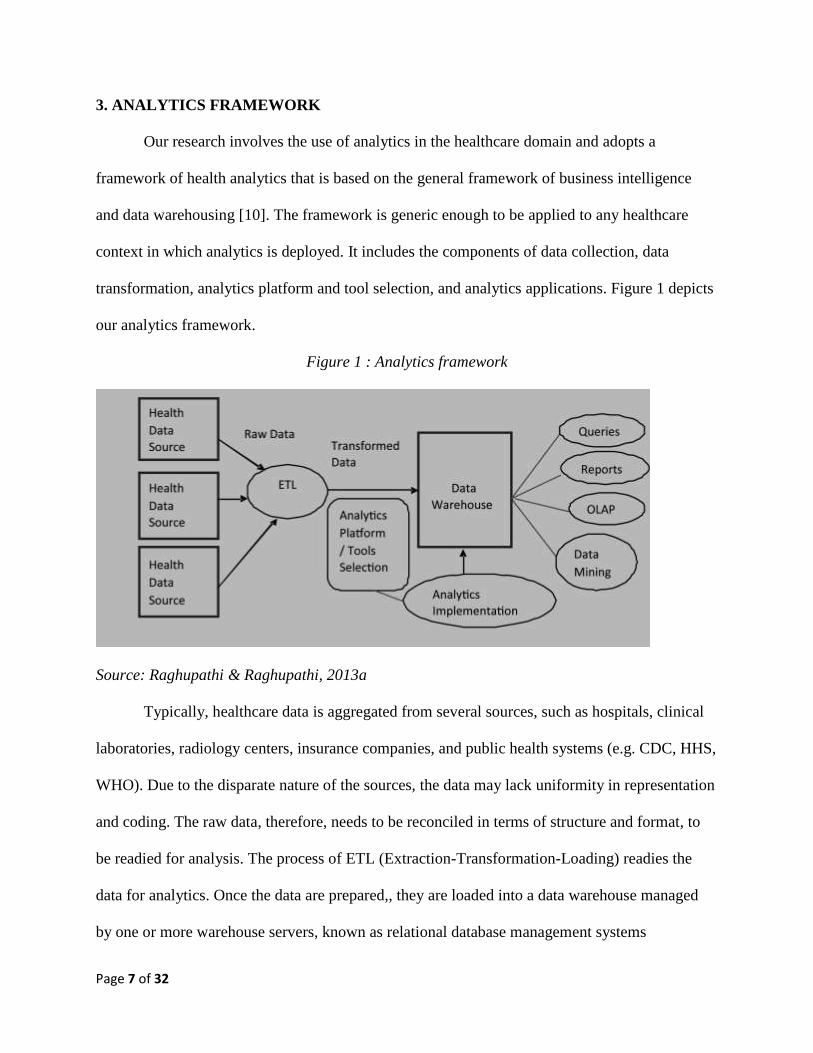
transformation, analytics platform and tool selection, and analytics applications. Figure 1 depicts
our analytics framework.
Figure 1 : Analytics framework
Source: Raghupathi & Raghupathi, 2013a
Typically, healthcare data is aggregated from several sources, such as hospitals, clinical
laboratories, radiology centers, insurance companies, and public health systems (e.g. CDC, HHS,
WHO). Due to the disparate nature of the sources, the data may lack uniformity in representation
and coding. The raw data, therefore, needs to be reconciled in terms of structure and format, to
be readied for analysis. The process of ETL (Extraction-Transformation-Loading) readies the
data for analytics. Once the data are prepared,, they are loaded into a data warehouse managed
by one or more warehouse servers, known as relational database management systems
Page 8 of 32
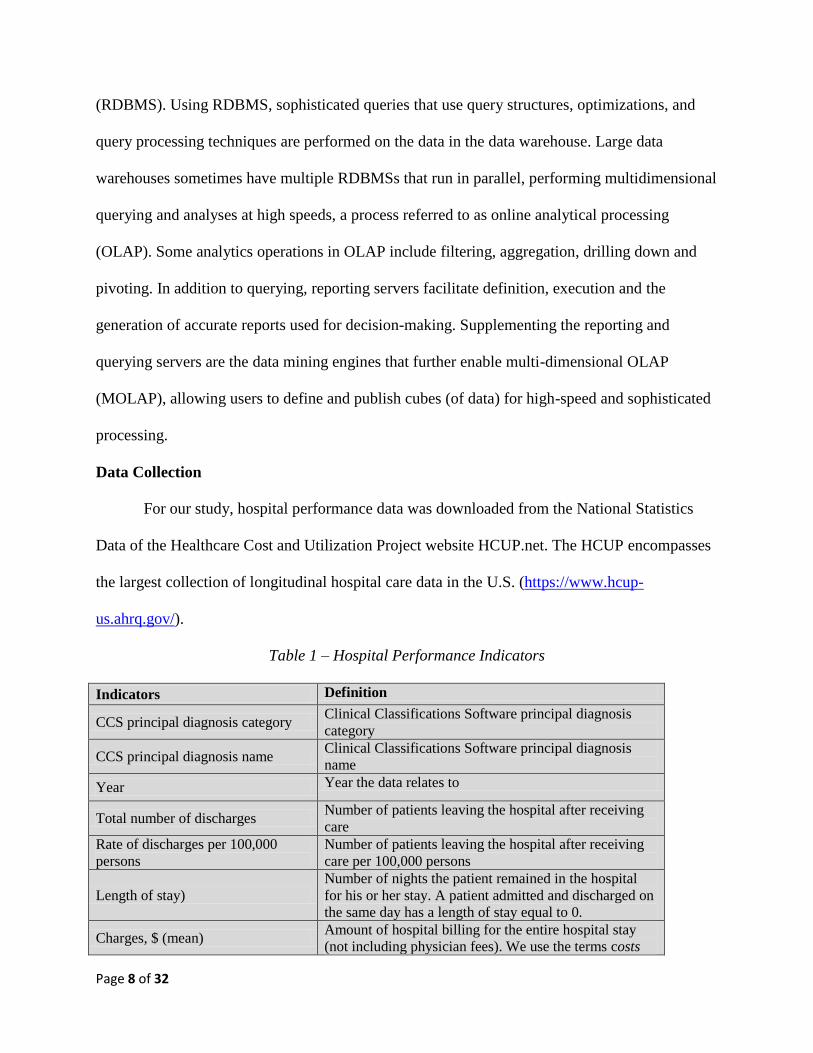
(RDBMS). Using RDBMS, sophisticated queries that use query structures, optimizations, and
query processing techniques are performed on the data in the data warehouse. Large data
warehouses sometimes have multiple RDBMSs that run in parallel, performing multidimensional
querying and analyses at high speeds, a process referred to as online analytical processing
(OLAP). Some analytics operations in OLAP include filtering, aggregation, drilling down and
pivoting. In addition to querying, reporting servers facilitate definition, execution and the
generation of accurate reports used for decision-making. Supplementing the reporting and
querying servers are the data mining engines that further enable multi-dimensional OLAP
(MOLAP), allowing users to define and publish cubes (of data) for high-speed and sophisticated
processing.
Data Collection
For our study, hospital performance data was downloaded from the National Statistics
Data of the Healthcare Cost and Utilization Project website HCUP.net. The HCUP encompasses
the largest collection of longitudinal hospital care data in the U.S. (https://www.hcup-
us.ahrq.gov/).
Table 1 – Hospital Performance Indicators
Indicators Definition
CCS principal diagnosis category Clinical Classifications Software principal diagnosis
category
CCS principal diagnosis name Clinical Classifications Software principal diagnosis
name
Year Year the data relates to
Total number of discharges Number of patients leaving the hospital after receiving
care
Rate of discharges per 100,000
persons
Number of patients leaving the hospital after receiving
care per 100,000 persons
Length of stay)
Number of nights the patient remained in the hospital
for his or her stay. A patient admitted and discharged on
the same day has a length of stay equal to 0.
Charges, $ (mean) Amount of hospital billing for the entire hospital stay
(not including physician fees). We use the terms costs

Page 9 of 32
and hospital charges interchangeably.
Aggregate charges, $ (the "national
bill")
Sum of all costs for all hospital stays.
Admitted from emergency
department Number, Rate
Number and rate of patients admitted from the
emergency department
Admitted from other hospital
Number, Rate
Number and rate of patients admitted from other
hospitals
Admitted from long term care
number, Rate
Number and rate of patients admitted from long-term
care
In-hospital deaths Number/Rate Number and rate of patient deaths during hospital stay
Routine discharge Number/Rate Number and rate of patients routinely discharged
Discharge to another short-term
hospital
Number of Patients discharged to another short-term
hospital
Discharge to another institution Number of Patients discharged to another healthcare
institution
Discharge to home health care Number of Patients discharged to home health care
Against medical advice (AMA)
number
Number of patients who leave the hospital against the
advice of their doctor.
As shown in Table 1, the hospital performance indicators included in our analysis were
in-hospital deaths, hospital cost, lengths of stay in hospital, and patient discharges—all crucial in
determining the performance of hospitals in the overall healthcare system. The unit of data
collection for the indicators shown in the table was their use per 100,000. The principal CCS
principal diagnosis category, CCS principal diagnosis category name, and year were used as
filters.
Using analytics, we identified trends in the significant indicators of hospital performance
over the time period 1997 to 2006. Among other questions, we asked:
- Have hospital costs changed over the 10-year time period from 1997 to 2006?
- Has there been a reduction in hospital deaths over the 10-year time period 1997 to 2006?
- Has there been a reduction in the length of stay in the hospital over the 10-year time
period 1997 to 2006?

Page 10 of 32
- Has there been a reduction in the total number of discharges over the 10-year time period
1997 to 2006?
Data Transformation
In order to analyze raw data extracted from the Agency for Healthcare Research and
Quality it must be reconciled in terms of structure and format. Quality issues were corrected by
integrating, cleansing, and standardizing the data through the steps of extract, transform, and
load [11].
Analytics Platform and Tool Selection
Once the data are transformed, a suite of tools is utilized to perform different types of analytics.
It is typical to have a combination of business intelligence tools for analytics. We selected
Cognos Studio and Tableau as the business intelligence tools. The Cognos Studio platform is
very effective for time series analysis of data. Tableau, especially practical for its trend line
function, was used for data visualization. Analysis consisted of manipulating different indicators
to find significant trends and patterns in the data. Specifically, we deployed linear regression for
the Tableau trend line application.
Analytics Applications
Using the selected tools, different types of analytics was performed in the context of queries,
reports, online analytical processing and data mining. The data that are cleansed and readied are
then loaded into Cognos and Tableau for analysis. We utilized Cognos Studio tools for querying,
reporting. We utilized the data mining techniques of ranking, association and visualization. We
also used the online analytical processing functions of filtering, aggregation, drilling down, and
pivoting of data. For display, we used the dual display feature of chart and table. We also relied

Page 11 of 32
heavily on Tableau’s visualization using scatter plots, highlight tables, and trend line features.
The results of our analysis offer insight into the trends in hospital performance and help us better
assess the state of healthcare performance at a national level.
4. RESULTS AND DISCUSSION
Various analytical techniques were applied to reveal associations between indicators and to
uncover patterns that offer insights into our propositions. Data was explored and analyzed in
several ways, and we generated a total of 13 charts and tables. What follows is a discussion of
our results for the different analyses.
Healthcare Charges and Cost
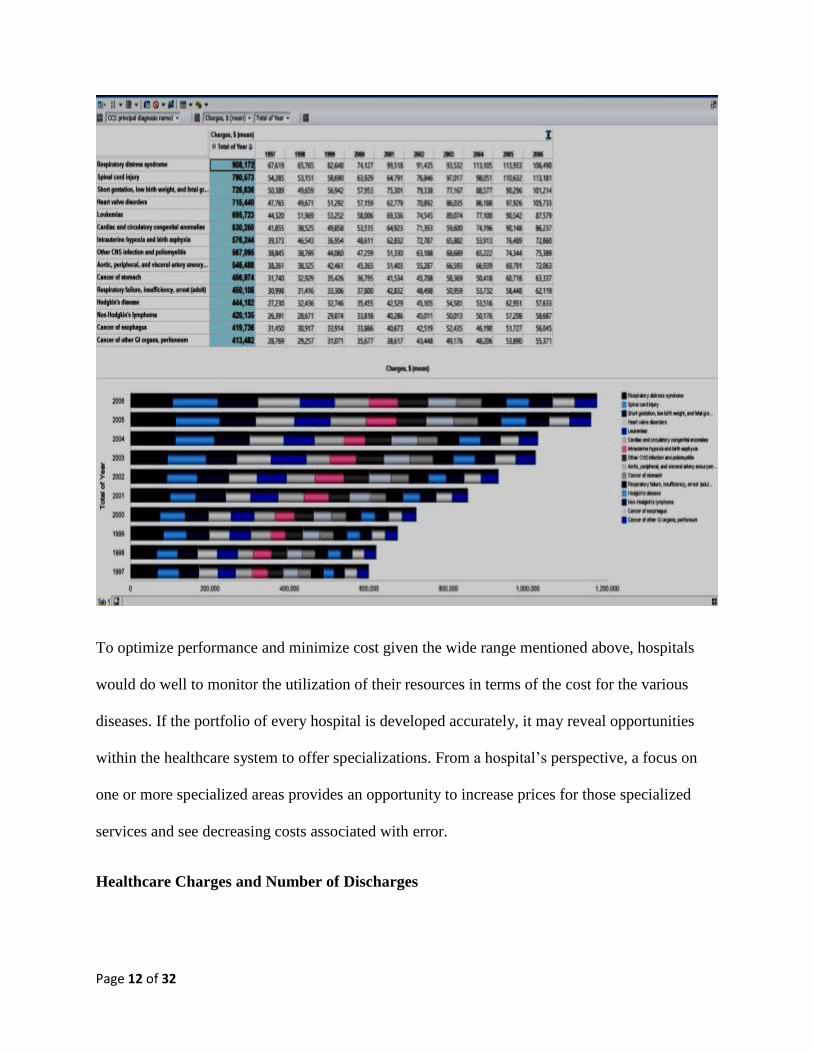
The trends in the mean healthcare costs for the U.S. displayed in Figure 2 show that healthcare
costs, on average, have doubled in the years between 1997 and 2006, from $413,482 to $908,172.
There is a general increase in cost across all diseases, but the largest increase appears to be for
respiratory distress syndrome, followed by spinal cord injury ($790,573) and low birth weight
and fetal growth retardation ($726,836). The diseases with the least cost are cancers of gastro
intestinal organs and peritoneum.
Figure 2 – Trends in Healthcare costs
Page 12 of 32
To optimize performance and minimize cost given the wide range mentioned above, hospitals
would do well to monitor the utilization of their resources in terms of the cost for the various
diseases. If the portfolio of every hospital is developed accurately, it may reveal opportunities
within the healthcare system to offer specializations. From a hospital’s perspective, a focus on
one or more specialized areas provides an opportunity to increase prices for those specialized
services and see decreasing costs associated with error.
Healthcare Charges and Number of Discharges
Page 13 of 32
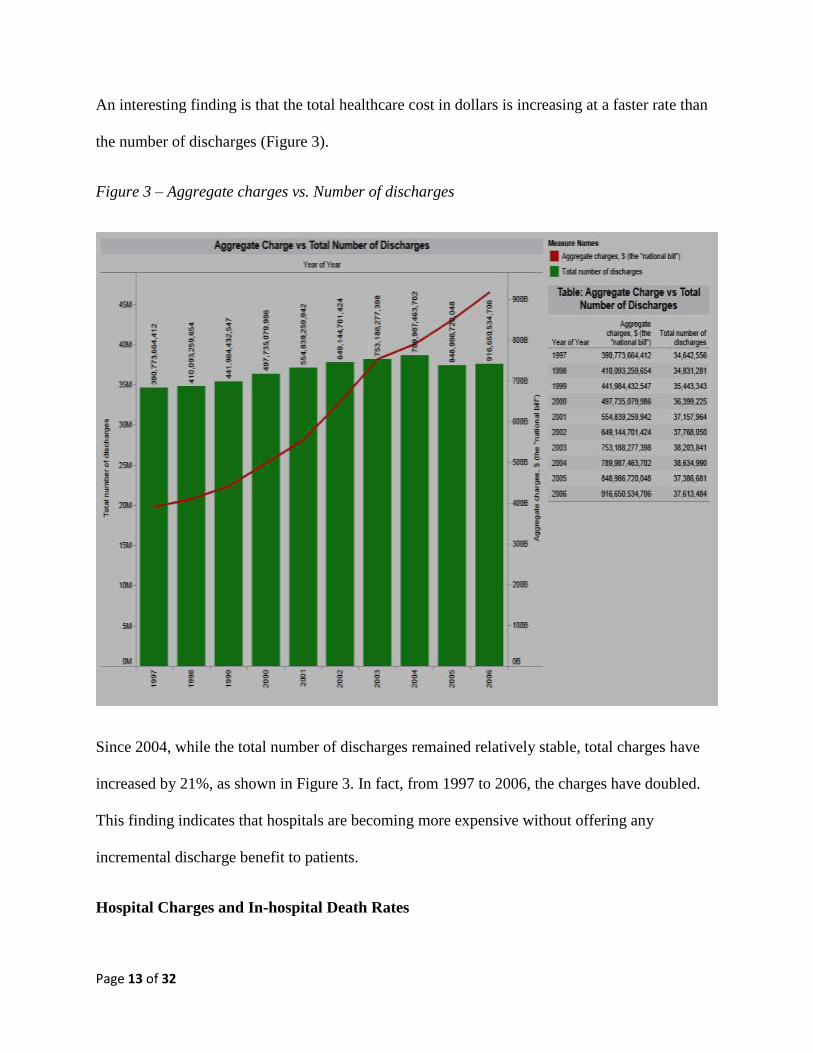
An interesting finding is that the total healthcare cost in dollars is increasing at a faster rate than
the number of discharges (Figure 3).
Figure 3 – Aggregate charges vs. Number of discharges
Since 2004, while the total number of discharges remained relatively stable, total charges have
increased by 21%, as shown in Figure 3. In fact, from 1997 to 2006, the charges have doubled.
This finding indicates that hospitals are becoming more expensive without offering any
incremental discharge benefit to patients.
Hospital Charges and In-hospital Death Rates
Page 14 of 32
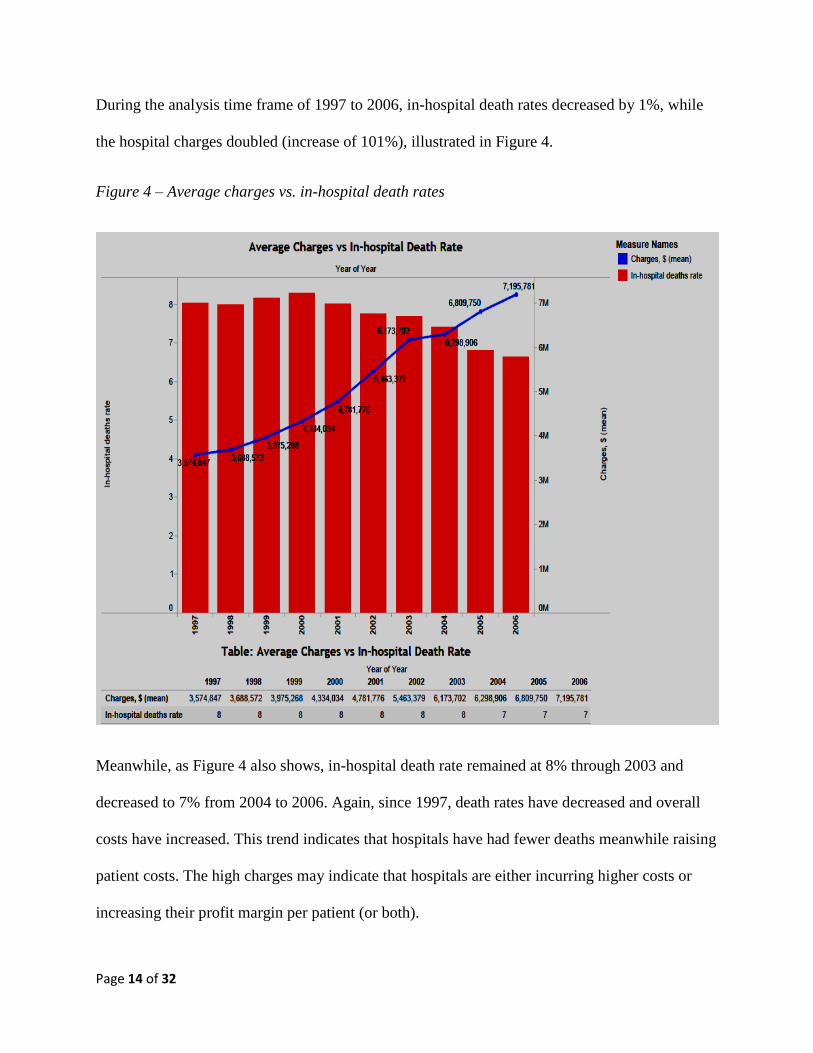
During the analysis time frame of 1997 to 2006, in-hospital death rates decreased by 1%, while
the hospital charges doubled (increase of 101%), illustrated in Figure 4.
Figure 4 – Average charges vs. in-hospital death rates
Meanwhile, as Figure 4 also shows, in-hospital death rate remained at 8% through 2003 and
decreased to 7% from 2004 to 2006. Again, since 1997, death rates have decreased and overall
costs have increased. This trend indicates that hospitals have had fewer deaths meanwhile raising
patient costs. The high charges may indicate that hospitals are either incurring higher costs or
increasing their profit margin per patient (or both).
Page 15 of 32
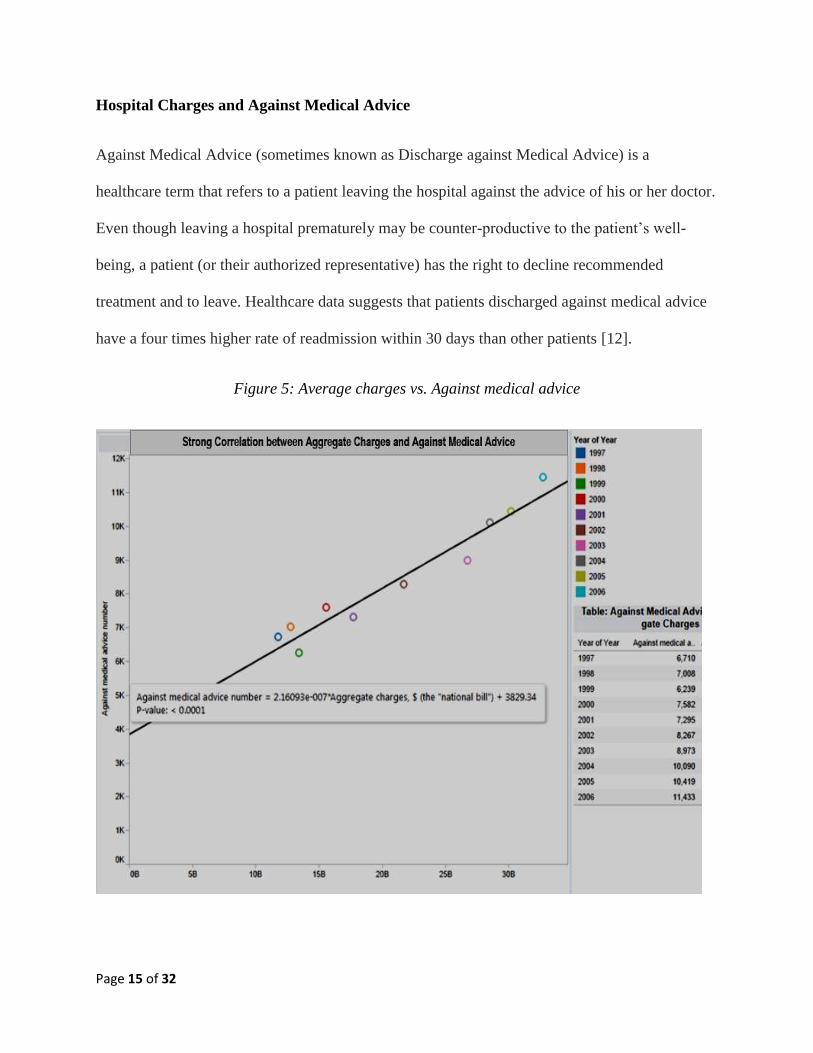
Hospital Charges and Against Medical Advice
Against Medical Advice (sometimes known as Discharge against Medical Advice) is a
healthcare term that refers to a patient leaving the hospital against the advice of his or her doctor.
Even though leaving a hospital prematurely may be counter-productive to the patient’s well-
being, a patient (or their authorized representative) has the right to decline recommended
treatment and to leave. Healthcare data suggests that patients discharged against medical advice
have a four times higher rate of readmission within 30 days than other patients [12].
Figure 5: Average charges vs. Against medical advice
Page 16 of 32
We found a statistically significant correlation between Aggregate Charges and Against Medical
Advice Number for Congestive Heart Failure. Figure 5 shows that the number of discharges
against medical advice for congestive heart failure almost doubled from 6710 to 11,433 between
the years 1997 to 2006. The aggregate charges also more than doubled between these years, from
$11,819,073,303 to $32,762,953,824. The positive correlation between the two indicators
suggests that if hospitals minimize the increase in charges, the rate of discharges may also
decrease. In the case of congestive heart failure, hospitals should try and lower the charges so
that more patients can avail themselves of treatment recommended by their doctors. It is no great
cause and effect leap of understanding from the fact of increased cost of a treatment to the
implication that patients may refuse treatment (and leave the hospital) against doctor’s advice
due to inability to meet those high charges.
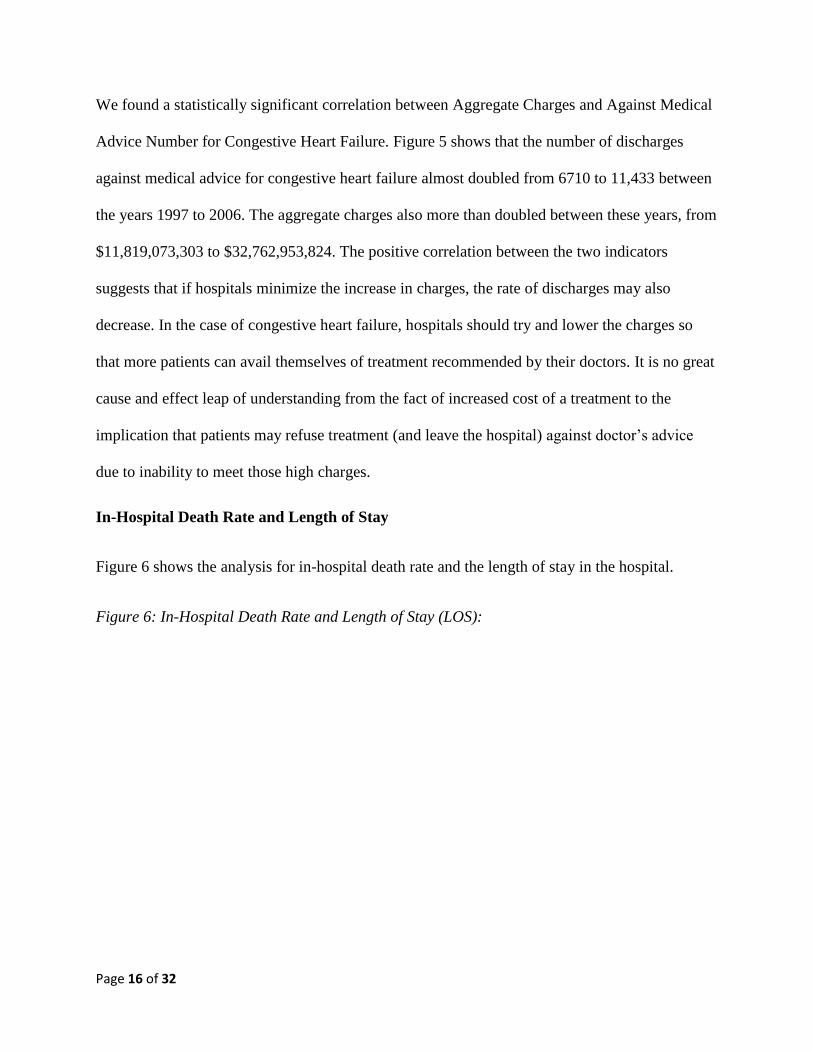
In-Hospital Death Rate and Length of Stay
Figure 6 shows the analysis for in-hospital death rate and the length of stay in the hospital.
Figure 6: In-Hospital Death Rate and Length of Stay (LOS):
Page 17 of 32
We found that there is a statistically significant positive correlation between the length of stay
and in-hospital death rate for liver cancer: the longer the stay, the higher the death rate. From
1997 to 2006, the death rate for liver cancer decreased by 15% from 0.178 to 0.15. However,
during this time frame, the length of stay also decreased by 7% from 7.379 to 6.851. Thus, even
though the death rate decreased over these years, it’s important to recognize that this decrease
can be attributed partly to the shortening in the length of stay at the hospital, which naturally
lowers the chances for in-hospital deaths. As far as mortality goes, hospitals should aim to
reduce the in-hospital death rate by improving the quality of service for diseases with a history of
high mortality. From our analysis, because liver cancer has a high in-hospital death rate, a better
strategy for hospitals would be to focus on improving the quality of treatment for cancer patients
and lower the in-hospital death rate. Obviously, cancer carries with it an inherent risk of in-
Page 18 of 32
hospital mortality. Hospitals should periodically evaluate patient portfolios and, when
appropriate, transfer patients to other hospices or maintenance facilities for continued care.
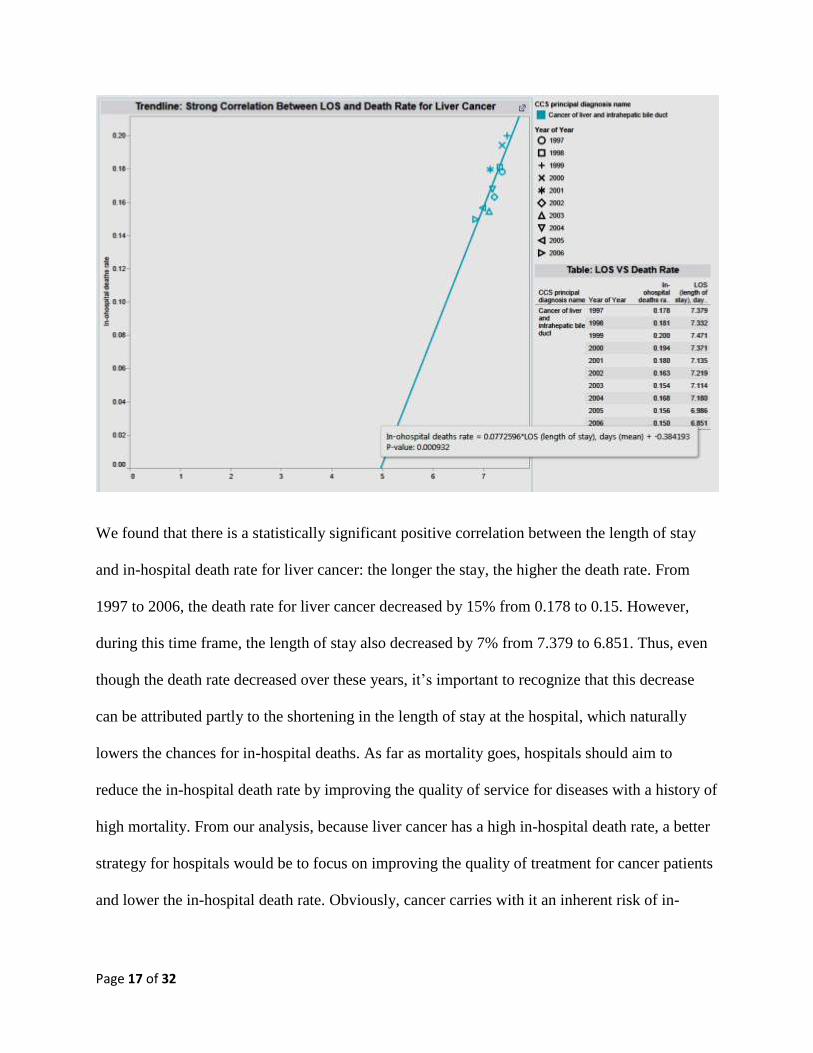
Hospital Charges across Diseases
Figure 7 shows the hospital charges across diseases.
Figure 7: Average charges across diseases
As shown in Figure 7, hospital charges vary across diseases. The mean charges are about
$150,000 while the range is from almost $0 to $900,000. Many factors may cause price
disparities across diseases, or even across regions. These include hospital location, patient’s
health, disease stage, and severity of illness during admission. Transparency in hospital pricing is
an alternative to keeping prices in check.
Page 19 of 32
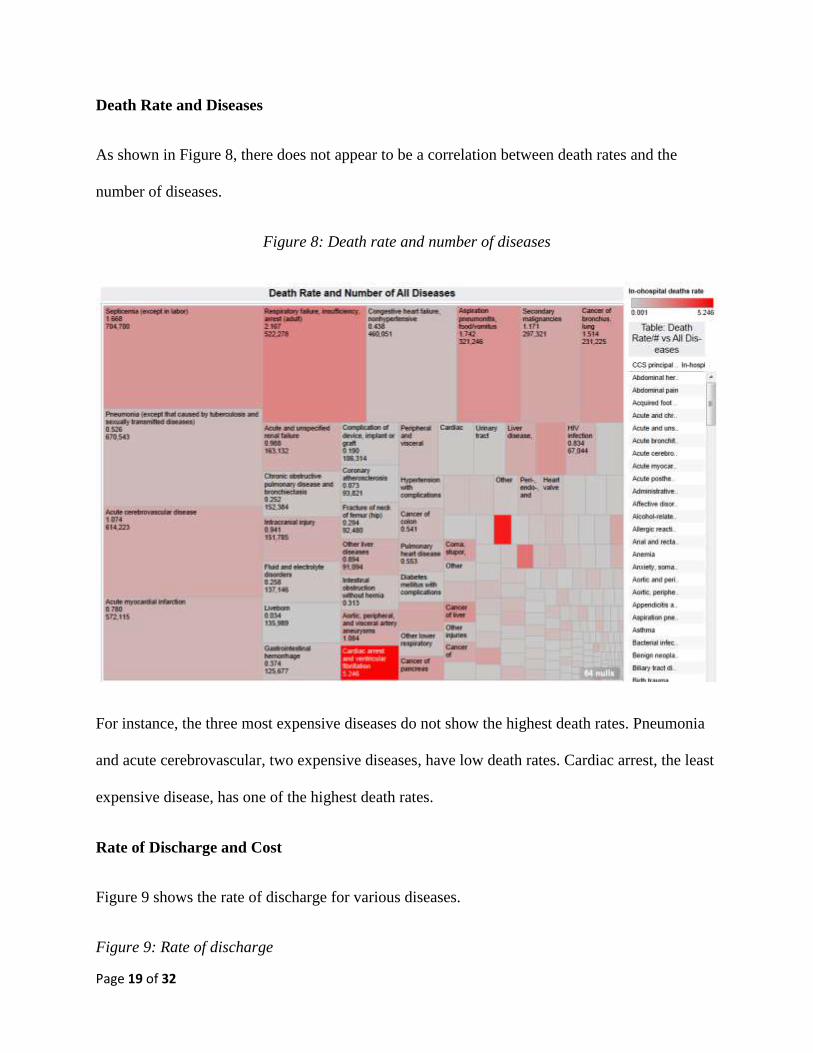
Death Rate and Diseases
As shown in Figure 8, there does not appear to be a correlation between death rates and the
number of diseases.
Figure 8: Death rate and number of diseases
For instance, the three most expensive diseases do not show the highest death rates. Pneumonia
and acute cerebrovascular, two expensive diseases, have low death rates. Cardiac arrest, the least
expensive disease, has one of the highest death rates.
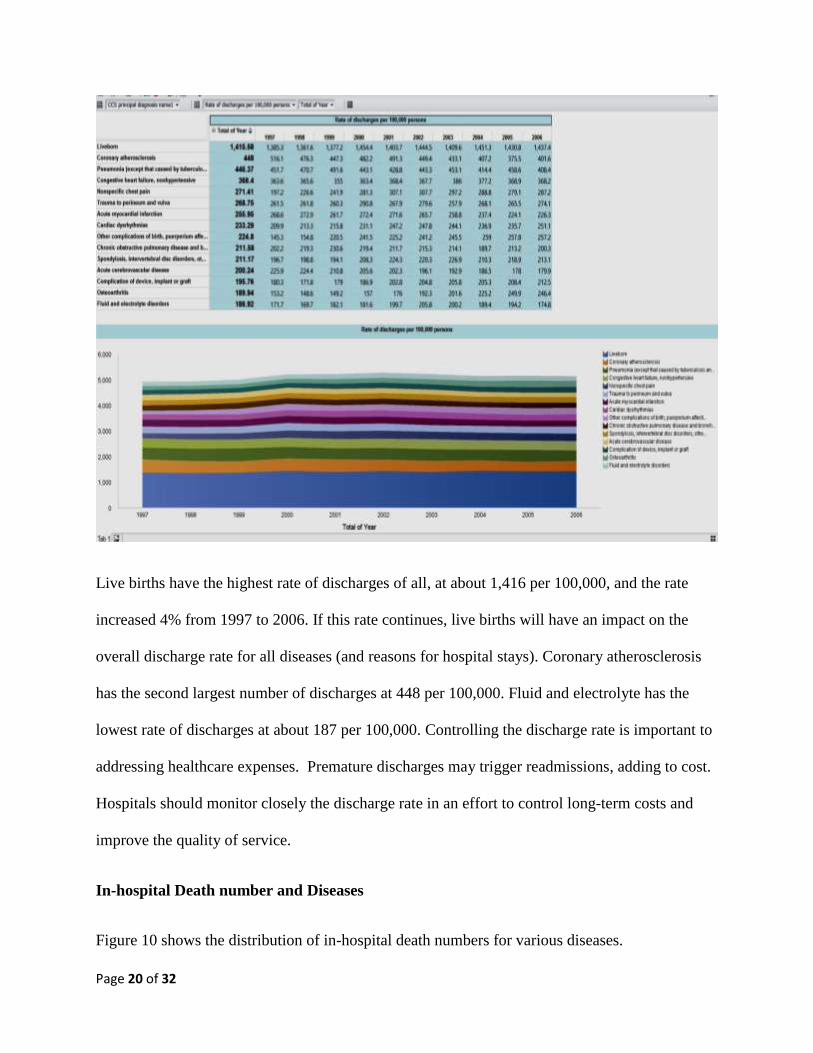
Rate of Discharge and Cost
Figure 9 shows the rate of discharge for various diseases.
Figure 9: Rate of discharge
Page 20 of 32
Live births have the highest rate of discharges of all, at about 1,416 per 100,000, and the rate
increased 4% from 1997 to 2006. If this rate continues, live births will have an impact on the
overall discharge rate for all diseases (and reasons for hospital stays). Coronary atherosclerosis
has the second largest number of discharges at 448 per 100,000. Fluid and electrolyte has the
lowest rate of discharges at about 187 per 100,000. Controlling the discharge rate is important to
addressing healthcare expenses. Premature discharges may trigger readmissions, adding to cost.
Hospitals should monitor closely the discharge rate in an effort to control long-term costs and
improve the quality of service.
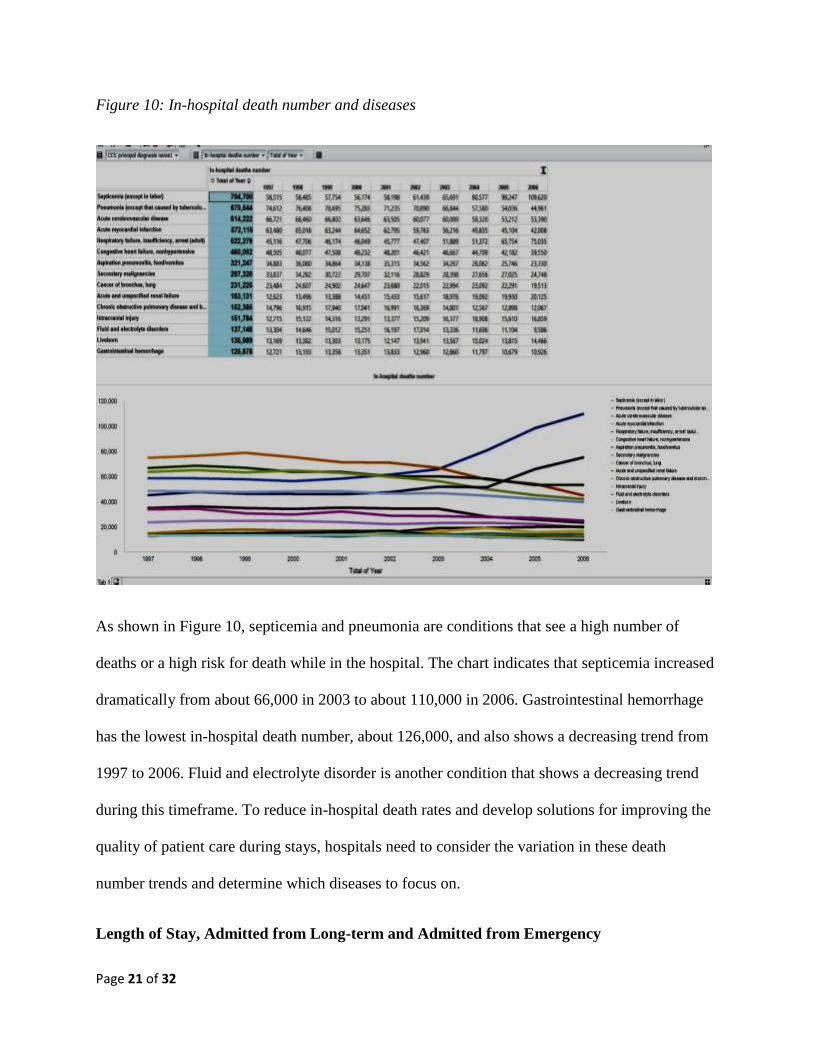
In-hospital Death number and Diseases
Figure 10 shows the distribution of in-hospital death numbers for various diseases.
Page 21 of 32
Figure 10: In-hospital death number and diseases
As shown in Figure 10, septicemia and pneumonia are conditions that see a high number of
deaths or a high risk for death while in the hospital. The chart indicates that septicemia increased
dramatically from about 66,000 in 2003 to about 110,000 in 2006. Gastrointestinal hemorrhage
has the lowest in-hospital death number, about 126,000, and also shows a decreasing trend from
1997 to 2006. Fluid and electrolyte disorder is another condition that shows a decreasing trend
during this timeframe. To reduce in-hospital death rates and develop solutions for improving the
quality of patient care during stays, hospitals need to consider the variation in these death
number trends and determine which diseases to focus on.
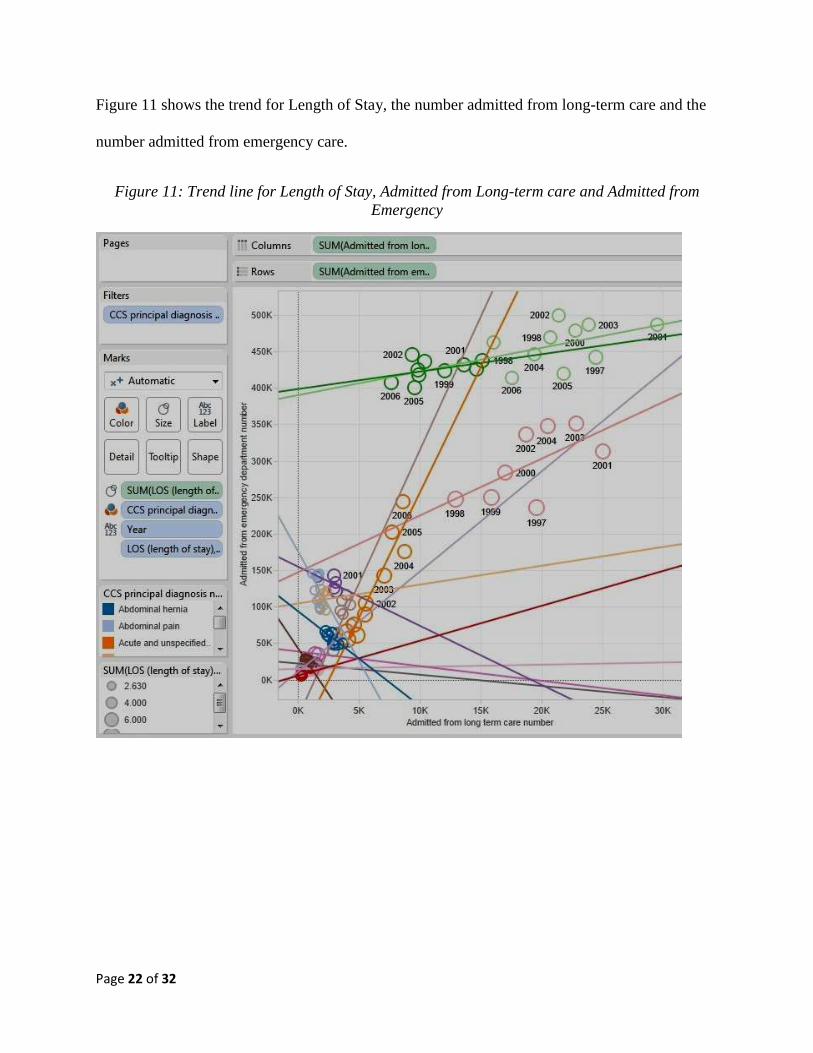
Length of Stay, Admitted from Long-term and Admitted from Emergency
Page 22 of 32
Figure 11 shows the trend for Length of Stay, the number admitted from long-term care and the
number admitted from emergency care.
Figure 11: Trend line for Length of Stay, Admitted from Long-term care and Admitted from
Emergency
Page 23 of 32
The analysis of the model for Length of Stay and the number from the two modes of admission -
long-term care and emergency care - was significant (R2 is close to 1; p-value<0.0001) (Figure
11). In Figure 11, the numbers admitted from long-term care are in columns, and the numbers
admitted from emergency care are in rows. CCS principal diagnosis is the filter. For acute
cerebro-vascular condition, the number admitted from long-term care and from emergency care
showed a significant relationship. For others, such as abdominal hernia, abdominal pain, acute
and unspecified renal failure, acute bronchitis, acute myocardial infraction, and affective
disorders, the length of stay and the number admitted from long-term care and emergency care
show a significant relationship. In general, the number admitted from long term care and
emergency care decreased considerably with the same length of stay for these diseases. This can
be attributed to the fact that hospitals have been able to efficiently control and/or treat these
particular diseases.
Discharge of Patients to Different Healthcare Providers
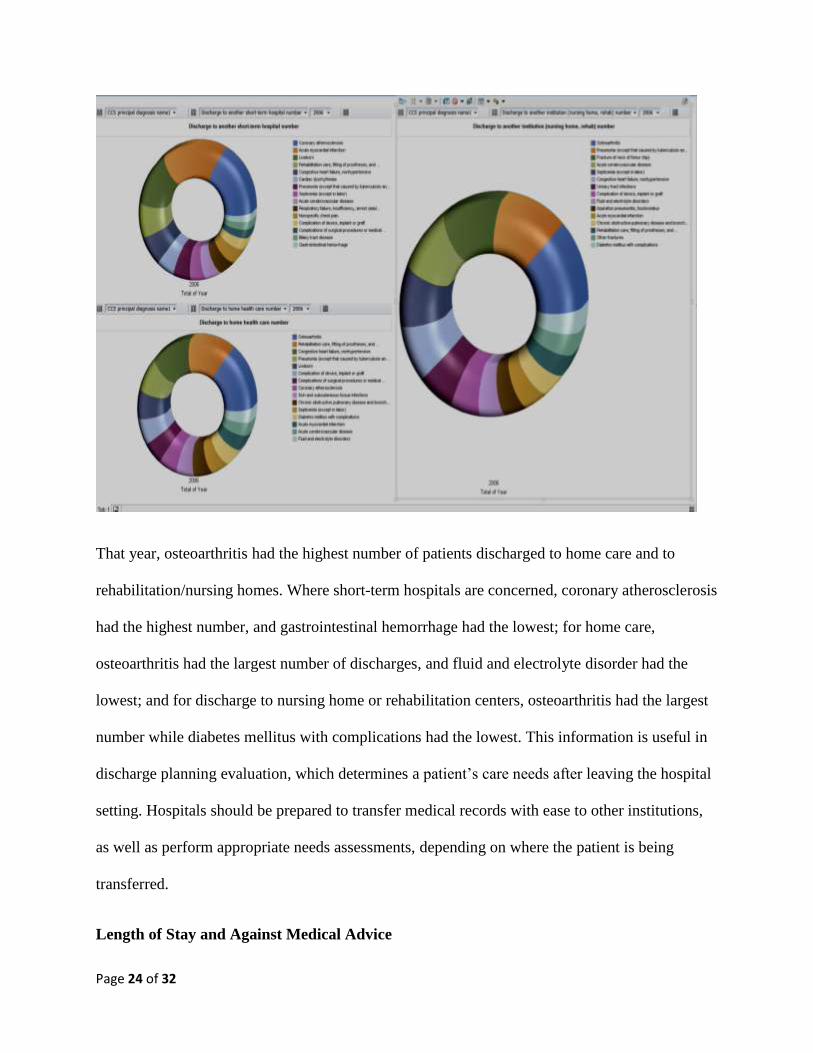
Figure 12 shows our analysis of the distribution of patient discharges to short-term hospitals,
rehabilitation centers and nursing homes (and other institutions), and home health care in the
year 2006.
Figure 12: Discharge of patients to other healthcare providers
Page 24 of 32
That year, osteoarthritis had the highest number of patients discharged to home care and to
rehabilitation/nursing homes. Where short-term hospitals are concerned, coronary atherosclerosis
had the highest number, and gastrointestinal hemorrhage had the lowest; for home care,
osteoarthritis had the largest number of discharges, and fluid and electrolyte disorder had the
lowest; and for discharge to nursing home or rehabilitation centers, osteoarthritis had the largest
number while diabetes mellitus with complications had the lowest. This information is useful in
discharge planning evaluation, which determines a patient’s care needs after leaving the hospital
setting. Hospitals should be prepared to transfer medical records with ease to other institutions,
as well as perform appropriate needs assessments, depending on where the patient is being
transferred.
Length of Stay and Against Medical Advice

Page 25 of 32
Figure 13 shows the distribution of the Length of Stay and Against Medical Advice.
Figure 13: Length of Stay and Against Medical Advice
The model for length of stay and the number discharged against medical advice has been
significant for the years 1997 to 2006 (R2 =.6; p<.05). As shown in Figure 13, the total numbers
for Length of Stay and those leaving Against Medical Advice have decreased over this 10-year
period, demonstrating considerable improvement in quality of hospital service.
Total Number of Discharges and In-hospital Deaths for Each Disease
Page 26 of 32
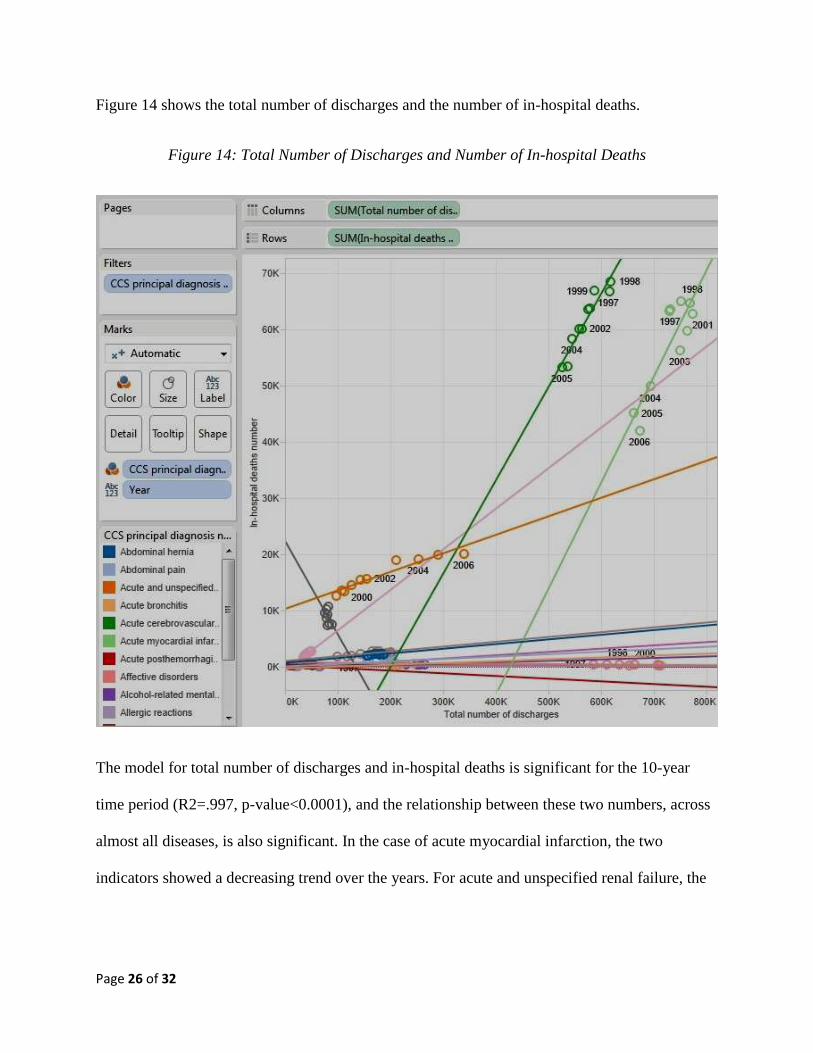
Figure 14 shows the total number of discharges and the number of in-hospital deaths.
Figure 14: Total Number of Discharges and Number of In-hospital Deaths
The model for total number of discharges and in-hospital deaths is significant for the 10-year
time period (R2=.997, p-value<0.0001), and the relationship between these two numbers, across
almost all diseases, is also significant. In the case of acute myocardial infarction, the two
indicators showed a decreasing trend over the years. For acute and unspecified renal failure, the
Page 27 of 32
two indicators showed an increasing trend. Hospitals should monitor these relationships for
various diseases and address how to improve negative trends.
Analysis of Hospital Charges and National Healthcare Cost
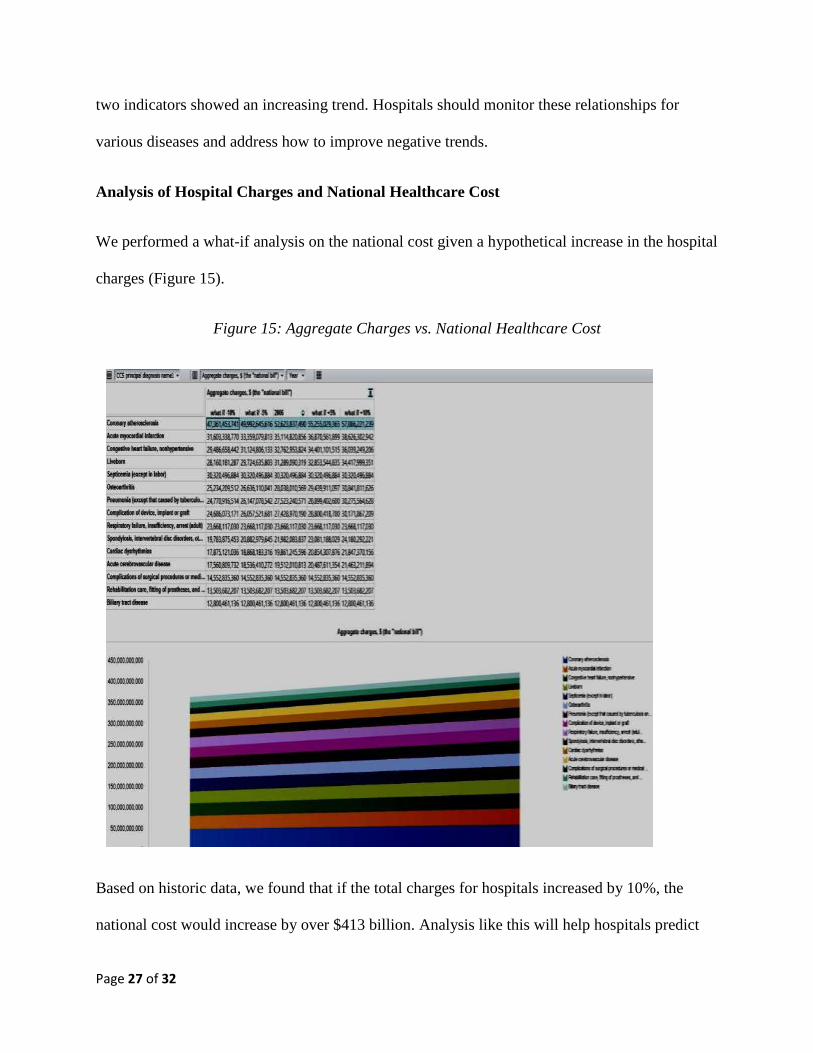
We performed a what-if analysis on the national cost given a hypothetical increase in the hospital
charges (Figure 15).
Figure 15: Aggregate Charges vs. National Healthcare Cost
Based on historic data, we found that if the total charges for hospitals increased by 10%, the
national cost would increase by over $413 billion. Analysis like this will help hospitals predict
Page 28 of 32
future healthcare costs for various scenarios and plan accordingly. It can also help identify which
specific diseases will have the highest impact on overall costs.
From our analyses, hospitals can assess the portfolio of charges for various diseases and
make decisions on optimizing overall costs. Our results, which show that during the period of
analysis, hospitals have grown more expensive without any incremental discharge benefits to the
patients, have major implications for public and national healthcare, and from them, we can
propose specific insights into disease management. Hospitals should attempt to reduce the
charges (for example, for congestive heart failure) to make treatment more affordable to patients.
Hospitals might also consider improving the level of service for diseases that have a history of
high death rate (such as liver cancer and septicemia), thereby lowering in-hospital deaths.
Hospitals can identify factors that positively impact the discharge rate and also improve the
quality of discharge. An ancillary implication is the identification of alternative institutions that
patients may be discharged to and the steps required to ensure a smooth and functional transition
for each patient in terms of the transfer of medical records and other resources for continuous
care. The positive correlation between length of stay and the number of discharges against
medical advice indicates that hospitals need to pay attention to determining the length of stay for
the portfolio of diseases for which patients are hospitalized. Between 1997 and 2011, the number
of discharges against medical advice has increased 41% in the U.S., and is dominated by 18-44
year olds [5]. This number should be addressed and lowered.
5. SCOPE & LIMITATIONS
Limitations to our study include the fact that it covered only a 10-year period. Future
longitudinal studies should cover greater time spans so as to reveal more trends and
Page 29 of 32
relationships. Second, while we investigated correlations and trends, we did not include causality
across the indicators, which future studies can do, thereby helping to identify and target factors
that cause increase in healthcare costs and/or decrease in healthcare performance. Third, we
utilized a set of indicators that were available in the database of the Agency for Healthcare
Research and Quality. There may be other indicators that better explain or offer more valuable
insight into the phenomenon of hospital performance. Lastly, we did not account for or remove
outliers from our data set, and there were some significant outliers relative to other data. In future
studies, the outliers could be removed to understand whether results would differ greatly.
6. CONTRIBUTIONS AND POLICY IMPLICATIONS
Despite limitations, our study contributes to healthcare in several ways. The analysis
provides an understanding of how hospitals performed over a recent 10-year period and whether
progress is being made in patient care. Trends over time for key performance indicators—such as
total number of discharges, length of stay, dollar hospital charges and in-hospital deaths,—help
assess whether progress has been made to improve treatment and/or death rate for certain
diseases. Certainly the healthcare system in the U.S. has progressed over the years, but it also has
become more expensive. In addition, quality of healthcare requires attention.
Hospital management and health professionals can use this analysis to understand how
certain measures have changed in 10 years and focus on improving the weak areas. In addition,
the healthcare insurance industry can leverage such analysis for their present and future cost
structures. Our results contribute to the arena of healthcare reform, so regulators and government
agencies may develop effective policies relevant to hospital management and healthcare
delivery.
Page 30 of 32
In terms of future research, there are many possibilities. As stated, future studies can
include a more extensive sample, range of indicators, and time span. The indicators from the
Agency for Healthcare Research and Quality may be used in conjunction with other healthcare
indicators to highlight dimensions that were not captured in this study. In addition, further
research can incorporate a global perspective by comparing hospitals in the U.S. to those in other
developed countries and discover similarities and differences among the measures. Such a
perspective will contribute to reducing global disparities and improving global health.
We also contribute to the methodology of analytics in healthcare. Analytics offers a
perfect method for mining and analyzing the immense amount of data available in the healthcare
sector. Our study compliments the literature of empirical work that deploys an analytic approach.
Finally, our study helps patients, the most important aspect of the healthcare equation.
Patients recognize that hospital performance varies across procedures. They can estimate a
specific hospital’s performance based on the charges, mortality rates, complications, and other
indicators. This is critical since healthcare costs are ultimately passed on to the patients in the
form of higher insurance premiums, deductibles, and co-payments. When patients are
empowered by information, they can make appropriate healthcare choices as to whether they opt
to receive treatment at a particular facility or choose not to avail themselves of any treatment
because of the high cost.
7. CONCLUSIONS
Hospitals in the U.S. have improved over the years in terms of reducing length of stay, reducing
number of in-hospital deaths, and increasing number of discharges from hospitals. However, the
Page 31 of 32
cost of healthcare has risen significantly during the same period. Escalating healthcare costs
impact the national cost, as we have shown in our analysis.
Meanwhile, the U.S has been rated very low for the quality of healthcare service.
Hospitals striving to make themselves marketable to managed care providers and to their patients
need to address the negatives, in particular finding ways to improve in the areas of patient care
and healthcare delivery. Findings from our study indicate that much is needed to achieve these
objectives. Health analytics or clinical analytics will help focus on target areas for improvement
and reduce the associated direct cost. We show how patients, healthcare providers and physicians
need to be better informed in terms of what’s working and what needs improvement.
REFERENCES
1. Hollingsworth B. Non-parametric and parametric applications measuring efficiency in health
care. Heath Care Manag Science 2003; 6: 203–218.
2. McGlynn EA, Asch SM, Adams J, Keesey J, Hicks J, DeCristofaro A, Kerr EA et al. The
quality of health care delivered to adults in the United States. N Engl J Med 2003; 348: 2635-
2645.
3. Gutierez C, Saloner R, Ranji U. U.S. Healthcare costs: Background Brief. Medicare Patient
Manag 2007: http://www.medicarepatientmanagement.com/issues/02-05/mpmSO07-
CostsKaiser-0827.pdf Accessed [9/12/14]
4. OECD. OECD Health Data 2013: How does the United States compare. OECD Publishing
2013: http://www.oecd.org/unitedstates/Briefing-Note-USA-2013.pdf Accessed [6/7/14]
5. Pfuntner A, Wier LM, Elixhauser A. Overview of Hospital Stays in the United States, 2011.
HCUP Statistical Brief #166. Agency for Healthc Res Qual, Rockville, MD, Nov 2013.
6. World Health Organization. World health statistics 2011. World Health Organization, Geneva
2011:
http://www.who.int/gho/publications/world_health_statistics/EN_WHS2011_Full.pdf?ua=1
Accessed [6/7/14]
7. Schoen C, Osborn R, Squires D, Doty MM. Access, affordability, and insurance complexity
are often worse in the United States compared to 10 other countries Nov 2013:
http://www.commonwealthfund.org/publications/in-the literature/2013/nov/access-affordability-
and-insurance Accessed [6/4/14]
Page 32 of 32
8. Kearney AT. A healthy dose of data analytics 2013:
http://www.atkearney.com/documents/10192/1044787/A+Healthy+Dose+
of+Data+Analytics.pdf/e3830106-cfb7-4d4b-886a- 60972770de8f Accessed [9/12/14]
9. American Hospital Quality Outcomes. Healthgrades report to the nation: Executive summary
2014: https://d2dcgio3q2u5fb.cloudfront.net/56/90/e07df9f64a5fb741ab59924a9e0d/2013-
american-hospital-quality-outcomes-2014-healthgrades-report-to-the-nation.pdf Accessed
[6/7/14]
10. Raghupathi V, Raghupathi W. Exploring the relationship between ICTs and public health at a
country level. Int J Healthc Inf Syst Inform 2013a; 8(3): 1-22.
11. Raghupathi W, Raghupathi V. An overview of health analytics. J Health Med Inform 2013b;
4(3): http://dx.doi.org/10.4172/2157-7420.1000132
12. Fleeter TB. When a patient leaves against medical advice. Am Acad Orthop Surg Now 2012:
http://www.aaos.org/news/aaosnow/nov12/managing5.asp Accessed [6/22/14]