benchmarking in total quality management
DESCRIPTION
TQM managementTRANSCRIPT
BenchmarkingAn International Journal
Benchmarking in total qualitymanagementGuest Editors: Professor Fiorenzo Franceschiniand Dr Maurizio Galetto
Volume 13 Number 4 2006
ISSN 1463-5771
www.emeraldinsight.com
bij cover (i).qxd 04/07/2006 10:22 Page 1

Access this journal online __________________________ 391
Editorial advisory board ___________________________ 392
Guest editorial ____________________________________________ 393
A benchmarking implementation framework forautomotive manufacturing SMEsBaba Md Deros, Sha’ri Mohd Yusof and Azhari Md Salleh _____________ 396
The use of multi-attribute utility theory to determinethe overall best-in-class performer in a benchmarkingstudyTerry R. Collins, Manuel D. Rossetti, Heather L. Nachtmann andJames R. Oldham _______________________________________________ 431
Role of human factors in TQM: a graph theoreticapproachSandeep Grover, V.P. Agrawal and I.A. Khan ________________________ 447
Benchmarking:An International Journal
Benchmarking in total quality management
Guest EditorsProfessor Fiorenzo Franceschini and Dr Maurizio Galetto
ISSN 1463-5771
Volume 13Number 42006
CONTENTS
The current and past volumes of this journal are available at:
www.emeraldinsight.com/1463-5771.htmYou can also search more than 100 additional Emerald journals inEmerald Fulltext (www.emeraldinsight.com/ft) and EmeraldManagement Xtra (www.emeraldinsight.com/emx)
See page following contents for full details of what your access includes.
Access this journal electronically
Tourism services quality (TourServQual) in Egypt:the viewpoints of external and internal customersMohammed I. Eraqi _____________________________________________ 469
An empirically validated quality managementmeasurement instrumentPrakash J. Singh and Alan Smith __________________________________ 493
A worldwide analysis of ISO 9000 standard diffusion:considerations and future developmentF. Franceschini, M. Galetto and P. Cecconi ___________________________ 523
Book review_______________________________________ 542
CONTENTScontinued

As a subscriber to this journal, you can benefit from instant,electronic access to this title via Emerald Fulltext or EmeraldManagement Xtra. Your access includes a variety of features thatincrease the value of your journal subscription.
How to access this journal electronicallyTo benefit from electronic access to this journal, please [email protected] A set of login details will then beprovided to you. Should you wish to access via IP, pleaseprovide these details in your e-mail. Once registration iscompleted, your institution will have instant access to all articlesthrough the journal’s Table of Contents page atwww.emeraldinsight.com/1463-5771.htm More informationabout the journal is also available at www.emeraldinsight.com/bij.htm
Our liberal institution-wide licence allows everyone within yourinstitution to access your journal electronically, making yoursubscription more cost-effective. Our web site has beendesigned to provide you with a comprehensive, simple systemthat needs only minimum administration. Access is available viaIP authentication or username and password.
Key features of Emerald electronic journals
Automatic permission to make up to 25 copies of individualarticlesThis facility can be used for training purposes, course notes,seminars etc. This only applies to articles of which Emerald ownscopyright. For further details visit www.emeraldinsight.com/copyright
Online publishing and archivingAs well as current volumes of the journal, you can also gainaccess to past volumes on the internet via Emerald Fulltext orEmerald Management Xtra. You can browse or search thesedatabases for relevant articles.
Key readingsThis feature provides abstracts of related articles chosen by thejournal editor, selected to provide readers with current awarenessof interesting articles from other publications in the field.
Non-article contentMaterial in our journals such as product information, industrytrends, company news, conferences, etc. is available online andcan be accessed by users.
Reference linkingDirect links from the journal article references to abstracts of themost influential articles cited. Where possible, this link is to thefull text of the article.
E-mail an articleAllows users to e-mail links to relevant and interesting articles toanother computer for later use, reference or printing purposes.
Structured abstractsEmerald structured abstracts provide consistent, clear andinformative summaries of the content of the articles, allowingfaster evaluation of papers.
Additional complimentary services availableYour access includes a variety of features that add to thefunctionality and value of your journal subscription:
E-mail alert servicesThese services allow you to be kept up to date with the latestadditions to the journal via e-mail, as soon as new materialenters the database. Further information about the servicesavailable can be found at www.emeraldinsight.com/alerts
ConnectionsAn online meeting place for the research community whereresearchers present their own work and interests and seek otherresearchers for future projects. Register yourself or search ourdatabase of researchers at www.emeraldinsight.com/connections
Emerald online training servicesYou can also access this journal online. Visitwww.emeraldinsight.com/training and take an Emerald onlinetour to help you get the most from your subscription.
Choice of accessElectronic access to this journal is available via a number ofchannels. Our web site www.emeraldinsight.com is therecommended means of electronic access, as it provides fullysearchable and value added access to the complete content ofthe journal. However, you can also access and search the articlecontent of this journal through the following journal deliveryservices:
EBSCOHost Electronic Journals Serviceejournals.ebsco.com
Informatics J-Gatewww.j-gate.informindia.co.in
Ingentawww.ingenta.com
Minerva Electronic Online Serviceswww.minerva.at
OCLC FirstSearchwww.oclc.org/firstsearch
SilverLinkerwww.ovid.com
SwetsWisewww.swetswise.com
Emerald Customer SupportFor customer support and technical help contact:E-mail [email protected] www.emeraldinsight.com/customercharterTel +44 (0) 1274 785278Fax +44 (0) 1274 785204
www.emeraldinsight.com/bij.htm

BIJ13,4
392
Benchmarking: An InternationalJournalVol. 13 No. 4, 2006p. 392#Emerald Group Publishing Limited1463-5771
EDITORIAL ADVISORY BOARD
David BennettAston University, UK
Walter W.C. ChungThe Hong Kong Polytechnic University,Hong Kong
Sylvia CodlingThe Benchmarking Centre Ltd andOak Business Developers plc, UK
John F. DalrympleRMIT Business School, Melbourne, Australia
Tom DolanPresident, The Benchmarking Exchange,USA Chairman, Benchmarking Committee,ASQC, USA
James R. EvansUniversity of Cincinnati, USA
Barbara FlynnWake Forest University, USA
Shuichi FukudaDirector, Global Learning Center, TokyoMetropolitan Institute of Technology, Japan
H. Peter HolzerUniversity of Economics, Vienna, Austria
Zahir IraniBrunel University, Middlesex, UK
Gopal KanjiSheffield Hallam University, UK
Archie Lockamy IIISamford University, USA
Kambiz MaaniUniversity of Auckland, New Zealand
Professor Rodney McAdamUniversity of Ulster, School of Business,Organisation and Management, Belfast, UK
Christian MaduPace University, USA
Jaideep MotwaniGrand Valley State University, USA
Richard SchonbergerSchonberger & Associates, USA
Dean M. SchroederValparaiso University, USA
Roger G. SchroederUniversity of Minnesota, USA
Joel D. WisnerUniversity of Nevada at Las Vegas, USA
Dr Yahaya Y. YusufBusiness School, University of Hull, UK

Guest editorial
Introduction to the special issue on benchmarking in total qualitymanagementA world that is changing faster and faster forces companies to reinvent themselves andtheir capabilities. In this competitive environment total quality management (TQM)tools support organizations in managing strategic quality and decision processes. Thisis an era of break-through management, which demands creativity and new thinking.The organization competitive advantage is based on the ability to generate andsupport new ideas quickly and that hinges on the capability to create. Benchmarkingcan become a tool to sustain this new TQM paradigm, providing a means to increasean organization’s competitive performance by a comparison with the best-in-class.
The challenge is driving the change and not being driven. That is whybenchmarking in TQM can become the helm to drive the change. Changes can bevoluntary or not; may be big or small, but in all cases changes ensure that tomorrowwill be different than today. It is not necessary to agree with change or not, as it willhappen anyway. The question is do you want to be in the driver’s seat, or to bepassengers? . . . Can benchmarking methodologies be the reply?
This special issue of Benchmarking: An International Journal explores some of thelatest research on the frontiers of this field. It investigates how benchmarking canprovide approaches, methods and techniques for the next TQM challenges we aregoing to face this century. The papers in this issue were selected based on their newcontributions to theory and/or methodology or significant substantive findings, as wellas their fit with the organization of the issue. Taken together, these articles provide avaluable collective snapshot of interesting benchmarking progress in recent research.
The announcement for this special was framed in very broad terms. Both theoreticaland empirical papers, as well as rigorous case studies, were invited. Cross-functionalstudies as well as best practices experiences were particularly encouraged. Suggestedtopics for the special issue included:
. quality, innovation and benchmarking in manufacturing and serviceorganizations;
. theory building and new paradigms in TQM;
. advanced methods for benchmarking in TQM;
. measurement issues in benchmarking quality management;
. benchmarking analysis and strategic quality management; and
. surveying on TQM and benchmarking.
Papers that were submitted for the special issue were subjected to a normaldouble-blind review process to assess the compatibility of the topic addressed by thepaper with the theme and focus of the special issue. Papers that did not pass the screenwere, at the author’s discretion, forwarded to the editor of BIJ to be included in thenormal review process for the journal. Of ten papers submitted, six passed the reviewprocess.
Guest editorial
393
Benchmarking: An InternationalJournal
Vol. 13 No. 4, 2006pp. 393-395
q Emerald Group Publishing Limited1463-5771

The first paper is “A benchmarking implementation framework for automotivemanufacturing SMEs” by Baba M. Deros, Sha’ri M. Yusof and Azhari M. Salleh.The authors analyze how intense market competition and increasing businesscompetitiveness have led many small and medium-sized enterprises (SMEs) to practicebenchmarking. The paper provides a conceptual framework for benchmarkingimplementation in SMEs, taking into consideration the SMEs’ strengths, weaknessesand characteristics. The conceptual framework was based on selection of theappropriate key performance measures and benchmarking techniques.
The second paper by Terry R. Collins, Manuel D. Rossetti, Heather L. Nachtmann,James R. Oldham is “The use of multi-attribute utility theory to determine the overallbest-in-class performer in a benchmarking study.” The authors investigate theapplication of multi-attribute utility theory to aid in the decision-making process whenperforming a benchmarking gap analysis. The analysis was performed to determineindustry best practices for six main critical warehouse metrics of picking andinventory accuracy, storage speed, inventory and picking tolerance, and order cycletime, within a public sector warehouse.
The third paper is “Role of human factors in TQM – a graph theoretic approach” byS. Grover, V.P. Agrawal, I.A. Khan. The authors focus their attention on human factorsin TQM organizations. The paper proposes a preliminary mathematical model of thesefactors and their interactions using a graph theoretic approach. The methodologysupports the impact evaluation of these factors, providing a tool for a self-analysis andcomparison of organizations.
The fourth paper is “Tourism services quality (TourServQual) in Egypt: theviewpoints of external and internal customers” by Mohammed I. Eraqi. This paper isapplication oriented, and in it the author presents an analysis of tourism service qualityin Egypt. He analyzes the results of two surveys with the aim of identifying the level ofsatisfaction of internal customers (employers) and external customers (tourists).The paper addresses issues relating to the creative and innovative organizationbehavior in TQM practices.
The fifth paper by Prakash J. Singh and Alan Smith is “An empirically validatedquality management measurement instrument.” This paper proposes an assembledmeasurement instrument to overcome some quality measurement tool shortcomings.The paper focuses issues relating to quality measurement instruments benchmarking.The authors emphasize that the area of quality management is currently characterizedby three competing approaches: standards-based; prize-criteria; and, elemental. Thesethree approaches are analyzed to identify sets of key constructs and associated items.
The final paper “A worldwide analysis of ISO 9000 standard diffusion:considerations and future development” is from Fiorenzo Franceschini, MaurizioGaletto and Paolo Cecconi. This paper presents a deep investigation of ISO 9000worldwide diffusion. In it the authors benchmarks ISO 9000 standards with TQMstrategies. The paper addresses issues relating to possible development directions forquality system certification.
Preparation of this issue would be impossible without the help and support of ourcolleagues. They have done considerable work deserving a special acknowledgement.We would like to thank the authors of all submitted papers and the referees who foundtime in their busy schedules to review the contributions.
BIJ13,4
394
It is our hope that the six papers in this issue will stimulate new, better, moreinnovative and relevant benchmarking strategies, measurement and modeling. Thefields of benchmarking and TQM can greatly benefit from an infusion of new ideas,methods and researches. Increased attention to these areas by management scientistsin academic institutions, industry and services will help their practice and establish itas a valued core cross-disciplinary and global management discipline.
Fiorenzo Franceschini and Maurizio GalettoGuest Editors
Guest editorial
395

A benchmarking implementationframework for automotive
manufacturing SMEsBaba Md Deros
Faculty of Engineering, Universiti Kebangsaan Malaysia, Malaysia
Sha’ri Mohd YusofFacultyofMechanicalEngineering,UniversitiTeknologiMalaysia,Malaysia, and
Azhari Md SallehAcademic Director, Akademi Tentera Malaysia, Malaysia
Abstract
Purpose – The purpose of this paper is to present a conceptual framework for benchmarkingimplementation in small medium-sized enterprises (SMEs) taking into consideration their characteristics.
Design/methodology/approach – The paper begins with the review on the definition of SME anda comparison of the characteristics of SMEs and large organizations. It presents the need for aframework and its relationship with benchmarking and TQM. This is followed by reviewing thebenchmarking implementation frameworks proposed by researchers and discusses these frameworksbased on their strengths and weaknesses from SMEs perspective. The frameworks were categorisedinto two broad types based on the different writer’s background and the approach on how they viewthe benchmarking implementation process.
Findings – The paper suggested a conceptual framework for benchmarking implementation dedicatedto the automotive manufacturing SMEs. This framework guides them through from the start to end of thebenchmarking process. The framework was validated at six pilot case study companies, which gave usefulcomments and suggestions regarding the usefulness and applicability within the SMEs context.
Research limitations/implications – The conceptual framework is still in the development stageand research is undertaken to include the pilot study companies suggestions and comments into thefinal version of the framework.
Practical implications – This guidance and framework provides a useful guide for companies toadopt and adapt before embarking on their benchmarking journey.
Originality/value – This paper fulfils an identified knowledge gap and offers practical help to SMEsstarting out a benchmarking implementation effort.
Keywords Benchmarking, Competitive strategy, Small to medium-sized enterprises,Automotive industry, Malaysia
Paper type Research paper
IntroductionIn most countries, small and medium enterprises (SMEs) dominate the industrial andcommercial infrastructure. SMEs play a very important role in national economies,
The current issue and full text archive of this journal is available at
www.emeraldinsight.com/1463-5771.htm
The authors would like to thank the Ministry of Science Technology and Environment (MOSTE)and Universiti Teknologi Malaysia for their support in providing the research grant for theproject entitle “Development of an Integrated Quality Engineering Approach for MalaysianAutomotive Industry (IRPA 03-02-06-0060-EA254)”.
BIJ13,4
396
Benchmarking: An InternationalJournalVol. 13 No. 4, 2006pp. 396-430q Emerald Group Publishing Limited1463-5771DOI 10.1108/14635770610676272
providing job opportunities, act as supplier of goods and services to largeorganizations, and any lack of product quality could adversely affect thecompetitive ability of the larger organizations (Rose, 2000; Greenan et al., 1997;Ghobadian and Gallear, 1996; Parkin and Parkin, 1996; Storey, 1994). In manufacturingsector, SMEs act as specialist suppliers of components, parts, and sub-assemblies tolarger companies because the items can be produced at a cheaper price than the largecompanies could achieve in-house. For example, in Australia more than 50 per cent ofemployment and 90 per cent of businesses are represented by SMEs (Husband andMandal, 1999); 92 per cent of all enterprises in Thailand in 1998 comprised of SMEsand 28.9 per cent of them belongs to the manufacturing sector (Sevilla andSoonthornthada, 2000); 75 per cent of manufacturing employment in Japan is in SMEs(Ghobadian and Gallear, 1996); more than 90 per cent of manufacturing companies inMalaysia are classified as SMEs (Shan, 2000; Malaysia, 1998; MITI, 1998; Kim and Suh,1991). In the year 2000, the Malaysian SMEs contributed 82.6 per cent to the regionalincome generation through external sales/import substitution; 40 per cent towardsgross domestic production (GDP) and represent 31.2 per cent of the total workforce inthe manufacturing sector (Hashim and Wafa, 2002; SMIDEC, 2002). In other words, ifeconomies are to prosper, then it is essential that SMEs become competitive to meet theinternational and globalisation challenges and able to produce high quality outputs.
In a competitive market place, quality improvement tools and practices (such asbenchmarking) can help align organization’s key business processes (such as delivery,productivity, responsiveness to customer needs, etc.) to achieve higher customerssatisfaction, business competitiveness and bottom-line results (Cassell et al., 2001; Chinet al., 2001; Brah et al., 2000; Drew, 1997; Elnathan and Kim, 1995). However,benchmarking in SMEs has not received sufficient attention. For example, in a studyreported by Monkhouse (1995), about 59 per cent of SMEs claimed to havebenchmarking, nearly half of them (45 per cent) benchmarked their financialperformance, a quarter (25 per cent) have conducted in both financial and processbenchmarking, and about a third (30 per cent) performed internal benchmarking. Thislow percentage may be due to the fact that benchmarking involves a lot of processesand activities, which are complex. Without an appropriate and systematic framework,it might be difficult to achieve the desired outcomes. Therefore, the authors believe thata systematic framework needs to be developed first before embarking onbenchmarking to assists and ensure its successful implementation and adoption inany organisation. In this paper, the authors briefly presents the pertinent pointsconcerning benchmarking frameworks so as to provide an overall perspective andunderstanding of the main differences and similarities between all the frameworksreviewed. Once that is achieved it can guide the way towards further development of abenchmarking framework, which hopefully be suitable and useful for SMEs.
Definition for SMEsAt present, there seems to be no consensus on the definition for SMEs. Variations existbetween countries and industries. SMEs are defined by a number of factors and criteriasuch as location, size, age, structure, organization, number of employees, sales volume orworth of assets, ownership through innovation and technology (Rahman, 2001; Sevillaand Soonthornthada, 2000; Husband and Mandal, 1999). Table I shows the definitions ofmanufacturing SMEs in selected economies. Although, the definition and description
Benchmarkingimplementation
framework
397

Cou
ntr
yS
ecto
rN
um
ber
ofem
plo
yee
sO
ther
mea
sure
s
Au
stra
lia
Man
ufa
ctu
rin
g,
100
Can
ada
Man
ufa
ctu
rin
g,
500
Peo
ple
’sR
epu
bli
cof
Ch
ina
Var
ies
wit
hin
du
stry
Usu
ally
,10
0In
don
esia
,10
0Ja
pan
Man
ufa
ctu
rin
g,
300
¥10
0m
illi
onas
sets
Kor
eaM
anu
fact
uri
ng
,30
0M
alay
sia
Man
ufa
ctu
rin
g,
150
Sal
esv
alu
e,
RM
25m
illi
onP
hil
ipp
ines
,20
0P
40m
illi
onas
set
Sin
gap
ore
Man
ufa
ctu
rin
g,
S$1
2m
illi
onfi
xed
asse
tsT
aiw
anM
anu
fact
uri
ng
,N
T$4
0m
illi
onp
aid
-up
cap
ital
and,
NT
$120
mil
lion
ofto
tal
asse
tsU
nit
edS
tate
sof
Am
eric
a,
500
Sources:
An
thon
y(1
983)
,H
all
(199
5),
SM
IDE
C(1
998)
,S
MI
Bu
sin
ess
Dir
ecto
ry(2
002)
and
Sev
illa
and
Soo
nth
orn
thad
a(2
000)
Table I.Summaries of maindefinitions for SMES inselected economies
BIJ13,4
398

varies, however, in practice, most researchers and authors used both the quantitativeand qualitative methods to define a SME. In terms of the quantitative criteria, thenumber of employees is the most frequently used yardstick to determine the size of aSME in several countries (Hashim and Wafa, 2002; Yusof, 2000; Anthony, 1983).
The authors have used a similar set of criteria as adopted by previous researchers inbenchmarking to define the SMEs and considers SMEs as those firms, which employless than 250 employees (McAdam and Kelly, 2002; Jeffcoate et al., 2002; Hinton et al.,2000). The authors have adopted this definition for the SME so as to provide fair andeffective comparisons between this study and past studies on benchmarking in SMEs.In this study, monetary value based definitions, such as the amount of turnover andpaid-up capital were not used because monetary value varies wildly from one countryto another.
Comparing the characteristics of SMEs and large organizationsWelsh and White (1981) suggested that “a small company is not a little large business”because there are many differences between SMEs and large business organizations interms of structure, policy making procedures and utilization of resources to the extentthat the application of large business concepts directly to SMEs may not beappropriate. In the USA, as highlighted by Baumack (1988), many large corporations inthe Fortune 500 list actually started by small business entrepreneurs with very limitedcapital. Examples include Ford Motors, Hewlett-Packard and Microsoft to name a few.The differences of SMEs can be divided into structure, systems and procedures, cultureand behaviour, human resources, and also market and customers. Table II gives asummary of the SMEs characteristics, its strengths and weaknesses versus largeorganizations.
SMEs are in a more advantageous position in terms of structure because it facilitatesfaster communication line, quick decision-making process, faster implementation, shortdecision-making chain, higher contribution as a source of ideas in their operations andinnovation, unified culture and very few interest groups (Kraipornsak, 2002). A majorityof SMEs have simple systems and procedures, which allows flexibility, immediatefeedback, better understanding and quicker response to customer needs than largerorganizations (Kraipornsak, 2002). This is further enhanced by the SMEs corporatemind-set, which is conducive for new change initiatives, provided that theowner/management has the commitment to, and leadership of the change process,together with a sound knowledge of it. In addition, SMEs employees are given theauthority and responsibility in their own work areas that can create cohesion andenhance common purposes amongst the workforce to ensure that a job is well done.Innovative environment, early employees and union involvement in change initiativessuch as benchmarking will provide higher job satisfaction among its workers, whosupport the improvement culture and ensure its success compared to large businessorganizations. SMEs have fewer employees and everybody seems to know almosteveryone, thus promoting a better relationship between employees.
On the other hand, SMEs have a number major weaknesses, which can result in adisadvantageous situation such as majority of SMEs do not have adequate financialresources and lack of access to commercial lending (i.e. difficult to obtain loans)(Hashim and Wafa, 2002; Kraipornsak, 2002). As a result, SMEs do not have adequatebudget for staff training, which can stifle improvement efforts. In terms of human
Benchmarkingimplementation
framework
399
SM
Es
char
acte
rist
ics
Str
eng
ths
Wea
kn
esse
s
Str
uct
ure
Fla
tw
ith
ver
yfe
wla
yer
sof
man
agem
ent,
top
man
agem
ent
hig
hly
vis
ible
and
clos
eto
the
poi
nt
ofd
eliv
ery
Les
sd
eleg
atio
n.
Div
isio
nof
acti
vit
ies
lim
ited
and
un
clea
rL
owd
egre
eof
spec
iali
sati
onF
lex
ible
stru
ctu
rean
din
form
atio
nfl
ows.
Str
ateg
icp
roce
ssin
crem
enta
lan
dh
euri
stic
Fas
ter
com
mu
nic
atio
nli
ne,
qu
ick
dec
isio
n-m
akin
gp
roce
ss,
fast
erim
ple
men
tati
onS
hor
td
ecis
ion
-mak
ing
chai
nH
igh
inci
den
ceof
inn
ovat
iven
ess
and
un
ified
cult
ure
Ver
yfe
win
tere
stg
rou
ps
Bre
edin
gg
rou
nd
for
new
bu
sin
ess
ven
ture
san
den
trep
ren
eurs
Low
spec
iali
sati
onm
ayre
sult
inla
ckof
exp
erti
sein
chan
ge
init
iati
ves
Nee
dou
tsid
eas
sist
ance
Ow
ner
con
trol
sev
ery
thin
gan
dla
cks
del
egat
ion
can
stifl
eg
row
thL
ack
ofca
pit
alan
dcr
edit
faci
liti
es
Sys
tem
sand
proc
edure
sA
ctiv
itie
san
dop
erat
ion
sn
otg
over
ned
by
form
alru
les
and
pro
ced
ure
sL
owd
egre
eof
stan
dar
dis
atio
nan
dfo
rmal
isat
ion
Peo
ple
-dom
inat
edS
imp
lep
lan
nin
gan
dco
ntr
olsy
stem
Inci
den
ces
of“g
ut
feel
ing
”d
ecis
ion
sar
em
ore
pre
val
ent
Info
rmal
eval
uat
ion
,co
ntr
ol,
and
rep
orti
ng
pro
ced
ure
Fle
xib
lean
dad
apta
ble
pro
cess
es
Sim
ple
syst
emen
cou
rag
ein
nov
atio
n,
allo
ws
flex
ibil
ity
and
spee
dof
resp
onse
tocu
stom
ern
eed
s/d
eman
ds
Act
astr
ain
ing
gro
un
dfo
rn
ewen
trep
ren
eurs
and
wor
ker
s
Lac
kof
pro
per
syst
em–
dif
ficu
lty
inen
suri
ng
effi
cien
cyof
wor
k,
and
hig
hv
aria
bil
ity
inw
ork
outc
ome
Lac
kof
pro
per
/eff
ecti
ve
tim
ean
dca
shfl
owm
anag
emen
t“G
ut
feel
ing
”ap
pro
ach
may
resu
ltin
wro
ng
dec
isio
ns
Lim
ited
app
lica
tion
ofn
ewte
chn
olog
yIn
adeq
uat
ein
fras
tru
ctu
reS
hor
tag
eof
raw
mat
eria
ls
Culture
and
behavi
our
Op
erat
ion
san
db
ehav
iou
rof
emp
loy
ees
infl
uen
ceb
yow
ner
s’/m
anag
ers’
eth
osan
dou
tloo
kO
rgan
ic,
not
stro
ng
dep
artm
enta
l/fu
nct
ion
alm
ind
-set
,co
rpor
ate
min
d-s
etU
nifi
ed/fl
uid
cult
ure
Res
ult
-ori
ente
d
Cor
por
ate
min
d-s
etis
con
du
civ
efo
rn
ewch
ang
ein
itia
tiv
esH
igh
staf
flo
yal
tyan
dh
ard
wor
kto
com
pan
yA
sa
seed
-bed
from
wh
ich
larg
eco
mp
anie
sg
row
As
ag
rou
pp
rov
ides
sig
nifi
can
tec
onom
icou
tpu
tan
dsa
vin
gs
info
reig
nex
chan
ge
Lac
kof
man
ager
ial
and
tech
nic
alex
per
tise
Un
com
mit
ted
ord
icta
tori
alow
ner
/man
ager
eth
osca
nd
amag
en
ewin
itia
tiv
esD
ang
erw
hen
loy
alti
esan
dem
otio
nal
ties
are
pla
ceab
ove
com
pet
ence
and
per
form
ance
(con
tinued
)
Table II.SMEs characteristics,strengths andweaknesses versus largeorganisations
BIJ13,4
400

SM
Es
char
acte
rist
ics
Str
eng
ths
Wea
kn
esse
s
Hum
an
reso
urc
esH
igh
per
son
alau
thor
ity
and
com
mit
men
tof
the
own
erF
ewd
ecis
ion
mak
ers
Dom
inat
edb
yp
ion
eers
and
entr
epre
neu
rsIn
div
idu
alcr
eati
vit
yen
cou
rag
esan
dh
igh
inci
den
ceof
inn
ovat
iven
ess
Mod
est
hu
man
cap
ital
,fi
nan
cial
reso
urc
esan
dk
now
-how
Ind
ivid
ual
sn
orm
ally
can
see
the
resu
lts
ofth
eir
end
eav
ours
Low
inci
den
ceof
un
ion
isat
ion
Low
deg
ree
ofre
sist
ance
toch
ang
eM
ore
gen
eral
ists
,som
est
aff
may
cov
erm
ore
than
one
dep
artm
ent
Hig
hau
thor
ity
,co
mm
itm
ent
and
resp
onsi
bil
ity
can
crea
tes
coh
esio
nan
den
han
ceco
mm
onp
urp
oses
amon
gst
the
wor
kfo
rce
toen
sure
job
isd
one
Inn
ovat
ive
env
iron
men
tw
ill
sup
por
tim
pro
vem
ent
cult
ure
Ear
lyu
nio
nin
vol
vem
ent
nee
ded
toen
sure
succ
ess
Few
erem
plo
yee
s–
bet
ter
rela
tion
ship
,k
now
sal
mos
tev
ery
one
Pro
vid
esem
plo
ym
ent
opp
ortu
nit
ies
Lac
kof
fin
anci
alsu
pp
ort,
e.g
.no
trai
nin
gb
ud
get
,ad
hoc
,an
dsm
all-
scal
eap
pro
ach
can
stifl
eim
pro
vem
ent
effo
rts
Imp
rov
emen
tn
eed
sin
ves
tmen
tin
hu
man
reso
urc
esS
hor
tag
eof
skil
led
wor
ker
s
Mark
etand
cust
omer
sS
pan
ofac
tiv
itie
sn
arro
wL
imit
edex
tern
alco
nta
cts
Nor
mal
lyd
epen
den
ton
smal
lcu
stom
erb
ased
clos
eco
nta
ct,
easi
lyac
cess
ible
and
man
yk
now
ncu
stom
ers
per
son
ally
Pro
du
ctan
dse
rvic
esm
ostl
yfo
rlo
cal
mar
ket
,few
nat
ion
alor
inte
rnat
ion
al
Imm
edia
tefe
edb
ack
from
cust
omer
sA
ble
tore
spon
dq
uic
ker
Un
der
stan
db
ette
rcu
stom
ern
eed
s.A
idto
larg
eco
mp
anie
s.S
tim
ula
tem
ark
etco
mp
etit
ion
Mar
ket
ing
con
stra
ints
and
kn
owle
dg
eIn
tern
atio
nal
mar
ket
ing
exp
ensi
ve,
afte
rsa
les
sup
por
tn
otas
exte
nsi
ve
asla
rge
bu
sin
esse
sE
asil
ysu
pp
ress
edan
dd
icta
ted
by
larg
erm
ult
inat
ion
als
(if
they
are
cust
omer
s),
e.g
.p
rod
uct
cost
,et
c.
Sources:
Ch
ee(1
987)
,Sal
leh
and
Fic
htn
er(1
991)
,Hu
xta
ble
(199
5),G
hob
adia
nan
dG
alle
ar(1
996,
1997
),Y
uso
fan
dA
spin
wal
l(2
000a
,200
0b)
and
Has
him
and
Waf
a(2
002)
Table II.
Benchmarkingimplementation
framework
401

resources, SMEs are always faced with the shortage of skilled labour and they have tocompete with large companies for skilled workers (i.e. large companies able to offerskilled workers better wages and working conditions) (Reed et al., 2001; Chee, 1987). Inaddition, SMEs are also faced with frequent raw material shortages and have to paymore, fluctuation in raw material price, unable to obtain credit terms, inadequateinventory management and control of stock in raw materials and less bargainingpower compared to large companies (Kraipornsak, 2002; Chee, 1987). Majority of SMEsentrepreneurs have low level of formal education and limited training in newmanagement principles and practices, which led to lack of managerial and technicalexpertise (Hashim and Wafa, 2002; Chee, 1987).
Very often SMEs relied on one-person management, thus insufficient time andattention is given to the various managerial functions (Hashim and Wafa, 2002). InSMEs, the owner controls everything; poor management was attributed to the owners’lack of business experience, lack of management experience or know-how (Pickle andAbrahamson, 1990; Baumack, 1988).
Furthermore, most SMEs lack of proper time management and cash flowmanagement system, which cause high variability in work outcome and difficulty toensure efficiency of work. Many important business decisions are often based on“gut-feeling” and not on facts that may result in making wrong decisions. SMEs are alsofaced with other problems such as lack of knowledge in marketing techniques, lack ofopportunities at both local and international levels, poor accessibility to the distributionchannels and market information, marketing constraints such as pricing, late paymentfrom customers, inability to provide quality product and lack of promotional strategies(Kraipornsak, 2002). Very few SMEs owners prepare an adequate feasibility study of anew enterprise and a sound marketing investigation (Meredith and Grant, 1982). In mostcases, marketing investigation by potential entrepreneurs tend to be low level and basedon general opinions rather than expert advice, lack of effective selling techniques andmarket research (Hashim and Wafa, 2002).
As indicated by Kraipornsak (2002) and Chee (1987), a majority of SMEs rely onoutdated technology, labour intensive and traditional management practices. Some donot trust new technology, while others are unable to afford it, which in many cases ledto inefficient, lack of information and inadequate in-house expertise (Hashim and Wafa,2002). Thus, it is important to appreciate the differences that exist between SMEs andlarge business organizations. In other words, it is crucial to try and understand SMEsissues and characteristics before making any attempt to help them in implementingTQM activities (such as benchmarking, 7 QC tools, SPC, quality assurance system,etc.). It can be concluded that appropriate technology and efficient production systemplays an important role in explaining the comparative advantage and competitivenessof the SMEs and large companies.
Defining a frameworkIn the past, many writers and authors have used the term “framework” without firstdefining it appropriately. At present, there is no consensus on the definition of theframeworks; some writers define it as a set of principles or ideas used as a basis for one’sjudgement, decisions, while others portray the frameworks through diagrams, flowcharts,and graphical or pictorial representations (Yusof, 2000). The Oxford’s Advanced LearnerDictionary of current English defines a framework as “a structure giving shape and
BIJ13,4
402

support” (Hornby, 1990). Meanwhile, Struebing and Klaus (1997) believed a soundframework should define what the organisation does, what it is trying to do, how it is goingto do it and ensure that each step is done in the correct sequences. On the other hand,Popper (1994) as quoted by Yusof (2000) defines a framework as a set of basic fundamentalprinciples, which can help to promote discussions and actions. In other words, a soundframework can link-up between benchmarking concept and practical application becauseit guides the organisation in adopting and implementing benchmarking activities in amore systematic, comprehensive, controlled and timely manner.
Why need a framework?The most frequent reason cited for change efforts (such as TQM, BPR, reengineering,etc.) failure is wrong implementation approach. Aalbregtse et al. (1991), for examplecited the following reasons for having a framework to:
. illustrate an overview and communicate a new vision to the organisation;
. force management to address a substantial list of key issues which otherwisemight not be addressed;
. give valuable insights into the organisation’s strengths and weaknesses, and itsoverall strategic position in the market-place; and
. support implementation and to improve the chance of success because it willprovide not only overview but also more detailed information describing thecontent of each framework element and its relationship to other elements.
In the authors’ opinion, these reasons are also applicable and valid to thebenchmarking implementation, since benchmarking is one of the tools found in TQM.In this paper, the authors have defined framework as a set of simplified theoreticalprinciples and practical guidelines to carryout benchmarking implementation andadoption, which can enhance the chance of success that are easy to understand,efficient and can be implemented at reasonable costs and time.
Framework design requirementsThe SMEs characteristics, strengths and weaknesses against large organizations werediscussed in the preceding section. A question, which arises then, is how one cancharacterise a good framework that really suits the SMEs. In general, the followingcriteria can be considered as a guide in developing a good framework to suit the SMEscharacteristics (Yusof and Aspinwall, 2000a):
. systematic and easily understood;
. simple in structure;
. having clear links between the elements or steps outlined;
. general enough to suit different contexts;
. represent a road map and a planning tools for implementation;
. answers “how to?” and not “what is?”; and
. implementable at reasonable cost and time.
Thus, it is important that these criteria are considered when developing a frameworkfor SMEs.
Benchmarkingimplementation
framework
403

Meanwhile, Medori and Steeple (2000) summarised the design requirements fordeveloping a framework that include the following steps. They are:
. procedures for selecting and implementing measures;
. ability to identify whether existing measurement system is up to date andmeasuring critical issues (i.e. audit capability);
. selected measures should be congruent with company strategy and have strongrelationship with the six core competitive priorities (i.e. quality, cost, flexibility,time, delivery and future growth); and
. facilitates rapid selection of measures from a data bank; and workbook approach(i.e. step-by-step methodology).
Benchmarking framework’s relationship with benchmarking and TQMThe relationship of benchmarking framework with benchmarking and total qualitymanagement (TQM) can be summarised and shown in Figure 1. By referring toFigure 1, it can be seen that the benchmarking framework is at the heart of thebenchmarking process and thus plays a very important role in ensuring the success ofbenchmarking process. This in-turn, can lead to the success of the overall TQMprogram.
Generally, companies need to first know their strengths and weaknesses beforeembarking on adopting the benchmarking tool to improve their productivity, productquality, process efficiency, services, etc. This leads to improvement in their overallbusiness performance and competitiveness. Without a suitable benchmarkingframework that provides the steps and guides what actions to be taken, which iseasy to use, the SMEs have to face many difficulties and problems in conductingbenchmarking to investigate and identify their strengths and weaknesses compared totheir competitors.
Review on previous benchmarking implementation frameworksIn this paper, the authors present some relevant benchmarking framework studiesreviewed, which represent the various frameworks developed and proposed by variousacademics, researchers, consultants and experts in the field. It would be impractical tocover all the available frameworks, however, as far as possible the authors would
Figure 1.Benchmarkingframework’s relationshipwith benchmarking andTQM
Benchmarking
Benchmarking framework
Benchmarking
Benchmarking framework
TQM
BIJ13,4
404

present the ones, which form the representative samples of the most common, relevantand widely published. The various frameworks reviewed were categorised into twobroad types namely, consultant/expert and academic/research based on the author orresearcher background and in accordance to the approach how they viewbenchmarking implementation process. For example, the approach taken byconsultant/expert towards benchmarking implementation is more practicalorientated (i.e. hands-on); meanwhile the academic/researcher look at it fromtheoretical and conceptual aspect.
Consultant and expert based frameworkIn general, consultant based frameworks were derived from personal opinion andjudgement through practical experience in providing consultancy service toorganisations embarking on a benchmarking project.
Crow (1999) developed a generic framework for benchmarking best practices toimprove product development process that follows Deming PDCA cycle into five majordimensions, which includes strategy, organization, process, design optimisation, andtechnology. As shown in Table III, the five major dimensions are further subdivided into28 best practices categories. He had used the product development best practices toinvestigate competitive dimensions (such as time-to-market, low development cost, lowcost producer, high value product, innovation and product performance, quality,reliability, ease of use, serviceability, and agility) associated with product development.
The framework provides a detailed example to conduct the evaluation process; itdescribed the strategic levers associated with each of the competitive dimensions orstrategies; it shows how to perform the product performance summary, strategicalignment analysis, gap analysis for identifying implementation actions and priorities;it enable the organization to develop an action plan for improving the productdevelopment process. In addition, it can also be used to identify strengths andweaknesses relative to a common framework in product development process.However, it can be argued that the framework is very complex, categorise bestpractices into 28 categories with more than 270 best practices and can only be used inthe product development process (i.e. not a generic framework) thus the framework isnot applicable in other areas of the business.
Meanwhile, Spendolini (1992) prescribed a generic five stages benchmarking model,which is simple and incorporates essential elements in the benchmarking process. Thefive stages benchmarking process begins with determining what to benchmark,forming a benchmarking team, identifying benchmarking partners, collecting andanalysing benchmarking information, and finally, taking the appropriate action (i.e.following the Deming PDCA cycle) as shown in Figure 2. In addition, Spendolini (1992)proposed four general guidelines to conduct benchmarking process successfully, suchas: follow a simple, logical sequence of activity; give heavy emphasis on planning andorganization; use customer focused benchmarking; and make it a standardised processfor the whole organization. The model provides a structure, framework and commonlanguage for planning and execution of benchmarking investigation. It is very flexiblewhere anyone (for example the benchmarking team) who wants to use the frameworkcan modify the process to suit their needs and requirement; it provides a new benchmarker with basic process map and set of benchmarking do’s and do nots; andspecialists had validated it.
Benchmarkingimplementation
framework
405

Str
ateg
yO
rgan
izat
ion
Pro
cess
Des
ign
opti
mis
atio
nT
ech
nol
ogy
Bu
sin
ess
&p
rod
uct
stra
teg
yP
rod
uct
pla
nn
ing
&m
anag
emen
tT
ech
nol
ogy
man
agem
ent
Man
agem
ent
lead
ersh
ipE
arly
inv
olv
emen
tP
rod
uct
dev
elop
men
tte
ams
Org
aniz
atio
nal
env
iron
men
t
Pro
cess
man
agem
ent
Pro
cess
imp
rov
emen
tU
nd
erst
and
ing
the
cust
omer
Req
uir
emen
ts&
spec
ifica
tion
sm
anag
emen
tD
evel
opm
ent
pro
cess
inte
gra
tion
Su
pp
lier
/su
bco
ntr
acto
rin
teg
rati
onT
ran
siti
onto
pro
du
ctio
nC
onfi
gu
rati
onm
anag
emen
tD
esig
nas
sura
nce
Pro
ject
&re
sou
rce
man
agem
ent
Des
ign
for
man
ufa
ctu
rab
ilit
yP
rod
uct
cost
man
agem
ent
Rob
ust
des
ign
Inte
gra
ted
test
des
ign
&p
rog
ram
Des
ign
for
oper
atio
n&
sup
por
t
Pro
du
ctd
ata
Des
ign
auto
mat
ion
Sim
ula
tion
&an
aly
sis
Com
pu
ter
aid
edm
anu
fact
uri
ng
Su
pp
ort
tech
nol
ogy
Kn
owle
dg
eor
gan
izat
ion
Source:
Cro
w(1
999)
Table III.Product developmentbest practices framework
BIJ13,4
406
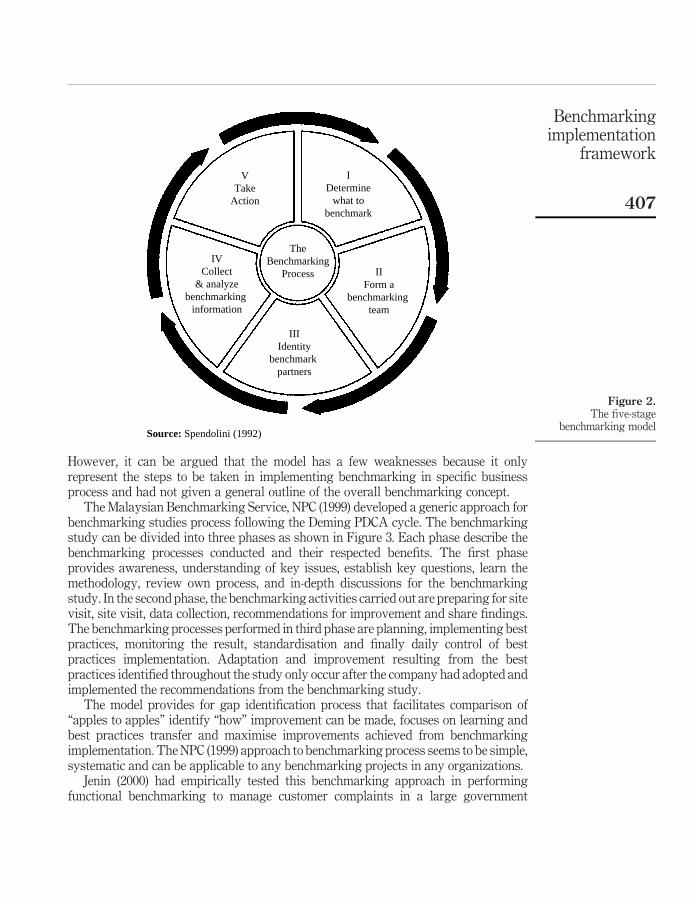
However, it can be argued that the model has a few weaknesses because it onlyrepresent the steps to be taken in implementing benchmarking in specific businessprocess and had not given a general outline of the overall benchmarking concept.
The Malaysian Benchmarking Service, NPC (1999) developed a generic approach forbenchmarking studies process following the Deming PDCA cycle. The benchmarkingstudy can be divided into three phases as shown in Figure 3. Each phase describe thebenchmarking processes conducted and their respected benefits. The first phaseprovides awareness, understanding of key issues, establish key questions, learn themethodology, review own process, and in-depth discussions for the benchmarkingstudy. In the second phase, the benchmarking activities carried out are preparing for sitevisit, site visit, data collection, recommendations for improvement and share findings.The benchmarking processes performed in third phase are planning, implementing bestpractices, monitoring the result, standardisation and finally daily control of bestpractices implementation. Adaptation and improvement resulting from the bestpractices identified throughout the study only occur after the company had adopted andimplemented the recommendations from the benchmarking study.
The model provides for gap identification process that facilitates comparison of“apples to apples” identify “how” improvement can be made, focuses on learning andbest practices transfer and maximise improvements achieved from benchmarkingimplementation. The NPC (1999) approach to benchmarking process seems to be simple,systematic and can be applicable to any benchmarking projects in any organizations.
Jenin (2000) had empirically tested this benchmarking approach in performingfunctional benchmarking to manage customer complaints in a large government
Figure 2.The five-stage
benchmarking model
VTake
Action
IDetermine
what tobenchmark
IIForm a
benchmarking team
IIIIdentity
benchmark partners
IVCollect
& analyzebenchmarking
information
Source: Spendolini (1992)
TheBenchmarking
Process
Benchmarkingimplementation
framework
407

agency involved in the service sector and not in the SMEs for its applicability andusability. However, it can be argued this benchmarking framework only described thespecific steps on how to perform the benchmarking implementation process but it didnot provide the overall roadmap and guidelines for companies to follow beforeembarking on the benchmarking effort.
Academic and research based frameworkOn the other hand, academics and researchers mainly through their own research,knowledge and experience in benchmarking developed the academic based frameworks.
Lee (2002) developed a generic model for assessing, implementing and sustainingbusiness excellence through structured approach in implementing best practices inTQM (such as in operations, quality, customer satisfaction, and, etc.) found in theSingapore Quality Award. The model consists of four major elements. They are corevalues, goals, approaches and deployment and business excellence. It starts byidentifying a set of core values and its goals, and followed by a systematicimplementation of initiatives based on the PDCA cycle. The model provides a guidingstructure for organizations to systematically implement an effective TQM programthat targets a specific purpose. In the authors’ opinion, this model could also be useeffectively for implementing benchmarking because benchmarking has a very closerelationship with the TQM program. The model provides a systematic structure toidentify core values; easily adapted, proposed a list of best practices for each core value
Figure 3.NPC approach forbenchmarking study
4.0 Share Strengths
Source: NPC (1999)
9.0 Planning for AdoptingBest Practices
14. Continue ExistingProject?
New Area
Start
New Area
Phase 1 Phase 2 Phase 3
2nd site visit(only if necessary)
Yes
NoYes
13. Daily Control
12. Standardisation
11. Monitoring the Result
10.0 Implementation ofBest Practices
7.0 RecommendImprovement?
6.0 Data Collection:Site Visit
5.0 Site VisitPreparation
1.0 Agree onBenchmarking Topic
2.0 Finalise on Scope:Measures and Definition
3.0 Data Collection:Survey
8.0 Share Findings
BIJ13,4
408
at each stage of the benchmarking effort and it is generic for all applications. Theframework for excellence model seems to be simple and generic in terms ofapplications but it has been designed and tested only in large organizations from pastSingapore Quality Award winners, meanwhile its applicability and usability in SMEsis still unknown and yet to be empirically proven.
Fong et al. (2001) proposed a generic analytical framework, which is simple, systematicand consists of both hard and soft measures for benchmarking the value managementprocess consisting of four basic steps. It starts by identifying the critical success factors(CSFs), followed by determining the factors to be benchmarked, then establishing thequantifiable performance metrics, and finally comparing the results and selecting thepractice with the best result for benchmarking. In addition, they investigated andidentified the CSFs for the value management process; objective measures (i.e. hardanalysis – e.g. time, cost, and quality, etc); subjective measures (i.e. soft analysis – e.g.facilitator skills, teamwork, creativity, customers satisfaction, etc.); and benchmarkingresults that reflect actual situation. On the other hand, the framework’s practicality,applicability and usability in SMEs are yet to be validated empirically.
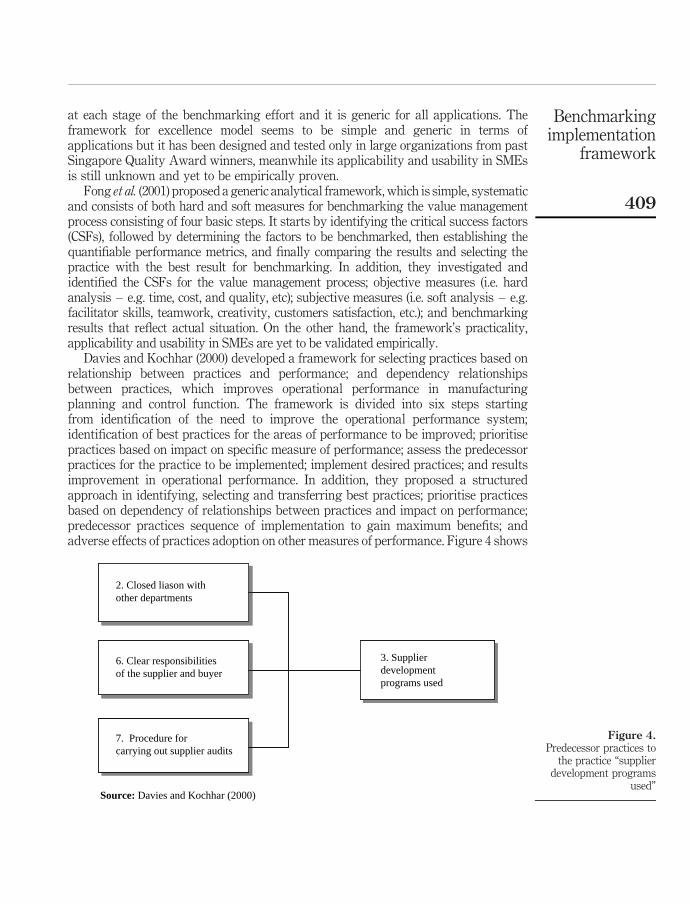
Davies and Kochhar (2000) developed a framework for selecting practices based onrelationship between practices and performance; and dependency relationshipsbetween practices, which improves operational performance in manufacturingplanning and control function. The framework is divided into six steps startingfrom identification of the need to improve the operational performance system;identification of best practices for the areas of performance to be improved; prioritisepractices based on impact on specific measure of performance; assess the predecessorpractices for the practice to be implemented; implement desired practices; and resultsimprovement in operational performance. In addition, they proposed a structuredapproach in identifying, selecting and transferring best practices; prioritise practicesbased on dependency of relationships between practices and impact on performance;predecessor practices sequence of implementation to gain maximum benefits; andadverse effects of practices adoption on other measures of performance. Figure 4 shows
Figure 4.Predecessor practices to
the practice “supplierdevelopment programs
used”
2. Closed liason withother departments
6. Clear responsibilitiesof the supplier and buyer
7. Procedure forcarrying out supplier audits
Source: Davies and Kochhar (2000)
3. Supplierdevelopmentprograms used
Benchmarkingimplementation
framework
409

an example of predecessor practices to the practice “supplier development programsused” for the area of purchasing.
In this case, the “supplier development programs used” is dependent on thepredecessor practices such as: close liaison with other departments; clear responsibilitiesof the supplier and buyer; and procedure for carrying out supplier audits. They believedthe framework could provide information to operational managers to focus and link bestpractices on objectives to be achieved, consider adverse effects of implementingpractices on related performance measures, analyse necessary predecessors which arerequired to make a practice effective, adopt best practices which are linked to objectivesand build on existing competencies and practices, minimise fire-fighting and avoidpanaceas. In addition, the framework has been validated empirically through casestudies, industrial experts, interviews and questionnaires.
Medori and Steeple (2000) developed a framework for enhancing operationalperformance in all areas of the manufacturing function. The framework is basedaround two separate but linked documents. The first document is a “workbook” whichconsist of a framework structure of six-stage plan as shown in Figure 5. Meanwhile, thesecond document consisted of “checklist” containing a list of performance measuresthat are segregated by six competitive priorities (i.e. quality, cost, flexibility, time,delivery and future growth). This second document contains mainly non-financialmeasures, with full descriptions and methods of calculation for each measure. Theyinvestigated the assessment of existing performance measurement system; establishand adopt appropriate financial (such as profit, market share, cost, etc.) andnon-financial performance measures (such as quality, flexibility, time, delivery andgrowth, etc.) for competitiveness.
Their framework’s can aid in setting-up a new performance measure if a company doesnot have one, identifying obsolete measures (false alarms), identifying and selecting corenon-financial measures not being measured (gaps); able to identify the route to implementany selected measures; has audit capability which can aid in examining a company’sexisting measurement system. This framework has been tested empirically for itsapplicability and usability. However, Medori and Steeple (2000), themselves believed theframework has two weaknesses, such as: in stage 1, it is difficult to relate company successfactors for manufacturing strategy, which was based on four competitive priorities (i.e.cost, quality, delivery and people) with performance measurement grid’s six competitivepriorities (i.e. quality, cost, flexibility, time, delivery and future growth) in stage 2.
Figure 5.Diagram illustratingframework structure
Stage 2PerformanceMeasurement
Grid
Stage 1.CompanySuccess Factors
Stage 6. Periodic Maintenance
Source: Medori and Steeple (2000)
Stage 3.Selection
OfMeasures
Stage 4
Audit
Stage 5. Implementation
of Measures
BIJ13,4
410

Secondly, the checklist, which is a critical part of the framework may be outdated in timeand hence measures may need to be updated.Voss et al. (1994) developed and tested a benchmarking framework based oninteraction between product and process innovation in the area of technologymanagement. The framework can be summarised into a generic six steps procedures.They are:
(1) identify business processes to be benchmarked;
(2) use a “top-down” approach to develop an overall framework of the processes tobe benchmarked;
(3) use a “bottom-up” approach, based on literature and knowledge of best practiceto identify sub-processes and characteristics of best practice;
(4) develop metrics for each process;
(5) develop tools, self-assessment scorecards and benchmarking frameworks; and
(6) test the frameworks and tools for usability and usefulness.
They believed the framework could assist in developing new manufacturing andbusiness processes, assuring effective implementation of new process technology andalso improving continuously the production processes. The framework is robustand generic, designed to support the assessing and benchmarking team, provides acommon focus, direction and designed to force companies’ management to ask relevantquestions during benchmarking and self-assessment process.
Zairi (1994) developed a generic step-by-step framework and classified thebenchmarking study process into two stages. The stages are:
(1) focus on internal comparison to increase effectiveness; and
(2) focus on external comparison to increase competitiveness.
The first stage is about controlling and managing all internal processes effectively byadopting and adapting to a culture of never ending improvement through Deming’scycle of Plan-Do-Check-Act (PDCA) (Figure 6). Internal comparison can lead toimproved performance through reduced variability with the workforce. During thefirst stage, best practices from high performers (i.e. department or areas) in theorganization are identified and “shared” with others to enable them to improve andraise their overall level of performance.
The second stage is the conversion of internal standards of effectiveness intoexternal competitiveness through benchmarking effort (Figure 7). Internalbenchmarking need low resources requirement (i.e. financial, human, time), easy toget cooperation from the workforce and able to prepare the organization for externalbenchmarking. In addition, it recognises the importance of organisational culture(i.e. committed to measurement and improvement) and also provides the problemsolving tools and techniques on how to conduct benchmarking process.
In the preceding paragraphs, the authors have described some previousbenchmarking implementation frameworks studies that are thought to be significantand relevant to this research. At this point, the authors would like to caution readersthat these frameworks would not form a definitive list of all the currently available
Benchmarkingimplementation
framework
411

Figure 7.Benchmarking stage 2 –competitiveness
PLAN
Repeat experiencewith same/
new partnerson regular basis
Apply benchmarking
to all processes
Selectprocess
sultable forbench-
marking Identitysuitable partners
Agree onmeasurement
strategy
Comparestandards
Understandwhy differencein performance
Changerelevant practices
for improvingperformance
Comparestandards
Competitiveness
1211
10
9
8
13
14
15
16
ACT
Source: Zairi (1994)
CHECK
DO
Figure 6.Benchmarking stage 1 –effectiveness
PLAN
ACT
Set internal standards
Control andmanage process
Understand internalprocess
Evaluating currentperformance
Identifyingprocess limitation/
Opportunitiesfor improvement
Improveprocesses
Measure andevaluate
Source: Zairi (1994)
Effectiveness
5 4
3
2
17
6
DO
CHECK
BIJ13,4
412

benchmarking frameworks. However, the authors felt that those described aresufficient to highlight the major issues in benchmarking framework studies.
Discussions on previous frameworksAll the frameworks described have been summarised according to certain importantissues as shown in Table IV.
Most of the frameworks have been developed and tested in various industries andorganisations such as electronics, healthcare, automotive, aerospace, componentsmanufacturers,, etc. which are large in size, except those frameworks developed byMedori and Steeple (2000) and Voss et al. (1994), which were also tested in SMEs fortheir applicability and usability.
Medori and Steeple (2000) framework’s was tested only in operational area of themanufacturing function in the automotive parts and components manufacturingindustry. Meanwhile, Voss et al. (1994) framework’s was tested in industries, which arenot related to the automotive sector. The other four frameworks reviewed such as Fonget al. (2001), Crow (1999), Zairi (1994) and Spendolini (1992) were still in thehypothetical stage because they did not indicate the research methodology used andbusiness size in testing the validity and applicability of their frameworks empiricallyby using actual field data.
The nine previous benchmarking frameworks reviewed had various numbers ofsteps, ranging from four to sixteen steps to perform the benchmarking activities orprocesses. Although, these benchmarking frameworks have different number of steps,one major similarity between the frameworks is that they can be condense into fourmajor elements of the Deming PDCA cycle. This is in line with the findings by previousauthors on benchmarking methodologies such as APQC (2001), NPC (2001), Sarkis(2001) and Ahmed and Rafiq (1998). In this context, PDCA means planning what to do,doing what has been planned, checking results or effects of what has been done andfinally acting upon those results, in terms of standardisation, further improvement orfeedback.
Although the various authors had used different terms, however, they actuallyrepresent the same meaning for each element (Yusof, 2000). For example, the termsdetermine what to benchmark, establish goals for core values, identify needs carry thesame activity in the planning stage. The activities, elements, ideas in the frameworkswere analysed and categorised into PDCA format and shown in Table V. The PDCAformat is effective because this general approach allows for incorporation of changecharacteristics.
Some of the frameworks, such as Crow’s (1999) and Davies and Kochhar (2000) aretoo complex and complicated in nature for SMEs to apply. For example, Crow (1999)developed a complicated framework that can only be used for benchmarking bestpractices to improve product development process. It is complicated because its fivemajor benchmarking dimensions is further subdivided into 28 best practices categoriesand comprise of more than 270 best practices. Davies and Kochhar (2000) developed aframework that could only be used for selecting practices based on dependencyrelationships between practices and performance. Fong’s (2001) analytical frameworkcould only be used for benchmarking value management process. Medori and Steeple(2000) themselves believed that their framework has two critical weaknesses; first, it isdifficult to relate the company success factors for manufacturing strategy with
Benchmarkingimplementation
framework
413

Au
thor
/res
earc
her
Ob
ject
ive
Ind
ust
ryF
ram
ewor
kst
ruct
ure
Res
earc
hm
eth
odol
ogy
Bu
sin
ess
size
Sim
ilar
itie
s
Lee
(200
2)T
od
evel
opa
gen
eric
mod
elth
atca
nb
eu
seto
asse
ssth
eor
gan
izat
ion
’sq
ual
ity
rela
ted
per
form
ance
inop
erat
ion
s,q
ual
ity
,an
dcu
stom
ersa
tisf
acti
on
Ele
ctro
nic
san
dh
ealt
hca
rein
du
stry
,an
dg
over
nm
ent
inst
itu
tion
Ste
pap
pro
ach
4p
has
es
Mu
ltip
leca
sest
ud
ies
by
usi
ng
in-d
epth
,fac
e-to
-fac
ein
terv
iew
s
Lar
ge
Use
Dem
ing
PD
CA
cycl
e
Fon
get
al.
(200
1)T
od
evel
opa
gen
eric
anal
yti
cal
fram
ewor
kfo
rb
ench
mar
kin
gth
ev
alu
em
anag
emen
tp
roce
ss
Ap
pli
cab
lein
all
ind
ust
ryor
org
aniz
atio
nS
tep
app
roac
hF
our
step
s
Not
ind
icat
edN
otin
dic
ated
Use
Dem
ing
PD
CA
cycl
e
Dav
ies
and
Koc
hh
ar(2
000)
To
dev
elop
afr
amew
ork
for
sele
ctin
gp
ract
ices
wh
ich
wil
lim
pro
ve
oper
atio
nal
per
form
ance
inm
anu
fact
uri
ng
pla
nn
ing
and
con
trol
fun
ctio
n
Au
tom
otiv
ean
dae
rosp
ace
par
tsco
mp
onen
tsm
anu
fact
ure
rs
Ste
pap
pro
ach
3p
has
esS
ixst
eps
Mu
ltip
leca
sest
ud
ies
Afo
cus
gro
up
Mai
lsu
rvey
Lar
ge
Use
Dem
ing
PD
CA
cycl
e
Med
ori
and
Ste
eple
(200
0)T
od
evel
opa
fram
ewor
kfo
ren
han
cin
gop
erat
ion
alp
erfo
rman
cein
all
area
sof
the
man
ufa
ctu
rin
gfu
nct
ion
Au
tom
otiv
ep
arts
and
com
pon
ents
man
ufa
ctu
rers
Ste
pap
pro
ach
6st
age
pla
n
Mu
ltip
leca
sest
ud
ies
Med
ium
larg
eU
seD
emin
gP
DC
Acy
cle
(con
tinued
)
Table IV.Comparison to similarframework studies forSMES and largeorganizations
BIJ13,4
414

Au
thor
/res
earc
her
Ob
ject
ive
Ind
ust
ryF
ram
ewor
kst
ruct
ure
Res
earc
hm
eth
odol
ogy
Bu
sin
ess
size
Sim
ilar
itie
s
Cro
w(1
999)
To
dev
elop
ag
ener
icfr
amew
ork
for
ben
chm
ark
ing
bes
tp
ract
ices
toim
pro
ve
pro
du
ctd
evel
opm
ent
pro
cess
Ap
pli
cab
leto
alli
nd
ust
ries
and
org
aniz
atio
ns
Ste
pap
pro
ach
4st
eps
Not
ind
icat
edN
otin
dic
ated
Use
Dem
ing
PD
CA
cycl
e
Mal
aysi
anb
ench
mar
kin
gse
rvic
e,N
PC
(199
9)
To
dev
elop
ag
ener
icm
odel
top
erfo
rmb
ench
mar
kin
gp
roce
ss
Ap
pli
cab
leto
all
org
aniz
atio
ns
bu
tte
sted
only
ina
gov
ern
men
tag
ency
inv
olv
edin
the
serv
ice
sect
or
Ste
pap
pro
ach
3p
has
es14
step
s
Cas
est
ud
yL
arg
eU
seD
emin
gP
DC
Acy
cle
Vos
set
al.
(199
4)T
od
evel
opan
dte
stb
ench
mar
kin
g/s
elf-
asse
ssm
ent
fram
ewor
ks/
tool
sin
pro
cess
tech
nol
ogy
inn
ovat
ion
and
man
agem
ent
Pet
roch
emic
als,
elec
tric
alfi
ttin
gs,
syst
emin
teg
rato
r,fi
bre
s,ch
emic
als,
adh
esiv
ean
dp
aper
ind
ust
ries
Ste
pap
pro
ach
3p
has
es6
step
s
Mu
ltip
leca
sest
ud
ies
Sm
all
Med
ium
Lar
ge
Use
Dem
ing
PD
CA
cycl
e
Zai
ri(1
994)
To
dev
elop
ag
ener
icm
odel
for
con
du
ctin
gb
ench
mar
kin
gA
pp
lica
ble
toal
lty
pes
ofin
du
stri
esan
dor
gan
izat
ion
s
Ste
pap
pro
ach
2p
has
es16
step
s
Not
ind
icat
edN
otin
dic
ated
Use
Dem
ing
PD
CA
cycl
e
Sp
end
olin
i(1
992)
To
dev
elop
ag
ener
icb
ench
mar
kin
gm
odel
that
pro
vid
esa
fram
ewor
kfo
ra
succ
essf
ul
ben
chm
ark
ing
pro
cess
Ap
pli
cab
leto
alli
nd
ust
ries
and
org
aniz
atio
ns
Ste
pap
pro
ach
5p
has
es
Not
ind
icat
edN
otin
dic
ated
Use
Dem
ing
PD
CA
cycl
e
Table IV.
Benchmarkingimplementation
framework
415

Au
thor
/res
earc
her
Fra
mew
ork
stru
ctu
reP
lan
nin
gD
oin
gC
hec
kA
ctio
n
Cro
w(1
999)
Ste
pap
pro
ach
Un
der
stan
dw
hat
bes
tp
ract
ices
tob
ead
opte
d(w
hat
isp
ossi
ble
)
Det
erm
ine
CS
Fs
for
stra
teg
icd
irec
tion
s(w
hat
’sn
eed
ed)
such
asti
me-
to-m
ark
et,
etc.
Ass
ess
stre
ng
ths
&w
eak
nes
ses
Con
du
ctg
apan
aly
sis
&im
pro
vem
ent
pla
n
Mal
aysi
anb
ench
mar
kin
gse
rvic
e,N
PC
(199
9)
Ste
pap
pro
ach
3p
has
es14
step
s
Ag
ree
onto
pic
and
scop
eP
lan
nin
gfo
rad
apti
ng
bes
tp
ract
ices
Sit
ev
isit
and
coll
ect
dat
aS
har
est
ren
gth
san
dfi
nd
ing
s
Rec
omm
end
imp
rov
emen
tM
onit
orin
gim
ple
men
tati
onre
sult
s
Imp
lem
ent
bes
tp
ract
ices
Sta
nd
ard
ised
Dai
lyco
ntr
ol
Sp
end
olin
i(1
992)
Ste
pap
pro
ach
5st
ages
Det
erm
ine
wh
atto
ben
chm
ark
For
ma
ben
chm
ark
ing
team
Iden
tify
ben
chm
ark
par
tner
s
Col
lect
and
anal
yse
ben
chm
ark
ing
info
rmat
ion
Tak
eac
tion
Lee
(200
2)S
tep
app
roac
h4
ph
ases
Est
abli
shg
oals
for
core
val
ues
Sel
ect
and
imp
lem
ent
bes
tp
ract
ices
toac
hie
ve
goa
lsM
onit
orim
ple
men
tati
onef
fect
iven
ess
Con
tin
uou
sim
pro
vem
ent
Fon
get
al.
(200
1)S
tep
app
roac
hF
our
step
s
Iden
tify
CS
Fs
Det
erm
ine
wh
ich
CS
Fs
are
tob
eb
ench
mar
ked
Mea
sure
per
form
ance
toin
dic
ate
lev
elof
succ
ess
Com
par
ere
sult
san
dse
lect
pra
ctic
ew
ith
bes
tre
sult
Dav
ies
and
Koc
hh
ar(2
000)
Ste
pap
pro
ach
3p
has
esS
ixst
eps
Iden
tify
nee
dan
db
est
pra
ctic
esP
rior
itis
ep
ract
ices
bas
edon
imp
act
onp
erfo
rman
ceA
sses
sp
red
eces
sor
pra
ctic
esfo
rth
ep
ract
ice
tob
eim
ple
men
ted
Imp
lem
ent
pra
ctic
esto
imp
rov
eop
erat
ion
alp
erfo
rman
ce
Med
ori
and
Ste
eple
(200
0)S
tep
app
roac
h6
stag
ep
lan
Mat
chm
issi
onan
dst
rate
gy
wit
hsu
cces
sfa
ctor
sb
ased
onco
mp
etit
ive
pri
orit
ies
Sel
ecti
onof
mea
sure
su
sin
gch
eck
list
Reg
ula
rly
aud
itan
dex
amin
eex
isti
ng
mea
sure
sIm
ple
men
tati
onof
mea
sure
sid
enti
fied
asg
aps
(con
tinued
)
Table V.Similarities of frameworkusing PDCA elements
BIJ13,4
416

Au
thor
/res
earc
her
Fra
mew
ork
stru
ctu
reP
lan
nin
gD
oin
gC
hec
kA
ctio
n
Zai
ri(1
994)
Ste
pap
pro
ach
2p
has
es16
step
s
Sel
ect
pro
cess
tob
ench
mar
kId
enti
fysu
itab
lep
artn
ers
Ag
ree
onm
easu
rem
ent
stra
teg
y
Un
der
stan
dp
roce
ssE
val
uat
ecu
rren
tp
erfo
rman
ceId
enti
fyp
roce
ssli
mit
atio
ns/
opp
ortu
nit
ies
for
imp
rov
emen
t
Mea
sure
and
eval
uat
eS
etan
dco
mp
are
stan
dar
ds
Imp
rov
ep
roce
ssp
erfo
rman
ceb
ych
ang
ing
rele
van
cep
ract
ices
Con
trol
and
man
age
pro
cess
Rep
eat
exp
erie
nce
wit
hsa
me/
new
par
tner
son
reg
ula
rb
asis
Ap
ply
ben
chm
ark
ing
toal
lp
roce
sses
Vos
set
al.
(199
4)S
tep
app
roac
h3
ph
ases
6st
eps
Iden
tify
bu
sin
ess
pro
cess
esto
be
ben
chm
ark
ed
Use
“top
-dow
n”
tod
evel
opov
eral
lfr
amew
ork
and
“bot
tom
-up
app
roac
hto
iden
tify
sub
-pro
cess
esan
dch
arac
teri
stic
sof
bes
tp
ract
ice
Dev
elop
met
rics
,to
ols,
self
-ass
essm
ent
scor
ecar
ds
and
ben
chm
ark
ing
fram
ewor
ks
for
each
pro
cess
Tes
tfr
amew
ork
san
dto
ols
for
usa
bil
ity
and
use
fuln
ess
Table V.
Benchmarkingimplementation
framework
417

performance measurement; second, the checklist, which a critical part of the frameworkmay be outdated with time and thus need to be constantly updated. Meanwhile, theframeworks developed by Spendolini (1992), NPC (1999), Lee (2002) and Zairi (1994)describe the steps on how to perform benchmarking for specific business process. Inshort, these frameworks only provide the steps to perform benchmarking but did notdescribe the overall outline or road map and guidelines for SMEs to follow beforeembarking on the benchmarking activities. In addition, majority of the frameworksrequires many people to execute the various tasks of implementing benchmarkinginitiatives such as establish close and long term relationships with suppliers, supplieraudits and collection of data on supplier capabilities, process improvement,understanding the customer, and, etc. again resembling a large company situationand not the SMEs.
To suit the SMEs context, the implementation framework developed for themshould be simple to understand and followed. As had been discussed in the precedingsection, SMEs are constrained by resources (such as financial, technological, humanand time), so implementing benchmarking initiatives based on these complicatedframeworks can be ridiculous and disastrous. In addition, besides being complex, someof the framework assumed that certain systems are already in place before embarkingon benchmarking implementation and adoption. For example, Crow (1999), NPC (1999),Fong et al. (2001), Davies and Kochhar (2000) and Medori and Steeple (2000), suggestedthat TQM systems are already in place. This may not be true of all SMEs but could betrue of large organizations because SMEs may not have similar systems as largeorganizations. Self-assessment and TQM practices, which are pre-requisitesto benchmarking adoption, must be implemented first, since they form thefoundation of a successful benchmarking process.
From the literature it can be seen that benchmarking framework, suitable andrelevant for SMEs to adopt is found to be lacking. The literature review had also shownthat there is no framework dedicated for the SMEs. Manufacturing SMEs are facedwith four major problems if they wish to benchmark, which includes:
(1) no generally accepted instrument for benchmarking of manufacturingpractices;
(2) no tools available to support benchmarking (such as a framework,self-assessment tool, etc.);
(3) not enough resources to collect the necessary data for benchmarking; and
(4) no adequate databases of manufacturing practices for companies to benchmarkthemselves against (Sarkis, 2001; Haksever, 1996; Voss et al., 1994).
This represents a gap in the current research at developing benchmarking frameworkfor SMEs. Therefore, there is a need for further research in developing a benchmarkingframework for SMEs to fill the gap, to compliment and to enrich the existing literatureon benchmarking frameworks.
The authors will propose a new benchmarking framework for the SMEs whichhopefully be suitable, effective, suits their characteristics and help them in their effortto become more effective and competitive at national, regional and internationalmarkets. The authors believe without a suitable framework and guidelines many
BIJ13,4
418
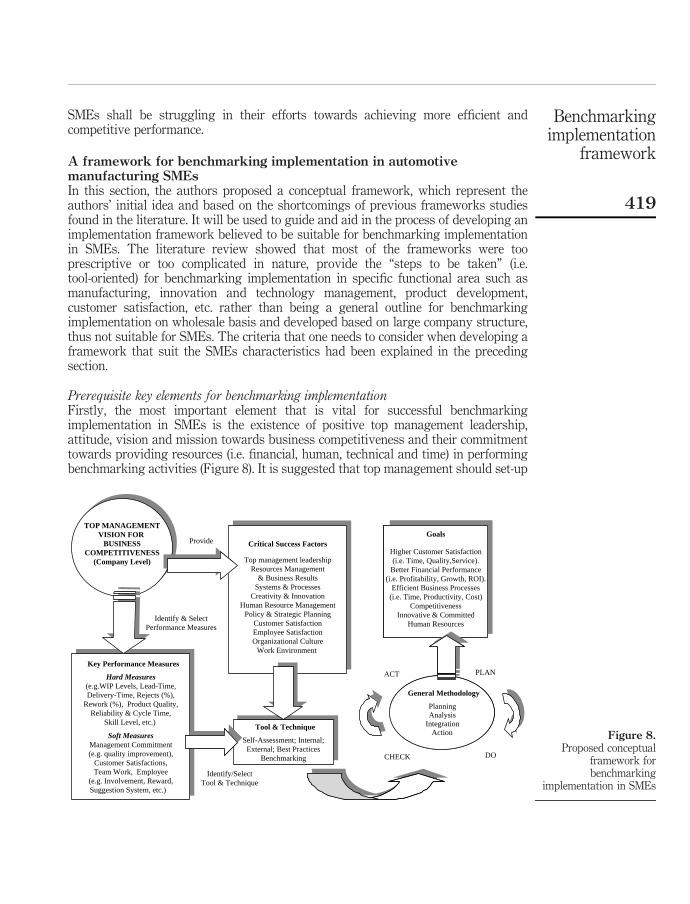
SMEs shall be struggling in their efforts towards achieving more efficient andcompetitive performance.
A framework for benchmarking implementation in automotivemanufacturing SMEsIn this section, the authors proposed a conceptual framework, which represent theauthors’ initial idea and based on the shortcomings of previous frameworks studiesfound in the literature. It will be used to guide and aid in the process of developing animplementation framework believed to be suitable for benchmarking implementationin SMEs. The literature review showed that most of the frameworks were tooprescriptive or too complicated in nature, provide the “steps to be taken” (i.e.tool-oriented) for benchmarking implementation in specific functional area such asmanufacturing, innovation and technology management, product development,customer satisfaction, etc. rather than being a general outline for benchmarkingimplementation on wholesale basis and developed based on large company structure,thus not suitable for SMEs. The criteria that one needs to consider when developing aframework that suit the SMEs characteristics had been explained in the precedingsection.
Prerequisite key elements for benchmarking implementationFirstly, the most important element that is vital for successful benchmarkingimplementation in SMEs is the existence of positive top management leadership,attitude, vision and mission towards business competitiveness and their commitmenttowards providing resources (i.e. financial, human, technical and time) in performingbenchmarking activities (Figure 8). It is suggested that top management should set-up
Figure 8.Proposed conceptual
framework forbenchmarking
implementation in SMEs
TOP MANAGEMENTVISION FOR
BUSINESSCOMPETITIVENESS
(Company Level)
Provide Critical Success Factors
Top management leadershipResources Management
& Business ResultsSystems & Processes
Creativity & InnovationHuman Resource Management
Policy & Strategic PlanningCustomer SatisfactionEmployee SatisfactionOrganizational Culture
Work Environment
Goals
Higher Customer Satisfaction(i.e. Time, Quality,Service).
Better Financial Performance(i.e. Profitability, Growth, ROI).
Efficient Business Processes(i.e. Time, Productivity, Cost)
CompetitivenessInnovative & Committed
Human Resources
General Methodology
PlanningAnalysis
IntegrationAction
PLAN
DOCHECK
ACT
Tool & Technique
Self-Assessment; Internal;External; Best Practices
Benchmarking
Key Performance Measures
Hard Measures(e.g.WIP Levels, Lead-Time,Delivery-Time, Rejects (%),
Rework (%), Product Quality,Reliability & Cycle Time,
Skill Level, etc.)
Soft MeasuresManagement Commitment(e.g. quality improvement),
Customer Satisfactions,Team Work, Employee
(e.g. Involvement, Reward,Suggestion System, etc.)
Identify/Select Tool & Technique
Identify & SelectPerformance Measures
Benchmarkingimplementation
framework
419

a benchmarking unit or task force at the company level. The four major roles of thebenchmarking unit are to:
(1) assists top management in making benchmarking policy decisions;
(2) identify and select key business performance measures to be benchmarked froma spectrum of performance measures depending upon the objectives, priority setby the company;
(3) decides on the benchmarking techniques to be adopted; and
(4) to review all the activities with respect to the benchmarking effort.
In terms membership, the unit must comprise of representatives from the managerial,supervisory and operator level from the majority of business functions in the company(such as manufacturing, quality, engineering, finance, and sales). In other words, theunit must include a cross section of employees, so that everybody could contributetheir share to the company’s effort of becoming more efficient, profitable andcompetitive. Subsequently, the company’s top management should empower this unitwith the appropriate authority and responsibility; and also provide the CSFs that shallact as enablers in achieving the benchmarking objectives.
The crucial role of the benchmarking unit is to assist the company’s top managementin formulating short (e.g. 1 year) and long term (e.g. 3 years) benchmarking strategiesand translate them into action plans, monitor their implementation progress, providefollow up actions to ensure the benchmarking efforts achieved its previously set goals. Inshort, the top management and benchmarking unit should ensure the company adoptand practice the continuous business process improvement philosophy in every aspectof their daily operations.
The next major role of the top management and benchmarking unit is tocommunicate the company’s benchmarking vision, mission and the required changesin working culture to all levels of the organisation. It is important to get employees’involvement at the early stages of the benchmarking effort to ensure they understandand receptive, why the company needs to perform the benchmarking process. Inaddition, the company’s top management should encourage the employees to beinvolved by giving their comments and suggestions with respect to the benchmarkingeffort plans. In short, effective two-ways communications link should be in-place beforeembarking on the benchmarking effort. As discussed in the preceding section, SMEshas a corporate mind-set that top management or owner act as the role model for anychange initiative, employees tend to copy, emulate, or imitate their actions andbehaviours. Therefore, it is important that top management or owner portrays the“positive thinking towards continuous business process improvement” and alsotowards achieving higher quality products and services at competitive price throughtheir actions and behaviour to give employees the right and consistent message.
Finally, in order to carry out the action plans, the top management andbenchmarking unit must first assess the level and amount of resources (i.e. financial,human, technical and time) available for the benchmarking effort within theorganisation. In other words, there must be enough funds, human resources, time andtechnical tools available for conducting the benchmarking effort and ensure its success.In addition, employees must be coaxed and not forced in performing the benchmarkingactivities because the success of the first few benchmarking projects could determine
BIJ13,4
420

the sustainability of benchmarking effort in the long run. In short, the main purpose ofconducting a benchmarking effort is to produce, offer and deliver high quality productsand services at competitive prices that are able to satisfy or exceeds customerexpectations, which in turn will bring profit to the company.
Critical success factorsHaving established the prerequisite key elements, vision and mission for businesscompetitiveness, the company’s top management must then establish the CSFs thatcan lead towards successful benchmarking implementation. These CSFs (Figure 8)represents a range of enablers which, when put into practice will enhance the chancefor successful benchmarking implementation and adoption in the organization. The listof CSFs presented is not meant to be a definitive of all CSFs available but just tohighlight the ones, which are commonly used. Additional CSFs should be added intothe list and used whenever it is necessary and appropriate. With regards to the SMEscharacteristics and constraints, it is important to ensure that the CSFs be implementedgradually and progressively in stages according to the company’s needs and availableresources. In other words, the benchmarking adoption and implementation shouldeventually lead to improvement in the business process performance measures(i.e. hard and soft measures), which in turn will enhanced the company’s overallbusiness competitiveness.
Key performance measuresThe first group of key performance measures (KPMs) commonly gathered inbenchmarking studies, which comes under the hard or tangible measures includeswork-in-progress (WIP) levels, lead-time, delivery-time, reject (per cent), rework(per cent), product quality, product reliability, process cycle time, employees skill level,and, etc. However, the authors would like to highlight and recognise that these“hard measures” are the “ends” or the objectives of the benchmarking effort. Thetangible KPMs targets or goals could be achieved through conducting andimplementing change effort such as TQM, business process redesign or reengineering(BPR), quality function deployment (QFD), self-assessment, benchmarking, etc. Inpractice, the application, adoption and implementation of these hard or tangiblemeasures shall depend upon the company needs and their applicability in the SMEsenvironment. The main objectives for monitoring these hard or tangible measures aretowards continuously improving the business process performance and efficiency,products quality, and also in the company’s overall management systems.
For example, high WIP levels may indicate large amount of the company’s money issitting on the shop floor, if not properly monitored and controlled may lead to cash flowproblems. Meanwhile, high reject levels would show that the company’smanufacturing or production processes are not performing very well and thusresulted in a lot of wasted resources. Therefore, the use and application of the hardmeasures in the company for monitoring business performance must be gearedtowards continuous product and service quality improvement, reduced costs and also100 per cent on-time delivery.
The second group of KPMs can be termed as “soft or intangible measures”. Theyare more difficult to quantify in terms of numbers, dollars and cents. However, theyplay very important role in ensuring the success of benchmarking initiatives. In short,
Benchmarkingimplementation
framework
421

these intangible or soft performance measures act as enablers in changing ortransforming the organisation’s overall perception, practice and culture towardscontinuous business survival and competitiveness in the market place. In other words,these intangible measures are the “ends” or “results” of the human resource’s qualityimprovement initiatives, which are targeted towards changing the company’smanagement and employees mind-set. The main purpose of measuring these“soft measures” while implementing the benchmarking effort is to find out whetherthe company’s management and employees are motivated and receptive towards thechange efforts that are taking place. The soft measures may include managementcommitment towards quality improvement, improvement in customer’s satisfaction forboth internal and external customers, existence and practice of team working,employee’s involvement, rewards and suggestion schemes, etc.
Employees’ satisfaction can be achieved not only through “employees caringpractices” but also through activities such as family medical facilities, employee’shealth and safety insurance policy, etc. In most cases, companies really work hard tosatisfy their external customers, however, it has been noticed that very little is donetowards satisfying their internal customers (i.e. employees). To survive and becompetitive in the market place, companies need to satisfy both their internal andexternal customers because only satisfied internal customers can bring satisfaction tothe external customers. Furthermore, sustaining the benchmarking effort is possible ifonly the employees are satisfied and motivated, thus soft measures initiatives must gohand-in-hand with the hard measures. For example, employees will be confused andfrustrated if they were told to perform the benchmarking effort without the appropriateand adequate training relating to the process.
Initially, the benchmarking initiatives should concentrate on the company’sbusiness process weaknesses in which improvement would result in improvedperformance. In SMEs, the hard measures such as machine down-time reduction,machine set-up time, scrap rate, rework, machine repair and material wastages aresome of the main areas on which to focus in the early part of the benchmarking effort.This is important that tangible results are seen early in the implementation process, ifnot, the SMEs will shy away from practising the benchmarking effort and blame for its“lip-service” of promoting more efficient processes and higher quality products.
Self-assessment and benchmarking techniquesThe four basic groups of business process improvement techniques for conductingthe benchmarking process are self-assessment, internal, external and best practicebenchmarking. Self-assessment is a very important process prior to conductingbenchmarking because it provides the company with the critical baseline data on itscurrent business process performance status. In addition, the baseline data could beused as a reference for comparing the company’s future business processesperformance and competitiveness whether they are improving or otherwise.
Having conducted the self-assessment exercise during the early stages of thebenchmarking implementation process, the company can then proceed to conduct theinternal benchmarking. Internal benchmarking can be use as a training ground forunderstanding and implementing benchmarking because it could provide asound-learning base for building-up confidence on the benchmarking technique.In other words, the company must fully understand its own business processes first
BIJ13,4
422

before comparing them with others. Once, this is achieved and when it is no longerpossible to improve against internal performance, the company can then progress toconduct external benchmarking. In general, external benchmarking is more difficult toperform as compared to internal benchmarking, however it can discover newinnovations and produce significant returns. External benchmarking partners maycome from other companies within the same industry or any other industries that sharesimilar business processes. Eventually there comes a point when it is no longerpossible to improve against external partners using similar business processes, thecompany could then proceeds to perform the best practice benchmarking againstexternal partners regardless of business processes, industry sector or location. In thiscase, the most important factor is the “process” being benchmarked. Best practicebenchmarking is more difficult to perform when compared internal and externalbenchmarking, however it could bring breakthrough innovation and significantbusiness process improvement.
General benchmarking methodologyHaving selected the KPMs to be benchmarked and the benchmarking technique to beadopted, there must be a systematic approach for implementing the benchmarkinginitiatives. In other words, the general methodology describes the guidelines or processmap on how to implement or conduct the actual benchmarking process. To ensure it isdone systematically the selected processes to be benchmarked need to go through aseries of process steps. The steps to be taken represent a generic approach towards theimplementation and adoption of the various benchmarking techniques (i.e. internalbenchmarking, external benchmarking, and best practice benchmarking). A generalbenchmarking methodology shown in Figure 9 provides an aid towards betterunderstanding of the benchmarking process. In addition, a simplified example will beused to further illustrate the implementation process for the internal benchmarkingtechnique.
Referring to Figure 9, the first step of the benchmarking process is planning. It isdesigned to develop the plan for conducting the benchmarking investigation. It willform the basis for the entire benchmarking investigation; therefore, every effort shouldbe made to conduct this step as thoroughly as possible. During this step the companyneed to decide and select the processes it wants to benchmark, analyse the processes in
Figure 9.General benchmarking
methodology
4. Action
3. Integration
1. Planning
2. Analysis4. Action
3. Integration
1. Planning
2. Analysis
Benchmarkingimplementation
framework
423
detail, calculate the processes metrics and define their performance gaps, identifycomparative best practice partners, determine data collection method and collect data.The person who is responsible for drafting the benchmarking implementation planshould have a certain level of knowledge, experience and technical know-how inbenchmarking concepts, its practical implementation and application. For example,one should understand what internal benchmarking means, where to implement it,how to implement it; what are their associated CSFs; are they quantifiable, measurableand auditable; is it easy to obtain the data; which specific data to collect; is the dataintegrity reliable; is the resulting CSFs measures can be easily calculated; who shouldbe trained; what preparatory work that should be carried out; how to interpret the data;and, etc. All these questions need to be addressed in the early part of the benchmarkingprocess. In short, proper planning requires a detailed study to prevent a lot of problemsthat might crop-up later on during the benchmarking implementation process.
Having established the detailed plan, the company can then proceed to the analysisstep. In this step, the data collected in the benchmarking study is analysed thoroughlyto find out and provide a basis for comparison. The key questions to be answered inthis step are: what is the performance of the best practice partners; what is ourperformance compared to them; why they are better; what can we learn from them; andhow can we apply the lessons to our company. In other words, this step involvesanalysing the benchmarking data to determine current performance “gap” projectfuture performance levels, identify and understand the practices which contributes tothe best practice partners’ strengths.
The objective of the third step is to develop goals and integrate them into thebenchmarked process so that significant performance improvements are made. The keyquestions to be answered in this step are: has top management accepted thebenchmarking team’s findings; based on the findings do the company need to modifyits benchmarking goals; and also have the goals been clearly communicated to all therelevant parties. In step four, develop the action plans needed to achieve the goalsdecided upon in step three. The key questions that need to addressed in this step are:will the plans allow the achievement of the stated goals; how will benchmarkingprogress be tracked and what is the schedule for recalibration of the benchmarks. Inshort, this step involves the implementation of the necessary actions, monitor theirprogress and finally recalibrate benchmarks.
Benchmarking goalsIn general, the benchmarking goals could be in the form of higher customer satisfaction(i.e. product quality, on-time delivery, lower costs, etc.); better financial performance(i.e. profitability, growth, return on investments, return on assets, etc.); efficientbusiness processes (i.e. cycle time, cost, productivity, etc.); competitiveness (i.e. productcost, product selling price, etc.); and innovative and committed human resources(i.e. employees satisfaction, effectiveness, safety, health, absenteeism, etc.). Thesebenchmarking goals may differ from one company to the other and depends on thecompany objectives in performing the benchmarking effort.
Validation of the conceptual framework for benchmarkingThe proposed conceptual framework for benchmarking implementation was validatedand tested in SMEs. In this section, the authors discuss the general and specific
BIJ13,4
424

comments, criticisms and suggestions made by the pilot case study companies’respondents concerning the framework’s strengths and weaknesses. All the six pilotcase study companies gave very positive comments on the proposed conceptualframework. Their comments are: it is feasible, easily understood and can beimplemented with ease, a comprehensive approach that covers all the major aspects ofthe benchmarking implementation and it provides a straight forward guide, whichcould simplify the benchmarking process even to someone who is new to thebenchmarking concept. In short, the framework could be used as a base for conductingthe benchmarking process even to beginners. Apart from that, most of them agreed theframework is a sensible approach towards conducting benchmarking initiatives inSMEs particularly that involves in the manufacturing sector. In addition, with somemodifications the framework can be made applicable to other types of industries. Mostof them highlighted the top management’s roles and responsibilities in the key areas ofthe framework should be in-place first before embarking on the actual benchmarkingimplementation effort in achieving the vision towards business competitiveness.For example, developing benchmarking strategies, policies, vision and mission forcompetitiveness should form an integral part of the business planning in anorganisation.
All of them agreed that top management must not only give their full commitmentin providing sufficient resources but they must also be committed to implement therecommendations made by the benchmarking team. Meanwhile, five of the pilot studycompanies agreed that the framework’s overall structure is sensible and suitableapproach for SMEs to adopt while implementing benchmarking effort. In addition, fourof them perceived the framework as practical, realistic and uncomplicated, which caneasily be used in real working environment. Other positive comments raised by at leastone of the pilot study company are the framework could give a clear and effective wayof presenting the overall benchmarking concept; and it is a simple approach forincorporating benchmarking effort into a SME.
The pilot study companies also provide a few suggestions and constructivecriticisms that could further enhance the framework’s applicability and usability inSMEs. They are:
. The vision and goal section should also include “competitiveness” advantages inthe area of product quality, cost and delivery (i.e. QCD).
. It is difficult to evaluate costs incurred against the improvement achievedespecially the soft measures in benchmarking implementation.
. A “target to be achieved” should also be included in the general methodologysection while conducting the review step because a “target” will drive thecompany to practice continuous improvement.
. Add continuous improvement and equipment utilisation in the KPMs sectionbecause idle equipment and machineries did not produce any output. A highequipment utilisation indicates the company is maximising the usage of itsavailable facilities, meanwhile, a low utilisation values indicates the machineryand equipment are under utilise.
. Human resource development and training should be focussed on educating theemployees to improve their usage and practices of positive work cultures.
Benchmarkingimplementation
framework
425

. A dedicated coordinator is strongly required to ensure the benchmarkingimplementation program successfulness.
. Most SMEs are always constrained by limited availability of resources(i.e. financial, technical, human and time), therefore this aspect should be takeninto account during benchmarking effort implementation.
In addition, majority of pilot study respondents agrees with the authors that thedifferent types of benchmarking techniques and initiatives may be implementedaccording to the needs of the company and also depends on the resources availabilityand not applied wholesale.
Discussions and conclusionsThe implementation of benchmarking is not, and has not been an easy task for manyorganisations. Majority of the frameworks proposed by previous researchers andconsultants tend to be prescriptive in nature and seems to provide the “steps to betaken” to implement benchmarking in specific area of the business process such as theoperational performance in manufacturing function, value management process,innovation and technology management, evaluating the organization’s quality relatedperformance in operations and customer satisfaction, product development process,rather than being a road map or general outline for implementing benchmarking as awhole.
An insight has been gained into the strengths, weaknesses, similarities anddifferences that exist between the frameworks reviewed by classifying them into twomajor types (i.e. consultant/expert and academic/research based). Theconsultants/experts benchmarking implementation frameworks were actuallyfounded based on practical experience. Meanwhile, academic/research frameworkswere based on conceptual and theoretical background. The literature review showedthat both these types of frameworks suffer from similar weaknesses such as beingcomplicated and prescriptive in nature. Furthermore, most of the frameworks found inthe literature were not specifically developed for the SMEs sector and thus were notsuitable for SMEs. Even if they appear to be suitable, they still suffer from certainproblems such as being complicated and prescriptive, which need addressing. Inaddition, as has been shown from the review, the frameworks developed to date havebeen dominated by large company approaches. The problem highlighted, indicate thatcurrent benchmarking implementation framework still suffer from many weaknessesthat need improvements and are far from suitable for SMEs to apply. SMEs aredifferent in terms of their structures, processes, resources and culture, which need tobe taken into account when developing a framework that fits them. Therefore, theweaknesses of the currently available frameworks, which have been highlighted in thereview, need to be considered when developing an implementation framework to suitthe SMEs needs and environment. In other words, the literature review has providedthe authors with a lot of information on the shortcomings of currently availablebenchmarking frameworks. However, on the positive side, these shortcomings fromprevious benchmarking frameworks could be use as a baseline in formulating theconceptual benchmarking implementation framework for SMEs. The authors believes,what is important in any change effort or initiative, such as benchmarking, is theability to do it right the first time.
BIJ13,4
426

In summary, the literature review had also shown that there is still lack ofbenchmarking framework that was dedicated specifically to the SMEs in themanufacturing sector. Thus, a new benchmarking implementation framework isneeded to fill the gap in the existing literature and to help the SMEs in their effort tobecome more effective, productive and improve their competitiveness level in national,regional and international markets through benchmarking implementation andadoption.
The concepts within the proposed framework have been developed to be simple innature and structure, not prescriptive, provide a systematic approach, present ageneral outline for benchmarking implementation on wholesale basis and encompassmost of the pertinent issues with regards to benchmarking implementation. Theframework does not suggest that all the concepts should be taken wholesale at-one-go,but rather one-at-a-time according to a company’s needs and available resources.Due to their limited resources, SMEs actually need to start the benchmarking andimprovement initiatives in “tangible” measures (such as reject per cent, rework percent, WIP levels, lead-time, etc.) rather than “intangible” measures, which are difficultto quantify in the form of numbers or percentages. This is important because positiveresults at the early stages of the benchmarking implementation would provide futuremotivation and thrust in the benchmarking technique, which in turn, help to sustainthe use of benchmarking practice in improving business and management processes.The use and implementation of hard and soft KPMs for benchmarking purposes mustbe geared towards continuous business processes performance improvement in theorganisation. Past experienced showed that sustainable benchmarking efforts requiremotivated employees, thus soft performance measures must go hand-in-hand withthe hard performance measures. Above all, relevant training must be provided firstbefore embarking on the benchmarking process to ensure its successfulimplementation and adoption.
The conceptual benchmarking implementation framework was empirically testedand validated at six pilot study SMEs in the automotive manufacturing sector. Futureresearch is underway to include the pilot study companies’ suggestions and commentsinto the final version of the framework. Having done that the framework will then bewidely deployed in SMEs in the automotive manufacturing sector. Finally, the authorshope the framework would be of benefit to the SMEs in their pursuit towardsenhancing their business competitiveness and excellence.
References
Aalbregtse, R.J., Hejka, J.A. and McNeley, P.K. (1991), “Total quality management (TQM): howdo you do it?”, Automation, August, pp. 30-32.
Ahmed, P.K. and Rafiq, M. (1998), “Integrated benchmarking: a holistic examination of selecttechniques for benchmarking analysis”, Benchmarking for Quality Management &Technology, Vol. 5 No. 3, pp. 225-42.
Anthony, D. (1983), “Japan”, in Storey, D.J. (Ed.), The Small Firms: An International Survey,Croom Helm, London, pp. 46-83.
APQC (2001), “Process classification framework”, Developed by: APQC’s InternationalBenchmarking Clearinghouse In Partnership with Arthur Andersen & Co., SC.
Baumack, C.M. (1988), How to Organise and Operate Small Business, 8th ed., Prentice-Hall,Englewood Cliffs, NJ.
Benchmarkingimplementation
framework
427

Brah, S.A., Ong, A.L. and Rao, B.M. (2000), “Understanding the benchmarking process inSingapore”, International Journal of Quality & Reliability Management, Vol. 17 No. 3,pp. 259-75.
Cassell, C., Nadin, S. and Gray, M.O. (2001), “The use and effectiveness of benchmarking inSMEs”, Benchmarking: An International Journal, Vol. 8 No. 3, pp. 212-22.
Chee, L.P. (1987), Industrial Development: An Introduction to the Malaysian Industrial MasterPlan, Pelanduk Publications, Kuala Lumpur.
Chin, K.S., Pun, K.F., Lau, C.S. and Lau, H. (2001), “Performance improvement of internationalroaming service: a benchmarking study”, Benchmarking: An International Journal, Vol. 8No. 2, pp. 120-31.
Crow, K. (1999), Benchmarking Best Practices to Improve Product Development, DRM Associates,2613 Via Olivera, Palos Verde’s, CA 90274.
Davies, A.J. and Kochhar, A.K. (2000), “A framework for the selection of best practices”,International Journal of Operations & Production Management, Vol. 20 No. 10, pp. 1203-17.
Drew, S.A.W. (1997), “From knowledge to action: the impact of benchmarking on organizationalperformance”, Long Range Planning, Vol. 30 No. 3, pp. 427-41.
Elnathan, D. and Kim, O. (1995), “Partner selection and group formation in cooperativebenchmarking”, Journal of Accounting & Economics, Vol. 19 No. 345, p. 364.
Fong, P.S.W., Shen, Q. and Cheng, E.W.L. (2001), “A framework for benchmarking the valuemanagement process”, Benchmarking: An International Journal, Vol. 8 No. 4, pp. 306-16.
Ghobadian, A. and Gallear, D.N. (1996), “Total quality management in SMEs”, Omega,International Journal Management Science, Vol. 24 No. 1, pp. 83-106.
Ghobadian, A. and Gallear, D. (1997), “TQM and organization size”, International Journal ofOperations & Production Management, Vol. 17 No. 2, pp. 121-63.
Greenan, K., Humphreys, P. and McIvor, R. (1997), “The green initiative: improving qualityand competitiveness for European SMEs”, European Business Review, Vol. 97 No. 5,pp. 208-14.
Haksever, C. (1996), “Total Quality Management in the Small Business Environment”, BusinessHorizon, Vol. 39 No. 2, pp. 33-40.
Hall, C. (1995), “APEC and SME policy: suggestions for an action agenda”, Australian APECStudy Centre, Issues Paper No. 1, available at: www.arts.monash.edu.au.auspec/iss1.htm
Hashim, M.K. and Wafa, S.A. (2002), Small & Medium Sized Enterprises in Malaysia –Development Issues, Prentice-Hall, Englewood Cliffs, NJ.
Hinton, M., Francis, G. and Holloway, J. (2000), “Best practice benchmarking in the UK”,Benchmarking: An International Journal, Vol. 7 No. 1, pp. 52-61.
Hornby, A.S. (1990) in Cowie, A.P. (Ed.), Oxford’s Advanced Learner Dictionary of CurrentEnglish, 4th ed., Oxford University Press, Oxford.
Husband, S. and Mandal, P. (1999), “A conceptual model for quality integrated management insmall and medium size enterprises”, International Journal of Quality & ReliabilityManagement, Vol. 16 No. 7, pp. 699-713.
Huxtable, N. (1995), Small Business Total Quality, Chapman & Hall, London.
Jeffcoate, J., Chappell, C. and Feindt, S. (2002), “Best practice in SME adoption of e-commerce”,Benchmarking: An International Journal, Vol. 9 No. 2, pp. 122-32.
Jenin, M.Y.B. (2000), “Functional benchmarking: a system for managing customer complaints – acase study in national productivity corporation”, MSc dissertation, Universiti KebangsaanMalaysia.
BIJ13,4
428

Kim, S.J. and Suh, J.W. (1991), Cooperation in Small and Medium – Scale Industries in ASEAN,Asia and Pacific Development Centre, Kuala Lumpur, pp. 9-28.
Kraipornsak, P. (2002), “The plastic industry of Thailand”, available at: www.econ.chula.ac.th/about/member /paitoon_k/Thailand.pdf
Lee, P.M. (2002), “Sustaining business excellence through a framework of best practices inTQM”, The TQM Magazine, Vol. 14 No. 3, pp. 142-9.
McAdam, R. and Kelly, M. (2002), “A business excellence approach to generic benchmarking inSMEs”, Benchmarking: An International Journal, Vol. 9 No. 1, pp. 7-27.
Malaysia (1998), “The small scale industry division in the ministry of international trade andindustry definition of SMEs”, Information Malaysia Year Book, Berita Publishing SdnBhd, Kuala Lumpur.
Medori, D. and Steeple, D. (2000), “A framework for auditing and enhancing performancemeasurement systems”, International Journal of Operations & Production Management,Vol. 20 No. 5, pp. 520-33.
Meredith, G.G. and Grant, G. (1982), Small Business Management in Australia, 2nd ed.,McGraw-Hill, London.
MITI (1998), “Redefinition of manufacturing SMEs”, Press Release by Ministry of InternationalTrade and Industry (MITI), Malaysia, Utusan Malaysia, 19th January.
Monkhouse, E. (1995), “The role of competitive benchmarking in small to medium-sizedenterprises”, Benchmarking for Quality Management & Technology, Vol. 2 No. 4, pp. 41-50.
NPC (1999), Achieve business excellence through best practices, Malaysian Benchmarking Service,The Best Practices Division, National Productivity Corporation, available at: www.npc.org.my
NPC (2001), National productivity corporation, Malaysia. URL – www.npc.org.my
Parkin, M.A. and Parkin, R. (1996), “The impact of TQM in UK SMEs”, Industrial Management &Data Systems, Vol. 96 No. 4, pp. 6-10.
Pickle, H.B. and Abrahamson, R.L. (1990), Small Business Management, Wiley, New York, NY.
Popper, K.R. (1994), The Myth of the Framework: In Defense of Science and Rationality,Routledge, London.
Rahman, S. (2001), “A comparative study of TQM practice and organisational performance ofSMEs with and without ISO 9000 certification”, International Journal of Quality &Reliability Management, Vol. 18 No. 1, pp. 35-49.
Reed, F.M., Walsh, K. and Grice, R. (2001), “Supporting the information needs of smallmanufacturing firms”, paper presented at 25th ISBA National Small Firms Policy andResearch Conference, Competing Perspectives of Small Business and Entrepreneurship.
Rose, T. (2000), “PhD project – SME growth, enterprise integration”, available at: www.crankfield.ac.uk/sims/cim/people/rose.htm
Salleh, M. and Fichtner, G. (1991), Promotion of SMEs: Policy Environment and InstitutionalFramework, Government Printer, Kuala Lumpur.
Sarkis, J. (2001), “Benchmarking for agility”, Benchmarking: An International Journal, Vol. 8No. 2, pp. 88-107.
Sevilla, R.C. and Soonthornthada, K. (2000), SME Policy in Thailand: Vision and Challenges,Institute for Population and Social Research, Mahidol University, Salaya Campus, NakhonPathom, Thailand.
Shan, S. (2000), “SMEs still strong”, Malaysian Enterprise, March, pp. 54, 55.
Benchmarkingimplementation
framework
429

SMI Business Directory (2002), The Official Business Directory of SMI Association of Malaysia,SMI Association Malaysia, Kuala Lumpur.
(1998), “SMIDEC IKS bagi perkilangan didefinisikan semula”, Utusan Malaysia, 19 January 1998.
SMIDEC (2002), SMI Development Plan (2001 – 2005), Small and Medium IndustriesDevelopment Corporation, Kuala Lumpur.
Spendolini, M.J. (1992), “The Benchmarking Process”, Compensation & Benefits Review, Vol. 24No. 5, pp. 21-9.
Storey, D.J. (1994), Understanding the Small Business Sector, Routledge, London.
Struebing, L. and Klaus, L.A. (1997), “Small businesses thinking big”, Quality Progress,February 1997, pp. 23-27.
Voss, C.A., Chiesa, V. and Coughlan, P. (1994), “Developing and testing benchmarking andself-assessment frameworks in manufacturing”, International Journal of Operations &Production Management, Vol. 14 No. 3, pp. 83-100.
Welsh, J. and White, J. (1981), “A small business is not a little big business”, Harvard BusinessReview, July-August, pp. 18-32.
Yusof, S.M. (2000), “Development of a framework for TQM implementation in small businesses”,unpublished PhD thesis, Faculty of Engineering, University of Birmingham.
Yusof, S.M. and Aspinwall, E. (2000a), “A conceptual framework for TQM implementation forSMEs”, The TQM Magazine, Vol. 12 No. 1, pp. 31-6.
Yusof, S.M. and Aspinwall, E. (2000b), “Total quality management implementation frameworks:comparison and review”, Total Quality Management, Vol. 11 No. 3, pp. 281-94.
Zairi, M. (1994), “Benchmarking: the best tool for measuring competitiveness”, Benchmarking forQuality Management & Technology, Vol. 1 No. 1, pp. 11-24.
Further reading
Parker, O. and Kovacs, N. (2001), “The benchmarking advantages a benefit management tool”,Canadian HR Reporter, pp. 10-12.
Corresponding authorSha’ri Mohd Yusof can be contacted at: [email protected]
BIJ13,4
430
To purchase reprints of this article please e-mail: [email protected] visit our web site for further details: www.emeraldinsight.com/reprints
The use of multi-attribute utilitytheory to determine the overallbest-in-class performer in a
benchmarking studyTerry R. Collins
Department of Industrial Engineering, Texas Tech University, Lubbock,Texas, USA
Manuel D. Rossetti and Heather L. NachtmannDepartment of Industrial Engineering, University of Arkansas, Fayetteville,
Arkansas, USA, and
James R. OldhamWhirlpool, Inc., Fort Smith, Arkansas, USA
Abstract
Purpose – To investigate the application of multi-attribute utility theory (MAUT) to aid in thedecision-making process when performing benchmarking gap analysis.
Design/methodology/approach – MAUT is selected to identify the overall best-in-class (BIC)performer for performance metrics involving inventory record accuracy within a public sectorwarehouse. A traditional benchmarking analysis is conducted on 14 industry warehouse participantsto determine industry best practices for the four critical warehouse metrics of picking and inventoryaccuracy, storage speed, and order cycle time. Inventory and picking tolerances are also investigatedin the study. A gap analysis is performed on the critical metrics and the absolute BIC is used tomeasure performance gaps for each metric. The gap analysis results are then compared to the MAUTutility values, and a sensitivity analysis is performed to compare the two methods.
Findings – The results indicate that an approach based on MAUT is advantageous in its ability toconsider all critical metrics in a benchmarking study. The MAUT approach allows the assignment ofpriorities and analyzes the subjectivity for these decisions, and provides a framework to identify oneperformer as best across all critical metrics.
Research limitations/implications – This research study uses the additive utility theory (AUT)which is only one of multiple decision theory techniques.
Practical implications – A new approach to determine the best performer in a benchmarking study.
Originality/value – Traditional benchmarking studies use gap analysis to identify a BIC performerover a single critical metric. This research integrates a mathematically driven decision analysistechnique to determine the overall best performer over multiple critical metrics.
Keywords Benchmarking, Performance measures, Utility theory, Sensitivity analysis, Gap analysis,Best practice
Paper type Research paper
IntroductionFor decades, practitioners in the public and private sector have adopted thebenchmarking approach as a useful tool for performance and quality assessments.Landmark benchmarking studies have been performed and the results widely
The current issue and full text archive of this journal is available at
www.emeraldinsight.com/1463-5771.htm
Use ofmulti-attribute
utility theory
431
Benchmarking: An InternationalJournal
Vol. 13 No. 4, 2006pp. 431-446
q Emerald Group Publishing Limited1463-5771
DOI 10.1108/14635770610676281

publicized over the years (Camp, 1989; Kolarik, 1995; McNamee, 1994; Yasin, 2002).Benchmarking has many benefits to the organization; however, the data analysisaspect of the process is an area in need of further refinement. For example, how can itbe proven that the best practices realized are actually the best? How can the relevanceof best practices be assessed by an organization? And finally, what is the best methodfor determining the best practices?
A recent study discovered difficulties in determining the best-in-class (BIC)performer because of dissimilar reporting statistics and varying analysis techniques(Roider, 2000). Another study finds that the adopting best practices are related toresource constraints, size of organization, and the comparability of data (Hinton et.al.,2000). Classic benchmarking analysis tools of flow charts, matrix analysis, spidercharts, and Z-charts “have no structured means to evaluate the data, characterize andmeasure performance gaps, and project future performance levels (Barr and Seiford,1996).” Therefore, a benchmarking group must identify a correct data analysis tool touse.
This research utilizes and validates the decision-based analysis tool ofmulti-attribute utility theory (MAUT) for the benchmarking gap analysis process.This analytical approach provides a robust mathematical method to determine anoverall best performer for a selected best practice. MAUT is a relevant addition to thebenchmarking process for this method carefully evaluates the trade-off issuesassociated with the risks and benefits of considering multiple criteria at the same time.
A warehouse benchmarking study in the public sector is used as a case study tocompare the mathematical decision method of MAUT against traditionalbenchmarking practices. The case study first presents the traditional processbenchmarking approach, which focuses on sampling other warehouses across multipleindustries to identify BIC performance metrics for warehouse management. Next, a gapanalysis is performed to compare general industry results to the public sectors’ currentoperating procedures to identify opportunities for adaptation. The results of the gapanalysis identify the BIC performer. The gap analysis results are compared with theMAUT technique to evaluate the applicability and fit of MAUT as a more quantitativedecision making approach for benchmarking. Utility values and relative weightsare assigned using the benchmarking data. Finally, sensitivity analysis is performed todetermine the outcome effects of varying the relative weight values.
Multi-attribute utility theoryMAUT provides a comprehensive set of quantitative and qualitative approaches tojustify a decision between alternatives (Canada and Sullivan, 1989), such as identifyingthe BIC performer in a benchmarking study. A specific type of multi-attribute decisiontheory MADT, called MAUT, is evaluated for its applicability to benchmarkinganalysis. Utility theory takes into account a range of the consequences of a particulardecision and the risks of this decision, just as probability theory does for uncertainty.MAUT is selected as a viable method for improving benchmarking analysis due to itsrelative ease of both formation and computation. The MAUT approach enables thedecision maker to incorporate preference and value trade-offs for each metric andmeasure the relative importance of each (Keeney and Raiffa, 1993). While other MAUTstudies have been performed, there still exists a need for documented applications ofthis type of analysis (Walls, 1995). Bordley (2001) describes the use of MAUT to
BIJ13,4
432

perform gap analysis for service research. The resulting gap analysis discounts thegap between performance and expectations, providing more empirical inferences thanconventional gap analysis (Bordley, 2001). It is expected that applying MAUT tobenchmarking will yield the same benefits.
Multi-attribute utility theoryThe basic goal of MAUT is to substitute information with an arbitrary measure calledutiles so that the information can be compared. The utile values range from a low of0 to a high of 1, with intermediate values decided upon by the decision maker. Theidentified critical metrics are plotted on a graph from 0 (worst case) to 1 (best case).Then, a utility curve is plotted to model the subjective value of each outcome(Daellenbach, 1994).
The end result of MAUT is simply to maximize the combined utility value (Keeneyand Raiffa, 1993). Each metric is assigned a utile value and is combined with other utilevalues to assess an aggregate utility value according to set mathematical procedures.These procedures are explained in detail in the next paragraph. MAUT allows thedecision maker to develop reasonable preference criteria, determine which assumptionsare most appropriate, and assess the resulting utility functions (Lindey, 1985).
For this research, additive utility theory (AUT) is chosen for the following tworeasons:
(1) AUT provides a more practical methodology due to easier computationalanalysis.
(2) AUT is easier to understand and explain to decision makers.
AUT allows the benchmarking party to assign priorities to certain metrics and allowsstratification of all critical metrics. Also, AUT can be applied using common spreadsheetsoftware, which is readily available in most business settings. No components of theformulation require complex iterative solutions. This analysis method uses subjectivityin formulating the relative weight factors (ki), which therefore requires sensitivityanalysis to be conducted to ensure the robustness of the assessment.
For i alternatives with j attributes, the additive utility model is expressed:
U ðxiÞ ¼Xn
j¼1
kj*ujðxijÞ ð1Þ
Xn
j¼1
kj ¼ 1:0 ð2Þ
where: kj is a relative weight factor of the jth attribute, uj(xij) is the utility of theoutcome xij for the jth attribute, All attributes are independent of each other.
Sensitivity analysis and additive utility theoryAUT requires personal subjectivity. Because of this, extensive and thoroughsensitivity analysis is necessary for justifying the end objective scores. The purpose ofthis analysis is to determine how sensitive the outcome is to changes in the variablevalues. This step is crucial because small changes in assigned values could produce
Use ofmulti-attribute
utility theory
433

very different results. Sensitivity analysis identifies these small changes and allows thedecision maker to decide if the values need to be adjusted. Also, sensitivity analysiscan identify user bias and help the decision maker to re-evaluate the original criteriaused (Daellenbach, 1994).
A least squares method of sensitivity analysis for AUT was developed by Barronand Schmidt (1988). For known single attribute value functions uj(xij), this methodcomputes, for two independent alternatives, new kj (noted as wj in the equation) valuesrequired to make the total utility value of alternative xi exceed the total utility value ofalternative xb by an amount D whose value is decided upon by the researcher. The leastsquares method is expressed as:
minimize:
Xn
j¼1
ðwj 2 kjÞ2 ð6Þ
subject to:
Xn
j¼1
wjaj ¼ D ð7Þ
Xn
j¼1
wj ¼ 1
wj $ 0 ð8Þ
aj ¼ ujðxijÞ2 ujðxbjÞ ð9Þ
xb is the BIC performer discovered for initial relative weights bj; i – j. (Barron andSchmidt, 1988)
After the wj values are found, sensitivity analysis can be performed. For example, ifattribute A is deemed twice as important as attribute B, all wj values violating this canbe ruled out. Also, varying levels of D in the above formulation allows sensitivityanalysis for the implied relationship between alternatives i and b, and thecorresponding effect on all other alternatives (Barron and Schmidt, 1988).
In essence, a formal MAUT analysis forces the benchmarking party to clearly defineits priorities and measure the attractiveness of a discovered best practice. This isespecially crucial in benchmarking studies, as the effects of the study are far-reachingthroughout the organization (Forger, 1998). As benchmarking studies continue tobecome more complex, traditional benchmarking tools do not apply to new research(Ammons, 1999), and the need for more powerful benchmarking techniques increases.
Research methodology and proceduresThe research methodology is broken down into a two-stage process. First, existing casestudy data will be presented from the warehouse benchmarking study. Next, a MAUTcomparison will be conducted using the gap analysis results of the benchmarkingstudy. In each stage of the research process there are several steps or procedures. Steps1-4 are related to the case study, while the remaining steps are procedures for theMAUT comparison.
BIJ13,4
434

Case study application:
(1) identify the goals and objectives for the benchmarking study;
(2) select critical benchmarking metrics using multiple criteria;
(3) perform a gap analysis on the benchmarking metrics; and
(4) define gap analysis recommendations from the benchmarking study.
Comparison between MAUT and traditional benchmarking process:
(5) assign utility values to the critical metrics;
(6) calculate and assign the relative weights for the selected benchmarking metrics;
(7) perform a sensitivity analysis on the utility values; and
(8) analyze the results of the comparison.
Case study applicationTo evaluate the use of MAUT as a decision-making tool for benchmarking, a casestudy is presented using data from a warehouse study. The warehouse study usedbenchmarking to investigate warehouse best practices in the public and privatesectors. The case study provides information on the goals of the benchmarking studyand how the critical benchmarking metrics are selected based on benchmarking bestpractices for the study. The traditional gap analysis approach and recommendationsare presented to identify the benchmarking best practices.
Benchmarking goals. The benchmarking study compared a warehouse’s inventoryintegrity procedure to that of their competition. In other words, what are the acceptablelevels of performance for selected best practices used in the inventorying process. Thepurpose of the study is to provide recommendations for improving record accuracy,identifying policies for physical inventories, and methods to sustain inventoryintegrity. The areas of particular interest for the sponsoring warehouse are as follows:
. How does industry set tolerance levels for inventory accuracy reporting? That is,how much of an error in reported inventory levels is acceptable for recordinginventory performance? The objective is to identify best practices for settinginventory accuracy tolerance levels.
. How does industry handle errors during a picking operation? That is, when anorder is being filled, what actions are taken if an error is discovered during thisprocess?
. Does industry perform cycle counting or 100 percent wall-to-wall inventories?That is, does the warehouse ever conduct regular interval counts on particularitems or check every single item in the entire warehouse? How often does thisoccur, and what methods are employed to achieve this?
. What is the highest inventory and picking accuracy rates that can be expected?That is, assuming best practices are implemented, what are the predictedaccuracy targets?
Identification of critical metrics. The identification of the critical metrics is essential tosuccessful benchmarking. If the improper metrics are chosen, the end result may beuseless. Proper tracking of the selected performance metrics can identify best practicesin the benchmarking study. In this study, warehouse square footage, number ofemployees, dollar value of material handling equipment, and types of items handled
Use ofmulti-attribute
utility theory
435
were reported. In addition, specific warehouse accuracy indicators such as inspectionand order accuracy are sampled. The sponsoring warehouses identified the followingcritical performance metrics for the case study (Frazelle and Hackman, 1994):
. Picking accuracy is defined as the number of correct picks performed divided bythe total number of pick performed. That is, what percentage of the time is thepicker able to select both the correct stock keeping unit (SKU) and the correctquantity?
. Inventory accuracy is defined as the number of items found in its correct locationand quantity when conducting an inventory. That is, what percentage of the timeis the location on the shelf identical to the inventory record?
. Storage time is defined as the time required placing new stock to a specificlocation in the warehouse. That is, how long does it take to move material fromthe loading dock to its stocking location?
. Order cycle time is defined as the time required to complete an order once pickingbegins. That is, how long does it take to ship an order once the picking processbegan?
Gap analysis and recommendations. A narrative style of gap analysis is used asdescribed by Keehley et al. (1997). This method consists of three parts: statement of thequestion, identification of the gap in the procedures, and recommendations for closingthe gap. In the gap analysis section, the rationale behind each question and the criticalmetric used for the analysis is described. The methodology was successful indeveloping recommendations for the specific areas of interest.
Based on the gap analysis, answers are provided to the original four key questionsposed at the initiation of the study were obtained as follows:
(1) How does industry set tolerance levels for inventory accuracy reporting?
(2) The BIC performer for inventory accuracy does not use tolerance levels forreporting purposes.
(3) How does industry handle errors during a picking operation?
(4) The BIC performer for picking accuracy checked nearby locations and triggeredan inventory to be taken. Also, a second party is sent to re-check the error.
(5) Does industry perform cycle counting or 100 percent wall-to-wall inventories?
(6) The BIC performer for inventory accuracy used control group andactivity-based cycle counting. The use of 100 percent wall-to-wall inventoriesand its effect on inventory integrity is inconclusive.
(7) What is the highest inventory and picking accuracy rates that can be expected?
(8) The absolute BIC performers achieved a reported 99.999 percent inventoryaccuracy and 99.9 percent picking accuracy. This level is achieved by usingcycle counting, radio frequency identification (RFID) for picking and storingoperations, and a computer system that monitored all warehouse policies.
MAUT comparisonAssigning utility values. To assign utility values, a judgment must be made on whatperformance level is assigned its associated utility. The research team worked closely
BIJ13,4
436

with experts associated with the study to assign the utility values. It should be notedthat most benchmarking studies would deal with several groups by varying utilityvalues for each metric. This research is not directly concerned with combining grouputility values, but primarily examines the difference utility assignment has on theidentification of the BIC for this data set. For case studies regarding group utilityvalues, see Eyrich (1991) and Korpela and Tuominen (1996).
Tables I and II show the utility assignments used for picking and inventoryaccuracy utility assignments. To allow all pertinent data to be evaluated, the lowerbounds of the utility curve had to be set. The lowest possible performance for bothpicking and inventory accuracy, 0.0 percent, is assigned a 0 utility value so that anypossible picking or inventory accuracy can be represent by a utility value. This allowsall responses for a particular question to receive a utility value for each metricregardless of other responses. However, the same method does not work for storageand order cycle time lower bound assignments. After multiple discussions, it wasdetermined that any times equal to 120 hours or more should be assigned a 0 utilityvalue. This lower bound is chosen for its application in the sponsoring organization’sown warehouse procedures. Cycle times above 120 hours are unsuitable for thisoperation. For inventory and picking tolerances, it was determined that any tolerancelevel of 5 percent or more should be given a utility value of 0. This limit is chosen due tothe fact that a decrease in 5 percent of actual accuracy severely affected BICidentification and the validity of the best practices identified.
After calculating the lower bounds, the upper bounds are calculated. The theoreticalBIC is designated as a 100 percent level for picking and inventory accuracies and 0 timeunits for storage and order cycle times. Although these values are virtually unattainable,they provide an upper bound for these metrics. Also, inventory and picking tolerancesset at 0 percent are considered BIC. Therefore, inventory and picking accuracies are notassumed under any tolerance and are interpreted as absolutes. To assign intermediateutility values, judgment on the relative difficulty of increasing accuracy or decreasing
Picking accuracy ( percent) Utility value
Top 100 1.00Level 1 99.9 0.80Level 2 99.5 0.60Level 3 99.0 0.40Level 4 95.0 0.20Level 5 0.00 0.00
Table I.Picking accuracy utility
assignment
Inventory accuracy (percent) Utility value
Top 100 1.00Level 1 99.5 0.80Level 2 99.0 0.60Level 3 98.0 0.40Level 4 95.0 0.20Level 5 0.00 0.00
Table II.Inventory accuracyutility assignment
Use ofmulti-attribute
utility theory
437

time must be determined. For example, an increase from 90 to 95 percent may be easier toachieve than an increase from 99 to 99.5 percent. A close breakdown of each basic metricwill identify which levels of performance mark an increase in capacity and thus a higherutility value. To create the utility curves, the performance criteria for picking andinventory accuracies are analyzed first. It is determined that accuracy values increaserapidly from 95 to 100 percent, with increases in this range doubling every 1/2 percent.The graph becomes asymptotic (relative to 1 utile value) as the accuracy approaches100 percent. It should be noted that the configurations around the extreme values forthese curves is debatable. The utility values as they approach the highest level couldsuggest less utility gain. For example, if someone received a donation of $100, thenreceived another $100, their utility value would be favorable. However, if someonereceived a donation of $100,000, then $100 more, their utility value would not be asfavorable as in the first condition. This scenario existed in the utility curves for accuracylevels and cycle times. The expected utility gain in these curves continues to be high,even as inventory accuracy increases from 99.99 to 100.00 percent. However, theformulated curve represented the preliminary reasoning that examined how difficultchange above a certain level became.
Next, the sponsoring organization and research team analyzed the utilityassignments for storage and order cycle times. The utility assignments used forstorage and order cycle times are presented in Tables III and IV. It is decided that anytimes less than one complete day (24 hours) or less would determine the bounds from autile value of 0.2. This is chosen to allow time ranging from 8 to 5 hours to have amarked improvement in utility assignment. This line would again break at 2 hours,allowing even more value to be assigned to shorter cycle times.
Finally, the utility assignments to use for the tolerance levels used in reportingaccuracies are analyzed. Tables V and VI show the resulting utility assignments used forinventory and picking tolerances. As stated earlier, the lower bound for tolerance limitsis assigned as 5 percent. It is decided to construct the utility curve as a linear relationship
Storage time (in hours) Utility value
Top 0 1.00Level 1 2 0.80Level 2 5 0.60Level 3 8 0.40Level 4 24 0.20Level 5 120 0.00
Table III.Storage time utilityassignment
Order cycle time (in hours) Utility value
Top 0 1.00Level 1 2 0.80Level 2 5 0.60Level 3 8 0.40Level 4 24 0.20Level 5 120 0.00
Table IV.Order cycle time utilityassignment
BIJ13,4
438

between the best possible (0 percent) and worst possible (5 percent). This decision ismade to allow an equal penalty to be assigned as inventory tolerance increased.
The utility curve could now be plotted and all associated utility values for eachresponse can be calculated. Because the methods for fitting curves to the utilityassignments are most commonly done by hand, it is decided to use a linear relationshipbetween each pair of data points to set intermediate utility values. Also, this linearrelationship allows the easiest interpolation of intermediate metric values.
Calculation of relative weights. To evaluate the total utility for each warehouse, allsix metrics must be compared. However, one metric may be favorable over others dueto the design of the survey and from the responses acquired. The following list outlinesthe reasoning for choosing a relative ranking scale:
. Which metrics are more important: picking accuracy, inventory accuracy,storage time, or order cycle time? How does inventory and picking tolerancesrelate to these metrics?
. Why is one metric more important and how much more important (in terms of kjvalues)?
The selected relative weights can deal with these problems and help justify theidentification of the BIC across all metrics, which adds robustness to the results.The relative weights are used in calculating the total utility for each participant. Thesponsoring organization and the research team discussed the priorities of the currentwarehouse policies. It is deemed that the benchmarking best practice metrics should bearranged in the following order of importance:
. picking accuracy;
. inventory accuracy;
. storage time; and
. order cycle time.
Inventory tolerance (percent) Utility value
Top 0.0 1Level 1 1.0 0.8Level 2 2.0 0.6Level 3 3.0 0.4Level 4 4.0 0.2Level 5 5.0 0
Table V.Inventory tolerance
utility assignment
Picking tolerance (percent) Utility value
Top 0.0 1Level 1 1.0 0.8Level 2 2.0 0.6Level 3 3.0 0.4Level 4 4.0 0.2Level 5 5.0 0
Table VI.Picking tolerance utility
assignment
Use ofmulti-attribute
utility theory
439

Inventory and picking tolerances are not considered warehouse performance metrics,but this study wanted to investigate the relationship between the four metrics mentionedabove and the inventory and picking tolerances which are set by management.
From this original examination, it is determined that picking and inventoryaccuracy rates identified BIC more than storage and order cycle times and tolerancevalues. Therefore, the following relative weight assignments are formulated. Table VIIshows the initial relative weights assigned to this data.
Sensitivity analysis. A sensitivity analysis is then performed to justify the relativeweights, which are ultimately affecting the identification of the BIC performers. Withthe initial utility value for each participant calculated, sensitivity analysis is conductedfor each relative weight used in this calculation. Each weight factor is altered toidentify the critical weights that will change the identity of the BIC performers. Thisstep is crucial in the analysis of each weight factor to ensure a top performer is noteliminated or created by marginal changes in each relative weight.
To perform sensitivity, the least squares method described by Barron and Schmidt(1988) in equations 6-9 is used. The BIC participant (xb) is identified and used for theassociated calculation. A pair-wise comparison is then made to each participant to calculatethe associated kj values necessary to have equivalent total utility values (D ¼ 0). Then, thecumulative utility values for all participants are calculated to discover if BIC identificationhas changed. Once tested for sensitivity and justified weight factors are found, the bestoverall performer is identified and recommendations are gathered from this respondent.
Data analysis of MAUT results. After sensitivity analysis, the participant with thehighest combined utility value is identified. Then, their associated responses are analyzed.The specific operating procedures for the entire warehouse accuracy process are evaluatedand recorded. Gap analysis is performed from this data to the home processes to developrecommendations for improvements. Once this gap analysis is complete, therecommendations realized through MAUT are compared to the previous analysis.
Comparison of results. Using the previously obtained data, a pair-wise comparisonis made to identify the different suggestions made for each question. A comparison ismade between what suggestions the original study provided compared to thesuggestions provided by MAUT. For each question, a pair-wise comparison is made toidentify the different suggestions realized for the four critical questions posed duringthe previous research:
(1) How does industry set tolerance levels for inventory accuracy reporting?
(2) How does industry handle errors during a picking operation?
(3) Does industry perform cycle counting or 100 percent wall-to-wall inventories?
(4) What is the typical inventory and picking accuracy rate that can be expected?
Metric Symbol Relative weight
Picking accuracy kp 0.45Inventory accuracy ki 0.35Storage time ks 0.10Order cycle time ko 0.05Inventory tolerance kit 0.025Picking tolerance kpt 0.025
Table VII.Relative weightassignment
BIJ13,4
440

It is anticipated that the suggestions identified through MAUT are similar for somequestions, while others may be very different.
However, the careful consideration of applying MAUT is to add robustness to thedecision criteria that identified these critical metrics. The purpose of this analysis is toexamine the additional information MAUT provided for this data set.
Discussion of resultsCase study dataAfter completing the questionnaires, the 14 participant’s responses to the basicwarehouse metrics are recorded. Table VIII shows the raw data recorded for thesefourteen warehouses. With the data recorded, a quick comparison is warranted toensure the previously formulated utility assignments are valid for this data set. Pickingaccuracy ranged from a low of 85.000 percent to a high of 99.999 percent. Inventoryaccuracy ranged from a low of 82.000 percent to a high of 99.900 percent. Storage speedranged from just under one hour up to 48 hours. Order cycle time ranged from10 minutes up to 120 hours. Inventory accuracy tolerances ranged from 0.0 to5.0 percent; the majority of warehouses did not use inventory tolerances for calculatingaccuracy. Picking tolerances ranged from 0.0 to 5.0 percent; again, the majority ofwarehouses did not use picking tolerances for calculating accuracy.
From the original assignments presented in the methodology section, the researchteam felt the original utility assignments would work for this data set. The originalranges allowed both extremes of each metric to be evaluated using MAUT. The nextstep is to convert each warehouse metric into its new utility value and evaluate the datausing the relative weight factors.
Utility values and relative weightsUtility curves for each metric are used to calculate the proper utility assignment foreach metric. Then, the value is mapped to the curve to assign the utility value to eachperformance metric. After the utility values are assigned, the relative weights aremultiplied by each of the corresponding metrics to arrive at a total additive utility
WarehouseID
Pickingaccuracy
Inventoryaccuracy
Storagespeed
Ordercycle time
Inventorytolerance
Pickingtolerance
1 0.991 0.973 10.417 8.283 0.050 0.0502 0.994 0.924 21.600 26.400 0.000 0.0003 0.990 0.970 3.000 1.000 0.010 0.0004 0.999 0.980 48.000 0.167 0.000 0.0005 0.981 0.982 24.000 0.100 0.000 0.0006 0.900 0.820 3.000 0.133 0.030 0.0107 0.995 0.950 24.000 120.000 0.000 0.0008 0.996 0.999 1.500 3.000 0.000 0.0009 0.950 0.850 8.000 1.670 0.100 0.010
10 0.990 0.985 6.000 0.083 0.000 0.00011 0.998 0.976 35.280 24.000 0.046 0.04612 0.997 0.997 8.000 6.000 0.000 0.00013 0.980 0.970 4.000 4.000 0.000 0.00014 0.850 0.900 1.000 0.500 0.000 0.000
Table VIII.Raw data
Use ofmulti-attribute
utility theory
441

value. The combined utility values are derived from equation 1. Table IX shows theresults of the initial utility value assignments for these data and the relative ranking ofeach warehouse’s combined utility.
From this analysis, Warehouse 8 has the highest additive utility value of 0.807.Warehouse 9 has the lowest additive utility of 0.254. The next step is to use sensitivityanalysis to check if slight variations in relative weight factors would affect theidentification of BIC status.
Sensitivity analysisSensitivity analysis is performed according to the method presented by Barron andSchmidt (1988). This method calculated the required change in relative weight factorsto make a particular warehouse’s additive utility value equal to the original BIC’additive utility value using the least squares principle. The utility data are re-evaluatedusing the new relative weight factors to produce the corresponding additive utility forall participants. Table X shows the results of the sensitivity analysis, the relativeweights calculated, and the corresponding warehouse deemed BIC for this set ofrelative weights. The BIC column for each warehouse ID denotes the particularwarehouse that is identified as BIC under the calculated wj values.
This sensitivity allowed the calculation of new relative weights and evaluation ofthese new values. The sensitivity analysis proved that marginal changes in the originalrelative weights would not alter the identification of BIC. Also, one warehouse isunable to converge to a solution, as all metrics are below that of the BIC performer.That is, the least squares procedure will not converge with this series; the BIC wouldalways have a higher utility for any and all relative weights greater than or equal tozero.
Finally, five warehouses calculated a least squares solution of 0.50 and 0.50for inventory and picking tolerances, respectively. The result of this sensitivityanalysis produced multiple BIC rankings, as most warehouses did not use tolerances.
kp ki ks ko kit kpt
0.450 0.350 0.100 0.050 0.025 0.025Warehouse ID upick uinv ustore uoct uit upt Utility value Relative ranking
1 0.440 0.351 0.370 0.396 0.000 0.000 0.378 112 0.576 0.195 0.230 0.195 1.000 1.000 0.410 93 0.400 0.333 0.733 0.900 0.800 1.000 0.460 64 0.800 0.400 0.150 0.983 1.000 1.000 0.614 35 0.357 0.441 0.200 0.990 1.000 1.000 0.434 76 0.189 0.173 0.733 0.987 0.400 0.800 0.298 137 0.600 0.200 0.200 0.000 1.000 1.000 0.410 108 0.650 0.978 0.850 0.733 1.000 1.000 0.807 19 0.200 0.179 0.400 0.833 0.000 0.800 0.254 14
10 0.400 0.500 0.533 0.992 1.000 1.000 0.508 411 0.750 0.373 0.177 0.200 0.080 0.080 0.500 512 0.700 0.880 0.400 0.533 1.000 1.000 0.740 213 0.350 0.333 0.667 0.667 1.000 1.000 0.424 814 0.179 0.189 0.900 0.950 1.000 1.000 0.334 12
Table IX.Calculated utility valuesand relative ranking
BIJ13,4
442

However, it was noted that these five warehouses all had metric values that are lessthan that of the BIC performer. Therefore, convergence is dependent only on thetolerance levels used, eliminating all other metrics. Therefore, the sensitivity analysisprovided adequate proof that marginal changes in relative weights would not changethe identification of the best overall performer.
Comparison between methodologiesBoth analysis types revealed the best performers did not use tolerance levels. Thisimplied accuracy levels are accurate as given and no allowances were used tocalculate accuracy levels. For errors that occurred during picking, the process offlagging the error by the actual picker and filling a partial order and shippingremaining items later or per the customer’s instructions is identified. The analysisdid not identify whether or not nearby locations are checked for reconciliation ofthe error. Both analysis techniques revealed that a second party is sent to re-checkfor the error. For cycle counting, the MAUT analysis identified random samplecycle counting and not conducting 100 percent wall-to-wall inventories. In contrast,the traditional benchmarking analysis identified different types of cycle counting,and 100 percent wall-to-wall inventories are conducted. Table XI shows the gapanalysis for the four key questions posed in the original study.
Conclusions and implications for use in the benchmarking processThis research followed a comprehensive application of MAUT and sensitivity analysisto a benchmarking study. This analysis differed from the classis benchmarkingapproach where recommendations are made based on traditional benchmarking tools.Comparing the suggestions of each method showed some similarities as well as somedifferences. However, because of the various benchmarking methods existing today, acareful consideration should be taken to determine if MAUT is useful for a particularstudy.
Advantages of using MAUTMAUT proves to be effective in establishing priorities of several critical metrics andprovides a method to compare these metrics across several participants. The most
1 No solution N/A2 0.000 0.000 0.000 0.000 0.500 0.500 Multiple3 0.244 0.000 0.088 0.449 0.037 0.182 44 0.527 0.204 0.000 0.157 0.056 0.056 45 0.318 0.011 0.000 0.386 0.143 0.143 46 0.215 0.000 0.208 0.527 0.000 0.050 87 0.000 0.000 0.000 0.000 0.500 0.500 Multiple8 0.450 0.350 0.100 0.050 0.025 0.025 89 0.099 0.000 0.000 0.750 0.000 0.152 4
10 0.333 0.032 0.000 0.380 0.128 0.128 411 0.858 0.142 0.000 0.000 0.000 0.000 812 0.561 0.285 0.000 0.000 0.077 0.077 813 0.000 0.000 0.000 0.000 0.500 0.500 Multiple14 0.176 0.000 0.243 0.326 0.128 0.128 13
Table X.Sensitivity analysis
results
Use ofmulti-attribute
utility theory
443

powerful advantage to using MAUT for this research is its ability to consider allcritical metrics and define a best overall performer for these data. Also, MAUT allowsthe comparison of different types of data to be directly compared. For example,accuracy percentages and cycle times are converted into identical units, makingcomparison easier. In addition, the use of MAUT allows further investigation of thedata gathered and provides a different look at the best practices discovered. The dataused in classical benchmarking methodologies is easily re-used for the MAUTanalysis, providing even more information. Finally, MAUT provides a framework toidentify one performer as best across all critical metrics. Because the questionssampled are affected by multiple metrics, this fact became critical for best practiceidentification.
ContributionsIn this research, the application of MAUT is analyzed for its applicability tobenchmarking analysis. This research is successful in proving the following points forthis comparative study:
. MAUT provides stratification of all critical metrics chosen and allows for directcomparison between them.
. MAUT allows the research team to assign priorities and analyze the subjectivityof these decisions.
. MAUT provides a mathematical method for comparing trade-offs andidentifying BIC.
. MAUT adds robustness to the decision criteria and is suspected to increaserobustness as the amount of critical data increased.
A formal MAUT application to benchmarking is recommended for any party whorequires a method to compare several metrics simultaneously. The MAUT modelworks best for small benchmarking efforts where the research team can clearly define
Question Old analysis Utility theory analysis
How does industry set tolerancelevels for inventory accuracyreporting?
No tolerance used No tolerance used
How does industry handle errorsduring a picking operation?
Check nearby locations, triggersitem inventory; second partysent to re-check error
Triggers item inventory, part oforder is filled and remainingitems are shipped later; secondparty sent to re-check error, errorflagged by picker
Does industry perform cyclecounting or 100 percentwall-to-wall inventories?
Uses control group andactivity-based cycle counting;conduct 100 percent wall-to-wallinventories annually
Uses random sample cyclecounting; 100 percentwall-to-wall inventories notperformed
What is the typical inventoryand picking accuracy rates thatcan be expected?
99.999, 99.900 percent 99.946, 99.600 percentTable XI.Gap analysis for originalquestion set
BIJ13,4
444

priorities within the study. Also, the tests for sensitivity allow the benchmarking partyto evaluate its choices for weight factors and to adjust them if necessary. It should benoted that the MAUT method finds a “best overall” performer for all critical metrics,rather than a “best-in-class” performer for each critical metric. Therefore, the propermethod to employ depends on the end result desired. This research used the same dataset for both analysis methods. MAUT could be used in addition to the previousmethodology to gain even more insight on the information. Through the initialinvestigation of MAUT on benchmarking, some suggestions for future research wereformulated at the conclusion of the study.
References
Ammons, D. (1999), “A proper mentality for benchmarking”, Public Administration Review,Vol. 59 No. 2, pp. 105-9.
Barr, R.S. and Seiford, L.M. (1996), “Benchmarking and performance improvement tools formanufacturing and service processes”, paper presented at the National Science FoundationDesign and Manufacturing Grantees Conference, Albuquerque.
Barron, H. and Schmidt, C. (1988), “Sensitivity analysis of additive multi-attribute value models”,Operations Research, Vol. 36 No. 1, pp. 122-7.
Bordley, R.F. (2001), “Integrating gap analysis and utility theory in service research”, Journal ofService Research, Vol. 3 No. 4, pp. 300-9.
Camp, R.C. (1989), Benchmarking: The Search for Industry Best Practices that Lead to SuperiorPerformance, ASQC Quality Press, Milwaukee, MN.
Canada, J.R. and Sullivan, W.G. (1989), Economic and Multi-attribute Evaluation of AdvancedManufacturing Systems, Prentice-Hall, New York, NY.
Daellenbach, H.G. (1994), Systems and Decision Making, Wiley, New York, NY.
Eyrich, H.G. (1991), “Benchmarking to become the best in breed”, Manufacturing Systems, Vol. 9No. 4.
Forger, G. (1998), “Benchmark your warehouse for future success”, Modern Materials Handling,Vol. 53 No. 12, pp. 39-41.
Frazelle, E.H. and Hackman, S. (1994), “The warehouse performance index: a single-point metricfor benchmarking warehouse performance”, Material Handling Research Center FinalReport #93-14, Georgia Tech.
Hinton, M., Francis, G. and Holloway, J. (2000), “Best practice benchmarking in the UK”,International Journal of Benchmarking, Vol. 7 No. 1, pp. 52-62.
Keehley, P. and MacBride, S. (1997), Benchmarking for Best Practices in the Public Sector,Jossey-Bass Publications, San Francisco, CA.
Keeney, R.L. and Raiffa, H. (1993), Decisions with Multiple Objectives: Preferences and ValueTradeoffs, Wiley, New York, NY.
Kolarik, W.J. (1995), Creating Quality: Concepts, Systems, Strategies, and Tools, McGraw-Hill,New York, NY.
Korpela, J. and Tuominen, M. (1996), “Benchmarking logistics performance with an applicationof the analytical hierarchy process”, IEEE Transactions on Engineering Management,Vol. 43 No. 1, pp. 323-33.
Lindey, D.V. (1985), Making Decisions, Wiley, New York, NY.
McNamee, D. (1994), Reinventing the Audit: Frameworks for Change, Mc2 ManagementConsulting, California.
Use ofmulti-attribute
utility theory
445

Rodier, M.M. (2000), “A quest for best practices”, IIE Solutions, Vol. 32 No. 2, pp. 36-9.
Walls, M.R. (1995), “Integrating business strategy and capital allocation: an application ofmulti-objective decision making”, The Engineering Economist, Vol. 40, pp. 247-66.
Yasin, M.M. (2002), “The theory and practice of benchmarking: then and now”, InternationalJournal of Benchmarking, Vol. 9 No. 3, pp. 217-34.
Corresponding authorTerry R. Collins can be contacted at: [email protected]
BIJ13,4
446
To purchase reprints of this article please e-mail: [email protected] visit our web site for further details: www.emeraldinsight.com/reprints

Role of human factors in TQM:a graph theoretic approach
Sandeep GroverDepartment of Mechanical Engineering, YMCA Institute of Engineering,
Faridabad, India
V.P. AgrawalDepartment of Mechanical Engineering, Indian Institute of Technology Delhi,
New Delhi, India, and
I.A. KhanDepartment of Mechanical Engineering, Faculty of Engineering and
Technology, Jamia Millia Islamia, New Delhi, India
Abstract
Purpose – To represent the effect of ‘human factors in total quality management (TQM)environment’ in terms of a single numerical index by considering their inheritances and interactions.
Design/methodology/approach – Various human factors affecting the TQM culture in anorganization are identified and discussed for the sub factors affecting them. These factors areinteracting with each other and their overall effect helps an organization in attaining TQM enabledneeds. The paper attempts to represent the overall effect of human factors quantitatively bydeveloping a mathematical model using graph theoretic approach. In this approach, interaction amongidentified human factors is represented through digraph, matrix model and a multinomial.
Findings – The extent of human aspects present in an organization, conducive to TQM culture isrepresented in terms of the “human index”. It provides an insight into the human factors at system andsubsystem level. The developed procedure may be useful for self-analysis and comparison amongorganizations.
Research limitations/implications – Since, human behaviour is difficult to predict, so are thehuman factors. The paper considers general factors, which may vary depending on type oforganization, size of organization and geographical location. There is a scope of research in factorspecific organizations.
Practical implications – It provides a useful methodology for organizations to assess humanaspects and improve upon therein. Procedure for stepwise application of methodology is given withexample that may help an industry to implement it.
Originality/value – The paper attempts to quantify the intangibles through systematic approachand is of value to industries to improve upon their work environment.
Keywords Total quality management, Employee behaviour, Graph theory
Paper type Research paper
Introduction and literature reviewTotal quality management (TQM) has received worldwide acceptability andrecognition. The core values of TQM, integrating all the interacting components inan organization, are applicable to any size of organization – large or small, any type oforganization – manufacturing or service, private or public. However, preparation forrealizing the fruits of TQM is challenging, since it is a multifaceted and complexphenomenon involving every facility and every individual at all levels.
The current issue and full text archive of this journal is available at
www.emeraldinsight.com/1463-5771.htm
Role of humanfactors in TQM
447
Benchmarking: An InternationalJournal
Vol. 13 No. 4, 2006pp. 447-468
q Emerald Group Publishing Limited1463-5771
DOI 10.1108/14635770610676290

Dr Deming and Dr Juran were the pioneers in the field of TQM, who gave valuableguidelines on quality systems. Since, then, TQM has been revisited and revitalized byvarious authors. Extensive literature available on TQM reveals the various facets ofTQM covered by various authors and researchers across the globe. Sila andEbrahimpour (2003) analyse and compare various TQM factors and their impact onvarious performance measures across countries. Mehra et al. (2001) conducted aliterature survey on TQM and identified 45 elements that affect TQM implementation.Apart from these various studies (Tamini, 1995; Ahire et al., 1996; Dalu and Deshmukh,2002) refer to factors affecting TQM.
Literature on TQM advocates the influence of human factors more as compared toother factors on implementation of TQM and business performance.
Saad and Siha (2000) feel the visible (or tangible) variables such as technology,structure and strategy have a relatively small impact on TQM effectiveness comparedwith largely hidden and intangible variables such as values, attitudes and perception.These factors have also been classified as hard and soft elements or hardware andsoftware determinants. Improvement in the soft elements is important since there isadequate research proving that business performance is more heavily influenced bythese elements of TQM. (Gotzamani and Tsiotras, 2001).
An important key issue for any productivity improvement program is managementof people (Gunasekaran et al., 2000).
Lakhe and Mohanty (1994) presented a conceptual model to judge the effectivenessof TQM in an organization. The importance of human factors is also depicted in thevariables affecting TQM effectiveness.
Badiru (1990) identifies the utilization of human resources as most important whileapplying the concept of triple C – communication, cooperation and coordination – toTQM. Brenda Weeks et al. (1995) identify seven critical organizational characteristicsthat must be assessed to judge an organization’s readiness to implement a successfulTQM programme. Most of the factors relate to human behaviour.
Taveira et al. (2003) examined hypotheses regarding influence of TQM on workenvironment and concluded that most TQM elements were significantly related towork environment scales viz. supervisor support, task orientation, task clarity andinnovation. Testa et al. (2003) did regression analysis to suggest national andorganizational cultural congruence has positive effect on job satisfaction. Specificdimensions of human factors have been covered by various other studies (Legge, 1995;Taylor, 1997; Axelsson et al., 1999). However, the authors have not come across anyliterature on mathematical modeling of different human aspects in TQM leading tosingle numerical index.
The interdependencies and overall impact of human aspects on TQM is discussed inthis paper using a mathematical model by applying graph theoretic approach.
Graph theoretic approach is a systematic and logical approach that has been appliedin various disciplines to make and analyse systems (Gandhi and Agrawal, 1996).
The procedure of quantification looks at human aspects in TQM from a differentangle and as an improvement over present practiced procedure of studying them. Themain advantage is that it not only takes into account the amount of human behaviouralfactors but also their interdependencies. This is desirable in the present case as thehuman aspects have interactive complexity leading to TQM environment in anorganization.
BIJ13,4
448

The extent of human aspects present in an organization, conductive to TQM cultureare represented in terms of a numerical index – the human index in this paper.
Identification of human factors in TQMOne’s willingness to work for organizational goals is as important as ability. Ability isdependent on qualification, knowledge and experience whereas willingness is often afunction of behavioural dynamics. Human behaviour is subject to change and difficultto predict, so is his attitude to work. It is the internal environment of an organizationthat can create a work culture to fulfill organizations’ goals. Human factors help incatering to the needs of such environment. Human factors refer to those aspects whichcan affect the behaviour to work for conducive TQM environment. Further in thispaper, human behavioural factors are referred as behavioural factors. These aspectsare identified based on exhaustive literature survey and discussion with academiciansand practitioners. These factors are epitomized in Figure 1. With a view to develop amathematical model for quantification, these are discussed in brief.
Top management involvementNo discussion on TQM is complete without the reference of top managementinvolvement. Before TQM implementation, it is necessary to decide the vision, mission,goals, values, ethics and attitude for the organization to follow. A sound foundation for
Figure 1.Cause and effect
diagram – human aspectsin TQM
DesiredHuman Aspects.
ManagementStyle
Skill
Commitment
Managerial values
Empowerment
JobSecurity
Training
Education
PositiveThinking Communication
Discipline
Urge to learn
Awareness EconomicCondition
Team Work
Trust
Responsibility
Leadership
Quality ofWork life
SatisfactionPerception
Individual belief
INNOVATION ATTITUDECHANGE
COORDINATION
MOTIVATION WORKCULTURE
TOP MANAGEMENTINVOLVEMENT
B1
B4
B3
B2
B5B6
ResourceAllocation
Leadership
Remuneration
Role of humanfactors in TQM
449

initiating TQM activities is to be laid by top management. It must understand,recognize and willing to inculcate the quality management principles. It must developoverall TQM framework by formulating policies and converting those policies intoaction by providing needed resources. Management’s commitment to excellence sendssignals down up to the shop floor and can inspire the whole organization. Since,everyone’s involvement is prerequisite for TQM, management must exerciseleadership abilities to influence the behaviour of other. It is the appropriateleadership style that can manage human resources effectively. Top managementinvolvement should thus be demonstrated by the actions that are needed and not justby words and declarations of quality policy.
Work cultureWork culture in an organization, which is also referred as climate, atmosphere orinternal environment, is another critical element of TQM culture. It is summation ofhabits, attitude and behaviour of members of organization. It may vary from oneorganization to another and different in different countries.
Readiness of an organization to adopt TQM requires a change in mindset of peopleto overcome inertia. Quality consciousness and involvement of employee are to beensured by the policies of management. Once top management accepts the need andresponsibility for organizational change, intended goals can be realized.
MotivationMotivation is changing behaviour of employee towards work from negative to positive.Since, workforce is regarded as valuable asset, to maintain and develop it becomesimportant. Morale, which is a group motivation concept, often is an automatic outcomeof management’s supporting and stimulating attitude towards employee’s needs. Basicfactors in Maslow’s need hierarchy theory are appropriate in any environment andTQM culture in no exception to it. Slogans, posters and lectures can do a little if thebasic remuneration to an employee is not able to fulfill his basic needs. Similarly goodworking conditions, job security, a fair and free work environment provide jobsatisfaction to an employee. Absence of these may also act as demotivator and canfurther be assigned as an important reason for TQM failure. Since, behaviour is acomplex phenomenon and motives cannot be determined accurately, organizationmust continuously improve quality of work life by empowerment, job rotation, jobenrichment, rewards and recognition. A feeling of self-organization is to be inculcatedby management by involving employees at all levels in decision-making. A motivatedgroup of employees always achieves the results expected from quality circle.
Co-ordinationAlthough individual effort is recognized, coordinated effort of group is emphasized inTQM. Lack of coordination may lead to wastage of resources. Management mustevolve a mechanism to coordinate activities. Factors affecting coordination include:discipline, teamwork, communication and mutual trust.
Moreover, with production system involving multidisciplinary approach, groupapproach has become the requirement to solve production related problems. TQMculture requires people to prefer organizational interests to self-interest and a team canprovide synergic effect to individual efforts.
BIJ13,4
450

Attitude changeThis behavioural aspect refers to change in way of thinking of an employee aboutorganizational aspects. TQM is a way of thinking broadly about stakeholders. It isbringing in the positive attitude towards work. Changing attitude is considered as moredifficult and time taking as compared to one’s knowledge. Attitude change is highlyaffected by personals traits – education, background and age group. If change isperceived by an employee as threat to position and a signal of danger then it requiresthrough knowledge, awareness and benefits to be known to an employee. Sometimesgiving more responsibility to an employee in the process of change may click. It is theculture that can change the attitude and vice-versa.
InnovationDeveloping a new and better way of doing existing work enables TQM culture. It issearch for creativity through research and development applied by knowledgeupdating and skill improvement through training and continuing education. Apartfrom individual factors, innovation is to be encouraged by openness of management.Rewarded and recognized innovative ideas boost other employees to experiment.The economic condition of an organization has also influence on innovative culture inan organization. Innovation helps in fulfilling organization’s quest for continuous andbreakthrough improvement.
To achieve the desired organizational goals through TQM environment, it isnecessary to understand, analyse and evaluate the contribution critical humanfactors and sub factors for improving competitiveness, work culture and profitability.This is achieved through quantification of effect and interdependency among thesefactors discussed in next section.
Development of graph theoretic modelGraph theoretic and matrix model consists of digraph representation, matrixrepresentation and permanent representation. Digraph representation is useful forvisual analysis. Matrix model is useful for computer processing. Permanent multinomialfunction characterizes abstract TQM environment uniquely. Permanent value ofmultinomial represents the effect of human factors on environment uniquely by a singlenumber/index, which is useful for comparison, ranking and optimum selection. Thesystematic application of graph theoretic methodology is discussed further in this paper.
Behavioural digraphA Behavioural digraph is prepared to represent the behavioural factors of the TQMenvironment in terms of nodes and edges. Let nodes represent behavioural factors andedges represent their interactions. It represents TQM environment – behaviouralmeasure of characteristics or factors (Bi’s) through its nodes and dependence of factors(bij’s) through its edges. Bi indicates the inheritance of factors and bij indicates degree ofdependence of jth factor on ith factor. In the digraph bij is represented as a directededge from node i to node j. The digraph permits to show the proposed behaviouralfactors and interactions between factors. In particular six factors identified form thebehavioural digraph. The six behavioural factors – top management involvement (B1),work culture (B2), motivation (B3), coordination (B4), attitude change (B5) andinnovation (B6) and interactions amongst them are shown in Figure 2.
Role of humanfactors in TQM
451

A brief reasoning of interactions (i.e. edges shown in the digraph) is given below.Involvement of management through commitment, resource allocation and providingleadership influences other factors. Thus, directed edges from node 1 to all other nodes.However, work culture and motivated workforce may also force the involvement ofmanagement to some extent. Thus, a directed edge from node 2 and node 3 to node1.The extent to which one factor is dependent on other may vary from one organizationto another.
Work culture (B2) is dependent on management, motivation of employee, attitude ofemployee and innovation. Thus, a directed edge from node 1, 3, 5, and 6 to node 2.However, there is no directed edge from node 4 to node 2 as it is the coordination thatwill result from proper work culture (thus node from 2 to 4). Similarly work culturemay motivate and employee will be encouraged to innovate (node from 2 to 3 and 6).Similarly other factors can be visualized from the digraph (Figure 2).
Behavioural matrixSince, digraph is a visual representation, it helps in analysis to a limited extent only.To establish an expression for behavioural effect, the digraph is represented in matrixform, which is convenient in computer processing also.
Let us consider a general case of n factors leading to n th order symmetric (0,1) matrixA ¼ [bij]. The value bij represents the interaction of i th factor with the j th factor:
bij ¼ 1 if factor i is connected to factor j;
¼ 0 otherwise
Generally bij# bji as behavioural effect is directional and bii ¼ 0 as factor is notinteracting with itself. Behavioural matrix is square and non-symmetric and isanalogous to adjacency matrix in graph theory (Narsingh, 2000). The behaviouralmatrix representing the digraph shown in Figure 2 is written as:
Figure 2.Behavioural digraph
B1
B4
B2
B3
B5 B6
BIJ13,4
452

A ¼
1 2 3 4 5 6 Factor
0 1 1 1 1 1
1 0 1 1 0 1
1 1 0 1 1 1
0 0 1 0 1 0
0 1 1 1 0 1
0 1 0 0 0 0
266666666664
377777777775
1
2
3
4
5
6
ð1Þ
Off diagonal elements with value 0 or 1 represent the interdependency of behaviouralfactors. The diagonal elements are 0 since effect of behavioural factors is not taken intoconsideration. To consider this, another matrix, behavioural characteristic matrix is defined.
Behavioural characteristic matrix (CM-B)The characteristic matrix already used in mathematics is used to characterizebehavioural factors affecting TQM environment. Considering I as an identity matrixand B as the variable representing behavioural factors, behavioural characteristicmatrix is written as C ¼ [BI 2 A]
C ¼
1 2 3 4 5 6 Factor
B 21 21 21 21 21
21 B 21 21 0 21
21 21 B 21 21 21
0 0 21 B 21 0
0 21 21 21 B 21
0 21 0 0 0 B
266666666664
377777777775
1
2
3
4
5
6
ð2Þ
In the above matrix the value of all diagonal elements is same, i.e. behavioural factorshave been assigned same value which is not true practically, since all behaviouralfactors have different values (effects) depending on various parameters affecting them.Moreover, interdependencies have been assigned value depending on it is there or not.To consider the effect of behavioural factors and their interdependencies, anothermatrix, behavioural variable characteristic matrix (VCM) is considered.
Behavioural variable characteristic matrix (VCM-B)It is proposed to characterize the TQM environment by various behavioural factorsand their effects through VCM. For this let us consider digraph in Figure 2 for definingVCM-B. Consider a matrix D with off-diagonal elements bij’s representing interactionsbetween behavioural factors, i.e. instead of 1 (as in matrix 1). Consider another matrixE with diagonal elements Bi, i ¼ 1, 2, . . .6, where Bi represent behavioural effect ofvarious factor, i.e. instead of B only (as in matrix 2). Considering matrices D and E, theVCM-B is written as H ¼ [E 2 D]
Role of humanfactors in TQM
453

H ¼
1 2 3 4 5 6 Factor
B1 2b12 2b13 2b14 2b15 2b16
2b21 B2 2b23 2b24 0 2b26
2b31 2b32 B3 2b34 2b35 2b36
0 0 2b43 B4 2b45 0
0 2b52 2b53 2b54 B5 2b56
0 2b62 0 0 0 B6
266666666664
377777777775
1
2
3
4
5
6
ð3Þ
The matrix provides a powerful tool through its determinant called variablecharacteristic behavioural multinomial (VCBM). This is a characteristic of the systemand represents the behavioural effect of the system consisting of behavioural effect offactors and their interactions.
Determinant of matrix equation (3), i.e. VCBM carries positive and negative signswith some of its co-efficient. Hence, complete information on behavioural effect will notbe obtained as some will be lost due to addition and subtraction of numerical valuesof diagonal and off diagonal elements (i.e. Bi’s and bij’s). Thus, the determinant ofVCM – behavioural, i.e. matrix equation (3) does not provide complete informationconcerning behavioural effect. For this, another matrix, behavioural variablepermanent matrix (VPM-B) is introduced.
Behavioural variable permanent matrixOverall behavioural effect is maximum when the behavioural effect of all the factors ismaximum. Since, total quantitative information is not obtained in VCM-B, VPM-Bis defined for the system in general (assuming interactions among all factors) asB ¼ ½E þ D�
B ¼
1 2 3 4 5 6 Factor
B1 b12 b13 b14 b15 b16
b21 B2 b23 b24 b25 b26
b31 b32 B3 b34 b35 b36
b41 b42 b43 B4 b45 b46
b51 b52 b53 b54 B5 b56
b61 b62 b63 b64 b65 B6
266666666664
377777777775
1
2
3
4
5
6
ð4Þ
Where E and D have meaning as in matrix equation (3).The permanent of matrix equation (4) is multinomial and is called variable
permanent behavioural function (VPF-B), also known as permanent of B (per B).This permanent function is a standard matrix function and is used and defined incombinatorial mathematics. This is evaluated by standard procedures and is same asdeterminant of VCM but with all signs positive. The permanent for matrix equation (4)in general form is written as:
BIJ13,4
454

VPF 2 B ¼ per B ¼ PBi
6
i¼1þ
i
Xj
Xk
Xl
Xm
Xn
XðbijbjiÞBkBlBmBn
þi
Xj
Xk
Xl
Xm
Xn
Xðbijbjkbki þ bikbkjbjiÞBlBmBn
þi
Xj
Xk
Xl
Xm
Xn
XðbijbjiÞðbklblkÞBmBn
0@
24
þi
Xj
Xk
Xl
Xm
Xn
Xðbijbjkbklbli þ bilblkbkjbjiÞBmBn
1A
35
þi
Xj
Xk
Xl
Xm
Xn
XðbijbjiÞðbklblmbmk þ bkmbmlblkÞBn
24
þi
Xj
Xk
Xl
Xm
Xn
Xðbijbjkbklblmbmi þ bimbmlblkbkjbjiÞBn
35
þi
Xj
Xk
Xl
Xm
Xn
XðbijbjiÞðbklblmbmnbnk þ bknbnmbmlblkÞ
24
þi
Xj
Xk
Xl
Xm
Xn
XðbijbjkbkiÞðblmbmnbnlÞ
þi
Xj
Xk
Xl
Xm
Xn
XðbijbjiÞðbklblkÞðbmnbnmÞ
þi
Xj
Xk
Xl
Xm
Xn
Xðbijbjkbklblmbmnbni þ binbnmbmlblkbkjbjiÞ
35
ð5Þ
The permanent function defined above, i.e. equation (5) is the complete expression forbehavioural effect as it considers presence of all attributes and their interdependencies.
A close look at multinomial, i.e. equation (5) reveals presence of behavioural effect ina systematic manner. The expression contains terms arranged in n þ 1 grouping. Heren ¼ 6, therefore seven grouping are there.
The first grouping contains only one term and is a set of behavioural effect of sixfactors, i.e. B1B2. . .B6.
In general second grouping is absent in absence of self-loops.The third grouping contains set of two behavioural factor interdependence, i.e. bijbji
and measure remaining n 2 2 (i.e. 4 here) behavioural factors.Each term of fourth grouping represents a set of three behavioural factor
interdependence bijbjkbki or its pair bikbkjbji and measure of remaining n 2 3 (i.e. 3 here)behavioural factors.
The terms of fifth grouping are arranged in two subgroups. The first sub-groupingis a set of two, 2 – behavioural factor interdependence, i.e. bijbji and bklblk and measureof remaining n 2 4 (i.e. 2 here) behavioural factors.
Role of humanfactors in TQM
455

The second sub-grouping is a set of four behavioural factor interdependence,i.e. bijbjkbklbli or its pair bilblkbkjbji and measure of remaining n 2 4 (i.e. 2 here) behaviouralfactors.
The terms of sixth grouping are also arranged in two subgroups. The first subgrouping is a set of 2 behavioural factor interdependence, i.e. bijbji, a set of 3behavioural factor interdependence, i.e. bklblmbmk or its pair bkmbmlblk and measure ofremaining n 2 5 (i.e. 1 here) behavioural factor.
The second sub-grouping is a set of five behavioural factor interdependence, i.e.bijbjkbklblmbmi or its pair bimbmlblkbkjbji and measure of remaining n 2 5 (i.e. 1 here)behavioural factor.
Similarly seventh grouping analyses sub-grouping in terms of a set of two andfour behavioural factor interdependence, 2 – three behavioural factor interdependence,3 – two behavioural factor interdependence and six behavioural factor interdependence.
Quantification of Bi’s and bij’sQuantification of human factors (i.e. Bi’s) is carried out on the lines of per B (equation (5)).Each factor is identified as a subsystem and graph theoretic approach is applied in eachsubsystem. Behavioural subsystem permanent characteristic matrix (similar toequation (5)) is evaluated for permanent function considering various factors affectingthe subsystem. The various factors affecting subsystems are identified in Figure 1. Thedependencies of factors at subsystem level are visualized through digraphs. Thesedigraphs lead to the inheritance of factors at system level through matrix and measures.The corresponding variable permanent matrices are then derived for each subsystem(ss) and permanent function of each VPM (ss) is evaluated. The permanent functions ofthese matrices (similar to equation (5)) will lead to inheritance of behavioural factors.
Thus, graph theoretic approach may be applied at every level.In order to avoid complexity, suitable scale may be used to assign value at
subsystem level or sub subsystem. If all the factors are not equally important to anorganization, suitable weights may be assigned. Table I suggests assignment ofnumerical values to factors.
To get the complete value of multinomial (equation (5)), the off diagonal elements inVPM-B (equation (4)) are to be assigned numerical values. As already discussed, theseoff diagonal elements represent interdependencies among human factors in TQM.However, this dependence among factors at system level (or subsystem level) cannot be
S.No Qualitative measure of human factor Assigned value of human factor
1 Exceptionally low 12 Very low 23 Low 34 Below average 45 Average 56 Above average 67 High 78 Very high 89 Exceptionally high 9
Table I.Quantification of humanfactors
BIJ13,4
456

measured directly and values can be assigned only after proper interpretation througha team of experts. It is suggested to use Table II for value of interdependencies.
Human indexHuman aspects in an organization, which help it to create TQM culture, are a functionof inheritance of behavioural factors and their interdependencies. Quantification ofhuman factors, i.e. exact amount of human aspects present (conducive to TQMenvironment) is very difficult to calculate under actual interactive conditions.All possible combination of factors in equation (5) represent different states of humanbehaviour. Variable permanent function (equation (5)), which thus representsstructural complexity, effect of characteristics and their interdependence, is a usefultool for developing an index for human aspects. This is the permanent of VPM-B,which is given by equation (5). Thus, human index is given by
H* ¼ Permanent value of VPM 2 B:
The numerical values of various factors and dependencies required for H * can bedetermined using the procedure already explained. The features of human index arehighlighted below:
. This index is a means to evaluate the content of human factors needed for anenvironment in an organization conducive to TQM.
. Human aspects in an organization are represented by single numerical value.A higher value of index is an indicator of more conducive environment to TQM.
. The value may be used for self-analysis of an organization and by this procedurethe permanent value can be increased by varying (increasing in particular) thehuman factors identified.
MethodologyThe graph theoretic approach helps to model TQM environment in terms of inheritanceof factors and their interdependencies. The methodology discussed earlier helps tofocus the role of human behaviour in TQM environment and is presented in terms ofsalient steps.
(1) Identify various factors that effect behaviour of human being in an environmentconducive to TQM culture.
(2) Identify the sub factors affecting human factors in step (1).
(3) Develop sub factor digraph considering attributes affecting each sub factor.The nodes in the digraph represent attributes identified in each sub factor. Theinteraction among attributes is represented by edges.
S.No Qualitative measure of interdependencies Bij
1 Very strong 52 Strong 43 Medium 34 Weak 25 Very weak 1
Table II.Quantification of humanfactor interdependencies
Role of humanfactors in TQM
457
(4) Develop sub factor matrix. This will be of size M £ M, with diagonal elementsrepresenting attributes and the off diagonal elements representing interactionsamong them (equation (4)).
(5) At the sub subsystem level use Tables I and II. This will provide numericalvalues for inheritance of attributes and their interactions.
(6) Find the value of permanent function for sub factor (equation (5)).
(7) Repeat steps (3)-(6 )for each sub factor.
(8) Develop behavioural factor digraph and behavioural matrix at system level asexplained in steps (3) and (4).
(9) At system level, the permanent value of each sub factor (obtained in step (7))provides inheritance of TQM environment of each factor (i.e. diagonal elementsin equation (4)). The quantitative value of interactions among factors (i.e. offdiagonal elements in equation (4)) are obtained from Table II through properinterpretation by experts. This will form behavioural matrix at system levelsimilar to equation (4).
(10) Find the value of permanent function for the system (equation (5)). This is thevalue of the human index.
Based on the above-discussed methodology, the organization can evaluate the extent ofhuman behaviour involvement/presence in TQM environment.
ExampleFor demonstration the proposed methodology, an organization is taken as anexample. It is proposed to find the value of human index. For determining theindex we require numerical values of all human factors and their interdependencies,i.e. all values in Behavioural variable permanent matrix (equation (4)). The value ofdiagonal elements in the VPM-B, i.e. the value of behavioural factors B1,B2. . .B6
are evaluated by applying graph theoretic methodology. Step by stepmethodology discussed in previous section is used to evaluate human index inthis example.
(1) Step 1. The various factors affecting behaviour of human being for TQMenvironment are identified in Figure 1.
(2) Step 2. The sub factors affecting the human factors are discussed earlier in thispaper and are listed in Table III.
(3) Step 3. The dependencies of factors at subsystem level are visualized throughdigraphs shown in Figures 3–8. Superscript denotes the subsystem andsubscript indicates the factors affecting the subsystem. As explained the nodesin the digraph represent attributes identified in each sub factor. The interactionamong attributes is represented by edges.
(4) Step 4. Variable permanent matrix for digraph for each subsystem iswritten.At subsystem level, variable permanent matrix for digraph forsubsystem 1 (Figure 3) in general form is considered. Similar to equation (4),VPM-B1 is given by
BIJ13,4
458
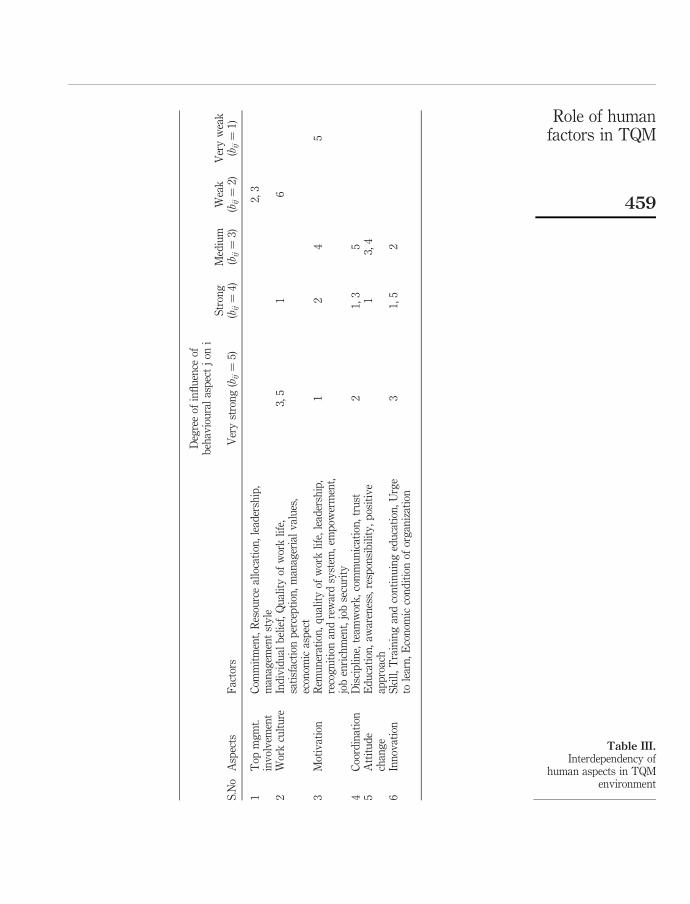
Deg
ree
ofin
flu
ence
ofb
ehav
iou
ral
asp
ect
jon
i
S.N
oA
spec
tsF
acto
rsV
ery
stro
ng
(bij¼
5)S
tron
g(bij¼
4)M
ediu
m(bij¼
3)W
eak
(bij¼
2)V
ery
wea
k(bij¼
1)
1T
opm
gm
t.in
vol
vem
ent
Com
mit
men
t,R
esou
rce
allo
cati
on,
lead
ersh
ip,
man
agem
ent
sty
le2,
3
2W
ork
cult
ure
Ind
ivid
ual
bel
ief,
Qu
alit
yof
wor
kli
fe,
sati
sfac
tion
per
cep
tion
,m
anag
eria
lv
alu
es,
econ
omic
asp
ect
3,5
16
3M
otiv
atio
nR
emu
ner
atio
n,
qu
alit
yof
wor
kli
fe,
lead
ersh
ip,
reco
gn
itio
nan
dre
war
dsy
stem
,em
pow
erm
ent,
job
enri
chm
ent,
job
secu
rity
12
45
4C
oord
inat
ion
Dis
cip
lin
e,te
amw
ork
,co
mm
un
icat
ion
,tr
ust
21,
35
5A
ttit
ud
ech
ang
eE
du
cati
on,
awar
enes
s,re
spon
sib
ilit
y,
pos
itiv
eap
pro
ach
13,
4
6In
nov
atio
nS
kil
l,T
rain
ing
and
con
tin
uin
ged
uca
tion
,U
rge
tole
arn
,E
con
omic
con
dit
ion
ofor
gan
izat
ion
31,
52
Table III.Interdependency of
human aspects in TQMenvironment
Role of humanfactors in TQM
459
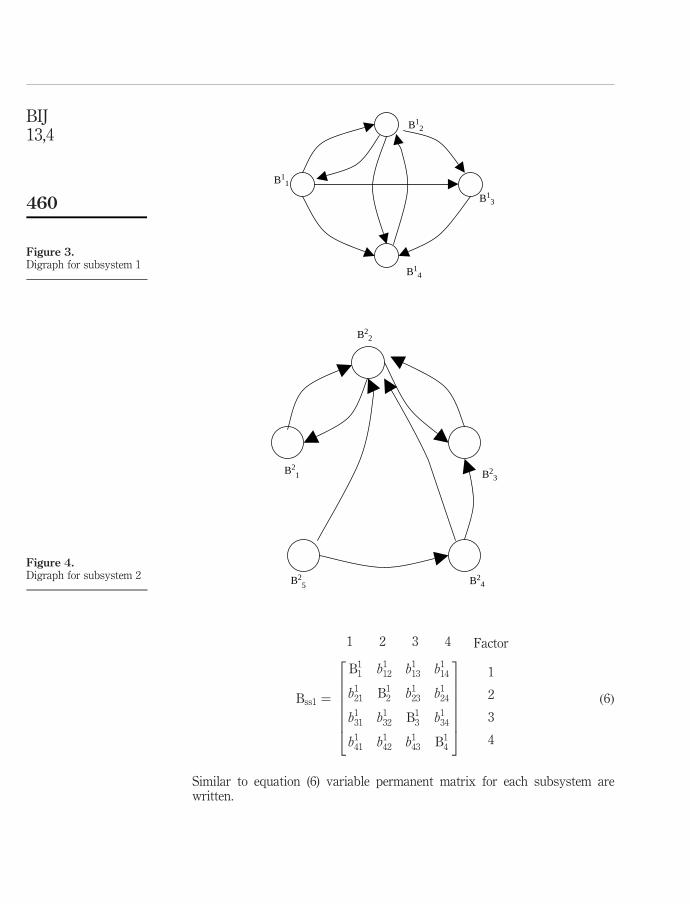
Bss1 ¼
1 2 3 4 Factor
B11 b1
12 b113 b1
14
b121 B1
2 b123 b1
24
b131 b1
32 B13 b1
34
b141 b1
42 b143 B1
4
26666664
37777775
1
2
3
4
ð6Þ
Similar to equation (6) variable permanent matrix for each subsystem arewritten.
Figure 3.Digraph for subsystem 1
B12
B11
B13
B14
Figure 4.Digraph for subsystem 2
B22
B21 B2
3
B25 B2
4
BIJ13,4
460
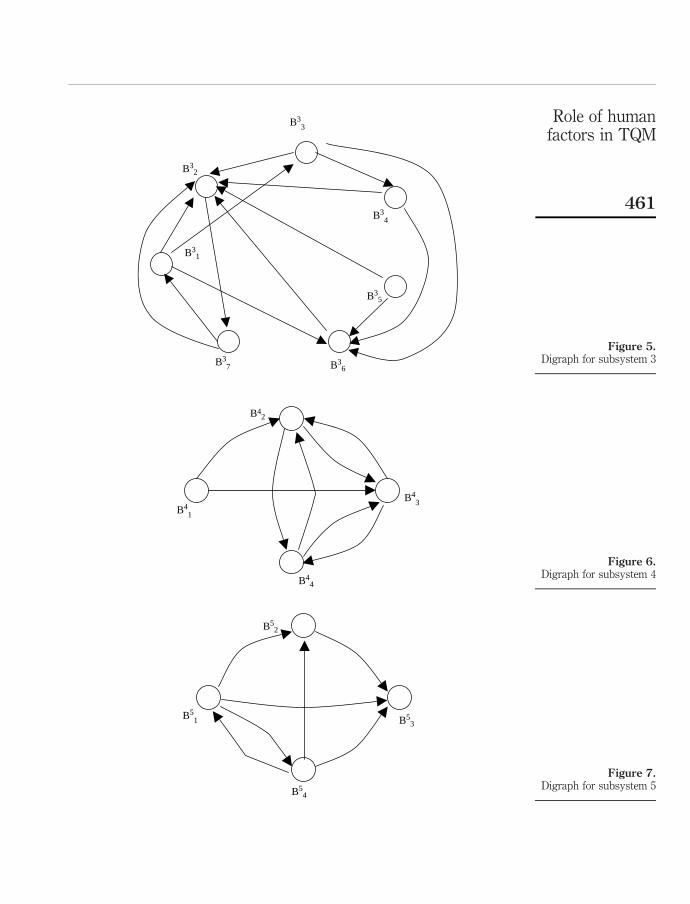
Figure 5.Digraph for subsystem 3
B33
B32
B34
B31
B35
B37 B3
6
Figure 6.Digraph for subsystem 4
B42
B43
B41
B44
Figure 7.Digraph for subsystem 5
B52
B51 B5
3
B54
Role of humanfactors in TQM
461

(5) Step 5. At the sub subsystem level Tables I and II are used to determinenumerical values for inheritance of attributes and their interactions. Thevariable permanent matrices for different subsystems (based on their digraphs)are written through equations (7.1)-(7.6). For subsystem 1, the values taken fromTable I are B1
1 ¼ 7;B12 ¼ 5;B1
3 ¼ 6;B14 ¼ 5: The values taken from Table II are
b112 ¼ 4; b1
13 ¼ 3; b114 ¼ 4; b1
21 ¼ 3; b123 ¼ 3; b1
24 ¼ 2; b134 ¼ 4; b1
42 ¼ 2:
Substituting these values in equation (6), VPM-B1 is given as
VPM B1 ¼
1 2 3 4 Sub factor
7 4 3 4
3 5 3 2
0 0 6 4
0 2 0 5
2666664
3777775
1
2
3
4
ð7:1Þ
In similar way, variable permanent matrices for other subsystems arewritten as
VPM B2 ¼
1 2 3 4 5 Sub factor
6 5 0 0 0
3 7 4 0 0
0 3 7 0 0
0 3 2 6 0
0 4 0 3 5
266666664
377777775
1
2
3
4
5
ð7:2Þ
Figure 8.Digraph for subsystem 6
B62
B61 B6
3
B64
BIJ13,4
462
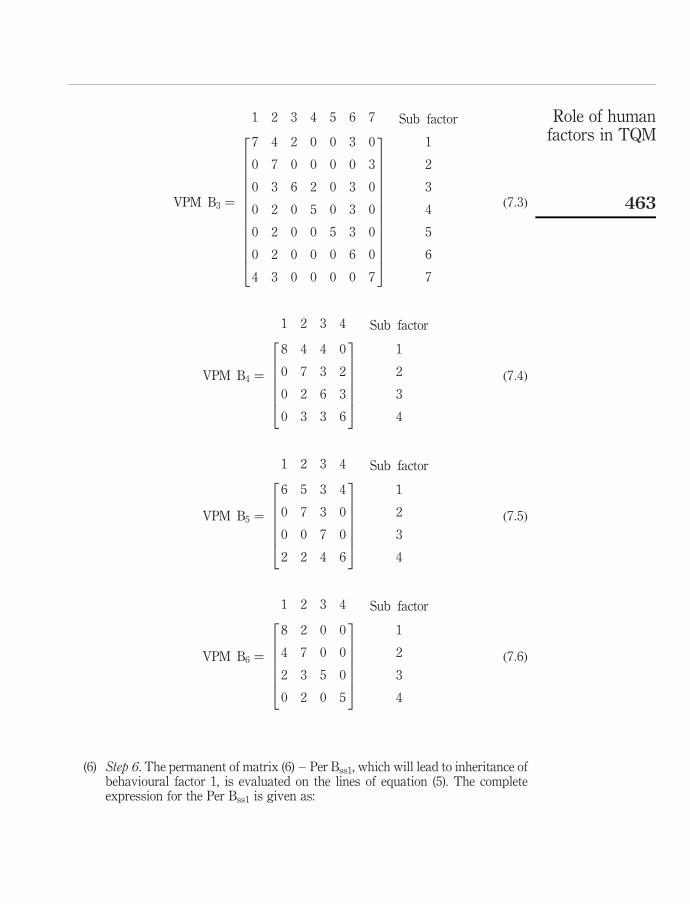
VPM B3 ¼
1 2 3 4 5 6 7 Sub factor
7 4 2 0 0 3 0
0 7 0 0 0 0 3
0 3 6 2 0 3 0
0 2 0 5 0 3 0
0 2 0 0 5 3 0
0 2 0 0 0 6 0
4 3 0 0 0 0 7
266666666666664
377777777777775
1
2
3
4
5
6
7
ð7:3Þ
VPM B4 ¼
1 2 3 4 Sub factor
8 4 4 0
0 7 3 2
0 2 6 3
0 3 3 6
2666664
3777775
1
2
3
4
ð7:4Þ
VPM B5 ¼
1 2 3 4 Sub factor
6 5 3 4
0 7 3 0
0 0 7 0
2 2 4 6
2666664
3777775
1
2
3
4
ð7:5Þ
VPM B6 ¼
1 2 3 4 Sub factor
8 2 0 0
4 7 0 0
2 3 5 0
0 2 0 5
2666664
3777775
1
2
3
4
ð7:6Þ
(6) Step 6. The permanent of matrix (6) – Per Bss1, which will lead to inheritance ofbehavioural factor 1, is evaluated on the lines of equation (5). The completeexpression for the Per Bss1 is given as:
Role of humanfactors in TQM
463

Per Bss1 ¼ B1B2B3B4 þ ½b12b21B3B4 þ b13b31B2B4 þ b14b41B2B3
þ b23b32B1B4 þ b24b42B1B3 þ b34b43B1B2�
þ ½ðb12b23b31 þ b13b32b21ÞB4 þ ðb12b24b41 þ b14b42b21ÞB3
þ ðb13b34b41 þ b14b43b31ÞB2 þ ðb23b34b42 þ b24b43b32ÞB1�
þ ½ðb12b21Þðb34b43Þ þ ðb13b31Þðb24b42Þ þ ðb14b41Þðb23b32Þ�
þ ½ðb12b23b34b41 þ b14b43b32b21Þ þ ðb13b34b42b21 þ b12b24b43b31Þ
þ ðb14b42b23b31 þ b13b32b24b41Þ�
ð8Þ
The value of permanent function for ss1 leads to the inheritance of behavioural factorB1. Substituting the values from equation (7.1)
Per Bss1 ¼ 1; 050 þ 360 þ 168 þ 144 þ 168 þ 72 ¼ 1; 962
(7) Step 7. Similarly the value of permanent functions of different subsystems areevaluated from the variable permanent matrices in equations (7.1)-(7.6) and arewritten as under:
Per Bss1 ¼ 1; 962
Per Bss2 ¼ 14; 130
Per Bss3 ¼ 438; 120
Per Bss4 ¼ 3; 408
Per Bss5 ¼ 2; 156
Per Bss6 ¼ 1; 600
(8) Step 8. Behavioural factor digraph is shown in Figure 2 and behavioural matrixat system level is developed through equations (1)-(4). Variable permanentmatrix for this example is written in symbolic form as:
VPM–B ¼
1 2 3 4 5 6 Factor
B1 b12 b13 b14 b15 b16
b21 B2 b23 b24 0 b26
b31 b32 B3 b34 b35 b36
0 0 b43 B4 b45 0
0 b52 b53 b54 B5 b56
0 b62 0 0 0 B6
266666666664
377777777775
1
2
3
4
5
6
ð9Þ
As explained, the values of diagonal elements are to be taken from step 7 andthe values of off diagonal elements are taken from Table II. Table III also
BIJ13,4
464

indicates the degree of dependence among factors based on scale given inTable II. For the given application these may be modified, if required:
B1 ¼ Per Bss1;B2 ¼ Per Bss2;B3 ¼ Per Bss3;B4 ¼ Per Bss4;B5
¼ Per Bss5;B6 ¼ Per Bss6
(9) Step 9. To obtain variable permanent matrix-behavioural for this example,values are substituted as per step 8.
VPM–B ¼
1 2 3 4 5 6 Factor
1;962 4 5 4 4 4
2 14;130 4 5 0 3
2 5 438;120 4 3 5
0 0 3 3;408 3 0
0 5 1 3 2;156 4
0 2 0 0 0 1;600
266666666664
377777777775
1
2
3
4
5
6
ð10Þ
(10) Step 10. Value of permanent function for the system is evaluated as perequation (5).
The value of permanent of above matrix (equation (10)) is 1.42792 £ 1023, whichindicates human index for the case considered. By carrying out similar analysis humanindex for different organization can be obtained. As suggested, this will help anorganization to access itself and improve. For a particular period of time, similarorganizations may be compared and rated.
It is also suggested to find hypothetical best and hypothetical worst value of humanindex. Human index is at its best when the inheritance of all its factors is at its best.Since, inheritance of factors is evaluated considering sub factors and applying graphtheoretic approach at the subsystem level, it is evident that human index is at its bestwhen inheritance of sub factors is at its best. Since, Table I is used at subsystem level,maximum value of Per B1 is obtained when inheritance of all the sub factors ismaximum, i.e. value taken from Table I is 9. Thus, equation (7.1) may be rewritten forthe maximum value of Per B1 as
VPM B1 ¼
1 2 3 4 Sub factor
9 4 3 4
3 9 3 2
0 0 9 4
0 2 0 9
2666664
3777775
1
2
3
4
ð11Þ
The value of the permanent of the above function is 8361, i.e. max. Per Bss1 ¼ 8,361.
Role of humanfactors in TQM
465

Similarly human index is at its worst when the inheritance of all its factors and subfactors is at its worst. This is the case when inheritance of all the sub factors isminimum, i.e. value taken from Table I is 1. Thus, equation (7.1) may be rewritten forthe minimum value of Per B1 as
VPM B2 ¼
1 2 3 4 Sub factor
1 4 3 4
3 1 3 2
0 0 1 4
0 2 0 1
2666664
3777775
1
2
3
4
ð12Þ
The value of the permanent of the above function is 137, i.e. min. Per Bss1 ¼ 137.Similarly maximum and minimum values for each subsystem are evaluated and
different values of permanent of subsystem matrices are summarized in Table IV.Maximum value of human index at system level is evaluated by considering maximumvalues of all subsystems and minimum value of human index at system level isevaluated by considering minimum values of all subsystems.
The value of per B indicates the value of human index. Thus, the maximum andminimum value of human index indicates the range with in which it can vary.Experts can use this range to decide a threshold value for a given set of similarindustries.
Monitoring at regular interval may be carried out by third party to assess TQMenvironment in an organization. Moreover, the values may be used for self-assessmentof industry, i.e. the internal audit of TQM environment may be carried out at regularintervals.
ConclusionThe paper endeavours to quantify the overall effect of human factors in TQMenvironment through systematic approach. The human factors not only help anorganization to achieve intangible objectives – better quality, customer satisfaction,goodwill, and responsiveness through continuous improvement but also have longlasting effect on tangible objectives – profitability through productivity.
System/Subsystem Current value Maximum value Minimum value
Per B1 1,962 8,361 137Per B2 14,130 78,732 28Per B3 438,120 5,756,350 730Per B4 3,408 8,613 61Per B5 2,156 7,209 9Per B6 1,600 7,209 9Per B 1.42792 £ 1023 1.69614 £ 1027 1.45711 £ 1010
Table IV.Values formaximum/minimumhuman index
BIJ13,4
466
The proposed structural approach based on digraph and matrix method for theevaluation of human aspects in TQM environment has the following features:
. It identifies factors pertaining to human aspects in TQM environment.
. It permits modeling of dependence among factors.
. Application of graph theoretic approach makes it convenient for visual analysisand computer processing.
. The presence of human aspects in TQM environment is indicated by a singlenumerical index.
. It permits self-analysis and comparison of organizations.
. Cause and effect analysis is useful in improving the environment.
. The method permits to consider different factors in alternative environment.
. Systematic methodology for conversion of qualitative factors to quantitativevalues and mathematical modeling gives an edge to the proposed technique overconventional methods.
References
Ahire, S.L., Golhar, D.Y. and Waller, M.A. (1996), “Development and validation of TQMimplementation constructs”, Decision Sciences, Vol. 27 No. 1, pp. 23-56.
Axelsson, J.R.C., Bergman, B. and Eklund, J. (1999), Proceedings of the international conferenceon TQM and human factors, Linkoping, Sweden.
Badiru, A.B. (1990), “A system approach to total quality management”, Industrial Engineering,pp. 33-6, March.
Brenda, Weeks, Marilyn, M.H. and Lawrence, P.E. (1995), “Is your organization ready for TQM?An assessment methodology”, The TQM Magazine, Vol. 7 No. 5, pp. 43-9.
Dalu, R.S. and Deshmukh, S.G. (2002), “Multi – attribute decision model for assessingcomponents of total quality management”, Total Quality Management, Vol. 13 No. 6,pp. 779-96.
Gandhi, O.P. and Agrawal, V.P. (1996), “Failure cause analysis – a structural approach”,Transactions of ASME, pp. 434-9.
Gotzamani, K.D. and Tsiotras, G.D. (2001), “An empirical study of the ISO 9000 standards’contribution towards total quality management”, International Journal of Operations &Production Management, Vol. 21 No. 10, pp. 1326-42.
Gunasekaran, A. et al., (2000), “Improving operations performance in a small company: a casestudy”, International Journal of Operations & Production Management, Vol. 20 No. 3,pp. 316-35.
Lakhe, R.R. and Mohanty, R.P. (1994), “Understanding TQM”, Production, Planning and Control,Vol. 5 No. 5, pp. 426-41.
Legge, K. (1995), Human Resource Management: Rhetorics and Realities, Macmillan,Basingstoke.
Mehra, S., Holfman, J.M. and Sirias, D. (2001), “TQM as a management strategy for the nextmillennia”, International Journal of Operations & Production Management, Vol. 21 Nos 5/6,pp. 855-76.
Narsingh, D. (2000), Graph Theory with Application to Engineering and Computer Science,Prentice Hall of India Private Ltd, New Delhi.
Role of humanfactors in TQM
467

Saad, G.H. and Siha, S. (2000), “Managing quality: critical links and a contingency model”,International Journal of Operations & Production Management, Vol. 20 No. 10, pp. 1146-63.
Sila, I. and Ebrahimpour, M. (2003), “Examination and comparison of the critical factors of totalquality management (TQM) across countries”, International Journal of ProductionResearch, Vol. 41 No. 2, pp. 235-68.
Tamini, N. (1995), “An empirical investigation of critical TQM factors using exploratory factoranalysis”, International Journal of Production Research, Vol. 33 No. 11, pp. 3040-51.
Taveira, A.D., James, C.A., Karsh, B-T. and Sainfort, F. (2003), “Quality management and thework environment: an empirical investigation in a public sector organization”, AppliedErgonomics, Vol. 34, pp. 281-91.
Taylor, W. (1997), “Leadership challenges for smaller organizations: self Perceptions of TQMimplementation”, Omega, International Journal of Management Science, Vol. 25 No. 5,pp. 567-79.
Testa, M.R., Mueller, S.L. and Thomas, A.S. (2003), “Cultural fit and job satisfaction in a globalservice environment”, Management International Review, Vol. 43, quarter 2, pp. 129-48.
Further reading
Logothetis, N. (1997), Managing for Total Quality from Deming to Taguchi and SPC,Prentice Hall of India Private Ltd, New Delhi.
Corresponding authorSandeep Grover can be contacted at: [email protected]
BIJ13,4
468
To purchase reprints of this article please e-mail: [email protected] visit our web site for further details: www.emeraldinsight.com/reprints

Tourism services quality(TourServQual) in Egypt
The viewpoints of external and internalcustomers
Mohammed I. EraqiTourism Studies Department, Faculty of Tourism & Hotels,
Cairo University, Egypt
Abstract
Purpose – This research paper aims is to evaluate the customer’s views related to tourism quality inEgypt. It attempts to measure the extent to which tourism business environment is creative andinnovative as necessary conditions for internal customer satisfaction.
Design/methodology/approach – The objectives of this research have been achieved throughreviewing a number of literatures in the fields of services quality management and tourism qualitymeasurements. The paper’s outcomes have been obtained through two surveys, one to measure thesatisfaction of the internal customer (employees) and the second to measure the external customersatisfaction (tourists).
Findings – The main conclusions of this research paper are: quality can be considered as aphilosophy for guiding tourism organization/destination when taking decisions related to tourismservices; tourism business environment in Egypt does not support the internal customer satisfactionbecause the absence of a suitable system for encouraging people to be creative and innovative; and inthe area of the external customer satisfaction there is still a need for things to be done such as theenvironmental conditions improvements, internal transport quality enhancement, increasing peopleawareness, and improving the level of safety and security conditions.
Research limitations/implications – There is a number of limitations which faced this paperresearch they are: the sample size is small, compared with the size of total population, that wasreflected on the level of reliability of the research results; and the limited time allowed to therespondents was reflected on the validity of the research outcomes, because they interviewed at thelast time of their journey by the time they are ready for departure.
Practical implications – A useful source of information about total quality management (TQM)and how practitioners can measure it. It provides wide guidelines for improving the quality of tourismservices in total manner in Egypt.
Originality/value – This paper provides useful information that are needed for tourism servicesquality improvement. It offers a practical help to tourism planners and marketers in Egypt tounderstand the concept of TQM and how they can improve their services continually.
Keywords Tourism, Quality, Customer satisfaction, Egypt
Paper type Research paper
IntroductionThe complexity and globalisation of today’s competitive business environments havemade quality as one of the most important sources of competitive advantage for thetourism business enterprise/destination. Many leading quality organisations havestarted to exploit opportunities to face this situation and recognized the importance tohave systematic processes to manage quality to gain and maintain this competitiveposition. Each business management is aware of the fierce competition in every sector
The current issue and full text archive of this journal is available at
www.emeraldinsight.com/1463-5771.htm
Tourism servicesquality in Egypt
469
Benchmarking: An InternationalJournal
Vol. 13 No. 4, 2006pp. 469-492
q Emerald Group Publishing Limited1463-5771
DOI 10.1108/14635770610676308

and customer expectations have never been greater. It is no longer sufficient just tomaintain a business; it is necessary to move forward if a business wants to achieve asustainable future. Customer care, improvements in efficiency, effective marketing,benchmarking, staff training and development are all vital for survival andcompetitiveness in a changeable business environment.
To improve, means to change, and change can be stressful. There is no magic formulathat can be applied to every business, but there are proven systems, such as qualitymanagement that can bring great benefits if it is applied in the right way. For business tobe successful, the motivation to develop and implement a quality management systemmust be based on a clear understanding of the business aims and objectives. Whateverthe size of the organisation and whatever the type of business, management willappreciate just how important quality is to the organization/destination’s continuedsuccess.
After all, the term “quality” frequently leads to misunderstanding. A betterunderstanding of the term is essential, particularly if the quality has been seen from astrategic viewpoint. However, the term quality has come to take on a broader meaningin the management of organisations. The total quality management (TQM) movementand other management philosophies have focused on the fitness of final products andservices for stakeholders, have emphasised not only the product quality, but also theneed to build quality into the production and delivery processes of the organisation andhave stressed the importance of employee involvement in process redesign andcommitment to the improvement of the final tourism product or service.
Tourism as a business is asserting itself as the engine of Egypt’s economicdevelopment. In 1982 Egypt hosted about one million visitors. By 2003, that figure hasrisen to 6.0 million visitors and it has continued to rise, despite the political turbulenceof the last few years. Egypt’s tourist facilities and destinations are able to compete wellby following tourism quality standards and sustainable tourism models.
Owing to the customer-oriented service endeavours, tourism enterprises, eitherprivate or public, need to improve service offerings by determining the needs of theirtarget groups. Exploring the current ratings of customer expectations and customerperceptions on specific service attributes provides a tool for management in order toimprove the service quality of the firm. Within this context, this study aims atdetermining the current service quality level of tourism services in Egypt.
This paper endeavors to evaluate the customer overview related to tourism qualityin Egypt. Also, measuring the extent to which tourism business environment in Egyptis creative and innovative.
Quality definitions and implicationQuality in service industries has both static and dynamic dimensions (Day and Peters,1994). The static dimension represents the expectation of the customers, that alwayschanges over time as extra facilities such as in-flight meals become the rule rather thanthe exception. Dynamic dimension of quality occurs during service delivery and offersopportunities for the customer to be delighted by the extra efforts of staff to, forexample, address the customer tangible product which is a primary cause of customerdissatisfaction, but dynamic quality is not achieved easily. By definition, spontaneousacts of dynamic quality, cannot be pre-arranged or scripted, but are nevertheless animportant means of customer satisfaction (Ingram et al., 1997).
BIJ13,4
470

There are many definitions and implications for the quality as a concept. The maindefinitions and implications are summarised in Table I.
Whatever the definition of quality is, for success in a highly competitive tourismmarket, a tourism enterprise/destination has to make sure it is providing the goods orservices that the customer wants; it gets its quality right; and that it delivers on time. Thisleads to customer satisfaction and achieving a suitable level of profits. Quality in servicedelivery leads to more repeated visits and greater sales revenue. This enables serving staffon performance-related pay to earn more and enhance the quality of their service to thecustomer. In addition, the extra profit generated enables tourism enterprise/destinationmanagement to invest in upgrading facilities to the customer and in training schemesbeside creating innovative business environment for tourism services improvement.
The philosophy of qualityDeregulation and globalization have increased competitive pressures, helping to bringdown prices and to improve the quality of services provided by professional tourismenterprises/destinations. From this standpoint, what it is needed is to enforce compliancewith safety and environmental regulations and new working conditions. The 1980switnessed many service industries placing increased emphasis on managing quality.Traditional ideas of quality, which had evolved from manufacturing industries and hadbeen based on the conformance to the standards defined by operation management, beganto be replaced by customer-focused notions. This required close consideration of what thecustomer wanted and how their needs could be met. Different dimensions of service weredefined and customer satisfaction, considered to be the gab between perceived andexpected service, was assessed. Quality management began to be viewed as an overallprocess which involved everybody from top management down to junior staff rather thanjust to do with concentrating on the employee-customer interaction. New approaches suchas TQM and the continuous improvement programmes began to be applied by anincreasing number of service industries (Souty, 2003; Lockwood and Guerrier, 1989).
However, the source of competitive advantage is found firstly in the ability of theorganization to differentiate itself, in the eyes of the consumer, from its competitors andsecondly by operating at a lower cost and hence at greater profit. This requiresexamining consumer service under three conditions (Lalonde and Zinszer, 1976):
(1) pre-transaction elements;
(2) transaction elements; and
(3) post-transaction elements.
Quality of service attracts new customers and ensures consumer retention. Consumerretention provides a higher profit contribution and has to grow in terms of the valueand frequency of purchases. The importance of customer retention is underlined by theconcept of the “lifetime value” of a customer. The life time value of a customer iscalculated as follows (Christopher, 1998):
Life time value ¼ average transaction value £ yearly frequency of purchase
£ customer life expectancy
A successful business would better serve its shareholders’ needs by focusingon customers, employees, suppliers and the wider community (Mann et al., 1999).
Tourism servicesquality in Egypt
471

Sou
rce
Defi
nit
ion
Imp
lica
tion
s
Th
eO
xfo
rdD
icti
onar
y(I
ng
ram
etal.,
1997
)T
he
deg
ree
orle
vel
ofex
cell
ence
;ch
arac
teri
stic
;so
met
hin
gth
atis
spec
ial
abou
tin
ap
erso
nor
thin
gQ
ual
ity
has
two
par
ts:(
1)it
sin
her
ent
char
acte
rist
ics
(2)
ast
and
ard
ofex
cell
ence
Th
eB
riti
shS
tan
dar
ds
Inst
itu
te(1
987)
Qu
alit
yis
the
tota
lity
offe
atu
res
and
char
acte
rist
ics
ofa
pro
du
ctor
serv
ice
that
bea
ron
its
abil
ity
tosa
tisf
yst
ated
orim
pli
edn
eed
sT
he
imp
lica
tion
ofth
isd
efin
itio
nis
that
qu
alit
yh
asto
reso
lve
the
use
r’s
actu
alor
per
ceiv
edn
eed
sJu
ran
(198
0)Q
ual
ity
isth
efi
tnes
sfo
rp
urp
ose
oru
seQ
ual
ity
isju
dg
edb
yit
sab
ilit
yto
mee
tn
eed
s
Ern
stan
dY
oun
g(I
ng
ram
etal.,
1997
)Q
ual
ity
isth
eco
nfo
rman
ceto
spec
ifica
tion
san
dth
ere
lati
ve
abse
nce
ofd
efec
tsQ
ual
ity
isju
dg
edp
osit
ivel
yan
dn
egat
ivel
yco
mp
ared
toth
eex
pec
tati
on
Fei
gen
bau
m(1
983)
Qu
alit
yis
the
tota
lco
mp
osit
ep
rod
uct
and
serv
ice
char
acte
rist
ics
ofm
ark
etin
g;
eng
inee
rin
g;
man
ufa
ctu
re;
and
mai
nte
nan
ceth
rou
gh
wh
ich
the
pro
du
ctan
dse
rvic
ein
use
wil
lm
eet
the
exp
ecta
tion
by
cust
omer
Qu
alit
yis
der
ived
thro
ug
ha
ran
ge
ofp
roce
sses
wh
ich
tran
sfor
mth
een
dp
rod
uct
orse
rvic
eO
akla
nd
(198
9)Q
ual
ity
issi
mp
lym
eeti
ng
the
req
uir
emen
tsQ
ual
ity
has
tob
eeq
ual
toth
ed
eman
ds
pla
ceu
pon
it
Dem
ing
(198
2)Q
ual
ity
isa
pre
dic
tab
led
egre
eof
un
ifor
mit
yan
dd
epen
dab
ilit
yat
low
cost
and
suit
edto
the
mar
ket
Qu
alit
yis
also
mea
sure
don
aco
st/b
enefi
tb
asis
Dod
wel
lan
dS
imm
ons
(199
4)Q
ual
ity
isco
nce
rned
wit
hd
elig
hti
ng
the
cust
omer
Th
efi
nal
test
ofq
ual
ity
isa
sub
ject
ive
one
Day
and
Pet
ers
(199
4)
Qu
alit
yis
rath
erli
ke
por
nog
rap
hy
inth
isre
spec
t.It
may
not
be
easy
defi
ned
,b
ut
itis
kn
own
wh
enit
isse
en
Era
qi
(200
2)
Qu
alit
yas
aco
nce
pt
isco
nsi
der
edas
ap
hil
osop
hy
over
wh
elm
edth
eor
gan
isat
ion
man
agem
ent.
Itis
aco
nti
nu
ous
imp
rov
emen
t
Qu
alit
yh
asth
ree
com
pon
ents
:(1
)in
tern
alcu
stom
ersa
tisf
acti
on(2
)ex
tern
alcu
stom
ersa
tisf
acti
on(3
)th
eef
fici
ency
ofp
roce
sses
Source:
Ad
apte
dfr
omIn
gra
met
al.
(199
7)
Table I.Quality definitions andimplications
BIJ13,4
472

Culture management is an important aspect of leadership and plays a great role increating positive business environment for innovating and changing to the best. Thisis vital to continuous improvements. It deals with the ability of leaders to know andunderstand what the organization culture is, modifying that culture to meet the needsof the organization as it progresses. Organizations that have tried to proactively exploitnew opportunities in the environment experienced successful culture change (Baron,1995; Horner, 1997). The development of employees empowerment and autonomybeside their participations in decision-making process are very important for ensuringtourism quality.
As Hamel and Prahalad (1993, p. 76) have commented “long term competitivenessdepends on manager’s willingness to challenge continually their managerial frame” tomaximize their benefits from the new opportunities and minimize the negative effects.This needs to create an atmosphere of generosity, freedom and safety in whichinnovation can flourish. Effective knowledge management is essential to innovationand it also needs an atmosphere of generosity, freedom and safety if it is to act as theriver on which innovation can sail (Brand, 1998, p. 17). For example, The Ritz-Carltonfosters a work environment where diversity is valued, quality of life is enhanced,individual aspiration are fulfilled, and The Ritz-Carlton mystique is strengthened. TheRitz-Carlton pledges to provide excellent personal service and facilities for itscustomers who will always enjoy a warm, relaxed yet refined ambience.
Customization has begun to play an important role in the tourism industry. Tourismoperators are attempting to gain a competitive edge by catering for the individualneeds of clients. The tourist product has thus been transformed over time from beingcompletely dominated by mass tourism to an industry that is quite diversified andcaters more to the individual needs of its participants, for example, the niche markethas become an important factor in the tourism industry reflecting the need to diversifyand customize the industry and ensure the sustainability of the product . . . the mainnich markets such as sports travel, spa and health care, adventure and nature tourism,cultural tourism, theme parks, cruise ships, religious travel and others hold greatpotential and are developing rapidly. So, suppliers will have to pay more attention tothe way people think, feel and behave than they have done hitherto. The increasedtravel experience, flexibility and independent nature of the new tourists are generatingdemand for better quality, more value for money and greater flexibility in the travelexperience.
In general terms, customer satisfaction is seen as the essential determinant ofbusiness success (Moore et al., 1998). On the other hand, as the competition hasincreased, service quality has been identified as a determinant of market share, returnon investment and cost reduction; thus it is seen as critical to corporate success (Burchet al., 1995). There are three essential factors that have forced the firms focusing onquality (Lockwood, 1994). These are: the style of offering the goods and services;technological developments providing new service challenges, although the personalcontact is highly valued as an important theme; and, finally, increase in competitionand international markets. Within this context, evaluating service quality offered tocustomers is essential, and several evaluation models have been developed(Parasuraman et al., 1985; Cronin and Taylor, 1992; Cheung and Law, 1998). Themost known and used models are SERVQUAL, SERVPERF, TQS and ISQM.The widely used model is SERVQUAL developed by Parasuraman et al. (1985).
Tourism servicesquality in Egypt
473
The SERVQUAL model consists of 22 items on service attributes, which are groupedalong the five dimensions of tangibles, reliability, assurance, responsiveness, andempathy. On the other hand, the SERVPERF model developed by Cronin and Taylor(1992) includes these 22 items of SERVQUAL. What are additional in the SERVPERFmodel are the overall ratings of satisfaction, perceived service quality and purchasingintention. The main difference between SERVQUAL and SERVPERF is the focus ofSERVPERF underlying the fact that customer satisfaction is the result of (mostly)service quality. As the case is based on public services and firms/institutions, thecurrent structure – mainly bureaucratic – is not compatible with the implementationof quality. The centralized organizational structure of public firms retains newincentives to be conducted. Thus, the efforts of managers of these firms play importantroles in applying service quality incentives.
Tourism product qualityTourism is a highly competitive industry, and tourism enterprise sector can no longercompete on the basis of cost alone. Quality is, therefore, a key element for thecompetitiveness of the tourism industry. It is also important for the sustainabletourism development of the industry and for creating and improving jobs. Therefore,promoting quality in tourism and tourist products is a priority in different tourismactivities.
However, the main reasons behind the complexity of measuring quality in tourismcould be summarized as follows (CEC, 2001):
. First there is the continuation of significant growth in tourism demand and thevolume of tourism in tourist destinations, along with diverging developments inthe various types of tourism. An appropriate response to these changes may befound only through the emergence of new types of tourism and control masstourism for the sake of quality.
. The lack of skilled manpower for certain jobs, mainly because of the workingconditions that may not encourage creative and innovation; the development oftransport and its effect on flows, service quality, sustainable development andenvironmental protection; and the adoption and incorporation of newinformation and communication technologies as a factor of competitiveness.
. Tourism is a service sector with a particularly complex product which dependson an extremely fragmented supply. Each link in the tourism value chain (travelagencies, tour operators, carriers, hoteliers, restaurateurs, etc.) offers one elementin the overall product. Together, these components determine tourists’experiences and their appreciation of the quality of the service. The touristdestination is the main place of consumption of tourist services and, therefore,the location and place of activity of tourist businesses. Tourists identify theproduct with both the businesses providing a service and the destination visited.
. For a big number of people tourism activity does not meet a vital need, touristbehaviour is particularly volatile and subject to psychological and socialinfluences, personal sensitivities and short-term reactions. If the image of justone link in the chain is affected, it is the whole tourism value chain that suffersthe consequences. The foot-and-mouth epidemic and the various oil slicks thathave affected European coastlines in the recent past have already shown
BIJ13,4
474

the negative effect of a current event on the image of a tourist destination orregion, to the immediate detriment of the tourism industry.
. The tourism product is extremely diverse. Natural and cultural resources, touristfacilities, the communications infrastructure, accommodation and restaurantsare the basic resources of a tourist destination. The combination of local tourismresources and the services offered determines the type of tourism to which adestination belongs, such as coastal or mountain tourism, sport or religioustourism, thermal or gastronomic tourism and, of course, business tourism.
. In addition, vertical interdependence between tourism businesses is morepronounced than in most other sectors of the economy. Such interdependence,which also exists at world level, results in what are sometimes complexstructures and trends in commercial relations. Apart from businesses and theirrepresentative organisations, destinations, with their different activities,combining public and private interests, are important stakeholders.
. Because of its diversity and fragmented nature, the tourism sector has no clearidentity. This may, in part, explain why tourism has featured little at a politicallevel, compared with its economic and social importance.
. The diversity of the business environment and the public and privatestakeholders involved in tourism, its effect on many other economic activities, itsvery wide social and emotional dimension and the geographically dispersed andvery variable consumption of the product mean that tourism is of a verypronounced horizontal nature. A large number, if not the majority, of politicalfields may directly affect it considerably, such as those for enterprise, transportand regional development. The annual report on community measures affectingtourism, which the commission drew up at the same time as this communication,provides detailed information on this subject.
For tourism organization, to deal with these challenges successfully and to be able tomeasure quality in tourism, it is necessary to take the following factors intoconsideration when deciding tourism quality strategy:
. the fundamental role of information, knowledge and its dissemination;
. the need for competent human resources motivated by medium and long-termprospects;
. the integration of environmental policy and the promotion of sustainabletourism;
. recognition of the need for European harmonization of the concept of quality oftourism services and infrastructures, and its assessment and monitoring;
. the need to speed up the integration of information society tools and services inall tourism activities and businesses, in particular SMEs;
. the need for a network of the stakeholders involved and a generalizedpartnership, particularly between those in the field to ensure implementation ofall the recommendations; and
Tourism servicesquality in Egypt
475

. overall, the quality and satisfaction levels are average. Education for managersand service personnel is the main proposal for the improvement in servicequality and consumer satisfaction.
Tourism quality requirementsAccording to world tourism organization program quality in tourism could be definedas:
. . . the result of a process which implies the satisfaction of all the legitimate product andservice needs, requirements and expectations of the consumer, at an acceptable price, inconformity with the underlying quality determinants such as safety and security, hygiene,accessibility, transparency, authenticity and harmony of the tourism activity concerned withits human and natural environment.
This definition could be summarized in what is called consumer value equation(Fitzsimmons and Fitzsimmons, 2001):
Value ¼ðResults produced for the customer þ Process qualityÞ
ðPrice to the customer þ Costs of acquiring the servicesÞ
The analysis of each term used in this definition suggests concrete actions which canbe evaluated from the perspective of quality criteria (Myburgh, 2001; WTO, 1991, 1993,1995):
. “Result” implies that quality is attained and perceived at a given time. It cannotbe in place without harmonious and active engagement of all the factorsintervening in tourism experience. The “result” can be measured by consumersatisfaction as well as by social, environmental and economic effects of thetourism activity concerned.
. “Process” means that a single undertaking is not sufficient to attain quality.Work towards quality always has to be in place, it cannot discontinue because ofthe temporarily attained quality result. It also implies a seamless or flawlessprocess in which it is possible to identify and do away with the constrains of asupply which spoil the tourism product and are responsible for direct andindirect losses to the company or destination. Also it is necessary to note thatbecause the customer is a participant in the service delivery, improvement inprocess quality must be acceptable to customers.
. “Satisfaction” introduces the elements of subjectivity in quality perception.According to their characteristics, customers have different requirements andexpectations. Informed quality-driven marketing caters to these characteristicsand attempts to identify consumers according to the different types and levels ofperceived quality. This should be achieved with suitable prices levels.
. “Legitimate” brings into the analysis the elements of rights and entitlement.Consumers cannot expect to receive more than what they remunerate bypayment or what has been determined by social and environmental limits. Therole of tourism planners and entrepreneurs is to relate quality types and levels toremuneration and external limitations, taking into consideration the private andsocial costs relating to providing or offering tourism services.
BIJ13,4
476

. The notion of “needs” follows on the concern for legitimacy and looks forsatisfying people’s basic and vital needs which should never be overlooked whilebringing into tourism projects and programmes the other aspects with a view tointroducing attractions, strengthening experiences, etc. The needs are primarilyrelated to the underlying quality determinants, although over time theexpectations related to the type and volume of “basic needs” change and usuallyincrease. Basic needs of the past are not exactly the basic needs of today.
. The notion of “product requirements” emphasizes the need to relate a singleservice and facility use to the whole product and the total tourism experience.One good quality service is not sufficient to give rise to tourism product qualityperception, although an excellent service may positively impress the consumer tomake him or her close their eyes to shortcomings and defects experiencedelsewhere in the tourism product.
. The term “service requirements” relates quality to its human, personal andpersonnel dimensions which are often intangible and apparently difficult tomeasure, evaluate and quantify in contrast with the physical attributes oftourism facilities which are used primarily in facility classifications or grading.However, certain service elements are quantifiable, for example, waiting time,frequency of service (e.g. cleaning), the number and type of services included inthe basic price, etc.
. The term “expectations” relates to the requirement of positive communicationand perception of the product characteristics to the potential consumer. Thereshould be no negative surprises at the time of delivery of a service or supply of aproduct, the consumer must receive what has been promised (or even more).Expectations should also be legitimate, there are limits to expectations, someexpectations cannot be fulfilled even at a very high price which can be offered.
. The term “consumer” relates to individual (end) consumers, who may includegroups of people (e.g. a family), corporate consumers (e.g. a company purchasingan incentive trip) and commercial intermediaries (e.g. a tour operator). The lattermay request that the product quality be assessed and certified by its ownrepresentative or a recognized external third party.
. “Acceptable price” suggests that the client’s expectations reflected in the pricecannot be attained at any cost, and that “positive surprises” should not be toogenerous, otherwise this may imply excessive allocation of resources which donot receive adequate remuneration. If quality is guaranteed and the product isexceptional, there should be no expectation that it should be sold cheap.
. “The underlying quality determinants” suggest that there should be common,irrevocable criteria of quality which are vital for the consumer independently ofcategory or class of the product, establishment, facility or service sophistication.They establish the minimum level of consumer protection under which quality,or total quality, is impossible to achieve, or when failing to meet any of suchdeterminants will significantly reduce the quality of tourism experience.
Tourism quality standardsWorld Tourism Organisation (WTO, 2003) has designed six standards for touristproduct or service that have to be put into consideration when tourism
Tourism servicesquality in Egypt
477

enterprise/destination management is taking decision related to tourism productdesign and marketing. These standards could be summarized as follows:
(1) Safety and security. A tourism product or service cannot represent danger to life,damage to health and other vital interests and integrity of the consumer (even ifwe talk about “adventure tourism”). Safety and security standards are normallyestablished by law (e.g. by fire prevention regulations) and should beconsidered as quality standards per se.
(2) Hygiene. For example, an accommodation facility just has to be safe and clean,one cannot pretend that such requirements are more important to high-classestablishments. Food safety standards (often also established by law) must bemet and be common to all types of food outlets, from street vendors to luxurygourmet restaurants to airline catering.
(3) Accessibility. This determinant requires that physical, communication andservice barriers must be done away with to allow, without discrimination, theuse of mainstream tourism products and services by all people irrespective oftheir natural and acquired differences, including people with disabilities.
(4) Transparency. It is a key element to provide for legitimacy of expectations andconsumer protection. It relates to providing and effectively communicatingtruthful information on the characteristics and coverage of the product and itstotal price. In includes to state what is covered by the price and what is not inthe product on supply.
(5) Authenticity. In a commercial world, authenticity is the hardest and mostsubjective quality determinant to attain. It also has marketing and competitiondimensions. Authenticity is culturally determined and one of its results is makingthe product markedly distinct from other similar products. Authenticity mustmeet consumer expectations. It diminishes and eventually terminates when theproduct loses its links with its cultural and natural background. In this sense, a“genuine” ethnic restaurant can never be entirely authentic in a place distinctfrom its original setting. This does not mean that such an establishment cannotbe an attraction and that it cannot be assessed from the viewpoint of quality withrespect to production (content and design), marketing, distribution, sale anddelivery of the service concerned. A theme park representing other lands and faraway cultures is a good example of an initially artificial tourism product whichmay create an authenticity and a quality image of its own. On the other hand, anauthentic product can also develop and adapt to needs and expectations.
(6) Harmony. Harmony with the human and natural environment pertains tosustainability which is a medium- and long-term concept. “Maintaining thesustainability of tourism requires managing environmental and socio-economicimpacts, establishing environmental indicators and maintaining the quality ofthe tourism products and tourist markets” (WTO Guide for Local Authorities onDeveloping Sustainable Tourism (WTO, 2003)). There can be no sustainabilitywithout quality.
Quality should be implemented through a comprehensive system under the conditionof consistency and harmony for the quality system components or its subsystems(value chain components).
BIJ13,4
478
Value creation managementThe creation of value is managed through what is called supply chain or value chain(Dumond, 2000), which refers to a series of integrated, dependent processes andactivities within/outside a tourism business enterprise through which value istransferred to the final customers. This new managerial system for managing the valuecreation processes concentrates on:
. create improvements in the tourism product or service that increase the tourist’ssense of its worth; or
. reduce operation costs through the chain.
It is necessary to involve the customer in internal operations by incorporatingcustomer feedback into improving tourism product/service or process quality, placingcustomers on internal teams or linking them into the company’s information system.Also involvement of the suppliers in the tourism company’s operations is equallyessential in value management. These procedures give the tourismenterprise/destination the opportunity to gain a competitive advantage and improveits product/service quality by:
. responding quickly to customers’ needs and requirements with new ideas andtechnologies;
. anticipating and tailoring product/service according to what exactly customers’demand characteristics are; and
. personalizing the tourism product/service provided.
However, meeting customer expectations is not enough to be a world classorganizations. A world class organization expands on these expectations to the levelsthat competitors find difficult to meet. Management is proactive in promoting higherstandards of performance and identifying new business opportunities by listening tocustomers. World class service organization such as Disney, Marriott, and AmericanAirlines define the quality standards by which others are judged.
Quality system managementQuality has become a major interest of public and private tourism business enterprises,according to the tourism market evolution, in terms of both supply of new tourismservices and the increasing complexity of tourists’ demand. Such a crucial issuerequires a comprehensive approach and a more definite integration among all thefactors involved in tourism.
Policies improving the quality of tourism services production and delivery shouldbe matched with both the features of the destination and the explicit/implicitcustomers’ expectation. It is only through this synergy that competition, rising fromthe value of global supply and its perception and evaluation by clients, can be met andchallenged.
An integrated approach to quality management is necessary because so manydifferent elements affect the tourist’s perception of a destination (such as transport,accommodation, information, attractions, the environment, etc.). Integrated qualitymanagement needs to take into account tourist businesses, tourists’ interests, the localpopulation and the environment, and to have a positive impact on all of them.
Tourism servicesquality in Egypt
479

It is not sufficient to inspect, control, or assure quality in order to achieve customersatisfaction. TQM requires the application of quality management rules and principlesto every component and at every level of the organization. Everyone should becommitted to continuous improvement in their part of the operation. Through thisparticipation and commitment, with the use of different tools and techniques that theTQM concept has adopted or developed, quality can be managed effectively. As aresult the quality system will be capable to minimize errors, to ensure continuousimprovement leading to excellence and to delight the customer (Augustyn, 1998;Creech, 1994; Juran, 1964). Recent researchers and experts have proved that the conceptof TQM is currently the best possible strategy for building quality managementsystem to achieve or gain competitive advantage through achieving customersatisfaction (Wilson et al., 1995; Eraqi, 2002). However, from the view points ofrelationships between the quality system’s subsystems, there are some shortagesthey are:
. Lack of advanced processes as a result they are based on the use of basic qualitymanagement methods that have been developed at the lowest level of inspectionand quality control by setting basic quality objectives and standards dependingon basic statistics. In some cases quality assurance instruments techniques havebeen applied like certificates and rewards.
. Lack of comprehensiveness because quality management techniques are appliedin a selective manner without taking TQM concepts as a comprehensivephilosophy. These quality-management processes have inadequate tools ofmonitoring and feedback.
. Lack of consistency, inconsistency results from the incompatibility ofsubsystems’ objectives with the quality objectives of the whole system.
For example, a room of top quality standard as a hotel X’ objective, is not in a positionto compensate the unfriendly and inhospitable behaviour of the hotel staff. Severalsmall tourism enterprises base their processes on the concept of inspection or qualitycontrol, independently of the national or regional quality requirements.
In view of the fact that the great majority of public and private tourismorganizations are aware of and interested in quality improvement in tourism, theemployment of inappropriate tourism quality systems has been associated with themajor source of current quality problems in tourism. These problems are reflected inan increasing number of customers dissatisfied with their total tourism experience.The lack and incapability of securing an advanced, comprehensive, and consistentquality-management process constitutes the major weakness of tourism qualitysystems. Shortcomings in the systems’ inputs and its relations with the suppliers makeit impossible for the quality systems of individual tourism enterprises to close thequality perception gap and quality control gap. None of the existing tourism qualitysystems is in a position to introduce the required changes that would enable them toconform to the conditions of tourism quality enhancement. Therefore, a new tourismquality system, based on co-operative links among private, public and voluntaryorganizations and operating within a tourism destination area, has been proposed. Theestablishment of a total quality tourism consortium, TQTC, within the framework ofthis system enables quality enhancement inasmuch as the TQTC is in a position to:
BIJ13,4
480

. secure adequate inputs and close the tourism quality perception gap;
. develop an advanced, comprehensive and consistent quality-managementprocess that converts the inputs into outputs (total quality tourism products);and
. manage effectively the relationships with the external environment and thesuppliers in particular with the result of bridging the tourism quality control gap.
The conceptual model of service quality (SERVQUAL), developed by Parasuramanet al. (1990), is regarded as an important tool for identifying quality improvement areaswithin individual service organisations in relation to enhancing customer satisfaction.The model measures tangible and intangible elements of the service and investigatesgaps in the customer-supplier chain to highlight target areas where quality may beimproved. These gaps include the gap between:
. customers’ expectations and management’s perceptions of customersexpectations;
. management’s perceptions of customers’ expectations and service qualityspecifications;
. service quality specifications and service delivery;
. service delivery and external communications to customers; and
. customers’ expectations and perceived services.
The success of SERVQUAL as a concept depends, however, on circumstances in whicha tourism destination area attempts to survive, grow and improve the quality of touristproducts or services.
Policies for tourism quality continuous improvementsQuality is the perception by the tourist of the extent to which his expectations are metby his experience of the product. Quality is not to be equated to luxury, and must not beexclusive, but must be available to all tourists, including those who are with specialneeds. The tourist product should be seen as the destination and process resulting inthe tourist’s overall experience. The key stakeholders are organisations fulfilling theroles of: policy makers, destination management and quality control; suppliers oftourist sub-products; commercial intermediaries; training suppliers; the guests, and thehost population.
The assessment of the contribution of relevant community policies andprogrammes to quality in tourism revealed the following policy areas as particularlyrelevant to quality development: structural policies; consumer protection; environmentalpolicies; transport and enterprise policies. Of these, the structural funds offered the mostpotential to directly influence quality improvement in tourism.
There are four priority areas requiring specific efforts, they are:
(1) Indicators for the measurement of the quality improvement process. Qualityimprovement is a cyclical and continuing process, and as such must be able tobe measured and evaluated. A list of appropriate indicators is regarded as amanagement tool for use by those who are responsible for the different aspectsof quality improvement, e.g. destination management.
Tourism servicesquality in Egypt
481

(2) Benchmarking. Benchmarking of destinations will help to ensure qualityimprovement and could benefit from common quality indicators. It should be avoluntary exercise, led by the destinations, supported by information-exchangeprocedures based on networking.
(3) Non-financial support for tourism SMEs implementing quality systems. E.g.consultancy, business advice, flora and fauna, etc. should be improved toencourage adoption of a quality approach, this in preference to direct financialaid, which risks distorting local competition.
(4) More intensive use of structural funds to improve the quality of touristproducts. The structural funds should concentrate resources on creating theframework for tourism business development, rather than supportingindividual enterprises or destinations, (e.g. through training, infrastructureimprovement, non-financial business support). Tourism authorities should beactively integrated into the implementation and operation of structural fundprogrammes. There is a need for better dissemination of information on theoperation of structural funds programmes throughout the tourism industry.
Tourism services quality in EgyptOn the basis of the above analysis, quality can be considered as a philosophy forguiding tourism business’ managers in taking their managerial decisions on the levelof all tourism enterprise/destination’s departments. For achieving tourism servicesquality (TServQual) tourism organization management has to ensure that fulfilment ofthree requirements:
(1) internal customer satisfaction;
(2) external customer satisfaction;quality-management process; and
(3) achieving the efficiency of processes.
In the context of this philosophy of quality, this paper depends on the first two factorsfor evaluating TServQual in Egypt, from the view points of the internal customers(employees) and the external customers (tourists) assuming that the efficiency ofprocesses has been fulfilled.
Research methodologyThe research sample frame is based on two groups. The first one is the number of directemployees in the Egyptian tourism sector which amounted to 1.2 million employees inthe year 2001 (ETF, 2001). The second is the number of departures at Cairo Airportwhich amounted to 252,000 in average per month (Egypt, 2001). Sample size of the firstgroup is 500 employees and 700 tourists for the second group. These two samples sizeshave been decided according to the outcomes of discussions with tourism experts fromthe Tourism Training and Research Department (TTRD) of Ministry of Tourism.
There are two questionnaires, one for the employees to measure the internalcustomer satisfaction indicators (employee satisfaction). The other questionnaire isdesigned for tourists to measure the external customer satisfaction level (touristsatisfaction). The questions of both questionnaires have been chosen according to theoutput points of two pilot studies and discussion with ten tourism experts fromthe tourism experts from the TTRD. Data has been collected through distributing 500
BIJ13,4
482
questionnaires among employees from 50 Egyptian tourist companies who haveworked in the tourism sector for at least two years. Among tourists at Cairo Airportand the Egyptian Museum, 700 questionnaires have been distributed. The questions ofboth questionnaires have been designed based on the outcome of reviewing therelevant literature and with the help of the experts of TTRD. The two samples items(employees and tourists) have been chosen randomly.
Likert scale has been used to measure the indicators of employee satisfaction.This scale involves a serious of questions or statements related to the attitude inquestion. The respondent is required to indicate degree of agreement or disagreementwith each of these statements, and responses are given a numerical score that willconsistently reflect the direction of the person’s attitudes on each question/statement.The respondent’s total score is computed by summing scores for all statement and thefinal measure depends on the percentage of each indicator (Kinnear and Taylor, 1991).
Based on Likert scale it has been suggested three options (good, fair, and weak) foreach question/statement to measure the external customer satisfaction.
Questionnaires have been distributed and collected under the supervision of TTRDof the Ministry of Tourism.
The validity and reliability of these processes are based on the outcomes ofdiscussions with the Egyptian tourism experts and the inter- items statistical correlationindicators. The inter-items correlations, according to the results of using SPSS Ver. 10,range from 0.749 to 0.972 for employee satisfaction indicators and from 0.601 to 0.971 fortourists satisfaction indicators. The a value (Cronbach’s a coefficient) for the scale ofemployees satisfaction indicators is 0.9915 and the corrected item – total correlationranges from 0.9699 to 0.8628. For the scale of tourists satisfaction indicators, the alphavalue is 0.9749 and the corrected item – total correlation ranges from 0.9724 to 0.8287. Inboth two cases the value of alpha is above 0.7000 and the range of corrected item – totalcorrelation is greater than 0.3000. So the scale of satisfaction indicators that both twocases can be considered reliable with the two chosen samples (Pallant, 2001).
However, there is a number of limitations which faced this research as follows:. the sample size is small, compared with the size of total population, that was
reflected on the level of reliability of the research results; and. the limited time allowed to the respondents was reflected on the validity of the
research outcomes, because they are interviewed at the last time of their journeyby the time they are ready for departure.
The internal customer satisfactionFor achieving this task there were 500 questionnaires which have been distributedamong employees and managers from 50 tourist companies based on a randomtechnique. The internal customer satisfaction is measured as follows.
The mean of employees satisfaction indicatorsTable II demonstrates the statistical mean of employees satisfaction indicators.
It is clear that the statistical mean of the internal customer satisfaction indicatorsranges from 2.4 to 3.7. The location of this range is between the scale of “agree” and thescale of “neither agree nor disagree” with standard deviation that ranges from 0.9755 to1.4121. This result indicates that the level of the internal customer satisfaction is stillless than the accepted level from the view points of employee.
Tourism servicesquality in Egypt
483
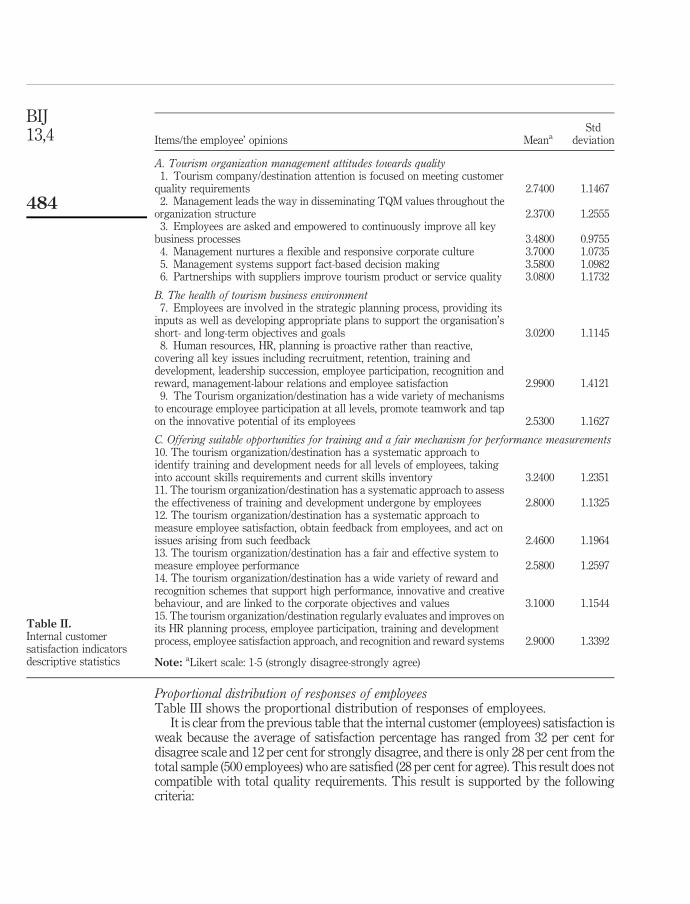
Proportional distribution of responses of employeesTable III shows the proportional distribution of responses of employees.
It is clear from the previous table that the internal customer (employees) satisfaction isweak because the average of satisfaction percentage has ranged from 32 per cent fordisagree scale and 12 per cent for strongly disagree, and there is only 28 per cent from thetotal sample (500 employees) who are satisfied (28 per cent for agree). This result does notcompatible with total quality requirements. This result is supported by the followingcriteria:
Items/the employee’ opinions MeanaStd
deviation
A. Tourism organization management attitudes towards quality1. Tourism company/destination attention is focused on meeting customer
quality requirements 2.7400 1.14672. Management leads the way in disseminating TQM values throughout the
organization structure 2.3700 1.25553. Employees are asked and empowered to continuously improve all key
business processes 3.4800 0.97554. Management nurtures a flexible and responsive corporate culture 3.7000 1.07355. Management systems support fact-based decision making 3.5800 1.09826. Partnerships with suppliers improve tourism product or service quality 3.0800 1.1732
B. The health of tourism business environment7. Employees are involved in the strategic planning process, providing its
inputs as well as developing appropriate plans to support the organisation’sshort- and long-term objectives and goals 3.0200 1.1145
8. Human resources, HR, planning is proactive rather than reactive,covering all key issues including recruitment, retention, training anddevelopment, leadership succession, employee participation, recognition andreward, management-labour relations and employee satisfaction 2.9900 1.4121
9. The Tourism organization/destination has a wide variety of mechanismsto encourage employee participation at all levels, promote teamwork and tapon the innovative potential of its employees 2.5300 1.1627
C. Offering suitable opportunities for training and a fair mechanism for performance measurements10. The tourism organization/destination has a systematic approach toidentify training and development needs for all levels of employees, takinginto account skills requirements and current skills inventory 3.2400 1.235111. The tourism organization/destination has a systematic approach to assessthe effectiveness of training and development undergone by employees 2.8000 1.132512. The tourism organization/destination has a systematic approach tomeasure employee satisfaction, obtain feedback from employees, and act onissues arising from such feedback 2.4600 1.196413. The tourism organization/destination has a fair and effective system tomeasure employee performance 2.5800 1.259714. The tourism organization/destination has a wide variety of reward andrecognition schemes that support high performance, innovative and creativebehaviour, and are linked to the corporate objectives and values 3.1000 1.154415. The tourism organization/destination regularly evaluates and improves onits HR planning process, employee participation, training and developmentprocess, employee satisfaction approach, and recognition and reward systems 2.9000 1.3392
Note: aLikert scale: 1-5 (strongly disagree-strongly agree)
Table II.Internal customersatisfaction indicatorsdescriptive statistics
BIJ13,4
484

Item
s/th
eem
plo
yee
’op
inio
ns
Str
ong
lyag
ree
(per
cen
t)A
gre
e(p
erce
nt)
Nei
ther
agre
en
ord
isag
ree
(per
cen
t)D
isag
ree
(per
cen
t)S
tron
gly
dis
agre
e(p
erce
nt)
A.Tourism
organization
managementattitudes
towardsquality
1.T
ouri
smco
mp
any
/des
tin
atio
nat
ten
tion
isfo
cuse
don
mee
tin
gcu
stom
erq
ual
ity
req
uir
emen
ts10
1913
517
2.M
anag
emen
tle
ads
the
way
ind
isse
min
atin
gT
QM
val
ues
thro
ug
hou
tth
eor
gan
izat
ion
stru
ctu
re8
1511
3828
3.E
mp
loy
ees
are
ask
edan
dem
pow
ered
toco
nti
nu
ousl
yim
pro
ve
all
key
bu
sin
ess
pro
cess
es8
5615
183
4.M
anag
emen
tn
urt
ure
sa
flex
ible
and
resp
onsi
ve
corp
orat
ecu
ltu
re23
4514
153
5.M
anag
emen
tsy
stem
ssu
pp
ort
fact
-bas
edd
ecis
ion
-mak
ing
1750
1216
56.
Par
tner
ship
sw
ith
sup
pli
ers
imp
rov
eto
uri
smp
rod
uct
orse
rvic
eq
ual
ity
1133
1633
7A
ver
age
(A)
1336
1329
9
B.Thehealthof
tourism
businessenvironment
7.E
mp
loy
ees
are
inv
olv
edin
the
stra
teg
icp
lan
nin
gp
roce
ss,
pro
vid
ing
its
inp
uts
asw
ell
asd
evel
opin
gap
pro
pri
ate
pla
ns
tosu
pp
ort
the
org
anis
atio
n’s
shor
tan
dlo
ng
-ter
mob
ject
ives
and
goa
ls8
3318
356
8.H
um
anre
sou
rces
,H
R,
pla
nn
ing
isp
roac
tiv
era
ther
than
reac
tiv
e,co
ver
ing
all
key
issu
esin
clu
din
gre
cru
itm
ent,
rete
nti
on,
trai
nin
gan
dd
evel
opm
ent,
lead
ersh
ipsu
cces
sion
,em
plo
yee
par
tici
pat
ion
,re
cog
nit
ion
and
rew
ard
,m
anag
emen
t-la
bou
rre
lati
ons
and
emp
loy
eesa
tisf
acti
on18
2515
2220
9.T
he
tou
rism
org
aniz
atio
n/d
esti
nat
ion
has
aw
ide
var
iety
ofm
ech
anis
ms
toen
cou
rag
eem
plo
yee
par
tici
pat
ion
atal
llev
els,
pro
mot
ete
amw
ork
and
tap
onth
ein
nov
ativ
ep
oten
tial
ofit
sem
plo
yee
s5
2018
3720
Av
erag
e(B
)11
2617
3115
(continued
)
Table III.Internal customer
satisfaction indicators
Tourism servicesquality in Egypt
485

Item
s/th
eem
plo
yee
’op
inio
ns
Str
ong
lyag
ree
(per
cen
t)A
gre
e(p
erce
nt)
Nei
ther
agre
en
ord
isag
ree
(per
cen
t)D
isag
ree
(per
cen
t)S
tron
gly
dis
agre
e(p
erce
nt)
C.Offeringsuitableopportunitiesfortrainingandafairmechanism
forperformance
measurements
10.
Th
eto
uri
smor
gan
izat
ion
/des
tin
atio
nh
asa
syst
emat
icap
pro
ach
toid
enti
fytr
ain
ing
and
dev
elop
men
tn
eed
sfo
ral
llev
els
ofem
plo
yee
s,ta
kin
gin
toac
cou
nt
skil
lsre
qu
irem
ents
and
curr
ent
skil
lsin
ven
tory
1733
1429
711
.T
he
tou
rism
org
aniz
atio
n/d
esti
nat
ion
has
asy
stem
atic
app
roac
hto
asse
ssth
eef
fect
iven
ess
oftr
ain
ing
and
dev
elop
men
tu
nd
erg
one
by
emp
loy
ees
1019
1945
712
.T
he
tou
rism
org
aniz
atio
n/d
esti
nat
ion
has
asy
stem
atic
app
roac
hto
mea
sure
emp
loy
eesa
tisf
acti
on,
obta
infe
edb
ack
from
emp
loy
ees,
and
act
onis
sues
aris
ing
from
such
feed
bac
k7
1518
3723
13.
Th
eto
uri
smor
gan
izat
ion
/des
tin
atio
nh
asa
fair
and
effe
ctiv
esy
stem
tom
easu
reem
plo
yee
per
form
ance
820
1732
2314
.Th
eto
uri
smor
gan
izat
ion
/des
tin
atio
nh
asa
wid
ev
arie
tyof
rew
ard
and
reco
gn
itio
nsc
hem
esth
atsu
pp
ort
hig
hp
erfo
rman
ce,
inn
ovat
ive
and
crea
tiv
eb
ehav
iou
r,an
dar
eli
nk
edto
the
corp
orat
eob
ject
ives
and
val
ues
1622
2040
215
.T
he
tou
rism
org
aniz
atio
n/d
esti
nat
ion
reg
ula
rly
eval
uat
esan
dim
pro
ves
onit
sH
Rp
lan
nin
gp
roce
ss,
emp
loy
eep
arti
cip
atio
n,
trai
nin
gan
dd
evel
opm
ent
pro
cess
,em
plo
yee
sati
sfac
tion
app
roac
h,
and
reco
gn
itio
nan
dre
war
dsy
stem
s18
1813
3813
Av
erag
e(C
)13
2117
3712
Gen
eral
aver
age
1228
1632
12
Table III.
BIJ13,4
486

. Tourism organization management towards quality as criterion is relativelyweak because there is 36 per cent from the employees agree and 13 per centstrongly agree, however, there is 29 per cent with the scale of disagree and 9 percent with the scale of strongly disagree.
. The health of tourism business environment indicates that 31 per cent from thetotal sample does not support this criterion (31 per cent disagree) and 15 per centstrongly disagree, and there is 26 per cent support this indicator (26 per centagree) and 11 per cent is strongly agree.
. Offering suitable opportunities for training and a fair mechanism forperformance measurements as criterion for internal customer satisfaction isweak because there is only 21 per cent agrees and 13 per cent strongly agree, andthere 37 per cent does not support this indicator (37 disagree) and 12 per centstrongly disagree.
Figure 1 shows the percentage of general average of the internal customer satisfactionindicators.
External customer satisfactionExternal customer satisfaction as dependent variable of equality, from the viewpointsof tourists, has been measured depending upon a number of criteria such as:
. the general evaluation of tourism services in Egypt;
. the extent to which tourists are satisfied with hotel’s services;
. customer value related to tourism services’ prices;
. level of services at accommodations;
. internal transport quality;
. the extent to which tourism services prices at suitable levels; and
. tourist desire to repeat his/her visit to Egypt.
The next tables explains the tourists’ points of view related to these criteria, based on asurvey distributed among 700 tourists whom are interviewed at International CairoAirport and the Egyptian Museum.
Figure 1.Likert scale indicators of
the internal customerattitudes
Agree28%
Neitheragree
nordisagree 16%Disagree
32%
StronglyDisagree
12%
StronglyAgree12%
Agree
Neither agreenor disagree
Disagree
StronglyDisagree
Strongly Agree
Tourism servicesquality in Egypt
487

The mean of tourists satisfaction indicatorsTable IV explains the statistical mean of tourist satisfaction indicators.
According to the previous table the statistical mean is more than 2 (the scale of fair)which means that the level of TServQual in Egypt is accepted from the view points oftourists.
Proportional distribution of responses of touristsTable V shows the proportional distribution of responses of tourists.
The results show that the average of external customer satisfaction (touristssatisfaction) with tourism services in Egypt ranges from 71 per cent to the scale of good,18 per cent for the scale of weak to 11 per cent for the scale of fair. However, the generalevaluation of tourism services, from the viewpoints of tourists, in Egypt is good.
The weakness point may attributed to the internal transport quality criterion whichscored 60 per cent for the scale of good.
There is 22 per cent of tourists do not like to repeat their visit to Egypt for thefollowing reasons (according to the analysis of tourists viewpoints):
. the weakness of infrastructure’s services levels, 40 per cent;
. unsuitable environmental conditions, 30 per cent;
. bad behaviour of people, 20 per cent; and
. unsuitable safety and security conditions, 10 per cent.
Figure 2 shows the percentage of general average of the external customer satisfactionindicators.
Tourists satisfaction criteria Meana Std deviation
The general evaluation of tourism services in Egypt 2.7400 0.5941The extent to which tourists are satisfied with hotel’s services 2.5200 0.7813Customer value related to tourism services’ prices 2.6000 0.7354Level of services at staying places 2.6600 0.6671Internal transport quality 2.2700 0.9265The extent to which tourism services prices at suitable levels 2.4600 0.8058Tourist desire to repeat his/her visit to Egypt 2.4600 0.8303
Note: aSurvey scale: 1-3 (weak-good)
Table IV.External customersatisfaction indicatorsdescriptive statistics
Tourists satisfaction criteriaGood
(per cent)Fair
(per cent)Weak
(per cent)
The general evaluation of tourism services in Egypt 82 10 8The extent to which tourists are satisfied with hotel’s services 70 12 18Customer value related to tourism services’ prices 75 10 15Level of services at staying places 77 12 11Internal transport quality 60 7 33The extent to which tourism services prices at suitable levels 66 14 20Tourist desire to repeat his/her visit to Egypt 68 10 22Average 71 11 18
Table V.External customersatisfaction indicators
BIJ13,4
488

ConclusionsThis paper has tried to examine the concept of quality as a philosophy that guidestourism organization management when taking decision related to tourism services aswell as determining TServQual improvements’ requirements applied to tourismservices in Egypt.
The main conclusions of this paper can be summarized as follows:
(1) For improving tourism service quality it is necessary to achieve threerequirements:. internal customer satisfaction (employee satisfaction);. external customer satisfaction (tourists satisfaction); and. the efficiency of processes.
(2) For quality improvements it is necessary to be a creative and innovativebusiness environment which support the employee new ideas and theirparticipating in making decision processes.
(3) It is important to be a wide range of empowerment to give the employee theopportunities to behave positively according to the condition he/she faces intourism competitive markets.
(4) In the case of Egypt it is necessary to restructure tourism business sector to be akind of cooperation between tourism enterprises such as strategic alliances inthe field of information technology, strategic marketing, etc.
(5) Business environment in the Egyptian tourism sector still has a number ofweaknesses that do not support the internal customer satisfaction for thefollowing reasons:. there is no suitable system for encouraging people to be creative (or to be
innovative) and participate in decision making processes;. the weakness of empowerment levels within tourism business enterprises;
and. the style of family business management overwhelmed tourism business
sector in Egypt and this put obstacles in the way of creativity and innovation.
(6) Tourism services levels are quite suitable, in general, from the viewpoints oftourists (external customers).
(7) There is a lot of efforts need to be done for TServQual improvement in Egypt inareas of infrastructure services, the environmental conditions, the safety andsecurity conditions, increasing people awareness, and the internal transportquality.
Figure 2.The grade of the external
customer satisfactionindicatorsGood
71%
Fair11%
Weak18%
GoodFairWeak
Tourism servicesquality in Egypt
489

(8) It is necessary to be an effective system for designing and implementing moreefficient quality control measures in the areas of food safety, security and theenvironmental tourism activities.
(9) It is necessary to be a kind of co-operation between tourism governmentinstitutions and tourism private sector in the fields of tourism product safetyand tourism crisis management for improving TServQual in Egypt.
References
Augustyn, M.M. (1998), “The road to quality enhancement in tourism”, International Journal ofContemporary Hospitality Management, pp. 145-58.
Baron, A. (1995), “Going public with studies on culture management”, Personal ManagementReview, Vol. 1 No. 19.
Brand, A. (1998), “Knowledge management and innovation at 3M”, Journal of KnowledgeManagement, Vol. 2 No. 1, pp. 17-22.
Burch, E., Rogers, H.P. and Underwood, J. (1995), “Exploring SERVPERF: an empiricalinvestigation of the importance-performance, service quality relationship in the uniformrental industry”, available at: http://sbaer.uca.edu/docs/proceedings11/95ama.121.htm
CEC (2001), Working Together for the Future of European Tourism, Commission of the EuropeanCommunities, COM, Brussels.
Cheung, C. and Law, R. (1998), “Hospitality service quality and the role of performanceappraisal”, Managing Service Quality, Vol. 8 No. 6.
Christopher, M. (1998), Logistics & Supply Chain Management, Strategies for Reducing Cost andImproving Service, 2nd ed., Financial Times, Pitman Publishing, Marshfield, MA,Commentary: The barometer of customer satisfaction: how to deliver service excellenceContemporary Hospitality.
Creech, B. (1994), The Five Pillars of TQM, Truman Talley Books/Plume, New York, NY.
Cronin, J.J. and Taylor, S.A. (1992), “Measuring service quality: a re-examination and extension”,Journal of Marketing, Vol. 52 No. 3.
Day, A. and Peters, J. (1994), “Rediscovering standards: static and dynamic quality”,International Journal of Contemporary Hospitality Management, Vol. 1 No. 2, pp. 81-4.
Deming, W.E. (1982), Quality Productivity and Competitive Position, Cambridge University, MITCentre for Advanced Engineering Study, Cambridge, MA.
Dodwell, S. and Simmons, P. (1994), “Trials and tribulations in the pursuit of qualityimprovement”, International Journal of Contemporary Hospitality Management, Vol. 1No. 2, pp. 14-8.
Dumond, E.J. (2000), “Value management: an underlying framework”, International Journal ofOperation & Production Management, Vol. 20 No. 9.
Egypt (2001), Tourism in Figures, Year Book, Information & Computer Center, Ministry ofTourism, Belmopan.
Eraqi, M.I. (2002), An introduction to total quality management and the tourism service qualityin Egypt, tourists’ viewpoint survey, (in Arabic Language), Neda El-janoub Journal,Appeals from the south, No. 2, January, Center for Developing Countries Studies, CairoUniversity, Egypt.
ETF (2001), “The Egyptian tourism industry”, annual report, Egyptian Tourism Federation,Egypt.
Feigenbaum, A.V. (1983), Total Quality Control, 3rd ed., McGraw-Hill, New York, NY.
BIJ13,4
490

Fitzsimmons, J.A. and Fitzsimmons, M.J. (2001), Service Management Operations, Strategy, andInformation Technology, 3rd ed., McGraw-Hill Higher Education, New York, NY.
Hamel, G. and Prahalad, C.K. (1993), “Strategy as stretch and leverage”, Harvard BusinessReview, March/April, pp. 75-89.
Horner, M. (1997), “Leadership theory: past, present and future”, Team PerformanceManagement Journal, Vol. 3 No. 4, University of North Texas, University Press, USA.International Journal of ISO 9000, The TQM Magazine, Vol. 8 No 5, pp. 7-13.
Ingram, H., Tear, R., Ridley, S. and Ferrone, L. (1997), “Strategic competitive advantage throughstructure, quality and teamwork”, in Teare, R., Farber Canziani, B. and Brown, G. (Eds),Global Directions: New Strategies for Hospitality and Tourism, Cassell, London, pp. 133-64.
Juran, J.M. (1964), Managerial Breakthrough, McGraw-Hill, New York, NY.
Juran, J.M. (1980), Quality Planning and Analysis, McGraw- Hill, New York, NY.
Kinnear, T.C. and Taylor, J.R. (1991), Marketing Research, an Applied Approach, McGraw-Hill,New York, NY.
Lalonde, B.J. and Zinszer, P.H. (1976), Customer Service: Managing and Measurement, NationalCouncil of Physical Distribution Management, Chicago, IL.
Lockwood, A. (1994), “Managing quality in food and beverage operations”, in Bernard, D. andLockwood, A. (Eds), Food and Beverage Management: A Selection of Readings,Butterworth-Heinemann, Oxford, pp. 172-86.
Lockwood, A. and Guerrier, Y. (1989), “Flexibility working in hospitality industry: currentstrategies and future potential”, International Journal of Contemporary HospitalityManagement, Vol. 1 No. 1, pp. 11-6.
Mann, R. et al., (1999), “An assessment of management systems and business performance in theUK food and drinks industry”, British Food Journal, Vol. 101 No. 1.
Moore, L.G., Hopkins, W.E. and Hopkins, S.A. (1998), “Quality and empowerment programs: dualpaths to customer satisfaction?”, Managing Service Quality, Vol. 8 No. 1.
Myburgh, A. (2001), Quality management in the chief directorate: Economic Statistics andSurveys and National Accounts at States SA, June.
Oakland, J.S. (1989), Total Quality Management, Butterworth-Heinemann, Oxford.
Pallant, J. (2001), Spss Survival Manual, a Step by Step Guide to Data Analysis Using SPSS forWindows Ver. 10, Open University Press, Buckingham.
Parasuraman, A., Zeithaml, V. and Berry, L. (1990), Delivering Quality Service, The Free Press,New York, NY.
Parasuraman, A., Zeithaml, V.A. and Berry, L.L. (1985), “A conceptual model of service qualityand its implications for future research”, Journal of Marketing, Vol. 49, pp. 41-50.
Souty, F. (2003), Passport to Progress: Competition Challenges for World Tourism andGlobal Anticompetitive Practices in the Tourism Industry, World Tourism Organization,Madrid.
The British Standards Institute (1987), BS 4778, Quality Vocabulary: Part 1 InternationalTerms, Part 2 National Terms (ISO 8402, 1986), The British Standards Institution,London.
Wilson, S.R., Ballance, R. and Pogany, J. (1995), Beyond Quality, Edward Elgar, Aldershot.
WTO (1991), Recommended Measures for Tourism Safety, WTO, Buenos Aires.
WTO (1993), Health Protection: Health Information and Formalities in International Travel,WTO, Bali.
Tourism servicesquality in Egypt
491

WTO (1995), Newsletter, Vol. 1.
WTO (2003), Quality standards, WTO tourism quality, World Tourism Organisation, availalbleat: www.world-tourism.org
Further reading
Bemowski, M.T. (1991), “The competitive benchmarking wagon”, Quality Progress, January.
EC (1990), EC Directive on Package Travel, Package Holiday and Package Tours, EC Commission,Brussels.
BIJ13,4
492
To purchase reprints of this article please e-mail: [email protected] visit our web site for further details: www.emeraldinsight.com/reprints

An empirically validated qualitymanagement measurement
instrumentPrakash J. Singh
Department of Management, The University of Melbourne, Melbourne,Australia, and
Alan SmithDepartment of Mechanical and Manufacturing Engineering,
The University of Melbourne, Melbourne, Australia
Abstract
Purpose – To develop a quality management (QM) measurement instrument that has soundpsychometric properties and recognizes a key feature of the field, i.e. QM is currently characterized bythree competing approaches: standards-based; prize-criteria; and, elemental implementation approaches.
Design/methodology/approach – The three disparate approaches were analyzed to identify sets ofkey constructs and associated items. The assembled instrument was empirically validated through asurvey of 418 Australian manufacturing organizations. A full set of reliability and validity tests wereperformed. Wherever applicable, confirmatory approach using structural equation modeling was used.
Findings – The results of psychometric tests suggest that the constructs of the three approacheshave good empirical support. In the manner in which the instrument is presented, it is possible toseparately measure constructs related to each of the three approaches.
Research limitations/implications – The measurement instrument has been validated withmanufacturing organizations from Australia. It is applicability to other industry sectors or countrycontexts needs to be verified.
Practical implications – Practitioners and consultants can use the measurement instrument forconducting QM benchmarking exercises within and across organizations. Researchers can use theinstrument in future studies for, inter alia, theory development in the area.
Originality/value – The measurement instrument overcomes the shortcomings of the existinginstruments by explicitly including all three practical approaches to quality management. Also, arigorous psychometric validation process is adopted that provides credible outcomes.
Keywords Quality management, Performance measures, Psychometric tests, Australia
Paper type Research paper
IntroductionTo hasten the rate of knowledge consolidation in the quality management (QM) area,there needs to be greater consensus on its ontological bases and epistemologicalprinciples among researchers. Measurement instruments that have soundpsychometric properties can make important contribution towards this end. Theseinstruments would provide confidence to users that the information they obtain arereliable and valid. Further, if these instruments get universally accepted, then this willprevent the continual “reinvention of the wheel” facilitate congruence in research, andeventually, impact positively upon the intellectual development of the field (Filippini,1997; Amundson, 1998; Wacker, 1998).
The current issue and full text archive of this journal is available at
www.emeraldinsight.com/1463-5771.htm
Qualitymanagement
493
Benchmarking: An InternationalJournal
Vol. 13 No. 4, 2006pp. 493-522
q Emerald Group Publishing Limited1463-5771
DOI 10.1108/14635770610676317

The QM literature shows that several measurement instruments have been published.Table I provides a summary of four such instruments. These four were selected foranalysis because psychometric details are provided. The researchers developed theseinstruments with the intention of measuring organizational QM practices. Some otherresearchers (Black and Porter, 1996; Zeitz et al., 1997) have used QM measurementinstruments, but have not provided details of how they were developed.
As Table I shows, all of these instruments attempt to ensure that good qualityinformation can be collected. However, these instruments have a number of shortcomings.Firstly, none of these instruments reflects the current state of practice in the area. The QMarea has evolved to the stage where three major approaches dominate: the standards-basedapproach in which the ISO 9000 is the most prominent; the prize-criteria approach whichcomprises the various business excellence and quality awards; and, the elemental approachpromoted by various academicians and practitioners. None of the published instrumentstruly reflect the three-pronged approach that currently dominates: Saraph et al.(1989)instrument reflects the modus operandi of the 1980s when the ideas of quality gurus such asDeming and Juran were popular; Flynn et al.(1994) instrument is too broad-based (i.e.addressing the concepts of World Class Manufacturing); and, Ahire et al.’s (1996) andGrandzol and Gershon’s (1998) instruments are narrowly focused on “TQM” only.Secondly, there is significant disparity in the types of analyses used to demonstrate theability of the instruments to collect good quality information. Saraph et al.(1989), Flynnet al.(1994) and, Grandzol and Gershon (1998) use exploratory approaches which have anumber of limitations. Saraph et al.’s (1989) instrument has been used in other studies(Quazi et al., 1998; Joseph et al., 1999), but the statistical procedures used to show reliabilityand validity are limited to simple exploratory techniques. Only Ahire et al. (1996) use thepreferred confirmatory approach. Finally, many organizational theories, including those onQM, have low universal applicability due to cultural, economic, political and socialdifferences that exist between countries (Shenkar and Glinow, 1994). Except Saraph et al.(1989), the other existing QM instruments have been validated in organizations in the USAand Japan. As a result, it is unclear if these instruments are suited for studies in othercountries. In sum, owing to differences in the subject areas emphasized, analysis tools usedand the domains in which the instruments are validated, there are significant differences inthe instruments, leading to low universal acceptance.
Whilst we understand the calls made for not “reinventing the wheel” and usingexisting instruments, we feel the limitations outlined above are serious and warrant thedevelopment of a new instrument. In this paper, an empirically validated QMmeasurement instrument is presented. In order to ensure that the instrument reflectsthe state of art in the field, the content is based on a review of literature and practice.Also, a scientific process that comprehensively tests the psychometric properties of theinstrument is used. The outcome is a QM measurement instrument that has soundreliability and validity that researchers and practitioners can use for benchmarkingwithin and across organizations.
The next section of this paper provides details of the instrument development andpsychometric validation process that was used. Within this section, details of the testsperformed are provided. The paper concludes by summarizing the characteristics ofthe instrument, identifying the contributions it makes to the QM body of knowledge,and describing the implications of the instrument to research and practice in the area.
BIJ13,4
494

Inst
rum
ent
Sar
aph
etal.
(198
9)F
lyn
net
al.
(199
4)A
hir
eet
al.
(199
6)G
ran
dzo
lan
dG
ersh
on(1
998)
Are
asem
ph
asiz
edQ
Mas
pre
scri
bed
by
qu
alit
yg
uru
san
dem
inen
tac
adem
ics
QM
asp
art
ofW
orld
Cla
ssM
anu
fact
uri
ng
(WC
M)
TQ
MT
QM
Dom
ain
Com
pan
ies
inM
inn
eap
olis
/St
Pau
lar
eain
the
US
AU
SA
and
Jap
anes
em
ach
iner
y,
tran
spor
tati
onco
mp
onen
tsan
del
ectr
onic
sp
lan
ts
Mot
orv
ehic
lep
arts
and
acce
ssor
ies
ind
ust
ryin
the
US
A
Su
pp
lier
sto
US
AN
avy
’sA
via
tion
Su
pp
lyO
ffice
Sam
ple
size
(res
pon
sera
te)
20fi
rms
(35
per
cen
t)16
2re
spon
den
ts45
pla
nts
(60
per
cen
t)71
6re
spon
den
ts37
1re
spon
den
ts(3
7p
erce
nt)
273
resp
ond
ents
(47
per
cen
t)
Res
pon
den
tsQ
ual
ity
man
ager
san
dg
ener
alm
anag
ers
Ran
dom
lyse
lect
edm
anag
ers,
sup
erv
isor
san
dw
ork
ers
Pla
nt
man
ager
sC
hie
fex
ecu
tiv
eof
fice
rs
Lev
elof
anal
ysi
sF
irm
Pla
nt
Fir
mF
irm
Sca
le5-
poi
nt
Lik
ert
scal
e5-
poi
nt
Lik
ert
scal
e7-
poi
nt
Lik
ert
scal
e6-
poi
nt
Lik
ert
scal
eP
re-t
esti
ng
ofin
stru
men
t?Y
esY
es–
pre
test
and
pil
otte
stco
mb
ined
Yes
–p
rete
stan
dp
ilot
test
com
bin
edY
es
Pil
otte
stin
gof
inst
rum
ent?
No
Yes
An
aly
sis
ofp
ilot
test
ing
dat
aN
otap
pli
cab
leQ
ual
itat
ive
imp
rov
emen
tsQ
ual
itat
ive
imp
rov
emen
tsR
elia
bil
ity
and
val
idit
yan
aly
sis
Con
ten
tv
alid
atio
nL
iter
atu
resu
rvey
and
exp
ert
pan
elre
vie
wC
omp
reh
ensi
ve
lite
ratu
rere
vie
wC
omp
reh
ensi
ve
lite
ratu
rere
vie
wL
iter
atu
resu
rvey
and
exp
ert
pan
elre
vie
wM
ult
icol
lin
eari
tyof
item
san
aly
sis
No
No
No
Inte
r-it
emco
rrel
atio
n
Un
idim
ensi
onal
ity
anal
ysi
sN
oN
oC
onfi
rmat
ory
fact
oran
aly
sis
(goo
dn
ess
offi
tnes
sin
dex
)E
xp
lora
tory
fact
oran
aly
sis
Rel
iab
ilit
yan
aly
sis
Cro
nb
ach
’sa
Cro
nb
ach
’sa
and
item
inte
rcor
rela
tion
sC
ron
bac
h’sa
and
Wer
ts-L
inn
-Jor
sek
ogco
effi
cien
t
Cro
nb
ach
’sa
(con
tinued
)
Table I.Comparison of four
published QMmeasurement
instruments
Qualitymanagement
495

Inst
rum
ent
Sar
aph
etal.
(198
9)F
lyn
net
al.
(199
4)A
hir
eet
al.
(199
6)G
ran
dzo
lan
dG
ersh
on(1
998)
Con
stru
ctv
alid
atio
nE
xp
lora
tory
fact
oran
aly
sis
Ex
plo
rato
ryfa
ctor
anal
ysi
san
du
niv
aria
teco
rrel
atio
nb
etw
een
sele
cted
con
stru
cts
and
ind
epen
den
tm
easu
res
ofsi
mil
arco
nst
ruct
s
Con
ver
gen
tv
alid
ity
:co
nfi
rmat
ory
fact
oran
aly
sis
(Ch
i-sq
uar
ed
iffe
ren
ceb
etw
een
all
pai
rsof
con
stru
cts)
dis
crim
inan
tv
alid
ity
:B
entl
er-B
onn
ett
coef
fici
ent
Ex
plo
rato
ryfa
ctor
anal
ysi
san
dit
em-c
onst
ruct
corr
elat
ion
Pre
dic
tiv
e(c
rite
rion
-rel
ated
)v
alid
atio
n
Cor
rela
tion
bet
wee
nQ
Mco
nst
ruct
san
dm
easu
res
ofq
ual
ity
per
form
ance
Can
onic
alco
rrel
atio
nb
etw
een
QM
scal
esan
dm
easu
res
ofq
ual
ity
per
form
ance
Str
uct
ura
leq
uat
ion
mod
elli
ng
(cor
rela
tion
bet
wee
nQ
Mco
nst
ruct
san
dm
easu
res
ofq
ual
ity
per
form
ance
)
Mea
nsc
ale
scor
esco
rrel
atio
ns
bet
wee
nex
ogen
ous
and
end
ogen
ous
var
iab
les
Fin
alin
stru
men
tco
nst
ruct
s(n
um
ber
ofit
ems)
1.R
ole
ofd
ivis
ion
alto
pm
anag
emen
tan
dq
ual
ity
pol
icy
(13)
2.R
ole
ofth
eq
ual
ity
dep
artm
ent
(5)
3.T
rain
ing
(8)
4.P
rod
uct
/se
rvic
ed
esig
n(6
)5.
Su
pp
lier
QM
(8)
6.P
roce
ssm
anag
emen
t/
oper
atin
gp
roce
du
res
(10)
7.Q
ual
ity
dat
a&
rep
orti
ng
(8)
8.E
mp
loy
eere
lati
ons
(8)
Dim
ensi
onI:
Top
Man
agem
ent
Su
pp
ort
1.Q
ual
ity
Lea
der
ship
(5)
2.Q
ual
ity
Imp
rov
emen
tR
ewar
ds
(6)
DII
:Q
ual
ity
Info
rmat
ion
3.P
roce
ssC
ontr
ol(3
)4.
Fee
db
ack
(7)
DII
I:P
roce
ssM
anag
emen
t5.
Cle
anli
nes
s&
Org
aniz
atio
n(5
)D
IV:
Pro
du
ctD
esig
n6.
New
Pro
du
ctQ
ual
ity
(4)
7.In
ter-
fun
ctio
nal
Des
ign
Pro
cess
(4)
DV
:W
ork
forc
eM
anag
emen
t8.
Sel
ecti
onfo
rT
eam
wor
kP
oten
tial
(3)
9.T
eam
wor
k(4
)D
VI:
Su
pp
lier
Inv
olv
emen
t10
.Su
pp
lier
Rel
atio
nsh
ip(4
)D
VII
:C
ust
omer
Inv
olv
emen
t11
.C
ust
omer
Inte
ract
ion
(3)
1.T
opM
anag
emen
tC
omm
itm
ent
(6)
2.C
ust
omer
Foc
us
(4)
3.S
up
pli
erQ
ual
ity
Man
agem
ent
(6)
4.D
esig
nQ
ual
ity
Man
agem
ent
(6)
5.B
ench
mar
kin
g(4
)6.
SP
CU
sag
e(4
)7.
Inte
rnal
Qu
alit
yIn
form
atio
nU
sag
e(6
)8.
Em
plo
yee
Em
pow
erm
ent
(5)
9.E
mp
loy
eeIn
vol
vem
ent
(8)
10.
Em
plo
yee
Tra
inin
g(5
)11
.P
rod
uct
Qu
alit
y(4
)12
.S
up
pli
erP
erfo
rman
ce(6
)
1.E
xog
enou
sle
ader
ship
(5)
2.C
onti
nu
ous
imp
rov
emen
t(4
)3.
Em
plo
yee
fulfi
lmen
t(5
)4.
Lea
rnin
g(5
)5.
Pro
cess
man
agem
ent
(8)
6.C
oop
erat
ion
(8)
7.C
ust
omer
focu
s(4
)
Table I.
BIJ13,4
496

Instrument development and validation processThe psychometric method (Nunnally, 1978) was employed for the purpose ofdeveloping and validating the measurement instrument. Based on this method, anumber of researchers have proposed instrument development and validationprocesses (Malhotra and Grover (1998), Flynn et al. (1990) and Saraph et al. (1989).A synthesized version of these schemes was used in this study. These includedconducting a literature review, identifying key constructs and associated items,selecting suitable scale, pretesting, pilot testing, collecting data, and finally,performing statistical tests on data collected. Details of these are provided next.
Literature reviewA careful review of literature ensures that all the important aspects in the field arecovered, i.e. the instrument has content validity (Flynn et al., 1990). This is a subjectiveprocess. For the instrument developed in this study, the literature review was basedmainly on the existing instruments, ISO 9000 (2000), the business excellence/qualityawards frameworks such as the Australian Quality Awards (2001), and ideas on QMpublished by practitioners and academicians. A summary of this literature review ispresented in the next section.
Constructs of QMUsing the psychometric approach, the QM concepts were estimated with items whichwere grouped into constructs. From the literature review, eight QM constructs weresynthesized. Also developed were one business environment and four performanceconstructs. These constructs and their items are discussed below.
Top management leadership. The role of the top management leadership team isregarded as being important by all three QM approaches. However, the scope differs.In the standards-based approach, the top management leadership group is expected toensure that the QM system is regularly audited, revised and continually improved foreffectiveness. The top management leadership team also needs to ensure, whererelevant, that the QM system is based on statistical thinking. In the prize-criteriaapproach, the top management leadership team plays a broader role than in thestandards-based approach. It needs to be committed to quality and use a participativestyle in order to involve all stakeholders in creating quality-based value system for theorganization. As for the elemental approach, the top management leadership teamneeds to demonstrate commitment to quality, take a long-term strategic view ofquality, and ensure that sufficient resources are available for quality related activities.All three approaches advocate a contingent view to leadership. The approaches are notprescriptive on the leadership styles needed for effective QM, suggesting that it ispossible to use any combination of participative and authoritative styles depending oncontext. Similarly, leadership behavior can range from transformational totransactional, again depending on context.
Customers. QM places great emphasis on organizations achieving strong customerfocus and high satisfaction levels. All three approaches reflect this core principle,however, the extent of treatment differs. In the standards-based approach, theemphasis is on ensuring that the requirements of customers are well understood andthat mistakes in this aspect are minimized. Organizations are expected to haveprocedures in place to ensure this. In the prize-criteria approach, organizations are
Qualitymanagement
497

required to have systems to deal with customers’ complaints. Suitable feedback fromcustomers should be obtainable. Also, organizations need to systematically capturecustomer requirements and satisfaction levels. The elemental approach includes all ofprize-criteria approach, with the addition of viewing customer satisfaction as animportant measure of quality.
Employees. All three approaches recognize employees as an important construct ofQM. The focus is on the organization enabling employees to contribute meaningfully toquality of work. The standards-based approach concentrates on employees being awareof and empowered to act on quality-related matters and being suitably trained for thejobs they do. The prize-criteria approach focuses on having an open culture, teamwork,and continuous improvement. The human resources management and remunerationsystems are required to be in place to support these. The elemental approach shares withthe standards-based approach the requirement that employees be aware of their rolesand goals and are trained for their jobs. It also shares with the prize-criteria approach theneed for open culture and teamwork. In addition, the elemental approach suggestsemployees be engaged in continuous improvement of work output.
Suppliers. QM promotes the idea that long term, stable, cooperative and mutuallybeneficial relationships with a few suppliers is preferable to having multiple suppliersthat are dealt with in an overly formal, competitive, contractual and arms-lengthmanner. The standards-based approach focuses on ensuring that misunderstandingswith suppliers are avoided, materials from customers are treated in the same way as ifthey are from other suppliers and subcontractors are suitably pre-qualified. Theprize-criteria approach strongly emphasizes the need for mutually-beneficialcollaborative relationships. In addition, organizations are expected to have systemsin place to ensure quality of incoming goods and services, share relevant informationwith suppliers, pass on some of the cost-savings to suppliers and make quality animportant criterion for selecting suppliers. The elemental approach is similar to theprize-criteria in terms of developing long-term relationships, quality being the maincriteria for selecting suppliers and ensuring quality from suppliers. In addition to these,the elemental approach expects organizations to involve suppliers in the developmentof new products.
Information and communication system. All three approaches recognize thatan efficient and effective information and communication system forms the bedrockupon which many quality initiatives and activities take place. However, the extentto which each of the approaches addresses this construct differs considerably. Thestandards-based approach has a rather narrow focus with emphasis on ensuing thatpractices relating to documentation are sound, and that goods and services, whetherthey are in-process or finished form, are traceable. The prize-criteria approach focus onensuring that the information and communication system outputs are used formeasuring performance and thus are of very high quality. The elemental approachrequires that the information and communication system enable data to be collected ina timely fashion, transparently shared, and used to provide feedback to employees.All three approaches require that information relating to quality is readily available.
Processes. All three approaches have strong emphasis on the business processesthat impact upon quality of products. The standards-based approach has a verypractical outlook to processes. A planned and systematic approach to quality isrequired. Regular reviews of all aspects of operations are expected, and, if problems are
BIJ13,4
498
detected, remedial actions are required to be taken in a timely manner. Systems need tobe in place to ensure that defective products are not produced. The prize-criteriaapproach takes a broader approach to processes and emphasizes the key role ofinnovation, suggesting that high degree of innovativeness is required for continuousimprovement of processes. Also, there is recognition that a focus on quality needs tostart at the design stage. The elemental approach also recognizes this last point. Inaddition, this approach requires that processes be safe, constantly monitored andformal methods such as statistical process control are used when appropriate.
Wider community. Only the prize-criteria approach formally addresses the issue oforganizations needing to meaningfully engage with their wider community.Organizations are expected to address their societal responsibilities and wherepossible, provide support to relevant community groups. There is also an expectationto reduce risks posed to society as a result of organizations’ activities, as well as sharebest practice information where possible.
Competitors. All three approaches favor quality (ahead of cost, flexibility anddelivery) as the basis for competition. However, it is only the elemental approach thatseems to require specific actions. Organizations are required to assess the impact ofcompetition by benchmarking themselves against leading competitors, as well asdeveloping understanding of the competition they face.
Business conditions. The prize-criteria approach is the only one that explicitly requiresorganizations scan their business environments as part of the strategic planning processin order to assess the conditions they face. The scanning involves understanding the stateof the industry, macro-economic conditions, the rules and regulations that are in place, andthe rate at which changes take place in products, processes and customers.
Product quality. The standards-based and prize-criteria approaches both predict thatorganizations can expect improvements in the quality of products that are produced.Specifically, organizations can expect reductions in quality costs, defective andwastage rates, as well as improvements in perceived product quality. The elementalapproach does not appear to make any explicit predictions in terms of direct productquality performance outcomes. Instead, it appears to imply that product quality wouldinherently improve once other aspects of QM are in place.
Customer satisfaction. Similar to the product quality construct, the standards-basedand prize-criteria approaches suggest that organizations can expect to generate highlevels of customer satisfaction. Organizations can expect to offer higher levels ofcustomer service, achieve greater consistency in documentation, have fewersecond-party audits and generate higher perceived quality by customers.
Business performance. The prize-criteria approach is the only one that makes explicitpredictions that its implementation will lead to financial and other organizationalperformance outcomes. These are in the form of greater demand for products, betteroperating efficiency levels, improved employee satisfaction levels, and better relationshipswith suppliers. All of these culminate in improved profitability and market share levels.
Community relations. As with the business performance construct, the prize-criteriaapproach is also the only one that suggests this approach will generate greater positiveinvolvement of organizations in community activities. This will enable greater levels ofcommunity goodwill to accrue to organizations.
These QM constructs and the final sets of associated items in the form of aquestionnaire are shown in the Appendix. As can be seen, the three approaches have
Qualitymanagement
499

a number of constructs that share the same labels. However, the items for theseconstructs are quite different for all three approaches, with only a handful beingcommon across two or three of the approaches. Also shown in the Appendix are thescales used to measure the items. The rest of this section provides details ofpsychometric analyses performed on the constructs of the three QM approaches.
Measurement scalesThe Likert scale was used throughout to measure all the items. This scale is able to dealwith the conceptual nature of the subject area, large number of items and difficultieswith eliciting specific information from respondents. A five-point scale was used sincereliability does not improve further with higher-resolution scales (Forkeret et al., 1997).Also, it was deemed not necessary to force respondents to choose a position by using aneven numbered scale. This is because it was felt that respondents might sometimesgenuinely arrive at a “neutral” position. Finally, a “not applicable” option was provided.
For the QM constructs, respondents were requested to indicate their level ofagreement with the items that most closely reflected the situation at their work site. Forthe business conditions construct, managers’ perceptions of how their organizationswere affected by business environmental factors were gauged. As for theorganizational performance items, managers’ perceptions of the degree ofsatisfaction their organizations had with their performance levels were assessed.
PretestingIndependent third-party advice to fix possible tautological problems and improve theclarity of the statements was obtained. A panel of eight people (experts in QM,statisticians, and linguists) were asked to examine the draft questionnaire and suggestpossible improvements. Many useful suggestions were made and these were incorporatedinto the instrument.
Pilot testingThe instrument was sent to quality managers of 50 manufacturing organizations inVictoria, Australia in order to obtain feedback on the questionnaire. Useable responseswere received from 22 organizations. A range of statistical tests for reliability andvalidity was performed. However, the small sample size meant that some tests were notmeaningful. As a result, the items that violated the statistical tests that could beperformed were modified, instead of being eliminated from the instrument, as isrecommended (Hair et al., 1998).
Data collectionThe empirical data for this study was obtained from Australian manufacturingorganizations. A total of 1,053 organizations were randomly selected from theJAS-ANZ register (1999) and requested to take part in this study. This register lists allorganizations that are accredited to quality, environmental, safety and other standards.About 418 organizations responded. After accounting for non-deliverablequestionnaires, a final response rate of 42 percent was achieved.
The level of analysis for this study was limited to the plant level. Only oneregistered site per organization was included in the sample. Managers in charge ofquality-related activities were specifically asked to complete the questionnaires
BIJ13,4
500

because it was felt that they were best qualified to answer the questions. It was alsonecessary to ensure that the sample consisted of organizations that were practicingQM. Several indicators suggested that this was the case: all the organizations wereregistered to QM standards; 31 percent claimed to have formally implemented TQMprograms; and, some had applied for national and other quality awards.
Checks were performed to ensure that the sample of responding organizations wasrepresentative of the broader population of manufacturing firms. First, thedemographic characteristics of the sample were compared to the general populationof manufacturing organizations. The distributions in terms of location, type ofmanufacturing and size of organizations were similar in proportion. Second, thepossibility that non-response bias could have resulted in a non-representative samplewas investigated. A sub-sample of organizations that had not taken part in the studywas contacted by telephone cited time, resource and confidentiality constraints. Also,the survey was conducted in two phases and a comparison of responses between thesephases showed no significant differences. This suggested that the late respondents(who could have been non-participants) were not significantly different to theresponding organizations. Together, these two tests suggested that there were nosystematic biases. Overall, it was possible to assume that the sample wasrepresentative of the total manufacturing sector.
Statistical testsA range of statistical tests was performed on data obtained from the survey to assessthe reliability and validity of the instrument. The essence of these analyses was toensure that the constructs had acceptable psychometric properties. Since, aconfirmatory approach was adapted, most of these analyses depended on the outputof structural equation modeling analysis for each construct. The asymptoticallydistribution free (ADF) estimation procedure was used because all the variables weremeasured with ordinal scales. Prior to performing these tests, missing data werereplaced with values obtained through the “expectation-maximization” iterativealgorithm (Hair et al., 1998) since this method has been shown to be better than othersubstitution and elimination techniques (Jamshidian and Bentler, 1999).
The set of statistical tests for validity and reliability is shown as a flow chart inFigure 1. These involved tests for multicollinearity, unidimensionality, reliability, itemassignment, construct validity and predictive validity. The results of tests forunidimensionality, reliability and construct (convergent) validity is provided in thispaper. Tests for multicollinearity, item assignment, construct (discriminant) validityand predictive validity involve a number of large correlation matrices. Owing to spaceconstraints, these are not shown in this paper. These matrices are available from theauthors on request.
Test for multicollinear-ity. Multicollinearity occurs when two or more items measurethe same entity and are therefore identical (Ahire et al., 1996). Highly collinear itemscan distort the results substantially or make them unstable and not generalizable (Hairet al., 1998). If inter-item correlations, measured as polychroic correlations (Joreskorg,1993) in this case because of the ordinal data type of the items, are greater than 0.9, thenthe possibility that multicollinearity exists is high (Hair et al., 1998). For all the items ofthe constructs of this study, none of the inter-item correlations was greater that 0.9.Hence, multicollinearity type problems did not appear to be present.
Qualitymanagement
501
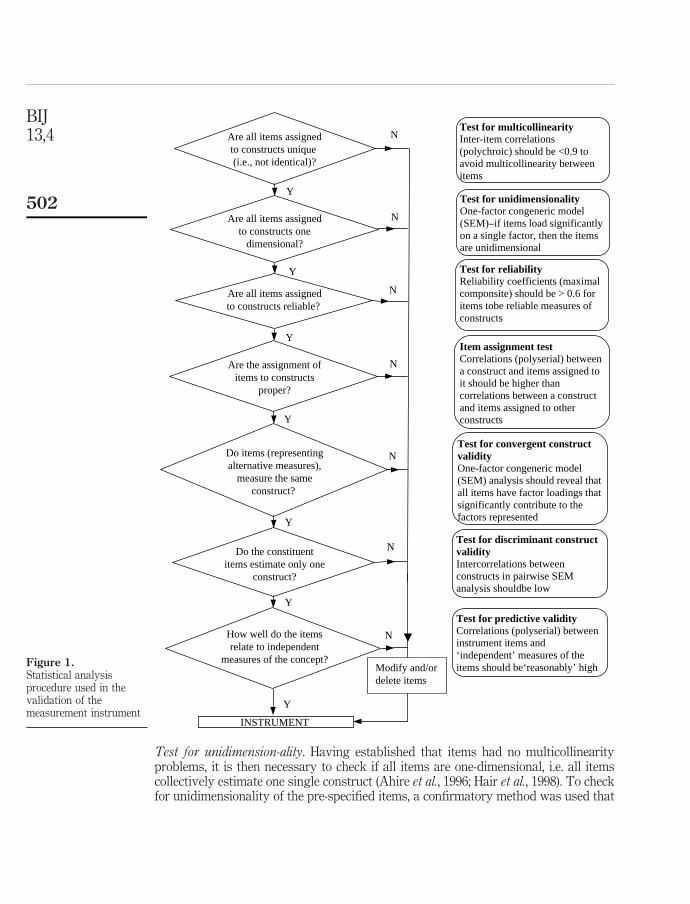
Test for unidimension-ality. Having established that items had no multicollinearityproblems, it is then necessary to check if all items are one-dimensional, i.e. all itemscollectively estimate one single construct (Ahire et al., 1996; Hair et al., 1998). To checkfor unidimensionality of the pre-specified items, a confirmatory method was used that
Figure 1.Statistical analysisprocedure used in thevalidation of themeasurement instrument
N
Y
Do the constituentitems estimate only one
construct?
Do items (representingalternative measures),
measure the sameconstruct?
Are the assignment ofitems to constructs
proper?
Are all items assignedto constructs reliable?
Are all items assignedto constructs one
dimensional?
Y
Y
Y
N
N
N
N
N
N
Y
Are all items assignedto constructs unique (i.e., not identical)?
Test for multicollinearity Inter-item correlations (polychroic) should be <0.9 toavoid multicollinearity between items
Test for unidimensionality One-factor congeneric model(SEM)–if items load significantlyon a single factor, then the items are unidimensional
Test for reliability Reliability coefficients (maximal componsite) should be > 0.6 foritems tobe reliable measures ofconstructs
Item assignment testCorrelations (polyserial) between a construct and items assigned to it should be higher thancorrelations between a construct and items assigned to other constructs
Test for convergent construct validityOne-factor congeneric model (SEM) analysis should reveal thatall items have factor loadings thatsignificantly contribute to thefactors represented
Test for discriminant construct validity Intercorrelations betweenconstructs in pairwise SEManalysis shouldbe low
INSTRUMENT
How well do the itemsrelate to independent
measures of the concept?
Test for predictive validityCorrelations (polyserial) betweeninstrument items and ‘independent’ measures of theitems should be‘reasonably’ high
Y
Y
Modify and/ordelete items
BIJ13,4
502
involved the specification of one-factor congeneric measurement models (Joreskog,1971) for all the constructs. The results are shown in Table II. For most of theconstructs, the goodness-of-fit indices for the initial models (not shown in Table II)suggested poor data – model fits. This implied, inter alia, the items of these initialmodels were not unidimensional. For these offending models, modifications were madeto improve data – model fit. Two types of modifications were carried out: items thatwere not significantly loading on the construct were eliminated; and, wherever therewas logical and theoretical justification, error terms of items were allowed to covarywith error terms of other items. As can be seen from Table II, the levels of fit betweendata and modified models for most of the constructs were good. Analyses of the pathdiagrams of the final models showed that the factor loadings for the majority ofconstructs were significant. Overall, it was possible to assume that the majority ofconstructs in their final form consisted of items that were unidimensional.
Test for reliability. Once unidimensionality of the items is established, it is thennecessary to assess the reliability of the constructs (Flynn et al., 1990). The mostcommon method for measuring reliability of self-administered survey questionnairesinvolves estimating internal consistency. The assumption behind internal consistencyis that items are all slightly different measures of the same concept (Nunnally). Theinter-correlation between items would be high if they were indeed measuring the sameconcept. Cronbach’s coefficient a is commonly used as a measure of internalconsistency, but it has some flaws (Novick and Lewis, 1967; Cortina, 1993; Ahire et al.,1996). To overcome these flaws, maximal composite reliability coefficients developedby Werts et al. (1978) were calculated for all the constructs in this study that had threeor more items. Table III shows these coefficients. As can be seen, these coefficientsexceed the minimum threshold level of 0.6 (Hair et al., 1998) for all the constructs of theprize-criteria and elemental approaches, and six out of eight constructs of thestandards-based approach. The two constructs of the standards-based approach thatwere below the threshold (customers and suppliers) were only marginally outside thelimit. Overall, the items assigned to the constructs were generally reliable measures ofthe constructs.
Test for “proper” assignment of items to constructs. The next step in the validationprocess involves evaluating whether the items have been “properly” assigned toconstructs. An item-construct correlation matrix can be used to assess this (Grandzoland Gershon, 1998). Since, the items were measured on ordinal scale and the weightedmean scores for the constructs were continuous, polyserial correlation is most suitablemeasure of the relationships between the variables (Joreskorg, 1993). The resultsshowed that overwhelmingly, the correlation coefficients for items that were assignedto constructs were higher than that of items not assigned to the constructs. Thissuggested that all items were “properly” assigned to their respective constructs.
Test for construct validity. Assessing construct validity involves two issues: do theitems truly measure what they are supposed to measure, and, do they measure nothingelse? This requires assessing convergent and discriminant validities (Pannirselvamet al., 1998). Convergent validity refers to the extent to which varying approaches to themeasurement of the constructs yield the same results (Ahire et al., 1996). In the case ofself-administered questionnaire survey, each item is treated as a different approach tomeasuring the same construct. The Tucker Lewis Index (TLI) values obtained as partof the structural equation modeling analysis were used to assess the convergent
Qualitymanagement
503

Mea
sure
sof
fit
Ab
solu
teF
itIn
dic
esIn
crem
enta
lfi
tin
dic
esM
odel
par
sim
ony
ind
ex
Con
stru
ctQ
Map
pro
ach
Ch
i-sq
uar
e(x
2,
df,
p-v
alu
e)1
Goo
dn
ess-
of-fi
t(G
FI)
2
Ad
just
edg
ood
nes
s-of
-fit
(AG
FI)
3
Roo
tm
ean
-sq
uar
ere
sid
ual
(RM
R)4
Roo
tm
ean
squ
are
erro
rof
app
rox
imat
ion
(RM
SE
A)5
Tu
cker
-Lew
isin
dex
(TL
I)6
Com
par
ativ
efi
tin
dex
(CF
I)7
Nor
med
Ch
i-sq
uar
e(x
2/
df)
8
Ak
aik
ein
form
atio
ncr
iter
ia(A
IC)9
Cov
aria
nce
sof
erro
rte
rms
allo
wed
inth
efi
nal
one-
fact
orco
ng
ener
icm
odel
rep
rese
nti
ng
each
con
stru
ct
Top
man
agem
ent
lead
ersh
ip
Sta
nd
ard
s-b
ased
3.87
4,2,
0.14
40.
992
0.95
80.
017
0.04
80.
914
0.97
11.
937
19.8
74N
oco
var
ian
ces
nee
ded
Pri
ze-c
rite
ria
71.5
62,
39,
0.00
10.
942
0.90
20.
060
0.04
50.
770
0.83
71.
835
125.
562
T5-
T6,
T7-
T8,
T7-
T9,
T9-
T11
,T
11-T
12E
lem
enta
l46
.905
,18,
0.00
00.
960.
920.
046
0.06
20.
775
0.85
52.
606
82.9
05T
14-T
15,
T20
-T21
Cu
stom
ers
Sta
nd
ard
s-b
ased
––
––
––
––
––
Pri
ze-c
rite
ria
41.4
,23
,0.
011
0.95
90.
920.
039
0.04
40.
887
0.92
11.
885
.404
C4-
C5,
C4-
C8,
C6-
C9,
C7-
C11
Ele
men
tal
14.2
99,5
,0.
014
0.98
10.
942
0.02
90.
067
0.82
40.
912
2.86
34.2
99N
oco
var
ian
ces
nee
ded
Em
plo
yee
sS
tan
dar
ds-
bas
ed2.
574,
2,0.
276
0.99
50.
973
0.01
50.
026
0.98
10.
994
1.28
718
.574
No
cov
aria
nce
sn
eed
edP
rize
-cri
teri
a93
.6,
50,
0.00
00.
927
0.88
70.
051
0.04
60.
740.
803
1.87
114
9.56
5E
5-E
9,E
6-E
8,E
10-E
11,
E12
-E13
Ele
men
tal
21.0
97,
13,
0.07
10.
976
0.94
80.
031
0.03
90.
914
0.94
71.
623
51.0
97E
4-E
18S
up
pli
ers
Sta
nd
ard
s-b
ased
––
––
––
––
––
Pri
ze-c
rite
ria
26.8
36,7
,0.
000
0.96
40.
892
0.04
20.
082
0.67
10.
847
3.83
454
.836
S5-
S6,
S7-
S8
Ele
men
tal
5.14
1,2,
0.07
60.
991
0.95
60.
022
0.06
10.
855
0.95
22.
571
21.1
41N
oco
var
ian
ces
nee
ded
(con
tinued
)
Table II.One-factor congenericconfirmatorymeasurement models forconstructs of qualitymanagement
BIJ13,4
504
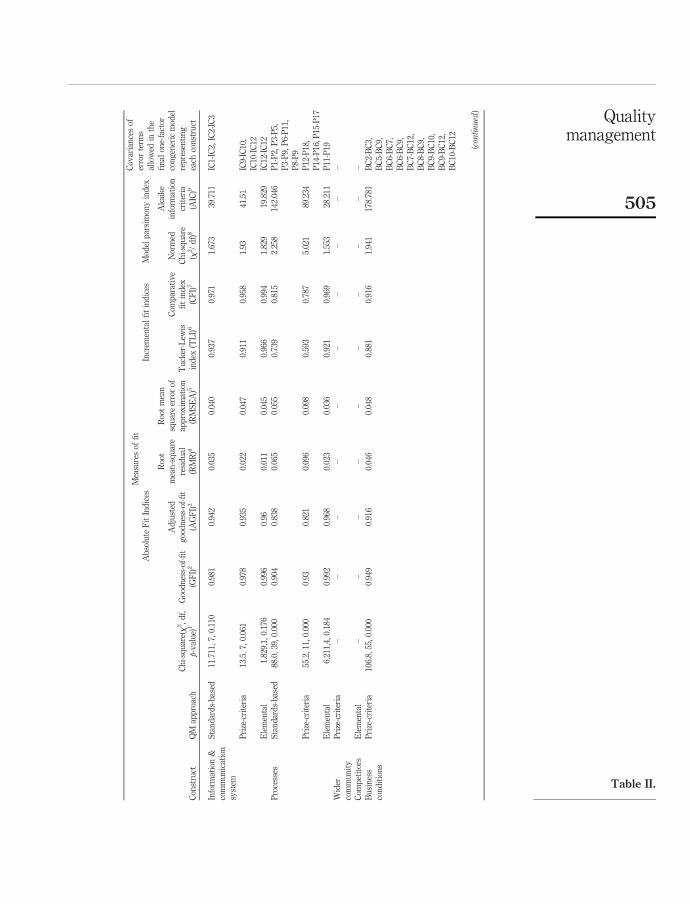
Mea
sure
sof
fit
Ab
solu
teF
itIn
dic
esIn
crem
enta
lfi
tin
dic
esM
odel
par
sim
ony
ind
ex
Con
stru
ctQ
Map
pro
ach
Ch
i-sq
uar
e(x
2,
df,
p-v
alu
e)1
Goo
dn
ess-
of-fi
t(G
FI)
2
Ad
just
edg
ood
nes
s-of
-fit
(AG
FI)
3
Roo
tm
ean
-sq
uar
ere
sid
ual
(RM
R)4
Roo
tm
ean
squ
are
erro
rof
app
rox
imat
ion
(RM
SE
A)5
Tu
cker
-Lew
isin
dex
(TL
I)6
Com
par
ativ
efi
tin
dex
(CF
I)7
Nor
med
Ch
i-sq
uar
e(x
2/
df)
8
Ak
aik
ein
form
atio
ncr
iter
ia(A
IC)9
Cov
aria
nce
sof
erro
rte
rms
allo
wed
inth
efi
nal
one-
fact
orco
ng
ener
icm
odel
rep
rese
nti
ng
each
con
stru
ct
Info
rmat
ion
&co
mm
un
icat
ion
syst
em
Sta
nd
ard
s-b
ased
11.7
11,
7,0.
110
0.98
10.
942
0.03
50.
040
0.93
70.
971
1.67
339
.711
IC1-
IC2,
IC2-
IC3
Pri
ze-c
rite
ria
13.5
.7,
0.06
10.
978
0.93
50.
022
0.04
70.
911
0.95
81.
9341
.51
IC9-
IC10
,IC
10-I
C12
Ele
men
tal
1.82
9,1,
0.17
60.
996
0.96
0.01
10.
045
0.96
60.
994
1.82
919
.829
IC12
-IC
12P
roce
sses
Sta
nd
ard
s-b
ased
88.0
,39
,0.
000
0.90
40.
838
0.06
50.
055
0.73
90.
815
2.25
814
2.04
6P
1-P
2,P
3-P
5,P
3-P
9,P
6-P
11,
P8-
P9
Pri
ze-c
rite
ria
55.2
,11
,0.
000
0.93
0.82
10.
096
0.09
80.
593
0.78
75.
021
89.2
34P
12-P
18,
P14
-P16
,P15
-P17
Ele
men
tal
6.21
1,4,
0.18
40.
992
0.96
80.
023
0.03
60.
921
0.96
91.
553
28.2
11P
11-P
19W
ider
com
mu
nit
yP
rize
-cri
teri
a–
––
––
––
––
–
Com
pet
itor
sE
lem
enta
l–
––
––
––
––
–B
usi
nes
sco
nd
itio
ns
Pri
ze-c
rite
ria
106.
8,55
,0.
000
0.94
90.
916
0.04
60.
048
0.88
10.
916
1.94
117
8.78
1B
C2-
BC
3,B
C5-
BC
9,B
C6-
BC
7,B
C6-
BC
9,B
C7-
BC
12,
BC
8-B
C9,
BC
9-B
C10
,B
C9-
BC
12,
BC
10-B
C12
(con
tinued
)
Table II.
Qualitymanagement
505

Mea
sure
sof
fit
Ab
solu
teF
itIn
dic
esIn
crem
enta
lfi
tin
dic
esM
odel
par
sim
ony
ind
ex
Con
stru
ctQ
Map
pro
ach
Ch
i-sq
uar
e(x
2,
df,
p-v
alu
e)1
Goo
dn
ess-
of-fi
t(G
FI)
2
Ad
just
edg
ood
nes
s-of
-fit
(AG
FI)
3
Roo
tm
ean
-sq
uar
ere
sid
ual
(RM
R)4
Roo
tm
ean
squ
are
erro
rof
app
rox
imat
ion
(RM
SE
A)5
Tu
cker
-Lew
isin
dex
(TL
I)6
Com
par
ativ
efi
tin
dex
(CF
I)7
Nor
med
Ch
i-sq
uar
e(x
2/
df)
8
Ak
aik
ein
form
atio
ncr
iter
ia(A
IC)9
Cov
aria
nce
sof
erro
rte
rms
allo
wed
inth
efi
nal
one-
fact
orco
ng
ener
icm
odel
rep
rese
nti
ng
each
con
stru
ct
Pro
du
ctq
ual
ity
Sta
nd
ard
s-b
ased
,P
rize
-cri
teri
a5.
319,
2,0.
070
0.99
00.
951
0.01
80.
063
0.89
70.
966
2.65
921
.319
No
cov
aria
nce
sn
eed
edC
ust
omer
sati
sfac
tion
Sta
nd
ard
s-b
ased
,P
rize
-cri
teri
a11
.331
,2,
0.00
30.
976
0.88
00.
037
0.10
60.
673
0.89
15.
666
27.3
31N
oco
var
ian
ces
nee
ded
Bu
sin
ess
per
form
ance
Pri
ze-c
rite
ria
69.5
,29
,0.
000
0.94
40.
893
0.07
40.
040.
783
0.86
2.39
512
1.46
9P
F1-
PF
8,P
F4-
PF
7,P
F5-
PF
6,P
F6-
PF
10,
PF
8-P
F9,
PF
8-P
F10
Com
mu
nit
yre
lati
ons
Pri
ze-c
rite
ria
––
––
––
––
––
Notes:
1C
hi-
squ
are
(x2,
df,
p-v
alu
e):p
-val
ue.
0.05
(goo
dfi
t);2
Goo
dn
ess-
of-fi
t(G
FI)
:0.9
5,
GF
I,
1.00
(goo
dfi
t);0
.90,
GF
I,
0.95
(acc
epta
ble
fit)
;3R
oot
mea
n-s
qu
are
resi
du
al(R
MR
):R
MR,
0.05
(goo
dfi
t);
4R
oot
mea
nsq
uar
eer
ror
ofap
pro
xim
atio
n(R
MS
EA
):R
MS
EA,
0.05
(goo
dfi
t);
0.05
,R
MS
EA,
0.08
(acc
epta
ble
fit)
;5A
dju
sted
goo
dn
ess-
of-fi
t(A
GF
I):
0.95
,A
GF
I,
1.00
(goo
dfi
t);
0.90
,A
GF
I,
0.95
(acc
epta
ble
fit)
;6T
uck
er-L
ewis
Ind
ex(T
LI)
:T
LI.
0.95
(goo
dfi
t);
0.90
,T
LI,
0.95
(acc
epta
ble
fit)
;7N
orm
edF
itIn
dex
(NF
I):
0.95
,N
FI,
1.00
(goo
dfi
t);0
.90,
NF
I,
0.95
(acc
epta
ble
fit)
;8N
orm
edC
hi-
squ
are
(x2/d
f):
1.0,
(x2/d
f),
2.0
(goo
dfi
t);
2.0,
(x2/
df),
3.0
(acc
epta
ble
fit)
;an
d9A
kai
ke
Info
rmat
ion
Cri
teri
a(A
IC):
Mod
elw
ith
smal
lest
AIC
ism
ost
par
sim
onio
us
Table II.
BIJ13,4
506

validity of all the constructs, as suggested by Ahire et al. (1996) Table II shows the TLIstatistics for the final models representing the constructs of QM. Seven out of the20 constructs had TLI values that indicated acceptable fits. A further four were close tothe threshold, with values between 0.824 and 0.9. Overall, the TLI values in Table IIindicated that a reasonable number of constructs had acceptable levels of convergentvalidity. In terms of discriminant validity, a construct exhibits this validity if itemsassigned to it estimate only one construct (Ahire et al., 1996). If an item of one constructreflects heavily on another construct, then the correlation between these constructswould be high (Ahire et al., 1996). Based on this logic, constructs were tested fordiscriminant validity using a chi-square difference test suggested by Ahire et al. (1996)Results for all pairs of constructs yielded chi-square differences to be statisticallysignificant at p-values of less than or equal to 0.01. Thus, all the constructs that couldbe tested were distinct constructs with good discriminant validity levels.
Test for predictive validity. Predictive validity assesses the extent to which items arerelated to their independent measures (Flynn et al., 1990). In this research, trulyindependent measures of the items were not available. As is the case with other similarstudies (Ahire et al., 1996; Saraph et al., 1989), managers’ assessments of performancewere used in place of truly independent items. Since, performance was measured as18 individual items with a Likert ordinal scale and the constructs of QM werecomposite constructs measured on continuous scale, polyserial correlation coefficientswere calculated. Results showed that all these coefficients were positive andstatistically significant at 0.01 levels. The correlation coefficients suggested supportfor predictive validity of the constructs.
Discussion and concluding remarksThis study has shown that most of the constructs of the three QM approaches havebeen well measured. The constructs as defined by their items generally have soundpsychometric properties, i.e. errors were within tolerable range and levels of reliabilityand validity were higher than conventionally acceptable in most cases.
Maximal composite reliability coefficientConstruct Standards-based Prize-criteria Elemental
Top management leadership 0.7585 0.8675 0.9056Customers 0.5574 0.8625 0.8194Employees 0.7918 0.9056 0.8745Suppliers 0.5921 0.8297 0.7286Information & communication systems 0.8659 0.9128 0.8853Processes 0.8538 0.8382 0.6293Wider community Not applicable 0.8578 Not applicableCompetitors Not applicable Not applicable 0.9665Business conditions Not applicable 0.9342 Not applicableProduct quality 0.7922 0.7922 Not applicableCustomer satisfaction 0.6450 0.6450 Not applicableBusiness performance Not applicable 0.8325 Not applicableCommunity relations Not applicable Not applicablea Not applicable
Note: aSingle item construct – not possible to calculate reliability coefficient
Table III.Results of reliability
analysis
Qualitymanagement
507

The methodology used to develop constructs for the standards-based andprize-criteria approach differed slightly from that used with the elemental approach.Since, the standards-based and prize-criteria approaches are reasonably wellestablished, the choice of constructs and items was rather constrained. In otherwords, items for these approaches were a priori specified. There was little freedom tochoose these items. On the other hand, for the elemental approach, the constructs andassociated items were chosen based on a broader view of QM literature. While slightlydifferent approaches were taken, the psychometric properties of the constructs of thethree approaches were similar.
The measurement instrument proposed in this paper has a number of features thatsuggest that it is an improvement over the existing ones, and that it more closelyreflects the status quo of the field. These include: recognizing that there are threedistinct approaches to QM that are currently being advocated; using a confirmatoryapproach to psychometric analysis; and relaxing many assumptions relating tostatistical analysis of data, thus enabling results to more accurately reflect the actualsituation. Each of these is discussed next.
Throughout the instrument development and validation process, a clear attemptwas made to ensure that the contemporary reality in terms of how it is practiced wasreflected, i.e. three separate approaches (standards-based, prize-criteria and elemental)are popular. None of the existing instruments seriously addresses this. The instrumentenables users to easily identify the constructs and associated items for each of theapproaches. In this way, users can tailor the instrument to their requirements. At thesame time, the instrument enables an integrated approach to QM. This is throughthe common labels used for many of the constructs, as well as, the common itemsshared between constructs across the three approaches.
In this paper, a purely confirmatory approach to instrument development andvalidation process was adapted. This was deemed appropriate because the instrumentis based on QM concepts (i.e. the three approaches) that have been practiced for a whileand are therefore reasonably well defined and understood. Also, the instrumentattempts to consolidate a number of existing instruments. Given the rather maturestate of the QM field, purely exploratory and inductive methods are no longerappropriate. The confirmatory approach will assist in knowledge consolidation in thearea.
In all the statistical analysis performed, particular care was taken with respect tothe assumptions made about the data type and the impact these have had on the outputand interpretation of statistical tests. Throughout this instrument, five-point Likertscale has been used. Some researchers (Flynn et al., 1990) assume that the Likert scaleis of metric interval data type and therefore use inferential parametric statistical tests.In this paper, we do not make this assumption. All statistical analyses reflect this. Forexample, where correlation coefficients were required, polychroic and polyserialcorrelation coefficients were calculated instead of the popular Pearson’s correlationcoefficients. In the structural equation modeling analyses, the asymptotic distributionfree parameter estimation algorithm was used. In reliability calculations, the maximalcomposite reliability values were calculated instead of Cronbach’s a coefficients.Assuming Likert scale to be of interval data type leads to underestimation ofcorrelation, reliability and goodness-of-fit structural equation modeling coefficients(Novick and Lewis, 1967; Joreskog, 1971). This, therefore, inflates type I error levels.
BIJ13,4
508
Treating the Likert scale as being of ordinal data type and calculating the moreappropriate above-mentioned correlation, reliability and structural equation modelingfit coefficients allows them to more closely estimate the actual values and thereforeminimize type I error level. This has improved the confidence in the results obtained.
Given that this measurement instrument has sound psychometric properties, it couldbe of interest to several parties. Practitioners, consultants and researchers could use it toconduct self-assessments, audits, and survey-type research in organizations. All partiescan be confident that the data they collect with this instrument are reliable and valid.
One of the major reasons for the lack of consistency in research in the QM area is theabsence of standard and universally accepted measurement instruments. For theproposed instrument in this paper to make a contribution in this respect, considerableadditional work remains. These include further validation of the instrument in alongitudinal sense over several time intervals, testing of the instrument in several othergeographical domains, using it in other industry settings and triangulating theinstrument with other research methods. All of these will generate greater consensuson its acceptance as a universally applicable QM measurement instrument.
In sum, the process that was used to develop the QM measurement instrumentprovides ample confidence that high quality data can be collected and that the threeQM approaches can be measured well. If used consistently, this should contribute toaccelerated empirical research in the area, leading to knowledge consolidation,increased levels of paradigm consensus and maturity of the QM field.
References
Ahire, S.L., Golhar, D.Y. and Waller, M.A. (1996), “Development and validation of TQMimplementation constructs”, Decision Sciences, Vol. 27 No. 1, pp. 23-56.
Amundson, S.D. (1998), “Relationships between theory-driven empirical research in operationsmanagement and other disciplines”, Journal of Operations Management, Vol. 16, pp. 341-59.
Black, S. and Porter, L. (1996), “Identification of the critical factors of TQM”, Decision Sciences,Vol. 27 No. 1, pp. 1-21.
Cortina, J.M. (1993), “What is coefficient alpha? An examination of theory and application”,Journal of Applied Psychology, Vol. 78 No. 1, pp. 98-104.
Filippini, R. (1997), “Operations management research: some reflections on evolution, models andempirical studies in OM”, International Journal of Operations & Production Management,Vol. 17 No. 7, pp. 655-70.
Flynn, B.B., Shroeder, R.G. and Sakakibara, S. (1994), “A framework for quality managementresearch and an associated measurement instrument”, Journal of Operations Management,Vol. 11, pp. 339-66.
Flynn, B., Sakakibara, S., Schroeder, R.G., Bates, K.A. and Flynn, E.J. (1990), “Empirical researchmethods in operations management”, Journal of Operations Management, Vol. 9 No. 2,pp. 250-84.
Forker, L., Mendez, D. and Hershauer, J. (1997), “Total quality management in the supply chain:what is its impact on performance?”, International Journal of Production Research, Vol. 35No. 6, pp. 1681-701.
Grandzol, J.R. and Gershon, M. (1998), “A survey instrument for standardizing TQM modelingresearch”, International Journal of Quality Science, Vol. 3 No. 1, pp. 80-105.
Hair, J.F. Jr, Anderson, R.E., Tatham, R.L. and Black, W.C. (1998), Multivariate Data Analysis,Prentice-Hall, Englewood Cliffs, NJ.
Qualitymanagement
509
ISO 9001 (2000), ISO 9001:2000 Quality Management Systems – Requirements, StandardsAustralia, Homebush.
Jamshidian, M. and Bentler, P.M. (1999), “ML estimation of mean and covariance structures withmissing data using complete data routines”, Journal of Educational & Behavioral Statistics,Vol. 24 No. 1, pp. 21-41.
Joreskorg, K. (1993), “Testing structural equation models”, in Bollen, K.A. and Long, J.S. (Eds),Testing Structural Equation Models, Sage, Newbury Park, CA, pp. 295-316.
Joreskog, K.G. (1971), “Statistical analysis of sets of congeneric tests”, Psychometrika, Vol. 36No. 2, pp. 109-33.
Joseph, I.N., Rajendran, C. and Kamalanabhan, T.J. (1999), “An instrument for measuring totalquality management implementation in manufacturing-based business units in India”,International Journal of Production Research, Vol. 37 No. 10, pp. 2201-15.
Malhotra, M.K. and Grover, V. (1998), “An assessment of survey research in POM: fromconstructs to theory”, International Journal of Operations & Production Management,Vol. 16, pp. 407-25.
Novick, M.R. and Lewis, C. (1967), “Coefficient alpha and the reliability of compositemeasurements”, Psychometrika, Vol. 32 No. 1, pp. 1-13.
Nunnally, J.C. (1978), Psychometric Theory, McGraw-Hill, New York, NY.
Pannirselvam, G.P., Siferd, S.P. and Ruch, W.A. (1998), “Validation of the Arizona governor’squality award criteria: a test of the baldrige criteria”, Journal of Operations Management,Vol. 16, pp. 529-50.
Quazi, H., Jemangin, J., Low, W.K. and Chin, L.K. (1998), “Critical factors in quality managementand guidelines for self-assessment: the case of Singapore”, Total Quality Management,Vol. 9 No. 1, pp. 35-55.
Saraph, J.V., Benson, P.G. and Schroeder, R.G. (1989), “An instrument for measuring the criticalfactors of quality management”, Decision Sciences, Vol. 20, pp. 810-29.
Shenkar, O. and Glinow, M.A. (1994), “Paradoxes of organizational theory and research: usingthe case of China to Illustrate national contingency”, Management Science, Vol. 40 No. 1,pp. 56-71.
Wacker, J.G. (1998), “A definition of theory: research guidelines for different theory-buildingresearch methods in operations management”, Journal of Operations Management, Vol. 16,pp. 361-85.
Werts, C.E., Rock, D.R., Linn, R.L. and Joreskog, K.G. (1978), “A general method of estimating thereliability of a composite”, Educational and Psychological Measurement, Vol. 38, pp. 933-8.
Zeitz, G., Johanneson, R. and Ritchie, J. (1997), “An employee survey measuring total qualitymanagement practices and culture”, Group & Organisational Management, Vol. 22 No. 4,pp. 414-44.
Further reading
Australian Quality Council (2001), Australian Business Excellence Awards, AQC.
Standards Australia (1999), Joint Accredited System – Australia and New Zealand (JAS-ANZ)Register, Standards Australia, Homebush.
AppendixItems assigned to constructs of the three approaches to QM (Table AI)
BIJ13,4
510

Con
stru
ctIt
ems
Std
-bas
edP
rize
-Cri
teri
aE
lem
e-n
tal
Ple
ase
circ
leth
edeg
ree
ofagr
eem
ent
that
mos
tcl
osel
yre
flec
tsth
eC
UR
RE
NT
situ
ati
onat
your
loca
lor
ganiz
ati
on
Str
ongl
yA
gree
Agr
eeN
eutr
al
Dis
agr
eeS
tron
gly
Dis
agr
eeN
otA
pplic
-abl
e
Top
man
agem
ent
lead
ersh
ip
T1:
QM
anag
eren
sure
sq
ual
ity
syst
emis
con
tin
ual
lyim
pro
ved
12
34
50
p
T2:
Qu
alit
ysy
stem
reg
ula
rly
rev
iew
edb
ym
anag
emen
t
12
34
50
p
T3:
Inte
rnal
qu
alit
yau
dit
sv
erif
yef
fect
iven
ess
ofq
ual
ity
syst
em
12
34
50
p
T4:
Sta
tist
ical
thin
kin
gre
flec
ted
inp
olic
ies/
pro
cess
es/r
epor
tin
gsy
stem
12
34
50
p
T5:
CE
Op
lay
sk
eyro
lein
crea
tin
gv
alu
es1
23
45
0p
T6:
Val
ues
con
ver
ted
into
pra
ctic
alp
olic
ies
and
pla
ns
12
34
50
p
T7:
Cu
stom
ers
con
trib
ute
tod
evel
opm
ent
ofv
alu
es1
23
45
0p
T8:
Su
pp
lier
sh
adin
pu
tin
dev
elop
ing
val
ues
12
34
50
p
T9:
Em
plo
yee
sco
ntr
ibu
teto
dev
elop
men
tof
val
ues
12
34
50
p
T10
:C
ult
ure
that
CE
Ois
crea
tin
gis
con
sist
ent
wit
hv
alu
es
12
34
50
p
T11
:E
mp
loy
ees
are
resp
onsi
ble
/ex
erci
sele
ader
ship
12
34
50
p
T12
:Em
plo
yee
sk
now
thei
rro
les
and
goa
ls1
23
45
0p
(con
tinued
)
Table AI.
Qualitymanagement
511
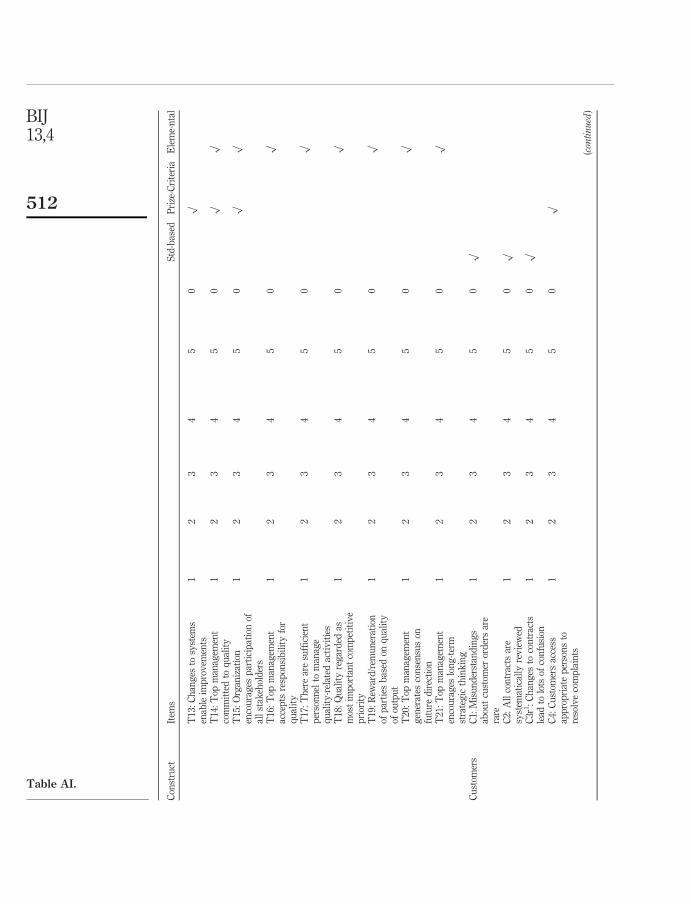
Con
stru
ctIt
ems
Std
-bas
edP
rize
-Cri
teri
aE
lem
e-n
tal
T13
:C
han
ges
tosy
stem
sen
able
imp
rov
emen
ts1
23
45
0p
T14
:T
opm
anag
emen
tco
mm
itte
dto
qu
alit
y1
23
45
0p
p
T15
:O
rgan
izat
ion
enco
ura
ges
par
tici
pat
ion
ofal
lst
akeh
old
ers
12
34
50
pp
T16
:T
opm
anag
emen
tac
cep
tsre
spon
sib
ilit
yfo
rq
ual
ity
12
34
50
p
T17
:T
her
ear
esu
ffici
ent
per
son
nel
tom
anag
eq
ual
ity
-rel
ated
acti
vit
ies
12
34
50
p
T18
:Q
ual
ity
reg
ard
edas
mos
tim
por
tan
tco
mp
etit
ive
pri
orit
y
12
34
50
p
T19
:R
ewar
d/r
emu
ner
atio
nof
par
ties
bas
edon
qu
alit
yof
outp
ut
12
34
50
p
T20
:T
opm
anag
emen
tg
ener
ates
con
sen
sus
onfu
ture
dir
ecti
on
12
34
50
p
T21
:T
opm
anag
emen
ten
cou
rag
eslo
ng
-ter
mst
rate
gic
thin
kin
g
12
34
50
p
Cu
stom
ers
C1:
Mis
un
der
stan
din
gs
abou
tcu
stom
eror
der
sar
era
re
12
34
50
p
C2:
All
con
trac
tsar
esy
stem
atic
ally
rev
iew
ed1
23
45
0p
C3r
1:
Ch
ang
esto
con
trac
tsle
adto
lots
ofco
nfu
sion
12
34
50
p
C4:
Cu
stom
ers
acce
ssap
pro
pri
ate
per
son
sto
reso
lve
com
pla
ints
12
34
50
p
(con
tinued
)
Table AI.
BIJ13,4
512

Con
stru
ctIt
ems
Std
-bas
edP
rize
-Cri
teri
aE
lem
e-n
tal
C5:
Th
ere
are
syst
emat
icp
roce
sses
for
han
dli
ng
com
pla
ints
12
34
50
p
C6:
Cu
stom
erfe
edb
ack
imp
rov
escu
stom
erre
lati
ons
etc
12
34
50
p
C7:
Cu
stom
ers
con
trib
ute
tod
evel
opm
ent
ofv
alu
es1
23
45
0p
C8:
Org
aniz
atio
nm
easu
res
cust
omer
sati
sfac
tion
12
34
50
p
C9:
Cu
stom
ers
are
enco
ura
ged
top
rov
ide
feed
bac
k
12
34
50
pp
C10
:O
rgan
izat
ion
isaw
are
ofcu
stom
erre
qu
irem
ents
12
34
50
pp
C11
:Cu
stom
ers
hel
pd
esig
nn
ewp
rod
uct
s/p
roce
sses
12
34
50
pp
C12
:P
roce
sses
/act
ivit
ies
incr
ease
cust
omer
sati
sfac
tion
12
34
50
pp
C13
:C
ust
omer
sati
sfac
tion
isa
mea
sure
ofq
ual
ity
12
34
50
p
Em
plo
yee
sE
1:E
ver
yon
eis
awar
eh
owq
ual
ity
pol
icy
affe
cts
his
job
12
34
50
p
E2:
Em
plo
yee
sar
ere
spon
sib
le/e
xer
cise
lead
ersh
ip
12
34
50
p
E3:
Em
plo
yee
sk
now
thei
rro
les
and
goa
ls1
23
45
0p
p
E4:
Em
plo
yee
sar
efu
lly
trai
ned
for
the
wor
kth
eyp
erfo
rm
12
34
50
pp
E5:
HR
pla
ns
inte
gra
ted
wit
hov
eral
lp
lan
s/v
alu
es1
23
45
0p
(con
tinued
)
Table AI.
Qualitymanagement
513

Con
stru
ctIt
ems
Std
-bas
edP
rize
-Cri
teri
aE
lem
e-n
tal
E6:
Ind
ivid
ual
emp
loy
eed
evel
opm
ent
and
mot
ivat
ion
pro
mot
ed
12
34
50
p
E7:
Em
plo
yee
sfi
nd
thei
rw
ork
ver
yfu
lfill
ing
12
34
50
p
E8:
Man
agin
gp
erfo
rman
ceof
emp
loy
ees
imp
rov
edfl
exib
ilit
y/
resp
onsi
ven
ess
12
34
50
p
E9:
Rec
ogn
itio
n/r
ewar
dp
roce
sses
ach
iev
eg
oals
12
34
50
p
E10
:E
mp
loy
ees
pro
vid
edw
ith
feed
bac
k1
23
45
0p
E11
:E
mp
loy
ees
awar
eof
chan
ges
top
erfo
rman
cem
easu
rem
ent
12
34
50
p
E12
:E
mp
loy
ees
free
lyco
mm
un
icat
ew
ith
oth
ers
12
34
50
p
E13
:C
omm
un
icat
ion
syst
emis
effe
ctiv
e1
23
45
0p
E14
:P
roce
sses
/str
uct
ure
sar
ein
pla
ceto
ach
iev
eO
H&
Sob
lig
atio
ns
12
34
50
p
E15
:O
rgan
izat
ion
has
“op
en”
cult
ure
12
34
50
pp
E16
:E
mp
loy
ees
wor
kin
team
s1
23
45
0p
p
E17
:E
mp
loy
ees
effe
ctch
ang
eto
ach
iev
eob
ject
ives
12
34
50
p
E18
:E
mp
loy
ees
hav
ero
lein
form
ula
tin
gp
lan
s1
23
45
0p
E19
:E
mp
loy
ees
con
tin
uou
sly
imp
rov
ew
ork
outp
ut
12
34
50
p (con
tinued
)
Table AI.
BIJ13,4
514

Con
stru
ctIt
ems
Std
-bas
edP
rize
-Cri
teri
aE
lem
e-n
tal
Su
pp
lier
sS
1:M
isu
nd
erst
and
ing
sab
out
ord
ers
pla
ced
wit
hsu
pp
lier
sar
era
re
12
34
50
p
S2:
All
sub
con
trac
tors
suit
edto
task
sth
eyp
erfo
rm1
23
45
0p
S3:
Mat
eria
lsfr
omal
lcu
stom
ers/
sup
pli
ers
trea
ted
sam
e
12
34
50
p
S4:
Qu
alit
yof
sup
pli
edp
rod
uct
s/se
rvic
esar
eas
sess
ed
12
34
50
p
S5:
Su
pp
lier
sre
ceiv
ein
form
atio
nto
imp
rov
eq
ual
ity
/res
pon
siv
enes
s
12
34
50
p
S6:
Gai
ns
from
coop
erat
ion
wit
hsu
pp
lier
ssh
ared
wit
hth
em
12
34
50
p
S7:
Qu
alit
yis
the
mai
ncr
iter
ion
for
choo
sin
gsu
pp
lier
s
12
34
50
pp
S8:
Org
aniz
atio
nse
eks
assu
ran
ceof
qu
alit
yfr
omsu
pp
lier
s
12
34
50
pp
S9:
Lon
g-t
erm
stab
lere
lati
onsh
ips
wit
hsu
pp
lier
sis
sou
gh
t
12
34
50
pp
S10
:S
up
pli
ers
inv
olv
edin
dev
elop
men
tof
new
pro
du
cts
12
34
50
p
Info
rmat
ion
and
com
mu
nic
at-i
onsy
stem
IC1:
Qu
alit
ym
anu
alco
ver
all
req
uir
emen
tsfo
rq
ual
ity
12
34
50
p
IC2:
Ob
sole
ted
ocu
men
tsd
on
otca
use
con
fusi
onw
ith
new
ver
sion
s
12
34
50
p
IC3:
Pos
sib
leto
esta
bli
shd
etai
lsof
fin
ish
edp
rod
uct
s1
23
45
0p
(con
tinued
)
Table AI.
Qualitymanagement
515
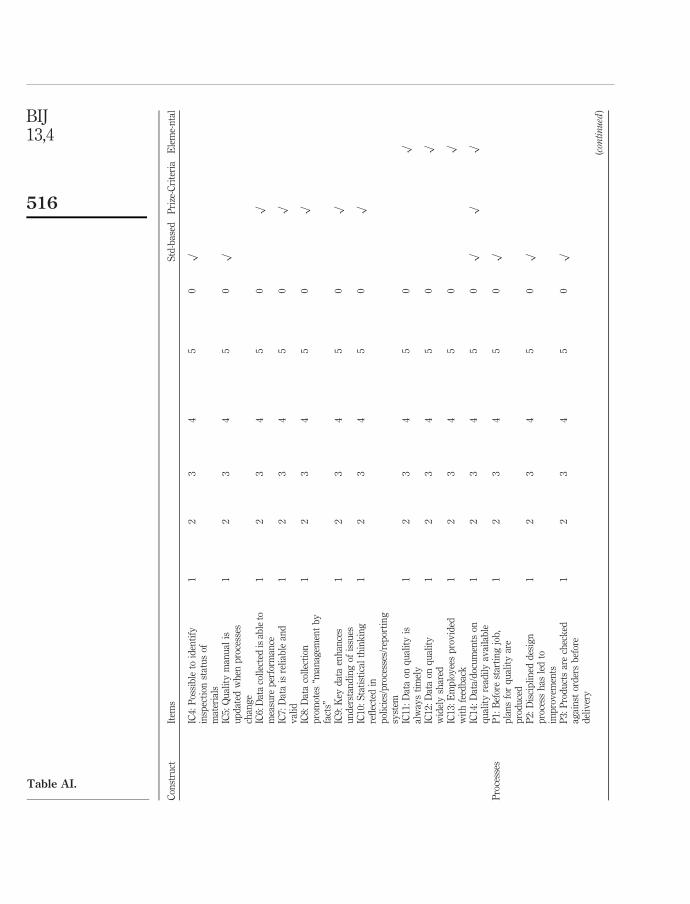
Con
stru
ctIt
ems
Std
-bas
edP
rize
-Cri
teri
aE
lem
e-n
tal
IC4:
Pos
sib
leto
iden
tify
insp
ecti
onst
atu
sof
mat
eria
ls
12
34
50
p
IC5:
Qu
alit
ym
anu
alis
up
dat
edw
hen
pro
cess
esch
ang
e
12
34
50
p
IC6:
Dat
aco
llec
ted
isab
leto
mea
sure
per
form
ance
12
34
50
p
IC7:
Dat
ais
reli
able
and
val
id1
23
45
0p
IC8:
Dat
aco
llec
tion
pro
mot
es“m
anag
emen
tb
yfa
cts”
12
34
50
p
IC9:
Key
dat
aen
han
ces
un
der
stan
din
gof
issu
es1
23
45
0p
IC10
:S
tati
stic
alth
ink
ing
refl
ecte
din
pol
icie
s/p
roce
sses
/rep
orti
ng
syst
em
12
34
50
p
IC11
:D
ata
onq
ual
ity
isal
way
sti
mel
y1
23
45
0p
IC12
:D
ata
onq
ual
ity
wid
ely
shar
ed1
23
45
0p
IC13
:E
mp
loy
ees
pro
vid
edw
ith
feed
bac
k1
23
45
0p
IC14
:D
ata/
doc
um
ents
onq
ual
ity
read
ily
avai
lab
le1
23
45
0p
pp
Pro
cess
esP
1:B
efor
est
arti
ng
job
,p
lan
sfo
rq
ual
ity
are
pro
du
ced
12
34
50
p
P2:
Dis
cip
lin
edd
esig
np
roce
ssh
asle
dto
imp
rov
emen
ts
12
34
50
p
P3:
Pro
du
cts
are
chec
ked
agai
nst
ord
ers
bef
ore
del
iver
y
12
34
50
p
(con
tinued
)
Table AI.
BIJ13,4
516

Con
stru
ctIt
ems
Std
-bas
edP
rize
-Cri
teri
aE
lem
e-n
tal
P4:
Pro
du
cts
that
can
not
be
test
edar
eco
nti
nu
ousl
ym
onit
ored
12
34
50
p
P5:
Eq
uip
men
tto
test
/in
spec
tis
avai
lab
le1
23
45
0p
P6:
Ev
ery
one
isaw
are
ofw
hat
hap
pen
sto
pro
du
cts
that
fail
insp
ecti
ons
12
34
50
p
P7:
Rev
iew
sof
all
asp
ects
are
carr
ied
out
12
34
50
p
P8:
Ifre
vie
ws
ind
icat
ep
rob
lem
s,ac
tion
sar
eta
ken
12
34
50
p
P9:
Ifp
rob
lem
soc
cur,
acti
ons
are
tak
en1
23
45
0p
P10
:H
and
lin
g/s
tora
ge/
del
iver
ym
eth
ods
min
imiz
eq
ual
ity
pro
ble
ms
12
34
50
p
P11
:Pro
du
cts/
pro
cess
esar
ein
spec
ted
/tes
ted
12
34
50
pp
P12
:In
nov
ativ
ep
roce
sses
/pro
du
cts/
serv
ices
hav
eb
een
com
mer
cial
ized
12
34
50
p
P13
:R
&D
dev
elop
wor
ld-c
lass
tech
niq
ues
/tec
hn
olog
ies
12
34
50
p
P14
:O
rgan
izat
ion
sup
por
tscu
ltu
reof
crea
tiv
ity
and
inn
ovat
ion
12
34
50
p
P15
:T
her
eis
stro
ng
emp
has
ison
inte
rnal
cust
omer
/su
pp
lier
rela
tion
ship
s
12
34
50
p
P16
:E
mp
loy
ees
con
tin
uou
sly
imp
rov
ew
ork
outp
ut
12
34
50
p
(con
tinued
)
Table AI.
Qualitymanagement
517

Con
stru
ctIt
ems
Std
-bas
edP
rize
-Cri
teri
aE
lem
e-n
tal
P17
:Q
Ap
roce
sses
ensu
recu
stom
erre
qu
irem
ents
are
met
12
34
50
p
P18
:S
tron
gem
ph
asis
isg
iven
onq
ual
ity
ind
esig
n1
23
45
0p
p
P19
:S
PC
tech
niq
ues
are
use
d1
23
45
0p
P20
:P
hy
sica
lw
ork
env
iron
men
tis
safe
for
emp
loy
ees
12
34
50
p
P21
:E
mp
loy
ees
hav
e“z
ero-
def
ects
”m
enta
lity
12
34
50
p
Wid
erco
mm
un
ity
W1:
Org
aniz
atio
nin
clu
ded
com
mu
nit
yre
spon
sib
ilit
ies
into
pol
icie
s
12
34
50
p
W2:
Org
aniz
atio
nd
evel
oped
pla
ns
tom
anag
eri
sks
toco
mm
un
ity
12
34
50
p
W3:
Ex
per
ien
ceg
ain
edth
rou
gh
bes
tp
ract
ice
shar
edw
ith
com
mu
nit
y
12
34
50
p
Com
pet
itor
sC
P1:
Org
aniz
atio
nb
ench
mar
ks
itse
lf1
23
45
0p
CP
2:T
her
eis
kee
nco
mp
etit
ion
inlo
cal
and
fore
ign
mar
ket
s
12
34
50
p
CP
3:A
few
larg
eco
mp
etit
ors
dom
inat
eth
ein
du
stry
12
34
50
p (con
tinued
)
Table AI.
BIJ13,4
518

Con
stru
ctIt
ems
Std
-bas
edP
rize
-Cri
teri
aE
lem
e-n
tal
Ple
ase
circ
lehow
the
loca
lor
ganiz
ati
onis
CU
RR
EN
TL
Ybe
ing
aff
ecte
dby
the
follo
win
gbu
sines
sen
viro
nm
enta
lfa
ctor
s:
Ver
yP
osit
ivel
yP
osit
ivel
yN
eutr
al
Neg
ati
vely
Ver
yN
egati
vely
Not
App
lic-a
ble
Bu
sin
ess
con
dit
ion
sB
C1:
Th
eco
sts
ofb
usi
nes
sin
pu
ts(e
.g.
lab
or,
mat
eria
l,ov
erh
ead
s)
12
34
50
p
BC
2:T
he
avai
lab
ilit
yof
suit
ably
qu
alifi
edst
aff
12
34
50
p
BC
3:T
he
ind
ust
rial
rela
tion
sen
vir
onm
ent
12
34
50
p
BC
4:C
omp
etit
ion
inlo
cal
and
fore
ign
mar
ket
s1
23
45
0p
BC
5:T
he
mar
gin
sin
the
ind
ust
ry1
23
45
0p
BC
6:T
he
com
pet
itiv
est
ruct
ure
ofth
ein
du
stry
12
34
50
p
BC
7:C
ust
omer
s’lo
yal
ty1
23
45
0p
BC
8:T
he
rule
san
dre
gu
lati
ons
that
gov
ern
the
ind
ust
ry
12
34
50
p
BC
9:E
colo
gic
alco
nsi
der
atio
ns
inth
isin
du
stry
12
34
50
p
BC
10:
Th
era
teof
intr
odu
ctio
nof
new
pro
du
cts
and
serv
ices
12
34
50
p
BC
11:
Th
era
teof
inn
ovat
ion
ofn
ewop
erat
ion
alp
roce
sses
12
34
50
p
(con
tinued
)
Table AI.
Qualitymanagement
519

Con
stru
ctIt
ems
Std
-bas
edP
rize
-Cri
teri
aE
lem
e-n
tal
BC
12:T
he
rate
ofch
ang
ein
tast
ean
dp
refe
ren
ces
ofcu
stom
ers
12
34
50
p
Ple
ase
circ
leth
edeg
ree
ofsa
tisf
act
ion
ofth
eor
ganiz
ati
onth
at
mos
tcl
osel
yre
flec
tsth
eC
UR
RE
NT
situ
ati
onat
the
loca
lor
ganiz
ati
on:
Ver
yS
ati
s-fa
ctor
yS
ati
s-fa
ctor
yN
eutr
al
Dis
sati
s-fa
ctor
yV
ery
Dis
sati
s-fa
ctor
yN
otA
pplic
-abl
e
Pro
du
ctq
ual
ity
PQ
1:C
osts
rela
tin
gto
qu
alit
yof
pro
du
cts
12
34
50
pp
PQ
2:D
efec
tiv
ep
rod
uct
sra
te1
23
45
0p
p
PQ
3:P
erce
ived
pro
du
ctq
ual
ity
by
cust
omer
s1
23
45
0p
p
PQ
4:W
asta
ge
12
34
50
pp
Cu
stom
ersa
tisf
acti
onC
S1:
Per
ceiv
edp
rod
uct
qu
alit
yb
ycu
stom
ers
12
34
50
pp
CS
2:C
onsi
sten
cyin
doc
um
enta
tion
12
34
50
pp
CS
3:C
ust
omer
serv
ice
12
34
50
pp
CS
4:Q
ual
ity
aud
its
by
cust
omer
s1
23
45
0p
p
Bu
sin
ess
per
form
ance
PF
1:In
ven
tory
lev
els
12
34
50
p
PF
2:P
rofi
ts1
23
45
0p
PF
3:C
ash
flow
12
34
50
p
PF
4:D
eman
dfo
rp
rod
uct
sm
ade
atth
ere
gis
tere
dsi
te1
23
45
0p
PF
5:D
own
tim
e1
23
45
0p
(con
tinued
)
Table AI.
BIJ13,4
520

Con
stru
ctIt
ems
Std
-bas
edP
rize
-Cri
teri
aE
lem
e-n
tal
PF
6:C
apac
ity
uti
liza
tion
rate
s1
23
45
0p
PF
7:M
ark
etsh
are
12
34
50
p
PF
8:E
mp
loy
eeco
mp
lain
ts1
23
45
0p
PF
9:E
mp
loy
eem
oral
e1
23
45
0p
PF
10:
Rel
atio
ns
wit
hsu
pp
lier
san
dsu
bco
ntr
acto
rs
12
34
50
p
Com
mu
nit
yre
lati
ons
CR
1:In
vol
vem
ent
ofth
eor
gan
izat
ion
inco
mm
un
ity
acti
vit
ies
12
34
50
p
Noet:
1T
his
item
was
stat
edn
egat
ivel
yan
dre
qu
ired
rev
erse
cod
ing
Table AI.
Qualitymanagement
521

About the authorsPrakash J. Singh is a lecturer at the Department of Management at the University of Melbourne,Australia. His research interests are in operations management, quality management, projectmanagement, supply chain management and innovation management. Dr Singh has publishedhis research in several journal articles and presented papers at a number of internationalconferences. He is the author of a new book entitled “What really works in QM: a comparison ofapproaches”. Dr Singh holds a PhD from the University of Melbourne. He also holds Bachelor ofEngineering (first class honours) and Bachelor of Business (Distinction) degrees fromQueensland University of Technology. He is the corresponding author and can be contacted at:[email protected]
Alan Smith is deputy head of the Department of Mechanical and Manufacturing Engineeringat the University of Melbourne, Australia. For about fifteen years, Dr Smith has taughtundergraduate and industry courses and carried out research in various aspects of engineeringmanagement including quality management and quality standards, operations management,performance measurement and inventory management. He has presented at several internationalconferences and been an invited lecturer on his quality research findings in Hong Kong.Dr Smith’s particular interests are in supporting the manufacturing industry through advancedstudies.
BIJ13,4
522
To purchase reprints of this article please e-mail: [email protected] visit our web site for further details: www.emeraldinsight.com/reprints
Aworldwide analysis of ISO 9000standard diffusion
Considerations and future development
F. Franceschini, M. Galetto and P. CecconiDISPEA, Politecnico di Torino, Torino, Italy
Abstract
Purpose – To provide a cross-section of International Standardization Organization (ISO) 9000quality certification diffusion over time and its impact on industrial systems.
Design/methodology/approach – The starting point of the analysis is “The ISO survey of ISO 9000and ISO 14001 certificates” document. Available data concur to trace a synthesis of what hashappened and what is in process all over the world. Five main aspects are discussed: thecorrespondence between ISO 9000 standards and total quality management strategy; the effects ofISO 9000 certification on business performance; the ISO 9000 certificates diffusion in the world; thecomparison between economical and entrepreneurial structure of different countries and certificatesdiffusion; the proposal of a prediction model for the diffusion of ISO 9000 certificates.
Findings – The evolution curve of the number of certificates over time in each country presents a“saturation effect.” This behavior has been analyzed by a diffusion forecasting model. The analysis ofregional share certificates evolution evidences a sensible increase of Far East countries. The analysisof ISO 9000 certificates’ share by industrial sector highlights a growth for the most sectors; only a fewof them show a negative trend in last two years. A relationship between ISO 9000 certificates andsocio-economic indicators of a country (human development index, gross national product) has beenindividuated.
Practical implications – The stunning growth of ISO 9000 certifications all over the worldconfirms a strong polarization of enterprises’ interest in this practice. Looking at the empirical data,some questions come out about the future. Will the certification market go on? Will certifiedenterprises continue to be interested to the certification process?
Originality/value – This paper analyzes the worldwide evolution of ISO 9000 certification andsuggests a new prediction model for the diffusion of ISO 9000 certificates.
Keywords ISO 9000 series, Quality standards, Quality systems, Quality management
Paper type Research paper
1. IntroductionSince, the early eighties, a proliferation of ideas for enterprises’ management accordingto Quality principles has been taking place. Quality assurance models (MilitaryStandards Mil, 9859A:1963, 1963; ISO, 9000’s:1987, 1987), first, and total qualitymanagement (TQM), lean organization and benchmarking models, afterwards, haveconstituted a basis for involving and integrating all the factory competencies whichcan contribute to the competitiveness enhancement.
In such a context, International Standardization Organization (ISO) 9000certification has acted as a catalyst of the existing tendencies, in order to induceorganizations towards a structural model based on the logic of strategic qualitymanagement (ISO 9000-1:1994, 1994; ISO 9001:1994, 1994; ISO 9002:1994, 1994;ISO 9003:1994, 1994).
The current issue and full text archive of this journal is available at
www.emeraldinsight.com/1463-5771.htm
Analysis of ISO9000 standard
diffusion
523
Benchmarking: An InternationalJournal
Vol. 13 No. 4, 2006pp. 523-541
q Emerald Group Publishing Limited1463-5771
DOI 10.1108/14635770610676326

The first attempt to draw a series of guidelines for applying quality principles inindustrial sectors dates back to fifties in USA, initially in the military sector, subsequentlyin the nuclear, pharmaceutical and automotive ones. Originally this was done in order toensure that products matched technical requirements defined by contracts. Later, theserules have been adopted by British Standard Institution, which broadened the applicationfield to the whole company system by the introduction of BS 5750 Standard.
As from the end of seventies, even though the most developed countries werepossessing their own internal standardization bodies, at least for specific sectoralapplications, the need of giving a unique and coherent international configuration tothe quality assurance standardization structure and to the related activities(certification, accreditation, laboratories, etc.) began to be even more impelling.
The International Standardization Organization (ISO), at first only interested in theregulation of measurement activities in the different industrial sectors, took its cuefrom these standards, and in 1987 published the first edition of ISO 9000 series. Thiswas fated to become in a few years the leading reference for Quality SystemOrganization all over the world.
The expectation was to facilitate the international commerce and improve thecompetitiveness of European and North-American companies in an ever more selectivemarket, characterized by a strong penetration of far-eastern products, by harmonizingterms, systems and methodologies. This could only be done by acquiring competitiveadvantage in terms of customer satisfaction and product reliability (Withers andEbrahimpour, 2000).
ISO 9000 family standards specify organization requirements for giving a “formalevidence” of the capability to organize resources and processes with respect toregulation, prescriptions and customer requirements. The aim is to ensurestakeholders’ satisfaction (Franceschini, 2002).
ISO 9000 standards represent a benchmark for company management in its whole.They are not focused on the intrinsic product/service quality, but on the relatedprocesses, enlarging their action to the entire network of interactions in which thefactory is acting. The extension of the application field originates from the awarenessthat quality is a strategic variable to be planned and managed through the wholenetwork of the value-chain (Romano and Vinelli, 2001).
Nowadays, quality certification is steering towards a new frontier which isrepresented by the “Vision 2000” project, aimed to the reorganization of the wholequality standard structure. The leading philosophy results from the need of aligningfactories’ growth opportunities towards market dynamics in order to redefine theirstrategies and their industrial/commercial targets.
The past approach of “conformity to requirements” which has largely conditionedthe application of 1994 and earlier editions, is now trimmed in order to promote areview of the organizational order, coherent with a “quality-oriented” model. Stillpreserving its bargaining power and connotation of commercial visibility media interms of credibility, the certification becomes a tool for integrating factorymanagement, performance and process verification according to a scheme of“continuous improvement” (ISO 9000:2000, 2000).
ISO 9000 standard series represents a special category of “horizontal” standards ofgeneral application, aimed to guarantee product quality through an adequatemanagement of resources and processes (quality system management). These
BIJ13,4
524
standards define the criteria for quality evaluation and the guidelines for theimplementation of related tools and methodologies (ISO 9000:2000, 2000; ISO 9001:2000,2000; ISO 9004:2000, 2000; ISO 19011:2002, 2002).
Up to the end of December 2002 more than 560,000 certificates had been issued in159 countries all over the world, still persisting a significant growing rate (about þ10percent on annual average over the end of December 2001) (ISO, 2003). On the otherhand, a drastic reduction of growth in the last year (Table I) is evident.
In the present paper, the ISO 9000 quality standard diffusion and its impact onindustrial system is analyzed. Particular attention is dedicated to future trends andevolution.
Five main aspects are discussed:
(1) the correspondence between ISO 9000 standards and TQM strategy;
(2) the effects of ISO 9000 certification on business performance;
(3) the ISO 9000 certificates diffusion in the world, with particular attention toactual trends, geographic share, and most involved industrial sectors;
(4) the comparison among economical and entrepreneurial structure of differentcountries and certificates diffusion; and
(5) the proposal of a prediction model for the diffusion of ISO 9000 certificates.
In the rest of the paper, case by case, it will be specified if the analysis refers to the newor the past standard edition.
2. ISO 9000 standards and TQMThe standard reassessment which led to the Vision 2000 project can be interpreted asan effect of a reorientation of factory management principles, induced by the increasingdiffusion of TQM philosophy (Laszo, 2000; Conti, 2000).
The similarity to TQM can be easily found in many aspects of the new standards.Basic concepts such as customer centrality and satisfaction, continuous improvement,employees’ valorization and involvement, process-organization-results integration,customers-suppliers-competitors connection, which represent the basis of TQM, havebeen assimilated and emphasized in the new ISO 9000 architecture.
Year World total World growth Number of countries/economies
December 2002 561,747 of which 9001:2000 167,210 51,131 159 of which 9001:2000 134December 2001 510,616of which 9001:2000 44,388 101,985 161of which 9001:2000 98December 2000 408,631 64,988 157December 1999 343,643 71,796 150December 1998 271,847 48,548 141December 1997 223,299 60,698 126December 1996 162,701 35,352 113December 1995 127,349 32,232 96March 1995 95,117 24,753 88June 1994 70,364 23,793 75Septemer 1993 46,571 18,755 60January 1993 27,816 48
Source: ISO (2003)
Table I.Worldwide total of ISO
9000 certificates since1993
Analysis of ISO9000 standard
diffusion
525

Referring to the efficacy of the two models, the scientific literature is disagreeing andthere is no common interpretation so far. Many empirical researches reveal in ISO 9000standard application a potentiality for valorization of TQM (Beattie and Sohal, 1999;Ismail and Hashimi, 1999; Lee and Palmer, 1999), some others interpret the ISO 9000implementation as the starting point for the construction of a factory model for TQM(Parr, 1999; Kanji, 1998). Recent researches characterize the ISO 9000 standards as atool for facilitating and implementing the adoption of TQM (Sun et al., 2004), but not asa necessary precondition (Sun, 1999; Brown and van Der Wiele, 1996) or as the signal ofa natural migration towards its implementation (Sun, 1999; Wiele et al., 1997). Theyonly give a set of general/generic guidelines, but they do not guarantee that the processis durable, capable and mature in the application of related constructs.
Although the 2000 series of ISO 9000 standards is closer to TQM principles,the cultural gap between the two models still remains large and not easily fillable(Laszo, 2000; Conti, 2000).
3. The effects of the ISO 9000 certification on business performanceCurrently, a common point of discussion concerns the effectiveness of ISO 9000certification on business performance. Many researches tried to find an empiricalevidence of the relationship between these two aspects.
A cross-sectional study undertaken on the Australian market showed that themotive for adopting ISO 9000 certification and the maturity of the quality culture aresignificant factors for determining the benefits derived from ISO 9000 certification(Terziovski et al., 2003). The style of the auditor, on the other hand, does not appear tohave a significant and positive effect on the benefits derived from ISO 9000certification. According to that, the natural conclusion is that certification contributesto business performance when the quality culture in the organization is well developedand the manager’s motivation to gain certification is to improve business performanceand not to conform to a standard.
Furthermore, many empirical evidences show that ISO 9000 certification is anecessary condition to support competitive and marketing objectives. Attention mustbe given in assuring that the company and its customers obtain the maximum benefitsby the integration of the certification process in the marketing program (Stevenson andBarnes, 2002).
To confirm the influence of ISO 9000 certification on marketing results, a recentstudy, performed on a set of Spanish companies, analyzed the stock market’s reactionto a publicly announced winner of a quality award (Nicolau and Sellers, 2002). Resultsshow that the stock market reacts positively to such a certification. Qualitycertification can be considered as a useful tool for reducing the information asymmetrybetween buyers and sellers, as well as a strategic element for the companies todistinguish themselves in the business competition (Nicolau and Sellers, 2002).
4. A cross-section of ISO 9000 certificates diffusion in the worldThe starting point of the analysis is “The ISO survey of ISO 9000 and ISO 14001certificates”document (ISO, 2001, 2002, 2003). Available data concur to trace a synthesis ofwhat has happened and what is in process all over the world. It must be highlighted thatthe surveys do not claim to be completely exhaustive and the reported data should beconsidered with care. In some cases undercounting has occurred, elsewhere accredited and
BIJ13,4
526
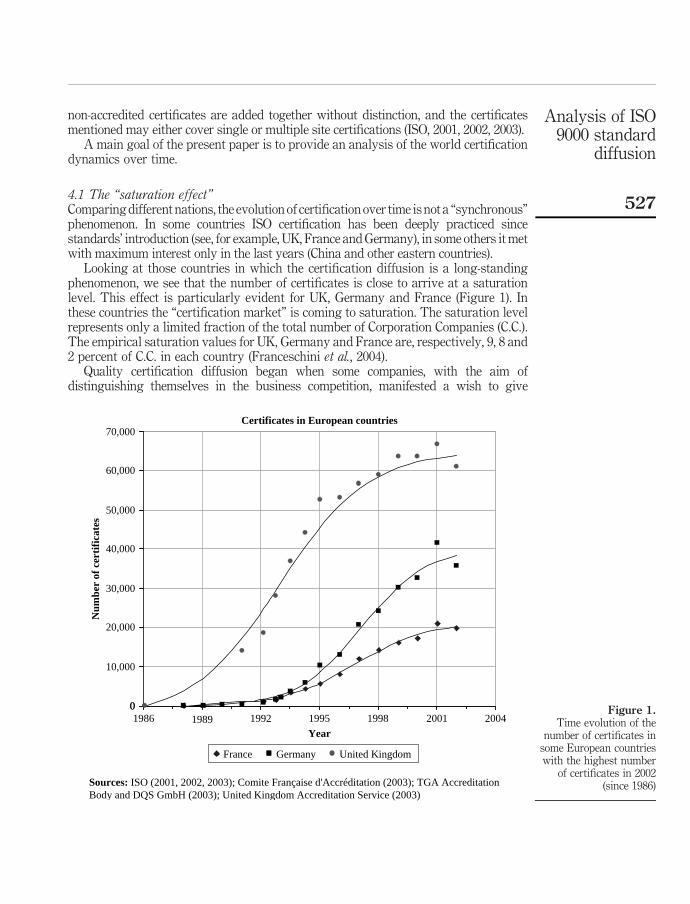
non-accredited certificates are added together without distinction, and the certificatesmentioned may either cover single or multiple site certifications (ISO, 2001, 2002, 2003).
A main goal of the present paper is to provide an analysis of the world certificationdynamics over time.
4.1 The “saturation effect”Comparing different nations, the evolution of certification over time is not a “synchronous”phenomenon. In some countries ISO certification has been deeply practiced sincestandards’ introduction (see, for example, UK, France and Germany), in some others it metwith maximum interest only in the last years (China and other eastern countries).
Looking at those countries in which the certification diffusion is a long-standingphenomenon, we see that the number of certificates is close to arrive at a saturationlevel. This effect is particularly evident for UK, Germany and France (Figure 1). Inthese countries the “certification market” is coming to saturation. The saturation levelrepresents only a limited fraction of the total number of Corporation Companies (C.C.).The empirical saturation values for UK, Germany and France are, respectively, 9, 8 and2 percent of C.C. in each country (Franceschini et al., 2004).
Quality certification diffusion began when some companies, with the aim ofdistinguishing themselves in the business competition, manifested a wish to give
Figure 1.Time evolution of the
number of certificates insome European countrieswith the highest number
of certificates in 2002(since 1986)
Certificates in European countries
0
10,000
20,000
30,000
40,000
50,000
60,000
70,000
France Germany United Kingdom
0
Year
Num
ber
of c
erti
fica
tes
1986 200420011998199519921989
Sources: ISO (2001, 2002, 2003); Comite Française d'Accréditation (2003); TGA Accreditation Body and DQS GmbH (2003); United Kingdom Accreditation Service (2003)
Analysis of ISO9000 standard
diffusion
527
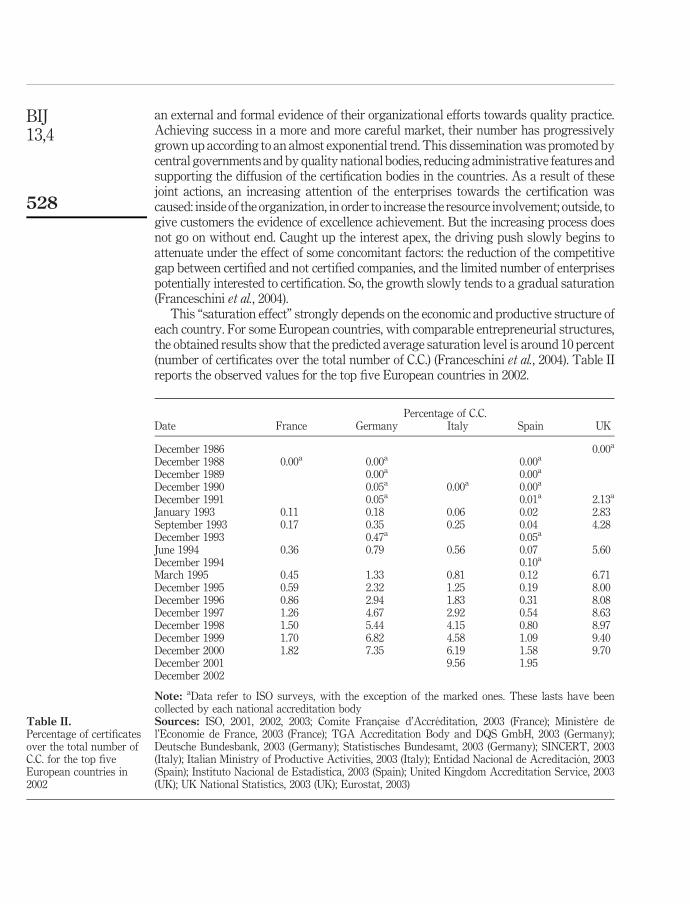
an external and formal evidence of their organizational efforts towards quality practice.Achieving success in a more and more careful market, their number has progressivelygrown up according to an almost exponential trend. This dissemination was promoted bycentral governments and by quality national bodies, reducing administrative features andsupporting the diffusion of the certification bodies in the countries. As a result of thesejoint actions, an increasing attention of the enterprises towards the certification wascaused: inside of the organization, in order to increase the resource involvement; outside, togive customers the evidence of excellence achievement. But the increasing process doesnot go on without end. Caught up the interest apex, the driving push slowly begins toattenuate under the effect of some concomitant factors: the reduction of the competitivegap between certified and not certified companies, and the limited number of enterprisespotentially interested to certification. So, the growth slowly tends to a gradual saturation(Franceschini et al., 2004).
This “saturation effect” strongly depends on the economic and productive structure ofeach country. For some European countries, with comparable entrepreneurial structures,the obtained results show that the predicted average saturation level is around 10 percent(number of certificates over the total number of C.C.) (Franceschini et al., 2004). Table IIreports the observed values for the top five European countries in 2002.
Percentage of C.C.Date France Germany Italy Spain UK
December 1986 0.00a
December 1988 0.00a 0.00a 0.00a
December 1989 0.00a 0.00a
December 1990 0.05a 0.00a 0.00a
December 1991 0.05a 0.01a 2.13a
January 1993 0.11 0.18 0.06 0.02 2.83September 1993 0.17 0.35 0.25 0.04 4.28December 1993 0.47a 0.05a
June 1994 0.36 0.79 0.56 0.07 5.60December 1994 0.10a
March 1995 0.45 1.33 0.81 0.12 6.71December 1995 0.59 2.32 1.25 0.19 8.00December 1996 0.86 2.94 1.83 0.31 8.08December 1997 1.26 4.67 2.92 0.54 8.63December 1998 1.50 5.44 4.15 0.80 8.97December 1999 1.70 6.82 4.58 1.09 9.40December 2000 1.82 7.35 6.19 1.58 9.70December 2001 9.56 1.95December 2002
Note: aData refer to ISO surveys, with the exception of the marked ones. These lasts have beencollected by each national accreditation bodySources: ISO, 2001, 2002, 2003; Comite Francaise d’Accreditation, 2003 (France); Ministere del’Economie de France, 2003 (France); TGA Accreditation Body and DQS GmbH, 2003 (Germany);Deutsche Bundesbank, 2003 (Germany); Statistisches Bundesamt, 2003 (Germany); SINCERT, 2003(Italy); Italian Ministry of Productive Activities, 2003 (Italy); Entidad Nacional de Acreditacion, 2003(Spain); Instituto Nacional de Estadıstica, 2003 (Spain); United Kingdom Accreditation Service, 2003(UK); UK National Statistics, 2003 (UK); Eurostat, 2003)
Table II.Percentage of certificatesover the total number ofC.C. for the top fiveEuropean countries in2002
BIJ13,4
528

The same “saturation effect” can be observed for many other non-European countries(see, for example, Australia, Republic of Korea, and USA in Figure 2).
4.2 ISO 9000:2000 certificates’ geographic distributionThe number of ISO 9000:2000 certificates is 29.77 percent of the overall total at the end of2002 (Figure 3). Considering that within the end of December 2003, the full transition to thenew standards is supposed to take place, this percentage does not represent anencouraging result for the Vision 2000 project. Even if considering that this delay can beascribed to some inertial effect towards change (typical in industrial/social environments),this percentage is too exiguous to give assurance of a complete transition.
Figure 2.Time evolution of the
number of certificates insome non-European
countries with the highestnumber of certificates in
2002 (since 1988)
0
5,000
10,000
15,000
20,000
25,000
30,000
35,000
40,000
Num
ber
of c
erti
fica
tes
Certificates in non-European countries
Australia Republic of Korea USAAustralia Republic of Korea USA
1988 20032000199719941991
Year
Sources: ISO (2001, 2002, 2003)
Figure 3.Portions of ISO 9000:2000
and ISO 9000:1994certificates at the end of
2002
ISO 9001,9002,9003:1994(394 537)
ISO 9000:2000(167 210)
Source: ISO (2003)
Analysis of ISO9000 standard
diffusion
529

A further investigation about the causes of this phenomenon is mandatory.Three points of view may be considered:
(1) organizations consider ISO certification as a flop, hence they decide to notrenew the process;
(2) organizations still consider ISO certification 1994 standard version an effectivemodel for industrial quality management, hence they do not require a transitiontowards the Vision 2000 model; and
(3) the transition follows an exponential growth (Figure 4). This behavior can beexplained by a “cascade effect” induced by the deadline approaching (December2003).
4.3 Emerging countriesAnalyzing the regional share of certificates in the lapse of time from January 1993 tillDecember 2002, two elements are particularly relevant: a continuous and systematicreduction of European countries’ percentage (compared to the overall number ofcertificates), and a parallel growth of Far East countries’ percentage (Table III andFigure 5). More details for European and Far East countries are shown in Figure 6.
This phenomenon can be justified by two main causes:
(1) the maturity of European “quality market” particularly evidenced by theachievement of the so-called “saturation level” in most countries in this area; and
(2) the appearing of “emerging countries” such as, for example, China (for its largesize) and Republic of Korea.
Figure 4.Growth of ISO 9000:2000certificates at the end of2001 and 2002 comparedto a hypotheticalexponential growth
0%
20%
40%
60%
80%
100%
YearSource: ISO (2003)
Per
cent
age
of I
SO 9
000:
2000
cer
tifi
cate
s
ISO 9000:2000 certificats growth
2001 2002 2003
8.69%
29.77%
100.00%
BIJ13,4
530
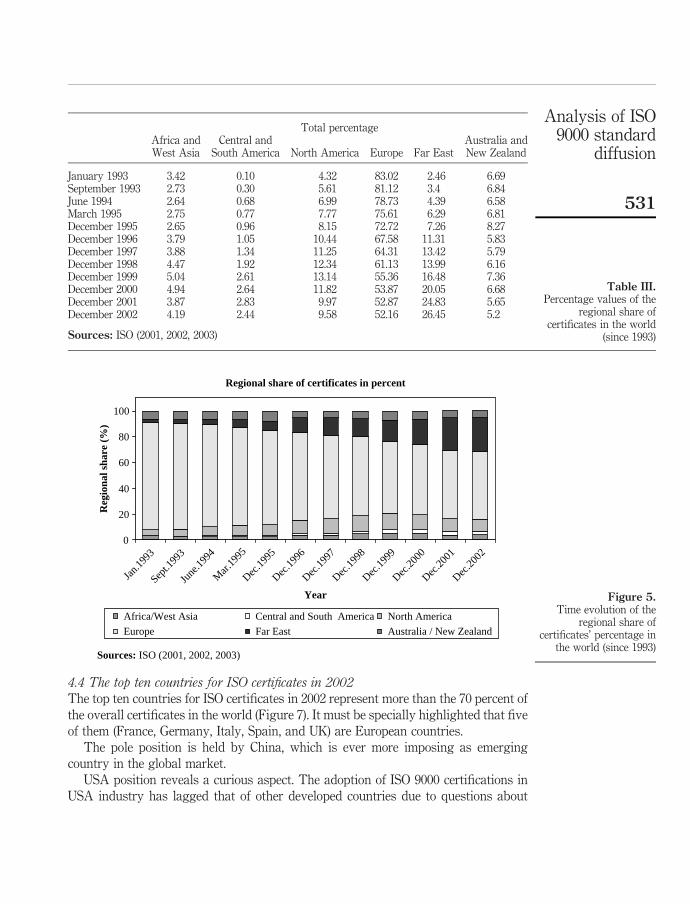
4.4 The top ten countries for ISO certificates in 2002
The top ten countries for ISO certificates in 2002 represent more than the 70 percent ofthe overall certificates in the world (Figure 7). It must be specially highlighted that fiveof them (France, Germany, Italy, Spain, and UK) are European countries.
The pole position is held by China, which is ever more imposing as emergingcountry in the global market.
USA position reveals a curious aspect. The adoption of ISO 9000 certifications inUSA industry has lagged that of other developed countries due to questions about
Figure 5.Time evolution of the
regional share ofcertificates’ percentage in
the world (since 1993)
Regional share of certificates in percent
0
20
40
60
80
100
Jan.1
993
Sept.1
993
June
.1994
Mar.
1995
Dec.19
95
Dec.19
96
Dec.19
97
Dec.19
98
Dec.19
99
Dec.20
00
Dec.20
01
Dec.20
02
Year
Reg
iona
l sha
re (
%)
Africa/West Asia
Sources: ISO (2001, 2002, 2003)
Central and South America North America
Europe Far East Australia / New Zealand
Total percentageAfrica andWest Asia
Central andSouth America North America Europe Far East
Australia andNew Zealand
January 1993 3.42 0.10 4.32 83.02 2.46 6.69September 1993 2.73 0.30 5.61 81.12 3.4 6.84June 1994 2.64 0.68 6.99 78.73 4.39 6.58March 1995 2.75 0.77 7.77 75.61 6.29 6.81December 1995 2.65 0.96 8.15 72.72 7.26 8.27December 1996 3.79 1.05 10.44 67.58 11.31 5.83December 1997 3.88 1.34 11.25 64.31 13.42 5.79December 1998 4.47 1.92 12.34 61.13 13.99 6.16December 1999 5.04 2.61 13.14 55.36 16.48 7.36December 2000 4.94 2.64 11.82 53.87 20.05 6.68December 2001 3.87 2.83 9.97 52.87 24.83 5.65December 2002 4.19 2.44 9.58 52.16 26.45 5.2
Sources: ISO (2001, 2002, 2003)
Table III.Percentage values of the
regional share ofcertificates in the world
(since 1993)
Analysis of ISO9000 standard
diffusion
531

whether the benefits of ISO 9000 registration were sufficient to offset costs and sheercomplexity (Stevenson and Barnes, 2002). This behavior was also supported by thenatural dynamism of USA market, which did not force companies in pursuing ISO9000 certification as distinguishing element in business competition.
Nine countries of the top ten in 2002 (China, Japan, Italy, Germany, UK, Spain,Australia, France, and USA) are also part of the top ten for ISO 9001:2000 (2000)certificates.
4.5 ISO 9000 certificates’ share by industrial sectorsCertificates subdivided by industrial sectors are reported in Table IV (ISO, 2003).
Figure 6.Time evolution of theregional share ofcertificates’ percentage inthe world. Detail forEuropean and Fare Eastcountries (since 1993)
Detail for European and Far East countries
0.00
10.00
20.00
30.00
40.00
50.00
60.00
70.00
80.00
90.00
Jan.1
993
Sept.1
993
June
.1994
Mar.
1995
Dec.19
95
Dec.19
96
Dec.19
97
Dec.19
98
Dec.19
99
Dec.20
00
Dec.20
01
Dec.20
02
Year
Sources: ISO (2001, 2002, 2003)
Reg
iona
l sha
re (
%)
Europe Far East
Figure 7.Share of certificatesreferring to top tencountries in 2002
China13%
Italy11%
Source: ISO (2003)
United Kingdom
11%
Usa7%
Germany6%
Japan6%
Spain5%
Australia5%
France4%
Korea3%
Others29%
BIJ13,4
532
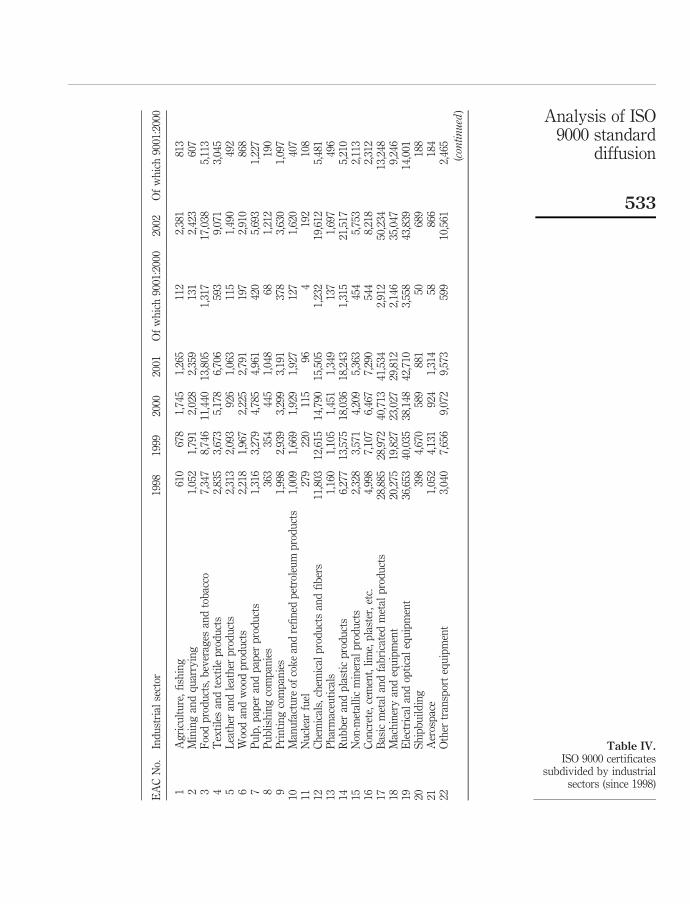
EA
CN
o.In
du
stri
alse
ctor
1998
1999
2000
2001
Of
wh
ich
9001
:200
020
02O
fw
hic
h90
01:2
000
1A
gri
cult
ure
,fi
shin
g61
067
81,
745
1,26
511
22,
381
813
2M
inin
gan
dq
uar
ryin
g1,
052
1,79
12,
028
2,35
913
12,
423
607
3F
ood
pro
du
cts,
bev
erag
esan
dto
bac
co7,
347
8,74
611
,440
13,8
051,
317
17,0
385,
113
4T
exti
les
and
tex
tile
pro
du
cts
2,83
53,
673
5,17
86,
706
593
9,07
13,
045
5L
eath
eran
dle
ath
erp
rod
uct
s2,
313
2,09
392
61,
063
115
1,49
049
26
Woo
dan
dw
ood
pro
du
cts
2,21
81,
967
2,22
52,
791
197
2,91
086
87
Pu
lp,
pap
eran
dp
aper
pro
du
cts
1,31
63,
279
4,78
54,
961
420
5,69
31,
227
8P
ub
lish
ing
com
pan
ies
363
354
445
1,04
868
1,21
219
09
Pri
nti
ng
com
pan
ies
1,99
82,
939
3,29
93,
191
378
3,63
01,
097
10M
anu
fact
ure
ofco
ke
and
refi
ned
pet
role
um
pro
du
cts
1,00
91,
669
1,92
91,
927
127
1,62
040
711
Nu
clea
rfu
el27
922
011
596
419
210
812
Ch
emic
als,
chem
ical
pro
du
cts
and
fib
ers
11,8
0312
,615
14,7
9015
,505
1,23
219
,612
5,48
113
Ph
arm
aceu
tica
ls1,
160
1,10
51,
451
1,34
913
71,
697
496
14R
ub
ber
and
pla
stic
pro
du
cts
6,27
713
,575
18,0
3618
,243
1,31
521
,517
5,21
015
Non
-met
alli
cm
iner
alp
rod
uct
s2,
328
3,57
14,
209
5,36
345
45,
753
2,11
316
Con
cret
e,ce
men
t,li
me,
pla
ster
,et
c.4,
998
7,10
76,
467
7,29
054
48,
218
2,31
217
Bas
icm
etal
and
fab
rica
ted
met
alp
rod
uct
s28
,885
28,9
7240
,713
41,5
342,
912
50,2
3413
,248
18M
ach
iner
yan
deq
uip
men
t20
,275
19,8
2723
,027
29,8
122,
146
35,0
479,
246
19E
lect
rica
lan
dop
tica
leq
uip
men
t36
,653
40,0
3538
,148
42,7
103,
558
43,8
3914
,001
20S
hip
bu
ild
ing
398
4,67
058
988
150
689
188
21A
eros
pac
e1,
052
4,13
192
41,
314
5886
618
422
Oth
ertr
ansp
ort
equ
ipm
ent
3,04
07,
656
9,07
29,
573
599
10,5
612,
465
(con
tinued
)
Table IV.ISO 9000 certificates
subdivided by industrialsectors (since 1998)
Analysis of ISO9000 standard
diffusion
533
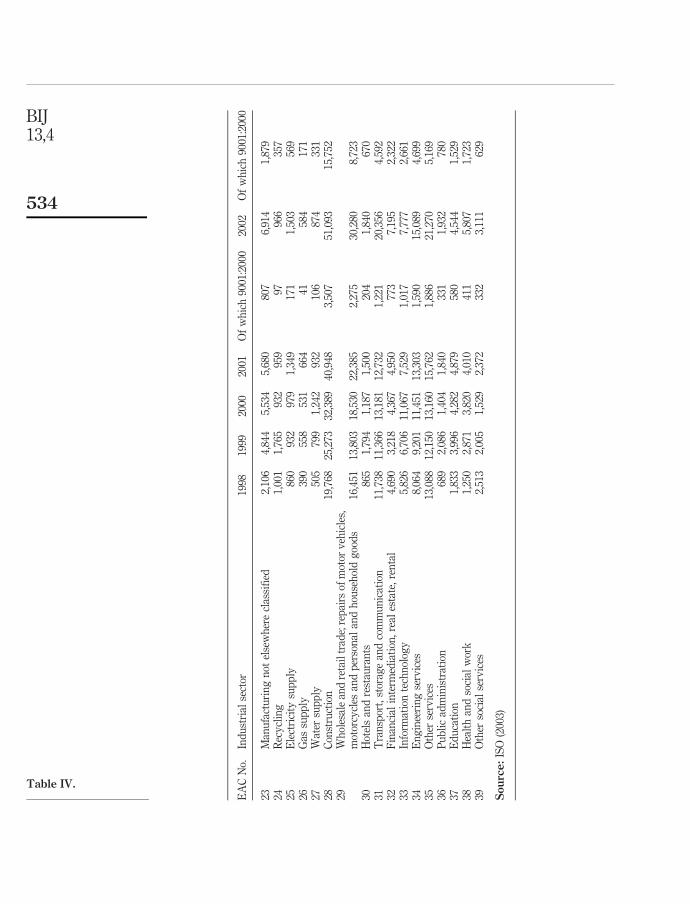
EA
CN
o.In
du
stri
alse
ctor
1998
1999
2000
2001
Of
wh
ich
9001
:200
020
02O
fw
hic
h90
01:2
000
23M
anu
fact
uri
ng
not
else
wh
ere
clas
sifi
ed2,
106
4,84
45,
534
5,68
080
76,
914
1,87
924
Rec
ycl
ing
1,00
11,
765
932
959
9796
635
725
Ele
ctri
city
sup
ply
860
932
979
1,34
917
11,
503
569
26G
assu
pp
ly39
055
853
166
441
584
171
27W
ater
sup
ply
505
799
1,24
293
210
687
433
128
Con
stru
ctio
n19
,768
25,2
7332
,389
40,9
483,
507
51,0
9315
,752
29W
hol
esal
ean
dre
tail
trad
e;re
pai
rsof
mot
orv
ehic
les,
mot
orcy
cles
and
per
son
alan
dh
ouse
hol
dg
ood
s16
,451
13,8
0318
,530
22,3
852,
275
30,2
808,
723
30H
otel
san
dre
stau
ran
ts86
51,
794
1,18
71,
500
204
1,84
067
031
Tra
nsp
ort,
stor
age
and
com
mu
nic
atio
n11
,738
11,3
6613
,181
12,7
321,
221
20,3
564,
592
32F
inan
cial
inte
rmed
iati
on,
real
esta
te,
ren
tal
4,69
03,
218
4,36
74,
950
773
7,19
52,
322
33In
form
atio
nte
chn
olog
y5,
826
6,70
611
,067
7,52
91,
017
7,77
72,
661
34E
ng
inee
rin
gse
rvic
es8,
064
9,20
111
,451
13,3
031,
590
15,0
894,
699
35O
ther
serv
ices
13,0
8812
,150
13,1
6015
,762
1,88
621
,270
5,16
936
Pu
bli
cad
min
istr
atio
n68
92,
086
1,40
41,
840
331
1,93
278
037
Ed
uca
tion
1,83
33,
996
4,28
24,
879
580
4,54
41,
529
38H
ealt
han
dso
cial
wor
k1,
250
2,87
13,
820
4,01
041
15,
807
1,72
339
Oth
erso
cial
serv
ices
2,51
32,
005
1,52
92,
372
332
3,11
162
9
Source:
ISO
(200
3)
Table IV.
BIJ13,4
534

The top five sectors in 2002 are construction (28), basic metal and fabricated metalproducts (17), electrical and optical equipment (19), machinery and equipment (18), andwholesale and retail trade; repairs of motor vehicles, motorcycles and personal andhousehold goods (29) (Figure 8).
This outcome reveals some particular aspects. The first position, held by the sectorconstruction (28), can be justified by considering a “regulatory/legislation effect.”Many countries impose a ISO 9000 quality certification for participating to public-workcontracts. Certificates in this sector manifest a constant growth since 1998.
Till 2001 (except 2000) the first place was held by electrical and optical equipment(19), currently holding third position.
The second position, held by the sector basic metal and fabricated metal products(17), is due to the large influence of automotive industry, which is one of the mostinvolved in quality certification (QS-9000:1998, 1998; ISO/TS 16949:2002, 2002standards are an evidence of this strong attention).
Looking at Table IV, a series of particular behaviors leaps out. In some cases, thelimited number of certificates is due to the small number of companies operating in aspecific sector (see, for example, nuclear fuel (11)); in other cases, sectors are still“immature” towards the implementation of a quality system (see, for example,agriculture, fishing (1)).
The common trend for most sectors is a regular growth over years till a saturation level(maturity stage). However, some sectors reveal a reduction of the number of certificates inthe last years. This is a questionable aspect. Referring to sectors such as aerospace (21) andshipbuilding (20) the causes can be found in the reduction of the number of companies
Figure 8.Time evolution of the topfive sectors for number of
certificates in 2002
Top five sectors in 2002
0
10,000
20,000
30,000
40,000
50,000
60,000
1998 1999 2000 2001 2002
Year
Source: ISO (2003)
Num
ber
of c
erti
fica
tes
ConstructionBasic metal & fabricated metal products
Electrical and optical equipmentMachinery and equipmentWholesale & retail trade; repairs of motor vehicles,motorcycles & personal& household goods
Analysis of ISO9000 standard
diffusion
535

currently operating in these fields. In other cases, the causes must be ascribed to themonopolistic conditions and to the low sensibility to the market competition (manufactureof coke and refined petroleum products (10) and gas supply (26)).
Service sectors show a clear growth in the last two years (see, for example, financialintermediation, real estate, rental (32), engineering services (34) and other services (35)).On the other hand, after an initial booming period, the information technology (33)sector is displaying a moment of stagnation.
5. ISO 9000 certification in developed countries and GNPA comparison between economical and entrepreneurial structure of different countriescan help to better understand the ISO certificates regional share. A natural index for athorough analysis could be the ratio between ISO 9000 certificates and the totalnumber of potentially “certifiable” companies in each country (Franceschini et al.,2004). Unfortunately this kind of information is not available for all the countries, as aconsequence of the different entrepreneurial classification.
Some authors tried to normalize the number of certificates for each country byintroducing the so-called “ISO 9000 per capita index” defined as the average number ofISO 9000 certificates per inhabitant (Saraiva and Duarte, 2003). This approach can be,at least, fairly hazardous. There is no direct correlation between the number ofcompanies in a country and the number of its inhabitant.
On the other hand, it is interesting to analyze the relationship between ISO 9000certification and the economic development of a country. This can be done byconsidering the number of certificates in a country and the corresponding gross nationalproduct (GNP). A one-to-one comparison between the ISO 9000 ranking position and theGNP is reported in Table V.
Eight of top ten countries for ISO 9000 certificates also appear in the first tenpositions in GNP ranking (i.e. China, Italy, UK, USA, Germany, Japan, Spain andFrance). This shows a high correlation between the two sets of indicators.
To better understand the correlation between ISO 9000 certification andsocio-economic development of a country, the analysis has been enlarged to the humandevelopment index (HDI) (see Table VI). HDI is a composite index that measures theaverage achievements in a country in three basic dimensions of human development: a
CountryCertificates (2002)
(percentage of world total)GNP (2002)
(billions US dollars)GNP
ranking
China 13.49 1,234.157 6Italy 10.90 1,100.713 7UK 10.85 1,510.771 4USA 6.93 10,207.039 1Germany 6.37 1,876.340 3Japan 6.05 4,323.919 2Spain 5.11 596.469 10Australia 4.83 384.075 14France 3.54 1,362.077 5Republic of Korea 2.58 473.050 13
Sources: ISO (2003); World Bank (2003)
Table V.Comparison between theISO 9000 rankingposition and the GPN forthe top ten countries in2002
BIJ13,4
536
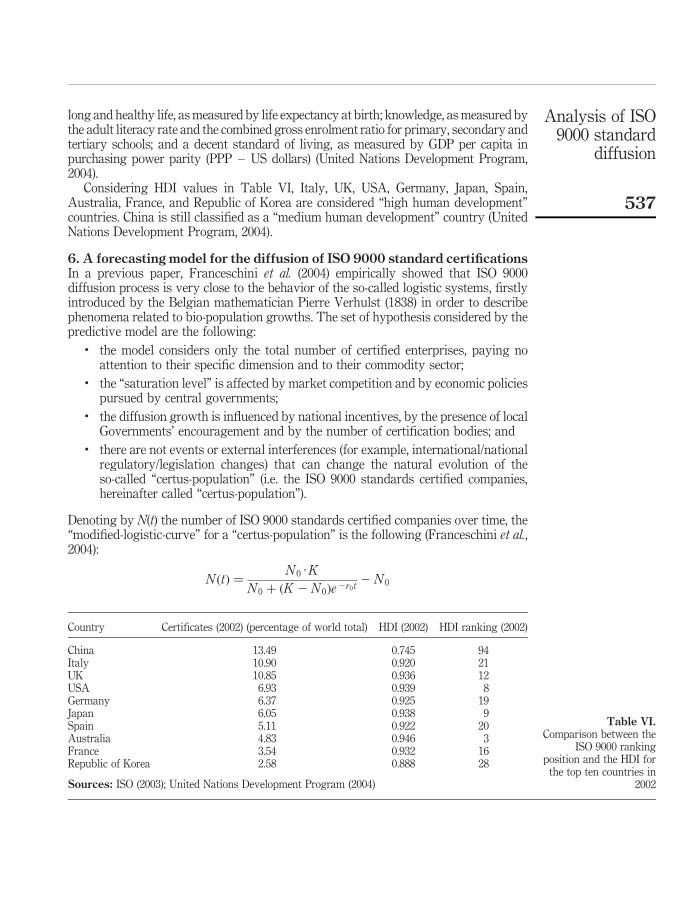
long and healthy life, as measured by life expectancy at birth; knowledge, as measured bythe adult literacy rate and the combined gross enrolment ratio for primary, secondary andtertiary schools; and a decent standard of living, as measured by GDP per capita inpurchasing power parity (PPP – US dollars) (United Nations Development Program,2004).
Considering HDI values in Table VI, Italy, UK, USA, Germany, Japan, Spain,Australia, France, and Republic of Korea are considered “high human development”countries. China is still classified as a “medium human development” country (UnitedNations Development Program, 2004).
6. A forecasting model for the diffusion of ISO 9000 standard certificationsIn a previous paper, Franceschini et al. (2004) empirically showed that ISO 9000diffusion process is very close to the behavior of the so-called logistic systems, firstlyintroduced by the Belgian mathematician Pierre Verhulst (1838) in order to describephenomena related to bio-population growths. The set of hypothesis considered by thepredictive model are the following:
. the model considers only the total number of certified enterprises, paying noattention to their specific dimension and to their commodity sector;
. the “saturation level” is affected by market competition and by economic policiespursued by central governments;
. the diffusion growth is influenced by national incentives, by the presence of localGovernments’ encouragement and by the number of certification bodies; and
. there are not events or external interferences (for example, international/nationalregulatory/legislation changes) that can change the natural evolution of theso-called “certus-population” (i.e. the ISO 9000 standards certified companies,hereinafter called “certus-population”).
Denoting by N(t) the number of ISO 9000 standards certified companies over time, the“modified-logistic-curve” for a “certus-population” is the following (Franceschini et al.,2004):
N ðtÞ ¼N 0 · K
N 0 þ ðK 2 N 0Þe2r0t2 N 0
Country Certificates (2002) (percentage of world total) HDI (2002) HDI ranking (2002)
China 13.49 0.745 94Italy 10.90 0.920 21UK 10.85 0.936 12USA 6.93 0.939 8Germany 6.37 0.925 19Japan 6.05 0.938 9Spain 5.11 0.922 20Australia 4.83 0.946 3France 3.54 0.932 16Republic of Korea 2.58 0.888 28
Sources: ISO (2003); United Nations Development Program (2004)
Table VI.Comparison between the
ISO 9000 rankingposition and the HDI for
the top ten countries in2002
Analysis of ISO9000 standard
diffusion
537

where the parameters have the following meaning: r0 is the population growth rate inthe absence of intra-specific competition; N0 is a constant to assure the initial conditionN ð0Þ ¼ 0;
N ð1Þ ¼ ðK 2 N 0Þ is the certus-population saturation level, that is the total numberof companies that will be interested in the certification process.
Analyzing by this model the ISO 9000 top ten countries, a series of considerationstake rise. Consider, for example, the case of Germany, which has achieved thesaturation plateau (“maturity stage” see Figure 9). The prediction curve has beenderived by applying to the empirical data a first-order non-linear regression fit (Seberand Wild, 1989). The estimated average asymptotic value N ð1Þ is approximately40,000 (about 8 percent of C.C.). These results show that the certificates growth hascome to the end.
It can be shown that this phenomenon is happening in many other countries, suchas, for example, United Kingdom (the first country to introduce the ISO certificates),Australia, France, Republic of Korea, and USA, (see also Figures 1 and 2).
The “modified-logistic-curve” model can be applied to “certus-populations” only untilthe plateau level is reached. After this point, other mechanisms drive the diffusion and amore appropriate model should be individuated. At the moment many different scenarioscan be hypothesized for the evolution after the saturation plateau. Related mechanisms arenot clear yet (Figure 9). Some current behaviors let believe that a “reverse mechanism” istaking place (see, for example, UKPPP and Germany curves in Figure 1).
Figure 9.Forecast of the GermanISO 9000 standardcertificates elaborated by amodified-logistic-modeluntil 2012
Prediction curve with confidence band
0
5,000
10,000
15,000
20,000
25,000
30,000
35,000
40,000
45,000
50,000
Year
Note: The figure reports the empirical data (circles), the fit curve (thick line), and the forecast confidence interval (95%) (dotted lines)Source: Franceschini et al. (2004)
Num
ber
of c
erti
fica
tes
1988 2013200319981993 2008
BIJ13,4
538

7. ConclusionsThe paper presents a cross-section of the diffusion of ISO 9000 family certification inthe world. Many aspects which highlight the peculiarity of this framework have beenanalyzed. Some main results are hereafter summarized.
By the analysis of the scientific literature a correlation among certification andbusiness performances is not univocally demonstrable. It is still a matter of discussionif the increase of business is due to the management methodology prescribed byquality standards, or if it is only a question of marketing (certification as a way fordistinguishing itself in a global market).If we look at the evolution curve of the number of certificates over time in each country,we can observe a kind of “saturation effect.” This means that after a certain period offast growth a physiologic break take places. This phenomenon can be explained byinterpreting the certification process as a distinction element. When the number ofcertified organizations reaches a certain limit, certification loses its connotation andbecomes less attractive for the remaining companies.
This behavior has been analyzed by a diffusion forecasting model. The “saturationeffect” has been verified for those countries which are attaining the so-called “maturitylevel” (i.e. the level in which no certification growth is registered).
The analysis of regional share certificates evolution evidences a sensible increase ofFar East countries.
On the other hand, referring to the new Vision 2000, the results do not seem to be soexciting. Up to the end of 2002, the number of certificates issued for the revisedstandard (ISO 9001:2000, 2000) seems too exiguous to give assurance of a completetransition by the fixed term.
The analysis of ISO 9000 certificates’ share by industrial sector evidences a growthfor the most sectors; only a few of them show a negative trend in last two years.
A relationship between ISO 9000 certificates and socio-economic indicators of acountry (HDI, GNP) has been considered.
Looking at the obtained results, some questions come out about the future ofcertification. Will the certification market go on? Will certified enterprises continue tobe interested to the certification process?
A possible future scenario will polarize the certification focus from the inside ofenterprises (internal quality systems) to the actual beneficiaries of their performances(stakeholders). Some markets are already showing examples in this direction. Manycommodity associations are adopting their own “quality standards”. At this point, howcan international standardization authorities act for avoiding this new certification“Far-West”?
References
Beattie, K.R. and Sohal, A.S. (1999), “Implementing ISO 9000: a study of its benefits amongAustralian organisations”, Total Quality Management, Vol. 10 No. 1, pp. 95-106.
Brown, A. and van Der Wiele, T. (1996), “A typology of approaches to ISO 9000 certification andTQM”, Australian Journal of Management, Vol. 21 No. 1, pp. 57-73.
Comite Francaise d’Accreditation (2003), available at: www.cofrac.fr
Conti, T. (2000), “Vision 2000: positioning the new ISO standards with respect to total qualitymanagement models”, Total Quality Management, Vol. 10 Nos 4/5, pp. 454-64.
Deutsche Bundesbank (2003), available at: www.bundesbank.de
Analysis of ISO9000 standard
diffusion
539

Entidad Nacional de Acreditacion (2003), available at: www.enac.es
EUROSTAT (2003), available at: www.eurostat.eu
Franceschini, F. (2002), Advanced Quality Function Deployment, CRC Press, Boca Roton, FL.
Franceschini, F., Galetto, M. and Giannı, G. (2004), “A new forecasting model for the diffusion ofISO 9000 standard certifications in European countries”, International Journal of Quality &Reliability Management, Vol. 21 No. 1, pp. 32-50.
Instituto Nacional de Estadıstica (2003), available at: www.ine.es
Ismail, M.Y. and Hashimi, M.S.J. (1999), “The state of quality management in the Irishmanufacturing industry”, Total Quality Management, Vol. 10 No. 6, pp. 853-62.
ISO (2001), “The ISO survey of ISO 9000 and ISO 14000 certificates”, Tenth Cycle, 2000, Geneva.
ISO (2002), “The ISO survey of ISO 9000 and ISO 14000 certificates”, Eleventh Cycle, 2001,Geneva.
ISO (2003), “The ISO survey of ISO 9000 and ISO 14000 certificates”, Twelfth Cycle, 2002,Geneva.
ISO 19011:2002 (2002), Guidelines for Quality and/or Environmental Management SystemsAuditing, ISO, Geneva.
ISO 9000 (1987), Quality Management and Quality Assurance Standards, Geneva.
ISO 9000:2000 (2000), Quality Management Systems – Fundamentals and Vocabulary, ISO,Geneva.
ISO 9000-1:1994 (1994), “Quality management and quality assurance standards – Part 1”,Guidelines for Selection and Use, ISO, Geneva.
ISO 9001:1994 (1994), “Quality systems – model for quality assurance in design, development,production, installation and servicing”, ISO, Geneva.
ISO 9001:2000 (2000), Quality Management Systems – Requirements Specifies, ISO, Geneva.
ISO 9002:1994 (1994), Quality Systems – Model for Quality Assurance in Production, Installationand Servicing, ISO, Geneva.
ISO 9003:1994 (1994), Quality Systems – Model for Quality Assurance in Final Inspection andTest, ISO, Geneva.
ISO 9004:2000 (2000), Quality Management Systems – Guidelines for Performance Improvements,ISO, Geneva.
ISO/TS 16949:2002 (2002), Quality Management Systems – Particular Requirements for theApplication of ISO 9001:2000 for Automotive Production and Relevant Service PartOrganizations, ISO, Geneva.
Italian Ministry of Productive Activities (2003), available at: www.minindustria.it
Kanji, G.K. (1998), “An innovative approach to make ISO 9000 standard more effective”,Total Quality Management, Vol. 9 No. 1, pp. 67-78.
Laszo, G.P. (2000), “ISO 9000 – 2000 version: implications for applicants and examiners”,The TQM Magazine, Vol. 12 No. 5.
Lee, K.S. and Palmer, E. (1999), “An empirical examination of ISO 9000 registered companies inNew Zealand”, Total Quality Management, Vol. 10 No. 6, pp. 887-99.
Military Standards Mil 9859A (1963), Quality Program Requirements, US Department of Defence.
Ministere de l’ Economie de France (2003), available at: www.minefi.gouv.fr
Nicolau, J.L. and Sellers, R. (2002), “The stock market’s reaction to quality certification: empiricalevidence from Spain”, European Journal of Operations Research, Vol. 142, pp. 632-41.
BIJ13,4
540
Parr, G.L. (1999), “ISO 9000 drives TQM”, Quality, Vol. 38 No. 7, pp. 23-35.
QS-9000:1998 (1998), Quality System Requirements QS-9000, ASQ, Milwaukee, WI.
Romano, P. and Vinelli, A. (2001), “Quality management in a supply chain perspective. Strategicand operative choices in a textile-apparel network”, International Journal of Operations &Production Management, Vol. 21, pp. 446-60.
Saraiva, P.M. and Duarte, B. (2003), “ISO 9000: some statistical results for a worldwidephenomenon”, TQM & Business Excellence, Vol. 14 No. 10, pp. 1169-78.
Seber, G.A.F. and Wild, C.J. (1989), Nonlinear Regression, Wiley Series in Probability andMathematical Statistics, Wiley, New York, NY.
SINCERT (2003), Database query available at: www.sincert.it
Statistisches Bundesamt (2003), “Steuerpflichtige und deren Lieferungen und Leistungen 1999nach Wirtschaftsabschnitten und Rechtsformen”, available at: www.destatis.de
Stevenson, T.H. and Barnes, F.C. (2002), “What industrial markets need to know about ISO 9000certification. A review, update, and integration with marketing”, Industrial MarketingManagement, Vol. 31, pp. 695-703.
Sun, H. (1999), “The patterns of implementing TQM versus ISO 9000 in the 1990s”, InternationalJournal of Quality & Reliability Management, Vol. 16 No. 3, pp. 20-1.
Sun, H., LI, S., Ho, K., Gertsen, F., Hansen, P. and Frick, J. (2004), “The trajectory of implementingISO 9000 standards versus total quality management in Western Europe”, InternationalJournal of Quality & Reliability Management, Vol. 21 No. 2, pp. 131-53.
Terziovski, M., Power, D. and Sohal, A.S. (2003), “The longitudinal effects of the ISO 9000certification process on business performance”, European Journal of Operational Research,Vol. 146, pp. 580-95.
TGA Accreditation Body e DQS GmbH (2003), available at: www.tga-gmbh.de
UK National Statistics (2003), “Size analysis of UK businesses”, available at: www.statistics.gov.uk
United Kingdom Accreditation Service (2003), available at: www.ukas.com
United Nations Development Program (2004), available at: www.undp.org
Wiele, T.B., Dale, B.G. and Williams, A.R.T. (1997), “ISO 9000 series registration to total qualitymanagement: the transformation journey”, International Journal of Quality Science, Vol. 2No. 4, pp. 236-52.
Withers, B.E. and Ebrahimpour, M. (2000), “Does ISO 9000 certification affect the dimensions ofquality used for competitive advantage?”, European Management Journal, Vol. 18 No. 4,pp. 431-43.
World Bank (2003), “Data and statistics”, available at: www.worldbank.org
Further reading
Stevenson, T.H. and Barnes, F.C. (2001), “Fourteen years of ISO 9000: impact criticisms, costs andbenefits”, Business Horizons, Vol. 44 No. 3, pp. 45-51.
Corresponding authorF. Franceschini can be contacted at: [email protected]
Analysis of ISO9000 standard
diffusion
541
To purchase reprints of this article please e-mail: [email protected] visit our web site for further details: www.emeraldinsight.com/reprints
Book review
Benchmarking: A Guide for EducatorsSue TuckerCorwin PressThousand Oaks, CA1996pp. 104Paperback: $18.95ISBN: 080396367XKeywords Benchmarking, Education, MeasurementReview DOI 10.1108/14635770610676335
While the quality of education in the US higher education system undoubtedly leadsthe world, the education in K through 12 grades admittedly demonstrated relativeweakness in quality compared to many Asian and European nations. As a result, theissues of quality, quality standards, the measurement of quality and performance inthe public education system have been a matter of concern in the socio-political arenaof the nation. The governmental responses to these issues in the form of subjectinginstitutions to a defined national standard (for measuring student competencies andperformances at various grade levels for funding purposes) have been controversialand often led to partisan political rhetoric. Public schools and school districts in thenation under pressures of compliance have begun to embrace the business model ofcontinuous improvement through benchmarking performance toward achieving worldclass standards.
However, as the culture of continuous improvement and the adoption of bestpractices through benchmarking are more readily accepted in the business communityfor competitive advantage, the public school system with their elective governancebodies and entrenched bureaucratic system find it quite difficult to change thetraditional culture. Sue Tucker of the NETWORK, Inc. a consultant for the publiceducation system for many years wrote this guidebook in nine sequential chapters as astep by step manual for the educators who have been contemplating “restructuringand reform.” The approach described in the book conforms to “peer benchmarking”or “competitive benchmarking” methodology. The intended readers are primarilythe educators in the public institutions, an individual school or the school district in thenation. In author’s own words, “This book provides step-by-step actions thatimprovement teams can take . . . ” (p. x). Each chapter of the book contains a purposestatement, limited background information on the step, a simple and illustrativeexercise aimed at empirical understanding of the step.
In the first chapter (ten pages), the book provides an introduction of terms, concepts,benefits of benchmarking, and the existing methodologies of benchmarking drawingfrom the successes in the business world. The level of explanation in this chapter isgeneric and rudimentary with a focus on simple and empirical understanding of theconcepts by an ordinary individual. In Chapter 2, under a catchy question or phrase,“Should your school begin benchmarking”, the author in seven pages discusses the
BIJ13,4
542
Benchmarking: An InternationalJournalVol. 13 No. 4, 2006pp. 542-544q Emerald Group Publishing Limited1463-5771

experiences of benchmarking and continuous improvement in business organizations;the prerequisites that must be in place for benchmarking; a desirable time frame for abenchmarking study; the cost and logistical considerations; and the provision of somegeneral resource guidelines. Again, the level of analysis in this chapter was also keptvery simple. The third chapter consists of nine pages and dealt with the planningaspect of the benchmarking project. The author stressed such things as what to andwhat not to benchmark; selecting a benchmarking team; and writing a term ofreference for the team.
Chapter 4 consists of 11 pages. The author describes the need to document currentpractices; establishing performance measures; and understanding of the currentprocesses and the bottlenecks associated with them. The Chapter 5 consists of sevenpages. It deals with the development of relevant criteria to be used in selecting abenchmarking partner (i.e. a peer). In brief statements, the need for conducting researchto locate a partner, and once located, concluding an agreement with the same wasemphasized. The Chapter 6 in seven pages deals with the mechanics of developing aquestionnaire and a site visit guidelines. In this important segment, the authorprovides the likely contents of the questionnaire and the important logisticalconsiderations for the site visit. In the Chapter 7, also in seven pages, the authordiscusses actions, Analyze-Recommend-Communicate. She highlights actions such ascomparative analysis (relative to the peer institution) of data leading to thedetermination of performance gaps; and development of performance improvementideas for the institutions. In the six pages of Chapter 8, the author discusses the needfor developing an implementation plan. Establishing a structure with a mission to“Plan-Do-Check-Act Cycle” through an action plan was also recommended. In the fourpages of the concluding (Chapter 9) chapter, the author demonstrated the need forcelebration of the success, recording of the process improvement, and the teamrecognition.
Sue Tucker wrote this book in a workshop format for an audience of educators in acommonsense language. The complex and technical vocabulary of the benchmarkingstudy were carefully avoided. She has the background and understanding of the publiceducational system, the target readers of the book, and the political, administrative,and economic realities of the public schools. This book was probably the first of itskind to address benchmarking, best practices and continuous improvement in thepublic elementary through the secondary school system. The important strength ofthis book is that it takes the fear out of the reader of a perceived complex system ofmeasurement methodology of benchmarking. The workshop format providesempirical grounding of concepts and methods. Another good aspect of the book isthat it prepares the reader in the understanding of the logistical imperatives, therequirement of financial, the time, and the leadership commitments for a benchmarkingstudy. Researching for a peer institution as a reference point for calculatingperformance gaps should be interesting to the target readers.
Making benchmarking simple and worthwhile for any organization is a noble buttask. In many ways, Sue Tucker’s book would appear to be too simplistic. It raisesmore questions of “how” in every step that she describes in the book. Neither does itdeal with the complexities of measurement, nor does it provide examples. Within alittle over a page, the author provides an overview of benchmarking methodology.In such a brief space, only certain pertinent questions that a benchmarking
Book review
543

methodology should address were listed. One wonders how the educators wouldoperationalize these questions and develop reliable and valid instruments. They woulddefinitely need and seek assistance of the consultants or professionals in the absence ofin-house expertise of the proposed team. There is also no discussion about thecomposition of the benchmarking team or discussion of cases of success in locating apeer institution. The reader may also become puzzled in handling the actionimperatives of Chapter 7 of the book. The author only affirms the need for analyzingthe findings and confirming and articulating performance gaps. But how would theseactivities be accomplished? In an intuitive exercise of performance gap, the authorasked the readers to use the performance measurement technique developed in Chapter4. But in Chapter 4, the author asks the reader to develop a process chart of existingoperation and analyzing the root causes of problems in the existing processes; but howshould the reader do these activities? In exercise 4.1: establishing performancemeasures, the author implies gathering of subjective and global opinions to be listed ona flip chart – implying a sort of brainstorming exercise. Without quantifiableoutcomes, attempting a comparative analysis toward establishing the performance gapis good for intuitive exercise and probably best for conceptual understanding but notpractical and useful in quantitative analyses of any benchmarking study. In theabsence of a discussion pertaining to a robust methodological model and empiricalexercises, this guide may be treated as an orientation workshop rather than actualguide of benchmarking for best practices.
M. Ruhul AminDepartment Chairperson and Co-Coordinator of MBA Program,
Bloomsburg University, USA
BIJ13,4
544