benchmarking supply chain ... - decisionsciences.org fileresearchers in supply chain management have...
TRANSCRIPT
Aggarwal et.al. Benchmarking Supply Chain Collaboration
.
DECISION SCIENCES INSTITUTE Benchmarking Supply Chain Collaboration using Data Envelopment Analysis
Full Paper Submission
Shikha Aggarwal Management Development Institute, India
Dr. Manoj Kumar Srivastava Management Development Institute, India
Dr. Vijay Aggarwal Management Development Institute, India
ABSTRACT
In this study, we have proposed a framework to benchmark supply chain collaboration using Data Envelopment Analysis (DEA). A list of input and output parameters for DEA framework was identified through focus group interviews. It was found that, for successful supply chain collaboration, input parameters required were communication cost, process integration cost, and relationship management cost, while outcomes were reduction in product cost, process cost and inventory cost. Further, the tool was applied in a food-processing case organization, which indicated that supply chain managers should focus on information sharing and developing good relations with other supply chain entities.
KEYWORDS: Supplier Relationship Management, Collaborative Partnerships
INTRODUCTION
Supply chain collaboration has been a prominent area of interest for researchers and practitioners over the last few decades (Bowersox et. al., 2000; Whipple and Frankle, 2000; Simatupang and Sridharan, 2002). The literature on supply chain collaboration consists of studies dealing with various dimensions of collaboration; discussing collaboration index and proposing various quantitative models, to capture impact of collaboration on firm performance (Stank et.al. 2001; Whipple et. al. 2002; Barratt 2004; Simatupang and Sridharan, 2005; Cao and Zhang, 2011 etc.) Despite the apparent popularity of supply chain collaboration among academic researchers, there is a scarcity of research articles that deal with methods to evaluate and benchmark collaboration against best practices. The practical application of a concept remains limited if the managers are not able to implement it properly or understand its benefits relative to peers or competitors.
Benchmarking is the process of evaluating the products, services, and processes of best performing organizations vis-à-vis it’s own and further evaluating their best practices. Many researchers in supply chain management have used benchmarking for performance improvement (Gilmor 1998; Basnet et.al. 2003). Companies like General Motors, American Express, and Xerox have used benchmarking to move up against competitors in their respective industries globally (Hiebeler et. al., 1998).
However, the process of benchmarking is complex and involves several issues to be addressed. Some of the key issues pertain to the appropriateness of the tool, implementation of that tool,

Aggarwal et.al. Benchmarking Supply Chain Collaboration
.
from the perspective of availability of data, ease of usage, and identification of areas and processes to benchmark etc. This study puts forward a simple and yet powerful tool based on Data Envelopment Analysis (DEA) for benchmarking supply chain collaboration. The research attempts to enhance our knowledge on two fronts. Firstly we contribute to the field of research by proposing a robust DEA tool for benchmarking of supply chain collaboration. Secondly, we show usefulness and applicability of this method through an illustrative case study demonstration. Precisely the objectives of this study are:
1. To identify costs or inputs and, benefits or positive outcomes of supply chain collaboration.
2. Develop a DEA framework for benchmarking supply chain collaboration. 3. Illustrate through a case, the application of this framework.
The paper is organized around seven sections. Section 2 provides a review of the past literature and applied methods used to compare collaborative practices across supply chains. Section 3 presents the framework proposed in this study. Section 4 demonstrates its implementation in an organization and discusses the results of outcome. Section 5 outlines findings and managerial implications. Section 6 highlights the conclusion of the study and section 7 discusses limitations and scope of future research.
LITERATURE REVIEW
In the last few decades, the recognition of and focus on the supply chain as an important area for an enterprises’ success, has increased. In many studies, it has been found that the firms’ ability to compete is directly linked with their ability to integrate and collaborate with other enterprises (Lewis, 1990). In this era of intense competition, companies are compelled to create close relations with both their upstream and downstream partners. The traditional arm’s length relationships are no longer effective in today’s dynamic environment (Bowersox et al., 2000).
It has been suggested by literature on supply chain collaboration that companies benefit from their collaborative initiatives, (Narasimhan and Jayaram, 1998; Shin et.al., 2000; Vereecke and Muylle, 2006; Sanders, 2008). Benchmarking is a popular tool used worldwide to improve organizations’ performance in businesses. Benchmarking encourages companies to quickly learn from others so as to leap ahead of the competition and establish new standards of performance (Garvin, 1985; Elmuti and Kathawala, 1997). A benchmark can be provided to an organization’ by comparing different supply chains of its supplier network or with another company’s supply chain based on availability of data (Simatupang and Sridharan, 2004).
A number of studies in the field of supply chain management are dedicated towards the work on benchmarking (e.g. Spendolini, 1993; Bogan and Callahan, 2001; Singh et. al. 2006; Ellinger and Chapman 2011 etc.). It encourages companies to learn from others and improve so as to keep themselves at pace with others in competition (Garvin, 1993). Hanman (1997) claimed that supply chain benchmarking can be viewed as an improvement technique which is based on how others perform in a similar activity, assignment, process or a function. In this way, the companies may discover that there is a lot of potential yet to be unleashed. In supply chain management, benchmarking is relevant by determining the company’s products, processes, services, and comparing them on the basis of specific metrics of relatively more efficient firms (Christopher, 1998).
Geary and Zonnenberg (2000) used the Supply Chains Operations Reference (SCOR) model and reported that the benchmarking study, led by the Performance Measurement Group (PMG),

Aggarwal et.al. Benchmarking Supply Chain Collaboration
.
indicated that the top performing supply chain companies were gaining substantial financial and operating benefits over others.
The past the studies on benchmarking supply chain collaboration (Poirier, 1999; Polese, 2002, Simatupang and Sridharan, 2004) don’t provide much guidance on how to quantify the goals and decide whether a given firm can attain those goals or not. In this paper we have proposed a benchmarking scheme for supply chain collaboration through DEA. It first identifies a specific most-efficient peer group, which can be used as a comparison set, and then it would be able to help managers to determine goals for improvement in specific areas. The next section describes how DEA can be used to benchmark supply chain collaboration.
BENCHMARKING SUPPLY CHAIN COLLABORATION USING DEA
Explanation for using DEA
DEA also called frontier analysis; as a concept, was introduced by Charnes, Cooper and Rhodes in 1978. DEA is a technique of performance measurement and can be used to evaluate relative efficiencies of the decision-making units (DMU). Any economic agent that has limited resources and that aspires to achieve certain goals or performance targets with as few inputs as possible can be a DMU. A DMU is basically a distinct unit in an organization that has the flexibility for some of the decisions it makes, while not much freedom for these decisions. DEA is used either to compare the performance of one firm with that of another, assuming that all the firms have similar goals and directions or to conduct a longitudinal study by comparing the efficiencies of a firm or one of its stores or departments over a period of time. It is an operations research based method to evaluate the performance efficiency of one DMU against other similar DMUs. It converts multiple inputs and outputs of a DMU in a single performance measure that is relative efficiency (Seiford, 1996).
DEA is a tool to evaluate relative efficiencies of peer DMU’s when more than one measures of performance are there (Charnes et. al., 1978). In DEA, there is no need to specify the relationships between the performance measures before calculation. This has an advantage in enabling one to evaluate any measure without the need to find a relationship. DEA uses the concept of efficient frontier to evaluate the efficiencies of DMUs. DEA can provide information regarding the most efficient unit(s) with respect to each input and output and helps analyze the inefficient units. It helps identify which should be the reference DMUs and interpret efficiency parameters. DEA provides an opportunity to evaluate operational performance relative to peer units and to identify the gaps in performance or scope of improvement for a DMU.
Kamakura et al. (1988) measured welfare loss and market efficiency with the help of DEA. Mahajan (1991) used DEA to investigate operations in insurance sector by a comparison of 33 companies. Boles et. al. (1995) used DEA to calculate relative performance of sales people. Seiford’s literature survey in 1996 presented a few hundred papers that use DEA. Kamakura et. al. (1997) evaluated the performance of retail stores using DEA. DEA had been used in diverse areas such as school performance (Charnes et al., 1981), production (Banker and Maindiratta, 1986; sustainability development (Sueyoshi and Wang, 2014); performance evaluation of green practices (Jia et. al. 2014), etc. Gunasekaran et al. (2001) mentioned that a new type of benchmarking is required for supply chain collaboration since the members across the supply chain are concerned with both- the drivers of performance and the targets. Further, Simatupang and Sridharan (2004) concluded from their study that there is a growing need for a tool or a methodology that can guide benchmarking of supply chain collaboration. Academicians and practitioners acknowledge that a

Aggarwal et.al. Benchmarking Supply Chain Collaboration
.
tool for performance measurement should be simple and easy-to-use (Maskell, 1991). Wong and Wong (2008) after an extensive literature review on measures of supply chain performance concluded that DEA is apt to be used for benchmarking supply chain performance measurement. The authors also suggest that DEA should be reviewed and explored deeper for different areas in supply chain management. Therefore, in this study, we have used a robust qualitative technique- Focus Group Interview to identify input and output parameters for DEA.
Focus Group Interviews
The objective of the focus group interviews was to identify the input and output variables for DEA. In view of the fact that prior research lacked on this issue, an exploratory qualitative methodology was found to be most suitable. The aim of exploratory studies is to identify and simplify the problem by bringing out new insights and developing a deeper understanding of the issue.
Number of focus groups: Three focus group interviews were conducted with 6 people in each group, three buyers and three suppliers. The first author was the facilitator of all the 3 groups. In this way, consistency was maintained. The participants were also provided with a list of collaboration costs and benefits compiled from literature for reference. The whole session was recorded and themes for input and output variables of supply chain collaboration were identified using content analysis. (Refer to appendix for interview protocol).
The DEA framework
The following DEA framework was formed after analyzing transcripts of focus-group interviews.
Table 1: Input and Output Variables
Input variables Output variables
Communication Cost Product Cost Reduction
Process Integration Cost Process Cost Reduction
Relationship Management Cost Inventory Cost Reduction
Communication Cost: One of the most important activity that collaborating companies are involved in was communication with other supply chain members. This included sharing of information and updating other form of data, such as inventory levels, point-of-sale data, market demand, etc. (Simatupang and Sridharan, 2002; Simatupang et. al., 2004). Costs are incurred in communicating through the use of telephone, emails, or internet, etc. The decision about mode of communication depends on the scale of operations of an organization, the volume of data to be shared and the frequency of sharing. The costs may be minimal in case of telephonic conversations while it may go very high in case of installing ERP systems (Kelle and Akbulut, 2005).
Process Integration Cost: The collaborating companies try to integrate their supply chain process to coordinate better and save in terms of time and money (Chen et. al., 2009). It would

Aggarwal et.al. Benchmarking Supply Chain Collaboration
.
depend on the scale of business and nature of industry, whether process integration costs would be high or low (Rai et. al., 2006).
Relationship Maintenance Cost: In this head, companies accounted for costs they incurred in building relationships with supply chain partners. These costs included costs invested in building trust with the partner, or sharing of losses incurred by the partner firm to maintain the relationship (Handfield and Bechtel, 2002; Wathne and Heide, 2004).
Product Cost Reduction refers to decrease in cost of production that resulted due to collaboration with supply chain member. The reasons as suggested by previous studies could be due to availability of cheaper raw materials from a supplier, decrease in transportation costs etc. (Swink, 1999; McLaren et. al. 2004 etc.).
Process Cost Reduction refers to decrease in operating costs of a company as a result of collaboration. Previous literature suggested that gaining technical know-how or innovation or by learning new methods of working by collaborating with supply partners results in lower process costs of the organization (Sigala, M. 2004, McLaren et. al. 2002 etc.).
Inventory Cost Reduction refers to decrease in cost of inventory that results when information is shared between the firms and results in an optimum level of inventory as per forecasted demand (Rao et. al. 2006). Here, it might be noted that inventory reduction is different from inventory cost reduction. Reduction of inventory level does not give a true picture of firm’s performance. On the other hand, year on year costs reduced by keeping inventory level constant would mean better practices of inventory carrying or improvement in transportation and warehousing or that there is lesser wastage incurred as a result of collaboration (Tyan et. al. 2003; Yang et. al. 2007; Bhakoo et. al. 2012).
CASE STUDY ILLUSTRATION
The DEA framework developed in the study was applied in a food-processing firm to illustrate its use and applicability. The firm didn’t want to disclose the name; therefore it has been referred to as ‘ABC’ in the paper ahead. ABC, a food-processing firm was chosen for collecting data and illustrating the use of proposed tool. The firm is a rice-processing unit situated in Haryana, India, which distributers rice all across the country. Data for four retail chains of this organization was collected on each of the six parameters identified in qualitative phase (Refer to Table 2).
Table 2: Input and Output values
Retail Chains
Input variable 1
Input variable 2
Input variable 3
Output variable 1
Output variable 2
Output variable 3
R1 16 12 10 2 19 11
R2 21 7 6 4 23 12
R3 12 6 5 5 24 13
R4 23 11 9 3 21 8
(All the figures are in lakhs of rupees)
In DEA, a linear programming model is formulated for each supply chain whose efficiency is to be evaluated. In this illustration, let us assume we want to find the relative efficiency of R3.

Aggarwal et.al. Benchmarking Supply Chain Collaboration
.
w1= weights applied to inputs and outputs for R1
w2= weights applied to the inputs and output for R2
w3= weights applied to inputs and outputs for R3
w4= weights applied to inputs and outputs for R4
Table 3: Costs of Collaboration
Input Measure R1 R2 R3 R4
Communication Cost i11 i12 i13 i14
Process Integration Cost i21 i22 i23 i24
Relationship Management Cost i31 i32 i33 i34
Table 4: Outcomes of Collaboration
Output Measure R1 R2 R3 R4
Product Cost Reduction o11 o12 o13 o14
Process Cost Reduction o21 o22 o23 o24
Inventory Cost Reduction o31 o32 o33 o34
The DEA approach requires that the sum of the weights is equal to one. In this model, a hypothetical composite is created based on outputs and inputs of all operating units with the same goal.
E = the fraction of R3’s inputs available to the composite unit (1)
According to the DEA linear programming model approach, the efficient evaluation of R3 in this case will have
Min E
s.t.
w1 +w2+w3+w4=1 (2)
o11w1+ o12w2+ o13w3+ o14w4 >= o13 (3)
o21w1+ o22w2+ o23w3+ o24w4 >= o23 (4)
o31w1+ o32w2+ o33w3+ o34w4 >= o33 (5)
-i13E + i11w1+ i12w2+ i13w3+ i14w4<=0 (6)
Aggarwal et.al. Benchmarking Supply Chain Collaboration
.
-i23E + i21w1+ i22w2+ i23w3+ i24w4<=0 (7)
-i33E + i31w1+ i32w2+ i33w3+ i34w4<=0 (8)
E, w1, w2, w3, w4 >= 0 (9)
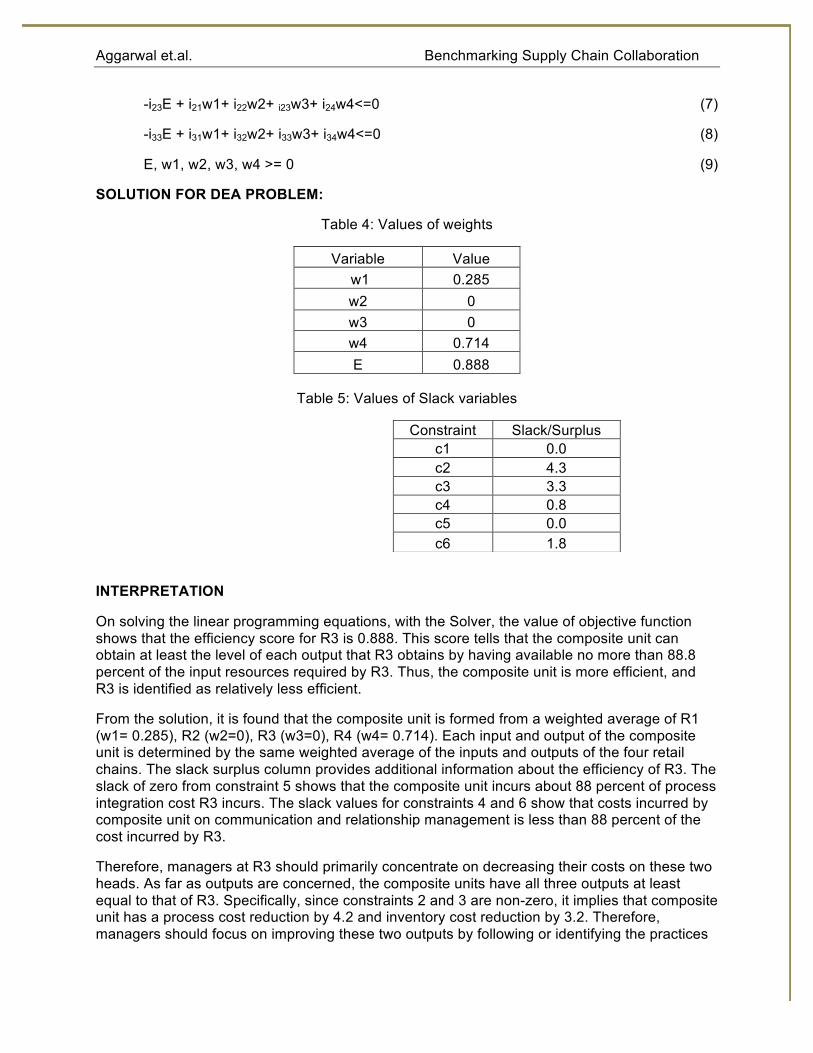
SOLUTION FOR DEA PROBLEM:
Table 4: Values of weights
Variable Value w1 0.285 w2 0 w3 0 w4 0.714 E 0.888
Table 5: Values of Slack variables
INTERPRETATION
On solving the linear programming equations, with the Solver, the value of objective function shows that the efficiency score for R3 is 0.888. This score tells that the composite unit can obtain at least the level of each output that R3 obtains by having available no more than 88.8 percent of the input resources required by R3. Thus, the composite unit is more efficient, and R3 is identified as relatively less efficient.
From the solution, it is found that the composite unit is formed from a weighted average of R1 (w1= 0.285), R2 (w2=0), R3 (w3=0), R4 (w4= 0.714). Each input and output of the composite unit is determined by the same weighted average of the inputs and outputs of the four retail chains. The slack surplus column provides additional information about the efficiency of R3. The slack of zero from constraint 5 shows that the composite unit incurs about 88 percent of process integration cost R3 incurs. The slack values for constraints 4 and 6 show that costs incurred by composite unit on communication and relationship management is less than 88 percent of the cost incurred by R3.
Therefore, managers at R3 should primarily concentrate on decreasing their costs on these two heads. As far as outputs are concerned, the composite units have all three outputs at least equal to that of R3. Specifically, since constraints 2 and 3 are non-zero, it implies that composite unit has a process cost reduction by 4.2 and inventory cost reduction by 3.2. Therefore, managers should focus on improving these two outputs by following or identifying the practices
Constraint Slack/Surplus c1 0.0 c2 4.3 c3 3.3 c4 0.8 c5 0.0 c6 1.8

Aggarwal et.al. Benchmarking Supply Chain Collaboration
.
followed by other DMUs who have better values of outputs on these variables. Also, managers can look up to efficient chains to understand what the Human Resource (HR) practices are followed by them, what is the nature of information shared between partners, what are the supply chain activities that are jointly done between partners etc.
FINDINGS AND MANAGERIAL IMPLICATIONS
This study has huge practical implications for supply chain managers to periodically evaluate their collaborative practices and refine them accordingly. Through this study, we found that supply chain collaboration can be benchmarked through data on six parameters. The first three parameters correspond to efforts input by an organization to build collaborative practices with supply chain members. These are basically in the form of investments made for communication, process integration and relationship management. Secondly, the outcomes from collaboration can be judged through reduction in costs of product, processes and inventory. By using linear programming method to formulate a DEA model, we incorporated these variables to develop a tool that can be easily used by managers by entering values for these six variables. Supply chain managers, may find this useful in order to evaluate their efficiency in supply chain collaboration in comparison to peers. It can be used for internal benchmarking in case of large organizations that have multiple supply chains for identifying best practices, and accordingly incorporating changes for improvement in ‘inefficient’ chains. Secondly, it can be used to benchmark best practices on collaboration followed by suppliers or buyers, in an industry through the DEA framework.
CONCLUSION
Supply chain collaboration is increasingly being adopted by companies, but the research on its benchmarking is still at an initial stage. The methods proposed in literature for benchmarking have limited application in diverse situations. This study made an attempt to a tool for benchmarking supply chain collaboration through DEA. In DEA, the relative efficiencies of DMUs are evaluated and managers do not need to specify beforehand the relationships among performance measures. For supply chain collaboration, a DEA framework is proposed in which three input variables- communication cost, process integration cost, and relationship management cost, and three output variables- product cost, process cost and inventory cost were used. Further the application of this tool in a real case study confirmed its usefulness and simplicity in application.
LIMITATIONS AND FUTURE SCOPE
Our work aimed for analytical and not statistical generalization, therefore, there is a need for further work to test our findings from qualitative phase across different industries and settings. As suggested earlier, this tool can be used to benchmark supply chains in an industry or across industries. One limitation of this study is that, we have provided an example of a case in which it was used for benchmarking retail chains of an organization. By replicating the illustration of our study in different contexts, organizations and industries, the findings could be further strengthened and have wider applicability. The variables identified for DEA analysis are critical to evaluation of supply chain collaboration practices. Future researches can test in different contexts whether the variables remain similar or find new ones based on peculiarities of an industry. In future studies, the insights developed from benchmarking of collaborative practices can be refined on the basis of concepts like Capability Maturity Model (CMM), to guide managers in designing supply chain strategies for increasing efficiency and productivity. More robust tools like fuzzy DEA (Guo and Tanaka, 2001) can be used to increase precision and scope of the results. Also, on the lines on Seiford and Zhu (2002), DEA can be used to evaluate
Aggarwal et.al. Benchmarking Supply Chain Collaboration
.
undesirable outcomes of a phenomenon as well. For that, undesirable outcomes of collaboration like threat to information security etc. can be explored through an in-depth qualitative study.
APPENDIX: FOCUSED GROUP INTERVIEW PROTOCOL
1. Introduction Today we have gathered here to discuss various costs and benefits associated with supply chain collaboration. I would like to mention here that there are no right or wrong answers. All of your comments are valuable.
2. Questions i. How would you define supply chain collaboration? ii. Do you think if partners in a supply chain work collaboratively, it would benefit
them? iii. Looking back at your experience with suppliers (or buyers), what all can you
recall, that the buyer (or supplier) organization did, to develop good relations with buyers (or suppliers).
iv. Please share your experience with your buyers (or suppliers), over a span of time, describing, how you think you have benefited because of good relations or they have benefited.
v. Here I have compiled a list of costs and benefits from collaboration, by reviewing literature and published news articles, I would like you to spend a little time discussing these, and sharing your opinion on whether these are worth considering or not.
3. Concluding Remarks; If anybody would like to share any point that we have missed or anything about today’s discussion, please feel free to come forward. Thank you for your participation.
REFERENCES
Banker RD, Maindiratta A., (1986). Piecewise log linear estimation of efficient production surfaces. Management Science; 32, pp. 126 – 35.
Barratt, M. (2004). Understanding the meaning of collaboration in the supply chain. Supply Chain Management: An International Journal, 9(1), pp. 30-42.
Basnet, C., Corner, J., Wisner, J., & Tan, K. C. (2003). Benchmarking supply chain management practice in New Zealand. Supply Chain Management: An International Journal, 8(1), 57-64.
Bhakoo, V., Singh, P., & Sohal, A. (2012). Collaborative management of inventory in Australian hospital supply chains: practices and issues. Supply Chain Management: An International Journal, 17(2), 217-230.
Bogan, C. and Callahan, D. (2001). Benchmarking in rapid time. Industrial Management, 43(2), pp. 28-33.

Aggarwal et.al. Benchmarking Supply Chain Collaboration
.
Boles, J. S., Donthu, N., & Lohtia, R. (1995). Salesperson evaluation using relative performance efficiency: The application of data envelopment analysis. Journal of personal selling & sales management, 15(3), 31-49.
Bowersox, D.J., Closs, D.J. and Stank, T.P. (2000). Ten mega-trends that will revolutionize supply chain logistics. Journal of Business Logistics, 21(2), pp. 1-16
Brian H. Maskell. (1991). Performance measurement for world class manufacturing: A model for American companies. Productivity Press.
Cao, M., & Zhang, Q. (2011). Supply chain collaboration: impact on collaborative advantage and firm performance. Journal of Operations Management, 29(3), pp. 163-180.
Charnes A, Cooper WW, Rhodes E. (1978). Measuring the efficiency of decision-making units. European Journal of Operations Research, 3, pp. 429–44.
Charnes A, Cooper WW, Rhodes E. (1981). Evaluating program and managerial efficiency: an application of data envelopment analysis to program follow through. Management Science, 27, pp. 668 – 97.
Chen, H., Daugherty, P. J., & Landry, T. D. (2009). Supply chain process integration: a theoretical framework. Journal of Business Logistics, 30(2), 27-46.
Christopher, M. (1998), Logistics and Supply Chain Management, Financial Times Management, London.
Ellinger, A. E., & Chapman, K. (2011). Benchmarking leading supply chain management and logistics strategy journals. The International Journal of Logistics Management, 22(3), 403-419.
Elmuti, D., & Kathawala, Y. (1997). An overview of benchmarking process: a tool for continuous improvement and competitive advantage. Benchmarking for Quality Management & Technology, 4(4), 229-243.
Garvin, D. A. (1985). Building a learning organization. Org Dev & Trng, 6E (Iae), 274.
Garvin, D.A. (1993). Building a learning organization. Harvard Business Review, 71(4), pp.78-81.
Geary, S. and Zonnenberg, J.P. (2000). What it means to be best in class. Supply Chain Management Review, 4(3), pp. 42-8.
Gilmour, P. (1998). Benchmarking supply chain operations. Benchmarking for Quality Management & Technology, 5(4), 283-290
Gunasekaran, A., Patel, C., & Tirtiroglu, E. (2001). Performance measures and metrics in a supply chain environment. International journal of operations & production Management, 21(1/2), 71-87.

Aggarwal et.al. Benchmarking Supply Chain Collaboration
.
Guo, P., & Tanaka, H. (2001). Fuzzy DEA: a perceptual evaluation method. Fuzzy sets and systems, 119(1), 149-160.
Handfield, R. B., & Bechtel, C. (2002). The role of trust and relationship structure in improving supply chain responsiveness. Industrial marketing management, 31(4), 367-382.
Hanman, S. (1997). Benchmarking your firm's performance with best practice. The International Journal of Logistics Management, 8(2), 1-18.
Hiebeler Robert, Kelly Thomas B, Ketteman Charles. Best practices. New York: Simon & Schuster; 1998.
Jia, H. M., Yu, K. C., & Zhang, J. C. (2014). A Study on Performance Evaluation of Green Supply Chain Management Based on DEA. In Advanced Materials Research,1006, pp. 525-529).
Kamakura, W. A., Lenartowicz, T., & Ratchfrord, B. T. (1997). Productivity assessment of multiple retail outlets. Journal of retailing, 72(4), 333-356.
Kamakura, W. A., Ratchford, B. T., & Agrawal, J. (1988). Measuring market efficiency and welfare loss. Journal of Consumer Research, 289-302.
Kelle, P., & Akbulut, A. (2005). The role of ERP tools in supply chain information sharing, cooperation, and cost optimization. International Journal of Production Economics, 93, 41-52.
Lewis, B. R., & Entwistle, T. W. (1990). Managing the service encounter: a focus on the employee. International Journal of Service Industry Management, 1(3), 41-52.
Mahajan, J. (1991). A data envelopment analytic model for assessing the relative efficiency of the selling function. European Journal of Operational Research, 53(2), 189-205.
McLaren, T. S., Head, M. M., & Yuan, Y. (2004). Costs and benefits in supply chain collaboration.
McLaren, T., Head, M., & Yuan, Y. (2002). Supply chain collaboration alternatives: understanding the expected costs and benefits. Internet research, 12(4), 348-364.
Narasimhan, R., & Jayaram, J. (1998). Causal linkages in supply chain management: an exploratory study of North American manufacturing firms. Decision Sciences, 29(3), 579-605.
Poirier, C.C. (1999), Advanced Supply Chain Management, Berret-Koehler, San Francisco, CA.
Polese, W.T. (2002), “Measuring the success of collaboration across the virtual supply chain through performance measurement systems and benchmarking”, paper presented at the Supply Chain World Conference and Exposition, New Orleans, LA, 23 April.
Rai, A., Patnayakuni, R., & Seth, N. (2006). Firm performance impacts of digitally enabled supply chain integration capabilities. MIS quarterly, 225-246.
Aggarwal et.al. Benchmarking Supply Chain Collaboration
.
Rao Tummala, V. M., Phillips, C. L., & Johnson, M. (2006). Assessing supply chain management success factors: a case study. Supply Chain Management: An International Journal, 11(2), 179-192.
Sanders, N. R. (2008). Pattern of information technology use: The impact on buyer–suppler coordination and performance. Journal of Operations Management, 26(3), 349-367.
Seiford, L. M. (1996). Data envelopment analysis: the evolution of the state of the art (1978–1995). Journal of Productivity Analysis, 7(2-3), 99-137.
Seiford, L. M., & Zhu, J. (2002). Modeling undesirable factors in efficiency evaluation. European Journal of Operational Research, 142(1), 16-20.
Shin, H., Collier, D. A., & Wilson, D. D. (2000). Supply management orientation and supplier/buyer performance. Journal of operations management, 18(3), 317-333.
Sigala, M. (2004). Collaborative supply chain management in the airline sector: the role of global distribution systems (GDS). Advances in hospitality and leisure, 1(1), 103-21.
Simatupang, T. M., & Sridharan, R. (2005). The collaboration index: a measure for supply chain collaboration. International Journal of Physical Distribution & Logistics Management, 35(1), 44-62.
Simatupang, T. M., Wright, A. C., & Sridharan, R. (2002). The knowledge of coordination for supply chain integration. Business process management journal, 8(3), pp. 289-308.
Simatupang, T.M., Wright, A.C. and Sridharan,R. (2004). Applying the theory of constraints to supply chain collaboration. Supply Chain Management: An International Journal, 9(1), pp. 57-70.
Singh, A., Narain, R., & Yadav, R. C. (2006). Benchmarking and performance measurement of supply chain management practices: a survey of Indian organizations. International Journal of Services and Operations Management, 2(4), 313-334.
Spendolini, M. J. (1993). How to build a benchmarking team. Journal of Business Strategy, 14(2), 53-57.
Stank, T. P., Keller, S. B., & Daugherty, P. J. (2001). Supply chain collaboration and logistical service performance. Journal of Business logistics, 22(1), pp. 29-48.
Sueyoshi, T., & Wang, D. (2014). Sustainability development for supply chain management in US petroleum industry by DEA environmental assessment. Energy Economics, 46, 360-374.
Swink, M. (1999). Threats to new product manufacturability and the effects of development team integration processes. Journal of Operations Management, 17(6), 691-709.
Tyan, J. C., Wang, F. K., & Du, T. (2003). Applying collaborative transportation management models in global third-party logistics. International Journal of Computer Integrated Manufacturing, 16(4-5), 283-291.

Aggarwal et.al. Benchmarking Supply Chain Collaboration
.
Vereecke, A., & Muylle, S. (2006). Performance improvement through supply chain collaboration in Europe. International journal of operations & production management, 26(11), 1176-1198.
Wathne, K. H., & Heide, J. B. (2004). Relationship governance in a supply chain network. Journal of Marketing, 68(1), 73-89.
Whipple, J. M., & Frankel, R. (2000). Strategic alliance success factors. Journal of Supply Chain Management, 36(3), pp. 21-28.
Whipple, J. M., Frankel, R., & Daugherty, P. J. (2002). Information support for alliances: performance implications” Journal of Business Logistics, 23(2), pp. 67-82.
Wong, W. P., & Wong, K. Y. (2008). A review on benchmarking of supply chain performance measures. Benchmarking: An International Journal, 15(1), 25-51.
Yang, P. C., Wee, H. M., & Yang, H. J. (2007). Global optimal policy for vendor–buyer integrated inventory system within just in time environment. Journal of Global Optimization, 37(4), 505-511.