benchmarks for deeper learning on next ... for deeper learning on next generation tests: a study of...
TRANSCRIPT

JULY 2016 CRESST REPORT 855
BENCHMARKS FOR DEEPER LEARNING ON NEXT GENERATION TESTS: A STUDY OF PISA
Joan L. Herman
Deborah La Torre
Scott Epstein
Jia Wang
Benchmarks for Deeper Learning on Next Generation Tests: A Study of PISA
CRESST Report 855
Joan L. Herman, Deborah La Torre, Scott Epstein, and Jia Wang CRESST/University of California, Los Angeles
July 2016
National Center for Research on Evaluation, Standards, and Student Testing (CRESST) Center for the Study of Evaluation (CSE)
Graduate School of Education & Information Studies University of California, Los Angeles
300 Charles E. Young Drive North GSE&IS Building, Box 951522 Los Angeles, CA 90095-1522
(310) 206-1532

Copyright © 2016 The Regents of the University of California. The work reported herein was supported by grant number 2012-8075 from The William and Flora Hewlett Foundation with funding to the National Center for Research on Evaluation, Standards, and Student Testing (CRESST). The findings and opinions expressed in this report are those of the authors and do not necessarily reflect the positions or policies of The William and Flora Hewlett Foundation. To cite from this report, please use the following as your APA reference: Herman, J. L., La Torre, D., Epstein, S., & Wang, J. (2016). Benchmarks for deeper learning on next generation tests: A study of PISA (CRESST Report 855). Los Angeles: University of California, Los Angeles, National Center for Research on Evaluation, Standards, and Student Testing (CRESST).
iii
TABLE OF CONTENTS
Acknowledgments.......................................................................................................................... iv Abstract ............................................................................................................................................1 Introduction ......................................................................................................................................1
Background on PISA ...................................................................................................................3 Study Methodology ..........................................................................................................................4
DOK Framework and Deeper Learning .......................................................................................5 Review Panel Recruitment ...........................................................................................................5 Review Panel Training .................................................................................................................6 Data Collection and Panel Process ..............................................................................................7 Analysis .......................................................................................................................................9
Study Results .................................................................................................................................11 PISA Reading Literacy Results .................................................................................................11 PISA Mathematics Literacy Results ..........................................................................................17
Comparison to Other Studies .........................................................................................................22 Validity of Findings Relative to RAND Study ..........................................................................22 Comparison of Deeper Learning in PISA and Common Core State Standards .........................24 Comparison to the Representation of Deeper Learning in the New Common Core Aligned Assessments ...............................................................................................................................26
Summary and Conclusions ............................................................................................................27 PISA Reading Literacy Results .................................................................................................27 PISA Mathematics Literacy Results ..........................................................................................28 How PISA’s Attention to Deeper Learning Compares to Expectations for the Common Core State Standards ...........................................................................................................................29 Conclusions ................................................................................................................................29
References ......................................................................................................................................31 Appendix A: Panelist Recruitment ................................................................................................33
Panel Recruitment Letter ...........................................................................................................34 Reading Literacy Study Information Form ................................................................................35 Mathematics Literacy Study Information Form ........................................................................36
Appendix B: Panelist Biographies .................................................................................................37 Reading Literacy Panelists .........................................................................................................38 Mathematics Literacy Panelists .................................................................................................40
Appendix C: Review Panel Training and Data Collection ............................................................43 Reading Depth of Knowledge Framework ................................................................................44 Mathematics Depth of Knowledge Framework .........................................................................45 Reading Literacy Sample Web-Based Coding Form .................................................................46 Rating Session Notebook: Table of Contents ............................................................................48 Reading and Mathematics Literacy Variables ...........................................................................49 Rating Session Agendas .............................................................................................................51
Appendix D: Reading Literacy Analyses ......................................................................................52 Appendix E: Mathematics Literacy Analyses ................................................................................57

iv
Acknowledgments
We wish to acknowledge the many individuals who contributed to this study and made it
possible.
First, we are grateful to those individuals who were instrumental in helping us gain access
to the Programme for International Student Assessment (PISA) Reading Literacy and
Mathematics Literacy tests. We thank Andreas Schleicher, Director for the Directorate of
Education and Skills at the Organisation for Economic Co-operation and Development (OECD),
for his support, and Michael Davidson, then Senior Analyst at OECD, for facilitating our request
to the PISA Governing Board. We also thank our colleagues at the National Center for Education
Statistics (NCES) for endorsing our study and their Governing Board for granting our request.
Colleagues at NCES could not have been more helpful or efficient in arranging our access
to the PISA items and associated materials and in coordinating logistics for our panel meetings.
We would especially like to thank Dana Kelly, Branch Chief, and Patrick Gonzales, a research
analyst at NCES, as well as Anindita Sen, Senior Researcher, and Teresa Kroeger, then a
Research Assistant at the American Institutes for Research (AIR) for their help with these
arrangements.
The study panels included an exceptional group of expert educators and researchers who
brought their deep knowledge of reading and mathematics to the deliberations. We thank them
for their patience in complying with study procedures, for the care that they took in conducting
the panel tasks, and for their insights and wisdom in helping us to complete our study.
Finally, we thank Barbara Chow, Education Director, and Denis Udall, Program Officer at
the William and Flora Hewlett Foundation, for their support of this project and their unwavering
commitment to deeper learning for all children.
1
BENCHMARKS FOR DEEPER LEARNING ON NEXT GENERATION TESTS:
A STUDY OF PISA
Joan L. Herman, Deborah La Torre, Scott Epstein, and Jia Wang CRESST/University of California, Los Angeles
Abstract
This report presents the results of expert panels’ item-by-item analysis of the 2015 PISA Reading Literacy and Mathematics Literacy assessments and compares study findings on PISA’s representation of deeper learning with that of other related studies. Results indicate that about 11% to 14% of PISA’s total raw score value for reading and mathematics literacy respectively are devoted to deeper learning, defined as items addressing depth of knowledge (DOK) Levels 3 or 4, based on Norman Webb’s framework (Webb, Alt, Ely, & Vesperman, 2005). These levels are compared to those in the Common Core State Standards (CCSS) and in recent tests of the CCSS. Study results suggest the complexity of establishing deeper learning benchmarks.
Introduction
College and career ready standards have been adopted by states across the country.
Common Core State Standards (CCSS) or not, these standards reflect a general consensus that to
be prepared for success in college and work, students need to master core academic content and
to be able to use their knowledge and skills to think critically, communicate effectively, and
solve complex, real-life problems (National Research Council, 2012; William and Flora Hewlett
Foundation, n.d.). In both English language arts (ELA) and mathematics, students need to be
engaged by the content and they need to attain deeper learning.
These college and career ready expectations carry with them the need for not only new
pedagogies to support student success, but also new assessments of student learning that can
provide valid measures of, and motivation for, student success in the standards. Ample research,
for example, demonstrates the powerful signal that accountability tests send to schools about
what the standards mean as well as what, and how, students should be taught (Hamilton, Stecher
& Yuan, 2008; Herman, 2010). In response to pressure to improve test scores, schools tend to
align their curriculum to focus on what is tested: What is tested is what is taught, and added
attention is paid to where test scores show weaknesses. Further, teachers not only tend to teach
what is tested, but how it is tested: Test formats and demands serve as the model for instruction.
As a result, new assessments of college and career ready standards will play an important role in
how these standards are implemented. To play a productive role, the tests must reflect both the
content and deeper learning goals of the standards.
2
However, what does it mean for tests to reflect deeper learning? Historically, state
accountability tests have focused predominantly on low-level learning and have given scant, if
any, attention to students’ ability to apply, synthesize, communicate, and use their knowledge to
solve complex problems (Webb, 2002a; Yuan & Le, 2012). Clearly, if new exams of college and
career readiness are to send a strong signal about the importance of deeper learning and
encourage its teaching, they must give more attention to higher levels of thinking and problem
solving. There currently is no established benchmark to evaluate the cognitive rigor of new tests
and to hold them accountable for the assessment of deeper learning. Assessment experts have
offered opinions on what such benchmarks should be, ranging from one third to half of the test.
For example, based on existing state and other expert analyses of DOK in the CCSS and that
estimated in nationally prominent assessments, Herman and Linn (2013) recommended that for
ELA, 50% of the total score value should reflect deeper learning, while in mathematics, 30% of
total score value should be at this level.
Funded by the William and Flora Hewlett Foundation, the following study provides one
source of evidence to help establish a benchmark. The study examines the depth of knowledge
evident in the Programme for International Student Assessment (PISA), the highly regarded
international assessment of reading and mathematics literacy used for cross-country
comparisons. PISA serves as a focal point because of its high visibility internationally and its
reputed attention to students’ problem solving and ability to apply their knowledge in everyday
situations.
The study examines two PISA assessments fielded in 2015, Reading Literacy and
Mathematics Literacy, and addresses the following questions:
1. To what extent does PISA assess deeper learning in reading literacy and mathematics literacy?
2. How does PISA’s attention to deeper learning compare with that reflected in the CCSS and projected for the new CCSS-aligned year-end tests developed by ACT Aspire, the Partnership for Assessment of Readiness for College and Careers (PARCC), and the Smarter Balanced Assessment Consortium (Smarter Balanced)?
3. What are study implications for establishing benchmarks for deeper learning?
We start by providing background information on PISA and our study methodology. We
then present separate results for the Reading Literacy and Mathematics Literacy assessments. We
also compare these results with those from other related studies. Finally, we present our
conclusions and suggest implications for establishing benchmarks for deeper learning.

3
Background on PISA
PISA is conducted every three years to evaluate and compare educational systems across
the world in the core topics of reading, mathematics, and science in addition to optional,
additional select topics that vary across administration years. Rather than a direct test of school
curriculum at a particular grade, PISA targets 15-year-old students’ ability to apply their
knowledge to real-life issues and to participate in society (OECD, 2013a). This age is the focus
for PISA since it is when compulsory school attendance ends in many countries.
PISA is administered to students in randomly sampled schools in each country, carefully
selected to represent demographically each country’s full population of 15-year-olds (OECD,
2013a). An internationally developed content framework guides the development of each
assessment. The frameworks organize each content domain to be assessed relative to key
dimensions that define the content and how it will be assessed, while assuring broad coverage of
the subject. The framework also specifies both the total number of items that will comprise each
assessment and how the items are to be distributed across dimensions. The framework, as the
following elucidates, has been uniquely developed to serve PISA and does not, nor is it intended
to, reflect college and career ready standards.
PISA defines reading literacy as “understanding, using, reflecting on and engaging with
written texts, in order to achieve one’s goals, to develop one’s knowledge and potential, and to
participate in society” (OECD, 2013c, p. 9). Three major dimensions are used to organize the
reading literacy domain:
Situation: The range of broad contexts or purposes for which reading takes place, which includes (1) personal, (2) public, (3) occupational, and (4) educational contexts.
Text: The range of material that is read, which includes (1) text display space (whether fixed or dynamic text—all in the current assessment is fixed, static text); (2) text format (whether continuous or non-continuous text and whether it involves multiple texts or a single text that includes multiple kinds of objects); and (3) text type (whether text involves description, narration, exposition, argumentation, instruction, or transaction).
Aspect: Cognitive engagement with a text, which includes (1) access and retrieve (specific information from the text), (2) integrate and interpret (form an understanding from relationships within the text or texts), and (3) reflect and evaluate (require readers to relate knowledge outside the text to what they are reading).
PISA defines students’ mathematical literacy as “an individual’s capacity to formulate,
employ, and interpret mathematics in a variety of contexts. It includes reasoning mathematically
and using mathematical concepts, procedures, facts and tools to describe, explain and predict
phenomena. It assists individuals to recognize the role that mathematics plays in the world and to
make the well-founded judgments and decisions needed by constructive, engaged and reflective

4
citizens” (OECD, 2013b, p. 5). The framework uses three dimensions to define the domain for
assessment:
Mathematical process and capabilities: These enable students to “connect the context of the problem with mathematics and thus solve the problem” (OECD, 2013b, p. 9), which includes (1) formulating situations mathematically; (2) employing mathematical concepts, facts, procedures, and reasoning; (3) interpreting, applying, and evaluating mathematical outcomes; and (4) fundamental underlying capabilities including communication, mathematizing, representation, reasoning and argument, using symbolic, formal, and technical language and operations, and using mathematical tools.
Mathematical content knowledge: This is categorized as (1) change and relationships, (2) space and shape, (3) quantity, and (4) uncertainty and data.
Problem contexts: These contexts include (1) personal, (2) occupational, (3) societal, and (4) scientific.
The 2015 PISA Reading Literacy and Mathematics Literacy assessments are composed of
92 and 70 items respectively. Both tests are computer administered and use multiple choice and
open response item types. Matrix sampling is used in administering the tests, such that the full
set of items is systematically distributed across a number of test forms, with each student taking
only one, two-hour form. Responses are aggregated across students to provide country-level
estimates of performance. More than 500,000 students in 65 economies1 participated in the 2012
PISA assessment and more than 70 economies were scheduled to take the 2015 assessment (For
more information, see http://www.oecd.org/pisa/aboutpisa/).2
Study Methodology
The study used Norman Webb’s DOK framework (Webb, Alt, Ely, & Vesperman, 2005) to
examine the representation of deeper learning in PISA. Past and present state tests have used this
metric, so study results can be used to examine if and how they compare to one another and with
PISA.
Expert panels of high school teachers, curriculum specialists, and other subject matter and
learning experts were convened to conduct an item-level review of each PISA assessment, as the
following describes.
1 PISA uses the term “economy” to denote the locales that participate in the assessment. In general, these are countries, but there are smaller locales that also participate. For example, China, Hong Kong, Macao, and Shanghai participate as separate economies. 2 In the United States, data collection took place during October and November of 2015.

5
DOK Framework and Deeper Learning
Webb’s framework (Webb et al., 2005) defines four levels to characterize the DOK and
thinking that students are required to apply to respond correctly to an item and/or to attain full
credit for the response:
DOK1: Recall of a fact, term, concept, or procedure: basic comprehension
DOK2: Application of concepts and/or procedures involving some mental processing
DOK3: Applications requiring abstract thinking, reasoning, and/or more complex inferences
DOK4: Extended analysis or investigation that requires synthesis and analysis across multiple contexts and nonroutine problems and applications
We have argued elsewhere that DOK3 and DOK4 represent important aspects of deeper
learning, because to answer items or tasks at these levels students have to apply and synthesize
their knowledge and engage in critical thinking and reasoning (Herman & Linn, 2013). Further,
both levels have been grossly underrepresented in most prior state tests. For example, RAND’s
analysis of the DOK assessed in released items from the 17 states reputed to have the most
challenging state assessments, showed that virtually all of the multiple choice and open response
items in mathematics were categorized as DOK1 or DOK2, with similar results for the multiple
choice items of reading and writing (Yuan & Le, 2012). The situation was better for states with
open response items: more than half the open response reading tasks were at or above DOK3.
The eight states that directly assessed writing had open response writing prompts that were
nearly uniformly classified at DOK3 or DOK4.
Review Panel Recruitment
Expert panelists were recommended and recruited through trusted colleagues and respected
organizations known for their expertise in the CCSS in ELA or mathematics (e.g., Student
Achievement Partners, Curtis Mathematics Center, UCLA’s Center X, and America Achieves).
We solicited nominations of individuals who had prior experience teaching high school ELA
and/or mathematics, were highly knowledgeable about the CCSS in one or both content areas,
had prior experience in test development and/or alignment studies, and/or had work experience
with special populations. Furthermore, all applicants were asked to complete a questionnaire
regarding their background and experiences in each of these areas, as well as indicating any
additional teaching experience and their current work positions (see Appendix A).
The final panelists were selected to assure that all members had strong qualifications and
each panel included members who had experiences across educational settings (e.g., high school
educators, district specialists, university researchers and professors) and were geographically

6
distributed. The names and affiliations of all panelists can be found in Figure 1, while individual
biographies can be found in Appendix B.
Reading literacy Mathematics literacy
Katherine Allebach Franz, M.A.Ed., Minneapolis Public Schools
Katrina Boone, M.A.T., Shelby County High School
Mark Conley, Ph.D., University of Memphis
Linda Friedrich, Ph.D., National Writing Project
P. David Pearson, Ph.D., University of California, Berkeley
Martha Thurlow, Ph.D., NCEO/University of Minnesota
Sheila Valencia, Ph.D., University of Washington
Karen Wixson, Ph.D., University of North Carolina at Greensboro
Christopher Affie, M.A., The Gilbert School
Patrick Callahan, Ph.D., California Mathematics Project
Phil Daro, B.A., University of California, Berkeley
Wally Etterbeek, Ph.D., California State University, Sacramento
David Foster, B.A., Silicon Valley Mathematics Initiative
Curtis Lewis, Ph.D., Henry Ford Academy: School for Creative Studies (Middle and High School)
Barbara Schallau, M.A., East Side Union High School District
Guillermo Solano-Flores, Ph.D., University of Colorado Boulder
Figure 1. Reading and mathematics literacy panelists.
Review Panel Training
Synchronous and asynchronous trainings were conducted for the reading and mathematics
panels during the month prior to the rating sessions. Panelists were provided with orientation
materials concerning the logistics for the study, publicly released drafts of the PISA frameworks
and associated documentation, and depth of knowledge frameworks.
Webinars. Webinar trainings were conducted with each panel to ensure that all
participants had an understanding of the study purpose and procedures, the PISA test structure,
and the content-specific applications of DOK for mathematics and reading (see Webb, 2002b).
As part of the process of familiarizing panelists with the content-specific frameworks (see
Appendix C), the webinars provided an initial opportunity for panelists to apply and discuss their
ratings of items from the Web Alignment Tool (WAT) Training Tutorial developed by the
Wisconsin Center of Education Research (see http://wat.wceruw.org/tutorial/index.aspx).
Practice ratings. To begin establishing interrater reliability and to identify the need for
additional training, during the period between the webinars and the on-site rating sessions, all
panelists were asked to rate released items from prior PISA administrations. These ratings were
completed online using Qualtrics web forms similar to those used for the formal rating sessions
(see Appendix C). The reading web form included 21 items spanning four units, while the

7
mathematics web form included 13 items spanning six units.3 Each web form included categories
for panelists to rate item DOK, the primary CCSS domain, construct-irrelevant obstacles, and
any notes they might have concerning these obstacles. The reading web form also included a
category to rate text complexity at the item level and the mathematics web form also included a
category to indicate evidence of a primary mathematical practice.4
Data Collection and Panel Process
Rating sessions for the reading and mathematics panels were conducted separately for two
days each at an American Institutes for Research (AIR) facility in Washington, DC, where the
PISA measures are securely held. Two members of the CRESST research team who have
expertise in Webb’s DOK framework facilitated the rating sessions. In order to ensure
confidentiality, staff from AIR also supervised these sessions and panelists were required to
provide notarized affidavits of nondisclosure prior to being given electronic access to the test
items as well as notebooks containing further documentation. Each notebook included
supplemental materials (i.e., a statement of confidentiality concerning secure items, instructions
for assessing the electronic items, item classifications by framework characteristics, and item
allocations by cluster), hard copies of the assessment items, and coding guides and answer keys
for all human-scored items (see Appendix C for the Table of Contents).
Session structure and procedures. Each on-site panel meeting began with introductions, a
review of the study purpose, and an overview of the session agenda (see Appendix C). Once this
was completed, results from the practice ratings were discussed and further training was
conducted on the content-specific DOK framework for the session. Because of the results of the
practice ratings, particular attention was paid during this follow-up training to helping panelists
differentiate reliably between DOK2 and DOK3 as well as between DOK3 and DOK4.
Once re-training was complete, panelists were oriented to the test software and the
materials in their notebooks, and were given a review of the Qualtrics web form and procedures
for coding. As with the practice ratings, all panelists were asked to rate the following at the item
level: DOK, CCSS domain, construct-irrelevant obstacles, and in the case of mathematics, the
primary CCSS practice. Reading panelists also coded the text complexity of each reading stimuli
3 The computer-based PISA test forms are each constructed to include four clusters of items spanning the major subject area for that testing cycle (e.g., science in 2015) as well as one or more of the other content areas. Items within each cluster are then organized into units that each contain a common theme and text or stimulus, depending upon the content area. For the 2015 test cycle in the United States, the reading sub-measure included 92 items spanning 23 units and 6 clusters and the mathematics sub-measure included 70 items spanning 40 units and 6 clusters. 4 After practice coding, it was decided to rate the text complexity of each stimuli for reading literacy. The ordering of the categories in the web form was also updated to improve functionality.

8
(see Appendix C for details of all variables coded by panelists). The subsequent panel time was
organized into six rating sessions, each corresponding to the rating of one cluster of items. For
each of these sessions, panelists first individually rated all items within an assigned cluster.
Following individual ratings, panelists’ ratings of each item were shared and their rationales for
the ratings discussed, facilitated by one or both members of the research team. Subsequent to the
discussion of each item, panelists had the opportunity to revise their ratings if their perspective
had changed based on the discussion.
The whole panel rated and discussed Cluster 01 in the first rating session. For the
remaining sessions, participants were organized into two sub-panels of four each to balance the
sequence of review of the various clusters and to facilitate more extensive discussion (see Table
1). These subsequent sessions were structured so that Group A reviewed items in order from
Cluster 02, while Group B worked in the opposite order beginning with Cluster 06. The sub-
panels were composed to ensure a balance of individuals with classroom content teaching
experience, expert knowledge in the CCSS, and experience with test development or alignment.
A second round of consensus making was then conducted with the whole group for Clusters 02
through 06 on the second afternoon (see Appendix C for the session agendas).
Members of the CRESST research team also recorded other variables of interest for the
analysis. These included an examination of the reading units to determine text type, as well as
information from the notebooks concerning representing reading and mathematics framework
categories, including content aspect/process, item format, score type, and score points (see
Appendix C for details of these variables).
9
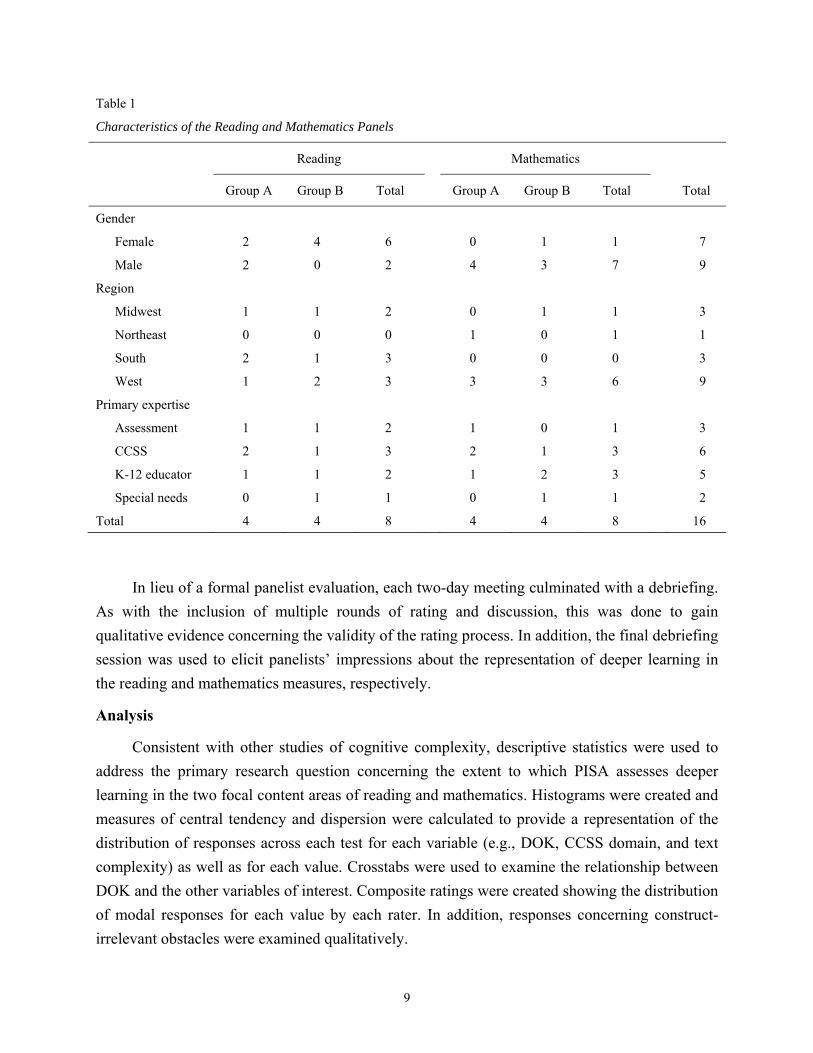
Table 1
Characteristics of the Reading and Mathematics Panels
Reading Mathematics
Group A Group B Total Group A Group B Total Total
Gender
Female 2 4 6 0 1 1 7
Male 2 0 2 4 3 7 9
Region
Midwest 1 1 2 0 1 1 3
Northeast 0 0 0 1 0 1 1
South 2 1 3 0 0 0 3
West 1 2 3 3 3 6 9
Primary expertise
Assessment 1 1 2 1 0 1 3
CCSS 2 1 3 2 1 3 6
K-12 educator 1 1 2 1 2 3 5
Special needs 0 1 1 0 1 1 2
Total 4 4 8 4 4 8 16
In lieu of a formal panelist evaluation, each two-day meeting culminated with a debriefing.
As with the inclusion of multiple rounds of rating and discussion, this was done to gain
qualitative evidence concerning the validity of the rating process. In addition, the final debriefing
session was used to elicit panelists’ impressions about the representation of deeper learning in
the reading and mathematics measures, respectively.
Analysis
Consistent with other studies of cognitive complexity, descriptive statistics were used to
address the primary research question concerning the extent to which PISA assesses deeper
learning in the two focal content areas of reading and mathematics. Histograms were created and
measures of central tendency and dispersion were calculated to provide a representation of the
distribution of responses across each test for each variable (e.g., DOK, CCSS domain, and text
complexity) as well as for each value. Crosstabs were used to examine the relationship between
DOK and the other variables of interest. Composite ratings were created showing the distribution
of modal responses for each value by each rater. In addition, responses concerning construct-
irrelevant obstacles were examined qualitatively.

10
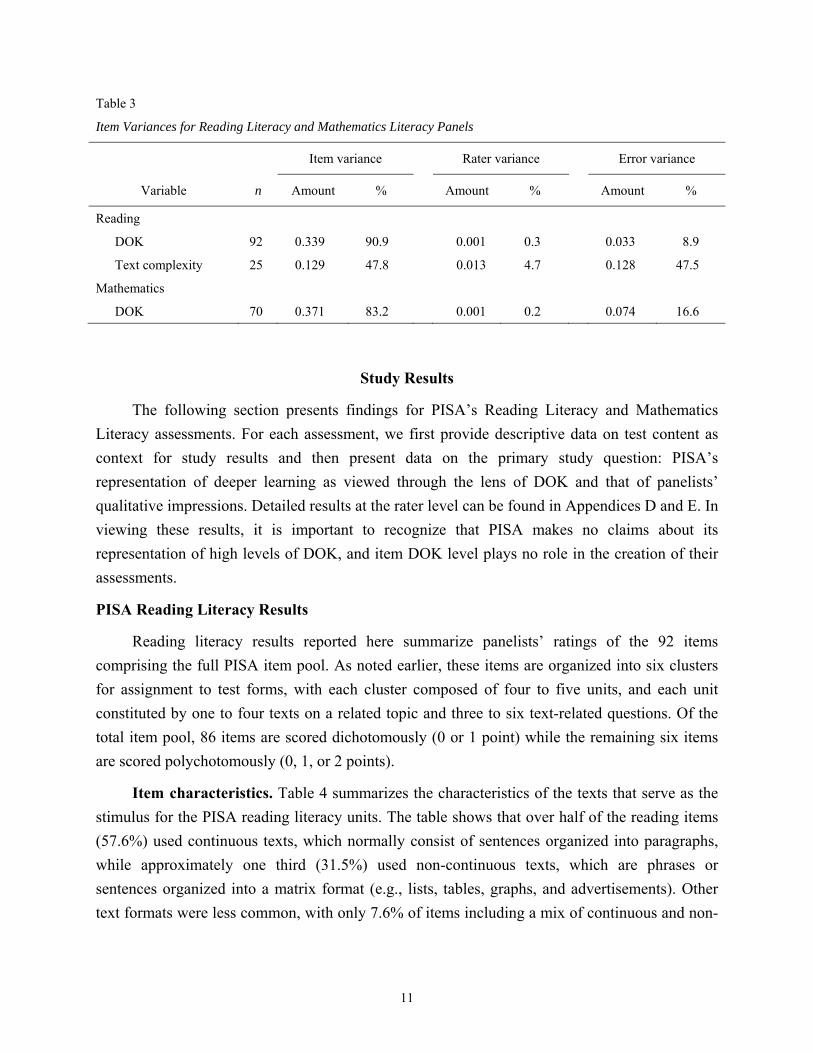
Reliability. Interrater reliability was assessed by examining the distribution of ratings (i.e.,
units) across raters and by computing intraclass correlations (ICCs) for ordinal data and kappa
(K) correlations for nominal data (see Table 2). As would be expected based on the process of
using multiple rounds of discussion for the rating of DOK, overall reliability was extremely high
for both reading and mathematics. When examining the distribution of units across raters,
consensus was reached for DOK for the vast majority of reading items (84.8%) and for two
thirds of the mathematics items (67.1%). In addition, the ICC for DOK was very high when
averaged across raters (Reading = .99, Mathematics = .98). Furthermore, reliability was
generally high for text complexity with a mean agreement level of 83.5% and an ICC of .89. It
should also be noted that while variance was primarily at the item level for the reading and
mathematics ratings of DOK, ratings of text complexity varied substantially from rater to rater
(see Table 3). Even so, a majority of panelists (five or more) agreed on the modal rating for each
text.
Table 2
Indices of Reliability Across Reading Literacy and Mathematics Literacy Panels
# of
options Mean % agreement
across items % items with
perfect agreement Mean K across
rater pairs Mean
rater ICC
Reading
CCSS domain 3 85.6 47.8 .32 --
DOK 4 95.9 84.8 -- .99
Text complexity 3 83.5 24.0 -- .89
Mathematics
CCSS domain 6 67.3 8.6 .39 --
DOK 4 90.9 67.1 -- .98
CCSS mathematical practice 2 77.7 11.4 .33 --
Note. Since “Range of reading and level of text complexity” received no ratings, only three reading domains were included in the reliability analyses.
11
Table 3
Item Variances for Reading Literacy and Mathematics Literacy Panels
Item variance Rater variance Error variance
Variable n Amount % Amount % Amount %
Reading
DOK 92 0.339 90.9 0.001 0.3 0.033 8.9
Text complexity 25 0.129 47.8 0.013 4.7 0.128 47.5
Mathematics
DOK 70 0.371 83.2 0.001 0.2 0.074 16.6
Study Results
The following section presents findings for PISA’s Reading Literacy and Mathematics
Literacy assessments. For each assessment, we first provide descriptive data on test content as
context for study results and then present data on the primary study question: PISA’s
representation of deeper learning as viewed through the lens of DOK and that of panelists’
qualitative impressions. Detailed results at the rater level can be found in Appendices D and E. In
viewing these results, it is important to recognize that PISA makes no claims about its
representation of high levels of DOK, and item DOK level plays no role in the creation of their
assessments.
PISA Reading Literacy Results
Reading literacy results reported here summarize panelists’ ratings of the 92 items
comprising the full PISA item pool. As noted earlier, these items are organized into six clusters
for assignment to test forms, with each cluster composed of four to five units, and each unit
constituted by one to four texts on a related topic and three to six text-related questions. Of the
total item pool, 86 items are scored dichotomously (0 or 1 point) while the remaining six items
are scored polychotomously (0, 1, or 2 points).
Item characteristics. Table 4 summarizes the characteristics of the texts that serve as the
stimulus for the PISA reading literacy units. The table shows that over half of the reading items
(57.6%) used continuous texts, which normally consist of sentences organized into paragraphs,
while approximately one third (31.5%) used non-continuous texts, which are phrases or
sentences organized into a matrix format (e.g., lists, tables, graphs, and advertisements). Other
text formats were less common, with only 7.6% of items including a mix of continuous and non-
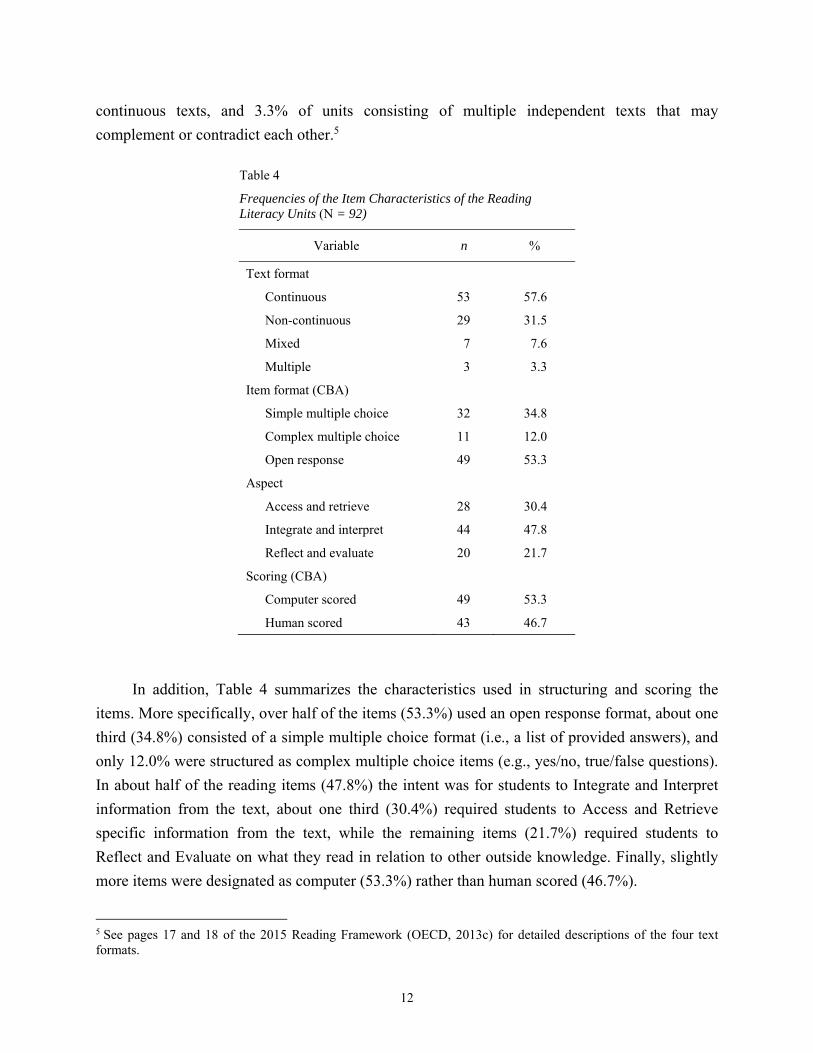
12
continuous texts, and 3.3% of units consisting of multiple independent texts that may
complement or contradict each other.5
Table 4
Frequencies of the Item Characteristics of the Reading Literacy Units (N = 92)
Variable n %
Text format
Continuous 53 57.6
Non-continuous 29 31.5
Mixed 7 7.6
Multiple 3 3.3
Item format (CBA)
Simple multiple choice 32 34.8
Complex multiple choice 11 12.0
Open response 49 53.3
Aspect
Access and retrieve 28 30.4
Integrate and interpret 44 47.8
Reflect and evaluate 20 21.7
Scoring (CBA)
Computer scored 49 53.3
Human scored 43 46.7
In addition, Table 4 summarizes the characteristics used in structuring and scoring the
items. More specifically, over half of the items (53.3%) used an open response format, about one
third (34.8%) consisted of a simple multiple choice format (i.e., a list of provided answers), and
only 12.0% were structured as complex multiple choice items (e.g., yes/no, true/false questions).
In about half of the reading items (47.8%) the intent was for students to Integrate and Interpret
information from the text, about one third (30.4%) required students to Access and Retrieve
specific information from the text, while the remaining items (21.7%) required students to
Reflect and Evaluate on what they read in relation to other outside knowledge. Finally, slightly
more items were designated as computer (53.3%) rather than human scored (46.7%).
5 See pages 17 and 18 of the 2015 Reading Framework (OECD, 2013c) for detailed descriptions of the four text formats.

13
Mean average text complexity was 1.95 (SD = 0.38), indicating that texts were at a grade
level appropriate for 15-year-olds (e.g., approximately ninth grade). Examining panelists’ modal
ratings for each item, more than three quarters (76.0%) of the units consisted of texts rated as
being at grade level, while only five units had texts (20.0%) rated as below and one unit (4.0%)
had texts rated as above grade level (see Figure 2).
0%
10%
20%
30%
40%
50%
60%
70%
80%
Below grade level(n = 5)
At grade level(n = 19)
Above grade level(n = 1)
Figure 2. Modal text complexity ratings for the reading literacy stimuli (N = 25).
CCSS reading domains addressed. Although we did not expect PISA to be aligned with
the CCSS, the research team did ask panelists to evaluate the reading domain each item
principally addressed to provide a general sense of PISA test content. As the data in Figure 3
show, the vast majority of reading items (89.1%) were characterized as addressing the first
reading domain, Key Ideas and Details, which is to be expected given PISA’s focus on students’
ability to use their reading in real-life applications. Based on panelists’ ratings, Craft and
Structure was the focus of seven items (7.6%), and Integration of Knowledge and Ideas the focus
of three items (3.3%). No items were rated as principally addressing the Range of Reading and
Level of Text Complexity domain.

14
0.00%
10.00%
20.00%
30.00%
40.00%
50.00%
60.00%
70.00%
80.00%
90.00%
100.00%
Key Ideas and Details(n = 82)
Craft and Structure(n = 7)
Integration ofKnowledgeand Ideas(n = 3)
Range of Reading andLevel of TextComplexity
(n = 0)
Figure 3. CCSS domains assessed for the reading literacy items (N = 92).
Construct-irrelevant obstacles. PISA reading literacy items were rated as generally free
from construct-irrelevant obstacles (73.9%) that might impede students’ understanding of the
questions being asked or their ability to demonstrate their competencies. Only one of the items
was identified as problematic by a majority of raters (n = 6) and for only six items (6.5%) did
two or more raters note potential problems. These tended to focus on the clarity of the question
posed in the item and/or concerns about whether an item was text-based or could be answered
based only on background knowledge.
Depth of knowledge. Frequency and descriptive data were calculated on panelists’ modal
DOK ratings across all reading literacy items. Based on all indicators, the results indicate a
modest level of cognitive demand on the test, with a mean DOK level across all items of 1.75
(SD = 0.59), and DOK2 representing both the median and mode.
The distribution of ratings, as shown in Figure 4, confirms a preponderance of items at
DOK2 (57.6%). About one third of the items (33.7%) were rated as DOK1, only eight (8.7%)
achieved a modal rating at DOK3, while none of the items were rated at DOK4. Based on the
study definitions of what DOK levels reflect deeper learning, less than one tenth of the PISA
reading literacy items meet this standard.

15
0.00%
10.00%
20.00%
30.00%
40.00%
50.00%
60.00%
70.00%
DOK1(n = 31)
DOK2(n = 53)
DOK3(n = 8)
DOK4(n = 0)
Figure 4. Percentage of reading literacy items at each DOK level (N = 92).
Because the scoring rubrics indicate that some items have higher values than others do—
that is, some items are worth two points rather than one—simply examining the proportion of
items at each level may not adequately describe the weighting given higher level DOK in PISA
scores.6 We intuitively expected there to be a relationship between score type and DOK, with
human-scored items eliciting higher levels of DOK than those that are automatically scored by
computer. We also expected higher levels of DOK being accorded more score points than those
at lower levels.
To explore these hypotheses we investigated possible relationships between score type
(computer versus human scored, a proxy for open response items), score value, and DOK. As
shown in Table 5, results show that all of the computer-scored items were rated as DOK1 or
DOK2, with the majority at the latter (67.3%). A roughly similar proportion of human-scored
items addressed DOK1, but the remaining were split between DOK2 and DOK3, with DOK3
accounting for 18.6% of the human-scored items.
Delving more deeply into the relationship between DOK level, open response items, and
item score points, this table also shows the relationship between score value and DOK level. The
vast majority of human-scored items worth one point were rated at DOK1 or DOK2, with only
five of the one-point items rated at DOK3. In contrast, the relatively few two-point items were all 6 Although items may vary in their score values, the IRT scaling procedures used with PISA weight each item equally (OECD, personal communication, April 5, 2016). Nonetheless, the number of score points associated with an item often provides one indicator of its relative importance.
16
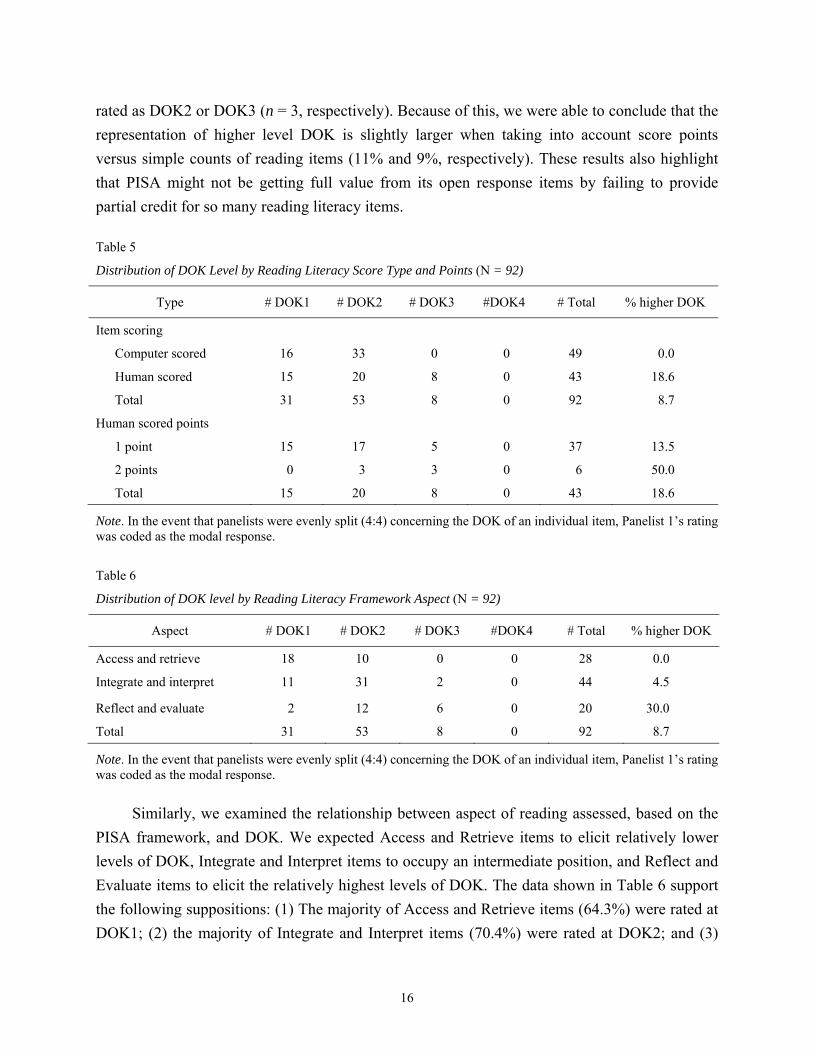
rated as DOK2 or DOK3 (n = 3, respectively). Because of this, we were able to conclude that the
representation of higher level DOK is slightly larger when taking into account score points
versus simple counts of reading items (11% and 9%, respectively). These results also highlight
that PISA might not be getting full value from its open response items by failing to provide
partial credit for so many reading literacy items.
Table 5
Distribution of DOK Level by Reading Literacy Score Type and Points (N = 92)
Type # DOK1 # DOK2 # DOK3 #DOK4 # Total % higher DOK
Item scoring
Computer scored 16 33 0 0 49 0.0
Human scored 15 20 8 0 43 18.6
Total 31 53 8 0 92 8.7
Human scored points
1 point 15 17 5 0 37 13.5
2 points 0 3 3 0 6 50.0
Total 15 20 8 0 43 18.6
Note. In the event that panelists were evenly split (4:4) concerning the DOK of an individual item, Panelist 1’s rating was coded as the modal response.
Table 6
Distribution of DOK level by Reading Literacy Framework Aspect (N = 92)
Aspect # DOK1 # DOK2 # DOK3 #DOK4 # Total % higher DOK
Access and retrieve 18 10 0 0 28 0.0
Integrate and interpret 11 31 2 0 44 4.5
Reflect and evaluate 2 12 6 0 20 30.0
Total 31 53 8 0 92 8.7
Note. In the event that panelists were evenly split (4:4) concerning the DOK of an individual item, Panelist 1’s rating was coded as the modal response.
Similarly, we examined the relationship between aspect of reading assessed, based on the
PISA framework, and DOK. We expected Access and Retrieve items to elicit relatively lower
levels of DOK, Integrate and Interpret items to occupy an intermediate position, and Reflect and
Evaluate items to elicit the relatively highest levels of DOK. The data shown in Table 6 support
the following suppositions: (1) The majority of Access and Retrieve items (64.3%) were rated at
DOK1; (2) the majority of Integrate and Interpret items (70.4%) were rated at DOK2; and (3)

17
while the majority of Reflect and Evaluate items (60.0%) also were rated at DOK2, they were
less likely than the Integrate and Interpret items to be rated DOK1 (10.0% and 25.0%) and more
likely to garner DOK3 (30.0% and 4.5%).
General observations. During the debriefings, panelists were asked to reflect on their
ratings and to discuss the session protocols. Some of the more salient issues voiced by panelists
included the following: (1) Panelists noted struggling more in differentiating between DOK1 and
DOK2 than with higher levels. They noted a number of items where the correct answer was a
paraphrase of information explicitly mentioned in the text. In these cases, they struggled to
differentiate whether items required a literal restating of a detail from the text or actually
required students to make an inference across words, sentences, or paragraphs. In the end,
panelists agreed that the distinction was a matter of professional judgment. (2) Another issue was
how to classify an item that could potentially elicit a higher level DOK3 or DOK4 response, but
the scoring rubric only required a DOK2 response for full credit. Panelists agreed that the
expectations set forth in the rubric should govern the DOK rating. Although this decision
partially led to a preponderance of DOK2 ratings, panelists noted that with slight changes in the
rubrics, a number of items could have been moved to a DOK3. (3) Finally, panelists noted a
surprising number of items that they felt were not text dependent. That is, students did not need
to read or draw evidence from the text to get the answer correct, but could depend upon their
prior knowledge. Panelists suggested that the PISA reading literacy items should give more
attention to citing text and should take fuller advantage of cross-text comparisons.
PISA Mathematics Literacy Results
The 70 total items in PISA’s Mathematics Literacy assessment are organized into six
clusters, with each composed of five to nine units. Each unit presents a scenario that serves as the
stimulus for one to four items.
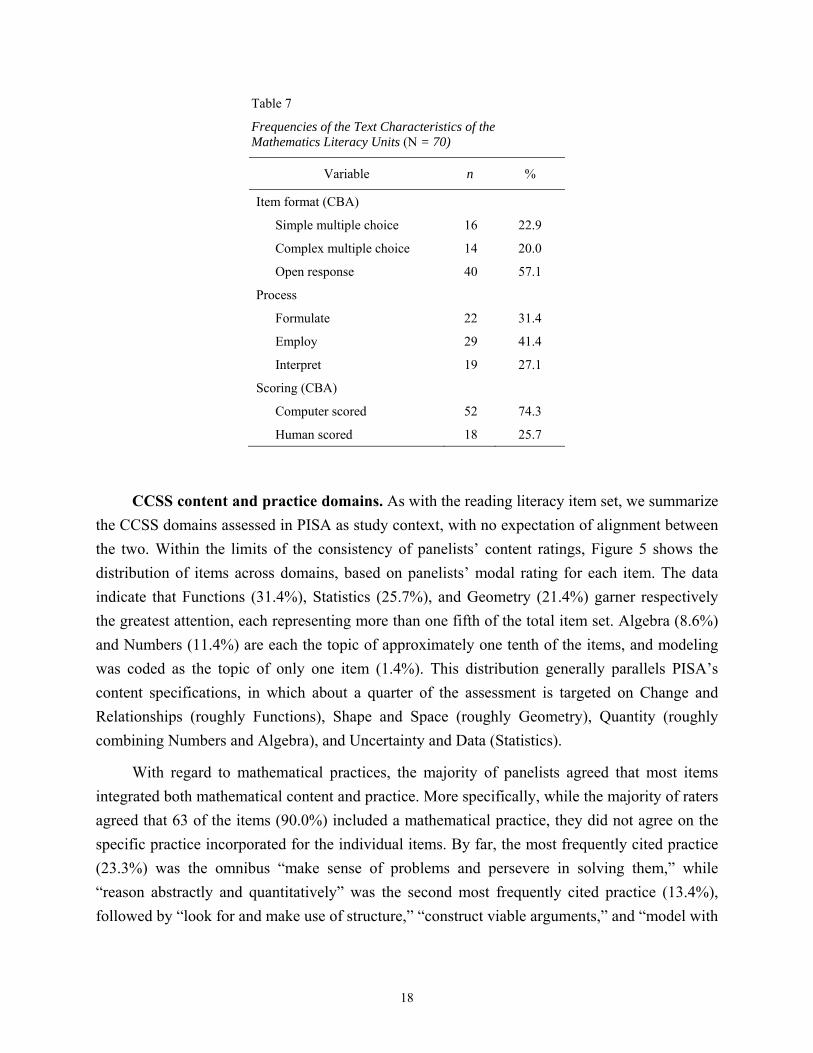
Item characteristics. As shown in Table 7, of the total mathematics items, the majority
(57.1%) used an open response format and one quarter (25.7%) required human scoring. The
remaining items used either a simple (22.9%) or a complex (20.0%) multiple choice format: both
of which were automatically computer scored. When examining the cognitive processes focused
on in the PISA framework, the most common item type involves employing mathematical
concepts (41.4%), with the remaining items fairly evenly distributed between the processes of
formulating situations mathematically (31.4%) and interpreting outcomes (27.1%).
18
Table 7
Frequencies of the Text Characteristics of the Mathematics Literacy Units (N = 70)
Variable n %
Item format (CBA)
Simple multiple choice 16 22.9
Complex multiple choice 14 20.0
Open response 40 57.1
Process
Formulate 22 31.4
Employ 29 41.4
Interpret 19 27.1
Scoring (CBA)
Computer scored 52 74.3
Human scored 18 25.7
CCSS content and practice domains. As with the reading literacy item set, we summarize
the CCSS domains assessed in PISA as study context, with no expectation of alignment between
the two. Within the limits of the consistency of panelists’ content ratings, Figure 5 shows the
distribution of items across domains, based on panelists’ modal rating for each item. The data
indicate that Functions (31.4%), Statistics (25.7%), and Geometry (21.4%) garner respectively
the greatest attention, each representing more than one fifth of the total item set. Algebra (8.6%)
and Numbers (11.4%) are each the topic of approximately one tenth of the items, and modeling
was coded as the topic of only one item (1.4%). This distribution generally parallels PISA’s
content specifications, in which about a quarter of the assessment is targeted on Change and
Relationships (roughly Functions), Shape and Space (roughly Geometry), Quantity (roughly
combining Numbers and Algebra), and Uncertainty and Data (Statistics).
With regard to mathematical practices, the majority of panelists agreed that most items
integrated both mathematical content and practice. More specifically, while the majority of raters
agreed that 63 of the items (90.0%) included a mathematical practice, they did not agree on the
specific practice incorporated for the individual items. By far, the most frequently cited practice
(23.3%) was the omnibus “make sense of problems and persevere in solving them,” while
“reason abstractly and quantitatively” was the second most frequently cited practice (13.4%),
followed by “look for and make use of structure,” “construct viable arguments,” and “model with

19
mathematics” (8.1%, 7.7%, and 7.5%). Other practices were each observed among less than 5%
of the items.
Figure 5. CCSS domains assessed for the mathematics literacy items (N = 70).
Construct-irrelevant obstacles. As with reading literacy, the mathematics literacy items
were generally rated as free from construct-irrelevant characteristics that would impede students’
ability to show what they know (n = 54, 77.1%). While individual raters noted scattered potential
problems across the remaining item set, only one item (1.4%) had three panelists note a potential
problem and this related to the quality of the visual (i.e., the alignment of axis labels). Only six
other items (8.6%) had two panelists note a problem and nine items (12.9%) had one panelist
note a potential problem.
Depth of knowledge. Frequency and descriptive data were calculated on panelists’ modal
DOK ratings across all 70 mathematics literacy items. The data indicate a mean DOK level of
1.80 (SD = 0.62) over the entire item set, with a range of DOK1 to DOK3 and ratings of DOK2
representing both the median and mode.
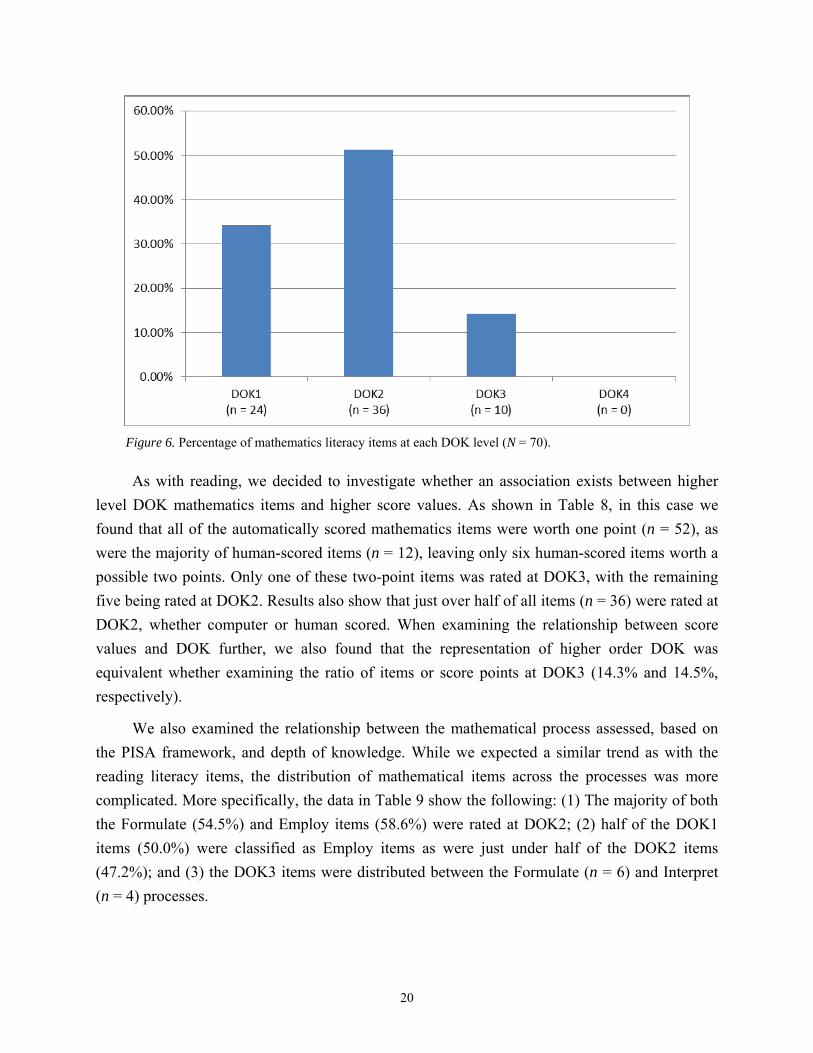
The frequency distributions shown in Figure 6 indicate that more than half (51.4%) of the
items were rated at DOK2, approximately one third at DOK1 (34.2%), and only 14.3% achieved
a modal response of DOK3. Furthermore, no items achieved DOK4. Based on the definition used
for this study, this would mean that less than one fifth of all mathematics literacy items
represented deeper learning.
20
Figure 6. Percentage of mathematics literacy items at each DOK level (N = 70).
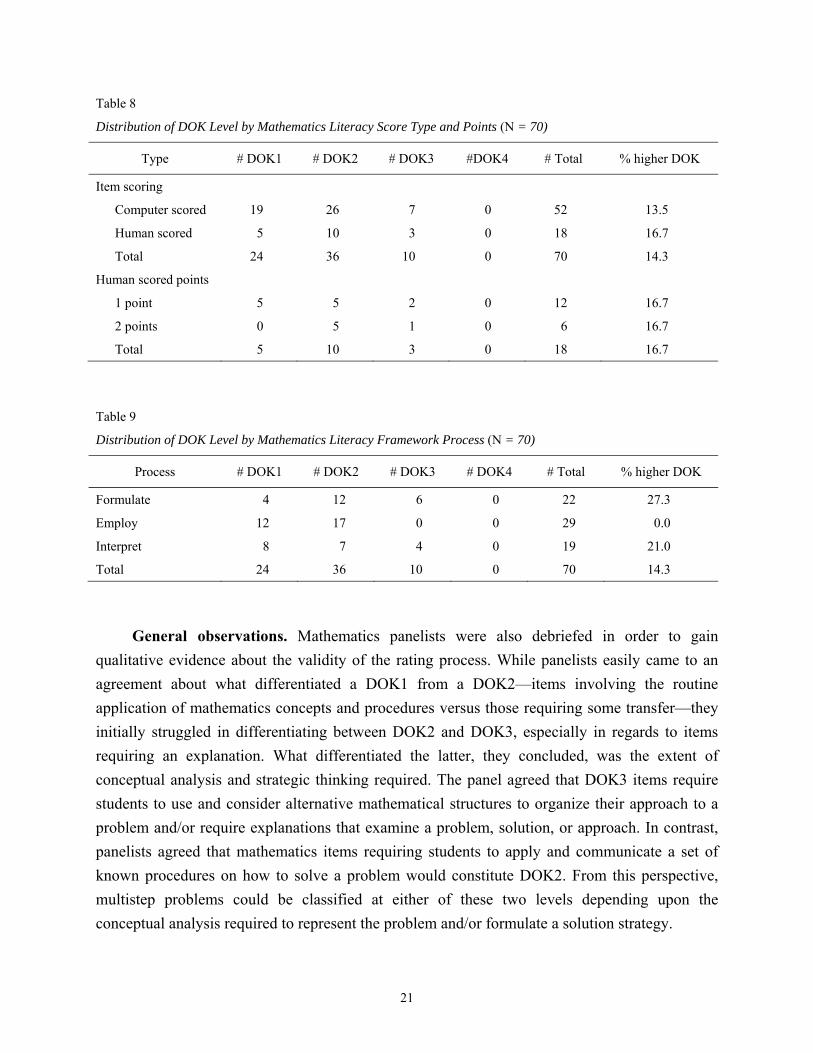
As with reading, we decided to investigate whether an association exists between higher
level DOK mathematics items and higher score values. As shown in Table 8, in this case we
found that all of the automatically scored mathematics items were worth one point (n = 52), as
were the majority of human-scored items (n = 12), leaving only six human-scored items worth a
possible two points. Only one of these two-point items was rated at DOK3, with the remaining
five being rated at DOK2. Results also show that just over half of all items (n = 36) were rated at
DOK2, whether computer or human scored. When examining the relationship between score
values and DOK further, we also found that the representation of higher order DOK was
equivalent whether examining the ratio of items or score points at DOK3 (14.3% and 14.5%,
respectively).
We also examined the relationship between the mathematical process assessed, based on
the PISA framework, and depth of knowledge. While we expected a similar trend as with the
reading literacy items, the distribution of mathematical items across the processes was more
complicated. More specifically, the data in Table 9 show the following: (1) The majority of both
the Formulate (54.5%) and Employ items (58.6%) were rated at DOK2; (2) half of the DOK1
items (50.0%) were classified as Employ items as were just under half of the DOK2 items
(47.2%); and (3) the DOK3 items were distributed between the Formulate (n = 6) and Interpret
(n = 4) processes.
21
Table 8
Distribution of DOK Level by Mathematics Literacy Score Type and Points (N = 70)
Type # DOK1 # DOK2 # DOK3 #DOK4 # Total % higher DOK
Item scoring
Computer scored 19 26 7 0 52 13.5
Human scored 5 10 3 0 18 16.7
Total 24 36 10 0 70 14.3
Human scored points
1 point 5 5 2 0 12 16.7
2 points 0 5 1 0 6 16.7
Total 5 10 3 0 18 16.7
Table 9
Distribution of DOK Level by Mathematics Literacy Framework Process (N = 70)
Process # DOK1 # DOK2 # DOK3 # DOK4 # Total % higher DOK
Formulate 4 12 6 0 22 27.3
Employ 12 17 0 0 29 0.0
Interpret 8 7 4 0 19 21.0
Total 24 36 10 0 70 14.3
General observations. Mathematics panelists were also debriefed in order to gain
qualitative evidence about the validity of the rating process. While panelists easily came to an
agreement about what differentiated a DOK1 from a DOK2—items involving the routine
application of mathematics concepts and procedures versus those requiring some transfer—they
initially struggled in differentiating between DOK2 and DOK3, especially in regards to items
requiring an explanation. What differentiated the latter, they concluded, was the extent of
conceptual analysis and strategic thinking required. The panel agreed that DOK3 items require
students to use and consider alternative mathematical structures to organize their approach to a
problem and/or require explanations that examine a problem, solution, or approach. In contrast,
panelists agreed that mathematics items requiring students to apply and communicate a set of
known procedures on how to solve a problem would constitute DOK2. From this perspective,
multistep problems could be classified at either of these two levels depending upon the
conceptual analysis required to represent the problem and/or formulate a solution strategy.
22
Additional issues noted by mathematics panelists included the following. First, despite
their breadth of knowledge and experience, they had difficulty assigning items to a primary
CCSS domain, in that the concepts and procedures that students could use in the solution rarely
fell neatly into one domain. Indeed, panelists felt that some of the PISA items could be solved
using routine procedures from one domain or another (e.g., simple computation or applying an
algebraic formula), while a few other items required students to think strategically to formulate
one or more possible approaches to a solution. Second, while panelists were complimentary in
their opinions about a number of the scenarios presented in the mathematics test, they did feel
that some of the item prompts did not take full advantage of their respective scenarios for posing
specific problems, in requiring students to construct viable mathematical arguments, or in using
modeling. Finally, as with reading, panelists felt that the scoring rubrics sometimes lowered the
potential depth of knowledge that items might otherwise elicit.
Comparison to Other Studies
In this section, we compare our results to a number of different studies. First, we consider
the validity of our findings by comparing study results to a prior RAND study examining the
depth of knowledge of PISA’s released items. We then examine expectations for deeper learning
relative to others’ analyses of that evidence in the CCSS and new CCSS-aligned assessments.
Validity of Findings Relative to RAND Study
Although study panelists found the potential for assessing deeper learning in a number of
additional items, actual representation in the 2015 assessments appear fairly modest:
approximately 11% to 14% for reading and mathematics literacy, respectively. While we have
confidence in our findings based on the caliber of our assembled reading and mathematics
panels, the careful process used, and the reliability of results, it is interesting to compare study
results to a prior RAND study of PISA’s DOK (Yuan & Le, 2014). The RAND study was based
on earlier items that the OECD released to the public to describe and characterize their
assessments.
23
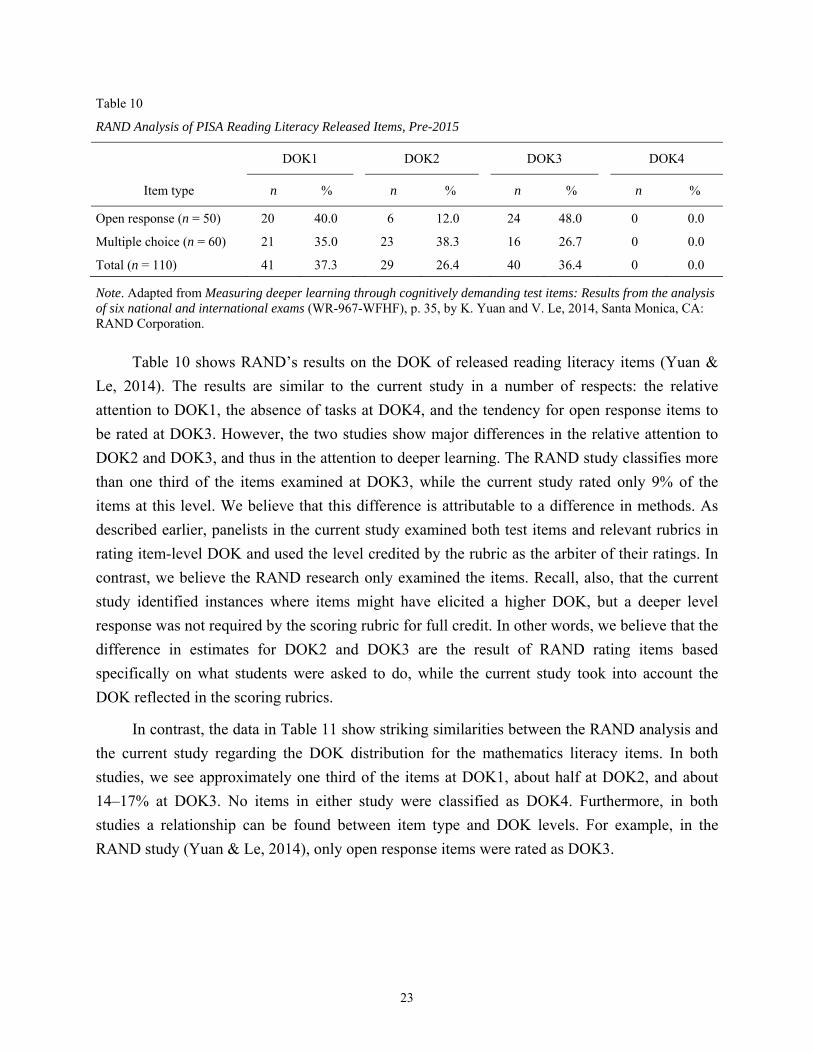
Table 10
RAND Analysis of PISA Reading Literacy Released Items, Pre-2015
DOK1 DOK2 DOK3 DOK4
Item type n % n % n % n %
Open response (n = 50) 20 40.0 6 12.0 24 48.0 0 0.0
Multiple choice (n = 60) 21 35.0 23 38.3 16 26.7 0 0.0
Total (n = 110) 41 37.3 29 26.4 40 36.4 0 0.0
Note. Adapted from Measuring deeper learning through cognitively demanding test items: Results from the analysis of six national and international exams (WR-967-WFHF), p. 35, by K. Yuan and V. Le, 2014, Santa Monica, CA: RAND Corporation.
Table 10 shows RAND’s results on the DOK of released reading literacy items (Yuan &
Le, 2014). The results are similar to the current study in a number of respects: the relative
attention to DOK1, the absence of tasks at DOK4, and the tendency for open response items to
be rated at DOK3. However, the two studies show major differences in the relative attention to
DOK2 and DOK3, and thus in the attention to deeper learning. The RAND study classifies more
than one third of the items examined at DOK3, while the current study rated only 9% of the
items at this level. We believe that this difference is attributable to a difference in methods. As
described earlier, panelists in the current study examined both test items and relevant rubrics in
rating item-level DOK and used the level credited by the rubric as the arbiter of their ratings. In
contrast, we believe the RAND research only examined the items. Recall, also, that the current
study identified instances where items might have elicited a higher DOK, but a deeper level
response was not required by the scoring rubric for full credit. In other words, we believe that the
difference in estimates for DOK2 and DOK3 are the result of RAND rating items based
specifically on what students were asked to do, while the current study took into account the
DOK reflected in the scoring rubrics.
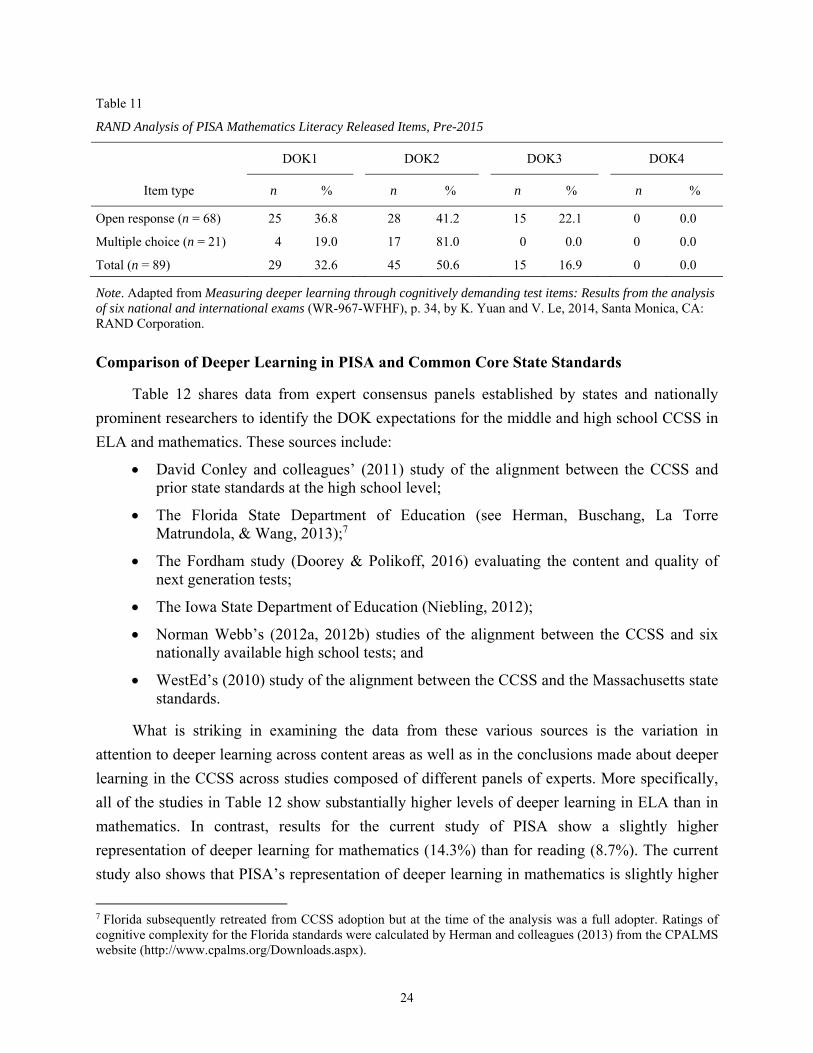
In contrast, the data in Table 11 show striking similarities between the RAND analysis and
the current study regarding the DOK distribution for the mathematics literacy items. In both
studies, we see approximately one third of the items at DOK1, about half at DOK2, and about
14–17% at DOK3. No items in either study were classified as DOK4. Furthermore, in both
studies a relationship can be found between item type and DOK levels. For example, in the
RAND study (Yuan & Le, 2014), only open response items were rated as DOK3.
24
Table 11
RAND Analysis of PISA Mathematics Literacy Released Items, Pre-2015
DOK1 DOK2 DOK3 DOK4
Item type n % n % n % n %
Open response (n = 68) 25 36.8 28 41.2 15 22.1 0 0.0
Multiple choice (n = 21) 4 19.0 17 81.0 0 0.0 0 0.0
Total (n = 89) 29 32.6 45 50.6 15 16.9 0 0.0
Note. Adapted from Measuring deeper learning through cognitively demanding test items: Results from the analysis of six national and international exams (WR-967-WFHF), p. 34, by K. Yuan and V. Le, 2014, Santa Monica, CA: RAND Corporation.
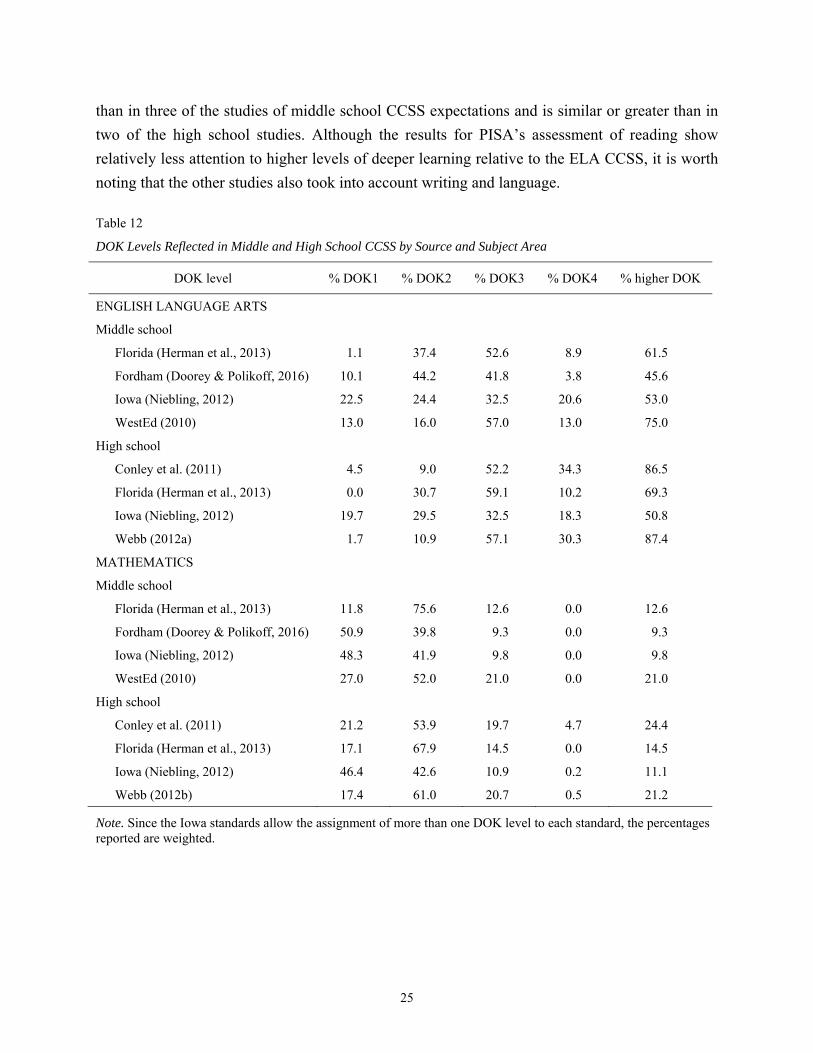
Comparison of Deeper Learning in PISA and Common Core State Standards
Table 12 shares data from expert consensus panels established by states and nationally
prominent researchers to identify the DOK expectations for the middle and high school CCSS in
ELA and mathematics. These sources include:
David Conley and colleagues’ (2011) study of the alignment between the CCSS and prior state standards at the high school level;
The Florida State Department of Education (see Herman, Buschang, La Torre Matrundola, & Wang, 2013);7
The Fordham study (Doorey & Polikoff, 2016) evaluating the content and quality of next generation tests;
The Iowa State Department of Education (Niebling, 2012);
Norman Webb’s (2012a, 2012b) studies of the alignment between the CCSS and six nationally available high school tests; and
WestEd’s (2010) study of the alignment between the CCSS and the Massachusetts state standards.
What is striking in examining the data from these various sources is the variation in
attention to deeper learning across content areas as well as in the conclusions made about deeper
learning in the CCSS across studies composed of different panels of experts. More specifically,
all of the studies in Table 12 show substantially higher levels of deeper learning in ELA than in
mathematics. In contrast, results for the current study of PISA show a slightly higher
representation of deeper learning for mathematics (14.3%) than for reading (8.7%). The current
study also shows that PISA’s representation of deeper learning in mathematics is slightly higher
7 Florida subsequently retreated from CCSS adoption but at the time of the analysis was a full adopter. Ratings of cognitive complexity for the Florida standards were calculated by Herman and colleagues (2013) from the CPALMS website (http://www.cpalms.org/Downloads.aspx).
25
than in three of the studies of middle school CCSS expectations and is similar or greater than in
two of the high school studies. Although the results for PISA’s assessment of reading show
relatively less attention to higher levels of deeper learning relative to the ELA CCSS, it is worth
noting that the other studies also took into account writing and language.
Table 12
DOK Levels Reflected in Middle and High School CCSS by Source and Subject Area
DOK level % DOK1 % DOK2 % DOK3 % DOK4 % higher DOK
ENGLISH LANGUAGE ARTS
Middle school
Florida (Herman et al., 2013) 1.1 37.4 52.6 8.9 61.5
Fordham (Doorey & Polikoff, 2016) 10.1 44.2 41.8 3.8 45.6
Iowa (Niebling, 2012) 22.5 24.4 32.5 20.6 53.0
WestEd (2010) 13.0 16.0 57.0 13.0 75.0
High school
Conley et al. (2011) 4.5 9.0 52.2 34.3 86.5
Florida (Herman et al., 2013) 0.0 30.7 59.1 10.2 69.3
Iowa (Niebling, 2012) 19.7 29.5 32.5 18.3 50.8
Webb (2012a) 1.7 10.9 57.1 30.3 87.4
MATHEMATICS
Middle school
Florida (Herman et al., 2013) 11.8 75.6 12.6 0.0 12.6
Fordham (Doorey & Polikoff, 2016) 50.9 39.8 9.3 0.0 9.3
Iowa (Niebling, 2012) 48.3 41.9 9.8 0.0 9.8
WestEd (2010) 27.0 52.0 21.0 0.0 21.0
High school
Conley et al. (2011) 21.2 53.9 19.7 4.7 24.4
Florida (Herman et al., 2013) 17.1 67.9 14.5 0.0 14.5
Iowa (Niebling, 2012) 46.4 42.6 10.9 0.2 11.1
Webb (2012b) 17.4 61.0 20.7 0.5 21.2
Note. Since the Iowa standards allow the assignment of more than one DOK level to each standard, the percentages reported are weighted.
26
Comparison to the Representation of Deeper Learning in the New Common Core Aligned
Assessments
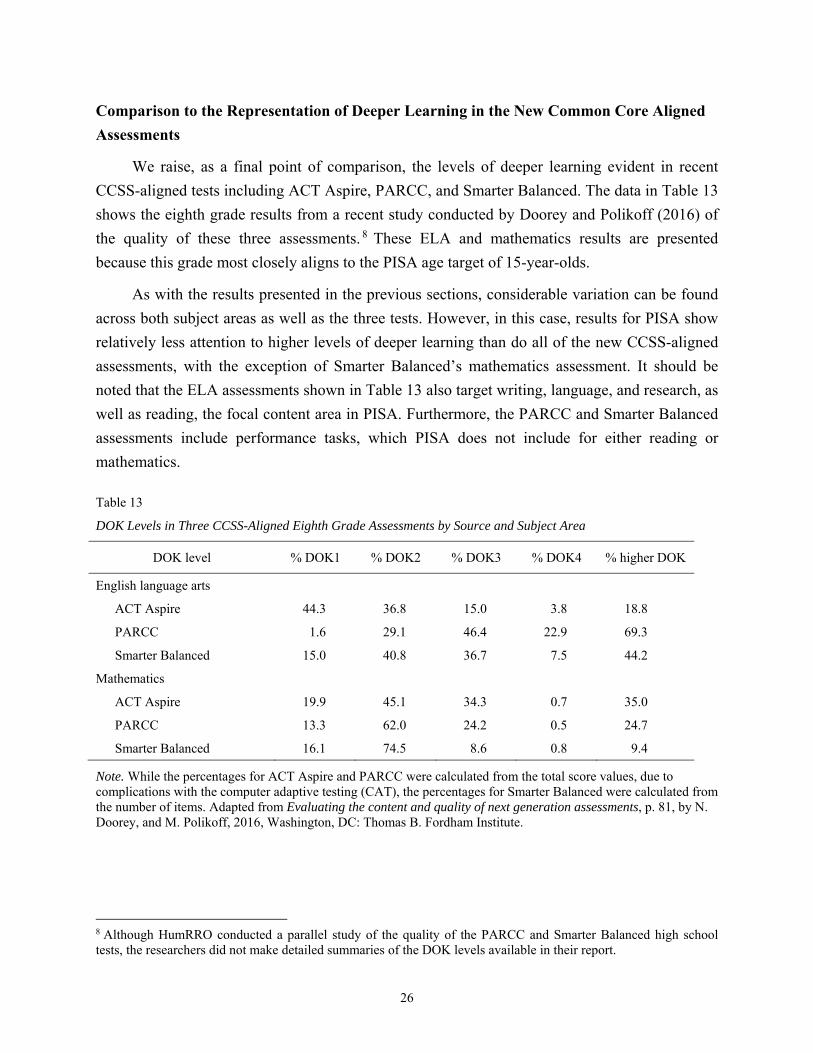
We raise, as a final point of comparison, the levels of deeper learning evident in recent
CCSS-aligned tests including ACT Aspire, PARCC, and Smarter Balanced. The data in Table 13
shows the eighth grade results from a recent study conducted by Doorey and Polikoff (2016) of
the quality of these three assessments. 8 These ELA and mathematics results are presented
because this grade most closely aligns to the PISA age target of 15-year-olds.
As with the results presented in the previous sections, considerable variation can be found
across both subject areas as well as the three tests. However, in this case, results for PISA show
relatively less attention to higher levels of deeper learning than do all of the new CCSS-aligned
assessments, with the exception of Smarter Balanced’s mathematics assessment. It should be
noted that the ELA assessments shown in Table 13 also target writing, language, and research, as
well as reading, the focal content area in PISA. Furthermore, the PARCC and Smarter Balanced
assessments include performance tasks, which PISA does not include for either reading or
mathematics.
Table 13
DOK Levels in Three CCSS-Aligned Eighth Grade Assessments by Source and Subject Area
DOK level % DOK1 % DOK2 % DOK3 % DOK4 % higher DOK
English language arts
ACT Aspire 44.3 36.8 15.0 3.8 18.8
PARCC 1.6 29.1 46.4 22.9 69.3
Smarter Balanced 15.0 40.8 36.7 7.5 44.2
Mathematics
ACT Aspire 19.9 45.1 34.3 0.7 35.0
PARCC 13.3 62.0 24.2 0.5 24.7
Smarter Balanced 16.1 74.5 8.6 0.8 9.4
Note. While the percentages for ACT Aspire and PARCC were calculated from the total score values, due to complications with the computer adaptive testing (CAT), the percentages for Smarter Balanced were calculated from the number of items. Adapted from Evaluating the content and quality of next generation assessments, p. 81, by N. Doorey, and M. Polikoff, 2016, Washington, DC: Thomas B. Fordham Institute.
8 Although HumRRO conducted a parallel study of the quality of the PARCC and Smarter Balanced high school tests, the researchers did not make detailed summaries of the DOK levels available in their report.
27
Summary and Conclusions
This report presents the results of an analysis conducted by expert panels of the PISA
Reading Literacy and Mathematics Literacy assessments and compares findings to that of other
related studies. Reading and mathematics panels conducted item-by-item reviews of each
assessment. Although these reviews provided descriptive information about the content of each
test, their prime purpose was to examine the extent to which the two PISA assessments reflected
deeper learning, as judged by panelists’ ratings of item depth of knowledge. Based on Webb’s
four-point scale (Webb, 2002a) the study defined deeper learning as being represented by ratings
of DOK3 and DOK4. Because PISA is highly regarded internationally as a test of problem
solving, the study was undertaken in the belief that PISA could serve as a benchmark for
assessing deeper learning for new state tests of college and career ready standards. Note,
however, as mentioned earlier in this report, that PISA makes no claims about its representation
of deeper learning, and DOK plays no role in the construction of the tests.
PISA Reading Literacy Results
Panelists analyzed the full set of 92 items that constitute the 2015 Reading Literacy
assessment. The item set reflects a mix of multiple choice, open response, machine-scored, and
human-scored items. Item stimuli feature passages of both continuous text and non-continuous
texts, such as advertisements, applications, and brochures. Although some items are based on
multiple texts or multiple text types, the great majority are based on a single stimulus.
To provide a sense of item content, panelists characterized each item relative to dimensions
relevant to the CCSS. Of the continuous text passages, the preponderance were judged to be at
grade level in text complexity for the 15-year-old student sample that is the target of the
assessment. Nearly 90% of the items addressed the Key Ideas and Details domain, while the
remaining addressed Craft and Structure (n = 7) or Integration of Knowledge and Ideas (n = 3).
Panelists judged most of the items free of construct-irrelevant features that could impede
students’ ability to show their knowledge.
Mean depth of knowledge across all items was 1.75, representing a basic level of skill
application. Based on panelists’ ratings, nearly 60% of the items were rated as DOK2, requiring
modest mental processing; approximately one third were rated at a rote level (DOK1); and only
9% achieved DOK3, where abstract thinking, reasoning and more complex inferences are
required. None of the items were rated as DOK4. Thus based on study definitions, less than 10%
of the items assessed deeper learning. The percentage increased slightly to 11% when taking into

28
account the percentage of the total possible score points that could be attributed to deeper
learning, since only six items had a score value of 2, and of those, only half were at DOK3.9
While all DOK3 items used a human-scored, open response format, relatively few of the
items using this format and score type reached this level. Based on these results, it appears that
PISA may not be getting full value from its open response items for assessing thinking that is
more complex. In this vein, panelists commented that although some items may have elicited
DOK3 responses, their associated rubrics did not require a response of this level for full credit.
PISA Mathematics Literacy Results
Seventy items comprised PISA’s 2015 Mathematics Literacy assessment. As with the
reading assessment, the items reflected a mix of multiple choice and open response items.
Despite this, less than half of the latter item format required human judgment for scoring.
Functions, Statistics, and Geometry together accounted for more than three fourths of the items,
with Numbers and Algebra each receiving relatively less attention, and Modeling virtually none.
Most items, according to panelists’ ratings, did incorporate mathematical practices, and again
like the reading assessments, were generally free of construct-irrelevant obstacles.
Across all items, panelists’ ratings revealed a mean depth of knowledge of 1.80, suggesting
a relatively basic level of mathematics application. Just over half of the items were judged to be
DOK2, requiring some mental processing; about one third were judged to reflect routine
procedures or rote concepts (DOK1); and, the remaining 10 items (14.3%) were judged to be at
DOK3, requiring strategic thinking and application of mathematical reasoning. As with reading,
none of the mathematics items achieved DOK4. Thus based on study definitions, only 14.3% of
the items addressed deeper learning. As with reading, taking into account the number of score
points associated with given items made no appreciable difference in the allocation to deeper
learning since only one of the six items accorded two rather than one possible score point was
rated at DOK3.
Similar to reading, it appears that PISA may not be getting full value for its open response,
human scored items. Mathematics panelists also suggested that while the scenarios established as
the stimulus for some units were very rich, the item prompts and scoring rubrics did not
necessarily take full advantage of the scenario in eliciting and crediting deeper learning.
9 As previously noted, the IRT scaling procedures used for PISA give all items equal weight, regardless of the number of score points associated with an item.
29
How PISA’s Attention to Deeper Learning Compares to Expectations for the Common
Core State Standards
PISA, of course, was not developed to be consistent with the CCSS and its expectations for
depth of knowledge. Moreover, because it is intended for an international student population that
varies widely in educational opportunity and achievement, it may not be surprising that the DOK
levels found in PISA are generally lower than were those found for the CCSS, particularly in
regards to reading. That is, PISA items must be sensitive to the students whose ability ranges
from the lowest to the highest end.
Although available studies show substantial variation in expectations for deeper learning,
PISA’s DOK levels in reading appear lower than what is expected of the CCSS in English
language arts. However, we note again that the latter also includes standards for language and
writing, which naturally lend themselves towards higher levels of DOK. PISA and CCSS
expectations for deeper learning are closer in mathematics. In this case, the PISA distribution is
similar or greater than what was found in three of the expert analyses of middle school standards,
and two of the studies of high school standards.
Similarly, in comparison to expert panel analyses of the DOK for new CCSS-aligned tests
(i.e., ACT Aspire, PARCC, and Smarter Balanced), PISA generally showed less attention to
higher levels of deeper learning. Although the differences were again more notable in ELA than
in mathematics, it is important to keep in mind important content and format differences between
the tests. This includes the focus of PISA solely on reading literacy as well as the inclusion of
performance tasks, which are uniquely suited to assessing deeper learning, in the PARCC and
Smarter Balanced assessments, but not in PISA.
Attention to deeper learning in PISA did not vary much whether percentages were based on
the number of items or total score points. In part, this was because PISA contains relatively few
items with a score value larger than one, and because all items are weighted equally in their
scaling procedures. However, the analysis of the relationship between item type, score value, and
DOK mirrors findings from earlier studies showing that open response items, particularly in
mathematics, are more likely to tap higher levels of DOK than multiple choice ones (Herman, La
Torre Matrundola, & Wang, 2015; Yuan & Le, 2012).
Conclusions
We began this study with a hypothesis that because it is so highly regarded internationally
as a measure of knowledge application and practical problem solving, that PISA’s depth of
knowledge and attention to deeper learning might serve as an appropriate benchmark for the new
assessments aligned to the CCSS and other college and career ready standards in the United

30
States. Our results suggest otherwise, and instead indicate new complexities in the identification
of an appropriate benchmark.
For historical and comparison purposes we chose to use Norman Webb’s depth of
knowledge framework (see Webb et al., 2005) to evaluate the extent of deeper learning in
assessment. From the perspective of Webb’s framework, the adequacy of an assessment’s DOK
should be judged relative to the standards it is designed to address. Although they are not fully
synonymous, there is general agreement that the CCSS is a reasonable instantiation of deeper
learning, at least in regards to its academic goals (see National Research Council, 2012). Despite
this, the data reviewed for this report show tremendous variation in how different expert panels
characterize the deeper learning expectations for the CCSS. Even when individual panels reach
consensus, findings can vary significantly across panels. Furthermore, reports often vary in the
details they provide about the methodology—such as the procedures used in the study, who and
how many experts were involved, and the level of agreement—making it difficult to judge the
relative rigor and credibility of the final ratings. Determining how well an assessment meets the
deeper learning expectations of the CCSS, or other college and career ready standards, requires a
firmer foundation of these concepts as well as a rigorous, well-designed, and validated process
for credibly setting these expectations.
Moreover, when establishing reasonable deeper learning targets for assessment, it is
important to take into account the reality that standards represent goals for all students. As such,
to provide good measurement, assessments need to include items that are sensitive to the full
range of achievement, including that of students who have not yet achieved the goals. Thus, it is
not unreasonable to see, as was generally, that studies of the CCSS ELA assessments showed
lower levels of deeper learning than did studies of the ELA standards themselves, despite their
variation. Furthermore, it should be kept in mind that Norman Webb’s (2002a) metric, is based
on the assumption that an assessment’s DOK is aligned with standards if at least 50% of the
items are at or above the specified levels.
State accountability assessments serve to both communicate what is important for students
to know and to provide an accurate and reliable measure of student accomplishment. In order to
promote and measure deeper learning goals, these two concerns must be delicately balanced and
accommodated during assessment development and validation. Historically, measurement
concerns have been served by attention to item difficulty, psychometric modeling, and other
indicators without regard to DOK, as is the case with PISA. Assessment development and
validation of the future will need to consider both if deeper learning goals are to be achieved.
31
References
Conley, D., Drummond, K. V., de Gonzalez, A., Seburn, M., Stout, O., & Rooseboom, J. (2011). Lining up: The relationship between the Common Core State Standards and five sets of comparison standards. Eugene, OR: Educational Policy Improvement Center (EPIC).
Doorey, N., & Polikoff, M. (2016). Evaluating the content and quality of next generation assessments. Washington, DC: Thomas B. Fordham Institute.
Hamilton, L. S., Stecher, B. M., & Yuan, K. (2008). Standards-based reform in the United States: History, research, and future directions (No. RP-1384). Santa Monica, CA: RAND Corporation.
Herman, J. L. (2010). Impact of assessment on classroom practice. In E. L. Baker, B. McGaw, & P. Peterson (Eds.), International encyclopedia of education (pp. 506-511). Oxford, England: Elsevier Limited.
Herman, J. L., Buschang, R. E., La Torre Matrundola, D., & Wang, J. (2013). Assessment for deeper learning in CCSS: Progress report on the status of Smarter Balanced and PARCC Assessment Consortia (CRESST Report 851). Los Angeles: University of California, Los Angeles, National Center for Research on Evaluation, Standards, and Student Testing (CRESST).
Herman, J. L., La Torre Matrundola, D., & Wang, J. (2015). On the road to deeper learning: What direction do test blueprints provide? (CRESST Report 849). Los Angeles: University of California, Los Angeles, National Center for Research on Evaluation, Standards, and Student Testing (CRESST).
Herman, J., & Linn, R. (2013). On the road to assessing deeper learning: The status of Smarter Balanced and PARCC assessment consortia (CRESST Report 823). Los Angeles: University of California, Los Angeles, National Center for Research on Evaluation, Standards, & Student Testing (CRESST).
Liebman, A., & Friedrich, L. (2010). How teachers become leaders: Learning from practice and research. New York, NY: Teachers College Press.
National Research Council. (2012). Education for life and work: Developing transferable knowledge and skills in the 21st century. Committee on defining deeper learning and 21st century skills, J. W. Pellegrino and M. L. Hilton (Eds.). Board on testing and assessment and board on science education, division of behavioral and social sciences and education. Washington, DC: The National Academies Press.
Niebling, B. C. (2012). Determining the cognitive complexity of the Iowa Core in literacy and mathematics: Implications and applications for curriculum alignment. Des Moines, IA: Iowa Department of Education.
OECD. (2013a). PISA 2012 assessment and analytical framework: Mathematics, reading, science, problem solving and financial literacy. Paris, France: Author. Retrieved from http://dx.doi.org/10.1787/9789264190511-en
OECD. (2013b). PISA 2015: Draft mathematics literacy framework. Paris, France: Author. Retrieved from http://www.oecd.org/pisa/pisaproducts/Draft%20PISA%202015%20 Mathematics%20Framework%20.pdf

32
OECD. (2013c). PISA 2015: Draft reading literacy framework. Paris, France: Author. Retrieved from http://www.oecd.org/pisa/pisaproducts/Draft%20PISA%202015%20Reading%20 Framework%20.pdf
Webb, N. L. (2002a). An analysis of the alignment between mathematics standards and assessments for three states. Paper presented at the annual meeting of the American Educational Research Association, New Orleans, LA.
Webb, N. L. (2002b). Depth-of-knowledge levels for four content areas. Madison: Wisconsin Center for Education Research, University of Wisconsin-Madison.
Webb, N. L. (2012a). Alignment analysis of the English language arts Common Core State Standards for Grades 9–12 and six assessments—ACT, SAT, PSAT, PLAN, EXPLORE, and ReadiStep. Indianapolis, IN: Indiana Department of Education.
Webb, N. L. (2012b). Alignment analysis of the mathematics Common Core State Standards for Grades 9–12 and six assessments—ACT, SAT, PSAT, PLAN, EXPLORE, and ReadiStep. Indianapolis, IN: Indiana Department of Education.
Webb, N. L., Alt, M., Ely, R., & Vesperman, B. (2005). Web alignment tool (WAT): Training manual 1.1. Retrieved from http://www.wcer.wisc.edu/WAT/Training%20 Manual%202.1%20Draft%20091205.doc
WestEd. (2010). Analysis of the Commonwealth of Massachusetts State Standards and the Common Core State Standards for English language arts and mathematics. Boston, MA: Massachusetts Business Alliance for Education (MBAE).
William and Flora Hewlett Foundation. (n.d.). What is deeper learning? Retrieved from http://www.hewlett.org/programs/education/deeper-learning/what-deeper-learning
Yuan, K., & Le, V. (2012). Estimating the percentage of students who were tested on cognitively demanding items through the state achievement tests (WR-967-WFHF). Santa Monica, CA: RAND Corporation.
Yuan, K., & Le, V. (2014). Measuring deeper learning through cognitively demanding test items: Results from the analysis of six national and international exams (RR-483-WFHF). Santa Monica, CA: RAND Corporation.

33
Appendix A:
Panelist Recruitment
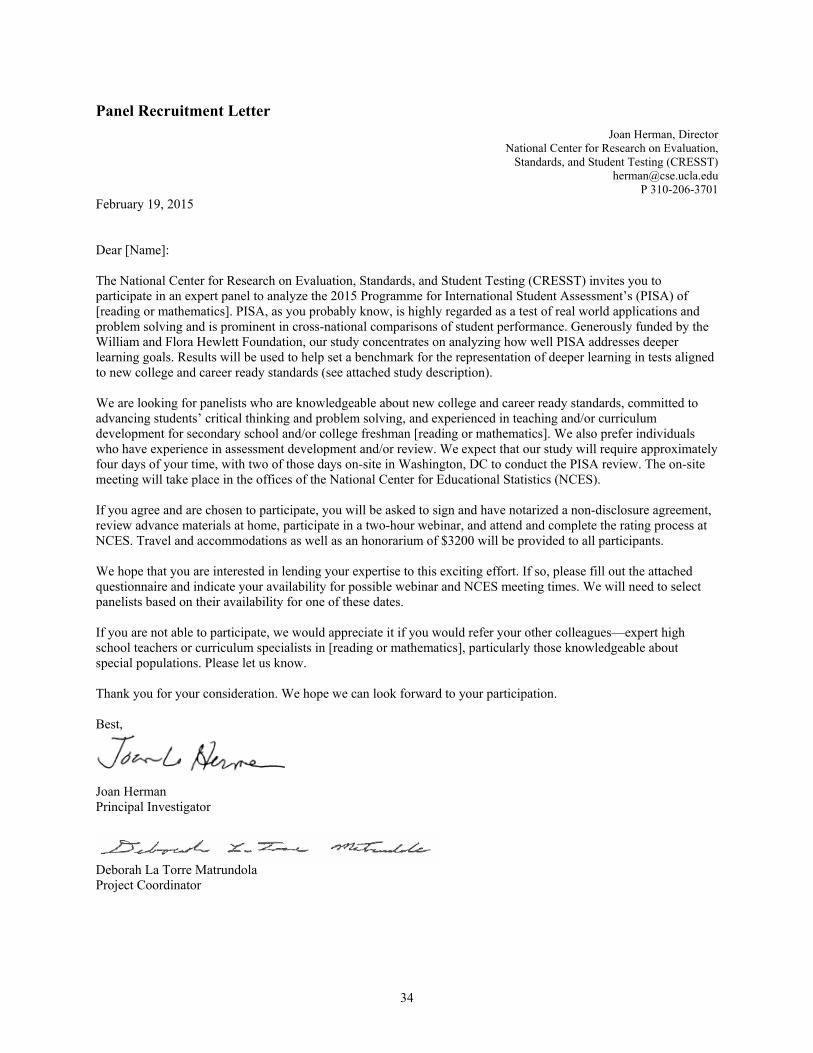
34
Panel Recruitment Letter
Joan Herman, Director National Center for Research on Evaluation,
Standards, and Student Testing (CRESST) [email protected]
P 310-206-3701 February 19, 2015 Dear [Name]: The National Center for Research on Evaluation, Standards, and Student Testing (CRESST) invites you to participate in an expert panel to analyze the 2015 Programme for International Student Assessment’s (PISA) of [reading or mathematics]. PISA, as you probably know, is highly regarded as a test of real world applications and problem solving and is prominent in cross-national comparisons of student performance. Generously funded by the William and Flora Hewlett Foundation, our study concentrates on analyzing how well PISA addresses deeper learning goals. Results will be used to help set a benchmark for the representation of deeper learning in tests aligned to new college and career ready standards (see attached study description). We are looking for panelists who are knowledgeable about new college and career ready standards, committed to advancing students’ critical thinking and problem solving, and experienced in teaching and/or curriculum development for secondary school and/or college freshman [reading or mathematics]. We also prefer individuals who have experience in assessment development and/or review. We expect that our study will require approximately four days of your time, with two of those days on-site in Washington, DC to conduct the PISA review. The on-site meeting will take place in the offices of the National Center for Educational Statistics (NCES). If you agree and are chosen to participate, you will be asked to sign and have notarized a non-disclosure agreement, review advance materials at home, participate in a two-hour webinar, and attend and complete the rating process at NCES. Travel and accommodations as well as an honorarium of $3200 will be provided to all participants. We hope that you are interested in lending your expertise to this exciting effort. If so, please fill out the attached questionnaire and indicate your availability for possible webinar and NCES meeting times. We will need to select panelists based on their availability for one of these dates. If you are not able to participate, we would appreciate it if you would refer your other colleagues—expert high school teachers or curriculum specialists in [reading or mathematics], particularly those knowledgeable about special populations. Please let us know. Thank you for your consideration. We hope we can look forward to your participation. Best,
Joan Herman Principal Investigator
Deborah La Torre Matrundola Project Coordinator

35
Reading Literacy Study Information Form
Thank you for your interest in helping us review and score the cognitive complexity of the 2015 PISA test items in reading. Please fill out this form and return it to Deborah La Torre Matrundola at [email protected] by March 13, 2015.
Rater Information
Last Name: First Name:
Street Address: Apt/Unit #:
City: State: Zip:
Home Phone: ( ) Cell Phone: ( )
Email Address:
Organization:
Position:
Background Information
Teaching Experience (e.g. years, grades, and ELA subjects taught): Common Core (CCSS) Curriculum and/or Assessment Development/Review Experience (e.g. participation in creating/reviewing curriculum or assessment aligned with the CCSS):
Experience in Assessment Development and/or Scoring (e.g., participation in development of state or district reading test, scoring of extended constructed response tasks):
Common Core State Standards
Please rate yourself concerning each of the following:
Beginner Intermediate Advanced Expert
1. Knowledge of the CCSS in ELA:
2. Experience with the CCSS in ELA:
General Availability for Study
Webinars (PDT) Scoring Sessions (9am–5pm EDT)*
Weekdays (4–6pm): Yes No June 10–11: Yes No
Weekdays (5–7pm): Yes No June 11–12: Yes No
Saturdays (am): Yes No June 18–19: Yes No
Saturdays (pm): Yes No
*Please take into account travel to/from Washington, D.C. when listing your availability for the scoring sessions.
36
Mathematics Literacy Study Information Form
Thank you for your interest in helping us review and score the cognitive complexity of the 2015 PISA test items in reading. Please fill out this form and return it to Deborah La Torre Matrundola at [email protected] by March 13, 2015.
Rater Information
Last Name: First Name:
Street Address: Apt/Unit #:
City: State: Zip:
Home Phone: ( ) Cell Phone: ( )
Email Address:
Organization:
Position:
Background Information
Teaching Experience (e.g. years, grades, and math subjects taught): Common Core (CCSS) Curriculum and/or Assessment Development/Review Experience (e.g. participation in creating/reviewing curriculum or assessment aligned with the CCSS):
Experience in Assessment Development and/or Scoring (e.g., participation in development of state or district reading test, scoring of extended constructed response tasks):
Common Core State Standards
Please rate yourself concerning each of the following:
Beginner Intermediate Advanced Expert
1. Knowledge of the CCSS in math:
2. Experience with the CCSS in math:
General Availability for Study
Webinars (PDT) Scoring Sessions (9am–5pm EDT)*
Weekdays (4–6pm): Yes No June 10–11: Yes No
Weekdays (5–7pm): Yes No June 11–12: Yes No
Saturdays (am): Yes No June 18–19: Yes No
Saturdays (pm): Yes No
*Please take into account travel to/from Washington, D.C. when listing your availability for the scoring sessions.

37
Appendix B:
Panelist Biographies

38
Reading Literacy Panelists
Katherine Allebach Franz, M.A.Ed., is a high school teacher in Minneapolis Public
Schools. She has over 15 years of experience teaching courses in language arts (e.g., English,
Honors English, IB MYP [International Baccalaureate Middle Years Programme] English, and
Reading), humanities, theater, and AVID. Allebach Franz has also served as a literacy coach,
conducted trainings on data interpretation as a reading specialist, has written curricula and
common assessments for her district, and has participated in efforts to vertically align the CCSS
and AP standards.
Katrina Boone, M.A.T., is an America Achieves fellow who teaches for the Shelby
County Public Schools in Kentucky. She has over five years of experience teaching language arts
at the high school level including courses in Reading and Writing, English, and AP English.
Boone has created and scored common assessments at the school and district levels and has
helped create CCSS aligned curricula for her school. In addition, she has participated in CCSS
alignment studies of curricula and assessment for both Student Achievement Partners and for
Collaborative for Student Success.
Mark Conley, Ph.D., is a professor at the University of Memphis in Tennessee. He
conducts research on teacher education policy and practice, adolescent literacy, assessment and
human and artificial intelligence tutoring, all within interdisciplinary contexts. Prior to moving to
Tennessee, he was an associate professor at Michigan State University. Dr. Conley often
collaborates with school districts, including the Memphis City School District, to develop
programs to assist students as they become literate. Among his extensive experience, he has
served as co-chair of the standards committee for the English Language Arts National Board for
Professional Teaching Standards; he participated in a CCSS and cognitive complexity alignment
study of the ACT and Cambridge tests; and he has 15 years of experience working with the
Michigan Department of Education on reading and writing test development.
Linda Friedrich, Ph.D., has served as the director of research and evaluation at the
National Writing Project (NWP) since 2002. In this capacity, she has overseen the use, ongoing
development, and scoring of writing samples for NWP’s CCSS-aligned writing assessment
system (Analytic Writing Continuum) and, as a member of their management team, she supports
the organization in strategically using research results and tools. Her research interests include
teacher leadership and professional development, writing assessment, teacher research, and the
diffusion of knowledge and practice. She is coauthor of How Teachers Become Leaders:
Learning from Practice and Research (Liebman & Friedrich, 2010). Prior to joining NWP, she
39
served as director of research at the Coalition of Essential Schools. Dr. Friedrich has also worked
on the CCSS and cognitive complexity alignment study of the ACT and Cambridge tests.
P. David Pearson, Ph.D., is a professor and former dean in the Graduate School of
Education at the University of California, Berkeley. His research interests focus on language and
literacy and on human development. Dr. Pearson’s current projects include an interdisciplinary
study on the use of reading, writing, and language to foster knowledge and inquiry in science as
well as a collaborative research partnership between Berkeley, Stanford, and the San Francisco
Unified District. Prior to joining the faculty at Berkeley, he was the John A. Hannah
Distinguished Professor of Education at Michigan State and Co-Director of the Center for the
Improvement of Early Reading Achievement (CIERA). He has also written and co-edited
numerous books and articles, including the Handbook of Reading Research.
Martha Thurlow, Ph.D., is director of the National Center on Educational Outcomes at
the University of Minnesota. In this position, she addresses the implications of contemporary
U.S. policy and practice for students with disabilities and English language learners, including
national and statewide assessment policies and practices, standards-setting efforts, and
graduation requirements. This includes serving on both the technical and students with
disabilities advisory committees for Smarter Balanced. Dr. Thurlow has conducted research for
the past 35 years in a variety of areas, including assessment and decision making, learning
disabilities, early childhood education, dropout prevention, effective classroom instruction, and
integration of students with disabilities in general education settings. Dr. Thurlow has published
extensively on all of these topics, authoring numerous books and book chapters, and publishing
more than 200 articles and reports. In 2003, she completed her 8-year term as co-editor of
Exceptional Children, the research journal of the Council for Exceptional Children, and is
currently associate editor for numerous journals.
Sheila Valencia, Ph.D., is a professor of language, literacy, and culture at the University of
Washington, Seattle. In this capacity, she teaches and conducts research in the areas of literacy
assessment, instruction, policy, and teacher development. She also has more than 28 years of
experience teaching ELA methods at the university level. Dr. Valencia has served on the
Common Core Standards Advisory Panel on Literacy, National Assessment of Educational
Progress (NAEP) subcommittees, and the International Reading Association and National
Council of Teachers of English (IRA/NCTE) standards and assessment committees. Prior to
joining the faculty at the University of Washington, she was an assistant professor at the
University of Illinois, Urbana-Champaign and an acting assistant professor at the University of
Colorado Boulder. She also has over five years of experience as a district reading coordinator in
Colorado. Dr. Valencia has authored numerous books, chapters, and articles, and has served on

40
the editorial boards of Educational Researcher, Educational Assessment, Reading Research
Quarterly, Journal of Literacy Research, and The Reading Teacher.
Karen Wixson, Ph.D., is a former professor and dean in the schools of education at the
University of North Carolina, Greensboro and at the University of Michigan. As a professor, she
taught reading methods classes to both pre-service and in-service teachers, and she served as
director of the Center for the Improvement of Early Reading Achievement (CIERA) at the
University of Michigan. Dr. Wixson has extensive experience consulting with NAEP including
serving on their framework, achievement-level descriptors, and reading standing committees as
well as leading their Validity Studies Panel concerning alignment of their assessments with the
ELA CCSS. In addition, she previously worked on the development of the Progress in
International Reading Literacy Study (PIRLS) assessment and was a member of the extended
work team for the ELA CCSS. Dr. Wixson has also served on the editorial boards for
Educational Assessment, Journal of Literacy Research, and Reading Research Quarterly.
Mathematics Literacy Panelists
Christopher Affie, M.A., is an America Achieves fellow who is currently head of the
mathematics department at The Gilbert School, a college prep school in Connecticut. He has
more than 15 years of teaching experience at secondary schools in Connecticut. Courses he has
taught include Pre-Algebra, Algebra 1 and 2, Geometry, Pre-Calculus, Calculus, and AP
Statistics. As department head, he has focused on designing and implementing the school’s
CCSS-aligned mathematics curriculum. Affie has also created district-level common assessments
in mathematics, and has completed training on the use of the Educators Evaluating the Quality of
Instructional Products (EQuIP) and Instructional Materials Evaluation Tool (IMET) rubrics from
Achieve and Student Achievement Partners, respectively.
Patrick Callahan, Ph.D., is co-director of the California Mathematics Project (CMP). He
spent 6 years teaching mathematics at the University of Texas at Austin, after which he spent 10
years working at the University of California Office of the President. The focus of his
professional and research activities has been on the professional development of K-16 pre-
service and in-service teachers in mathematics instruction. Dr. Callahan has served as a member
of a National Center on Education and the Economy (NCEE) panel on college and career ready
standards. He has also served as a member of the Smarter Balanced Item Quality Review Expert
Panel in mathematics and has worked as a content expert for Illustrative Mathematics.
Phil Daro, B.A., is director of mathematics for the Strategic Education Research
Partnership (SERP). He previously directed teacher professional development programs for the
University of California, including CMP and the American Mathematics Project (AMP). In this
41
capacity, he helped states to develop mathematics standards as well as accountability and testing
systems. Daro is one of the key authors of the mathematics CCSS. He has served on numerous
other mathematics committees such as the NAEP Validity Committee, the RAND Mathematics
Education Research Panel, the College Board Mathematics Framework Committee, the
ACHIEVE Technical (Assessment) Advisory and Mathematics Work Groups, and the
Mathematical Sciences Education Board of the National Research Council.
Wallace Etterbeek, Ph.D., is a professor emeritus of mathematics at California State
University, Sacramento. In addition to teaching mathematics at the university level, he taught
advanced mathematics courses at the high school level including AP Calculus and Level 4 of the
IB program. Dr. Etterbeek has extensive experience as a reader and table leader for the AP
Calculus and Statistics exams. He has served as a statistician and workgroup member for the
Mathematics Diagnostic Testing Project (MDTP), with a focus on the outlining of pathways for
courses and development of CCSS-aligned tests for Integrated Mathematics I, II, and III. In
addition, he participated in a CCSS and cognitive complexity alignment study of the ACT and
Cambridge tests.
David Foster, B.A., is the executive director of the Silicon Valley Mathematics Initiative.
In this capacity, he has spent over 15 years developing and scoring the Mathematics Assessment
Collaborative and Mathematics Assessment Resource Service (MAC/MARS) performance
assessment exam. Foster has 20 years of experience teaching mathematics and computer science
courses at the secondary school level. He is an author of the following mathematics curricula:
Interactive Mathematics, Glencoe, Agile Mind Middle School Program, and Pearson’s CCSS-
aligned System of Courses for the high school level. He has also consulted with PARCC and has
developed exemplar items for Smarter Balanced.
Curtis Lewis, Ph.D., is an America Achieves fellow who is principal of both the
elementary and secondary school programs at the Henry Ford Academy: School for Creative
Studies in Detroit. He holds a Ph.D. in curriculum, teaching, and education policy from
Michigan State University. Dr. Lewis has over 10 years of experience teaching at the elementary,
secondary, and post-secondary levels. Mathematics courses he has taught include Basic Math,
Algebra, Geometry, and Trigonometry. Dr. Lewis has also taught courses and professional
development on CCSS mathematics to both pre-service and in-service teachers. He has also
assisted in the creation of district-level common assessments in mathematics as well as the
scoring of student responses on constructed response items.
Barbara Schallau, M.A., is the Mathematics Subject Area Coordinator for East Side High
School District (ESHSD) in Silicon Valley, California. In this capacity, she heads the
42
development and alignment of the district’s mathematics curriculum and provides in-service
trainings to faculty. Schallau also has over 25 years of experience teaching mathematics with
ESHSD, and has recently started teaching adult education for the district as well. Courses she has
taught include Pre-Algebra, Algebra 1 and 2, Geometry, the Integrated Math Program (IMP)
Years 1–4, and CCSS Math 1. In addition, Schallau has assisted in the development of CCSS-
aligned curricula and common interim assessments for use at the elementary and middle school
levels, she has standardized rubrics for the MAC tasks, and she helped create mathematics
assessment items for the Santa Clara County Office of Education (SCCOE).
Guillermo Solano-Flores, Ph.D., is a professor of bilingual education and English as a
second language at the School of Education of the University of Colorado Boulder. In this
capacity, he has taught graduate-level courses on the educational assessment of bilingual
populations, sociolinguistics in education, and on language issues in educational research. Dr.
Solano-Flores has served as a member of the English language learners (ELL) advisory
committee for Smarter Balanced, has authored conceptual frameworks for the consortium
concerning the development of mathematics test translations and accessibility resources in
mathematics assessments for ELLs, and served on their item quality review panel. He has also
done work on the NAEP, PISA, and TIMSS assessments. Dr. Solano Flores also co-created a
translation model for the Assessment of Higher Education Learning Outcomes (AHELO) tasks
and facilitated international teams in their translation, utilizing his theory of test translation error.
43
Appendix C:
Review Panel Training and Data Collection

44
Reading Depth of Knowledge Framework
Level Descriptors
Level 1 Task requires recall or recognition of details from the passage.
Identification of needed information often explicit, obvious, or prompted.
Students do not need to make significant connections to the text; they do not need to draw relationships between words, sentences, and/or paragraphs to address the task/item.
Level 2
Requires engagement of some mental processing beyond recall or recognition and
requires application of skill or knowledge.
Students need to draw some relationships between words, sentences, and paragraphs and between the task/item and the relevant portions of the passage.
Level 3 Requires higher level processing, including synthesis of details and/or examples, of supporting ideas, inferring and/or producing a logical progression of ideas, application of prior knowledge, inference across an entire passage, or the identification of connections among texts.
Students need to make significant connections in text and to infer relationships words, sentences, and paragraphs across the passage(s).
Level 4 Requires student to perform complex tasks such as synthesizing and analyzing complex ideas, analyzing the complex connections among texts, developing hypotheses, or finding themes across texts, which are not explicitly related.
Given the complexity, tasks at Level 4 often require an extended period of time.
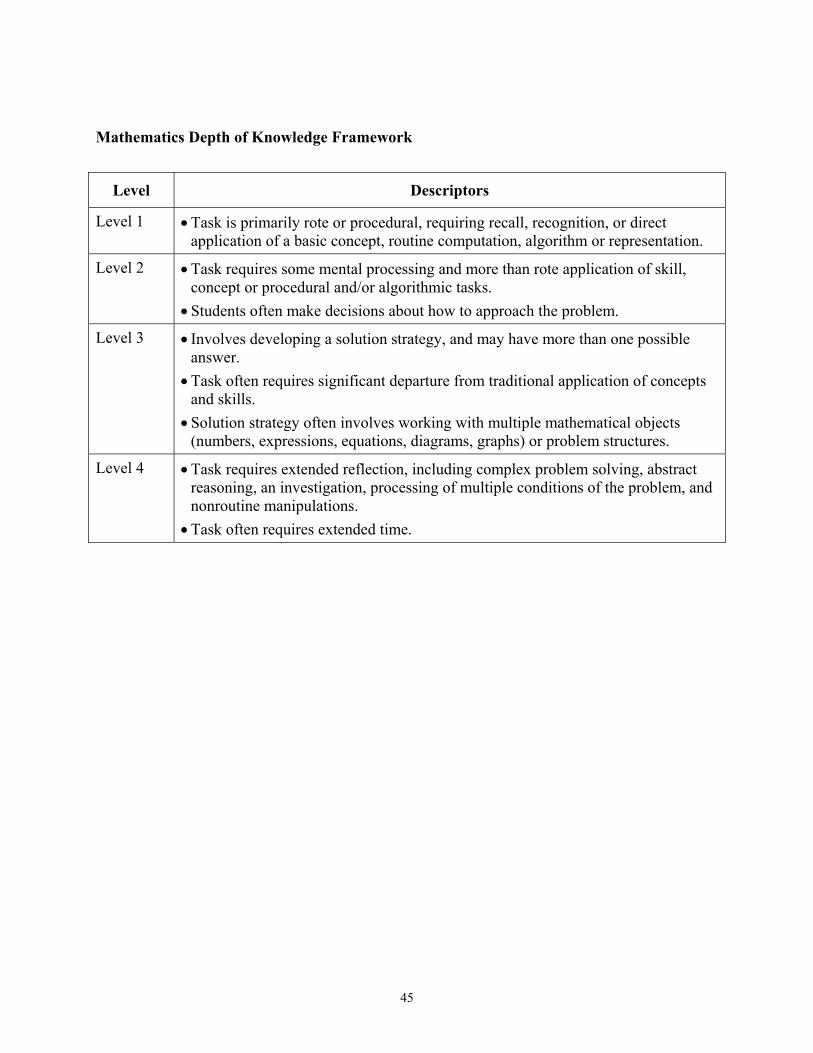
45
Mathematics Depth of Knowledge Framework
Level Descriptors
Level 1 Task is primarily rote or procedural, requiring recall, recognition, or direct application of a basic concept, routine computation, algorithm or representation.
Level 2
Task requires some mental processing and more than rote application of skill,
concept or procedural and/or algorithmic tasks.
Students often make decisions about how to approach the problem.
Level 3 Involves developing a solution strategy, and may have more than one possible answer.
Task often requires significant departure from traditional application of concepts and skills.
Solution strategy often involves working with multiple mathematical objects (numbers, expressions, equations, diagrams, graphs) or problem structures.
Level 4 Task requires extended reflection, including complex problem solving, abstract reasoning, an investigation, processing of multiple conditions of the problem, and nonroutine manipulations.
Task often requires extended time.
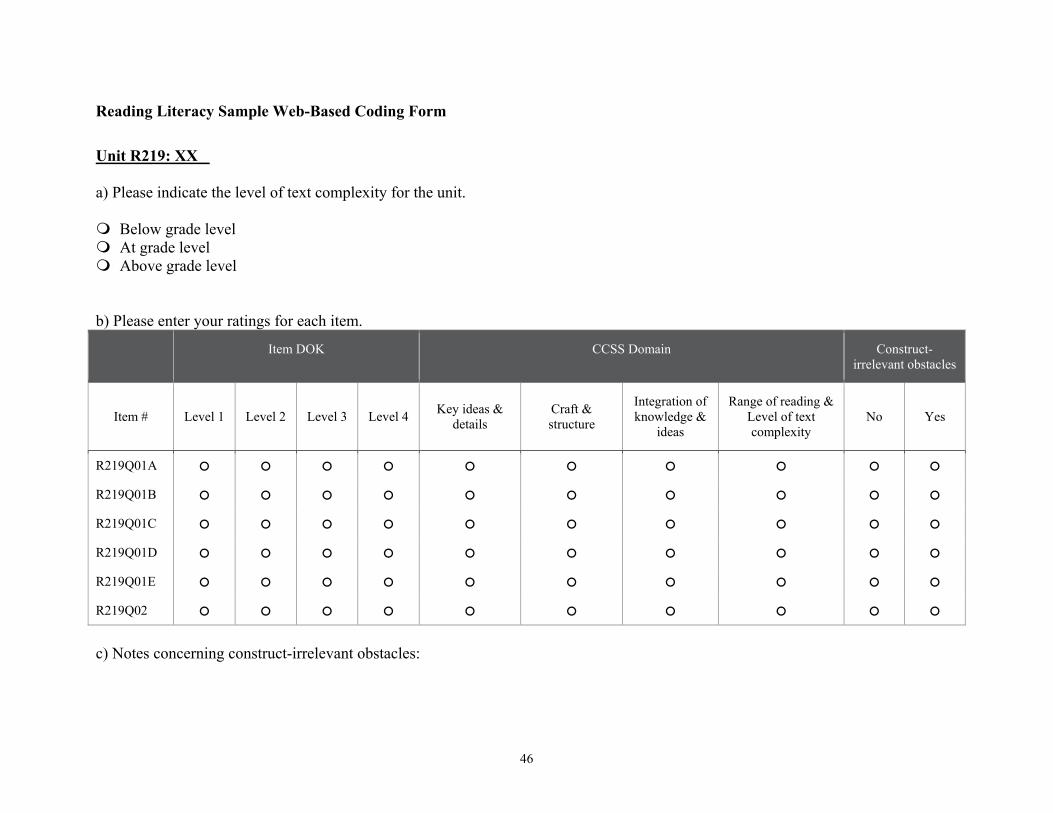
46
Reading Literacy Sample Web-Based Coding Form
Unit R219: XX a) Please indicate the level of text complexity for the unit. Below grade level At grade level Above grade level b) Please enter your ratings for each item.
Item DOK CCSS Domain Construct-irrelevant obstacles
Item # Level 1 Level 2 Level 3 Level 4 Key ideas &
details Craft & structure
Integration of knowledge &
ideas
Range of reading & Level of text complexity
No Yes
R219Q01A ○ ○ ○ ○ ○ ○ ○ ○ ○ ○
R219Q01B ○ ○ ○ ○ ○ ○ ○ ○ ○ ○
R219Q01C ○ ○ ○ ○ ○ ○ ○ ○ ○ ○
R219Q01D ○ ○ ○ ○ ○ ○ ○ ○ ○ ○
R219Q01E ○ ○ ○ ○ ○ ○ ○ ○ ○ ○
R219Q02 ○ ○ ○ ○ ○ ○ ○ ○ ○ ○ c) Notes concerning construct-irrelevant obstacles:
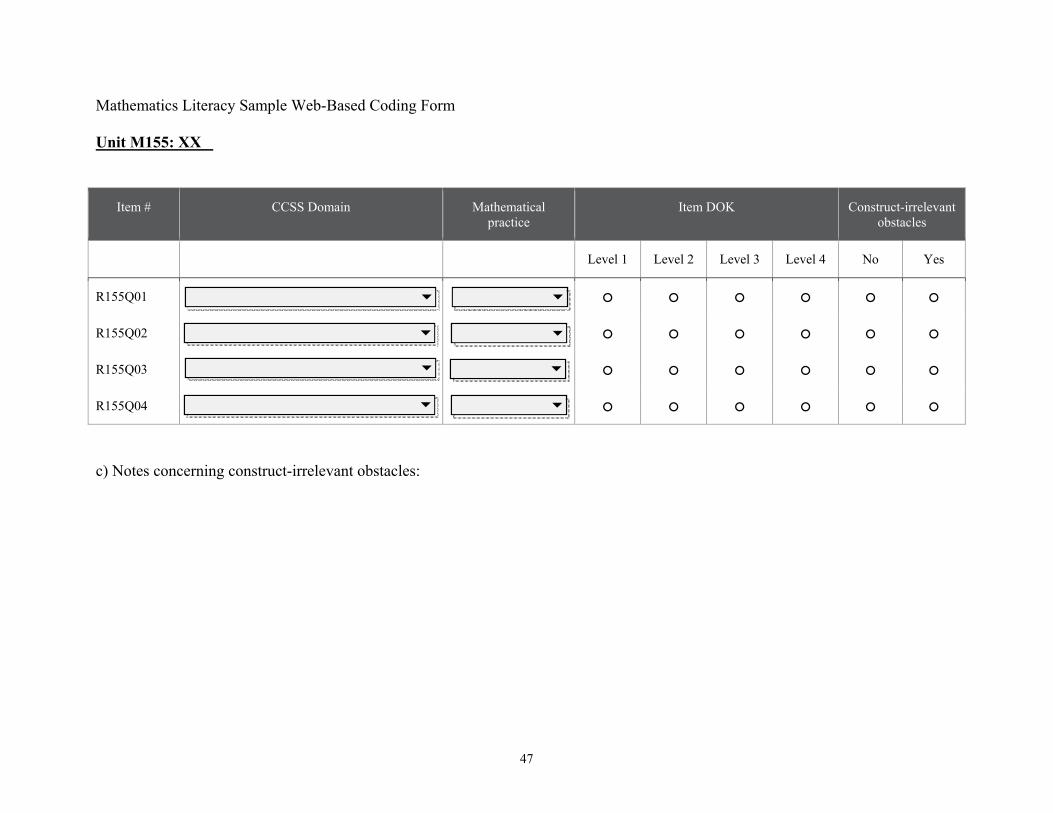
47
Mathematics Literacy Sample Web-Based Coding Form Unit M155: XX
Item # CCSS Domain Mathematical practice
Item DOK Construct-irrelevant obstacles
Level 1 Level 2 Level 3 Level 4 No Yes
R155Q01 ○ ○ ○ ○ ○ ○
R155Q02 ○ ○ ○ ○ ○ ○
R155Q03 ○ ○ ○ ○ ○ ○
R155Q04 ○ ○ ○ ○ ○ ○
c) Notes concerning construct-irrelevant obstacles:
48
Rating Session Notebook: Table of Contents
Section 1: Supplemental materials
Note to Reviewers of Secure Items
Instructions for Accessing Units on the Computer
Item Classifications by Framework Characteristics
Item Allocation by Cluster
Section 2: Reading
Reading Units (Clusters)
Coding Guide and Answer Key
Section 3: Mathematics
Mathematics Units (Clusters)
Coding Guide and Answer Key
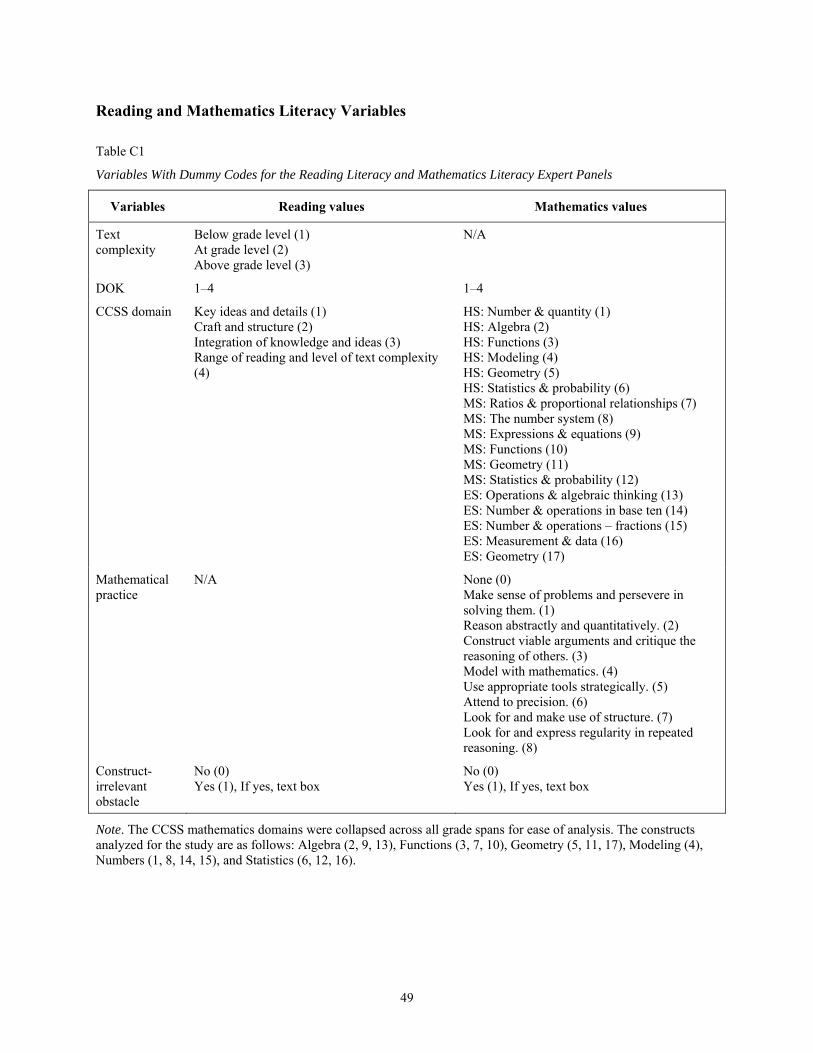
49
Reading and Mathematics Literacy Variables
Table C1
Variables With Dummy Codes for the Reading Literacy and Mathematics Literacy Expert Panels
Variables Reading values Mathematics values
Text complexity
Below grade level (1) At grade level (2) Above grade level (3)
N/A
DOK 1–4 1–4
CCSS domain Key ideas and details (1) Craft and structure (2) Integration of knowledge and ideas (3) Range of reading and level of text complexity (4)
HS: Number & quantity (1) HS: Algebra (2) HS: Functions (3) HS: Modeling (4) HS: Geometry (5) HS: Statistics & probability (6) MS: Ratios & proportional relationships (7) MS: The number system (8) MS: Expressions & equations (9) MS: Functions (10) MS: Geometry (11) MS: Statistics & probability (12) ES: Operations & algebraic thinking (13) ES: Number & operations in base ten (14) ES: Number & operations – fractions (15) ES: Measurement & data (16) ES: Geometry (17)
Mathematical practice
N/A None (0) Make sense of problems and persevere in solving them. (1) Reason abstractly and quantitatively. (2) Construct viable arguments and critique the reasoning of others. (3) Model with mathematics. (4) Use appropriate tools strategically. (5) Attend to precision. (6) Look for and make use of structure. (7) Look for and express regularity in repeated reasoning. (8)
Construct-irrelevant obstacle
No (0) Yes (1), If yes, text box
No (0) Yes (1), If yes, text box
Note. The CCSS mathematics domains were collapsed across all grade spans for ease of analysis. The constructs analyzed for the study are as follows: Algebra (2, 9, 13), Functions (3, 7, 10), Geometry (5, 11, 17), Modeling (4), Numbers (1, 8, 14, 15), and Statistics (6, 12, 16).

50
Table C2
Variables With Dummy Codes for the PISA Reading Literacy and Mathematics Literacy Frameworks
Variables Reading values Mathematics values
Aspect/process Access and retrieve (1) Integrate and interpret (2) Reflect and evaluate (3)
Formulate (1) Employ (2) Interpret (3)
Item format N/A (0) Simple multiple choice (1) Complex multiple choice (2) Open response (3)
N/A (0) Simple multiple choice (1) Complex multiple choice (2) Open response (3)
Text format Continuous (1) Non-continuous (2) Mixed (3) Multiple (4)
N/A
Scoring N/A (0) Computer scored (1) Human scored (2)
N/A (0) Computer scored (1) Human scored (2)
Points 0–2 0–2
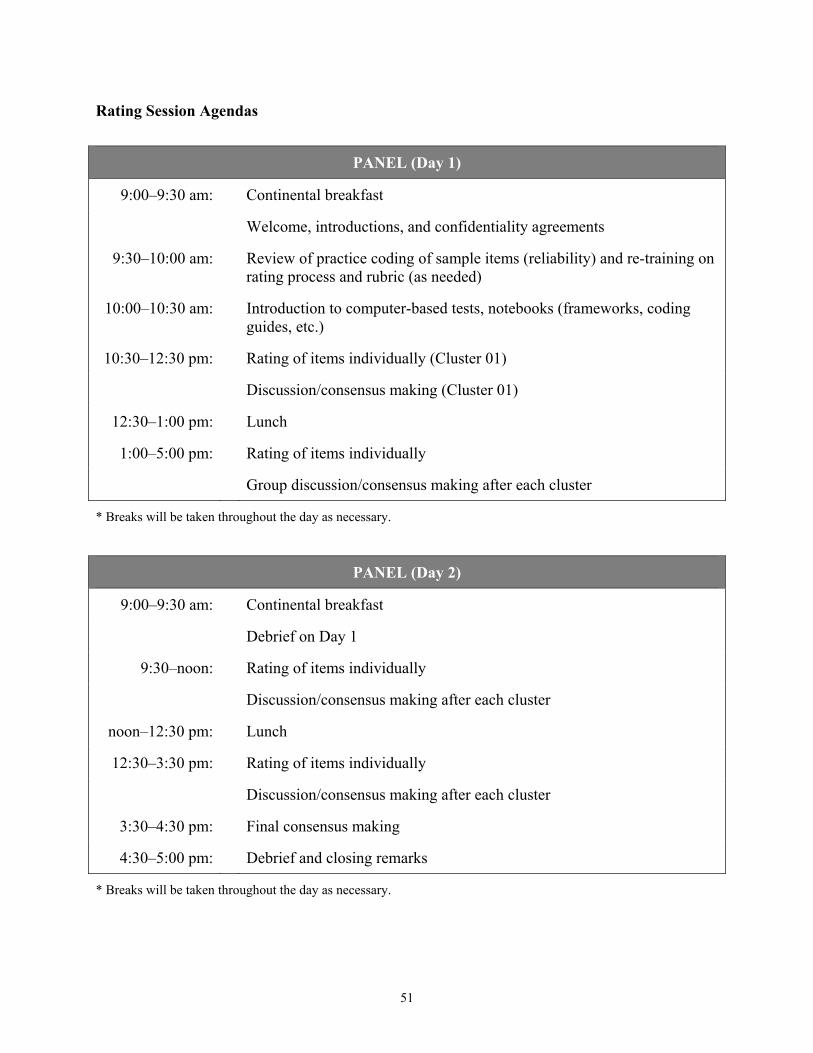
51
Rating Session Agendas
PANEL (Day 1)
9:00–9:30 am: Continental breakfast
Welcome, introductions, and confidentiality agreements
9:30–10:00 am: Review of practice coding of sample items (reliability) and re-training on rating process and rubric (as needed)
10:00–10:30 am: Introduction to computer-based tests, notebooks (frameworks, coding guides, etc.)
10:30–12:30 pm: Rating of items individually (Cluster 01)
Discussion/consensus making (Cluster 01)
12:30–1:00 pm: Lunch
1:00–5:00 pm: Rating of items individually
Group discussion/consensus making after each cluster
* Breaks will be taken throughout the day as necessary.
PANEL (Day 2)
9:00–9:30 am: Continental breakfast
Debrief on Day 1
9:30–noon: Rating of items individually
Discussion/consensus making after each cluster
noon–12:30 pm: Lunch
12:30–3:30 pm: Rating of items individually
Discussion/consensus making after each cluster
3:30–4:30 pm: Final consensus making
4:30–5:00 pm: Debrief and closing remarks
* Breaks will be taken throughout the day as necessary.
52
Appendix D:
Reading Literacy Analyses

53
Figure D1. Mean text complexity ratings for the reading literacy stimuli (n = 25).
Figure D2. Mean DOK ratings for the reading literacy items (n = 92).

54
Table D1
Overall Summary Statistics for Reading Literacy
Variable n Mean (SD) Median Mode Min Max
Text complexity 25 1.95 (0.38) 2.00 2.00 & 2.13 1.13 2.63
DOK 92 1.75 (0.59) 2.00 2.00 1.00 3.00
Note. When calculating the mean at the rating level, the standard deviations for text complexity (n = 200) and DOK (n = 736) change to 0.51 and 0.61.
Table D2
Distribution of Reading Literacy Items by Number of Panelists Who Provided the Modal Response
CCSS domain DOK Text complexity
Modal given by # Items % # Items % # Items %
0 panelists 0 0.0 0 0.0 0 0.0
1 panelists 0 0.0 0 0.0 0 0.0
2 panelists 0 0.0 0 0.0 0 0.0
3 panelists 0 0.0 0 0.0 0 0.0
4 panelists 7 7.6 4 4.3 0 0.0
5 panelists 12 13.0 2 2.2 3 12.0
6 panelists 12 13.0 2 2.2 8 32.0
7 panelists 17 18.5 6 6.5 8 32.0
8 panelists 44 47.8 78 84.8 6 24.0
Total 92 100.0 92 100.0 25 100.0
Note. Percentages represent weighted averages.

55
Table D3
Panelist Agreement on the Presence of Construct-Irrelevant Obstacles for Reading Literacy Items
# Panelists # Items %
0 panelists 68 73.9
1 panelist 18 19.6
2 panelists 4 4.3
3 panelists 0 0.0
4 panelists 1 1.1
5 panelists 0 0.0
6 panelists 1 1.1
Total 92 100.0
Table D4
Panelist Agreement on Modal Responses for CCSS Domain and DOK in Reading Literacy
Modal CCSS domain DOK modal response
# Panelists % DOK1 DOK2 DOK3 DOK4 # Total % Total
0 panelists 0.0 0 0 0 0 0 0.0
1 panelists 0.0 0 0 0 0 0 0.0
2 panelists 0.0 0 0 0 0 0 0.0
3 panelists 0.0 0 0 0 0 0 0.0
4 panelists 50.0 1 2 4 0 7 7.6
5 panelists 62.5 1 11 0 0 12 13.0
6 panelists 75.0 3 8 1 0 12 13.0
7 panelists 87.5 2 13 2 0 17 18.5
8 panelists 100.0 24 19 1 0 44 47.8
Total 31 53 8 0 92 100.0
Note. There was a correlation of -0.42 between CCSS domain and DOK rating indicating that there was higher agreement on lower DOK items.
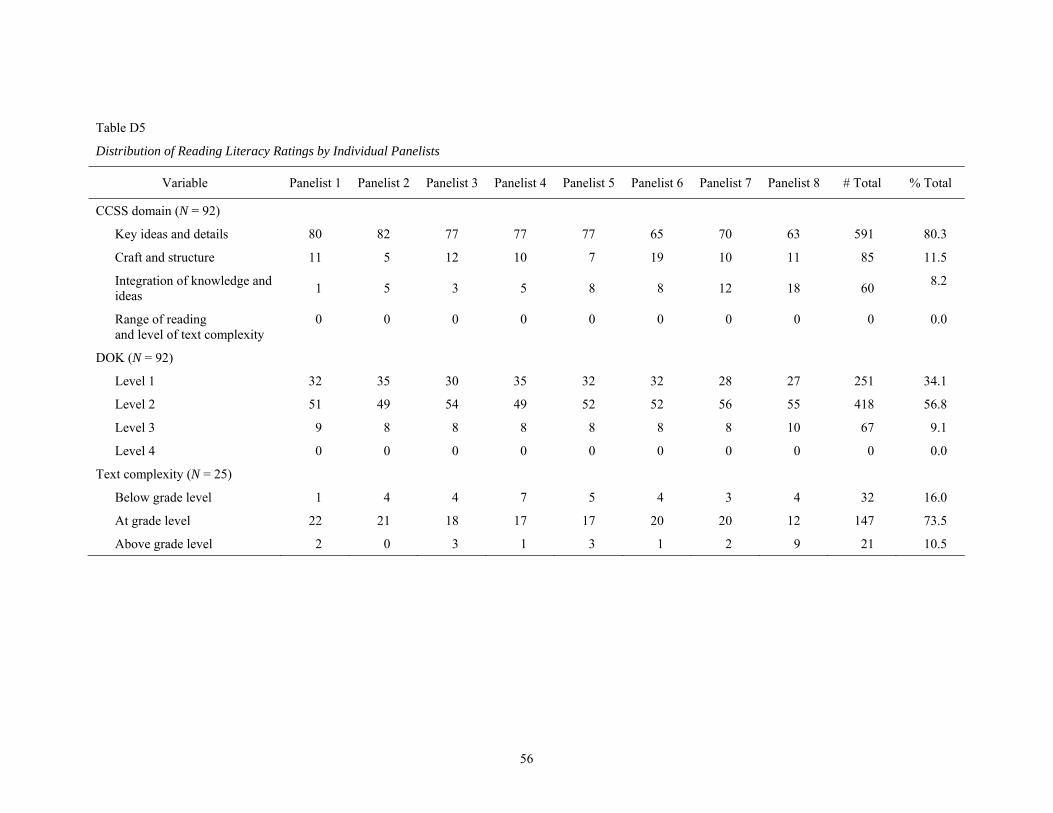
56
Table D5
Distribution of Reading Literacy Ratings by Individual Panelists
Variable Panelist 1 Panelist 2 Panelist 3 Panelist 4 Panelist 5 Panelist 6 Panelist 7 Panelist 8 # Total % Total
CCSS domain (N = 92)
Key ideas and details 80 82 77 77 77 65 70 63 591 80.3
Craft and structure 11 5 12 10 7 19 10 11 85 11.5
Integration of knowledge and ideas
1 5 3 5 8 8 12 18 60 8.2
Range of reading and level of text complexity
0 0 0 0 0 0 0 0 0 0.0
DOK (N = 92)
Level 1 32 35 30 35 32 32 28 27 251 34.1
Level 2 51 49 54 49 52 52 56 55 418 56.8
Level 3 9 8 8 8 8 8 8 10 67 9.1
Level 4 0 0 0 0 0 0 0 0 0 0.0
Text complexity (N = 25)
Below grade level 1 4 4 7 5 4 3 4 32 16.0
At grade level 22 21 18 17 17 20 20 12 147 73.5
Above grade level 2 0 3 1 3 1 2 9 21 10.5
57
Appendix E:
Mathematics Literacy Analyses
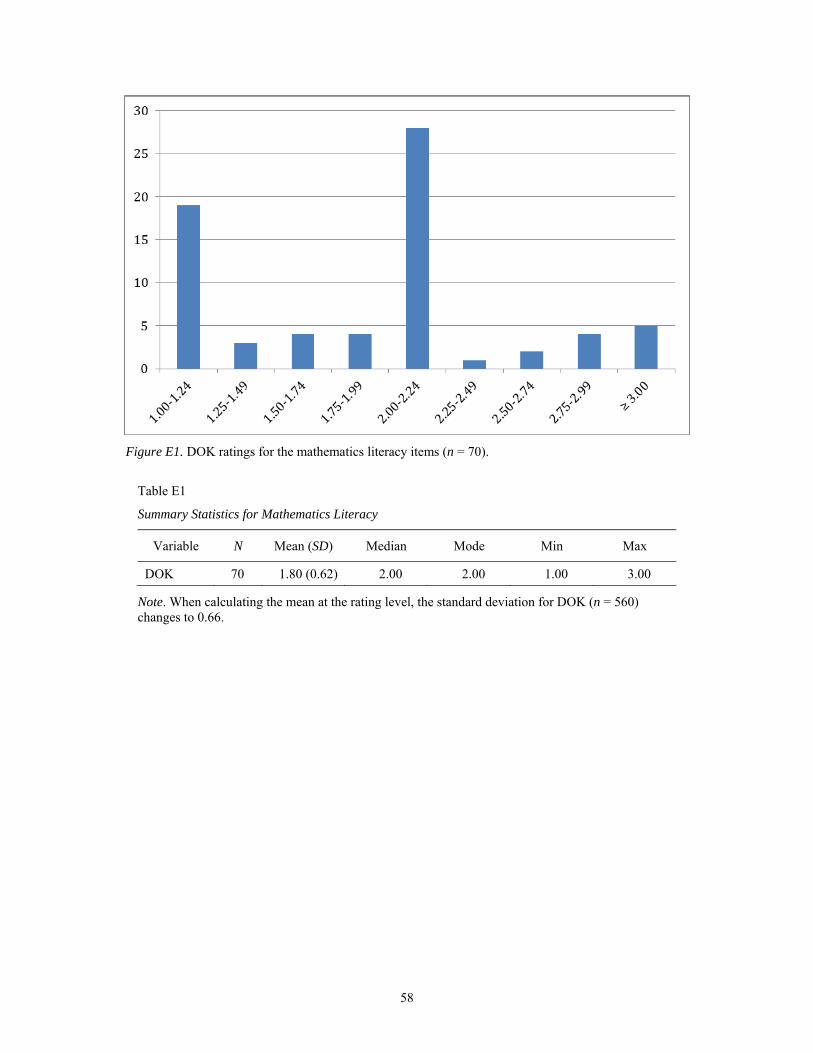
58
Figure E1. DOK ratings for the mathematics literacy items (n = 70).
Table E1
Summary Statistics for Mathematics Literacy
Variable N Mean (SD) Median Mode Min Max
DOK 70 1.80 (0.62) 2.00 2.00 1.00 3.00
Note. When calculating the mean at the rating level, the standard deviation for DOK (n = 560) changes to 0.66.
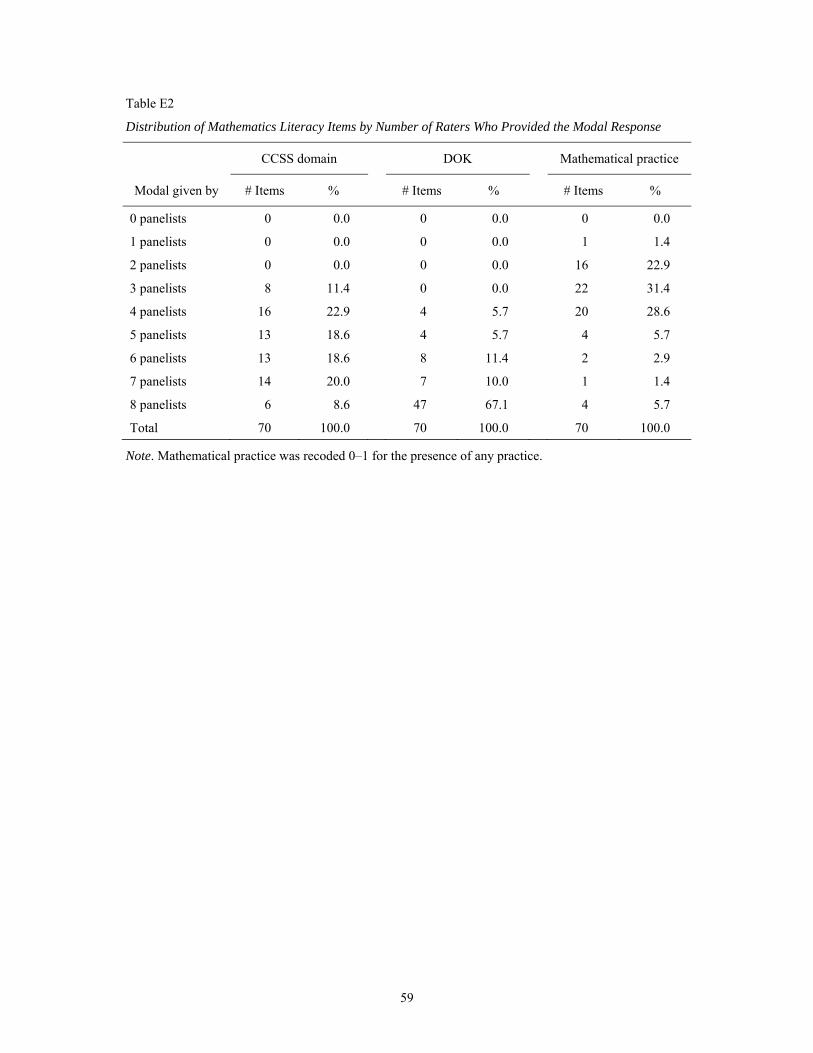
59
Table E2
Distribution of Mathematics Literacy Items by Number of Raters Who Provided the Modal Response
CCSS domain DOK Mathematical practice
Modal given by # Items % # Items % # Items %
0 panelists 0 0.0 0 0.0 0 0.0
1 panelists 0 0.0 0 0.0 1 1.4
2 panelists 0 0.0 0 0.0 16 22.9
3 panelists 8 11.4 0 0.0 22 31.4
4 panelists 16 22.9 4 5.7 20 28.6
5 panelists 13 18.6 4 5.7 4 5.7
6 panelists 13 18.6 8 11.4 2 2.9
7 panelists 14 20.0 7 10.0 1 1.4
8 panelists 6 8.6 47 67.1 4 5.7
Total 70 100.0 70 100.0 70 100.0
Note. Mathematical practice was recoded 0–1 for the presence of any practice.

60
Table E3
Detailed Distribution of CCSS Mathematics Domain Ratings by Individual Rater (N = 559)
Variable # Total % Total
Algebra
Elementary school: Operations and Algebraic Thinking 13 2.3
Middle school: Expressions and Equations 68 12.2
High school: Algebra 7 1.3
Total 88 15.7
Functions
Middle school: Functions 33 5.9
Middle school: Ratios and Proportional Relationships 98 17.5
High school: Functions 22 3.9
Total 153 27.4
Geometry
Elementary school: Geometry 6 1.1
Middle school: Geometry 87 15.6
High school: Geometry 19 3.4
Total 112 20.0
Modeling
High school: Modeling 14 2.5
Total 14 2.5
Numbers
Elementary school: Numbers and Operations – Fractions 3 0.5
Elementary school: Numbers and Operations in Base Ten 23 4.1
Middle school: The Number System 42 7.5
High school: Number and Quantity 1 0.2
Total 69 12.3
Statistics
Elementary school: Measurement and Data 12 2.1
Middle school: Statistics and Probability 92 16.5
High school: Statistics and Probability 19 3.4
Total 123 22.0
Note. One panelist failed to rate the primary domain for one mathematics item.
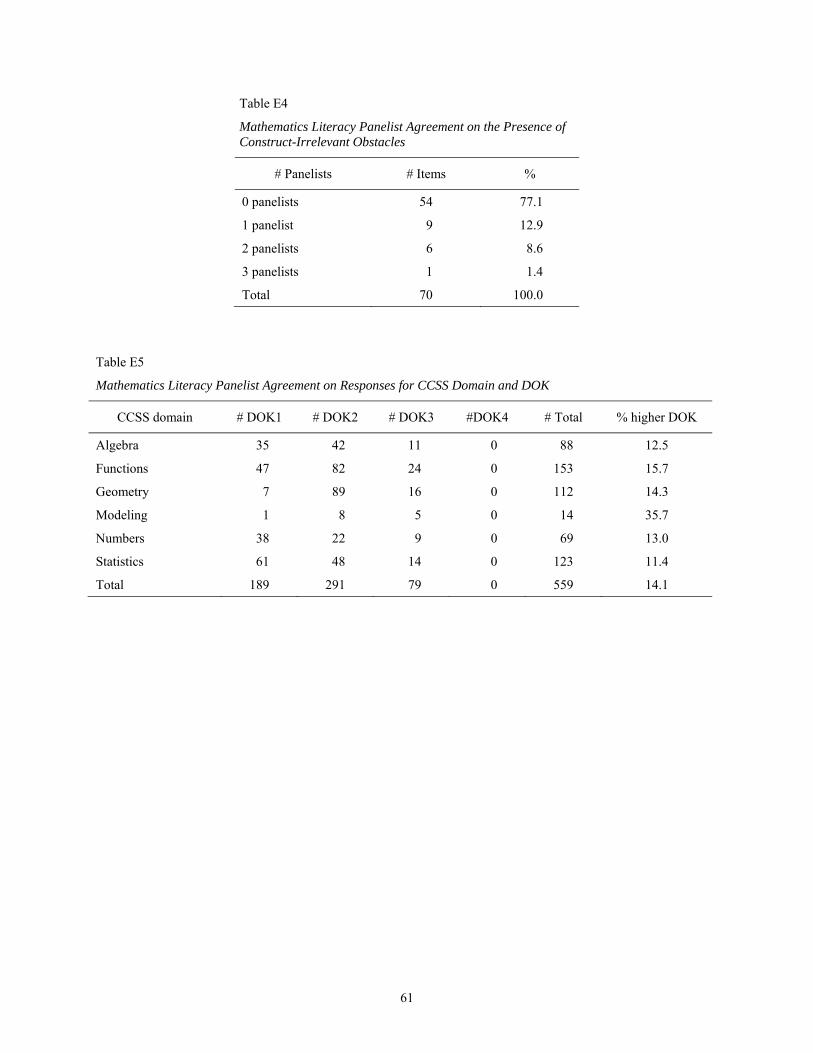
61
Table E4
Mathematics Literacy Panelist Agreement on the Presence of Construct-Irrelevant Obstacles
# Panelists # Items %
0 panelists 54 77.1
1 panelist 9 12.9
2 panelists 6 8.6
3 panelists 1 1.4
Total 70 100.0
Table E5
Mathematics Literacy Panelist Agreement on Responses for CCSS Domain and DOK
CCSS domain # DOK1 # DOK2 # DOK3 #DOK4 # Total % higher DOK
Algebra 35 42 11 0 88 12.5
Functions 47 82 24 0 153 15.7
Geometry 7 89 16 0 112 14.3
Modeling 1 8 5 0 14 35.7
Numbers 38 22 9 0 69 13.0
Statistics 61 48 14 0 123 11.4
Total 189 291 79 0 559 14.1
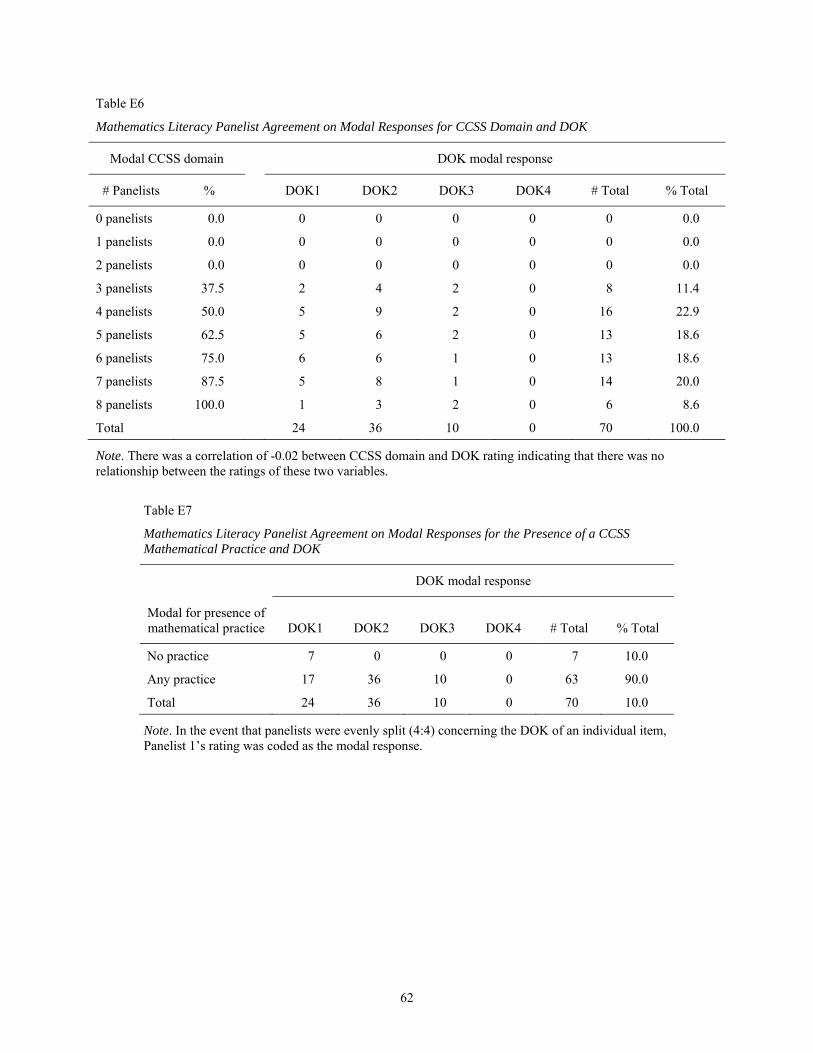
62
Table E6
Mathematics Literacy Panelist Agreement on Modal Responses for CCSS Domain and DOK
Modal CCSS domain DOK modal response
# Panelists % DOK1 DOK2 DOK3 DOK4 # Total % Total
0 panelists 0.0 0 0 0 0 0 0.0
1 panelists 0.0 0 0 0 0 0 0.0
2 panelists 0.0 0 0 0 0 0 0.0
3 panelists 37.5 2 4 2 0 8 11.4
4 panelists 50.0 5 9 2 0 16 22.9
5 panelists 62.5 5 6 2 0 13 18.6
6 panelists 75.0 6 6 1 0 13 18.6
7 panelists 87.5 5 8 1 0 14 20.0
8 panelists 100.0 1 3 2 0 6 8.6
Total 24 36 10 0 70 100.0
Note. There was a correlation of -0.02 between CCSS domain and DOK rating indicating that there was no relationship between the ratings of these two variables.
Table E7
Mathematics Literacy Panelist Agreement on Modal Responses for the Presence of a CCSS Mathematical Practice and DOK
DOK modal response
Modal for presence of mathematical practice DOK1 DOK2 DOK3 DOK4 # Total % Total
No practice 7 0 0 0 7 10.0
Any practice 17 36 10 0 63 90.0
Total 24 36 10 0 70 10.0
Note. In the event that panelists were evenly split (4:4) concerning the DOK of an individual item, Panelist 1’s rating was coded as the modal response.

63
Table E8
Mathematical Literacy Panelist Agreement on Modal Responses for the Presence of Specific CCSS Mathematical Practices and DOK
DOK modal response
Mathematical practice DOK1 DOK2 DOK3 DOK4 # Total % Total
No practice 104 59 5 0 168 30.1
Practice 1 31 80 19 0 130 23.3
Practice 2 14 46 15 0 75 13.4
Practice 3 9 30 4 0 43 7.7
Practice 4 4 21 17 0 42 7.5
Practice 5 5 8 2 0 15 2.7
Practice 6 13 13 1 0 27 4.8
Practice 7 6 26 13 0 45 8.1
Practice 8 3 8 3 0 14 2.5
Total 189 291 79 0 559 100.0
Note. In the event that panelists were evenly split (4:4) concerning the DOK of an individual item, Panelist 1’s rating was coded as the modal response.
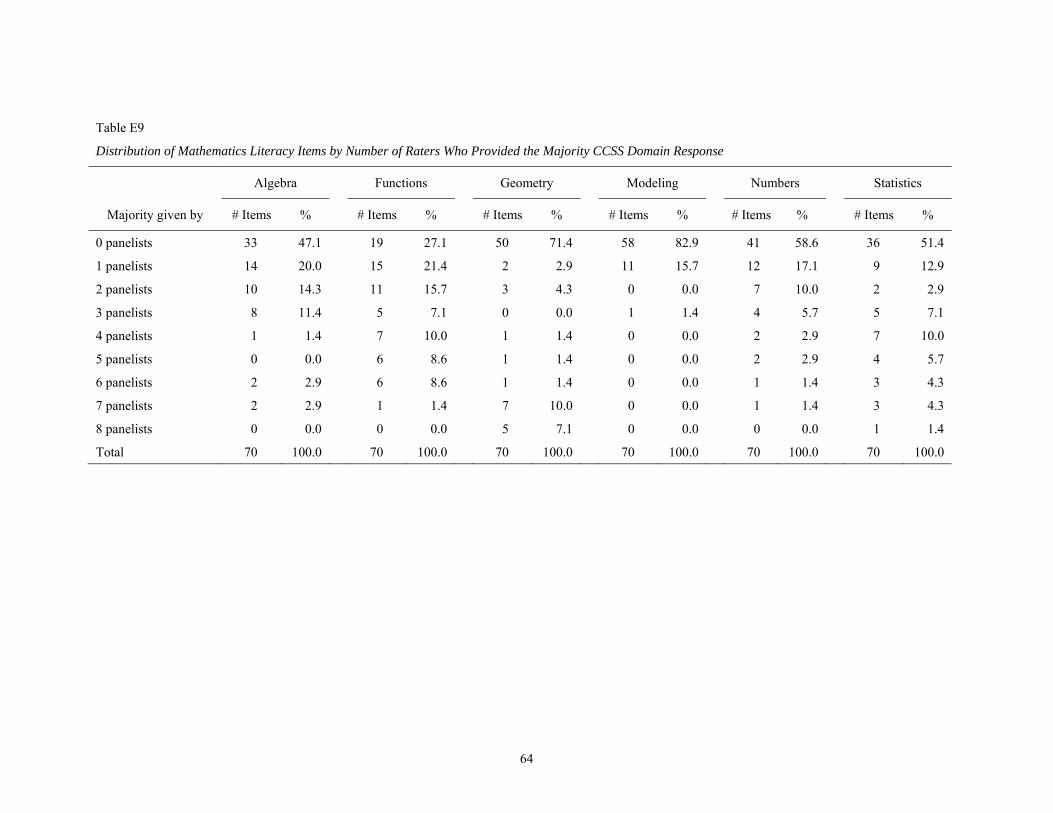
64
Table E9
Distribution of Mathematics Literacy Items by Number of Raters Who Provided the Majority CCSS Domain Response
Algebra Functions Geometry Modeling Numbers Statistics
Majority given by # Items % # Items % # Items % # Items % # Items % # Items %
0 panelists 33 47.1 19 27.1 50 71.4 58 82.9 41 58.6 36 51.4
1 panelists 14 20.0 15 21.4 2 2.9 11 15.7 12 17.1 9 12.9
2 panelists 10 14.3 11 15.7 3 4.3 0 0.0 7 10.0 2 2.9
3 panelists 8 11.4 5 7.1 0 0.0 1 1.4 4 5.7 5 7.1
4 panelists 1 1.4 7 10.0 1 1.4 0 0.0 2 2.9 7 10.0
5 panelists 0 0.0 6 8.6 1 1.4 0 0.0 2 2.9 4 5.7
6 panelists 2 2.9 6 8.6 1 1.4 0 0.0 1 1.4 3 4.3
7 panelists 2 2.9 1 1.4 7 10.0 0 0.0 1 1.4 3 4.3
8 panelists 0 0.0 0 0.0 5 7.1 0 0.0 0 0.0 1 1.4
Total 70 100.0 70 100.0 70 100.0 70 100.0 70 100.0 70 100.0
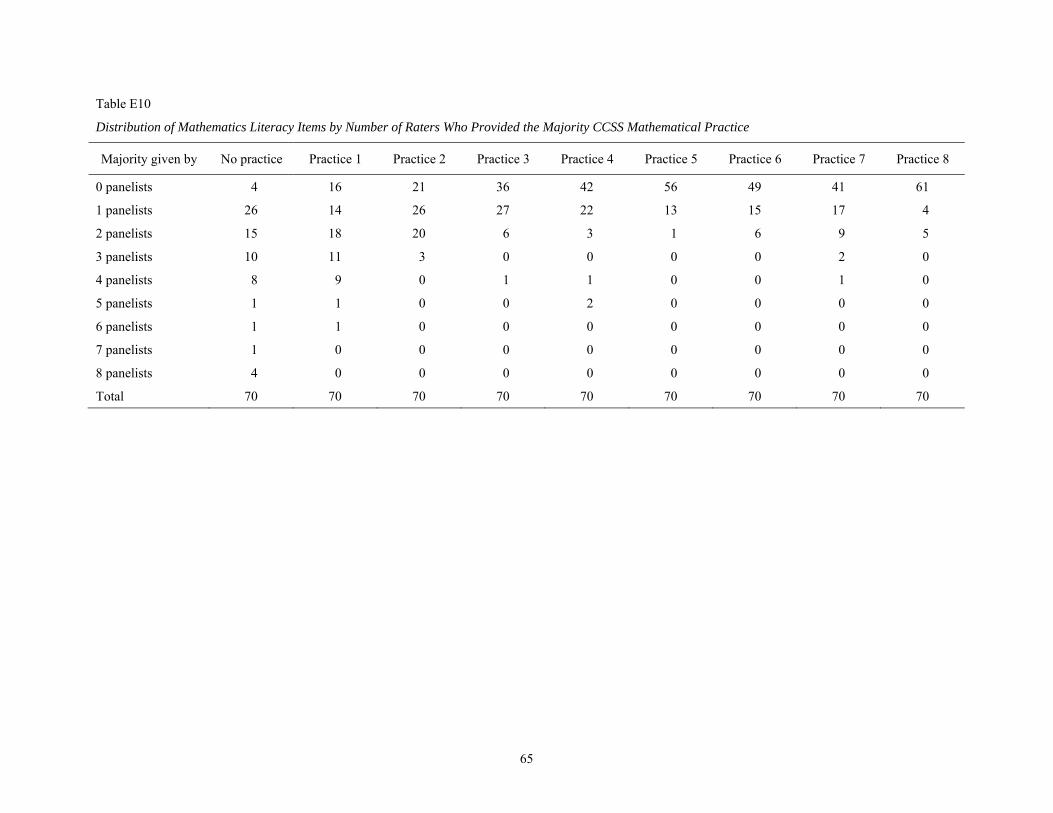
65
Table E10
Distribution of Mathematics Literacy Items by Number of Raters Who Provided the Majority CCSS Mathematical Practice
Majority given by No practice Practice 1 Practice 2 Practice 3 Practice 4 Practice 5 Practice 6 Practice 7 Practice 8
0 panelists 4 16 21 36 42 56 49 41 61
1 panelists 26 14 26 27 22 13 15 17 4
2 panelists 15 18 20 6 3 1 6 9 5
3 panelists 10 11 3 0 0 0 0 2 0
4 panelists 8 9 0 1 1 0 0 1 0
5 panelists 1 1 0 0 2 0 0 0 0
6 panelists 1 1 0 0 0 0 0 0 0
7 panelists 1 0 0 0 0 0 0 0 0
8 panelists 4 0 0 0 0 0 0 0 0
Total 70 70 70 70 70 70 70 70 70
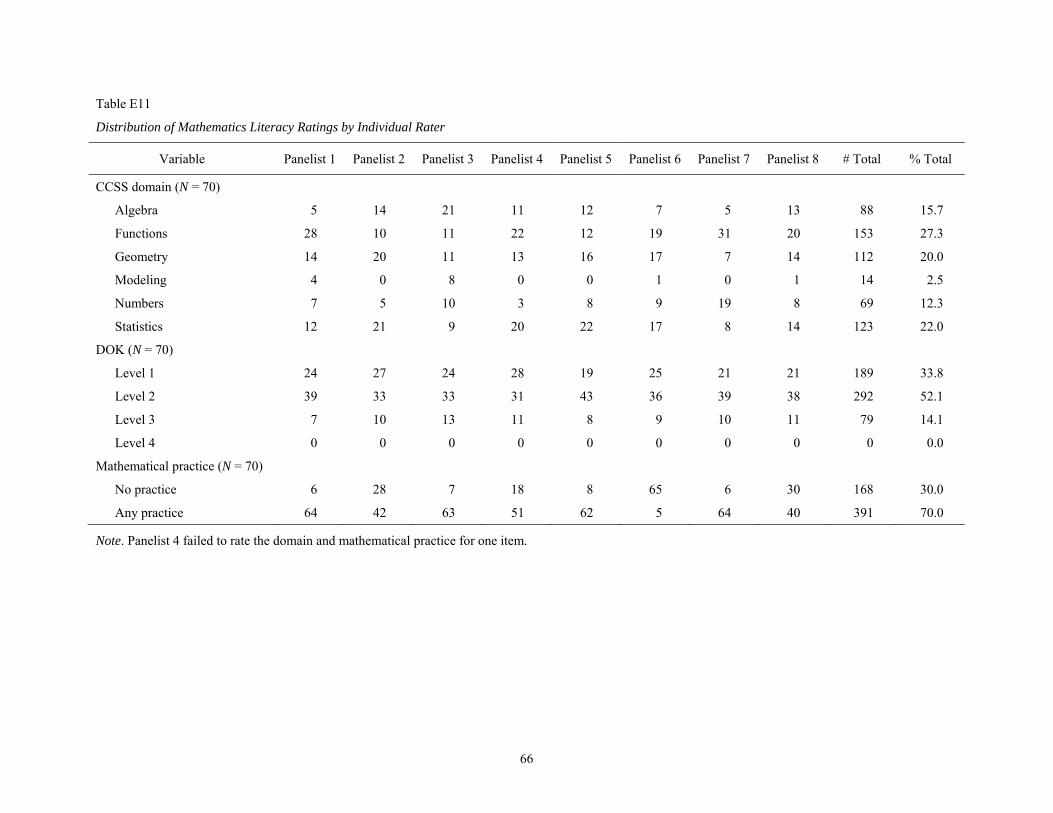
66
Table E11
Distribution of Mathematics Literacy Ratings by Individual Rater
Variable Panelist 1 Panelist 2 Panelist 3 Panelist 4 Panelist 5 Panelist 6 Panelist 7 Panelist 8 # Total % Total
CCSS domain (N = 70)
Algebra 5 14 21 11 12 7 5 13 88 15.7
Functions 28 10 11 22 12 19 31 20 153 27.3
Geometry 14 20 11 13 16 17 7 14 112 20.0
Modeling 4 0 8 0 0 1 0 1 14 2.5
Numbers 7 5 10 3 8 9 19 8 69 12.3
Statistics 12 21 9 20 22 17 8 14 123 22.0
DOK (N = 70)
Level 1 24 27 24 28 19 25 21 21 189 33.8
Level 2 39 33 33 31 43 36 39 38 292 52.1
Level 3 7 10 13 11 8 9 10 11 79 14.1
Level 4 0 0 0 0 0 0 0 0 0 0.0
Mathematical practice (N = 70)
No practice 6 28 7 18 8 65 6 30 168 30.0
Any practice 64 42 63 51 62 5 64 40 391 70.0
Note. Panelist 4 failed to rate the domain and mathematical practice for one item.
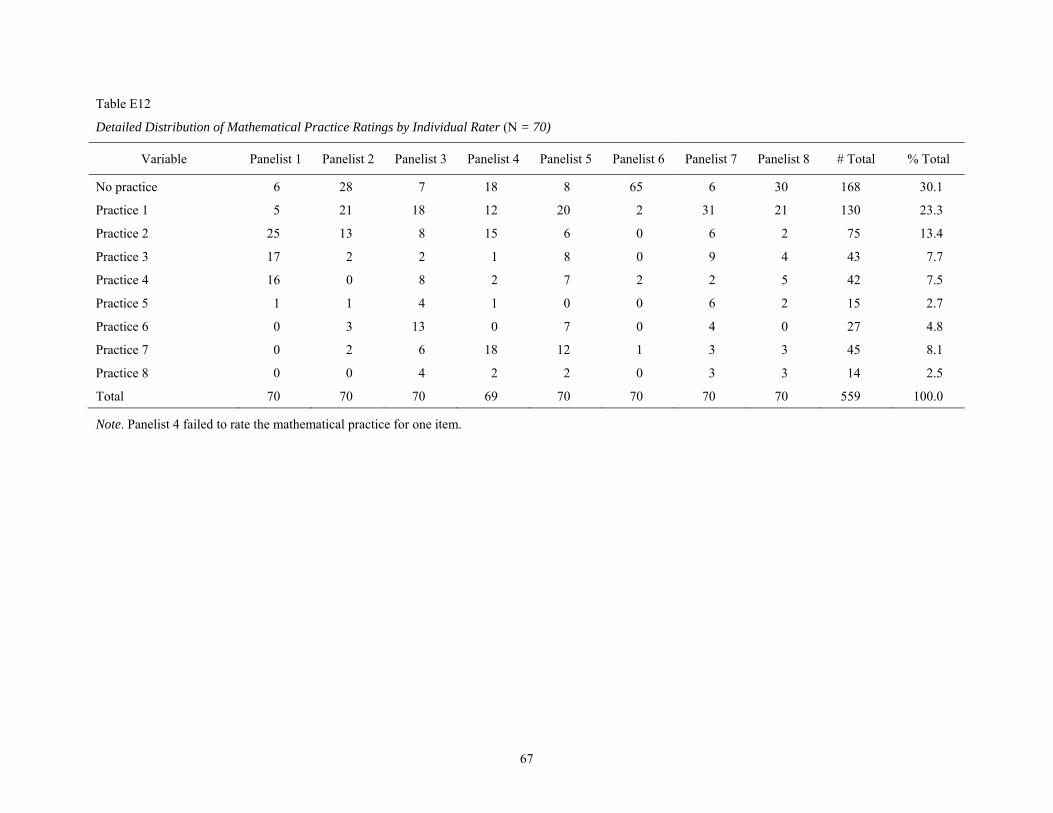
67
Table E12
Detailed Distribution of Mathematical Practice Ratings by Individual Rater (N = 70)
Variable Panelist 1 Panelist 2 Panelist 3 Panelist 4 Panelist 5 Panelist 6 Panelist 7 Panelist 8 # Total % Total
No practice 6 28 7 18 8 65 6 30 168 30.1
Practice 1 5 21 18 12 20 2 31 21 130 23.3
Practice 2 25 13 8 15 6 0 6 2 75 13.4
Practice 3 17 2 2 1 8 0 9 4 43 7.7
Practice 4 16 0 8 2 7 2 2 5 42 7.5
Practice 5 1 1 4 1 0 0 6 2 15 2.7
Practice 6 0 3 13 0 7 0 4 0 27 4.8
Practice 7 0 2 6 18 12 1 3 3 45 8.1
Practice 8 0 0 4 2 2 0 3 3 14 2.5
Total 70 70 70 69 70 70 70 70 559 100.0
Note. Panelist 4 failed to rate the mathematical practice for one item.