beneficiation of iron-copper ores from kasaan peninsula...
TRANSCRIPT

Bureau of MinesReport of Investigations 5312
4
BENEFICIATION OF IRON-COPPER ORES
FROM KASAAN PENINSULA,
PRINCE OF WALES ISLAND, ALASKA
BY R. R. WELLS, E. G. ERSPAMER, AND F. T. STERLING
- United States Department of the Interior--February 1957
-

I
BENEFICIATION OF IRON-COPPER ORES
FROM KASAAN PENINSULA,
PRINCE OF WALES ISLAND, ALASKA
BY R. R. WELLS, E. G. ERSPAMER, AND F. T. STERLING
* * * * * * * * Report of Investigations 5312
UNITED STATES DEPARTMENT OF THE INTERIORFred A. Seaton, Secretary
BUREAU OF MINESMarling J. Ankeny, Director
Work on manuscript completed August 1956. The Bureau of Mines will welcome reprinting of this paper, providedthe following footnote acknowledgment is made: "Reprinted from Bureau of Mines Reportof Investigations5312."
February 1957

BENEFICIATION OF IRON-COPPER ORES FROM KASAAN PENINSULA,PRINCE OF WALES ISLAND, ALASKA
by
R. R. Wells,- / E. G. Erspamer, 2/ and F. T. Sterling2/
CONTENTSPage
Summary ....................................................... 1
Introduction ......................................... .......... 2
The ore ...................................................... 2
Samples ................................... , .......... 2
Physical character ...................................... ... 5
Poorman ore ...................................... ... 5
Rush & Brown ore .................................... 5
Copper Center ore .....................................
Chemical character ........................................ 5
Methods of concentration ....................................... 6
Direct wet magnetic separation ............................ 7
Two-stage magnetic separation ............................. 9
Magnetic separation followed by flotation ................ 10
Flotation followed by magnetic separation .................. 12
Sintering ................................................ 14
Flowsheet ............................................ .... 14
/ Supervising metallurgist, Bureau of Mines, Region I, JuneauAlaska.
2/ Formerly metallurgist, Bureau of Mines, Region I, Juneau, Alaska.3/ Extractive metallurgist, Bureau of Mines, Region I, Juneau, Alaska.
Report of Investigations 5312

ii
Fig. Page
1. Index map of southeastern Alaska ......................... 3
2. Vicinity map, Kasaan Peninsula ........................... 4
3. Suggested flowsheet ...................................... 15
TABLES
1. Summary of results ........................................ 1
2. Chemical analyses ....................................... 6
3. Spectrographic analyses ............................. 6.... 6
4. Wet magnetic separation, Poorman ......................... 7
5. Wet magnetic separation, Rush & Brown .................... 8
6. Wet magnetic separation, Copper Center ................... 9
7. Two-stage magnetic separation, Poorman ................... 10
8. Magnetic separation followed by flotation, Poorman ....... 10
9. Magnetic separation and flotation, Rush & Brown ........... 11
10. Magnetic separation and flotation, Copper Center ......... 11
11. Flotation followed by magnetic separation, Poorman ....... 12
12. Flotation and magnetic separation, Rush & Brown .......... 12
13. Flotation and magnetic separation, Copper Center .......... 13
14. Sintering results ........................................ 14

1
SUMMARY
This report summarizes the results of laboratory testing of copper-bearingmagnetite ore from the Poorman, Rush & Brown, and Copper Center deposits, KasaanPeninsula, Prince of Wales Island, southeastern Alaska. The ores contain minoramounts of chalcopyrite and pyrite. Intimate association of these sulfides withmagnetite necessitates fine grinding for adequate liberation and rejection of copperand sulfur and for the production of high-grade iron concentrate low in objection-able impurities.
Laboratory tests indicated that the optimum results can be obtained by flota-tion of ore ground to minus-100-mesh, with subsequent wet magnetic separation treat-ment of the flotation tailing. A summary of results obtained by this treatment ofthe three samples tested is shown in table 1.
TABLE 1. - Summary of results
Copper concentrateIron concentrate Grade
Head Grade Distb., Assay, Distb.,Assay, percent Assa prcent percent percent percent
Ore Fe Cu S F Cu S Fe Cu CuPoorman ...... 55.2 0.32 3.86 6. 0.03 0.03 88. 25.1 69.3Rush & Brown.. 54.6 1.10 2.32 68.2 .10 .9 88.9 24.6 70.6Copper Center. 50.6 1.85 3.73 0.3 . .06 86.8 19.3 87.2
The three ores were amenable to flotation and magnetic separation treatment forthe production of high-grade magnetite concentrate of low copper content. The methodwas effective for virtually complete removal of sulfur from the Poorman and CopperCenter ores. The concentrate made from Rush & Brown ore contained 0.9 percent S;subsequent sintering, however, reduced the sulfur content to 0.15 percent. Totaliron recovery ranged from 87 to 89 percent; this represents a recovery of approxi-mately 99 percent of the magnetite present.
Cleaning of the flotation concentrates yielded copper products that assayed 19to 25 percent Cu. Copper recovery ranged from 69 to 87 percent, depending upon thecopper content of the various samples.
A similar method is in actual commercial use in eastern Pennsylvania, whereore from the Cornwall mine is crushed, concentrated and sintered profitably by theBethlehem Steel Corp.

2
INTRODUCTION
Early in the century numerous deposits of copper ore were discovered on KasaanPeninsula, Prince of Wales Island, Alaska (fig. 1); a smelting plant was built atHadley, and shipments of ore were made from several mines. Deposits of magnetitewere found to be associated closely with the copper ores but were not exploited.In 1915 Wright4/ reported:
The only iron ore found in Kasaan Peninsula and the Copper Mountainarea is magnetite which occurs in large bodies along contacts of dioritesand limestones. No special study has been made of these deposits, whichhave been developed only in connection with the mining of the copper ores....The utilization of these iron ores would seem to be a metallurgical problem,as there is no question that they occur in quantities that should make themcommercially valuable.
In 1942 to 1944 the Bureau of Mines examined the more promising magnetite bod-ies by trenching, diamond drilling, and sampling.5 6 7 8 9/ Preliminary mineral-dressing studies were conducted on Poorman ore and on Mount Andrew ore. It wasdetermined that the ores are similar; they consist of irregular contact metamorphicdeposits of magnetite and quartz with minor amounts of chalcopyrite and pyrite.Because copper and sulfur are detrimental in iron and steel processing, the oreswould require beneficiation treatment to fit them for blast-furnace use.
Although the known reserves of individual deposits are relatively small, thecombined reserves within a limited area have been indicated to be substantial;therefore the purpose of this laboratory investigation was to develop a simplemethod of concentration that would be applicable to each of the deposits.
THE ORE
Samples
During a field investigation in the Kasaan Peninsula area (fig. 2), samplesfor metallurgical testing were obtained from the Poorman, Rush & Brown, and Copper
4/ Wright, Charles Will, Geology and Ore Deposits of Copper Mountain and KasaanPeninsula, Alaska: Geol. Survey Prof. Paper 87, 1915, 110 pp.
5/ Wright, W. S., and Posse, E. L., Exploration of the Jumbo Basin Iron Deposit,Prince of Wales Island, Southeastern Alaska: Bureau of Mines Bept. of In-vestigations 3952, 1946, 9 pp.
6/ Wright, W. S., and Tolonen, A. W., Mount Andrew Iron Deposit, Kasaan Peninsula,Prince of Wales Island, Southeastern Alaska: Bureau of Mines Rept. ofInvestigations 4129, 1947, 27 pp.
7/ Holt, S. P., and Sanford, Robert S., Poor Man Iron Deposit, Kasaan Peninsula,Prince of Wales Island, Southeastern Alaska: Bureau of Mines Report ofInvestigations 3956, 1946, 8 pp.
8/ Holt, S. P., Shepard, J. G., Thorne, R. L., Tolonen, A. W., and Fosse, E. L.,Diamond Drilling at Rush & Brown Copper Mine, Kasaan Bay, Prince of WalesIsland, Southeastern Alaska: Bureau of Mines Rept. of Investigations 4349,1948, 7 pp.
9/ Erickson, Aner W., Investigation of Tolstoi Mountain Iron Deposits, KasaanPeninsula, Prince of Wales Island, Southeastern Alaska: Bureau of MinesRept. of Investigations 4373, 1948, 5 pp.

Figure 1. - Index map of southeastern Alaska. (Modified from mop of Geological Survey.) UJ

Figure 2. - Vicinity map, Kasaan Peninsula.

5
Center properties. A suite of samples was taken from old adits and trenches at thePoorman mine; the individual samples were assayed and blended to produce a compositewhich, as nearly as possible, was representative of the ore body as determined byprevious field work.l1/ The samples from the Rush & Brown and the Copper Centerproperties were, of necessity, procured from ore dumps near the portals of thesemines. Consequently, the chemical analyses of these samples may be at variance withthe average grade of the deposits. The samples tested, however, are believed to berepresentative of the ore of the Rush and Brown and the Copper Center mines in regardto physical and mineralogical nature.
Physical Character
Poorman Ore
The Poorman ore, as represented by the composite sample, contains magnetitewith relatively small amounts of associated pyrite, chalcopyrite, calcite, alteredamphibole and clinopyroxene, chlorite, quartz, altered feldspar, epidote, andlimonite. Traces of malachite and apatite are also present.
The magnetite essentially is liberated in the minus-100-, plus-200-mesh frac-tion; however, a small amount of the fine-grained material remains locked with cal-cite and ferromagnesian minerals in the minus-200-mesh material. The chalcopyriteessentially is liberated in the minus-35-, plus-48-mesh size range.
Rush & Brown Ore
The sample of Rush & Brown ore submitted to the laboratory essentially containsmagnetite, with some associated calcite, quartz, chalcopyrite, pyrite, chlorite,pyrrhotite, and limonite and small amounts of malachite and azurite.
Much of the chalcopyrite and malachite is liberated in the plus-200-mesh frac-tion. Because of the intimate association of the copper minerals with the otherminerals of this sample, however, complete liberation does not take place, even inthe minus-200-mesh.
Copper Center Ore
The sample of Copper Center ore essentially contains magnetite, with some as-sociated quartz, chlorite, chalcopyrite, epidote, limonite, and small amounts ofcalcite, pyrite, malachite, amphibole, and azurite.
Much of the chalcopyrite, malachite, and azurite is liberated in the plus-200-mesh fraction. Complete liberation is not effected, however, even in the minus-200-mesh size range, because of intimate association of the copper minerals with magnet-ite and quartz.
Chemical Character
Chemical analyses of representative portions of the ores are shown in table 2.
l0/ Work cited in footnote 7 (p. 2).

6
TABLE 2. - Chemical analyses
Assa, percent Oz. per tonOre Fe Cu S P CaO MgO Si02 Au Ag
Poorman ..... 55.2 0.32 3.8 0.03 3.2 1.3 9.7 0.02 0.03Rush & Brown. 54.6 1.10 2.32 _J.O1 4.0 .9 6.6 .01 Tr.Copper Center 50.6 1.85 3.73 1/.01 2.6 .9 13.4 .05 .251/ Less than.
Semiquantitative spectrographic analyses indicated the presence and approximateamounts of the metals shown in table 3. Any other elements, if present, are inamounts less than the minimum detectable by the routine method used.
TABLE 3. - Spectrographic analyses
Ore Al As C Co Fe MnMoNa Ni Si Ti BPoorman ......... D- - E - D- A F E - - F D E FRush & Brown ...... C - C F C A C D E- - F A E -Copper Center ..... C D C - C A C- D - D F A E
Legend: A More than 10 percent. D 0.1 to 1 percent.B 5 to 10 percent. E 0.01 to 0.1 percent.C 1 to 5 percent. F 0.001 to 0.01 percent.
METHODS OF CONCENTRATION
Iron ore is a relatively low-priced commodity. Mineral-dressing treatment,therefore must be simple and inexpensive if the beneficiated product is to competewith direct-smelting ores. In addition, the beneficiated product must be made toconform to chemical and physical requirements for blast-furnace feed.
Inasmuch as smelting costs rise rapidly with the amount of slag-forming con-stituents in the ore, the ideal blast-furnace feed should be as high in iron and aslow in silica content as possible. Both sulfur and phosphorus are deleterious,hence only minor amounts of these impurities are allowable. The presence of copperin significant quantities is considered undesirable. The physical condition of thefeed is as important as its chemical composition. The product should be free oflumps greater than 6 inches in diameter and also should be free of fine material.Fine concentrate, therefore, requires sintering or nodulizing to meet physicalspecifications.
During this investigation, laboratory testing was directed toward productionof a concentrate that contained at least 65 percent Fe, with a maximum of 0.10 per-cent each Cu and S. None of the ores tested contained appreciable amounts of phos-phorus; consequently elimination of this element imposed no problem.
Because of the fine-grained nature of the ores, concentration testing was re-stricted to wet magnetic separation and flotation methods. Preliminary sinteringtests were made on beneficiated products to determine the effectiveness of sinter-ing for elimination of sulfur.

7
Direct Wet Magnetic Separation
To determine the degree of grinding necessary to effect rejection of copperand sulfur, samples of Poorman ore were ground to pass various screens ranging from10- to 325-mesh. Each ground portion was treated in a low-intensity wet magneticseparator (Davis-tube type) to produce magnetic and nonmagnetic fractions. Similartreatment was given samples of Rush & Brown and Copper Center ores at sizes rangingfrom minus-20-mesh to minus-325-mesh. Results, showing iron, copper, silica, andsulfur contents, together with the distribution of these elements in each fraction,are summarized in tables 4, 5, and 6.
TABLE 4. - Wet magnetic separation, Poorman
Grind Weight sAssay,percent Distribution, percent(mesh) Product percent Fe Cu SiO2 S Fe Cu SiO2 S
Minus-10 Magnetic l81.91 63.5 0.18 5.80 1.10 93.2 41.6 51.1 244Nonmag. 18.09 21.1 1.14 25.1 15.5 6.8 58.4 48.9 17.6Calc. head 100.00 55.8 .35 9.3 3.70 100.0 100.0 00 .0 100.0
Minus-20 Magnetic 78.35 63.9 .14 5.72 1.04 93.0 30.9 48.8 21.2Nonmag. 21.65 17.5 1.12 21.7 14.0 7.0 69.1 51.2 78.8Calc. head 100.00 53.9 .35 9.2 3.85 100.0 100.0 100.0 100.0
Minus-35 Magnetic 76.87 64.8 .12 5.68 .68 92.1 27.4 45.0 14.8Nonmag. 23.13 18.5 1.10 23.1 13.0 7.9 72.6 55.0 85.2Calc. head 100.00 54.1 .35 9.7 3.53 100.0 100.0 100.0 100.0
Minus-48 Magnetic 75.86 65.6 .11 5.08 .51 91.3 23.5 40.9 11.0Nonmag. 24.14 19.7 1.12 23.1 13.0 8.7 76.5 59.1 89.0Calc. head 100.00 54.5 .35 9.4 3.52 100.0 100.0 100.0 100.0
Minus-65 Magnetic 74.91 67.2 .09 4.62 .25 91.0 19.3 38.0 5.1Nonmag. 25.09 19.8 1.12 22.5 13.9 9.0 80.7 62.0 94.9Calc. head 100.00 55.3 .35 9.1 3.68 100.0 100.0 100.0
Minus-100 Magnetic 73.32 67.2 .09 4.30 .05 91.0 18.8 32.5 1.1Nonmag. 26.68 18.3 1.07 24.6 12.0 9.0 81.2 67. _98.9Calc. head 100.00 54.2 .35 9.7 3.24 100.0 100.0 100.0 100.0
Minus-150 Magnetic 73.28 68.6 .07 3.80 .04 90.6 14.7 30.7 0.8Nonmag. 26.72 19.6 1.11 23.5 13.1 9.4 85.3 69.3 99.2Calc. head 100.00 55.5 .35 9.1 3.53 100.0 100. 1.0 100.0 100.0
Minus-200 Magnetic 73.19 68.6 .04 3.48 .02 90.3 8.2 28.7 .5Nonmag. 26.81 20.6 1.21 23.6 13.0 Q9.7 91.8 71.3 99.5Calc. head 100.00 55.6 .35 8.9 3.50 100.0 100.0 100.0 100.0
Minus-325 Magnetic 73.03 69.0 .03 3.24 1/.01 89.6 6.5 25.2 .1Nonmag. 26.97 21.6 1.18 26.0 14.3 10.4 93.5- 74.8 99-9C__alc. head 100.00 -1 .2 .34 9.4 3.86 10 100.0 1000.0 100.0
l/ Less than.

8
TABLE 5. - Wet magnetic separation, Rush & Brown
Grind Weight, Assay, ercent Distribution, percent(mesh) Product percent Fe Cu Si02 S Fe Cu Si02 S
Minus-20 Magnetic 84.23 63.0 0.26 T4. 1.2 93.9 22.1 58.9 40.8Nonmag. 15.77 21.7 4.9 17.5 9.3 6.1 77.9 41.1 59.2Calc. head 100.00 56.5 1.00 6.7 2.48 .O 100.0 100.0 100.0000 00
Minus-35 Magnetic 82.21 64.0 .20 3.7 1.1 93.5 17.0 46.6 37.7Nonmag. 17.79 20.6 4.5 19.7 8.4 6.5 83.0 53.4 62.3Calc. head 100.00 56.3 .95 6.5 2.40 100.0 100.0 100.0 100.0
Minus-48 Magnetic 79.54 64.6 .14 3.3 .90 92.3 11.7 39.8 30.4Nonmag. 20.46 21.0 4.1 19.4 8.0 7.Z 88.3 60.2 69.6Calc. head 100.0 55.7 .95 6.6 2.35 100.0 100.0 100.0 100.0
Minus-65 Magnetic 78.92 66.2 .10 3.0 .88 92.2 8.4 35.5 30.0Nonmag. 21.08 21.2 4.3 20.4 7.7 7.8 91.6 64.5 70.0Calc. head 100.00 56.7 .95 6.7 2.32 100.0 100.0 100.0 100.0
Minus-100 Magnetic 78.65 66.3 .08 2.9 .85 91.7 6.6 34.3 29.2Nonmag. 21.35 22.0 4.2 20.5 7.6 8.3 93.4 65.7 70.8Calc. head 100.00 56.8 .95 6.7 2.29 100.0 100.0 100.0 100.0
Minus -150 Magnetic 78.62 66.4 .08 2.4 .82 91.7 6.6 29.5 27.6Nonmag. 21.38 22.1 4.2 21.1 7.9 8.3 93.4 70.5 72.4Calc. head 100.00 56.9 .95 6.4 2.33 100.0 100.0 100.0 100.0
Minus-200 Magnetic 76.41 67.4 .08 2.3 .80 90.5 6.5 26.1 27.0Nonmag. 23.59 22.8 3.7 21.1 7.0 9.5 935 73.9 73.0Calc. head 100.00 56.9 .95 6.7 2.26 100.0 100.0 100.0 100.0
Minus-325 Magnetic 75.71 67.4 .06 2.2 .78 90.2 4.5 24.4 25.5Nonmag. 24.29 22.8 3.9 21.2 7.1 9.8 95.5 75.6 74.5Calc. head 100.00 56.6 1.00 6.8 2.32 100.0 100.0 100.0 100.0
9
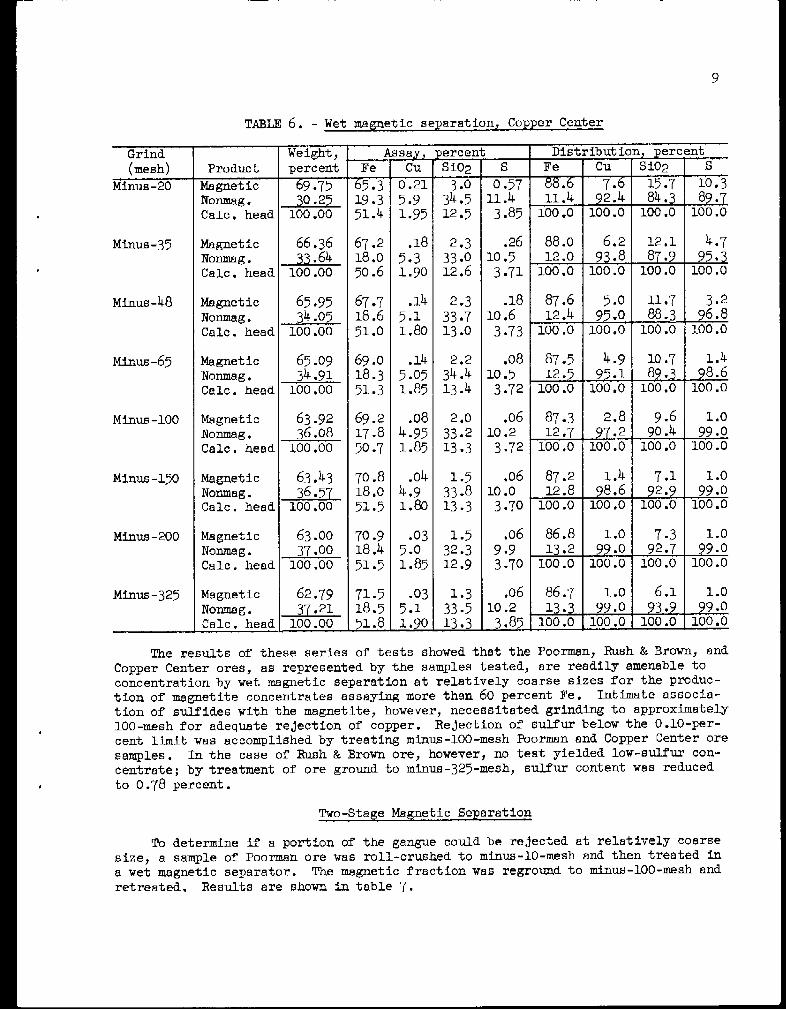
TABLE 6. - Wet magnetic separation, Copper Center
Grind Weight, Assay, percent Distribution, percent(mesh) Product percent Fe Cu Si02 S Fe Cu Siop S
Minus-20 Magnetic 69.75 5.3 0.21 3.0 0.57 588 7.6 15.7 10.3Nonmag. 30.25 19.3 5.9 34.5 11.4 1.4 21.4 4 84.3 897Calc. head 100.00 51.4 1.95 12.5 3.85 100.0 100.0 100. 0 1.
Minus-35 Magnetic 66.36 67.2 .18 2.3 .26 88.0 6.2 12.1 4.7Nonmag. 33.64 18.0 5.3 33.0 10.5 12.0 93.8 87.9 95.3Calc. head 100.00 50.6 1.90 12.6 3.71 100.0 100.0 100.0 100.0
Minus-48 Magnetic 65.95 67.7 .14 2.3 .18 87.6 5.0 11.7 3.2Nonmag. 34.05 18.6 5.1 33.7 10.6 12.4 95.0 88.3 96.8Calc. head 100.00 51.0 1.80 13.0 3.73 100.0 100.0 100.0 100.0
Minus-65 Magnetic 65.09 69.0 .14 2.2 .08 87.5 4.9 10.7 1.4Nonmag. 34.91 18.3 5.05 34.4 10.5 12.5 95.1 89.3 98.6Calc. head 100.00 51.3 1.85 13.4 3.72 100.0 100.0 100.0 100.0
Minus-100 Magnetic 63.92 69.2 .08 2.0 .06 87.3 2.8 9.6 1.0Nonmag. 36.08 17.8 4.95 33.2 10.2 12.7 97.2 90.4 99.¢Calc. head 100.00 50.7 1.85 13.3 3.72 100.0 100.0 100.0 100.0
Minus-150 Magnetic 63.43 70.8 .04 1.5 .06 87.2 1.4 7.1 1.0Nonmag. 6.57 18.0 4.9 33.8 10.0 12.8 98.6 92.9 99.0Calc. head 100.00 51.5 1.80 13.3 3.70 100.0 100.0 100.0 100.0
Minus-200 Magnetic 63.00 70.9 .03 1.5 .06 86.8 1.0 7.3 1.0Nonmag. 37.00 18.4 5.0 32.3 9.9 13.2 99.0 92.7 99.0Calc. head 100.00 51.5 1.85 12.9 3.70 100.0 100.0 100.0 100.0
Minus-325 Magnetic 62.79 71.5 .03 1.3 .06 86.7 1.0 6.1 1.0Nonmag. 37.21 18.5 5.1 33.5 10.2 13.3 I 99.0 93.9- 99.0Calc. head 100.00 51.8 1.90 13.3 _385 100.0 10. 100. 0 100 .0 1
The results of these series of tests showed that the Poorman, Rush & Brown, andCopper Center ores, as represented by the samples tested, are readily amenable toconcentration by wet magnetic separation at relatively coarse sizes for the produc-tion of magnetite concentrates assaying more than 60 percent Fe. Intimate associa-tion of sulfides with the magnetite, however, necessitated grinding to approximately100-mesh for adequate rejection of copper. Rejection of sulfur below the 0.10-per-cent limit was accomplished by treating minus-100-mesh Poorman and Copper Center oresamples. In the case of Rush & Brown ore, however, no test yielded low-sulfur con-centrate; by treatment of ore ground to minus-325-mesh, sulfur content was reduced
to 0.78 percent.
Two-Stage Magnetic Separation
To determine if a portion of the gangue could be rejected at relatively coarsesize, a sample of Poorman ore was roll-crushed to minus-10-mesh and then treated ina wet magnetic separator. The magnetic fraction was reground to minus-100-mesh andretreated. Results are shown in table 7.

10
TABLE 7. - Two-stage magnetic separation, Poorman
Weight, Assay, percent Distribution, percentProduct percent Fe Cu S Fe Cu S
Minus-100-mesh mag.... 74.51 67.2 0.09 0.10 89.7 19.2 2.0Minus-100-mesh nonmag. 7.40 25.9 1.03 11.1 3.5 21.8 22.2Minus-10-mesh nonmag.. 18.09 21.1 1.14 15.5 6.8 5. 75 .8Calc. head ........... 100.00 55.8 .35 3.70 100.0 100.0 100.0
Combined nonmag. .......... 4 22.5 1.11 14.2 10.3 80.8 98.0
Two-stage magnetic separation eliminated fine grinding of only 18 percent ofthe total ore. Recovery of iron was slightly inferior to that obtained by directtreatment of ore ground to minus-100-mesh. In addition, recovery of copper wouldnecessitate fine grinding of the minus-10-mesh reject, thus nullifying any possi-ble advantage of the two-stage treatment. This method of concentration was notinvestigated further.
Magnetic Separation Followed by Flotation
In an effort to produce separate marketable concentrates of iron and copper,the reject from magnetic separation was treated by flotation in a series of tests.Best results were obtained from ore ground to minus-100-mesh. The fine ore wasmagnetically separated in a Davis-tube type separator to recover magnetite; thenonmagnetic fraction was treated by flotation to recover chalcopyrite. Results ob-tained by this treatment of each of the three ores are shown in tables 8, 9, and 10.
TABLE 8. - Magnetic separation followed by flotation, Poorman
Metallurgical dataWeight, Assay percent Distribution, percent
Product percent Fe Cu Si02 S Fe Cu SiO2 SMagnetic .............75.29 66. 0.10 4.9 0.2 90. 23.5 33.9 1Cleaner concentrate. 1.75 39.4 10.1 2.2 43.0 1.3 55.5 - 22.1Cleaner tailing .... 5.64 39.9 .69 76 41.0 4.1 12.2 3.9 67.9Rougher tailing .... 132 12.0 .16 39.1 1.1 3.8 8.8 62.2 5.6Calculated head .... 100.00 5^.7 .32 10. 3.4 100.0 100.0 100.0 100.0
Operation dataGrind: Minus-100-mesh
Dowfroth 250, frother.

11
TABLE 9. - Magnetic separation and flotation, Rush & Brown
Metallurgical dataWeight, _ Assay, ercent___ Distribution percent
Product percent Fe Cu SiO2 S Fe Cu Si02 SMagnetic .... 77.27 67. 0 0 .20 23 0.95 9 1 4.8 28.2 31.1Cu cl. conc.. 3.87 36.7 19.0 2.8 36.3 2.5 70.4 1.7 59.5Cu cl. tail.. 1.09 29.8 4.4 17.6 9.8 .6 4.6 3.0 4.5Ro tail ...... 17.77 T 17.5 .33 23.8 .65 5.5 10.2 67.1 4.9Calc. head... 100.00 56.6 1. J 6.3 2.36 100.0 100.0 100.0 100.0
Operation dataGrind: Minus-100-mesh
Time, Reagents, ounds per ton of feedCircuit minutes pH Na2Co 3 Z-6 D-2502 / R-301/ Met4/
Condition ............. 5 - 5.0 0.5 0.0 - -Rougher ................ 4 9.7 - - .1 1.0 1.0Cleaner ................ 3 8.5 - .1 - -
J Potassium pentasol xanthate.f Dowfroth 250, frother.American Cyanamid Reagent 301.Sodium metasilicate.
TABLE 10. - Magnetic separation and flotation, Copper Center
Metallurgical dataWeight, Assay, percent__ Distribution percent
Product percent Fe Cu S102 S Fe Cu Si02 S
Magnetic..... 7.61 69.2 0.08 2.1 0.06 88.6 3.0 10.9 1.2Cu cl. conc.. 6.20 35.2 23.5 .8 37.9 4.1 81.9 .4 66.0Cu cl. tail.. 2.34 38.0 4.9 8.1 37.2 1.7 6.5 1.4 24.4Ro tail...... 23.84 12.5 .64 47.8 1.1 5.6 8.6 873 7.4Calc. head... 100.00 52.8 1.80 13.1 3.55 100.0 100.0 100.0 100.0
Operation dataGrind: Minus-100-mesh
CircuitCondition .........Rougher ............Cleaner ............
2/Potassium ethyl xanthate.Dowfroth 250, frother.
Magnetic separation of minus-100-mesh Poorman ore recovered 90.8 percent of thetotal iron in a concentrate that assayed 66.0 percent Fe, 0.10 percent Cu, 4.9 per-cent SiO2, and 0.2 percent S. The sulfur rejection was inferior to that obtained inthe corresponding test of a smaller sample (see table 4), probably due to overfeed-ing of the small separator during this test. Flotation of the nonmagnetic portionof the Poorman ore resulted in recovery of 55.5 percent of the copper at 10.1-per-cent-Cu grade.
Similar treatment of Rush & Brown ore recovered 91.4 percent of the iron in aconcentrate that contained 67.0 percent Fe, 0.20 percent Cu, 2.3 percent SiOp, and

12
0.95 percent S. The copper flotation concentrate assayed 19.0 percent Cu; copperrecovery was 70.4 percent.
Magnetic separation treatment of the Copper Center ore resulted in a concen-trate assaying 69.2 percent Fe, 0.08 percent Cu, 2.1 percent SiO 2, and 0.06 percentS; the concentrate contained 88.6 percent of the total iron. Flotation of the non-magnetic portion of the ore recovered 81.9 percent of the copper at 23.5 percent Cugrade.
In general, copper and sulfur content of the iron concentrate was high in alltests. This is attributed to the collection of locked magnetite-sulfide particlesin the iron product.
Flotation Followed by Magnetic Separation
In an effort to make a cleaner iron product by elimination of the locked mag-netite-sulfide particles, a reverse treatment method was tried. Ore was ground tominus-100-mesh; the sulfides were removed by flotation and cleaned to produce acopper concentrate; the flotation tailing was magnetically separated to produce amagnetite concentrate. Results are shown in tables 11, 12, and 13.
TABLE 11. - Flotation followed by magnetic separation, Poorman
.. ____.._Metallurgical dataWeight, Assay, percent Distribution, percent
Product percent Fe Cu SiO2 S Fe Cu Si0 2 SCopper concentrate .. 0.88 35.3 25.1 1.9 38.7 0.6 69.3 0.2 10.1Cleaner tail nonmag.. 6.58 41.2 .69 7.4 42.4 5.0 14.1 4.9 82.4Cleaner tail mag. ... 1.36 61.0 .83 5.4 6.9 1.5 3.4 .7 2.8Rougher tail nonmag.. 18.36 11.9 .11 33.7 .75 4.0 6.3 62.5 4.1Rougher tail mag. ... 2.88 66.0 .03 4.3 .03 889 .9 31. . 6Calculated head ..... 100.00 54.1 .32 9.9 3.39 100.0 100.0 100.0 100.0
Combined mag........ 74.18 6.04 4.3 .16 90.4 10.3 32.4 3.4
Operation dataGrind: Minus-100-mesh
Time, Reagents, pounds per tonCircuit minutes pH CaO NaCN Z-31/ |D-2502/
Cu rougher .......................... 2.5 11.3 1.9 0.1 0.2 0.04Cu cleaner .......................... 5 10.8 - .05 .1 .041/ Potassium ethyl xanthate.
Dowfroth 250, frother.
TABLE 12. - Flotation and magnetic separation, Rush & Brown
__________Metallurgical dataWeight, Assay percent__ Distribution, percent
Product percent Fe Cu SiO 2 S Fe Cu SiO2 S
Cu cl cone. ..... 2.70 34.9 246 3.~ 29.6 i.6 70. 1.3 36.2Cl tail mag. ... 2.65 63.2 0.75 2.2 2.2 2.1 1.5 .7 1.9Cl tail nonmag.. 1.89 35.6 6.2 7.9 20.1 1.7 17.4 3.3 24.1Ro tail mag. ... 74.53 68.2 .10 2.8 0.9 88.9 8.0 25.5 30.4Ro tail nonmag.. 18.23 17.9 .13 24.4 .9 .L 2.5 69.2 7.4Calc. head ..... 100.00 57.2 .95 6.9 2.21 100.0 100.0 100.0 100.0
Combined mag... 76.42 68.1 .12 2.8 .93 91.0 .5 28.8 32.3
4

13
TABLE 12. - Flotation and magnetic separationB Rush & Brown (Con.)
a
Operation dataGrind: Mesh-100-mesh
Time, Reagents pounds er ton of feedCircuit minutes pH Na2CO3 Z-6 1 D-2502 NaCN
Condition ......................... 5 - 2.0 0.3 0.08 -Rougher ........................... 2 9.5 - -Cleaner ........................... 1I.5 8.0 - - - 0.31/ Potassium pentasol xanthate.g Dowfroth 250, frother.
TABLE 13. - Flotation and magnetic separation, Copper Center
Metallurgical dataWeight, Assay, percent Distribution, percent
Product percent Fe Cu SiO2 S Fe Cu SiO2 SCu cl conc. ........ 7.97 37.7 19.3 0.05 36.4 5. 87.2 - 77.0Cu cl tail nonmag... 1.67 31.4 4.35 16.0 42.0 1.0 4.1 2.2 18.6Cu cl tail mag. .73 66.4 .70 2.6 .9 .9 .3 .2 .2Ro tail mag. ....... 65.48 70.3 .04 1.8 .06 86.8 1.5 9.6 1.0Ro tail nonmag. .... 24.15 12.3 .50 44.8 .5 5.6 6.9 88.0 3.2Calc. head ......... 100.00 53.0 1.75 12.3 3.75 100.0 100.0 100.0 100.0
Combined magnetic . 66.21 70.2 ,.02 1.8 . 7 87.7 1.8 9.8 1.2
Operation dataGrind: Minus-100-mesh
Time, Reagents pounds per ton of feedCircuit minutes pH Na2C03 Z-61/ D-2502
Condition........................ - 2.0 0.3 0.08Rougher .......................... 2 9.0 -Cleaner .......................... 2 8.5 - - -
1 Potassium ethyl xanthate.2/ Dowfroth 250, frother.
Flotation of Poorman ore, followed by magnetic separation of flotation tailing,recovered 90.4 percent of the total iron in a concentrate that assayed 65.9 percentFe, 0.04 percent Cu, 0.16 percent S, and 4.3 percent SiO2. The cleaned copper con-centrate contained 69.3 percent of the copper at 25.1-percent Cu grade.
By direct flotation of minus-100-mesh Rush & Brown ore, 70.6 percent of thecopper was recovered at 24.6-percent-Cu grade. Magnetic separation of the flotationrougher tailing recovered 88.9 percent of the iron in a concentrate that assayed68.2 percent Fe, 0.10 percent Cu, 0.9 percent S, and 2.8 percent SiO2. An additional2.1 percent of the iron can be recovered by magnetic separation of the cleaner tail-ing; the combined product would assay 68.1 percent Fe, 0.12 percent Cu, 0.93 percentS, and 2.8 percent SiO2.
By flotation, 87.2 percent of the copper in Copper Center ore was recovered ina concentrate that assayed 19.3 percent Cu. Magnetic separation of the combinedflotation tailings recovered 87.7 percent of the iron in a concentrate that assayed70.2 percent Fe, 0.05 percent Cu, 1.8 percent Si02, and 0.07 percent S.

14
In general, flotation followed by magnetic separation effected more completerejection of impurities from the iron concentrate than the reverse procedure. Thistreatment is similar to that developed at the Rolla, Missouri laboratory of theBureau of Mines for the treatment of Mount Andrew ore .11 The Mount Andrew ore, how-ever, responded to flotation after grinding to minus-35-mesh. Preliminary flotationtests of Poorman, Rush & Brown, and Copper Center ores indicated that grinding to atleast mlnus-65-mesh is required to produce a tailing low in copper and sulfur.
As the bulk of the total ore would require regrinding to minus-100-mesh formagnetic separation, it was decided that a simple 1-circuit grinding of all of theore to minus-100-mesh would be preferable to a treatment involving primary grindingto minus-65-mesh, flotation, and regrinding of the flotation tailing.
Sintering
Preliminary sintering tests were run on concentrates made from the KasaanPeninsula ores, using a laboratory sintering machine to simulate plant practice.Although exhaustive tests were not made, the sinters produced appeared to be similarin fuel requirements, moisture requirements, physical strength, and reducibility tothose made from other magnetite concentrates.
The sintering operation alters slightly the chemical composition of the concen-trate. The iron percentage is reduced slightly because of conversion of some mag-netite to hematite and because of a minor amount of dilution of ash from the addedcoke. Most of the sulfur is burned off.
Typical results obtained from sintering iron concentrate of the Kasaan Penin-sula ores are shown in table 14.
TABLE 14. - Sintering results
Concentrate SinterAssay, pe As rcentAsay r t
Fe Cu Sib Cu S SiO 2 P TiO2Poorman ............ 66.' 0.045 0.2 4.9 65.7 0.035 0.06 54 0.01 0.05Rush & Brown ..... 67.2 .08 .78 2.8 65.9 .095 .15 3.5 /.01Copper Center .... 69.6 .06 .06 1.5 68.1 .08. 03 2.4 -1/ Less than.
Flowsheet
A suggested flowsheet for milling the ores is appended (fig. 3). The flotationcleaner tailing could be rejected or stored for possible subsequent treatment for theproduction of sulfuric acid and copper and iron byproducts. An alternate plan wouldinclude magnetic separation of the original cleaner tailing; this would recover asmall amount of additional iron at the expense of grade. The nonmagnetic fractionof this treatment could be either rejected or stored. The cleaner tailing or thenonmagnetic fraction of the cleaner tailing should not be returned to the flotationcircuit, however, since it would result in contamination of both final concentrates.
11/ Work cited in footnote 6 (p. 2).

I
I
T
--
I I* f* .J>
Crushed ore
Ball mill
I ' Oversize
EL Classifier04(Jl I
Minus-65-mesh ore
oher flotationI Rougher flotation|I I
Concentrate Tailing
Cleaner flotation Magnetic separationI - . -Nonmagnetic
rejectP I
Finalcopperconcentrate
Cleaner tailing
if
F
Finalmagneticconcentrate
To wasteor
storage
Figure 3. - Suggested flowsheet. V-^Jl
a