benefit assessment system user manual - gov.uk
TRANSCRIPT
BENEFIT ASSESSMENT SYSTEM
USER MANUAL
Author: E. Fekpe ReCAP Ref: GEN2034B June, 2020
Cardno Emerging Markets (UK) Ltd Building & Road Research Institute Level 5, Clarendon Business Centre, University P O Box UP 40 Marylebone, London W1H 5PW KNUST, Kumasi United Kingdom Ghana

DISCLAIMER
The views in this document are those of the authors and they do not necessarily reflect the views of the Research for Community Access Partnership (ReCAP), or Cardno Emerging Markets (UK) Ltd for whom the document was prepared.
ACKNOWLEDGEMENTS
This User Manual was prepared under the terms of a contract between Cardno Emerging Markets (UK) Ltd (the
ReCAP Managers) and the CSIR in partnership with BRRI, as part of the DFID-funded Research for Community
Access Partnership (ReCAP) programme. The project team comprised E Fekpe (Team Leader and Lead Author);
F Afukaar (Project Coordinator); M Amuzu (Systems Analyst), J. Acquaah (Transport Economist); A Addae-Yeboah
(Socio-Economic Expert); and W. Ackaah (Safety Expert). The valuable support and technical advice of N Leta
and P Agyekum of Project Management Unit are gratefully acknowledged. The Ghana Ministry of Roads and
Highways (MRH) and Department of Feeder Roads (DFR) also provided immense support for which the project
team is grateful. Finally, the inputs and support of the national coordinators from all ReCAP partner countries in
Africa and South East Asia in defining the user requirements for the Benefits Assessment System, participating
in the training workshops, and providing valuable feedback, are greatly acknowledged.
Research for Community Access Partnership (ReCAP)
Safe and sustainable transport for rural communities
ReCAP is a research programme, funded by UK Aid, with the aim of promoting safe and sustainable transport for rural communities in Africa and Asia. ReCAP comprises the Africa Community Access Partnership (AfCAP)
and the Asia Community Access Partnership (AsCAP). These partnerships support knowledge sharing between participating countries in order to enhance the uptake of low cost, proven solutions for rural access
that maximise the use of local resources. The ReCAP programme is managed by Cardno Emerging Markets (UK) Ltd. www.research4cap.org
ReCAP Benefit Assessment System - User Manual
ReCAP | Benefits Assessment System iii
ABSTRACT
This user manual presents a detailed description of the steps involved in using the Benefit Assessment System (BAS). The manual describes the development of the Benefit Assessment framework, Systems Architecture, and the Monitoring and Evaluation (M&E) framework. The BAS was developed based on inputs from key stakeholders that define the user requirements specifications (URS). A systems approach is used in developing the BAS where each subsystem represents a component of the benefits of conducting and implementing the results of research projects. The BAS can be visualized as a report (score) card where grades (or scores) are assigned to the various indicators in each subsystem. The system architecture describes the structure of the database and M&E website using an open source software application. The open source application for data collection, storage, and application avoids the need to pay software subscription fees, making it sustainable. The User Manual presents detailed steps to follow in installing and setting up the data collection tool on Android smartphones, PC or Tablet. The steps necessary to collect and upload data onto a cloud server, download and manipulate such data are described. Also included are descriptions of steps to access the M&E system and results of the benefits analysis. The User Manual concludes with several examples demonstrating application of the BAS to projects focusing on different research areas.
Keywords: Benefits Assessment System Framework, Indicators, Monitoring and Evaluation System, Systems Architecture, User Requirements Specification, Sustainability.
ReCAP Benefit Assessment System - User Manual
ReCAP | Benefits Assessment System iv
ACRONYMS, UNITS AND CURRENCIES
AfCAP Africa Community Access Partnership AsCAP Asia Community Access Partnership API Application Programming Interface ARTREF African Road and Transport Research Forum BAS Benefits Assessment System B/C Benefit/Cost BRRI Building and Road Research Institute BSC Balanced Score Card CB Capacity Building CBA Cost Benefit Analysis CSIR Council for Scientific and Industrial Research DFID Department for International Development DFR Department of Feeder Roads DUR Department of Urban Roads EIRR Economic Internal Rate of Return HDM Highway Design and Management, software IRF International Road Federation IT Information Technology KTC Koforidua Training Center (under MRH) LCM Life Cycle Modelling LVRR MDA M&E MRH
Low Volume Rural Road Municipal and District Assemblies Monitoring and Evaluation Ministry of Roads and Highways
MoT Ministry of Transport NPV Net Present Value NS Name Server ODK Open Data Kit OS Operating System RAI Rural Access Index ReCAP Research for Community Access Partnership R&D Research and Development RED Road Economic Decision Model RR Rural Roads TCS Total Cost Savings ToR Terms of Reference TRL Transport Research Laboratories TS
UAT
Transport Services
User Acceptance Testing
UK
URS
United Kingdom (of Great Britain and Northern Ireland)
User Requirements Specifications
VOC Vehicle Operating Costs
VOT Value of Time

ReCAP Benefit Assessment System - User Manual
ReCAP | Benefits Assessment System v
Table of Contents
DISCLAIMER ................................................................................................................................. II
ACKNOWLEDGEMENTS ................................................................................................................ II
ABSTRACT ................................................................................................................................... III
ACRONYMS, UNITS AND CURRENCIES .......................................................................................... IV
LIST OF TABLES AND FIGURES ...................................................................................................... VI
1 INTRODUCTION ............................................................................................................... 1 1.1 BACKGROUND ................................................................................................................................. 1 1.2 ABOUT THIS DOCUMENT ................................................................................................................... 1 1.3 PURPOSE OF THIS MANUAL ............................................................................................................... 1 1.4 SCOPE OF THE MANUAL .................................................................................................................... 1 1.5 STRUCTURE OF THE MANUAL ............................................................................................................. 1 1.6 RECOMMENDATIONS ON THE USE OF THE MANUAL .............................................................................. 2 1.7 LIMITATIONS OF BAS ....................................................................................................................... 2 1.8 REQUESTS FOR CORRECTIONS AND UPDATES ........................................................................................ 2
2. RECAP-BAS FRAMEWORK ................................................................................................. 3 2.1 OVERVIEW OF BENEFITS ASSESSMENT FRAMEWORK .............................................................................. 3 2.2 PERFORMANCE INDICATORS .............................................................................................................. 5
2.2.1 Subsystem A – Research Product and Usage ...................................................................... 5 2.2.2 Subsystem B: Economic ....................................................................................................... 6 2.2.3 Subsystem C: Socio-Economic ............................................................................................. 8 2.2.4 Subsystem D: Road Safety .................................................................................................. 8 2.2.5 Subsystem E: Environmental .............................................................................................. 9 2.2.6 Subsystem F: User Satisfaction and Use ........................................................................... 10
3.0 SYSTEMS ARCHITECTURE ................................................................................................ 12 3.1 INTRODUCTION ................................................................................................................................... 12 3.2 SYSTEM ARCHITECTURE ........................................................................................................................ 12 3.3 DATA COLLECTION TEMPLATE OR XLSFORM ...................................................................................... 13
4.0 HOW TO INSTALL DATA COLLECTION TOOL AND COMPLETE DATA COLLECTION TEMPLATE15 4.1 INTRODUCTION ............................................................................................................................. 15 4.2 INSTALLING ODK COLLECT TOOL ON SMARTPHONE OR PC ................................................................... 15 4.3 SETTING UP ODK COLLECT TOOL ..................................................................................................... 15 4.4 USING ODK COLLECT TOOL ............................................................................................................ 17
5.0 DATA MANAGEMENT FROM CLOUD DATABASE .............................................................. 21 5.1 INTRODUCTION ............................................................................................................................. 21 5.2 VIEWING FORM SUBMISSIONS ......................................................................................................... 21 5.3 EXPORTING DATA FROM ODK AGGREGATE AS CSV............................................................................. 23
6.0 MONITORING AND EVALUATION (M&E) PORTAL ............................................................ 24 6.1 INTRODUCTION ............................................................................................................................. 24 6.2 M&E LOGIN PAGE......................................................................................................................... 24 6.3 M&E PORTAL MENU ..................................................................................................................... 24 6.4 IMPORTING DATA FROM ODK AGGREGATE INTO BAS FOR ANALYSIS ..................................................... 24 6.5 BAS PROJECTS AND RESULTS ........................................................................................................... 25
Subsystem A: Research Output and Use ....................................................................................... 26 Subsystem B: Economic ................................................................................................................. 28 Subsystem C Socio-Economic ........................................................................................................ 29
ReCAP Benefit Assessment System - User Manual
ReCAP | Benefits Assessment System vi
Subsystem D: Road Safety ............................................................................................................. 29 Subsystem E: Environmental Impacts ........................................................................................... 30 Subsystem F: User Satisfaction ...................................................................................................... 30 Overall Scorecard ............................................................................................................................. 31 Rating Scale ...................................................................................................................................... 31
6.6 PRINTING ANALYSIS RESULTS ........................................................................................................... 33 6.7 ILLUSTRATIVE EXAMPLES ................................................................................................................. 34
7. CONCLUDING REMARKS ................................................................................................. 34
FREQUENTLY ASKED QUESTIONS (FAQ) ...................................................................................... 35
ANNEX 1: DATA COLLECTION TEMPLATE .................................................................................... 36
ANNEX 2. EXAMPLES OF BAS APPLICATION ................................................................................. 41
EXAMPLE 1 – GHA2065B PROJECT NARRATIVE ............................................................................ 41 Overall Scorecard ............................................................................................................................. 48
EXAMPLE 2 – RAF2115A PROJECT NARRATIVE............................................................................. 49 Overall Scorecard ............................................................................................................................. 55
EXAMPLE 3 – RAF2116A PROJECT NARRATIVE............................................................................. 56 Overall Scorecard ............................................................................................................................. 63
EXAMPLE 4 – TAN2044H PROJECT NARRATIVE ............................................................................ 64
EXAMPLE 5 – RAF2114A PROJECT NARRATIVE............................................................................. 71 Overall Scorecard ............................................................................................................................. 78
EXAMPLE 6 - GEN2014C -PROJECT NARRATIVE ............................................................................ 79 Overall Scorecard ............................................................................................................................. 85
EXAMPLE 7 - HYPOTHETICAL PROJECT NARRATIVE ................................................................ 86 Overall Scorecard ............................................................................................................................. 93
SUMMARY RESULTS OF EXAMPLES ............................................................................................. 93
LIST OF TABLES AND FIGURES
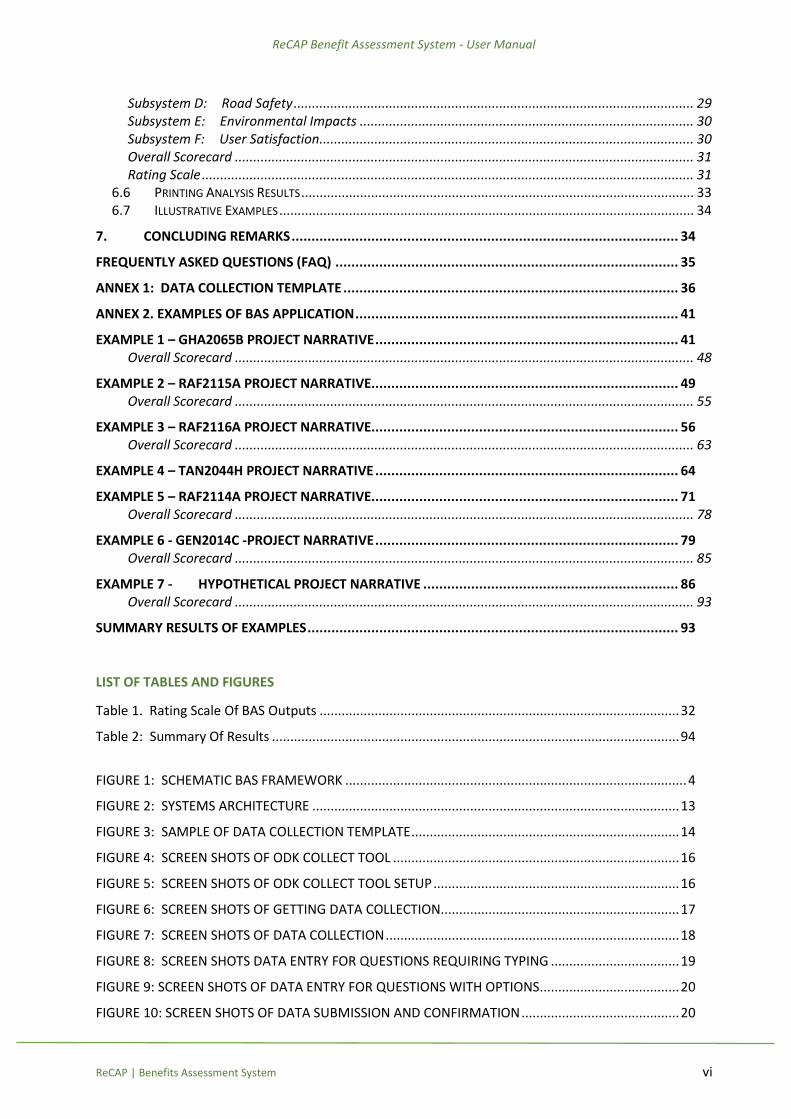
Table 1. Rating Scale Of BAS Outputs .................................................................................................. 32
Table 2: Summary Of Results ............................................................................................................... 94
FIGURE 1: SCHEMATIC BAS FRAMEWORK ............................................................................................. 4
FIGURE 2: SYSTEMS ARCHITECTURE .................................................................................................... 13
FIGURE 3: SAMPLE OF DATA COLLECTION TEMPLATE ......................................................................... 14
FIGURE 4: SCREEN SHOTS OF ODK COLLECT TOOL .............................................................................. 16
FIGURE 5: SCREEN SHOTS OF ODK COLLECT TOOL SETUP ................................................................... 16
FIGURE 6: SCREEN SHOTS OF GETTING DATA COLLECTION................................................................. 17
FIGURE 7: SCREEN SHOTS OF DATA COLLECTION ................................................................................ 18
FIGURE 8: SCREEN SHOTS DATA ENTRY FOR QUESTIONS REQUIRING TYPING ................................... 19
FIGURE 9: SCREEN SHOTS OF DATA ENTRY FOR QUESTIONS WITH OPTIONS ...................................... 20
FIGURE 10: SCREEN SHOTS OF DATA SUBMISSION AND CONFIRMATION ........................................... 20
ReCAP Benefit Assessment System - User Manual
ReCAP | Benefits Assessment System vii
FIGURE 11: ACCESS TO ODK AGGREGATE SERVER ............................................................................... 21
FIGURE 12: SCREEN SHOT OF FORM UPLOADED TO AGGREGATE SERVER ......................................... 22
FIGURE 13: SCREEN SHOT OF SAMPLE OF VISUALIZATION ................................................................. 22
ReCAP Benefit Assessment System - User Manual
ReCAP | Benefits Assessment System 1
1 INTRODUCTION
1.1 Background
Good rural access facilitates the movement of people, goods and services which affects the livelihoods of low income households, especially in developing economies. Evidence shows there is a strong correlation between poverty and connectivity. Road access in rural areas can improve social welfare by increasing the proximity and quality of basic services, and broadening livelihood opportunities. In order to monitor and evaluate the benefit assessment impact in rural access projects on livelihood opportunities and poverty reduction, and to measure the socio-economic benefits of improved accessibility on project beneficiaries, it is important to identify whether the project outcomes have been achieved through ex-ante and ex-post studies. Currently, various donor funded rural access programmes and projects are being implemented, whilst other such projects are in the pipeline. There is a growing need to measure the benefit of these projects on rural livelihoods and economic growth. To that end, Research for Community Access Partnership (ReCAP) sought to establish a Benefits Assessment System (BAS) for assessing the benefits of research investments, and a Monitoring and Evaluation (M&E) Framework for assessing ReCAP projects. Six subsystems are identified and performance indicators are categorised according to these sub-systems. A scoring system is used for the indicators, and their surrogates for each subsystem are scored according to the relative importance in defining the subsystem. ReCAP-BAS can be visualised as a report (score) card where grades (or scores) are assigned to the various indicators or groups for each subsystem.
1.2 About this Document
This document describes the ReCAP-BAS systems architecture, how to collect M&E data and upload
to the M&E database using Open Data Kit (ODK) application. It also explains how to manage data and
generate reports.
1.3 Purpose of this Manual
This manual is intended to be a resource to guide users on how to use the Benefits Assessment System from data collection through data management and visualization of results.
1.4 Scope of the Manual
The manual covers descriptions of the systems architecture, development of data collection template according to ODK requirements, data collection process and upload to the cloud database, and navigation of the M&E database system. The various subsystems of the BAS framework are described as well as explanation of the results generated from the BAS.
1.5 Structure of the Manual
The manual is in several parts, as described below. The first three parts present the background, BAS framework, and the system architecture. The remaining sections (parts IV and VI) describe the steps that a user needs to follow in installing the data collection tool, inputting data, and navigating the database to view data and results of the benefits analysis.
1. Part I presents an introduction to the user manual; 2. Part II describes ReCAP-BAS framework and indicators for the various subsystems;
ReCAP Benefit Assessment System - User Manual
ReCAP | Benefits Assessment System 2
3. Part III presents the systems architecture; 4. Part IV describes users’ actions with respect to installation and use of the ODK Collect Tool; 5. Part V describes data management functionalities of the ODK system once data has been
uploaded to the cloud database. It describes how to visualise data in different graphic forms and how to export data to .csv format that can be used in the M&E system;
6. Part VI describes the M&E portal and how data for the M&E database is imported for ReCAP-BAS analysis and presentation. Results and explanations are presented in this part. This part also describes other functionalities of the M&E system.
7. Annex 1 presents details of the data collection template. 8. Annex 2 presents several examples illustrating application of the BAS.
1.6 Recommendations on the Use of the Manual
In order to be proficient in the use of the system, it is recommended that users be well-versed in the
basics of field data survey implementation and use of an Android device.
Users are not required to learn Microsoft (MS) Excel, develop a new data collection template nor learn
or know Oracle database management in order to use the BAS system.
BAS system users’ actions are limited to Parts IV and VI of this manual. In Part V, the user can visualize
data that is inputted in the data collection form. The Systems Administrator executes data transfer
from the database into the BAS M&E system.
1.7 Limitations of BAS
The BAS was developed to allow users to assess the benefits of the conduct and implementation of the results of research projects. Analysis of the benefits in the various categories requires data on the various core indicators for each benefit area or subsystem. A limitation of this system is data availability especially for the impact indicators. Currently, ReCAP system is not set up to maintain baseline data prior project implementation. This data limitation is can be addressed by establishing a systematic data collection protocol.
1.8 Requests for Corrections and Updates
Request for updates and suggestions for corrections should be directed to the Project Administrator
of ReCAP.

ReCAP Benefit Assessment System - User Manual
ReCAP | Benefits Assessment System 3
2. RECAP-BAS FRAMEWORK
2.1 Overview of Benefits Assessment Framework
The BAS uses a systems approach where the benefits and impact assessment is viewed as an open system, that is composed of a number of interacting and interdependent parts, called subsystems. That is, the system is viewed as “an organised whole” made up of sub-systems integrated into a unity or orderly totality. These elements operate in an environment that it interacts with and that influences it. The BAS framework consists of six (6) sub-systems or assessment areas. The performance indicators are categorised according to these sub-systems: These subsystems are:
A. Research products and extent of use; B. Economic indicators (benefits and costs); C. Socio-economic; D. Road Safety; E. Environmental; F. User satisfaction and value.
A schematic of the BAS is presented in Figure 1. The guiding principle in the development of the performance indicators and assessment framework is to ensure that the indicators are relevant, that they capture all types of research, that they are objective enough to highlight the benefits and weaknesses of research programs and projects, and above all, they are simple enough to be easily understood and applied. Based on the systems approach as indicated above, the benefits assessment framework can be visualised as a report (score) card where grades (or scores) are assigned to the various indicators or groups and therefore for each subsystem. Poor performance in one area does not necessarily lead to the conclusion that the program/project is a failure. The relative merits (scores) of the various subsystems of the framework need to be considered in assessing the overall benefits of the program/project in any given time frame. The indicators in each subsystem are weighted based on their relative importance or contribution to defining the indicator for that subsystem. The weighted scores for each subsystem are summarised in a report or score card. This is visualised as a report card but with no aggregated or cumulative score for all the subsystems. Converting all scores to a single score would lose the essence of the assessment exercise where strong and weak points would not be easily identified and documented as lessons learned to help in designing future projects. Moreover, in situations where for a given project or program some subsystems are not applicable or indicators lack sufficient data, an aggregated single overall weighted score would be misleading.

ReCAP Benefit Assessment System - User Manual
ReCAP | Benefits Assessment System 4
Figure 1: Schematic BAS Framework
Performance Indicators Rating
Part A - Research Output and Usage Achievement of
objectives Types of research
products Adoption for
implementation Extent of use
Part B – Economic Cost of Research Agency costs (capital
and operation) User costs (VOC, travel
and transport) Crash cost savings
Part C – Socio-economic Impacts Access (Healthcare,
Education, social, retail, farming, economic activities)
Travel and transport costs
Employment opportunities
Women empowerment Social inclusion
Part F – User Satisfaction Awareness Use Value
Excellent: Fully achieved objectives Products widely used Good: Partially achieved objectives Some use of product Fair: Barely achieved objectives Product not yet readily available Poor: Objectives not met Product not widely used
Excellent – Adequately meets users’ needs Good – Satisfactorily meets users’ needs Fair – Limited user satisfaction Poor – Users not satisfied
Ratio of Cost Savings to Research Funding (Benefit/Cost Ratio)
Overall Rating Research Output and
Usage Cost Savings Socio-economic Safety Environmental User Satisfaction
Excellent – High positive impacts Good – Significant impacts Fair – Limited impacts Poor – Insignificant positive impacts or negative impacts
Part E – Environmental
Air quality/dust Erosion Drainage
structures
Excellent – High positive impacts Good – Low positive impacts Fair – Marginal positive or negative impacts Poor – Significant negative impacts
Part D – Road Safety
Accident rate Fatality rate Helmet use
Excellent – Exceeds all targets Good – Satisfactorily meets all targets Fair – Fails to meet some targets Poor – Targets not met

ReCAP Benefit Assessment System - User Manual
ReCAP | Benefits Assessment System 5
2.2 Performance Indicators
The performance indicators form the basis of the BAS. Several indicators are identified for each of the six (6) subsystems as follows.
A. Research products and extent of use indicators; B. Economic indicators (benefits and costs); C. Socio-economic indicators; D. Road safety indicators; E. Environmental indicators; F. User satisfaction and value indicators.
A large number of indicators have been identified in order to adequately assess the benefits from the various subsystems. It is recognised that for a given project or programme, not all indicators will be relevant and data may not be available for all the indicators. A balance between the efforts and resources required to collect useful data on one hand and the usefulness of the information on the other are considerations in selecting the key indicators. Therefore, the framework is designed with focus on minimum core indicators that would be sufficient to provide an indication of the benefits of each subsystem. Furthermore, the benefits assessment system is structured such that the calculation of the weighted score for each subsystem is based only on indicators for which data is available. Consequently, missing data for indicators will not affect calculation of the scores for a given subsystem. This section provides details of the indicators for each subsection.
2.2.1 Subsystem A – Research Product and Usage This subsystem assesses the success of the research effort and extent of adoption and implementation of the outputs. Four (4) major indicators are identified with several sub-elements or surrogate measures as follows:
Achievement of Research Objectives Indicators in this subgroup measure success in terms of achievement of the stated objectives of the research effort. Surrogate indicators of research success include:
i. development of research reports;
ii. publication of refereed papers in technical journals;
iii. conference presentations, working papers, workshop reports; and
iv. citations and/or awards.
Types of Products from Research This indicator identifies ReCAP research focus areas in terms of the types of research and outputs generated. These include:
i. Specifications, Guidelines and Handbooks; ii. Improved Conventional, New, and Innovative Materials;
iii. Advanced Technology/Equipment; iv. Software tools and advanced state-of-the-art procedures (e.g., methods and techniques); v. Technology Transfer Tools
Adoption for mandatory Implementation / Embedment This indicator measures the level of embedment or the level of adoption for implementation of the research products identified by the previous metric.
Data Sources ReCAP Website
ReCAP PMU Project reports

ReCAP Benefit Assessment System - User Manual
ReCAP | Benefits Assessment System 6
Notes: For projects whose primary products are specifications, adoption by ReCAP and its partner countries, organisations like World Bank, IRF or other standards setting agencies is critical. For projects whose product is new and improved materials, commercial production of the material is a good indicator of success. Equipment and technology-based research outcomes are considered to be successful if transportation agencies use the product. Projects with software tools as outputs are successful if their software is available as a completed product or in case of agency specific software like Rural Access Index (RAI), are being used. The success of technology transfer tools is in their creation and wider use.
Extent of Use at the National and Local Levels /Uptake This indicator assesses the level of usage or uptake of the research products at local and national levels. This metric is considered one of the key indicators of the benefits of the research effort. This is because the extent of usage of a research product or result is a true reflection of the benefits associated with the research product.
2.2.2 Subsystem B: Economic This subsystem assesses the cost savings or benefits of implementing the research products relative
to the research investment. Therefore, one of the key indicators is the investment or cost of the
resources associated with the conduct of the research project. Cost saving is estimated as the
difference in cost with (ex-poste) and without (do nothing or counterfactual) the use of the research
product. This includes savings to the implementing agencies and road users.
B1 Investment or cost of inputs This indicator measures investment, cost or resources used in conducting the research. Given the time value of money, the present worth of the investment should be used.
B2 Agency cost savings These relate to the cost savings to the implementing agency (typically national and local road agencies) that use the research product. This is made up of capital and operating costs. Capital Costs - For purposes of this analysis, capital costs are defined as costs incurred in the deployment or implementation of the research product. Where cost data is available on more than one project or application, of a research product, the average cost should be used. This includes labour, materials, and equipment costs. Operating Costs - The cost savings in maintenance operations results from the reduction in capital expenditure (reconstruction and major rehabilitation) and recurrent (routine and periodic) expenditures. This also includes labour, materials, and equipment costs. Training costs - These are costs incurred in training road agency staff personnel, supervisors as well as
civil works contractors in the implementation of the research outputs. These costs apply only to
certain research outputs where specialized training is required to ensure appropriate application.
Examples include, software tools, new construction techniques, innovative and new improved
materials, climate change adaptation strategies.
Total Agency Costs: The total agency costs is the sum of the annualized capital costs, the annual
routine maintenance costs and the annualized major reconstruction and rehabilitation (R&R) costs.
This is dependent on the type of research product or result.
Data Sources ReCAP website;
Road agencies
implementing research products

ReCAP Benefit Assessment System - User Manual
ReCAP | Benefits Assessment System 7
B3 User cost savings User cost savings includes vehicle operation cost savings, travel time and transport cost savings. Vehicle Operating Cost (VOC) Savings: VOC savings measures the difference between VOC with and without research products (or do-nothing) implementation. These are average VOCs per vehicle-kilometre of road segment. Travel time and transport savings: This indicator measures the impact of implementing research products on beneficiary communities’ travel time and transport costs between given origins and destinations relating to both economic and social activities. Travel time savings can be converted to monetary values using the Value of Time (VOT) concept. The VOT varies by type of vehicle and type of trip. The average cost savings can be estimated by the reductions in travel times multiplied by the VOT and annual average traffic volume. Ideally, travel time savings should be determined from empirical studies that take into account the local variables. NOTE: Travel time savings in less developed countries can be estimated based on rural wage rates. An international study estimated rural travel time savings as 51%, 64% and 49% of the rural wage rates in Bangaldesh, Ghana, and Tanzania respectively. 1 While this study is dated, the findings can provide useful guidelines to generate rough estimates for purposes of BAS application.
B4- Crash Cost Savings: Assigning or translating reductions in number, rate, or density of crashes directly to implementation of research products is difficult. Furthermore, placing monetary value on human life due to fatalities is difficult. It would be necessary to make assumptions based on domain knowledge or evidence from similar products e.g., Road Safety studies. NOTE: The most recent study on estimating the cost of road crashes in less developed countries was conducted in Ghana and based on 2004 data (Afukaar et al., 2008)2. The results of this study, summarized below, are dated and can only serve as a guide in estimating crash cost savings.
1 . I.T. Transport Ltd. (2005). The value of time in least developed countries: the African studies (R8307). Final Report., DFID, I.T. Transport Ltd., Ardington, Oxfordshire, United Kingdom UK 2 Afukaar, F.K., Agyemang, W., Debrah, E.K., and Ackaah, W. (2008). The Socio-Economic Cost of Road Traffic
Accidents in Ghana. Journal of Building and Road Research, Ghana. Vol. 11, Dec. 2008 pp. 39-44.
Per Fatal Crashes
(US$)
Per Serious
Crashes (US$)
Per Slight Crashes (US$)
Per Property Damage
Only Crashes (US$)
37,476.67 7,242.22 1,713.33 943.33
Data Sources Data on ex-ante and ex-post CBA results from Government Agencies implementing the ReCAP products; BAS users are not expected to generate VOC data from HDM or RED analyses
Notes Cost data, in particular, for certain indicators may be difficult to obtain. In such cases it is necessary to make assumptions based on domain knowledge or evidence from similar products or projects. It is important that any such assumptions be properly qualified and justified. The cost savings can be expressed per unit or project or application depending on the nature of the research product
ReCAP Benefit Assessment System - User Manual
ReCAP | Benefits Assessment System 8
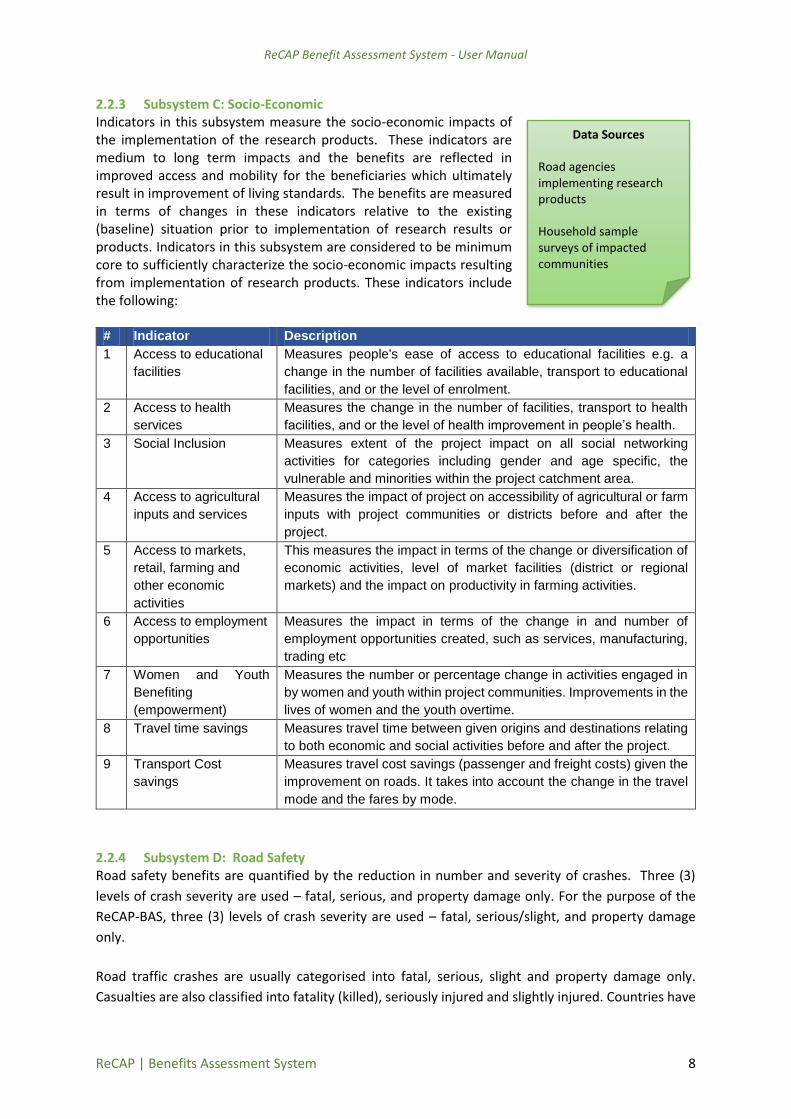
2.2.3 Subsystem C: Socio-Economic Indicators in this subsystem measure the socio-economic impacts of the implementation of the research products. These indicators are medium to long term impacts and the benefits are reflected in improved access and mobility for the beneficiaries which ultimately result in improvement of living standards. The benefits are measured in terms of changes in these indicators relative to the existing (baseline) situation prior to implementation of research results or products. Indicators in this subsystem are considered to be minimum core to sufficiently characterize the socio-economic impacts resulting from implementation of research products. These indicators include the following:
# Indicator Description
1 Access to educational
facilities
Measures people's ease of access to educational facilities e.g. a
change in the number of facilities available, transport to educational
facilities, and or the level of enrolment.
2 Access to health
services
Measures the change in the number of facilities, transport to health
facilities, and or the level of health improvement in people’s health.
3 Social Inclusion Measures extent of the project impact on all social networking
activities for categories including gender and age specific, the
vulnerable and minorities within the project catchment area.
4 Access to agricultural
inputs and services
Measures the impact of project on accessibility of agricultural or farm
inputs with project communities or districts before and after the
project.
5 Access to markets,
retail, farming and
other economic
activities
This measures the impact in terms of the change or diversification of
economic activities, level of market facilities (district or regional
markets) and the impact on productivity in farming activities.
6 Access to employment
opportunities
Measures the impact in terms of the change in and number of
employment opportunities created, such as services, manufacturing,
trading etc
7 Women and Youth
Benefiting
(empowerment)
Measures the number or percentage change in activities engaged in
by women and youth within project communities. Improvements in the
lives of women and the youth overtime.
8 Travel time savings Measures travel time between given origins and destinations relating
to both economic and social activities before and after the project.
9 Transport Cost
savings
Measures travel cost savings (passenger and freight costs) given the
improvement on roads. It takes into account the change in the travel
mode and the fares by mode.
2.2.4 Subsystem D: Road Safety Road safety benefits are quantified by the reduction in number and severity of crashes. Three (3)
levels of crash severity are used – fatal, serious, and property damage only. For the purpose of the
ReCAP-BAS, three (3) levels of crash severity are used – fatal, serious/slight, and property damage
only.
Road traffic crashes are usually categorised into fatal, serious, slight and property damage only.
Casualties are also classified into fatality (killed), seriously injured and slightly injured. Countries have
Data Sources
Road agencies implementing research products
Household sample surveys of impacted communities
ReCAP Benefit Assessment System - User Manual
ReCAP | Benefits Assessment System 9
different coverage periods for qualifying deaths as road traffic crash related. But by WHO standard, a
fatality is defined as a casualty who dies within 30 days from the time of occurrence of the crash. The
definition of the different crash categories also differ from one country to the other. It is advised that
countries use their existing definitions for the evaluation.
Any of the indicators listed below can be used to assess the impact on Road Safety. Data on all indicators are not necessarily required to assess the Road Safety impacts of implementing the research products. The safety benefits are measured in terms of safety improvements (i.e., reductions in number and severity of crashes or improvement in helmet use) in these indicators relative to the existing situation prior to implementation of research results or products. It is recommended that crash data of between three (3) and five (5) years are used in the before and after situation analysis. The proportion of safety helmet usage can be employed as a surrogate to assess intervention in the short term. In making the short-term evaluation, a cross-sectional study of helmet use before and after implementation of the measure is required.
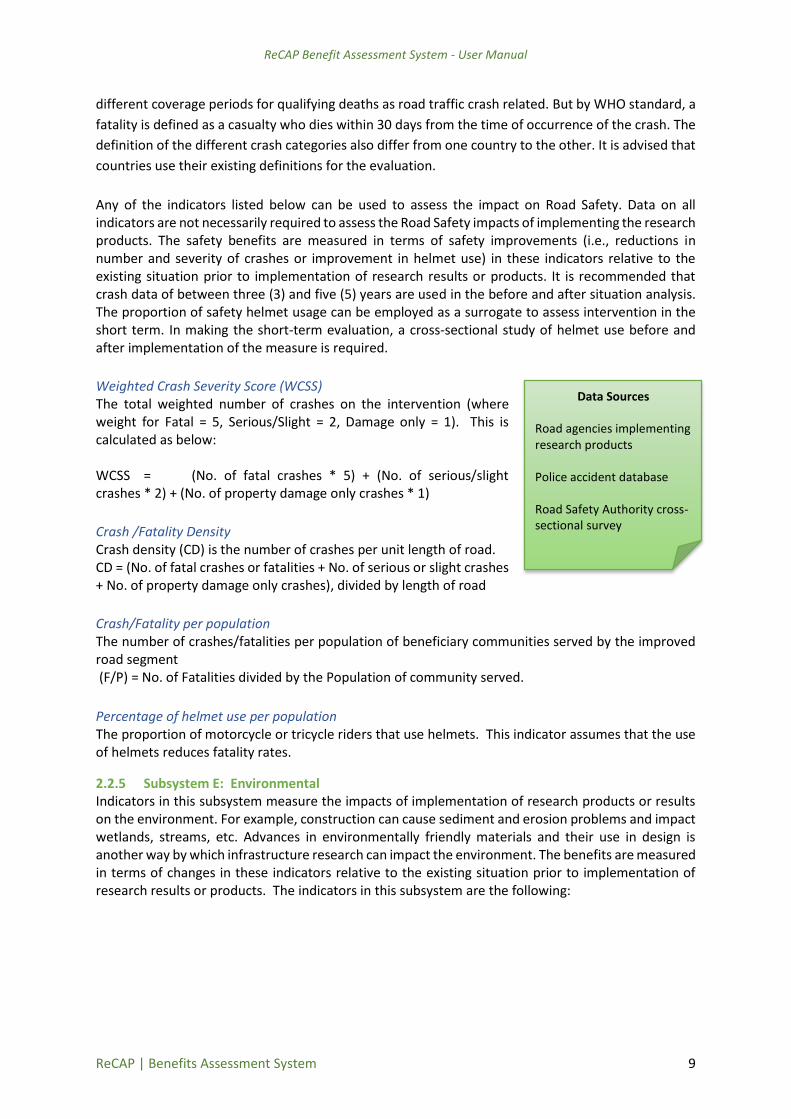
Weighted Crash Severity Score (WCSS) The total weighted number of crashes on the intervention (where weight for Fatal = 5, Serious/Slight = 2, Damage only = 1). This is calculated as below: WCSS = (No. of fatal crashes * 5) + (No. of serious/slight crashes * 2) + (No. of property damage only crashes * 1)
Crash /Fatality Density Crash density (CD) is the number of crashes per unit length of road. CD = (No. of fatal crashes or fatalities + No. of serious or slight crashes + No. of property damage only crashes), divided by length of road
Crash/Fatality per population The number of crashes/fatalities per population of beneficiary communities served by the improved road segment (F/P) = No. of Fatalities divided by the Population of community served.
Percentage of helmet use per population The proportion of motorcycle or tricycle riders that use helmets. This indicator assumes that the use of helmets reduces fatality rates.
2.2.5 Subsystem E: Environmental Indicators in this subsystem measure the impacts of implementation of research products or results on the environment. For example, construction can cause sediment and erosion problems and impact wetlands, streams, etc. Advances in environmentally friendly materials and their use in design is another way by which infrastructure research can impact the environment. The benefits are measured in terms of changes in these indicators relative to the existing situation prior to implementation of research results or products. The indicators in this subsystem are the following:
Data Sources
Road agencies implementing research products
Police accident database
Road Safety Authority cross-sectional survey

ReCAP Benefit Assessment System - User Manual
ReCAP | Benefits Assessment System 10
Air quality – Pollution (dust) This indicator measures air quality (e.g., in terms of emissions or dust concentration) in the beneficiary communities where the research products/results have been implemented. This is measured by the percentage of population directly exposed to dust and other forms of air pollution that can be attributed to the implementation of research products or results.
Erosion This indicator measures square metre or linear length eroded area in the beneficiary communities where the research products/results have been implemented. It could also be measured by the percentage of population whose daily activities are affected by erosion resulting from implementation of research product or result.
Drainage Structure Failures This indicator reflects the effects of climate change. It measures the number of drainage structures that fail due to flooding resulting from climate change. Where climate adaptation strategies are employed in the design and construction of the drainage structures, the chances of being washed away in floods and cause environmental problems are minimised. Notes: While it is clear that implementation of some research products or results impacts the environment positively or negatively, it might be difficult to quantify in terms of monetary terms. Therefore, the environmental impacts are measured in terms of the proportion of the population affected. Depending on the project or program, information may be available for some but not all of the indicators. Therefore, any of the indicators in this subsystem could be used to assess the impact on the environment.
2.2.6 Subsystem F: User Satisfaction and Use Indicators in this subsystem directly assess the users' (customers’) satisfaction with the research products. Users include national and local road agencies, international funding agencies, and ultimately the travelling public. The indicators used are:
Awareness of the research product, This indicator measures whether potential users are aware of the existence of the research product or result. It is measured by the percentage of potential users that are aware of the research product.
Use of the product This indicator measures the percentage of potential users who are aware of the existence of the research product or result and actually use it (e.g., road agencies). This includes the use of the product resulting from implementation of research product (e.g., road users).
Value that users place on the research product This indicator measures the percentage of potential users who are aware of implementation of the research product or result, use the facility, and place value on it relative to other products. Increased
Data Sources
Household sample surveys of impacted communities
Focus groups in impacted communities
Data Sources
Road agencies implementing research products
Environmental Protection Agencies
Household sample surveys
ReCAP Benefit Assessment System - User Manual
ReCAP | Benefits Assessment System 11
use of a facility resulting from implementation of research products or results reflects the value road users and beneficiaries in general place on the product. Notes: User satisfaction indicators assess the extent to which users are satisfied with the services provided by the implementation of the research products and results in improving their quality of life. The extent of use indirectly reflects the value that users (e.g., road agencies) place on the research product and may be exhibited in the extension of application to other facilities. Value is a long term indicator of user satisfaction. While the travelling public may not be aware of the underlying research that resulted in a more durable transportation infrastructure (e.g., pavement and drainage structures) or reliable transport services, increased use or expressions of satisfaction through other means are indications of value placed associated with the result or product. Thus hidden research outcomes cannot be directly measured or captured in the benefit assessment framework.

ReCAP Benefit Assessment System - User Manual
ReCAP | Benefits Assessment System 12
3.0 SYSTEMS ARCHITECTURE
3.1 Introduction
A systems architecture is a formal description and representation of the basic software structure, identifying the various components or functional layers and interrelationships amongst them. It depicts how a typical software system might interact with its users, external systems, data sources, and services. The systems architecture is therefore the conceptual model based on which the system is designed and developed. This section describes the design and structure of the systems architecture and the database system of ReCAP-BAS. The purpose of the systems architecture is to show the structure and the various components or steps from the design of the data collection template/form through data collection, analysis, and presentation of BAS results. The choice of software and approach is guided by the requirement that the benefit assessment system must be supported by an efficient, user friendly data acquisition and management system. More importantly, the system must be sustainable. As such, the BAS was developed using an open source software application where the source code is publicly accessible and anyone can modify, enhance or customize it to suit individual needs. Furthermore, an open source software facilitates updates and modifications without the need to pay licensing and updating fees. The systems architecture for
ReCAP-BAS was developed based on an open-source software called Open Data Kit (ODK) Collect. It
supports a wide range of question and answer types including location, audio, images, video, multiple-choice, free text, and numeric answers. This feature allows users to include project specific images as
part of data entry. Some advantages of ODK Collect include:
It replaces paper forms for data gathering;
The data collection forms are stored in a Cloud server so that users anywhere in the world can easily access it;
Because it operates on Android platform, users can enter data from their smartphones or Tablets or PCs with or without network connectivity;
Being an open source software System Administrators of the ReCAP countries can configure the ReCAP-BAS application to suit their respective server environments and link it to systems that can be used for data manipulation;
The choice of an open source software application also satisfies the sustainability requirement where no annual subscription, licensing, or updates fees are required. Therefore, the system will continue to be useful even after the ReCAP program ends.
Details of the various elements of the systems architecture are described in the following subsections of this user manual.
3.2 System Architecture
The system architecture shown in Figure 2 below consists of 6 elements or steps as follows: 1. Design the data collection form (also called XLSForm) using Microsoft Excel software. The
data collection template or XLSForm has been designed and created in Microsoft Excel and in accordance with ODK guidelines;
2. The data collection form or XLSForm is then uploaded to the ReCAP cloud server – Aggregate Server;
3. When ready to collect data, a blank data collection form or XLSForm is downloaded on the data collection device (smartphone or Tablet or PC) prior to start of data collection exercise;
4. Complete the data collection form or XLSForm by inputting data into the fields or answering questions on the downloaded form;
5. Upload the completed data collection form or XLSForm to the cloud server (i.e., Aggregate Server);

ReCAP Benefit Assessment System - User Manual
ReCAP | Benefits Assessment System 13
6. Before manipulating or processing the data uploaded, it is necessary to first download the data from Aggregate Server and then import and store it in the MySQL database for analysis. MySQL database is a relational database supporting the Monitoring and Evaluation (M&E) system of the BAS. The user can query, visualize, and analyze the data as desired. The analysis involves converting the answers to the questions in the data collection form into scores for the various indicators for each subsystem in ReCAP-BAS. The results of the analysis can be viewed in the M&E Portal and website.
Figure 2: Systems Architecture
All data collected are uploaded to ReCAP cloud server, which hosts ODK Aggregate Server and a MySQL server that supports the M&E Application. The key components of the architecture are further explained in the following subsections.
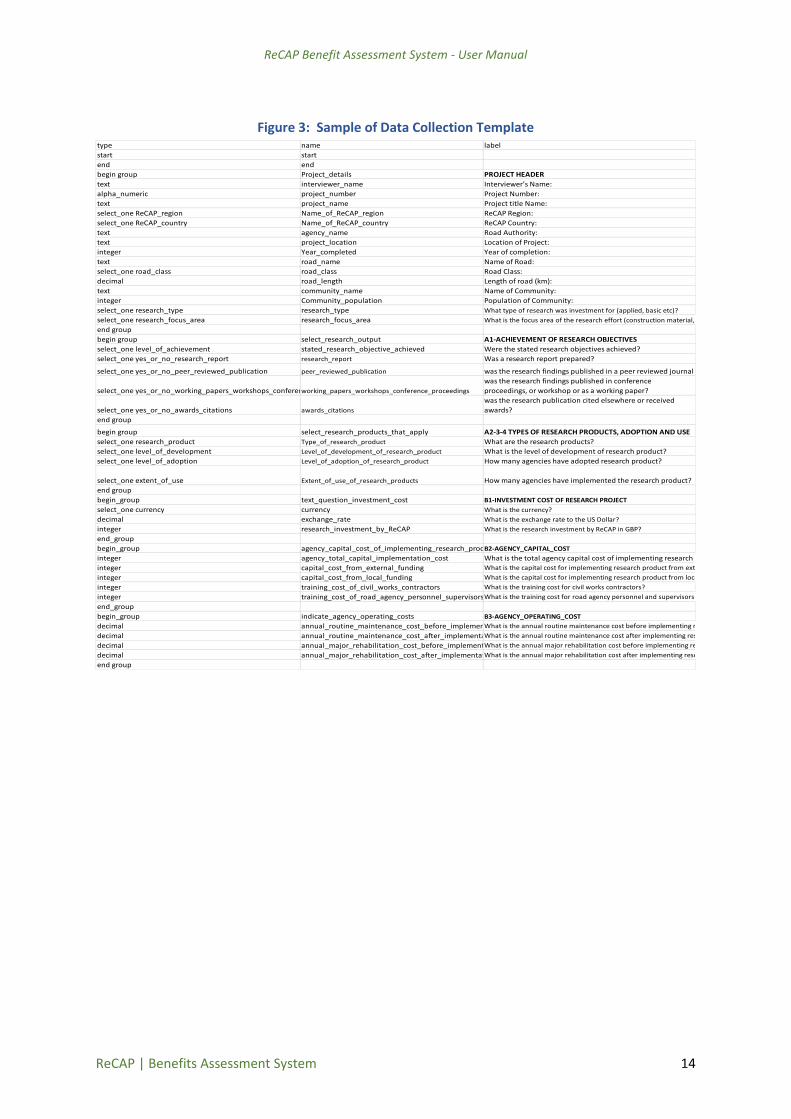
3.3 Data Collection Template or XLSForm
The data collection template is created offline in MS Excel (see below). For this project, the data collection template has been created and uploaded to the Cloud Aggregate Server. The user of BAS is not expected to create new forms in order to collect data. The form is uploaded to the Aggregate server and can be accessed and downloaded to Smartphone (Android operating system) devices, or Tablet or PC. The data collection template is included as Annex 1 to this manual. The Systems Administrator is responsible for future updates to the uploaded data collection form (XLSForm) as necessary.
Note
Data collection form (XLSForm has been created and uploaded to the Aggregate server.
Users are not required to create new data collection templates
ReCAP Benefit Assessment System - User Manual
ReCAP | Benefits Assessment System 14
Figure 3: Sample of Data Collection Template
type name label
start start
end end
begin group Project_details PROJECT HEADER
text interviewer_name Interviewer’s Name:
alpha_numeric project_number Project Number:
text project_name Project title Name:
select_one ReCAP_region Name_of_ReCAP_region ReCAP Region:
select_one ReCAP_country Name_of_ReCAP_country ReCAP Country:
text agency_name Road Authority:
text project_location Location of Project:
integer Year_completed Year of completion:
text road_name Name of Road:
select_one road_class road_class Road Class:
decimal road_length Length of road (km):
text community_name Name of Community:
integer Community_population Population of Community:
select_one research_type research_type What type of research was investment for (applied, basic etc)?
select_one research_focus_area research_focus_area What is the focus area of the research effort (construction material, climate change etc)?
end group
begin group select_research_output A1-ACHIEVEMENT OF RESEARCH OBJECTIVES
select_one level_of_achievement stated_research_objective_achieved Were the stated research objectives achieved?
select_one yes_or_no_research_report research_report Was a research report prepared?
select_one yes_or_no_peer_reviewed_publication peer_reviewed_publication was the research findings published in a peer reviewed journal
select_one yes_or_no_working_papers_workshops_conference_proceedingsworking_papers_workshops_conference_proceedings
was the research findings published in conference
proceedings, or workshop or as a working paper?
select_one yes_or_no_awards_citations awards_citations
was the research publication cited elsewhere or received
awards?
end group
begin group select_research_products_that_apply A2-3-4 TYPES OF RESEARCH PRODUCTS, ADOPTION AND USE
select_one research_product Type_of_research_product What are the research products?
select_one level_of_development Level_of_development_of_research_product What is the level of development of research product?
select_one level_of_adoption Level_of_adoption_of_research_product How many agencies have adopted research product?
select_one extent_of_use Extent_of_use_of_research_products How many agencies have implemented the research product?
end group
begin_group text_question_investment_cost B1-INVESTMENT COST OF RESEARCH PROJECT
select_one currency currency What is the currency?
decimal exchange_rate What is the exchange rate to the US Dollar?
integer research_investment_by_ReCAP What is the research investment by ReCAP in GBP?
end_group
begin_group agency_capital_cost_of_implementing_research_productsB2-AGENCY_CAPITAL_COST
integer agency_total_capital_implementation_cost What is the total agency capital cost of implementing research product?
integer capital_cost_from_external_funding What is the capital cost for implementing research product from external funding?
integer capital_cost_from_local_funding What is the capital cost for implementing research product from local funding?
integer training_cost_of_civil_works_contractors What is the training cost for civil works contractors?
integer training_cost_of_road_agency_personnel_supervisorsWhat is the training cost for road agency personnel and supervisors?
end_group
begin_group indicate_agency_operating_costs B3-AGENCY_OPERATING_COST
decimal annual_routine_maintenance_cost_before_implementationWhat is the annual routine maintenance cost before implementing research product?
decimal annual_routine_maintenance_cost_after_implementationWhat is the annual routine maintenance cost after implementing research product?
decimal annual_major_rehabilitation_cost_before_implementationWhat is the annual major rehabilitation cost before implementing research product?
decimal annual_major_rehabilitation_cost_after_implementationWhat is the annual major rehabilitation cost after implementing research product?
end group

ReCAP Benefit Assessment System - User Manual
ReCAP | Benefits Assessment System 15
4.0 HOW TO INSTALL DATA COLLECTION TOOL AND COMPLETE DATA COLLECTION TEMPLATE
4.1 Introduction
This section describes steps to install and set up ODK Collect Tool on your smartphone or PC and how to complete the data collection form that has already been created and available in the Cloud Aggregate Server.
4.2 Installing ODK Collect Tool on Smartphone or PC
There are two ways of installing the ODK Collect Tool as follows: A. – On an Android powered smartphone. This is easiest way to install ODK Collect Tool
1. Go to Play Store on your Android powered smartphone
2. Search for ODK Collect and install on your smartphone or Tablet
B. On a PC
1. download and install BlueStacks software on your computer. This is available at:
https://www.bluestacks.com/download.html?utm_campaign=aw-ded-siteextentdownloadnow-sitee-en-d-1&gclid=Cj0KCQjwvezZBRDkARIsADKQyPnhSD9GSC3Ri9av5buS72u1czCZjrXqSmunVFStT_7lT0uF--oiBzMaAgJTEALw_wcB
2. On your PC, open BlueStacks
3. Go to Google Play Store
4. Search for ODK Collect and install on your PC
4.3 Setting up ODK Collect Tool
Setting up ODK Collect Tool involves a few steps as described below.
1. To set up the ODK Data Collection tool, click on the ODK icon on your phone or PC
2. Click on the 3 dots on top right corner of Main Menu image that appears (see Figure 4)
3. Click on “General settings”
4. Click on “Server”
5. Click on Type and under Platform, select Other (see Fig. 5)
6. Enter the following URL:
http://173.255.217.175:8080/ODKAggregate
Note
The user is not required to create a new data collection form

ReCAP Benefit Assessment System - User Manual
ReCAP | Benefits Assessment System 16
Figure 4: Screen Shots of ODK Collect Tool
7. Username – To be provided by Systems Administrator
8. Password – To be provided by Systems Administrator
9. Under other platform Settings, enter the following exactly as shown:
Form list path – type in the following /formList Submission path - type in the following /submission
10. Click back to take you to main menu screen.
Figure 5: Screen Shots of ODK Collect Tool Setup
ReCAP Benefit Assessment System - User Manual
ReCAP | Benefits Assessment System 17
4.4 Using ODK Collect Tool
With the XLSForm (i.e., data collection template) created and uploaded to the Aggregate server in the
ReCAP cloud, and the ODK Collect installed, the next step is to access the form and begin to collect
data. The steps are outlined below:
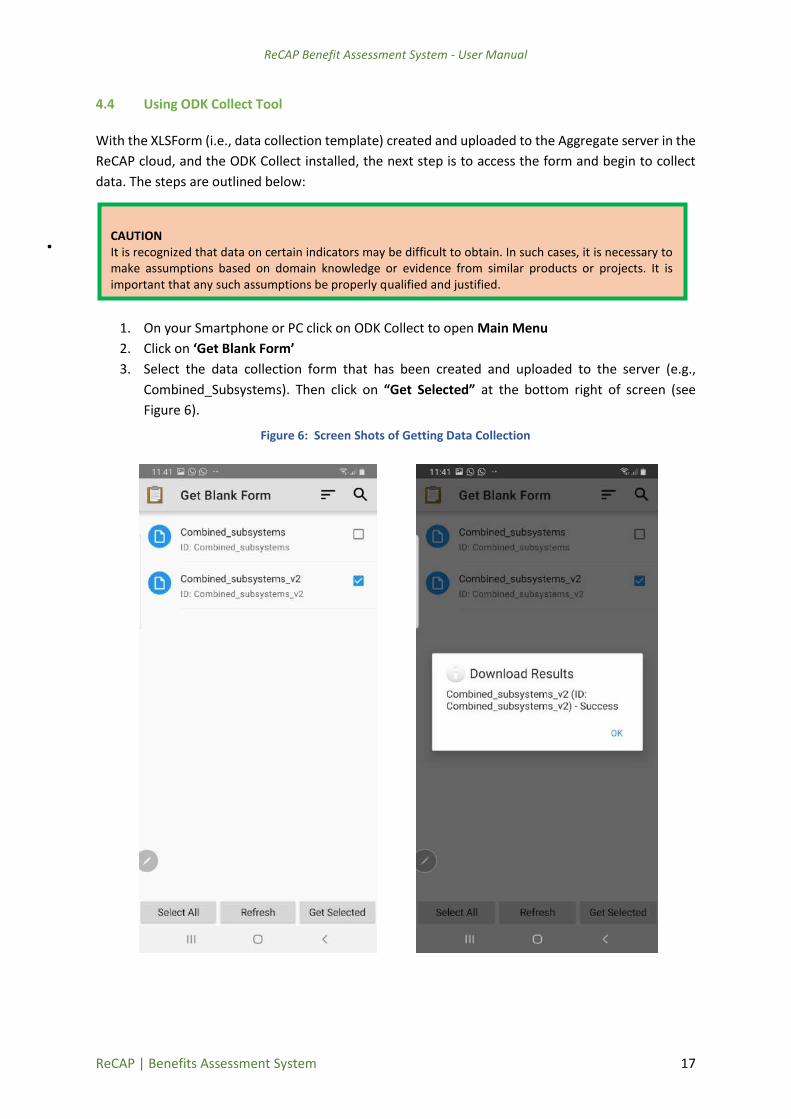
1. On your Smartphone or PC click on ODK Collect to open Main Menu
2. Click on ‘Get Blank Form’
3. Select the data collection form that has been created and uploaded to the server (e.g.,
Combined_Subsystems). Then click on “Get Selected” at the bottom right of screen (see
Figure 6).
Figure 6: Screen Shots of Getting Data Collection
CAUTION It is recognized that data on certain indicators may be difficult to obtain. In such cases, it is necessary to make assumptions based on domain knowledge or evidence from similar products or projects. It is important that any such assumptions be properly qualified and justified.

ReCAP Benefit Assessment System - User Manual
ReCAP | Benefits Assessment System 18
4. After the Blank form has been downloaded onto your phone or PC, the screen to the right in
Figure 6 appears confirming successful download of data collection form. Click OK to back to
the Main Menu
5. On the Main Menu page, Click on ‘Fill Blank Forms'
6. The screen shows all the subsections of the data collection form that has been created (Figure
7).
7. Click each section in turn and input the data either by typing the required information or
selecting the appropriate answer from a list of options.
Figure 7: Screen Shots of Data Collection
For example, when you click on section PROJECT HEADER, all questions under that section will
pop up as shown in the screenshot in Figure 8 (left side).
Click on each question and provide the required data. If the question requires you to type in
the information, then you do so as shown in the screenshot in Figure 8 (right side). When done
click on downward pointing at the top right corner of the screen to go to the next question in
the section.
ReCAP Benefit Assessment System - User Manual
ReCAP | Benefits Assessment System 19
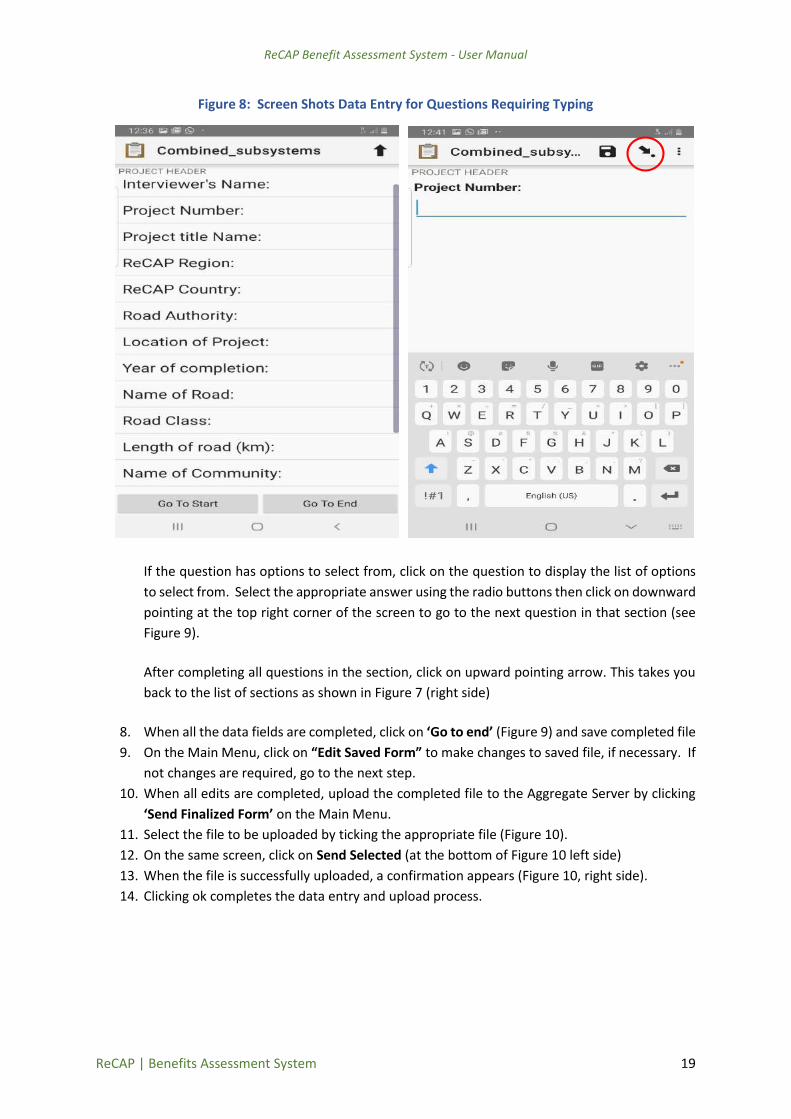
Figure 8: Screen Shots Data Entry for Questions Requiring Typing
If the question has options to select from, click on the question to display the list of options
to select from. Select the appropriate answer using the radio buttons then click on downward
pointing at the top right corner of the screen to go to the next question in that section (see
Figure 9).
After completing all questions in the section, click on upward pointing arrow. This takes you
back to the list of sections as shown in Figure 7 (right side)
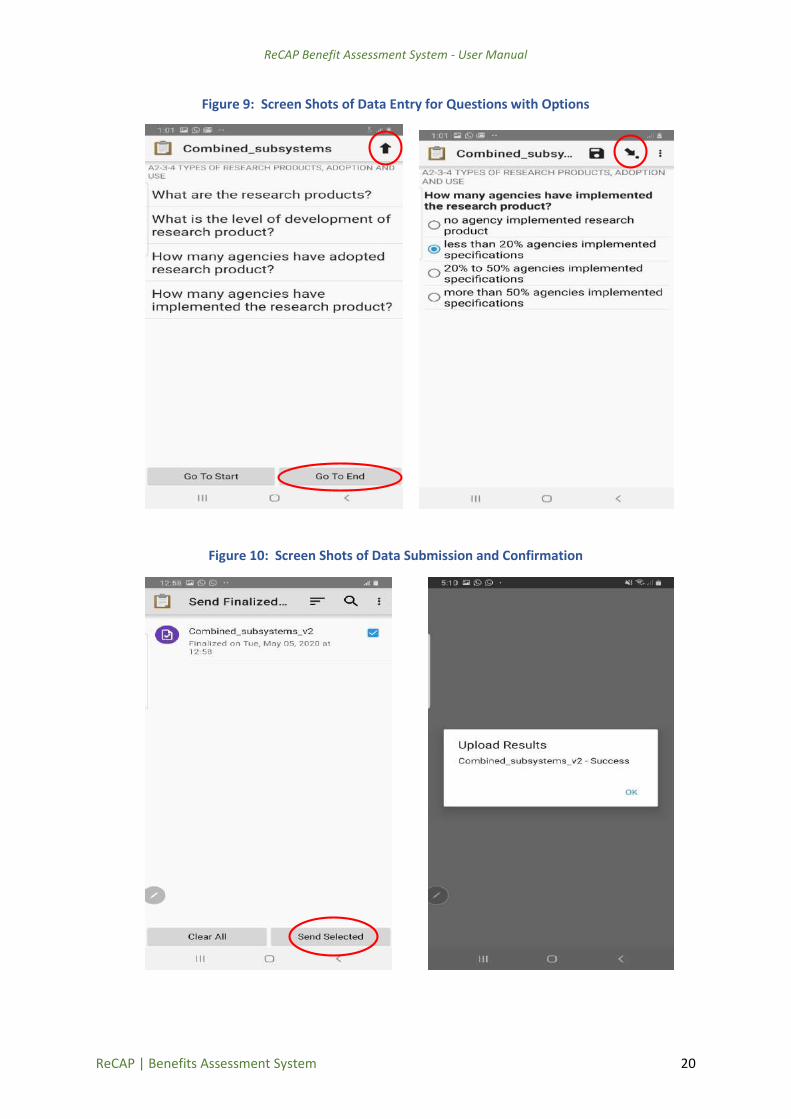
8. When all the data fields are completed, click on ‘Go to end’ (Figure 9) and save completed file
9. On the Main Menu, click on “Edit Saved Form” to make changes to saved file, if necessary. If
not changes are required, go to the next step.
10. When all edits are completed, upload the completed file to the Aggregate Server by clicking
‘Send Finalized Form’ on the Main Menu.
11. Select the file to be uploaded by ticking the appropriate file (Figure 10).
12. On the same screen, click on Send Selected (at the bottom of Figure 10 left side)
13. When the file is successfully uploaded, a confirmation appears (Figure 10, right side).
14. Clicking ok completes the data entry and upload process.
ReCAP Benefit Assessment System - User Manual
ReCAP | Benefits Assessment System 20
Figure 9: Screen Shots of Data Entry for Questions with Options
Figure 10: Screen Shots of Data Submission and Confirmation

ReCAP Benefit Assessment System - User Manual
ReCAP | Benefits Assessment System 21
5.0 DATA MANAGEMENT FROM CLOUD DATABASE
5.1 Introduction
Once you have completed the data collection template with ODK Collect and uploaded it into the cloud database, you can then view and manage your data using ODK Aggregate, if desired.
5.2 Viewing Form Submissions
The following are the steps to view data that has been uploaded to the server
1. Go to the Aggregate Database at https://agg.recapbas.com:8080/ODKAggregate/multimode_login.html (You have to put in your username and password provided by the Systems Administrator) Once logged in, the list of completed data collection forms that have been uploaded to the ODK Aggregate server will be displayed
Figure 11: Access to ODK Aggregate Server
2. Click on the Submissions tab and select the desired Form from the drop-down menu that you
wish to view. 3. Click on the “View Submissions” button next to the form. 4. Select the Form that you want to view
5. Click Visualize and it will take you to another page where you will see Type (Types of
visualization you desire; e.g.: Pie or Bar Chat)
Note Systems Administrator provides the usernames and passwords that are country specific.
Users can only view data for their respective countries
The user completes the data collection form and uploads the data to the cloud Aggregate server. This data can be viewed by the user by logging into the Aggregate Server website (See section5.2.1).
Project data available in the Aggregate Server needs to be exported from the Aggregate server in .cvs format and imported into this M&E system. We recommend that the System Administrator performs
these actions (See sections 5.3 and 6.4.)
ReCAP Benefit Assessment System - User Manual
ReCAP | Benefits Assessment System 22
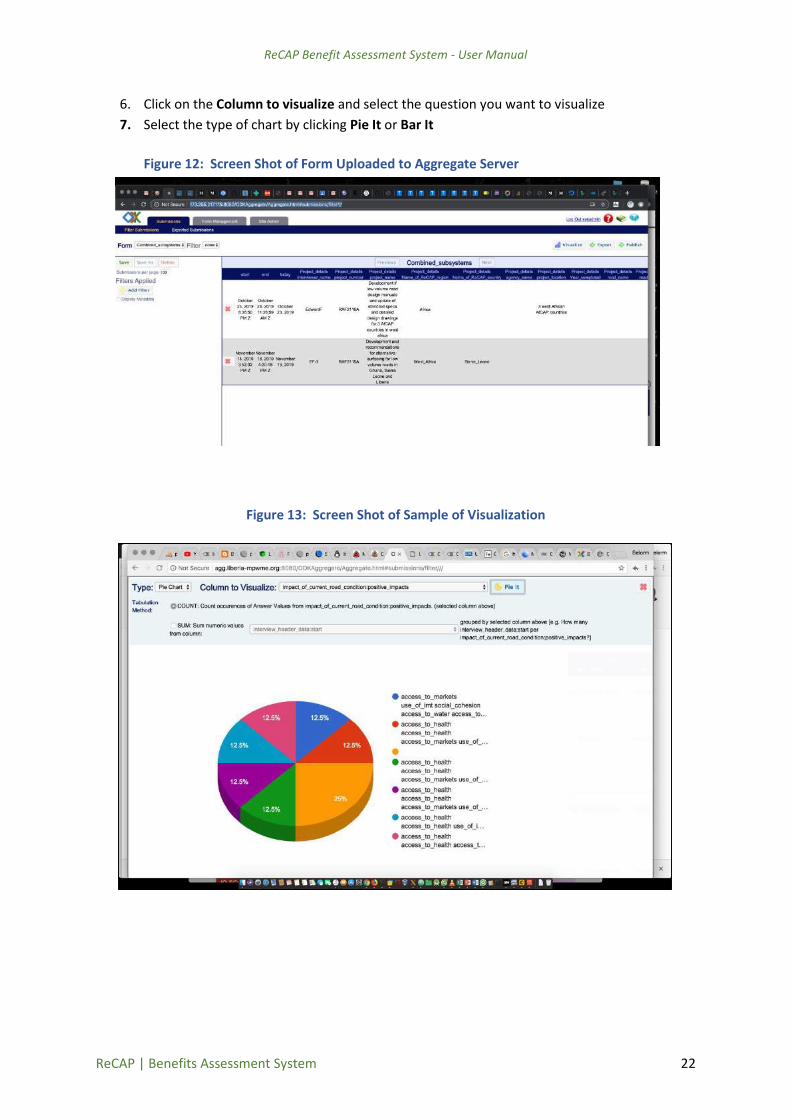
6. Click on the Column to visualize and select the question you want to visualize
7. Select the type of chart by clicking Pie It or Bar It
Figure 12: Screen Shot of Form Uploaded to Aggregate Server
Figure 13: Screen Shot of Sample of Visualization
ReCAP Benefit Assessment System - User Manual
ReCAP | Benefits Assessment System 23
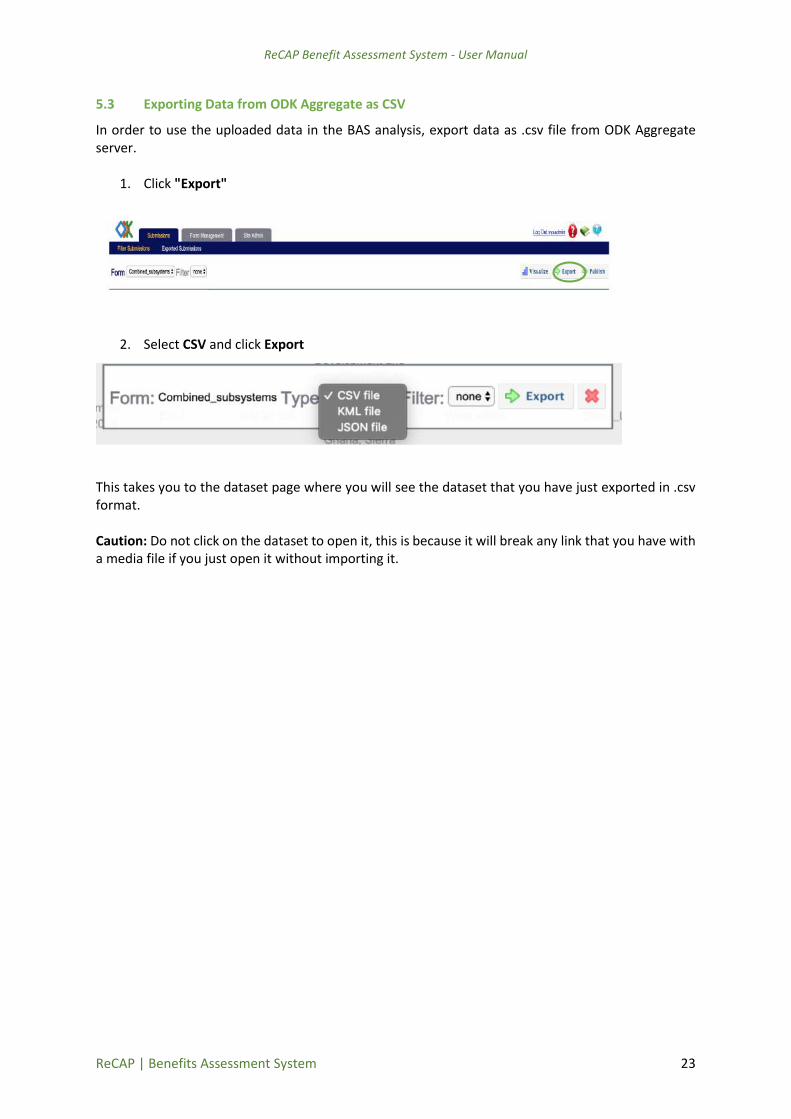
5.3 Exporting Data from ODK Aggregate as CSV
In order to use the uploaded data in the BAS analysis, export data as .csv file from ODK Aggregate server.
1. Click "Export"
2. Select CSV and click Export This takes you to the dataset page where you will see the dataset that you have just exported in .csv format. Caution: Do not click on the dataset to open it, this is because it will break any link that you have with a media file if you just open it without importing it.

ReCAP Benefit Assessment System - User Manual
ReCAP | Benefits Assessment System 24
6.0 MONITORING AND EVALUATION (M&E) PORTAL
6.1 Introduction
This section describes the steps to access the Monitoring and Evaluation (M&E) portal where the BAS results can be viewed. To access the M&E portal, go to the ReCAP Projects website and click on the M&E Portal tab: http://app.recapbas.com/me/index.php. This takes you to the login page.
6.2 M&E Login Page
Enter the username and password are provided by the
Systems Administrator.
6.3 M&E Portal Menu
When your login is successful, you will see the dashboard which gives you an overview of Projects with
information uploaded into the database.
6.4 Importing Data from ODK Aggregate into BAS for analysis
The exported .CSV file from the ODK Aggregate server in the section 5.3 is now imported into the ReCAP-BAS subsystem table for BAS analysis using the following steps.
1. After login to the M&E Portal http://app.recapbas.com/me/upload.php, from the dashboard,
click on projects. It takes you to another screen (see below). This page shows the list of
projects for which data has been uploaded to Aggregate Server.
2. Click on Load Project from csv

ReCAP Benefit Assessment System - User Manual
ReCAP | Benefits Assessment System 25
3. Click on choose file then and select your exported CSV file
4. click on Import and to populate the BAS subsystem tables
6.5 BAS Projects and Results
1. To view the benefits analyses results click on Dashboard – the project identity numbers and
titles will be displayed
2. Click on the Project ID for the project of interest
3. The next screen displays the scores for each indicator for each subsystem as well as the overall
or summary scores for that project.
The screen shots below show the benefit analyses results/scores for the 6 subsystems sequentially for A through F and a summary explanation of the scores for all subsystems. Notes:
Subsystem A has 4 parts and subsystem B has 3 parts (or Tables)
The scores are calculated based on responses to the questions in the data collection form. These are the numerical values associated with the responses. Explanations of the scorings are shown in the text boxes associated with each subsystem output.

ReCAP Benefit Assessment System - User Manual
ReCAP | Benefits Assessment System 26
Subsystem A: Research Output and Use
A1- achievement of research objectives The primary measure of success is if the research achieved its stated objectives. A scale from zero to three is provided with zero representing unmet objectives and 3 representing fully met objectives. Stated objective of program/project (weight =5):
0 = not achieved 1 = barely achieved 2 = partially achieved 3 = fully achieved
Additional measures of research success are given weights ranging from 4 to 1 with a binary value 1 (or 0) representing if a measure was met or not.
i. publishing of research reports (weight =4) ii. publishing a technical paper in a refereed journal (weight =3)
iii. publishing in workshops, conferences (weight =2) iv. citations and/or awards for technical publications (weight =1).
ReCAP Benefit Assessment System - User Manual
ReCAP | Benefits Assessment System 27
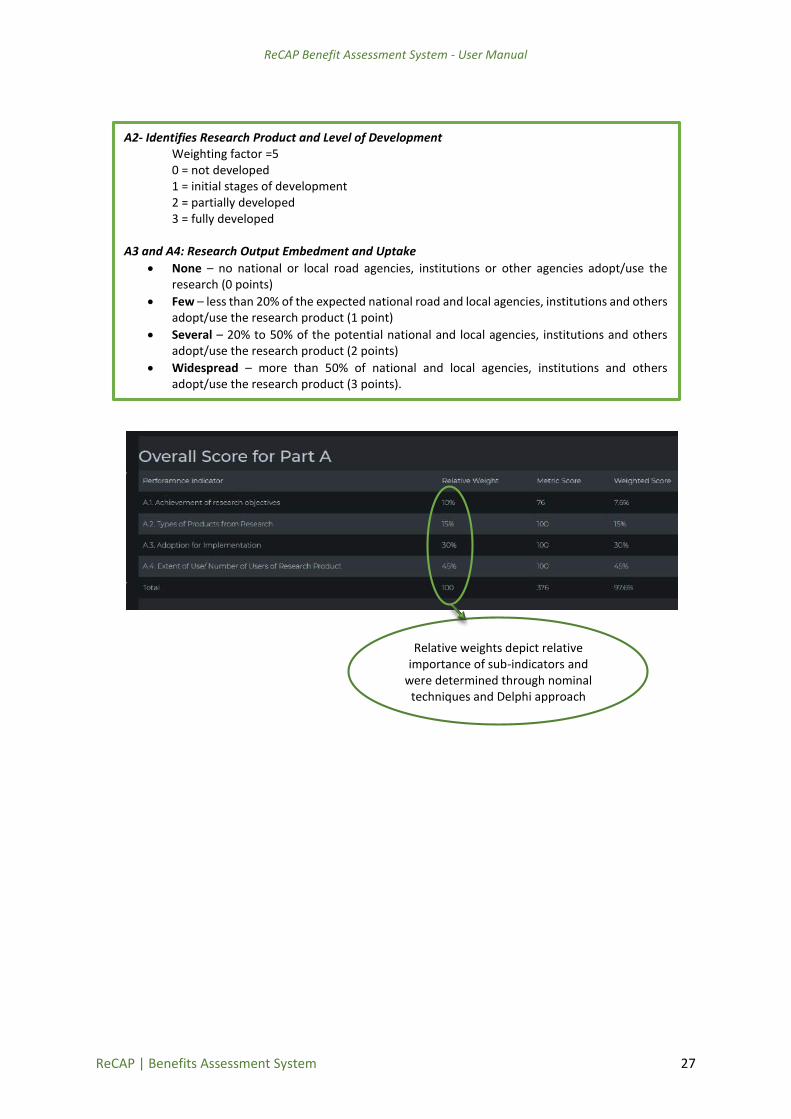
A2- Identifies Research Product and Level of Development Weighting factor =5 0 = not developed 1 = initial stages of development 2 = partially developed 3 = fully developed
A3 and A4: Research Output Embedment and Uptake
None – no national or local road agencies, institutions or other agencies adopt/use the research (0 points)
Few – less than 20% of the expected national road and local agencies, institutions and others adopt/use the research product (1 point)
Several – 20% to 50% of the potential national and local agencies, institutions and others adopt/use the research product (2 points)
Widespread – more than 50% of national and local agencies, institutions and others adopt/use the research product (3 points).
Relative weights depict relative importance of sub-indicators and
were determined through nominal techniques and Delphi approach

ReCAP Benefit Assessment System - User Manual
ReCAP | Benefits Assessment System 28
Subsystem B: Economic
Table B1 – Research Investment and Agency costs and investment Table B2 – User costs Table B3 – Summary of agency and user costs savings Investment and Cost Savings
Cost savings/research investment ratio represents the magnitude of benefits generated by implementing the results of the research project. This ratio is not a true benefit-cost ratio or return on investment because all the benefits and costs are not included in the calculation.

ReCAP Benefit Assessment System - User Manual
ReCAP | Benefits Assessment System 29
Subsystem C Socio-Economic
Subsystem D: Road Safety
Socio-Economic Impacts
Very low – no noticeable change (1 point)
Low – less than 20% of improvement due to implementation of research products
(2 points)
Medium– 20% to 50% of improvement due to implementation of research products
(3 points)
High –50% -75%of improvement due to implementation of research products (4
points).
Very High –greater than 75% improvement due to implementation of research
products (5 points).

ReCAP Benefit Assessment System - User Manual
ReCAP | Benefits Assessment System 30
Subsystem E: Environmental Impacts
Subsystem F: User Satisfaction
Road Safety Impacts
Very low – no noticeable improvement in road safety (1 point)
Low – less than 5% improvement in road safety (2 points)
Medium – 5-10% improvement in road safety (3 points)
High –10% to 20% improvement in road safety (4 points).
Very High – more than 20% improvement in road safety (5 points).
Environmental Impacts
Very low – high negative – more than 20% of population negatively impacted (1 point)
Low – less than 20% of population negatively impacted (2 points)
Neutral – no noticeable positive or negative impact (3 points)
Medium – less than 20% of population positively impacted (4 points).
High – more than 20% of population positively impacted (5 points).

ReCAP Benefit Assessment System - User Manual
ReCAP | Benefits Assessment System 31
Overall Scorecard
Rating Scale Depending on the score for each subsystem, the interpretations are different. The rating scheme is presented in Table 1 below and screenshot with graphical comparison of the scores for each subsystem are also shown below.
User Satisfaction
Very low –no noticeable impact (1 point)
Low – less than 20% of population satisfied (2 points)
Neutral – 20-50% of users satisfied and value implementation or research product (3 points)
Medium – 50-75% of users satisfied and value implementation or research product (4 points)
High – more than 75% of users satisfied and value implementation or research product (5
points).

ReCAP Benefit Assessment System - User Manual
ReCAP | Benefits Assessment System 32
Table 1. Rating Scale of BAS Outputs
Score Rating Research Output and Usage Economic Socio-Economic Road Safety Environmental
User Satisfaction
Score > 75%
Excellent
The research fully achieved its objectives, has developed products/outputs that are readily available and adopted by national agencies. These products/outputs are widely used by local and national agencies, and other institutions.
Total Cost Savings/Research Investment ratio
Excellent: Implementation of research product or result has significantly positive socio-economic effects
Implementation of research product or result has significantly improved road safety by reduced crashes and fatalities
High positive environmental impacts
Meets users’ needs/expectations adequately
60% < Score
75%
Good
The research partially achieved its objectives, has partially developed products that are available and adopted by national agencies. Several local and national agencies, and other institutions use these products
Implementation of research product or result has some positive socio-economic effects.
Implementation of research product or result has improved road safety by reduced crashes and fatalities to some measurable extent
Low positive environmental impacts
Meets users’ needs/expectations satisfactorily
45 < Score
60%
Fair
The research barely achieved its objectives, has developed products that are in the early stages of availability and adoption by national agencies. Few local and national agencies, and other institutions use these products.
Implementation of research product or result has marginal positive socio-economic effects.
Implementation of research product or result has marginal effects on road safety.
Marginal positive or negative environmental impacts
Limited users’ satisfaction
Score < 45%
Poor
The research did not quite achieve its intended objectives, has not developed products that are available and adopted by national agencies. Few or no local and national agencies, or other institutions use these products.
Poor: Implementation of research product or result has no significant positive socio-economic effects.
Implementation of research product or result has no significant effect on road safety.
Significant negative environmental impacts
Users not satisfied with research product

ReCAP Benefit Assessment System - User Manual
ReCAP | Benefits Assessment System 33
6.6 Printing Analysis Results
By clicking on the Print icon on top of the subsystem tables, you can either print or save the results
from the subsystem tables as pdf or select a printer to print everything.

ReCAP Benefit Assessment System - User Manual
ReCAP | Benefits Assessment System 34
6.7 Illustrative Examples
To illustrate and further explain application of the BAS, seven (7) worked examples are presented in Annex 2 of this report. These examples represent different research types or focus areas and demonstrate the systems’ flexibility to report benefit scores for subsystems with varying degrees of data availability. Six of the examples relate to specific ReCAP projects with different levels of data availability. The seventh example is hypothetical and it is included to demonstrate a situation where the research project produces more than one outcome and where data is available for all key indicators for each subsystem. The examples also illustrate the calculation of the benefit scores using the BAS framework.
7. CONCLUDING REMARKS
This project identifies performances measures and developed a framework to assess the benefits of research funded ReCAP. The guiding principle in the development of the performance indicators and assessment framework is to ensure that the measures are relevant, that they capture all types of research activities, objective enough to highlight the benefits and weaknesses of research projects and or programs and above all simple enough to be understood and applied by all potential users. The final output of the benefits assessment framework is visualized as a report or score card where scores are assigned to the various components. Poor performance in one area does not necessarily lead to the conclusion that the project or program is a failure. The relative merits of the various components of the framework need to be considered in assessing the overall benefits of the program in any given year. In applying the framework to new and potential projects it is recommended that assumptions and educated guesses of the data required be made and justified accordingly. It is recommended that the results of the assessment be updated as new data becomes available.

ReCAP Benefit Assessment System - User Manual
ReCAP | Benefits Assessment System 35
FREQUENTLY ASKED QUESTIONS (FAQ)
1) How do I install ODK?
Open 'Play Store'. Search for 'ODK', select 'ODK Collect' from the drop-down list. Click the
'INSTALL' button.
2) Can I download data from ODK without internet connectivity?
Yes, but you should also install ODK briefcase.
3) Can I go ahead with my data collection when offline? Yes, once you have downloaded your form to the mobile device, ODK can collect and queue the
data. Once back online, you can transfer your data to the server
4) Does ODK auto save my work?
Yes, the system auto saves first on your local device and after upload to the server. On the
server, it does auto save too.
5) Is there a way to retrieve my data after the app has abruptly closed or I ran out of battery?
If the user just re-launches ODK Collect and re-opens the form that they were filling out, ODK
Collect will open the save point file it made for that form.
6) Where do I get the username and password in order to access the ODK Aggregate server from
Collect?
Contact the ReCAP-BAS Systems Administrator.
7) Where do I get extra support on ODK Collect?
For support on how to use ODK and coordinated assessments, please visit
https://forum.opendatakit.org/c/support
8) Do I need all the data for a particular subsystem before the assessment will be done?
No. Just upload the data which is available to you. No assessment will be done for the
indicator(s) which data is unavailable. This will not affect the evaluation of the subsystem in
anyway.
9) Will I have results for all subsystems in any particular project?
No. Some subsystems may not apply or data may be missing or unavailable in certain projects.
10) Where can I find the aggregated or cumulative score for all the subsystems?
There is no aggregated or cumulative score for all the subsystems. Converting all scores to a
single score would lose the essence of the assessment exercise where strong and weak points
would not be easily identified and documented as lessons learned to help in designing future
projects.
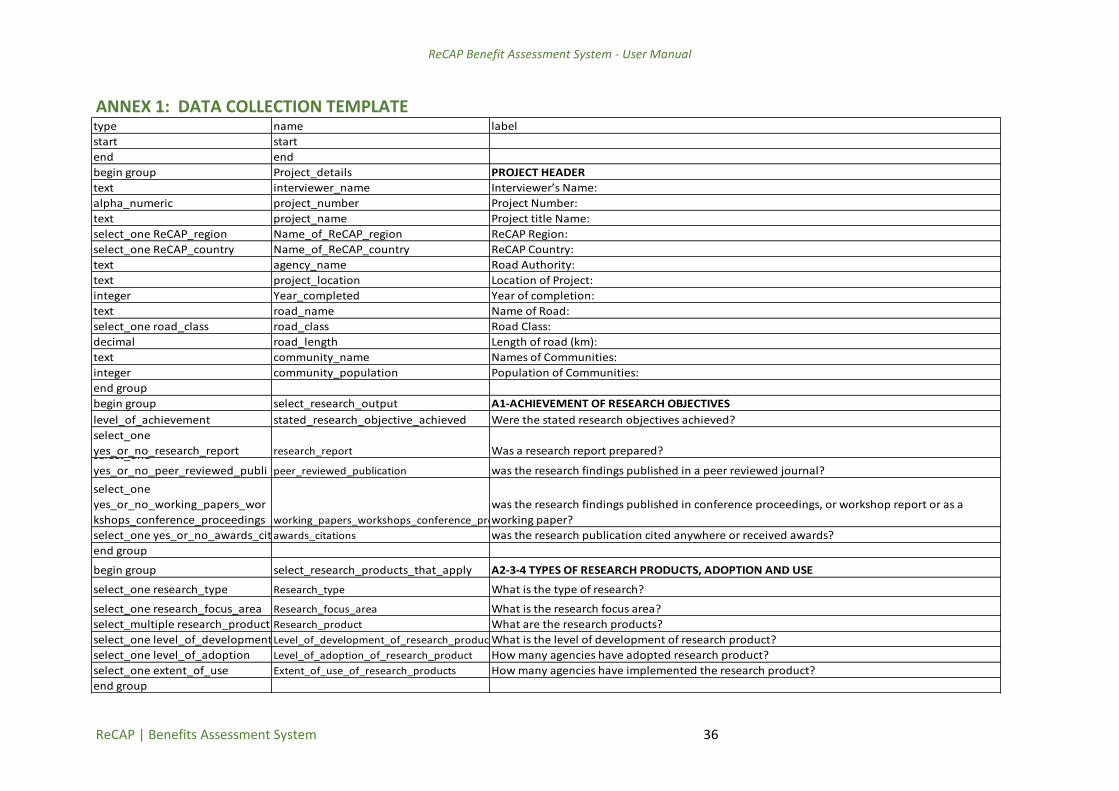
ReCAP Benefit Assessment System - User Manual
ReCAP | Benefits Assessment System 36
ANNEX 1: DATA COLLECTION TEMPLATE
type name label
start start
end end
begin group Project_details PROJECT HEADER
text interviewer_name Interviewer’s Name:
alpha_numeric project_number Project Number:
text project_name Project title Name:
select_one ReCAP_region Name_of_ReCAP_region ReCAP Region:
select_one ReCAP_country Name_of_ReCAP_country ReCAP Country:
text agency_name Road Authority:
text project_location Location of Project:
integer Year_completed Year of completion:
text road_name Name of Road:
select_one road_class road_class Road Class:
decimal road_length Length of road (km):
text community_name Names of Communities:
integer community_population Population of Communities:
end group
begin group select_research_output A1-ACHIEVEMENT OF RESEARCH OBJECTIVESselect_one
level_of_achievement stated_research_objective_achieved Were the stated research objectives achieved?
select_one
yes_or_no_research_report research_report Was a research report prepared?select_one
yes_or_no_peer_reviewed_publi peer_reviewed_publication was the research findings published in a peer reviewed journal?
select_one
yes_or_no_working_papers_wor
kshops_conference_proceedings working_papers_workshops_conference_proceedings
was the research findings published in conference proceedings, or workshop report or as a
working paper?
select_one yes_or_no_awards_citationsawards_citations was the research publication cited anywhere or received awards?
end group
begin group select_research_products_that_apply A2-3-4 TYPES OF RESEARCH PRODUCTS, ADOPTION AND USE
select_one research_type Research_type What is the type of research?
select_one research_focus_area Research_focus_area What is the research focus area?
select_multiple research_product Research_product What are the research products?
select_one level_of_developmentLevel_of_development_of_research_productWhat is the level of development of research product?
select_one level_of_adoption Level_of_adoption_of_research_product How many agencies have adopted research product?
select_one extent_of_use Extent_of_use_of_research_products How many agencies have implemented the research product?
end group
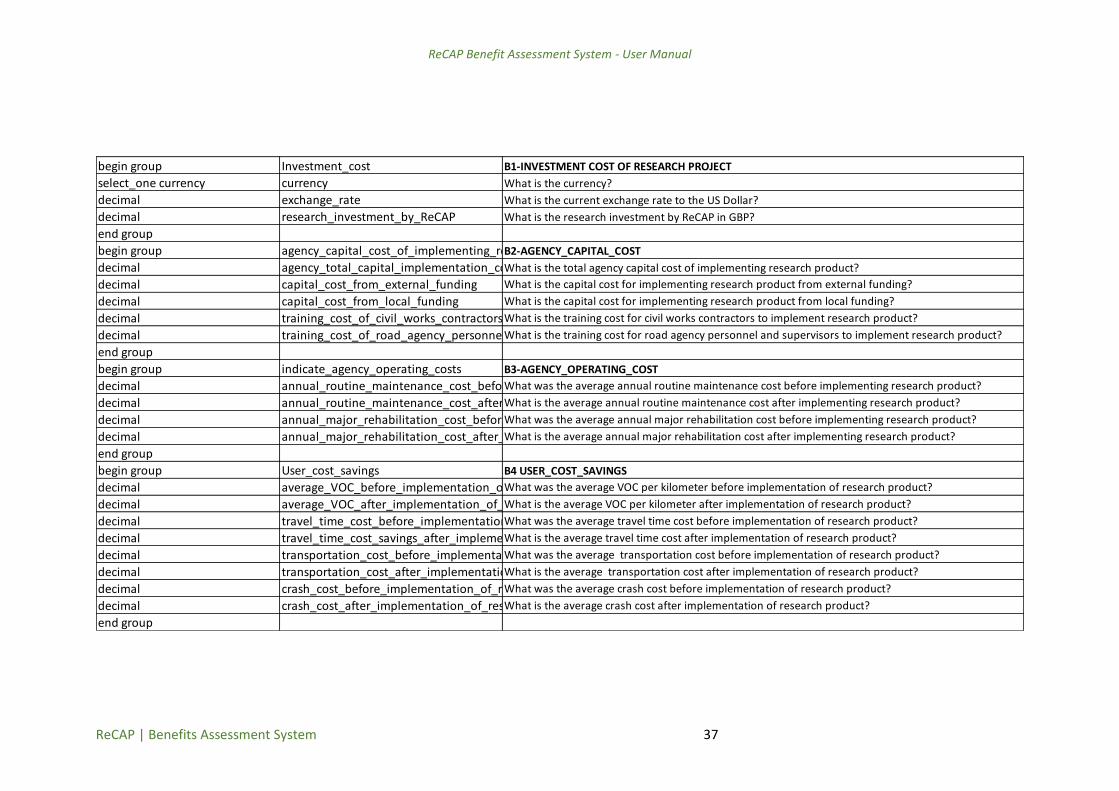
ReCAP Benefit Assessment System - User Manual
ReCAP | Benefits Assessment System 37
begin group Investment_cost B1-INVESTMENT COST OF RESEARCH PROJECT
select_one currency currency What is the currency?
decimal exchange_rate What is the current exchange rate to the US Dollar?
decimal research_investment_by_ReCAP What is the research investment by ReCAP in GBP?
end group
begin group agency_capital_cost_of_implementing_research_productsB2-AGENCY_CAPITAL_COST
decimal agency_total_capital_implementation_costWhat is the total agency capital cost of implementing research product?
decimal capital_cost_from_external_funding What is the capital cost for implementing research product from external funding?
decimal capital_cost_from_local_funding What is the capital cost for implementing research product from local funding?
decimal training_cost_of_civil_works_contractorsWhat is the training cost for civil works contractors to implement research product?
decimal training_cost_of_road_agency_personnel_supervisorsWhat is the training cost for road agency personnel and supervisors to implement research product?
end group
begin group indicate_agency_operating_costs B3-AGENCY_OPERATING_COST
decimal annual_routine_maintenance_cost_before_implementationWhat was the average annual routine maintenance cost before implementing research product?
decimal annual_routine_maintenance_cost_after_implementationWhat is the average annual routine maintenance cost after implementing research product?
decimal annual_major_rehabilitation_cost_before_implementationWhat was the average annual major rehabilitation cost before implementing research product?
decimal annual_major_rehabilitation_cost_after_implementationWhat is the average annual major rehabilitation cost after implementing research product?
end group
begin group User_cost_savings B4 USER_COST_SAVINGS
decimal average_VOC_before_implementation_of_research_productWhat was the average VOC per kilometer before implementation of research product?
decimal average_VOC_after_implementation_of_research_productWhat is the average VOC per kilometer after implementation of research product?
decimal travel_time_cost_before_implementation_of_research_productWhat was the average travel time cost before implementation of research product?
decimal travel_time_cost_savings_after_implementation_of_research_productWhat is the average travel time cost after implementation of research product?
decimal transportation_cost_before_implementation_of_research_productWhat was the average transportation cost before implementation of research product?
decimal transportation_cost_after_implementation_of_research_productWhat is the average transportation cost after implementation of research product?
decimal crash_cost_before_implementation_of_research_productWhat was the average crash cost before implementation of research product?
decimal crash_cost_after_implementation_of_research_productWhat is the average crash cost after implementation of research product?
end group
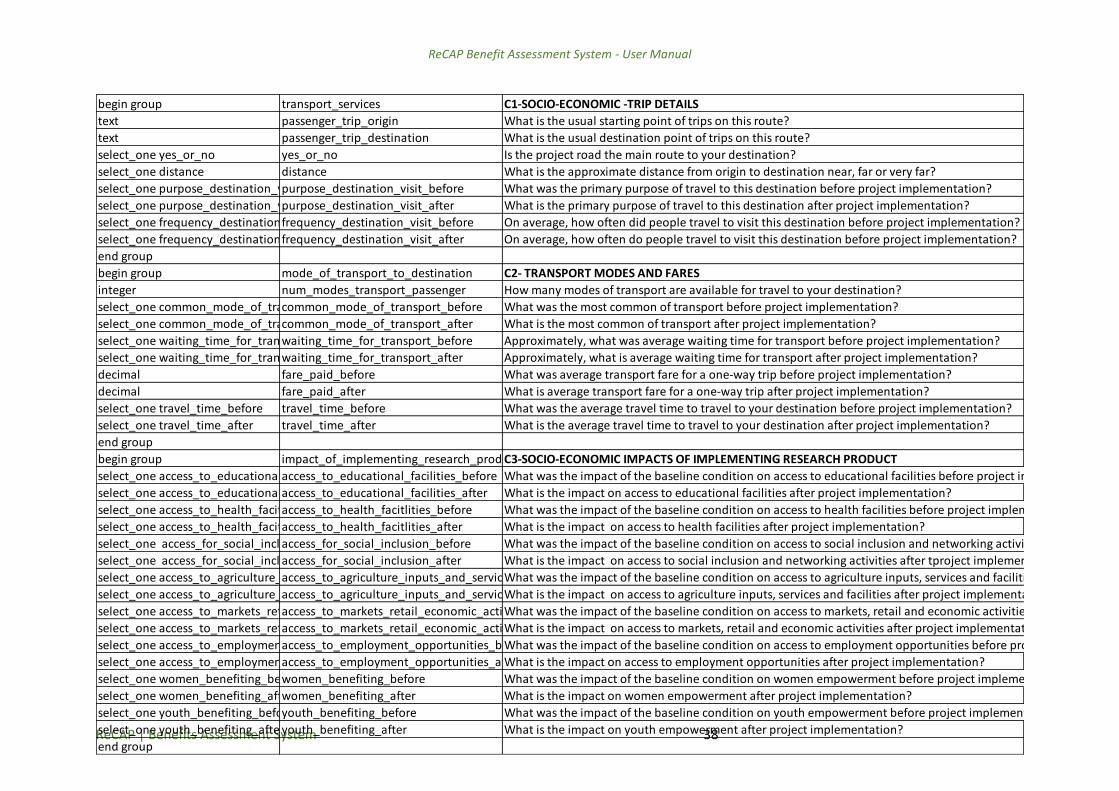
ReCAP Benefit Assessment System - User Manual
ReCAP | Benefits Assessment System 38
begin group transport_services C1-SOCIO-ECONOMIC -TRIP DETAILS
text passenger_trip_origin What is the usual starting point of trips on this route?
text passenger_trip_destination What is the usual destination point of trips on this route?
select_one yes_or_no yes_or_no Is the project road the main route to your destination?
select_one distance distance What is the approximate distance from origin to destination near, far or very far?
select_one purpose_destination_visit_beforepurpose_destination_visit_before What was the primary purpose of travel to this destination before project implementation?
select_one purpose_destination_visit_afterpurpose_destination_visit_after What is the primary purpose of travel to this destination after project implementation?
select_one frequency_destination_visit_beforefrequency_destination_visit_before On average, how often did people travel to visit this destination before project implementation?
select_one frequency_destination_visit_afterfrequency_destination_visit_after On average, how often do people travel to visit this destination before project implementation?
end group
begin group mode_of_transport_to_destination C2- TRANSPORT MODES AND FARES
integer num_modes_transport_passenger How many modes of transport are available for travel to your destination?
select_one common_mode_of_transport_beforecommon_mode_of_transport_before What was the most common of transport before project implementation?
select_one common_mode_of_transport_aftercommon_mode_of_transport_after What is the most common of transport after project implementation?
select_one waiting_time_for_transport_beforewaiting_time_for_transport_before Approximately, what was average waiting time for transport before project implementation?
select_one waiting_time_for_transport_afterwaiting_time_for_transport_after Approximately, what is average waiting time for transport after project implementation?
decimal fare_paid_before What was average transport fare for a one-way trip before project implementation?
decimal fare_paid_after What is average transport fare for a one-way trip after project implementation?
select_one travel_time_before travel_time_before What was the average travel time to travel to your destination before project implementation?
select_one travel_time_after travel_time_after What is the average travel time to travel to your destination after project implementation?
end group
begin group impact_of_implementing_research_productC3-SOCIO-ECONOMIC IMPACTS OF IMPLEMENTING RESEARCH PRODUCT
select_one access_to_educational_facilities_afteraccess_to_educational_facilities_before What was the impact of the baseline condition on access to educational facilities before project implementation?
select_one access_to_educational_facilities_beforeaccess_to_educational_facilities_after What is the impact on access to educational facilities after project implementation?
select_one access_to_health_facitlities_beforeaccess_to_health_facitlities_before What was the impact of the baseline condition on access to health facilities before project implementation?
select_one access_to_health_facitlities_afteraccess_to_health_facitlities_after What is the impact on access to health facilities after project implementation?
select_one access_for_social_inclusion_beforeaccess_for_social_inclusion_before What was the impact of the baseline condition on access to social inclusion and networking activities before project implementation?
select_one access_for_social_inclusion_afteraccess_for_social_inclusion_after What is the impact on access to social inclusion and networking activities after tproject implementation?
select_one access_to_agriculture_inputs_and_services_beforeaccess_to_agriculture_inputs_and_services_beforeWhat was the impact of the baseline condition on access to agriculture inputs, services and facilities before project implementation?
select_one access_to_agriculture_inputs_and_services_afteraccess_to_agriculture_inputs_and_services_afterWhat is the impact on access to agriculture inputs, services and facilities after project implementation?
select_one access_to_markets_retail_economic_activities_beforeaccess_to_markets_retail_economic_activities_afterWhat was the impact of the baseline condition on access to markets, retail and economic activities before project implementation?
select_one access_to_markets_retail_economic_activities_afteraccess_to_markets_retail_economic_activities_beforeWhat is the impact on access to markets, retail and economic activities after project implementation?
select_one access_to_employment_opportunities_beforeaccess_to_employment_opportunities_beforeWhat was the impact of the baseline condition on access to employment opportunities before project implementation?
select_one access_to_employment_opportunities_afteraccess_to_employment_opportunities_afterWhat is the impact on access to employment opportunities after project implementation?
select_one women_benefiting_beforewomen_benefiting_before What was the impact of the baseline condition on women empowerment before project implementation?
select_one women_benefiting_afterwomen_benefiting_after What is the impact on women empowerment after project implementation?
select_one youth_benefiting_beforeyouth_benefiting_before What was the impact of the baseline condition on youth empowerment before project implementation?
select_one youth_benefiting_afteryouth_benefiting_after What is the impact on youth empowerment after project implementation?
end group

ReCAP Benefit Assessment System - User Manual
ReCAP | Benefits Assessment System 39
begin group injury_severity_level D1-SAFETY - CASUALITIES BY SEVERITY
integer traffic_volume Annual Average Daily Traffic (AADT)
integer fatality_before What was the number of fatalities before project implementation?
integer fatality_after What is the number of fatalities after project implementation?
integer serious_injury_before What was the number of Seriously Injured Casualties before project implementation?
integer serious_injury_after What is the number of Seriously Injured Casualties after project implementation?
integer slight_injury_before What was the number of Slightly Injured Casualties before project implementation?
integer slight_injury_after What is the number of Slightly Injured Casualties after project implementation?
end group
begin group crash_severity_level D2- CRASHES BY SERVERITY
integer fatal_before What was the number of Fatal Crashes before project implementation?
integer fatal_after What is the number of Fatal Crashes after project implementation?
integer serious_crash_before What was the number of Serious Crashes before project implementation?
integer serious_crash_after What is the number of Serious Crashes after project implementation?
integer minor_crash_before What was number of minor of Minor Crashes before project implementation?
integer minor_crash_after What is number of minor of Minor Crashes after project implementation?
integer property_damage_only_before What was the number of Property Damage Only (PDO) crashes before project implementation?
integer property_damage_only_after What is the number of Property Damage Only (PDO) crashes after project implementation?
end group
begin group impact_of_implementing_research_productD3-SAFETY IMPACTS OF IMPLEMENTING RESEARCH PRODUCT
select_one crashes number_of_crashes_before What was the impact on number of crashes/accidents before project implementation?
select_one crashes number_of_crashes_after What is the impact on number of crashes/accidents after project implementation?
select_one crash_density crash_density_before What was the impact on number of crashes/accidents per kilometer before project implementation?
select_one crash_density crash_density_after What is the impact on number of crashes/accidents per kilometer after project implementation?
select_one fatalities number_of_fatalities_before What was the impact on number of fatalities before project implementation?
select_one fatalities number_of_fatalities_after What is the impact on number of fatalities after project implementation?
select_one serious_crashes number_of_serious_crashes_before What was the impact on number of serious crashes before project implementation?
select_one serious_crashes number_of_serious_crashes_after What is the impact on number of serious crashes after project implementation?
select_one minor_crashes number_of_minor_crashes_before What was the impact on number of minor crashes before project implementation?
select_one minor_crashes number_of_minor_crashes_after What is the impact on number of minor crashes after project implementation?
end group
begin group safety_helmet_use D4 - CRASH HELMET USE BY MOTORCYCLE RIDERS
select_one safety_helmet_users safety_helmet_user_before What was the approximate number of motorcycle riders use helmets before training?
select_one safety_helmet_users safety_helmet_use_after What is the approximate number of motorcycle riders use helmets after training?
select_one safety_training_sessionssafety_training_and_sensitization How many safety training and sensitization campaigns were conducted during implementation of research product?
select_one safety_training_participantsSafety_training_participants What is average number of participants in each training session?
end group

ReCAP Benefit Assessment System - User Manual
ReCAP | Benefits Assessment System 40
begin_group select_environmental_impacts_that_apply E1-ENVIRONMENTAL IMPACTS
select_one population_affected air_quality_emissions_and_dust
what proportion of the population is affected by environmental of implementation of research
products in terms of air quality (tail pipe emissions and dust)?
select_one area_eroded soil_erosion
what proportion of population is affected by erosion due to implementation of research
products?
select_one drainage_structures_faileddrainge_structure_failures How many drainage structures failed due to flooding, lanslides, construction trucks?
end group
begin group select_user_satisfaction_value_that_applyF1-USER SATISFACTION
select_one users_aware awareness_of_research_product What percentage of potential users are aware ofikplementation of the research product?
select_one beneficiaries_using_facilityuse_of_research_product
What percentage of beneficiaries actually use the facility after implementation of research
product (traffic volume)?
select_one users_value value_of_research_product What value do users or beneficiaries place on the use of the research product?
end group
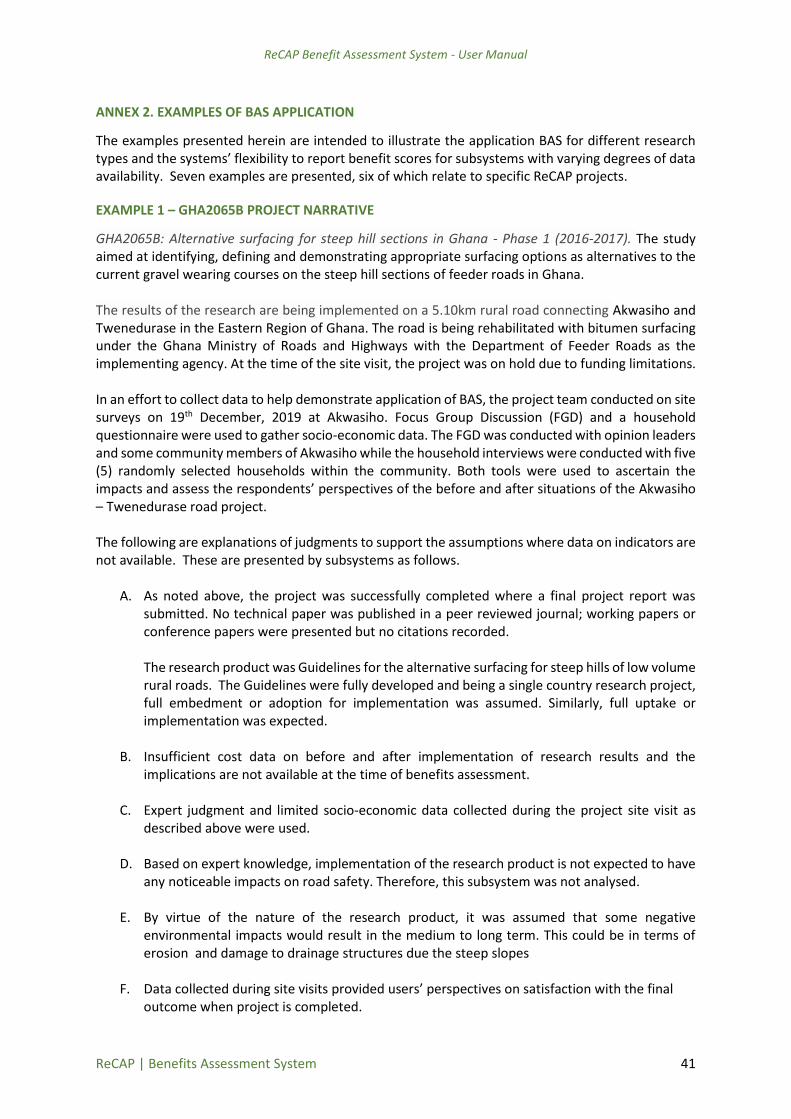
ReCAP Benefit Assessment System - User Manual
ReCAP | Benefits Assessment System 41
ANNEX 2. EXAMPLES OF BAS APPLICATION
The examples presented herein are intended to illustrate the application BAS for different research types and the systems’ flexibility to report benefit scores for subsystems with varying degrees of data availability. Seven examples are presented, six of which relate to specific ReCAP projects.
EXAMPLE 1 – GHA2065B PROJECT NARRATIVE
GHA2065B: Alternative surfacing for steep hill sections in Ghana - Phase 1 (2016-2017). The study aimed at identifying, defining and demonstrating appropriate surfacing options as alternatives to the current gravel wearing courses on the steep hill sections of feeder roads in Ghana. The results of the research are being implemented on a 5.10km rural road connecting Akwasiho and Twenedurase in the Eastern Region of Ghana. The road is being rehabilitated with bitumen surfacing under the Ghana Ministry of Roads and Highways with the Department of Feeder Roads as the implementing agency. At the time of the site visit, the project was on hold due to funding limitations. In an effort to collect data to help demonstrate application of BAS, the project team conducted on site surveys on 19th December, 2019 at Akwasiho. Focus Group Discussion (FGD) and a household questionnaire were used to gather socio-economic data. The FGD was conducted with opinion leaders and some community members of Akwasiho while the household interviews were conducted with five (5) randomly selected households within the community. Both tools were used to ascertain the impacts and assess the respondents’ perspectives of the before and after situations of the Akwasiho – Twenedurase road project. The following are explanations of judgments to support the assumptions where data on indicators are not available. These are presented by subsystems as follows.
A. As noted above, the project was successfully completed where a final project report was submitted. No technical paper was published in a peer reviewed journal; working papers or conference papers were presented but no citations recorded. The research product was Guidelines for the alternative surfacing for steep hills of low volume rural roads. The Guidelines were fully developed and being a single country research project, full embedment or adoption for implementation was assumed. Similarly, full uptake or implementation was expected.
B. Insufficient cost data on before and after implementation of research results and the
implications are not available at the time of benefits assessment.
C. Expert judgment and limited socio-economic data collected during the project site visit as described above were used.
D. Based on expert knowledge, implementation of the research product is not expected to have any noticeable impacts on road safety. Therefore, this subsystem was not analysed.
E. By virtue of the nature of the research product, it was assumed that some negative
environmental impacts would result in the medium to long term. This could be in terms of erosion and damage to drainage structures due the steep slopes
F. Data collected during site visits provided users’ perspectives on satisfaction with the final
outcome when project is completed.
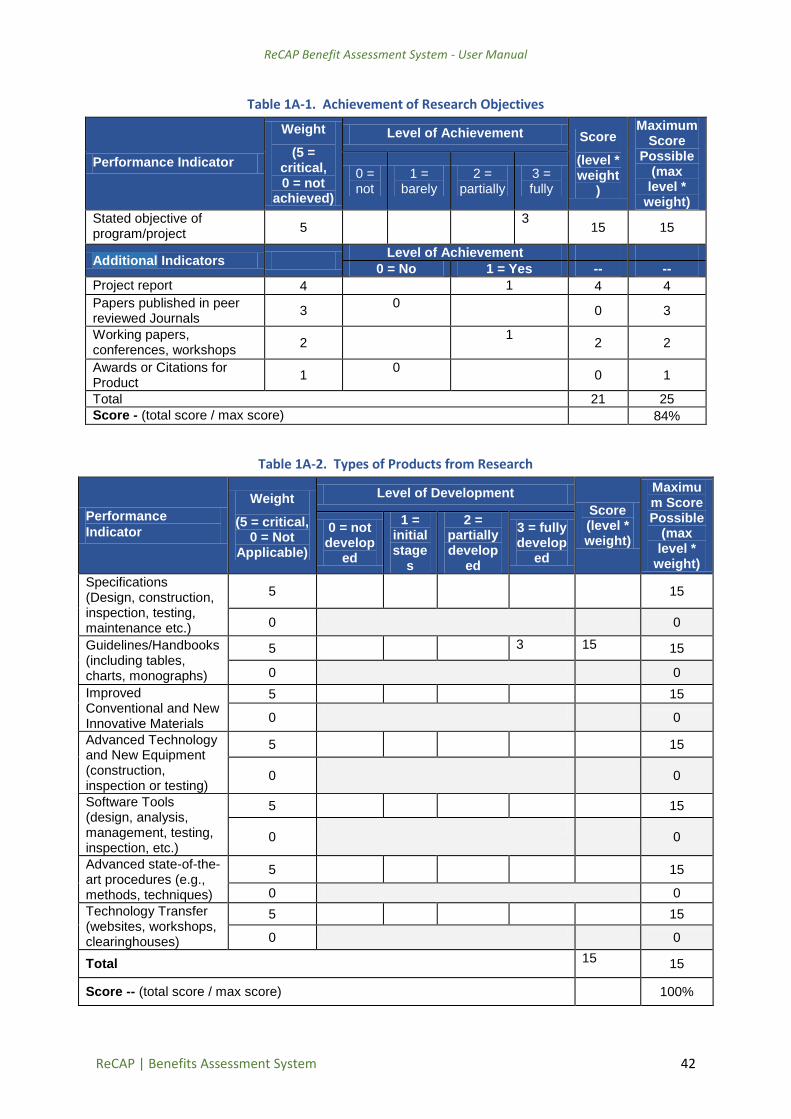
ReCAP Benefit Assessment System - User Manual
ReCAP | Benefits Assessment System 42
Table 1A-1. Achievement of Research Objectives
Performance Indicator
Weight
(5 = critical, 0 = not
achieved)
Level of Achievement Score
(level * weight
)
Maximum Score
Possible (max level *
weight)
0 = not
1 = barely
2 = partially
3 = fully
Stated objective of program/project
5 3
15 15
Additional Indicators Level of Achievement
0 = No 1 = Yes -- --
Project report 4 1 4 4
Papers published in peer reviewed Journals
3 0
0 3
Working papers, conferences, workshops
2 1
2 2
Awards or Citations for Product
1 0
0 1
Total 21 25
Score - (total score / max score) 84%
Table 1A-2. Types of Products from Research
Performance
Indicator
Weight
(5 = critical, 0 = Not
Applicable)
Level of Development
Score (level * weight)
Maximum Score Possible
(max level *
weight)
0 = not develop
ed
1 = initial stage
s
2 = partially develop
ed
3 = fully develop
ed
Specifications (Design, construction, inspection, testing, maintenance etc.)
5
15
0 0
Guidelines/Handbooks (including tables, charts, monographs)
5 3 15 15
0 0
Improved Conventional and New Innovative Materials
5 15
0 0
Advanced Technology and New Equipment (construction, inspection or testing)
5 15
0
0
Software Tools (design, analysis, management, testing, inspection, etc.)
5 15
0
0
Advanced state-of-the-art procedures (e.g., methods, techniques)
5 15
0 0
Technology Transfer (websites, workshops, clearinghouses)
5 15
0 0
Total 15 15
Score -- (total score / max score) 100%
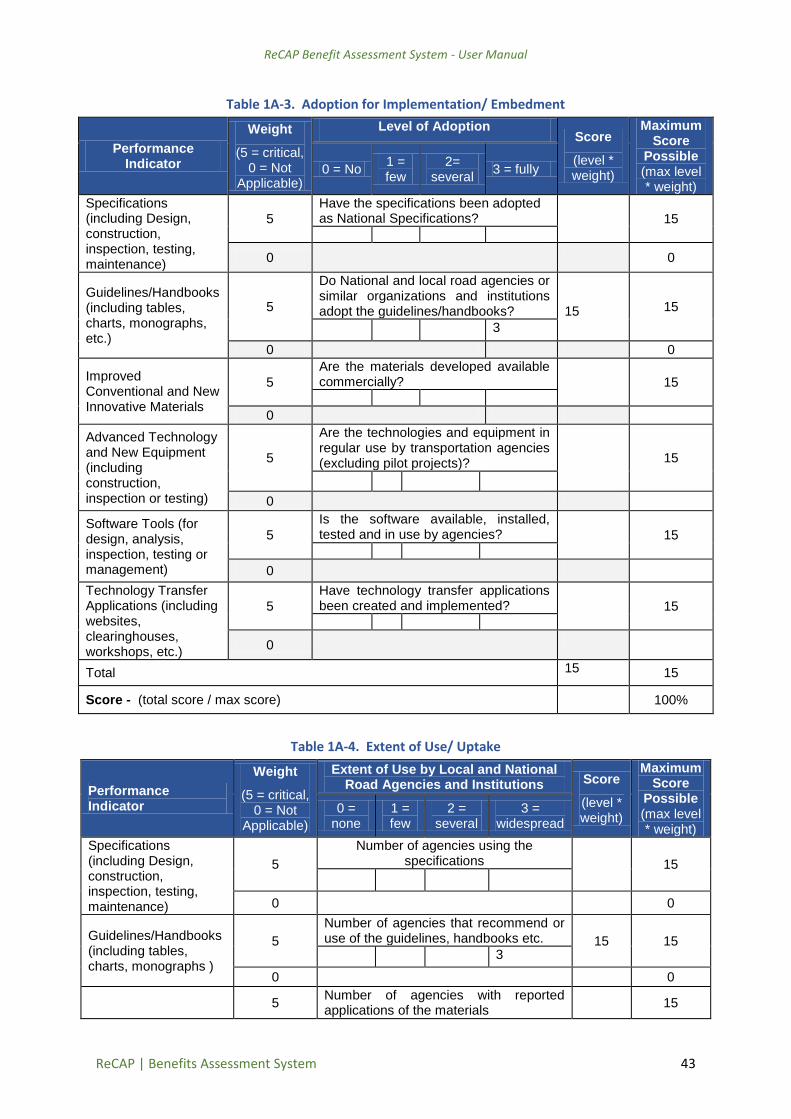
ReCAP Benefit Assessment System - User Manual
ReCAP | Benefits Assessment System 43
Table 1A-3. Adoption for Implementation/ Embedment
Performance Indicator
Weight
(5 = critical, 0 = Not
Applicable)
Level of Adoption Score
(level * weight)
Maximum Score
Possible (max level * weight)
0 = No 1 = few
2= several
3 = fully
Specifications (including Design, construction, inspection, testing, maintenance)
5
Have the specifications been adopted as National Specifications?
15
0
0
Guidelines/Handbooks (including tables, charts, monographs, etc.)
5
Do National and local road agencies or similar organizations and institutions adopt the guidelines/handbooks?
15 15
3
0 0
Improved Conventional and New Innovative Materials
5
Are the materials developed available commercially?
15
0
Advanced Technology and New Equipment (including construction, inspection or testing)
5
Are the technologies and equipment in regular use by transportation agencies (excluding pilot projects)?
15
0
Software Tools (for design, analysis, inspection, testing or management)
5
Is the software available, installed, tested and in use by agencies?
15
0
Technology Transfer Applications (including websites, clearinghouses, workshops, etc.)
5
Have technology transfer applications been created and implemented?
15
0
Total 15 15
Score - (total score / max score) 100%
Table 1A-4. Extent of Use/ Uptake
Performance Indicator
Weight
(5 = critical, 0 = Not
Applicable)
Extent of Use by Local and National Road Agencies and Institutions Score
(level * weight)
Maximum Score
Possible (max level * weight)
0 = none
1 = few
2 = several
3 = widespread
Specifications (including Design, construction, inspection, testing, maintenance)
5
Number of agencies using the specifications 15
0 0
Guidelines/Handbooks (including tables, charts, monographs )
5
Number of agencies that recommend or use of the guidelines, handbooks etc. 15 15 3
0 0
5 Number of agencies with reported applications of the materials
15
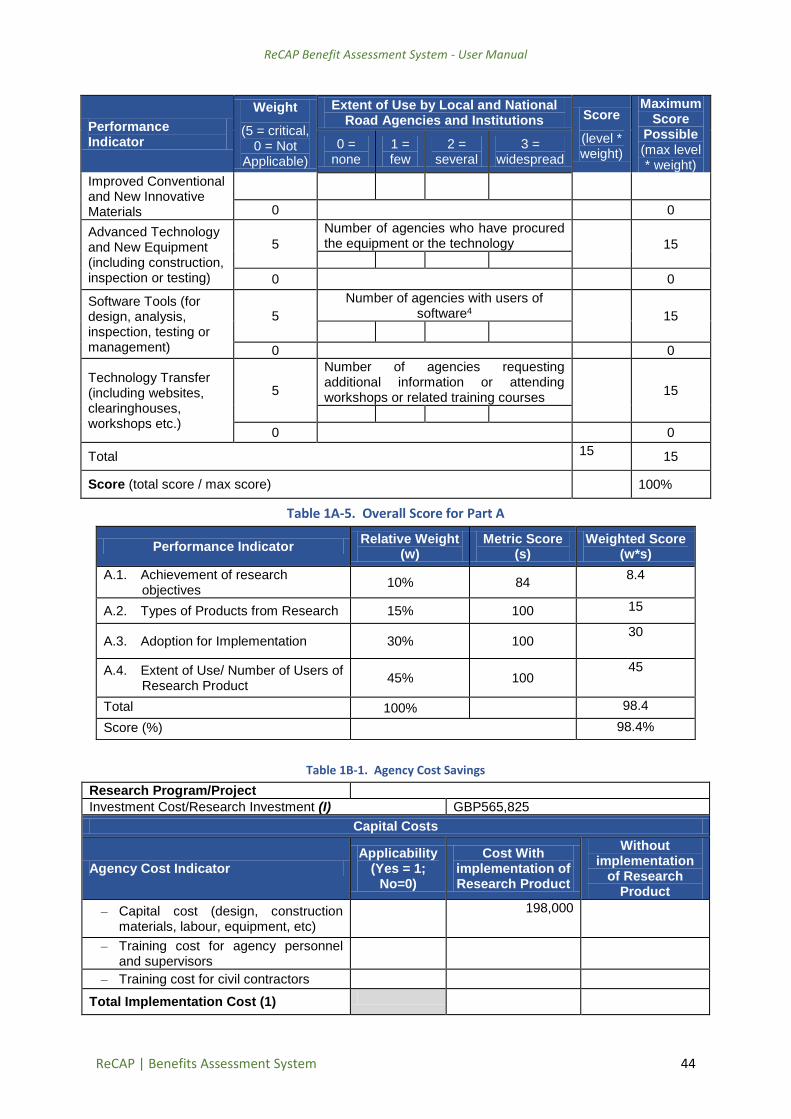
ReCAP Benefit Assessment System - User Manual
ReCAP | Benefits Assessment System 44
Performance Indicator
Weight
(5 = critical, 0 = Not
Applicable)
Extent of Use by Local and National Road Agencies and Institutions Score
(level * weight)
Maximum Score
Possible (max level * weight)
0 = none
1 = few
2 = several
3 = widespread
Improved Conventional and New Innovative Materials
0 0
Advanced Technology and New Equipment (including construction, inspection or testing)
5
Number of agencies who have procured the equipment or the technology
15
0 0
Software Tools (for design, analysis, inspection, testing or management)
5
Number of agencies with users of software4
15
0 0
Technology Transfer (including websites, clearinghouses, workshops etc.)
5
Number of agencies requesting additional information or attending workshops or related training courses
15
0 0
Total 15 15
Score (total score / max score) 100%
Table 1A-5. Overall Score for Part A
Performance Indicator Relative Weight
(w) Metric Score
(s) Weighted Score
(w*s)
A.1. Achievement of research objectives
10% 84 8.4
A.2. Types of Products from Research 15% 100 15
A.3. Adoption for Implementation 30% 100 30
A.4. Extent of Use/ Number of Users of Research Product
45% 100 45
Total 100% 98.4
Score (%) 98.4%
Table 1B-1. Agency Cost Savings
Research Program/Project
Investment Cost/Research Investment (I) GBP565,825
Capital Costs
Agency Cost Indicator Applicability
(Yes = 1; No=0)
Cost With implementation of Research Product
Without implementation
of Research Product
– Capital cost (design, construction materials, labour, equipment, etc)
198,000
– Training cost for agency personnel and supervisors
– Training cost for civil contractors
Total Implementation Cost (1)
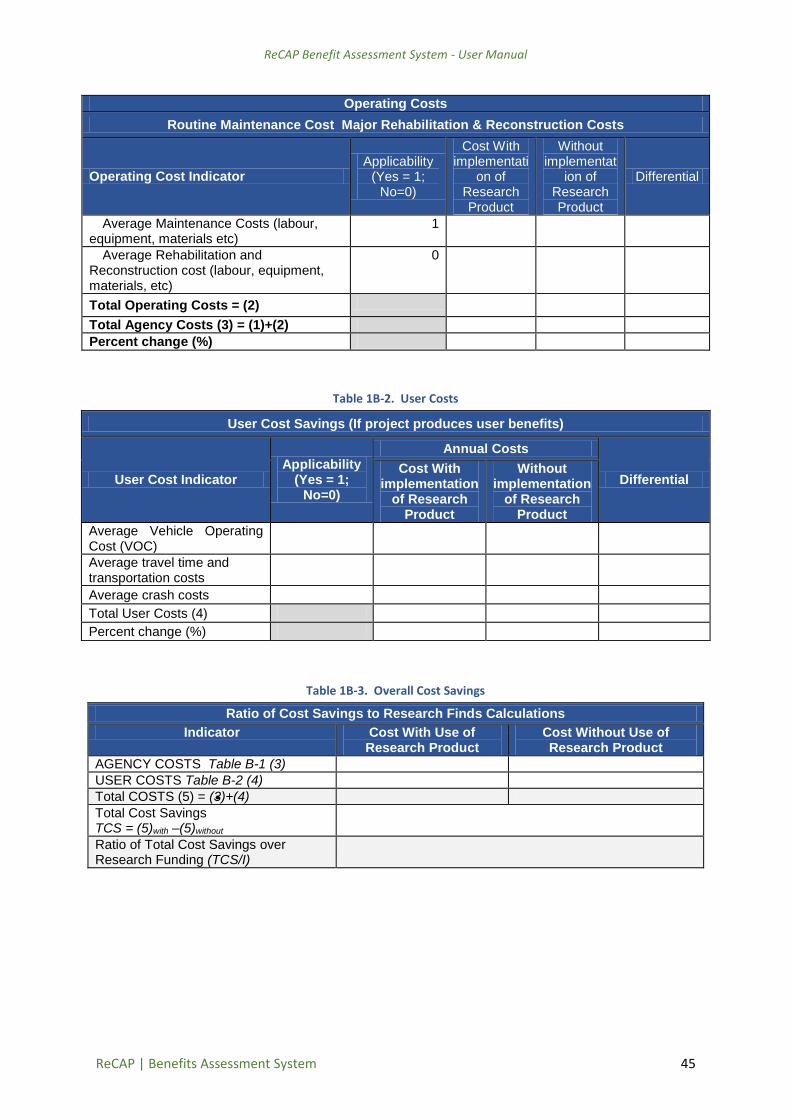
ReCAP Benefit Assessment System - User Manual
ReCAP | Benefits Assessment System 45
Operating Costs
Routine Maintenance Cost Major Rehabilitation & Reconstruction Costs
Operating Cost Indicator Applicability
(Yes = 1; No=0)
Cost With implementati
on of Research Product
Without implementat
ion of Research Product
Differential
Average Maintenance Costs (labour, equipment, materials etc)
1
Average Rehabilitation and Reconstruction cost (labour, equipment, materials, etc)
0
Total Operating Costs = (2)
Total Agency Costs (3) = (1)+(2)
Percent change (%)
Table 1B-2. User Costs
User Cost Savings (If project produces user benefits)
User Cost Indicator Applicability
(Yes = 1; No=0)
Annual Costs
Differential Cost With
implementation of Research
Product
Without implementation
of Research Product
Average Vehicle Operating Cost (VOC)
Average travel time and transportation costs
Average crash costs
Total User Costs (4)
Percent change (%)
Table 1B-3. Overall Cost Savings
Ratio of Cost Savings to Research Finds Calculations
Indicator Cost With Use of Research Product
Cost Without Use of Research Product
AGENCY COSTS Table B-1 (3)
USER COSTS Table B-2 (4)
Total COSTS (5) = (3)+(4)
Total Cost Savings TCS = (5)with –(5)without
Ratio of Total Cost Savings over Research Funding (TCS/I)

ReCAP Benefit Assessment System - User Manual
ReCAP | Benefits Assessment System 46
Table 1C-1. Socio-Economic Subsystem
Performance
Indicator
Weight
(5 = critical, 0 = Not
Applicable)
Degree of Impact Score (level * weight
)
Maximum Score Possible
(max level *
weight)
1= very low
2 = low 3 =
medium
4 = high
5 = very high
Access to educational facilities
5 4 20 25
0
Access to health facilities
5 4 20 25
0
Social Inclusion 5 5 25 25
0
Access to agric inputs and services
5 4 20 25
0
Access to markets, retail, farming and economic activities
5 4 20 25
0
Employment 5 3 15 25
0
Women benefiting 5 3 15 25
0
Youth benefiting 5 3 15 25
0
Travel time savings
5 5 25 25
0
Transport cost savings
5 4 20 25
0 0
Total 195 250
Score - (total score / max score) 78%

ReCAP Benefit Assessment System - User Manual
ReCAP | Benefits Assessment System 47
Table 1D-1. Road Safety Subsystem
Performance
Indicator
Weight
(5 = critical, 0 =
Not Applicable
)
Degree of Impact Score (level * weight
)
Maximum Score Possible
(max level *
weight)
1 = very low
2 = low 3 =
medium
4 = high
5 = very high
Number of crashes 5 25
0 0
Number of fatalities 5 25
Crash density (crashes/km)
5 25
0 0
Number of serious crashes
5 25
0 0
Number of minor crashes
5 25
0
Number safety helmet use
5 25
0
Total
Score – (total score / max score)
Table 1E-1. Environmental Subsystem
Performance
Indicator
Weight
(5 = critical, 0 = Not
Applicable)
Level of Impact Score
(level *
weight)
Max Score
Possible = (max level
*weight)
1 = high negativ
e impact
2 = low
negative
3 = no
noticeabl
e
4 = low
positive
5 = high positive
Air Quality or Emissions Reduction or dust control
5 25
0 0
0
Erosion 5 2 10 25
0 0
Drainage structure protection
5 2 10 25
0 0
Total 20 50
Score - (total score / max score) 40%
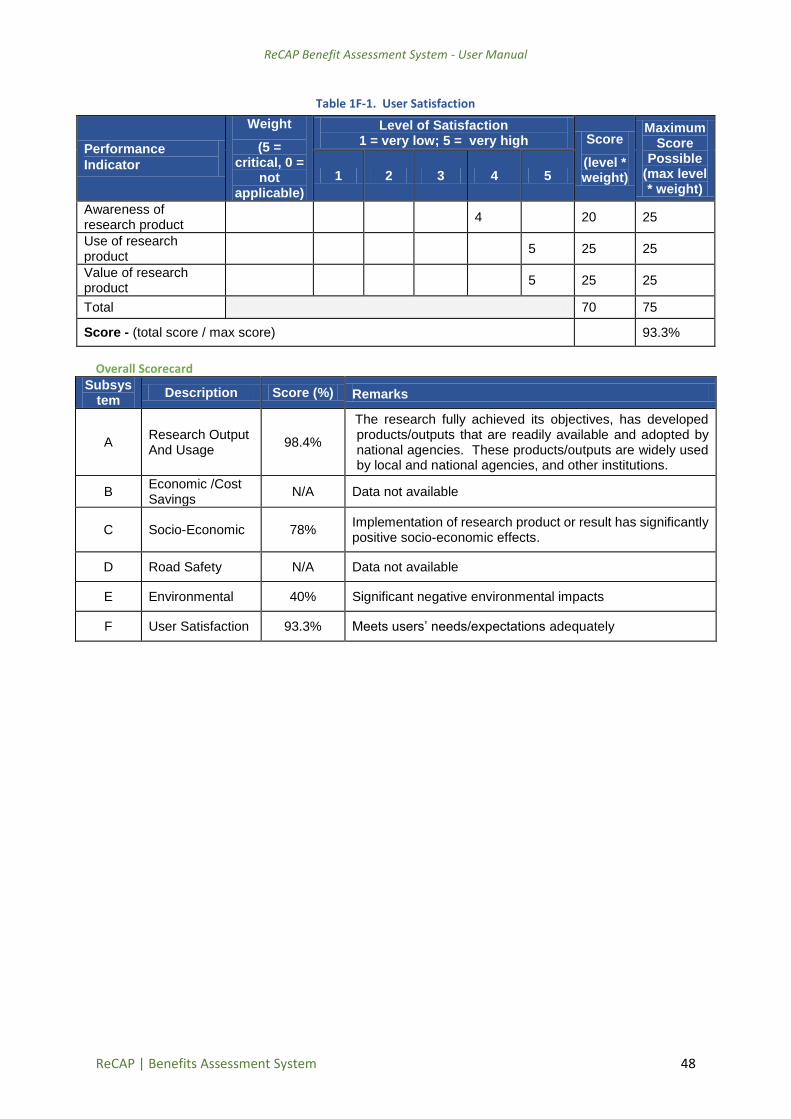
ReCAP Benefit Assessment System - User Manual
ReCAP | Benefits Assessment System 48
Table 1F-1. User Satisfaction
Performance
Indicator
Weight
(5 = critical, 0 =
not applicable)
Level of Satisfaction 1 = very low; 5 = very high Score
(level * weight)
Maximum Score
Possible (max level * weight)
1 2 3 4 5
Awareness of research product
4 20 25
Use of research product
5 25 25
Value of research product
5 25 25
Total 70 75
Score - (total score / max score) 93.3%
Overall Scorecard
Subsystem
Description Score (%) Remarks
A Research Output And Usage
98.4%
The research fully achieved its objectives, has developed products/outputs that are readily available and adopted by national agencies. These products/outputs are widely used by local and national agencies, and other institutions.
B Economic /Cost Savings
N/A Data not available
C Socio-Economic 78% Implementation of research product or result has significantly positive socio-economic effects.
D Road Safety N/A Data not available
E Environmental 40% Significant negative environmental impacts
F User Satisfaction 93.3% Meets users’ needs/expectations adequately

ReCAP Benefit Assessment System - User Manual
ReCAP | Benefits Assessment System 49
EXAMPLE 2 – RAF2115A PROJECT NARRATIVE
RAF2115A: Development and Recommendations for alternative surfacings for low volume roads in Ghana, Sierra Leone and Liberia (2017-2018). The following are explanations of judgments to support the assumptions where data on indicators are not available. These are presented by subsystems as follows.
A. The project was successfully completed where a final project report was submitted and accepted; no technical paper was published in a peer reviewed journal; working papers or conference papers were presented but no citations recorded.
The research product was Guidelines for alternative surfacings of low volume rural roads. This product was fully developed and being a regional research project for only three countries, full embedment or adoption for implement was assumed. Similarly, all three countries were assumed to uptake the research product (i.e. full uptake).
B. Insufficient cost data on before and after implementation of research results and the
implications are not available at the time of benefits assessment.
C. With regards to socio-economic impacts, no before and after data are available. The potential impacts resulting from implementation of the specific research products are estimated based on expert judgment for the different indicators.
D. For road safety, based on expert knowledge, improvements in road surface conditions would
not have significant (low to medium) impacts on road safety indicators
E. Improvements in road surface conditions were assumed to have no noticeable negative impacts on the environmental indicators.
F. No data on user satisfaction of implementation of the research product was available.
However, the nature of research product and data obtained from site visits for GHA2065A, guided the estimates used in analysing the benefits in the user satisfaction subsystem.
Table 2A-1. Achievement of Research Objectives
Performance Indicator
Weight
(5 = critical, 0 = not
achieved)
Level of Achievement Score
(level * weight
)
Maximum Score
Possible (max level * weight)
0 = not 1 =
barely
2 = partiall
y
3 = fully
Stated objective of program/project
5 3
15 15
Additional Measures Level of Achievement
0 = No 1 = Yes -- --
Project report 4 1 4 4
Papers published in peer reviewed Journals
3 0 0 3
Working papers, conferences, workshops
2 0 1 2 2
Awards or Citations for Product
1 0 0 1
Total 21 25
Score - (total score / max score) 84%

ReCAP Benefit Assessment System - User Manual
ReCAP | Benefits Assessment System 50
Table 2A-2. Types of Products from Research
Performance
Indicator
Weight
(5 = critical, 0 = Not
Applicable)
Level of Development
Score (level * weight)
Maximum
Score Possibl
e (max level *
weight)
0 = not develope
d
1 = initial stage
s
2 = partially develope
d
3 = fully develop
ed
Specifications (Design, construction, inspection, testing, maintenance etc.)
5
15
0 0
Guidelines/Handbooks (including tables, charts, monographs)
5 3 15 15
0 0
Improved Conventional and New Innovative Materials
5
15
0 0
Advanced Technology and New Equipment (construction, inspection or testing)
5
15
0
0
Software Tools (design, analysis, management, testing, inspection, etc.)
5
15
0 0
Advanced state-of-the-art procedures (e.g., methods, techniques)
5 15
0 0
Technology Transfer (websites, workshops, clearinghouses)
5 15
0
0
Total 15 15
Score -- (total score / max score) 100%
Table 2A-3. Adoption for Implementation/ Embedment
Performance Indicator
Weight
(5 = critical, 0 = Not
Applicable)
Level of Adoption Score
(level * weight)
Maximum Score
Possible (max level * weight)
0 = No
1 = few
2= several
3 = fully
Specifications (including Design, construction, inspection, testing, maintenance)
5
Have the specifications been adopted as National Specifications?
15
0
0
Guidelines/Handbooks (including tables, charts, monographs, etc.)
5
Do National and local road agencies or similar organizations and institutions adopt the guidelines/handbooks?
15
15
3
0 0
Improved Conventional and New Innovative Materials
5
Are the materials developed available commercially?
15
0

ReCAP Benefit Assessment System - User Manual
ReCAP | Benefits Assessment System 51
Performance Indicator
Weight
(5 = critical, 0 = Not
Applicable)
Level of Adoption Score
(level * weight)
Maximum Score
Possible (max level * weight)
0 = No
1 = few
2= several
3 = fully
Advanced Technology and New Equipment (including construction, inspection or testing)
5
Are the technologies and equipment in regular use by transportation agencies (excluding pilot projects)?
15
0
Software Tools (for design, analysis, inspection, testing or management)
5
Is the software available, installed, tested and in use by agencies?
15
0
Technology Transfer Applications (including websites, clearinghouses, workshops, etc.)
5
Have technology transfer applications been created and implemented?
15
0
Total 15 15
Score - (total score / max score) 100%
Table 2A-4. Extent of Use/ Uptake
Performance Measures
Weight
(5 = critical, 0 =
Not Applicable)
Extent of Use by Local and National Road Agencies and Institutions Score
(level * weight)
Maximum Score
Possible (max level *
weight)
0 = none
1 = few
2 = several
3 = widespread
Specifications (including Design, construction, inspection, testing, maintenance)
5
Number of agencies using the specifications 15
0 0
Guidelines/Handbooks (including tables, charts, monographs )
5
Number of agencies that recommend or use of the guidelines, handbooks etc. 15 15
3
0 0
Improved Conventional and New Innovative Materials
5
Number of agencies with reported applications of the materials 15
0 0
Advanced Technology and New Equipment (including construction, inspection or testing)
5
Number of agencies who have procured the equipment or the technology
15
0 0
Software Tools (for design, analysis, inspection, testing or management)
5
Number of agencies with users of software4
15
0 0
Technology Transfer (including websites, clearinghouses, workshops etc.)
5
Number of agencies requesting additional information or attending workshops or related training courses
15
0 0
Total 15 15
Score (total score / max score) 100%

ReCAP Benefit Assessment System - User Manual
ReCAP | Benefits Assessment System 52
Table 2A-5. Overall Score for Part A
Performance Indicator Relative Weight
(w) Metric Score
(s) Weighted Score
(w*s)
A.1. Achievement of research objectives
10% 84 8.4
A.2. Types of Products from Research 15% 100 15
A.3. Adoption for Implementation 30% 100 30
A.4. Extent of Use/ Number of Users of Research Product
45% 100 45
Total 100% 98.4
Score (%) 98.4%
Table 2B-1. Agency Cost Savings
Research Program/Project
Investment Cost/Research Investment (I) GBP235462
Capital Costs
Agency Cost Indicator Applicability
(Yes = 1; No=0)
Cost With implementation of Research Product
Without implementation of Research Product
– Capital cost (design, construction materials, labour, equipment, etc)
– Training cost for agency personnel and supervisors
941
– Training cost for civil contractors 1,413
Total Implementation Cost (1) 2,354
Operating Costs
Routine Maintenance Cost Major Rehabilitation & Reconstruction Costs
Operating Cost Indicator Applicability (Yes = 1;
No=0)
Cost With implement
ation of Research Product
Without implementa
tion of Research Product
Differential
Average Maintenance Costs (labour, equipment, materials etc)
1 16,482
Average Rehabilitation and Reconstruction cost (labour, equipment, materials, etc)
0 0
Total Operating Costs = (2) 1 18,836
Total Agency Costs (3) = (1)+(2) 18,836
Percent change (%)

ReCAP Benefit Assessment System - User Manual
ReCAP | Benefits Assessment System 53
Table 2B-2. User Costs
User Cost Savings (If project produces user benefits)
User Cost Indicator Applicability
(Yes = 1; No=0)
Annual Costs
Differential Cost With
implementation of Research
Product
Without implementation
of Research Product
Average Vehicle Operating Cost (VOC)
206
Average travel time and transportation costs
45
Average crash costs
Total User Costs (4) 251
Percent change (%)
Table 2B-3. Overall Cost Savings
Ratio of Cost Savings to Research Finds Calculations
Indicator Cost With Use of Research Product
Cost Without Use of Research Product
AGENCY COSTS Table B-1 (3) 18,836
USER COSTS Table B-2 (4) 251
Total COSTS (5) = (3)+(4) 19,807
Total Cost Savings TCS = (5)without –(5)with
Ratio of Total Cost Savings over Research Funding (TCS/I)
Table 2C-1. Socio-Economic Subsystem
Performance
Indicator
Weight
(5 = critical, 0 = Not
Applicable)
Degree of Impact Score (level * weight
)
Maximum Score Possible
(max level *
weight)
1= very low
2 = low 3 =
medium
4 = high
5 = very high
Access to educational facilities
5 4 20 25
0
Access to health facilities
5 2 10 25
0
Social Inclusion 5 2 10 25
0
Access to agric inputs and services
5 2 10 25
0
Access to markets, retail, farming and economic activities
5 3 15 25
0

ReCAP Benefit Assessment System - User Manual
ReCAP | Benefits Assessment System 54
Performance
Indicator
Weight
(5 = critical, 0 = Not
Applicable)
Degree of Impact Score (level * weight
)
Maximum Score Possible
(max level *
weight)
1= very low
2 = low 3 =
medium
4 = high
5 = very high
Employment 5 3 15 25
0
Women benefiting 5 3 15 25
0
Youth benefiting 5 3 15 25
0
Travel time savings
5 4 20 25
0
Transport cost savings
5 4 20 25
0 0
Total 150 250
Score - (total score / max score) 60%
Table 2D-1. Road Safety Subsystem
Performance
Indicators
Weight
(5 = critical, 0 =
Not Applicable
)
Degree of Impact Score (level * weight
)
Maximum Score Possible
(max level *
weight)
1 = very low
2 = low 3 =
medium
4 = high
5 = very high
Number of crashes 5 2 10 25
0 0
Number of fatalities 5 2 10 25
Crash density (crashes/km)
5 3 15 25
0 0
Number of serious crashes
5 3 15 25
0 0
Number of minor crashes
5 3 15 25
0
Proportion of safety helmet use
5 3 15 25
0
Total 80 150
Score – (total score / max score 53.3%

ReCAP Benefit Assessment System - User Manual
ReCAP | Benefits Assessment System 55
Table 2E-1. Environmental Subsystem
Performance
Indicator
Weight
(5 = critical, 0 = Not
Applicable)
Level of Impact
Score
(level * weight)
Max Score
Possible = (max level
*weight)
1 = high negative impact
2 = low
negative
3 = no
noticeable
4 = low positive
5 = high positive
Air Quality or Emissions Reduction or dust control
5 3 15 25
0
0
Erosion 5 3 15 25
0 0
Drainage structure protection
5 3 15 25
0 0 0
Total 45 75
Score - (total score / max score) 60%
Table 2F-1. User Satisfaction
Performance
Indicator
Weight
(5 = critical, 0 = not
applicable)
Level of Satisfaction 1 = very low; 5 = very high Score
(level * weight)
Maximum Score
Possible (max level * weight)
1 2 3 4 5
Awareness of research product
2 10 25
Use of research product
4 20 25
Value of research product
4 20 25
Total 50 75
Score - (total score / max score) 66.7%
Overall Scorecard
Subsystem
Description Score (%) Remarks
A Research Output And Usage
98.4%
The research fully achieved its objectives, has developed products/outputs that are readily available and adopted by national agencies. These products/outputs are widely used by local and national agencies, and other institutions.
B Economic /Cost Savings
N/A Insufficient data available
C Socio-Economic 60% Implementation of research product or result has some positive socio-economic effects.
D Road Safety 53.3% Implementation of research product or result has marginal effects on road safety.
E Environmental 60% Low positive environmental impacts
F User Satisfaction 66.7% Meets users’ needs/expectations satisfactorily

ReCAP Benefit Assessment System - User Manual
ReCAP | Benefits Assessment System 56
EXAMPLE 3 – RAF2116A PROJECT NARRATIVE
RAF2116A: Development of Low Volume Road Design Manuals and update of standard specifications and detailed drawings for three AfCAP member countries in West Africa (2017-2019). The overall objective of the project is to prepare manuals for low volume rural roads in Ghana, Sierra Leone and Liberia based on a review, adaption and expansion of previous AfCAP LVR manuals and local manuals that are available in these countries The following are explanations of judgments to support the assumptions where data on indicators are not available. These are presented by subsystems as follows.
A. The project was successfully completed where a final project report was submitted and accepted; no technical paper was published in a peer reviewed journal; working papers or conference papers were presented but no citations recorded.
The research product was Design Manual. This product was fully developed and being a regional research project, full embedment or adoption for implementation was assumed. Similarly, full uptake of the research product was assumed.
B. Insufficient cost data on before and after implementation of research results and the
implications are not available at the time of benefits assessment.
C. With regards to socio-economic impacts, no before and after data are available. The potential impacts resulting from implementation of the specific research products were estimated to be neutral for some of the core indicators based on expert judgment.
D. Based on expert knowledge, implementation of design manuals is not expected to have
significant direct impact on road safety indicators.
E. Given the research focus area, implementation of research product was assumed to have no noticeable negative impact on the environmental indicators.
F. No data on implementation of the research product was available. However, the nature of
research product and data obtained from site visits for GHA2065A, guided the estimates used in analysing the benefits in the user satisfaction subsystem.
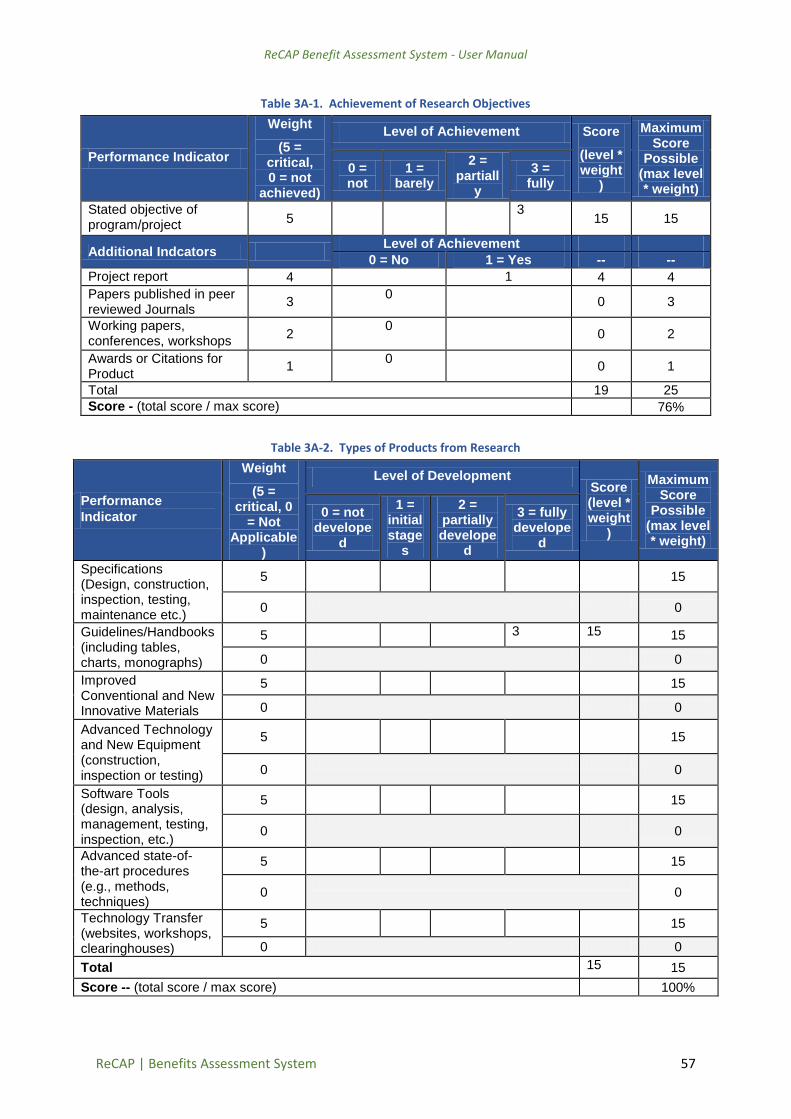
ReCAP Benefit Assessment System - User Manual
ReCAP | Benefits Assessment System 57
Table 3A-1. Achievement of Research Objectives
Performance Indicator
Weight
(5 = critical, 0 = not
achieved)
Level of Achievement Score
(level * weight
)
Maximum Score
Possible (max level * weight)
0 = not
1 = barely
2 = partiall
y
3 = fully
Stated objective of program/project
5 3
15 15
Additional Indcators Level of Achievement
0 = No 1 = Yes -- --
Project report 4 1 4 4
Papers published in peer reviewed Journals
3 0
0 3
Working papers, conferences, workshops
2 0
0 2
Awards or Citations for Product
1 0
0 1
Total 19 25
Score - (total score / max score) 76%
Table 3A-2. Types of Products from Research
Performance
Indicator
Weight
(5 = critical, 0
= Not Applicable
)
Level of Development Score (level * weight
)
Maximum Score
Possible (max level * weight)
0 = not develope
d
1 = initial stage
s
2 = partially develope
d
3 = fully develope
d
Specifications (Design, construction, inspection, testing, maintenance etc.)
5
15
0
0
Guidelines/Handbooks (including tables, charts, monographs)
5 3 15 15
0 0
Improved Conventional and New Innovative Materials
5 15
0 0
Advanced Technology and New Equipment (construction, inspection or testing)
5
15
0
0
Software Tools (design, analysis, management, testing, inspection, etc.)
5
15
0
0
Advanced state-of-the-art procedures (e.g., methods, techniques)
5 15
0
0
Technology Transfer (websites, workshops, clearinghouses)
5 15
0 0
Total 15 15
Score -- (total score / max score) 100%
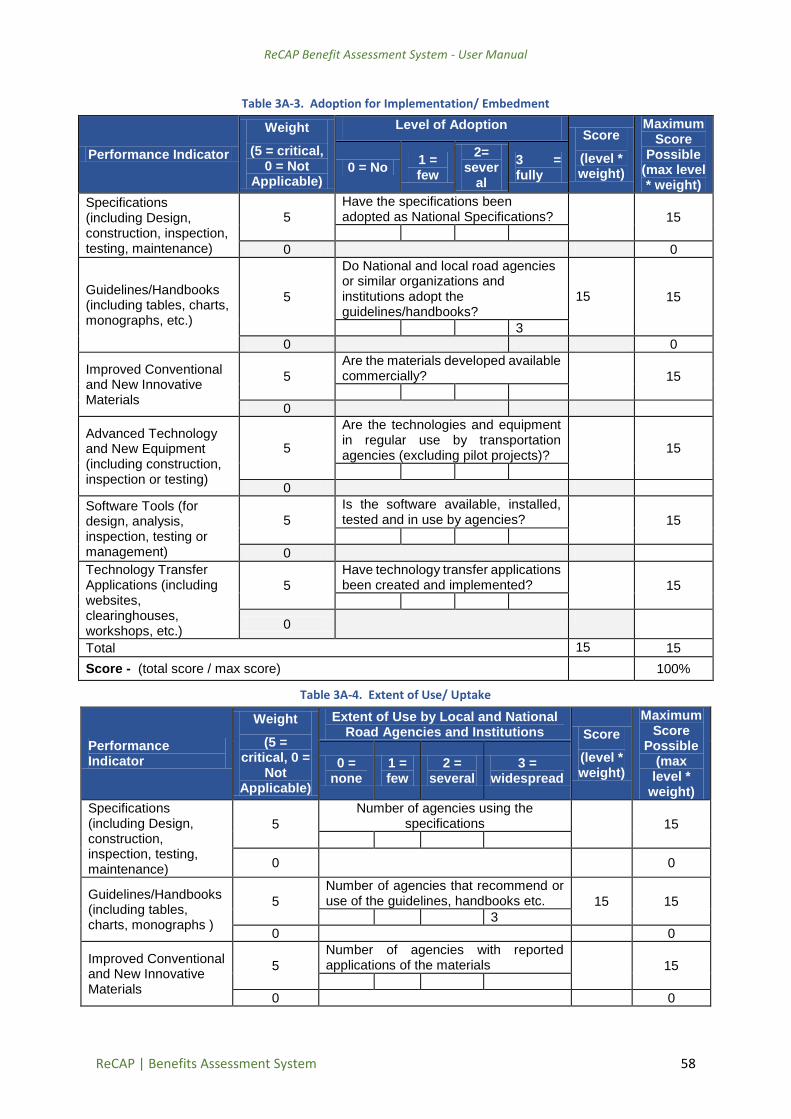
ReCAP Benefit Assessment System - User Manual
ReCAP | Benefits Assessment System 58
Table 3A-3. Adoption for Implementation/ Embedment
Performance Indicator
Weight
(5 = critical, 0 = Not
Applicable)
Level of Adoption Score
(level * weight)
Maximum Score
Possible (max level * weight)
0 = No 1 = few
2= sever
al
3 = fully
Specifications (including Design, construction, inspection, testing, maintenance)
5
Have the specifications been adopted as National Specifications?
15
0 0
Guidelines/Handbooks (including tables, charts, monographs, etc.)
5
Do National and local road agencies or similar organizations and institutions adopt the guidelines/handbooks?
15 15
3
0 0
Improved Conventional and New Innovative Materials
5
Are the materials developed available commercially?
15
0
Advanced Technology and New Equipment (including construction, inspection or testing)
5
Are the technologies and equipment in regular use by transportation agencies (excluding pilot projects)?
15
0
Software Tools (for design, analysis, inspection, testing or management)
5
Is the software available, installed, tested and in use by agencies?
15
0
Technology Transfer Applications (including websites, clearinghouses, workshops, etc.)
5
Have technology transfer applications been created and implemented?
15
0
Total 15 15
Score - (total score / max score) 100%
Table 3A-4. Extent of Use/ Uptake
Performance Indicator
Weight
(5 = critical, 0 =
Not Applicable)
Extent of Use by Local and National Road Agencies and Institutions Score
(level * weight)
Maximum Score
Possible (max level *
weight)
0 = none
1 = few
2 = several
3 = widespread
Specifications (including Design, construction, inspection, testing, maintenance)
5
Number of agencies using the specifications 15
0
0
Guidelines/Handbooks (including tables, charts, monographs )
5
Number of agencies that recommend or use of the guidelines, handbooks etc. 15 15
3
0 0
Improved Conventional and New Innovative Materials
5
Number of agencies with reported applications of the materials 15
0 0
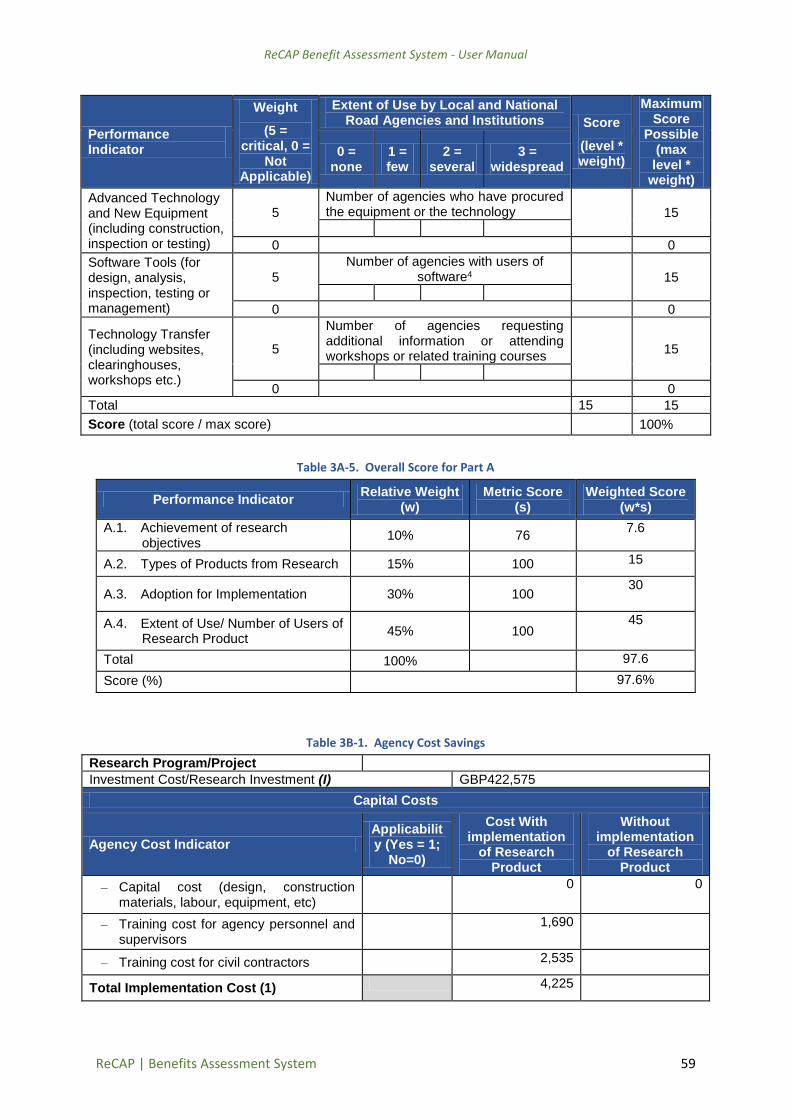
ReCAP Benefit Assessment System - User Manual
ReCAP | Benefits Assessment System 59
Performance Indicator
Weight
(5 = critical, 0 =
Not Applicable)
Extent of Use by Local and National Road Agencies and Institutions Score
(level * weight)
Maximum Score
Possible (max level *
weight)
0 = none
1 = few
2 = several
3 = widespread
Advanced Technology and New Equipment (including construction, inspection or testing)
5
Number of agencies who have procured the equipment or the technology
15
0 0
Software Tools (for design, analysis, inspection, testing or management)
5
Number of agencies with users of software4
15
0 0
Technology Transfer (including websites, clearinghouses, workshops etc.)
5
Number of agencies requesting additional information or attending workshops or related training courses
15
0 0
Total 15 15
Score (total score / max score) 100%
Table 3A-5. Overall Score for Part A
Performance Indicator Relative Weight
(w) Metric Score
(s) Weighted Score
(w*s)
A.1. Achievement of research objectives
10% 76 7.6
A.2. Types of Products from Research 15% 100 15
A.3. Adoption for Implementation 30% 100 30
A.4. Extent of Use/ Number of Users of Research Product
45% 100 45
Total 100% 97.6
Score (%) 97.6%
Table 3B-1. Agency Cost Savings
Research Program/Project
Investment Cost/Research Investment (I) GBP422,575
Capital Costs
Agency Cost Indicator Applicability (Yes = 1;
No=0)
Cost With implementation
of Research Product
Without implementation
of Research Product
– Capital cost (design, construction materials, labour, equipment, etc)
0 0
– Training cost for agency personnel and supervisors
1,690
– Training cost for civil contractors 2,535
Total Implementation Cost (1) 4,225

ReCAP Benefit Assessment System - User Manual
ReCAP | Benefits Assessment System 60
Operating Costs
Routine Maintenance Cost, Major Rehabilitation & Reconstruction Costs
Operating Cost Indicator Applicability
(Yes = 1; No=0)
Cost With implementa
tion of Research Product
Without implementat
ion of Research Product
Differential
Average Maintenance Costs (labour, equipment, materials etc)
1 29,580
Average Rehabilitation and Reconstruction cost (labour, equipment, materials, etc)
0 0
Total Operating Costs = (2) 1 29,580
Total Agency Costs (3) = (1)+(2) 33,805
Percent change (%)
Table 3B-2. User Costs
User Cost Savings (If project produces user benefits)
User Cost Indicator Applicability
(Yes = 1; No=0)
Annual Costs
Differential Cost With
implementation of Research
Product
Without implementation
of Research Product
Average Vehicle Operating Cost (VOC)
206
Average travel time and transportation costs
45
Average crash costs
Total User Costs (4) 251
Percent change (%)
Table 3B-3. Overall Cost Savings
Ratio of Cost Savings to Research Finds Calculations
Indicator Cost With Use of Research Product
Cost Without Use of Research Product
AGENCY COSTS Table B-1 (3) 33,805
USER COSTS Table B-2 (4) 251
Total COSTS (5) = (3)+(4) 34,056
Total Cost Savings TCS = (5)without –(5)with
Ratio of Total Cost Savings over Research Funding (TCS/I)

ReCAP Benefit Assessment System - User Manual
ReCAP | Benefits Assessment System 61
Table 3C-1. Socio-Economic Subsystem
Performance
Indicators
Weight
(5 = critical, 0
= Not Applicabl
e)
Degree of Impact
Score (level * weight
)
Maximum Score Possible
(max level *
weight)
1= very low
2 = low 3 =
medium
4 = high
5 = very high
Access to educational facilities
5 4 20 25
0
Access to health facilities
5 3 15 25
0
Social Inclusion 5 3 15 25
0
Access to agric inputs and services
5 3 15
0
Access to markets, retail, farming and economic activities
5 3 15 25
0
Employment 5 3 15 25
0
Women benefiting 5 3 15 25
0
Youth benefiting 5 3 15 25
0
Travel time savings 5 25
0
Transport cost savings
5 25
0 0
Total 125 200
Score - (total score / max score) 62.5%
Table 3D-1. Road Safety Subsystem
Performance
Indicators
Weight
(5 = critical, 0 = Not
Applicable)
Degree of Impact Score (level * weight
)
Maximum Score Possible
(max level *
weight)
1 = very low
2 = low 3 =
medium
4 = high
5 = very high
Number of crashes
5 25
0 0
Number of fatalities
5
0
5 1 5 25
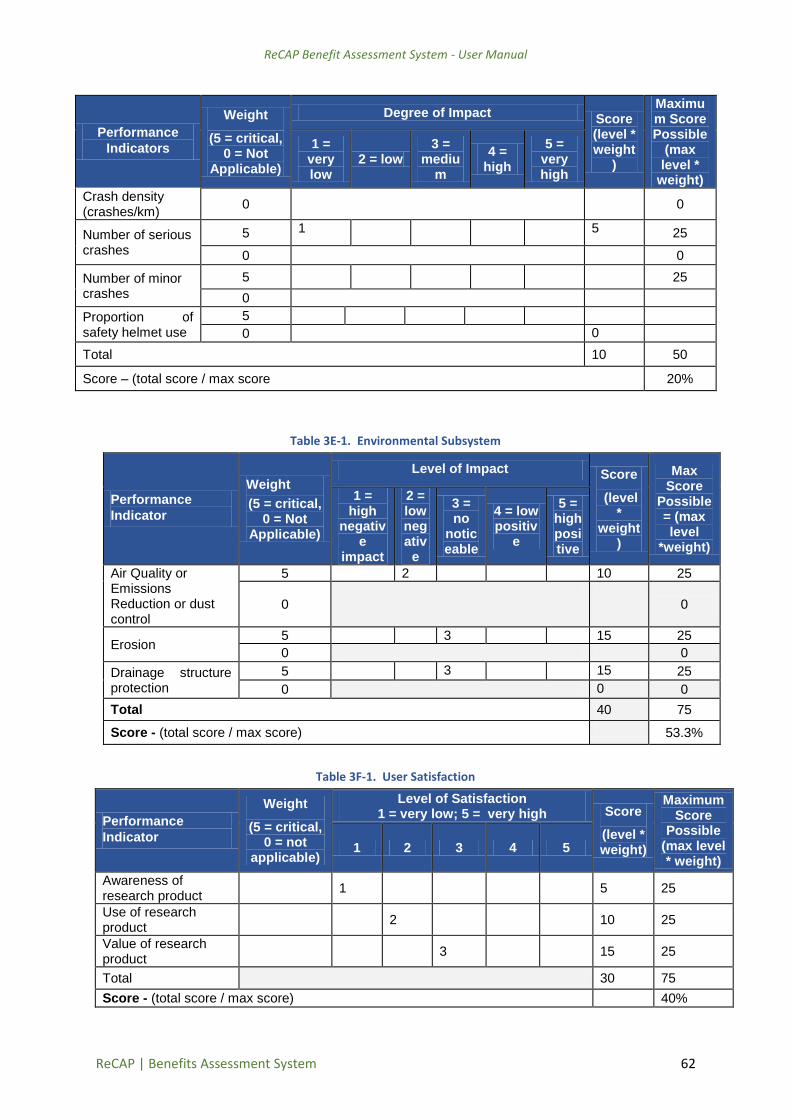
ReCAP Benefit Assessment System - User Manual
ReCAP | Benefits Assessment System 62
Performance
Indicators
Weight
(5 = critical, 0 = Not
Applicable)
Degree of Impact Score (level * weight
)
Maximum Score Possible
(max level *
weight)
1 = very low
2 = low 3 =
medium
4 = high
5 = very high
Crash density (crashes/km)
0
0
Number of serious crashes
5 1 5 25
0 0
Number of minor crashes
5 25
0
Proportion of safety helmet use
5
0 0
Total 10 50
Score – (total score / max score 20%
Table 3E-1. Environmental Subsystem
Performance
Indicator
Weight
(5 = critical, 0 = Not
Applicable)
Level of Impact Score
(level *
weight)
Max Score
Possible = (max level
*weight)
1 = high
negative
impact
2 = low negativ
e
3 = no
noticeable
4 = low positiv
e
5 = high positive
Air Quality or Emissions Reduction or dust control
5 2 10 25
0
0
Erosion 5 3 15 25
0 0
Drainage structure protection
5 3 15 25
0 0 0
Total 40 75
Score - (total score / max score) 53.3%
Table 3F-1. User Satisfaction
Performance
Indicator
Weight
(5 = critical, 0 = not
applicable)
Level of Satisfaction 1 = very low; 5 = very high Score
(level * weight)
Maximum Score
Possible (max level * weight)
1 2 3 4 5
Awareness of research product
1 5 25
Use of research product
2 10 25
Value of research product
3 15 25
Total 30 75
Score - (total score / max score) 40%

ReCAP Benefit Assessment System - User Manual
ReCAP | Benefits Assessment System 63
Overall Scorecard
Subsystem
Description Score (%) Remarks
A Research Output And Usage
97.6%
The research fully achieved its objectives, has developed products/outputs that are readily available and adopted by national agencies. These products/outputs are widely used by local and national agencies, and other institutions.
B Economic /Cost Savings
N/A Insufficient data available
C Socio-Economic 62.5% Implementation of research product or result has some positive socio-economic effects.
D Road Safety 20% Implementation of research product or result has no significant effect on road safety
E Environmental 53.3% Marginal positive or negative environmental impacts
F User Satisfaction 40% Users not satisfied with research product

ReCAP Benefit Assessment System - User Manual
ReCAP | Benefits Assessment System 64
EXAMPLE 4 – TAN2044H PROJECT NARRATIVE
TAN2044H: Impacts and Implications of gender mainstreaming in the rural transport sector in Tanzania with particular reference to women with multi-dimensional vulnerabilities. (2016-2017). The aim of this research is to assess whether gender mainstreaming in rural transport has had a transformative effect on women facing multiple forms of discrimination and exclusion The following are explanations of judgments to support the assumptions where data on indicators are not available. These are presented by subsystems as follows.
A. The project was successfully completed where a final project report was submitted and accepted; no technical paper was published in a peer reviewed journal; no working papers or conference papers were presented but no citations recorded.
The research product was Guidelines for Gender Mainstreaming. This product was fully developed and being a country specific research project, full embedment and uptake were assumed.
B. Insufficient cost data on before and after implementation of research results and the
implications are not available at the time of benefits assessment.
C. Based on expert judgment, the socio-economic impacts resulting from implementation of the specific research product are assumed to be medium to high depending on the indicator. For example, social inclusion and women empowerment are expected to be high, whereas access to education and other facilities are not expected to be affected.
D. Given the nature of the research product and based on expert knowledge, implementation of
research products is not expected to have any direct impact on road safety indicators.
E. Implementation of research products is assumed to have no environmental impacts.
F. No data on implementation of the research product was available. However, the nature of research product and data obtained from site visits for GHA2065A, guided the estimates used in analysing the benefits in the user satisfaction subsystem.
Table 4A-1. Achievement of Research Objectives
Performance Indicator
Weight
(5 = critical, 0 = not
achieved)
Level of Achievement Score
(level * weight)
Maximum Score
Possible (max level * weight)
0 = not
1 = barely
2 = partiall
y
3 = fully
Stated objective of program/project
5 3
15 15
Additional Indicators Level of Achievement
0 = No 1 = Yes -- --
Project report 4 1 4 4
Papers published in peer reviewed Journals
3 0
0 3
Working papers, conferences, workshops
2 0
0 2
Awards or Citations for Product
1 0
0 1
Total 19 25
Score - (total score / max score) 76%

ReCAP Benefit Assessment System - User Manual
ReCAP | Benefits Assessment System 65
Table 4A-2. Types of Products from Research
Performance
Indicator
Weight
(5 = critical, 0
= Not Applicable
)
Level of Development
Score (level * weight
)
Maximum Score
Possible (max level * weight)
0 = not develope
d
1 = initial stage
s
2 = partially develope
d
3 = fully develope
d
Specifications (Design, construction, inspection, testing, maintenance etc.)
5 15
0
0
Guidelines/Handbooks (including tables, charts, monographs)
5 3 15 15
0 0
Improved Conventional and New Innovative Materials
5
15
0 0
Advanced Technology and New Equipment (construction, inspection or testing)
5
15
0
0
Software Tools (design, analysis, management, testing, inspection, etc.)
5 15
0
0
Advanced state-of-the-art procedures (e.g., methods, techniques)
5 15
0
0
Technology Transfer (websites, workshops, clearinghouses)
5 15
0 0
Total 15 15
Score -- (total score / max score) 100%
Table 4A-3. Adoption for Implementation/ Embedment
Performance Indicator
Weight
(5 = critical, 0 = Not
Applicable)
Level of Adoption Score
(level * weight)
Maximum Score
Possible (max level * weight)
0 = No 1 = few
2= several
3 = fully
Specifications (including Design, construction, inspection, testing, maintenance)
5
Have the specifications been adopted as National Specifications?
15
0
0
Guidelines/Handbooks (including tables, charts, monographs, etc.)
5
Do National and local road agencies or similar organizations and institutions adopt the guidelines/handbooks?
15
15
3
0 0
Improved Conventional and New Innovative Materials
5
Are the materials developed available commercially?
15
0
Advanced Technology and New Equipment (including
5 Are the technologies and equipment in regular use by transportation agencies (excluding pilot projects)?
15

ReCAP Benefit Assessment System - User Manual
ReCAP | Benefits Assessment System 66
Performance Indicator
Weight
(5 = critical, 0 = Not
Applicable)
Level of Adoption Score
(level * weight)
Maximum Score
Possible (max level * weight)
0 = No 1 = few
2= several
3 = fully
construction, inspection or testing)
0
Software Tools (for design, analysis, inspection, testing or management)
5
Is the software available, installed, tested and in use by agencies?
15
0
Technology Transfer Applications (including websites, clearinghouses, workshops, etc.)
5
Have technology transfer applications been created and implemented?
15
0
Total 15 15
Score - (total score / max score) 100%
Table 4A-4. Extent of Use/ Uptake
Performance Indicators
Weight
(5 = critical, 0 =
Not Applicable)
Extent of Use by Local and National Road Agencies and Institutions Score
(level * weight)
Maximum Score
Possible (max level *
weight)
0 = none
1 = few
2 = several
3 = widespread
Specifications (including Design, construction, inspection, testing, maintenance)
5
Number of agencies using the specifications 15
0 0
Guidelines/Handbooks (including tables, charts, monographs )
5
Number of agencies that recommend or use of the guidelines, handbooks etc. 15 15
3
0 0
Improved Conventional and New Innovative Materials
5
Number of agencies with reported applications of the materials 15
0 0
Advanced Technology and New Equipment (including construction, inspection or testing)
5
Number of agencies who have procured the equipment or the technology
15
0 0
Software Tools (for design, analysis, inspection, testing or management)
5
Number of agencies with users of software4
15
0 0
Technology Transfer (including websites, clearinghouses, workshops etc.)
5
Number of agencies requesting additional information or attending workshops or related training courses
15
0 0
Total 15 15
Score (total score / max score) 100%
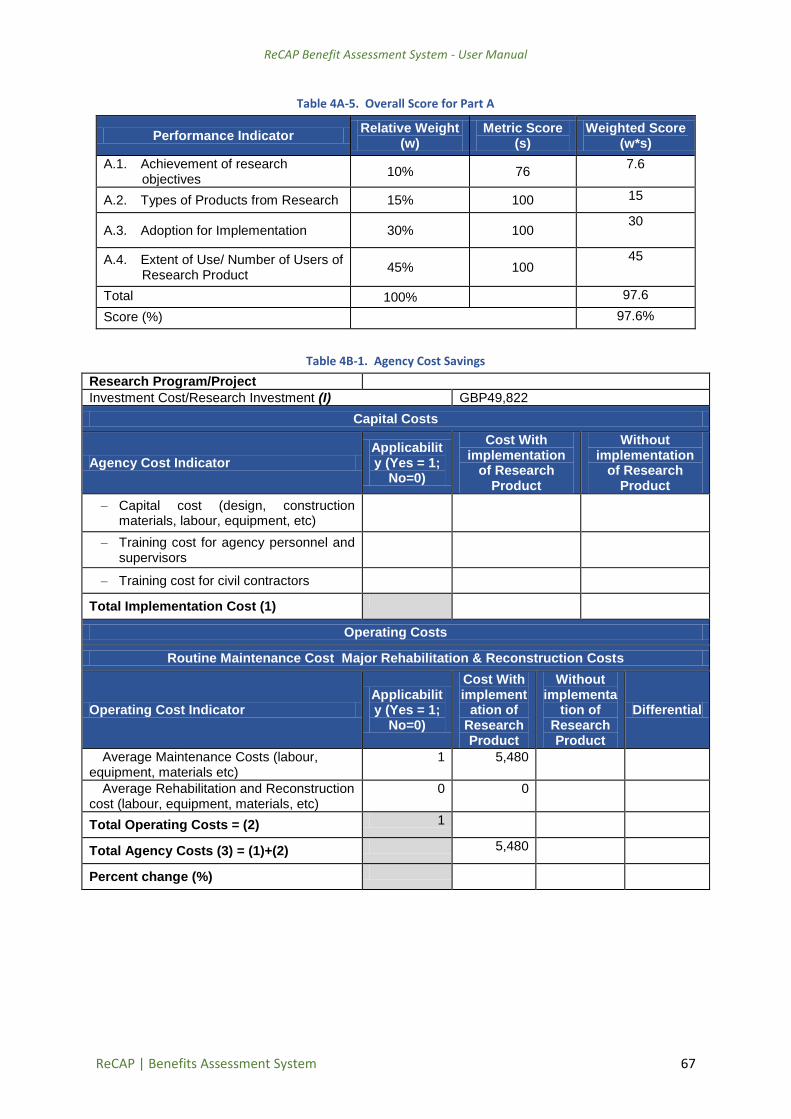
ReCAP Benefit Assessment System - User Manual
ReCAP | Benefits Assessment System 67
Table 4A-5. Overall Score for Part A
Performance Indicator Relative Weight
(w) Metric Score
(s) Weighted Score
(w*s)
A.1. Achievement of research objectives
10% 76 7.6
A.2. Types of Products from Research 15% 100 15
A.3. Adoption for Implementation 30% 100 30
A.4. Extent of Use/ Number of Users of Research Product
45% 100 45
Total 100% 97.6
Score (%) 97.6%
Table 4B-1. Agency Cost Savings
Research Program/Project
Investment Cost/Research Investment (I) GBP49,822
Capital Costs
Agency Cost Indicator Applicability (Yes = 1;
No=0)
Cost With implementation
of Research Product
Without implementation
of Research Product
– Capital cost (design, construction materials, labour, equipment, etc)
– Training cost for agency personnel and supervisors
– Training cost for civil contractors
Total Implementation Cost (1)
Operating Costs
Routine Maintenance Cost Major Rehabilitation & Reconstruction Costs
Operating Cost Indicator Applicability (Yes = 1;
No=0)
Cost With implement
ation of Research Product
Without implementa
tion of Research Product
Differential
Average Maintenance Costs (labour, equipment, materials etc)
1 5,480
Average Rehabilitation and Reconstruction cost (labour, equipment, materials, etc)
0 0
Total Operating Costs = (2) 1
Total Agency Costs (3) = (1)+(2) 5,480
Percent change (%)

ReCAP Benefit Assessment System - User Manual
ReCAP | Benefits Assessment System 68
Table 4B-2. User Costs
User Cost Savings (If project produces user benefits)
User Cost Indicator Applicability
(Yes = 1; No=0)
Annual Costs
Differential Cost With
implementation of Research
Product
Without implementation
of Research Product
Average Vehicle Operating Cost (VOC)
Average travel time and transportation costs
Average crash costs
Total User Costs (4)
Percent change (%)
Table 4B-3. Overall Cost Savings
Ratio of Cost Savings to Research Finds Calculations
Indicator Cost With Use of Research Product
Cost Without Use of Research Product
AGENCY COSTS Table B-1 (3) 5,480
USER COSTS Table B-2 (4) 0
Total COSTS (5) = (3)+(4) 5,480
Total Cost Savings TCS = (5)without –(5)with
Ratio of Total Cost Savings over Research Funding (TCS/I)
Table 4C-1. Socio-Economic Subsystem
Performance
Indicators
Weight
(5 = critical, 0 = Not
Applicable)
Degree of Impact Score (level * weight
)
Maximum Score Possible
(max level *
weight)
1= very low
2 = low 3 =
medium
4 = high
5 = very high
Access to educational facilities
5 25
0
Access to health facilities
5 25
0
Social Inclusion 5 4 20 25
0
Access to agric inputs and services
5 3 15 25
0
Access to markets, retail, farming and economic activities
5 3 15 25
0
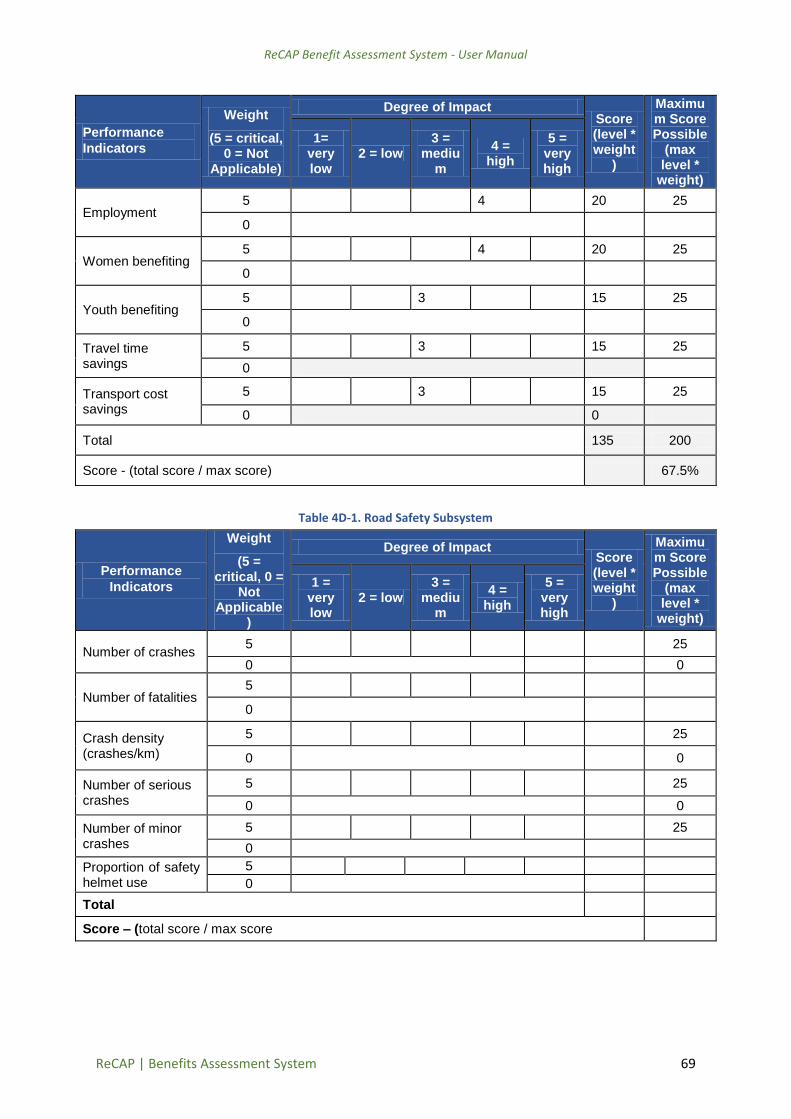
ReCAP Benefit Assessment System - User Manual
ReCAP | Benefits Assessment System 69
Performance
Indicators
Weight
(5 = critical, 0 = Not
Applicable)
Degree of Impact Score (level * weight
)
Maximum Score Possible
(max level *
weight)
1= very low
2 = low 3 =
medium
4 = high
5 = very high
Employment 5 4 20 25
0
Women benefiting 5 4 20 25
0
Youth benefiting 5 3 15 25
0
Travel time savings
5 3 15 25
0
Transport cost savings
5 3 15 25
0 0
Total 135 200
Score - (total score / max score) 67.5%
Table 4D-1. Road Safety Subsystem
Performance
Indicators
Weight
(5 = critical, 0 =
Not Applicable
)
Degree of Impact Score (level * weight
)
Maximum Score Possible
(max level *
weight)
1 = very low
2 = low 3 =
medium
4 = high
5 = very high
Number of crashes 5 25
0 0
Number of fatalities 5
0
Crash density (crashes/km)
5 25
0 0
Number of serious crashes
5 25
0 0
Number of minor crashes
5 25
0
Proportion of safety helmet use
5
0
Total
Score – (total score / max score
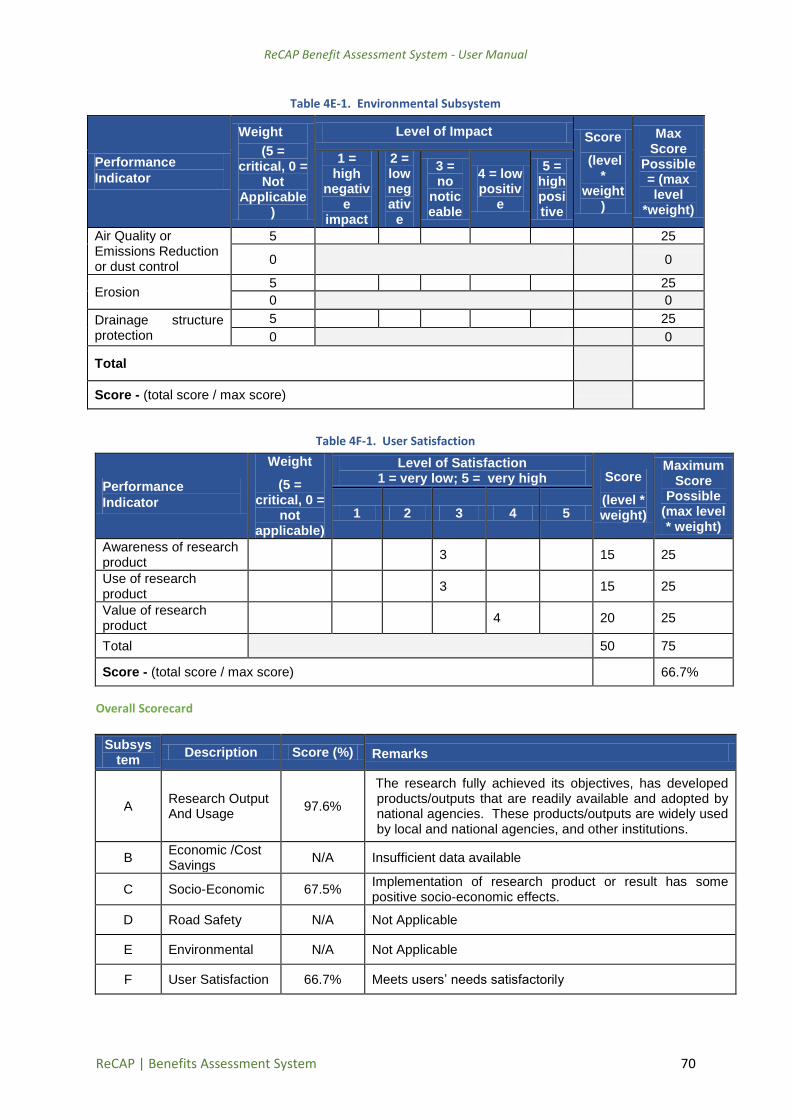
ReCAP Benefit Assessment System - User Manual
ReCAP | Benefits Assessment System 70
Table 4E-1. Environmental Subsystem
Performance
Indicator
Weight
(5 = critical, 0 =
Not Applicable
)
Level of Impact Score
(level *
weight)
Max Score
Possible = (max level
*weight)
1 = high
negative
impact
2 = low negativ
e
3 = no
noticeable
4 = low positiv
e
5 = high positive
Air Quality or Emissions Reduction or dust control
5 25
0
0
Erosion 5 25
0 0
Drainage structure protection
5 25
0 0
Total
Score - (total score / max score)
Table 4F-1. User Satisfaction
Performance
Indicator
Weight
(5 = critical, 0 =
not applicable)
Level of Satisfaction 1 = very low; 5 = very high Score
(level * weight)
Maximum Score
Possible (max level * weight)
1 2 3 4 5
Awareness of research product
3 15 25
Use of research product
3 15 25
Value of research product
4 20 25
Total 50 75
Score - (total score / max score) 66.7%
Overall Scorecard
Subsystem
Description Score (%) Remarks
A Research Output And Usage
97.6%
The research fully achieved its objectives, has developed products/outputs that are readily available and adopted by national agencies. These products/outputs are widely used by local and national agencies, and other institutions.
B Economic /Cost Savings
N/A Insufficient data available
C Socio-Economic 67.5% Implementation of research product or result has some positive socio-economic effects.
D Road Safety N/A Not Applicable
E Environmental N/A Not Applicable
F User Satisfaction 66.7% Meets users’ needs satisfactorily

ReCAP Benefit Assessment System - User Manual
ReCAP | Benefits Assessment System 71
EXAMPLE 5 – RAF2114A PROJECT NARRATIVE
RAF2114A: Enhancing understanding on safe motorcycle and three-wheeler use for rural transport and the implications for appropriate training and regulatory frameworks (2017-2019). The overall aim of the project was to improve knowledge and understanding concerning effective ways of enabling rural people to benefit from the safe use of motorcycles and three-wheelers, with an emphasis on rural motorcycle taxis, rider training, appropriate regulatory frameworks and realistic enforcement methods. The following are explanations of judgments to support the assumptions where data on indicators are not available. These are presented by subsystems as follows.
A. The project was successfully completed where a final project report was submitted and accepted; no technical paper was published in a peer reviewed journal; no working papers or conference papers were presented but no citations recorded.
The research product was a set of Guidelines for motorcycle safety and the product was fully developed. However, being a regional research project, it was assumed that several road agencies in the region adopted (embedded) the product for implementation. Similarly, it was assumed that several road agencies actually implemented the product.
B. Insufficient cost data on before and after implementation of research results and the
implications are not available at the time of benefits assessment.
C. With regards to socio-economic impacts, no before and after data are available. Based on expert knowledge it was assumed the potential impacts resulting from implementation of the specific research product will range from low to medium depending on the specific indicator.
D. Based on expert knowledge and the objectives of the research project, implementation of research products is expected to have low to high direct impact on road safety depending on the indicator.
E. Implementation of research products is assumed to have no environmental impacts.
F. No data on implementation of the research product was available. However, the nature of research product and data obtained from site visits for GHA2065A, guided the estimates used in analysing the benefits in the user satisfaction subsystem.

ReCAP Benefit Assessment System - User Manual
ReCAP | Benefits Assessment System 72
Table 5A-1. Achievement of Research Objectives
Performance Indicator
Weight
(5 = critical, 0 = not
achieved)
Level of Achievement Score
(level * weight
)
Maximum Score
Possible (max level * weight)
0 = not 1 =
barely
2 = partiall
y
3 = fully
Stated objective of program/project
5 3
15 15
Additional Indicators Level of Achievement
0 = No 1 = Yes -- --
Project report 4 1 4 4
Papers published in peer reviewed Journals
3 0
0 3
Working papers, conferences, workshops
2 0
0 2
Awards or Citations for Product
1 0
0 1
Total 19 25
Score - (total score / max score) 76%
Table 5A-2. Types of Products from Research
Performance
Indicator
Weight
(5 = critical, 0 = Not
Applicable)
Level of Development
Score (level * weight)
Maximum Score
Possible (max level * weight)
0 = not develop
ed
1 = initial
stages
2 = partially develop
ed
3 = fully develop
ed
Specifications (Design, construction, inspection, testing, maintenance etc.)
5
15
0 0
Guidelines/Handbooks (including tables, charts, monographs)
5 3 15 15
0 0
Improved Conventional and New Innovative Materials
5
15
0 0
Advanced Technology and New Equipment (construction, inspection or testing)
5
15
0
0
Software Tools (design, analysis, management, testing, inspection, etc.)
5
15
0 0
Advanced state-of-the-art procedures (e.g., methods, techniques)
5 15
0
0
Technology Transfer (websites, workshops, clearinghouses)
5 15
0 0
Total 15 15
Score -- (total score / max score) 100%

ReCAP Benefit Assessment System - User Manual
ReCAP | Benefits Assessment System 73
Table 5A-3. Adoption for Implementation/ Embedment
Performance Indicator
Weight
(5 = critical, 0 = Not
Applicable)
Level of Adoption Score
(level * weight)
Maximum Score
Possible (max level * weight)
0 = No
1 = few
2= several
3 = fully
Specifications (including Design, construction, inspection, testing, maintenance)
5
Have the specifications been adopted as National Specifications?
15
0 0
Guidelines/Handbooks (including tables, charts, monographs, etc.)
5
Do National and local road agencies or similar organizations and institutions adopt the guidelines/handbooks?
10 15
2
0 0
Improved Conventional and New Innovative Materials
5
Are the materials developed available commercially?
15
0
Advanced Technology and New Equipment (including construction, inspection or testing)
5
Are the technologies and equipment in regular use by transportation agencies (excluding pilot projects)?
15
0
Software Tools (for design, analysis, inspection, testing or management)
5
Is the software available, installed, tested and in use by agencies?
15
0
Technology Transfer Applications (including websites, clearinghouses, workshops, etc.)
5
Have technology transfer applications been created and implemented?
15
0
Total 10 15
Score - (total score / max score) 66.7%
Table 5A-4. Extent of Use/ Uptake
Performance Indicator
Weight
(5 = critical, 0 =
Not Applicable)
Extent of Use by Local and National Road Agencies and Institutions Score
(level * weight)
Maximum Score
Possible (max level *
weight)
0 = none
1 = few
2 = several
3 = widespread
Specifications (including Design, construction, inspection, testing, maintenance)
5
Number of agencies using the specifications 15
0 0
Guidelines/Handbooks (including tables, charts, monographs )
5
Number of agencies that recommend or use of the guidelines, handbooks etc. 10 15
2
0 0
Improved Conventional and New Innovative Materials
5
Number of agencies with reported applications of the materials 15
0 0
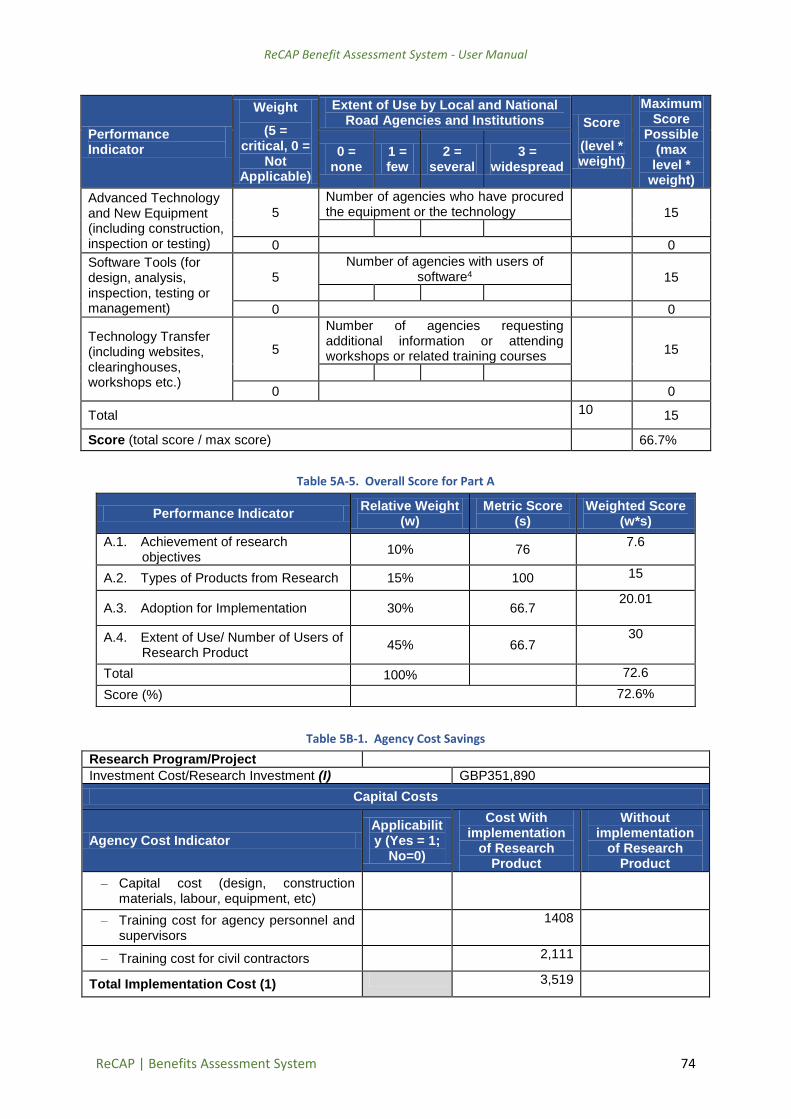
ReCAP Benefit Assessment System - User Manual
ReCAP | Benefits Assessment System 74
Performance Indicator
Weight
(5 = critical, 0 =
Not Applicable)
Extent of Use by Local and National Road Agencies and Institutions Score
(level * weight)
Maximum Score
Possible (max level *
weight)
0 = none
1 = few
2 = several
3 = widespread
Advanced Technology and New Equipment (including construction, inspection or testing)
5
Number of agencies who have procured the equipment or the technology
15
0 0
Software Tools (for design, analysis, inspection, testing or management)
5
Number of agencies with users of software4
15
0 0
Technology Transfer (including websites, clearinghouses, workshops etc.)
5
Number of agencies requesting additional information or attending workshops or related training courses
15
0 0
Total 10 15
Score (total score / max score) 66.7%
Table 5A-5. Overall Score for Part A
Performance Indicator Relative Weight
(w) Metric Score
(s) Weighted Score
(w*s)
A.1. Achievement of research objectives
10% 76 7.6
A.2. Types of Products from Research 15% 100 15
A.3. Adoption for Implementation 30% 66.7 20.01
A.4. Extent of Use/ Number of Users of Research Product
45% 66.7 30
Total 100% 72.6
Score (%) 72.6%
Table 5B-1. Agency Cost Savings
Research Program/Project
Investment Cost/Research Investment (I) GBP351,890
Capital Costs
Agency Cost Indicator Applicability (Yes = 1;
No=0)
Cost With implementation
of Research Product
Without implementation
of Research Product
– Capital cost (design, construction materials, labour, equipment, etc)
– Training cost for agency personnel and supervisors
1408
– Training cost for civil contractors 2,111
Total Implementation Cost (1) 3,519

ReCAP Benefit Assessment System - User Manual
ReCAP | Benefits Assessment System 75
Operating Costs
Routine Maintenance Cost Major Rehabilitation & Reconstruction Costs
Operating Cost Indicator Applicability
(Yes = 1; No=0)
Cost With implementa
tion of Research Product
Without implementat
ion of Research Product
Differential
Average Maintenance Costs (labour, equipment, materials etc)
1 24,632
Average Rehabilitation and Reconstruction cost (labour, equipment, materials, etc)
0
Total Operating Costs = (2) 1
Total Agency Costs (3) = (1)+(2) 28,151
Percent change (%)
Table 5B-2. User Costs
User Cost Savings (If project produces user benefits)
User Cost Indicator Applicability
(Yes = 1; No=0)
Annual Costs
Differential Cost With
implementation of Research
Product
Without implementation
of Research Product
Average Vehicle Operating Cost (VOC)
Average travel time and transportation costs
Average crash costs
Total User Costs (4)
Percent change (%)
Table 5B-3. Overall Cost Savings
Ratio of Cost Savings to Research Finds Calculations
Indicator Cost With Use of Research Product
Cost Without Use of Research Product
AGENCY COSTS Table B-1 (3) 28,151
USER COSTS Table B-2 (4) 2.468
Total COSTS (5) = (3)+(4) 28,154
Total Cost Savings TCS = (5)without –(5)with
Ratio of Total Cost Savings over Research Funding (TCS/I)
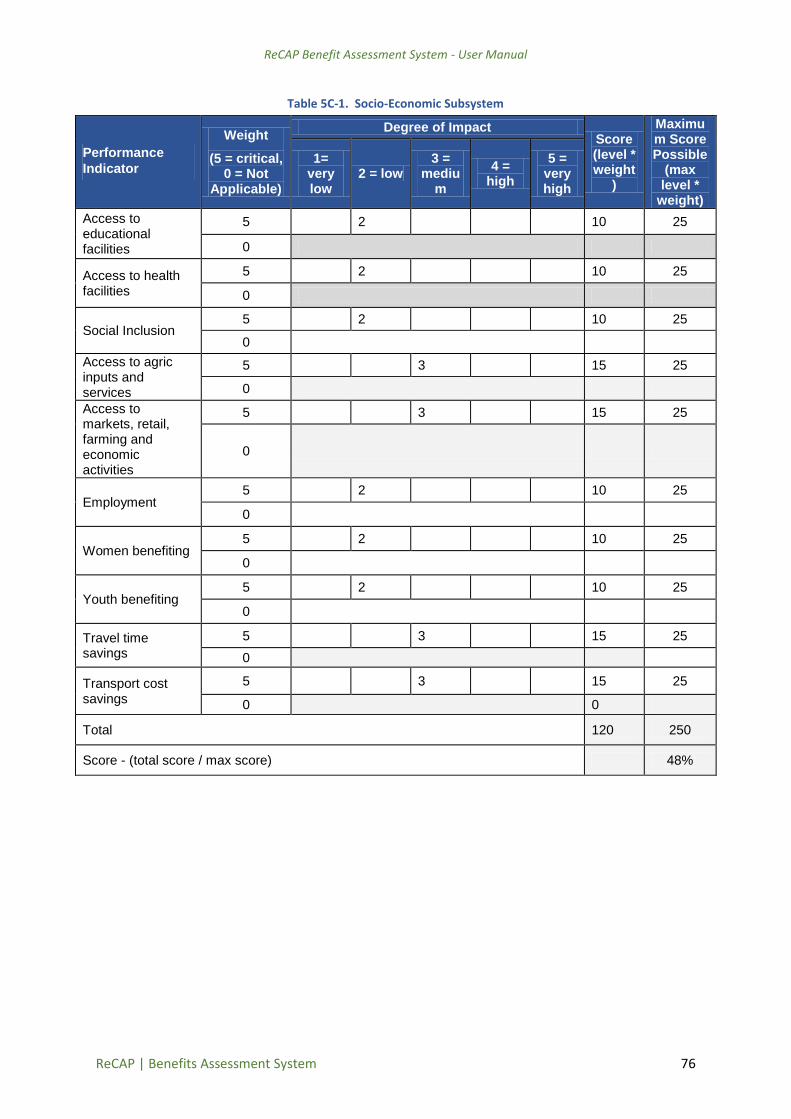
ReCAP Benefit Assessment System - User Manual
ReCAP | Benefits Assessment System 76
Table 5C-1. Socio-Economic Subsystem
Performance
Indicator
Weight
(5 = critical, 0 = Not
Applicable)
Degree of Impact Score (level * weight
)
Maximum Score Possible
(max level *
weight)
1= very low
2 = low 3 =
medium
4 = high
5 = very high
Access to educational facilities
5 2 10 25
0
Access to health facilities
5 2 10 25
0
Social Inclusion 5 2 10 25
0
Access to agric inputs and services
5 3 15 25
0
Access to markets, retail, farming and economic activities
5 3 15 25
0
Employment 5 2 10 25
0
Women benefiting 5 2 10 25
0
Youth benefiting 5 2 10 25
0
Travel time savings
5 3 15 25
0
Transport cost savings
5 3 15 25
0 0
Total 120 250
Score - (total score / max score) 48%

ReCAP Benefit Assessment System - User Manual
ReCAP | Benefits Assessment System 77
Table 5D-1. Road Safety Subsystem
Performance
Indicators
Weight
(5 = critical, 0 =
Not Applicable
)
Degree of Impact Score (level * weight
)
Maximum Score Possible
(max level *
weight)
1 = very low
2 = low 3 =
medium
4 = high
5 = very high
Number of crashes 5 3 15 25
0 0
Number of fatalities 5 3 15 25
0
Crash density (crashes/km)
5 2 10 25
0 0
Number of serious crashes
5 3 15 25
0 0
Number of minor crashes
5 3 15 25
0
Proportion of safety helmet use
5 4 20 25
0
Total 90 150
Score – (total score / max score) 60%
Table 5E-1. Environmental Subsystem
Performance
Indicator
Weight
(5 = critical, 0 =
Not Applicable
)
Level of Impact Score
(level *
weight)
Max Score
Possible = (max level
*weight)
1 = high
negative
impact
2 = low negativ
e
3 = no
noticeable
4 = low positiv
e
5 = high positive
Air Quality or Emissions Reduction or dust control
5 25
0
0
Erosion 5 25
0 0
Drainage structure protection
5 25
0 0
Total
Score - (total score / max score)
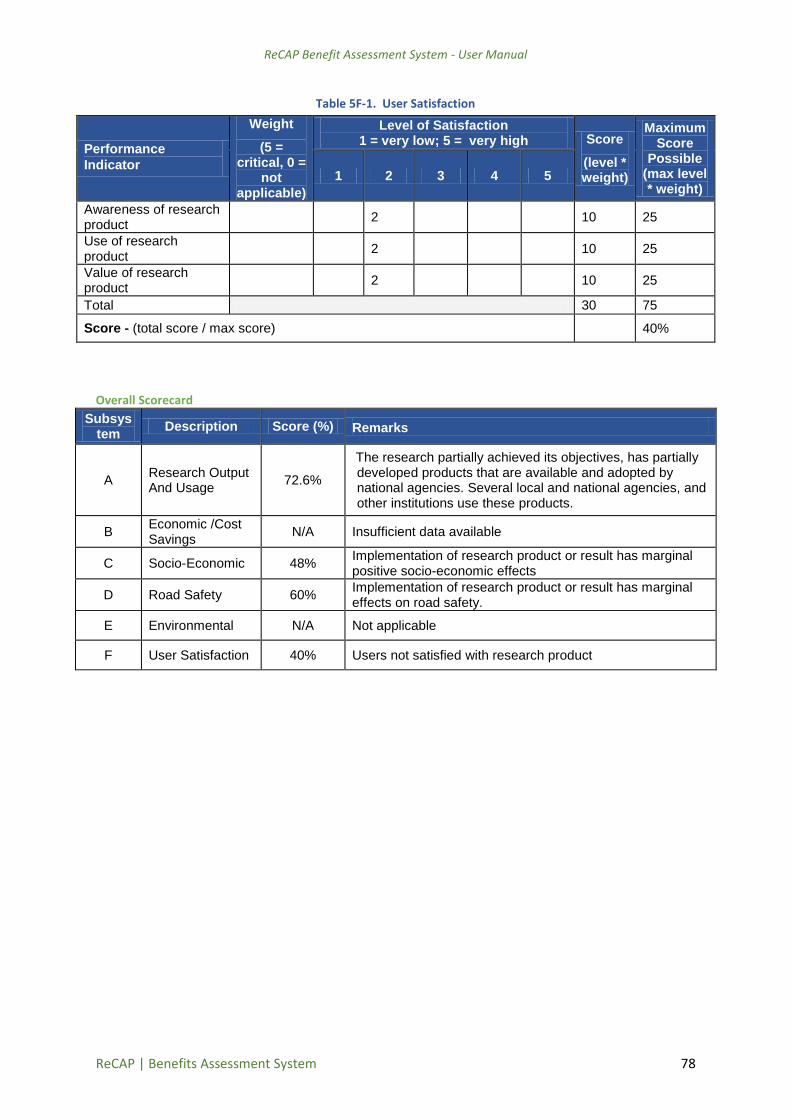
ReCAP Benefit Assessment System - User Manual
ReCAP | Benefits Assessment System 78
Table 5F-1. User Satisfaction
Performance
Indicator
Weight
(5 = critical, 0 =
not applicable)
Level of Satisfaction 1 = very low; 5 = very high Score
(level * weight)
Maximum Score
Possible (max level * weight)
1 2 3 4 5
Awareness of research product
2 10 25
Use of research product
2 10 25
Value of research product
2 10 25
Total 30 75
Score - (total score / max score) 40%
Overall Scorecard
Subsystem
Description Score (%) Remarks
A Research Output And Usage
72.6%
The research partially achieved its objectives, has partially developed products that are available and adopted by national agencies. Several local and national agencies, and other institutions use these products.
B Economic /Cost Savings
N/A Insufficient data available
C Socio-Economic 48% Implementation of research product or result has marginal positive socio-economic effects
D Road Safety 60% Implementation of research product or result has marginal effects on road safety.
E Environmental N/A Not applicable
F User Satisfaction 40% Users not satisfied with research product

ReCAP Benefit Assessment System - User Manual
ReCAP | Benefits Assessment System 79
EXAMPLE 6 - GEN2014C -PROJECT NARRATIVE
GEN2014C - Climate Adaptation: Risk Management and Resilience Optimisation for Vulnerable Road Access in Africa – Phase 1. Engineering Adaptation Guidelines (2016-2017). The fundamental research objective is to identify, characterise and demonstrate appropriate engineering and non-engineering adaptation procedures that may be implemented to strengthen the long-term resilience of rural access. The project developed “Climate Adaptation Handbook” to assist in the development of a climate-resilient road network that reaches fully into and between rural communities. The following are explanations of judgments to support the assumptions where data on indicators are not available. These are presented by subsystems as follows.
A. The project was successfully completed where a final project report was submitted and accepted; a technical paper was published in a peer reviewed journal; working papers or conference papers were presented but no citations recorded.
The research product was a Climate Adaptation Handbook to assist in the development of a climate-resilient road network. This product was fully developed and assumed to be adopted for implementation by most road agencies. It is also assumed most road agencies have actually implemented the research product.
B. Insufficient cost data on before and after implementation of research results and the
implications are not available at the time of benefits assessment.
C. With regards to socio-economic impacts, the potential impacts resulting from implementation of the specific research product are estimated based on expert judgment for the various indicators. The impacts are assumed to be low to medium depending on the indicator.
D. Based on expert knowledge and the research focus area, the direct road safety impacts of
implementing the research product is assumed be minimal.
E. Based on the research focus area, implementation of the research product is assumed to have high positive environmental impacts.
F. No data on user satisfaction of implementation of the research product was available. No
assumptions offered.
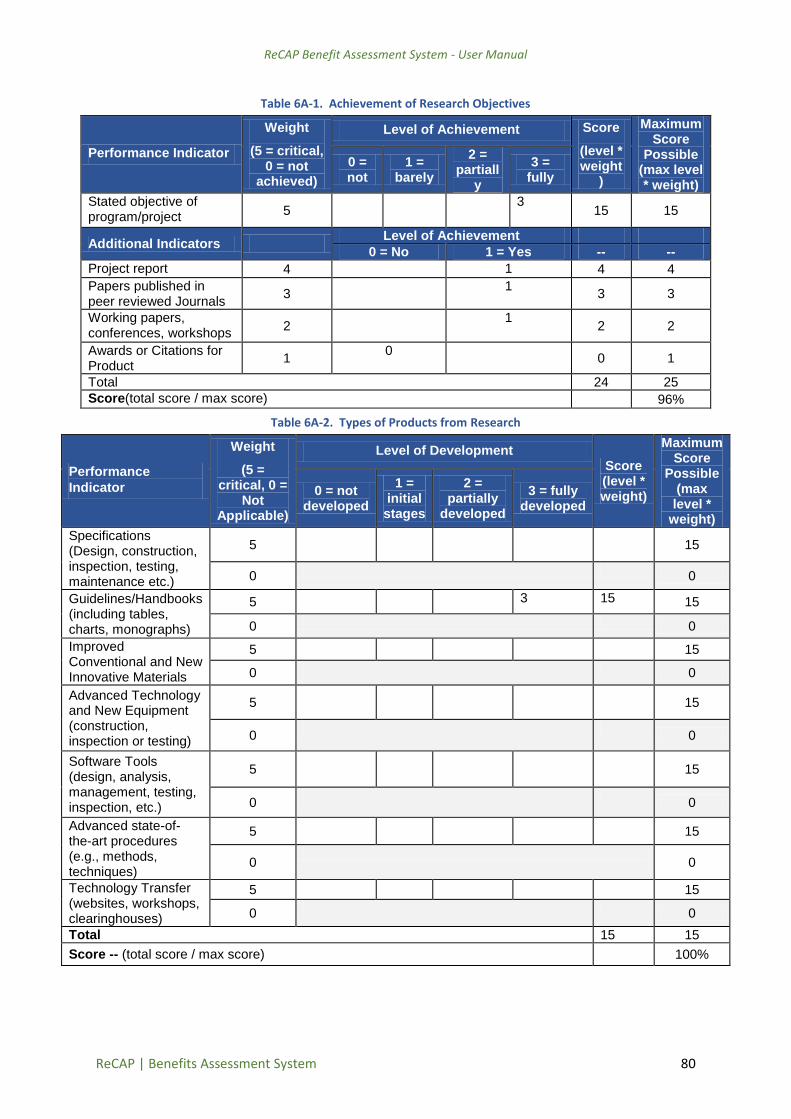
ReCAP Benefit Assessment System - User Manual
ReCAP | Benefits Assessment System 80
Table 6A-1. Achievement of Research Objectives
Performance Indicator
Weight
(5 = critical, 0 = not
achieved)
Level of Achievement Score
(level * weight
)
Maximum Score
Possible (max level * weight)
0 = not
1 = barely
2 = partiall
y
3 = fully
Stated objective of program/project
5 3
15 15
Additional Indicators Level of Achievement
0 = No 1 = Yes -- --
Project report 4 1 4 4
Papers published in peer reviewed Journals
3 1
3 3
Working papers, conferences, workshops
2 1
2 2
Awards or Citations for Product
1 0
0 1
Total 24 25
Score(total score / max score) 96%
Table 6A-2. Types of Products from Research
Performance
Indicator
Weight
(5 = critical, 0 =
Not Applicable)
Level of Development Score (level * weight)
Maximum Score
Possible (max level *
weight)
0 = not developed
1 = initial stages
2 = partially
developed
3 = fully developed
Specifications (Design, construction, inspection, testing, maintenance etc.)
5
15
0 0
Guidelines/Handbooks (including tables, charts, monographs)
5 3 15 15
0 0
Improved Conventional and New Innovative Materials
5 15
0 0
Advanced Technology and New Equipment (construction, inspection or testing)
5
15
0
0
Software Tools (design, analysis, management, testing, inspection, etc.)
5
15
0
0
Advanced state-of-the-art procedures (e.g., methods, techniques)
5 15
0
0
Technology Transfer (websites, workshops, clearinghouses)
5 15
0 0
Total 15 15
Score -- (total score / max score) 100%

ReCAP Benefit Assessment System - User Manual
ReCAP | Benefits Assessment System 81
Table 6A-3. Adoption for Implementation/ Embedment
Performance Indicator
Weight
(5 = critical, 0 = Not
Applicable)
Level of Adoption Score
(level * weight)
Maximum Score
Possible (max level * weight)
0 = No
1 = few
2= several
3 = fully
Specifications (including Design, construction, inspection, testing, maintenance)
5
Have the specifications been adopted as National Specifications?
15
0 0
Guidelines/Handbooks (including tables, charts, monographs, etc.)
5
Do National and local road agencies or similar organizations and institutions adopt the guidelines/handbooks?
15
15
3
0 0
Improved Conventional and New Innovative Materials
5
Are the materials developed available commercially?
15
0
Advanced Technology and New Equipment (including construction, inspection or testing)
5
Are the technologies and equipment in regular use by transportation agencies (excluding pilot projects)?
15
0
Software Tools (for design, analysis, inspection, testing or management)
5
Is the software available, installed, tested and in use by agencies?
15
0
Technology Transfer Applications (including websites, clearinghouses, workshops, etc.)
5
Have technology transfer applications been created and implemented?
15
1
0
Total 15 15
Score - (total score / max score) 100%
Table 6A-4. Extent of Use/ Uptake
Performance Indicator
Weight
(5 = critical, 0 =
Not Applicable)
Extent of Use by Local and National Road Agencies and Institutions Score
(level * weight)
Maximum Score
Possible (max level *
weight)
0 = none
1 = few
2 = several
3 = widespread
Specifications (including Design, construction, inspection, testing, maintenance)
5
Number of agencies using the specifications 15
0 0
Guidelines/Handbooks (including tables, charts, monographs )
5
Number of agencies that recommend or use of the guidelines, handbooks etc. 10 15
2
0 0
Improved Conventional and New Innovative Materials
5
Number of agencies with reported applications of the materials 15
0 0

ReCAP Benefit Assessment System - User Manual
ReCAP | Benefits Assessment System 82
Performance Indicator
Weight
(5 = critical, 0 =
Not Applicable)
Extent of Use by Local and National Road Agencies and Institutions Score
(level * weight)
Maximum Score
Possible (max level *
weight)
0 = none
1 = few
2 = several
3 = widespread
Advanced Technology and New Equipment (including construction, inspection or testing)
5
Number of agencies who have procured the equipment or the technology
15
0 0
Software Tools (for design, analysis, inspection, testing or management)
5
Number of agencies with users of software4
15
0 0
Technology Transfer (including websites, clearinghouses, workshops etc.)
5
Number of agencies requesting additional information or attending workshops or related training courses
15
0 0
Total 10 15
Score (total score / max score) 66.7%
Table 6A-5. Overall Score for Part A
Performance Indicator Relative Weight
(w) Score (s)
Weighted Score (w*s)
A.1. Achievement of research objectives
10% 76 7.6
A.2. Types of Products from Research 15% 100 15
A.3. Adoption for Implementation 30% 100 30
A.4. Extent of Use/ Number of Users of Research Product
45% 66.7 30.02
Total Score 100% 82.62
Score (%) 83%
Table 6B-1. Agency Cost Savings
Research Program/Project
Investment Cost/Research Investment (I) GBP277,260
Capital Costs
Agency Cost Indicator Applicability (Yes = 1;
No=0)
Cost With implementation
of Research Product
Without implementation
of Research Product
– Capital cost (design, construction materials, labour, equipment, etc)
– Training cost for agency personnel and supervisors
– Training cost for civil contractors
Total Implementation Cost (1)

ReCAP Benefit Assessment System - User Manual
ReCAP | Benefits Assessment System 83
Operating Costs
Routine Maintenance Cost Major Rehabilitation & Reconstruction Costs
Operating Cost Indicator Applicability
(Yes = 1; No=0)
Cost With implementa
tion of Research Product
Without implementat
ion of Research Product
Differential
Average Maintenance Costs (labour, equipment, materials etc)
Average Rehabilitation and Reconstruction cost (labour, equipment, materials, etc)
Total Operating Costs = (2)
Total Agency Costs (3) = (1)+(2)
Percent change (%)
Table 6B-2. User Costs
User Cost Savings (If project produces user benefits)
User Cost Indicator Applicability
(Yes = 1; No=0)
Annual Costs
Differential Cost With
implementation of Research
Product
Without implementation
of Research Product
Average Vehicle Operating Cost (VOC)
Average travel time and transportation costs
Average crash costs
Total User Costs (4)
Percent change (%)
Table 6B-3. Overall Cost Savings
Ratio of Cost Savings to Research Finds Calculations
Indicator Cost With Use of Research Product
Cost Without Use of Research Product
AGENCY COSTS Table B-1 (3)
USER COSTS Table B-2 (4)
Total COSTS (5) = (3)+(4)
Total Cost Savings TCS = (5)with –(5)without
Ratio of Total Cost Savings over Research Funding (TCS/I)

ReCAP Benefit Assessment System - User Manual
ReCAP | Benefits Assessment System 84
Table 6C-1. Socio-Economic Subsystem
Performance
Indicators
Weight
(5 = critical, 0 = Not
Applicable)
Degree of Impact Score (level * weight
)
Maximum Score Possible
(max level *
weight)
1= very low
2 = low 3 =
medium
4 = high
5 = very high
Access to educational facilities
5 2 10 25
0
Access to health facilities
5 2 10 25
0
Social Inclusion 5 2 10 25
0
Access to agric inputs and services
5 3 15 25
0
Access to markets, retail, farming and economic activities
5 3 15 25
0
Employment 5 2 10 25
0
Women benefiting 5 2 10 25
0
Youth benefiting 5 2 10 25
0
Travel time savings 5 25
0
Transport cost savings
5 25
0 0
Total 90 200
Score - (total score / max score) 45%
Table 6D-1. Road Safety Subsystem
Performance
Indicator
Weight
(5 = critical, 0 = Not
Applicable)
Degree of Impact Score (level * weight
)
Maximum Score Possible
(max level *
weight)
1 = very low
2 = low 3 =
medium
4 = high
5 = very high
Number of crashes 5 25
0 0
Number of fatalities
Crash density (crashes/km)
5 1 5 25
0 0
Number of serious crashes
5 1 5 25
0 0
Number of minor crashes
5 25
0
Proportion of safety helmet use
5
0 0
Total 10 50
Score – (total score / max score 20%

ReCAP Benefit Assessment System - User Manual
ReCAP | Benefits Assessment System 85
Table 6E-1. Environmental Subsystem
Performance
Indicator
Weight
(5 = critical, 0 = Not
Applicable)
Level of Impact Score
(level *
weight)
Max Score Possible = (max level *weight)
1 = high
negative
impact
2 = low negativ
e
3 = no
noticeable
4 = low positiv
e
5 = high positive
Air Quality or Emissions Reduction or dust control
5 4 20 25
0
0
Erosion 5 5 25 25
0 0
Drainage structure failures
5 5 25 25
0 0 0
Total 70 75
Score - (total score / max score) 93.3%
Table 6F-1. User Satisfaction
Performance
Indicator
Weight
(5 = critical, 0 = not
applicable)
Level of Satisfaction 1 = very low; 5 = very high Score
(level * weight)
Maximum Score
Possible (max level * weight)
1 2 3 4 5
Awareness of research product
25
Use of research product
25
Value of research product
25
Total
Score - (total score / max score)
Overall Scorecard
Subsystem
Description Score
(%) Remarks
A Research Output And Usage
83%
The research fully achieved its objectives, has developed products/outputs that are readily available and adopted by national agencies. These products/outputs are widely used by local and national agencies, and other institutions.
B Economic /Cost Savings
N/A Data not available
C Socio-Economic 45% Implementation of research product or result has marginal positive socio-economic effects.
D Road Safety N/A Not applicable
E Environmental 93.3% High positive environmental impacts
F User Satisfaction N/A Data not available
ReCAP Benefit Assessment System - User Manual
ReCAP | Benefits Assessment System 86
EXAMPLE 7 - HYPOTHETICAL PROJECT NARRATIVE
This is an example of the application of the BAS using a hypothetical project with the primary objective to develop improved highway pavement construction materials additive to reduce rutting in rural gravel road pavements. The project was also required to develop the outline/structure for a website for effective dissemination of the project findings to users.
The following are explanations of the assumptions for data for the indicators for which data is not available. These are presented by subsystems.
A. The project was successfully completed where a final project report was submitted and accepted; a technical paper was assumed to have been published in a peer reviewed journal; working papers or conference papers were presented but no citations recorded.
A. The research products were (a) Improved or innovative materials to reduce rutting on gravel
roads and (b) technology transfer (website for effective dissemination of the project findings). Product (a) was fully developed and assumed to be adopted for implementation by most road agencies. However, it is assumed several (not all) road agencies have actually implemented the research product. Product (b) on the other hand, was partially developed at the time of benefit assessment, few road agencies have adopted it for implementation and few have actually implemented it.
B. Based on experience and expert knowledge, some cost data were assumed for purposes of
this analysis to illustrate the computations of benefits in the economic subsystem.
C. Expert knowledge was used to estimate the impacts of this project implementation on the various indicators in the socio-economic subsystem. The impacts are assumed to be low to medium depending on the indicator.
D. Based on expert knowledge, implementation of the research products are assumed to have
very low impacts on road safety indicators.
E. The use of improved road construction materials is assumed to have noticeable positive impacts of environmental impact indicators.
F. It is assumed that the users derive benefits when products are implemented – e.g., smoother
rides, reduced VOCs. As such, it is assumed that users will derive some satisfaction with the implementation of the research product.
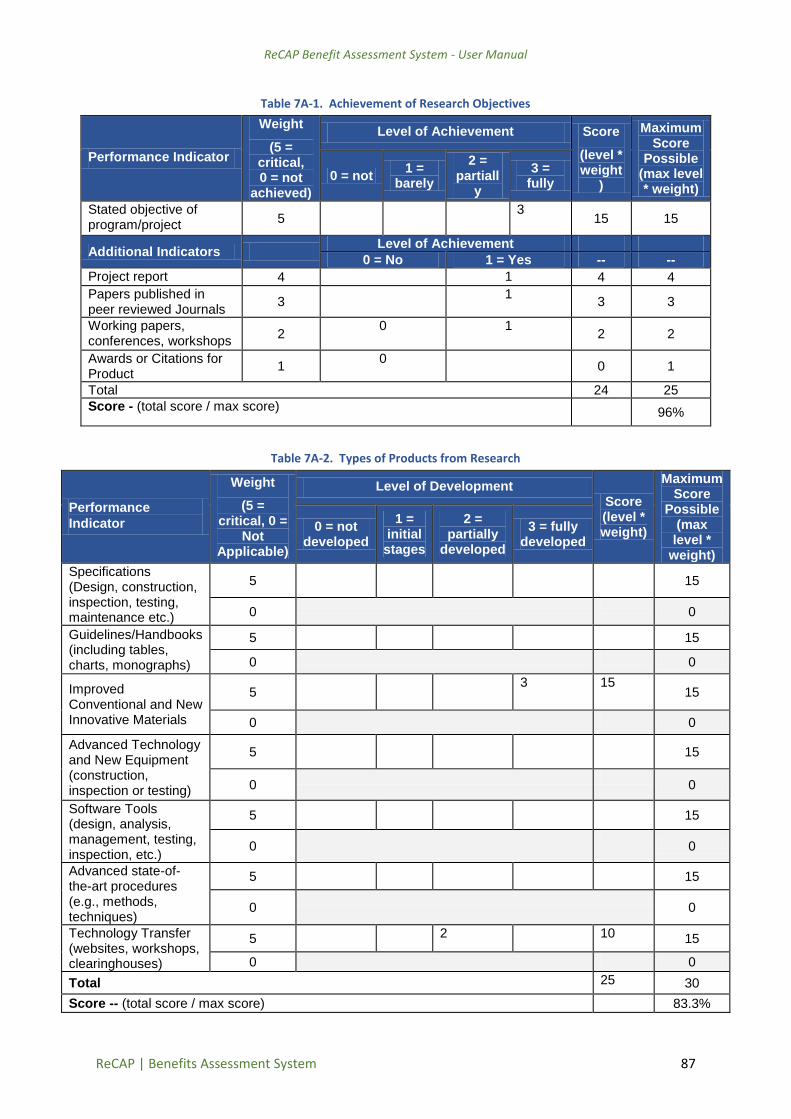
ReCAP Benefit Assessment System - User Manual
ReCAP | Benefits Assessment System 87
Table 7A-1. Achievement of Research Objectives
Performance Indicator
Weight
(5 = critical, 0 = not
achieved)
Level of Achievement Score
(level * weight
)
Maximum Score
Possible (max level * weight)
0 = not 1 =
barely
2 = partiall
y
3 = fully
Stated objective of program/project
5 3
15 15
Additional Indicators Level of Achievement
0 = No 1 = Yes -- --
Project report 4 1 4 4
Papers published in peer reviewed Journals
3 1
3 3
Working papers, conferences, workshops
2 0 1
2 2
Awards or Citations for Product
1 0
0 1
Total 24 25
Score - (total score / max score) 96%
Table 7A-2. Types of Products from Research
Performance
Indicator
Weight
(5 = critical, 0 =
Not Applicable)
Level of Development Score (level * weight)
Maximum Score
Possible (max level *
weight)
0 = not developed
1 = initial stages
2 = partially
developed
3 = fully developed
Specifications (Design, construction, inspection, testing, maintenance etc.)
5
15
0 0
Guidelines/Handbooks (including tables, charts, monographs)
5 15
0 0
Improved Conventional and New Innovative Materials
5 3 15
15
0 0
Advanced Technology and New Equipment (construction, inspection or testing)
5
15
0
0
Software Tools (design, analysis, management, testing, inspection, etc.)
5
15
0
0
Advanced state-of-the-art procedures (e.g., methods, techniques)
5 15
0
0
Technology Transfer (websites, workshops, clearinghouses)
5 2 10 15
0 0
Total 25 30
Score -- (total score / max score) 83.3%
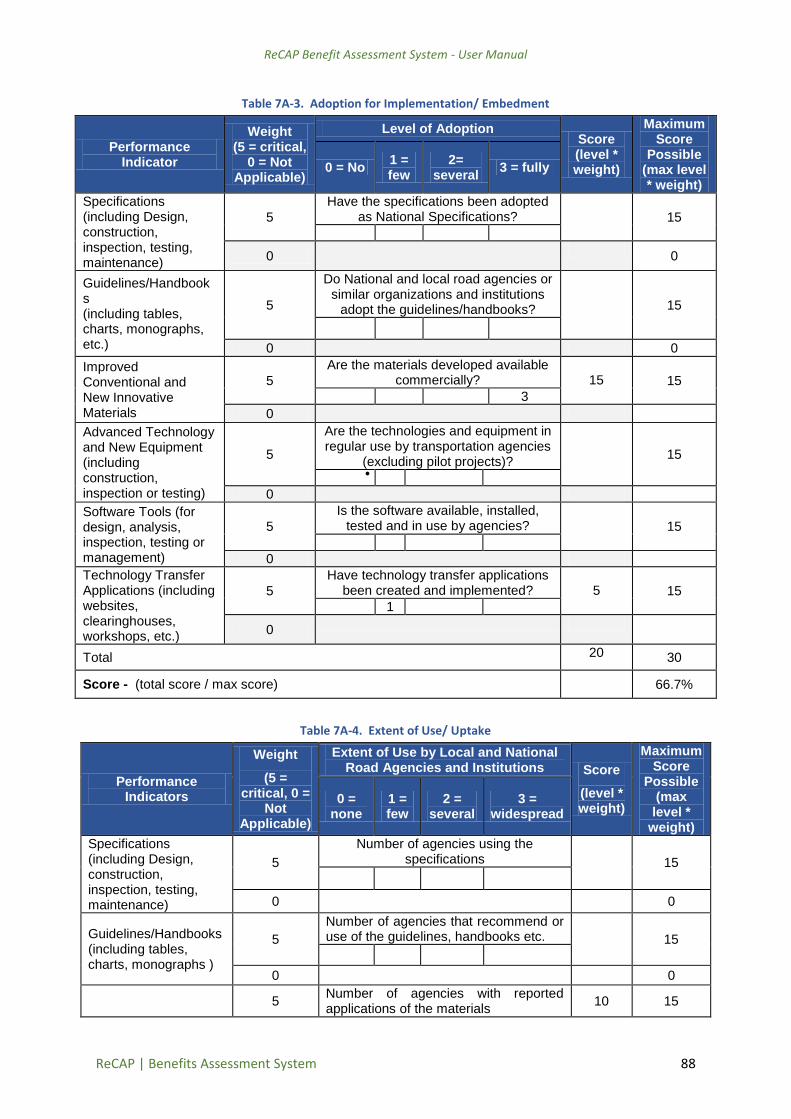
ReCAP Benefit Assessment System - User Manual
ReCAP | Benefits Assessment System 88
Table 7A-3. Adoption for Implementation/ Embedment
Performance Indicator
Weight (5 = critical,
0 = Not Applicable)
Level of Adoption Score (level * weight)
Maximum Score
Possible (max level * weight)
0 = No 1 = few
2= several
3 = fully
Specifications (including Design, construction, inspection, testing, maintenance)
5
Have the specifications been adopted as National Specifications?
15
0
0
Guidelines/Handbooks (including tables, charts, monographs, etc.)
5
Do National and local road agencies or similar organizations and institutions
adopt the guidelines/handbooks?
15
0 0
Improved Conventional and New Innovative Materials
5
Are the materials developed available commercially?
15
15
3
0
Advanced Technology and New Equipment (including construction, inspection or testing)
5
Are the technologies and equipment in regular use by transportation agencies
(excluding pilot projects)?
15
0
Software Tools (for design, analysis, inspection, testing or management)
5
Is the software available, installed, tested and in use by agencies?
15
0
Technology Transfer Applications (including websites, clearinghouses, workshops, etc.)
5
Have technology transfer applications been created and implemented?
5 15
1
0
Total 20 30
Score - (total score / max score) 66.7%
Table 7A-4. Extent of Use/ Uptake
Performance Indicators
Weight
(5 = critical, 0 =
Not Applicable)
Extent of Use by Local and National Road Agencies and Institutions Score
(level * weight)
Maximum Score
Possible (max level *
weight)
0 = none
1 = few
2 = several
3 = widespread
Specifications (including Design, construction, inspection, testing, maintenance)
5
Number of agencies using the specifications 15
0 0
Guidelines/Handbooks (including tables, charts, monographs )
5
Number of agencies that recommend or use of the guidelines, handbooks etc. 15
0 0
5 Number of agencies with reported applications of the materials
10 15
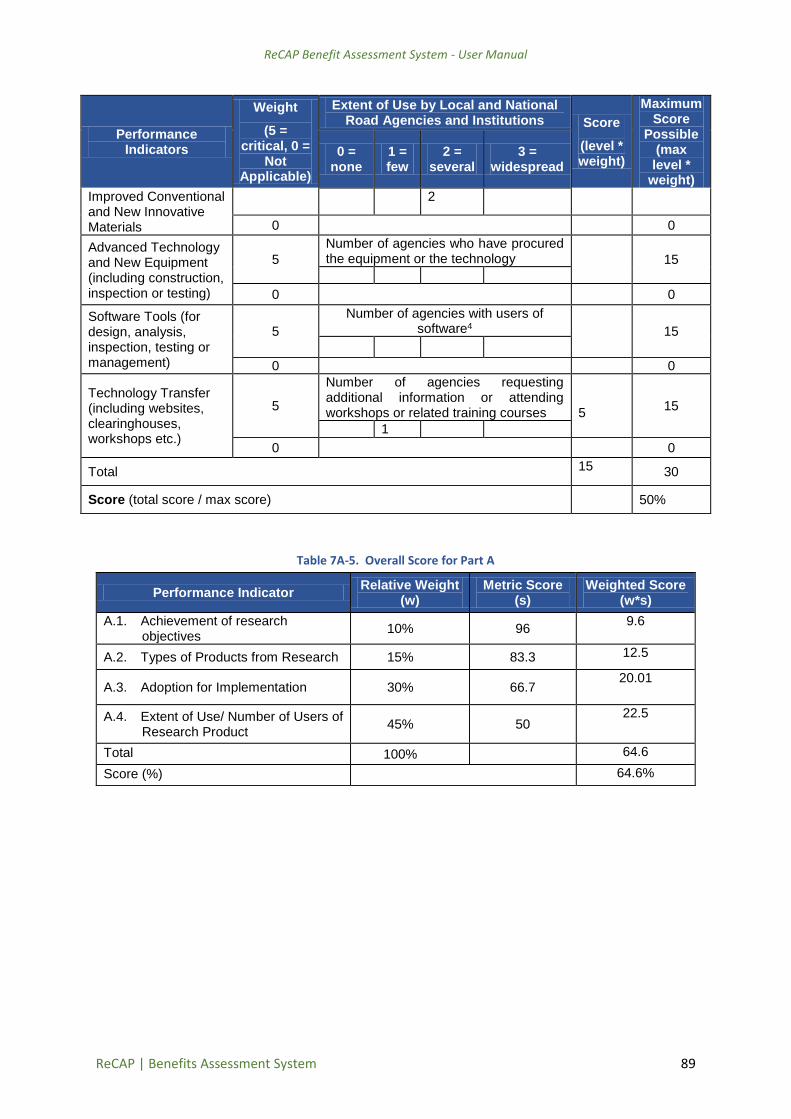
ReCAP Benefit Assessment System - User Manual
ReCAP | Benefits Assessment System 89
Performance Indicators
Weight
(5 = critical, 0 =
Not Applicable)
Extent of Use by Local and National Road Agencies and Institutions Score
(level * weight)
Maximum Score
Possible (max level *
weight)
0 = none
1 = few
2 = several
3 = widespread
Improved Conventional and New Innovative Materials
2
0 0
Advanced Technology and New Equipment (including construction, inspection or testing)
5
Number of agencies who have procured the equipment or the technology
15
0 0
Software Tools (for design, analysis, inspection, testing or management)
5
Number of agencies with users of software4
15
0 0
Technology Transfer (including websites, clearinghouses, workshops etc.)
5
Number of agencies requesting additional information or attending workshops or related training courses
5
15
1
0 0
Total 15 30
Score (total score / max score) 50%
Table 7A-5. Overall Score for Part A
Performance Indicator Relative Weight
(w) Metric Score
(s) Weighted Score
(w*s)
A.1. Achievement of research objectives
10% 96 9.6
A.2. Types of Products from Research 15% 83.3 12.5
A.3. Adoption for Implementation 30% 66.7 20.01
A.4. Extent of Use/ Number of Users of Research Product
45% 50 22.5
Total 100% 64.6
Score (%) 64.6%

ReCAP Benefit Assessment System - User Manual
ReCAP | Benefits Assessment System 90
Table 7B-1. Agency Cost Savings
Research Program/Project
Investment Cost/Research Investment (I) GBP350,000
Capital Costs
Agency Cost Indicator Applicability (Yes = 1;
No=0)
Cost With implementation
of Research Product
Without implementation
of Research Product
– Capital cost (design, construction materials, labour, equipment, etc)
200,000 300,000
– Training cost for agency personnel and supervisors
10,000 0
– Training cost for civil contractors 15,000 0
Total Implementation Cost (1) 225,000 300,000
Operating Costs
Routine Maintenance Cost Major Rehabilitation & Reconstruction Costs
Operating Cost Indicator Applicability (Yes = 1;
No=0)
Cost With implement
ation of Research Product
Without implementat
ion of Research Product
Differential
Average Maintenance Costs (labour, equipment, materials etc)
50,000 100,000 50,000
Average Rehabilitation and Reconstruction cost (labour, equipment, materials, etc)
Total Operating Costs = (2) 50,000 100,000 50,000
Total Agency Costs (3) = (1)+(2) 275,000 400,000
Percent change (%) 31.25%
Table 7B-2. User Costs
User Cost Savings (If project produces user benefits)
User Cost Indicator Applicability
(Yes = 1; No=0)
Annual Costs
Differential Cost With
implementation of Research
Product
Without implementation
of Research Product
Average Vehicle Operating Cost (VOC)
125 400 275
Average travel time and transportation costs
100 200 100
Average crash costs
Total User Costs (4) 225 600 375
Percent change (%) 62.5%

ReCAP Benefit Assessment System - User Manual
ReCAP | Benefits Assessment System 91
Table 7B-3. Overall Cost Savings
Ratio of Cost Savings to Research Finds Calculations
Indicator Cost With Use of Research Product
Cost Without Use of Research Product
AGENCY COSTS Table B-1 (3) 275,000 400,000
USER COSTS Table B-2 (4) 225 600
Total COSTS (5) = (3)+(4) 275,225 500,600
Total Cost Savings TCS = (5)without –(5)with
225,375
Ratio of Total Cost Savings over Research Funding (TCS/I)
64.4%
Table 7C-1. Socio-Economic Subsystem
Performance
Indicator
Weight (5 =
critical, 0 = Not
Applicable)
Degree of Impact Score (level * weight
)
Maximum Score Possible
(max level *
weight)
1= very low
2 = low 3 =
medium
4 = high
5 = very high
Access to educational facilities
5 2 10 25
0
Access to health facilities
5 2 10 25
0
Social Inclusion 5 2 10 25
0
Access to agric inputs and services
5 3 15 25
0
Access to markets, retail, farming and economic activities
5 3 15 25
0
Employment 5 4 20 25
0
Women benefiting 5 2 10 25
0
Youth benefiting 5 2 10 25
0
Travel time savings 5 5 25 25
0
Transport cost savings
5 5 25 25
0 0
Total 150 250
Score - (total score / max score) 60%

ReCAP Benefit Assessment System - User Manual
ReCAP | Benefits Assessment System 92
Table 7D-1. Road Safety Subsystem
Performance
Indicator
Weight
(5 = critical, 0 =
Not Applicable
)
Degree of Impact Score (level * weight
)
Maximum Score Possible
(max level *
weight)
1 = very low
2 = low 3 =
medium
4 = high
5 = very high
Number of crashes 5 25
0 0
Number of fatalities
Crash density (crashes/km)
5 1 5 25
0 0
Number of serious crashes
5 1 5 25
0 0
Number of minor crashes
5 25
0
Proportion of safety helmet use
5
0 0
Total 10 50
Score – (total score / max score 20%
Table 7E-1. Environmental Subsystem
Performance
Indicator
Weight
(5 = critical, 0 = Not
Applicable)
Level of Impact Score
(level *
weight)
Max Score
Possible = (max level
*weight)
1 = high negativ
e impact
2 = low
negative
3 = no
noticeabl
e
4 = low
positive
5 = high positive
Air Quality or Emissions Reduction or dust control
5 3 15 25
0
0
Erosion 5 4 20 25
0 0
Drainage structure protection
5 25
0 0 0
Total 35 50
Score - (total score / max score) 70%
Table 7F-1. User Satisfaction
Performance Indicator
Weight
(5 = critical, 0 = not
applicable)
Level of Satisfaction 1 = very low; 5 = very high Score
(level * weight)
Maximum Score
Possible (max level * weight)
1 2 3 4 5
Awareness of research product
3 15 25
Use of research product 4 20 25
Value of research product
3 15 25
Total 50 75
Score - (total score / max score)
66.7%
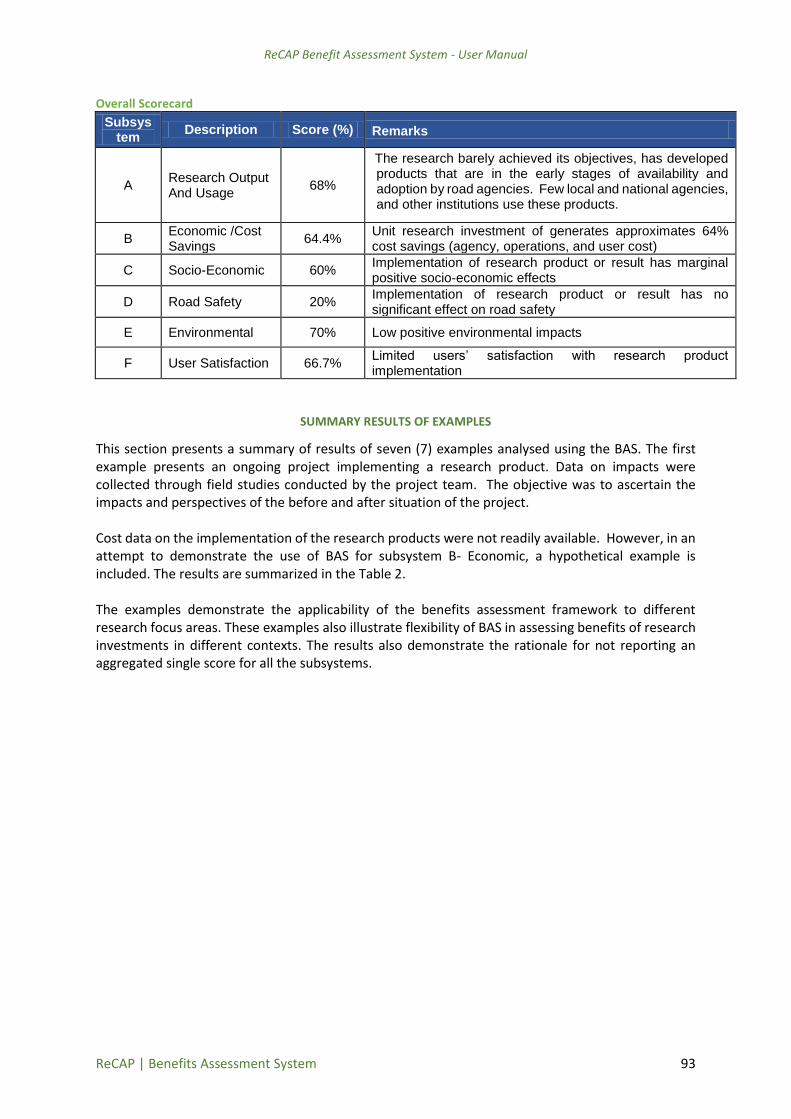
ReCAP Benefit Assessment System - User Manual
ReCAP | Benefits Assessment System 93
Overall Scorecard
Subsystem
Description Score (%) Remarks
A Research Output And Usage
68%
The research barely achieved its objectives, has developed products that are in the early stages of availability and adoption by road agencies. Few local and national agencies, and other institutions use these products.
B Economic /Cost Savings
64.4% Unit research investment of generates approximates 64% cost savings (agency, operations, and user cost)
C Socio-Economic 60% Implementation of research product or result has marginal positive socio-economic effects
D Road Safety 20% Implementation of research product or result has no significant effect on road safety
E Environmental 70% Low positive environmental impacts
F User Satisfaction 66.7% Limited users’ satisfaction with research product implementation
SUMMARY RESULTS OF EXAMPLES
This section presents a summary of results of seven (7) examples analysed using the BAS. The first example presents an ongoing project implementing a research product. Data on impacts were collected through field studies conducted by the project team. The objective was to ascertain the impacts and perspectives of the before and after situation of the project. Cost data on the implementation of the research products were not readily available. However, in an attempt to demonstrate the use of BAS for subsystem B- Economic, a hypothetical example is included. The results are summarized in the Table 2. The examples demonstrate the applicability of the benefits assessment framework to different research focus areas. These examples also illustrate flexibility of BAS in assessing benefits of research investments in different contexts. The results also demonstrate the rationale for not reporting an aggregated single score for all the subsystems.

ReCAP Benefit Assessment System - User Manual
ReCAP | Benefits Assessment System 94
Table 2. Summary of Results
Project ID Result Rating Description
A. Research Output and Usage
Ex-1 GHA2065B 98.4% Excellent The research fully achieved its objectives, has developed products/outputs that are readily available and adopted by national agencies. These products/outputs are widely used by local and national agencies, and other institutions.
Ex-2 RAF2114A 98.4% Excellent
Ex-3 RAF2116A 97.6% Excellent
Ex-4 TAN2014H 97.6% Excellent
Ex-5 RAF2114A 72.6 Good The research partially achieved its objectives, has partially developed products that are available and adopted by national agencies. Several local and national agencies, and other institutions use these products.
Ex-6 GEN2014C 83%% Excellent The research fully achieved its objectives, has developed products/outputs that are readily available and adopted by national agencies. These products/outputs are widely used by local and national agencies, and other institutions.
Ex-7 Hypothetical 73% Good The research partially achieved its objectives, has partially developed products that are available and adopted by national agencies. Several local and national agencies, and other institutions use these products.
B. Economic
Ex-1 GHA2065B N/A N/A N/A
Ex-2 RAF2114A N/A N/A N/A
Ex-3 RAF2116A N/A N/A N/A
Ex-4 TAN2014H N/A N/A N/A
Ex-5 RAF2114A N/A N/A N/A
Ex-6 GEN2014C N/A N/A N/A
Ex-7 Hypothetical 0.644 N/A Total Cost Savings/Research Investment Ratio is 0.644
C: Socio-Economic
Ex-1 GHA2065B 78% Excellent Implementation of research product or result has significant positive socio-economic effects
Ex-2 RAF2114A 60% Good Implementation of research product or result has some positive socio-economic effects.
Ex-3 RAF2116A 62.5% Good Implementation of research product or result has some positive socio-economic effects.
Ex-4 TAN2014H 67.5% Excellent Implementation of research product or result has significant positive socio-economic effects
Ex-5 RAF2114A 48% Excellent Implementation of research product or result has significant positive socio-economic effects
Ex-6 GEN2014C 45% Good Implementation of research product or result has some positive socio-economic effects.
Ex-7 Hypothetical 60% Fair Implementation of research product or result has marginal positive socio-economic effects.

ReCAP Benefit Assessment System - User Manual
ReCAP | Benefits Assessment System 95
Project ID Result Rating Description
D: Road Safety
Ex-1 GHA2065B N/A N/A N/A
Ex-2 RAF2114A 53.3% Fair Implementation of research product or result has marginal effects on road safety.
Ex-3 RAF2116A 20% Poor Implementation of research product or result has no significant effect on road safety
Ex-4 TAN2014H N/A N/A N/A
Ex-5 RAF2114A 60% Good Implementation of research product or result has improved road safety by reduced crashes and fatalities to some measurable extent
Ex-6 GEN2014C N/A N/A N/A
Ex-7 Hypothetical 20% Poor Implementation of research product or result has no significant effect on road safety
E: Environmental
Ex-1 GHA2065B 40% Poor Significant negative environmental impacts
Ex-2 RAF2114A 60% Good Low positive environmental impacts
Ex-3 RAF2116A 53.3% Fair Marginal positive or negative environmental impacts
Ex-4 TAN2014H N/A N/A N/A
Ex-5 RAF2114A N/A N/A N/A
Ex-6 GEN2014C 93.3% Excellent High positive environmental impacts
Ex-7 Hypothetical 70% Good Low positive environmental impacts
F: User Satisfaction
Ex-1 GHA2065B 93.3% Excellent Meets users’ needs/expectations adequately
Ex-2 RAF2114A 66.7% Good Meets users’ needs/expectations satisfactorily
Ex-3 RAF2116A 40% Poor Users not satisfied with research product
Ex-4 TAN2014H 66.7% Good Meets users’ needs/expectations satisfactorily
Ex-5 RAF2114A 40% Poor Users not satisfied with research product
Ex-6 GEN2014C N/A N/A N/A
Ex-7 Hypothetical 66.7% Good Meets users’ needs/expectations satisfactorily

ReCAP Benefit Assessment System - User Manual
ReCAP | Benefits Assessment System 96