benefits and cost analysis · benefits and cost analysis. ... levee elimination and flood...
TRANSCRIPT
Contra Costa Water District Proposition 1E Grant Proposal Round 2 Attachment 8
Benefits and Cost Analysis
Contra Costa Water District – Round 2 Stormwater Flood Management Grant Proposal 8‐1 Att8_SWF_BenCost_1of1
East Contra Costa County Region Contra Costa Water District
Round 2 Stormwater Flood Management Grant Proposal
ATTACHMENT 8 – BENEFITS AND COSTS
This attachment describes the flood damage reduction benefits provided by the Contra Costa Canal Levee Elimination and Flood Protection Project. In accordance with the PSP, the following details are provided for the proposed project:
Section D1 ‐ Flood Damage Reduction Benefit Analysis, which presents the Flood Damage Reduction Benefit Analysis summarizing the expected annual damages with and without the project to be completed.
Section D2 ‐ Non‐Monetized Benefit Analysis, which presents a Non‐Monetized Benefit Analysis that provides a description (where possible) of non‐monetizable applicable social, environmental stewardship, and sustainability benefits that may result from the implementation of a project.
Section D3 ‐ Monetized Benefits Analysis, which summarizes secondary benefits that can be quantified in dollar terms.
Section D4 – Proposal Costs and Benefits Summary, which includes annual costs (Table 16) for the project and a benefits and costs summary (Table 17).
The following sections present a quantitative and qualitative analysis of project costs and flood damage reduction benefits. Tables 11 through 17 are included at the end of this section. Because this Project will not result in any avoided Projects, Table 15 has not been included.
Flood Damage Reduction Benefit Analysis (D1)
The Department of Water Resources (DWR) method was used to estimate the flood damage reduction benefits provided by the Contra Costa Canal Levee Elimination and Flood Protection Project.
The full, five‐phased Contra Costa Canal Levee Elimination and Flood Protection Project (Project) will replace 21,000 feet of the unlined Contra Costa Canal (the Canal) with a pipeline and install a Canal flood isolation structure that will allow CCWD to remotely isolate the Canal following a major flood or earthquake. Completion of the Project will reduce regional flood risk, improve water supply reliability, and improve delivered water quality for CCWD’s 500,000 customers. Secondary benefits include increasing water supply and water supply reliability for the State Water Project (SWP) and Central Valley Project (CVP) and improving public safety by limiting access to the open Canal. Segment 1 of the Project, encasement of the Canal from Pump Plant #1 to Marsh Creek, was completed in 2009.
Proposal Page
Contra Costa Canal Levee Elimination and Flood Protection Project .......................................... 8‐1
Attachment 8 Benefits and Costs
Contra Costa Water District – Round 2 Stormwater Flood Management Grant Proposal 8‐2
Att8_SWF_BenCost_1of1
Construction of the flood isolation structure and Segment 2 pipeline is scheduled to begin in the summer of 2014.
The portion of the Project included in this proposal involves installing approximately 5,000 feet of pipe and replacing the Canal embankments along the portion of the unlined Canal immediately adjacent to the Dutch Slough Properties (Figure 7‐1). The proposed Project is intricately linked with the Dutch Slough Tidal Marsh Restoration Project, which will construct 3.4 miles of new flood protection levees surrounding the Emerson, Gilbert and Burroughs Parcels adjacent to the Canal. Together, these projects will improve regional flood protection four‐fold. Based on historical water levels, flood frequency curves in the area, and previous damage to the Canal, there is a 2% chance of major failure in the Canal embankments any given year. By eliminating the Canal embankments and upgrading the Dutch Slough levees, the risk of major flood damage in the region decreases from 2% in a given year to 0.5% or less. Relationship of Benefits to Segment 5 Benefits It should be noted that Segment 5, which includes implementation of a flow isolation structure, is currently under development. The flow isolation structure would allow CCWD to hydraulically isolate the Canal from the Delta in the event of a Canal levee failure, flood or earthquake. As such, implementing the flow isolation structure reduces the extent of damage that could result from a major flood but it does not necessarily reduce the risk of the Canal levee failure. As noted below, some of the Canal failures in the past have been associated with heavy rains rather than high waters. Until the entire Canal is encased in a pipeline, the risk of overtopping and levee failure exists. Implementing this Project would eliminate the risk of Canal levee overtopping and / or failure along segments 2 through 4 of the Canal. Without the Project, risk of overtopping and / or levee failure along this stretch of Canal persists, even with implementation of the flow isolation structure. The flood damage avoidance benefits evaluated in this proposal are limited to those damages resulting from hydrologic conditions and associated overtopping / levee failure that would be eliminated through encasement of segments 3 through 4 in a pipeline. Benefits associated with the flow isolation structure have not been claimed.
Summary of Flood Protection Benefits
The region surrounding the unlined Canal has been historically used for agricultural purposes, but land use has changed dramatically since 2003. The region at greatest risk of flooding due to Canal levee failure is bounded by Dutch Slough to the north, Sandmound Slough to the east and the open, unlined Canal to the south. Without the Project, approximately 555 residential units are at risk of flooding, and an additional 628 housing units in the Summer Lakes development would be isolated if the Canal failed. At least 32 miles of road are at risk of flooding, including the sole arterial access road for the majority of the regions’ residents. At least 8 active gas wells are at risk of flooding in the region. In addition, there are overhead power transmission lines for Pacific Gas and Electric and Western Alliance Power Association that transect the region. An additional 3,000 acres are planned for urban development, and 1,200 acres will be restored to tidal wetlands as part of the Dutch Slough Tidal Marsh Restoration Project – all of which are at risk should the Canal fail without the Project.
Selected Flood Events
For the purposes of determining flood damage benefits, four separate flood events were selected for analysis:
25-year Event. Discuss impacts.
50-year Event. Discuss impacts.

Attachment 8 Benefits and Costs
Contra Costa Water District – Round 2 Stormwater Flood Management Grant Proposal 8‐3
Att8_SWF_BenCost_1of1
100-year Event. Discuss impacts.
500-year event? Discuss impacts.
Without‐Project Conditions
Figure 8‐1 shows the areas that are currently at risk of flooding without the Project. Table 8‐1 presents various “Without Project” conditions for the selected hydrologic events.
Table 8‐1: Structures At Risk of Flooding Without the Project (Without East Cypress Corridor Development)
25 year Event 50 year Event 100 year Event 500 year Event
Total Acreage 3,215 3,562 4,482 5,512
Number of Homes 560 580 650 2,362
Miles of Road 23 28 37 43
Number of Schools 2 2 2 4
Number of Gas Wells
6 8 8 8
Acres of Farmland 257 561 872 1,030
Acres of Commercial & Industrial Property
226 229 240
290
Acres of Easement for Overhead Power lines
123 123 123 123
Acres of Dutch Slough Tidal Marsh Restoration Project
1200 1200 1200 1200

Contra Costa Water District – Round 2 Stormwater Flood Management Grant Proposal 8‐4 Att8_SWF_BenCost_1of1
Figure 8‐1: Potential Inundation Areas for Various Levels of Flooding – Without Project Conditions
Contra Costa Water District – Round 2 Stormwater Flood Management Grant Proposal 8‐5 Att8_SWF_BenCost_1of1
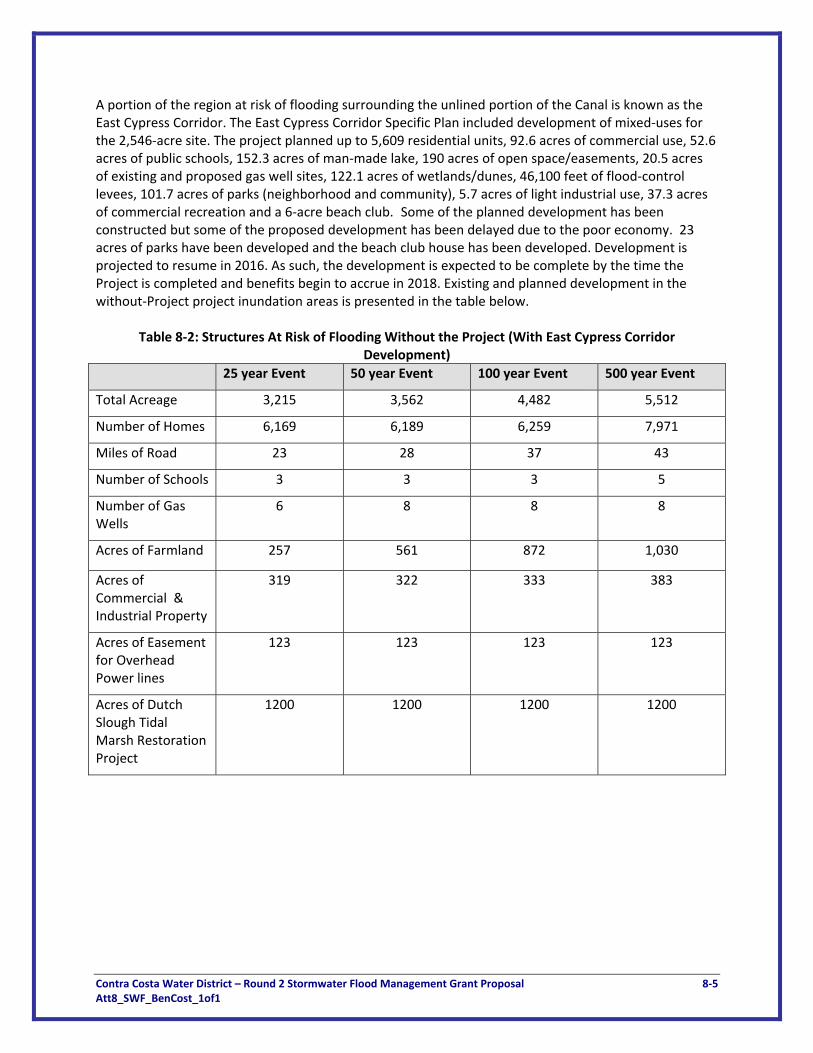
A portion of the region at risk of flooding surrounding the unlined portion of the Canal is known as the East Cypress Corridor. The East Cypress Corridor Specific Plan included development of mixed‐uses for the 2,546‐acre site. The project planned up to 5,609 residential units, 92.6 acres of commercial use, 52.6 acres of public schools, 152.3 acres of man‐made lake, 190 acres of open space/easements, 20.5 acres of existing and proposed gas well sites, 122.1 acres of wetlands/dunes, 46,100 feet of flood‐control levees, 101.7 acres of parks (neighborhood and community), 5.7 acres of light industrial use, 37.3 acres of commercial recreation and a 6‐acre beach club. Some of the planned development has been constructed but some of the proposed development has been delayed due to the poor economy. 23 acres of parks have been developed and the beach club house has been developed. Development is projected to resume in 2016. As such, the development is expected to be complete by the time the Project is completed and benefits begin to accrue in 2018. Existing and planned development in the without‐Project project inundation areas is presented in the table below.
Table 8‐2: Structures At Risk of Flooding Without the Project (With East Cypress Corridor Development)
25 year Event 50 year Event 100 year Event 500 year Event
Total Acreage 3,215 3,562 4,482 5,512
Number of Homes 6,169 6,189 6,259 7,971
Miles of Road 23 28 37 43
Number of Schools 3 3 3 5
Number of Gas Wells
6 8 8 8
Acres of Farmland 257 561 872 1,030
Acres of Commercial & Industrial Property
319 322 333
383
Acres of Easement for Overhead Power lines
123 123 123 123
Acres of Dutch Slough Tidal Marsh Restoration Project
1200 1200 1200 1200
Attachment 8 Benefits and Costs
Contra Costa Water District – Round 2 Stormwater Flood Management Grant Proposal 8‐6 Att8_SWF_BenCost_1of1
The following flood damages would occur without the Project. These damages are discussed in Attachment 7 and monetized in the following sections.
FD1: Residential and Commercial Structure and Content Damage
FD2: Loss of Agricultural Land Production
FD3: Loss of Gas Production
FD4: Damage to Dutch Slough Property
FD5: Road Inundation
FD6: Emergency Response Requirements
FD7: Supply Replacement Needs
FD1: Residential and Commercial Structure and Content Damage
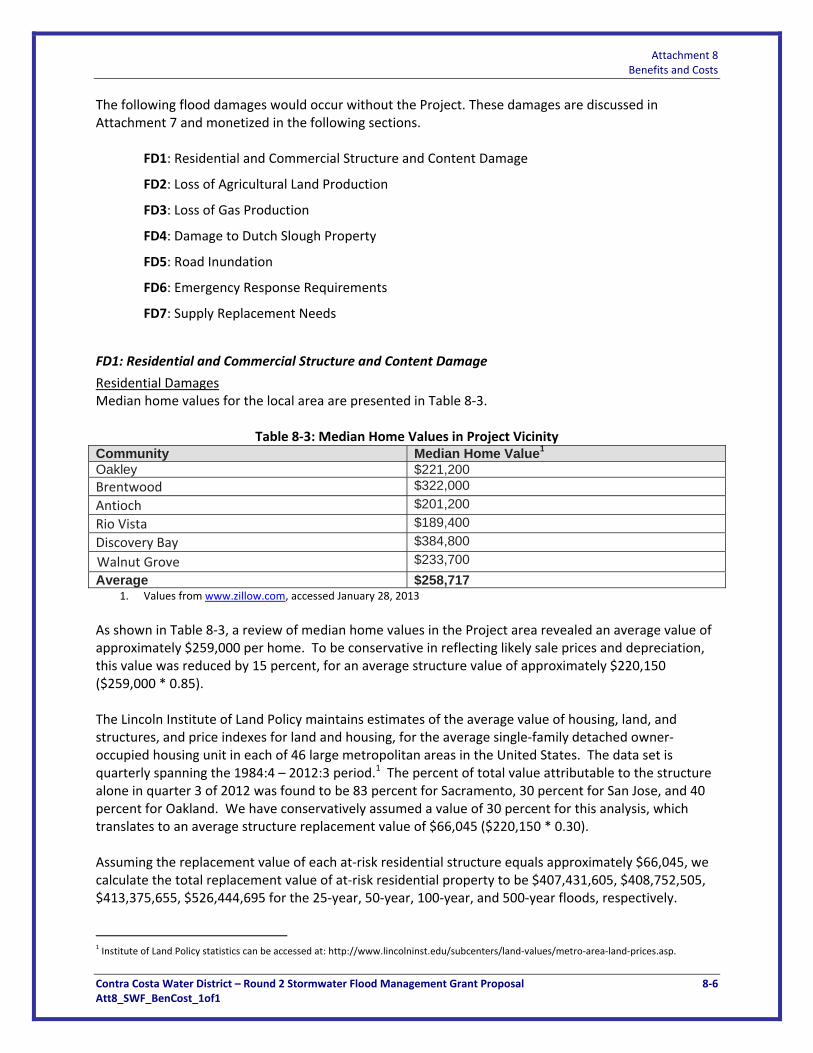
Residential Damages Median home values for the local area are presented in Table 8‐3.
Table 8‐3: Median Home Values in Project Vicinity Community Median Home Value1 Oakley $221,200Brentwood $322,000
Antioch $201,200
Rio Vista $189,400
Discovery Bay $384,800
Walnut Grove
$233,700
Average $258,717 1. Values from www.zillow.com, accessed January 28, 2013
As shown in Table 8‐3, a review of median home values in the Project area revealed an average value of approximately $259,000 per home. To be conservative in reflecting likely sale prices and depreciation, this value was reduced by 15 percent, for an average structure value of approximately $220,150 ($259,000 * 0.85). The Lincoln Institute of Land Policy maintains estimates of the average value of housing, land, and structures, and price indexes for land and housing, for the average single‐family detached owner‐occupied housing unit in each of 46 large metropolitan areas in the United States. The data set is quarterly spanning the 1984:4 – 2012:3 period.1 The percent of total value attributable to the structure alone in quarter 3 of 2012 was found to be 83 percent for Sacramento, 30 percent for San Jose, and 40 percent for Oakland. We have conservatively assumed a value of 30 percent for this analysis, which translates to an average structure replacement value of $66,045 ($220,150 * 0.30). Assuming the replacement value of each at‐risk residential structure equals approximately $66,045, we calculate the total replacement value of at‐risk residential property to be $407,431,605, $408,752,505, $413,375,655, $526,444,695 for the 25‐year, 50‐year, 100‐year, and 500‐year floods, respectively.
1 Institute of Land Policy statistics can be accessed at: http://www.lincolninst.edu/subcenters/land‐values/metro‐area‐land‐prices.asp.
Attachment 8 Benefits and Costs
Contra Costa Water District – Round 2 Stormwater Flood Management Grant Proposal 8‐7 Att8_SWF_BenCost_1of1
To estimate the percentage of structure value lost in each event, Structure Dept‐Damage tables were applied, based on tables presented in the Army Corps of Engineers December 4, 2000 Economic Guidance Memorandum (EGM) 01‐03, Generic Depth‐Damage Relationships. The residential structures affected in the area were estimated to be primarily one‐story structures without basements (approximately 80 percent), with some two‐story structures, also without basements (approximately 20 percent). Based on the information presented previously, water depth in the inundated areas varies with return interval and location, but is generally expected to range from 1‐12 ft in the residential areas inundated. For the purposes of this analysis, we have conservatively assumed an average depth of 1 foot above the first floor. The Army Corps Guidance Memorandum provides Structure Depth‐Damage values of 23.3 percent and 15.2 percent for one‐ and two‐story structures without basements, respectively. Assuming 80 percent of structures are one story and the remaining 20 percent of structures are two stories, this corresponds to an approximate value of 21.68 percent of structure value lost in a flooding event with flood waters one foot above the first floor elevation (23.3 * 0.8 + 15.2 * 0.2). Applying this percentage to our total at‐risk property values, we estimate structural damages in the 25‐year, 50‐year, 100‐year, and 500‐year flood events to be $88,331,172, $88,617,543, $89,619,842, and $114,133,210 ($407,431,605 * 0.2168, $408,752,505 * 0.2168, $413,375,655 * 0.2168, and $526,444,695 * 0.2168). To estimate the value of contents damaged in each event, we refer to guidance provided in the Army Corps of Engineers document entitled Guidelines to Estimating Existing and Future Residential Content Values, dated June, 1993. This document recommends that, in the absence of site‐specific content to structure value data, a value of 55 percent should be used (refer to recommendation #2). Following this guidance, we estimate the total value of residential contents at risk to be $224,087,383, $224,813,878, $227,356,610, and $289,544,582 for the 25‐year, 50‐year, 100‐ and 500‐year flood event, respectively ($407,431,605 * 0.55, $408,752,505 * 0.55, $413,375,655 * 0.55, and $526,444,695 * 0.55). We then reviewed the Content Depth‐Damage curves presented in the Army Corps of Engineers Economic Guidance Memorandum (EGM) 01‐03, Generic Depth‐Damage Relationships to find generic content damage values of 13.3 percent for a one‐story home with no basement and 8.7 percent for a two‐story home with no basement with flood waters reaching one foot above the first floor elevation. Assuming 80 percent of homes are one‐story and 20 percent of homes are two‐story, this gives us a content damage value of 12.38 percent (13.3 * 0.8 + 8.7 * 0.2). Applying this percentage to the total structural value at risk, we estimate residential structure content damages to be $27,742,018, $27,831,958, $28,146,748, and $35,845,619 for the 25‐year, 50‐year, 100‐year, and 500‐year events, respectively ($224,087,383 * 0.1238, $224,813,878 * 0.1238, $227,356,610 * 0.1238, and $289,544,582 * 0.1238). In summary, the total residential damages, including damages to structures and content, is estimated to be $116,073,190, $116,449,501, $117,766,590, $149,978,829 for the 25‐, 50‐, 100‐ and 500‐year flood events, respectively. Commercial Damages Commercial damages were estimated in the same manner as residential damages. The number of commercial facilities included in the inundation area was estimated based on acres of commercial and industrial land inundated, assuming an average of two structures per acre. Based on this analysis, it was estimated that approximately 638, 644, 666, and 766 structures would be at risk in a 25‐year, 50‐year, 100‐year, and 500‐year event, respectively. Property value data was not available for the at‐risk commercial structures; as such, structure values have been conservatively estimated at $1 million each. The total at‐risk value of commercial structures was therefore estimated to be approximately
Attachment 8 Benefits and Costs
Contra Costa Water District – Round 2 Stormwater Flood Management Grant Proposal 8‐8 Att8_SWF_BenCost_1of1
$638,000,00, $644,000,000, $666,000,000 and $766,000,000 for the 25‐year, 50‐year, 100‐year and 500‐year flood events, respectively. To estimate the percentage of structure value lost in each event, Army Corps of Engineers commercial depth damage factors were applied (NRCS flood tools). Although there are multiple types of businesses located within the inundation area, the bulk of the commercial properties affected can be characterized as office buildings. As such, we conservatively applied the depth‐damage factor for the category office buildings – general of 12 percent. This yielded estimated damages to commercial structures of $76,560,000, $77,280,000, $79,920,000, $91,920,000 for the 25‐year, 50‐year, 100‐year and 500‐year events, respectively ($638,000,00 * 0.12, $644,000,000 * 0.12, $666,000,000 * 0.12 and $766,000,000 * 0.12). Ratios of content to structure value were not available for commercial properties. For the purposes of this analysis, we have conservatively assumed that the ratio of content value to structure value for the nonresidential properties affected is approximately 20 percent, less than half of the assumption used for residential properties. Based on this assumption, the value of at‐risk contents in the inundation areas is approximately $127,600,000, $128,800,000, $133,200,000, and $153,200,000 for the 25‐year, 50‐year, 100‐year and 500‐year flood event, respectively ($638,000,00 * 0.2, $644,000,000 * 0.2, $666,000,000 * 0.2 and $766,000,000 * 0.2). The Army Corps of Engineers commercial depth damage factor for the category office building – general is 16 percent. Applying this factor to the at‐risk content values calculated previously, we estimate commercial content damages to be $20,416,000, $20,608,000, $21,312,000, and $24,512,000 for the 25‐year, 50‐year, 100‐year, and 500‐year floods, respectively ($127,600,000 * 0.16, $128,800,000 * 0.16, $133,200,000 * 0.16, and $153,200,000 * 0.16). In summary, the total commercial damages, including damages to structures and content, is estimated to be $96,976,000, $97,888,000, $101,232,000, and $116,432,000 for the 25‐, 50‐, 100‐ and 500‐year flood events, respectively. Data related to cleanup and debris removal costs are not available, and have therefore been excluded from this analysis.
FD2: Loss of Agricultural Land Production
Adjacent to the Canal is 1,030 acres of prime farmland, the annual revenue of which is estimated to be up to $600 per acre per year. The total estimated annual revenues associated with agricultural lands at risk from flooding is approximately $154,200, $336,600, $523,200, and $618,000 for the 25‐year, 50‐year, 100‐year, and 500‐year event, respectively. Assuming damages equal to 90 percent of the annual revenues, this corresponds to a loss of $138,780, $302,940, $470,880, $556,200 per year in the 25‐year, 50‐year, 100‐year, and 500‐year floods, respectively.
FD3: Loss of Gas Production
Adjacent to the Canal is a gas well field, which would be inundated in a 25‐, 50‐, 100‐ or 500‐year flood event (6 wells inundated in the 25‐year event and 8 wells inundated in all other events). Venoco owns the mineral rights on the Dutch Slough properties.2 Per Venoco, the field produces natural gas from the Hamilton, Anderson, Martinez and McCormick formations at depths ranging from 6,500 to 8,300 feet. Average net production from the field was 1,344 per thousand cubic feet per day (Mcf/d) in December 2005. As of December 31, 2005, there were five producing wells in the field. Two new wells were drilled in the first quarter of 2006.
2 Summary provided at:http://www.wikinvest.com/stock/Venoco_(VQ)/Sacramento%20Basin>

Attachment 8 Benefits and Costs
Contra Costa Water District – Round 2 Stormwater Flood Management Grant Proposal 8‐9 Att8_SWF_BenCost_1of1
Assuming that current average well production is equal to one fifth of the 2005 average production for five wells, production is estimated as 269 Mcf/d per well. Assuming inundation would cause a loss of inundated wells for at least a two‐week period (14 days), and considering current natural gas prices of approximately $3.03 / Mcf/d, this equates to a loss of $68,465 in the 25‐year event (14 * $3.03 *269 * 6) and $91,288 in the 50‐year, 100‐year, and 500‐year event (14 * $3.03 *269 * 8).3
FD4: Damage to Dutch Slough Property
DWR’s Dutch Slough Tidal Marsh Restoration Project will restore a tidal wetland just to the north of the Project. This Project is a critical early action to improve the ecosystem health of the Sacramento‐San Joaquin Delta, a point highlighted by Governor Schwarzenegger in a July 2007 statement and its inclusion in the Interim Delta Plan. The Dutch Slough property, purchased for approximately $23 M in 2003 ($2003), is located entirely within the inundation area. This translates to a 2012 value of $27.6 M. Assuming 50 percent of the land value would be lost in the event of inundation, this corresponds to $13.8 M ($2012) of Dutch Slough property value at risk under the 25‐, 50‐, 100‐, and 500‐year flood event.
FD5: Road Inundation
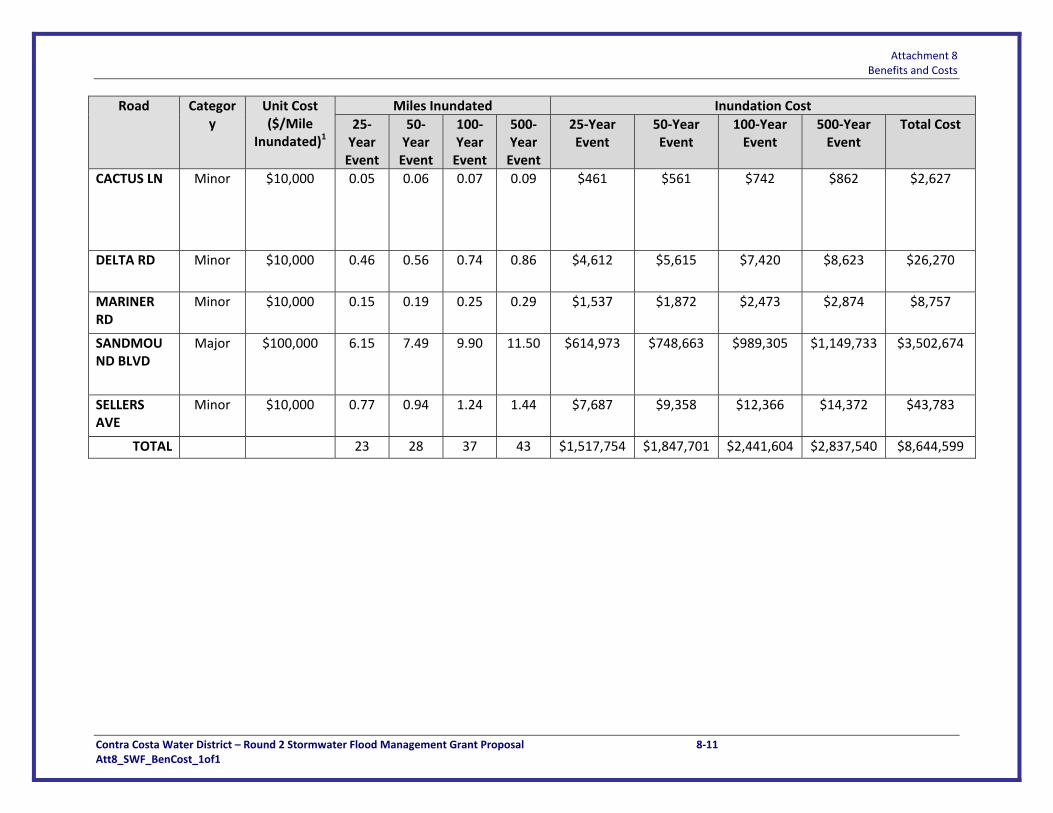
Road inundation was estimated by comparing aerial imagery of roads within the project area with the inundation maps for each flood event. The following table summarizes the length of each road type expected to be inundated in the 25‐, 50‐, 100‐ and 500‐year flood events. As shown in Table 8‐4, major roads, including E. Cypress Road, Sellers Ave, Bethel Island Rd and Sandmound Rd, would experience significant inundation in all flood events analyzed. Costs associated with road inundation were estimated using the default values within DWR’s Flood Rapid Assessment Model (F‐RAM). These default values assume the cost per mile of highway / arterial, major, minor, and unsealed roads to be $250,000, $100,000, $30,000, and $10,000, respectively. These assumptions are based on estimates developed for the San Francisco Bay Area. The inundation areas identified in the project area are also located within the San Francisco Bay Area. As such, it was determined that these values reasonably reflect the costs associated with road inundation in the project area. In total, these costs sum to $1,517,754, $1,847,701, $2,441,604, and $2,837,540 for the 25‐year, 50‐year, 100‐ and 500‐year floods, respectively.
3 Gas prices estimated based on information accessed on January 28, 2013 from: http://www.eia.gov/dnav/ng/hist/n9190us3m.htm.

Attachment 8 Benefits and Costs
Contra Costa Water District – Round 2 Stormwater Flood Management Grant Proposal 8‐10 Att8_SWF_BenCost_1of1
Table 8‐4: Miles of Roads Inundated Without Project
Road Category
Unit Cost ($/Mile
Inundated)1
Miles Inundated Inundation Cost
25‐Year Event
50‐Year Event
100‐Year Event
500‐Year Event
25‐Year Event
50‐Year Event
100‐Year Event
500‐Year Event
Total Cost
BETHEL ISLAND RD
Major $100,000 2.3 2.8 3.71 4.31 $230,615 $280,749 $370,989 $431,150 $1,313,503
BROADWAY Unsealed
$10,000 0.31 0.37 0.50 0.57 $3,075 $3,743 $4,947 $5,749 $17,513
DUTCH SLOUGH RD
Minor $30,000 0.61 0.75 1.00 1.15 $18,449 $22,460 $29,679 $34,492 $105,080
CYPRESS AND EAST CYPRESS RD
Major $100,000 4.61 5.61 7.41 8.62 $461,230 $561,497 $741,979 $862,299 $2,627,005
JERSEY ISLAND RD
Major $30,000 4.61 5.61 7.41 8.62 $138,369 $168,449 $222,594 $258,690 $788,102
KNIGHTSEN AVE
Minor $30,000 0.31 0.37 0.50 0.57 $9,225 $11,230 $14,840 $17,246 $52,540
TULE LN Minor $30,000 0.05 0.06 0.07 0.09 $1,384 $1,684 $2,226 $2,587 $7,881
COW POKE LN
Unsealed
$10,000 0.46 0.56 0.74 0.86 $4,612 $5,615 $7,420 $8,623 $26,270
FRANKLIN RD
Unsealed
$10,000 0.15 0.19 0.25 0.29 $1,537 $1,872 $2,473 $2,874 $8,757
WELLS RD Minor $10,000 2.00 2.43 3.22 3.74 $19,987 $24,332 $32,152 $37,366 $113,837
Attachment 8 Benefits and Costs
Contra Costa Water District – Round 2 Stormwater Flood Management Grant Proposal 8‐11 Att8_SWF_BenCost_1of1
Road Category
Unit Cost ($/Mile
Inundated)1
Miles Inundated Inundation Cost
25‐Year Event
50‐Year Event
100‐Year Event
500‐Year Event
25‐Year Event
50‐Year Event
100‐Year Event
500‐Year Event
Total Cost
CACTUS LN Minor $10,000 0.05 0.06 0.07 0.09 $461 $561 $742 $862 $2,627
DELTA RD Minor $10,000 0.46 0.56 0.74 0.86 $4,612 $5,615 $7,420 $8,623 $26,270
MARINER RD
Minor $10,000 0.15 0.19 0.25 0.29 $1,537 $1,872 $2,473 $2,874 $8,757
SANDMOUND BLVD
Major $100,000 6.15 7.49 9.90 11.50 $614,973 $748,663 $989,305 $1,149,733 $3,502,674
SELLERS AVE
Minor $10,000 0.77 0.94 1.24 1.44 $7,687 $9,358 $12,366 $14,372 $43,783
TOTAL 23 28 37 43 $1,517,754 $1,847,701 $2,441,604 $2,837,540 $8,644,599
Attachment 8 Benefits and Costs
Contra Costa Water District – Round 2 Stormwater Flood Management Grant Proposal 8‐12 Att8_SWF_BenCost_1of1
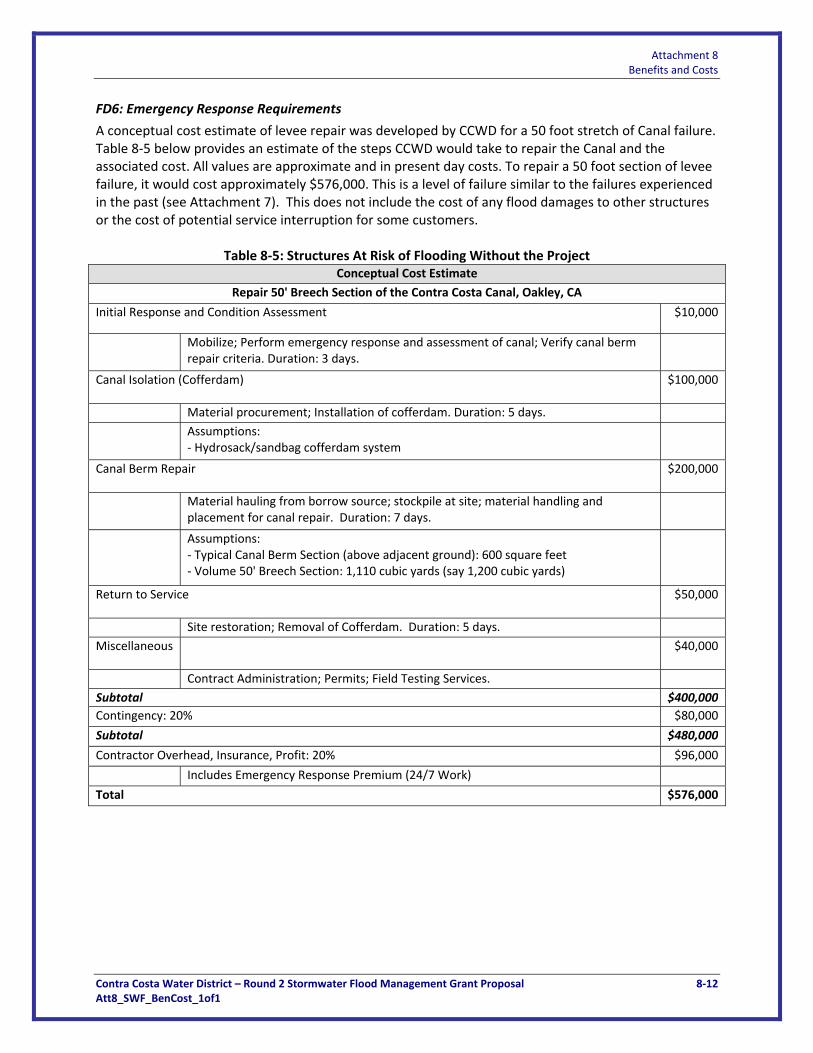
FD6: Emergency Response Requirements
A conceptual cost estimate of levee repair was developed by CCWD for a 50 foot stretch of Canal failure. Table 8‐5 below provides an estimate of the steps CCWD would take to repair the Canal and the associated cost. All values are approximate and in present day costs. To repair a 50 foot section of levee failure, it would cost approximately $576,000. This is a level of failure similar to the failures experienced in the past (see Attachment 7). This does not include the cost of any flood damages to other structures or the cost of potential service interruption for some customers.
Table 8‐5: Structures At Risk of Flooding Without the Project Conceptual Cost Estimate
Repair 50' Breech Section of the Contra Costa Canal, Oakley, CA
Initial Response and Condition Assessment $10,000
Mobilize; Perform emergency response and assessment of canal; Verify canal berm repair criteria. Duration: 3 days.
Canal Isolation (Cofferdam) $100,000
Material procurement; Installation of cofferdam. Duration: 5 days.
Assumptions: ‐ Hydrosack/sandbag cofferdam system
Canal Berm Repair $200,000
Material hauling from borrow source; stockpile at site; material handling and placement for canal repair. Duration: 7 days.
Assumptions: ‐ Typical Canal Berm Section (above adjacent ground): 600 square feet ‐ Volume 50' Breech Section: 1,110 cubic yards (say 1,200 cubic yards)
Return to Service $50,000
Site restoration; Removal of Cofferdam. Duration: 5 days.
Miscellaneous $40,000
Contract Administration; Permits; Field Testing Services.
Subtotal $400,000
Contingency: 20% $80,000
Subtotal $480,000
Contractor Overhead, Insurance, Profit: 20% $96,000
Includes Emergency Response Premium (24/7 Work)
Total $576,000

Attachment 8 Benefits and Costs
Contra Costa Water District – Round 2 Stormwater Flood Management Grant Proposal 8‐13 Att8_SWF_BenCost_1of1
FD7: Supply Replacement Needs
If the Canal failed in a similar fashion to the historical failures in the late 1990s, CCWD estimates that it would take approximately 20 days to repair the Canal and return the Canal to service. 20 days is roughly 5 percent of the year and that percent of CCWD’s demand would need to be met by other water sources. The Rock Slough Intake/PP1 is the least expensive facility in CCWD’s raw water system to operate. The cost of supplying water to the city of Brentwood is approximately $390 per AF because they only utilize water diverted at Rock Slough. CCWD’s normal untreated water rate is approximately $575 per AF. However, this rate is subsidized and the true cost of delivering the water is approximately $754 per acre‐foot, as shown in Appendix 1 to this Attachment. Assuming that during a Canal failure, CCWD’s Canal supplies could be replaced with other CCWD water supplies, the cost to treat and deliver that supply would be $754 per AF, an increase of $364/AF. If CCWD could not supply the replacement water for some reason (catastrophic levee failures around the Delta), the replacement cost would be much greater. The cost of replacing Canal supply for a 20 day outage would be $1,659,512.
Table 8‐6: Supply Replacement Costs in the Event of Canal Failure Amount of
Demand Met by PP1
Diversions
[AF/yr]
Percent of Annual Service
Would be Interrupted by 20 day outage
Amount of Water that
would need to be replaced
[AF/yr]
Increase in Cost of Replacing Canal Supplies with Other
Supplies $/AF
Replacement Cost of Water During 20 day Canal
Outage
Brentwood 4 19,500 5.5% 1,069 $364 $389,116
Complete CCWD Service Area 65,250 5.5% 3,589 $364 $1,306,396
Total $1,695,512
Probability of Flood Structure Failure
Once the Project is implemented, risk of flooding due to Canal berm failure will be completely eliminated. Further, when the related Dutch Slough Tidal Marsh Restoration Project & East Cypress Corridor Projects move forward, the level of protection for the area will exceed the 200 year urban levee design criteria. As such, the probability of failure without the Project is estimated to be approximately 33% per year for the 25‐year, 75% per year for the 50‐year, 85% for the 100‐year, and 100% for the 500‐year event.
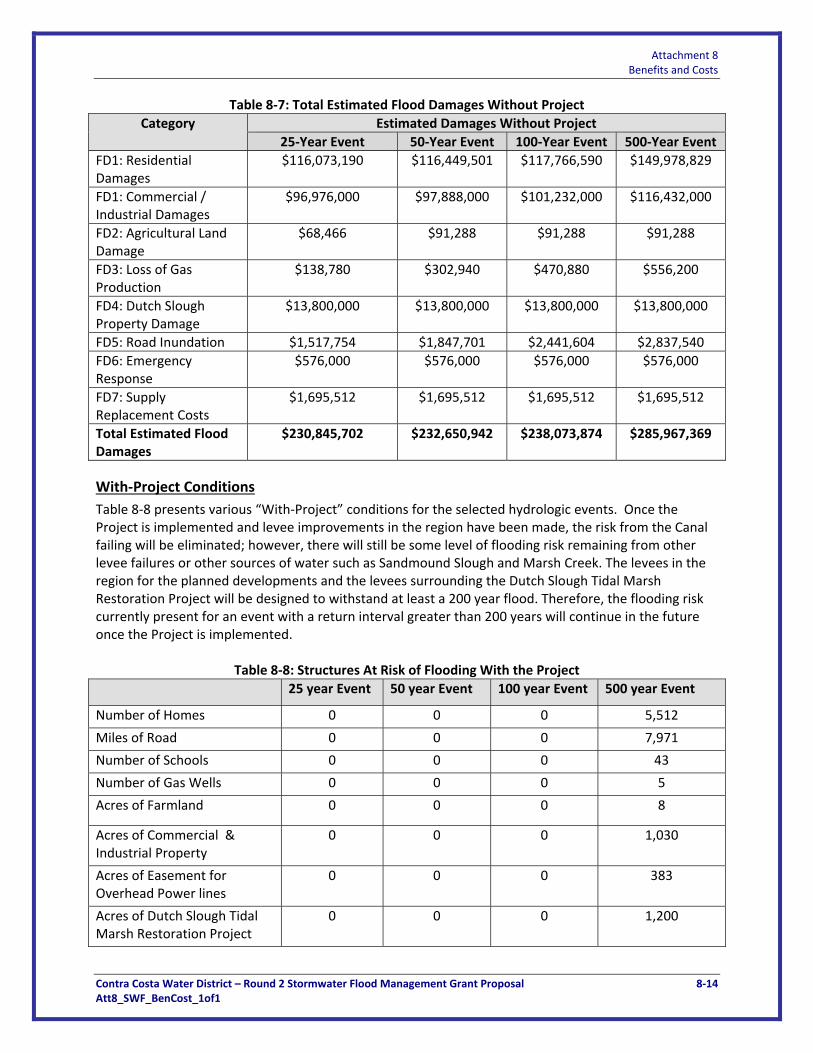
Estimate of Total Flood Damages
Table 8‐7 below summarizes total monetized flood damages without the Project.
4 http://www.brentwoodca.gov/pdf/newsletters/2010UWMP.pdf
Attachment 8 Benefits and Costs
Contra Costa Water District – Round 2 Stormwater Flood Management Grant Proposal 8‐14 Att8_SWF_BenCost_1of1
Table 8‐7: Total Estimated Flood Damages Without Project
Category Estimated Damages Without Project
25‐Year Event 50‐Year Event 100‐Year Event 500‐Year Event
FD1: Residential Damages
$116,073,190 $116,449,501 $117,766,590 $149,978,829
FD1: Commercial / Industrial Damages
$96,976,000 $97,888,000 $101,232,000 $116,432,000
FD2: Agricultural Land Damage
$68,466 $91,288 $91,288 $91,288
FD3: Loss of Gas Production
$138,780 $302,940 $470,880 $556,200
FD4: Dutch Slough Property Damage
$13,800,000 $13,800,000 $13,800,000 $13,800,000
FD5: Road Inundation $1,517,754 $1,847,701 $2,441,604 $2,837,540
FD6: Emergency Response
$576,000 $576,000 $576,000 $576,000
FD7: Supply Replacement Costs
$1,695,512 $1,695,512 $1,695,512 $1,695,512
Total Estimated Flood Damages
$230,845,702 $232,650,942 $238,073,874 $285,967,369
With‐Project Conditions
Table 8‐8 presents various “With‐Project” conditions for the selected hydrologic events. Once the Project is implemented and levee improvements in the region have been made, the risk from the Canal failing will be eliminated; however, there will still be some level of flooding risk remaining from other levee failures or other sources of water such as Sandmound Slough and Marsh Creek. The levees in the region for the planned developments and the levees surrounding the Dutch Slough Tidal Marsh Restoration Project will be designed to withstand at least a 200 year flood. Therefore, the flooding risk currently present for an event with a return interval greater than 200 years will continue in the future once the Project is implemented.
Table 8‐8: Structures At Risk of Flooding With the Project
25 year Event 50 year Event 100 year Event 500 year Event
Number of Homes 0 0 0 5,512
Miles of Road 0 0 0 7,971
Number of Schools 0 0 0 43
Number of Gas Wells 0 0 0 5
Acres of Farmland 0 0 0 8
Acres of Commercial & Industrial Property
0 0 0 1,030
Acres of Easement for Overhead Power lines
0 0 0 383
Acres of Dutch Slough Tidal Marsh Restoration Project
0 0 0 1,200

Attachment 8 Benefits and Costs
Contra Costa Water District – Round 2 Stormwater Flood Management Grant Proposal 8‐15 Att8_SWF_BenCost_1of1
Figure 8‐3: Potential Inundation Areas for 500‐Year Event With the Project

Attachment 8 Benefits and Costs
Contra Costa Water District – Round 2 Stormwater Flood Management Grant Proposal 8‐16 Att8_SWF_BenCost_1of1
Estimate of Total Flood Damages
Project implementation was expected to eliminate expected damages for events smaller than the 200‐year event. Table 8‐9 summarizes the expected damages with Project.
Table 8‐9: Total Estimated Flood Damages With Project
Category Estimated Damages Without Project
25‐Year Event 50‐Year Event 100‐Year Event 500‐Year Event1
FD1: Residential Damages
$0 $0 $0 $149,978,829
FD1: Commercial / Industrial Damages
$0 $0 $0 $116,432,000
FD2: Agricultural Land Damage
$0 $0 $0 $91,288
FD3: Loss of Gas Production
$0 $0 $0 $556,200
FD4: Dutch Slough Property Damage
$0 $0 $0 $13,800,000
FD5: Road Inundation $0 $0 $0 $2,837,540
FD6: Emergency Response
$0 $0 $0 $576,000
FD7: Supply Replacement Costs
$0 $0 $0 $1,695,512
Total Estimated Flood Damages
$0 $0 $0 $285,967,369
1. Assumed to equal the without‐Project condition.
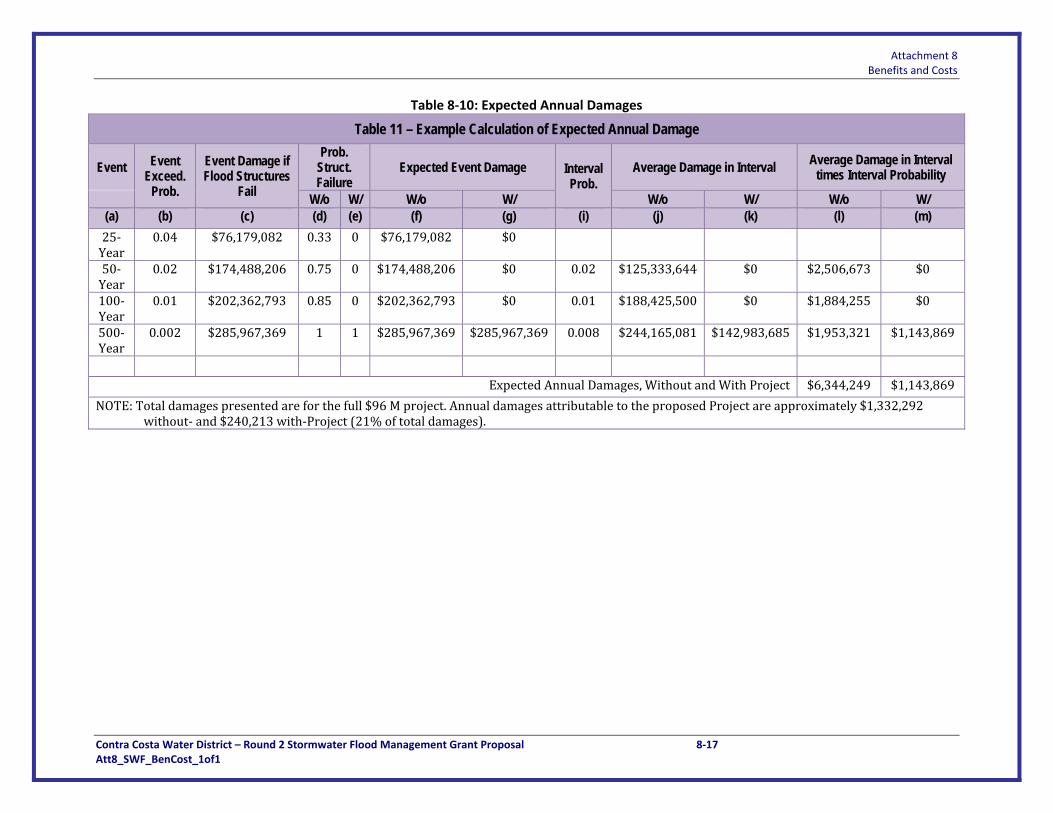
With‐ and Without‐Project Comparison
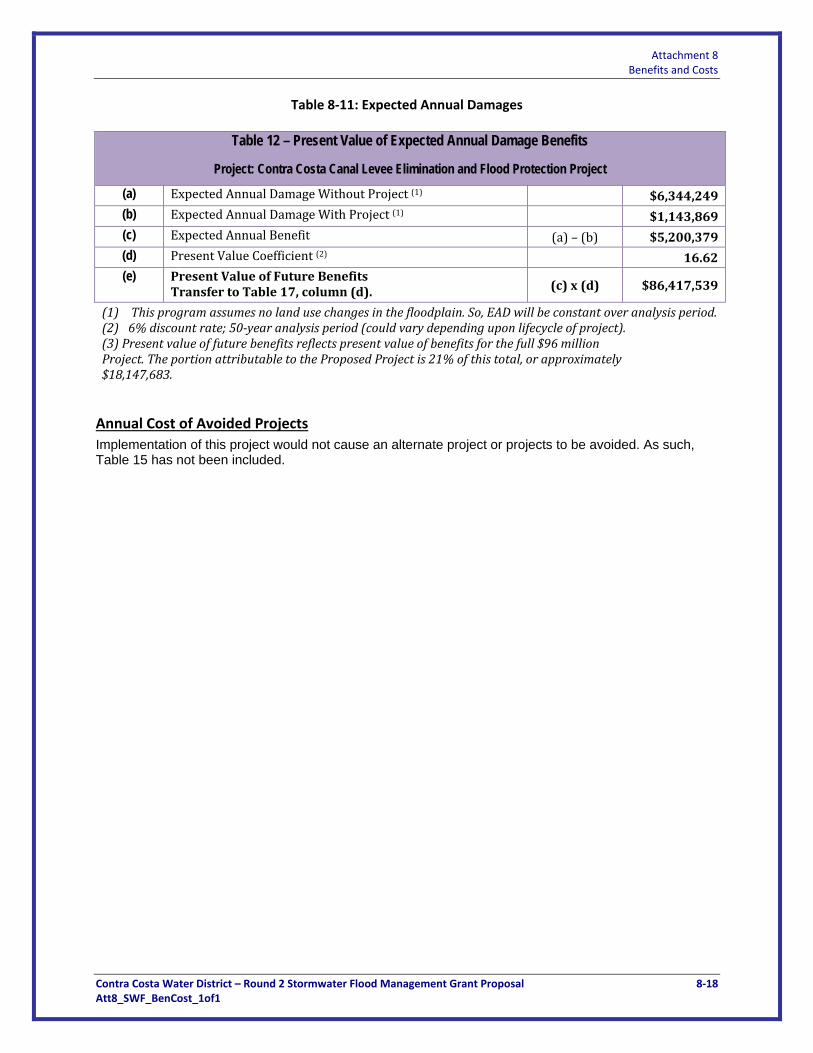
The economic analysis provides the cost and benefits for the with‐ and without‐project conditions for the 100‐year Project life. Table 8‐10 (PSP Table 11) summarizes Expected Annual Damages under with‐ and without‐project conditions. Table 8‐11 (PSP Table 12) presents the present value of avoided flood damage benefits over a 100‐year Project life, and using a 6 percent discount rate. As shown in this table, the present value of avoided flood damages totals approximately $86.4 million. Because this Project represents approximately 21 percent of the full $96 million Project, the portion of benefits attributable to this project is approximately $18.1 million.
Attachment 8 Benefits and Costs
Contra Costa Water District – Round 2 Stormwater Flood Management Grant Proposal 8‐17 Att8_SWF_BenCost_1of1
Table 8‐10: Expected Annual Damages
Table 11 – Example Calculation of Expected Annual Damage
Event Event Exceed.
Prob.
Event Damage if Flood Structures
Fail
Prob. Struct. Failure
Expected Event Damage Interval Prob.
Average Damage in Interval Average Damage in Interval times Interval Probability
W/o W/ W/o W/ W/o W/ W/o W/ (a) (b) (c) (d) (e) (f) (g) (i) (j) (k) (l) (m) 25‐Year
0.04 $76,179,082 0.33 0 $76,179,082 $0
50‐Year
0.02 $174,488,206 0.75 0 $174,488,206 $0 0.02 $125,333,644 $0 $2,506,673 $0
100‐Year
0.01 $202,362,793 0.85 0 $202,362,793 $0 0.01 $188,425,500 $0 $1,884,255 $0
500‐Year
0.002 $285,967,369 1 1 $285,967,369 $285,967,369 0.008 $244,165,081 $142,983,685 $1,953,321 $1,143,869
Expected Annual Damages, Without and With Project $6,344,249 $1,143,869
NOTE: Total damages presented are for the full $96 M project. Annual damages attributable to the proposed Project are approximately $1,332,292 without‐ and $240,213 with‐Project (21% of total damages).
Attachment 8 Benefits and Costs
Contra Costa Water District – Round 2 Stormwater Flood Management Grant Proposal 8‐18 Att8_SWF_BenCost_1of1
Table 8‐11: Expected Annual Damages
Table 12 – Present Value of Expected Annual Damage Benefits
Project: Contra Costa Canal Levee Elimination and Flood Protection Project
(a) Expected Annual Damage Without Project (1) $6,344,249
(b) Expected Annual Damage With Project (1) $1,143,869
(c) Expected Annual Benefit (a) – (b) $5,200,379
(d) Present Value Coefficient (2) 16.62
(e) Present Value of Future Benefits Transfer to Table 17, column (d). (c) x (d) $86,417,539
(1) This program assumes no land use changes in the floodplain. So, EAD will be constant over analysis period. (2) 6% discount rate; 50‐year analysis period (could vary depending upon lifecycle of project). (3) Present value of future benefits reflects present value of benefits for the full $96 million Project. The portion attributable to the Proposed Project is 21% of this total, or approximately $18,147,683.
Annual Cost of Avoided Projects
Implementation of this project would not cause an alternate project or projects to be avoided. As such, Table 15 has not been included.
Attachment 8 Benefits and Costs
Contra Costa Water District – Round 2 Stormwater Flood Management Grant Proposal 8‐19 Att8_SWF_BenCost_1of1
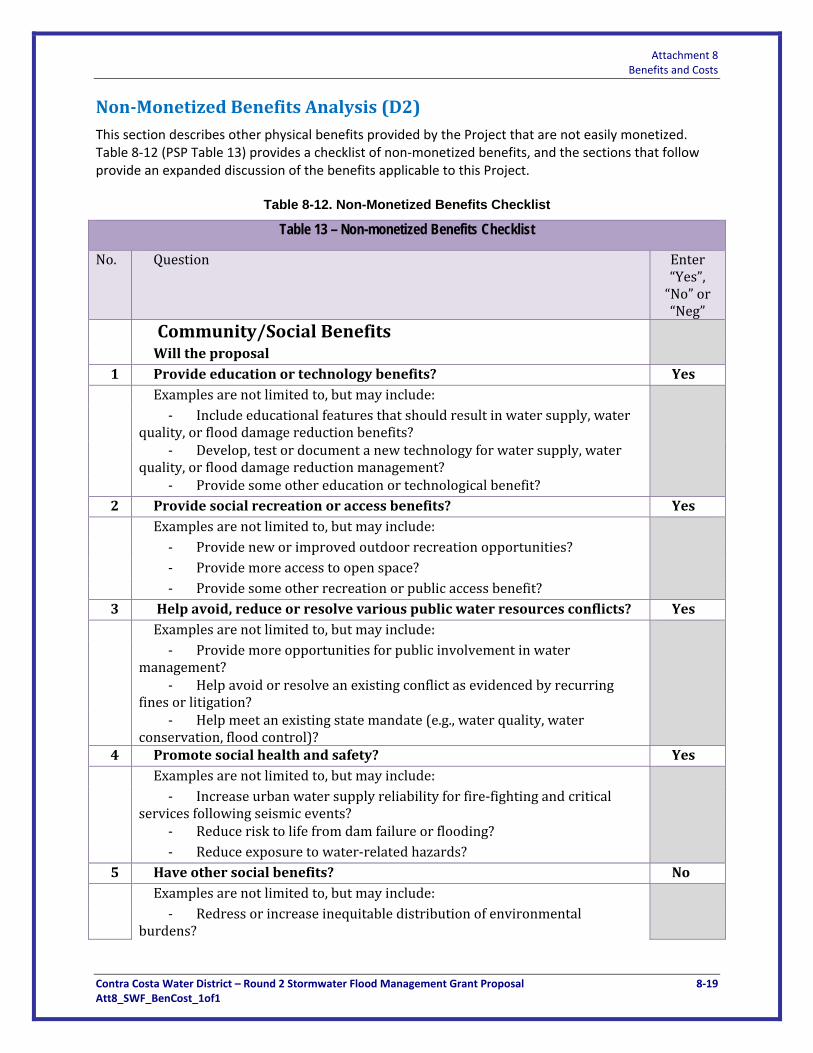
Non‐Monetized Benefits Analysis (D2)
This section describes other physical benefits provided by the Project that are not easily monetized. Table 8‐12 (PSP Table 13) provides a checklist of non‐monetized benefits, and the sections that follow provide an expanded discussion of the benefits applicable to this Project.
Table 8-12. Non-Monetized Benefits Checklist
Table 13 – Non-monetized Benefits Checklist
No. Question Enter “Yes”, “No” or “Neg”
Community/Social BenefitsWill the proposal
1 Provide education or technology benefits? Yes
Examples are not limited to, but may include:‐ Include educational features that should result in water supply, water
quality, or flood damage reduction benefits? ‐ Develop, test or document a new technology for water supply, water
quality, or flood damage reduction management? ‐ Provide some other education or technological benefit?
2 Provide social recreation or access benefits? Yes
Examples are not limited to, but may include:‐ Provide new or improved outdoor recreation opportunities? ‐ Provide more access to open space?‐ Provide some other recreation or public access benefit?
3 Help avoid, reduce or resolve various public water resources conflicts? Yes
Examples are not limited to, but may include:‐ Provide more opportunities for public involvement in water
management? ‐ Help avoid or resolve an existing conflict as evidenced by recurring
fines or litigation? ‐ Help meet an existing state mandate (e.g., water quality, water
conservation, flood control)? 4 Promote social health and safety? Yes
Examples are not limited to, but may include:‐ Increase urban water supply reliability for fire‐fighting and critical
services following seismic events? ‐ Reduce risk to life from dam failure or flooding?‐ Reduce exposure to water‐related hazards?
5 Have other social benefits? No
Examples are not limited to, but may include:‐ Redress or increase inequitable distribution of environmental
burdens?
Attachment 8 Benefits and Costs
Contra Costa Water District – Round 2 Stormwater Flood Management Grant Proposal 8‐20 Att8_SWF_BenCost_1of1
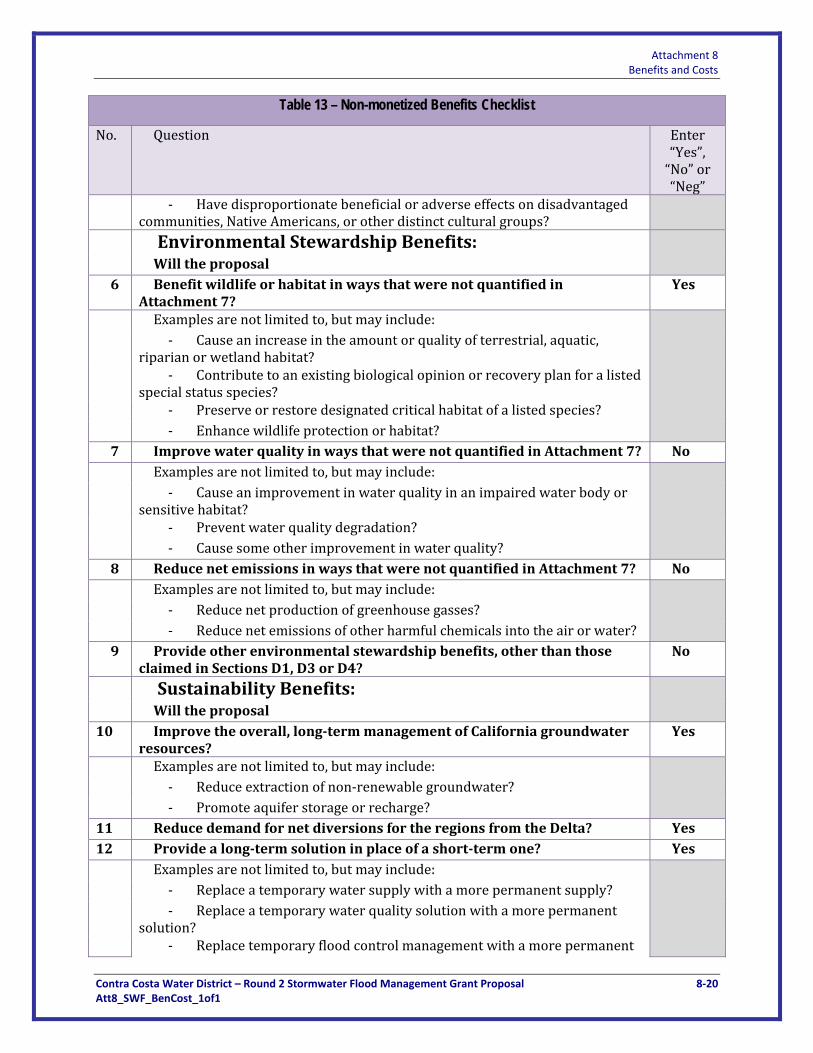
Table 13 – Non-monetized Benefits Checklist
No. Question Enter “Yes”, “No” or “Neg”
‐ Have disproportionate beneficial or adverse effects on disadvantaged communities, Native Americans, or other distinct cultural groups?
Environmental Stewardship Benefits:Will the proposal
6 Benefit wildlife or habitat in ways that were not quantified in Attachment 7?
Yes
Examples are not limited to, but may include:‐ Cause an increase in the amount or quality of terrestrial, aquatic,
riparian or wetland habitat? ‐ Contribute to an existing biological opinion or recovery plan for a listed
special status species? ‐ Preserve or restore designated critical habitat of a listed species? ‐ Enhance wildlife protection or habitat?
7 Improve water quality in ways that were not quantified in Attachment 7? No
Examples are not limited to, but may include:‐ Cause an improvement in water quality in an impaired water body or
sensitive habitat? ‐ Prevent water quality degradation?‐ Cause some other improvement in water quality?
8 Reduce net emissions in ways that were not quantified in Attachment 7? No
Examples are not limited to, but may include:‐ Reduce net production of greenhouse gasses?‐ Reduce net emissions of other harmful chemicals into the air or water?
9 Provide other environmental stewardship benefits, other than those claimed in Sections D1, D3 or D4?
No
Sustainability Benefits:Will the proposal
10 Improve the overall, long‐term management of California groundwater resources?
Yes
Examples are not limited to, but may include:‐ Reduce extraction of non‐renewable groundwater?‐ Promote aquifer storage or recharge?
11 Reduce demand for net diversions for the regions from the Delta? Yes
12 Provide a long‐term solution in place of a short‐term one? Yes
Examples are not limited to, but may include:‐ Replace a temporary water supply with a more permanent supply? ‐ Replace a temporary water quality solution with a more permanent
solution? ‐ Replace temporary flood control management with a more permanent
Attachment 8 Benefits and Costs
Contra Costa Water District – Round 2 Stormwater Flood Management Grant Proposal 8‐21 Att8_SWF_BenCost_1of1
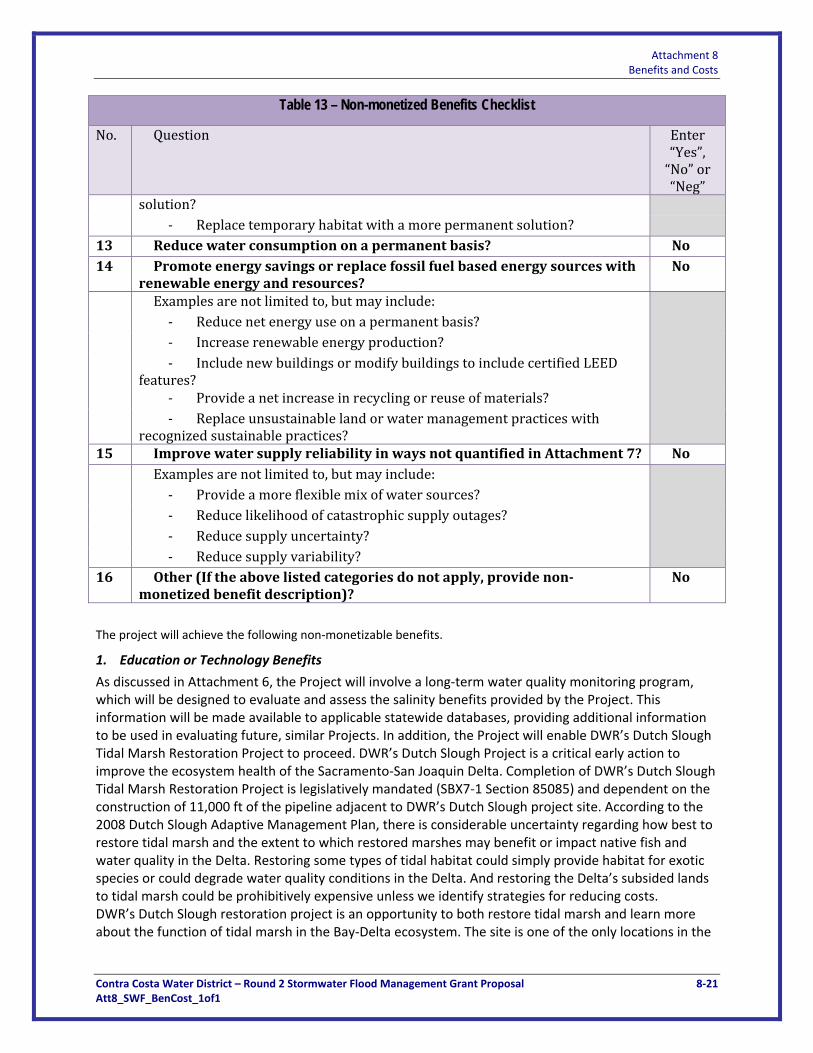
Table 13 – Non-monetized Benefits Checklist
No. Question Enter “Yes”, “No” or “Neg”
solution? ‐ Replace temporary habitat with a more permanent solution?
13 Reduce water consumption on a permanent basis? No
14 Promote energy savings or replace fossil fuel based energy sources with renewable energy and resources?
No
Examples are not limited to, but may include:‐ Reduce net energy use on a permanent basis?‐ Increase renewable energy production?‐ Include new buildings or modify buildings to include certified LEED
features? ‐ Provide a net increase in recycling or reuse of materials?‐ Replace unsustainable land or water management practices with
recognized sustainable practices? 15 Improve water supply reliability in ways not quantified in Attachment 7? No
Examples are not limited to, but may include:‐ Provide a more flexible mix of water sources? ‐ Reduce likelihood of catastrophic supply outages?‐ Reduce supply uncertainty?‐ Reduce supply variability?
16 Other (If the above listed categories do not apply, provide non‐monetized benefit description)?
No
The project will achieve the following non‐monetizable benefits.
1. Education or Technology Benefits
As discussed in Attachment 6, the Project will involve a long‐term water quality monitoring program, which will be designed to evaluate and assess the salinity benefits provided by the Project. This information will be made available to applicable statewide databases, providing additional information to be used in evaluating future, similar Projects. In addition, the Project will enable DWR’s Dutch Slough Tidal Marsh Restoration Project to proceed. DWR’s Dutch Slough Project is a critical early action to improve the ecosystem health of the Sacramento‐San Joaquin Delta. Completion of DWR’s Dutch Slough Tidal Marsh Restoration Project is legislatively mandated (SBX7‐1 Section 85085) and dependent on the construction of 11,000 ft of the pipeline adjacent to DWR’s Dutch Slough project site. According to the 2008 Dutch Slough Adaptive Management Plan, there is considerable uncertainty regarding how best to restore tidal marsh and the extent to which restored marshes may benefit or impact native fish and water quality in the Delta. Restoring some types of tidal habitat could simply provide habitat for exotic species or could degrade water quality conditions in the Delta. And restoring the Delta’s subsided lands to tidal marsh could be prohibitively expensive unless we identify strategies for reducing costs. DWR’s Dutch Slough restoration project is an opportunity to both restore tidal marsh and learn more about the function of tidal marsh in the Bay‐Delta ecosystem. The site is one of the only locations in the
Attachment 8 Benefits and Costs
Contra Costa Water District – Round 2 Stormwater Flood Management Grant Proposal 8‐22 Att8_SWF_BenCost_1of1
Western Delta with suitable elevations for tidal marsh restoration and is configured in three separate tracts which will allow scientists to compare and contrast the efficacy of different approaches on the different parcels. A key goal of DWR’s Dutch Slough Adaptive Management Plan is:
Contribute to scientific understanding of ecological restoration by implementing the project under an adaptive management framework.
By enabling the Project to proceed, the Contra Costa Canal Flood Protection and Levee Elimination Project will provide significant educational benefits.
2. Social Recreation or Access Benefits
As discussed previously, DWR’s Dutch Slough Tidal Marsh Restoration Project cannot proceed without implementation of the proposed Project. A key goal of DWR’s Dutch Slough Tidal Marsh Restoration is to:
Provide shoreline access, educational and recreational opportunities
Proposed recreational elements described in the Adaptive Management Plan include:
Open trail around Emerson levee
Create a 55‐acre community park
Provide public access to the Delta shoreline
Create signage to educate public about restoration project
Build wildlife viewing platforms
Involve schools and community groups
Build non‐motorized boat launch
Create swimming opportunities for the public
Create opportunities to canoe and kayak
By enabling DWR’s Dutch Slough Tidal Marsh Restoration Project to proceed, the proposed Project enables these recreation benefits to be realized.
3. Avoid, Reduce or Resolve Various Public Water Resources Conflicts
Currently, DWR’s Dutch Slough Tidal Marsh Restoration Project is proposed to be implemented adjacent to the unlined Contra Costa Canal (Canal). Implementation of DWR’s Dutch Slough Tidal Marsh Restoration Project without first encasing the Canal in a pipeline would result in significant water quality impacts to the Canal, impacting the water supply of nearly 550,000 Californians. By implementing the proposed Project, this conflict between ecological and drinking water needs could be eliminated.
4. Promote Social Health and Safety
As discussed later in this attachment, the Project will provide significant health and safety benefits by eliminating the risk of drowning in the Canal.
In addition, the Project will eliminate the potential for flooding related to hydrologic events. By encasing the Canal in a buried pipeline, virtually all concerns with regard to system security and public safety are alleviated as well. Fences will be maintained along the 300‐foot right of way boundary, maintenance roads will be maintained, and security personnel will patrol the area.
5. Provide Other Social Benefits
The social benefits provided by the proposed Project are discussed in other sections of this Proposal.
Attachment 8 Benefits and Costs
Contra Costa Water District – Round 2 Stormwater Flood Management Grant Proposal 8‐23 Att8_SWF_BenCost_1of1
6. Benefit Wildlife or Habitat
The Project will provide significant wildlife and habitat benefits.
Ecosystem restoration and habitat protection are linked to protecting the water quality and water supply reliability in East County. Protecting Delta water quality protects source water for the region and improves ecosystem habitat for the Delta’s aquatic species while also protecting them from the harmful impacts of degraded water quality. Promoting the recovery of the Delta’s endangered fish species improves water supply reliability by reducing regulatory conflicts between the legal requirements to protect endangered species and project operations to divert water from the Delta and. Tidal wetland and riparian restoration projects can sometimes create habitat for endangered species while at the same time reducing the amount of polluted runoff flowing into the Delta – a win for water quality, endangered species, and water supply reliability.
The Project will protect natural resources of the Delta and promote habitat restoration for sensitive species. Although construction of the full Project is not complete, the mitigation for the full Project is complete. CCWD purchased 47 acres of wetland and 98 acres of upland habitat as mitigation for the full Project. These lands provide habitat for species of concern such as Delta smelt, longfin smelt and the giant garter snake. Completion of the full Project will also promote the completion of DWR’s Dutch Slough Tidal Marsh Restoration Project. DWR’s Dutch Slough Tidal Marsh Restoration Project will restore a tidal wetland just to the north of the Project. The Project is a critical early action to improve the ecosystem health of the Sacramento‐San Joaquin Delta. Completion of DWR’s Dutch Slough Tidal Marsh Restoration Project is legislatively mandated (SBX7‐1 Section 85085) and dependent on the construction of 11,000 ft of the pipeline adjacent to DWR’s Dutch Slough project site.
7. Improve Water Quality
As discussed in Attachment 7 and later in this Attachment, the Project will provide water quality benefits through reduced salinity and turbidity and reduced risk of pathogen contamination from nearby grazing activities.
No other unquantified water quality improvements have been identified.
8. Reduce Net Emissions
As discussed in Attachment 7, project implementation will result in reduced energy usage and GHG emission reductions. No other, unquantified emissions reductions have been identified.
9. Provide other Environmental Stewardship Benefits
All environmental stewardships benefits are discussed previously in this section.
10. Improve the Overall, Long‐Term Management of Groundwater Resources
As discussed in Attachment 7 and previously in this Attachment, the Project will provide significant water supply benefits and will reduce water quality impacts associated with saline groundwater intrusion.
Delta supplies, groundwater, and reclaimed water in East Contra Costa County are operated as an interconnected system. If water quality impacts were to limit Delta supplies available to the Region, groundwater dependence would increase. As such, water quality in the Canal by implementing the proposed Project will reduce reliance on local groundwater supplies, improving the long‐term management of Groundwater Resources.
Attachment 8 Benefits and Costs
Contra Costa Water District – Round 2 Stormwater Flood Management Grant Proposal 8‐24 Att8_SWF_BenCost_1of1
11. Reduce Demand for net Diversions from the Delta
As discussed in Attachment 7 and previously in this Attachment, the Project will provide significant water supply benefits.
By eliminating local degradation from groundwater seepage and runoff, this Project will increase overall water supply for the Federal Central Valley Project by reducing the need for upstream releases into the Delta to offset this local degradation.
12. Provide a Long‐Term Solution in Place of a Short‐Term One
The full Project will eliminate up to eight miles of aging Canal embankments (unconsolidated dredging spoils from the original construction) that were not designed to provide flood protection and are not seismically sound. Encasing the Canal in a pipeline provides a long‐term solution to the flood protection challenges currently being caused by the improper use of the existing embankments for flood protection purposes.
13. Reduce Water Consumption on a Permanent Basis
The Project will not reduce water consumption on a permanent basis.
14. Promote Energy Savings or Replace Fossil Fuel‐Based Energy Sources with Renewable Energy and Resources
As discussed in Attachment 7, the Project will reduce energy usage and associated GHG emissions. It will not replace fossil fuel based energy sources with renewable energy and resources.
15. Improve Water Supply Reliability
As discussed in Attachment 7, the Project will provide significant water supply benefits and improved water supply reliability.
16. Other
All other benefits are summarized in Attachments 7 and 8.
Attachment 8 Benefits and Costs
Contra Costa Water District – Round 2 Stormwater Flood Management Grant Proposal 8‐25 Att8_SWF_BenCost_1of1
Other Monetized Benefits (D3)
This section describes other benefits (not including the flood reduction benefits described above) that can be quantified for the Contra Costa Canal Levee Elimination and Flood Protection Project. These benefits include:
WS1: Increase in emergency water supply available for CCWD customers and partners
WS2: CVP/SWP water savings from upstream reservoirs that would otherwise be released to meet state water quality regulations as measured at the downstream end of the Canal
WS3: CVP/SWP operational flexibility when regulations limit Old and Middle River flows
WQ1: Reduced Bromide Concentration and Associated Reduction in Excess Lifetime Cancer Risk
WQ2: Decreased Agricultural Runoff from Adjacent Fields (not monetized)
WQ3: Decreased Risk in Fecal Borne Pathogens Transported into the Canal (not monetized)
WQ4: Decreased Turbidity and Associated Solids Handling Requirements
ENV1: Enabled Completion of Dutch Slough Tidal Marsh Restoration Project
ENV2: Reduction in Herbicide Treatment of Unlined Canal
ERG1: Energy Reduction
ERG2: Greenhouse Gas Emission Reduction (not monetized)
OTH1: Reduced Security Risk
Monetization of these benefits is discussed in additional detail below.
Description of Benefits
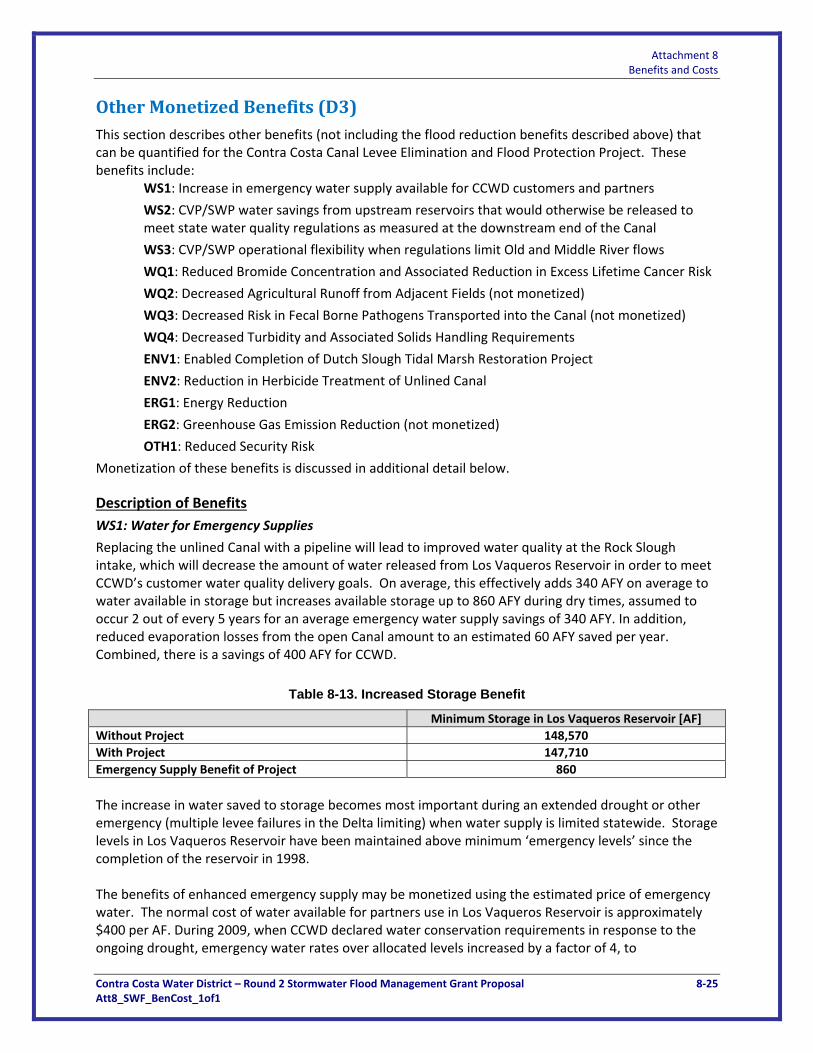
WS1: Water for Emergency Supplies
Replacing the unlined Canal with a pipeline will lead to improved water quality at the Rock Slough intake, which will decrease the amount of water released from Los Vaqueros Reservoir in order to meet CCWD’s customer water quality delivery goals. On average, this effectively adds 340 AFY on average to water available in storage but increases available storage up to 860 AFY during dry times, assumed to occur 2 out of every 5 years for an average emergency water supply savings of 340 AFY. In addition, reduced evaporation losses from the open Canal amount to an estimated 60 AFY saved per year. Combined, there is a savings of 400 AFY for CCWD.
Table 8-13. Increased Storage Benefit
Minimum Storage in Los Vaqueros Reservoir [AF]
Without Project 148,570
With Project 147,710
Emergency Supply Benefit of Project 860
The increase in water saved to storage becomes most important during an extended drought or other emergency (multiple levee failures in the Delta limiting) when water supply is limited statewide. Storage levels in Los Vaqueros Reservoir have been maintained above minimum ‘emergency levels’ since the completion of the reservoir in 1998. The benefits of enhanced emergency supply may be monetized using the estimated price of emergency water. The normal cost of water available for partners use in Los Vaqueros Reservoir is approximately $400 per AF. During 2009, when CCWD declared water conservation requirements in response to the ongoing drought, emergency water rates over allocated levels increased by a factor of 4, to
Attachment 8 Benefits and Costs
Contra Costa Water District – Round 2 Stormwater Flood Management Grant Proposal 8‐26 Att8_SWF_BenCost_1of1
approximately $1,600 per AF in 2009 dollars; this equates to approximately $1,648 in 2012 dollars. Utilizing this figure as an estimate of the value of enhanced emergency storage yields an annual benefit value of $659,200 M (400 AFY at $1,600 per AF). As shown in Table 8‐17 (PSP Table 14) at the end of this section, the present value of this benefit, assuming benefits begin to accrue in 2018 and a 100‐year project life and 6 percent discount rate are $8.2 million. Allocating 21 percent of these benefits to this specific portion of the Project, the present value benefits amount to approximately $1.7 million.
WS2: Avoided Releases from SWP and CVP reservoirs to Meet Water Quality Standards
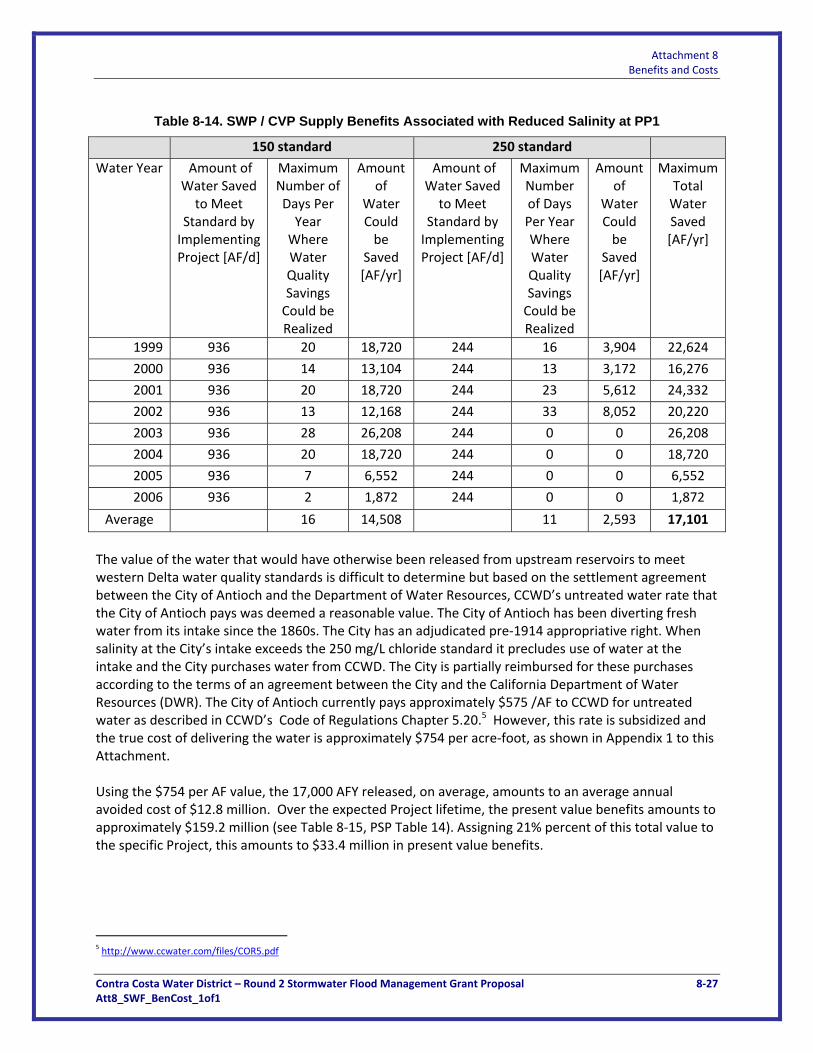
Water quality in the Contra Costa Canal affects both CCWD operations and statewide CVP/SWP operations. The federal water and state water projects are required to meet state water quality objective defined by the State Water Resource Control Board Decision 1641; compliance with two state water quality objectives are measured at Pumping Plant 1. One of the D‐1641 objectives specifies that salinity in the Contra Costa Canal as measured at Pumping Plant 1 (PP1) must be below 150 mg/L chlorides for a minimum of 155 days per year and up to 240 days per year depending on water year type. The second objective specifies that water quality at Pumping Plant 1 must be below 250 mg/L chlorides to comply with secondary MCL health standards. Although compliance with these standards does not often dictate statewide water operations, there are times when CVP/SWP reservoirs must make releases specifically to meet these water quality objectives. There are three sources of salinity and contamination in the Canal: 1) seawater intrusion from the ocean into the Delta, groundwater intrusion from an elevation water table adjacent to the Canal, and agricultural return flow from adjacent farms and ranches. Salinity in the Canal from seawater is naturally variable due to the variation in hydrologic conditions and tidal forcing. When there is high freshwater outflow from the Delta, water in the Canal is relatively fresh because the river flow is sufficient to keep seawater downstream of the Delta, conversely, when there is low freshwater outflow from the Delta, water in the Canal is relatively salty because seawater is able to mix upstream into the Delta. Salinity from the other two sources, groundwater and agricultural return flow, are largely due to human activities and will be eliminated by implementing the Project. Eliminating the two “human derived” sources of salt will improve water quality in the Canal and in turn can change SWP/CVP operations such that there are water supply benefits. Because compliance with the regulatory standards is measured at PP1, at the downstream end of the unlined Canal, degradation incurred along the unlined portion of the Canal from groundwater intrusion and agricultural runoff can result in increased releases from CVP/SWP reservoirs. Historical land use practices adjacent to the unlined Canal, such as land disposal of sewage, agricultural drainage, and cattle grazing, have resulted in significant water quality degradation in the unlined Canal. Implementing the Project will eliminate salinity intrusion from groundwater and direct agricultural runoff thereby decreasing the salinity at Pumping Plant 1 and decreasing the amount of water CVP/SWP need to release from upstream reservoirs to meet the water quality standards. According to the historical water quality record from 1999 through 2007, implementing the Project could have improved the water quality at Rock Slough such that the 150 mg/L chloride standard could have been achieved by reducing releases for 16 days per year on average for a total water savings of 14,000 AFY. Similarly, releases could have been reduced on average for 11 days per year to meet the 250 mg/L chloride standard for an average water savings of 2,593 AFY. Combined, implementing the Project could save between 24,000 AFY and 2,000 AFY depending on the water year type. Over the eight year period, the average potential water savings that could have been realized was 17,000 AFY.
Attachment 8 Benefits and Costs
Contra Costa Water District – Round 2 Stormwater Flood Management Grant Proposal 8‐27 Att8_SWF_BenCost_1of1
Table 8-14. SWP / CVP Supply Benefits Associated with Reduced Salinity at PP1
150 standard 250 standard
Water Year Amount of Water Saved to Meet
Standard by Implementing Project [AF/d]
Maximum Number of Days Per Year Where Water Quality Savings Could be Realized
Amount of
Water Could be
Saved [AF/yr]
Amount of Water Saved to Meet
Standard by Implementing Project [AF/d]
Maximum Number of Days Per Year Where Water Quality Savings Could be Realized
Amount of
Water Could be
Saved [AF/yr]
Maximum Total Water Saved [AF/yr]
1999 936 20 18,720 244 16 3,904 22,624
2000 936 14 13,104 244 13 3,172 16,276
2001 936 20 18,720 244 23 5,612 24,332
2002 936 13 12,168 244 33 8,052 20,220
2003 936 28 26,208 244 0 0 26,208
2004 936 20 18,720 244 0 0 18,720
2005 936 7 6,552 244 0 0 6,552
2006 936 2 1,872 244 0 0 1,872
Average 16 14,508 11 2,593 17,101
The value of the water that would have otherwise been released from upstream reservoirs to meet western Delta water quality standards is difficult to determine but based on the settlement agreement between the City of Antioch and the Department of Water Resources, CCWD’s untreated water rate that the City of Antioch pays was deemed a reasonable value. The City of Antioch has been diverting fresh water from its intake since the 1860s. The City has an adjudicated pre‐1914 appropriative right. When salinity at the City’s intake exceeds the 250 mg/L chloride standard it precludes use of water at the intake and the City purchases water from CCWD. The City is partially reimbursed for these purchases according to the terms of an agreement between the City and the California Department of Water Resources (DWR). The City of Antioch currently pays approximately $575 /AF to CCWD for untreated water as described in CCWD’s Code of Regulations Chapter 5.20.5 However, this rate is subsidized and the true cost of delivering the water is approximately $754 per acre‐foot, as shown in Appendix 1 to this Attachment. Using the $754 per AF value, the 17,000 AFY released, on average, amounts to an average annual avoided cost of $12.8 million. Over the expected Project lifetime, the present value benefits amounts to approximately $159.2 million (see Table 8‐15, PSP Table 14). Assigning 21% percent of this total value to the specific Project, this amounts to $33.4 million in present value benefits.
5 http://www.ccwater.com/files/COR5.pdf
Attachment 8 Benefits and Costs
Contra Costa Water District – Round 2 Stormwater Flood Management Grant Proposal 8‐28 Att8_SWF_BenCost_1of1
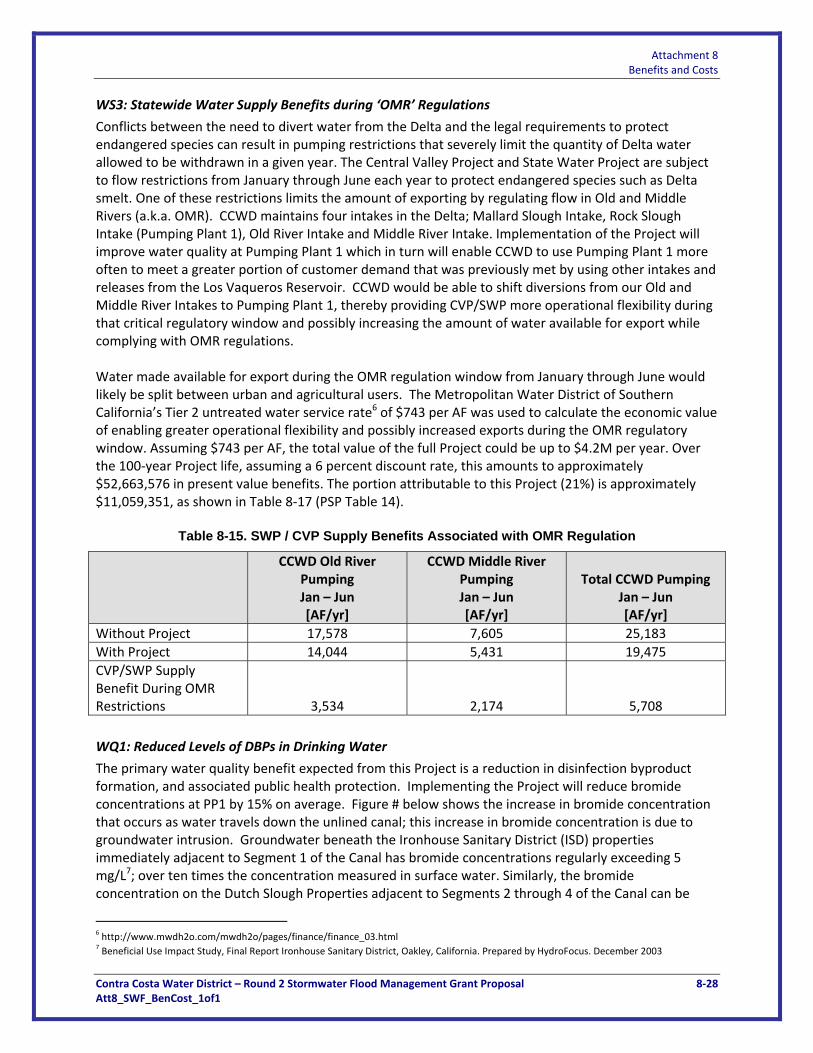
WS3: Statewide Water Supply Benefits during ‘OMR’ Regulations
Conflicts between the need to divert water from the Delta and the legal requirements to protect endangered species can result in pumping restrictions that severely limit the quantity of Delta water allowed to be withdrawn in a given year. The Central Valley Project and State Water Project are subject to flow restrictions from January through June each year to protect endangered species such as Delta smelt. One of these restrictions limits the amount of exporting by regulating flow in Old and Middle Rivers (a.k.a. OMR). CCWD maintains four intakes in the Delta; Mallard Slough Intake, Rock Slough Intake (Pumping Plant 1), Old River Intake and Middle River Intake. Implementation of the Project will improve water quality at Pumping Plant 1 which in turn will enable CCWD to use Pumping Plant 1 more often to meet a greater portion of customer demand that was previously met by using other intakes and releases from the Los Vaqueros Reservoir. CCWD would be able to shift diversions from our Old and Middle River Intakes to Pumping Plant 1, thereby providing CVP/SWP more operational flexibility during that critical regulatory window and possibly increasing the amount of water available for export while complying with OMR regulations. Water made available for export during the OMR regulation window from January through June would likely be split between urban and agricultural users. The Metropolitan Water District of Southern California’s Tier 2 untreated water service rate6 of $743 per AF was used to calculate the economic value of enabling greater operational flexibility and possibly increased exports during the OMR regulatory window. Assuming $743 per AF, the total value of the full Project could be up to $4.2M per year. Over the 100‐year Project life, assuming a 6 percent discount rate, this amounts to approximately $52,663,576 in present value benefits. The portion attributable to this Project (21%) is approximately $11,059,351, as shown in Table 8‐17 (PSP Table 14).
Table 8-15. SWP / CVP Supply Benefits Associated with OMR Regulation
CCWD Old River Pumping Jan – Jun [AF/yr]
CCWD Middle River Pumping Jan – Jun [AF/yr]
Total CCWD Pumping Jan – Jun [AF/yr]
Without Project 17,578 7,605 25,183
With Project 14,044 5,431 19,475
CVP/SWP Supply Benefit During OMR Restrictions 3,534 2,174 5,708
WQ1: Reduced Levels of DBPs in Drinking Water
The primary water quality benefit expected from this Project is a reduction in disinfection byproduct formation, and associated public health protection. Implementing the Project will reduce bromide concentrations at PP1 by 15% on average. Figure # below shows the increase in bromide concentration that occurs as water travels down the unlined canal; this increase in bromide concentration is due to groundwater intrusion. Groundwater beneath the Ironhouse Sanitary District (ISD) properties immediately adjacent to Segment 1 of the Canal has bromide concentrations regularly exceeding 5 mg/L7; over ten times the concentration measured in surface water. Similarly, the bromide concentration on the Dutch Slough Properties adjacent to Segments 2 through 4 of the Canal can be
6 http://www.mwdh2o.com/mwdh2o/pages/finance/finance_03.html 7 Beneficial Use Impact Study, Final Report Ironhouse Sanitary District, Oakley, California. Prepared by HydroFocus. December 2003

Attachment 8 Benefits and Costs
Contra Costa Water District – Round 2 Stormwater Flood Management Grant Proposal 8‐29 Att8_SWF_BenCost_1of1
greater than 3 mg/L.8 The lower panel of Figure # below shows that by implementing the Project, bromide concentrations could be reduced between 0% and 60%, with an annual average reduction of 15%.
Figure 8‐4: Influence of Groundwater on Canal Bromide Concentrations
Bromide in the source water is transformed into bromate during ozonation at CCWD’s Randall Bold Treatment Plant. Bromate is suspected of contributing to kidney and thyroid cancer in humans. The state and federal MCL for bromate is 10 µg/L. Bromate concentration in CCWD service area has exceeded 10 µg/L in the past, with a maximum of 12 µg/L recorded in 2005. Since 2008, Segment 1 of the Project was implemented limiting the groundwater flux of bromide from ISD’s property and the treatment process at Randall Bold Water Treatment Plant was modified to limit bromate concentrations in the service area to less than 5 µg/L. As bromate is presumed to have a linear no‐threshold dose‐response relationship, the only risk‐free level of exposure to bromate is zero. Thus, any Project that reduces the potential level of bromate in drinking water provides a positive reduction in risk of cancer to those who drink that water (US EPA, 2003). The bromate model of Ozekin and Amy2 determines bromate formation based on ozone dose, bromide, DOC, and pH as follows:9
BrO3 = 1.63 x 10‐6 * TOC‐1.26 * pH5.82 * (O3 dose) 1.57 *Br0.73 * time0.28
8 Dutch Slough Restoration Area First and Second Quarters 2012. Semi Annual Groundwater Monitoring Report. Prepared by HydroFocus October 2012. 9 Amy, G.L., M. Siddiqui, K. Ozekin, H.W. Zhu, and C. Wang, (1998). Empirically Based Models for Predicting Chlorination and Ozonation By‐Product: Haloacetic Acids, Chloral Hydrate, and Bromate. EPA Report CX 819579. USEPA Office of Groundwater and Drinking Water: Cincinnati, OH, 1998.
Attachment 8 Benefits and Costs
Contra Costa Water District – Round 2 Stormwater Flood Management Grant Proposal 8‐30 Att8_SWF_BenCost_1of1
with BrO3 in ug/L, TOC in mg/L, O3 in mg/L, Br in ug/L, and contact time in minutes. The 2005 CALFED Bay Area Water Quality and Supply Reliability Program (BAWQ&SRP) assessed bromate formation at CCWD’s water treatment plants.10 Page C‐29 of the BAWQ&SRP report presents long‐term average water quality concentrations for CCWD source water at Rock Slough. Long‐term average TOC and bromide concentrations presented in this report are approximately 3.0 mg/L and 0.35 mg/L, respectively. Based on conversations with CCWD staff, long‐term average pH in water treatment plant influent is approximately 7.2. The BAWQ&SRP also estimated water treatment conditions at Randall Bold water treatment plant. Based on this report (page D‐13), ozone dose is approximately 1 mg/L and contact time is approximately 11 min. Bromate production would therefore be calculated as 5.6 ug/L as follows:
BrO3 = 1.63 x 10‐6 * (3.0 mg/L TOC)‐1.26 * (pH of 7.2) 5.82 * (O3 dose of 1 mg/L) 1.57 *(Br of 350 ug/L)0.73 *
(11 min)0.28 Reducing bromide by 15% would reduce bromate formation to 4.99 ug/L, or a 11.2% percent reduction, as follows:
BrO3 = 1.63 x 10‐6 * (3.0 mg/L TOC)‐1.26 * (pH of 7.2) 5.82 * (O3 dose of 1 mg/L) 1.57 *(Br of 350 * 0.85 ug/L)0.73 * (11 min)0.28
The drinking water unit cancer risk for bromate is equal to 2 * 10‐5 per µg/L; for water at the MCL concentration of 10 µg/L, this corresponds to 2 in 10,000, or 2 x 10‐4 per ug/L (US EPA, 2011). The relationship between bromate risk and concentration is linear, so risk at 5.6 ug/L (as calculated above) equals 56% of the risk at the MCL, or 1.1 x 10‐4 per ug/L. Multiplying this risk level by the number of households served (178,571) and the average number of people per household in the area (3.1) provides the estimate of the excess lifetime cancer cases expected under baseline: 61. This Project will reduce bromide levels by approximately 11.2% on average to 4.99 ug/L. This corresponds to an excess lifetime cancer cases expected under the with‐Project condition of 54 (0.98 * 10‐4 * 178,571 * 3.1). This translates to a reduction in excess lifetime cancer cases of 7 fewer cancer cases per 70‐year lifetime compared to baseline, or an average of 0.1 cases avoided each year. In its Stage 2 Disinfectant and Disinfectant By‐Products Rule, the U.S. EPA estimates the value of a statistical life (VSL) at approximately $7.1 million, adjusted to 2005 dollars. More recently, EPA has updated its best estimate for VSL to $7.0 million (in 2006 dollars, but based on projected 2010 income levels) (US EPA 2008). Here we use the $7.0 million VSL figure as a reasonable approximation for 2012 dollars. The VSL estimates are based on meta‐analyses of the “wage‐risk” literature, which involves estimating the tradeoff individuals are willing to pay between risk and higher income based on salary differentials between occupations with differing risk levels. Based on the excess cancer cases avoided for this Project and the U.S. EPA‐sanctioned estimate of the value of a statistical life, this Project would provide approximately $700,000 in benefits from avoided cancer cases annually (0.1 cancer cases avoided per year, times $7 million per avoided cancer case). As shown in Table 8‐17 (PSP Table 14), the present value of this benefit amounts to $8.7 million for the entire Project. Assigning the 21 percent share of the total benefit attributable to the portion of the pipeline project covered by this specific component of the overall Project, the present value benefits amount to roughly $1.8 million.
10 Bay Area Water Quality & Supply Reliability Program. CALFED Bay Delta Program. May 2005.
Attachment 8 Benefits and Costs
Contra Costa Water District – Round 2 Stormwater Flood Management Grant Proposal 8‐31 Att8_SWF_BenCost_1of1
WQ2: Decreased Agricultural Runoff from Adjacent Fields
This benefit has not been monetized.
WQ3: Decreased Risk in Fecal Borne Pathogens Transported into the Canal
This benefit has not been monetized.
WQ4: Decreased Turbidity and Associated Solids Handling Requirements
As discussed in Attachment 7, implementing the Project would result in an approximately four‐fold reduction in turbidity during the beginning of rain events and the beginning of irrigation return flow, approximately 14 days per year. Turbidity accounts for roughly 25% of the solid waste that must disposed. Assuming that turbidity during those 14 days accounts for approximately 4 percent of the total solids attributable to turbidity (14/365), turbidity during those 14 days would account for approximately one percent of CCWD’s total solids handling (0.04*0.25). A four‐fold reduction in turbidity during those 14 days would therefore result in an overall 0.8 percent reduction in total solids handling requirements for CCWD (0.01*0.8). CCWD’s annual solids management budget is approximately $600,000. This would equate to an annual solids handling savings of $4,800/year.
ENV1: Enabled Completion of Dutch Slough Tidal Marsh Restoration Project
Encasing the unlined Canal is a critical step for the completion of DWR’s Dutch Slough Tidal Marsh Restoration Project, a tidal wetland restoration site just north of the Canal. DWR’s Dutch Slough Tidal Marsh Restoration Project cannot move forward as planned until the Canal is replaced by a pipeline through this area. As specified in Mitigation term 3.1.1‐5 of the Dutch Slough EIR Mitigation Monitoring and Reporting Program, “To avoid potential negative impacts to water quality within the Canal from groundwater intrusion, breaching of the Dutch Slough project site will not commence until encasement of the Canal south of the site is complete.”
DWR’s Dutch Slough Tidal Marsh Restoration Project, in the City of Oakley, is situated at a location and elevation which offer the only opportunity for an immediate and major tidal marsh restoration and research program in the western Delta. The 1,200 acre site is currently is the process of restoring over six miles of shoreline and a mosaic of tidal, riparian, and upland habitats. The resulting restored habitats will provide enhanced western Delta habitat for fish and wildlife. The unique site topography which is relatively unsubsided provides for immediate restoration of intertidal dendritic channels favored by native fish including threatened spring run Chinook salmon, endangered winter run Chinook salmon, and Sacramento splittail. The habitat restoration in the upland sites will allow for the development of riparian forest and shaded riverine habitats.
DWR’s Dutch Slough Tidal Marsh Restoration Project is expected to provide important benefits to the larger Delta ecosystem. Numerous planning processes, including the Delta Vision Strategic Plan, the CALFED Ecosystem Restoration Plan, and the Bay Delta Conservation Plan, have identified restoring tidal marsh as integral to restoring the health of the Bay‐Delta Ecosystem.
It has been assumed that the full value of the Dutch Slough Project will be realized approximately five years following completion of the pipeline, or in 2023. Wetland establishment/creation has ia very high value given the difficulties of gaining regulatory approval for wetland development and the shortage of available wetlands on the open market. The market value of wetland establishment/creation is increasing over time. CCWD has evidence to support a trend towards higher values for any wetlands that can be established and created based its own experience with purchasing wetlands to mitigate for project impacts.
Attachment 8 Benefits and Costs
Contra Costa Water District – Round 2 Stormwater Flood Management Grant Proposal 8‐32 Att8_SWF_BenCost_1of1
In 2007, CCWD entered into an agreement with Wildlands Inc. to pay $60,000 per acre for seasonal wetland establishment/creation at the Holland Tract Preserve. CCWD obtained 48.6 wetland acres at the Holland Tract Preserve to mitigate for impacts from filling in the open Canal and replacing it with a pipeline as well as impacts from constructing a new intake along Victoria Canal. In 2010, CCWD entered an agreement with Wildlands Inc to pay $74,500 per acre for establishment of tidal wetlands at Liberty Island. The East Contra Costa County Habitat Conservancy (ECCHCP) recommended wetland price in 2013 is $299,000 per wetland impact acre. In July of 2011 the ECCHCP evaluated wetland creation costs and advised that wetland development was costing between $345,000 to $755,000 per acre.11
Starting in 2012, CCWD sought to obtain wetlands credits from the ECCHCP to mitigate for wetland impacts associated with road construction along the Shortcut Pipeline (SCPL) Improvement Project in central Contra Costa County. The ECCHCP advised that they do not have sufficient wetlands within their program to support CCWD SCPL wetland requirements (impacts are estimated at approximately 1.23 acres and mitigation may be up to 3.11 acres to cover permanent and temporary wetland impacts).
CCWD has subsequently been seeking to obtain wetlands that can be applied to its SCPL Improvement Project. CCWD has been quoted prices varying from $800,000 (San Francisco District Wetland Mitigation Bank) to $500,000 (Newark Slough Wetland Mitigation Bank, not yet constructed). The $500,000 per acre price quoted by the Newark Slough Wetland Mitigation Bank is discounted from the expected asking price of $650,000 per acre. CCWD is currently working a turnkey mitigation site near Rheem Creek within the City of Richmond. The estimated cost of wetland developed at this location is approximately $363,000 per acre, assuming that 4.82 acre site of wetlands are are developed on the ten acre propoerty at one time. Price quotes from other wetland providers that could not be used by the District varied from $100,000 (Wildlands, Rivers Ranch in Yolo County, limited acreage available) to $200,000 (Elsie Gridely, Solano County and Grizzly Bay, Solano County) per acre.
Tidal wetland mitigation lands are in very limited supply and can cost up to $800,000 per acre. Within the ECCHCP the area where the Dutch Slough Tidal Wetlands are located the ECCHCP charges $299,000 per acre for seasonal wetlands. Assuming this is a reasonable market value for the Dutch Slough Wetlands, then by allowing the Canal to move forward this supports DWR creating 1,200 acres of wetlands with a market value of approximately $359 million.
To be conservative, we have assumed the value of the completed Dutch Slough Project will be on the order of $359 M ($1200 acres * $299,000 per acre), and that this benefit would be realized in 2023 (five years after the Canal is placed within a pipeline). Without available funding to support replacement of the unlined Canal, the Dutch Slough Project would face substantial delays. It is assumed that, without expeditious completion of the proposed Project, the Dutch Slough project would not be implemented until 203312, which represents a ten‐year delay. Preventing a ten‐year delay in implementation of the Dutch Slough Project would translates to a net present value of $83,468,405 ($189,011,364‐$105,542,958). The portion of this benefit that can be attributed to completion of the proposed Project is $17,528,365 (21 percent).
11 July 15, 2011, Economic & Planning Systems, Inc. East Contra Costa County HCP/NCCP 2011 Mitigation Fee Update: Additional
Information;EPS# 20149 12 CCWD assumes that the Canal must be replaced before DWR implements the Tidal Restoration Project. Proposition 1E Round 2 is the last
known grant funding opportunity that CCWD is aware of that is of sufficient size to allow the District to fully pipe the area adjacent to the Dutch Slough Tidal Restoration Project. It is assumed that if CCWD does not obtain Proposition 1E Round 2 grant funding to support work adjacent to the Dutch Slough Tidal Restoration Project, the Dutch Slough Tidal Marsh Restoration would be delayed from 2018 to 2028 (ten years) and the new Dutch Slough wetlands would not be successfully completed until 2033.

Attachment 8 Benefits and Costs
Contra Costa Water District – Round 2 Stormwater Flood Management Grant Proposal 8‐33 Att8_SWF_BenCost_1of1
ENV2: Reduction in Herbicide Treatment of Unlined Canal
An additional annual operating cost that would be avoided with this Project is the elimination of the need to use aquatic pesticides. Further, with the Project, CCWD will avoid the need for future consultation with the Bureau of Reclamation, US Fish and Wildlife Service, National Marine Fisheries Service, and the Department of Fish and Game to obtain approval to use aquatic pesticides. These costs would be eliminated with Project implementation.
The reduction in maintenance costs is estimated to be $360,000 / year, and includes the following activities.
CCWD labor and contractor costs involved in the herbicide treatment include:
Contractor to apply Sonar
CCWD Maintenance staff to facilitate contractor field work (provide access, install stoplogs)
CCWD Operations divert water from more expensive sources for the 2 months required for treatment (Canal is not used during treatment).
CCWD Water Quality staff to regularly sample and analyze water quality
CCWD Planning staff to report on permitted activity This benefit has a present value of approximately $4.5 million over the life of the Project. The portion attributable to this Project (21%) is approximately $939,000.
ERG1: Energy Reduction
CCWD estimates that the energy savings derived from pipeline‐related improvements to water quality will amount to over 490 MWH per year. This reduction in power usage translates to an annual cost savings of $98,000 per year for the full Project. This equates to a present value of approximately $1.2 million, as shown in Table 8‐17 (PSP Table 14). The portion of benefits attributable to this Project is approximately $260,000.
Table 8-16. Annual Energy Savings with Project
Total Power Use MWh/yr
Annual Power Cost
$/yr
Without Encasement 37,796 $4,551,014
With Encasement 37,306 $4,452,952
Energy and Cost Savings 490 $98,062
In addition to the cost savings of reducing power usage, energy savings is associated with a reduction in CO2 emissions of 460 thousand pounds per year. Over the 100‐year life of the pipeline, this amounts to a reduction in the CCWD carbon footprint of nearly 50,000 metric tons. Over 10,300 of these metric tons of reduced carbon emissions (41.7 percent) can be attributed to the portion of the pipeline addressed by this specific Project. No monetized values are associated with this reduction in CCWD’s carbon footprint.
ERG2: Greenhouse Gas Emission Reduction
This benefit has not been monetized.
Attachment 8 Benefits and Costs
Contra Costa Water District – Round 2 Stormwater Flood Management Grant Proposal 8‐34 Att8_SWF_BenCost_1of1
OTH1: Reduced Security Risk
Currently, the open Canal presents a risk for drowning or other accidents. This is of particular concern because the area is being developed rapidly for residential use, with up to 8,000 homes planned for the area and 25,000 residents. Enclosing the Canal will completely eliminate this risk.
According to CCWD’s records, there have been a total of 70 drownings in the Canal since 1942 (70 drownings over 69 years). The accuracy of older records is uncertain, but records kept since 1972 indicate a total of at least 24 drownings have occurred in recent history (24 drownings over 39 years). This past history indicates a risk of at least 24 fatalities in 39 years, and possibly as many as 70 fatalities in 69 years. To be conservative, we have applied an average risk of 62 percent (24 / 39) that a drowning will occur in any given year. Enclosing the Canal in a pipeline will eliminate this risk. Applying the generally accepted USEPA estimate of $7 million per VSL as the value of reducing risks of premature death, the annual risk reduction benefit of the Project amounts to $4.3 M per year (0.62 times $7 million).
As shown in Table 8‐17 (PSP Table 14), the present value of this benefit amounts to $53.9 million for the entire Project. Assigning the 21% percent share of these total benefits that are attributable to the portion of the full Project covered by this specific component, the present value benefits amount to about $11.1 million.
In addition, the open Canal is highly vulnerable to intentional and unintentional contamination, and poses a security risk to the utility, its customers, and adjacent residents. This vulnerability is likely to increase as development increases in the area. Enclosing the Canal will eliminate this security risk. No monetary value has been assigned to the reduced security risk.
In addition, the open Canal presents a security risk. To offset this risk, CCWD currently patrols the Canal. Replacing the open Canal with a pipeline will greatly reduce the need to patrol the Canal. CCWD estimates an annual benefit of $129,000 in reduced costs to patrol the open Canal. Over the life of the Project, this amounts to $1.6 million (21%, or $336,000, attributed to the proposed Project).
Summary of Other Monetized Benefits
Table 8‐17 (PSP Table 14) summarizes annual benefits monetized in this section. As shown in this Table, the total present value of benefits identified in this section is $315.3 million. The portion of benefits attributable to this segment of the Canal is approximately $66.2 million (21%).

Attachment 8 Benefits and Costs
Contra Costa Water District – Round 2 Stormwater Flood Management Grant Proposal 8‐35 Att8_SWF_BenCost_1of1
Table 8-17 (PSP Table 14). Present Value of Other Monetized Benefits
Table 14 – Annual Benefit (All benefits should be in 2012 dollars)
Project: Contra Costa Canal Levee Elimination and Flood Protection Project
Year Type of Benefit Measure of Benefit
Without Project
With Project
Change due to Project
Unit $ Value Annual $ Value Disc. Factor
Discounted Benefits
2018 Emergency Supply AFY 0 400 400 $1,648 $659,200 0.705 $464,710
Avoided SWP and CVP salinity releases
AFY 0 17000 17000 $754 $12,818,000 0.705 $9,036,184
Avoided SWP and CVP OMR releases
AFY 0 5708 5708 $743 $4,241,044 0.705 $2,989,769
Reduced drownings Drownings 0.62 0 0.62 $7,000,000 $4,340,000 0.705 $3,059,529
Energy savings Dollars 98,062 0 98,062 $1 $98,062 0.705 $69,130
Bromate cancer reduction
Excess cancer / yr
0.87 0.77 0.10 $7,000,000 $700,000 0.705 $493,472
Canal Maintenance Savings
Dollars $360,000 $0 $360,000 $1 $360,000 0.705 $253,786
Avoided Patrolling Dollars $129,000 $0 $129,000 $1 $129,000 0.705 $90,940
Reduced Solids Handling
Percent 1.000 0.992 0.008 $600,000 $4,800 0.705 $3,384
2019 Emergency Supply AFY 0 400 400 $1,648 $659,200 0.665 $438,406
Avoided SWP and CVP salinity releases
AFY 0 17000 17000 $754 $12,818,000 0.665 $8,524,702
Avoided SWP and CVP OMR releases
AFY 0 5708 5708 $743 $4,241,044 0.665 $2,820,536
Reduced drownings Drownings 0.62 0 0.62 $7,000,000 $4,340,000 0.665 $2,886,348
Energy savings Dollars 98,062 0 98,062 $1 $98,062 0.665 $65,217
Bromate cancer reduction
Excess cancer / yr
0.87 0.77 0.10 $7,000,000 $700,000 0.665 $465,540
Canal Maintenance Savings
Dollars $360,000 $0 $360,000 $1 $360,000 0.665 $239,421
Avoided Patrolling Dollars $129,000 $0 $129,000 $1 $129,000 0.665 $85,792
Reduced Solids Handling
Percent 1.000 0.992 0.008 $600,000 $4,800 0.665 $3,192
2020 Emergency Supply AFY 0 400 400 $1,648 $659,200 0.627 $413,590
Avoided SWP and CVP salinity releases
AFY 0 17000 17000 $754 $12,818,000 0.627 $8,042,172
Avoided SWP and CVP OMR releases
AFY 0 5708 5708 $743 $4,241,044 0.627 $2,660,883
Reduced drownings Drownings 0.62 0 0.62 $7,000,000 $4,340,000 0.627 $2,722,970
Energy savings Dollars 98,062 0 98,062 $1 $98,062 0.627 $61,525
Bromate cancer reduction
Excess cancer / yr
0.87 0.77 0.10 $7,000,000 $700,000 0.627 $439,189
Canal Maintenance Savings
Dollars $360,000 $0 $360,000 $1 $360,000 0.627 $225,868
Avoided Patrolling Dollars $129,000 $0 $129,000 $1 $129,000 0.627 $80,936
Reduced Solids Handling
Percent 1.000 0.992 0.008 $600,000 $4,800 0.627 $3,012
Attachment 8 Benefits and Costs
Contra Costa Water District – Round 2 Stormwater Flood Management Grant Proposal 8‐36 Att8_SWF_BenCost_1of1
Table 14 – Annual Benefit (All benefits should be in 2012 dollars)
Project: Contra Costa Canal Levee Elimination and Flood Protection Project
Year Type of Benefit Measure of Benefit
Without Project
With Project
Change due to Project
Unit $ Value Annual $ Value Disc. Factor
Discounted Benefits
2021 Emergency Supply AFY 0 400 400 $1,648 $659,200 0.592 $390,179
Avoided SWP and CVP salinity releases
AFY 0 17000 17000 $754 $12,818,000 0.592 $7,586,955
Avoided SWP and CVP OMR releases
AFY 0 5708 5708 $743 $4,241,044 0.592 $2,510,267
Reduced drownings Drownings 0.62 0 0.62 $7,000,000 $4,340,000 0.592 $2,568,839
Energy savings Dollars 98,062 0 98,062 $1 $98,062 0.592 $58,043
Bromate cancer reduction
Excess cancer / yr
0.87 0.77 0.10 $7,000,000 $700,000 0.592 $414,329
Canal Maintenance Savings
Dollars $360,000 $0 $360,000 $1 $360,000 0.592 $213,083
Avoided Patrolling Dollars $129,000 $0 $129,000 $1 $129,000 0.592 $76,355
Reduced Solids Handling
Percent 1.000 0.992 0.008 $600,000 $4,800 0.592 $2,841
2022 Emergency Supply AFY 0 400 400 $1,648 $659,200 0.558 $368,094
Avoided SWP and CVP salinity releases
AFY 0 17000 17000 $754 $12,818,000 0.558 $7,157,504
Avoided SWP and CVP OMR releases
AFY 0 5708 5708 $743 $4,241,044 0.558 $2,368,177
Reduced drownings Drownings 0.62 0 0.62 $7,000,000 $4,340,000 0.558 $2,423,433
Energy savings Dollars 98,062 0 98,062 $1 $98,062 0.558 $54,757
Bromate cancer reduction
Excess cancer / yr
0.87 0.77 0.10 $7,000,000 $700,000 0.558 $390,876
Canal Maintenance Savings
Dollars $360,000 $0 $360,000 $1 $360,000 0.558 $201,022
Avoided Patrolling Dollars $129,000 $0 $129,000 $1 $129,000 0.558 $72,033
Reduced Solids Handling
Percent 1.000 0.992 0.008 $600,000 $4,800 0.558 $2,680
2023 Emergency Supply AFY 0 400 400 $1,648 $659,200 0.527 $347,258
Avoided SWP and CVP salinity releases
AFY 0 17000 17000 $754 $12,818,000 0.527 $6,752,363
Avoided SWP and CVP OMR releases
AFY 0 5708 5708 $743 $4,241,044 0.527 $2,234,129
Reduced drownings Drownings 0.62 0 0.62 $7,000,000 $4,340,000 0.527 $2,286,258
Energy savings Dollars 98,062 0 98,062 $1 $98,062 0.527 $51,658
Bromate cancer reduction
Excess cancer / yr
0.87 0.77 0.10 $7,000,000 $700,000 0.527 $368,751
Canal Maintenance Savings
Dollars $360,000 $0 $360,000 $1 $360,000 0.527 $189,644
Avoided Patrolling Dollars $129,000 $0 $129,000 $1 $129,000 0.527 $67,956
Accelerated Dutch Slough Project Implementation
Wetland Acres
0 1,200 1,200 $299,000 $358,800,000 0.527 $189,011,364
Reduced Solids Percent 1.000 0.992 0.008 $600,000 $4,800 0.527 $2,529
Attachment 8 Benefits and Costs
Contra Costa Water District – Round 2 Stormwater Flood Management Grant Proposal 8‐37 Att8_SWF_BenCost_1of1
Table 14 – Annual Benefit (All benefits should be in 2012 dollars)
Project: Contra Costa Canal Levee Elimination and Flood Protection Project
Year Type of Benefit Measure of Benefit
Without Project
With Project
Change due to Project
Unit $ Value Annual $ Value Disc. Factor
Discounted Benefits
Handling
2024 Emergency Supply AFY 0 400 400 $1,648 $659,200 0.497 $327,602
Avoided SWP and CVP salinity releases
AFY 0 17000 17000 $754 $12,818,000 0.497 $6,370,153
Avoided SWP and CVP OMR releases
AFY 0 5708 5708 $743 $4,241,044 0.497 $2,107,669
Reduced drownings Drownings 0.62 0 0.62 $7,000,000 $4,340,000 0.497 $2,156,847
Energy savings Dollars 98,062 0 98,062 $1 $98,062 0.497 $48,734
Bromate cancer reduction
Excess cancer / yr
0.87 0.77 0.10 $7,000,000 $700,000 0.497 $347,879
Canal Maintenance Savings
Dollars $360,000 $0 $360,000 $1 $360,000 0.497 $178,909
Avoided Patrolling Dollars $129,000 $0 $129,000 $1 $129,000 0.497 $64,109
Reduced Solids Handling
Percent 1.000 0.992 0.008 $600,000 $4,800 0.497 $2,385
2025 Emergency Supply AFY 0 400 400 $1,648 $659,200 0.469 $309,059
Avoided SWP and CVP salinity releases
AFY 0 17000 17000 $754 $12,818,000 0.469 $6,009,579
Avoided SWP and CVP OMR releases
AFY 0 5708 5708 $743 $4,241,044 0.469 $1,988,367
Reduced drownings Drownings 0.62 0 0.62 $7,000,000 $4,340,000 0.469 $2,034,761
Energy savings Dollars 98,062 0 98,062 $1 $98,062 0.469 $45,975
Bromate cancer reduction
Excess cancer / yr
0.87 0.77 0.10 $7,000,000 $700,000 0.469 $328,187
Canal Maintenance Savings
Dollars $360,000 $0 $360,000 $1 $360,000 0.469 $168,782
Avoided Patrolling Dollars $129,000 $0 $129,000 $1 $129,000 0.469 $60,480
Reduced Solids Handling
Percent 1.000 0.992 0.008 $600,000 $4,800 0.469 $2,250
2026 Emergency Supply AFY 0 400 400 $1,648 $659,200 0.442 $291,565
Avoided SWP and CVP salinity releases
AFY 0 17000 17000 $754 $12,818,000 0.442 $5,669,414
Avoided SWP and CVP OMR releases
AFY 0 5708 5708 $743 $4,241,044 0.442 $1,875,818
Reduced drownings Drownings 0.62 0 0.62 $7,000,000 $4,340,000 0.442 $1,919,586
Energy savings Dollars 98,062 0 98,062 $1 $98,062 0.442 $43,373
Bromate cancer reduction
Excess cancer / yr
0.87 0.77 0.10 $7,000,000 $700,000 0.442 $309,611
Canal Maintenance Savings
Dollars $360,000 $0 $360,000 $1 $360,000 0.442 $159,228
Avoided Patrolling Dollars $129,000 $0 $129,000 $1 $129,000 0.442 $57,057
Reduced Solids Handling
Percent 1.000 0.992 0.008 $600,000 $4,800 0.442 $2,123
2027 Emergency Supply AFY 0 400 400 $1,648 $659,200 0.417 $275,061
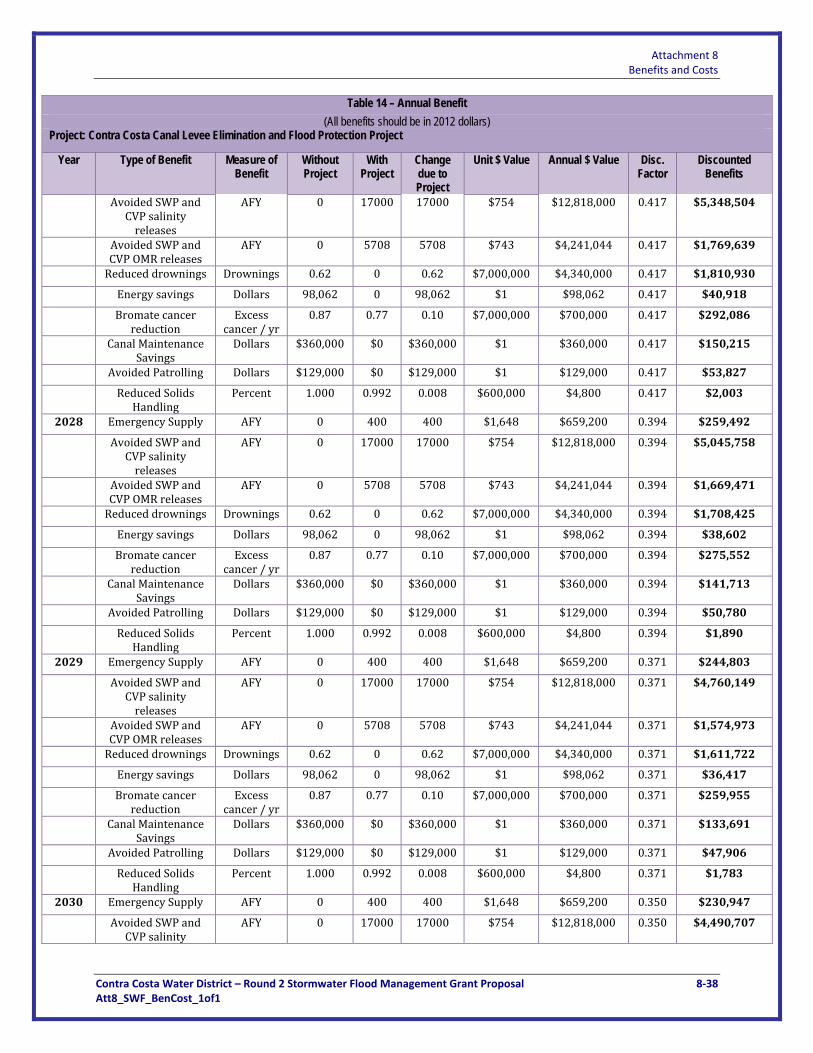
Attachment 8 Benefits and Costs
Contra Costa Water District – Round 2 Stormwater Flood Management Grant Proposal 8‐38 Att8_SWF_BenCost_1of1
Table 14 – Annual Benefit (All benefits should be in 2012 dollars)
Project: Contra Costa Canal Levee Elimination and Flood Protection Project
Year Type of Benefit Measure of Benefit
Without Project
With Project
Change due to Project
Unit $ Value Annual $ Value Disc. Factor
Discounted Benefits
Avoided SWP and CVP salinity releases
AFY 0 17000 17000 $754 $12,818,000 0.417 $5,348,504
Avoided SWP and CVP OMR releases
AFY 0 5708 5708 $743 $4,241,044 0.417 $1,769,639
Reduced drownings Drownings 0.62 0 0.62 $7,000,000 $4,340,000 0.417 $1,810,930
Energy savings Dollars 98,062 0 98,062 $1 $98,062 0.417 $40,918
Bromate cancer reduction
Excess cancer / yr
0.87 0.77 0.10 $7,000,000 $700,000 0.417 $292,086
Canal Maintenance Savings
Dollars $360,000 $0 $360,000 $1 $360,000 0.417 $150,215
Avoided Patrolling Dollars $129,000 $0 $129,000 $1 $129,000 0.417 $53,827
Reduced Solids Handling
Percent 1.000 0.992 0.008 $600,000 $4,800 0.417 $2,003
2028 Emergency Supply AFY 0 400 400 $1,648 $659,200 0.394 $259,492
Avoided SWP and CVP salinity releases
AFY 0 17000 17000 $754 $12,818,000 0.394 $5,045,758
Avoided SWP and CVP OMR releases
AFY 0 5708 5708 $743 $4,241,044 0.394 $1,669,471
Reduced drownings Drownings 0.62 0 0.62 $7,000,000 $4,340,000 0.394 $1,708,425
Energy savings Dollars 98,062 0 98,062 $1 $98,062 0.394 $38,602
Bromate cancer reduction
Excess cancer / yr
0.87 0.77 0.10 $7,000,000 $700,000 0.394 $275,552
Canal Maintenance Savings
Dollars $360,000 $0 $360,000 $1 $360,000 0.394 $141,713
Avoided Patrolling Dollars $129,000 $0 $129,000 $1 $129,000 0.394 $50,780
Reduced Solids Handling
Percent 1.000 0.992 0.008 $600,000 $4,800 0.394 $1,890
2029 Emergency Supply AFY 0 400 400 $1,648 $659,200 0.371 $244,803
Avoided SWP and CVP salinity releases
AFY 0 17000 17000 $754 $12,818,000 0.371 $4,760,149
Avoided SWP and CVP OMR releases
AFY 0 5708 5708 $743 $4,241,044 0.371 $1,574,973
Reduced drownings Drownings 0.62 0 0.62 $7,000,000 $4,340,000 0.371 $1,611,722
Energy savings Dollars 98,062 0 98,062 $1 $98,062 0.371 $36,417
Bromate cancer reduction
Excess cancer / yr
0.87 0.77 0.10 $7,000,000 $700,000 0.371 $259,955
Canal Maintenance Savings
Dollars $360,000 $0 $360,000 $1 $360,000 0.371 $133,691
Avoided Patrolling Dollars $129,000 $0 $129,000 $1 $129,000 0.371 $47,906
Reduced Solids Handling
Percent 1.000 0.992 0.008 $600,000 $4,800 0.371 $1,783
2030 Emergency Supply AFY 0 400 400 $1,648 $659,200 0.350 $230,947
Avoided SWP and CVP salinity
AFY 0 17000 17000 $754 $12,818,000 0.350 $4,490,707
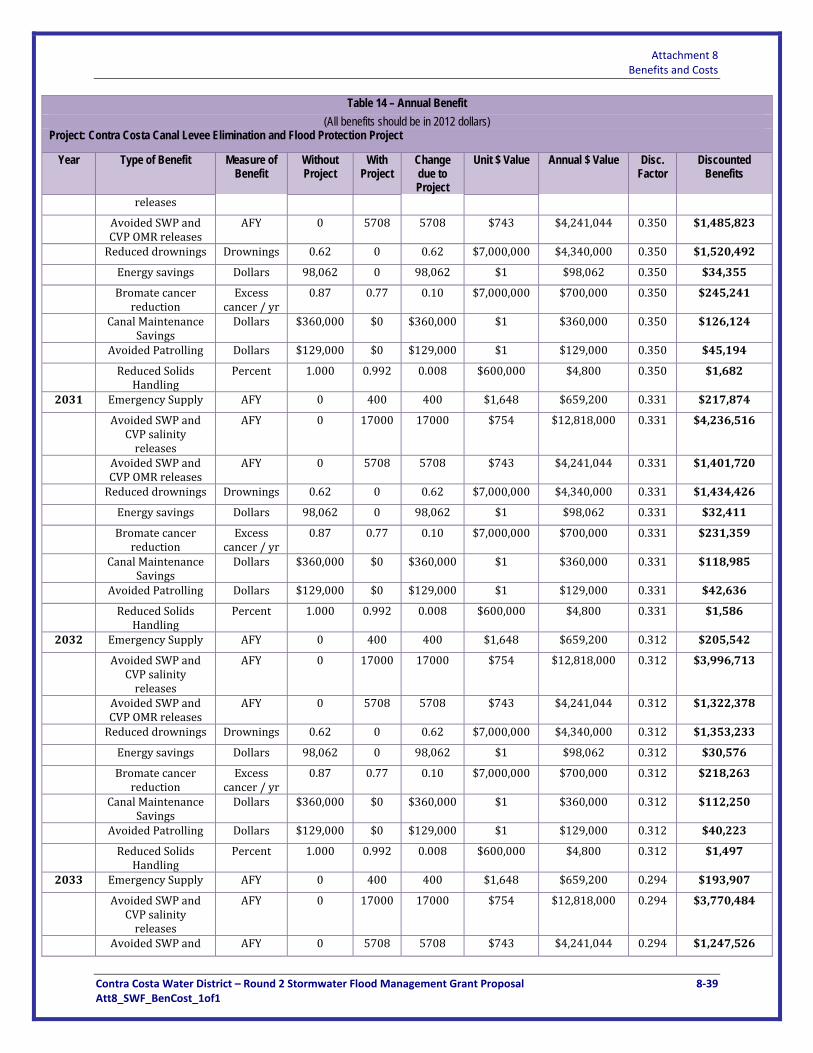
Attachment 8 Benefits and Costs
Contra Costa Water District – Round 2 Stormwater Flood Management Grant Proposal 8‐39 Att8_SWF_BenCost_1of1
Table 14 – Annual Benefit (All benefits should be in 2012 dollars)
Project: Contra Costa Canal Levee Elimination and Flood Protection Project
Year Type of Benefit Measure of Benefit
Without Project
With Project
Change due to Project
Unit $ Value Annual $ Value Disc. Factor
Discounted Benefits
releases
Avoided SWP and CVP OMR releases
AFY 0 5708 5708 $743 $4,241,044 0.350 $1,485,823
Reduced drownings Drownings 0.62 0 0.62 $7,000,000 $4,340,000 0.350 $1,520,492
Energy savings Dollars 98,062 0 98,062 $1 $98,062 0.350 $34,355
Bromate cancer reduction
Excess cancer / yr
0.87 0.77 0.10 $7,000,000 $700,000 0.350 $245,241
Canal Maintenance Savings
Dollars $360,000 $0 $360,000 $1 $360,000 0.350 $126,124
Avoided Patrolling Dollars $129,000 $0 $129,000 $1 $129,000 0.350 $45,194
Reduced Solids Handling
Percent 1.000 0.992 0.008 $600,000 $4,800 0.350 $1,682
2031 Emergency Supply AFY 0 400 400 $1,648 $659,200 0.331 $217,874
Avoided SWP and CVP salinity releases
AFY 0 17000 17000 $754 $12,818,000 0.331 $4,236,516
Avoided SWP and CVP OMR releases
AFY 0 5708 5708 $743 $4,241,044 0.331 $1,401,720
Reduced drownings Drownings 0.62 0 0.62 $7,000,000 $4,340,000 0.331 $1,434,426
Energy savings Dollars 98,062 0 98,062 $1 $98,062 0.331 $32,411
Bromate cancer reduction
Excess cancer / yr
0.87 0.77 0.10 $7,000,000 $700,000 0.331 $231,359
Canal Maintenance Savings
Dollars $360,000 $0 $360,000 $1 $360,000 0.331 $118,985
Avoided Patrolling Dollars $129,000 $0 $129,000 $1 $129,000 0.331 $42,636
Reduced Solids Handling
Percent 1.000 0.992 0.008 $600,000 $4,800 0.331 $1,586
2032 Emergency Supply AFY 0 400 400 $1,648 $659,200 0.312 $205,542
Avoided SWP and CVP salinity releases
AFY 0 17000 17000 $754 $12,818,000 0.312 $3,996,713
Avoided SWP and CVP OMR releases
AFY 0 5708 5708 $743 $4,241,044 0.312 $1,322,378
Reduced drownings Drownings 0.62 0 0.62 $7,000,000 $4,340,000 0.312 $1,353,233
Energy savings Dollars 98,062 0 98,062 $1 $98,062 0.312 $30,576
Bromate cancer reduction
Excess cancer / yr
0.87 0.77 0.10 $7,000,000 $700,000 0.312 $218,263
Canal Maintenance Savings
Dollars $360,000 $0 $360,000 $1 $360,000 0.312 $112,250
Avoided Patrolling Dollars $129,000 $0 $129,000 $1 $129,000 0.312 $40,223
Reduced Solids Handling
Percent 1.000 0.992 0.008 $600,000 $4,800 0.312 $1,497
2033 Emergency Supply AFY 0 400 400 $1,648 $659,200 0.294 $193,907
Avoided SWP and CVP salinity releases
AFY 0 17000 17000 $754 $12,818,000 0.294 $3,770,484
Avoided SWP and AFY 0 5708 5708 $743 $4,241,044 0.294 $1,247,526

Attachment 8 Benefits and Costs
Contra Costa Water District – Round 2 Stormwater Flood Management Grant Proposal 8‐40 Att8_SWF_BenCost_1of1
Table 14 – Annual Benefit (All benefits should be in 2012 dollars)
Project: Contra Costa Canal Levee Elimination and Flood Protection Project
Year Type of Benefit Measure of Benefit
Without Project
With Project
Change due to Project
Unit $ Value Annual $ Value Disc. Factor
Discounted Benefits
CVP OMR releases
Reduced drownings Drownings 0.62 0 0.62 $7,000,000 $4,340,000 0.294 $1,276,634
Energy savings Dollars 98,062 0 98,062 $1 $98,062 0.294 $28,845
Bromate cancer reduction
Excess cancer / yr
0.87 0.77 0.10 $7,000,000 $700,000 0.294 $205,909
Canal Maintenance Savings
Dollars $360,000 $0 $360,000 $1 $360,000 0.294 $105,896
Avoided Patrolling Dollars $129,000 $0 $129,000 $1 $129,000 0.294 $37,946
Accelerated Dutch Slough Project Implementation
Wetland Acres
1,200 0 (1,200) $299,000 ($358,800,000)
0.294 ($105,542,958)
Reduced Solids Handling
Percent 1.000 0.992 0.008 $600,000 $4,800 0.294 $1,412
2034 Emergency Supply AFY 0 400 400 $1,648 $659,200 0.278 $182,931
Avoided SWP and CVP salinity releases
AFY 0 17000 17000 $754 $12,818,000 0.278 $3,557,060
Avoided SWP and CVP OMR releases
AFY 0 5708 5708 $743 $4,241,044 0.278 $1,176,911
Reduced drownings Drownings 0.62 0 0.62 $7,000,000 $4,340,000 0.278 $1,204,372
Energy savings Dollars 98,062 0 98,062 $1 $98,062 0.278 $27,213
Bromate cancer reduction
Excess cancer / yr
0.87 0.77 0.10 $7,000,000 $700,000 0.278 $194,254
Canal Maintenance Savings
Dollars $360,000 $0 $360,000 $1 $360,000 0.278 $99,902
Avoided Patrolling Dollars $129,000 $0 $129,000 $1 $129,000 0.278 $35,798
Reduced Solids Handling
Percent 1.000 0.992 0.008 $600,000 $4,800 0.278 $1,332
2035 Emergency Supply AFY 0 400 400 $1,648 $659,200 0.262 $172,577
Avoided SWP and CVP salinity releases
AFY 0 17000 17000 $754 $12,818,000 0.262 $3,355,717
Avoided SWP and CVP OMR releases
AFY 0 5708 5708 $743 $4,241,044 0.262 $1,110,294
Reduced drownings Drownings 0.62 0 0.62 $7,000,000 $4,340,000 0.262 $1,136,200
Energy savings Dollars 98,062 0 98,062 $1 $98,062 0.262 $25,672
Bromate cancer reduction
Excess cancer / yr
0.87 0.77 0.10 $7,000,000 $700,000 0.262 $183,258
Canal Maintenance Savings
Dollars $360,000 $0 $360,000 $1 $360,000 0.262 $94,247
Avoided Patrolling Dollars $129,000 $0 $129,000 $1 $129,000 0.262 $33,772
Reduced Solids Handling
Percent 1.000 0.992 0.008 $600,000 $4,800 0.262 $1,257
2036 Emergency Supply AFY 0 400 400 $1,648 $659,200 0.247 $162,808
Avoided SWP and CVP salinity releases
AFY 0 17000 17000 $754 $12,818,000 0.247 $3,165,771

Attachment 8 Benefits and Costs
Contra Costa Water District – Round 2 Stormwater Flood Management Grant Proposal 8‐41 Att8_SWF_BenCost_1of1
Table 14 – Annual Benefit (All benefits should be in 2012 dollars)
Project: Contra Costa Canal Levee Elimination and Flood Protection Project
Year Type of Benefit Measure of Benefit
Without Project
With Project
Change due to Project
Unit $ Value Annual $ Value Disc. Factor
Discounted Benefits
Avoided SWP and CVP OMR releases
AFY 0 5708 5708 $743 $4,241,044 0.247 $1,047,447
Reduced drownings Drownings 0.62 0 0.62 $7,000,000 $4,340,000 0.247 $1,071,887
Energy savings Dollars 98,062 0 98,062 $1 $98,062 0.247 $24,219
Bromate cancer reduction
Excess cancer / yr
0.87 0.77 0.10 $7,000,000 $700,000 0.247 $172,885
Canal Maintenance Savings
Dollars $360,000 $0 $360,000 $1 $360,000 0.247 $88,912
Avoided Patrolling Dollars $129,000 $0 $129,000 $1 $129,000 0.247 $31,860
Reduced Solids Handling
Percent 1.000 0.992 0.008 $600,000 $4,800 0.247 $1,185
2037 Emergency Supply AFY 0 400 400 $1,648 $659,200 0.233 $153,593
Avoided SWP and CVP salinity releases
AFY 0 17000 17000 $754 $12,818,000 0.233 $2,986,576
Avoided SWP and CVP OMR releases
AFY 0 5708 5708 $743 $4,241,044 0.233 $988,157
Reduced drownings Drownings 0.62 0 0.62 $7,000,000 $4,340,000 0.233 $1,011,214
Energy savings Dollars 98,062 0 98,062 $1 $98,062 0.233 $22,848
Bromate cancer reduction
Excess cancer / yr
0.87 0.77 0.10 $7,000,000 $700,000 0.233 $163,099
Canal Maintenance Savings
Dollars $360,000 $0 $360,000 $1 $360,000 0.233 $83,880
Avoided Patrolling Dollars $129,000 $0 $129,000 $1 $129,000 0.233 $30,057
Reduced Solids Handling
Percent 1.000 0.992 0.008 $600,000 $4,800 0.233 $1,118
2038 Emergency Supply AFY 0 400 400 $1,648 $659,200 0.220 $144,899
Avoided SWP and CVP salinity releases
AFY 0 17000 17000 $754 $12,818,000 0.220 $2,817,525
Avoided SWP and CVP OMR releases
AFY 0 5708 5708 $743 $4,241,044 0.220 $932,224
Reduced drownings Drownings 0.62 0 0.62 $7,000,000 $4,340,000 0.220 $953,976
Energy savings Dollars 98,062 0 98,062 $1 $98,062 0.220 $21,555
Bromate cancer reduction
Excess cancer / yr
0.87 0.77 0.10 $7,000,000 $700,000 0.220 $153,867
Canal Maintenance Savings
Dollars $360,000 $0 $360,000 $1 $360,000 0.220 $79,132
Avoided Patrolling Dollars $129,000 $0 $129,000 $1 $129,000 0.220 $28,355
Reduced Solids Handling
Percent 1.000 0.992 0.008 $600,000 $4,800 0.220 $1,055
2039 Emergency Supply AFY 0 400 400 $1,648 $659,200 0.207 $136,697
Avoided SWP and CVP salinity releases
AFY 0 17000 17000 $754 $12,818,000 0.207 $2,658,042
Avoided SWP and CVP OMR releases
AFY 0 5708 5708 $743 $4,241,044 0.207 $879,457

Attachment 8 Benefits and Costs
Contra Costa Water District – Round 2 Stormwater Flood Management Grant Proposal 8‐42 Att8_SWF_BenCost_1of1
Table 14 – Annual Benefit (All benefits should be in 2012 dollars)
Project: Contra Costa Canal Levee Elimination and Flood Protection Project
Year Type of Benefit Measure of Benefit
Without Project
With Project
Change due to Project
Unit $ Value Annual $ Value Disc. Factor
Discounted Benefits
Reduced drownings Drownings 0.62 0 0.62 $7,000,000 $4,340,000 0.207 $899,977
Energy savings Dollars 98,062 0 98,062 $1 $98,062 0.207 $20,335
Bromate cancer reduction
Excess cancer / yr
0.87 0.77 0.10 $7,000,000 $700,000 0.207 $145,158
Canal Maintenance Savings
Dollars $360,000 $0 $360,000 $1 $360,000 0.207 $74,652
Avoided Patrolling Dollars $129,000 $0 $129,000 $1 $129,000 0.207 $26,750
Reduced Solids Handling
Percent 1.000 0.992 0.008 $600,000 $4,800 0.207 $995
2040 Emergency Supply AFY 0 400 400 $1,648 $659,200 0.196 $128,959
Avoided SWP and CVP salinity releases
AFY 0 17000 17000 $754 $12,818,000 0.196 $2,507,587
Avoided SWP and CVP OMR releases
AFY 0 5708 5708 $743 $4,241,044 0.196 $829,676
Reduced drownings Drownings 0.62 0 0.62 $7,000,000 $4,340,000 0.196 $849,035
Energy savings Dollars 98,062 0 98,062 $1 $98,062 0.196 $19,184
Bromate cancer reduction
Excess cancer / yr
0.87 0.77 0.10 $7,000,000 $700,000 0.196 $136,941
Canal Maintenance Savings
Dollars $360,000 $0 $360,000 $1 $360,000 0.196 $70,427
Avoided Patrolling Dollars $129,000 $0 $129,000 $1 $129,000 0.196 $25,236
Reduced Solids Handling
Percent 1.000 0.992 0.008 $600,000 $4,800 0.196 $939
2041 Emergency Supply AFY 0 400 400 $1,648 $659,200 0.185 $121,660
Avoided SWP and CVP salinity releases
AFY 0 17000 17000 $754 $12,818,000 0.185 $2,365,648
Avoided SWP and CVP OMR releases
AFY 0 5708 5708 $743 $4,241,044 0.185 $782,713
Reduced drownings Drownings 0.62 0 0.62 $7,000,000 $4,340,000 0.185 $800,976
Energy savings Dollars 98,062 0 98,062 $1 $98,062 0.185 $18,098
Bromate cancer reduction
Excess cancer / yr
0.87 0.77 0.10 $7,000,000 $700,000 0.185 $129,190
Canal Maintenance Savings
Dollars $360,000 $0 $360,000 $1 $360,000 0.185 $66,440
Avoided Patrolling Dollars $129,000 $0 $129,000 $1 $129,000 0.185 $23,808
Reduced Solids Handling
Percent 1.000 0.992 0.008 $600,000 $4,800 0.185 $886
2042 Emergency Supply AFY 0 400 400 $1,648 $659,200 0.174 $114,773
Avoided SWP and CVP salinity releases
AFY 0 17000 17000 $754 $12,818,000 0.174 $2,231,744
Avoided SWP and CVP OMR releases
AFY 0 5708 5708 $743 $4,241,044 0.174 $738,409
Reduced drownings Drownings 0.62 0 0.62 $7,000,000 $4,340,000 0.174 $755,638
Energy savings Dollars 98,062 0 98,062 $1 $98,062 0.174 $17,074
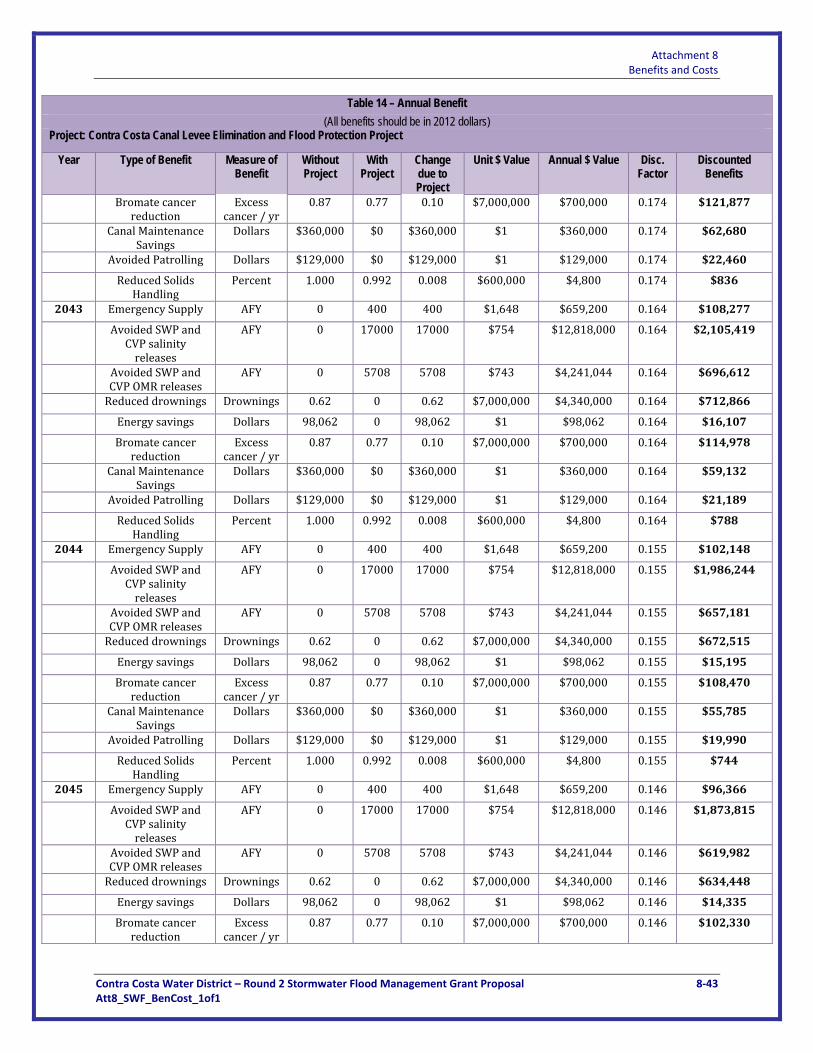
Attachment 8 Benefits and Costs
Contra Costa Water District – Round 2 Stormwater Flood Management Grant Proposal 8‐43 Att8_SWF_BenCost_1of1
Table 14 – Annual Benefit (All benefits should be in 2012 dollars)
Project: Contra Costa Canal Levee Elimination and Flood Protection Project
Year Type of Benefit Measure of Benefit
Without Project
With Project
Change due to Project
Unit $ Value Annual $ Value Disc. Factor
Discounted Benefits
Bromate cancer reduction
Excess cancer / yr
0.87 0.77 0.10 $7,000,000 $700,000 0.174 $121,877
Canal Maintenance Savings
Dollars $360,000 $0 $360,000 $1 $360,000 0.174 $62,680
Avoided Patrolling Dollars $129,000 $0 $129,000 $1 $129,000 0.174 $22,460
Reduced Solids Handling
Percent 1.000 0.992 0.008 $600,000 $4,800 0.174 $836
2043 Emergency Supply AFY 0 400 400 $1,648 $659,200 0.164 $108,277
Avoided SWP and CVP salinity releases
AFY 0 17000 17000 $754 $12,818,000 0.164 $2,105,419
Avoided SWP and CVP OMR releases
AFY 0 5708 5708 $743 $4,241,044 0.164 $696,612
Reduced drownings Drownings 0.62 0 0.62 $7,000,000 $4,340,000 0.164 $712,866
Energy savings Dollars 98,062 0 98,062 $1 $98,062 0.164 $16,107
Bromate cancer reduction
Excess cancer / yr
0.87 0.77 0.10 $7,000,000 $700,000 0.164 $114,978
Canal Maintenance Savings
Dollars $360,000 $0 $360,000 $1 $360,000 0.164 $59,132
Avoided Patrolling Dollars $129,000 $0 $129,000 $1 $129,000 0.164 $21,189
Reduced Solids Handling
Percent 1.000 0.992 0.008 $600,000 $4,800 0.164 $788
2044 Emergency Supply AFY 0 400 400 $1,648 $659,200 0.155 $102,148
Avoided SWP and CVP salinity releases
AFY 0 17000 17000 $754 $12,818,000 0.155 $1,986,244
Avoided SWP and CVP OMR releases
AFY 0 5708 5708 $743 $4,241,044 0.155 $657,181
Reduced drownings Drownings 0.62 0 0.62 $7,000,000 $4,340,000 0.155 $672,515
Energy savings Dollars 98,062 0 98,062 $1 $98,062 0.155 $15,195
Bromate cancer reduction
Excess cancer / yr
0.87 0.77 0.10 $7,000,000 $700,000 0.155 $108,470
Canal Maintenance Savings
Dollars $360,000 $0 $360,000 $1 $360,000 0.155 $55,785
Avoided Patrolling Dollars $129,000 $0 $129,000 $1 $129,000 0.155 $19,990
Reduced Solids Handling
Percent 1.000 0.992 0.008 $600,000 $4,800 0.155 $744
2045 Emergency Supply AFY 0 400 400 $1,648 $659,200 0.146 $96,366
Avoided SWP and CVP salinity releases
AFY 0 17000 17000 $754 $12,818,000 0.146 $1,873,815
Avoided SWP and CVP OMR releases
AFY 0 5708 5708 $743 $4,241,044 0.146 $619,982
Reduced drownings Drownings 0.62 0 0.62 $7,000,000 $4,340,000 0.146 $634,448
Energy savings Dollars 98,062 0 98,062 $1 $98,062 0.146 $14,335
Bromate cancer reduction
Excess cancer / yr
0.87 0.77 0.10 $7,000,000 $700,000 0.146 $102,330

Attachment 8 Benefits and Costs
Contra Costa Water District – Round 2 Stormwater Flood Management Grant Proposal 8‐44 Att8_SWF_BenCost_1of1
Table 14 – Annual Benefit (All benefits should be in 2012 dollars)
Project: Contra Costa Canal Levee Elimination and Flood Protection Project
Year Type of Benefit Measure of Benefit
Without Project
With Project
Change due to Project
Unit $ Value Annual $ Value Disc. Factor
Discounted Benefits
Canal Maintenance Savings
Dollars $360,000 $0 $360,000 $1 $360,000 0.146 $52,627
Avoided Patrolling Dollars $129,000 $0 $129,000 $1 $129,000 0.146 $18,858
Reduced Solids Handling
Percent 1.000 0.992 0.008 $600,000 $4,800 0.146 $702
2046 Emergency Supply AFY 0 400 400 $1,648 $659,200 0.138 $90,911
Avoided SWP and CVP salinity releases
AFY 0 17000 17000 $754 $12,818,000 0.138 $1,767,750
Avoided SWP and CVP OMR releases
AFY 0 5708 5708 $743 $4,241,044 0.138 $584,889
Reduced drownings Drownings 0.62 0 0.62 $7,000,000 $4,340,000 0.138 $598,536
Energy savings Dollars 98,062 0 98,062 $1 $98,062 0.138 $13,524
Bromate cancer reduction
Excess cancer / yr
0.87 0.77 0.10 $7,000,000 $700,000 0.138 $96,538
Canal Maintenance Savings
Dollars $360,000 $0 $360,000 $1 $360,000 0.138 $49,648
Avoided Patrolling Dollars $129,000 $0 $129,000 $1 $129,000 0.138 $17,791
Reduced Solids Handling
Percent 1.000 0.992 0.008 $600,000 $4,800 0.138 $662
2047 Emergency Supply AFY 0 400 400 $1,648 $659,200 0.130 $85,765
Avoided SWP and CVP salinity releases
AFY 0 17000 17000 $754 $12,818,000 0.130 $1,667,689
Avoided SWP and CVP OMR releases
AFY 0 5708 5708 $743 $4,241,044 0.130 $551,782
Reduced drownings Drownings 0.62 0 0.62 $7,000,000 $4,340,000 0.130 $564,657
Energy savings Dollars 98,062 0 98,062 $1 $98,062 0.130 $12,758
Bromate cancer reduction
Excess cancer / yr
0.87 0.77 0.10 $7,000,000 $700,000 0.130 $91,074
Canal Maintenance Savings
Dollars $360,000 $0 $360,000 $1 $360,000 0.130 $46,838
Avoided Patrolling Dollars $129,000 $0 $129,000 $1 $129,000 0.130 $16,784
Reduced Solids Handling
Percent 1.000 0.992 0.008 $600,000 $4,800 0.130 $625
2048 Emergency Supply AFY 0 400 400 $1,648 $659,200 0.123 $80,911
Avoided SWP and CVP salinity releases
AFY 0 17000 17000 $754 $12,818,000 0.123 $1,573,291
Avoided SWP and CVP OMR releases
AFY 0 5708 5708 $743 $4,241,044 0.123 $520,549
Reduced drownings Drownings 0.62 0 0.62 $7,000,000 $4,340,000 0.123 $532,695
Energy savings Dollars 98,062 0 98,062 $1 $98,062 0.123 $12,036
Bromate cancer reduction
Excess cancer / yr
0.87 0.77 0.10 $7,000,000 $700,000 0.123 $85,919
Canal Maintenance Savings
Dollars $360,000 $0 $360,000 $1 $360,000 0.123 $44,187

Attachment 8 Benefits and Costs
Contra Costa Water District – Round 2 Stormwater Flood Management Grant Proposal 8‐45 Att8_SWF_BenCost_1of1
Table 14 – Annual Benefit (All benefits should be in 2012 dollars)
Project: Contra Costa Canal Levee Elimination and Flood Protection Project
Year Type of Benefit Measure of Benefit
Without Project
With Project
Change due to Project
Unit $ Value Annual $ Value Disc. Factor
Discounted Benefits
Avoided Patrolling Dollars $129,000 $0 $129,000 $1 $129,000 0.123 $15,834
Reduced Solids Handling
Percent 1.000 0.992 0.008 $600,000 $4,800 0.123 $589
2049 Emergency Supply AFY 0 400 400 $1,648 $659,200 0.116 $76,331
Avoided SWP and CVP salinity releases
AFY 0 17000 17000 $754 $12,818,000 0.116 $1,484,237
Avoided SWP and CVP OMR releases
AFY 0 5708 5708 $743 $4,241,044 0.116 $491,084
Reduced drownings Drownings 0.62 0 0.62 $7,000,000 $4,340,000 0.116 $502,542
Energy savings Dollars 98,062 0 98,062 $1 $98,062 0.116 $11,355
Bromate cancer reduction
Excess cancer / yr
0.87 0.77 0.10 $7,000,000 $700,000 0.116 $81,055
Canal Maintenance Savings
Dollars $360,000 $0 $360,000 $1 $360,000 0.116 $41,686
Avoided Patrolling Dollars $129,000 $0 $129,000 $1 $129,000 0.116 $14,937
Reduced Solids Handling
Percent 1.000 0.992 0.008 $600,000 $4,800 0.116 $556
2050 Emergency Supply AFY 0 400 400 $1,648 $659,200 0.109 $72,010
Avoided SWP and CVP salinity releases
AFY 0 17000 17000 $754 $12,818,000 0.109 $1,400,224
Avoided SWP and CVP OMR releases
AFY 0 5708 5708 $743 $4,241,044 0.109 $463,287
Reduced drownings Drownings 0.62 0 0.62 $7,000,000 $4,340,000 0.109 $474,097
Energy savings Dollars 98,062 0 98,062 $1 $98,062 0.109 $10,712
Bromate cancer reduction
Excess cancer / yr
0.87 0.77 0.10 $7,000,000 $700,000 0.109 $76,467
Canal Maintenance Savings
Dollars $360,000 $0 $360,000 $1 $360,000 0.109 $39,326
Avoided Patrolling Dollars $129,000 $0 $129,000 $1 $129,000 0.109 $14,092
Reduced Solids Handling
Percent 1.000 0.992 0.008 $600,000 $4,800 0.109 $524
2051 Emergency Supply AFY 0 400 400 $1,648 $659,200 0.103 $67,934
Avoided SWP and CVP salinity releases
AFY 0 17000 17000 $754 $12,818,000 0.103 $1,320,966
Avoided SWP and CVP OMR releases
AFY 0 5708 5708 $743 $4,241,044 0.103 $437,063
Reduced drownings Drownings 0.62 0 0.62 $7,000,000 $4,340,000 0.103 $447,261
Energy savings Dollars 98,062 0 98,062 $1 $98,062 0.103 $10,106
Bromate cancer reduction
Excess cancer / yr
0.87 0.77 0.10 $7,000,000 $700,000 0.103 $72,139
Canal Maintenance Savings
Dollars $360,000 $0 $360,000 $1 $360,000 0.103 $37,100
Avoided Patrolling Dollars $129,000 $0 $129,000 $1 $129,000 0.103 $13,294
Reduced Solids Percent 1.000 0.992 0.008 $600,000 $4,800 0.103 $495
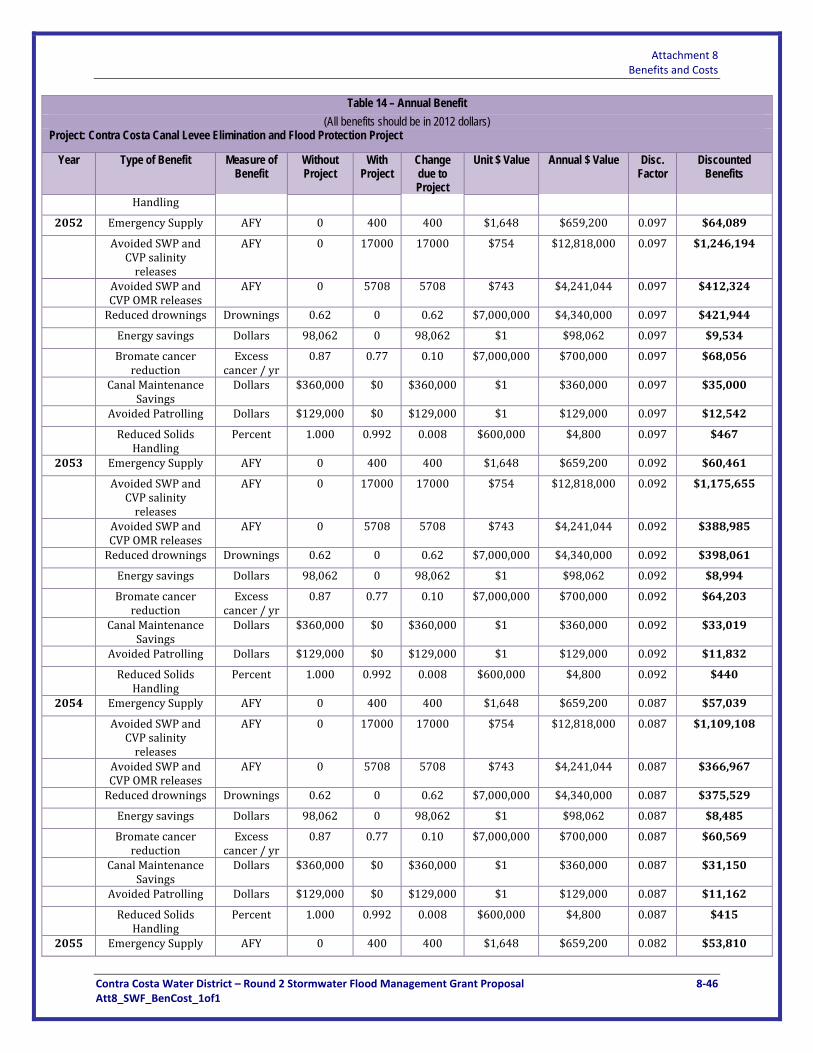
Attachment 8 Benefits and Costs
Contra Costa Water District – Round 2 Stormwater Flood Management Grant Proposal 8‐46 Att8_SWF_BenCost_1of1
Table 14 – Annual Benefit (All benefits should be in 2012 dollars)
Project: Contra Costa Canal Levee Elimination and Flood Protection Project
Year Type of Benefit Measure of Benefit
Without Project
With Project
Change due to Project
Unit $ Value Annual $ Value Disc. Factor
Discounted Benefits
Handling
2052 Emergency Supply AFY 0 400 400 $1,648 $659,200 0.097 $64,089
Avoided SWP and CVP salinity releases
AFY 0 17000 17000 $754 $12,818,000 0.097 $1,246,194
Avoided SWP and CVP OMR releases
AFY 0 5708 5708 $743 $4,241,044 0.097 $412,324
Reduced drownings Drownings 0.62 0 0.62 $7,000,000 $4,340,000 0.097 $421,944
Energy savings Dollars 98,062 0 98,062 $1 $98,062 0.097 $9,534
Bromate cancer reduction
Excess cancer / yr
0.87 0.77 0.10 $7,000,000 $700,000 0.097 $68,056
Canal Maintenance Savings
Dollars $360,000 $0 $360,000 $1 $360,000 0.097 $35,000
Avoided Patrolling Dollars $129,000 $0 $129,000 $1 $129,000 0.097 $12,542
Reduced Solids Handling
Percent 1.000 0.992 0.008 $600,000 $4,800 0.097 $467
2053 Emergency Supply AFY 0 400 400 $1,648 $659,200 0.092 $60,461
Avoided SWP and CVP salinity releases
AFY 0 17000 17000 $754 $12,818,000 0.092 $1,175,655
Avoided SWP and CVP OMR releases
AFY 0 5708 5708 $743 $4,241,044 0.092 $388,985
Reduced drownings Drownings 0.62 0 0.62 $7,000,000 $4,340,000 0.092 $398,061
Energy savings Dollars 98,062 0 98,062 $1 $98,062 0.092 $8,994
Bromate cancer reduction
Excess cancer / yr
0.87 0.77 0.10 $7,000,000 $700,000 0.092 $64,203
Canal Maintenance Savings
Dollars $360,000 $0 $360,000 $1 $360,000 0.092 $33,019
Avoided Patrolling Dollars $129,000 $0 $129,000 $1 $129,000 0.092 $11,832
Reduced Solids Handling
Percent 1.000 0.992 0.008 $600,000 $4,800 0.092 $440
2054 Emergency Supply AFY 0 400 400 $1,648 $659,200 0.087 $57,039
Avoided SWP and CVP salinity releases
AFY 0 17000 17000 $754 $12,818,000 0.087 $1,109,108
Avoided SWP and CVP OMR releases
AFY 0 5708 5708 $743 $4,241,044 0.087 $366,967
Reduced drownings Drownings 0.62 0 0.62 $7,000,000 $4,340,000 0.087 $375,529
Energy savings Dollars 98,062 0 98,062 $1 $98,062 0.087 $8,485
Bromate cancer reduction
Excess cancer / yr
0.87 0.77 0.10 $7,000,000 $700,000 0.087 $60,569
Canal Maintenance Savings
Dollars $360,000 $0 $360,000 $1 $360,000 0.087 $31,150
Avoided Patrolling Dollars $129,000 $0 $129,000 $1 $129,000 0.087 $11,162
Reduced Solids Handling
Percent 1.000 0.992 0.008 $600,000 $4,800 0.087 $415
2055 Emergency Supply AFY 0 400 400 $1,648 $659,200 0.082 $53,810

Attachment 8 Benefits and Costs
Contra Costa Water District – Round 2 Stormwater Flood Management Grant Proposal 8‐47 Att8_SWF_BenCost_1of1
Table 14 – Annual Benefit (All benefits should be in 2012 dollars)
Project: Contra Costa Canal Levee Elimination and Flood Protection Project
Year Type of Benefit Measure of Benefit
Without Project
With Project
Change due to Project
Unit $ Value Annual $ Value Disc. Factor
Discounted Benefits
Avoided SWP and CVP salinity releases
AFY 0 17000 17000 $754 $12,818,000 0.082 $1,046,329
Avoided SWP and CVP OMR releases
AFY 0 5708 5708 $743 $4,241,044 0.082 $346,195
Reduced drownings Drownings 0.62 0 0.62 $7,000,000 $4,340,000 0.082 $354,273
Energy savings Dollars 98,062 0 98,062 $1 $98,062 0.082 $8,005
Bromate cancer reduction
Excess cancer / yr
0.87 0.77 0.10 $7,000,000 $700,000 0.082 $57,141
Canal Maintenance Savings
Dollars $360,000 $0 $360,000 $1 $360,000 0.082 $29,387
Avoided Patrolling Dollars $129,000 $0 $129,000 $1 $129,000 0.082 $10,530
Reduced Solids Handling
Percent 1.000 0.992 0.008 $600,000 $4,800 0.082 $392
2056 Emergency Supply AFY 0 400 400 $1,648 $659,200 0.077 $50,764
Avoided SWP and CVP salinity releases
AFY 0 17000 17000 $754 $12,818,000 0.077 $987,102
Avoided SWP and CVP OMR releases
AFY 0 5708 5708 $743 $4,241,044 0.077 $326,599
Reduced drownings Drownings 0.62 0 0.62 $7,000,000 $4,340,000 0.077 $334,219
Energy savings Dollars 98,062 0 98,062 $1 $98,062 0.077 $7,552
Bromate cancer reduction
Excess cancer / yr
0.87 0.77 0.10 $7,000,000 $700,000 0.077 $53,906
Canal Maintenance Savings
Dollars $360,000 $0 $360,000 $1 $360,000 0.077 $27,723
Avoided Patrolling Dollars $129,000 $0 $129,000 $1 $129,000 0.077 $9,934
Reduced Solids Handling
Percent 1.000 0.992 0.008 $600,000 $4,800 0.077 $370
2057 Emergency Supply AFY 0 400 400 $1,648 $659,200 0.073 $47,891
Avoided SWP and CVP salinity releases
AFY 0 17000 17000 $754 $12,818,000 0.073 $931,229
Avoided SWP and CVP OMR releases
AFY 0 5708 5708 $743 $4,241,044 0.073 $308,112
Reduced drownings Drownings 0.62 0 0.62 $7,000,000 $4,340,000 0.073 $315,301
Energy savings Dollars 98,062 0 98,062 $1 $98,062 0.073 $7,124
Bromate cancer reduction
Excess cancer / yr
0.87 0.77 0.10 $7,000,000 $700,000 0.073 $50,855
Canal Maintenance Savings
Dollars $360,000 $0 $360,000 $1 $360,000 0.073 $26,154
Avoided Patrolling Dollars $129,000 $0 $129,000 $1 $129,000 0.073 $9,372
Reduced Solids Handling
Percent 1.000 0.992 0.008 $600,000 $4,800 0.073 $349
2058 Emergency Supply AFY 0 400 400 $1,648 $659,200 0.069 $45,180
Avoided SWP and CVP salinity
AFY 0 17000 17000 $754 $12,818,000 0.069 $878,518
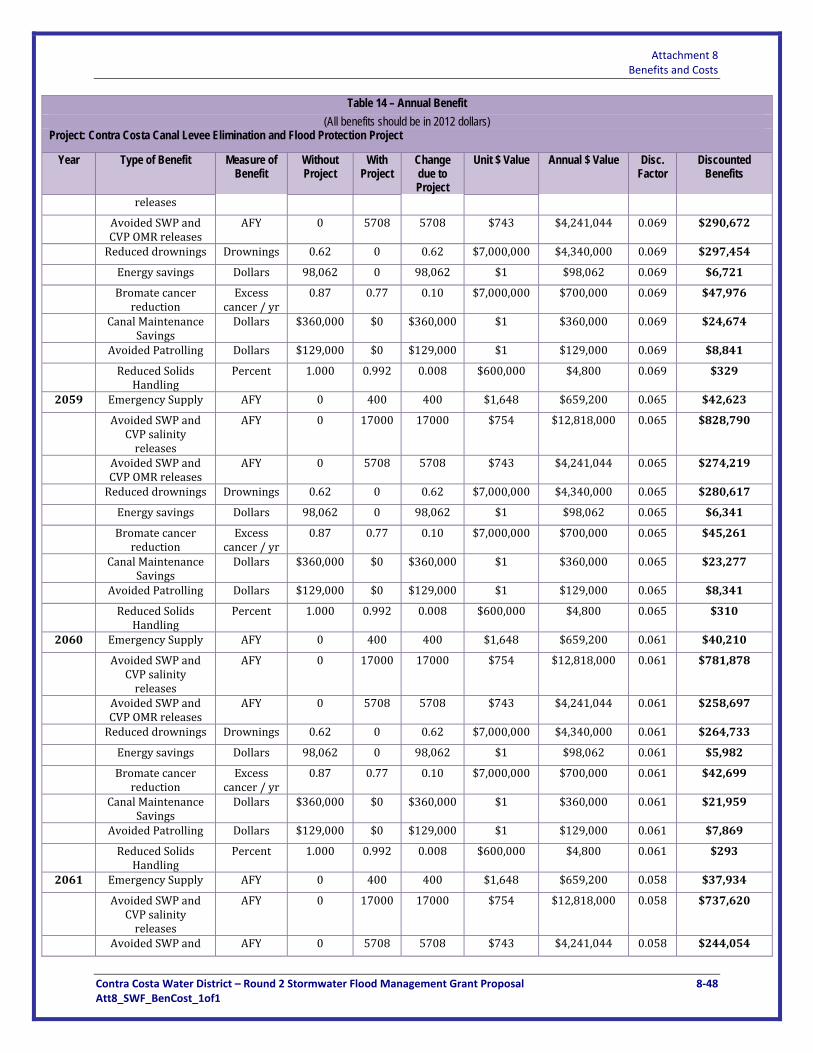
Attachment 8 Benefits and Costs
Contra Costa Water District – Round 2 Stormwater Flood Management Grant Proposal 8‐48 Att8_SWF_BenCost_1of1
Table 14 – Annual Benefit (All benefits should be in 2012 dollars)
Project: Contra Costa Canal Levee Elimination and Flood Protection Project
Year Type of Benefit Measure of Benefit
Without Project
With Project
Change due to Project
Unit $ Value Annual $ Value Disc. Factor
Discounted Benefits
releases
Avoided SWP and CVP OMR releases
AFY 0 5708 5708 $743 $4,241,044 0.069 $290,672
Reduced drownings Drownings 0.62 0 0.62 $7,000,000 $4,340,000 0.069 $297,454
Energy savings Dollars 98,062 0 98,062 $1 $98,062 0.069 $6,721
Bromate cancer reduction
Excess cancer / yr
0.87 0.77 0.10 $7,000,000 $700,000 0.069 $47,976
Canal Maintenance Savings
Dollars $360,000 $0 $360,000 $1 $360,000 0.069 $24,674
Avoided Patrolling Dollars $129,000 $0 $129,000 $1 $129,000 0.069 $8,841
Reduced Solids Handling
Percent 1.000 0.992 0.008 $600,000 $4,800 0.069 $329
2059 Emergency Supply AFY 0 400 400 $1,648 $659,200 0.065 $42,623
Avoided SWP and CVP salinity releases
AFY 0 17000 17000 $754 $12,818,000 0.065 $828,790
Avoided SWP and CVP OMR releases
AFY 0 5708 5708 $743 $4,241,044 0.065 $274,219
Reduced drownings Drownings 0.62 0 0.62 $7,000,000 $4,340,000 0.065 $280,617
Energy savings Dollars 98,062 0 98,062 $1 $98,062 0.065 $6,341
Bromate cancer reduction
Excess cancer / yr
0.87 0.77 0.10 $7,000,000 $700,000 0.065 $45,261
Canal Maintenance Savings
Dollars $360,000 $0 $360,000 $1 $360,000 0.065 $23,277
Avoided Patrolling Dollars $129,000 $0 $129,000 $1 $129,000 0.065 $8,341
Reduced Solids Handling
Percent 1.000 0.992 0.008 $600,000 $4,800 0.065 $310
2060 Emergency Supply AFY 0 400 400 $1,648 $659,200 0.061 $40,210
Avoided SWP and CVP salinity releases
AFY 0 17000 17000 $754 $12,818,000 0.061 $781,878
Avoided SWP and CVP OMR releases
AFY 0 5708 5708 $743 $4,241,044 0.061 $258,697
Reduced drownings Drownings 0.62 0 0.62 $7,000,000 $4,340,000 0.061 $264,733
Energy savings Dollars 98,062 0 98,062 $1 $98,062 0.061 $5,982
Bromate cancer reduction
Excess cancer / yr
0.87 0.77 0.10 $7,000,000 $700,000 0.061 $42,699
Canal Maintenance Savings
Dollars $360,000 $0 $360,000 $1 $360,000 0.061 $21,959
Avoided Patrolling Dollars $129,000 $0 $129,000 $1 $129,000 0.061 $7,869
Reduced Solids Handling
Percent 1.000 0.992 0.008 $600,000 $4,800 0.061 $293
2061 Emergency Supply AFY 0 400 400 $1,648 $659,200 0.058 $37,934
Avoided SWP and CVP salinity releases
AFY 0 17000 17000 $754 $12,818,000 0.058 $737,620
Avoided SWP and AFY 0 5708 5708 $743 $4,241,044 0.058 $244,054

Attachment 8 Benefits and Costs
Contra Costa Water District – Round 2 Stormwater Flood Management Grant Proposal 8‐49 Att8_SWF_BenCost_1of1
Table 14 – Annual Benefit (All benefits should be in 2012 dollars)
Project: Contra Costa Canal Levee Elimination and Flood Protection Project
Year Type of Benefit Measure of Benefit
Without Project
With Project
Change due to Project
Unit $ Value Annual $ Value Disc. Factor
Discounted Benefits
CVP OMR releases
Reduced drownings Drownings 0.62 0 0.62 $7,000,000 $4,340,000 0.058 $249,748
Energy savings Dollars 98,062 0 98,062 $1 $98,062 0.058 $5,643
Bromate cancer reduction
Excess cancer / yr
0.87 0.77 0.10 $7,000,000 $700,000 0.058 $40,282
Canal Maintenance Savings
Dollars $360,000 $0 $360,000 $1 $360,000 0.058 $20,716
Avoided Patrolling Dollars $129,000 $0 $129,000 $1 $129,000 0.058 $7,423
Reduced Solids Handling
Percent 1.000 0.992 0.008 $600,000 $4,800 0.058 $276
2062 Emergency Supply AFY 0 400 400 $1,648 $659,200 0.054 $35,787
Avoided SWP and CVP salinity releases
AFY 0 17000 17000 $754 $12,818,000 0.054 $695,868
Avoided SWP and CVP OMR releases
AFY 0 5708 5708 $743 $4,241,044 0.054 $230,239
Reduced drownings Drownings 0.62 0 0.62 $7,000,000 $4,340,000 0.054 $235,611
Energy savings Dollars 98,062 0 98,062 $1 $98,062 0.054 $5,324
Bromate cancer reduction
Excess cancer / yr
0.87 0.77 0.10 $7,000,000 $700,000 0.054 $38,002
Canal Maintenance Savings
Dollars $360,000 $0 $360,000 $1 $360,000 0.054 $19,544
Avoided Patrolling Dollars $129,000 $0 $129,000 $1 $129,000 0.054 $7,003
Reduced Solids Handling
Percent 1.000 0.992 0.008 $600,000 $4,800 0.054 $261
2063 Emergency Supply AFY 0 400 400 $1,648 $659,200 0.051 $33,761
Avoided SWP and CVP salinity releases
AFY 0 17000 17000 $754 $12,818,000 0.051 $656,479
Avoided SWP and CVP OMR releases
AFY 0 5708 5708 $743 $4,241,044 0.051 $217,207
Reduced drownings Drownings 0.62 0 0.62 $7,000,000 $4,340,000 0.051 $222,275
Energy savings Dollars 98,062 0 98,062 $1 $98,062 0.051 $5,022
Bromate cancer reduction
Excess cancer / yr
0.87 0.77 0.10 $7,000,000 $700,000 0.051 $35,851
Canal Maintenance Savings
Dollars $360,000 $0 $360,000 $1 $360,000 0.051 $18,438
Avoided Patrolling Dollars $129,000 $0 $129,000 $1 $129,000 0.051 $6,607
Reduced Solids Handling
Percent 1.000 0.992 0.008 $600,000 $4,800 0.051 $246
2064 Emergency Supply AFY 0 400 400 $1,648 $659,200 0.048 $31,850
Avoided SWP and CVP salinity releases
AFY 0 17000 17000 $754 $12,818,000 0.048 $619,320
Avoided SWP and CVP OMR releases
AFY 0 5708 5708 $743 $4,241,044 0.048 $204,912
Reduced drownings Drownings 0.62 0 0.62 $7,000,000 $4,340,000 0.048 $209,693
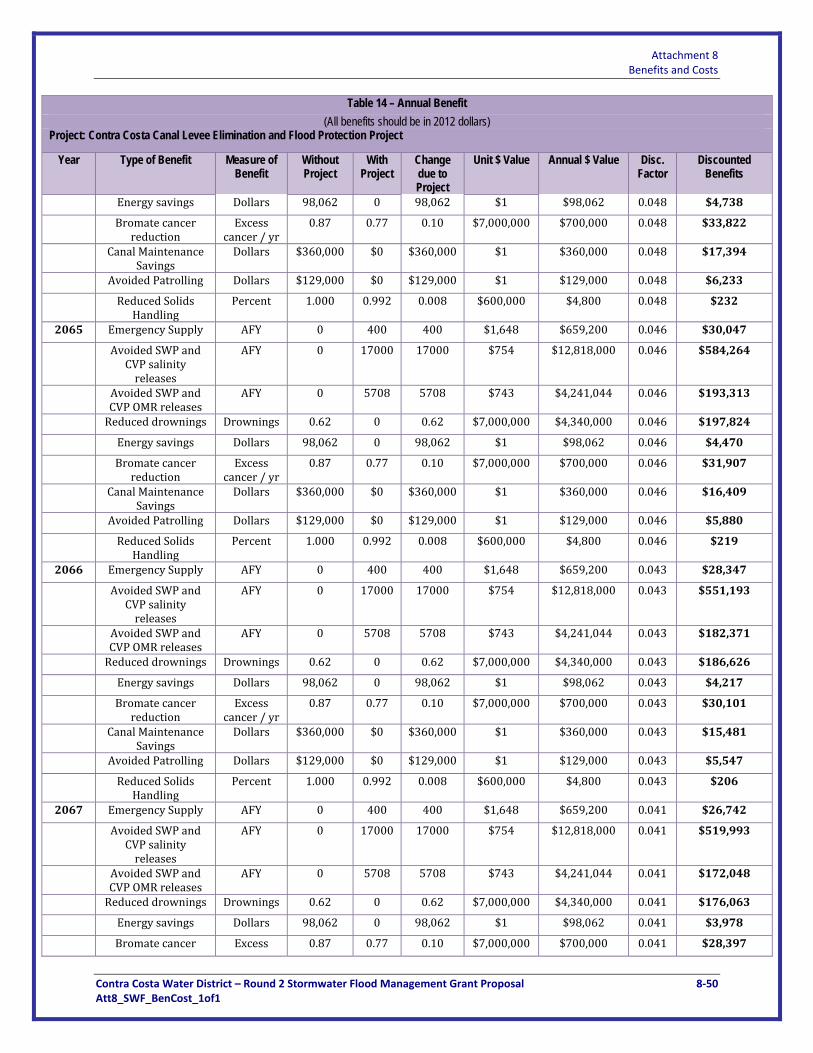
Attachment 8 Benefits and Costs
Contra Costa Water District – Round 2 Stormwater Flood Management Grant Proposal 8‐50 Att8_SWF_BenCost_1of1
Table 14 – Annual Benefit (All benefits should be in 2012 dollars)
Project: Contra Costa Canal Levee Elimination and Flood Protection Project
Year Type of Benefit Measure of Benefit
Without Project
With Project
Change due to Project
Unit $ Value Annual $ Value Disc. Factor
Discounted Benefits
Energy savings Dollars 98,062 0 98,062 $1 $98,062 0.048 $4,738
Bromate cancer reduction
Excess cancer / yr
0.87 0.77 0.10 $7,000,000 $700,000 0.048 $33,822
Canal Maintenance Savings
Dollars $360,000 $0 $360,000 $1 $360,000 0.048 $17,394
Avoided Patrolling Dollars $129,000 $0 $129,000 $1 $129,000 0.048 $6,233
Reduced Solids Handling
Percent 1.000 0.992 0.008 $600,000 $4,800 0.048 $232
2065 Emergency Supply AFY 0 400 400 $1,648 $659,200 0.046 $30,047
Avoided SWP and CVP salinity releases
AFY 0 17000 17000 $754 $12,818,000 0.046 $584,264
Avoided SWP and CVP OMR releases
AFY 0 5708 5708 $743 $4,241,044 0.046 $193,313
Reduced drownings Drownings 0.62 0 0.62 $7,000,000 $4,340,000 0.046 $197,824
Energy savings Dollars 98,062 0 98,062 $1 $98,062 0.046 $4,470
Bromate cancer reduction
Excess cancer / yr
0.87 0.77 0.10 $7,000,000 $700,000 0.046 $31,907
Canal Maintenance Savings
Dollars $360,000 $0 $360,000 $1 $360,000 0.046 $16,409
Avoided Patrolling Dollars $129,000 $0 $129,000 $1 $129,000 0.046 $5,880
Reduced Solids Handling
Percent 1.000 0.992 0.008 $600,000 $4,800 0.046 $219
2066 Emergency Supply AFY 0 400 400 $1,648 $659,200 0.043 $28,347
Avoided SWP and CVP salinity releases
AFY 0 17000 17000 $754 $12,818,000 0.043 $551,193
Avoided SWP and CVP OMR releases
AFY 0 5708 5708 $743 $4,241,044 0.043 $182,371
Reduced drownings Drownings 0.62 0 0.62 $7,000,000 $4,340,000 0.043 $186,626
Energy savings Dollars 98,062 0 98,062 $1 $98,062 0.043 $4,217
Bromate cancer reduction
Excess cancer / yr
0.87 0.77 0.10 $7,000,000 $700,000 0.043 $30,101
Canal Maintenance Savings
Dollars $360,000 $0 $360,000 $1 $360,000 0.043 $15,481
Avoided Patrolling Dollars $129,000 $0 $129,000 $1 $129,000 0.043 $5,547
Reduced Solids Handling
Percent 1.000 0.992 0.008 $600,000 $4,800 0.043 $206
2067 Emergency Supply AFY 0 400 400 $1,648 $659,200 0.041 $26,742
Avoided SWP and CVP salinity releases
AFY 0 17000 17000 $754 $12,818,000 0.041 $519,993
Avoided SWP and CVP OMR releases
AFY 0 5708 5708 $743 $4,241,044 0.041 $172,048
Reduced drownings Drownings 0.62 0 0.62 $7,000,000 $4,340,000 0.041 $176,063
Energy savings Dollars 98,062 0 98,062 $1 $98,062 0.041 $3,978
Bromate cancer Excess 0.87 0.77 0.10 $7,000,000 $700,000 0.041 $28,397

Attachment 8 Benefits and Costs
Contra Costa Water District – Round 2 Stormwater Flood Management Grant Proposal 8‐51 Att8_SWF_BenCost_1of1
Table 14 – Annual Benefit (All benefits should be in 2012 dollars)
Project: Contra Costa Canal Levee Elimination and Flood Protection Project
Year Type of Benefit Measure of Benefit
Without Project
With Project
Change due to Project
Unit $ Value Annual $ Value Disc. Factor
Discounted Benefits
reduction cancer / yr
Canal Maintenance Savings
Dollars $360,000 $0 $360,000 $1 $360,000 0.041 $14,604
Avoided Patrolling Dollars $129,000 $0 $129,000 $1 $129,000 0.041 $5,233
Reduced Solids Handling
Percent 1.000 0.992 0.008 $600,000 $4,800 0.041 $195
2068 Emergency Supply AFY 0 400 400 $1,648 $659,200 0.038 $25,228
Avoided SWP and CVP salinity releases
AFY 0 17000 17000 $754 $12,818,000 0.038 $490,560
Avoided SWP and CVP OMR releases
AFY 0 5708 5708 $743 $4,241,044 0.038 $162,310
Reduced drownings Drownings 0.62 0 0.62 $7,000,000 $4,340,000 0.038 $166,097
Energy savings Dollars 98,062 0 98,062 $1 $98,062 0.038 $3,753
Bromate cancer reduction
Excess cancer / yr
0.87 0.77 0.10 $7,000,000 $700,000 0.038 $26,790
Canal Maintenance Savings
Dollars $360,000 $0 $360,000 $1 $360,000 0.038 $13,778
Avoided Patrolling Dollars $129,000 $0 $129,000 $1 $129,000 0.038 $4,937
Reduced Solids Handling
Percent 1.000 0.992 0.008 $600,000 $4,800 0.038 $184
2069 Emergency Supply AFY 0 400 400 $1,648 $659,200 0.036 $23,800
Avoided SWP and CVP salinity releases
AFY 0 17000 17000 $754 $12,818,000 0.036 $462,792
Avoided SWP and CVP OMR releases
AFY 0 5708 5708 $743 $4,241,044 0.036 $153,122
Reduced drownings Drownings 0.62 0 0.62 $7,000,000 $4,340,000 0.036 $156,695
Energy savings Dollars 98,062 0 98,062 $1 $98,062 0.036 $3,541
Bromate cancer reduction
Excess cancer / yr
0.87 0.77 0.10 $7,000,000 $700,000 0.036 $25,273
Canal Maintenance Savings
Dollars $360,000 $0 $360,000 $1 $360,000 0.036 $12,998
Avoided Patrolling Dollars $129,000 $0 $129,000 $1 $129,000 0.036 $4,658
Reduced Solids Handling
Percent 1.000 0.992 0.008 $600,000 $4,800 0.036 $173
2070 Emergency Supply AFY 0 400 400 $1,648 $659,200 0.034 $22,453
Avoided SWP and CVP salinity releases
AFY 0 17000 17000 $754 $12,818,000 0.034 $436,596
Avoided SWP and CVP OMR releases
AFY 0 5708 5708 $743 $4,241,044 0.034 $144,455
Reduced drownings Drownings 0.62 0 0.62 $7,000,000 $4,340,000 0.034 $147,826
Energy savings Dollars 98,062 0 98,062 $1 $98,062 0.034 $3,340
Bromate cancer reduction
Excess cancer / yr
0.87 0.77 0.10 $7,000,000 $700,000 0.034 $23,843
Canal Maintenance Dollars $360,000 $0 $360,000 $1 $360,000 0.034 $12,262

Attachment 8 Benefits and Costs
Contra Costa Water District – Round 2 Stormwater Flood Management Grant Proposal 8‐52 Att8_SWF_BenCost_1of1
Table 14 – Annual Benefit (All benefits should be in 2012 dollars)
Project: Contra Costa Canal Levee Elimination and Flood Protection Project
Year Type of Benefit Measure of Benefit
Without Project
With Project
Change due to Project
Unit $ Value Annual $ Value Disc. Factor
Discounted Benefits
Savings
Avoided Patrolling Dollars $129,000 $0 $129,000 $1 $129,000 0.034 $4,394
Reduced Solids Handling
Percent 1.000 0.992 0.008 $600,000 $4,800 0.034 $163
2071 Emergency Supply AFY 0 400 400 $1,648 $659,200 0.032 $21,182
Avoided SWP and CVP salinity releases
AFY 0 17000 17000 $754 $12,818,000 0.032 $411,883
Avoided SWP and CVP OMR releases
AFY 0 5708 5708 $743 $4,241,044 0.032 $136,278
Reduced drownings Drownings 0.62 0 0.62 $7,000,000 $4,340,000 0.032 $139,458
Energy savings Dollars 98,062 0 98,062 $1 $98,062 0.032 $3,151
Bromate cancer reduction
Excess cancer / yr
0.87 0.77 0.10 $7,000,000 $700,000 0.032 $22,493
Canal Maintenance Savings
Dollars $360,000 $0 $360,000 $1 $360,000 0.032 $11,568
Avoided Patrolling Dollars $129,000 $0 $129,000 $1 $129,000 0.032 $4,145
Reduced Solids Handling
Percent 1.000 0.992 0.008 $600,000 $4,800 0.032 $154
2072 Emergency Supply AFY 0 400 400 $1,648 $659,200 0.030 $19,983
Avoided SWP and CVP salinity releases
AFY 0 17000 17000 $754 $12,818,000 0.030 $388,569
Avoided SWP and CVP OMR releases
AFY 0 5708 5708 $743 $4,241,044 0.030 $128,564
Reduced drownings Drownings 0.62 0 0.62 $7,000,000 $4,340,000 0.030 $131,564
Energy savings Dollars 98,062 0 98,062 $1 $98,062 0.030 $2,973
Bromate cancer reduction
Excess cancer / yr
0.87 0.77 0.10 $7,000,000 $700,000 0.030 $21,220
Canal Maintenance Savings
Dollars $360,000 $0 $360,000 $1 $360,000 0.030 $10,913
Avoided Patrolling Dollars $129,000 $0 $129,000 $1 $129,000 0.030 $3,911
Reduced Solids Handling
Percent 1.000 0.992 0.008 $600,000 $4,800 0.030 $146
2073 Emergency Supply AFY 0 400 400 $1,648 $659,200 0.029 $18,852
Avoided SWP and CVP salinity releases
AFY 0 17000 17000 $754 $12,818,000 0.029 $366,575
Avoided SWP and CVP OMR releases
AFY 0 5708 5708 $743 $4,241,044 0.029 $121,287
Reduced drownings Drownings 0.62 0 0.62 $7,000,000 $4,340,000 0.029 $124,117
Energy savings Dollars 98,062 0 98,062 $1 $98,062 0.029 $2,804
Bromate cancer reduction
Excess cancer / yr
0.87 0.77 0.10 $7,000,000 $700,000 0.029 $20,019
Canal Maintenance Savings
Dollars $360,000 $0 $360,000 $1 $360,000 0.029 $10,295
Avoided Patrolling Dollars $129,000 $0 $129,000 $1 $129,000 0.029 $3,689
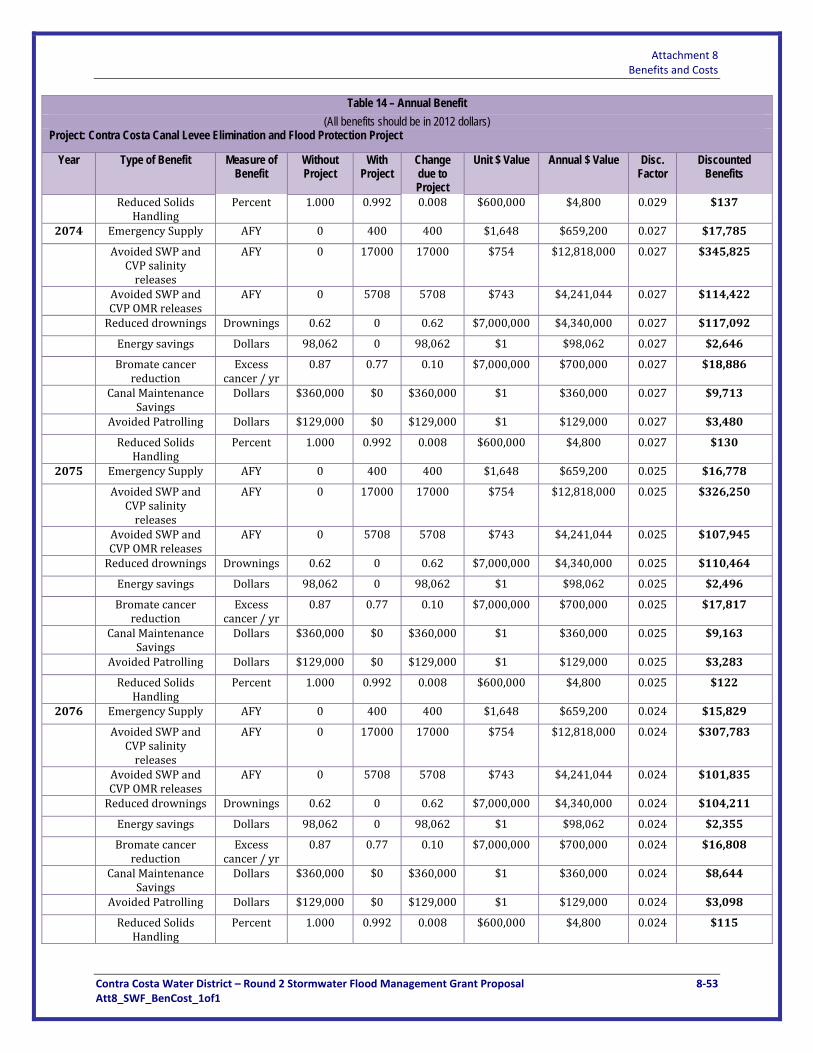
Attachment 8 Benefits and Costs
Contra Costa Water District – Round 2 Stormwater Flood Management Grant Proposal 8‐53 Att8_SWF_BenCost_1of1
Table 14 – Annual Benefit (All benefits should be in 2012 dollars)
Project: Contra Costa Canal Levee Elimination and Flood Protection Project
Year Type of Benefit Measure of Benefit
Without Project
With Project
Change due to Project
Unit $ Value Annual $ Value Disc. Factor
Discounted Benefits
Reduced Solids Handling
Percent 1.000 0.992 0.008 $600,000 $4,800 0.029 $137
2074 Emergency Supply AFY 0 400 400 $1,648 $659,200 0.027 $17,785
Avoided SWP and CVP salinity releases
AFY 0 17000 17000 $754 $12,818,000 0.027 $345,825
Avoided SWP and CVP OMR releases
AFY 0 5708 5708 $743 $4,241,044 0.027 $114,422
Reduced drownings Drownings 0.62 0 0.62 $7,000,000 $4,340,000 0.027 $117,092
Energy savings Dollars 98,062 0 98,062 $1 $98,062 0.027 $2,646
Bromate cancer reduction
Excess cancer / yr
0.87 0.77 0.10 $7,000,000 $700,000 0.027 $18,886
Canal Maintenance Savings
Dollars $360,000 $0 $360,000 $1 $360,000 0.027 $9,713
Avoided Patrolling Dollars $129,000 $0 $129,000 $1 $129,000 0.027 $3,480
Reduced Solids Handling
Percent 1.000 0.992 0.008 $600,000 $4,800 0.027 $130
2075 Emergency Supply AFY 0 400 400 $1,648 $659,200 0.025 $16,778
Avoided SWP and CVP salinity releases
AFY 0 17000 17000 $754 $12,818,000 0.025 $326,250
Avoided SWP and CVP OMR releases
AFY 0 5708 5708 $743 $4,241,044 0.025 $107,945
Reduced drownings Drownings 0.62 0 0.62 $7,000,000 $4,340,000 0.025 $110,464
Energy savings Dollars 98,062 0 98,062 $1 $98,062 0.025 $2,496
Bromate cancer reduction
Excess cancer / yr
0.87 0.77 0.10 $7,000,000 $700,000 0.025 $17,817
Canal Maintenance Savings
Dollars $360,000 $0 $360,000 $1 $360,000 0.025 $9,163
Avoided Patrolling Dollars $129,000 $0 $129,000 $1 $129,000 0.025 $3,283
Reduced Solids Handling
Percent 1.000 0.992 0.008 $600,000 $4,800 0.025 $122
2076 Emergency Supply AFY 0 400 400 $1,648 $659,200 0.024 $15,829
Avoided SWP and CVP salinity releases
AFY 0 17000 17000 $754 $12,818,000 0.024 $307,783
Avoided SWP and CVP OMR releases
AFY 0 5708 5708 $743 $4,241,044 0.024 $101,835
Reduced drownings Drownings 0.62 0 0.62 $7,000,000 $4,340,000 0.024 $104,211
Energy savings Dollars 98,062 0 98,062 $1 $98,062 0.024 $2,355
Bromate cancer reduction
Excess cancer / yr
0.87 0.77 0.10 $7,000,000 $700,000 0.024 $16,808
Canal Maintenance Savings
Dollars $360,000 $0 $360,000 $1 $360,000 0.024 $8,644
Avoided Patrolling Dollars $129,000 $0 $129,000 $1 $129,000 0.024 $3,098
Reduced Solids Handling
Percent 1.000 0.992 0.008 $600,000 $4,800 0.024 $115
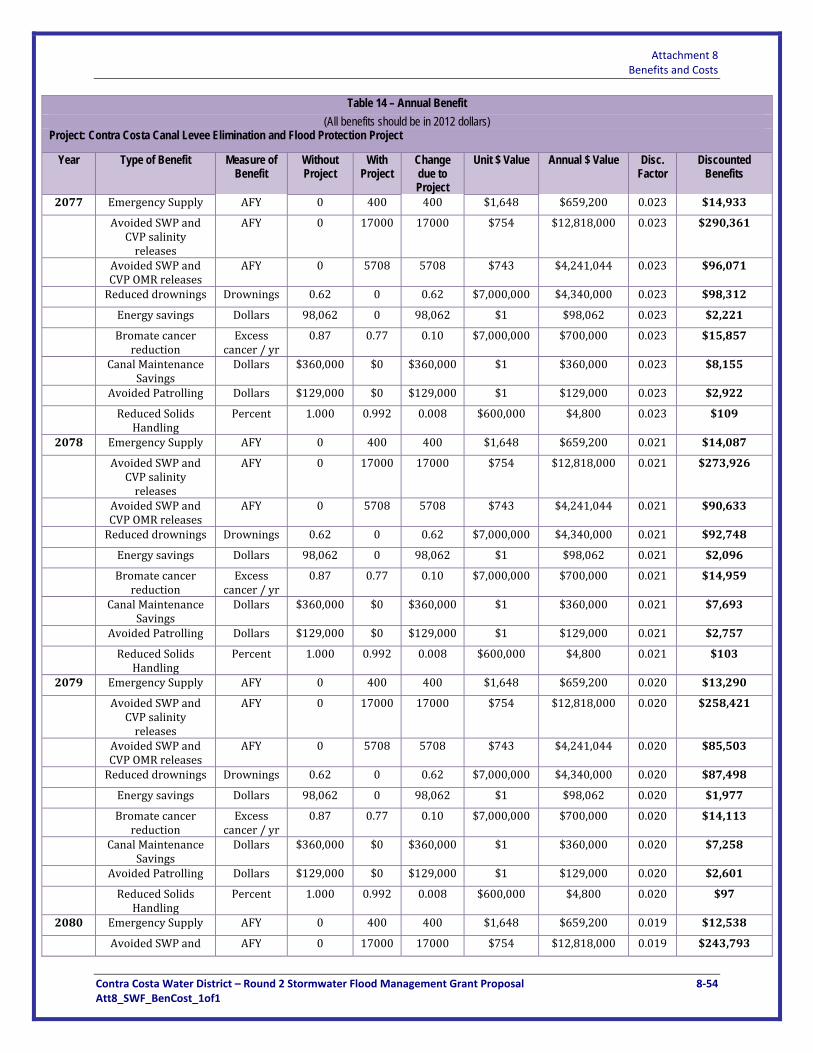
Attachment 8 Benefits and Costs
Contra Costa Water District – Round 2 Stormwater Flood Management Grant Proposal 8‐54 Att8_SWF_BenCost_1of1
Table 14 – Annual Benefit (All benefits should be in 2012 dollars)
Project: Contra Costa Canal Levee Elimination and Flood Protection Project
Year Type of Benefit Measure of Benefit
Without Project
With Project
Change due to Project
Unit $ Value Annual $ Value Disc. Factor
Discounted Benefits
2077 Emergency Supply AFY 0 400 400 $1,648 $659,200 0.023 $14,933
Avoided SWP and CVP salinity releases
AFY 0 17000 17000 $754 $12,818,000 0.023 $290,361
Avoided SWP and CVP OMR releases
AFY 0 5708 5708 $743 $4,241,044 0.023 $96,071
Reduced drownings Drownings 0.62 0 0.62 $7,000,000 $4,340,000 0.023 $98,312
Energy savings Dollars 98,062 0 98,062 $1 $98,062 0.023 $2,221
Bromate cancer reduction
Excess cancer / yr
0.87 0.77 0.10 $7,000,000 $700,000 0.023 $15,857
Canal Maintenance Savings
Dollars $360,000 $0 $360,000 $1 $360,000 0.023 $8,155
Avoided Patrolling Dollars $129,000 $0 $129,000 $1 $129,000 0.023 $2,922
Reduced Solids Handling
Percent 1.000 0.992 0.008 $600,000 $4,800 0.023 $109
2078 Emergency Supply AFY 0 400 400 $1,648 $659,200 0.021 $14,087
Avoided SWP and CVP salinity releases
AFY 0 17000 17000 $754 $12,818,000 0.021 $273,926
Avoided SWP and CVP OMR releases
AFY 0 5708 5708 $743 $4,241,044 0.021 $90,633
Reduced drownings Drownings 0.62 0 0.62 $7,000,000 $4,340,000 0.021 $92,748
Energy savings Dollars 98,062 0 98,062 $1 $98,062 0.021 $2,096
Bromate cancer reduction
Excess cancer / yr
0.87 0.77 0.10 $7,000,000 $700,000 0.021 $14,959
Canal Maintenance Savings
Dollars $360,000 $0 $360,000 $1 $360,000 0.021 $7,693
Avoided Patrolling Dollars $129,000 $0 $129,000 $1 $129,000 0.021 $2,757
Reduced Solids Handling
Percent 1.000 0.992 0.008 $600,000 $4,800 0.021 $103
2079 Emergency Supply AFY 0 400 400 $1,648 $659,200 0.020 $13,290
Avoided SWP and CVP salinity releases
AFY 0 17000 17000 $754 $12,818,000 0.020 $258,421
Avoided SWP and CVP OMR releases
AFY 0 5708 5708 $743 $4,241,044 0.020 $85,503
Reduced drownings Drownings 0.62 0 0.62 $7,000,000 $4,340,000 0.020 $87,498
Energy savings Dollars 98,062 0 98,062 $1 $98,062 0.020 $1,977
Bromate cancer reduction
Excess cancer / yr
0.87 0.77 0.10 $7,000,000 $700,000 0.020 $14,113
Canal Maintenance Savings
Dollars $360,000 $0 $360,000 $1 $360,000 0.020 $7,258
Avoided Patrolling Dollars $129,000 $0 $129,000 $1 $129,000 0.020 $2,601
Reduced Solids Handling
Percent 1.000 0.992 0.008 $600,000 $4,800 0.020 $97
2080 Emergency Supply AFY 0 400 400 $1,648 $659,200 0.019 $12,538
Avoided SWP and AFY 0 17000 17000 $754 $12,818,000 0.019 $243,793
Attachment 8 Benefits and Costs
Contra Costa Water District – Round 2 Stormwater Flood Management Grant Proposal 8‐55 Att8_SWF_BenCost_1of1
Table 14 – Annual Benefit (All benefits should be in 2012 dollars)
Project: Contra Costa Canal Levee Elimination and Flood Protection Project
Year Type of Benefit Measure of Benefit
Without Project
With Project
Change due to Project
Unit $ Value Annual $ Value Disc. Factor
Discounted Benefits
CVP salinity releases
Avoided SWP and CVP OMR releases
AFY 0 5708 5708 $743 $4,241,044 0.019 $80,663
Reduced drownings Drownings 0.62 0 0.62 $7,000,000 $4,340,000 0.019 $82,545
Energy savings Dollars 98,062 0 98,062 $1 $98,062 0.019 $1,865
Bromate cancer reduction
Excess cancer / yr
0.87 0.77 0.10 $7,000,000 $700,000 0.019 $13,314
Canal Maintenance Savings
Dollars $360,000 $0 $360,000 $1 $360,000 0.019 $6,847
Avoided Patrolling Dollars $129,000 $0 $129,000 $1 $129,000 0.019 $2,454
Reduced Solids Handling
Percent 1.000 0.992 0.008 $600,000 $4,800 0.019 $91
2081 Emergency Supply AFY 0 400 400 $1,648 $659,200 0.018 $11,828
Avoided SWP and CVP salinity releases
AFY 0 17000 17000 $754 $12,818,000 0.018 $229,994
Avoided SWP and CVP OMR releases
AFY 0 5708 5708 $743 $4,241,044 0.018 $76,097
Reduced drownings Drownings 0.62 0 0.62 $7,000,000 $4,340,000 0.018 $77,873
Energy savings Dollars 98,062 0 98,062 $1 $98,062 0.018 $1,760
Bromate cancer reduction
Excess cancer / yr
0.87 0.77 0.10 $7,000,000 $700,000 0.018 $12,560
Canal Maintenance Savings
Dollars $360,000 $0 $360,000 $1 $360,000 0.018 $6,459
Avoided Patrolling Dollars $129,000 $0 $129,000 $1 $129,000 0.018 $2,315
Reduced Solids Handling
Percent 1.000 0.992 0.008 $600,000 $4,800 0.018 $86
2082 Emergency Supply AFY 0 400 400 $1,648 $659,200 0.017 $11,159
Avoided SWP and CVP salinity releases
AFY 0 17000 17000 $754 $12,818,000 0.017 $216,975
Avoided SWP and CVP OMR releases
AFY 0 5708 5708 $743 $4,241,044 0.017 $71,790
Reduced drownings Drownings 0.62 0 0.62 $7,000,000 $4,340,000 0.017 $73,465
Energy savings Dollars 98,062 0 98,062 $1 $98,062 0.017 $1,660
Bromate cancer reduction
Excess cancer / yr
0.87 0.77 0.10 $7,000,000 $700,000 0.017 $11,849
Canal Maintenance Savings
Dollars $360,000 $0 $360,000 $1 $360,000 0.017 $6,094
Avoided Patrolling Dollars $129,000 $0 $129,000 $1 $129,000 0.017 $2,184
Reduced Solids Handling
Percent 1.000 0.992 0.008 $600,000 $4,800 0.017 $81
2083 Emergency Supply AFY 0 400 400 $1,648 $659,200 0.016 $10,527
Avoided SWP and CVP salinity releases
AFY 0 17000 17000 $754 $12,818,000 0.016 $204,693

Attachment 8 Benefits and Costs
Contra Costa Water District – Round 2 Stormwater Flood Management Grant Proposal 8‐56 Att8_SWF_BenCost_1of1
Table 14 – Annual Benefit (All benefits should be in 2012 dollars)
Project: Contra Costa Canal Levee Elimination and Flood Protection Project
Year Type of Benefit Measure of Benefit
Without Project
With Project
Change due to Project
Unit $ Value Annual $ Value Disc. Factor
Discounted Benefits
Avoided SWP and CVP OMR releases
AFY 0 5708 5708 $743 $4,241,044 0.016 $67,726
Reduced drownings Drownings 0.62 0 0.62 $7,000,000 $4,340,000 0.016 $69,306
Energy savings Dollars 98,062 0 98,062 $1 $98,062 0.016 $1,566
Bromate cancer reduction
Excess cancer / yr
0.87 0.77 0.10 $7,000,000 $700,000 0.016 $11,178
Canal Maintenance Savings
Dollars $360,000 $0 $360,000 $1 $360,000 0.016 $5,749
Avoided Patrolling Dollars $129,000 $0 $129,000 $1 $129,000 0.016 $2,060
Reduced Solids Handling
Percent 1.000 0.992 0.008 $600,000 $4,800 0.016 $77
2084 Emergency Supply AFY 0 400 400 $1,648 $659,200 0.015 $9,931
Avoided SWP and CVP salinity releases
AFY 0 17000 17000 $754 $12,818,000 0.015 $193,107
Avoided SWP and CVP OMR releases
AFY 0 5708 5708 $743 $4,241,044 0.015 $63,893
Reduced drownings Drownings 0.62 0 0.62 $7,000,000 $4,340,000 0.015 $65,383
Energy savings Dollars 98,062 0 98,062 $1 $98,062 0.015 $1,477
Bromate cancer reduction
Excess cancer / yr
0.87 0.77 0.10 $7,000,000 $700,000 0.015 $10,546
Canal Maintenance Savings
Dollars $360,000 $0 $360,000 $1 $360,000 0.015 $5,424
Avoided Patrolling Dollars $129,000 $0 $129,000 $1 $129,000 0.015 $1,943
Reduced Solids Handling
Percent 1.000 0.992 0.008 $600,000 $4,800 0.015 $72
2085 Emergency Supply AFY 0 400 400 $1,648 $659,200 0.014 $9,369
Avoided SWP and CVP salinity releases
AFY 0 17000 17000 $754 $12,818,000 0.014 $182,176
Avoided SWP and CVP OMR releases
AFY 0 5708 5708 $743 $4,241,044 0.014 $60,276
Reduced drownings Drownings 0.62 0 0.62 $7,000,000 $4,340,000 0.014 $61,682
Energy savings Dollars 98,062 0 98,062 $1 $98,062 0.014 $1,394
Bromate cancer reduction
Excess cancer / yr
0.87 0.77 0.10 $7,000,000 $700,000 0.014 $9,949
Canal Maintenance Savings
Dollars $360,000 $0 $360,000 $1 $360,000 0.014 $5,117
Avoided Patrolling Dollars $129,000 $0 $129,000 $1 $129,000 0.014 $1,833
Reduced Solids Handling
Percent 1.000 0.992 0.008 $600,000 $4,800 0.014 $68
2086 Emergency Supply AFY 0 400 400 $1,648 $659,200 0.013 $8,839
Avoided SWP and CVP salinity releases
AFY 0 17000 17000 $754 $12,818,000 0.013 $171,865
Avoided SWP and CVP OMR releases
AFY 0 5708 5708 $743 $4,241,044 0.013 $56,864
Attachment 8 Benefits and Costs
Contra Costa Water District – Round 2 Stormwater Flood Management Grant Proposal 8‐57 Att8_SWF_BenCost_1of1
Table 14 – Annual Benefit (All benefits should be in 2012 dollars)
Project: Contra Costa Canal Levee Elimination and Flood Protection Project
Year Type of Benefit Measure of Benefit
Without Project
With Project
Change due to Project
Unit $ Value Annual $ Value Disc. Factor
Discounted Benefits
Reduced drownings Drownings 0.62 0 0.62 $7,000,000 $4,340,000 0.013 $58,191
Energy savings Dollars 98,062 0 98,062 $1 $98,062 0.013 $1,315
Bromate cancer reduction
Excess cancer / yr
0.87 0.77 0.10 $7,000,000 $700,000 0.013 $9,386
Canal Maintenance Savings
Dollars $360,000 $0 $360,000 $1 $360,000 0.013 $4,827
Avoided Patrolling Dollars $129,000 $0 $129,000 $1 $129,000 0.013 $1,730
Reduced Solids Handling
Percent 1.000 0.992 0.008 $600,000 $4,800 0.013 $64
2087 Emergency Supply AFY 0 400 400 $1,648 $659,200 0.013 $8,338
Avoided SWP and CVP salinity releases
AFY 0 17000 17000 $754 $12,818,000 0.013 $162,136
Avoided SWP and CVP OMR releases
AFY 0 5708 5708 $743 $4,241,044 0.013 $53,645
Reduced drownings Drownings 0.62 0 0.62 $7,000,000 $4,340,000 0.013 $54,897
Energy savings Dollars 98,062 0 98,062 $1 $98,062 0.013 $1,240
Bromate cancer reduction
Excess cancer / yr
0.87 0.77 0.10 $7,000,000 $700,000 0.013 $8,854
Canal Maintenance Savings
Dollars $360,000 $0 $360,000 $1 $360,000 0.013 $4,554
Avoided Patrolling Dollars $129,000 $0 $129,000 $1 $129,000 0.013 $1,632
Reduced Solids Handling
Percent 1.000 0.992 0.008 $600,000 $4,800 0.013 $61
2088 Emergency Supply AFY 0 400 400 $1,648 $659,200 0.012 $7,866
Avoided SWP and CVP salinity releases
AFY 0 17000 17000 $754 $12,818,000 0.012 $152,959
Avoided SWP and CVP OMR releases
AFY 0 5708 5708 $743 $4,241,044 0.012 $50,609
Reduced drownings Drownings 0.62 0 0.62 $7,000,000 $4,340,000 0.012 $51,790
Energy savings Dollars 98,062 0 98,062 $1 $98,062 0.012 $1,170
Bromate cancer reduction
Excess cancer / yr
0.87 0.77 0.10 $7,000,000 $700,000 0.012 $8,353
Canal Maintenance Savings
Dollars $360,000 $0 $360,000 $1 $360,000 0.012 $4,296
Avoided Patrolling Dollars $129,000 $0 $129,000 $1 $129,000 0.012 $1,539
Reduced Solids Handling
Percent 1.000 0.992 0.008 $600,000 $4,800 0.012 $57
2089 Emergency Supply AFY 0 400 400 $1,648 $659,200 0.011 $7,421
Avoided SWP and CVP salinity releases
AFY 0 17000 17000 $754 $12,818,000 0.011 $144,301
Avoided SWP and CVP OMR releases
AFY 0 5708 5708 $743 $4,241,044 0.011 $47,744
Reduced drownings Drownings 0.62 0 0.62 $7,000,000 $4,340,000 0.011 $48,858
Energy savings Dollars 98,062 0 98,062 $1 $98,062 0.011 $1,104
Attachment 8 Benefits and Costs
Contra Costa Water District – Round 2 Stormwater Flood Management Grant Proposal 8‐58 Att8_SWF_BenCost_1of1
Table 14 – Annual Benefit (All benefits should be in 2012 dollars)
Project: Contra Costa Canal Levee Elimination and Flood Protection Project
Year Type of Benefit Measure of Benefit
Without Project
With Project
Change due to Project
Unit $ Value Annual $ Value Disc. Factor
Discounted Benefits
Bromate cancer reduction
Excess cancer / yr
0.87 0.77 0.10 $7,000,000 $700,000 0.011 $7,880
Canal Maintenance Savings
Dollars $360,000 $0 $360,000 $1 $360,000 0.011 $4,053
Avoided Patrolling Dollars $129,000 $0 $129,000 $1 $129,000 0.011 $1,452
Reduced Solids Handling
Percent 1.000 0.992 0.008 $600,000 $4,800 0.011 $54
2090 Emergency Supply AFY 0 400 400 $1,648 $659,200 0.011 $7,001
Avoided SWP and CVP salinity releases
AFY 0 17000 17000 $754 $12,818,000 0.011 $136,133
Avoided SWP and CVP OMR releases
AFY 0 5708 5708 $743 $4,241,044 0.011 $45,042
Reduced drownings Drownings 0.62 0 0.62 $7,000,000 $4,340,000 0.011 $46,093
Energy savings Dollars 98,062 0 98,062 $1 $98,062 0.011 $1,041
Bromate cancer reduction
Excess cancer / yr
0.87 0.77 0.10 $7,000,000 $700,000 0.011 $7,434
Canal Maintenance Savings
Dollars $360,000 $0 $360,000 $1 $360,000 0.011 $3,823
Avoided Patrolling Dollars $129,000 $0 $129,000 $1 $129,000 0.011 $1,370
Reduced Solids Handling
Percent 1.000 0.992 0.008 $600,000 $4,800 0.011 $51
2091 Emergency Supply AFY 0 400 400 $1,648 $659,200 0.010 $6,605
Avoided SWP and CVP salinity releases
AFY 0 17000 17000 $754 $12,818,000 0.010 $128,427
Avoided SWP and CVP OMR releases
AFY 0 5708 5708 $743 $4,241,044 0.010 $42,492
Reduced drownings Drownings 0.62 0 0.62 $7,000,000 $4,340,000 0.010 $43,484
Energy savings Dollars 98,062 0 98,062 $1 $98,062 0.010 $983
Bromate cancer reduction
Excess cancer / yr
0.87 0.77 0.10 $7,000,000 $700,000 0.010 $7,013
Canal Maintenance Savings
Dollars $360,000 $0 $360,000 $1 $360,000 0.010 $3,607
Avoided Patrolling Dollars $129,000 $0 $129,000 $1 $129,000 0.010 $1,292
Reduced Solids Handling
Percent 1.000 0.992 0.008 $600,000 $4,800 0.010 $48
2092 Emergency Supply AFY 0 400 400 $1,648 $659,200 0.009 $6,231
Avoided SWP and CVP salinity releases
AFY 0 17000 17000 $754 $12,818,000 0.009 $121,158
Avoided SWP and CVP OMR releases
AFY 0 5708 5708 $743 $4,241,044 0.009 $40,087
Reduced drownings Drownings 0.62 0 0.62 $7,000,000 $4,340,000 0.009 $41,022
Energy savings Dollars 98,062 0 98,062 $1 $98,062 0.009 $927
Bromate cancer reduction
Excess cancer / yr
0.87 0.77 0.10 $7,000,000 $700,000 0.009 $6,617
Attachment 8 Benefits and Costs
Contra Costa Water District – Round 2 Stormwater Flood Management Grant Proposal 8‐59 Att8_SWF_BenCost_1of1
Table 14 – Annual Benefit (All benefits should be in 2012 dollars)
Project: Contra Costa Canal Levee Elimination and Flood Protection Project
Year Type of Benefit Measure of Benefit
Without Project
With Project
Change due to Project
Unit $ Value Annual $ Value Disc. Factor
Discounted Benefits
Canal Maintenance Savings
Dollars $360,000 $0 $360,000 $1 $360,000 0.009 $3,403
Avoided Patrolling Dollars $129,000 $0 $129,000 $1 $129,000 0.009 $1,219
Reduced Solids Handling
Percent 1.000 0.992 0.008 $600,000 $4,800 0.009 $45
2093 Emergency Supply AFY 0 400 400 $1,648 $659,200 0.009 $5,878
Avoided SWP and CVP salinity releases
AFY 0 17000 17000 $754 $12,818,000 0.009 $114,300
Avoided SWP and CVP OMR releases
AFY 0 5708 5708 $743 $4,241,044 0.009 $37,818
Reduced drownings Drownings 0.62 0 0.62 $7,000,000 $4,340,000 0.009 $38,700
Energy savings Dollars 98,062 0 98,062 $1 $98,062 0.009 $874
Bromate cancer reduction
Excess cancer / yr
0.87 0.77 0.10 $7,000,000 $700,000 0.009 $6,242
Canal Maintenance Savings
Dollars $360,000 $0 $360,000 $1 $360,000 0.009 $3,210
Avoided Patrolling Dollars $129,000 $0 $129,000 $1 $129,000 0.009 $1,150
Reduced Solids Handling
Percent 1.000 0.992 0.008 $600,000 $4,800 0.009 $43
2094 Emergency Supply AFY 0 400 400 $1,648 $659,200 0.008 $5,545
Avoided SWP and CVP salinity releases
AFY 0 17000 17000 $754 $12,818,000 0.008 $107,830
Avoided SWP and CVP OMR releases
AFY 0 5708 5708 $743 $4,241,044 0.008 $35,677
Reduced drownings Drownings 0.62 0 0.62 $7,000,000 $4,340,000 0.008 $36,510
Energy savings Dollars 98,062 0 98,062 $1 $98,062 0.008 $825
Bromate cancer reduction
Excess cancer / yr
0.87 0.77 0.10 $7,000,000 $700,000 0.008 $5,889
Canal Maintenance Savings
Dollars $360,000 $0 $360,000 $1 $360,000 0.008 $3,028
Avoided Patrolling Dollars $129,000 $0 $129,000 $1 $129,000 0.008 $1,085
Reduced Solids Handling
Percent 1.000 0.992 0.008 $600,000 $4,800 0.008 $40
2095 Emergency Supply AFY 0 400 400 $1,648 $659,200 0.008 $5,232
Avoided SWP and CVP salinity releases
AFY 0 17000 17000 $754 $12,818,000 0.008 $101,726
Avoided SWP and CVP OMR releases
AFY 0 5708 5708 $743 $4,241,044 0.008 $33,658
Reduced drownings Drownings 0.62 0 0.62 $7,000,000 $4,340,000 0.008 $34,443
Energy savings Dollars 98,062 0 98,062 $1 $98,062 0.008 $778
Bromate cancer reduction
Excess cancer / yr
0.87 0.77 0.10 $7,000,000 $700,000 0.008 $5,555
Canal Maintenance Savings
Dollars $360,000 $0 $360,000 $1 $360,000 0.008 $2,857
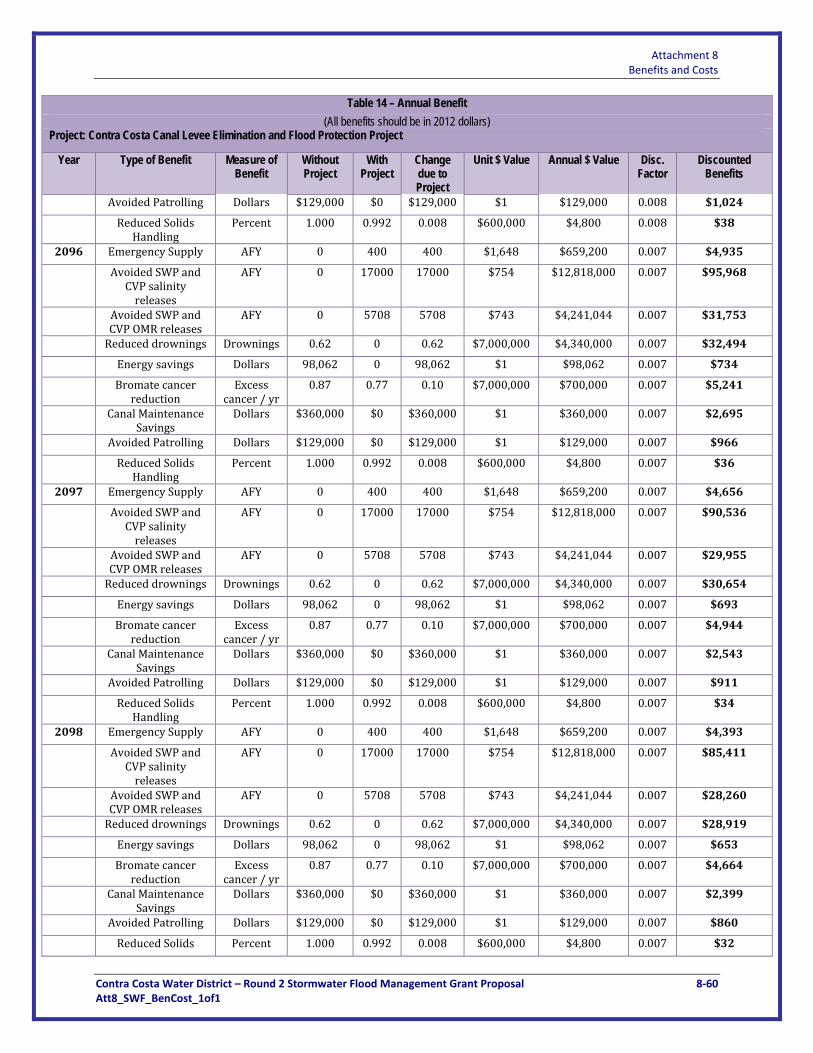
Attachment 8 Benefits and Costs
Contra Costa Water District – Round 2 Stormwater Flood Management Grant Proposal 8‐60 Att8_SWF_BenCost_1of1
Table 14 – Annual Benefit (All benefits should be in 2012 dollars)
Project: Contra Costa Canal Levee Elimination and Flood Protection Project
Year Type of Benefit Measure of Benefit
Without Project
With Project
Change due to Project
Unit $ Value Annual $ Value Disc. Factor
Discounted Benefits
Avoided Patrolling Dollars $129,000 $0 $129,000 $1 $129,000 0.008 $1,024
Reduced Solids Handling
Percent 1.000 0.992 0.008 $600,000 $4,800 0.008 $38
2096 Emergency Supply AFY 0 400 400 $1,648 $659,200 0.007 $4,935
Avoided SWP and CVP salinity releases
AFY 0 17000 17000 $754 $12,818,000 0.007 $95,968
Avoided SWP and CVP OMR releases
AFY 0 5708 5708 $743 $4,241,044 0.007 $31,753
Reduced drownings Drownings 0.62 0 0.62 $7,000,000 $4,340,000 0.007 $32,494
Energy savings Dollars 98,062 0 98,062 $1 $98,062 0.007 $734
Bromate cancer reduction
Excess cancer / yr
0.87 0.77 0.10 $7,000,000 $700,000 0.007 $5,241
Canal Maintenance Savings
Dollars $360,000 $0 $360,000 $1 $360,000 0.007 $2,695
Avoided Patrolling Dollars $129,000 $0 $129,000 $1 $129,000 0.007 $966
Reduced Solids Handling
Percent 1.000 0.992 0.008 $600,000 $4,800 0.007 $36
2097 Emergency Supply AFY 0 400 400 $1,648 $659,200 0.007 $4,656
Avoided SWP and CVP salinity releases
AFY 0 17000 17000 $754 $12,818,000 0.007 $90,536
Avoided SWP and CVP OMR releases
AFY 0 5708 5708 $743 $4,241,044 0.007 $29,955
Reduced drownings Drownings 0.62 0 0.62 $7,000,000 $4,340,000 0.007 $30,654
Energy savings Dollars 98,062 0 98,062 $1 $98,062 0.007 $693
Bromate cancer reduction
Excess cancer / yr
0.87 0.77 0.10 $7,000,000 $700,000 0.007 $4,944
Canal Maintenance Savings
Dollars $360,000 $0 $360,000 $1 $360,000 0.007 $2,543
Avoided Patrolling Dollars $129,000 $0 $129,000 $1 $129,000 0.007 $911
Reduced Solids Handling
Percent 1.000 0.992 0.008 $600,000 $4,800 0.007 $34
2098 Emergency Supply AFY 0 400 400 $1,648 $659,200 0.007 $4,393
Avoided SWP and CVP salinity releases
AFY 0 17000 17000 $754 $12,818,000 0.007 $85,411
Avoided SWP and CVP OMR releases
AFY 0 5708 5708 $743 $4,241,044 0.007 $28,260
Reduced drownings Drownings 0.62 0 0.62 $7,000,000 $4,340,000 0.007 $28,919
Energy savings Dollars 98,062 0 98,062 $1 $98,062 0.007 $653
Bromate cancer reduction
Excess cancer / yr
0.87 0.77 0.10 $7,000,000 $700,000 0.007 $4,664
Canal Maintenance Savings
Dollars $360,000 $0 $360,000 $1 $360,000 0.007 $2,399
Avoided Patrolling Dollars $129,000 $0 $129,000 $1 $129,000 0.007 $860
Reduced Solids Percent 1.000 0.992 0.008 $600,000 $4,800 0.007 $32

Attachment 8 Benefits and Costs
Contra Costa Water District – Round 2 Stormwater Flood Management Grant Proposal 8‐61 Att8_SWF_BenCost_1of1
Table 14 – Annual Benefit (All benefits should be in 2012 dollars)
Project: Contra Costa Canal Levee Elimination and Flood Protection Project
Year Type of Benefit Measure of Benefit
Without Project
With Project
Change due to Project
Unit $ Value Annual $ Value Disc. Factor
Discounted Benefits
Handling
2099 Emergency Supply AFY 0 400 400 $1,648 $659,200 0.006 $4,144
Avoided SWP and CVP salinity releases
AFY 0 17000 17000 $754 $12,818,000 0.006 $80,577
Avoided SWP and CVP OMR releases
AFY 0 5708 5708 $743 $4,241,044 0.006 $26,660
Reduced drownings Drownings 0.62 0 0.62 $7,000,000 $4,340,000 0.006 $27,282
Energy savings Dollars 98,062 0 98,062 $1 $98,062 0.006 $616
Bromate cancer reduction
Excess cancer / yr
0.87 0.77 0.10 $7,000,000 $700,000 0.006 $4,400
Canal Maintenance Savings
Dollars $360,000 $0 $360,000 $1 $360,000 0.006 $2,263
Avoided Patrolling Dollars $129,000 $0 $129,000 $1 $129,000 0.006 $811
Reduced Solids Handling
Percent 1.000 0.992 0.008 $600,000 $4,800 0.006 $30
2100 Emergency Supply AFY 0 400 400 $1,648 $659,200 0.006 $3,909
Avoided SWP and CVP salinity releases
AFY 0 17000 17000 $754 $12,818,000 0.006 $76,016
Avoided SWP and CVP OMR releases
AFY 0 5708 5708 $743 $4,241,044 0.006 $25,151
Reduced drownings Drownings 0.62 0 0.62 $7,000,000 $4,340,000 0.006 $25,738
Energy savings Dollars 98,062 0 98,062 $1 $98,062 0.006 $582
Bromate cancer reduction
Excess cancer / yr
0.87 0.77 0.10 $7,000,000 $700,000 0.006 $4,151
Canal Maintenance Savings
Dollars $360,000 $0 $360,000 $1 $360,000 0.006 $2,135
Avoided Patrolling Dollars $129,000 $0 $129,000 $1 $129,000 0.006 $765
Reduced Solids Handling
Percent 1.000 0.992 0.008 $600,000 $4,800 0.006 $28
2101 Emergency Supply AFY 0 400 400 $1,648 $659,200 0.006 $3,688
Avoided SWP and CVP salinity releases
AFY 0 17000 17000 $754 $12,818,000 0.006 $71,713
Avoided SWP and CVP OMR releases
AFY 0 5708 5708 $743 $4,241,044 0.006 $23,727
Reduced drownings Drownings 0.62 0 0.62 $7,000,000 $4,340,000 0.006 $24,281
Energy savings Dollars 98,062 0 98,062 $1 $98,062 0.006 $549
Bromate cancer reduction
Excess cancer / yr
0.87 0.77 0.10 $7,000,000 $700,000 0.006 $3,916
Canal Maintenance Savings
Dollars $360,000 $0 $360,000 $1 $360,000 0.006 $2,014
Avoided Patrolling Dollars $129,000 $0 $129,000 $1 $129,000 0.006 $722
Reduced Solids Handling
Percent 1.000 0.992 0.008 $600,000 $4,800 0.006 $27
2102 Emergency Supply AFY 0 400 400 $1,648 $659,200 0.005 $3,479

Attachment 8 Benefits and Costs
Contra Costa Water District – Round 2 Stormwater Flood Management Grant Proposal 8‐62 Att8_SWF_BenCost_1of1
Table 14 – Annual Benefit (All benefits should be in 2012 dollars)
Project: Contra Costa Canal Levee Elimination and Flood Protection Project
Year Type of Benefit Measure of Benefit
Without Project
With Project
Change due to Project
Unit $ Value Annual $ Value Disc. Factor
Discounted Benefits
Avoided SWP and CVP salinity releases
AFY 0 17000 17000 $754 $12,818,000 0.005 $67,654
Avoided SWP and CVP OMR releases
AFY 0 5708 5708 $743 $4,241,044 0.005 $22,384
Reduced drownings Drownings 0.62 0 0.62 $7,000,000 $4,340,000 0.005 $22,907
Energy savings Dollars 98,062 0 98,062 $1 $98,062 0.005 $518
Bromate cancer reduction
Excess cancer / yr
0.87 0.77 0.10 $7,000,000 $700,000 0.005 $3,695
Canal Maintenance Savings
Dollars $360,000 $0 $360,000 $1 $360,000 0.005 $1,900
Avoided Patrolling Dollars $129,000 $0 $129,000 $1 $129,000 0.005 $681
Reduced Solids Handling
Percent 1.000 0.992 0.008 $600,000 $4,800 0.005 $25
2103 Emergency Supply AFY 0 400 400 $1,648 $659,200 0.005 $3,282
Avoided SWP and CVP salinity releases
AFY 0 17000 17000 $754 $12,818,000 0.005 $63,824
Avoided SWP and CVP OMR releases
AFY 0 5708 5708 $743 $4,241,044 0.005 $21,117
Reduced drownings Drownings 0.62 0 0.62 $7,000,000 $4,340,000 0.005 $21,610
Energy savings Dollars 98,062 0 98,062 $1 $98,062 0.005 $488
Bromate cancer reduction
Excess cancer / yr
0.87 0.77 0.10 $7,000,000 $700,000 0.005 $3,485
Canal Maintenance Savings
Dollars $360,000 $0 $360,000 $1 $360,000 0.005 $1,793
Avoided Patrolling Dollars $129,000 $0 $129,000 $1 $129,000 0.005 $642
Reduced Solids Handling
Percent 1.000 0.992 0.008 $600,000 $4,800 0.005 $24
2104 Emergency Supply AFY 0 400 400 $1,648 $659,200 0.005 $3,097
Avoided SWP and CVP salinity releases
AFY 0 17000 17000 $754 $12,818,000 0.005 $60,212
Avoided SWP and CVP OMR releases
AFY 0 5708 5708 $743 $4,241,044 0.005 $19,922
Reduced drownings Drownings 0.62 0 0.62 $7,000,000 $4,340,000 0.005 $20,387
Energy savings Dollars 98,062 0 98,062 $1 $98,062 0.005 $461
Bromate cancer reduction
Excess cancer / yr
0.87 0.77 0.10 $7,000,000 $700,000 0.005 $3,288
Canal Maintenance Savings
Dollars $360,000 $0 $360,000 $1 $360,000 0.005 $1,691
Avoided Patrolling Dollars $129,000 $0 $129,000 $1 $129,000 0.005 $606
Reduced Solids Handling
Percent 1.000 0.992 0.008 $600,000 $4,800 0.005 $23
2105 Emergency Supply AFY 0 400 400 $1,648 $659,200 0.004 $2,921
Avoided SWP and CVP salinity
AFY 0 17000 17000 $754 $12,818,000 0.004 $56,803
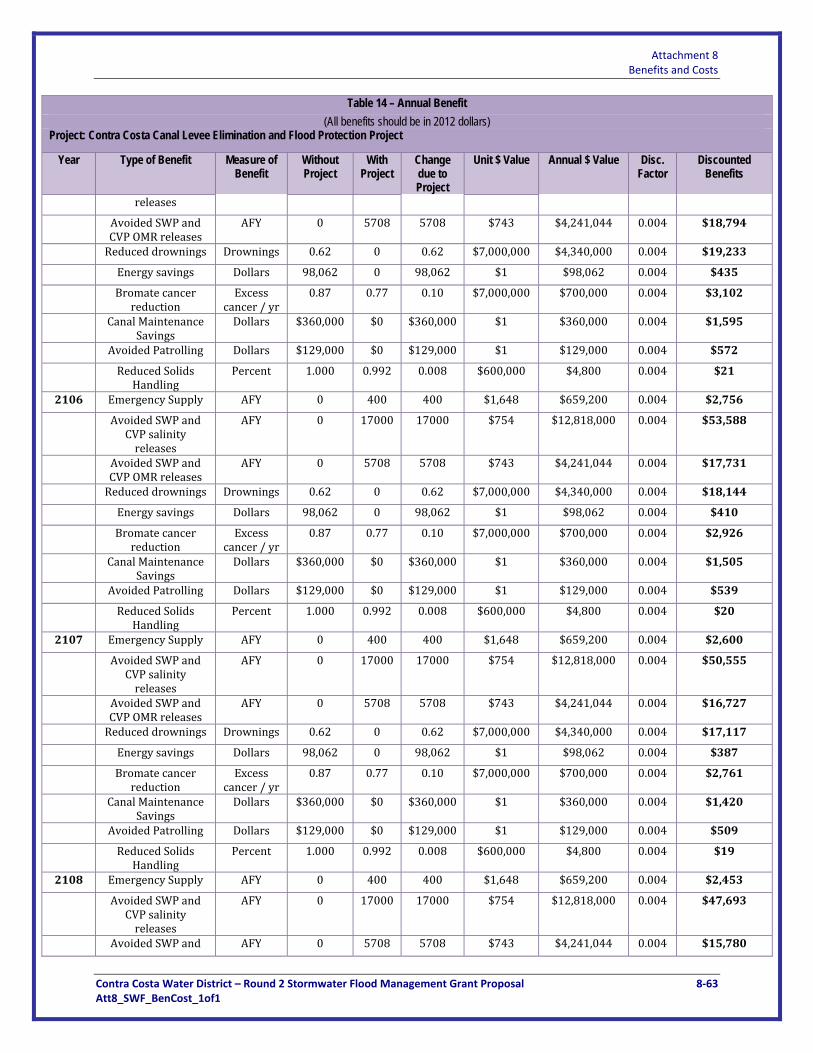
Attachment 8 Benefits and Costs
Contra Costa Water District – Round 2 Stormwater Flood Management Grant Proposal 8‐63 Att8_SWF_BenCost_1of1
Table 14 – Annual Benefit (All benefits should be in 2012 dollars)
Project: Contra Costa Canal Levee Elimination and Flood Protection Project
Year Type of Benefit Measure of Benefit
Without Project
With Project
Change due to Project
Unit $ Value Annual $ Value Disc. Factor
Discounted Benefits
releases
Avoided SWP and CVP OMR releases
AFY 0 5708 5708 $743 $4,241,044 0.004 $18,794
Reduced drownings Drownings 0.62 0 0.62 $7,000,000 $4,340,000 0.004 $19,233
Energy savings Dollars 98,062 0 98,062 $1 $98,062 0.004 $435
Bromate cancer reduction
Excess cancer / yr
0.87 0.77 0.10 $7,000,000 $700,000 0.004 $3,102
Canal Maintenance Savings
Dollars $360,000 $0 $360,000 $1 $360,000 0.004 $1,595
Avoided Patrolling Dollars $129,000 $0 $129,000 $1 $129,000 0.004 $572
Reduced Solids Handling
Percent 1.000 0.992 0.008 $600,000 $4,800 0.004 $21
2106 Emergency Supply AFY 0 400 400 $1,648 $659,200 0.004 $2,756
Avoided SWP and CVP salinity releases
AFY 0 17000 17000 $754 $12,818,000 0.004 $53,588
Avoided SWP and CVP OMR releases
AFY 0 5708 5708 $743 $4,241,044 0.004 $17,731
Reduced drownings Drownings 0.62 0 0.62 $7,000,000 $4,340,000 0.004 $18,144
Energy savings Dollars 98,062 0 98,062 $1 $98,062 0.004 $410
Bromate cancer reduction
Excess cancer / yr
0.87 0.77 0.10 $7,000,000 $700,000 0.004 $2,926
Canal Maintenance Savings
Dollars $360,000 $0 $360,000 $1 $360,000 0.004 $1,505
Avoided Patrolling Dollars $129,000 $0 $129,000 $1 $129,000 0.004 $539
Reduced Solids Handling
Percent 1.000 0.992 0.008 $600,000 $4,800 0.004 $20
2107 Emergency Supply AFY 0 400 400 $1,648 $659,200 0.004 $2,600
Avoided SWP and CVP salinity releases
AFY 0 17000 17000 $754 $12,818,000 0.004 $50,555
Avoided SWP and CVP OMR releases
AFY 0 5708 5708 $743 $4,241,044 0.004 $16,727
Reduced drownings Drownings 0.62 0 0.62 $7,000,000 $4,340,000 0.004 $17,117
Energy savings Dollars 98,062 0 98,062 $1 $98,062 0.004 $387
Bromate cancer reduction
Excess cancer / yr
0.87 0.77 0.10 $7,000,000 $700,000 0.004 $2,761
Canal Maintenance Savings
Dollars $360,000 $0 $360,000 $1 $360,000 0.004 $1,420
Avoided Patrolling Dollars $129,000 $0 $129,000 $1 $129,000 0.004 $509
Reduced Solids Handling
Percent 1.000 0.992 0.008 $600,000 $4,800 0.004 $19
2108 Emergency Supply AFY 0 400 400 $1,648 $659,200 0.004 $2,453
Avoided SWP and CVP salinity releases
AFY 0 17000 17000 $754 $12,818,000 0.004 $47,693
Avoided SWP and AFY 0 5708 5708 $743 $4,241,044 0.004 $15,780
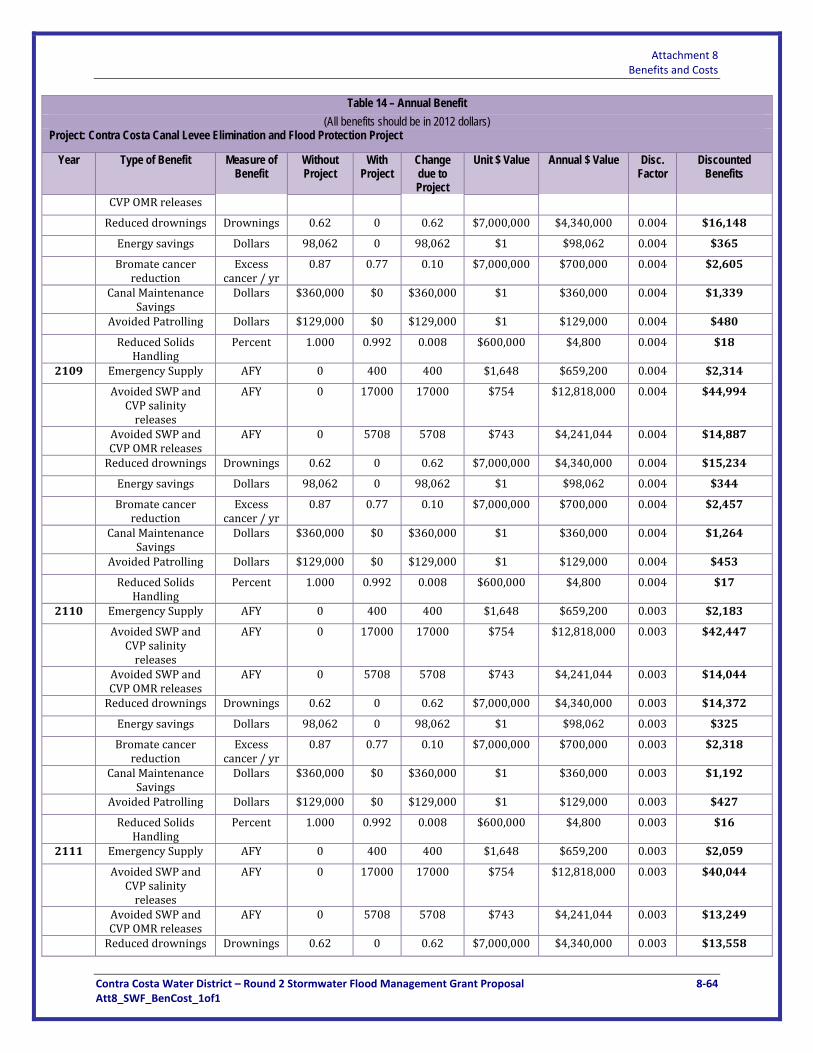
Attachment 8 Benefits and Costs
Contra Costa Water District – Round 2 Stormwater Flood Management Grant Proposal 8‐64 Att8_SWF_BenCost_1of1
Table 14 – Annual Benefit (All benefits should be in 2012 dollars)
Project: Contra Costa Canal Levee Elimination and Flood Protection Project
Year Type of Benefit Measure of Benefit
Without Project
With Project
Change due to Project
Unit $ Value Annual $ Value Disc. Factor
Discounted Benefits
CVP OMR releases
Reduced drownings Drownings 0.62 0 0.62 $7,000,000 $4,340,000 0.004 $16,148
Energy savings Dollars 98,062 0 98,062 $1 $98,062 0.004 $365
Bromate cancer reduction
Excess cancer / yr
0.87 0.77 0.10 $7,000,000 $700,000 0.004 $2,605
Canal Maintenance Savings
Dollars $360,000 $0 $360,000 $1 $360,000 0.004 $1,339
Avoided Patrolling Dollars $129,000 $0 $129,000 $1 $129,000 0.004 $480
Reduced Solids Handling
Percent 1.000 0.992 0.008 $600,000 $4,800 0.004 $18
2109 Emergency Supply AFY 0 400 400 $1,648 $659,200 0.004 $2,314
Avoided SWP and CVP salinity releases
AFY 0 17000 17000 $754 $12,818,000 0.004 $44,994
Avoided SWP and CVP OMR releases
AFY 0 5708 5708 $743 $4,241,044 0.004 $14,887
Reduced drownings Drownings 0.62 0 0.62 $7,000,000 $4,340,000 0.004 $15,234
Energy savings Dollars 98,062 0 98,062 $1 $98,062 0.004 $344
Bromate cancer reduction
Excess cancer / yr
0.87 0.77 0.10 $7,000,000 $700,000 0.004 $2,457
Canal Maintenance Savings
Dollars $360,000 $0 $360,000 $1 $360,000 0.004 $1,264
Avoided Patrolling Dollars $129,000 $0 $129,000 $1 $129,000 0.004 $453
Reduced Solids Handling
Percent 1.000 0.992 0.008 $600,000 $4,800 0.004 $17
2110 Emergency Supply AFY 0 400 400 $1,648 $659,200 0.003 $2,183
Avoided SWP and CVP salinity releases
AFY 0 17000 17000 $754 $12,818,000 0.003 $42,447
Avoided SWP and CVP OMR releases
AFY 0 5708 5708 $743 $4,241,044 0.003 $14,044
Reduced drownings Drownings 0.62 0 0.62 $7,000,000 $4,340,000 0.003 $14,372
Energy savings Dollars 98,062 0 98,062 $1 $98,062 0.003 $325
Bromate cancer reduction
Excess cancer / yr
0.87 0.77 0.10 $7,000,000 $700,000 0.003 $2,318
Canal Maintenance Savings
Dollars $360,000 $0 $360,000 $1 $360,000 0.003 $1,192
Avoided Patrolling Dollars $129,000 $0 $129,000 $1 $129,000 0.003 $427
Reduced Solids Handling
Percent 1.000 0.992 0.008 $600,000 $4,800 0.003 $16
2111 Emergency Supply AFY 0 400 400 $1,648 $659,200 0.003 $2,059
Avoided SWP and CVP salinity releases
AFY 0 17000 17000 $754 $12,818,000 0.003 $40,044
Avoided SWP and CVP OMR releases
AFY 0 5708 5708 $743 $4,241,044 0.003 $13,249
Reduced drownings Drownings 0.62 0 0.62 $7,000,000 $4,340,000 0.003 $13,558

Attachment 8 Benefits and Costs
Contra Costa Water District – Round 2 Stormwater Flood Management Grant Proposal 8‐65 Att8_SWF_BenCost_1of1
Table 14 – Annual Benefit (All benefits should be in 2012 dollars)
Project: Contra Costa Canal Levee Elimination and Flood Protection Project
Year Type of Benefit Measure of Benefit
Without Project
With Project
Change due to Project
Unit $ Value Annual $ Value Disc. Factor
Discounted Benefits
Energy savings Dollars 98,062 0 98,062 $1 $98,062 0.003 $306
Bromate cancer reduction
Excess cancer / yr
0.87 0.77 0.10 $7,000,000 $700,000 0.003 $2,187
Canal Maintenance Savings
Dollars $360,000 $0 $360,000 $1 $360,000 0.003 $1,125
Avoided Patrolling Dollars $129,000 $0 $129,000 $1 $129,000 0.003 $403
Reduced Solids Handling
Percent 1.000 0.992 0.008 $600,000 $4,800 0.003 $15
2112 Emergency Supply AFY 0 400 400 $1,648 $659,200 0.003 $1,943
Avoided SWP and CVP salinity releases
AFY 0 17000 17000 $754 $12,818,000 0.003 $37,778
Avoided SWP and CVP OMR releases
AFY 0 5708 5708 $743 $4,241,044 0.003 $12,499
Reduced drownings Drownings 0.62 0 0.62 $7,000,000 $4,340,000 0.003 $12,791
Energy savings Dollars 98,062 0 98,062 $1 $98,062 0.003 $289
Bromate cancer reduction
Excess cancer / yr
0.87 0.77 0.10 $7,000,000 $700,000 0.003 $2,063
Canal Maintenance Savings
Dollars $360,000 $0 $360,000 $1 $360,000 0.003 $1,061
Avoided Patrolling Dollars $129,000 $0 $129,000 $1 $129,000 0.003 $380
Reduced Solids Handling
Percent 1.000 0.992 0.008 $600,000 $4,800 0.003 $14
2113 Emergency Supply AFY 0 400 400 $1,648 $659,200 0.003 $1,833
Avoided SWP and CVP salinity releases
AFY 0 17000 17000 $754 $12,818,000 0.003 $35,639
Avoided SWP and CVP OMR releases
AFY 0 5708 5708 $743 $4,241,044 0.003 $11,792
Reduced drownings Drownings 0.62 0 0.62 $7,000,000 $4,340,000 0.003 $12,067
Energy savings Dollars 98,062 0 98,062 $1 $98,062 0.003 $273
Bromate cancer reduction
Excess cancer / yr
0.87 0.77 0.10 $7,000,000 $700,000 0.003 $1,946
Canal Maintenance Savings
Dollars $360,000 $0 $360,000 $1 $360,000 0.003 $1,001
Avoided Patrolling Dollars $129,000 $0 $129,000 $1 $129,000 0.003 $359
Reduced Solids Handling
Percent 1.000 0.992 0.008 $600,000 $4,800 0.003 $13
2114 Emergency Supply AFY 0 400 400 $1,648 $659,200 0.003 $1,729
Avoided SWP and CVP salinity releases
AFY 0 17000 17000 $754 $12,818,000 0.003 $33,622
Avoided SWP and CVP OMR releases
AFY 0 5708 5708 $743 $4,241,044 0.003 $11,124
Reduced drownings Drownings 0.62 0 0.62 $7,000,000 $4,340,000 0.003 $11,384
Energy savings Dollars 98,062 0 98,062 $1 $98,062 0.003 $257
Bromate cancer Excess 0.87 0.77 0.10 $7,000,000 $700,000 0.003 $1,836

Attachment 8 Benefits and Costs
Contra Costa Water District – Round 2 Stormwater Flood Management Grant Proposal 8‐66 Att8_SWF_BenCost_1of1
Table 14 – Annual Benefit (All benefits should be in 2012 dollars)
Project: Contra Costa Canal Levee Elimination and Flood Protection Project
Year Type of Benefit Measure of Benefit
Without Project
With Project
Change due to Project
Unit $ Value Annual $ Value Disc. Factor
Discounted Benefits
reduction cancer / yr
Canal Maintenance Savings
Dollars $360,000 $0 $360,000 $1 $360,000 0.003 $944
Avoided Patrolling Dollars $129,000 $0 $129,000 $1 $129,000 0.003 $338
Reduced Solids Handling
Percent 1.000 0.992 0.008 $600,000 $4,800 0.003 $13
2115 Emergency Supply AFY 0 400 400 $1,648 $659,200 0.002 $1,631
Avoided SWP and CVP salinity releases
AFY 0 17000 17000 $754 $12,818,000 0.002 $31,719
Avoided SWP and CVP OMR releases
AFY 0 5708 5708 $743 $4,241,044 0.002 $10,495
Reduced drownings Drownings 0.62 0 0.62 $7,000,000 $4,340,000 0.002 $10,740
Energy savings Dollars 98,062 0 98,062 $1 $98,062 0.002 $243
Bromate cancer reduction
Excess cancer / yr
0.87 0.77 0.10 $7,000,000 $700,000 0.002 $1,732
Canal Maintenance Savings
Dollars $360,000 $0 $360,000 $1 $360,000 0.002 $891
Avoided Patrolling Dollars $129,000 $0 $129,000 $1 $129,000 0.002 $319
Reduced Solids Handling
Percent 1.000 0.992 0.008 $600,000 $4,800 0.002 $12
2116 Emergency Supply AFY 0 400 400 $1,648 $659,200 0.002 $1,539
Avoided SWP and CVP salinity releases
AFY 0 17000 17000 $754 $12,818,000 0.002 $29,923
Avoided SWP and CVP OMR releases
AFY 0 5708 5708 $743 $4,241,044 0.002 $9,901
Reduced drownings Drownings 0.62 0 0.62 $7,000,000 $4,340,000 0.002 $10,132
Energy savings Dollars 98,062 0 98,062 $1 $98,062 0.002 $229
Bromate cancer reduction
Excess cancer / yr
0.87 0.77 0.10 $7,000,000 $700,000 0.002 $1,634
Canal Maintenance Savings
Dollars $360,000 $0 $360,000 $1 $360,000 0.002 $840
Avoided Patrolling Dollars $129,000 $0 $129,000 $1 $129,000 0.002 $301
Reduced Solids Handling
Percent 1.000 0.992 0.008 $600,000 $4,800 0.002 $11
2117 Emergency Supply AFY 0 400 400 $1,648 $659,200 0.002 $1,452
Avoided SWP and CVP salinity releases
AFY 0 17000 17000 $754 $12,818,000 0.002 $28,230
Avoided SWP and CVP OMR releases
AFY 0 5708 5708 $743 $4,241,044 0.002 $9,340
Reduced drownings Drownings 0.62 0 0.62 $7,000,000 $4,340,000 0.002 $9,558
Energy savings Dollars 98,062 0 98,062 $1 $98,062 0.002 $216
Bromate cancer reduction
Excess cancer / yr
0.87 0.77 0.10 $7,000,000 $700,000 0.002 $1,542
Canal Maintenance Dollars $360,000 $0 $360,000 $1 $360,000 0.002 $793
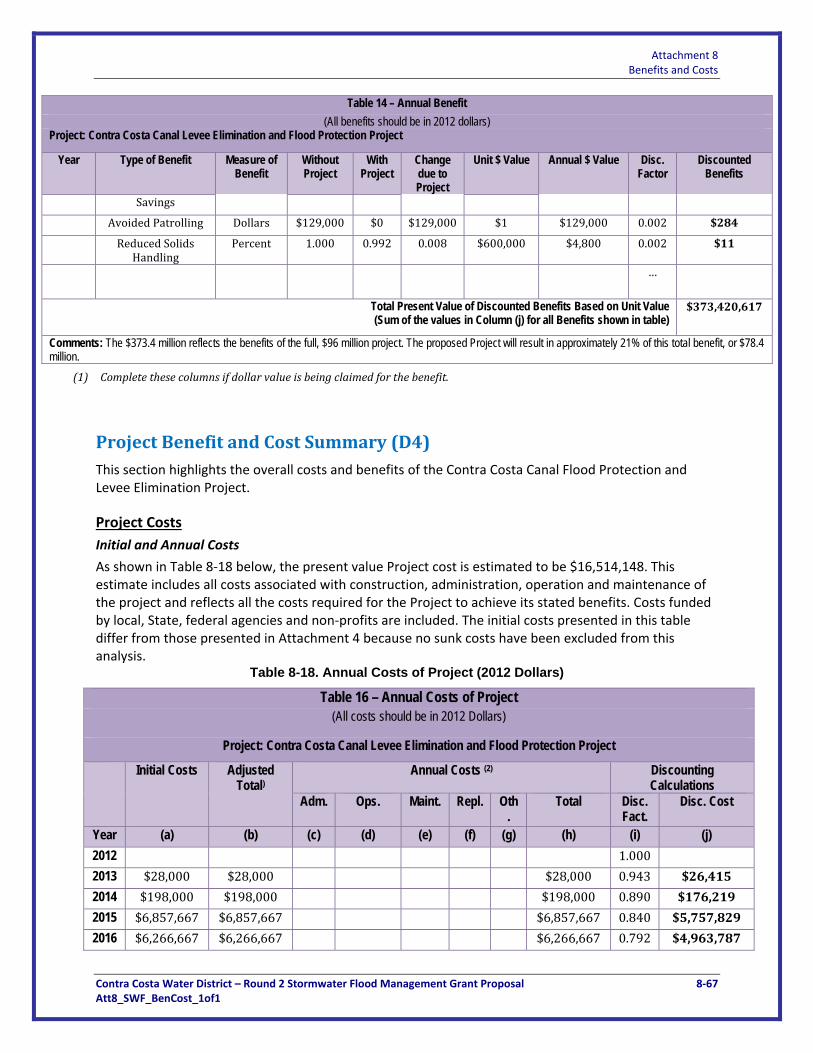
Attachment 8 Benefits and Costs
Contra Costa Water District – Round 2 Stormwater Flood Management Grant Proposal 8‐67 Att8_SWF_BenCost_1of1
Table 14 – Annual Benefit (All benefits should be in 2012 dollars)
Project: Contra Costa Canal Levee Elimination and Flood Protection Project
Year Type of Benefit Measure of Benefit
Without Project
With Project
Change due to Project
Unit $ Value Annual $ Value Disc. Factor
Discounted Benefits
Savings
Avoided Patrolling Dollars $129,000 $0 $129,000 $1 $129,000 0.002 $284
Reduced Solids Handling
Percent 1.000 0.992 0.008 $600,000 $4,800 0.002 $11
…
Total Present Value of Discounted Benefits Based on Unit Value (Sum of the values in Column (j) for all Benefits shown in table)
$373,420,617
Comments: The $373.4 million reflects the benefits of the full, $96 million project. The proposed Project will result in approximately 21% of this total benefit, or $78.4 million.
(1) Complete these columns if dollar value is being claimed for the benefit.
Project Benefit and Cost Summary (D4)
This section highlights the overall costs and benefits of the Contra Costa Canal Flood Protection and Levee Elimination Project.
Project Costs
Initial and Annual Costs
As shown in Table 8‐18 below, the present value Project cost is estimated to be $16,514,148. This estimate includes all costs associated with construction, administration, operation and maintenance of the project and reflects all the costs required for the Project to achieve its stated benefits. Costs funded by local, State, federal agencies and non‐profits are included. The initial costs presented in this table differ from those presented in Attachment 4 because no sunk costs have been excluded from this analysis.
Table 8-18. Annual Costs of Project (2012 Dollars)
Table 16 – Annual Costs of Project (All costs should be in 2012 Dollars)
Project: Contra Costa Canal Levee Elimination and Flood Protection Project
Initial Costs Adjusted Total)
Annual Costs (2) Discounting Calculations
Adm. Ops. Maint. Repl. Oth.
Total Disc. Fact.
Disc. Cost
Year (a) (b) (c) (d) (e) (f) (g) (h) (i) (j) 2012 1.000 2013 $28,000 $28,000 $28,000 0.943 $26,415
2014 $198,000 $198,000 $198,000 0.890 $176,219
2015 $6,857,667 $6,857,667 $6,857,667 0.840 $5,757,829
2016 $6,266,667 $6,266,667 $6,266,667 0.792 $4,963,787

Attachment 8 Benefits and Costs
Contra Costa Water District – Round 2 Stormwater Flood Management Grant Proposal 8‐68 Att8_SWF_BenCost_1of1
Table 16 – Annual Costs of Project (All costs should be in 2012 Dollars)
Project: Contra Costa Canal Levee Elimination and Flood Protection Project
Initial Costs Adjusted Total)
Annual Costs (2) Discounting Calculations
Adm. Ops. Maint. Repl. Oth.
Total Disc. Fact.
Disc. Cost
Year (a) (b) (c) (d) (e) (f) (g) (h) (i) (j) 2017 $6,649,667 $6,649,667 $6,649,667 0.747 $4,969,018
2018 $50,000 $50,000 0.705 $35,248
2019 $50,000 $50,000 0.665 $33,253
2020 $50,000 $50,000 0.627 $31,371
2021 $50,000 $50,000 0.592 $29,595
2022 $50,000 $50,000 0.558 $27,920
2023 $50,000 $50,000 0.527 $26,339
2024 $50,000 $50,000 0.497 $24,848
2025 $50,000 $50,000 0.469 $23,442
2026 $50,000 $50,000 0.442 $22,115
2027 $50,000 $50,000 0.417 $20,863
2028 $50,000 $50,000 0.394 $19,682
2029 $50,000 $50,000 0.371 $18,568
2030 $50,000 $50,000 0.350 $17,517
2031 $50,000 $50,000 0.331 $16,526
2032 $50,000 $50,000 0.312 $15,590
2033 $50,000 $50,000 0.294 $14,708
2034 $50,000 $50,000 0.278 $13,875
2035 $50,000 $50,000 0.262 $13,090
2036 $50,000 $50,000 0.247 $12,349
2037 $50,000 $50,000 0.233 $11,650
2038 $50,000 $50,000 0.220 $10,991
2039 $50,000 $50,000 0.207 $10,368
2040 $50,000 $50,000 0.196 $9,782
2041 $50,000 $50,000 0.185 $9,228
2042 $50,000 $50,000 0.174 $8,706
2043 $50,000 $50,000 0.164 $8,213
2044 $50,000 $50,000 0.155 $7,748
2045 $50,000 $50,000 0.146 $7,309
2046 $50,000 $50,000 0.138 $6,896
2047 $50,000 $50,000 0.130 $6,505
2048 $50,000 $50,000 0.123 $6,137
2049 $50,000 $50,000 0.116 $5,790
2050 $50,000 $50,000 0.109 $5,462
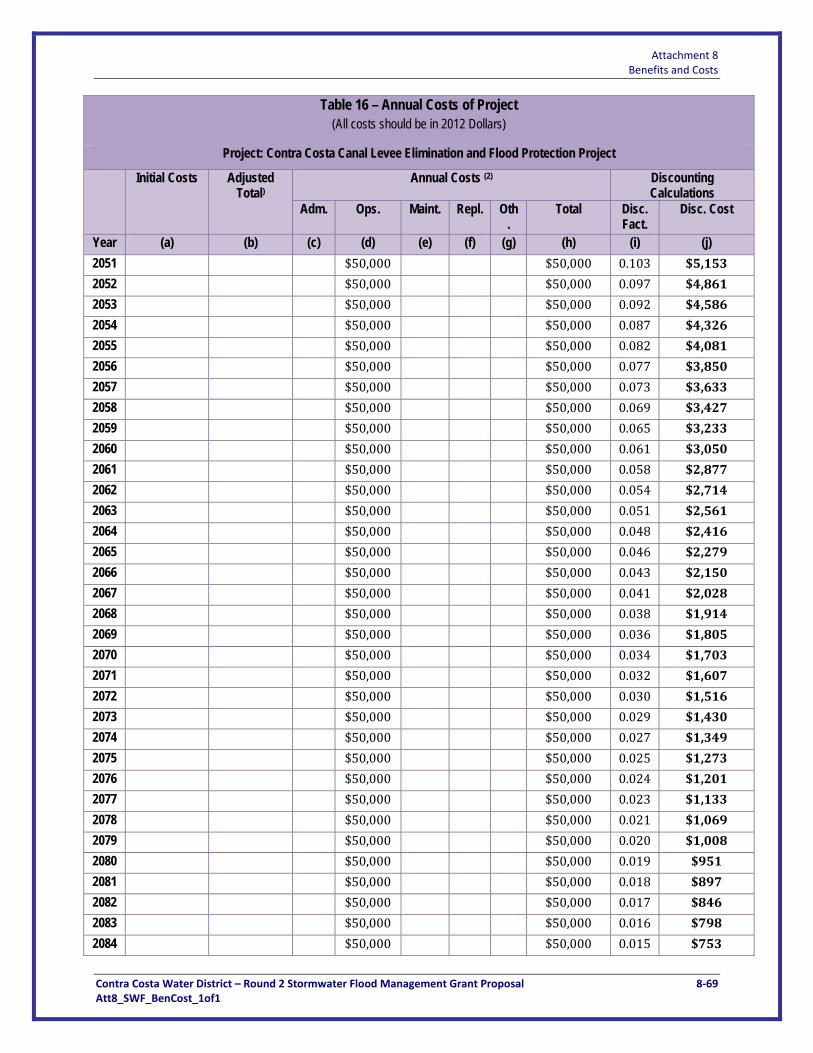
Attachment 8 Benefits and Costs
Contra Costa Water District – Round 2 Stormwater Flood Management Grant Proposal 8‐69 Att8_SWF_BenCost_1of1
Table 16 – Annual Costs of Project (All costs should be in 2012 Dollars)
Project: Contra Costa Canal Levee Elimination and Flood Protection Project
Initial Costs Adjusted Total)
Annual Costs (2) Discounting Calculations
Adm. Ops. Maint. Repl. Oth.
Total Disc. Fact.
Disc. Cost
Year (a) (b) (c) (d) (e) (f) (g) (h) (i) (j) 2051 $50,000 $50,000 0.103 $5,153
2052 $50,000 $50,000 0.097 $4,861
2053 $50,000 $50,000 0.092 $4,586
2054 $50,000 $50,000 0.087 $4,326
2055 $50,000 $50,000 0.082 $4,081
2056 $50,000 $50,000 0.077 $3,850
2057 $50,000 $50,000 0.073 $3,633
2058 $50,000 $50,000 0.069 $3,427
2059 $50,000 $50,000 0.065 $3,233
2060 $50,000 $50,000 0.061 $3,050
2061 $50,000 $50,000 0.058 $2,877
2062 $50,000 $50,000 0.054 $2,714
2063 $50,000 $50,000 0.051 $2,561
2064 $50,000 $50,000 0.048 $2,416
2065 $50,000 $50,000 0.046 $2,279
2066 $50,000 $50,000 0.043 $2,150
2067 $50,000 $50,000 0.041 $2,028
2068 $50,000 $50,000 0.038 $1,914
2069 $50,000 $50,000 0.036 $1,805
2070 $50,000 $50,000 0.034 $1,703
2071 $50,000 $50,000 0.032 $1,607
2072 $50,000 $50,000 0.030 $1,516
2073 $50,000 $50,000 0.029 $1,430
2074 $50,000 $50,000 0.027 $1,349
2075 $50,000 $50,000 0.025 $1,273
2076 $50,000 $50,000 0.024 $1,201
2077 $50,000 $50,000 0.023 $1,133
2078 $50,000 $50,000 0.021 $1,069
2079 $50,000 $50,000 0.020 $1,008
2080 $50,000 $50,000 0.019 $951
2081 $50,000 $50,000 0.018 $897
2082 $50,000 $50,000 0.017 $846
2083 $50,000 $50,000 0.016 $798
2084 $50,000 $50,000 0.015 $753
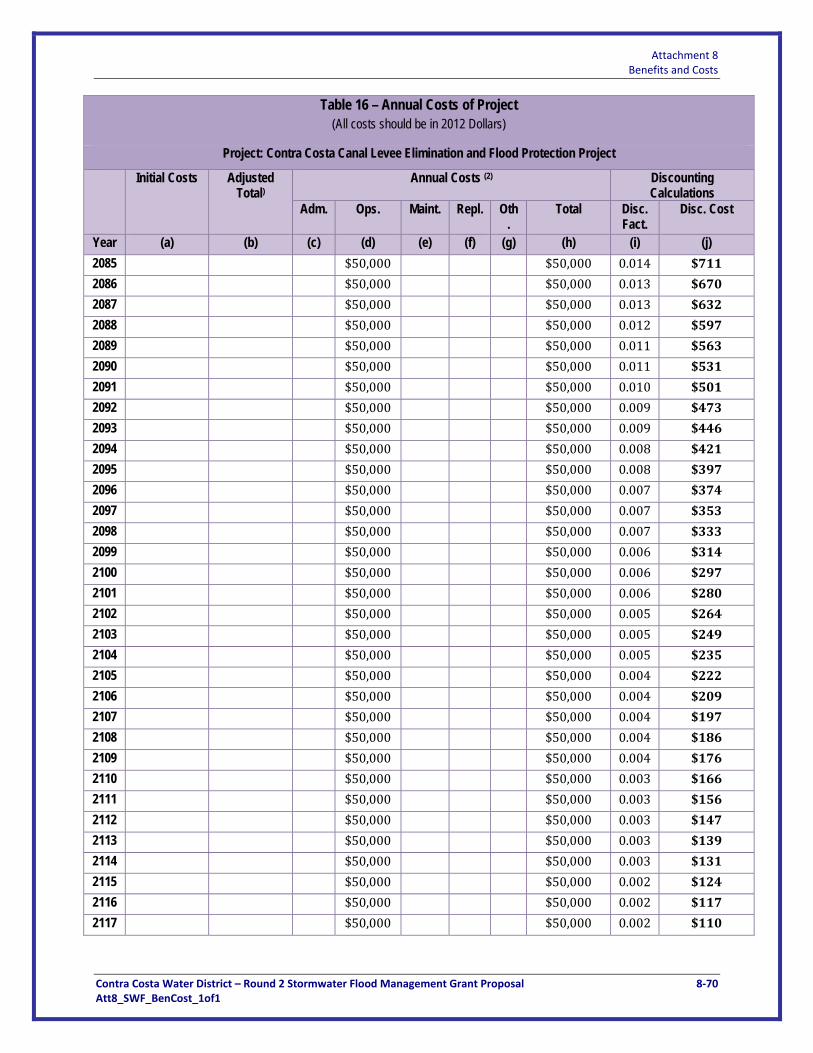
Attachment 8 Benefits and Costs
Contra Costa Water District – Round 2 Stormwater Flood Management Grant Proposal 8‐70 Att8_SWF_BenCost_1of1
Table 16 – Annual Costs of Project (All costs should be in 2012 Dollars)
Project: Contra Costa Canal Levee Elimination and Flood Protection Project
Initial Costs Adjusted Total)
Annual Costs (2) Discounting Calculations
Adm. Ops. Maint. Repl. Oth.
Total Disc. Fact.
Disc. Cost
Year (a) (b) (c) (d) (e) (f) (g) (h) (i) (j) 2085 $50,000 $50,000 0.014 $711
2086 $50,000 $50,000 0.013 $670
2087 $50,000 $50,000 0.013 $632
2088 $50,000 $50,000 0.012 $597
2089 $50,000 $50,000 0.011 $563
2090 $50,000 $50,000 0.011 $531
2091 $50,000 $50,000 0.010 $501
2092 $50,000 $50,000 0.009 $473
2093 $50,000 $50,000 0.009 $446
2094 $50,000 $50,000 0.008 $421
2095 $50,000 $50,000 0.008 $397
2096 $50,000 $50,000 0.007 $374
2097 $50,000 $50,000 0.007 $353
2098 $50,000 $50,000 0.007 $333
2099 $50,000 $50,000 0.006 $314
2100 $50,000 $50,000 0.006 $297
2101 $50,000 $50,000 0.006 $280
2102 $50,000 $50,000 0.005 $264
2103 $50,000 $50,000 0.005 $249
2104 $50,000 $50,000 0.005 $235
2105 $50,000 $50,000 0.004 $222
2106 $50,000 $50,000 0.004 $209
2107 $50,000 $50,000 0.004 $197
2108 $50,000 $50,000 0.004 $186
2109 $50,000 $50,000 0.004 $176
2110 $50,000 $50,000 0.003 $166
2111 $50,000 $50,000 0.003 $156
2112 $50,000 $50,000 0.003 $147
2113 $50,000 $50,000 0.003 $139
2114 $50,000 $50,000 0.003 $131
2115 $50,000 $50,000 0.002 $124
2116 $50,000 $50,000 0.002 $117
2117 $50,000 $50,000 0.002 $110
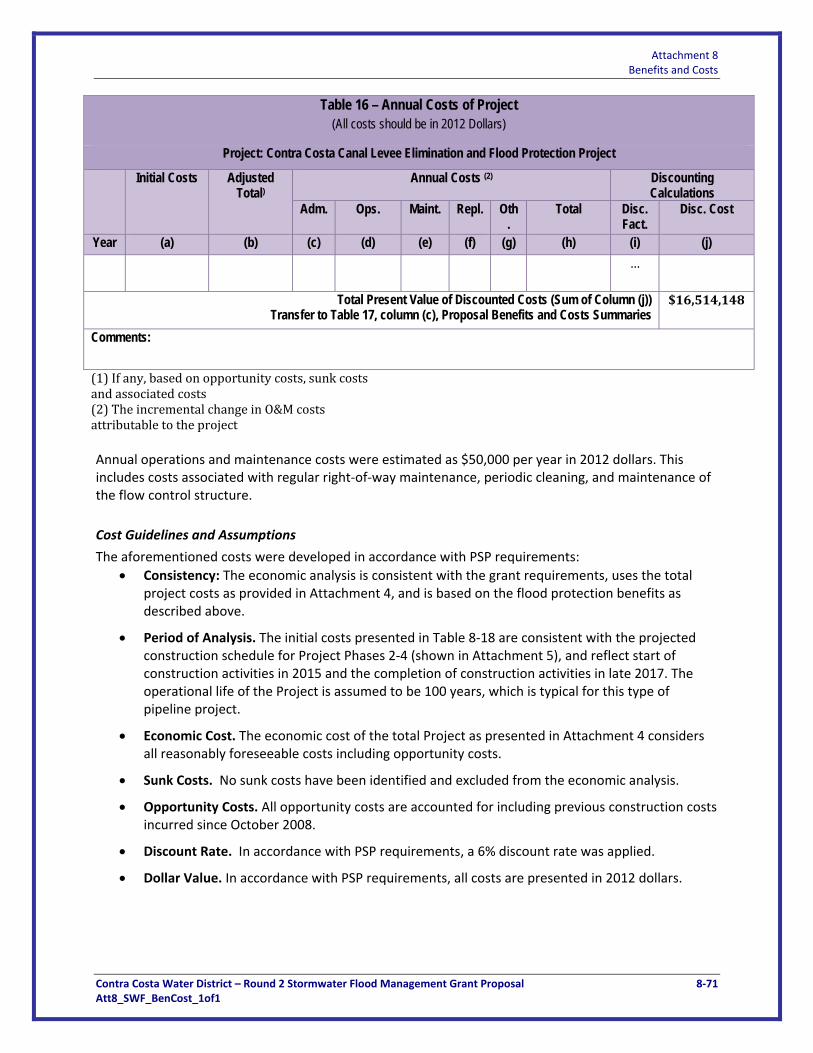
Attachment 8 Benefits and Costs
Contra Costa Water District – Round 2 Stormwater Flood Management Grant Proposal 8‐71 Att8_SWF_BenCost_1of1
Table 16 – Annual Costs of Project (All costs should be in 2012 Dollars)
Project: Contra Costa Canal Levee Elimination and Flood Protection Project
Initial Costs Adjusted Total)
Annual Costs (2) Discounting Calculations
Adm. Ops. Maint. Repl. Oth.
Total Disc. Fact.
Disc. Cost
Year (a) (b) (c) (d) (e) (f) (g) (h) (i) (j) …
Total Present Value of Discounted Costs (Sum of Column (j)) Transfer to Table 17, column (c), Proposal Benefits and Costs Summaries
$16,514,148
Comments:
(1) If any, based on opportunity costs, sunk costs and associated costs (2) The incremental change in O&M costs attributable to the project Annual operations and maintenance costs were estimated as $50,000 per year in 2012 dollars. This includes costs associated with regular right‐of‐way maintenance, periodic cleaning, and maintenance of the flow control structure.
Cost Guidelines and Assumptions
The aforementioned costs were developed in accordance with PSP requirements:
Consistency: The economic analysis is consistent with the grant requirements, uses the total project costs as provided in Attachment 4, and is based on the flood protection benefits as described above.
Period of Analysis. The initial costs presented in Table 8‐18 are consistent with the projected construction schedule for Project Phases 2‐4 (shown in Attachment 5), and reflect start of construction activities in 2015 and the completion of construction activities in late 2017. The operational life of the Project is assumed to be 100 years, which is typical for this type of pipeline project.
Economic Cost. The economic cost of the total Project as presented in Attachment 4 considers all reasonably foreseeable costs including opportunity costs.
Sunk Costs. No sunk costs have been identified and excluded from the economic analysis.
Opportunity Costs. All opportunity costs are accounted for including previous construction costs incurred since October 2008.
Discount Rate. In accordance with PSP requirements, a 6% discount rate was applied.
Dollar Value. In accordance with PSP requirements, all costs are presented in 2012 dollars.
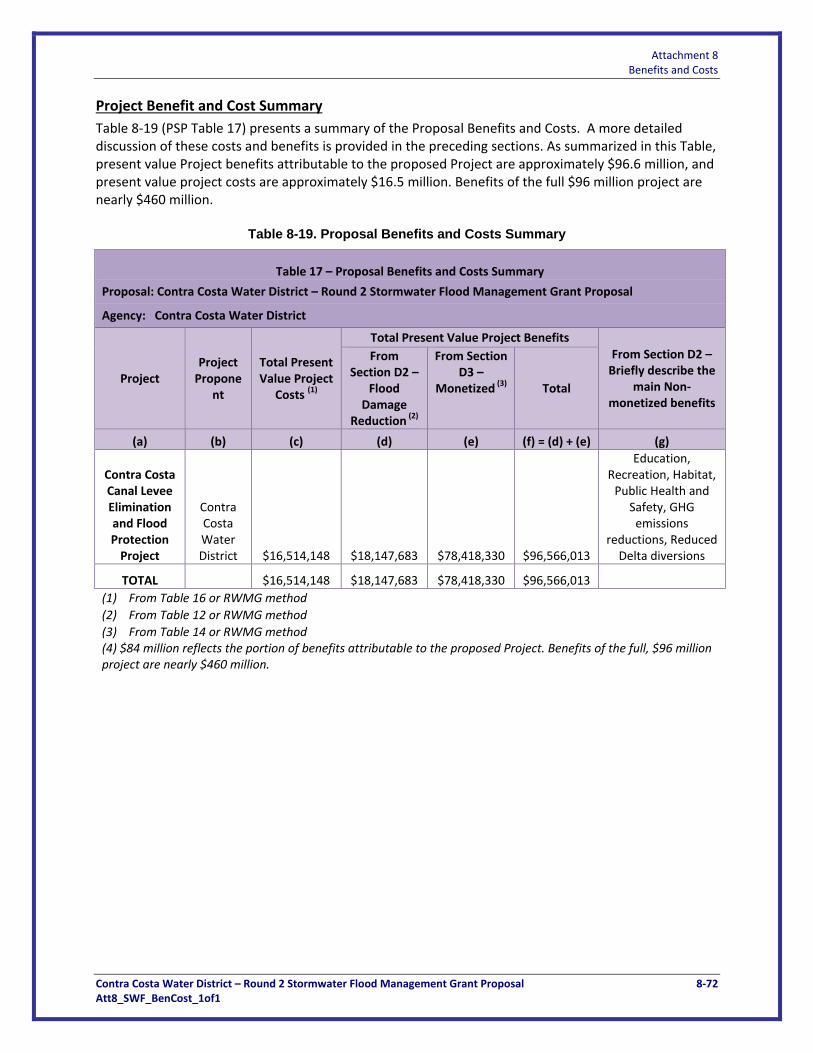
Attachment 8 Benefits and Costs
Contra Costa Water District – Round 2 Stormwater Flood Management Grant Proposal 8‐72 Att8_SWF_BenCost_1of1
Project Benefit and Cost Summary
Table 8‐19 (PSP Table 17) presents a summary of the Proposal Benefits and Costs. A more detailed discussion of these costs and benefits is provided in the preceding sections. As summarized in this Table, present value Project benefits attributable to the proposed Project are approximately $96.6 million, and present value project costs are approximately $16.5 million. Benefits of the full $96 million project are nearly $460 million.
Table 8-19. Proposal Benefits and Costs Summary
Table 17 – Proposal Benefits and Costs Summary
Proposal: Contra Costa Water District – Round 2 Stormwater Flood Management Grant Proposal
Agency: Contra Costa Water District
Project Project Propone
nt
Total Present Value Project
Costs (1)
Total Present Value Project Benefits From Section D2 – Briefly describe the
main Non‐monetized benefits
From Section D2 –
Flood Damage
Reduction (2)
From Section D3 –
Monetized (3) Total
(a) (b) (c) (d) (e) (f) = (d) + (e) (g)
Contra Costa Canal Levee Elimination and Flood Protection Project
Contra Costa Water District $16,514,148 $18,147,683 $78,418,330 $96,566,013
Education, Recreation, Habitat, Public Health and
Safety, GHG emissions
reductions, Reduced Delta diversions
TOTAL $16,514,148 $18,147,683 $78,418,330 $96,566,013
(1) From Table 16 or RWMG method
(2) From Table 12 or RWMG method
(3) From Table 14 or RWMG method (4) $84 million reflects the portion of benefits attributable to the proposed Project. Benefits of the full, $96 million project are nearly $460 million.
Attachment 8 Benefits and Costs
Contra Costa Water District – Round 2 Stormwater Flood Management Grant Proposal 8‐73 Att8_SWF_BenCost_1of1
Appendix 1
Cost Breakdown of CCWD Rates with and without Reserve Fund Subsidy
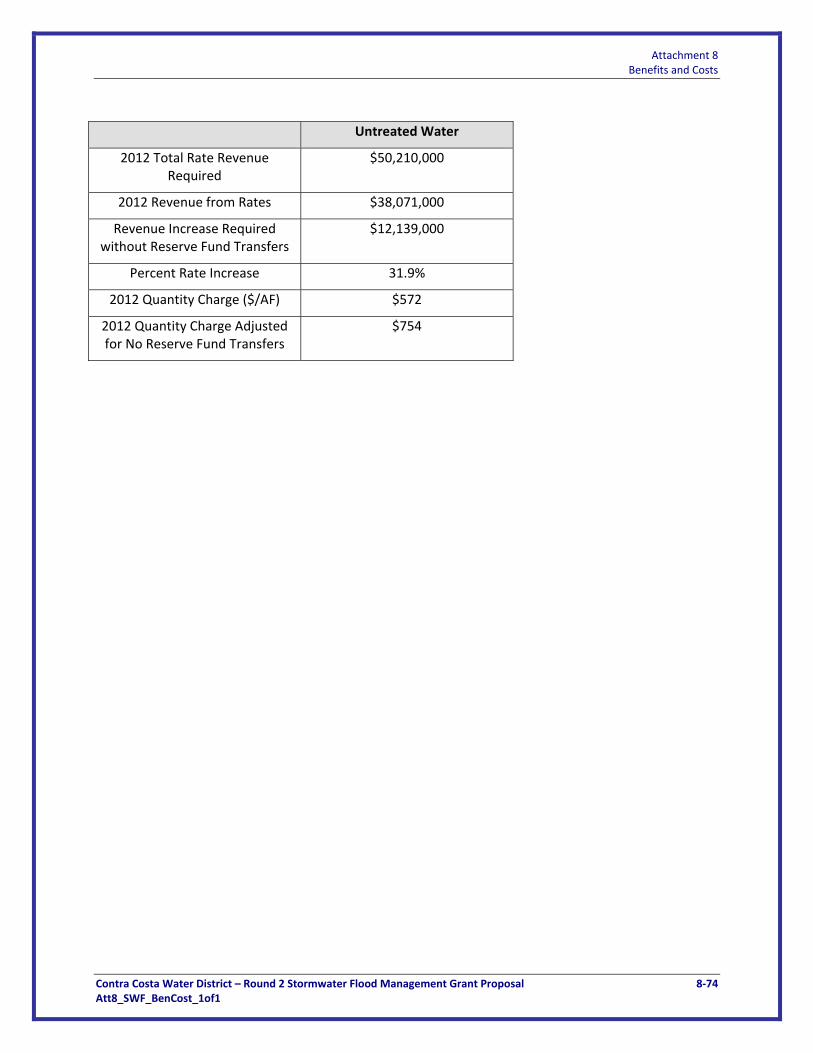
Attachment 8 Benefits and Costs
Contra Costa Water District – Round 2 Stormwater Flood Management Grant Proposal 8‐74 Att8_SWF_BenCost_1of1
Untreated Water
2012 Total Rate Revenue Required
$50,210,000
2012 Revenue from Rates $38,071,000
Revenue Increase Required without Reserve Fund Transfers
$12,139,000
Percent Rate Increase 31.9%
2012 Quantity Charge ($/AF) $572
2012 Quantity Charge Adjusted for No Reserve Fund Transfers
$754
