benefits and costs of drinking water, sanitation and hygiene
TRANSCRIPT
Benefits and Costs of Drinking Water, Sanitation and Hygiene Interventions
BENEFITS AND COSTS OF DRINKING WATER, SANITATION AND HYGIENE INTERVENTIONS
BJORN LARSEN, ENVIRONMENTAL ECONOMIST, CONSULTANT


Benefits and Costs of Drinking Water, Sanitation and Hygiene Interventions
Bangladesh Priorities
Bjorn Larsen
Environmental Economist, Consultant

© 2016 Copenhagen Consensus Center [email protected] www.copenhagenconsensus.com This work has been produced as a part of the Bangladesh Priorities project, a collaboration between Copenhagen Consensus Center and BRAC Research and Evaluation Department. The Bangladesh Priorities project was made possible by a generous grant from the C&A Foundation. Some rights reserved
This work is available under the Creative Commons Attribution 4.0 International license (CC BY 4.0). Under the Creative Commons Attribution license, you are free to copy, distribute, transmit, and adapt this work, including for commercial purposes, under the following conditions:
Attribution Please cite the work as follows: #AUTHOR NAME#, #PAPER TITLE#, Bangladesh Priorities, Copenhagen Consensus Center, 2016. License: Creative Commons Attribution CC BY 4.0.
Third-party-content Copenhagen Consensus Center does not necessarily own each component of the content contained within the work. If you wish to re-use a component of the work, it is your responsibility to determine whether permission is needed for that re-use and to obtain permission from the copyright owner. Examples of components can include, but are not limited to, tables, figures, or images.

1
ACRONYMS ...................................................................................................................................................... 2
EXECUTIVE SUMMARY ..................................................................................................................................... 3
STATUS OF DRINKING WATER, SANITATION AND HYGIENE ............................................................................. 5
SOURCES OF DRINKING WATER ................................................................................................................................... 5
QUALITY OF DRINKING WATER .................................................................................................................................... 5
POINT-OF-USE DRINKING WATER TREATMENT ............................................................................................................... 7
WATER QUANTITY AND ACCESS .................................................................................................................................. 7
ACCESS TO SANITATION ............................................................................................................................................ 7
HANDWASHING WITH SOAP ....................................................................................................................................... 8
INTERVENTIONS ............................................................................................................................................... 9
ARSENIC CONTAMINATION ........................................................................................................................................ 9
HOUSEHOLD SANITATION FACILITIES ............................................................................................................................ 9
HANDWASHING WITH SOAP ..................................................................................................................................... 10
BENEFITS OF INTERVENTIONS ........................................................................................................................ 10
ARSENIC MITIGATION ............................................................................................................................................. 10
IMPROVED SANITATION AND HANDWASHING WITH SOAP ............................................................................................... 11
COST OF INTERVENTIONS .............................................................................................................................. 12
ARSENIC MITIGATION INTERVENTIONS ....................................................................................................................... 12
SANITATION INTERVENTIONS ................................................................................................................................... 13
HANDWASHING WITH SOAP ..................................................................................................................................... 15
BENEFIT-COST RATIOS ................................................................................................................................... 16
VALUATION OF HEALTH BENEFITS .............................................................................................................................. 16
BENEFITS AND COSTS OF ARSENIC MITIGATION ............................................................................................................ 17
BENEFITS AND COSTS OF SANITATION INTERVENTIONS ................................................................................................... 18
BENEFITS AND COSTS OF HANDWASHING WITH SOAP .................................................................................................... 19
SUMMARY AND CONCLUSIONS ..................................................................................................................... 19
REFERENCES ................................................................................................................................................... 21
ANNEX 1. HEALTH EFFECTS FROM WATER, SANITATION AND HYGIENE ......................................................... 25
Direct effect .................................................................................................................................................. 25
Indirect effect ............................................................................................................................................... 26
ANNEX 2. MORTALITY FROM ARSENIC IN DRINKING WATER ......................................................................... 28
ANNEX 3. VALUATION OF HEALTH BENEFITS ................................................................................................. 28
ANNEX 4. BENEFIT-COST RATIOS.................................................................................................................... 30

2
Acronyms AF Attributable fraction
ALRI Acute lower respiratory infection
BBS Bangladesh Bureau of Statistics
BDT Bangladeshi Taka
CCC Copenhagen Consensus Center
CI Confidence Interval
CLTS Community Led Total Sanitation
DALY Disability adjusted life year
DHS Demographic and Health Survey
ft feet
GBD Global burden of disease
GDP Gross domestic product
HH Household
JMP Joint Monitoring Programme
MICS Multiple Indicator Cluster Survey
ml milliliter
OR Odds ratio
POU Point-of-use
Ppb parts per billion
PPP Purchasing power parity
RR Relative risk
SD Standard deviation
µg microgram
VSL Value of statistical life
YLD Year lost to disease
YLL Year of life lost to premature death
WASH Water, sanitation and hygiene
WHO World Health Organization
WSP Water and Sanitation Program

3
Executive summary
This paper presents an assessment of the benefits and costs of i) interventions to mitigate exposure
to arsenic in drinking water; ii) provision of improved on-site household sanitation; and iii) promotion
of regular handwashing with soap.
As many as 98% of the population in Bangladesh have access to an improved drinking water source.
This is a tremendous achievement at Bangladesh’s income level. It was, however, discovered that
many of the tubewells were contaminated by arsenic, a problem affecting 25% of households with
concentrations above the WHO guideline.
Bangladesh has also made huge strides in sanitation. Open defecation has almost been eradicated,
down from 34% of the population in 1990. And there has been a substantial increase in improved,
non-shared facilities, but also a substantial increase in households sharing facilities. Thus in 2015,
61% of the population had access to improved non-shared sanitation while 28% shared facilities with
other households.
The single most effective hygiene practice is regular handwashing with soap. Albeit somewhat higher
than regional averages in low- and middle-income countries, 7 studies indicate that only about 18%
of the population in Bangladesh practice handwashing with soap (Freeman et al, 2014).
The paper finds that as many as 45-63 thousand people die prematurely each year due to arsenic in
drinking water in Bangladesh, of which almost all can be avoided by the interventions assessed in this
paper. The paper also finds that around 11 thousand deaths can be avoided from improved sanitation
and handwashing with soap.
The three arsenic mitigation interventions – deep tubewells, pond sand filter, and rainwater
harvesting – are found to provide health benefits that are 6 – 35 times higher than the cost of the
interventions, depending on arsenic concentrations and method of valuation of health benefits.
The BCRs are highest for deep tubewells followed by rainwater harvesting and pond sand filter. Thus
from an economic and health perspective, deep tubewell is the preferred option. It is also the option
that generally requires least maintenance, has the lowest risk of bacteriological contamination, and is
likely to be the most reliable options in both the dry and rainy season. However, there may be
locations where deep tubewells cannot satisfactorily replace shallow tubewells with arsenic, and
communities may choose to opt for pond sand filter or rainwater harvesting.
The two sanitation interventions – improved sanitation for households currently with unimproved
facilities and non-shared improved sanitation for households currently sharing a facility with other
4
households – provide benefits that are 1.4 – 2.3 times higher than the costs. These benefits do not
include intangible benefits such as status and comfort, which are more difficult to estimate.
And the regular handwashing with soap provides benefits that are 1.05 – 1.35 higher than costs for
mothers and young children, but only 1/4th of costs for older children and other adults.
The relatively low benefit-cost ratios of improved sanitation and handwashing with soap mainly reflect
two basic realities. Firstly, Bangladesh has achieved substantial reductions in child mortality and
diarrheal case fatality rates. This lowers the health benefits of the interventions. Secondly, the
valuation of the health benefits is proportional to the country’s income level in order to be realistic
about affordability. The monetized benefits are therefore relatively low, as GDP per capita in
Bangladesh was about US$ 1,330 in 2014.
The main conclusion of the assessment in this paper is the very high benefits relative to costs of
combatting exposure to arsenic in drinking water. This is not only the case for households exposed to
concentration levels above the Bangladeshi standard of 50 ppb, but also for households exposed to
concentrations as low as the WHO guideline of 10 ppb. The BCRs are highest for deep tubewells which
from an economic and health perspective is the preferred option wherever they suitably can be
implemented.

5
Status of drinking water, sanitation and hygiene Six domains of household drinking water, sanitation and hygiene are reviewed to inform a selection
of interventions for which benefits and costs are assessed. The domains are:
i) Sources of drinking water
ii) Quality of drinking water (arsenic, microbiological)
iii) Point-of-use (POU) treatment of water prior to drinking
iv) Water quantity and access
v) Access to sanitation
vi) Handwashing with soap
Sources of drinking water The Joint Monitoring Programme (JMP) of WHO/UNICEF classifies household drinking water sources
into improved and unimproved sources. As many as 98% of households in Bangladesh have access to
an improved drinking water source according to the Multiple Indicator Cluster Survey (MICS) 2012-13
and the Demographic and Health Survey (DHS) 2011 (figure 1.1). The predominant source in rural
areas is tubewells (96%). The predominant sources in urban areas are tubewells (55-70% depending
on data source) and piped water to dwelling/yard (24-37%). Thus the issue of simply improved versus
unimproved sources of household drinking water is no longer the main issue in Bangladesh.
Figure 1.1. Sources of household drinking water (% of population)
Source: Produced from NIPORT et al (2013) and BBS/UNICEF (2014).
Quality of drinking water The wide provision of tubewells, as a protection against microbacteriological contamination, is a
major accomplishment in Bangladesh. Very unfortunately, however, it turned out that many
aquifers contain arsenic. Consequently, 25% of households have arsenic concentrations in drinking
water above the WHO (provisional) guideline of 10 parts per billion (ppb) or microgram per liter
90.6%
5.8%1.6% 2.1%
85.5%
10.2%2.8% 1.4%
0%
20%
40%
60%
80%
100%
Tubewell Piped todwelling/yard
Other improvedsources
Unimprovedsources
MICS 2012-13 DHS 2011

6
(µg/L)1 and 12% above the Bangladeshi standard of 50 ppb (µg/L) according to MICS 2012-13 (figure
1.2).
Figure 1.2. Population with arsenic in drinking water, 2012-13 (% of population)
Source: Produced from BBS/UNICEF (2014).
The prevalence of arsenic in Bangladesh is much higher in tubewells than in piped water supply or
other sources of drinking water. And several studies have found that arsenic contamination is far
more widespread in relatively shallow tubewells than in deep tubewells. According to the MICS 2009,
71% of households have “shallow” tubewells of depth < 5oo ft while 16% have “deep” tubewells of
depth > 550 ft (BBS/UNICEF, 2010).
The prevalence of arsenic also varies geographically. Less than 5% of the population has arsenic > 50
ppb in their source water and drinking water in the northwest while almost 25% have this level of
arsenic in their drinking water in eastern Bangladesh (figure 1.3).
Figure 1.3. Percent of population with source water (left) and drinking water (right) with arsenic > 50 ppb
Source: BBS/UNICEF (2014)
1 This is also the legal standard in the US and the EU.
0%
2%
4%
6%
8%
10%
12%
14%
10-50 50-200 >200
National
Urban
Rural

7
The MICS 2012-13 also measured E.coli contamination of household source water and drinking water
(BBS/UNICEF, 2014). 19% of households had source water with high or very high contamination levels
of greater than 10 E.coli colony forming units per 100 milliliter of water (> 10 CFU/100 ml). 38% of
households had drinking water with these levels of contamination, suggesting that contamination
takes place between the point of collection and use (during the process of fetching, storing, and
dispensing water). One intervention to address this problem is household point of use treatment of
drinking water, such as boiling or filtering.
Point-of-use drinking water treatment Improved drinking water sources are generally less contaminated by microbiological pollution than
unimproved sources. However, improved sources are also at risk of contamination. Household point-
of-use (POU) treatment has therefore been advocated to mitigate risk of contamination, both for
households with and without improved drinking water sources.
As few as 10% of households in Bangladesh practice POU drinking water treatment. Boiling or filtering
is the most common practices. Treatment is far more prevalent among urban households (26-31%)
than among rural households (3%), and among households with unimproved drinking water sources
(25%) versus much less than 10% among those with improved sources (BBS/UNICEF, 2014; NIPORT et
al, 2013).
Water quantity and access Availability and convenient access to plentiful water is essential for good health. One indicator
included in the Bangladesh DHS 2011 and MICS 2012-13 surveys is time to obtain (drinking) water.
According to the surveys, 71-75% of households have water on premises and 21-25% have water
within 30 minutes round trip. And only 3-4% have a more than 30 minutes round trip for fetching
(drinking) water (BBS/UNICEF, 2014; NIPORT et al, 2013).
Access to sanitation An estimated 61% of the population in Bangladesh had access to an improved, non-shared sanitation
facility in 2015 according to the Joint Monitoring Programme of WHO/UNICEF (WHO/UNICEF, 2015).2
28% shared facilities, 10% had other unimproved facilities, and only 1% practiced open defecation
(had no access to facility). Rural coverage rates of improved, non-shared facilities were somewhat
higher than the urban rate.
2 The Joint Monitoring Programme (JMP) of WHO/Unicef does not recognize a sanitation facility that is shared by two or more households as an improved facility.
8
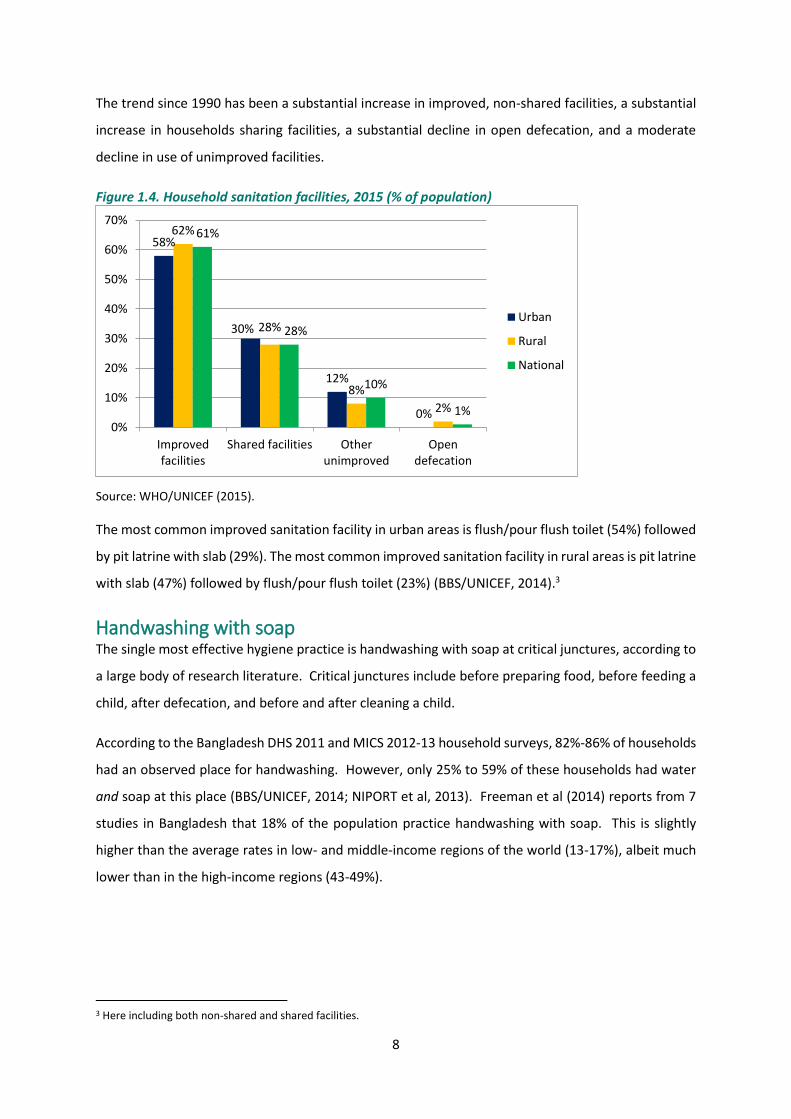
The trend since 1990 has been a substantial increase in improved, non-shared facilities, a substantial
increase in households sharing facilities, a substantial decline in open defecation, and a moderate
decline in use of unimproved facilities.
Figure 1.4. Household sanitation facilities, 2015 (% of population)
Source: WHO/UNICEF (2015).
The most common improved sanitation facility in urban areas is flush/pour flush toilet (54%) followed
by pit latrine with slab (29%). The most common improved sanitation facility in rural areas is pit latrine
with slab (47%) followed by flush/pour flush toilet (23%) (BBS/UNICEF, 2014).3
Handwashing with soap The single most effective hygiene practice is handwashing with soap at critical junctures, according to
a large body of research literature. Critical junctures include before preparing food, before feeding a
child, after defecation, and before and after cleaning a child.
According to the Bangladesh DHS 2011 and MICS 2012-13 household surveys, 82%-86% of households
had an observed place for handwashing. However, only 25% to 59% of these households had water
and soap at this place (BBS/UNICEF, 2014; NIPORT et al, 2013). Freeman et al (2014) reports from 7
studies in Bangladesh that 18% of the population practice handwashing with soap. This is slightly
higher than the average rates in low- and middle-income regions of the world (13-17%), albeit much
lower than in the high-income regions (43-49%).
3 Here including both non-shared and shared facilities.
58%
30%
12%
0%
62%
28%
8%
2%
61%
28%
10%
1%0%
10%
20%
30%
40%
50%
60%
70%
Improvedfacilities
Shared facilities Otherunimproved
Opendefecation
Urban
Rural
National

9
Interventions Two main principles guided the selection of WASH domains for the assessment of benefits and costs
of interventions:
i) The percentage of the population affected by a WASH domain, as reviewed in the previous
section; and
ii) The severity of health effects in each WASH domain as generally known from the scientific
research literature.
The selected domains are:
a) Arsenic contamination of drinking water;
b) Household sanitation facilities; and
c) Handwashing with soap at critical junctures.
Arsenic contamination Arsenic contamination of drinking water is the most important WASH related health concern in
Bangladesh today. Finding cost effective solutions with acceptable benefit-cost ratios is a priority. An
intervention to avoid arsenic exposure is provision of deep tubewells. Another intervention is
household filtering. In some parts of Bangladesh ponds with sand filter is also an option. Rainwater
harvesting for drinking would also solve the problem of arsenic, albeit very little utilized in Bangladesh
and likely only a seasonal solution.
Three arsenic mitigation interventions therefore assessed in this paper are:
1) Deep tubewells;
2) Community level pond sand filter; and
3) Community level rainwater harvesting.
Household sanitation facilities The household sanitation interventions assessed are:
1) Non-shared improved sanitation facility for households currently with a non-shared
unimproved facility; and
2) Non-shared improved sanitation facility for households currently sharing a facility with other
household(s).
The type of improved sanitation facility is a pour-flush toilet or an improved pit latrine or VIP latrine.
These are all common improved sanitation facilities in Bangladesh.

10
As “only” 1% practice open defecation (OD), interventions to eliminate OD would have relatively small
total benefits compared to the two interventions defined above, and is therefore not assessed.
Handwashing with soap The benefit of handwashing in relation to child health is substantially higher than for adult health. This
is because young children are more susceptible to diarrheal infections, have diarrheal infections more
frequently, and have higher fatality rate from diarrheal infections than adults (or older children).
Handwashing promotion programs are therefore assessed for children and adults separately:
1) Handwashing with soap promotion programs targeting mothers with young children; and
2) Handwashing with soap promotion targeting adults (in addition to mothers with young
children).
Benefits of interventions Improved drinking water quality, sanitation and hygiene can provide multiple health benefits. The
health benefits include reduced risk of mortality and disease from arsenic mitigation (Argos et al, 2010;
Sohel et al, 2009), reduced risk of diarrhea and other infectious diseases from improved bacteriological
water quality, sanitation and hygiene (Pruss-Ustun et al, 2014), reduced risk of parasite infestation
from improved sanitation and hygiene (Ziegelbauer et al, 2012), and reduced risk of respiratory
infections in children from improved handwashing practices (Rabie and Curtis, 2006). Reduction in
repeated diarrheal infections in early childhood can also contribute to improved nutritional status
(reduced underweight and stunting), as evidenced by research studies in communities with a wide
range of diarrheal infection rates in a diverse group of countries (World Bank, 2008).
Arsenic mitigation Exposure to arsenic in drinking water has been found to be associated with various health effects,
including both mortality and morbidity, and many studies of these health effects have been conducted
in Bangladesh.
Studies of mortality from arsenic exposure in populations in Bangladesh include: All-cause and chronic
disease mortality (Argos et al, 2010), non-accidental mortality, cancers, cardiovascular disease
mortality, and infectious disease mortality (Sohel et al, 2009), heart disease mortality (Chen et al,
2011), lung disease mortality (Argos et al, 2014), mortality in children (Rahman et al, 2013), and stroke
mortality (Rahman et al, 2014).
Exposure to arsenic in drinking water is also associated with skin lesions (Argos et al, 2011; Karagas et
al, 2015), various forms of cancer, kidney and liver failure, and ulcer (FAO et al, 2010). There is
11
increasing evidence that prenatal arsenic exposure is associated with morbidity and mortality later in
life (FAO et al, 2010). Various neurological impairments from arsenic exposure have also been
documented in many studies, such as poor cognitive performance, reduced intellectual function,
learning deficits, mood disorders, and visual, speech, attention and memory disturbances (Brinkel et
al, 2009; Tyler and Allan, 2014).
About 39 million people, or 25% of households in Bangladesh, have arsenic concentrations in drinking
water above 10 parts per billion (ppb) or microgram per liter (µg/L) and over 19 million have arsenic
above the Bangladeshi standard of 50 ppb (µg/L) according to MICS 2012-13 (BBS/UNICEF, 2014).
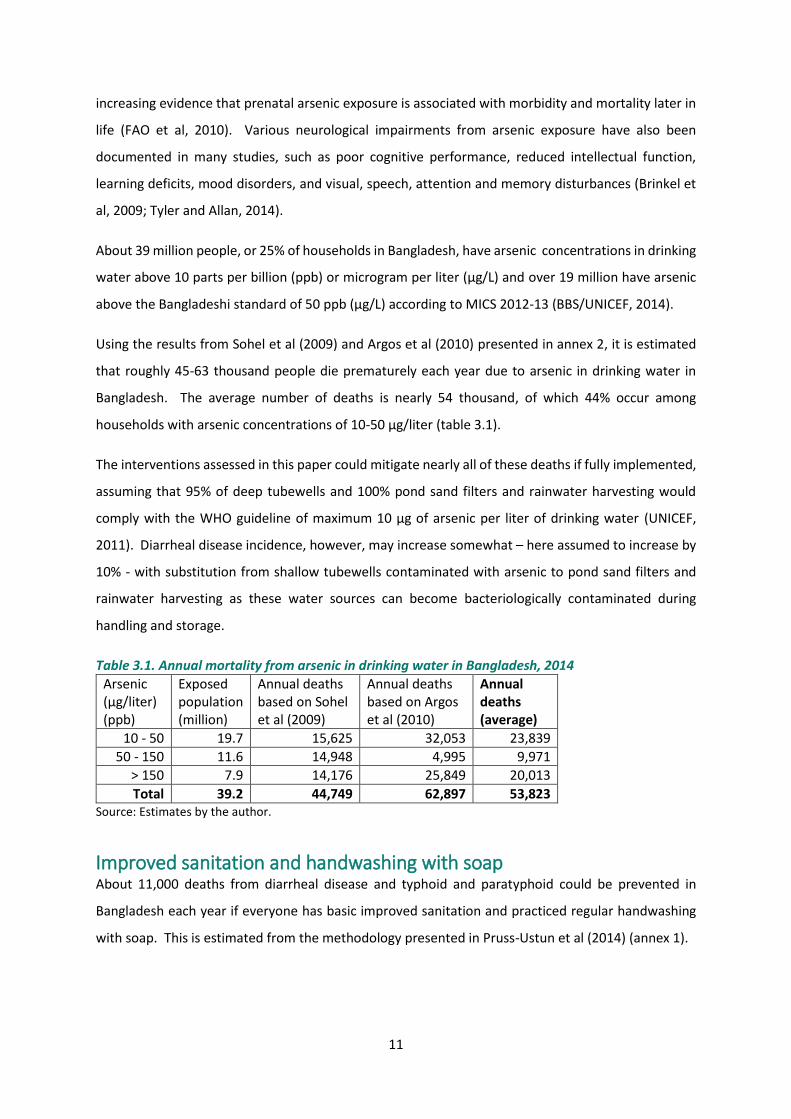
Using the results from Sohel et al (2009) and Argos et al (2010) presented in annex 2, it is estimated
that roughly 45-63 thousand people die prematurely each year due to arsenic in drinking water in
Bangladesh. The average number of deaths is nearly 54 thousand, of which 44% occur among
households with arsenic concentrations of 10-50 µg/liter (table 3.1).
The interventions assessed in this paper could mitigate nearly all of these deaths if fully implemented,
assuming that 95% of deep tubewells and 100% pond sand filters and rainwater harvesting would
comply with the WHO guideline of maximum 10 µg of arsenic per liter of drinking water (UNICEF,
2011). Diarrheal disease incidence, however, may increase somewhat – here assumed to increase by
10% - with substitution from shallow tubewells contaminated with arsenic to pond sand filters and
rainwater harvesting as these water sources can become bacteriologically contaminated during
handling and storage.
Table 3.1. Annual mortality from arsenic in drinking water in Bangladesh, 2014
Arsenic (µg/liter) (ppb)
Exposed population (million)
Annual deaths based on Sohel et al (2009)
Annual deaths based on Argos et al (2010)
Annual deaths (average)
10 - 50 19.7 15,625 32,053 23,839
50 - 150 11.6 14,948 4,995 9,971
> 150 7.9 14,176 25,849 20,013
Total 39.2 44,749 62,897 53,823 Source: Estimates by the author.
Improved sanitation and handwashing with soap About 11,000 deaths from diarrheal disease and typhoid and paratyphoid could be prevented in
Bangladesh each year if everyone has basic improved sanitation and practiced regular handwashing
with soap. This is estimated from the methodology presented in Pruss-Ustun et al (2014) (annex 1).
12
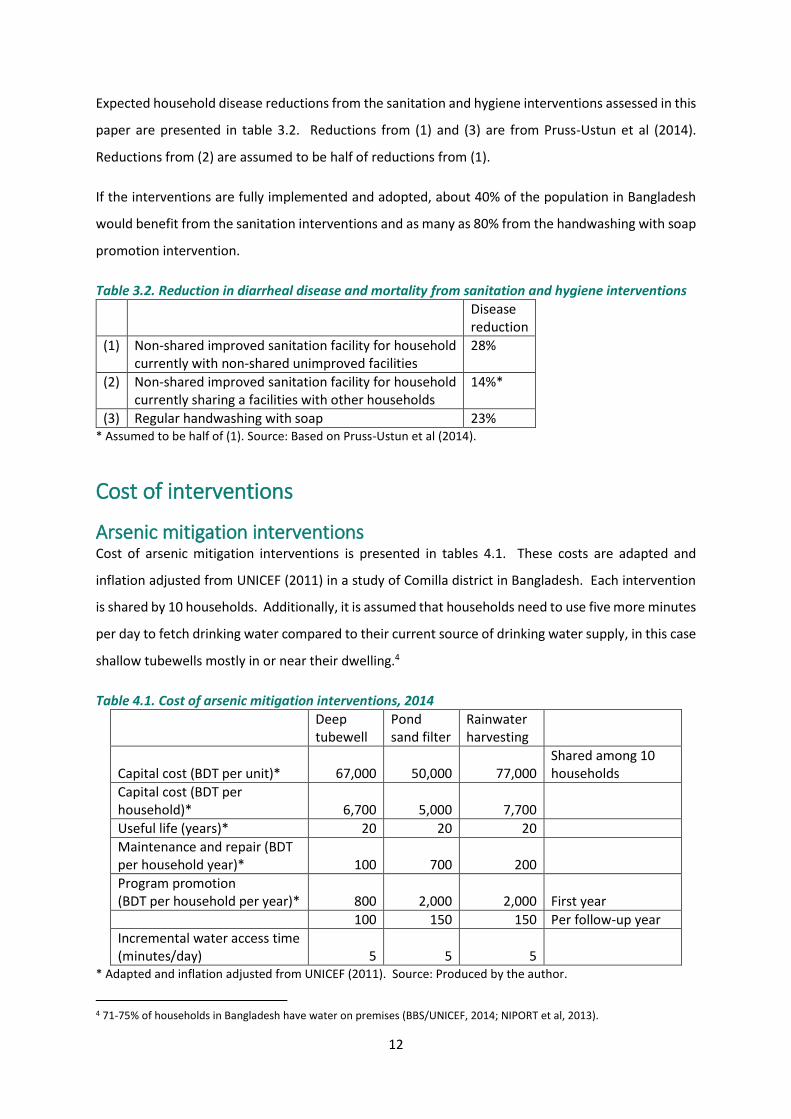
Expected household disease reductions from the sanitation and hygiene interventions assessed in this
paper are presented in table 3.2. Reductions from (1) and (3) are from Pruss-Ustun et al (2014).
Reductions from (2) are assumed to be half of reductions from (1).
If the interventions are fully implemented and adopted, about 40% of the population in Bangladesh
would benefit from the sanitation interventions and as many as 80% from the handwashing with soap
promotion intervention.
Table 3.2. Reduction in diarrheal disease and mortality from sanitation and hygiene interventions
Disease reduction
(1) Non-shared improved sanitation facility for household currently with non-shared unimproved facilities
28%
(2) Non-shared improved sanitation facility for household currently sharing a facilities with other households
14%*
(3) Regular handwashing with soap 23% * Assumed to be half of (1). Source: Based on Pruss-Ustun et al (2014).
Cost of interventions
Arsenic mitigation interventions Cost of arsenic mitigation interventions is presented in tables 4.1. These costs are adapted and
inflation adjusted from UNICEF (2011) in a study of Comilla district in Bangladesh. Each intervention
is shared by 10 households. Additionally, it is assumed that households need to use five more minutes
per day to fetch drinking water compared to their current source of drinking water supply, in this case
shallow tubewells mostly in or near their dwelling.4
Table 4.1. Cost of arsenic mitigation interventions, 2014
Deep tubewell
Pond sand filter
Rainwater harvesting
Capital cost (BDT per unit)* 67,000 50,000 77,000 Shared among 10 households
Capital cost (BDT per household)* 6,700 5,000 7,700
Useful life (years)* 20 20 20
Maintenance and repair (BDT per household year)* 100 700 200
Program promotion (BDT per household per year)* 800 2,000 2,000 First year
100 150 150 Per follow-up year
Incremental water access time (minutes/day) 5 5 5
* Adapted and inflation adjusted from UNICEF (2011). Source: Produced by the author.
4 71-75% of households in Bangladesh have water on premises (BBS/UNICEF, 2014; NIPORT et al, 2013).

13
The largest annualized cost components are capital cost and incremental water access time for deep
tubewells and rainwater harvesting. The largest component for pond sand filter is maintenance and
repair (table 4.2). The cost of this access time is estimated as 50% of wage rates.
Table 4.2. Annualized cost of arsenic mitigation interventions (BDT per household per year), 2014
Deep tubewell
Pond sand filter
Rainwater harvesting
Discount rate
Annualized capital cost 437 326 502 3%
512 382 588 5%
715 534 822 10%
Annualized program cost 152 281 281 3%
161 303 303 5%
185 364 364 10%
Maintenance and repair 100 700 200
Incremental water access time 473 473 473
Source: Produced by the author.
The total annualized intervention cost per household per year is on the order of BDT 1,200-1,500 for
deep tubewells, BDT 1,800-2,100 for pond sand filter, and BDT 1,500-1,900 for rainwater harvesting
systems, using discount rates from 3-10% (table 4.3).
Table 4.3.Total annualized cost of arsenic mitigation interventions (BDT per household per year), 2014
Discount rate Deep tubewell Pond sand filter Rainwater harvesting
3% 1,162 1,780 1,456
5% 1,246 1,858 1,564
10% 1,474 2,070 1,859 Source: Produced by the author.
Sanitation interventions The cost of on-site household sanitation facilities varies tremendously depending on type, quality and
durability of the facilities. In a Community Led Total Sanitation (CLTS) program in Bangladesh very
basic latrines were reported to cost as little as BDT 1,200 (US$17.4) per latrine, plus about BDT 500
(US$ 7) in CLTL program cost per household, and BDT 350 (US$ 5) per latrine per year in operating
cost.5 However, these latrines did not always meet WHO/UNICEF’s JMP’s definition of an improved
sanitation facility. More expensive latrines built within the project area cost up to BDT 2,200 (WSP,
2010). In a nationwide total sanitation campaign, latrines have been reported to cost from BDT 350
to BDT 3,500 (Accenture, 2012). More recently, resulting from sanitation marketing is the availability
of multiple on-site household sanitation solutions made by local entrepreneurs that range in cost from
5 These costs were during the study period 2004-2008 of the CLTS program.

14
BDT 1,600 (US$20) to BDT 20,000 (US$ 250), often available on an installment payment plan of 10-12
months. An example is an improved, twin pit off-set latrine complete with handwashing facilities for
BDT 6,500 (WSP, 2013).
A cost of BDT 7,000 per improved household sanitation facility has been applied in this paper for the
year 2014. Two household sanitation situations are assessed:
The first situation is a single household that currently has a non-shared unimproved sanitation facility
and will upgrade to an improved non-shared facility. The second situations are 3 households (HH)
currently sharing 1 facility and 2 of these households will have an improved facility constructed so that
each household will have 1 non-shared facility.
In the situation of 3 households currently sharing 1 facility, the intervention cost is 2 times the cost
per household. Costs are presented in table 4.4.
Table 4.4. Cost of sanitation interventions, 2014
From non-shared unimproved to non-shared improved facility (1 HH)
From shared to non-shared improved facility (3 HHs)
Capital cost per household (BDT) 7,000 7,000
Capital cost per intervention (BDT) 7,000 14,000
Useful life (years) 15 15
Operations and maintenance cost (BDT per intervention per year) 350 700
Initial program cost (BDT per intervention) 500 1,000
Source: Produced by the author.
The largest annualized cost component is capital cost followed by operations and maintenance at
about half of capital cost (table 4.5).
Table 4.5. Annualized cost of sanitation interventions (BDT per intervention per year), 2014
From non-shared unimproved to non-shared improved facility (1 HH)
From shared to non-shared improved facility (3 HHs)
Discount rate
Annualized capital cost 586 1,173 3%
674 1,349 5%
920 1,841 10%
Annualized program cost 42 84 3%
48 96 5%
66 131 10%
Operations and maintenance cost 350 700
Source: Produced by the author.

15
The total annualized intervention cost is on the order of BDT 1,000-1,300 per year for a single
household and BDT 2,000-2,700 for the situation in which 3 households currently share 1 facility, using
discount rates from 3-10% (table 4.6).
Table 4.6.Total annualized cost of sanitation interventions (BDT per intervention per year), 2014
Discount rate
From non-shared unimproved to non-shared improved facility (1 HH)
From shared to non-shared improved facility (3HHs)
3% 978 1,956
5% 1,073 2,145
10% 1,336 2,672 Source: Produced by the author.
Handwashing with soap Improvement in handwashing practices - i.e., handwashing with soap at critical junctures such as
before food preparation, before eating and feeding a child, after going to the toilet, before cleaning a
child – involves an increase in use of time, water, and soap and time. All three components have a
cost. Time has an opportunity cost, here valued at 50% of wage rates. Water and soap needs to be
purchased, or time has to be spent on fetching water.
Unit private costs of handwashing with soap are presented in table 4.7 and annual private and public
cost per person in table 4.8. The largest cost components are soap and time consumption. Time
consumption is assumed to be 3 minutes per person per day. This implies ½ to 1 minute per hand
washing session, including time of walking back and forth to place of handwashing. Water is assumed
to cost BDT 25 per m3. Thus on an annual basis, cost of water for handwashing is 5% of total private
cost of BDT 715 per person per year (table 4.8).6
Additional cost of improvement in handwashing is a public promotion program. Handwashing
promotion programs often targets mothers with children under five years of age as this is the age
group most susceptible and vulnerable to diarrheal infections. The cost of a program is assumed to
be BDT 500 per person, or the same as per household for improved sanitation. It is further assumed
that the improvement in handwashing is fully sustained for 3 years. This is the period of time for the
average child targeted by the program to surpass five years of age. Thus annualized promotion cost
is BDT 184 with a discount rate of 5%.7
6 The water cost of BDT 25 per m3 (or BDT 37 per person per year) is equivalent to the time cost of spending 2 minutes on fetching 20 liters of free water. 7 Annualized promotion cost is BDT 177 with a discount rate of 3% and BDT 201 with a discount rate of 10%. Thus the discount rate has minimal effect on total cost.

16
The program promotion cost is here allocated to the cost of protecting young children by promoting
handwashing with soap to their mothers. However, household members other than the mother of
the young child may also improve their handwashing practices and thus benefit from the promotion
program at no additional public cost. Thus total annualized cost per person is BDT 899 for children
under five years of age and BDT 715 for the population five years and above (table 4.8).
Table 4.7. Quantities and unit private costs of handwashing with soap, 2014
Unit Per person Unit Value
Increased water use for improved hand washing Liters/day 4 BDT/m3 25
Soap consumption Soaps/month 1 BDT/soap 25
Time used for hand washing Minutes/day 3 BDT/hour 21 Source: Assumptions by the author.
Table 4.8. Annual cost of handwashing with soap (BDT per person), 2014
For children under 5 years of age
Population 5+ years of age
Increased water use for improved hand washing 37 37
Soap consumption 300 300
Time used for hand washing 379 379
Total private cost 715 715
Annualized program promotion cost 184 0
Total annualized cost 899 715 Source: Estimates by the author.
Benefit-cost ratios
Valuation of health benefits The interventions are unlikely to instantaneously provide full benefits for health outcomes that
develop over long periods of exposure such as from arsenic exposure. It is therefore assumed that
the health benefits of arsenic mitigation are gradually realized over ten years. This means that over a
time horizon of 20 years annualized health benefits are 65-75% of full benefits, i.e., of the estimated
health benefits presented in section 3.8
For infectious diseases associated with sanitation and hygiene full health benefits of interventions are
realized in the same year the intervention is implemented.
Avoided deaths and illness from the interventions can be monetized by using various benefit valuation
measures. The Copenhagen Consensus Center (CCC) has suggested to apply a value of GDP per capita
per avoided “disability adjusted life year” or DALY.
8 Discount rate is 3 to 10%.

17
A common alternative approach that attempts to reflect how much people are willing to pay to reduce
the risk of death is the use of the so-called value of statistical life (VSL) for valuation of avoided deaths.
A VSL of BDT 4.8 million (US$ 61,672) is estimated for Bangladesh for the year 2014 in this paper
(annex 3), equivalent to 50 times GDP per capita. Along with valuation of a day of illness at 50% of
wage rates in Bangladesh, this approach results in estimated health benefits for arsenic mitigation and
sanitation and hygiene interventions that respectively are 2.1 and 1.2 times larger than when using
GDP per capita for a DALY.9 Health benefits using both approaches are presented in this paper.
Benefits and costs of arsenic mitigation Benefits and costs of interventions are compared by using their ratio. Thus a benefit-cost ratio (BCR)
greater than one indicates that benefits exceed costs. The ratio can be calculated as the present value
of benefits over the present value of costs, or as annualized benefits over annualized costs. Discount
rates of 3%, 5% and 10% are used in the calculations. BCRs using a discount rate of 5% are presented
here, and with all three discount rates in annex 4.
Two health benefit valuation scenarios are presented. Valuation of health benefits using VSL is
denoted as “high” and GDP per capita for a DALY as “low”.
Annualized benefits per household of the three arsenic exposure mitigation interventions range from
about BDT 21,000-46,000 for “high” valuation of health effects and BDT 10,000-21,000 for “low”
valuation of health effects. The range reflects arsenic exposure levels from 10-50 µg/liter to > 150
µg/liter (see annex 4).
BCRs of the three interventions are presented in tables 5.1-2. The BCRs are largest for households
exposed to arsenic concentrations exceeding 150 µg/liter (150 ppb), but also very substantial for
households exposed to arsenic concentrations of 10-50 µg/liter (10-50 ppb), which are as many people
as exposed to levels > 50 µg/liter. And BCRs for “high” are about twice as large as for “low”.
The BCRs are highest for deep tubewells followed by rainwater harvesting and pond sand filter. On
average, across all exposure concentrations (i.e., > 10 µg/liter), the BCRs for deep tubewells are 19
and 9 for “high” and “low” valuation of health benefits, respectively. The average BCR for rainwater
harvesting and pond sand filter is 15 and 7 for “high” and “low”, respectively. Thus from an economic
and health perspective, deep tubewell is the preferred option for the 39 million exposed to arsenic in
drinking water above the WHO guideline. It is also the option that generally requires least
9 The difference is much smaller for sanitation and hygiene interventions than for arsenic mitigation because the number of DALYs per death from infectious diseases is much larger the number of DALYs per death from arsenic.

18
maintenance, has the lowest risk of bacteriological contamination, and is likely to be the most reliable
options in both the dry and rainy season. However, there may be locations where deep tubewells
cannot satisfactorily replace shallow tubewells with arsenic, and communities may choose to opt for
pond sand filter or rainwater harvesting.
Table 5.1 Benefit-cost ratios of arsenic mitigation interventions, 2014 (“High”)
Arsenic exposure (µg/liter) Deep tubewell Pond sand filter Rainwater harvesting
>150 35 25 29
>50 22 15 18
>10 19 13 16 Note: The BCRs in this table reflect a discount rate of 5%. BCRs with a range of discount rates are presented in Annex 4. Source: Estimates by the author.
Table 5.2 Benefit-cost ratios of arsenic mitigation interventions, 2014 (“Low”)
Arsenic exposure (µg/liter) Deep tubewell Pond sand filter Rainwater harvesting
>150 17 12 14
>50 10 7 8
>10 9 6 7
Note: The BCRs in this table reflect a discount rate of 5%. BCRs with a range of discount rates are presented in Annex 4. Source: Estimates by the author.
Benefits and costs of sanitation interventions BCRs of the three sanitation interventions are presented in table 5.3 for two health benefit valuation
scenarios. Valuation of health benefits using VSL is denoted as “VSL” and GDP per capita for a DALY
as “low”. The BCRs range from 1.4 to 2.3. BCRs for “high” are about 10 percent larger as for “low”.
The BCRs are highest for the situations with households currently sharing a sanitation facility. This is because these households will benefit from time savings of each getting a non-shared facility.
Annualized benefits range from about BDT 1,500-1,800 for the single household (HH) intervention to BDT 4,500-5,000 for the intervention involving 3 households. Time savings benefits are 45-50% of total benefits for the situations in which households currently share a sanitation facility.
Table 5.3 Benefit-cost ratios of household sanitation interventions, 2014
"High" "Low"
From unimproved to improved facility (1 HH) 1.7 1.4
From shared to non-shared improved facility (3 HHs) 2.3 2.1
Note: The BCRs in this table reflect a discount rate of 5%. BCRs with a range of discount rates are presented in annex 4. Source: Estimates by the author.

19
Benefits and costs of handwashing with soap BCRs of handwashing with soap for the protection of the health of young children and for the population of age five years and above are presented in table 5.4 for two health benefit valuation scenarios. Valuation of health benefits using VSL is denoted as “highVSL” and GDP per capita for a DALY as “lowDALY”. BCRs for “highVSL” are lower than for “lowDALY” for children under five. This is because the high number of DALYs lost per death of a child. Annualized benefits are BDT 960-1,200 per young children (including the benefit to the mother of improved handwashing), and BDT 130-220 per person aged five years and above. This reflects the substantially higher diarrheal disease burden among young children prior to handwashing intervention, and thus larger benefit of intervention. In view of the intervention cost presented in the previous section, the BCRs are therefore only slightly above 1 for young children (1.05-1.35), and 0.2 – 0.3 for the population of age five years and above.
Table 5.4. Benefit-cost ratios of handwashing with soap, 2014
Children Under 5 Years Population Over 5 Years
Health valuation method 3% 5% 10% 3% 5% 10%
VSL 1.08 1.07 1.05 0.31 0.31 0.31
DALY 1.35 1.34 1.31 0.18 0.18 0.18 Source: Estimates by the author.
Summary and conclusions As many as 98% of the population in Bangladesh have access to an improved drinking water source.
This is a tremendous achievement at Bangladesh’s income level. It was, however, discovered that
many of the tubewells were contaminated by arsenic, a problem affecting 25% of households with
concentrations above the WHO guideline.
Bangladesh has also made huge strides in sanitation. Open defecation has almost been eradicated,
down from 34% of the population in 1990. And there has been a substantial increase in improved,
non-shared facilities, but also a substantial increase in households sharing facilities. Thus in 2015,
61% of the population had access to improved non-shared sanitation while 28% shared facilities with
other households.
The single most effective hygiene practice is regular handwashing with soap. Albeit somewhat higher
than regional averages in low- and middle-income countries, 7 studies indicate that only about 18%
of the population in Bangladesh practice handwashing with soap (Freeman et al, 2014).
On the basis of this situation, this paper assesses the benefits and costs of arsenic mitigation, improved
sanitation and regular handwashing with soap. It finds that as many as 45-63 thousand people die
prematurely each year due to arsenic in drinking water in Bangladesh, of which almost all can be

20
avoided by the interventions assessed in this paper. The paper also finds that around 11 thousand
deaths can be avoided from improved sanitation and handwashing with soap.
The three arsenic mitigation interventions – deep tubewells, pond sand filter, and rainwater
harvesting – are found to provide health benefits that are 6 – 35 times higher than the cost of the
interventions, depending on arsenic concentrations and method of valuation of health benefits.
The BCRs are highest for deep tubewells followed by rainwater harvesting and pond sand filter. Thus
from an economic and health perspective, deep tubewell is the preferred option. It is also the option
that generally requires least maintenance, has the lowest risk of bacteriological contamination, and is
likely to be the most reliable options in both the dry and rainy season. However, there may be
locations where deep tubewells cannot satisfactorily replace shallow tubewells with arsenic, and
communities may choose to opt for pond sand filter or rainwater harvesting.
The two sanitation interventions – improved sanitation for households currently with unimproved
facilities and non-shared improved sanitation for households currently sharing a facility with other
households – provide benefits that are 1.4 – 2.3 times higher than the costs. These benefits do not
include intangible benefits such as status and comfort, which are more difficult to estimate.
And the regular handwashing with soap provides benefits that are 1.05 – 1.35 higher than costs for
mothers and young children, but only 1/4th of costs for older children and other adults.
The relatively low benefit-cost ratios of improved sanitation and handwashing with soap mainly reflect
two basic realities. Firstly, Bangladesh has achieved substantial reductions in child mortality and
diarrheal case fatality rates. This lowers the health benefits of the interventions. Secondly, the
valuation of the health benefits is proportional to the country’s income level in order to be realistic
about affordability. The monetized benefits are therefore relatively low, as GDP per capita in
Bangladesh was about US$ 1,330 in 2014.
The main conclusion of the assessment in this paper is the very high benefits relative to costs of
combatting exposure to arsenic in drinking water. This is not only the case for households exposed to
concentration levels above the Bangladeshi standard of 50 ppb, but also for households exposed to
concentrations as low as the WHO guideline of 10 ppb. The BCRs are highest for deep tubewells which
from an economic and health perspective is the preferred option wherever they suitably can be
implemented.

21
References Accenture. 2012. Bangladesh Market Assessment – Sector Mapping. Global Alliance for Clean
Cookstoves.
Argos, M., Kalra, T., Rathouz, P., Chen, Y., et al. 2010. Arsenic exposure from drinking water, and all-
cause and chronic-disease mortalities in Bangladesh (HEALS): a prospective cohort study. Lancet,
376: 252-58.
Argos, M., Kalra, T., Pierce, B., Chen, Y., et al. 2011. A prospective study of arsenic exposure from
drinking water and incidence of skin lesions in Bangladesh. Am J Epidemiol, 174(2): 185-94.
Argos, M., Parvez, F., Rahman, M., et al. 2014. Arsenic and skin lesion status in relation to malignant
and non-malignant lung disease mortality in Bangladeshi adults. Epidemiology, 25(4): 536-43.
BBS/UNICEF. 2014. Bangladesh Multiple Indicator Cluster Survey 2012-13. Final Report. Bangladesh
Bureau of Statistics (BBS) and UNICEF Bangladesh. Dhaka, Bangladesh.
BBS/UNICEF. 2010. Bangladesh Multiple Indicator Cluster Survey 2009. Final Report. Bangladesh
Bureau of Statistics (BBS) and UNICEF Bangladesh. Dhaka, Bangladesh.
BBS/UNICEF. 2007. Bangladesh Multiple Indicator Cluster Survey 2006. Final Report. Bangladesh
Bureau of Statistics (BBS) and UNICEF Bangladesh. Dhaka, Bangladesh.
Black, R., Allen, L., Bhutta, Z., et al. 2008. Maternal and child undernutrition: global and regional
exposures and health consequences. Lancet, 371: 243-60.
Brinkel, J., Khan, M.H. and Kraemer, A. 2009. A systematic review of arsenic exposure and its social
and mental health effects with special reference to Bangladesh. Int. J. Eviron. Res. Public Health, 6:
1609-19.
Cairncross, S., Hunt, C., Boisson, S., et al. 2010. Water, sanitation and hygiene for preventing
diarrhoea. Int J. Epidemiology, 39: i193-i205.
Chen, Y., Graziano, J., Parvez, F., Liu, M., et al. 2011. Arsenic exposure from drinking water and
mortality from cardiovascular disease in Bangladesh: a prospective cohort study. British Medical
Journal, 342:d2431.
Curtis, V., and S. Cairncross. 2003. Effect of Washing Hands with Soap on Diarrhoea Risk in the
Community: A Systematic Review. The Lancet Infectious Diseases 3:275-81.
Ejemot, RI., Ehiri, JE., Meremikwu, MM., and Critchley, JA. 2009. Handwashing for preventing
diarrhea (Review). The Cochrane Library, Issue 3.
FAO, UNICEF, WHO and WSP. 2010. Towards an arsenic safe environment in Bangladesh. A joint
publication by the Food and Agriculture Organization, UNICEF, World Health Organization and the
Water and Sanitation Programme.
Fewtrell, L., A. Prüss-Üstün, R. Bos, F. Gore, and J. Bartram. 2007. Water, Sanitation and Hygiene:
Quantifying the Health Impact at National and Local Levels in Countries with Incomplete Water
22
Supply and Sanitation Coverage. Environmental Burden of Disease Series 15. Geneva: World Health
Organization.
Fewtrell, L., R.B. Kaufmann, D. Kay, W. Enanoria, L. Haller, and J.M. Colford. 2005. Water, Sanitation
and Hygiene Interventions to Reduce Diarrhea in Less Developed countries: a systematic review and
meta-analysis. The Lancet Infectious Diseases 5:42-52.
Fewtrell, L., Kaufmann, R., and Pruss-Ustun, A. 2003. Lead: assessing the environmental burden of
disease at national and local levels. Environmental Burden of Disease Series, No.2. WHO, Geneva.
Fishman, M.S., L.E. Caulfield, M. De Onis, M. Blossner, A.A. Hyder, L. Mullany, and R.E. Black. 2004.
Childhood and Maternal Underweight. In Ezzati, M., A.D. Lopez, A. Rodgers, and C.J.L. Murray (Eds):
Comparative Quantification of Health Risks – Global and Regional Burden of Disease Attributable to
Selected Major Risk Factors. Vol. 1. Geneva: World Health Organization.
Freeman, M., Stocks, M., Cumming, O., et al. 2014. Hygiene and health: Systematic review of
handwasing practices worldwide and update of health effects. Trop Med Int Health, 19: 906-16.
Gakidou, E., Oza, S., Fuertes, CV., et al. 2007. Improving child survival through environmental and
nutritional interventions. Journal of the American Medical Association, 298(16): 1876-87.
Karagas, M., Gossai, A., Pierce, B., and Ahsan, H. 2015. Drinking water arsenic contamination, skin
lesions, and malignancies: A systematic review of the global evidence. Curr Envir Hlth Rpt, 2: 52-68.
Larsen, B., 2007. Cost of environmental health risk in children under five years of age: Accounting
for malnutrition in Ghana and Pakistan. Background report prepared for the World Bank.
Environment Department, World Bank.
Lim, S.S., Vos, T., Flaxman, A.D., Danaei, G., et al. 2012. A comparative risk assessment of burden of
disease and injury attributable to 67 risk factors and risk factor clusters in 21 regions, 1990-2010: a
systematic analysis for the Global Burden of Disease Study 2010. Lancet, 380: 2224-60.
Lindhjem, H., Narvud, S., Braathen, N.A., and Biausque, V. 2011. Valuing mortality risk reductions
from environmental, transport, and health policies: A global meta-analysis of stated preference
studies. Risk Analysis, 31(9): 1381-1407.
Navrud, S. and Lindhjem, H. 2010. Meta-analysis of stated preference VSL studies: Further model
sensitivity and benefit transfer issues. Prepared for the Environment Directorate, OECD.
NIPORT, Mitra Assoc., and ICF Int. 2013. Bangladesh Demographic and Health Survey 2011. Dhaka,
Bangladesh and Calverton, Maryland, USA.
NIPORT, Mitra Assoc., and Macro Int. 2009. Bangladesh Demographic and Health Survey 2007.
Dhaka, Bangladesh and Calverton, Maryland, USA.
Pruss-Ustun, A., Bartram, J., Clasen, T., Colford, J., et al 2014. Burden of disease from inadequate
water, sanitation and hygiene in low- and middle-income settings: a retrospective analysis of data
from 145 countries. Trop Med Int Health, 19: 894-905.

23
Pruss-Ustun, A., Kay, D., Fewtrell, L., and Bartram, J., 2004. Unsafe water, sanitation and hygiene. In:
Ezzati, M. et al. (eds): Comparative quantification of health risks: global and regional burden of
disease attributable to selected major risk factors. World Health Organization. Geneva.
Pruss, A., Kay, D., Fewtrell, L., and Bartram, J.,2002. Estimating the Burden of Disease from Water,
Sanitation and Hygiene at the Global Level. Environmental Health Perspectives, 110(5):537-42.
Rabie, T. and Curtis, V. 2006. Handwashing and risk of respiratory infections: a quantitative
systematic review. Tropical Medicine and International Health, 11(3): 258-67.
Rahman, M., Sohel, N., Yunus, M., Chowdhury, M.E., et al. 2014. A prospective cohort study of
stroke mortality and arsenic in drinking water in Bangladeshi adults. BMC Public Health, 14:174.
Rahman, M., Sohel, N., Yunus, M., Chowdhury, M.E., et al. 2013. Increased childhood mortality and
arsenic in drinking water in Matlab, Bangladesh: A population-based cohort study. PLOS ONE, 8(1):
e55014.
Sohel, N., Persson, LA., Rahman, M., Streatfield, PK., Yunus, M., Ekström, EC., Vahter, M. 2009.
Arsenic in drinking water and adult mortality: a population-based cohort study in rural Bangladesh.
Epidemiology, 20(6):824-30.
Tyler, C., and Allan, A. 2014. The effects of arsenic exposure on neurological and cognitive
dysfunction in human and rodent studies: A review. Curr Envir Health Rpt, 1: 132-47.
UNICEF. 2011. Making economic sense for arsenic mitigation: A case study of Comilla District,
Bangladesh.
Waddington, H., Snilstveit, B., White, H., and Fewtrell, L. 2009. Water, sanitation and hygiene
interventions to combat childhood diarrhoea in developing countries. Synthetic Review 001.
International Initiative for Impact Evaluation (3ie).
WHO/UNICEF. 2015. Bangladesh: Estimates on the use of water sources and sanitation facilities.
Joint Monitoring Programme for Water Supply and Sanitation (JMP). Update June 2015.
www.wssinfo.org
WHO. 2009. Estimated deaths and DALYs attributable to selected environmental risk factors, by
WHO member states, 2004. World Health Organization. Downloadable at:
http://www.who.int/quantifying_ehimpacts/national/countryprofile/intro/en/index.html
WHO. 2004. Comparative quantification of health risks: Global and regional burden of disease
attributable to selected major risk factors. World Health Organization. Geneva, Switzerland.
World Bank. 2015. World Development Indicators. World Bank. Washington DC. USA.
World Bank. 2008. Environmental health and child survival: Epidemiology, economics, experiences.
Washington, DC: World Bank.
WSP. 2013. Making sanitation marketing work: The Bangladesh story. Water and Sanitation
Program, World Bank.

24
WSP. 2010. Financing on-site sanitation for the poor: A six country comparative review and analysis.
Water and Sanitation Program, World Bank.
Ziegelbauer, K., Speich, B., Mausezahl, D., Bos, R., Keiser, J., and Utzinger, J. 2012. Effect of
sanitation and soil-transmitted helminth infection: Systematic review and meta-analysis. PLOS
Medicine, 9(1): e1001162.

25
Annex 1. Health effects from water, sanitation and hygiene Inadequate water, sanitation and hygiene (WASH) is directly and indirectly affecting population
health. Directly, poor WASH causes diarrheal infections and other health effects which in turn lead to
mortality especially in young children. Indirectly, poor WASH contributes to poor nutritional status in
young children through the effect of diarrheal infections (World Bank, 2008; Fewtrell et al, 2007;
Larsen, 2007).10 Poor nutritional status in turn increases the risk of child mortality from disease
(Fishman et al., 2004; Black et al, 2008). Child underweight is the nutritional indicator most commonly
used in assessing the risk of mortality from poor nutritional status (Fishman et al, 2004).
Direct effect Pruss-Ustun et al (2014), based on a global review, presents a methodology for estimating the
diarrheal disease burden from inadequate WASH, or that can be expected to be prevented from
improved WASH. For drinking water, the preventable disease burden is estimated in relation to piped
water supply to dwelling or yard combined with safe point-of-use treatment and drinking water
storage. For sanitation, a distinction is only made between unimproved and improved sanitation
facilities as studies of health risks of other sanitation dimensions are insufficient. For hygiene, the
focus is on handwashing with soap. The relative risks of disease from unimproved sanitation and lack
of adequate handwashing with soap are presented in table A1.1.
Table A1.1. Relative risk of diarrheal disease and mortality from sanitation and hygiene
Relative risk of diarrheal disease (RR)
Unimproved sanitation (vs. improved sanitation)
1.39
Lack of adequate handwashing with soap
1.30
Source: Based on Pruss-Ustun et al (2014).
The attributable fraction (AF) of diarrheal disease and mortality from unimproved sanitation or lack of
adequate handwashing with soap is calculated as follows:
1)1(
)1(
1
1
n
i
ii
n
i
ii
RRP
RRP
AF (A1.1)
10 Repeated infections, and especially diarrheal infections, have been found to significantly impair weight gains in young children. Studies documenting and quantifying this effect have been conducted in communities with a wide range of infection loads in a diverse group of countries. World Bank (2008) provides a review of these studies.

26
where Pi is the population share with unimproved and improved sanitation, or population share with
inadequate and inadequate handwashing with soap, and RRi is the corresponding relative risks in table
A1.111
The joint attributable fraction (AFJ) of disease burden from unimproved sanitation and inadequate
handwashing with soap, or preventable disease burden from provision of improved sanitation and
adequate handwashing with soap can be approximated as follows:
𝐴𝐹𝐽 = 1 − ∏ (1 − 𝐴𝐹𝑘)𝑛𝑘=1 (A1.2)
where AFk is the attributable fraction associated with sanitation and handwashing with soap. It should
be noted, however, that the joint AF formula as applied here hinges on two key assumptions (Gakidou
et al, 2007). First, exposures to the risk factors are uncorrelated and second, that the hazardous
effects of one risk factor are not mediated through any of the other risk factors. The formula is
nevertheless applied here, as in Pruss-Ustun et al (2014), in the absence of a more suitable approach.
Indirect effect Estimating the indirect mortality effects of diarrhea from WASH is here undertaken in two stages.
First, the fraction of under-five child mortality attributable to child underweight is estimated. This
follows the methodology in Black et al (2008). Second, a fraction of under-five child mortality from
underweight is attributed to diarrheal infections from WASH in early childhood using the approach in
Fewtrell et al (2007).
An alternative approach to estimating the fraction of mortality attributable to diarrheal infections
from WASH is the methodology developed in Larsen (2007) and World Bank (2008). This, however,
requires estimation of counterfactual prevalence rates of child underweight (prevalence of
underweight in the absence of diarrheal infections) from original survey data of child nutritional
status. As the original survey data are often not readily available, the approach in Fewtrell et al is here
used instead. The approach in Fewtrell et al gives a somewhat lower estimate of indirect mortality
from WASH than the Larsen and World Bank methodology.
Estimates of increased risk of cause-specific mortality in children under five years of age with mild,
moderate and severe underweight is presented in table A1.2 based on Black et al (2008).
11 RR=1 for improved sanitation and adequate handwashing with soap.

27
Table A1.2. Relative risk of mortality from severe, moderate and mild underweight in children under five
Severe Moderate Mild None
Acute lower respiratory infections (ALRI) 6.4 1.3 1.2 1.0
Diarrhea 9.5 3.4 2.1 1.0
Measles 6.4 2.3 1.3 1.0
Malaria 1.6 1.2 0.8 1.0 Source: Black et al (2008). ALRI is acute lower respiratory infections. Relative risks are in relation to underweight according to the WHO Child Growth Standards.
These relative risk ratios are applied to prevalence rates of child underweight to estimate attributable
fractions (AFj) of mortality by cause, j, from child underweight as follows:
1)1(
)1(
1
1
n
i
jii
n
i
jii
j
RRP
RRP
AF (A1.3)
where RRji is relative risk of mortality from cause, j, for children in each of the underweight categories,
i, in table A1.2; and Pi is the underweight prevalence rate.
Annual cases of mortality from child underweight (by cause, “j”, in table A1.2) are estimated as
follows:
jjj AFMRUCM *5* (A1.4)
where C is annual live child births in unit of thousands, U5MR is the under-five child mortality rate (per
1,000 live births), and βj is the fraction of under-five mortality by cause “j”.
Annual under-five child mortality from diarrheal infections in early childhood (W) is then estimated as
follows:
mj
j
jj MW1
(A1.5)
where γj is the fraction of child underweight mortality (Mj) attributed to diarrheal infections in early
childhood. A value γj = 0.5 for ALRI, measles, malaria and “other infectious diseases” is applied here
based on Fewtrell et al (2007). This is then multiplied by the fraction of diarrheal disease attributed
to water, sanitation and hygiene using the methodology in Pruss-Ustun et al (2014), i.e., 0.56 for
Bangladesh, to calculate estimated mortality from WASH. The additional indirect effect through child
underweight on diarrheal mortality is estimated using a joint attributable fraction formula in Gakidou
et al (2007).

28
Annex 2. Mortality from arsenic in drinking water Argos et al (2010) assessed the association between arsenic exposure and all-cause mortality among
adults of age 18+ years, and Sohel et al (2009) assessed the association between arsenic exposure and
all-cause non-accidental mortality among people of age 15+ years. Argos et al used the prospective
cohort Health Effects of Arsenic Longitudinal Study (HEALS) data from Araihazar in Bangladesh. Nearly
12,000 population based participants were recruited during October 2000 to May 2002 with an
average follow-up of 6.5-6.6 years. Sohel et al studied a population of 115,903 persons in Matlab in
Bangladesh from 1991 to 2000.
Estimated hazard ratios from the two studies for all-cause and non-accidental all-cause mortality are
presented in table A2.1 in relation to arsenic concentrations in the participants’ drinking water.
Table A2.1. Hazard ratios for all-cause and non-accidental all-cause mortality associated with arsenic in drinking water
Arsenic (µg/liter) Hazard ratio (95% CI)
All-cause mortality
Non-accidental all-cause mortality
≤ 10 1.00 1.00
10 - 50 1.34 (0.99-1.82) 1.16 (1.06–1.26)
50 - 150 1.09 (0.81-1.47) 1.26 (1.18–1.36)
> 150 1.68 (1.26-2.23) 1.36 (1.27–1.47) Note; CI=Confidence Interval. Source: Argos et al (2010) and Sohel et al (2009).
Argos et al estimate the attributable fraction (AF) of all-cause mortality as follows:
𝐴𝐹 = 1 − ∑ 𝑃𝑖𝑛𝑖=1 /𝐻𝑅𝑖 (A2.1)
where Pi is the proportion of all deaths that are within the ith arsenic exposure category and HRi is the
hazard ratio in arsenic exposure category i=1,….4 in table A2.1. Annual cases of mortality (M) from
arsenic in drinking water can then be estimated as follows:
M = AF* POP * CDR/1000 (A2.2)
where POP is the total population and CDR is the crude death rate (per 1,000) among the population.
Annex 3. Valuation of health benefits Two valuation measures are considered for estimating the benefit of avoided illness is in this paper: i)
a day of disease is valued as 50% of average labor income per day; or ii) a year lost to disease (YLD) is
valued at GDP per capita as suggested by the Copenhagen Consensus Center (CCC).
29
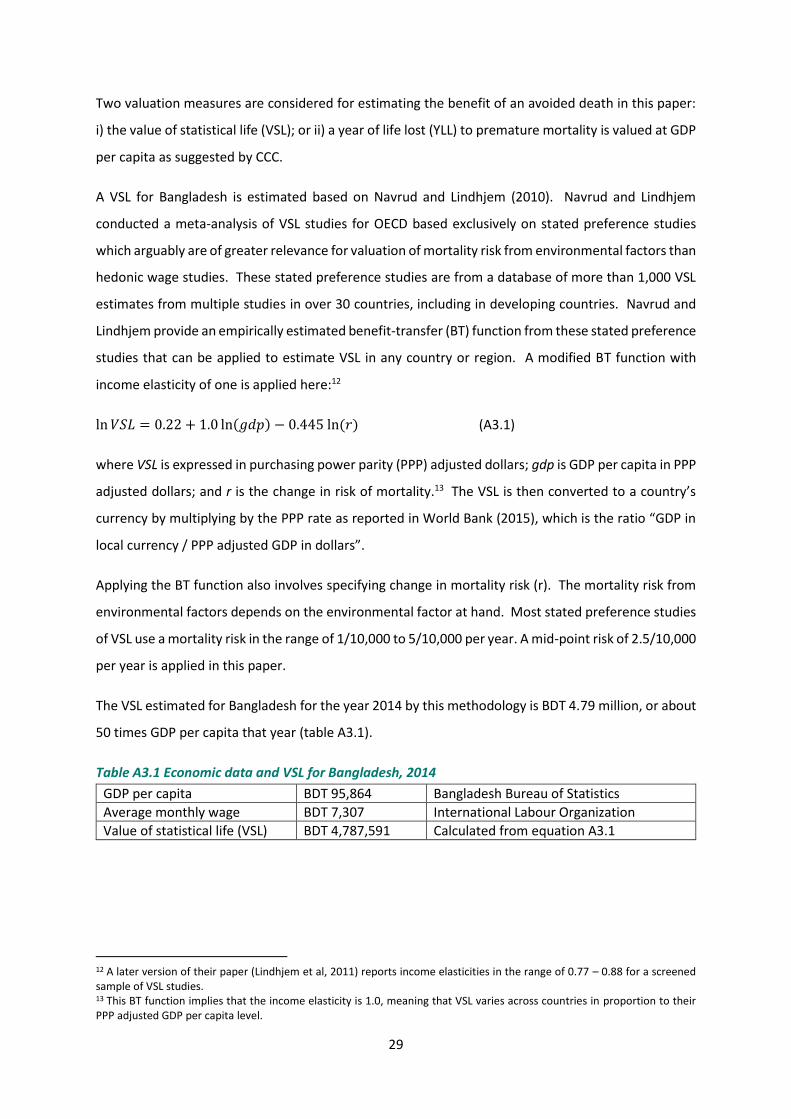
Two valuation measures are considered for estimating the benefit of an avoided death in this paper:
i) the value of statistical life (VSL); or ii) a year of life lost (YLL) to premature mortality is valued at GDP
per capita as suggested by CCC.
A VSL for Bangladesh is estimated based on Navrud and Lindhjem (2010). Navrud and Lindhjem
conducted a meta-analysis of VSL studies for OECD based exclusively on stated preference studies
which arguably are of greater relevance for valuation of mortality risk from environmental factors than
hedonic wage studies. These stated preference studies are from a database of more than 1,000 VSL
estimates from multiple studies in over 30 countries, including in developing countries. Navrud and
Lindhjem provide an empirically estimated benefit-transfer (BT) function from these stated preference
studies that can be applied to estimate VSL in any country or region. A modified BT function with
income elasticity of one is applied here:12
ln 𝑉𝑆𝐿 = 0.22 + 1.0 ln(𝑔𝑑𝑝) − 0.445 ln (𝑟) (A3.1)
where VSL is expressed in purchasing power parity (PPP) adjusted dollars; gdp is GDP per capita in PPP
adjusted dollars; and r is the change in risk of mortality.13 The VSL is then converted to a country’s
currency by multiplying by the PPP rate as reported in World Bank (2015), which is the ratio “GDP in
local currency / PPP adjusted GDP in dollars”.
Applying the BT function also involves specifying change in mortality risk (r). The mortality risk from
environmental factors depends on the environmental factor at hand. Most stated preference studies
of VSL use a mortality risk in the range of 1/10,000 to 5/10,000 per year. A mid-point risk of 2.5/10,000
per year is applied in this paper.
The VSL estimated for Bangladesh for the year 2014 by this methodology is BDT 4.79 million, or about
50 times GDP per capita that year (table A3.1).
Table A3.1 Economic data and VSL for Bangladesh, 2014
GDP per capita BDT 95,864 Bangladesh Bureau of Statistics
Average monthly wage BDT 7,307 International Labour Organization
Value of statistical life (VSL) BDT 4,787,591 Calculated from equation A3.1
12 A later version of their paper (Lindhjem et al, 2011) reports income elasticities in the range of 0.77 – 0.88 for a screened sample of VSL studies. 13 This BT function implies that the income elasticity is 1.0, meaning that VSL varies across countries in proportion to their PPP adjusted GDP per capita level.
30
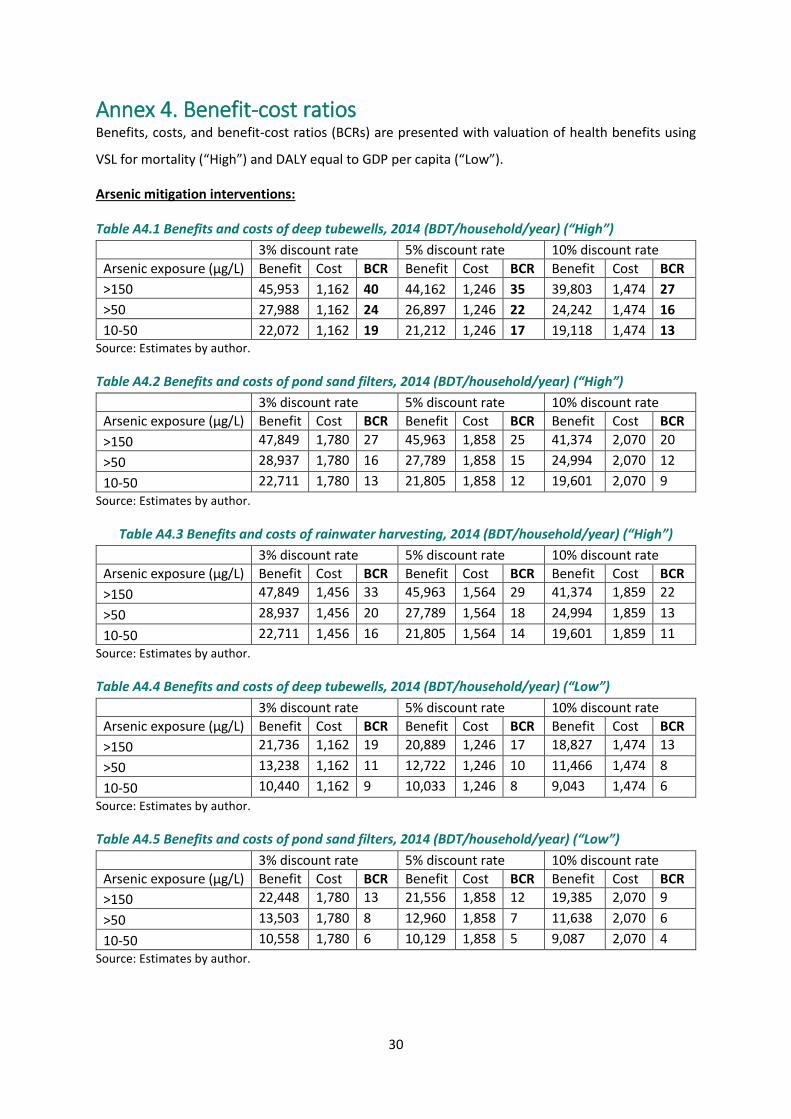
Annex 4. Benefit-cost ratios Benefits, costs, and benefit-cost ratios (BCRs) are presented with valuation of health benefits using
VSL for mortality (“High”) and DALY equal to GDP per capita (“Low”).
Arsenic mitigation interventions:
Table A4.1 Benefits and costs of deep tubewells, 2014 (BDT/household/year) (“High”)
3% discount rate 5% discount rate 10% discount rate
Arsenic exposure (µg/L) Benefit Cost BCR Benefit Cost BCR Benefit Cost BCR
>150 45,953 1,162 40 44,162 1,246 35 39,803 1,474 27
>50 27,988 1,162 24 26,897 1,246 22 24,242 1,474 16
10-50 22,072 1,162 19 21,212 1,246 17 19,118 1,474 13 Source: Estimates by author.
Table A4.2 Benefits and costs of pond sand filters, 2014 (BDT/household/year) (“High”)
3% discount rate 5% discount rate 10% discount rate
Arsenic exposure (µg/L) Benefit Cost BCR Benefit Cost BCR Benefit Cost BCR
>150 47,849 1,780 27 45,963 1,858 25 41,374 2,070 20
>50 28,937 1,780 16 27,789 1,858 15 24,994 2,070 12
10-50 22,711 1,780 13 21,805 1,858 12 19,601 2,070 9
Source: Estimates by author.
Table A4.3 Benefits and costs of rainwater harvesting, 2014 (BDT/household/year) (“High”)
3% discount rate 5% discount rate 10% discount rate
Arsenic exposure (µg/L) Benefit Cost BCR Benefit Cost BCR Benefit Cost BCR
>150 47,849 1,456 33 45,963 1,564 29 41,374 1,859 22
>50 28,937 1,456 20 27,789 1,564 18 24,994 1,859 13
10-50 22,711 1,456 16 21,805 1,564 14 19,601 1,859 11
Source: Estimates by author.
Table A4.4 Benefits and costs of deep tubewells, 2014 (BDT/household/year) (“Low”)
3% discount rate 5% discount rate 10% discount rate
Arsenic exposure (µg/L) Benefit Cost BCR Benefit Cost BCR Benefit Cost BCR
>150 21,736 1,162 19 20,889 1,246 17 18,827 1,474 13
>50 13,238 1,162 11 12,722 1,246 10 11,466 1,474 8
10-50 10,440 1,162 9 10,033 1,246 8 9,043 1,474 6
Source: Estimates by author.
Table A4.5 Benefits and costs of pond sand filters, 2014 (BDT/household/year) (“Low”)
3% discount rate 5% discount rate 10% discount rate
Arsenic exposure (µg/L) Benefit Cost BCR Benefit Cost BCR Benefit Cost BCR
>150 22,448 1,780 13 21,556 1,858 12 19,385 2,070 9
>50 13,503 1,780 8 12,960 1,858 7 11,638 2,070 6
10-50 10,558 1,780 6 10,129 1,858 5 9,087 2,070 4
Source: Estimates by author.

31
Table A4.6 Benefits and costs of rainwater harvesting, 2014 (BDT/household/year) (“Low”)
3% discount rate 5% discount rate 10% discount rate
Arsenic exposure (µg/L) Benefit Cost BCR Benefit Cost BCR Benefit Cost BCR
>150 22,448 1,456 15 21,556 1,564 14 19,385 1,859 10
>50 13,503 1,456 9 12,960 1,564 8 11,638 1,859 6
10-50 10,558 1,456 7 10,129 1,564 6 9,087 1,859 5
Source: Estimates by author.
Sanitation interventions: Table A4.7 Benefits and costs of household sanitation, 2014 (BDT/intervention/year) (“High”)
Intervention 3% discount rate 5% discount rate 10% discount rate
Benefit Cost BCR Benefit Cost BCR Benefit Cost BCR
From non-shared unimproved to non-shared improved facility
1,821 978 1.9 1,821 1,073 1.7 1,821 1,336 1.4
From shared to non-shared improved facility (3 HHs)
4,997 1,956 2.6 4,997 2,145 2.3 4,997 2,672 1.9
Note: HH=household. Source: Estimates by author.
Table A4.8 Benefits and costs of household sanitation, 2014 (BDT/intervention/year) (“Low”)
Intervention 3% discount rate 5% discount rate 10% discount rate
Benefit Cost BCR Benefit Cost BCR Benefit Cost BCR
From non-shared unimproved to non-shared improved facility
1,503 978 1.5 1,503 1,073 1.4 1,503 1,336 1.1
From shared to non-shared improved facility (3 HHs)
4,532 1,956 2.3 4,532 2,145 2.1 4,532 2,672 1.7
Note: HH=household. Source: Estimates by author.

© Copenhagen Consensus Center 2016
Bangladesh, like most nations, faces a large number of challenges. What should be the top priorities for policy makers, international donors, NGOs and businesses? With limited resources and time, it is crucial that focus is informed by what will do the most good for each taka spent. The Bangladesh Priorities project, a collaboration between Copenhagen Consensus and BRAC, works with stakeholders across Bangladesh to find, analyze, rank and disseminate the best solutions for the country. We engage Bangladeshis from all parts of society, through readers of newspapers, along with NGOs, decision makers, sector experts and businesses to propose the best solutions. We have commissioned some of the best economists from Bangladesh and the world to calculate the social, environmental and economic costs and benefits of these proposals. This research will help set priorities for the country through a nationwide conversation about what the smart - and not-so-smart - solutions are for Bangladesh's future.
For more information vis it w ww .Bangladesh -Prior it ies.com
C O P E N H A G E N C O N S E N S U S C E N T E R Copenhagen Consensus Center is a think tank that investigates and publishes the best policies and investment opportunities based on social good (measured in dollars, but also incorporating e.g. welfare, health and environmental protection) for every dollar spent. The Copenhagen Consensus was conceived to address a fundamental, but overlooked topic in international development: In a world with limited budgets and attention spans, we need to find effective ways to do the most good for the most people. The Copenhagen Consensus works with 300+ of the world's top economists including 7 Nobel Laureates to prioritize solutions to the world's biggest problems, on the basis of data and cost-benefit analysis.