benefits and drawbacks of using data assimilation for hydrological modelling in karstic regions....
TRANSCRIPT

Benefits and drawbacks of using data assimilation for hydrological modelling in karstic regions.
Recent work on the Lez catchment in Southern France
IAHS General Assembly in Göteborg - July 2013
Mathieu COUSTAU, Elizabeth HARADER, Valérie BORRELL ESTUPINA, Sophie RICCI, Olivier THUAL, Christophe BOUVIER, Andrea PIACENTINI
Made possible by a collaboration
Montpellier, September 2005
Session : Testing simulation and forecasting models in non-stationary conditions
1

Environmental context The Mediterranean region is subject to violent rainfall producing devastating flash floods. These
flash floods are responsible for numerous deaths and expensive material damages.
How to improve forecast of these floods ?
Scientific issue Hydrological models are helpful to understand and to forecast these floods. However The
physical processes involved are not well represented.The precipitation used to force models is not accurately measured, nor is it stationary, and it should be be corrected in order to reduce model uncertainty. Model parameters require some level of adaptation to better represent catchment behaviour.
How to deal with the limited performance of the hydrological models linked to the heterogeneity or non stationary of the observed data between the calibration and validation steps ?
Methodological difficultyData assimilation is an innovative method that allows to correct the model parameters as well
as the forcing input to the model (precipitation) when discharge observations are available. As a result, the capacity of the model to cope with non stationary conditions is improved.
Which data assimilation strategy should be implemented in order to improve flash flood forecatsing ?
General Context & Issues
2Intro Study Case Model Correction Results Conclusion

Project Work Packages : - The observation tasks - The model work package- The vulnerability study- The climate changes and
pumping scenarii impacts
*Gestion Multi Usages : Multiple-Use Management
Sources: Dörflinger and
al., 2008
Context & Issues : The Lez GMU* project
3Intro Study Case Model Correction Results Conclusion
A 4-year project focused on the karstic water resource and active
management
Regional water
agencyDepartmental administration
Private company
Research labs
Main objective discussed in this presentation : How to improve flash flood forecasting using data assimilation?

• Small catchment • 114 km2
• Short lag times, 2-5h • Vineyards, scrubland, forest (poor urban cover)• From 34 m asl to 700 m
• Karstic formations• spring = resurgence of a 380 km2 karstic aquifer• karst covered with soil or karst outcrops
• Extreme rainfall events (mesoscale convective systems ) • The spring has been exploited for more than 100 years for water needs of the population• The Mediterranean region is prone to flash flooding events due to intense rainfalls.
Sources: Nuissier and al., 2008;
Dörflinger and al., 2008; Kong A Siou
and al., 2011; Coustau, 2008
The Lez catchment
4Intro Study Case Model Correction Results Conclusion

Rain and Floods studied after 1994
• 4 Rain Gauges within the surface catchment, measurements at an hourly time step
• Weather radar over the region with different correcting algorithms (Hydram, Calamar) with a temporal resolution of 5 minutes
• Around 20 raingauges available in the region with a daily time step
• 1 streamflow gauge at the outlet (Peak discharge : 40 to 467 m3/s)
• 21 flood eventsSmall floods and false alarms are
not considered.
55Intro Study Case Model Correction Results Conclusion
The data Base
Event Rain Intensity
mean (mm/h)
Runoff coefficient
Spring Peak
discharge (m3/s)
Outelt peak
discharge (m3/s)
Oct 2001 10.4 0.33 24 238
Sep 2002 8 0.34 8 103
Dec 2002 4.6 0.97 20 373
Sep 2003 10.9 0.14 3 91
Dec 2003 7.3 0.70 28 423
Sep 2005 10.8 0.36 - 467
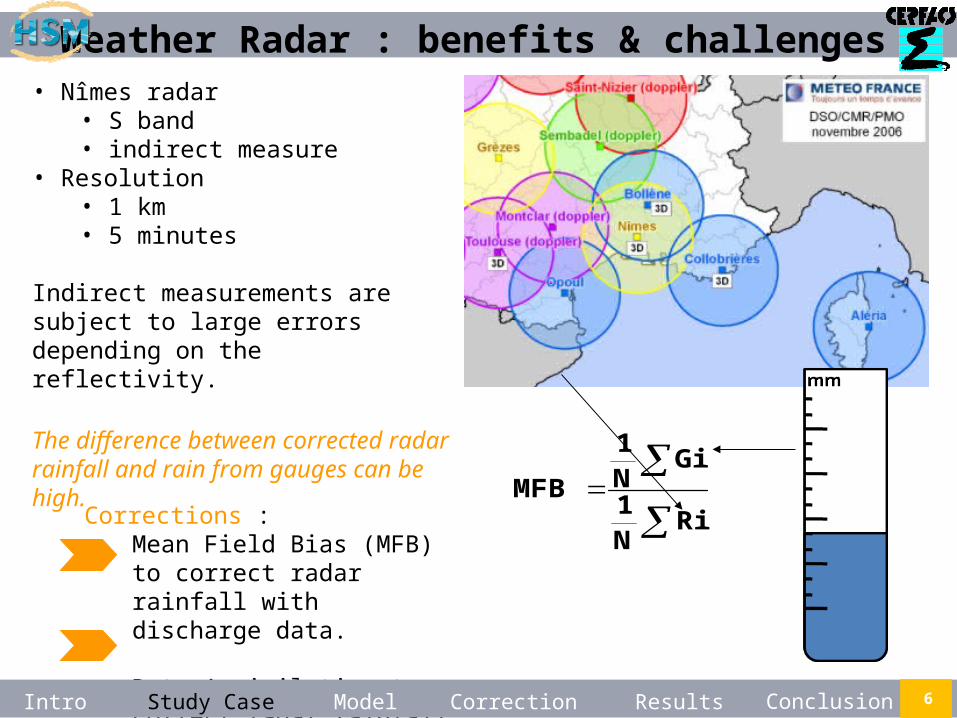
• Nîmes radar• S band • indirect measure
• Resolution• 1 km• 5 minutes
Indirect measurements are subject to large errors depending on the reflectivity.
The difference between corrected radar rainfall and rain from gauges can be high.
Corrections : Mean Field Bias (MFB) to correct radar rainfall with discharge data.
Data Assimilation to correct radar rainfall with discharge data.
66Intro Study Case Model Correction Results Conclusion
Weather Radar : benefits & challenges
RiN1
GiN1
MFB

Conceptual reservoir model = SCS loss function adaptated for
karstic watershed
7 7Intro Study Case Model Correction Results Conclusion
The Hydrological Model
Loss Function : modified SCS
S
p(t)
min(1,w/S) * ds * S(t)
(1-min(1,w/S)) * ds * S(t)
ds * S(t)
p(t) – r(t)
S(t)
r(t) = C(t) * p(t)
S0
sol + karst
Sources: Borrell and al. 2008, Coustau and al. 2010
• 2 parameters : w and ds• S (initial condition) : the potential storage depth must be calibrated
IRD, HSM

• Lag and route transfer function : with 2 parameters (Vo and Ko)
•Parsimonious Model•Robustness evaluated by cross
calibration•Model performance evaluated
through the Nash criterion.
8
Sources: Borrell and al. 2008, Coustau and al. 2010
8Intro Study Case Model Correction Results Conclusion
The Hydrological Model
Transfer Function : Lag & Route
t0 t
R
Rainfall on the watershed
lag (V0)
diffusion (K0)
Qm
Tm
t0 t0 + Tm t
Transfered rainfall at the outlet
2
2
)(
)(1
obsobs
obssim
QQNash

The model can be initialized with piezometric levels or the soil humidity. The mix of rain gauges and radar rainfall corrected with MFB considerably improve the performance of the model (in particular the initial estimation). We loose quality in forcast-like mode due to uncertainty in the S estimation. The use of the MFB => no forecast-like runs ! The results in re-analysis mode are improved over the forecast mode.
9Intro Study Case Model Correction Results Conclusion
Analysis and forecast-like runs 7 different piezometric stations to
establish the initial correlation : 0,63 < R2 < 0,81
The SIM parameter to establish the initial correlation : R2 = 0.67
Satisfactory quality for the false forecast-like runs (Nash > 0.7 for
9 events)

HYDROLOGICAL MODEL
State Variable Parameters
S , Vo
Rrain(t)
Qb(t)
Q(t)
t
Observations
Qo(t)
Assimilation :
Extended Kalman Filter
234
Qb(t) : background run
Qo(t) : observationsQa(t) : analysis run
correction1
Qa(t)
Data Assimilation
Correction on the observed radar rainfall
tRrain 4
A sensitivity analysis highligthed the most influence parameters : S and Rainfall

Kalman gain:K = BHT(HBHT+R)-1
Update: xa = xb - K(yo – H(xb))
x control vectorH, H observation operatoryo observation vectorxb background xa analysisB background error cov. matrixR observation error cov. matrix
11
A Simplified Extended Kalman Filter (updated BLUE)
*OpenPALM is a coupling software developped at CERAFCS.
11Intro Study Case Model Correction Results Conclusion
Data Assimilation to correct S with discharge data
Observations
Background (S = 160 mm)
Analysis : Iteration 1 (S = 140 mm)
Analysis : Iteration 5 (S = 131 mm)

12
Improvement in the forecast-like mode when correcting initial S value with Data Assimilation :
12Intro Study Case Model Correction Results Conclusion
Data Assimilation to correct S with discharge data
(ERDP)
Improvement
Corrected parameter by DA
obs
obsbbRDP Qp
QpQpE
bRDPaRDPRDP EEE )(
Calculated for the Background and Analyse
The correction of S improves the peak flow in re-analysis mode and in forecast-like mode.

In reanalysis mode :• initialise S using known hydrograph• and create background hydrograph α =1 (pink)• then assimilate to find multiplier, α and calculate analysis (green)
Rain
fall
(mm
)
13Intro Study Case Model Correction Results Conclusion
Data Assimilation to correct radar rain with discharge data
Q(m3/s)
In forecast-like mode :• use the piezometric level to estimate S• and create background hydrograph α =1 (pink)• then assimilate the first observed discharges to find multiplier, α and calculate analysis (green)

Uncertainty in forecast is increased by : • Parameterisation of S with piezometry • Reduced assimilation window,peak not included • Variability of the rainfall error (α constant )
Forecats-like runs
Average NS = 0.50
1414Intro Study Case Model Correction Results Conclusion
Results of the forecast mode
Direct runs with radar rainfall not corrected
ref Average NS = 0.05
Re-analysis runs 96% Average NS = 0.70
Forecast-like runs 61% Average NS = 0.50
Harader and al. 2012
Evaluation of the results: • iterate for each episode (1997-2008)• calculate performance criteria:
Peak Height (PH)Nash-Sutcliffe criterion (NS)
The correction of precipitation produced by weather radar in re-analysis conditions improved simulation quality.

General objective : to propose an appropriate methodology for a flood forecasting model under changing conditions to improve its efficiency
15Thank you for your attention.
Conclusions & Perspectives
Different rainfall measurements
Temporal variability of initial condition
Different flood intensities
The conceptual hydrological model does not guarantee the quality of flood simulations with intensities not observed in the data base used for calibration.
The data assimilation loop helps to improve flash flood simulation on re-analysis settings, whatever the flood intensities are.
The data assimilation loop opens new perspectives in forecast-like settings.
Work in progress : Improving algorithms in order to
correct radar rainfall before forcing the model Work on other karstic watersheds
Data Assimilation of discharge at the beginning of the flood
initial condition rainfall
Planned work with data assimilation : Multiple windows for correcting rainfall Considering both rain gauges and radar rain in the corrected fields