bereket zerai andhra university, india & mekelle...
TRANSCRIPT

African Journal of Accounting, Economics, Finance and Banking Research Vol. 8.No. 8, 2012. Bereket Zerai & Lalitha Rani
1
TECHNICAL EFFICIENCY AND ITS DETERMINANTS OF MICRO
FINANCE INSTITUTIONS IN ETHIOPIA: A STOCHASTIC
FRONTIER APPROACH
Bereket Zerai1,
Andhra University, India & Mekelle University Ethiopia
Email: [email protected]
Lalitha Rani2,
Andhra University, India
E-mail: [email protected]
ABSTRACT
This study aims to examine technical efficiency performance of Ethiopian Micro Finance
institutions (MFIs) over the period of 2004 to 2009 using Stochastic Frontier Analysis (SFA)
model. The results of the analysis revealed that an overall average technical efficiency of
71.72%; imply that there is a substantial scope for Ethiopian MFIs to improve their
performance without the need to use additional resources. The study further shows that
asset, operational sustainability, women, i.e., depth of outreach and trend are significant
determinants of efficiency. Our findings also provide evidence on tradeoff between efficiency
and outreach of microfinance institutions. Overall, the findings imply that the MFIs should
devise strategies and practices boosting scale and ensuring sustainability while maintain
social goals.
Key words: technical efficiency, stochastic frontier analysis, microfinance institutions,
Ethiopia
JEL Codes: D24, G21
1 Ph.D. candidate at Andhra University, Visakhapatnam - 530 003, Andhra Pradesh, India; and
Lecturer in Department of Accounting & Finance, Mekelle University, P o. Box 451,Mekelle, Ethiopia
2 Professor of Marketing and Entrepreneurship, Department of Commerce and Management studies,
Andhra University, Visakhapatnam- 530 003, Andhra Pradesh, India email [email protected]
3
African Journal of Accounting, Economics, Finance and Banking Research Vol. 8.No. 8, 2012. Bereket Zerai & Lalitha Rani
2
I. INTRODUCTION
In developing countries, including Ethiopia, Micro Finance Institutions (MFIs)
emerged with unique opportunity to poor people who do not have access to
commercial Banks. Microfinance involves the provision of micro-credit, savings, and
other services to the poor that are excluded by the commercial banks for collateral
and other reasons. Microfinance is relatively new to Ethiopia and came to appear in
1994/95 with the government’s Licensing and Supervision of Microfinance Institution
Proclamation.
As of 2010, there were 30 MFIs operating in the urban and rural parts of the country
and have tried to reach more than 2.3 million poor clients (AEMFI, 2010). Indeed, the
figure seems large in absolute term; however, it is small in relation to the potential
poor clients.
Cognizant to the fact Ethiopian MFIs have made notable progress in the past decade
in terms of outreach(see Amaha, 2008) yet covering only a small percentage of the
population and many of the poor in the country are heavily dependent on informal
credits and informal financial institutions. The demand for microfinance is far from
being met by the existing MFIs. Studies such as (Chao-Beroff et al, 2000; Amaha, 2008)
show that the existing MFIs in the country reach only a fraction of the country’s poor,
i.e., 10-20 percent of microfinance demand of the country. This study, however,
argues that such limited outreach could be due to inefficient utilization of limited
resources in producing the required output apart from weak governance and
ownership and other challenges that the industry is facing (Itana, 2003; Pfister et al,
2008; Amaha, 2008; Bienen 2009).
The ownership structure of Ethiopian MFIs is thought to be very loose in the sense
that firstly, the so-called owners have no real control over the shares and hence may
not have sufficient interest to control and guide the management of MFIs. Secondly, it
is dominated by the groups with different historical and strategic camps -government
affiliated verses NGO affiliated. In some cases, such dominances have been spoiling
the market and remain a threat for the industry due to the practice of some illegal
government and NGO operations (Amaha 2008). Moreover, microfinance industry of
the country is highly concentrated. The four largest – Amhara Credit and Saving
Institution (ACSI), Dedebit Credit and Saving Institution (DECSI), Oromia Credit and
Saving Share Company (OCSSCO) and Omo Micro Finance Institution – are backed
by the government account for 81 per cent of client outreach and 85 per cent of total
African Journal of Accounting, Economics, Finance and Banking Research Vol. 8.No. 8, 2012. Bereket Zerai & Lalitha Rani
3
loans outstanding(AEMFI, 2010). Ethiopian MFIs are also criticized for not being
innovative of their own approach rather they replicate each other and in most cases
the financial products of these institutions seem to be the same (Berihun et al, 2009).
Thus it seems timely to have a study that signifies the efficiency/performance status
of the MFIs and factors accounting for inefficiencies therein with the expectation that
helping them to reach more clients in sustainable way if there is possibility of scale to
operate.
These institutions, in fulfilling their social and commercial objectives in a sustainable
way in the long run, need to be efficient. In other words, they should allocate their
resources efficiently such that resources such as labor, capital and other resources
should be allocated in a way that maximize social and financial objectives. However,
we are not aware of any study that attempts to estimate efficiency of these
institutions. In this paper, therefore, we have tried to evaluate the efficiency of
Ethiopian MFIs using a widely applied parametric measure - stochastic frontier
approach. The underlining assumption of this study is that an efficient microfinance
may satisfy both the interests of the institution and its clients. Micro finances, in
striving for efficiency, need to maximize outputs and minimize inputs and in the
meantime enhance growth and sustainability. Such performances would help
Ethiopian MFIs to charge reasonable and affordable interest rates to poor clients
while meeting interests of owners.
So far, various studies have been done in Ethiopia concerning microfinance.
However, most of them focused only on impact of such institutions in the
livelihood and well being of the poor (cf: Gobeze,2001; Thehay and Bediye, 2002;
Amaha, 2003;Borchgrevink et al 2005; Assefa et al, 2005;Garber et al 2006;
Negash ,2008; 2009; Berhane, 2010 ). Notable studies on regulation and governance
and ownership include Itana et.al (2003), Amaha (2005); Amaha (2008). Some
performance analysis papers also Amaha (2003), Amaha (2007), Amha (2008). The
two exceptions are those of Keriata (2007) and Ejigu (2009) who tried to evaluate the
performances of Ethiopian MFIs in terms of outreach and sustainability and are
found to be less rigorous. This is the first paper that addresses efficiency
performances of Ethiopian MFIs. Therefore, this paper is expected to influence policy
makers and practitioners by giving empirical evidences on efficiency status and
operating circumstances of Ethiopian MFIs. The study is also expected to add value
to the limited stock of literature in the area of MFIs efficiency. In literature one could
find substantial papers on efficiency in banking in different parts of the world
African Journal of Accounting, Economics, Finance and Banking Research Vol. 8.No. 8, 2012. Bereket Zerai & Lalitha Rani
4
following the first application paper of Sherman(1982) unlike to a few recent in MFIs.
Our findings provide empirical evidence on efficiency status of the MFIs. Despite the
efficiency improvement experienced in the period there still is substantial room to
expand their outreach level using the existing resources. Further, the study observes
considerable differences in inefficiency among Ethiopian MFIs and the variation in
output/performance is due to the differences inefficiency effect. These are mainly
attributed to scale, sustainability, management practices, and goal orientation of the
institutions.
The rest of the paper is organized as follows. Section 2 puts brief review of empirical
studies on efficiency of MFIs in the world. Section 3 provides data and methodology.
Section 4 presents results and discussions. Finally, Section 5 ends up with
conclusions.
II. LITERATURE REVIEW
Efficiency in microfinance is a question of how well an MFI allocates inputs such as
staff, assets and subsidies to produce the maximum output such as number of loans,
financial self-sufficiency and poverty outreach, (Balkenhol, 2007). MFIs are expected
not only to become financial self sufficient but also to reach the poor. To that end they
should allocate their resources efficiently, i.e., resources such as labor, capital and
other resources should be allocated in a way that maximize social and financial
objectives. Traditionally, microfinance institution’s performance has been commonly
measured using various accounting ratios. Though ratios provide great deal of
information they are not without problem. Ratios provide only partial measures of
efficiency and partial efficiency may be misleading when we draw conclusions on the
overall efficiency of MFIs. Studies attempted to measure efficiency of MFIs using
ratios include (Farrington, 2000; Lafouracade et al., 2005; Baumman, 2005). On the
other hand, studies such as (Nghiem, 2004; Gutierrez-Nieto et al. 2005; Gutierrez-
Nieto et al., 2009; Hassan & Tuffe, 2001; Abdul Qayyum & Ahmed, 2006; Haq et al.,
2007; Sufian, 2006; Bassem, 2008; Hermes et al., 2008; Hassan & Benito, 2009; Nawaz,
2009; Masood and Ahmed, 2010; Oteng-Abayie et.al 2011) have applied frontier
efficiency measures either the Data Envelopment Analysis or Stochastic Frontier
Analysis. These recent studies on MFIs are quite minimal comparing to more than
130 studies made before the year 1997 in banking (see Berger and Humphrey 1997).
Following is explained the findings of empirical studies on efficiency of MFIs around
the globe.
African Journal of Accounting, Economics, Finance and Banking Research Vol. 8.No. 8, 2012. Bereket Zerai & Lalitha Rani
5
Guitierrez-Nieto et al. (2006) applied a DEA non-parametric approach to analyze the
efficiency of 30 Latin American MFIs. In their study, they tried to explore the
multivariate analysis of the DEA results by developing 21 specifications using two
inputs and three outputs. Their study found that an NGO and a non-bank financial
institution are the most efficient among the various group of MFIs. Bassem (2008)
estimated efficiency of 35 MFIs in the Mediterranean zone for the period 2004–2005
using DEA and found that eight institutions were efficient. Further, the study found
that size of the MFI has a negative effect on efficiency. Masood and Ahmed (2010)
applied a stochastic frontier model to estimate the efficiency of 40 Indian
microfinance institutions for the period 2005-2008. They found that mean efficiency
level of microfinance institutions is low. Further, the study found that regulated
microfinance institutions are less efficient and age of microfinance institution has a
positive effect on efficiency. Haq et al. (2009) investigated the efficiency of 39 MFIs in
developing world (Africa, Asia, and Latin America) using the data envelopment
analysis (DEA) based intermediation and production approaches. These diffident
approaches tend to give conflicting results. Their findings show that non-
governmental microfinance institutions under production approach are the most
efficient. On the other hand, the study shows bank-microfinance institutions
outperform and are more efficient under intermediation approach.
Abdul Qayyum and Ahmad (2006) tried to investigate the efficiency of 85 MFIs in
South Asia (consisting of 15 Pakistani, 25 Indian, and 45 Bangladeshi). The analysis
revealed that the inefficiency of the MFIs in Pakistan, India, and Bangladesh is mainly
of technical nature and to improve their efficiencies, they suggest that the MFIs need
to enhance their managerial expertise and improve technology.
Nghiem et al. (2004) investigates the efficiency of microfinance industry in Vietnam
through a survey of 46 schemes in the north and central regions by employing the
Data Envelopment Analysis (DEA). The result of the study reveals that the average
technical efficiency score of schemes is 80%. Further, the study found that age and
location have positive effect on efficiency of the schemes.
Hassan and Tufte (2001) examine cost inefficiency and determinants of the Grameen
Bank (GB) using branch level cost data over the 1988-1991 period. Using a stochastic
frontier analysis they found that Grameen Bank’s branches staffed by the female
employees operated more efficiently than their counterparts staffed by the male
employees.

African Journal of Accounting, Economics, Finance and Banking Research Vol. 8.No. 8, 2012. Bereket Zerai & Lalitha Rani
6
Hermes et al. (2008) used stochastic frontier analysis to examine a trade-off between
outreach to the poor and efficiency of microfinance institutions based on 435 MFIs
and found that outreach and efficiency of MFIs are negatively correlated. Their
finding further indicates that efficiency of MFIs is higher if they focus less on the poor
and/or reduce the percentage of female borrowers. Oteng-Abayie et.al (2011) applied
a Cobb-Douglas Stochastic frontier model for Ghana MFIs for the period from 2007-
2010. They found that average economic efficiency of 56.29%; and further age and
savings indicators of outreach and productivity, and cost per borrower found to be
significant determinants of economic efficiency.
III. METHODOLOGICAL FRAMEWORK
In literatures of financial institutions there are two computing approaches commonly
used to measure efficiency of institutions namely parametric which include among
others, Stochastic Frontier Approach (SFA) and non parametric mainly the Data
Envelopment Analysis(DEA). DEA and stochastic frontiers are two alternative
methods for estimating frontier functions and thereby measuring efficiency of
production. DEA involves the use of linear programming whereas stochastic frontiers
involve the use econometric methods (Coelli, et al., 1998). In contrast to SFA which
attempts to determine the absolute economic efficiency of institution DEA tries to
evaluate the efficiency of an institution relative to other institutions in the same
industry. Studies acknowledged that both approaches have advantages and
limitations as well (see for example, Berger and Humphrey, 1997; Coelli, et al.,
1998).The superiority of one approach over the other has been a subject of discussion
and is still remaining debatable in literature. Apparently, however, others suggest
that, for instance, (Resti 1997; Bauer et al., 1998; Ondrich and Ruggiero, 2000; Leon
2001) both produce similar rankings, and conclude that both approaches are
complimentary to measure efficiency.
Stochastic frontier analysis (SFA) is an econometric method that can be used to
measure efficiency in a similar way to DEA. This approach was first introduced
simultaneously by Aigner Lovell and Schmidt (1977) and Meeusen and Van den
Broeck (1977).SFA specifies the relationship between output and input levels and
decomposes the error term in to two components, one to account for random effects
and another to account for technical inefficiency. SFA has the advantages over DEA
of accommodating data ‘noise’ and statistical tests, but has the disadvantages of
requiring a functional form to be specified and it does not provide the wealth of
information on things such as peers and peer weights, which are provided by DEA.
African Journal of Accounting, Economics, Finance and Banking Research Vol. 8.No. 8, 2012. Bereket Zerai & Lalitha Rani
7
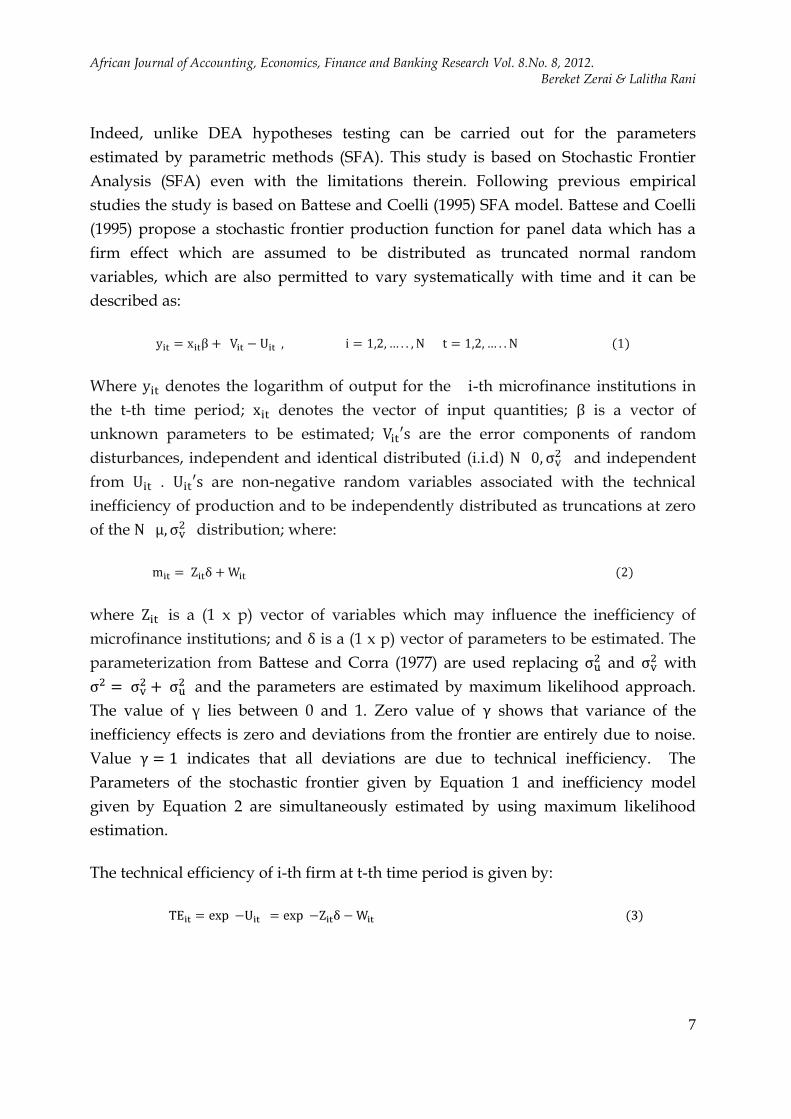
Indeed, unlike DEA hypotheses testing can be carried out for the parameters
estimated by parametric methods (SFA). This study is based on Stochastic Frontier
Analysis (SFA) even with the limitations therein. Following previous empirical
studies the study is based on Battese and Coelli (1995) SFA model. Battese and Coelli
(1995) propose a stochastic frontier production function for panel data which has a
firm effect which are assumed to be distributed as truncated normal random
variables, which are also permitted to vary systematically with time and it can be
described as:
Where denotes the logarithm of output for the i-th microfinance institutions in
the t-th time period; denotes the vector of input quantities; is a vector of
unknown parameters to be estimated; are the error components of random
disturbances, independent and identical distributed (i.i.d) and independent
from . are non-negative random variables associated with the technical
inefficiency of production and to be independently distributed as truncations at zero
of the distribution; where:
where is a (1 x p) vector of variables which may influence the inefficiency of
microfinance institutions; and is a (1 x p) vector of parameters to be estimated. The
parameterization from Battese and Corra (1977) are used replacing and with
and the parameters are estimated by maximum likelihood approach.
The value of γ lies between 0 and 1. Zero value of shows that variance of the
inefficiency effects is zero and deviations from the frontier are entirely due to noise.
Value indicates that all deviations are due to technical inefficiency. The
Parameters of the stochastic frontier given by Equation 1 and inefficiency model
given by Equation 2 are simultaneously estimated by using maximum likelihood
estimation.
The technical efficiency of i-th firm at t-th time period is given by:
African Journal of Accounting, Economics, Finance and Banking Research Vol. 8.No. 8, 2012. Bereket Zerai & Lalitha Rani
8
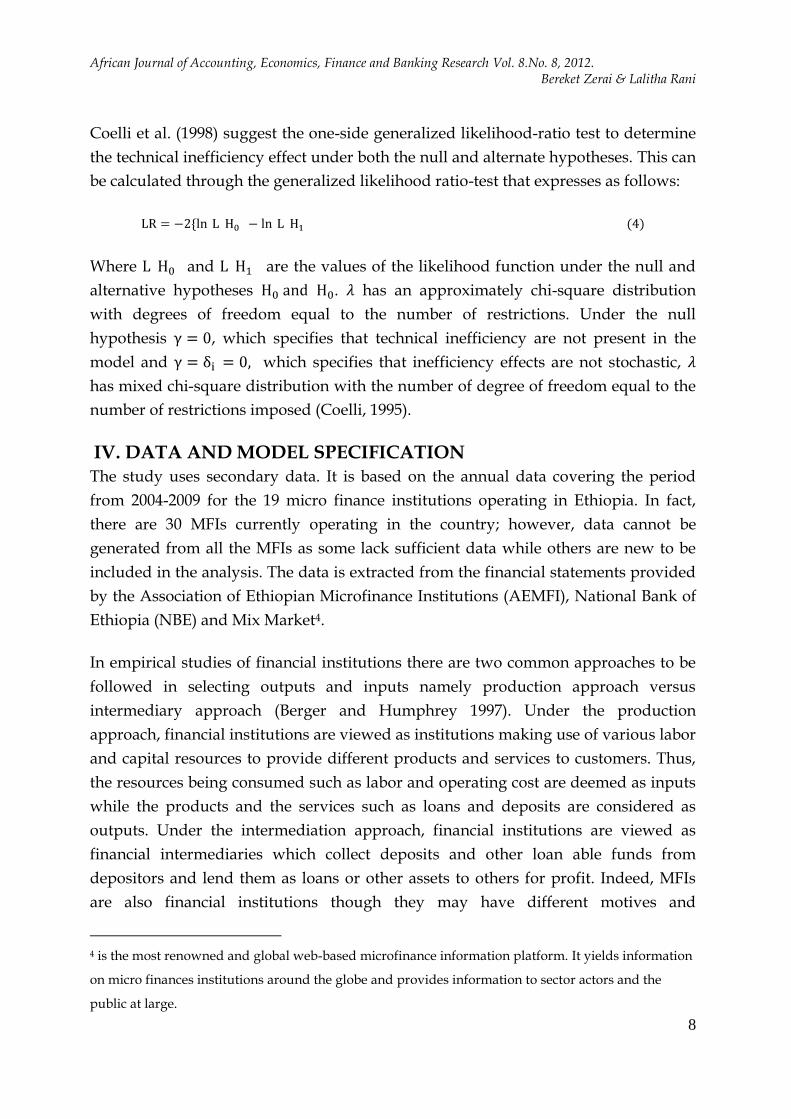
Coelli et al. (1998) suggest the one-side generalized likelihood-ratio test to determine
the technical inefficiency effect under both the null and alternate hypotheses. This can
be calculated through the generalized likelihood ratio-test that expresses as follows:
Where and are the values of the likelihood function under the null and
alternative hypotheses . has an approximately chi-square distribution
with degrees of freedom equal to the number of restrictions. Under the null
hypothesis , which specifies that technical inefficiency are not present in the
model and which specifies that inefficiency effects are not stochastic,
has mixed chi-square distribution with the number of degree of freedom equal to the
number of restrictions imposed (Coelli, 1995).
IV. DATA AND MODEL SPECIFICATION
The study uses secondary data. It is based on the annual data covering the period
from 2004-2009 for the 19 micro finance institutions operating in Ethiopia. In fact,
there are 30 MFIs currently operating in the country; however, data cannot be
generated from all the MFIs as some lack sufficient data while others are new to be
included in the analysis. The data is extracted from the financial statements provided
by the Association of Ethiopian Microfinance Institutions (AEMFI), National Bank of
Ethiopia (NBE) and Mix Market4.
In empirical studies of financial institutions there are two common approaches to be
followed in selecting outputs and inputs namely production approach versus
intermediary approach (Berger and Humphrey 1997). Under the production
approach, financial institutions are viewed as institutions making use of various labor
and capital resources to provide different products and services to customers. Thus,
the resources being consumed such as labor and operating cost are deemed as inputs
while the products and the services such as loans and deposits are considered as
outputs. Under the intermediation approach, financial institutions are viewed as
financial intermediaries which collect deposits and other loan able funds from
depositors and lend them as loans or other assets to others for profit. Indeed, MFIs
are also financial institutions though they may have different motives and
4 is the most renowned and global web-based microfinance information platform. It yields information
on micro finances institutions around the globe and provides information to sector actors and the
public at large.
African Journal of Accounting, Economics, Finance and Banking Research Vol. 8.No. 8, 2012. Bereket Zerai & Lalitha Rani
9
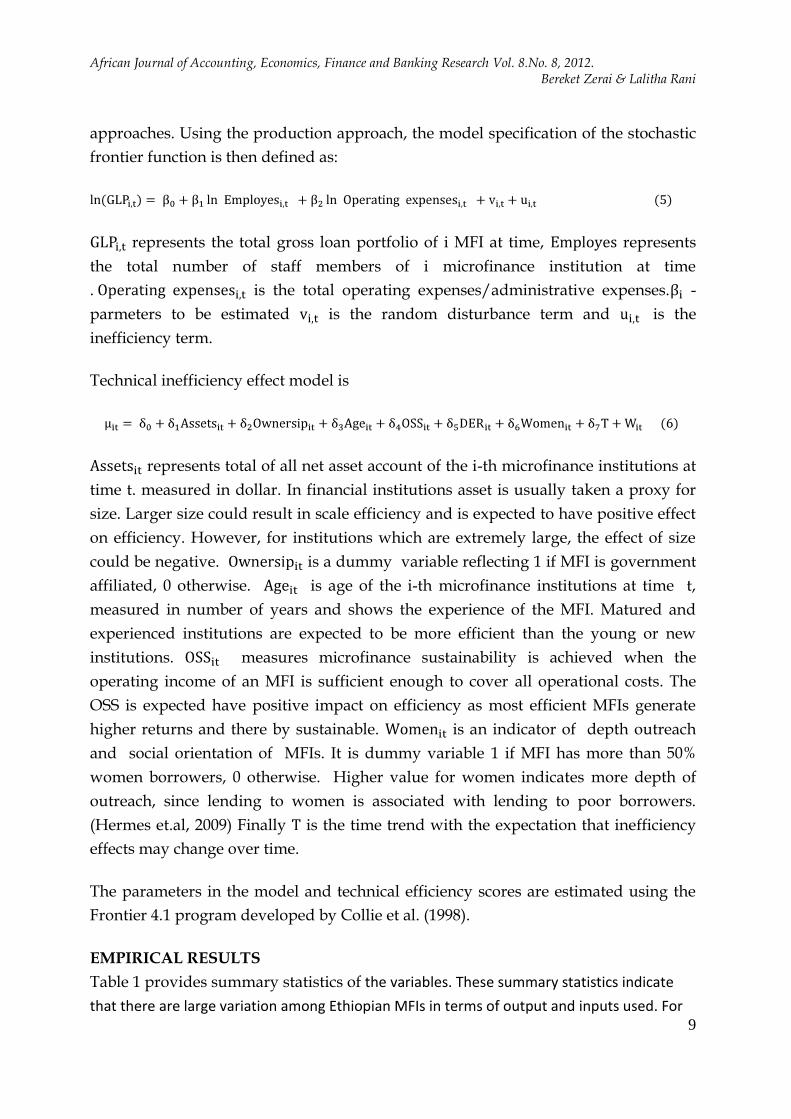
approaches. Using the production approach, the model specification of the stochastic
frontier function is then defined as:
represents the total gross loan portfolio of i MFI at time, represents
the total number of staff members of i microfinance institution at time
. is the total operating expenses/administrative expenses. -
parmeters to be estimated is the random disturbance term and is the
inefficiency term.
Technical inefficiency effect model is
represents total of all net asset account of the i-th microfinance institutions at
time t. measured in dollar. In financial institutions asset is usually taken a proxy for
size. Larger size could result in scale efficiency and is expected to have positive effect
on efficiency. However, for institutions which are extremely large, the effect of size
could be negative. is a dummy variable reflecting 1 if MFI is government
affiliated, 0 otherwise. is age of the i-th microfinance institutions at time t,
measured in number of years and shows the experience of the MFI. Matured and
experienced institutions are expected to be more efficient than the young or new
institutions. measures microfinance sustainability is achieved when the
operating income of an MFI is sufficient enough to cover all operational costs. The
OSS is expected have positive impact on efficiency as most efficient MFIs generate
higher returns and there by sustainable. is an indicator of depth outreach
and social orientation of MFIs. It is dummy variable 1 if MFI has more than 50%
women borrowers, 0 otherwise. Higher value for women indicates more depth of
outreach, since lending to women is associated with lending to poor borrowers.
(Hermes et.al, 2009) Finally is the time trend with the expectation that inefficiency
effects may change over time.
The parameters in the model and technical efficiency scores are estimated using the
Frontier 4.1 program developed by Collie et al. (1998).
EMPIRICAL RESULTS
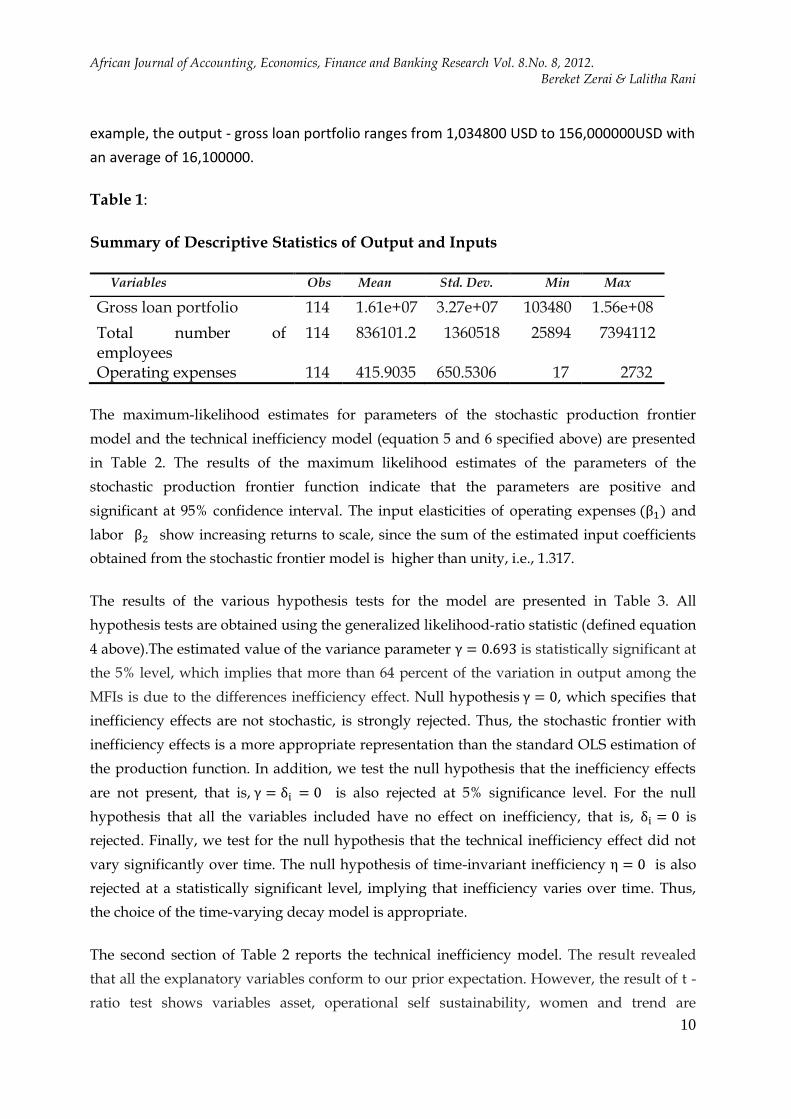
Table 1 provides summary statistics of the variables. These summary statistics indicate
that there are large variation among Ethiopian MFIs in terms of output and inputs used. For
African Journal of Accounting, Economics, Finance and Banking Research Vol. 8.No. 8, 2012. Bereket Zerai & Lalitha Rani
10
example, the output - gross loan portfolio ranges from 1,034800 USD to 156,000000USD with
an average of 16,100000.
Table 1:
Summary of Descriptive Statistics of Output and Inputs
Variables Obs Mean Std. Dev. Min Max
Gross loan portfolio 114 1.61e+07 3.27e+07 103480 1.56e+08
Total number of employees
114 836101.2 1360518 25894 7394112
Operating expenses 114 415.9035 650.5306 17 2732
The maximum-likelihood estimates for parameters of the stochastic production frontier
model and the technical inefficiency model (equation 5 and 6 specified above) are presented
in Table 2. The results of the maximum likelihood estimates of the parameters of the
stochastic production frontier function indicate that the parameters are positive and
significant at 95% confidence interval. The input elasticities of operating expenses and
labor show increasing returns to scale, since the sum of the estimated input coefficients
obtained from the stochastic frontier model is higher than unity, i.e., 1.317.
The results of the various hypothesis tests for the model are presented in Table 3. All
hypothesis tests are obtained using the generalized likelihood-ratio statistic (defined equation
4 above).The estimated value of the variance parameter is statistically significant at
the 5% level, which implies that more than 64 percent of the variation in output among the
MFIs is due to the differences inefficiency effect. Null hypothesis , which specifies that
inefficiency effects are not stochastic, is strongly rejected. Thus, the stochastic frontier with
inefficiency effects is a more appropriate representation than the standard OLS estimation of
the production function. In addition, we test the null hypothesis that the inefficiency effects
are not present, that is, is also rejected at 5% significance level. For the null
hypothesis that all the variables included have no effect on inefficiency, that is, is
rejected. Finally, we test for the null hypothesis that the technical inefficiency effect did not
vary significantly over time. The null hypothesis of time-invariant inefficiency is also
rejected at a statistically significant level, implying that inefficiency varies over time. Thus,
the choice of the time-varying decay model is appropriate.
The second section of Table 2 reports the technical inefficiency model. The result revealed
that all the explanatory variables conform to our prior expectation. However, the result of t -
ratio test shows variables asset, operational self sustainability, women and trend are

African Journal of Accounting, Economics, Finance and Banking Research Vol. 8.No. 8, 2012. Bereket Zerai & Lalitha Rani
11
statistically different from zero at 5 percent level of significance. Thus, these variables are
important determinant of efficiency of the MFIs. The negative value of parameters asset
financial sustainability and trend in the technical inefficiency function indicates the positive
influence on the performance of the MFIs. In other words, asset, operational sustainability
and time are inversely related with inefficiency implying that these variables are found to
improve efficiency. The negative coefficient of asset to inefficiency suggests that large MFIs
are more efficient than the small MFIs. This would support the assumption that large firms
tend to enjoy economies of scale. Coefficient of the variable operational sustainability is
negative indicate that sustainable MFIs are more efficient than the unsustainable MFIs. The
negative coefficient of time implies that technical efficiency increases significantly over time.
The positive sign linked to the variable women is also expected. The positive coefficient of
women to inefficiency suggests that more social oriented MFIs are less efficient. This also
shows a tradeoff between efficiency and outreach which is consistent with the findings of
Hermes et al., (2008).
Table 2
Maximum Likelihood Estimates of the Production Function
Model Parameter Coefficient Standard error t-ratio
Constant 0.595* 0.176 3.381 Ln total operating expenses
0.872* 0.130 6.708
Ln number of employees 0.383* 0.139 2.755 Technical inefficiency: Constant 0.114 0.350 0.326 Time -0.451* 0.125 -3.608 Total asset -0.873* 0.209 -4.177 Ownership -0.132 0.281 -0.469 Age -0.109 0.110 -0.991 Financial sustainability -0.685* 0.121 -5.661 Women 0.669* 0.210 3.185 Sigma-squared 0.252 0.119 2.117 Gamma 0.639 0.188 3.399 Log likelihood estimation -39.41
* shows the significance of variable at 5% level of significance
African Journal of Accounting, Economics, Finance and Banking Research Vol. 8.No. 8, 2012. Bereket Zerai & Lalitha Rani
12
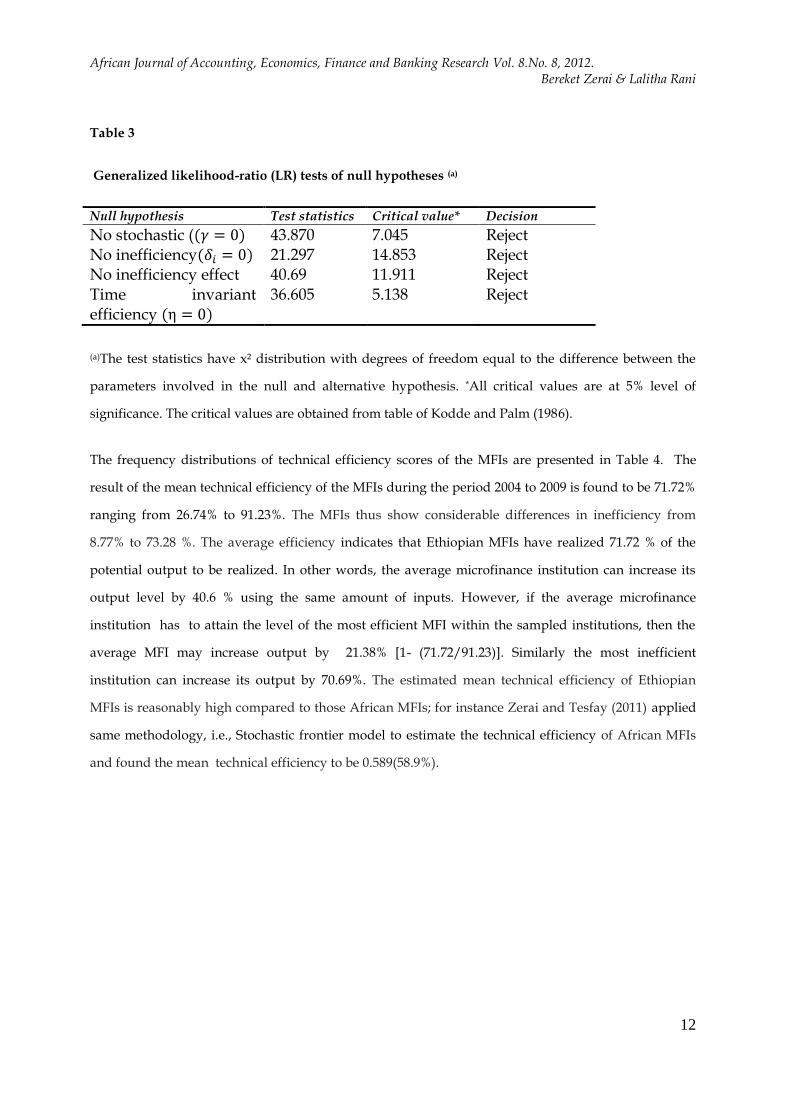
Table 3
Generalized likelihood-ratio (LR) tests of null hypotheses (a)
Null hypothesis Test statistics Critical value* Decision
No stochastic ( 43.870 7.045 Reject No inefficiency 21.297 14.853 Reject No inefficiency effect 40.69 11.911 Reject Time invariant efficiency
36.605 5.138 Reject
(a)The test statistics have x² distribution with degrees of freedom equal to the difference between the
parameters involved in the null and alternative hypothesis. *All critical values are at 5% level of
significance. The critical values are obtained from table of Kodde and Palm (1986).
The frequency distributions of technical efficiency scores of the MFIs are presented in Table 4. The
result of the mean technical efficiency of the MFIs during the period 2004 to 2009 is found to be 71.72%
ranging from 26.74% to 91.23%. The MFIs thus show considerable differences in inefficiency from
8.77% to 73.28 %. The average efficiency indicates that Ethiopian MFIs have realized 71.72 % of the
potential output to be realized. In other words, the average microfinance institution can increase its
output level by 40.6 % using the same amount of inputs. However, if the average microfinance
institution has to attain the level of the most efficient MFI within the sampled institutions, then the
average MFI may increase output by 21.38% [1- (71.72/91.23)]. Similarly the most inefficient
institution can increase its output by 70.69%. The estimated mean technical efficiency of Ethiopian
MFIs is reasonably high compared to those African MFIs; for instance Zerai and Tesfay (2011) applied
same methodology, i.e., Stochastic frontier model to estimate the technical efficiency of African MFIs
and found the mean technical efficiency to be 0.589(58.9%).
African Journal of Accounting, Economics, Finance and Banking Research Vol. 8.No. 8, 2012. Bereket Zerai & Lalitha Rani
13
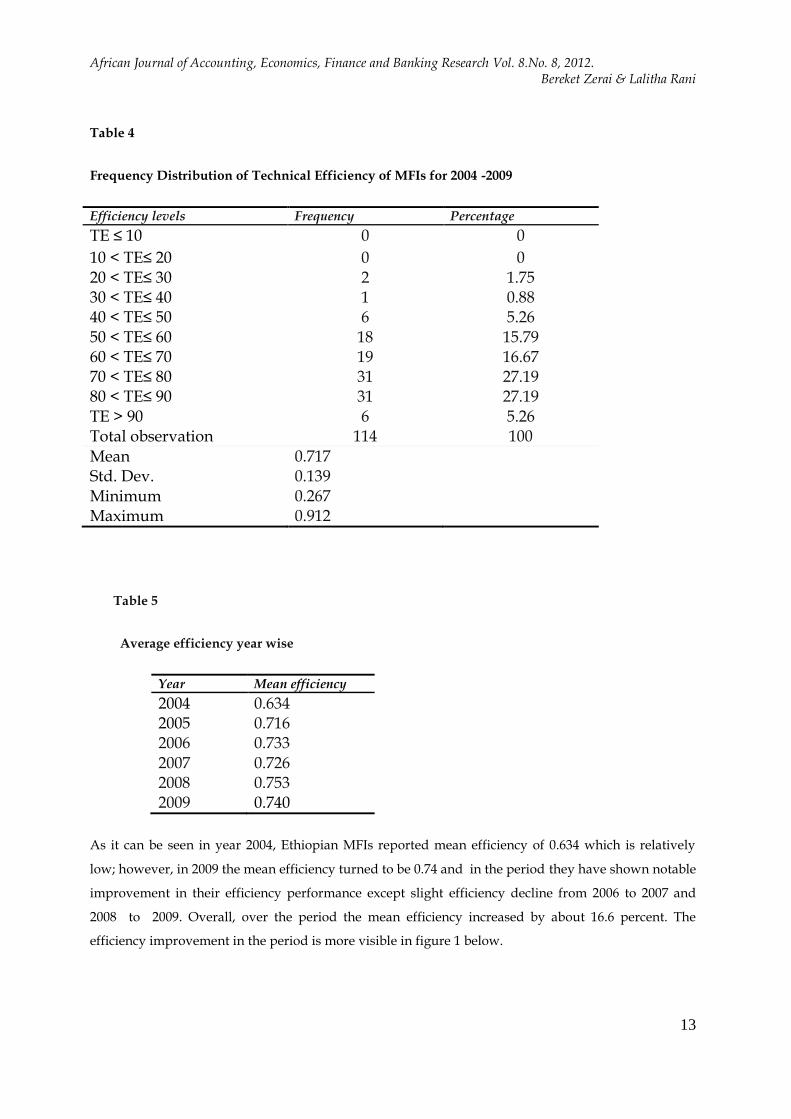
Table 4
Frequency Distribution of Technical Efficiency of MFIs for 2004 -2009
Efficiency levels Frequency Percentage
TE ≤ 10 0 0
10 < TE≤ 20 0 0 20 < TE≤ 30 2 1.75 30 < TE≤ 40 1 0.88 40 < TE≤ 50 6 5.26 50 < TE≤ 60 18 15.79 60 < TE≤ 70 19 16.67 70 < TE≤ 80 31 27.19 80 < TE≤ 90 31 27.19 TE > 90 6 5.26 Total observation 114 100 Mean 0.717 Std. Dev. 0.139 Minimum 0.267 Maximum 0.912
Table 5
Average efficiency year wise
Year Mean efficiency
2004 0.634 2005 0.716 2006 0.733 2007 0.726 2008 0.753 2009 0.740
As it can be seen in year 2004, Ethiopian MFIs reported mean efficiency of 0.634 which is relatively
low; however, in 2009 the mean efficiency turned to be 0.74 and in the period they have shown notable
improvement in their efficiency performance except slight efficiency decline from 2006 to 2007 and
2008 to 2009. Overall, over the period the mean efficiency increased by about 16.6 percent. The
efficiency improvement in the period is more visible in figure 1 below.

African Journal of Accounting, Economics, Finance and Banking Research Vol. 8.No. 8, 2012. Bereket Zerai & Lalitha Rani
14
Figure 1 average efficiency trends of Ethiopian MFIs
It is interesting to observe a clear trend in time from the figure above and suggests that Ethiopian MFIs
have experienced continuous improvement in their efficiency performance over the period.
V. CONCLUSIONS
This paper investigates the technical efficiency of Ethiopian microfinance institutions
with panel data for 19 MFIs during 2004-2009 using the Stochastic Frontier Analysis.
The results show that Ethiopian MFIs are operating at a sub optimal size with an
overall mean efficiency for the group of MFIs to be 71.72%; indicating that there is
substantial scope for improving efficiency performance of the MFIs without the need
to use more resources. Moreover, provided that the prevalence of large variation in
the level of technical efficiency across the institutions, the potential for increasing
MFIs output (outreach) through efficient use of existing inputs varies greatly across
the MFIs. Further the results reveal that asset, operational sustainability, women, and
trend are important determinants of efficiency of MFIs. The negative signs linked to
the variables of asset, sustainability and trend to inefficiency signifies that the
positive influence of these variables on the efficiency performance of MFIs. Our
findings also provide evidence on the tradeoff between efficiency and outreach of
microfinance institutions. It can be concluded that the main sources of inefficiency for
Ethiopian MFIs are attributed to scale, sustainability, management practices, and goal
orientation of the institutions.
REFERENCES
1. AEMFI (2010) Ethiopian microfinance institutions performance analysis report,
Bulletin No 6.
0.55
0.6
0.65
0.7
0.75
0.8
2004 2005 2006 2007 2008 2009
Average efficiency trends, 2004-2009

African Journal of Accounting, Economics, Finance and Banking Research Vol. 8.No. 8, 2012. Bereket Zerai & Lalitha Rani
15
2. Abdul Qayyum A. and Ahmad M. (2006) Efficiency and sustainability of
microfinance institutions in south Asia”, Pakistan Institute of Development
Economics (PIDE), Australia.
3. Aigner, D., Lovell, C., and Schmidt, P. (1977) Formulation and estimation of
stochastic frontier production function models, Journal of Econometrics, 6(1), pp.
21–37.
4. Assefa Admassie, Gebrehiwot Ageba and Mulat Demeke (2005) Rural finance
in Ethiopia: Assessment of the financial products of microfinance institutions.
Occasional paper No.12. AEMFI. Addis Ababa
5. Amaha, W., (2003) Microfinance in Ethiopia: Performance, challenges and the
role in poverty reduction. Occasional paper No. 7. AEMFI. Addis Ababa
6. Amaha, W., (2007) Linking banks and microfinance institutions in Ethiopia:
Best practices, challenges and prospects. Occasional Paper No. 20. AEMFI.
Addis Ababa
7. Amaha, W.,(2007) Managing growth of microfinance
institutions(MFIs):Balancing sustainability and reaching large number of
clients in Ethiopia. Occasional paper No. 28. AEMFI. Addis Abeba
8. Amaha, W., (2008) A decade of microfinance institutions (MFIs) Development
in Ethiopia: Growth, performance, impact and prospect (2008-2017)
Occasional paper No.21, AEMFI. Addis Ababa
9. Amaha, W., (2008) Corporate Governance of the Deposit Taking MFIs, AEMFI
Occasional Paper No. 23, AEMFI. Addis Abeba
10. Balkenhol, B. (2007) Microfinance and public policy: Outreach, performance
and efficiency. ILO.
11. Bassem, S. B. (2008) Efficiency of microfinance institutions in the
mediterranean: an application of data envelopment analysis, Transit Studies
Review, 15, pp. 343-354.
12. Battese, G.E. and Coelli T.J. (1995) A model for technical inefficiency effects in
a stochastic frontier production function for panel data, Empirical Economics,
20, pp. 325–332.
13. Battese, G.E and Corra, G.S (1997) Estimation of a production frontier model:
with application to the pastoral zone of eastern Australia, Australian Journal of
Agricultural Economics, 21, pp.169-179.
14. Bauer, P.W., Berger, A.N., Ferrier, G., and Humphrey, D.B. (1998) Consistency
conditions for regulatory analysis of financial institutions: a comparison of
frontier efficiency methods, Journal of Economics and Business, 50, pp. 85–114.
African Journal of Accounting, Economics, Finance and Banking Research Vol. 8.No. 8, 2012. Bereket Zerai & Lalitha Rani
16
15. Baumman, T., (2005) Pro-poor microcredit in South Africa: Cost-efficiency and
productivity of south african pro-poor microfinance institutions, Journal of
Microfinance ,7(1), pp. 95-118.
16. Berger, A.N., Humphrey, D.B. (1997) Efficiency of financial institutions:
international survey and directions for future research, European Journal of
Operational Research, 98, pp. 175–212.
17. Berhane, G.(2009) Econometric analyses of microfinance credit group
formation, contractual risks and welfare impacts in Northern Ethiopia.
18. Berihun H, Tsehaye T., Teklu K., and Tassew W.,(2009) Financial needs of
micro and small enterprise(MSE) operators in Ethiopia, Occasional paper No
24. AEMFI.
19. Bienen D, Ageba G., Berihun H., and Habte M.,(2009) Ethiopian Microfinance
Ownership and Governance” occasional paper No 27. AEMFI.
20. Borchgrevink, A., T. Woldehanna, G. Ageba, and W. Teshome (2005)
Marginalized groups, credit and empowerment: The case of Dedebit Credit
and Saving Institution (DECSI) of Tigray, Ethiopia", Occasional Paper, No. 14,
AEMFI
21. Chao-Beroff, R., W. Amha, T. Mengesha, Y. Sefere and K. Tsegera (2000)
Enhancing rural financial intermediation in Ethiopia, IFAD and the World
Bank
22. Coelli, T.J. (1995) A Computer program for frontier production function
estimation: FRONTIER, Version 2.0, Economics letters, 39, pp. 29-32
23. Coelli, T.J. (1995) A Monte Carlo analysis of the stochastic frontier production
functions, Journal of Productivity Analysis, 6, pp. 247-268.
24. Coelli, T.J. (1996) A guide to FRONTIER version 4.1: A computer program for
stochastic frontier production and cost function estimation, CEPA Working
Papers No. 7/96. School of Economics, University of New England, Armidale.
25. Coelli, T.G., Prasada Rao D.S. and Battese, G. (1998), An Introduction to
Efficiency and Productivity Analysis., Kluwer Academic Publishers, Boston,
Dordrecht and London.
26. Ejigu., L.(2009) Performance analysis of a sample microfinance institutions of
Ethiopia, University Business School, Panjab University, Chandigarh(Draft)
27. Ethiopian Government. (1996) Proclamation No.40/1996. Licensing and
supervision of the business of micro finance institutions. Addis Ababa.
28. Farrington, T., (2000) Efficiency in Microfinance Institutions, Micro Banking
Bulletin
African Journal of Accounting, Economics, Finance and Banking Research Vol. 8.No. 8, 2012. Bereket Zerai & Lalitha Rani
17
4(Feb.2010):1823.http://www.microfinancegateway.org/gm/document1.9.288
71/27056_file_MBB_4.pdf.
29. Garber C, Puneetha Palakurthi and Wolday Amha (2006) Socio-economic
impact on ACSI’s clients: A decade of serving the productive poor in the
Amhara region. (Draft)
30. Gobeze, G., (2001) Some challenges of microfinance as an anti-poverty
strategy: Experience from ACSI. A paper submitted on the international
workshop on Dimensions of Microfinance Institutions in Sub-Saharan Africa:
Relevance of International Experiences. Mekelle University. Mekelle
31. Guitierrez-Nieto, B. Serrano-Cinca, C. and Molinero, C. M. (2006) Microfinance
institutions and efficiency, International Journal of Management Science, 35(2),
pp.131–142.
32. Gutierrez-Neito, B., Serrano-Cinca, C. & Mar Molinero, C. (2009). Social
efficiency in microfinance institutions. Journal of the Operations Research Society,
60, pp.104-119.
33. Haq M., Skully, M. and Pathan, S. (2010) Efficiency of microfinance
institutions: a data envelopment analyses, Asia-Pacific Financial Markets, 17, pp.
63-97.
34. Hassan, M.K. and S. Benito. (2009) Efficiency analysis of microfinance
institutions in developing countries, Working Paper-12, Networks Financial
Institute, Indiana State University, Indiana
35. Hassan, M. K. and Tuffe, D. R. (2001) The x-efficiency of a group based lending
institution: the case of Grameen bank, World Development, 29(6), pp. 1071-1082.
36. Hermes, N., Lensink, R. and Meesters, A. (2008) Outreach and efficiency of
microfinance institutions, available at: http://papers.ssm.com. (accessed 24
November 2010).
37. IFAD(2011) Federal Democratic Republic of Ethiopia Rural Financial
Intermediation Programme Interim Evaluation Report No. 2373-ET
38. Itana Ayana, Tsehay Tsegaye and Eshetu Erena (2003) Governance and
ownership structure of microfinance institutions in Ethiopia. Occasional Paper
No.8 AEMFI
39. Kereta, B. (2007) Outreach and financial performance analysis of microfinance
institutions in Ethiopia” African Economic Conference, Addis Ababa.
40. Kodde, D.A. and F.C. Palm (1986) Wald criteria for jointly testing equality and
inequality restrictions”, Econometrica , 54, pp.1243–1248.
African Journal of Accounting, Economics, Finance and Banking Research Vol. 8.No. 8, 2012. Bereket Zerai & Lalitha Rani
18
41. Leon. J. V. (2001) Decentralized efficient organizations of microfinance: the
case of the Peruvian municipal banks”, Working paper series. Wittenberg
University, Ohio.
42. Lafourcade AL, Isern J, Mwangi P, and Brown M., (2005) Overview of the
outreach and financial performance of microfinace institutions in Africa. The
MIX market Inc.
43. Masood, T. and Ahmad, M. (2010) Technical efficiency of micro finance
institutions in India: a stochastic frontier approach, available at:
http://mpra.ub.uni-muenchen.de/25454/ (accessed 17 Dec 2010).
44. Meeusen, W. and Van den Broeck, J. (1977) Efficiency estimation from cobb-
ouglas production functions with composed error, International Economic
Review, 18, pp. 435-444.
45. Nawaz, A.(2010) Efficiency and productivity of microfinance:Incorporating the
role of subsidies. CEB Working Paper No 10/009, Brussles
46. Negash, Z., (2008) Microfinance loan delivery, utilization and impact: with
specfic reference to Tigray, Nothern Ethiopia, Katholicieke University Leuven
47. Nghiem, H., Coelli,T. and Rao, D. S. P. (2006) The efficiency of microfinance in
Vietnam: evidence from NGO schemes in the north and the central regions,
International Journal of Environmental, Cultural, Economic and Social Sustainability,
2( 5), pp. 71-78.
48. Ondrich, J., Ruggiero, J. (2001) Efficiency measurement in the stochastic
frontier model, European Journal of Operational Research, 129, pp.434-442.
49. Oteng-Abayie,E., Amanor, K and Magnus, J.(2011) The measurement and
determinants of economic efficiency of microfinance institutions in Ghana: A
stochastic frontier approach , African Review of Economics and Finance, 2, pp.1-18
50. Pfister M. W., Gesesse D., Amha W., Mommartz R., Duflos W., Steel E. (2008)
Access to finance in Ethiopia: Sector Assessment study volume 2, GTZ
51. Resti, A. (1997) Evaluating the cost-efficiency of the Italian banking system:
what can be learned from the joint application of parametric and non-
parametric techniques, Journal of Banking & Finance, 21, pp.221-250.
52. Sherman, H. D. & Gold, F. (1985). Bank branch operating efficiency: Evaluation
with data envelopment analysis, Journal of Banking and Finance, 9, pp. 297-315
53. Sufian, F. (2006). The efficiency of non-bank financial institutions: Empirical
evidence from Malaysia. International Research Journal of Financial Economics, 6,
pp.1-21.
African Journal of Accounting, Economics, Finance and Banking Research Vol. 8.No. 8, 2012. Bereket Zerai & Lalitha Rani
19
54. Tsehay Tsegaye and Mengistu Bediye (2002) Impact of microfinance services
among the poor women in Ethiopia. A study submitted to the Association of
Ethiopian Microfinance Institutions(AEMFI). Addis Ababa.
55. Zeari, B. and Tesfay, H. (2011) Technical efficiency of African micro finance
institutions: comparing data envelopment analysis and stochastic frontier
analysis Mekelle University, Mekelle, Ethiopia.