berg symposium washington university sept 2003 michael w weiner md
Post on 22-Dec-2015
217 views
TRANSCRIPT

BERG SYMPOSIUMWASHINGTON UNIVERSITY
SEPT 2003
MICHAEL W WEINER MD

CURRENT FOCUS OF MOST IMAGING RESEARCH
• Improved methods to detect treatment effects in clinical trials– Reduce sample size– Shorten length of trial
• Early detection of AD

NICK FOXUNIVERSITY OF LONDON

-0.5108
-0.1054
-8 -6 -4 -2 0 2 4 6
-0.5108
-0.1054
-8 -6 -4 -2 0 2 4 6
Time from MMSE of 23/30 (years)
Brain volume as % of intracranial volume Brain volume as % of intracranial volume vs timevs time

CLIFFORD JACK
MAYO CLINIC

Sample size estimates to detect differences equaling 50% or 25% of observed median
with 90% probability and an alpha level of 0.05 using two-sided t-tests among MCI patients
Observed median
SD (on transformed scale)
Sample size to detect effect size of 50%
Sample size to detect effect size of 25%
Hippocampus -2.55 16.13 24 102
Entorhinal cortex -5.97 72.72 21 91
Whole brain -0.63 1.91 32 130
Ventricle 3.29 0.44 16 69
CDR 0.54 0.33 311 1277
MMSE -0.47 1.31 658 2628
Neurology in review

IMAGING THE TREATMENT AND EARLY DETECTION OF AD WITH:
sMRI, pMRI, MRSI
Michael W Weiner MD
Norbert Schuff PhD
Nathan Johnson MD
Linda Chao PhD

Sample Size/Arm for 20% treatment effectOne year trial
80% power (One tail)
80% power (Two tail)
90% power (One tail)
90% power (Two tail)
ERC Rate 64 82 89 109
HP Rate 52 66 71 88
BSI_VENT 58 74 81 99 Entorhinal cortex (ERC), hippocampus (HP), ventricular BSI (BSI_VENT). Calculated from data on 20 AD subjects. Interscan interval = 1.8

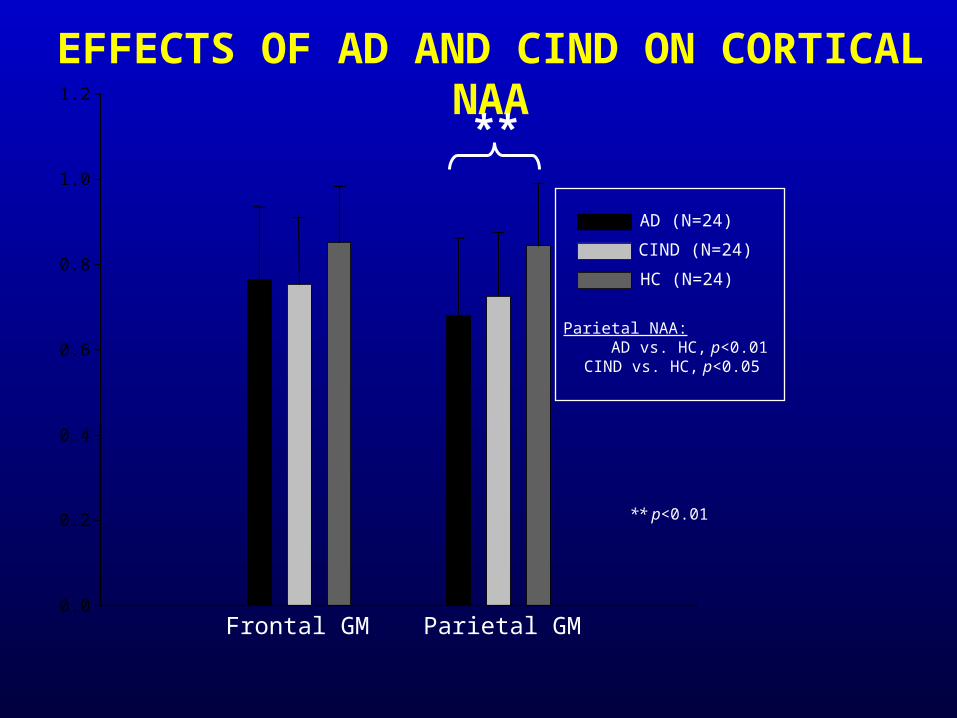
AD (N=24)
CIND (N=24)
HC (N=24)
Effects of AD and CIND on Hippocampal NAA
L. Hippocampus: AD vs. HC, p=0.001 CIND vs. HC, p<0.01
R. Hippocampus: AD vs. HC, p<0.0001 CIND vs. HC, p<0.05
0.0
0.5
1.0
1.5
2.0
2.5
3.0
3.5
Left Right
** ***
** p<0.01; *** p<0.001
0.0
0.2
0.4
0.6
0.8
1.0
1.2
Frontal GM Parietal GM
EFFECTS OF AD AND CIND ON CORTICAL NAA
AD (N=24)
CIND (N=24)
HC (N=24)
Parietal NAA: AD vs. HC, p<0.01 CIND vs. HC, p<0.05
**
** p<0.01

P<0.05; cluster-level correction
Perfusion MRI: MCI v NCrCBF
GM concentration

Diffusion-weighted MRI and fMRI
of Aging and Dementia
Randy BucknerWashington U. St Louis Mo

YNG vs OLD YNG vs DAT OLD vs DAT
A
3.09
8.21
Z-v
alue
AGING CHANGE IN WHITE-MATTER
Head, Buckner et al., in press, Cerebral Cortex

Functional Neuroimaging
YOUNG OLD
LEFT LEFT
Logan et al, Neuron 2002

-0.20
-0.10
0.00
0.10
0.20
Do words represent living/non living: Deactivations
YOUNG OLD DAT
YOUNG OLD DATLustig et al., in press, PNAS
YOUNG OLD DAT
YOUNG OLD DAT

Functional MRI studies in early Alzheimer’s disease
Reisa Sperling, M.D., M.MSc.Brigham and Women’s Hospital
Massachusetts General Hospital
Harvard Medical School

Functional MRI - Face-Name Association Fusiform Activation
YoungControl
s
OldControl
s
MildAD
N R
+ + + + +N R
p<0.0000001
p<0.000001
p<0.00001
p<0.0001
Sperling

Test-Retest Reliability of fMRI in AD for Pharmacological studies
Sperling

SCOTT SMALLColumbia U
New York NY• Aging predominately reduces LTP in the granule
cells of the dentate gyrus;• In contrast, AD causes deficits in basal synaptic
transmission in pyramidal cells of the entorhinal cortex and CA subfields.
• Taken together, these studies suggest that AD and aging are separate and dissociable processes.

FDG PET in the Study ofCognitively Normal Persons at
Genetic Risk for Alzheimer’s Disease
Eric M. Reiman, MD
Banner Good Samaritan Medical Center
University of Arizona
Translational Genomics Research Institute
Arizona Alzheimer’s Disease Consortium
Phoenix, Arizona, USA

CMRgI Abnormalities in Probable Alzheimer’s Dementia

Number of AD Patients per Treatment Group Needed to Number of AD Patients per Treatment Group Needed to Detect an Effect with 80% Power in One YearDetect an Effect with 80% Power in One Year
Treatment Effect
20% 30% 40% 50%
Frontal 85 38 22 14
Parietal 217 97 55 36
Temporal 266 119 68 44
Cingulate 343 153 87 57
Combined 62 28 16 10
P=0.01 (two-tailed)
No adjustment for normal aging effects or subject attrition

CMRgI Abnormalities in 50-65 y.o. 4/4’s

Correlations Between APOE 4 Gene Dose and Reductions in Regional CMRgl (36 HM, 46 HT, 78 NC)
PF PFTP TP
PC PC
P < 0.005

Reg
ion
a l t
o W
ho
le B
rai n
CM
Rg
l
0.90
0.95
1.00
1.05
1.10
0 1 2
PrefrontalPrefrontal
0 1 2
ParietalParietal
0 1 2
Posterior CingulatePosterior Cingulate
0 1 2
TemporalTemporal
APOE 4 Gene Dose
P < P < 00..00050005
APOE APOE 4 Gene Dose is Correlated with Reductions in Regional CMRgl4 Gene Dose is Correlated with Reductions in Regional CMRgl

IMAGING PATHOLOGICAL PROTEINS WITH PET

Update on In Vivo Imaging of Plaques and Tangles
Gary W. Small, M.D.
University of California, Los Angeles

N
NC CN
R1
R
DDNP and F-18 DDNP
DDNPDDNP R = R R = R11 =CH =CH33
[F-18]FDDNP R = CH[F-18]FDDNP R = CH33; ; R1 = CHR1 = CH22CHCH22
1818FF
Gary Small, UCLA School of MedicineGary Small, UCLA School of Medicine

Gary Small, UCLA School of MedicineGary Small, UCLA School of Medicine

MMSE Scores vs. Residence Time (RT) ValuesMMSE Scores vs. Residence Time (RT) Values
9988776655443322
1010
2020
3030
Residence TimeResidence Time
MM
SE
MM
SE
1515
55
2525
3535
HypotheticalStages V-VIHypotheticalStages V-VI
HypotheticalStages III-IVHypotheticalStages III-IV
HypotheticalStages I-IIHypotheticalStages I-II
Shoghi-Jadid et al. Am J Ger Psychiatry 10, 24-35 (2002)
AD
Controls
Gary Small, UCLA School of MedicineGary Small, UCLA School of Medicine

Imaging Amyloid in Alzheimer's Disease
with PIBWilliam E. Klunk, MD, PhD
Laboratory of Molecular Neuropharmacology
Department of Psychiatry, Western Psychiatric Institute & Clinic
University of Pittsburgh Medical Center

[11C]6-OH-BTA-1 (PIB) Retention in Controls & AD
Uppsala University PET CentreUppsala Research Imaging Solutions AB
SUV Images

0
0.5
1
1.5
2
2.5
Brain Area
SU
V
Retention of [11C]6-OH-BTA-1 (PIB) in AD and Controls – SUV
Analysis
Uppsala University PET CentreUppsala Research Imaging Solutions AB

Correlation of [11C]6-OH-BTA-1 (PIB) Retention and rCMRglu
Uppsala University PET CentreUppsala Research Imaging Solutions AB
Parietal
R2 = 0.6695
0
0.5
1
1.5
2
2.5
0 20 40 60
rCMRglu (umoles/min/100 ml)
PIB
SU
V

SUMMARY
• Accumulating evidence that structural MRI will play a major role in– Clinical trials for AD etc– Early detection of AD
• fMRI sheds light on mechanism of cognitive impairments and compensatory response. May play a role in drug trials and early detection

SUMMARY
• Molecular imaging with PET shows exciting potential to detect amyloid, and possibly other proteins
• The future role of these methods in clinical trials and early detection remains unknown