best 4 year average annual median growth suburbs...
TRANSCRIPT

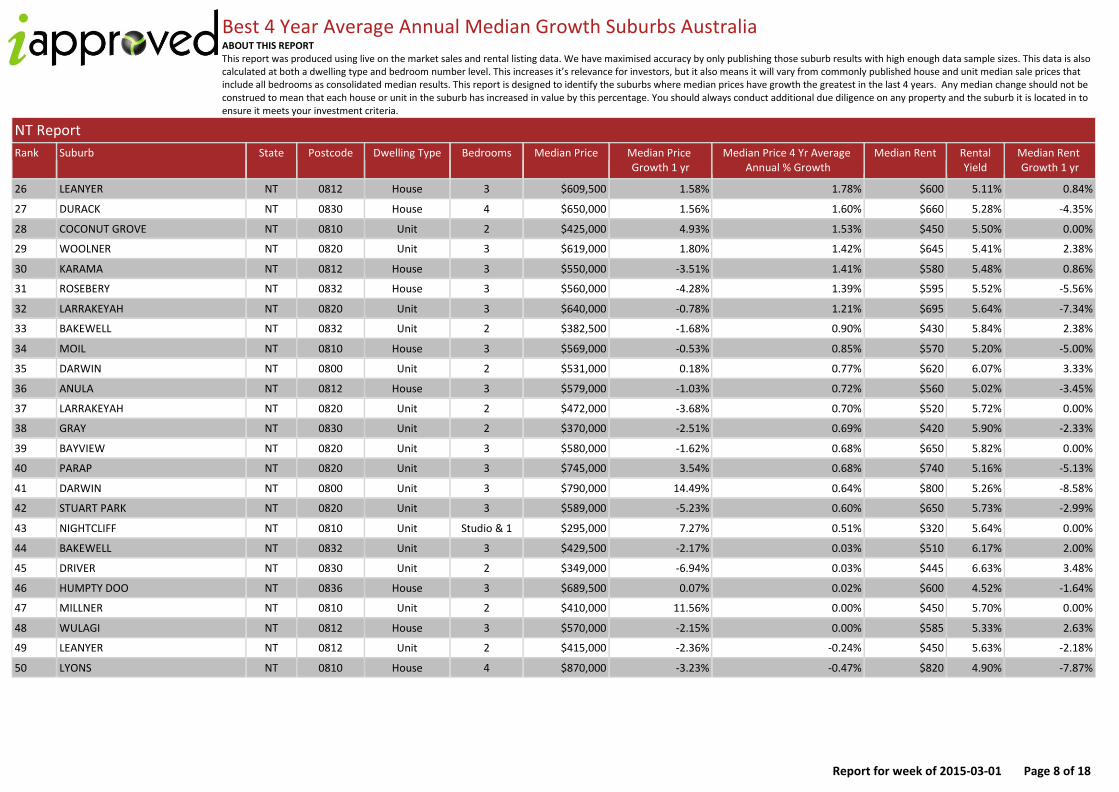
Best 4 Year Average Annual Median Growth Suburbs Australia ABOUT THIS REPORT This report was produced using live on the market sales and rental listing data. We have maximised accuracy by only publishing those suburb results with high enough data sample sizes. This data is also calculated at both a dwelling type and bedroom number level. This increases it’s relevance for investors, but it also means it will vary from commonly published house and unit median sale prices that include all bedrooms as consolidated median results. This report is designed to identify the suburbs where median prices have growth the greatest in the last 4 years. Any median change should not be construed to mean that each house or unit in the suburb has increased in value by this percentage. You should always conduct additional due diligence on any property and the suburb it is located in to ensure it meets your investment criteria.
Report for week of 2015-03-01 Page 1 of 18
National Report
Rank Suburb State Postcode Dwelling Type Bedrooms Median Price Median Price Growth 1 yr
Median Price 4 Yr Average Annual % Growth
Median Rent Rental Yield
Median Rent Growth 1 yr
1 ROUSE HILL NSW 2155 House 3 $690,000 9.52% 27.63% $570 4.29% 0.00%
2 HAWTHORN EAST VIC 3123 Unit Studio & 1 $395,000 9.72% 22.57% $300 3.94% -6.25%
3 MERMAID BEACH QLD 4218 Townhouse 3 $795,000 16.91% 18.99% $600 3.92% 8.10%
4 ORANGE NSW 2800 Unit Studio & 1 $195,000 -2.50% 18.77% $210 5.60% -8.70%
5 RYDE NSW 2112 Unit Studio & 1 $600,000 15.60% 17.95% $430 3.72% 19.44%
6 BREAKFAST POINT NSW 2137 Unit 3 $1,825,000 54.66% 17.45% $865 2.46% 1.76%
7 ST MARYS NSW 2760 Unit 2 $365,000 37.73% 16.97% $300 4.27% -7.70%
8 THE ENTRANCE NORTH NSW 2261 Unit 3 $745,000 90.05% 16.89% $350 2.44% 0.00%
9 CHIPPENDALE NSW 2008 Unit 2 $1,020,000 8.62% 16.70% $795 4.05% 14.38%
10 CAMPSIE NSW 2194 Unit Studio & 1 $498,500 31.18% 16.67% $320 3.33% 3.22%
11 GLEN WAVERLEY VIC 3150 House 5 $1,544,000 43.62% 16.26% $550 1.85% 0.00%
12 BALWYN VIC 3103 Unit Studio & 1 $375,000 2.73% 14.59% $350 4.85% 11.11%
13 WINDSOR VIC 3181 Unit Studio & 1 $377,500 2.02% 14.45% $330 4.54% 10.00%
14 CHATSWOOD NSW 2067 Unit 3 $1,450,000 29.46% 14.20% $900 3.22% 20.00%
15 RIVERVALE WA 6103 Unit 2 $530,000 30.86% 13.89% $380 3.72% 5.55%
16 DROMANA VIC 3936 Unit 2 $460,000 -2.03% 13.72% $275 3.10% 14.58%
17 NORTH SYDNEY NSW 2060 Unit 3 $1,900,000 26.66% 13.68% $950 2.60% -5.00%
18 MACQUARIE PARK NSW 2113 Unit Studio & 1 $597,500 14.90% 13.66% $490 4.26% 28.94%
19 SUMMER HILL NSW 2130 Unit Studio & 1 $616,000 40.31% 13.59% $370 3.12% 1.36%
20 MALVERN EAST VIC 3145 Unit Studio & 1 $349,000 26.90% 13.54% $265 3.94% 1.92%
21 RYDE NSW 2112 Unit 2 $648,000 13.68% 13.17% $470 3.77% 11.90%
22 CHIPPENDALE NSW 2008 Unit Studio & 1 $595,000 0.84% 13.15% $535 4.67% 7.00%
23 KINGSWOOD NSW 2747 Unit 2 $307,500 28.12% 13.09% $280 4.73% 1.81%
24 HABERFIELD NSW 2045 House 4 $2,159,000 25.52% 12.88% $950 2.28% 11.76%
25 NORTH PERTH WA 6006 Unit Studio & 1 $419,000 45.48% 12.78% $300 3.72% -6.25%

Best 4 Year Average Annual Median Growth Suburbs Australia ABOUT THIS REPORT This report was produced using live on the market sales and rental listing data. We have maximised accuracy by only publishing those suburb results with high enough data sample sizes. This data is also calculated at both a dwelling type and bedroom number level. This increases it’s relevance for investors, but it also means it will vary from commonly published house and unit median sale prices that include all bedrooms as consolidated median results. This report is designed to identify the suburbs where median prices have growth the greatest in the last 4 years. Any median change should not be construed to mean that each house or unit in the suburb has increased in value by this percentage. You should always conduct additional due diligence on any property and the suburb it is located in to ensure it meets your investment criteria.
Report for week of 2015-03-01 Page 2 of 18
National Report
Rank Suburb State Postcode Dwelling Type Bedrooms Median Price Median Price Growth 1 yr
Median Price 4 Yr Average Annual % Growth
Median Rent Rental Yield
Median Rent Growth 1 yr
26 OAKLEIGH VIC 3166 Unit Studio & 1 $369,000 12.15% 12.54% $320 4.50% 0.00%
27 PENRITH NSW 2750 Unit Studio & 1 $280,000 27.27% 12.47% $250 4.64% 0.00%
28 BALWYN NORTH VIC 3104 House 5 $1,900,000 46.15% 12.35% $845 2.31% 12.66%
29 ROSEHILL NSW 2142 Unit Studio & 1 $269,000 -2.19% 12.24% $380 7.34% 0.00%
30 TOORAK VIC 3142 Unit 3 $1,495,000 57.36% 12.00% $650 2.26% 3.17%
31 COOKS HILL NSW 2300 Unit 3 $775,000 1.30% 11.86% $530 3.55% 1.92%
32 NEWTOWN NSW 2042 Unit Studio & 1 $499,000 16.86% 11.83% $430 4.48% 2.38%
33 CAMPERDOWN NSW 2050 Unit 3 $1,250,000 35.13% 11.80% $865 3.59% 8.12%
34 WINDSOR NSW 2756 House 3 $570,000 52.20% 11.79% $410 3.74% 5.12%
35 RIVERVALE WA 6103 Unit Studio & 1 $420,000 21.03% 11.78% $320 3.96% 6.66%
36 GEELONG VIC 3220 House 4 $615,000 18.49% 11.70% $510 4.31% 13.33%
37 GLADSTONE QLD 4680 Unit 2 $450,000 12.78% 11.70% $350 4.04% -28.58%
38 LIVERPOOL NSW 2170 Unit Studio & 1 $310,000 8.77% 11.65% $280 4.69% 3.70%
39 AUBURN NSW 2144 House 5 $943,500 11.00% 11.54% $635 3.49% 7.62%
40 BATHURST NSW 2795 Townhouse 3 $309,500 -5.93% 11.53% $290 4.87% -7.94%
41 REDFERN NSW 2016 Unit 3 $1,000,000 25.00% 11.41% $800 4.16% 1.26%
42 ARNCLIFFE NSW 2205 Unit 2 $600,000 6.19% 11.37% $520 4.50% 4.00%
43 HAWTHORN VIC 3122 Unit Studio & 1 $300,000 42.85% 11.37% $300 5.20% 1.69%
44 WENDOUREE VIC 3355 House 4 $400,000 38.40% 11.37% $305 3.96% 1.66%
45 AUBURN NSW 2144 House 2 $599,000 49.75% 11.32% $410 3.55% 2.50%
46 GIRRAWEEN NSW 2145 Townhouse 3 $650,000 30.00% 11.21% $480 3.84% 6.66%
47 MARRICKVILLE NSW 2204 Unit 2 $650,000 22.87% 11.21% $470 3.76% 4.44%
48 WILEY PARK NSW 2195 House 3 $745,000 8.12% 11.10% $510 3.55% 6.25%
49 MARRICKVILLE NSW 2204 Unit Studio & 1 $495,000 24.06% 11.09% $375 3.93% 4.16%
50 LIDCOMBE NSW 2141 Unit 3 $713,500 29.72% 11.06% $550 4.00% 0.00%

Best 4 Year Average Annual Median Growth Suburbs Australia ABOUT THIS REPORT This report was produced using live on the market sales and rental listing data. We have maximised accuracy by only publishing those suburb results with high enough data sample sizes. This data is also calculated at both a dwelling type and bedroom number level. This increases it’s relevance for investors, but it also means it will vary from commonly published house and unit median sale prices that include all bedrooms as consolidated median results. This report is designed to identify the suburbs where median prices have growth the greatest in the last 4 years. Any median change should not be construed to mean that each house or unit in the suburb has increased in value by this percentage. You should always conduct additional due diligence on any property and the suburb it is located in to ensure it meets your investment criteria.
Report for week of 2015-03-01 Page 3 of 18
ACT Report
Rank Suburb State Postcode Dwelling Type Bedrooms Median Price Median Price Growth 1 yr
Median Price 4 Yr Average Annual % Growth
Median Rent Rental Yield
Median Rent Growth 1 yr
1 CRACE ACT 2911 House 4 $699,000 9.38% 4.33% $600 4.46% 0.00%
2 LYNEHAM ACT 2602 Unit 2 $409,500 -6.19% 3.27% $375 4.76% -8.54%
3 WANNIASSA ACT 2903 House 4 $560,000 1.81% 2.87% $520 4.82% 0.00%
4 BONNER ACT 2914 House 4 $549,000 3.58% 2.44% $520 4.92% -5.46%
5 AINSLIE ACT 2602 House 3 $702,500 -2.30% 2.36% $500 3.70% 0.00%
6 EVATT ACT 2617 House 4 $549,000 1.29% 1.86% $470 4.45% -5.06%
7 HARRISON ACT 2914 House 4 $617,500 5.55% 1.64% $540 4.54% -1.82%
8 THEODORE ACT 2905 House 3 $440,000 6.02% 1.62% $400 4.72% 1.26%
9 FORDE ACT 2914 House 4 $669,000 4.69% 1.51% $580 4.50% -3.34%
10 MONASH ACT 2904 House 3 $465,000 -2.11% 1.39% $425 4.75% -4.50%
11 GUNGAHLIN ACT 2912 House 4 $599,000 6.96% 1.25% $520 4.51% -5.46%
12 BRUCE ACT 2617 Townhouse 3 $525,000 -2.69% 1.23% $490 4.85% -2.00%
13 NGUNNAWAL ACT 2913 House 3 $409,000 -0.25% 1.20% $390 4.95% -4.88%
14 AMAROO ACT 2914 House 3 $460,000 0.00% 1.12% $440 4.97% -3.30%
15 AMAROO ACT 2914 House 4 $575,000 4.73% 1.12% $520 4.70% -3.71%
16 GORDON ACT 2906 House 4 $575,000 4.54% 1.12% $530 4.79% -5.36%
17 KALEEN ACT 2617 House 3 $509,000 1.80% 0.95% $440 4.49% -2.23%
18 HOLT ACT 2615 House 3 $420,000 -1.18% 0.91% $390 4.82% -6.03%
19 MONASH ACT 2904 House 4 $585,000 2.72% 0.87% $520 4.62% -5.46%
20 FORREST ACT 2603 Unit 2 $512,000 -12.11% 0.85% $540 5.48% -1.82%
21 CALWELL ACT 2905 House 4 $574,000 3.42% 0.84% $530 4.80% -3.64%
22 HACKETT ACT 2602 House 3 $619,000 3.16% 0.82% $450 3.78% -9.10%
23 LATHAM ACT 2615 House 3 $412,500 -4.07% 0.77% $390 4.91% -2.50%
24 KAMBAH ACT 2902 House 3 $440,000 -1.13% 0.58% $420 4.96% -2.33%
25 KINGSTON ACT 2604 Unit Studio & 1 $439,000 5.78% 0.52% $430 5.09% -4.45%

Best 4 Year Average Annual Median Growth Suburbs Australia ABOUT THIS REPORT This report was produced using live on the market sales and rental listing data. We have maximised accuracy by only publishing those suburb results with high enough data sample sizes. This data is also calculated at both a dwelling type and bedroom number level. This increases it’s relevance for investors, but it also means it will vary from commonly published house and unit median sale prices that include all bedrooms as consolidated median results. This report is designed to identify the suburbs where median prices have growth the greatest in the last 4 years. Any median change should not be construed to mean that each house or unit in the suburb has increased in value by this percentage. You should always conduct additional due diligence on any property and the suburb it is located in to ensure it meets your investment criteria.
Report for week of 2015-03-01 Page 4 of 18
ACT Report
Rank Suburb State Postcode Dwelling Type Bedrooms Median Price Median Price Growth 1 yr
Median Price 4 Yr Average Annual % Growth
Median Rent Rental Yield
Median Rent Growth 1 yr
26 CONDER ACT 2906 House 4 $560,000 -4.93% 0.45% $520 4.82% -4.59%
27 WATSON ACT 2602 House 3 $580,000 5.45% 0.43% $430 3.85% -4.45%
28 GRIFFITH ACT 2603 Unit 2 $439,500 3.41% 0.40% $400 4.73% -4.77%
29 RICHARDSON ACT 2905 House 3 $420,000 0.00% 0.33% $420 5.20% 1.20%
30 DUNLOP ACT 2615 House 3 $425,000 -4.50% 0.30% $410 5.01% -4.66%
31 HIGGINS ACT 2615 House 3 $425,000 -3.30% 0.30% $415 5.07% -3.49%
32 GILMORE ACT 2905 House 3 $450,000 0.00% 0.28% $430 4.96% -4.45%
33 GIRALANG ACT 2617 House 3 $457,500 1.66% 0.27% $430 4.88% -2.28%
34 KAMBAH ACT 2902 House 4 $540,000 -2.27% 0.23% $490 4.71% -9.26%
35 NGUNNAWAL ACT 2913 House 4 $540,000 4.34% 0.23% $490 4.71% -5.77%
36 MACGREGOR ACT 2615 House 4 $519,000 3.80% 0.19% $490 4.90% -2.00%
37 DUNLOP ACT 2615 House 4 $520,000 1.96% 0.00% $500 5.00% 0.00%
38 GORDON ACT 2906 House 3 $410,000 0.00% 0.00% $390 4.94% -4.88%
39 FADDEN ACT 2904 House 4 $649,500 1.64% -0.02% $540 4.32% -3.58%
40 FLYNN ACT 2615 House 4 $519,000 1.76% -0.05% $480 4.80% -2.05%
41 PALMERSTON ACT 2913 House 4 $572,500 -0.09% -0.09% $505 4.58% -4.72%
42 KINGSTON ACT 2604 Unit 2 $499,000 0.80% -0.18% $475 4.94% -5.00%
43 HOLT ACT 2615 Townhouse 3 $397,000 4.47% -0.19% $370 4.84% -7.50%
44 NICHOLLS ACT 2913 House 4 $647,500 -6.84% -0.19% $580 4.65% -2.53%
45 WATSON ACT 2602 House 4 $634,000 -3.36% -0.24% $550 4.51% 0.91%
46 BRUCE ACT 2617 Unit 3 $445,000 -0.90% -0.25% $450 5.25% 0.00%
47 RIVETT ACT 2611 House 3 $480,000 2.23% -0.26% $415 4.49% -4.60%
48 BRADDON ACT 2612 Unit 2 $449,000 -3.45% -0.33% $460 5.32% -4.17%
49 CONDER ACT 2906 House 3 $419,000 -0.12% -0.36% $395 4.90% -5.96%
50 MACGREGOR ACT 2615 House 3 $404,000 -0.25% -0.37% $400 5.14% -6.98%

Best 4 Year Average Annual Median Growth Suburbs Australia ABOUT THIS REPORT This report was produced using live on the market sales and rental listing data. We have maximised accuracy by only publishing those suburb results with high enough data sample sizes. This data is also calculated at both a dwelling type and bedroom number level. This increases it’s relevance for investors, but it also means it will vary from commonly published house and unit median sale prices that include all bedrooms as consolidated median results. This report is designed to identify the suburbs where median prices have growth the greatest in the last 4 years. Any median change should not be construed to mean that each house or unit in the suburb has increased in value by this percentage. You should always conduct additional due diligence on any property and the suburb it is located in to ensure it meets your investment criteria.
Report for week of 2015-03-01 Page 5 of 18
NSW Report
Rank Suburb State Postcode Dwelling Type Bedrooms Median Price Median Price Growth 1 yr
Median Price 4 Yr Average Annual % Growth
Median Rent Rental Yield
Median Rent Growth 1 yr
1 ROUSE HILL NSW 2155 House 3 $690,000 9.52% 27.63% $570 4.29% 0.00%
2 ORANGE NSW 2800 Unit Studio & 1 $195,000 -2.50% 18.77% $210 5.60% -8.70%
3 RYDE NSW 2112 Unit Studio & 1 $600,000 15.60% 17.95% $430 3.72% 19.44%
4 BREAKFAST POINT NSW 2137 Unit 3 $1,825,000 54.66% 17.45% $865 2.46% 1.76%
5 ST MARYS NSW 2760 Unit 2 $365,000 37.73% 16.97% $300 4.27% -7.70%
6 THE ENTRANCE NORTH NSW 2261 Unit 3 $745,000 90.05% 16.89% $350 2.44% 0.00%
7 CHIPPENDALE NSW 2008 Unit 2 $1,020,000 8.62% 16.70% $795 4.05% 14.38%
8 CAMPSIE NSW 2194 Unit Studio & 1 $498,500 31.18% 16.67% $320 3.33% 3.22%
9 CHATSWOOD NSW 2067 Unit 3 $1,450,000 29.46% 14.20% $900 3.22% 20.00%
10 NORTH SYDNEY NSW 2060 Unit 3 $1,900,000 26.66% 13.68% $950 2.60% -5.00%
11 MACQUARIE PARK NSW 2113 Unit Studio & 1 $597,500 14.90% 13.66% $490 4.26% 28.94%
12 SUMMER HILL NSW 2130 Unit Studio & 1 $616,000 40.31% 13.59% $370 3.12% 1.36%
13 RYDE NSW 2112 Unit 2 $648,000 13.68% 13.17% $470 3.77% 11.90%
14 CHIPPENDALE NSW 2008 Unit Studio & 1 $595,000 0.84% 13.15% $535 4.67% 7.00%
15 KINGSWOOD NSW 2747 Unit 2 $307,500 28.12% 13.09% $280 4.73% 1.81%
16 HABERFIELD NSW 2045 House 4 $2,159,000 25.52% 12.88% $950 2.28% 11.76%
17 PENRITH NSW 2750 Unit Studio & 1 $280,000 27.27% 12.47% $250 4.64% 0.00%
18 ROSEHILL NSW 2142 Unit Studio & 1 $269,000 -2.19% 12.24% $380 7.34% 0.00%
19 COOKS HILL NSW 2300 Unit 3 $775,000 1.30% 11.86% $530 3.55% 1.92%
20 NEWTOWN NSW 2042 Unit Studio & 1 $499,000 16.86% 11.83% $430 4.48% 2.38%
21 CAMPERDOWN NSW 2050 Unit 3 $1,250,000 35.13% 11.80% $865 3.59% 8.12%
22 WINDSOR NSW 2756 House 3 $570,000 52.20% 11.79% $410 3.74% 5.12%
23 LIVERPOOL NSW 2170 Unit Studio & 1 $310,000 8.77% 11.65% $280 4.69% 3.70%
24 AUBURN NSW 2144 House 5 $943,500 11.00% 11.54% $635 3.49% 7.62%
25 BATHURST NSW 2795 Townhouse 3 $309,500 -5.93% 11.53% $290 4.87% -7.94%

Best 4 Year Average Annual Median Growth Suburbs Australia ABOUT THIS REPORT This report was produced using live on the market sales and rental listing data. We have maximised accuracy by only publishing those suburb results with high enough data sample sizes. This data is also calculated at both a dwelling type and bedroom number level. This increases it’s relevance for investors, but it also means it will vary from commonly published house and unit median sale prices that include all bedrooms as consolidated median results. This report is designed to identify the suburbs where median prices have growth the greatest in the last 4 years. Any median change should not be construed to mean that each house or unit in the suburb has increased in value by this percentage. You should always conduct additional due diligence on any property and the suburb it is located in to ensure it meets your investment criteria.
Report for week of 2015-03-01 Page 6 of 18
NSW Report
Rank Suburb State Postcode Dwelling Type Bedrooms Median Price Median Price Growth 1 yr
Median Price 4 Yr Average Annual % Growth
Median Rent Rental Yield
Median Rent Growth 1 yr
26 REDFERN NSW 2016 Unit 3 $1,000,000 25.00% 11.41% $800 4.16% 1.26%
27 ARNCLIFFE NSW 2205 Unit 2 $600,000 6.19% 11.37% $520 4.50% 4.00%
28 AUBURN NSW 2144 House 2 $599,000 49.75% 11.32% $410 3.55% 2.50%
29 GIRRAWEEN NSW 2145 Townhouse 3 $650,000 30.00% 11.21% $480 3.84% 6.66%
30 MARRICKVILLE NSW 2204 Unit 2 $650,000 22.87% 11.21% $470 3.76% 4.44%
31 WILEY PARK NSW 2195 House 3 $745,000 8.12% 11.10% $510 3.55% 6.25%
32 MARRICKVILLE NSW 2204 Unit Studio & 1 $495,000 24.06% 11.09% $375 3.93% 4.16%
33 LIDCOMBE NSW 2141 Unit 3 $713,500 29.72% 11.06% $550 4.00% 0.00%
34 NORTH PARRAMATTA NSW 2151 House 3 $760,000 18.28% 11.04% $520 3.55% 10.63%
35 CANTERBURY NSW 2193 Unit 2 $630,000 20.00% 11.00% $440 3.63% 4.76%
36 FAIRFIELD EAST NSW 2165 House 3 $599,000 20.04% 10.97% $420 3.64% 2.43%
37 MERRYLANDS NSW 2160 House 2 $560,000 7.69% 10.92% $390 3.62% 1.29%
38 RIVERSTONE NSW 2765 House 3 $550,000 5.76% 10.91% $420 3.97% 5.00%
39 GRANVILLE NSW 2142 House 4 $750,000 10.45% 10.72% $520 3.60% 6.12%
40 BANKSTOWN NSW 2200 Townhouse 3 $599,000 25.05% 10.69% $500 4.34% 4.16%
41 CABRAMATTA NSW 2166 Unit Studio & 1 $279,000 17.22% 10.67% $260 4.84% 4.00%
42 LIDCOMBE NSW 2141 Unit 2 $538,500 14.57% 10.67% $450 4.34% 2.27%
43 MASCOT NSW 2020 Unit Studio & 1 $600,000 20.00% 10.67% $510 4.42% 6.25%
44 MERRYLANDS NSW 2160 House 3 $674,000 24.81% 10.63% $470 3.62% 4.44%
45 STRATHFIELD NSW 2135 Unit Studio & 1 $449,000 4.90% 10.61% $390 4.51% -2.50%
46 GLENORIE NSW 2157 House 4 $1,335,000 6.80% 10.51% $700 2.72% 40.00%
47 PARRAMATTA NSW 2150 Unit Studio & 1 $431,000 21.40% 10.51% $370 4.46% 2.77%
48 KINGSWOOD NSW 2747 House 3 $469,000 28.49% 10.46% $380 4.21% 5.55%
49 DULWICH HILL NSW 2203 Unit Studio & 1 $519,000 18.22% 10.43% $350 3.50% 6.06%
50 BONNYRIGG NSW 2177 House 4 $682,000 8.08% 10.41% $500 3.81% 3.09%

Best 4 Year Average Annual Median Growth Suburbs Australia ABOUT THIS REPORT This report was produced using live on the market sales and rental listing data. We have maximised accuracy by only publishing those suburb results with high enough data sample sizes. This data is also calculated at both a dwelling type and bedroom number level. This increases it’s relevance for investors, but it also means it will vary from commonly published house and unit median sale prices that include all bedrooms as consolidated median results. This report is designed to identify the suburbs where median prices have growth the greatest in the last 4 years. Any median change should not be construed to mean that each house or unit in the suburb has increased in value by this percentage. You should always conduct additional due diligence on any property and the suburb it is located in to ensure it meets your investment criteria.
Report for week of 2015-03-01 Page 7 of 18
NT Report
Rank Suburb State Postcode Dwelling Type Bedrooms Median Price Median Price Growth 1 yr
Median Price 4 Yr Average Annual % Growth
Median Rent Rental Yield
Median Rent Growth 1 yr
1 FANNIE BAY NT 0820 Townhouse 3 $862,500 15.00% 4.98% $690 4.16% 0.72%
2 STUART PARK NT 0820 House 4 $998,000 24.75% 4.48% $900 4.68% -5.27%
3 KATHERINE NT 0850 House 3 $399,000 6.40% 4.47% $450 5.86% 4.65%
4 WOODROFFE NT 0830 House 4 $589,000 0.85% 4.18% $630 5.56% 5.00%
5 FARRAR NT 0830 House 4 $685,000 0.73% 4.02% $695 5.27% -0.72%
6 KATHERINE NT 0850 House 4 $482,500 10.91% 3.99% $550 5.92% 4.76%
7 NIGHTCLIFF NT 0810 Unit 2 $429,500 -8.62% 3.87% $460 5.56% 6.97%
8 DARWIN NT 0800 Unit Studio & 1 $382,000 3.24% 3.53% $435 5.92% 8.75%
9 RAPID CREEK NT 0810 Unit 2 $456,500 -4.70% 3.36% $445 5.06% -1.12%
10 KARAMA NT 0812 Unit 2 $398,000 2.05% 3.26% $430 5.61% 2.38%
11 MOULDEN NT 0830 House 3 $489,000 3.49% 2.97% $520 5.52% 4.00%
12 DURACK NT 0830 House 3 $559,500 2.28% 2.90% $590 5.48% -1.67%
13 STUART PARK NT 0820 Unit 2 $492,000 4.79% 2.83% $520 5.49% 0.00%
14 PARAP NT 0820 Unit 2 $457,500 11.58% 2.78% $530 6.02% 1.92%
15 GRAY NT 0830 House 3 $499,000 -1.58% 2.67% $540 5.62% 3.84%
16 MALAK NT 0812 House 3 $585,000 0.00% 2.64% $580 5.15% 9.43%
17 ROSEBERY NT 0832 House 4 $684,500 0.66% 2.63% $700 5.31% 0.00%
18 TIWI NT 0810 House 3 $575,000 4.54% 2.54% $600 5.42% 9.09%
19 GUNN NT 0832 House 3 $550,000 0.09% 2.41% $560 5.29% -5.09%
20 GUNN NT 0832 House 4 $657,000 -3.39% 2.38% $675 5.34% -2.18%
21 WOODROFFE NT 0830 House 3 $512,500 -0.10% 2.24% $540 5.47% 1.88%
22 ALICE SPRINGS NT 0870 House 4 $600,000 11.21% 1.99% $650 5.63% 0.00%
23 DRIVER NT 0830 House 3 $505,000 -4.09% 1.86% $540 5.56% 3.84%
24 BAKEWELL NT 0832 House 3 $526,500 -1.59% 1.81% $550 5.43% 0.00%
25 ALAWA NT 0810 House 3 $585,000 -2.34% 1.78% $590 5.24% 1.72%
Best 4 Year Average Annual Median Growth Suburbs Australia ABOUT THIS REPORT This report was produced using live on the market sales and rental listing data. We have maximised accuracy by only publishing those suburb results with high enough data sample sizes. This data is also calculated at both a dwelling type and bedroom number level. This increases it’s relevance for investors, but it also means it will vary from commonly published house and unit median sale prices that include all bedrooms as consolidated median results. This report is designed to identify the suburbs where median prices have growth the greatest in the last 4 years. Any median change should not be construed to mean that each house or unit in the suburb has increased in value by this percentage. You should always conduct additional due diligence on any property and the suburb it is located in to ensure it meets your investment criteria.
Report for week of 2015-03-01 Page 8 of 18
NT Report
Rank Suburb State Postcode Dwelling Type Bedrooms Median Price Median Price Growth 1 yr
Median Price 4 Yr Average Annual % Growth
Median Rent Rental Yield
Median Rent Growth 1 yr
26 LEANYER NT 0812 House 3 $609,500 1.58% 1.78% $600 5.11% 0.84%
27 DURACK NT 0830 House 4 $650,000 1.56% 1.60% $660 5.28% -4.35%
28 COCONUT GROVE NT 0810 Unit 2 $425,000 4.93% 1.53% $450 5.50% 0.00%
29 WOOLNER NT 0820 Unit 3 $619,000 1.80% 1.42% $645 5.41% 2.38%
30 KARAMA NT 0812 House 3 $550,000 -3.51% 1.41% $580 5.48% 0.86%
31 ROSEBERY NT 0832 House 3 $560,000 -4.28% 1.39% $595 5.52% -5.56%
32 LARRAKEYAH NT 0820 Unit 3 $640,000 -0.78% 1.21% $695 5.64% -7.34%
33 BAKEWELL NT 0832 Unit 2 $382,500 -1.68% 0.90% $430 5.84% 2.38%
34 MOIL NT 0810 House 3 $569,000 -0.53% 0.85% $570 5.20% -5.00%
35 DARWIN NT 0800 Unit 2 $531,000 0.18% 0.77% $620 6.07% 3.33%
36 ANULA NT 0812 House 3 $579,000 -1.03% 0.72% $560 5.02% -3.45%
37 LARRAKEYAH NT 0820 Unit 2 $472,000 -3.68% 0.70% $520 5.72% 0.00%
38 GRAY NT 0830 Unit 2 $370,000 -2.51% 0.69% $420 5.90% -2.33%
39 BAYVIEW NT 0820 Unit 3 $580,000 -1.62% 0.68% $650 5.82% 0.00%
40 PARAP NT 0820 Unit 3 $745,000 3.54% 0.68% $740 5.16% -5.13%
41 DARWIN NT 0800 Unit 3 $790,000 14.49% 0.64% $800 5.26% -8.58%
42 STUART PARK NT 0820 Unit 3 $589,000 -5.23% 0.60% $650 5.73% -2.99%
43 NIGHTCLIFF NT 0810 Unit Studio & 1 $295,000 7.27% 0.51% $320 5.64% 0.00%
44 BAKEWELL NT 0832 Unit 3 $429,500 -2.17% 0.03% $510 6.17% 2.00%
45 DRIVER NT 0830 Unit 2 $349,000 -6.94% 0.03% $445 6.63% 3.48%
46 HUMPTY DOO NT 0836 House 3 $689,500 0.07% 0.02% $600 4.52% -1.64%
47 MILLNER NT 0810 Unit 2 $410,000 11.56% 0.00% $450 5.70% 0.00%
48 WULAGI NT 0812 House 3 $570,000 -2.15% 0.00% $585 5.33% 2.63%
49 LEANYER NT 0812 Unit 2 $415,000 -2.36% -0.24% $450 5.63% -2.18%
50 LYONS NT 0810 House 4 $870,000 -3.23% -0.47% $820 4.90% -7.87%

Best 4 Year Average Annual Median Growth Suburbs Australia ABOUT THIS REPORT This report was produced using live on the market sales and rental listing data. We have maximised accuracy by only publishing those suburb results with high enough data sample sizes. This data is also calculated at both a dwelling type and bedroom number level. This increases it’s relevance for investors, but it also means it will vary from commonly published house and unit median sale prices that include all bedrooms as consolidated median results. This report is designed to identify the suburbs where median prices have growth the greatest in the last 4 years. Any median change should not be construed to mean that each house or unit in the suburb has increased in value by this percentage. You should always conduct additional due diligence on any property and the suburb it is located in to ensure it meets your investment criteria.
Report for week of 2015-03-01 Page 9 of 18
QLD Report
Rank Suburb State Postcode Dwelling Type Bedrooms Median Price Median Price Growth 1 yr
Median Price 4 Yr Average Annual % Growth
Median Rent Rental Yield
Median Rent Growth 1 yr
1 MERMAID BEACH QLD 4218 Townhouse 3 $795,000 16.91% 18.99% $600 3.92% 8.10%
2 GLADSTONE QLD 4680 Unit 2 $450,000 12.78% 11.70% $350 4.04% -28.58%
3 DUTTON PARK QLD 4102 Unit 2 $535,000 0.94% 10.84% $475 4.61% 39.70%
4 WILSONTON QLD 4350 Unit 2 $278,000 21.39% 10.57% $245 4.58% 8.88%
5 ALBION QLD 4010 Unit 3 $679,000 49.39% 10.28% $480 3.67% -22.59%
6 CARRARA QLD 4211 Townhouse 2 $395,000 0.00% 10.08% $320 4.21% 4.91%
7 WESTCOURT QLD 4870 Unit 2 $259,000 -2.27% 9.98% $220 4.41% 2.32%
8 SURFERS PARADISE QLD 4217 Townhouse 3 $589,000 -18.76% 8.50% $480 4.23% 4.34%
9 MILES QLD 4415 House 5 $537,000 -3.25% 8.46% $435 4.21% -65.20%
10 CLONCURRY QLD 4824 House 4 $476,500 0.31% 8.25% $500 5.45% -23.08%
11 MACKAY QLD 4740 Unit Studio & 1 $299,000 2.57% 8.09% $235 4.08% -7.85%
12 BOYNE ISLAND QLD 4680 Unit 3 $580,000 16.23% 8.08% $500 4.48% 1.01%
13 NOOSAVILLE QLD 4566 Townhouse 3 $634,500 14.01% 8.08% $550 4.50% 22.22%
14 SOUTH TOOWOOMBA QLD 4350 House 4 $422,500 26.11% 8.05% $350 4.30% 7.69%
15 SOUTH BRISBANE QLD 4101 Unit Studio & 1 $395,000 3.94% 7.57% $430 5.66% 2.38%
16 HOME HILL QLD 4806 House 4 $360,000 6.19% 7.55% $280 4.04% 9.80%
17 SAMFORD VALLEY QLD 4520 House 4 $864,500 3.40% 7.39% $635 3.81% -5.93%
18 SUNSHINE BEACH QLD 4567 House 4 $1,990,000 6.13% 7.32% $785 2.05% 4.66%
19 CLAYFIELD QLD 4011 House 2 $510,000 7.36% 7.28% $395 4.02% 3.94%
20 KEARNEYS SPRING QLD 4350 Unit 2 $297,000 25.58% 6.66% $270 4.72% 3.84%
21 KURANDA QLD 4881 House 2 $412,500 18.02% 6.55% $320 4.03% 0.00%
22 BENOWA QLD 4217 Townhouse 3 $509,000 -5.66% 6.54% $480 4.90% 9.09%
23 NORTH TOOWOOMBA QLD 4350 House 3 $320,000 17.64% 6.47% $300 4.87% 7.14%
24 MOUNT LOFTY QLD 4350 House 4 $625,000 8.69% 6.27% $420 3.49% 5.00%
25 DICKY BEACH QLD 4551 House 4 $892,000 23.88% 5.87% $550 3.20% 22.22%

Best 4 Year Average Annual Median Growth Suburbs Australia ABOUT THIS REPORT This report was produced using live on the market sales and rental listing data. We have maximised accuracy by only publishing those suburb results with high enough data sample sizes. This data is also calculated at both a dwelling type and bedroom number level. This increases it’s relevance for investors, but it also means it will vary from commonly published house and unit median sale prices that include all bedrooms as consolidated median results. This report is designed to identify the suburbs where median prices have growth the greatest in the last 4 years. Any median change should not be construed to mean that each house or unit in the suburb has increased in value by this percentage. You should always conduct additional due diligence on any property and the suburb it is located in to ensure it meets your investment criteria.
Report for week of 2015-03-01 Page 10 of 18
QLD Report
Rank Suburb State Postcode Dwelling Type Bedrooms Median Price Median Price Growth 1 yr
Median Price 4 Yr Average Annual % Growth
Median Rent Rental Yield
Median Rent Growth 1 yr
26 FIG TREE POCKET QLD 4069 House 5 $1,252,500 4.81% 5.79% $800 3.32% -20.00%
27 BROWNS PLAINS QLD 4118 Townhouse 3 $338,000 21.58% 5.78% $350 5.38% 2.94%
28 MIDDLE RIDGE QLD 4350 House 5 $699,000 -9.23% 5.75% $480 3.57% -3.04%
29 ROMA QLD 4455 House 5 $495,000 -0.91% 5.60% $590 6.19% -1.67%
30 EAST TOOWOOMBA QLD 4350 House 4 $617,000 -4.86% 5.50% $410 3.45% -2.39%
31 NEWTOWN QLD 4305 Unit 2 $269,000 15.94% 5.39% $270 5.21% 10.20%
32 COLLINSVILLE QLD 4804 House 4 $370,000 -12.43% 5.38% $280 3.93% -20.00%
33 RANGEVILLE QLD 4350 Unit 3 $395,000 7.04% 5.24% $345 4.54% 9.52%
34 MACHANS BEACH QLD 4878 House 3 $472,000 41.95% 5.22% $360 3.96% 7.46%
35 REDCLIFFE QLD 4020 Unit Studio & 1 $289,000 0.69% 5.19% $240 4.31% -29.42%
36 CALOUNDRA WEST QLD 4551 Townhouse 3 $390,000 1.56% 5.07% $415 5.53% 18.57%
37 EAST BRISBANE QLD 4169 Unit 2 $450,000 17.64% 5.01% $380 4.39% -1.30%
38 PORT DOUGLAS QLD 4877 Townhouse 2 $285,000 5.94% 5.00% $300 5.47% 3.44%
39 ROCHEDALE QLD 4123 House 4 $696,500 10.20% 4.98% $630 4.70% 6.77%
40 LUTWYCHE QLD 4030 Unit 2 $449,000 28.28% 4.96% $360 4.16% 0.00%
41 BROADBEACH QLD 4218 House 2 $499,000 16.31% 4.94% $450 4.68% 25.00%
42 KELSO QLD 4815 House 5 $519,500 -1.80% 4.93% $365 3.65% -27.00%
43 CLONTARF QLD 4019 Unit 3 $604,500 9.11% 4.91% $405 3.48% 19.11%
44 TOOWOOMBA QLD 4350 House 3 $344,000 6.83% 4.82% $295 4.45% 1.72%
45 CHERMSIDE QLD 4032 Unit Studio & 1 $350,000 17.05% 4.81% $295 4.38% 1.72%
46 WILSONTON HEIGHTS QLD 4350 House 3 $288,000 5.68% 4.77% $295 5.32% 5.35%
47 WINDSOR QLD 4030 Unit 2 $438,000 20.00% 4.70% $370 4.39% -2.64%
48 COORPAROO QLD 4151 Unit 3 $522,500 24.55% 4.69% $460 4.57% 2.22%
49 EDGE HILL QLD 4870 House 4 $550,000 10.00% 4.62% $480 4.53% 0.00%
50 KINGSTHORPE QLD 4400 House 3 $299,000 11.35% 4.58% $285 4.95% 1.78%

Best 4 Year Average Annual Median Growth Suburbs Australia ABOUT THIS REPORT This report was produced using live on the market sales and rental listing data. We have maximised accuracy by only publishing those suburb results with high enough data sample sizes. This data is also calculated at both a dwelling type and bedroom number level. This increases it’s relevance for investors, but it also means it will vary from commonly published house and unit median sale prices that include all bedrooms as consolidated median results. This report is designed to identify the suburbs where median prices have growth the greatest in the last 4 years. Any median change should not be construed to mean that each house or unit in the suburb has increased in value by this percentage. You should always conduct additional due diligence on any property and the suburb it is located in to ensure it meets your investment criteria.
Report for week of 2015-03-01 Page 11 of 18
SA Report
Rank Suburb State Postcode Dwelling Type Bedrooms Median Price Median Price Growth 1 yr
Median Price 4 Yr Average Annual % Growth
Median Rent Rental Yield
Median Rent Growth 1 yr
1 WHYALLA SA 5600 Unit 2 $222,500 11.25% 9.46% $200 4.67% -23.08%
2 FLINDERS PARK SA 5025 House 4 $625,000 6.83% 7.96% $490 4.07% 5.37%
3 MARINO SA 5049 House 4 $875,000 4.79% 6.90% $475 2.82% 18.75%
4 COOBER PEDY SA 5723 House 3 $130,000 8.33% 6.78% $180 7.20% 12.50%
5 GLENELG NORTH SA 5045 House 4 $857,500 25.27% 6.36% $650 3.94% 21.49%
6 ST GEORGES SA 5064 House 3 $880,000 16.55% 6.08% $455 2.68% 1.11%
7 NORTH HAVEN SA 5018 House 4 $690,000 -4.50% 5.83% $425 3.20% -5.56%
8 BEAUMONT SA 5066 House 3 $825,000 24.06% 5.34% $485 3.05% 0.00%
9 LOXTON SA 5333 House 3 $231,000 12.68% 5.07% $240 5.40% 17.07%
10 MIDDLETON SA 5213 House 3 $495,000 0.00% 4.19% $270 2.83% 0.00%
11 QUORN SA 5433 House 3 $222,500 14.10% 4.03% $220 5.14% 0.00%
12 MUNNO PARA SA 5115 House 3 $268,500 2.48% 4.00% $285 5.51% 1.78%
13 WALLAROO SA 5556 House 4 $379,000 2.43% 3.80% $300 4.11% 3.44%
14 WHYALLA SA 5600 House 3 $279,500 7.50% 3.67% $280 5.20% -12.50%
15 PORT AUGUSTA SA 5700 House 4 $317,000 -1.56% 3.62% $290 4.75% -3.34%
16 LOXTON SA 5333 House 4 $319,000 2.90% 3.36% $290 4.72% 20.83%
17 SEAFORD SA 5169 House 4 $425,000 10.38% 3.35% $370 4.52% 5.71%
18 UNLEY SA 5061 House 3 $795,000 4.26% 3.23% $480 3.13% -3.04%
19 CARRICKALINGA SA 5204 House 3 $420,000 15.06% 3.22% $270 3.34% -48.08%
20 BLACKWOOD SA 5051 House 3 $475,000 9.19% 3.12% $375 4.10% -1.32%
21 FULLARTON SA 5063 House 3 $672,500 -0.38% 3.11% $510 3.94% 9.67%
22 CLARE SA 5453 House 4 $422,000 0.47% 3.00% $370 4.55% 12.12%
23 PARKSIDE SA 5063 House 2 $540,000 0.93% 2.99% $390 3.75% 1.29%
24 PLYMPTON SA 5038 House 3 $475,000 3.26% 2.97% $390 4.26% 2.63%
25 GRANGE SA 5022 House 4 $722,500 1.83% 2.90% $480 3.45% -12.73%

Best 4 Year Average Annual Median Growth Suburbs Australia ABOUT THIS REPORT This report was produced using live on the market sales and rental listing data. We have maximised accuracy by only publishing those suburb results with high enough data sample sizes. This data is also calculated at both a dwelling type and bedroom number level. This increases it’s relevance for investors, but it also means it will vary from commonly published house and unit median sale prices that include all bedrooms as consolidated median results. This report is designed to identify the suburbs where median prices have growth the greatest in the last 4 years. Any median change should not be construed to mean that each house or unit in the suburb has increased in value by this percentage. You should always conduct additional due diligence on any property and the suburb it is located in to ensure it meets your investment criteria.
Report for week of 2015-03-01 Page 12 of 18
SA Report
Rank Suburb State Postcode Dwelling Type Bedrooms Median Price Median Price Growth 1 yr
Median Price 4 Yr Average Annual % Growth
Median Rent Rental Yield
Median Rent Growth 1 yr
26 NORWOOD SA 5067 House 4 $1,050,000 -14.26% 2.87% $650 3.21% 0.00%
27 NORTH BRIGHTON SA 5048 House 3 $600,000 3.89% 2.86% $415 3.59% -7.78%
28 LINDEN PARK SA 5065 House 3 $730,000 12.30% 2.75% $475 3.38% 6.74%
29 BEVERLEY SA 5009 House 3 $417,500 8.44% 2.72% $345 4.29% 6.15%
30 HENLEY BEACH SA 5022 House 4 $880,000 3.52% 2.57% $590 3.48% -4.07%
31 PASADENA SA 5042 House 3 $476,000 12.26% 2.57% $370 4.04% 2.77%
32 PORT LINCOLN SA 5606 Unit 2 $215,000 3.11% 2.47% $200 4.83% 0.00%
33 MANNUM SA 5238 House 2 $252,000 2.85% 2.42% $175 3.61% -5.41%
34 MCLAREN VALE SA 5171 House 4 $527,000 11.53% 2.42% $400 3.94% 14.28%
35 BELAIR SA 5052 House 4 $645,000 11.20% 2.36% $480 3.86% -6.80%
36 HENLEY BEACH SA 5022 House 3 $630,000 -1.18% 2.31% $460 3.79% 4.54%
37 PARADISE SA 5075 House 3 $446,500 5.55% 2.31% $340 3.95% 3.03%
38 SHEIDOW PARK SA 5158 House 3 $394,500 8.08% 2.31% $340 4.48% -1.45%
39 LITTLEHAMPTON SA 5250 House 3 $405,000 5.46% 2.28% $350 4.49% 2.94%
40 PORT AUGUSTA WEST SA 5700 House 3 $290,000 18.36% 2.28% $275 4.93% 5.76%
41 OSBORNE SA 5017 House 3 $350,000 2.94% 2.26% $360 5.34% 2.85%
42 EVANSTON GARDENS SA 5116 House 3 $300,000 1.18% 2.24% $260 4.50% 1.96%
43 HAHNDORF SA 5245 House 3 $530,000 20.72% 2.24% $420 4.12% 7.69%
44 KENSINGTON GARDENS SA 5068 House 3 $710,000 4.41% 2.23% $445 3.25% 17.10%
45 CLARE SA 5453 House 3 $311,000 9.12% 2.21% $270 4.51% 8.00%
46 BERRI SA 5343 House 3 $175,000 -7.90% 2.11% $200 5.94% 0.00%
47 CEDUNA SA 5690 House 4 $369,000 5.73% 2.07% $300 4.22% -6.25%
48 BRIGHTON SA 5048 Unit 2 $352,500 1.00% 2.05% $300 4.42% 3.44%
49 GRANGE SA 5022 House 3 $632,500 6.30% 1.97% $420 3.45% 0.00%
50 NORMANVILLE SA 5204 House 3 $340,000 4.77% 1.97% $270 4.12% -3.58%

Best 4 Year Average Annual Median Growth Suburbs Australia ABOUT THIS REPORT This report was produced using live on the market sales and rental listing data. We have maximised accuracy by only publishing those suburb results with high enough data sample sizes. This data is also calculated at both a dwelling type and bedroom number level. This increases it’s relevance for investors, but it also means it will vary from commonly published house and unit median sale prices that include all bedrooms as consolidated median results. This report is designed to identify the suburbs where median prices have growth the greatest in the last 4 years. Any median change should not be construed to mean that each house or unit in the suburb has increased in value by this percentage. You should always conduct additional due diligence on any property and the suburb it is located in to ensure it meets your investment criteria.
Report for week of 2015-03-01 Page 13 of 18
TAS Report
Rank Suburb State Postcode Dwelling Type Bedrooms Median Price Median Price Growth 1 yr
Median Price 4 Yr Average Annual % Growth
Median Rent Rental Yield
Median Rent Growth 1 yr
1 SANDY BAY TAS 7005 House 5 $935,000 38.51% 5.67% $565 3.14% -5.84%
2 SOUTH HOBART TAS 7004 House 2 $352,500 10.15% 4.77% $340 5.01% 13.33%
3 EAST DEVONPORT TAS 7310 House 2 $196,500 16.27% 4.62% $200 5.29% 0.00%
4 MIDWAY POINT TAS 7171 House 4 $385,000 16.66% 4.33% $330 4.45% -5.72%
5 GEEVESTON TAS 7116 House 3 $277,500 15.62% 4.02% $240 4.49% 6.66%
6 CARLTON TAS 7173 House 3 $275,000 4.76% 2.41% $300 5.67% 0.00%
7 BINALONG BAY TAS 7216 House 3 $445,000 22.08% 2.22% $230 2.68% -4.17%
8 NEW TOWN TAS 7008 House 2 $375,000 10.29% 1.74% $315 4.36% 10.52%
9 MOONAH TAS 7009 House 2 $265,000 1.92% 1.47% $270 5.29% 1.88%
10 TAROONA TAS 7053 House 3 $465,000 3.33% 1.39% $400 4.47% 5.26%
11 TURNERS BEACH TAS 7315 House 3 $368,500 -0.14% 1.29% $350 4.93% 9.37%
12 KINGSTON TAS 7050 House 4 $472,500 9.24% 1.28% $400 4.40% 1.26%
13 HOBART TAS 7000 Unit 2 $430,000 -14.00% 1.20% $370 4.47% 0.00%
14 LAUDERDALE TAS 7021 House 3 $365,000 4.28% 1.05% $350 4.98% 6.06%
15 CHIGWELL TAS 7011 House 3 $229,000 14.50% 1.01% $295 6.69% 7.27%
16 LENAH VALLEY TAS 7008 House 4 $442,500 10.62% 1.01% $425 4.99% 11.84%
17 MORNINGTON TAS 7018 House 3 $265,000 0.95% 0.97% $310 6.08% 0.00%
18 LAUNCESTON TAS 7250 House 4 $499,500 -6.64% 0.48% $360 3.74% -2.71%
19 LEGANA TAS 7277 Unit 2 $270,000 0.00% 0.47% $265 5.10% -1.86%
20 KINGSTON BEACH TAS 7050 House 3 $445,000 8.53% 0.45% $360 4.20% 2.85%
21 TRANMERE TAS 7018 House 3 $495,000 3.12% 0.25% $395 4.14% 0.00%
22 PENGUIN TAS 7316 House 3 $292,000 -0.69% 0.21% $260 4.63% 1.96%
23 RIVERSIDE TAS 7250 House 4 $390,000 -10.35% 0.06% $340 4.53% 0.00%
24 LATROBE TAS 7307 Unit 2 $228,000 5.06% 0.05% $240 5.47% 9.09%
25 BRIGHTON TAS 7030 House 3 $290,000 0.00% 0.00% $315 5.64% -1.57%

Best 4 Year Average Annual Median Growth Suburbs Australia ABOUT THIS REPORT This report was produced using live on the market sales and rental listing data. We have maximised accuracy by only publishing those suburb results with high enough data sample sizes. This data is also calculated at both a dwelling type and bedroom number level. This increases it’s relevance for investors, but it also means it will vary from commonly published house and unit median sale prices that include all bedrooms as consolidated median results. This report is designed to identify the suburbs where median prices have growth the greatest in the last 4 years. Any median change should not be construed to mean that each house or unit in the suburb has increased in value by this percentage. You should always conduct additional due diligence on any property and the suburb it is located in to ensure it meets your investment criteria.
Report for week of 2015-03-01 Page 14 of 18
TAS Report
Rank Suburb State Postcode Dwelling Type Bedrooms Median Price Median Price Growth 1 yr
Median Price 4 Yr Average Annual % Growth
Median Rent Rental Yield
Median Rent Growth 1 yr
26 EAST LAUNCESTON TAS 7250 House 3 $400,000 5.26% 0.00% $350 4.55% 4.47%
27 HUONVILLE TAS 7109 Unit 2 $199,000 0.00% 0.00% $230 6.01% 0.00%
28 HUONVILLE TAS 7109 House 3 $299,000 11.15% 0.00% $280 4.86% 0.00%
29 LOW HEAD TAS 7253 House 3 $320,000 6.66% 0.00% $300 4.87% -6.25%
30 SCOTTSDALE TAS 7260 House 3 $210,000 7.69% 0.00% $220 5.44% 10.00%
31 SOUTH HOBART TAS 7004 House 4 $550,000 -4.35% 0.00% $450 4.25% 1.12%
32 WEST LAUNCESTON TAS 7250 House 2 $265,000 -1.86% 0.00% $260 5.10% 6.12%
33 WYNYARD TAS 7325 House 4 $385,000 1.58% 0.00% $305 4.11% 5.17%
34 OAKDOWNS TAS 7019 House 3 $349,000 7.38% -0.07% $330 4.91% 3.12%
35 GLENORCHY TAS 7010 House 4 $317,000 2.58% -0.08% $340 5.57% 0.00%
36 DEVONPORT TAS 7310 Unit 3 $267,000 1.90% -0.19% $275 5.35% 1.85%
37 SUMMERHILL TAS 7250 House 3 $269,000 0.00% -0.19% $300 5.79% 0.00%
38 SMITHTON TAS 7330 House 3 $239,000 0.00% -0.21% $220 4.78% 4.76%
39 SOMERSET TAS 7322 House 3 $240,000 -4.00% -0.21% $260 5.63% 0.00%
40 SORELL TAS 7172 House 3 $327,000 0.61% -0.23% $320 5.08% 0.00%
41 MIDWAY POINT TAS 7171 House 3 $295,000 0.00% -0.25% $320 5.64% 0.00%
42 SOUTH LAUNCESTON TAS 7249 House 4 $345,000 16.94% -0.29% $350 5.27% 12.90%
43 OLD BEACH TAS 7017 House 4 $395,000 -1.25% -0.31% $420 5.52% 6.32%
44 QUEENSTOWN TAS 7467 House 2 $79,000 16.17% -0.31% $120 7.89% -11.12%
45 INVERMAY TAS 7248 House 3 $236,000 4.88% -0.32% $270 5.94% 3.84%
46 PRIMROSE SANDS TAS 7173 House 2 $195,000 8.93% -0.32% $190 5.06% 0.00%
47 GEORGE TOWN TAS 7253 House 3 $177,500 4.41% -0.35% $200 5.85% 5.26%
48 DELORAINE TAS 7304 House 3 $275,000 -4.19% -0.36% $255 4.82% 2.00%
49 HOWRAH TAS 7018 House 3 $344,000 -1.72% -0.43% $350 5.29% 0.00%
50 PRIMROSE SANDS TAS 7173 House 3 $235,000 -5.63% -0.47% $215 4.75% -10.42%

Best 4 Year Average Annual Median Growth Suburbs Australia ABOUT THIS REPORT This report was produced using live on the market sales and rental listing data. We have maximised accuracy by only publishing those suburb results with high enough data sample sizes. This data is also calculated at both a dwelling type and bedroom number level. This increases it’s relevance for investors, but it also means it will vary from commonly published house and unit median sale prices that include all bedrooms as consolidated median results. This report is designed to identify the suburbs where median prices have growth the greatest in the last 4 years. Any median change should not be construed to mean that each house or unit in the suburb has increased in value by this percentage. You should always conduct additional due diligence on any property and the suburb it is located in to ensure it meets your investment criteria.
Report for week of 2015-03-01 Page 15 of 18
VIC Report
Rank Suburb State Postcode Dwelling Type Bedrooms Median Price Median Price Growth 1 yr
Median Price 4 Yr Average Annual % Growth
Median Rent Rental Yield
Median Rent Growth 1 yr
1 HAWTHORN EAST VIC 3123 Unit Studio & 1 $395,000 9.72% 22.57% $300 3.94% -6.25%
2 GLEN WAVERLEY VIC 3150 House 5 $1,544,000 43.62% 16.26% $550 1.85% 0.00%
3 BALWYN VIC 3103 Unit Studio & 1 $375,000 2.73% 14.59% $350 4.85% 11.11%
4 WINDSOR VIC 3181 Unit Studio & 1 $377,500 2.02% 14.45% $330 4.54% 10.00%
5 DROMANA VIC 3936 Unit 2 $460,000 -2.03% 13.72% $275 3.10% 14.58%
6 MALVERN EAST VIC 3145 Unit Studio & 1 $349,000 26.90% 13.54% $265 3.94% 1.92%
7 OAKLEIGH VIC 3166 Unit Studio & 1 $369,000 12.15% 12.54% $320 4.50% 0.00%
8 BALWYN NORTH VIC 3104 House 5 $1,900,000 46.15% 12.35% $845 2.31% 12.66%
9 TOORAK VIC 3142 Unit 3 $1,495,000 57.36% 12.00% $650 2.26% 3.17%
10 GEELONG VIC 3220 House 4 $615,000 18.49% 11.70% $510 4.31% 13.33%
11 HAWTHORN VIC 3122 Unit Studio & 1 $300,000 42.85% 11.37% $300 5.20% 1.69%
12 WENDOUREE VIC 3355 House 4 $400,000 38.40% 11.37% $305 3.96% 1.66%
13 CARLTON VIC 3053 Unit 2 $480,000 0.20% 10.67% $490 5.30% 0.00%
14 SUNSHINE VIC 3020 Unit 2 $390,000 56.00% 10.67% $290 3.86% 16.00%
15 CANTERBURY VIC 3126 House 3 $1,500,000 17.18% 9.33% $700 2.42% -3.45%
16 PAYNESVILLE VIC 3880 House 4 $507,500 18.29% 8.96% $320 3.27% 0.00%
17 MOUNT ELIZA VIC 3930 Unit 2 $400,000 0.75% 8.37% $320 4.16% 10.34%
18 MARYBOROUGH VIC 3465 House 2 $195,000 5.40% 8.25% $200 5.33% 0.00%
19 SOUTH MELBOURNE VIC 3205 Unit 3 $985,000 -21.20% 8.15% $670 3.53% -2.90%
20 WOODEND VIC 3442 House 4 $599,500 -4.69% 8.04% $420 3.64% -4.55%
21 MALVERN VIC 3144 House 3 $1,725,000 44.35% 7.85% $750 2.26% 0.00%
22 FITZROY VIC 3065 Unit Studio & 1 $415,000 24.06% 7.65% $380 4.76% 5.55%
23 NORTH GEELONG VIC 3215 House 3 $422,500 9.45% 7.62% $310 3.81% 6.89%
24 BOX HILL VIC 3128 Unit Studio & 1 $240,000 42.01% 7.46% $230 4.98% 2.22%
25 FITZROY VIC 3065 House 3 $1,200,000 26.31% 7.46% $750 3.25% 4.16%

Best 4 Year Average Annual Median Growth Suburbs Australia ABOUT THIS REPORT This report was produced using live on the market sales and rental listing data. We have maximised accuracy by only publishing those suburb results with high enough data sample sizes. This data is also calculated at both a dwelling type and bedroom number level. This increases it’s relevance for investors, but it also means it will vary from commonly published house and unit median sale prices that include all bedrooms as consolidated median results. This report is designed to identify the suburbs where median prices have growth the greatest in the last 4 years. Any median change should not be construed to mean that each house or unit in the suburb has increased in value by this percentage. You should always conduct additional due diligence on any property and the suburb it is located in to ensure it meets your investment criteria.
Report for week of 2015-03-01 Page 16 of 18
VIC Report
Rank Suburb State Postcode Dwelling Type Bedrooms Median Price Median Price Growth 1 yr
Median Price 4 Yr Average Annual % Growth
Median Rent Rental Yield
Median Rent Growth 1 yr
26 LAKE GARDENS VIC 3355 House 3 $385,000 3.35% 7.34% $310 4.18% -3.13%
27 ABBOTSFORD VIC 3067 Unit 2 $600,000 -0.42% 7.22% $490 4.24% 0.00%
28 SOLDIERS HILL VIC 3350 House 3 $330,000 10.36% 7.19% $270 4.25% -1.82%
29 NORTH BENDIGO VIC 3550 House 3 $289,500 8.42% 7.16% $280 5.02% 5.66%
30 MAIDEN GULLY VIC 3551 House 3 $392,500 12.46% 7.13% $330 4.37% -2.95%
31 KORUMBURRA VIC 3950 House 4 $414,500 10.53% 7.10% $320 4.01% 6.66%
32 GEELONG WEST VIC 3218 House 4 $550,000 -5.58% 6.97% $410 3.87% -2.39%
33 BENDIGO VIC 3550 House 2 $304,000 3.05% 6.93% $260 4.44% 0.00%
34 HAWTHORN EAST VIC 3123 House 3 $1,500,000 36.36% 6.87% $650 2.25% 4.83%
35 BALLARAT EAST VIC 3350 House 3 $299,500 13.01% 6.82% $270 4.68% 0.00%
36 BENDIGO VIC 3550 Unit 2 $260,000 4.00% 6.78% $230 4.60% 4.54%
37 GLEN WAVERLEY VIC 3150 Unit 3 $780,000 30.00% 6.78% $450 3.00% 5.88%
38 HORSHAM VIC 3400 Unit 2 $180,000 -2.71% 6.58% $195 5.63% 8.33%
39 MARYBOROUGH VIC 3465 House 4 $335,000 13.55% 6.54% $250 3.88% 4.16%
40 AIRPORT WEST VIC 3042 House 4 $680,000 26.62% 6.30% $395 3.02% 1.28%
41 GEELONG WEST VIC 3218 House 2 $350,000 0.00% 6.21% $295 4.38% -1.67%
42 BRUNSWICK WEST VIC 3055 House 2 $585,000 6.36% 6.19% $400 3.55% 2.56%
43 WINCHELSEA VIC 3241 House 3 $292,500 0.00% 6.19% $290 5.15% 7.40%
44 PRAHRAN VIC 3181 Unit Studio & 1 $305,000 -8.28% 6.17% $320 5.45% 6.66%
45 BEAUFORT VIC 3373 House 3 $240,000 20.60% 6.15% $240 5.20% 4.34%
46 FLORA HILL VIC 3550 House 3 $330,000 3.12% 6.14% $290 4.56% 0.00%
47 MALVERN EAST VIC 3145 Unit 2 $495,000 7.60% 6.14% $395 4.14% 6.75%
48 HAMPTON VIC 3188 Townhouse 3 $967,500 22.46% 6.13% $680 3.65% -2.86%
49 ARARAT VIC 3377 House 4 $327,000 1.55% 6.10% $320 5.08% 6.66%
50 CALIFORNIA GULLY VIC 3556 House 3 $275,000 7.84% 6.10% $265 5.01% -1.86%

Best 4 Year Average Annual Median Growth Suburbs Australia ABOUT THIS REPORT This report was produced using live on the market sales and rental listing data. We have maximised accuracy by only publishing those suburb results with high enough data sample sizes. This data is also calculated at both a dwelling type and bedroom number level. This increases it’s relevance for investors, but it also means it will vary from commonly published house and unit median sale prices that include all bedrooms as consolidated median results. This report is designed to identify the suburbs where median prices have growth the greatest in the last 4 years. Any median change should not be construed to mean that each house or unit in the suburb has increased in value by this percentage. You should always conduct additional due diligence on any property and the suburb it is located in to ensure it meets your investment criteria.
Report for week of 2015-03-01 Page 17 of 18
WA Report
Rank Suburb State Postcode Dwelling Type Bedrooms Median Price Median Price Growth 1 yr
Median Price 4 Yr Average Annual % Growth
Median Rent Rental Yield
Median Rent Growth 1 yr
1 RIVERVALE WA 6103 Unit 2 $530,000 30.86% 13.89% $380 3.72% 5.55%
2 NORTH PERTH WA 6006 Unit Studio & 1 $419,000 45.48% 12.78% $300 3.72% -6.25%
3 RIVERVALE WA 6103 Unit Studio & 1 $420,000 21.03% 11.78% $320 3.96% 6.66%
4 SPEARWOOD WA 6163 Unit 2 $459,000 53.51% 10.58% $325 3.68% -7.15%
5 EAST PERTH WA 6004 Townhouse 3 $1,122,500 18.28% 10.06% $650 3.01% -16.13%
6 ROSSMOYNE WA 6148 House 4 $1,380,000 6.15% 9.67% $635 2.39% -9.29%
7 ROSSMOYNE WA 6148 House 3 $999,000 -4.18% 9.34% $520 2.70% -3.71%
8 ERSKINE WA 6210 Unit 3 $419,000 40.13% 8.80% $340 4.21% -2.86%
9 SCARBOROUGH WA 6019 Unit Studio & 1 $450,000 50.50% 8.68% $320 3.69% -3.04%
10 ROCKINGHAM WA 6168 Unit 2 $339,000 23.27% 8.46% $300 4.60% 1.69%
11 KARRATHA WA 6714 Unit Studio & 1 $435,000 -20.19% 8.45% $500 5.97% -23.08%
12 WAROONA WA 6215 House 4 $399,000 0.25% 8.40% $360 4.69% -7.70%
13 NORTH PERTH WA 6006 Unit 2 $569,000 13.80% 7.92% $420 3.83% -19.24%
14 CLOVERDALE WA 6105 House 3 $539,000 8.01% 7.74% $420 4.05% -2.33%
15 EAST CANNINGTON WA 6107 House 3 $498,500 8.36% 7.38% $450 4.69% 1.12%
16 ST JAMES WA 6102 House 4 $724,500 13.38% 7.18% $520 3.73% 0.00%
17 EMBLETON WA 6062 House 4 $667,000 17.22% 6.99% $520 4.05% -5.46%
18 KOONDOOLA WA 6064 House 3 $425,000 10.38% 6.53% $370 4.52% -2.64%
19 MIRRABOOKA WA 6061 House 4 $512,000 15.83% 6.43% $450 4.57% -1.10%
20 MIDDLE SWAN WA 6056 House 4 $469,000 4.45% 6.28% $445 4.93% -14.43%
21 LATHLAIN WA 6100 House 3 $742,500 12.67% 6.25% $450 3.15% -1.10%
22 LYNWOOD WA 6147 House 3 $489,000 13.72% 6.16% $400 4.25% -1.24%
23 WILLETTON WA 6155 House 3 $659,000 6.29% 6.15% $460 3.62% -2.13%
24 JOONDANNA WA 6060 Unit 2 $449,000 15.12% 6.12% $380 4.40% -1.30%
25 MIDLAND WA 6056 House 2 $379,000 9.85% 6.11% $350 4.80% 6.06%

Best 4 Year Average Annual Median Growth Suburbs Australia ABOUT THIS REPORT This report was produced using live on the market sales and rental listing data. We have maximised accuracy by only publishing those suburb results with high enough data sample sizes. This data is also calculated at both a dwelling type and bedroom number level. This increases it’s relevance for investors, but it also means it will vary from commonly published house and unit median sale prices that include all bedrooms as consolidated median results. This report is designed to identify the suburbs where median prices have growth the greatest in the last 4 years. Any median change should not be construed to mean that each house or unit in the suburb has increased in value by this percentage. You should always conduct additional due diligence on any property and the suburb it is located in to ensure it meets your investment criteria.
Report for week of 2015-03-01 Page 18 of 18
WA Report
Rank Suburb State Postcode Dwelling Type Bedrooms Median Price Median Price Growth 1 yr
Median Price 4 Yr Average Annual % Growth
Median Rent Rental Yield
Median Rent Growth 1 yr
26 GIRRAWHEEN WA 6064 House 3 $430,000 11.68% 6.08% $380 4.59% -2.57%
27 EMBLETON WA 6062 House 3 $579,000 5.46% 5.98% $420 3.77% -6.67%
28 COOLBELLUP WA 6163 House 3 $499,000 13.66% 5.92% $400 4.16% 0.00%
29 CHURCHLANDS WA 6018 Unit 2 $430,000 -1.15% 5.89% $380 4.59% -5.00%
30 CLOVERDALE WA 6105 House 4 $589,000 7.09% 5.86% $500 4.41% -7.41%
31 BAYSWATER WA 6053 Townhouse 2 $349,000 17.31% 5.85% $350 5.21% 0.00%
32 WILLETTON WA 6155 House 4 $775,000 7.78% 5.78% $550 3.69% -4.35%
33 WOODLANDS WA 6018 House 4 $1,250,000 25.37% 5.76% $635 2.64% -9.29%
34 LEEMING WA 6149 House 3 $649,000 9.07% 5.47% $475 3.80% 3.26%
35 BALCATTA WA 6021 Unit 3 $529,000 -2.04% 5.32% $435 4.27% 1.16%
36 KEWDALE WA 6105 House 4 $627,000 8.29% 5.32% $520 4.31% -7.15%
37 KENWICK WA 6107 House 4 $465,000 6.04% 5.25% $435 4.86% -1.14%
38 MADDINGTON WA 6109 House 3 $392,500 4.11% 5.24% $380 5.03% 0.00%
39 MADDINGTON WA 6109 House 4 $449,000 8.06% 5.17% $430 4.97% 7.50%
40 KEWDALE WA 6105 House 3 $549,000 9.90% 5.16% $400 3.78% -6.98%
41 RIVERTON WA 6148 House 4 $779,000 6.85% 5.08% $550 3.67% -4.35%
42 BASSENDEAN WA 6054 House 2 $499,000 1.31% 5.06% $400 4.16% 3.89%
43 BERTRAM WA 6167 House 3 $389,000 0.00% 5.00% $400 5.34% -2.44%
44 BULL CREEK WA 6149 House 4 $829,000 3.75% 5.00% $550 3.44% -1.79%
45 LOCKRIDGE WA 6054 House 3 $395,000 5.33% 5.00% $380 5.00% 0.00%
46 VICTORIA PARK WA 6100 Unit 3 $637,000 15.81% 5.00% $495 4.04% -14.66%
47 CAVERSHAM WA 6055 House 4 $514,000 6.52% 4.99% $495 5.00% -1.00%
48 WATTLE GROVE WA 6107 House 4 $550,000 12.24% 4.97% $520 4.91% 0.00%
49 LYNWOOD WA 6147 House 4 $499,000 6.39% 4.87% $430 4.48% 0.00%
50 THORNLIE WA 6108 Unit 3 $399,000 5.27% 4.86% $400 5.21% -2.44%