best etfs for the buck - etf channel · pdf filebest etfs for the buck . each month, ... the...
TRANSCRIPT
. . . . . .. . . .
. . . . . . . . . .
May, 2011 http://www.etfchannel.com
Best ETFs For The Buck
Each month, ETF Channel sorts through more than 800 ETFs to find the leader in 12 categories with regard to the average expense ratio and average trailing twelve month return; the list of ETFs below highlight the funds from these categories with the largest TTM gain paired with the lowest expense ratio.

. . . . . . .. . .
According to the National Stock Exchange, in 2010, ETF industry assets have increased approximately 28% since December 2009 and for the full year of 2010, net cash inflows to ETFs totaled $119 billion. It is fair to say that ETFs are now on many investors’ radar screens and learning more about these instruments is becoming increasingly important. Two factors to consider while researching ETFs are the fund’s expense ratio, and their track record. Because an ETF’s expense ratio determines how much is subtracted from an ETF’s assets each year, it is important to keep an eye on this number. If presented with two ETFs with identical holdings, and one ETF has an expense ratio of 0.25% while the other is 0.5%, investors would naturally gravitate toward the 0.25% to juice their returns. Additionally, within each category, there are many ETFs, and some are very similar to each other. An example would be iShares Gold Trust (IAU) versus SPDR Gold Shares (GLD). While they are not perfectly identical, they are very similar. GLD returned 29.27% in 2010 and IAU returned 29.42% over the same period. GLD has an expense ratio of 0.4%, while IAU is 0.25%. The difference in the return between IAU and GLD is 0.15%, the exact difference between the expense ratios (0.4% vs 0.25%). So, the investor who picked the ETF with the lowest expense ratio would have come out ahead.
TABLE OF CONTENTS ASIA: iShares MSCI Hong Kong Index Fund CURRENCIES: CurrencyShares Swiss Franc Trust EMERGING MARKETS: iShares MSCI Indonesia Investable Market Index Fund ENERGY: SPDR S&P Oil & Gas Exploration & Production ETF EUROPE: iShares FTSE EPRA/NAREIT Developed Europe Index Fund FINANCIAL: SPDR KBW Insurance ETF HEALTH: SPDR S&P Biotech ETF INCOME: WisdomTree Dividend ex-Financials Fund INDUSTRIAL/MATERIALS: Vanguard Materials ETF METALS: ETFS Physical Silver Shares REAL ESTATE: iShares Cohen & Steers Realty Majors Index Fund TECHNOLOGY: PowerShares NASDAQ Internet Portfolio
. . . . . . .. . .
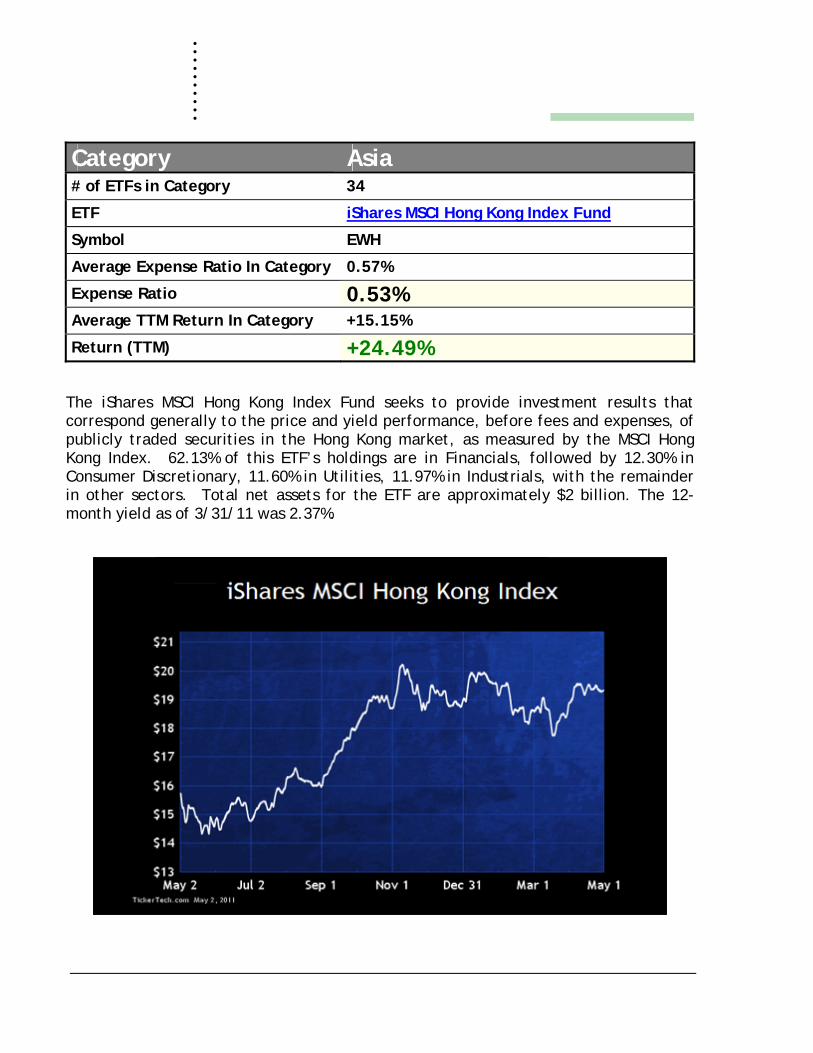
Category Asia # of ETFs in Category 34
ETF iShares MSCI Hong Kong Index Fund
Symbol EWH
Average Expense Ratio In Category 0.57%
Expense Ratio 0.53% Average TTM Return In Category +15.15%
Return (TTM) +24.49%
The iShares MSCI Hong Kong Index Fund seeks to provide investment results that correspond generally to the price and yield performance, before fees and expenses, of publicly traded securities in the Hong Kong market, as measured by the MSCI Hong Kong Index. 62.13% of this ETF’s holdings are in Financials, followed by 12.30% in Consumer Discretionary, 11.60% in Utilities, 11.97% in Industrials, with the remainder in other sectors. Total net assets for the ETF are approximately $2 billion. The 12-month yield as of 3/31/11 was 2.37%.

Category Currencies # of ETFs in Category 19
ETF CurrencyShares Swiss Franc Trust
Symbol FXF
Average Expense Ratio In Category 0.45%
Expense Ratio 0.40% Average TTM Return In Category +10.20%
Return (TTM) +23.58%
CurrencyShares Swiss Franc Trust is designed to track the price of the Swiss Franc net of Trust expenses, which are expected to be paid from interest earned on the deposited Swiss Francs. Total net assets for the ETF are $649,940,442.
Special Offer: Find out what Dave Moenning is holding in the ETF Channel Flexible Growth Investment Portfolio with a special 10% off coupon and 30 Days Free.

. . . . . . .. . .
Category Emerging Markets # of ETFs in Category 24
ETF iShares MSCI Indonesia Investable Market Index Fund
Symbol EIDO
Average Expense Ratio In Category 0.63%
Expense Ratio 0.61% Average TTM Return In Category +16.56%
Return (TTM) +44.83%
The iShares MSCI Indonesia Investable Market Index Fund seeks investment results that correspond generally to the price and yield performance, before fees and expenses, of the MSCI Indonesia Investable Market Index. The underlying index is designed to measure the performance of the top 99%, by market capitalization, of equities listed on stock exchanges in Indonesia. The ETF has total net assets of $197,007,377 and a 12 month yield of 0.50%. Top industries held: 32.03% Financials, 15.07% Energy, 12.95% Consumer Discretionary, 11.59% Consumer Staples, 9.02% Telecom.
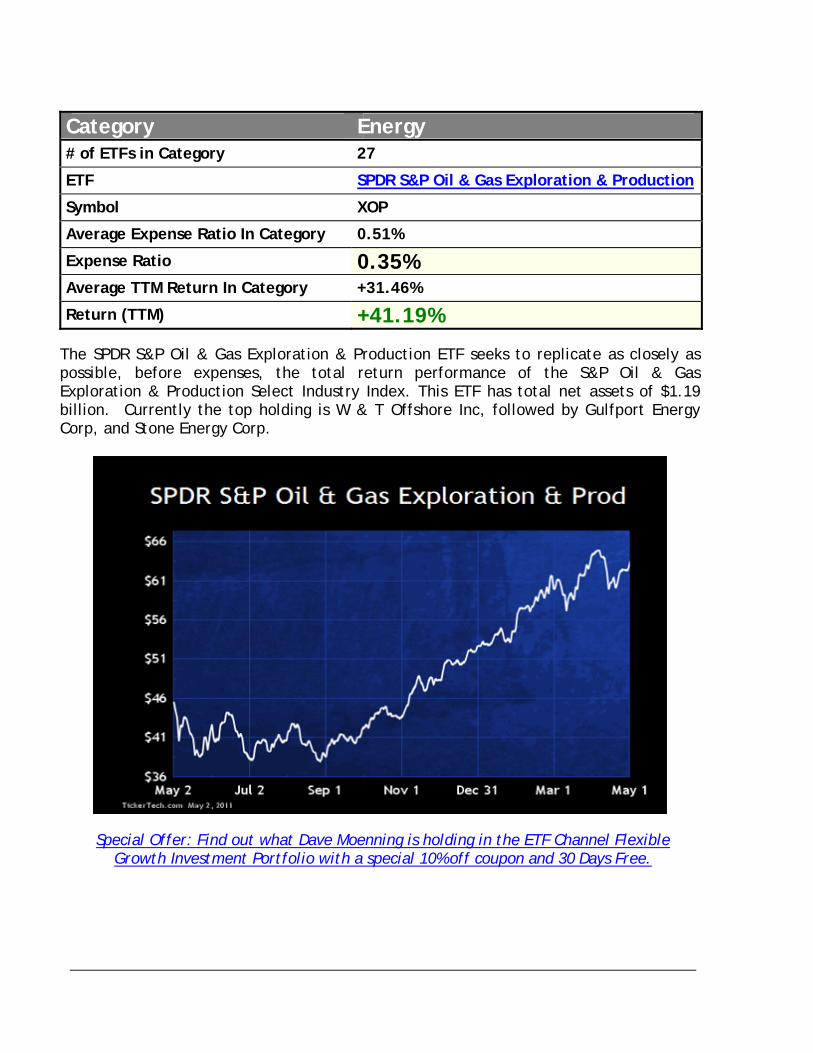
Category Energy # of ETFs in Category 27
ETF SPDR S&P Oil & Gas Exploration & Production
Symbol XOP
Average Expense Ratio In Category 0.51%
Expense Ratio 0.35% Average TTM Return In Category +31.46%
Return (TTM) +41.19%
The SPDR S&P Oil & Gas Exploration & Production ETF seeks to replicate as closely as possible, before expenses, the total return performance of the S&P Oil & Gas Exploration & Production Select Industry Index. This ETF has total net assets of $1.19 billion. Currently the top holding is W & T Offshore Inc, followed by Gulfport Energy Corp, and Stone Energy Corp.
Special Offer: Find out what Dave Moenning is holding in the ETF Channel Flexible Growth Investment Portfolio with a special 10% off coupon and 30 Days Free.

. . . . . . .. . .
Category Europe # of ETFs in Category 24
ETF iShares FTSE EPRA/NAREIT Developed Europe Index Fund
Symbol IFEU
Average Expense Ratio In Category 0.49%
Expense Ratio 0.48% Average TTM Return In Category +24.58%
Return (TTM) +29.08%
The iShares FTSE EPRA/NAREIT Developed Europe Index Fund seeks investment results that correspond generally to the price and yield performance, before fees and expenses, of the FTSE EPRA/NAREIT Developed Europe Index. The index looks at the stock performance of companies that own or develop European real estate. The ETF has total net assets of $21,042,368. Largest holdings include UNIBAIL-RODAMCO SE, LAND SECURITIES GROUP PLC, and BRITISH LAND CO PLC.

Category Financial # of ETFs in Category 24
ETF SPDR KBW Insurance ETF
Symbol KIE
Average Expense Ratio In Category 0.43%
Expense Ratio 0.35% Average TTM Return In Category +2.53%
Return (TTM) +9.13%
The SPDR KBW Insurance ETF, seeks to closely match the returns and characteristics (before expenses) of the KBW Insurance Index. The ETF has net assets of $204.36 million and a dividend yield of 1.56%. Approximately 35.5% of the ETF is in Life & Health Insurance.
Special Offer: Find out what Dave Moenning is holding in the ETF Channel Flexible Growth Investment Portfolio with a special 10% off coupon and 30 Days Free.
. . . . . . .. . .
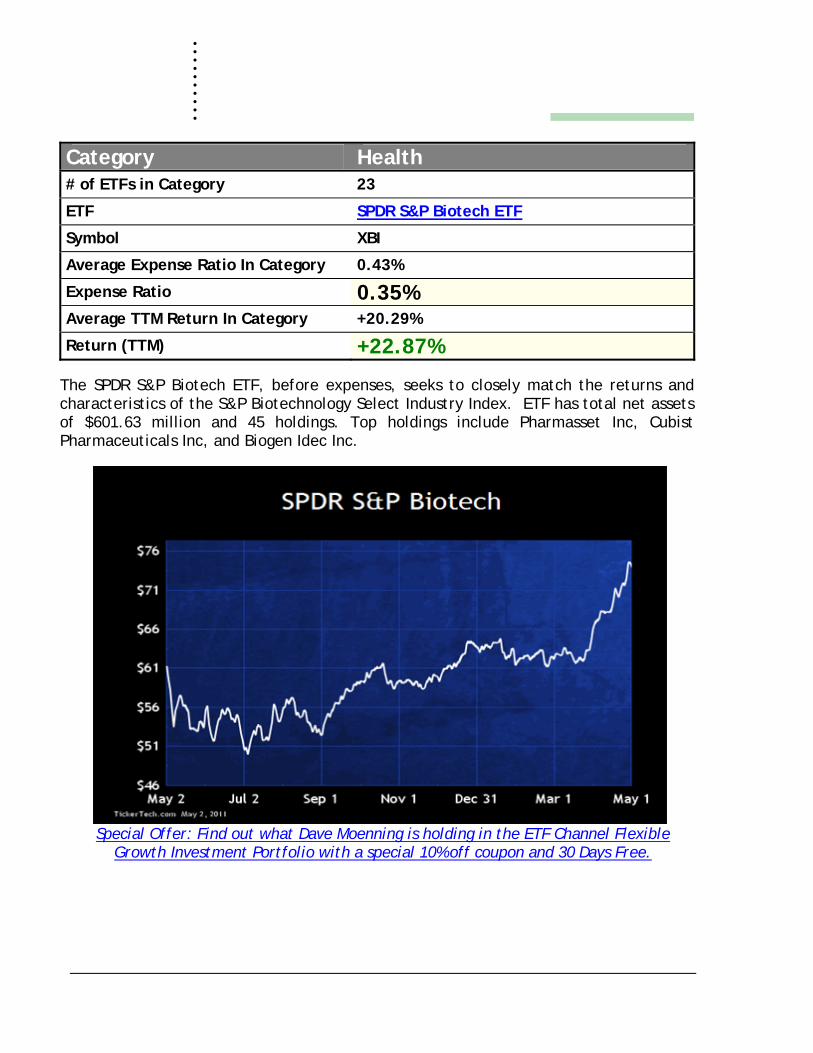
Category Health # of ETFs in Category 23
ETF SPDR S&P Biotech ETF
Symbol XBI
Average Expense Ratio In Category 0.43%
Expense Ratio 0.35% Average TTM Return In Category +20.29%
Return (TTM) +22.87%
The SPDR S&P Biotech ETF, before expenses, seeks to closely match the returns and characteristics of the S&P Biotechnology Select Industry Index. ETF has total net assets of $601.63 million and 45 holdings. Top holdings include Pharmasset Inc, Cubist Pharmaceuticals Inc, and Biogen Idec Inc.
Special Offer: Find out what Dave Moenning is holding in the ETF Channel Flexible
Growth Investment Portfolio with a special 10% off coupon and 30 Days Free.

Category Income # of ETFs in Category 21
ETF WisdomTree Dividend ex-Financials Fund
Symbol DTN
Average Expense Ratio In Category 0.43%
Expense Ratio 0.38% Average TTM Return In Category +16.86%
Return (TTM) +22.23%
WisdomTree Dividend ex-Financials Fund seeks investment results that closely correspond to the price and yield performance, before fees and expenses, of the WisdomTree Dividend ex-Financials Index, which measures the performance of high dividend-yielding stocks outside the financial sector. The ETF has total net assets of $355,672.22, and a distribution yield of 3.15%.
Special Offer: Find out what Dave Moenning is holding in the ETF Channel Flexible Growth Investment Portfolio with a special 10% off coupon and 30 Days Free.
. . . . . . .. . .
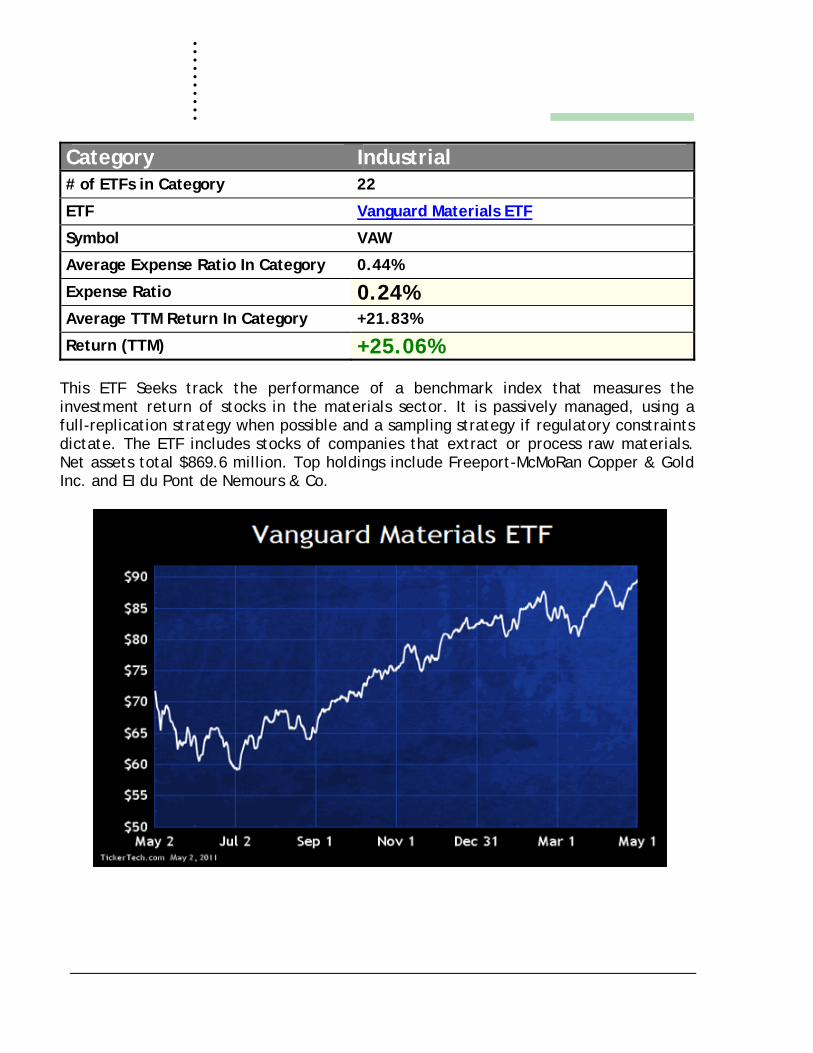
Category Industrial # of ETFs in Category 22
ETF Vanguard Materials ETF
Symbol VAW
Average Expense Ratio In Category 0.44%
Expense Ratio 0.24% Average TTM Return In Category +21.83%
Return (TTM) +25.06%
This ETF Seeks track the performance of a benchmark index that measures the investment return of stocks in the materials sector. It is passively managed, using a full-replication strategy when possible and a sampling strategy if regulatory constraints dictate. The ETF includes stocks of companies that extract or process raw materials. Net assets total $869.6 million. Top holdings include Freeport-McMoRan Copper & Gold Inc. and EI du Pont de Nemours & Co.

Category Metals # of ETFs in Category 20
ETF ETFS Physical Silver Shares
Symbol SIVR
Average Expense Ratio In Category 0.60%
Expense Ratio 0.30% Average TTM Return In Category +49.42%
Return (TTM) +161.55%
ETFS Physical Silver Shares is designed to offer investors a simple way to access the precious metals market. SIVR is intended to provide investors with a return equivalent to movements in the silver spot price less fees.
Special Offer: Find out what Dave Moenning is holding in the ETF Channel Flexible
Growth Investment Portfolio with a special 10% off coupon and 30 Days Free.
. . . . . . .. . .
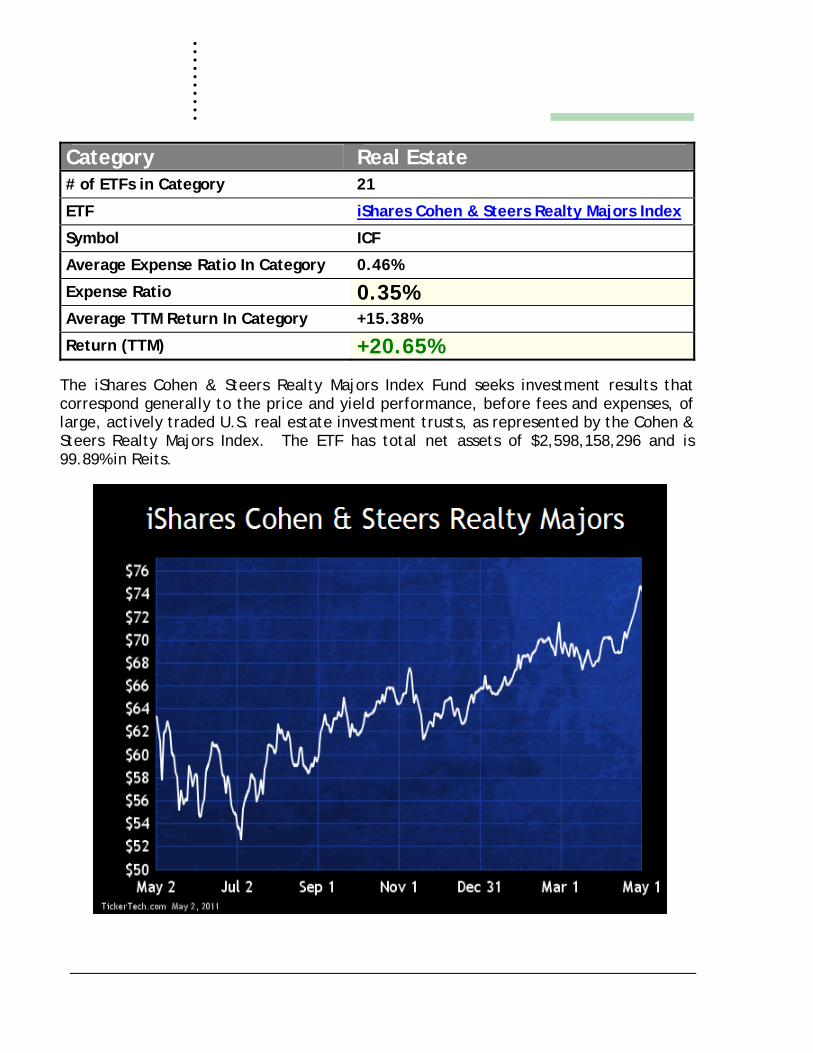
Category Real Estate # of ETFs in Category 21
ETF iShares Cohen & Steers Realty Majors Index
Symbol ICF
Average Expense Ratio In Category 0.46%
Expense Ratio 0.35% Average TTM Return In Category +15.38%
Return (TTM) +20.65%
The iShares Cohen & Steers Realty Majors Index Fund seeks investment results that correspond generally to the price and yield performance, before fees and expenses, of large, actively traded U.S. real estate investment trusts, as represented by the Cohen & Steers Realty Majors Index. The ETF has total net assets of $2,598,158,296 and is 99.89% in Reits.
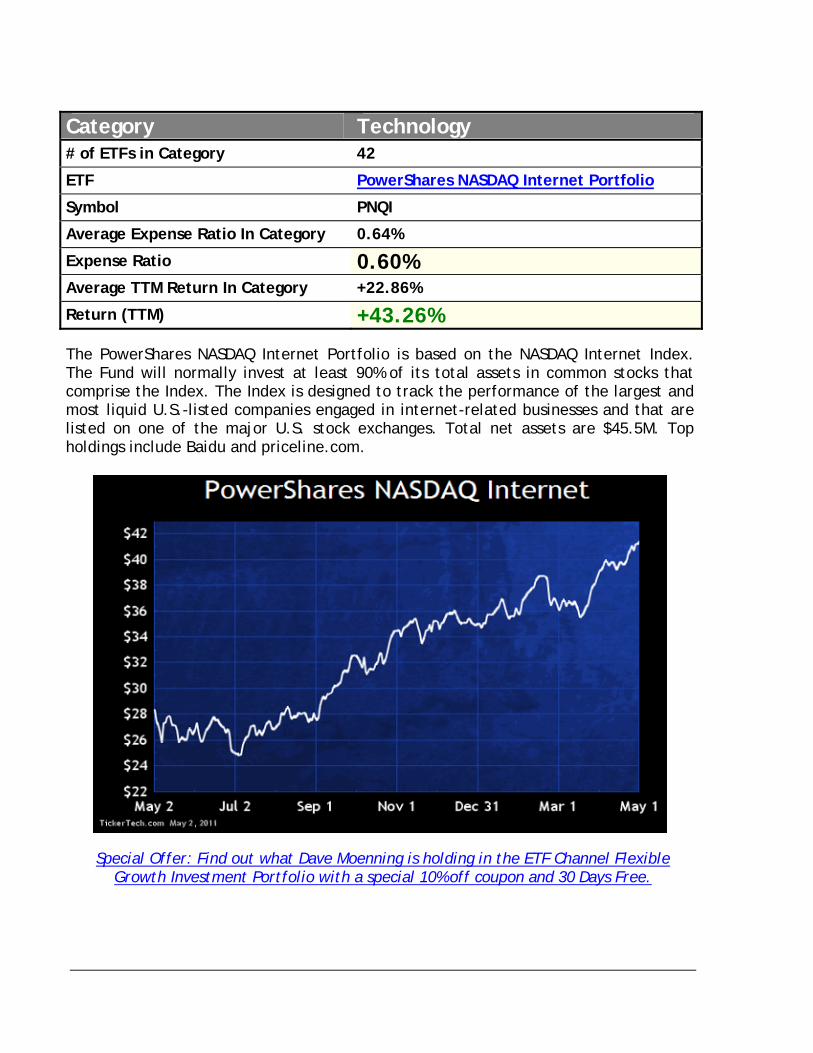
Category Technology # of ETFs in Category 42
ETF PowerShares NASDAQ Internet Portfolio
Symbol PNQI
Average Expense Ratio In Category 0.64%
Expense Ratio 0.60% Average TTM Return In Category +22.86%
Return (TTM) +43.26%
The PowerShares NASDAQ Internet Portfolio is based on the NASDAQ Internet Index. The Fund will normally invest at least 90% of its total assets in common stocks that comprise the Index. The Index is designed to track the performance of the largest and most liquid U.S.-listed companies engaged in internet-related businesses and that are listed on one of the major U.S. stock exchanges. Total net assets are $45.5M. Top holdings include Baidu and priceline.com.
Special Offer: Find out what Dave Moenning is holding in the ETF Channel Flexible Growth Investment Portfolio with a special 10% off coupon and 30 Days Free.