best practice guide - ecf.com
TRANSCRIPT

Funded by
BESTPRACTICE
GUIDE
G L O B A L A L L I A N C E O F N G O s F O R R O A D S A F E T Y
EUROPEAN CYCLISTS’ FEDERATION
Ceri Woolsgrove, Policy Officer, [email protected] Armstrong, Project Assistant, [email protected]
January 2020
This study was funded by FedEx Express Europe

3ROAD USER BEHAVIOURI. Types of cycle users
How to incorporate children onto the roads
II. Cyclist education and trainingChildren and school trainingOther community members training needs Effective cycling techniques for cycling in mixed traffic
III. Driver educationLook right on right turnImplementing the Dutch Reach for drivers
IV. Passing distancesV. Strict liability VI. Enforcement
Penalties for drivers Proportionate penalties – Are all vehicles equal? Police checks (alcohol/speed) Proportions of effort on driver checks and cyclist checks
VII. Role of police on bikes
SAFE VEHICLESI. Bicycles for safer cyclingII. Motor vehicles for safer cyclingIII. Lorries for safer cyclingIV. Road worthiness of vehicles
MANAGEMENTI. Monitoring and evaluation Data collection examples Data collection recommendationsII. Policy management Stakeholder buy in National cycling strategies FedEx express experience
4
5
6
INFRASTRUCTUREI. Design principles for cycling infrastructureII. Sustainable safetyIII. When to build segregated cycling infrastructureIV. Cycling infrastructure design Surface/materials Curves/turns Visibility Width Lighting and horizontal markingsV. Light infrastructureVI. Junctions and crossingsVII. How to organize priorityVIII. Two way cycling on a one-way streetIX. Bus lane sharingX. 30km/h roads as the default in urban areasXI. Traffic light programmingXII. Cycle streets and shared space conceptsXIII. Shared spacesXIV. Edge lane roadsXV. Maintenance
Contents
PROJECT EXPLANATIONTHE BEST PRACTICE GUIDE
1
2INTRODUCTIONI. Target group – including the potential for cyclingII. How perceived safety leads to real safety
Increase cycling safety for better healthSafety in numbers
III. The benefits of cyclingIV. Safe Systems, Vision Zero and sustainable safetyV. EPACs (Electric Power Assisted Cycles) as a future trend
3
3
45557
8
9
1011
11111213
141414
14
16
1717171718
19
20
21222424242526262728333637383940424344
45464748
49495154545454

INTRODUCTIONI. TARGET GROUP – INCLUDING THE POTENTIAL FOR CYCLING
Bicycle traffic should be an essential part of an integrated urban development and transport policy; and this is beginning to happen. Cycling is being seen more and more by public authorities as an excellent tool to alleviate problems in areas such as health, congestion, air pollution and CO2 emissions, as well as to improve road safety. Increased cycling levels are linked with increased road safety in general since most serious crashes involve a motorised vehicle of some sort.
More than 30% of trips made in cars in Europe cover distances of less than 3 km and 50% cover less than 5 km6, yet 73% of Europeans believe that the cycling sector as a mode should benefit from preferential treatment compared with motor vehicles7. This shows clear potential for increased cycle use, however one of the major barriers to increasing cycling is danger on the roads. Better road safety is an essential part of getting people cycling; we must reduce the risk and perceived risk to incentivise people to move from polluting forms of transport to more sustainable, safe and active modes.
The EU has been a relative road safety success story, with the number of fatal crashes falling by 43% between 2001 and 2010, and by another 20% between 2010 and 2017. Yet despite this, fatalities still sit at around 26,000 people killed each year8, with fatality reductions stalling at this number since 2014.
THE BEST PRACTICE GUIDEThe Safer Cycling Advocate Program’s Best Practice Guide contains a list of positive measures that can be adopted to promote cycling and cycling safety. It is based on the experiences of the Netherlands and Denmark, two countries that have developed significant expertise in the field of cycling safety.
Written in cooperation between the European Cyclists’ Federation, the Fietsersbond (the Dutch Cyclists‘ Union) and the Cyklistforbundet, (the Danish Cyclists’ Federation), this guide seeks to collate and advocate for the adoption of best practice measures regarding road user behaviour, infrastructure design, safe vehicles and the management of road infrastructure. Whilst non-exhaustive, a wide variety of topics are covered, representing the areas most relevant to policymakers, safety campaigners and anyone with an interest in improving road user safety.
While car occupant fatalities have dropped by 50% over the past ten years, cycling fatalities have stalled at around 25% as a total of all fatalities and have even increased slightly over some time periods (in 2014 for example). This means that whilst Europe has made good progress generally in reducing cycling fatalities, they are not keeping pace with fatality reductions in other transport modes.
SAFER CYCLING ADVOCATE PROGRAM - BEST PRACTICE GUIDE PAGE 4PAGE 3 SAFER CYCLING ADVOCATE PROGRAM - BEST PRACTICE GUIDE
1 ASIRT, 2019, Road safety facts, https://www.asirt.org/safe-travel/road-safety-facts/2 WHO, 2018, Global status report on road safety 2018, https://www.who.int/violence_injury_prevention/road_safety_sttatus/2018/en/ 3 WHO, 2014, Health for the World’s Adolescents, http://apps.who.int/adolescent/second-decade/files/1612_MNCAH_HWA_Executive_Summary.pdf 4 WHO, 2019, Maternal, newborn, child and adolescent health, http://www.who.int/maternal_child_adolescent/topics/adolescence/what-is-global-aa-ha/en/ 5 WRI, 2013, Saving lives with sustainable transport, http://wriorg.s3.amazonaws.com/s3fs-public/saving_lives_with_sustainable_transport.pdf
6 Edwards P, Tsouros A, 2006, Promoting physical activity and active living in urban environments, WHO Europe, http://www.euro.who.int/__data/assets/pdf_file/0009/98424/E89498.pdf7 EC, 1999, Cycling: the way ahead for towns and cities, http://ec.europa.eu/environment/archives/cycling/cycling_en.pdf 8 EC, 2019, CARE Statistics – accidents data, https://ec.europa.eu/transport/road_safety/specialist/statistics_en
The Safer Cycling Advocate Program (SCAP) seeks to empower civil society organizations by building their capacity to advocate for safer roads and to promote cycling as a transport mode. Road crashes are estimated to kill around 1.3 million people every year and are the leading cause of death among children and young people aged between 5 and 29 years. Although the burden is universal, low- and middle-income countries (LMICs) are hit the hardest, with over 90% of all deaths occurring in these countries1.
In 2015 the World Health Organization released the Global Status Report on Road Safety2. This publication highlighted risk areas to work on in order to achieve the road safety targets set for 2020 and 2030. When more than 3,000 teenagers die every day from preventable causes3 and road fatalities are the leading cause of death for teens between 10–19 years of age in high-, middle-, and low-income countries, the incentive to strive to put an end to this situation is pressing4.
According to the World Resource Institute research study “Saving lives with sustainable transport”, when there is a shift towards cycling in cities on a larger scale, safety trends improve considerably and not only for non-motorized modes. As an example, Copenhagen is cited as a city where infrastructure improvements to encourage cycling had as a direct consequence a sharp decrease on road fatalities5. Road Safety measures should also seek to increase cycling and other sustainable modes of transport, promoting their use through comfortable, and easy to use infrastructure.
PROJECT EXPLANATION
occurring in low- andmiddle-income countries
90% of all deathspeople killed
every year
1.3 millionteenagers die
every day
3,000

Simply put, the greater the number of cyclists, the lower the risk for each individual cyclist. This phenomenon occurs at the national and local levels, as well as on specific routes, it can even be seen across countries.
This is a correlation and the cause is not yet known, so caution should be used in interpretation16, but there are four potential causal factors:
Drivers grow more aware of cyclists and become better at anticipating their behaviour17
Drivers are more likely to be cyclists themselves, which means that they are more likely to understand how their driving may affect other road users18
More people cycling leads to greater political will to improve conditions for cyclists, and therefore there is better infrastructure for cyclists with greater numbers19
Higher cycle use often goes together with lower car use, decreasing the risk of conflict with motor vehicles, with consequent safety benefits for all road users
This does not necessarily mean that increases in walking and cycling will always be accompanied by absolute reductions in pedestrian and cyclist casualty and fatality numbers. However, the key point is that walking and cycling still gets safer for the individual pedestrian or cyclist per kilometre (or per trip, or per hour) cycled. Increased cycling should not be seen as a threat to road safety20, but as having a positive impact on road safety.
Indeed, it is not only the safety of cyclists that improves when cycling numbers increase, but there is good evidence that the safety of all road users will improve with an increase in safer cycling infrastructure. In fact, a US study showed that building cycling infrastructure was one of the largest factors in improving all round safety21.
II. HOW PERCEIVED SAFETY LEADS TO REAL SAFETY
Increase cycling safety for better healthGiven the huge health and environmental benefits of cycling9 ,a cycling safety plan should also look at promoting cycling and walking by reducing the perception of risk. Increased cycling is a solution to many issues within our cities as well as promoting improved health, as health related life-years gained by cycling outweigh injury-related life years lost by significant amounts10. Cycling can improve air quality, ease congestion, promote liveable cities, and create sustainable, democratic access to city amenities and services. Active commuting by bicycle is associated with a substantial decrease in the risk of premature death, including cancer and cardiovascular disease, compared with non-active commuting11. Active transport use can boost self-esteem, mood, sleep quality and energy, as well as reducing the risk of stress, depression, dementia and Alzheimer’s disease.
Around 50% of motorised vehicle journeys are under 5 km and 30% are under 3 km12. This shows the huge potential of shifting from motorised transport to active modes of transport like cycling, as these short journeys are most easily replaced by active transport. However, a huge barrier to increasing cycling is the perception of safety risks13, so it is important that cycling, as well as being safe, also looks safe and is comfortable. The perception of risk and safety therefore is an important element of cycling road safety and advocacy. Promoting cycling can improve public health and road safety; while improved road safety promotes cycle use and can increase cycling. Good cycling road safety interventions also therefore promote the use of cycling by reducing the perception of risk, whilst in turn that same increase in cycling improves safety and public health.
Crucially it is important to observe that cycling is not overly dangerous; cycling is as risky as walking per distance travelled14. Road safety interventions should not decrease the number of cyclists or act as a barrier to potential cyclists, as this intervention would almost always bring about a reduction in overall public health no matter how effective the specific road safety measure is. Rather road safety interventions should be seen as an opportunity to improve public health outcomes generally, through increasing the use of cycling as a sustainable, healthy transport mode.
Safety in NumbersWe see a correlation between an increase in the numbers of people cycling and a reduced risk for each individual cyclist (Safety in Numbers)15.
Net
herl
ands
2011
- 20
15
Aus
tria
2014
Finl
and
2011
Den
mar
k20
13
Belg
ium
2009
Fran
ce20
08
Ger
man
y20
11 -2
014
Ital
y20
11 -
2015
Irel
and
2012
- 20
14
Nor
way
2014
Swed
en20
14
Uni
ted
King
dom
2011
- 20
15
USA
2009
Swit
zela
nd20
11 -
2015
223 279
547
267
88
439
10389
891
255
199262
83
48
28
11 8 812
1621
49
18
51
9
16
24 24
Distance cycled per year per inhabitant (km)Cycling fatalities per year per million inhabitant
9 ECF, (2019), The economic benefits of cycling, https://ecf.com/what-we-do/cycling-economy/economic-benefits 10 J. Johan de Hartog, H. Boogaard, H. Nijland, G. Hoek, 2010, Do the health benefits of cycling outweigh the risks?, Environmental health perspectives, 118(8), 1109–1116, https://www.ncbi.nlm.nih.gov/pmc/articles/PMC2920084/11 Rutter, Harry, et al. "Economic impact of reduced mortality due to increased cycling." American journal of preventive medicine 44.1 (2013): 89-92. and Litman, Todd. "Evaluating active transport benefits and costs: guide to valuing walking and cycling improvements and encouragement programs." (2013)12 Edwards P, Tsouros A, 2006, Promoting physical activity and active living in urban environments, WHO Europe, http://www.euro.who.int/__data/assets/pdf_file/0009/98424/E89498.pdf13 DFT UK, 2015, Climate change and transport choices, https://www.gov.uk/government/publications/climate-change-and-transport-choices-segmentation-update14 NHS, 2014, Cycling safety special report, https://www.nhs.uk/news/lifestyle-and-exercise/news-analysis-cycling-safety-special-report/Beck LF, Dellinger AM, O’Neil ME, 2007, Motor vehicle crash injury rates by mode of travel, United States: using exposurebased methods to quantify differences. American Journal of Epidemiology;166(2):212–218 http://aje.oxfordjournals.org/content/166/2/212.full.pdf+htmlITF, 2013, Road Safety Annual Report 2013, http://www.internationaltransportforum.org/pub/pdf/13IrtadReport.pdfDFT UK, Walking and Cycling Statistics, England: 2016; UK Department for Transport https://www.gov.uk/government/uploads/system/uploads/attachment_data/file/674503/walking-and-cyclingstatistics-england-2016.pdf15 Safety in Numbers. A full literature review on this can be found here (in Swedish) - Koucky & Partners AB, 2015, Studien är framtagen med medel från Trafikverket Skyltfond, http://www.trafikverket.se/contentassets/e2cb0e0ce34744369e293d6d35d1091d/safety_in_numbers_minskar_risken_for_cykleolyckor_med_fler_cyklister_litteraturstudie.pdf
16 Bhatia, R., & Wier, M. (2011). “Safety in Numbers” re-examined: can we make valid or practical inferences from available evidence?. Accident Analysis & Prevention, 43(1), 235-240.17 Jacobsen, P. L. (2015). Safety in numbers: more walkers and bicyclists, safer walking and bicycling. Injury prevention, 21(4), 271-275.18 Vandenbulcke, G., Thomas, I., de Geus, B., Degraeuwe, B., Torfs, R., Meeusen, R., & Panis, L. I. (2009). Mapping bicycle use and the risk of accidents for commuters who cycle to work in Belgium. Transport Policy, 16(2), 77-87.19 Wegman, F., Zhang, F., & Dijkstra, A. (2012). How to make more cycling good for road safety?. Accident Analysis & Prevention, 44(1), 19-29.20 Schepers, J. P., & Heinen, E, 2013. How does a modal shift from short car trips to cycling affect road safety?. Accident Analysis & Prevention, 50, 1118-1127. https://www.sciencedirect.com/science/article/pii/S000145751200311921 Marshall, Wesley E., and Nicholas N. Ferenchak. "Why cities with high bicycling rates are safer for all road users." Journal of Transport & Health (2019).
SAFER CYCLING ADVOCATE PROGRAM - BEST PRACTICE GUIDE PAGE 6PAGE 5 SAFER CYCLING ADVOCATE PROGRAM - BEST PRACTICE GUIDE

III. BENEFITS OF CYCLING
IV. SAFE SYSTEMS, VISION ZERO AND SUSTAINABLE SAFETY
The idea of the Safe Systems Approach (SSA) is to realise that mistakes will always be made on the road. Even the best drivers, riders, and walkers make mistakes, or make the wrong decision. It is up to road safety experts to come up with a way of eliminating incidents while taking into account the fact that we are all human.
The SSA aims to ensure a safe transport system for all road users. Such an approach takes into account people’s vulnerability to serious injuries in road traffic crashes and recognises that the system should be designed to be forgiving of human error. The cornerstones of this approach are safe roads and roadsides, safe speeds, safe vehicles, and safe road users, all of which must be addressed in order to eliminate fatal crashes and reduce serious injuries.
A SSA looks at the road as a whole and as a system. Planning and development takes into account all road users and spreads the share of responsibility between those on the road, transport planners, infrastructure designers, implementers and road agencies.
Infrastructure must be forgiving when mistakes are made, with crashes and impact forces when crashes do occur being kept as low as possible.
A Safe Systems approach challenges the traditional cost/benefit model of road safety whereby safety interventions in saving lives are weighed against other costs and benefits. The Swedish Safe Systems Approach states “human life and health are paramount and take priority over mobility and other objectives of the road traffic system”23, a clear denunciation of transport costs, freight costs, or time and mobility costs. Human life and health is sacrosanct and is the number one priority for road management and funding. This is an excellent approach and the inclusion of health benefits is particularly important with regards to active modes of transport.
It is important that we keep public health benefits in mind when thinking about road safety interventions and are aware of the SSA from an ‘active’ transport mode viewpoint. If a road safety intervention has a detrimental effect on the comfort and attractiveness of cycling, or if it increases the perception of risk, then this should be thoroughly questioned within the Safe Systems/Vision Zero conception of road safety, because of the wider health/activity benefits of cycling. Even reducing risk through vehicular improvements and road infrastructure improvements (as well as by improved driver behaviour) could result in increased kilometres travelled and volumes of motor vehicle traffic and thus a negative result overall for public health. Hence the importance of a system approach, viewing safety in our traffic system holistically.
Cycling is such a healthy activity that if practised daily24, even for short journeys, then no matter how effective a road safety intervention, if that intervention acts as a barrier to cycling then it will have failed to improve public health. Even if a road safety intervention prevented 100% of all fatalities it would still be ineffective as a public health measure if it reduced the number of people cycling by even a small amount25.
Improving cycling conditions and prioritising active modes should be a crucial part of the Vision Zero/Safe Systems Approach. We should not accept the continual (or even increased) use of motorised vehicles as these are the main cause of traffic crashes in highly populated areas. The Safe Systems Approach should be about encouraging greater use of safer, active modes of travel such as public transport, walking and cycling, yet unfortunately sometimes this is forgotten in Vision Zero/Safe Systems work.
The European Cyclists’ Federation (ECF) has produced a document highlighting the Benefits of Cycling22. At current levels, cycling already produces benefits for the EU in excess of 150 billion euros per year. More than 90 billion euros of this comes from positive externalities for the environment, public health and the mobility system. In the EU:
23 MOEI SE, 2016, Renewed commitment to Vision Zero, https://www.government.se/4a800b/contentassets/b38a99b2571e4116b81d6a5eb2aea71e/trafiksakerhet_160927_webny.pdf24 DFT UK, 2015, The health benefits of cycling, http://www.dft.gov.uk/cyclingengland/health-fitness/health-benefits-of-cycling/25 De Jong, P, 2012, The health impact of mandatory bicycle helmet laws.Risk Analysis: An International Journal, 32(5), 782-790. https://www.ncbi.nlm.nih.gov/pubmed/2246268022 ECF, (2019), Cycling facts and figures, https://ecf.com/resources/cycling-facts-and-figures
SAFER CYCLING ADVOCATE PROGRAM - BEST PRACTICE GUIDE PAGE 8PAGE 7 SAFER CYCLING ADVOCATE PROGRAM - BEST PRACTICE GUIDE
Cycling reduces CO2 (e) emissions by more than
16 million tonsper year
The overall value of reduced air pollution though cycling equals around
435 million eurosper year
The overall value of reduced noise pollution throughcycling equals around
300 million eurosper year
The value of the bicycle market inEurope was estimated at
13.2 billion eurosin 2016
The current levels of cycling correspondto motor vehicle fuel savings of more than
4 billion eurosper year
This list of benefits highlights the need to link cycling safety with cycling promotion and also for safety interventions to increase the number of cyclists.
There is an estimated 2.3 billion cycle tourism trips per year with a total economic value of
44 billion euros
The value of congestion easing through cycling equals around
6.8 billion eurosper year
The annual costs for the construction and maintenance of infrastructure for motorised transport that are
saved through cycling amount to
2.9 billion euros per year
Cycling prevents 18,110 premature deaths per year.This corresponds to an economic value of
52 billion eurosper year

V. EPACS (ELECTRIC POWER ASSISTED CYCLES) AS A FUTURE TREND
Electric Power Assisted Cycles (EPACs, otherwise known as Pedelecs or electric bikes) are excellent new additions to the transport system. EPACs assist the rider with a low power boost from an electric motor. They make it easier to travel longer distances, carry heavier loads, to overcome natural obstacles (such as inclines and headwinds), and offer a great alternative to company cars. They have the potential to be a valid substitute for 80% of private car use. A German survey found that EPAC users most often stated the car as their alternative means of transport, whereas other bicycle users stated most often public transport. In Sweden 47–67% of new EPAC riders had replaced a car trip26. EPAC sales are rising dramatically year on year with a sales increase of around 20% every year (about 19% of bicycles sold are EPACs). The health benefits of EPACs are similar to conventional bicycles and in some circumstances are even higher due to the increased journey times, longer distances, and age/health standards of the riders27.
The vast majority of EPACs have a 250-Watt power assisted motor that cuts out at 25 km/h. These EPACs are very similar to bicycles and are treated as bicycles in most EU Member State road codes and legislation. Initial research suggests that the risk of injury from lower powered EPACs do not differ much from the traditional bicycle28. However, we recommend additional research on the use of Electric Power Assisted Bicycles on the roads, such as how they share the roads with other road users, safety of elderly people using these bicycles and how the bicycles could be improved. It should be born in mind that these bicycles have a battery, which could be used to incorporate better safety devices and designs.
To safely tap into the potential of EPACs, careful consideration must be given to the design standards of cycling infrastructure. Geometry of cycle paths needs to be adapted to slightly higher speeds and to facilitate safe overtaking of bicycles traveling at different speeds. As EPACs are an attractive mobility option for the elderly, more attention must be given to quality of signing, horizontal markings and general readability of cycling infrastructure. Even now, many bicycle crashes are related to the visual characteristics of bicycle facilities29, and this is expected to be more acute in the ageing European society.
There are also more powerful EPACs that have a higher power (usually around 500 – 750 watts) with a cut-out speed of 45 km/h (though average journey speeds are around 30 km/h) called Speed EPACs. While lower powered bicycles are regulated through the same standardization bodies as conventional cycles30, Speed EPACs are regulated through European Type Approval along with other ‘motorised vehicles’. This is a good and clear separation that seems to have been successful in creating a stable environment for manufacturers to enter the market and should be maintained, recognising that higher-powered Speed EPACs are different and should be treated as such, requiring wider infrastructure and more mixing with motorised traffic in urban areas.
Speed EPACs are however a good addition to the vehicle fleet. They are an active, healthy and environmentally friendly mode of transport, however careful thought should be given to which infrastructure they should be allowed on. The Dutch (that have the highest number per head of population of both EPACs and Speed EPACs in Europe) allow Speed Pedelecs on some of their faster, long distance cycle routes, but do not allow them on their urban cycling infrastructure.
ROAD USER BEHAVIOURI. TYPES OF CYCLE USERS
There is no such thing as a ‘typical cyclist’. Just as with any other mode of transport, people who cycle do so for a wide variety of motivations and with a wide variety of different behaviours/preferences. Indeed a ‘cyclist’, is often also a car driver, a bus or train user, a parent or child and a commuter. Sometimes all in one day!
Perhaps the best example of this is that people in the Netherlands and Denmark wear all types of clothes while they cycle: casual clothes for students, smart clothes for commuters, sports clothes when getting ready to use a racing bike, and even dresses or party clothes when going on a night out or for dinner.
We can however identify different kinds of cyclist; people that whilst riding their bicycle have different needs and wants. These groups all need to be thought about individually for road safety as they have different needs.
26 A full list of potential for modal shift to EPACs from motorised vehicles is available here: Cairns, S., Behrendt, F., Raffo, D., Beaumont, C., & Kiefer, C. 2017, Electrically-assisted bikes: Potential impacts on travel behaviour. Transportation research part A: policy and practice, 103, 327-342, https://www.sciencedirect.com/science/article/pii/S096585641530186527 Castro, A., Gaupp-Berhausen, M., Dons, E., Standaert, A., Laeremans, M., Clark, A., ... & Nieuwenhuijsen, M. (2019). Physical activity of electric bicycle users compared to conventional bicycle users and non-cyclists: Insights based on health and transport data from an online survey in seven European cities. Transportation Research Interdisciplinary Perspectives, 100017.28 ITF presentation of ongoing research by Schepers, Klein Wolt and Fishman here: https://www.itf-oecd.org/cycling-safety-roundtablehttps://www.ncbi.nlm.nih.gov/pubmed/25238296 and German study with similar conclusions https://www.thieme-connect.de/DOI/DOI?10.1055/s-0043-12020029 See for example http://www.fietsberaad.nl/library/repository/bestanden/121107_schepers_What-do-cyclists-need-to-see-to-avoid-single-bicycle-crashes.pdf30 Requirements for the compatibility with the Machinery Directive are built into the EPAC standard EN 15194
SAFER CYCLING ADVOCATE PROGRAM - BEST PRACTICE GUIDE PAGE 10PAGE 9 SAFER CYCLING ADVOCATE PROGRAM - BEST PRACTICE GUIDE
THE DUTCH CATEGORISE CYCLISTS INTO SIX GROUPS
THE EVERYDAY CYCLIST
Someone trying toget to work or school, taking a direct route & wishing to continue cycling undisturbed, wanting to stop as
rarely as possible.
THE SPORTSCYCLIST
Someone doing cycling for sport, including mountain bikers, road racers & others. They tend to cycle in laps or for a long distance, moving very quickly, which can lead to conflict with other road users & even other cyclists!
THE RECREATIONAL CYCLIST
Someone cycling for the enjoyment of
being on their bike and with others,
stopping commonly for food, coffee or at
other attractions.
THE ATTENTIVECYCLIST
Someone who wants to be able to cycle safely, understands the traffic
rules well and also wants to follow them. They want good sign
posting, and clear intersections.
THE VULNERABLE CYCLISTSomeone who wants a traffic-safe,
peaceful cycling environment, where they are not passed by other traffic and even other faster cyclists; infrastructure must be forgiving to allow for errors. They tend to be
children, the elderly and disabled people.
THE COURIER CYCLISTSomeone who wants to get from A to B
very quickly because they cycle under time pressure. They also often require more space. They represent a range of riders, some wearing
large backpacks, others using three or fourwheel cargo bikes.

Making skid marks or catching soap bubbles helps children get used to their bikes. Nursery school children are too small to cycle alone in traffic, but they are not too small to learn how to cycle. If they become proficient at it, they will be much better at learning the rules of cycling and how to deal with traffic lights and other road users when they have to cycle in traffic at an older age31.
Though it is not mandatory, most Danish children have completed a “cycling test” in elementary school. Children in the school practice their cycling skills and get educated in safety rules and requirements for the bike. It all ends up with a practical test often with the presence of a local police officer visiting the school and teaching them about road safety and rules32. The Danish Cyclists’ Federation would strongly recommend mandating a cycling proficiency qualification for primary school children, perhaps as part of physical education lessons at school. Not only would this improve cycling safety, but would improve general road safety, as skills learnt using a bicycle are applicable to other modes of transport too. Without this, it is worth remembering that for most people, taking a driving test is the only time when the state verifies their understanding of traffic rules. This leaves a significant proportion of adults who don’t have a driving licence, as well as virtually all teenagers, without any formal training on how our roads work.
Other community members training needs The Cycling School of the Fietsersbond gives cycling lessons to all kinds of people who can use a helping hand with safe cycling, for example children, migrants and seniors. The Cycling School has been organizing 'bicycle parties' for seniors for 10 years, where they have a pleasant day and receive important information that can increase their knowledge and skills. Fietsersbond’s experience is that this allows participants to keep cycling more pleasantly, comfortably and safely. At least that's what the seniors who visited these days think: a pleasant educational day.
There is a need for cycling lessons among new Dutch citizens, especially among migrant women. Cycling increases their radius of action and thus their independence and assimilation into Dutch life. The National Bicycle Support Centre, specialist in this field, provides this part of the bicycle teacher training at Fietsersbond’s Bicycle School. Asylum seekers' centres and schools for newcomers can also rely on the ‘Fietsschool’. In addition, courses for employees of home care institutions, and to foreign employees of large companies are also provided.
The Danish Cyclists Federations also runs several programs that represent best practice in this area:
ABC (‘ALL CHILDREN BIKE’) – nation-wide school campaign with competitions, teaching
material, material for parents etc.
www.abc-abc.dk
VI KAN CYCLE!(‘WE CAN BIKE!’)
– campaign for kindergartens where Cycle Gamesare incorporated.
www.vikancykle.dk
CYCLE GAMES – for children mostly but also adults in need of (re)learning to bike – games such as ‘catch’ on the bike teaching children to control the bike before having to navigate in traffic.
www.cykelleg.dk
How to incorporate children onto the roads
In general children and roads do not safely mix. It is therefore sensibly the case that in many countries children up to a certain age are allowed to cycle on the pavement (Poland, Germany). In Denmark children under the age of 6 must be accompanied by a person at least 15 years of age and are allowed to cycle on the pavement until the age of 5. In the Netherlands however there are no special rules allowing children to cycle on the pavement, but this could be said to be representative more of the ideal provision of safe segregated cycling lanes that facilitate this. There is also a large cultural, (if not legal) tolerance of children cycling on the pavement!
II. CYCLIST EDUCATION AND TRAINING
Children and school training For young children the bicycle in the Netherlands and Denmark is an important tool, providing the means of establishing their independence and improving their confidence in dealing with the wider world. The bicycle enables connections between a wider network of friends, resources and institutions. Children in the Netherlands grow up cycling, on cycle tracks but also in mixed traffic. They learn how to handle different traffic situations on the street. In a lot of big cities is it necessary to share the road with motorized vehicles, and the advice then is to hold as right as possible, don’t make any unexpected moves and hold their speed. Don’t forget that motor vehicle drivers in the Netherlands and Denmark are also used to cyclists and their way of moving. Communication by hands, eyes and the rest of the body to the other road users can make it a lot safer and easier. Most of the schools in The Netherlands take part in Traffic Exams, with a theoretical and a practical part. Children will be informed about legislation, but also about behaviour on the public road when riding their bike. A practical exam similar to that for the motor vehicle driving license, is the final test.
In Demark traditionally, cycle training is a family matter with parents teaching children to cycle as they approach school age so they can cycle to school, visit friends and go to after school activities on their own. This is an excellent model in a society where cycling is the norm. However, the model becomes vulnerable when adults increasingly choose the car for everyday errands, when the distance between school and home is too great, or when traffic safety on school roads is poor. It is crucial that schools, day care institutions, and local authorities support children cycling, so the sole responsibility does not rest with the parents.
The Danish Cyclists' Federation recommends starting cycling training from the age of two. At that age, children can start using a running/balance bike and by training in a playful manner to master cycling in a safe place without traffic. The cycling games developed by the Danish Cyclists’ Federation offer a very enjoyable and effective form of cycle training.
years old
31 Cyklistforbundet, 2019, Bicycle Play, https://www.cyklistforbundet.dk/Boerncykler/Cykelleg,https://www.youtube.com/watch?v=DtP3cBHXE-Y32 Sikkertrafik, 2019, Cyklistprøven (5. - 6. klasse), https://www.sikkertrafik.dk/boern-unge/skole/4-6-klasse/cyklistproeven and Ruby, L., Cycling children – cycle training and traffic safety, 2019, https://cyclingsolutions.info/cycling-children-cycle-training-and-traffic-safety/
SAFER CYCLING ADVOCATE PROGRAM - BEST PRACTICE GUIDE PAGE 12PAGE 11 SAFER CYCLING ADVOCATE PROGRAM - BEST PRACTICE GUIDE

Effective cycling techniques in mixed traffic? III. DRIVERS EDUCATION
Look right on right turnAn introduction to all the typical situations demanding special attention to cyclists is included in the theoretical as well as the practical education of drivers in Denmark and laid out in the “Ordinance on the instructional plan for driving education for ordinary cars”34. Details include teaching prospective drivers: the characteristics of cyclist behaviour, steering and braking movements; how to perceive possible dangerous situations (particularly at junctions and in mixed traffic), and the nature and function of Various pieces of cyclist infrastructure infrastructure.
Danish research has also looked into the problem of right turning HGVs (trucks/lorries). Their ‘Right Turn Group’ came up with a list of recommendations to reduce HGV right turn crashes with cyclists, including recommending behavioural campaigns for drivers and cyclists, as well as looking how drivers should set up mirrors and seats to make the most of the direct and indirect vision from the cab35.
Implementing the Dutch Reach for driversThe idea of the Dutch Reach is that when a driver goes to open the door to get out of the car the door is opened with the ‘wrong hand’, the hand that is furthest from the door when sitting behind the wheel. When doing that, the driver automatically turns their body to face the rear where a cyclist may be approaching. This measure is designed to reduce incidents of ‘dooring’, where a person in a parked car does not check behind them when opening their car/motor vehicle door into the traffic stream. This is a particularly nasty hazard for cyclists, as if the door is opened at the wrong moment it can be almost unavoidable, and result in, at the least, a serious injury. We would recommend this measure be included in the list of requirements a driver is tested on when taking their driving test.
Cyclists are often taught that they should cycle as close to the kerb as possible and near to parked cars in order to allow motor vehicles more room and to be further from motor vehicles passing. This is often incorrect advice. Riding too close to the kerb can often be the most dangerous place to cycle; apart from the fact that this is where broken glass, debris, and drainage covers are to be found, there is often not adequate room for cars to pass. The cyclist should be the one to determine whether there is enough room to pass, if it is deemed that there is too little space then the centre of the road should be taken (the primary position) until it is safe for motor vehicles to pass and the cyclist can move to the right of the road (the secondary position).
Parked cars are also a hazard particularly for ‘dooring’ incidents. Dooring is when a car occupant opens the door onto a cyclist who is then pushed off the bike into traffic. Cyclists should leave space of around 1 meter between themselves and parked cars in order to avoid dooring, and road rules should not force cyclists to be as far to the right of the road as possible. This is also important for advisory bicycle lane design to make sure that there is a gap between parked cars and the lane of a car door width.
There is a system of recommending how cyclists should act in mixed traffic of many kinds. Developed by John Forester, he introduces what he calls, "the five basic principles of cycling in traffic33; This has been very much overplayed as a controversial way of dealing with cycling road safety but is still useful to take into account whether a road administration has good infrastructure or not, as even Dutch and Danish cyclists often share the road with traffic.
IV. PASSING DISTANCES
In the Netherlands and Denmark there are no rules about the minimum distance a motor vehicle must leave when passing a cyclist. This is not an ideal situation from a road safety perspective, the Fietsersbond, for example, recommends that there should be at the very least a distance of 1 meter, but preferably 1.5 meters or more, whilst some Dutch and Danish driving schools are very active regarding passing distances, teaching student drivers to keep a good distance from cyclists when passing during driving lessons, as this is considered good practice.
In Denmark there is some debate on whether passing distance legislation is effective, and the Danish police have concerns about how this can be enforced, while the high degree of cycling segregation in many Danish cities makes it less effective. It is also argued passing distances in Denmark and the Netherlands would probably be more effective in rural areas rather than urban areas.
Overall however, requiring drivers to keep an adequate distance from cyclists when overtaking should be considered a useful tool for countries with lesser amounts of segregated infrastructure, as the effectiveness of passing distances is arguably significantly greater in less optimal cycling conditions, albeit with a focus on education and training to back up the legislation. Specifically, there are many countries around the EU that have minimum passing distances of between 1 and 1.5 metres including Belgium, France, Luxembourg, Germany, Spain, Poland and Portugal36.
Position yourself appropriately at junctions when turning — near the curb when turning off the road
on the side you are travelling on, near the centre line when turning across the other side of the road, and in the centre when continuing straight on.
Ride on the road, with the direction of traffic.
Yield to crossing traffic at junctions with larger roads.
Ride in a part of the road appropriate to your speed; typically, faster traffic is near the centre line.
Yield to traffic in any lane you are moving to, or when you are moving laterally on the road.
1 4
522
33
SPEEDLIMIT
SECONDARYPOSITION
PRIMARYPOSITION
33 Forester, J., 1993, Effective Cycling, https://mitpress.mit.edu/books/effective-cycling-seventh-edition
34 Formal rules for drivers’ education in Denmark can be found here: https://www.retsinformation.dk/Forms/R0710.aspx?id=195079 (see sections 3.2.7 Cykler, 5.2.3 Vejens udstyr eller standard; Fortov og cykelsti; 7.13.3 Orienterings-færdigheder). Also relevant is this short movie explaining safety rules and behaviour in the Danish cycling culture: https://copenhagenbicycles.dk/safety/35 https://www.vejdirektoratet.dk/api/drupal/sites/default/files/2019-08/H%C3%B8jresvingsfolder-ENG.pdf-seventh-edition36 France has a passing distance of 1m on roads with ≤50km/h speed limit, and 1.5m on roads with >50km/h speed limit.
SAFER CYCLING ADVOCATE PROGRAM - BEST PRACTICE GUIDE PAGE 14PAGE 13 SAFER CYCLING ADVOCATE PROGRAM - BEST PRACTICE GUIDE

SELFISH
NICE
+1.5m
ALSO ABICYCLE RIDER
+2m
V. STRICT LIABILITY
Most EU countries have some form of “Strict Liability”, this assumes that the driver is liable for damages (not criminal guilt) if there is a crash with a pedestrian/cyclist. It avoids victim blaming and gives cyclists some additional legal defence. The argument being that the cyclist is not the party in the crash that brought a multiple tonne vehicle, powered by a several hundred horsepower engine to the incident. Strict liability also can resolve issues revolving around insurance in vehicle collisions, as it means there will always be insurance available to pay for any damages that result as part of a crash.
There are some laws that are quite weak regarding this, and some that are very strong. In France, the ‘Law Badinter’ is in place, where the driver is deemed liable for all harm caused by their vehicle without any fault, and without any defence of force majeure and with significant restrictions if the defence of contributory negligence is applied.
In the Netherlands according to Article 185 of the Dutch Road Traffic Act 1994, in a crash between a motor vehicle and a cyclist, the driver is ‘risk’ liable, as the motor vehicle is the party which brings the danger to the situation. However, drivers are not held 100% liable for all crashes with cyclists. The law draws a distinction at the age of 14 years. In a collision with a cyclist or pedestrian aged under 14, a motorist is likely to be held to be responsible. However, a cyclist or pedestrian who is older than 14 years of age is expected to know how to behave on the streets and is likely to be held at least partly responsible in the event of a crash. If they're behaving recklessly then they can instantly expect at least 50% of the blame for any collision.
Danish law states that, “Any person in charge of a power-driven vehicle shall be liable for any damage caused by such vehicle by a traffic accident. Strict liability solely covers personal injuries and is restricted to motor liability alone. Damage to property is fault-based and governed by Art. 101 (3) (non-motorised parties) and 103 (2) (motor vehicles) of the Danish Road Traffic Act:
"Damages or compensation for damage to property may be reduced or dispensed with in case of contributory intent or negligence on part of the sufferer."
"In case of damage to property in consequence of collision between power-driven vehicles, the decision whether or by which amount damages or compensation shall be paid shall be based on the circumstances in question".
Bike Law Firm Logo Icon Design - SAK Design
SAFER CYCLING ADVOCATE PROGRAM - BEST PRACTICE GUIDE PAGE 16PAGE 15 SAFER CYCLING ADVOCATE PROGRAM - BEST PRACTICE GUIDE

Proportions of effort on driver checks and cyclist checksIn the Netherlands there are a lot more checks for drivers than cyclists. For cars, there are speed checks that are active 24 hours a day, and alcohol checks happen commonly on Friday and Saturday night in urban areas. Surveillance is also something that happens commonly, so you see many police cars and police by bike all day long.
For cyclists in winter there are checks for using bike lights but checks for alcohol or defects in your bike are rare. Recently it was made illegal to use your mobile phone whilst cycling, as this is new there are quite a lot of police checks for this, although it remains an open question whether the high level of controls will continue in the next few years.
VI. ENFORCEMENT
In the Netherlands it is forbidden to stop with your car on parts of the road that are for use by other road users, like a cycling lane or cycle path. By doing this, you risk a fine of 95 euros37. There is a list of various fines for speeding depending on the speed above the limit, for being 5 km/h above the limit it is a fine of 34 euros, but for being 30 km/h or higher it is 334 euros. Offenses such as red light jumping, crossing a solid line, an overtaking violation, or using a mobile phone will all set you back 240 euros. More serious offenses such as greater speeding or driving under the strong influence of alcohol fall under criminal law.
In Denmark the situation is similar, with, for example, a fine of €69 (DKK 510) for parking on cycling infrastructure. Notably regarding this specific offence, the number of people parking illegally on segregated cycle lanes/tracks is much lower than where bicycle lanes/tracks are only painted on the road.
Proportionate penalties – are all vehicles equal?Fines in Denmark for cyclists are lower than for car drivers. They start at approximately 100 euros for cyclists and pedestrians and approximately 150 euros for others. Regulated by the Danish road traffic act §118a, fines for violation of this act are measured at 135 Euros (DKK 1,000). However, for pedestrians and cyclists, fines amount to 100 Euros (DKK 700) or more, and for persons with particularly low income for 70 euros (DKK 500) or more.
Fines for cyclists in the Netherlands are not considered comparatively high for most violations38.
For a defect on your bike (reflectors, lighting, brakes, frame) the fines are €35-€55.
For behavioural violations (riding against the traffic direction, parking in the wrong place, cycling in a bus lane) the fines are €55.
For not giving priority, cycling through a red light, cycling under the influence of alcohol, or not holding your right, the fines are between €95-150.
Since July 1st of 2019 it is forbidden to hold your phone in your hand while riding the bike; the fine is €95 reduced to €47.50 for children.
Penalties for drivers You are obliged to participate in a breath test in case of an alcohol control. If this is refused, then the police will draw up an official report. If the alcohol content in your breath higher than the 220 mg limit (or less for newer drivers) then the driver must go to the police station for a breath analysis. This breath test is accurate enough to serve as evidence in the event of a prosecution.
THE POLICE IN THE NETHERLANDS USE SOME DIFFERENT METHODS TOCONTROL THE SPEED OF CARS39
Speed cameras: driving too fast past a speed camera will result in a photograph and a fine. The cameras are smart, taking a photo of the passing car at two points along the road, sometimes also in between. The average speed between the points determine whether a fine is produced or not.
SPEED CAMERAS
These checks are performed with the help of a radar that measures whether passing cars drive faster than permitted. If this is the case, the radar sends a signal to the camera and it takes a picture of the speeding license plate. With this, the owner is traced, and the ticket is sent to their home.
RADAR CHECKS
Any police officer who drives behind a car that goes too fast can require a car to pull over without special equipment. The officer simply looks at how fast their surveillance vehicle is driving at that moment and applies a correction when drawing up an official report.
SURVEILLANCE
A laser gun measures the speed at which a car approaches the device. It does this at the speed of light and to three decimal places. A laser gun only shows how fast someone drives but does not store information about the
motorist.
LASER GUN
For drivers who have only had their license for under 5 years there are stricter limits of maximum permitted blood alcohol level 0.2 per thousand.
Police checks (alcohol/speed)
For drivers (and cyclists) who have had a driver’s license for 5 years or longer, the maximum permissible blood alcohol level is 0.5 parts per thousand (or 220 micrograms per litre of exhaled air at a blow-test).
37 Other fines for drivers can be seen here: https://www.anwb.nl/vakantie/nederland/informatie/verkeersboetes38 Fietsersbond, 2019, Fines for Cyclists https://www.fietsersbond.nl/ons-werk/wetten-en-regels/boetes-voor-fietsers/ 39 Politie NL, 2019, Speed Control, https://www.politie.nl/themas/snelheidscontroles.html
SAFER CYCLING ADVOCATE PROGRAM - BEST PRACTICE GUIDE PAGE 18PAGE 17 SAFER CYCLING ADVOCATE PROGRAM - BEST PRACTICE GUIDE
VII. ROLE OF POLICE USING BIKES
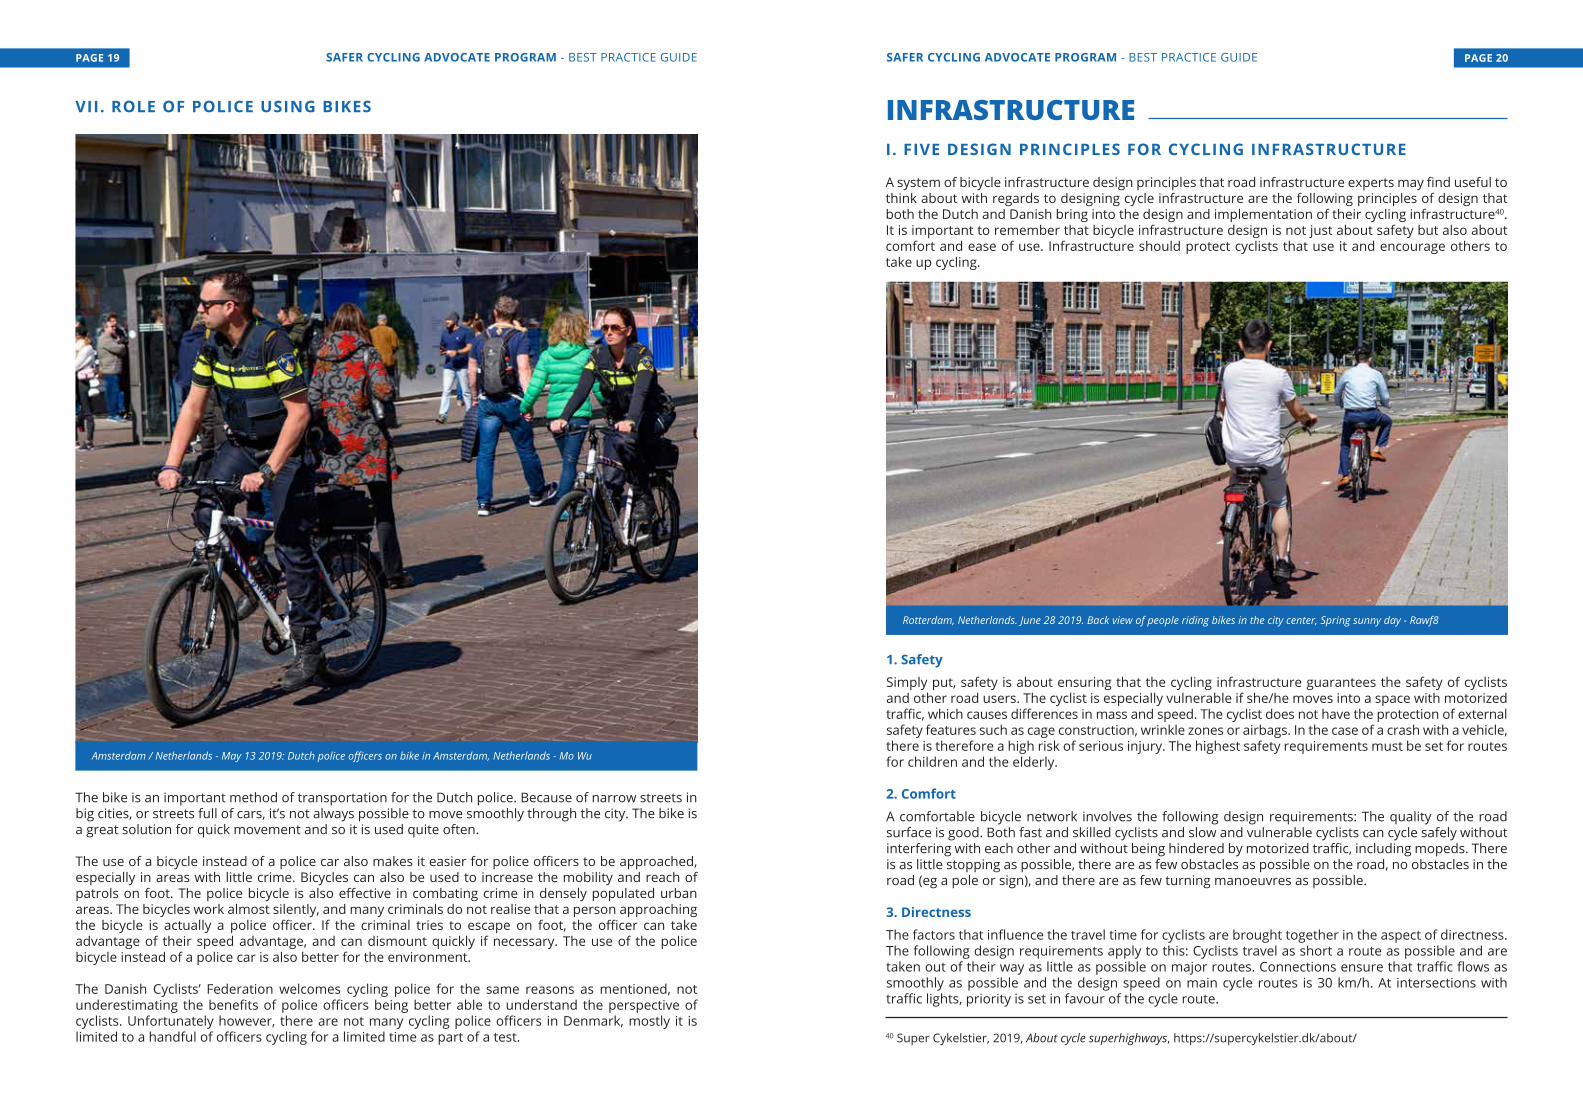
The bike is an important method of transportation for the Dutch police. Because of narrow streets in big cities, or streets full of cars, it’s not always possible to move smoothly through the city. The bike is a great solution for quick movement and so it is used quite often.
The use of a bicycle instead of a police car also makes it easier for police officers to be approached, especially in areas with little crime. Bicycles can also be used to increase the mobility and reach of patrols on foot. The police bicycle is also effective in combating crime in densely populated urban areas. The bicycles work almost silently, and many criminals do not realise that a person approaching the bicycle is actually a police officer. If the criminal tries to escape on foot, the officer can take advantage of their speed advantage, and can dismount quickly if necessary. The use of the police bicycle instead of a police car is also better for the environment.
The Danish Cyclists’ Federation welcomes cycling police for the same reasons as mentioned, not underestimating the benefits of police officers being better able to understand the perspective of cyclists. Unfortunately however, there are not many cycling police officers in Denmark, mostly it is limited to a handful of officers cycling for a limited time as part of a test.
1. SafetySimply put, safety is about ensuring that the cycling infrastructure guarantees the safety of cyclists and other road users. The cyclist is especially vulnerable if she/he moves into a space with motorized traffic, which causes differences in mass and speed. The cyclist does not have the protection of external safety features such as cage construction, wrinkle zones or airbags. In the case of a crash with a vehicle, there is therefore a high risk of serious injury. The highest safety requirements must be set for routes for children and the elderly.
2. ComfortA comfortable bicycle network involves the following design requirements: The quality of the road surface is good. Both fast and skilled cyclists and slow and vulnerable cyclists can cycle safely without interfering with each other and without being hindered by motorized traffic, including mopeds. There is as little stopping as possible, there are as few obstacles as possible on the road, no obstacles in the road (eg a pole or sign), and there are as few turning manoeuvres as possible.
3. DirectnessThe factors that influence the travel time for cyclists are brought together in the aspect of directness. The following design requirements apply to this: Cyclists travel as short a route as possible and are taken out of their way as little as possible on major routes. Connections ensure that traffic flows as smoothly as possible and the design speed on main cycle routes is 30 km/h. At intersections with traffic lights, priority is set in favour of the cycle route.
INFRASTRUCTUREI. FIVE DESIGN PRINCIPLES FOR CYCLING INFRASTRUCTURE
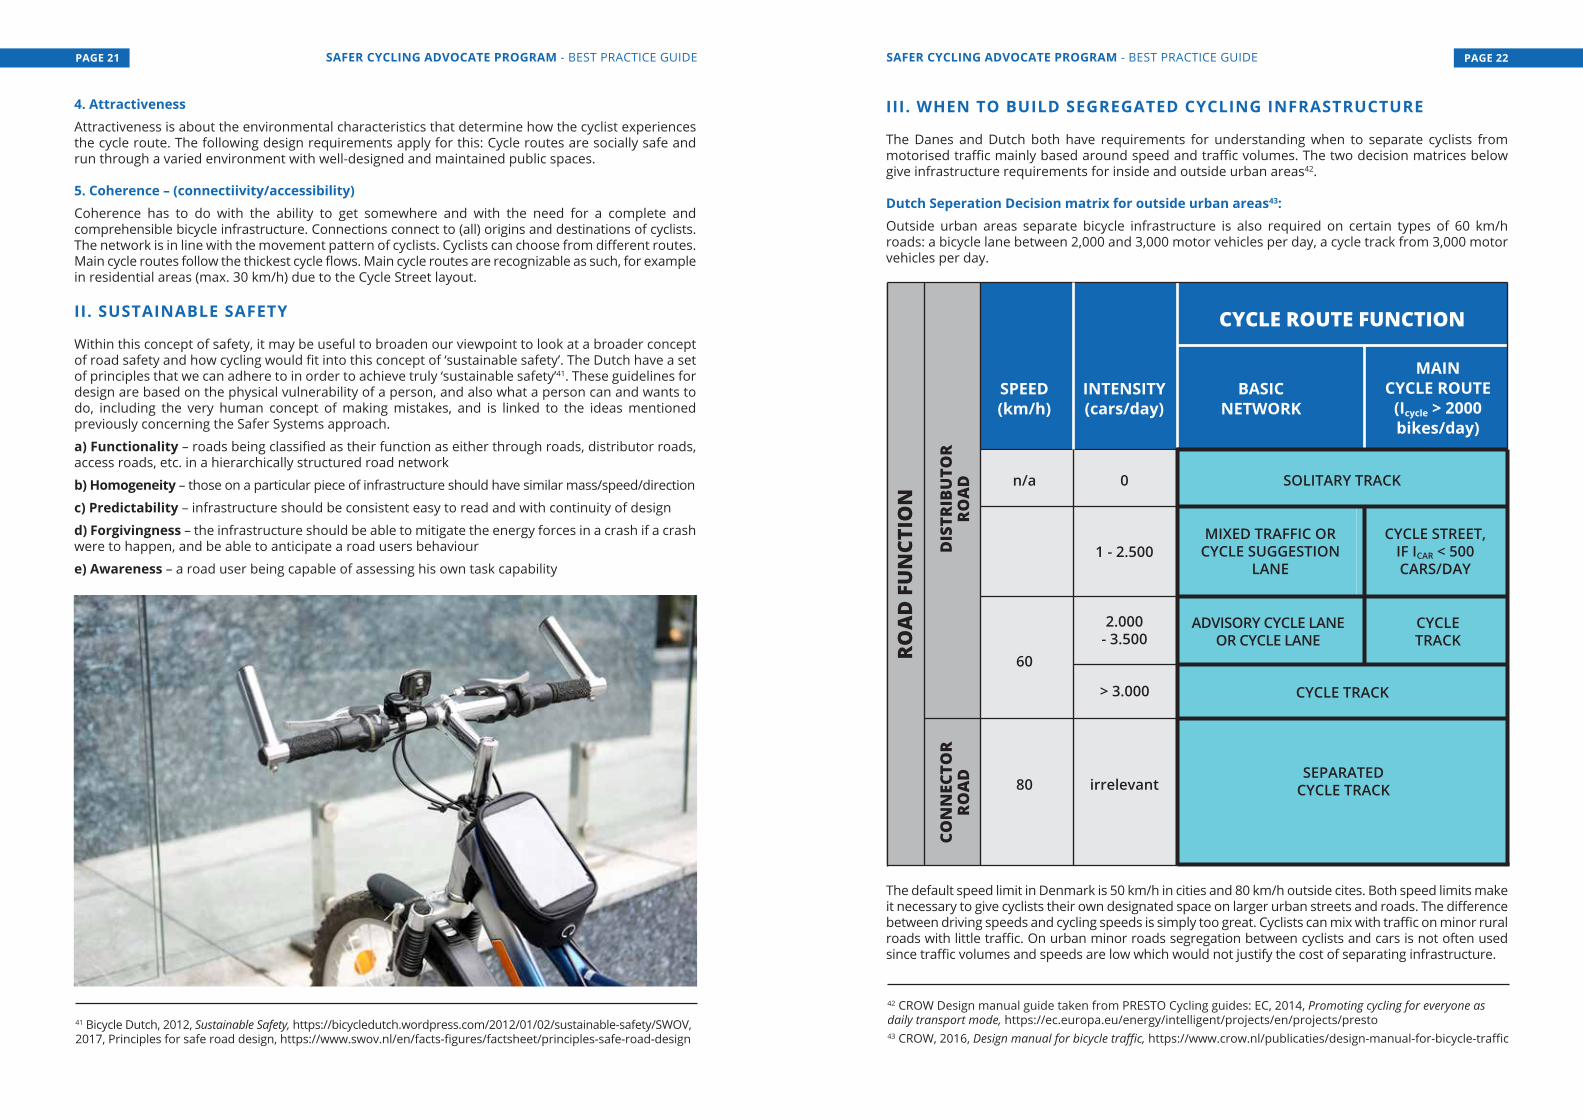
A system of bicycle infrastructure design principles that road infrastructure experts may find useful to think about with regards to designing cycle infrastructure are the following principles of design that both the Dutch and Danish bring into the design and implementation of their cycling infrastructure40. It is important to remember that bicycle infrastructure design is not just about safety but also about comfort and ease of use. Infrastructure should protect cyclists that use it and encourage others to take up cycling.
Amsterdam / Netherlands - May 13 2019: Dutch police officers on bike in Amsterdam, Netherlands - Mo Wu
Rotterdam, Netherlands. June 28 2019. Back view of people riding bikes in the city center, Spring sunny day - Rawf8
40 Super Cykelstier, 2019, About cycle superhighways, https://supercykelstier.dk/about/
SAFER CYCLING ADVOCATE PROGRAM - BEST PRACTICE GUIDE PAGE 20PAGE 19 SAFER CYCLING ADVOCATE PROGRAM - BEST PRACTICE GUIDE
4. AttractivenessAttractiveness is about the environmental characteristics that determine how the cyclist experiences the cycle route. The following design requirements apply for this: Cycle routes are socially safe and run through a varied environment with well-designed and maintained public spaces.
5. Coherence – (connectiivity/accessibility)Coherence has to do with the ability to get somewhere and with the need for a complete and comprehensible bicycle infrastructure. Connections connect to (all) origins and destinations of cyclists. The network is in line with the movement pattern of cyclists. Cyclists can choose from different routes. Main cycle routes follow the thickest cycle flows. Main cycle routes are recognizable as such, for example in residential areas (max. 30 km/h) due to the Cycle Street layout.
II. SUSTAINABLE SAFETY
Within this concept of safety, it may be useful to broaden our viewpoint to look at a broader concept of road safety and how cycling would fit into this concept of ‘sustainable safety’. The Dutch have a set of principles that we can adhere to in order to achieve truly ‘sustainable safety’41. These guidelines for design are based on the physical vulnerability of a person, and also what a person can and wants to do, including the very human concept of making mistakes, and is linked to the ideas mentioned previously concerning the Safer Systems approach.
a) Functionality – roads being classified as their function as either through roads, distributor roads, access roads, etc. in a hierarchically structured road network
b) Homogeneity – those on a particular piece of infrastructure should have similar mass/speed/direction
c) Predictability – infrastructure should be consistent easy to read and with continuity of design
d) Forgivingness – the infrastructure should be able to mitigate the energy forces in a crash if a crash were to happen, and be able to anticipate a road users behaviour
e) Awareness – a road user being capable of assessing his own task capability
III. WHEN TO BUILD SEGREGATED CYCLING INFRASTRUCTURE
The Danes and Dutch both have requirements for understanding when to separate cyclists from motorised traffic mainly based around speed and traffic volumes. The two decision matrices below give infrastructure requirements for inside and outside urban areas42.
Dutch Seperation Decision matrix for outside urban areas43:Outside urban areas separate bicycle infrastructure is also required on certain types of 60 km/h roads: a bicycle lane between 2,000 and 3,000 motor vehicles per day, a cycle track from 3,000 motor vehicles per day.
CYCLE ROUTE FUNCTION
SPEED(km/h)
DIS
TRIB
UTO
RRO
AD
CON
NEC
TOR
ROA
D
ROA
D F
UN
CTIO
N
BASICNETWORK
MAINCYCLE ROUTE
(Icycle > 2000bikes/day)
INTENSITY(cars/day)
MIXED TRAFFIC ORCYCLE SUGGESTION
LANE
CYCLE STREET,IF ICAR < 500CARS/DAY
CYCLETRACK
SOLITARY TRACK
CYCLE TRACK
SEPARATEDCYCLE TRACKirrelevant
> 3.000
2.000- 3.500
1 - 2.500
0n/a
60
80
ADVISORY CYCLE LANEOR CYCLE LANE
The default speed limit in Denmark is 50 km/h in cities and 80 km/h outside cites. Both speed limits make it necessary to give cyclists their own designated space on larger urban streets and roads. The difference between driving speeds and cycling speeds is simply too great. Cyclists can mix with traffic on minor rural roads with little traffic. On urban minor roads segregation between cyclists and cars is not often used since traffic volumes and speeds are low which would not justify the cost of separating infrastructure.
41 Bicycle Dutch, 2012, Sustainable Safety, https://bicycledutch.wordpress.com/2012/01/02/sustainable-safety/SWOV,2017, Principles for safe road design, https://www.swov.nl/en/facts-figures/factsheet/principles-safe-road-design
42 CROW Design manual guide taken from PRESTO Cycling guides: EC, 2014, Promoting cycling for everyone as daily transport mode, https://ec.europa.eu/energy/intelligent/projects/en/projects/presto43 CROW, 2016, Design manual for bicycle traffic, https://www.crow.nl/publicaties/design-manual-for-bicycle-traffic
SAFER CYCLING ADVOCATE PROGRAM - BEST PRACTICE GUIDE PAGE 22PAGE 21 SAFER CYCLING ADVOCATE PROGRAM - BEST PRACTICE GUIDE

IV. CYCLING INFRASTRUCTURE DESIGN
Surface and MaterialsIt is important that the correct choice of materials is made for bicycle infrastructure to ensure safety and comfort. Asphalt is the most commonly used material45; it is a smooth surface and easily manipulated and repaired, it lasts around 15-20 years and is relatively cheap. On long distance recreational routes outside the city, gravel (such as Rock Dust for example) can be used which is often cheaper, though can be more expensive to keep in good condition.
Using paved paving block types of surfaces should be avoided as they very often become uneven over time and provide an uncomfortable riding surface. They can be used to focus the cyclist’s attention when cycling with or near pedestrians but should be avoided for dedicated cycling routes.
Colouring and choice of surface can be a useful way of showing the cyclist which way to go and which infrastructure to use. The eyesight of the cyclist is often downwards so the infrastructure itself can provide information to the cyclist. Red is common in the Netherlands, and blue is the most prevalent in Denmark.
Cycle tracks should be constructed with an even surface with enough friction to allow cycling without slipping. They should also be able to withstand pressure from heavier motor vehicles that (often illegally!) use them. It’s a good idea for the roadbed to continue underneath the cycle track along roads with no verge.
Curves and turnsIt is important to remember that cyclists don’t make sharp 90 degree turns! Curves should accommodate the natural turning circle of a cyclist with smooth 90 degrees turns.
CYCLE ROUTE FUNCTION
SPEED(km/h)
LOCA
L A
CCES
S RO
AD
DIS
TRIB
UTO
R RO
AD
FUN
CTIO
N T
RAFF
IC R
OA
D
BASICNETWORK
MAIN CYCLEROUTE
INTENSITY(cars/day)
MIXED TRAFFIC(WITH OR WITHOUT
ADVISORY CYCLE LANE)
CYCLESTREET
ORCYCLE LANE(WITH RIGHT
OF WAY)
SOLITARY TRACK
CYCLE TRACK ORCYCLE LANE
CYCLE TRACK(ADJACENT OR SEPARATED)
Notapplicable
> 4.000
2.000 - 5.000
1 - 2.500
0Notapplicable
Walking space or30 km/h
50km/h
70km/h
2x1lanes
2x2lanes
(Ibicycle
> 2000/day)(Ibicycle
< 750/day)(Ibicycle
500 - 2500/day)
The default speed limit in Denmark is 50 km/h in cities and 80 km/h outside cites. Both speed limits make it necessary to give cyclists their own designated space on larger urban streets and roads. The difference between driving speeds and cycling speeds is simply too great. However, cyclists can mix with traffic on minor rural roads with little traffic. On urban minor roads segregation between cyclists and cars is not often used since traffic volumes and speeds are low which would not justify the cost of separating infrastructure.
The lesson from both countries for separating in both Denmark and Netherlands seems to be that separation is necessary when speeds are high (50 km/h or higher) and where there is high motor vehicle traffic volume. Distributor roads and major, direct roads should have full separation, while minor roads would not require full separation as long as speeds and volume are low and there is good roadside visibility.
The cyclist should be able to complete the curve at the appropriate design speed46, the Dutch give a minimum curve radius of 20 metres for a 30 km/h max design speed infrastructure. It is important to allow as much curve radius as the space allows, and essential to be at least equal to the minimum radius for a particular design speed.
Decision matrix for inside urban areas:Separate infrastructure for bicycles is always required on a 50 km/h road (cycle lane or cycle track) or 70 km/h road (cycle track)44. A bicycle lane is also required on certain types of 30 km/h streets or roads, and a lane or track where there is a lot of short-term parking and/or more than 4,000 motor vehicles per day. Additionally, a bus line can add to the need.
Aleksander Buczynski, ECF
45 CED, 2019, Materials, construction, and aesthetics, https://cyclingsolutions.info/materials-construction-and-aesthetics 46 Design speed defines how fast cyclists can travel along the route section without endangering their safety and defines the geometric requirements for the route or its sections.
44 For the different names of cycle paths/lanes we apply a general rule of thumb. A cycle track has physical separation and cycle lane has no physical separation. A useful glossary of English language cycling infrastructure terms can be found on the Irish national transport authority’s cycling guidelines https://www.cyclemanual.ie/glossary/. This is also quite a good manual to providing good facilities for cycling in general and makes use of many good principles.
SAFER CYCLING ADVOCATE PROGRAM - BEST PRACTICE GUIDE PAGE 24PAGE 23 SAFER CYCLING ADVOCATE PROGRAM - BEST PRACTICE GUIDE

Visibility
It is essential that there is clear visibility at conflict points (points where cyclists come into contact with other road users) particularly at junctions with motor vehicles, and when cyclist infrastructure comes into contact with motor traffic infrastructure.
WidthFor the Danish Cyclist Federation, the recommended width for one-way cycle tracks segregated from the main road should be 2.2m in both urban and rural areas ; with a width of 1.7m (minimum of 1.5m) when a cycle track is part of a shared-use path. A cycle track width of 2.2m makes it possible for cyclists to overtake safely, since cycling speeds vary greatly. Overtaking is very common among cyclists, indeed when there are large numbers of cyclists it may be necessary to create space for three cyclists to cycle abreast, with a minimum width of 2.8m, preferably 3m47. It should also be noted that width is normally related to the maximum legal width of bicycles in different countries.
Designers also must take obstacles into account; cyclists will want to keep their distance from kerbs, edges and walls. The Dutch design manual CROW48 indicates the following obstacle distances for green verges and low kerbstones, the obstacle distance is 0.25m; for higher kerbstones 0.50m, for closed walls 0.625m.
The busiest bike lane in the world on Queen Louise’s Bridge in Copenhagen has 3,5m wide unidirectional curb-protected bike lanes. 4-5 people are able to ride abreast here.
Lighting and horizontal markingsThe main functions of lighting by the roadside are:
Making the environment visibleIncreasing cycling comfortImproving social safety (security) and alertness on unsafe situationsImproving contrast between road and roadside
Depending on the number of cyclists, main routes should be provided with good lighting. For good environmental (and fiscal) benefits, lights should be motion sensitive and turn on and off depending on whether a cyclist is passing. For the basic network, the usual street lighting is sufficient, in combination with clear marking on the road. Because recreational cycling journeys are made mainly in daylight, recreational cycling routes are not usually provided with lighting, only when it is necessary for social safety (again with eco-friendly lighting).
The current CROW guidelines for affixing road markings to cycle tracks includes the application of a 0.3 - 2.7 mark (after each 30 cm block of marking there is a gap of 270 cm) on two-way cycle tracks, with the aim of guiding oncoming bicycle traffic into lanes. The CROW guidelines also pay attention to sharp turns, where a solid line can be applied in the middle of a two-way cycle track.
Design speed is also important in understanding the visibility requirements at crossings, junctions or turns. A comfortable sight distance of the surface of the infrastructure is considered equivalent to 8-10 seconds of cycling at the design speed (e.g. 70-80 metres at 30 km/h), bare minimum is 4-5 seconds (35-40 metres).
Design speed affects visibility requirements at crossings. Drivers yielding to bicycles should be able to see them from a distance that gives them enough time to react and decide. The requirements are usually expressed in terms of visibility splay – there should be no obstacles within the triangles as the driver/cyclist will be out of view while approaching the junction.
More details on the CHIPS project website https://cyclehighways.eu/design-and-build/design-principles/design-speed.html
L2
L1
Aleksander Buczynski, ECF
Aleksander Buczynski, ECF
47 CED, 2012, Collection of Cycle Concepts, https://bicycleinfrastructuremanuals.com/manuals1/Collection-of-Cycle-Concepts-2012_Denmark.pdf48 CROW, 2016, Design manual for bicycle traffic, https://www.crow.nl/publicaties/design-manual-for-bicycle-traffic
SAFER CYCLING ADVOCATE PROGRAM - BEST PRACTICE GUIDE PAGE 26PAGE 25 SAFER CYCLING ADVOCATE PROGRAM - BEST PRACTICE GUIDE

Commissioned by the province of Utrecht, the traffic advice agency, Loendersloot Groep and the traffic psychology advice agency, research by KeuzeWeg was carried out into the design of road markings on fast bike routes49. This resulted in a design with a continuous edge marking, a double middle marking and a blue line that is used at intersections for the recognition of a two-way cycle track (for crossing traffic) and wayfinding (for cyclists on the fast cycle route). The colour blue was deliberately chosen, because for colour-blind people it is sufficiently distinctive from a red, grey or black background. The material used is light-reflective (so that cyclists also have a good view of the direction of the road in the dark); tactile (making people aware of the approaching edge of the pavement); just as rough as the pavement (so that in wet weather no risk of slipping); and thin (so it is easy to drive over with overtaking).
Evaluation has shown that this new set of road markings has contributed to bicycle safety. Commuters (the primary target group of fast bike routes) and the elderly find it especially useful.
V. LIGHT INFRASTRUCTURE
It is worth mentioning in this section the possible role and use of ‘light infrastructure’. It is less common in the Netherlands and Denmark, but can be a useful stopgap measure, which is both cheap and quick to implement and can provide a good level of safety and comfort. The idea is to use small physical objects (poles, plants, or other objects, oftennamed Hedgehogs, or Armadillos and other various animal names!) which are quickly screwed/bolted onto the road surface to create a semi-physical separation between motorised traffic and cyclists.
The costs of this type of infrastructure are around 10% the cost of more permanent physical separation50. Another benefit is that the infrastructure can be re-positioned, set-up, taken down, and generally moved around to explore the best possibilities, or if road maintenance is to be carried out, all at minimal cost.
One of the major benefits of this type of infrastructure is the ability to create very dense and connected networks that are safe and also give some form of subjective safety.
Some words of warning about the implementation of these types of infrastructure:A legal check should be made as to the legal status of these infrastructure, they are not really street furniture, nor, road signs, nor markings and may not be covered by national or local legislation. They can sometimes be a trip hazard for pedestrians, and some motorcycle organisations have claimed that they could create a danger for motorbikes.The lanes themselves must be fit for purpose in terms of widths and hours of operation, and it would be particularly useful to have some regulations and national design standards for public authorities to implement, to make sure that these measures are in keeping with standard safety and planning considerations.Parking violations within the lanes/tracks must be enforced.
Whilst not as good as the use of full separation, light infrastructure canbe a useful transitionary step towards full separation. A useful guide on how and when to implement light separation measures, including many references, can be found in this Discussion Paper for the International Transport Forum on Light Segregation: https://www.itf-oecd.org/light-protection-cycle-lanes-best-practices.
VI. JUNCTIONS AND CROSSINGS
Here we will take a look at how the Dutch and Danes deal with right turns and straight ahead manoeuvres when coming to junctions (left turns are dealt with under the priority section). It does not matter how safe, segregated or wonderfully protected cycling infrastructure is if junctions where cyclists mix with motor vehicles are dangerous. To avoid crashes, it is important that there is clear uniformity in all crossings and that they are relatively self-explanatory. This enhances predictability amongst road users; so they know what to expect at each junction.
Dutch crossing and junctionsCrossing without traffic lights priority - Here the red cyclist and black car have priority, clearly marked
on the road and the signs alongside the road.
Google Maps
49 Mariëtte Pol, Berend Jan Bel en Maurice Veltrop, (2017), Verbeterde wegmarkering enbewegwijzering op snelfietsroutes, http://www.keuzeweg.nl/Intro/Doorfietsroutes__Nieuwe_markering_beproefd_files/Verbeterde%20wegmarkering%20en%20bewegwijzering%20Snelfietsroutes_Prov%20Utrecht_KeuzeWeg.pdf 50 Brian Deegan Discussion Paper for ITF https://www.itf-oecd.org/light-protection-cycle-lanes-best-practices
SAFER CYCLING ADVOCATE PROGRAM - BEST PRACTICE GUIDE PAGE 28PAGE 27 SAFER CYCLING ADVOCATE PROGRAM - BEST PRACTICE GUIDE

Danish crossings and junctionsIn Denmark there are three types of crossings for cyclists at traffic lights51. All these designs allow large numbers of cyclists to queue at lights. The general rule of giving way to vehicles on the right is always practised.
Shortened cycle tracks – Here the length of the waiting area is increased to accommodate cyclists. As the cycle lane finishes cyclists merge with cars in a shared bicycle/car lane.
Drawn cycle tracks – Here the box in front of the motor traffic is empty so that a large waiting area brings cyclists ahead of the motor traffic the cycle lane is ahead of the motor traffic lanes allowing cyclists a head start.
Crossing with traffic lights – Advanced Stop Line/Bike Boxes can be used for cyclists to come to the front of the junction so that they can start first when the lights change and are clearly visible to car drivers.
Below picture is a birdseye Google Maps view of a crossing in the Netherlands. Notice the jagged priority marks and the nice smooth bending for cyclists onto the junction. With regards to visibility it is important that there is good visibility for cyclists/drivers at 15 metres before the crossing and no visibility-inhibiting elements on the road or roadside. If there are visibility issues, then there needs to be a ‘stop-sign’ and warning markings on the road. Approaching the junction, the cyclist is often raised as he/she passes over it adding extra security and visibility.
Aleksander Buczynski, ECF
51 Celis, 2012, Håndbog i cykeltrafik, http://www.celis.dk/Haandbog_i_Cykeltrafik_Web_High.pdf
SAFER CYCLING ADVOCATE PROGRAM - BEST PRACTICE GUIDE PAGE 30PAGE 29 SAFER CYCLING ADVOCATE PROGRAM - BEST PRACTICE GUIDE

Cycle Shunts - There is also the so-called “cycles hunts”. Here the cycle track (for right turns) is totally separated from the crossing.
When crossiing straigh over crossroads in Denmark cyclists maintain a straight line across the junction as indicated by the blue cycle lane (See below)
RoundaboutsRoundabouts are a common feature of Dutch roads (less so in Denmark). Though of course the Netherlands has other crossings the roundabout is viewed in the Netherlands as a safe type of crossing. This may seem a bit strange to those in other countries where roundabouts can bring cyclists out in a cold sweat! However they are a convenient way to keep traffic moving and if built right are safe to use.
For smaller roundabouts the Dutch often continue a cycle lane onto the roundabout and have it circle along with the other traffic (such as the picture to the right) however, though this seems to be safe in the Netherlands, there is evidence currently that cycle lanes around smaller roundabouts are not so safe in other countries52.
Evidence from Belgium and Germany seems to suggest that it is better not to continue cycle lanes from the road and onto the roundabout53.
Rather it is better to bring cyclists and vehicles together into a narrow lane as they approach the roundabout in order to have them before or after each other rather than approaching parallel to each other and not to have two lanes on exit or on the entrance and risking side swipes and right hook crashes on exiting/entering (Such as the German example left).
To the left is a typical Dutch cycle roundabout. The cyclists are set 5 metres back from the roundabout, are routed around of the road for motor vehicles and cross each arm separately, whilst often being given priority at each crossing. The Fietsersbond is against roundabouts where cyclists have to cross two lanes of the car exit lanes (though these do exist) and advocates priority for cyclists at roundabouts.
In Denmark there are fewer roundabouts, commonly using a wider variety of designs, depending on whether they are rural or urban roundabouts. In rural areas cyclists tend to be segregated, while cyclists are often kept mixed on roundabouts in urban areas.
Aleksander Buczynski, ECF
Aleksander Buczynski, ECF
Goudappel Coffeng
52 Cerema, (2014), Vélo et giratoires, https://www.au5v.fr/IMG/pdf/cerema_fiche10v-velo_et_giratoires.pdf, AND,Benoît Dupriez, Miguel Vertriest, (2009), Aménagements cyclables en giratoires, https://mobilite-mobiliteit.brussels/sites/default/files/vm-4-amenagements-cyclables-giratoires-web.pdf53 Ir. A. Dijkstra, (2004), Rotondes met vrijliggende fietspaden ook veilig voor fietsers?, https://www.swov.nl/sites/default/files/publicaties/rapport/r-2004-14.pdf
SAFER CYCLING ADVOCATE PROGRAM - BEST PRACTICE GUIDEPAGE 31

VII. HOW TO ORGANIZE PRIORITY
In the Netherlands, there are several ways to organize priority on the roads, although there are several general rules, shared with many other countries, that apply54:
1. Traffic from the right has the priority on a crossing. This applies also to cyclists, but not for pedestrians. 2. Drivers on unpaved roads need to give priority to drivers on paved roads. 3. On leaving an exit, priority is given to all other traffic, including pedestrians.4. Cyclists should obey all road signs that apply to them even if these would contradict with these general rules.
At priority crossings there is block marking, and for crossings with no priority bar marking, in both cases ‘sharks teeth’ marking also indicates priority (yield when approaching). There should also be provision for a central island of at least 2.3 metres, though preferably 3.5 metres or more.
Organising left turns in mixed traffic56
This can be a particularly perilous manoeuvre for cyclists moving across a lane (or even two) of motor traffic in order to execute a left turn. In the Netherlands, when turning to the left in mixed traffic as a cyclist, there will often be on larger roads on-the-road markings guiding how to make a left turn, composed of a compartment in front of the row of cars.
A useful concept of organising cyclist (and pedestrian) priority is through a continuous pavement/sidewalk and cycle track. It is used quite often in the Netherlands and (less so) in Denmark to very good effect. Here the pavement/sidewalk and cycle track continues alongside the bigger road, crossing the end of a smaller road without interruption. Cars approaching the larger road wait behind the cycle track until all clear and then move over it.
LEFT47: Cyclist lane with priority using block markings.
RIGHT: Cyclist lane without priority using only bar markings alongside the lane.
In Denmark, before the intersection, the cyclist who intends to make a left turn, keeps to the right of the road until cycling almost past the intersection. Then he/she waits at the corner of the intersection at a place specifically signed for the cyclist until the intersection is clear. At busy intersections one might have to wait until the traffic lights turn (or until the traffic is clear if no lights) and then the left turn is carried out; a two-step process57.
Here, the cyclist passes the intersection pedestrian crossing and would wait in the section just before the second pedestrian crossing. This kind of ‘Hook turn’ is sometimes used in the Netherlands.
MAINSTOPPINGAREA
LEFT TURNWAITINGAREA
BIKE LANEBECOME FLUSHAT INTERSECTION
The road markings below more clearly display the type of road markings in the highlighted box on the previous page.
54 Though it should be remembered that signs and road information trumps general rules!55 CROW, 2014, Bebakening en markering van fietsoversteken: hoe zit het?,https://www.crow.nl/blog/april-2014/bebakening-en-markering-van-fietsoversteken-hoe-zi56 This section assumes that traffic moves on the right-hand side of the road. Change for left side countries like UK, Ireland, Malta, Cyprus etc. 57 Danish road traffic act, chapter 7, 49,https://www.retsinformation.dk/Forms/R0710.aspx?id=204976
SAFER CYCLING ADVOCATE PROGRAM - BEST PRACTICE GUIDE PAGE 34PAGE 33 SAFER CYCLING ADVOCATE PROGRAM - BEST PRACTICE GUIDE

VIII. TWO WAY CYCLING ON ONE-WAY STREET
Contra-flow cycling is when cyclists are allowed to ride against the motorised traffic flow of one-way streets. This is a simple regulatory measure and highly attractive for cyclists. It creates shortcuts away from busier traffic. It has proven to be safe, even in the narrowest streets, when speeds are low and traffic quiet. Contra-flow cycling should be generalised city-wide: this way, it becomes a normal situation for all and cyclists can benefit most. Although at first this may feel risky, the evidence suggests that roads allowing contraflow cycling are at worst no more dangerous than normal roads, and at best even safer58.
Contraflow cycling can make cycling more comfortable, significantly improve the density of the cycling network, and provide quicker direct routes. Most small one-way roads in the Netherlands and many roads in Denmark are available for cyclists to use in both directions. Word of warning; it crucial there is enough space, and that the infrastructure has been thought through, as well as there being sufficient signage to warn all road users. Contra-flow cycling works best when drivers know to expect cyclists coming the opposite way. Good signage can also reduce the number of ‘dooring’ crashes (when the driver opens the door onto a cyclist and knocks them into the road or off their bike).
In Denmark cyclists can turn right when it is red for other road users, but only if there is a special sign indicating this. The police need to approve the sign in each location.
undtaget
In the Netherlands Right turn on red is allowed byplacing a "turn right" sign under the traffic light or by placing an illuminated sign. The illuminated sign is readable only when a lamp comes on. However, the Fietsersbond is of the opinion that a right turn through red should always be allowed. It is almost always possible without risk, and anyone who would like cyclists to better adhere to traffic rules, can better legalise situations in which it is very tempting to drive through red.
Right turn on redThough many European countries allow cyclists a right turn on red it is as part of a general rule for all traffic. However France and Belgium are now taking up the option of cyclists to make right turns on a red light when indicated by a special sign. Pedestrians are given priority and sometimes a full stop is needed before turning. It is a useful way to reduce queues of cyclists at the lights, and to allow uninterrupted journeys. Though it is important that pedestrians are prioritised and may not be a great idea where there is heavy pedestrian traffic.
Aleksander Buczynski, ECF
Aleksander Buczynski, ECF
58 ETSC, 2018, Briefing Contraflow Cycling, https://etsc.eu/wp-content/uploads/Briefing-Contraflow-Cycling.pdf
SAFER CYCLING ADVOCATE PROGRAM - BEST PRACTICE GUIDE PAGE 36PAGE 35 SAFER CYCLING ADVOCATE PROGRAM - BEST PRACTICE GUIDE

IX. BUSLANE SHARING
In some countries allowing cyclists to use bus lanes is often used to provide cyclists with more space and is particularly prevalent in many EU countries, where the majority of bus lanes are shared with cyclists. Mixing the largest and the smallest vehicles on the road does not seem to be a particularly safe or comfortable option and there is often much tension between cyclists and bus drivers59.
In Denmark cyclists and buses do not share the roads and there are some additional rules for cyclists to follow here. When Cycling infrastructure interacts with bus stops cyclists have to stop behind the bus until the bus doors have closed again. Bus passengers who cross the cycle path when boarding and alighting have priority, unless there is a bus island, which is becoming more and more common
X. 30 KM/H ROADS AS DEFAULT IN URBAN AREAS
Unfortunately, the practice in the Netherlands is still to have a default of 50 km/h. Fietsersbond would recommend making 30 km/h the standard in urban areas with other busier, faster roads opting out and remaining at 50. There should be careful assessment of whether a road remains at 50km/h or can be reduced, it is necessary to make sure the traffic allows for it as it might be dangerous to simply place a 30 km/h sign over all current 50 km/h roads. Therefore though 30 km/h should be the go-to default option other roads can of course have increased speed limits if required, so each road must be assessed individually. To make the most impact, 30km/h zones should be in places which provide more support and a better quality of life for the people who live in the zone.
In Denmark the situation is very similar, as the default speed limit in Denmark is 50 km/h in cities and 80 km/h outside cites. Speed limits of 30 km/h (or less) are only possible in urban areas, in residential or play areas and on roads with traffic calming measures suitable for low speed limits. Moreover, the speed limit can be set at 30 km/h or less, when special road conditions with particularly poor overview, narrow curves or narrow lanes make it necessary for pedestrians or cyclists60. In practice, many municipalities find it hard to implement 30 km/h as the speed limit, as traffic calming measures can be expensive (even if the long term cost-benefit ratio is very favourable). In some new urban development areas, zones of 30-40 km/h are being put into place. The Danish Cyclists’ Federation for example recommends that the Danish parliament make it easier for local authorities to reduce the speed limit in urban areas with many pedestrians and cyclists, particularly by providing funds.
The European Network for 30 km/h campaign has a list of those cities that have implemented a default 30 km/h or introduced a large number of 30 km/h roads61, and also detailed many of the proven benefits that the reduction of speed has brought about62. The European Union has recently updated its safety type approval legislation to require that all new motor vehicles for sale in the EU must have an Intelligent Speed Assistance system from 202263. This system assists the driver to keep to the speed limit and will help reduce the costs of public authorities in reducing speeds.
In countries with good cycling levels and infrastructure (like the Netherlands and Denmark) Bus lane sharing is not seen as a safe or comfortable option. This however could be seen to say more about the relative attitudes to cycling in different countries and the resources that are spent on cycling infrastructure. In countries with less cyclists, not allowing cyclists in the bus lane means they would have to use the middle lane, resulting in being overtaken on the left by private cars and on the right by busses. Therefore, even if not perfectly safe in the interim, mixing buses and cyclists would often be preferable to banning them from the kerbside lane.
Robert Weetman
59 CEGB, 2004, TRL610 Cycling in Bus Lanes, https://www.cycling-embassy.org.uk/document/trl610-cycling-in-bus-lanes
60 Danish road traffic act, 2017, Order on local speed limits, https://www.retsinformation.dk/Forms/R0710.aspx?id=19660061 30km/h, 2015, Trendsetter cities for a 20mph speed limit, http://en.30kmh.eu/files/2015/11/30-kmh-TRENDSETTER-CITIES.pdf62 30km/h, 2015, How road safety in European cities is increasing, thanks to 30 km/h (20mph), http://en.30kmh.eu/2015/12/07/how-road-safety-in-european-cities-is-increasing-thanks-to-30-kmh-20mph/63 Woolsgrove, C., 2019, EU Mandatory vehicle regulations pave the way for great leap in cycling safety, https://ecf.com/news-and-events/news/eu-mandatory-vehicle-regulations-pave-way-great-leap-cycling-safety
SAFER CYCLING ADVOCATE PROGRAM - BEST PRACTICE GUIDE PAGE 38PAGE 37 SAFER CYCLING ADVOCATE PROGRAM - BEST PRACTICE GUIDE

XII. CYCLE STREETS
In the Netherlands, the so-called Fietsstraat (Bicycle-street) has become a standard. Cycle streets are a good way of demonstrating that in certain urban/residential areas motor vehicles are the ‘guest’, while cycling and walking are the standard means of getting about. These streets still allow motorised traffic, but drivers cannot overtake cyclists or must treat them with utmost care, with clear right of way in favour of cyclists, and priority accords to them only. They increase cycling and improve safety; before and after counts on the (longest Dutch) Cycle Street in Oss in 2004 saw a cycling increase of 11% and reduction in motor traffic of around 30%68.
The figure below shows the recommended width of the bicycle lane with bi-directional traffic from two sides and on a one way road69.
XI. TRAFFIC LIGHT PROGRAMMING
Controlling and manipulating the timing and use of traffic lights can give advantages to pedestrians to improve their experience of the roads. With regards to waiting times for cyclists at traffic lights, an average waiting time for cyclists of 15 seconds is considered good, and over 20 seconds poor (average waiting time corresponds to half the red-light time)64. When crossing a main road without traffic lights, the average waiting time may be shorter than this, but at peak hours the cyclist may have to wait four times as long. The recommended maximum waiting time for cyclists is 90 seconds inside the built-up area and 100 seconds outside the built-up area (maximum waiting corresponds to the red-light time). Often traffic phase duration is set unnecessarily high at 120 seconds as a precaution which should be avoided, as in many cases, reducing this time not only favours cyclists but improves general traffic flow.
In the Netherlands, some innovative traffic lights are being developed right now to improve cyclist flow and decrease waiting times. Some examples65:
To improve traffic flow, the Dutch municipality of Rotterdam placed small heat cameras on top of the traffic lights in 2016. In this way the traffic lights can "see" how many people are standing there. They do this by measuring the infrared radiation that people emit with their body heat. If many cyclists are waiting, the traffic lights will turn green earlier and longer.
Traffic lights with a rain sensor are installed in various places in the Netherlands, including Rotterdam, Enschede and Groningen. They ensure that cyclists can cycle faster if it rains.
In the Dutch Municipality of Den Bosch, cyclists can install the free "Schwung" app on their phones. It passes on their location to the traffic control system (VRI). Traffic light builder Vialis set the VRI for the provincial government office in such a way that the traffic lights take into account the reports from the approaching cyclists' smartphones.
"Flo" is a colourful box that is placed 120 meters in front of the traffic light. There is a radar in it that measures the speed of the cyclist. Flo is linked to the traffic control system and thus knows when the traffic light is on green. Based on that information, a display on the box with pictures shows how fast you have to cycle to catch the green light. If you see the hare, you have to speed up, with the thumb your current speed is good, and with the turtle you have to slow down a bit so as not to have to stand still at the crossing. Seeing a cow means that you will have to wait no matter.
Copenhagen has installed bicycle “green waves”—a series of lights synchronized so riders don’t hit a red if they maintain a certain speed of around 20 km/h66. The wave goes one way into the city during rush hour and changes direction for the evening rush hour. There are even speed radar detection systems that tell cyclists their speed so they can easier ride the wave. Many European cities now are using "Countdown lights" to provide an indication of the remaining waiting time via numbers or a circle of lights. To make the indication always accurate, the counters sometimes suddenly go faster or slower67.
TABLE 2: RECOMMENDED LANE WIDTH (CM) FOR BICYCLE STREETS WITH TWO-WAY TRAFFIC (LEFT)AND PARTIAL ONE-WAY TRAFFIC (RIGHT)70
BI-DIRECTIONAL TRAFFIC ONE-WAY TRAFFIC
50
100
150
200
250
300
350
400
450
530
610
I-mvt/hour
No bicycle street,possibly bicycle lanes
with narrow lane
No bicycle street,possibly bicycle lanes
with narrow lane
I-mvt/hour
100 cyclists/hour
235 cyclists/hour
400 cyclists/hour
100 cyclists/hour
235 cyclists/hour
400 cyclists/hour
450
480
520
580
650
450
480
480
500
550
600
650
690
50
100
150
200
250
300
350
400
400
460
600
400
400
490
490
600
400
400
400
400
490
600
600
630
Lane width incl. rebate strips of 30 cm. Percentage bus / freight traffic <2%
Vehicle combination bicycle-bicycle bicycle-mvt- (bicycle) mvt-mvt
Aleksander Buczynski, ECF
68 Sustrans, (2014), Cycle Streets, https://ec.europa.eu/transport/sites/transport/files/cycling-guidance/sustrans_technical_note_32_-_cycle_streets.pdf 69 Ibid70 Fietsberaad, 2019, Shortcuts for designers - recommendations on bicycle streets, https://www.fietsberaad.nl/getmedia/c8a66983-9cbf-48c4-b0df-3d7f5550e6b0/Fietsberaadnotitie-Aanbevelingen-Fietsstraten-binnen-de-bebouwde-kom-2018-(versie1-1).pdf.aspx?ext=.pdf
64 PRESTO Cycling guides: EC, 2014, Promoting cycling for everyone as daily transport mode, https://ec.europa.eu/energy/intelligent/projects/en/projects/presto65 Jaap Meijers, 2018, 6 nice and smart traffic lights, https://www.fietsersbond.nl/nieuws/zonder-te-stoppen-van-de-erasmusbrug-afsuizen/66 Copenhagenize, 2014, The Green Waves of Copenhagen, http://www.copenhagenize.com/2014/08/the-green-waves-of-copenhagen.html67 Details on pre-green for cyclists can be found here - https://cyclingsolutions.info/signal-controlled-intersections-safe-cycling-solutions/
SAFER CYCLING ADVOCATE PROGRAM - BEST PRACTICE GUIDE PAGE 40PAGE 39 SAFER CYCLING ADVOCATE PROGRAM - BEST PRACTICE GUIDE
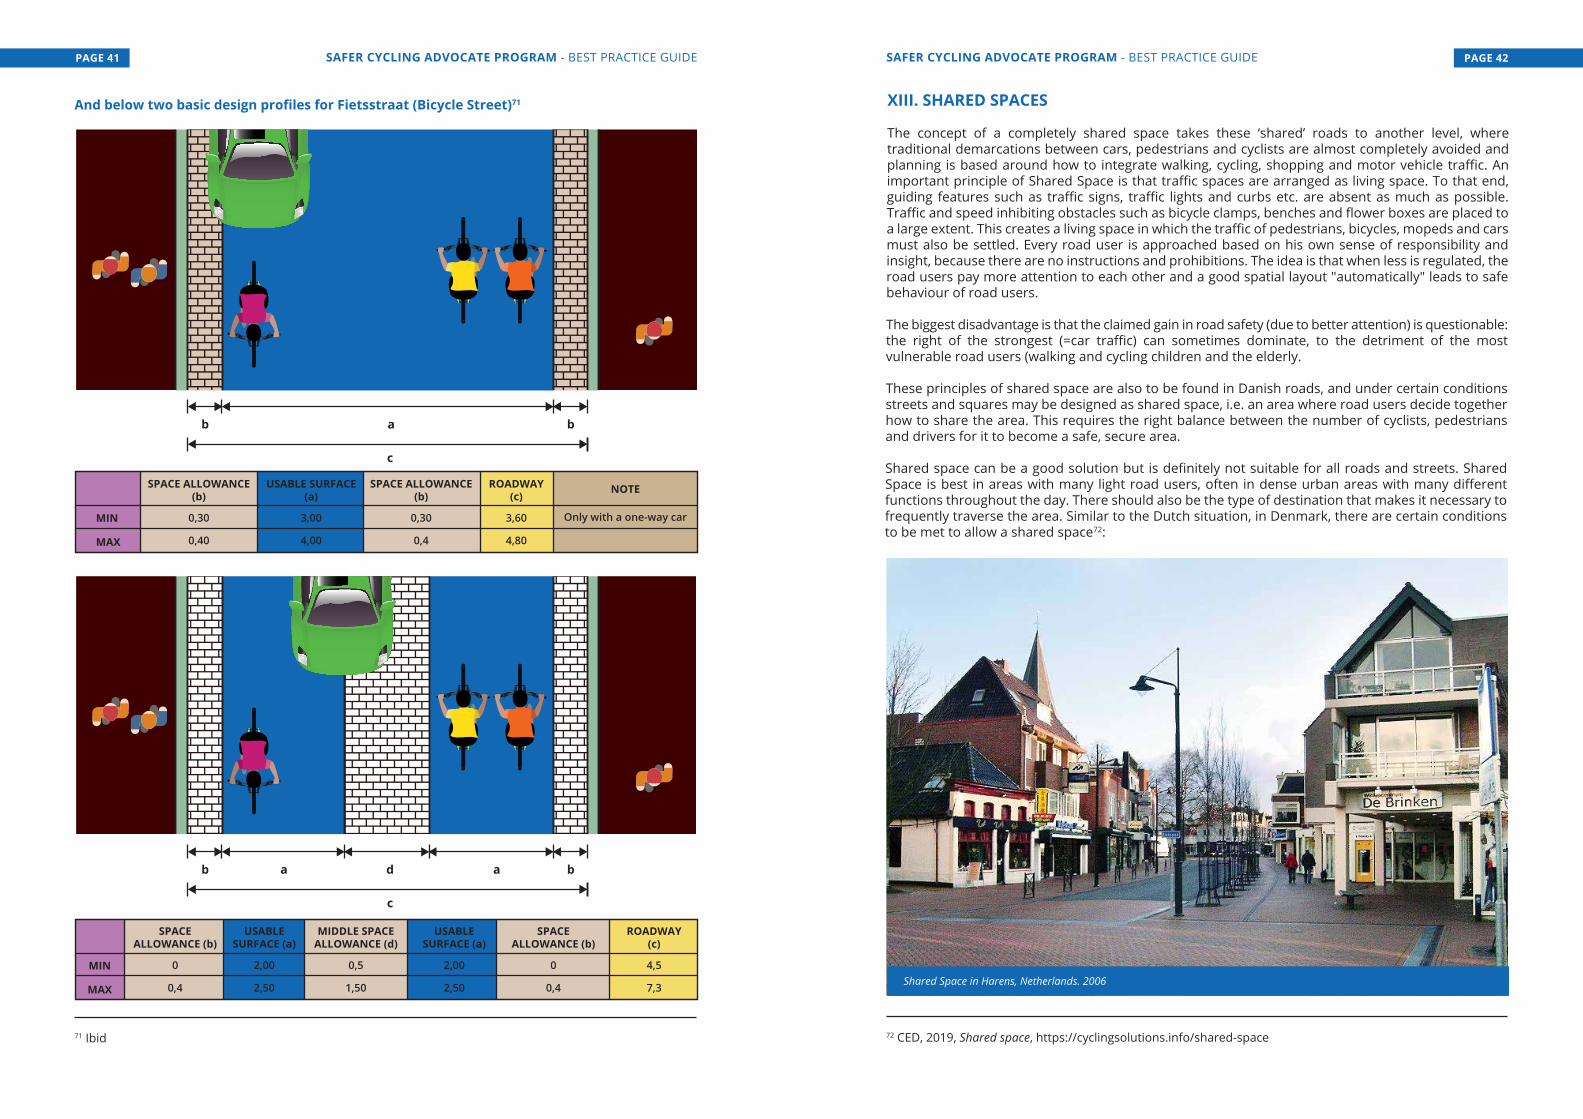
XIII. SHARED SPACES
The concept of a completely shared space takes these ‘shared’ roads to another level, where traditional demarcations between cars, pedestrians and cyclists are almost completely avoided and planning is based around how to integrate walking, cycling, shopping and motor vehicle traffic. An important principle of Shared Space is that traffic spaces are arranged as living space. To that end, guiding features such as traffic signs, traffic lights and curbs etc. are absent as much as possible. Traffic and speed inhibiting obstacles such as bicycle clamps, benches and flower boxes are placed to a large extent. This creates a living space in which the traffic of pedestrians, bicycles, mopeds and cars must also be settled. Every road user is approached based on his own sense of responsibility and insight, because there are no instructions and prohibitions. The idea is that when less is regulated, the road users pay more attention to each other and a good spatial layout "automatically" leads to safe behaviour of road users.
The biggest disadvantage is that the claimed gain in road safety (due to better attention) is questionable: the right of the strongest (=car traffic) can sometimes dominate, to the detriment of the most vulnerable road users (walking and cycling children and the elderly.
These principles of shared space are also to be found in Danish roads, and under certain conditions streets and squares may be designed as shared space, i.e. an area where road users decide together how to share the area. This requires the right balance between the number of cyclists, pedestrians and drivers for it to become a safe, secure area.
Shared space can be a good solution but is definitely not suitable for all roads and streets. Shared Space is best in areas with many light road users, often in dense urban areas with many different functions throughout the day. There should also be the type of destination that makes it necessary to frequently traverse the area. Similar to the Dutch situation, in Denmark, there are certain conditions to be met to allow a shared space72:
And below two basic design profiles for Fietsstraat (Bicycle Street)71
b ba ad
c
b ba
c
MIN
MAX
SPACE ALLOWANCE(b)
0,30
0,40
USABLE SURFACE(a)
3,00
4,00
SPACE ALLOWANCE(b)
0,30
0,4
ROADWAY(c)
3,60
4,80
NOTE
Only with a one-way car
MIN
MAX
SPACEALLOWANCE (b)
0
0,4
SPACEALLOWANCE (b)
0
0,4
USABLESURFACE (a)
2,00
2,50
USABLESURFACE (a)
2,00
2,50
MIDDLE SPACEALLOWANCE (d)
0,5
1,50
ROADWAY(c)
4,5
7,3 Shared Space in Harens, Netherlands. 2006
71 Ibid 72 CED, 2019, Shared space, https://cyclingsolutions.info/shared-space
SAFER CYCLING ADVOCATE PROGRAM - BEST PRACTICE GUIDE PAGE 42PAGE 41 SAFER CYCLING ADVOCATE PROGRAM - BEST PRACTICE GUIDE
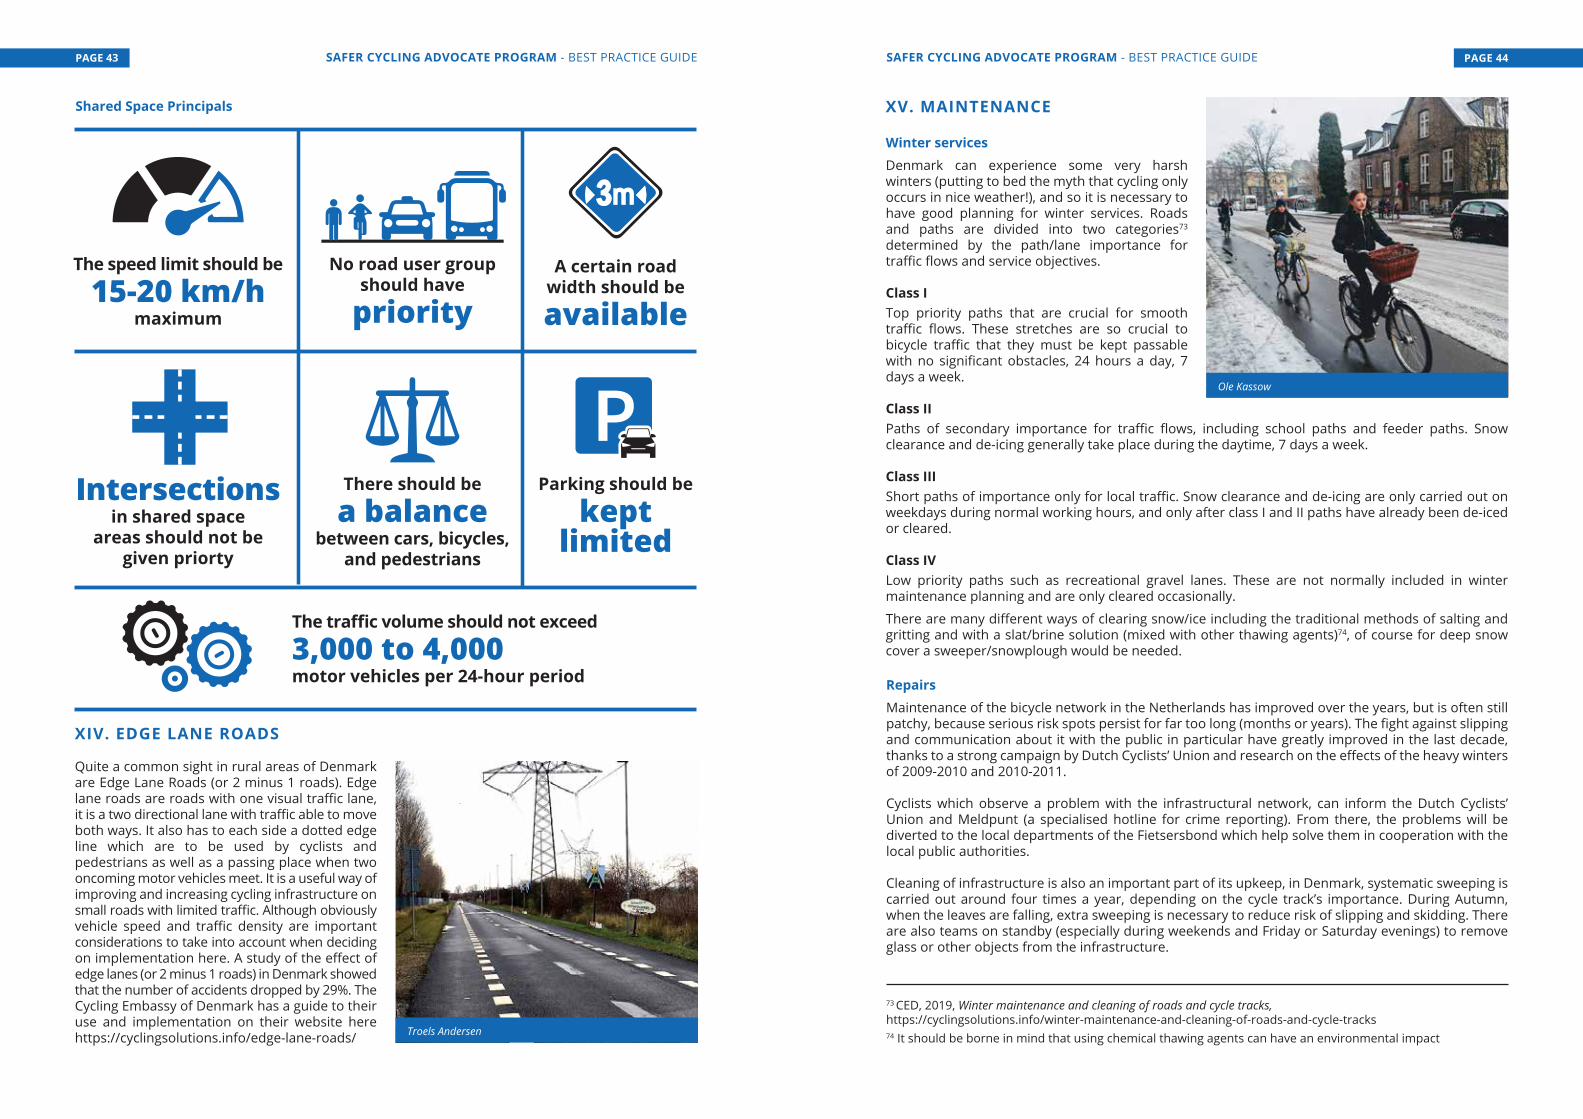
XIV. EDGE LANE ROADS
Quite a common sight in rural areas of Denmark are Edge Lane Roads (or 2 minus 1 roads). Edge lane roads are roads with one visual traffic lane, it is a two directional lane with traffic able to move both ways. It also has to each side a dotted edge line which are to be used by cyclists and pedestrians as well as a passing place when two oncoming motor vehicles meet. It is a useful way of improving and increasing cycling infrastructure on small roads with limited traffic. Although obviously vehicle speed and traffic density are important considerations to take into account when deciding on implementation here. A study of the effect of edge lanes (or 2 minus 1 roads) in Denmark showed that the number of accidents dropped by 29%. The Cycling Embassy of Denmark has a guide to their use and implementation on their website here https://cyclingsolutions.info/edge-lane-roads/
The speed limit should be
15-20 km/hmaximum
The traffic volume should not exceed
3,000 to 4,000motor vehicles per 24-hour period
Parking should be
keptlimited
Intersectionsin shared space
areas should not begiven priorty
There should be
a balancebetween cars, bicycles,
and pedestrians
No road user groupshould have
priorityA certain road
width should be
available
XV. MAINTENANCE
Winter servicesDenmark can experience some very harsh winters (putting to bed the myth that cycling only occurs in nice weather!), and so it is necessary to have good planning for winter services. Roads and paths are divided into two categories73 determined by the path/lane importance for traffic flows and service objectives.
Class ITop priority paths that are crucial for smooth traffic flows. These stretches are so crucial to bicycle traffic that they must be kept passable with no significant obstacles, 24 hours a day, 7 days a week.
Class IIPaths of secondary importance for traffic flows, including school paths and feeder paths. Snow clearance and de-icing generally take place during the daytime, 7 days a week.
Class IIIShort paths of importance only for local traffic. Snow clearance and de-icing are only carried out on weekdays during normal working hours, and only after class I and II paths have already been de-iced or cleared.
Class IVLow priority paths such as recreational gravel lanes. These are not normally included in winter maintenance planning and are only cleared occasionally.
There are many different ways of clearing snow/ice including the traditional methods of salting and gritting and with a slat/brine solution (mixed with other thawing agents)74, of course for deep snow cover a sweeper/snowplough would be needed.
RepairsMaintenance of the bicycle network in the Netherlands has improved over the years, but is often still patchy, because serious risk spots persist for far too long (months or years). The fight against slipping and communication about it with the public in particular have greatly improved in the last decade, thanks to a strong campaign by Dutch Cyclists’ Union and research on the effects of the heavy winters of 2009-2010 and 2010-2011.
Cyclists which observe a problem with the infrastructural network, can inform the Dutch Cyclists’ Union and Meldpunt (a specialised hotline for crime reporting). From there, the problems will be diverted to the local departments of the Fietsersbond which help solve them in cooperation with the local public authorities.
Cleaning of infrastructure is also an important part of its upkeep, in Denmark, systematic sweeping is carried out around four times a year, depending on the cycle track’s importance. During Autumn, when the leaves are falling, extra sweeping is necessary to reduce risk of slipping and skidding. There are also teams on standby (especially during weekends and Friday or Saturday evenings) to remove glass or other objects from the infrastructure.
Shared Space Principals
Troels Andersen
Ole Kassow
73 CED, 2019, Winter maintenance and cleaning of roads and cycle tracks, https://cyclingsolutions.info/winter-maintenance-and-cleaning-of-roads-and-cycle-tracks74 It should be borne in mind that using chemical thawing agents can have an environmental impact
SAFER CYCLING ADVOCATE PROGRAM - BEST PRACTICE GUIDE PAGE 44PAGE 43 SAFER CYCLING ADVOCATE PROGRAM - BEST PRACTICE GUIDE

SAFE VEHICLESI. BICYCLES FOR SAFER CYCLING
II. MOTOR VEHICLES FOR SAFER CYCLING
The safety features that vehicles must have in order to be sold into the EU single market are specified at the level of the European Union through a Type Approval testing regime. This currently includes measures such as the braking systems, lighting, tyres etc.
Most recently (2019) the EU has updated this legislation81 and by 2022 vehicles will also need to include Autonomous Emergency Braking Systems (to stop crashes with pedestrians and cyclists), Improved passive safety with larger impact zones on car bonnets (this will also include SUVs that were previously exempt); Intelligent Speed Assistance; Blind Spot Warning devices and better direct vision on trucks/lorries82. Intelligent Speed Assistance has revolutionary potential, with all new vehicles being fitted with a system that will interact with the driver accelerator pedal if the car is above the speed limit. The system can be overridden in case of any critical situations that arise and speed needs to be increased, but the default will be “on” in the car. The vehicle will read speed limit signs, or receive live GPS data, or both in order to understand the speed limits on the road. It is estimated that around 95% of speed limits are currently covered around the EU. The precise technical specifications of these measures are currently being put together in the UN body UNECE.
Although this has been a European competence, this does not mean that there is nothing additional that national governments can do to improve vehicle safety. Contracting parties (of which the EU member states are also involved) will decide how strong or weak the technical specifications and how these EU measures since the EU legislation will have to be interpreted.
National and local public authorities can also;
Improve road speed limit signage and speed limit digital mapping to get fully ready for the upcoming roll out of Intelligent Speed Assistance systems, including data requirements, interface specifications and system performance evaluation. This should be made available to public and private operators covering the entire road network including a function to update changes to speed limits.
Member states should provide political support and allocate budgets in order to enable digital mapping infrastructure and to provide frameworks for cooperation
Road administration authorities that deal with the road infrastructure would need to collect and consolidate speed limit information. This requires digital maps of all road types to be in place with a highly flexible system for updating (road works or weather changes for example). Local authorities would be the ones responsible for providing speed limit information to road administrations in a timely manner
ISA could be introduced and moved forward by making it compulsory in government vehicle fleets, buses etc. as well as introduced for serious speed offenders
Make 30 kph the default speed in urban areas or encourage local authorities to do so depending on competence.
National governments can take part within UNECE and relevant working groups to make sure that the technical standards and specifications are as strong as possible as have a strict focus on road safety.
The Vienna convention on road traffic75 states that “a cycle shall: a) have an efficient brake, b) be equipped with a bell capable of being heard at a sufficient distance, and carry no other audible warning device, and c) be equipped with a red reflecting device at the rear, and devices ensuring that the bicycle can show a white or yellow light at the front and a red light at the rear”. However around Europe there are no two countries that have the same rules for how this is implemented, and many including the Netherlands and Denmark have supplementary regulations76. There are some nationally recognised standards for bicycle lighting, including the German DIN 3395877, and a Dutch industry standard from DEKRA78. There is also the international ISO standard for both dynamo and battery lighting79.
In Denmark bikes with two wheels cannot be more than 1 metre wide and 3.5 meters long. A bike with more than two wheels cannot be more than 1.25 metres wide and 3.5 metres long. With regards to lighting a bike is required to have two lights – one white light at the front and another red at the back. Front and back lights may be flashing lights but must flash at least 200 times a minute. Lights must be visible from the side as well and it is required to be visible at a distance of 300 metres. The lights cannot blind other users of the road. The lights must be placed on the bike and not on the cyclist. Bike lights in back pockets or on the leg must not be used alone but can be used as a supplement to the ones mounted on the bike. Between sunset and dusk it is compulsory to use the lights as well as in weather with restricted visibility, for example fog and heavy snow.
It is also required to have a bell on the handlebars. Your bike needs to have functioning brakes on both wheels – either two handbrakes or one handbrake and one back pedal brake. Violation of the law leads to a fine80 (around 100 Euros).
For the Netherlands, lighting requirements include white or yellow lights at the front of the bike and red at the back. These are required to be used at night (between sunset and sunrise) and in bad weather conditions. The front light should be connected to the bicycle or chest of the cyclist and should be visible for oncoming traffic. The rear light should be connected to the bicycle or back of the cyclist and should be visible to traffic approaching from behind. The back light must be attached to the bicycle at a distance of 26 to 120 cm above the road surface. No extra lights are allowed (so a bicycle with 2 operated front lights with dynamos is illegal).
75 UNECE, 1993, Convention on Road Traffic of 8 November 1968, incorporating the amendments to the Convention which entered into force on 3 September 1993, http://www.unece.org/trans/conventn/crt1968e.pdf76 For bicycle lighting ECF produced a report for ANEC in 2013 which classifies all the different European counties’ requirements for bicycle lighting, https://anec.eu/attachments/ANEC-R&T-2012-TRAF-002.pdf77 Beuth, 2012, DIN Bicycles - lighting equipment and dynamos, http://www.beuth.de/de/norm/din-33958/14822187878 RAI, Quality mark - Bicycle lighting http://www.raivereniging.nl/activiteiten/keurmerken/keurmerk%20fietsverlichting.aspx79 All international ISO bicycle standards can be found here: https://www.iso.org/ics/43.150/x/80 Danish national legislation on the design and equipment of bikes https://www.retsinformation.dk/Forms/R0710.aspx?id=182136chapters 4,5,6&7.
81 http://www.europarl.europa.eu/doceo/document/TA-8-2019-0391_EN.html the full list of measures can be found here82 Direct Vision by 2025
SAFER CYCLING ADVOCATE PROGRAM - BEST PRACTICE GUIDE PAGE 46PAGE 45 SAFER CYCLING ADVOCATE PROGRAM - BEST PRACTICE GUIDE
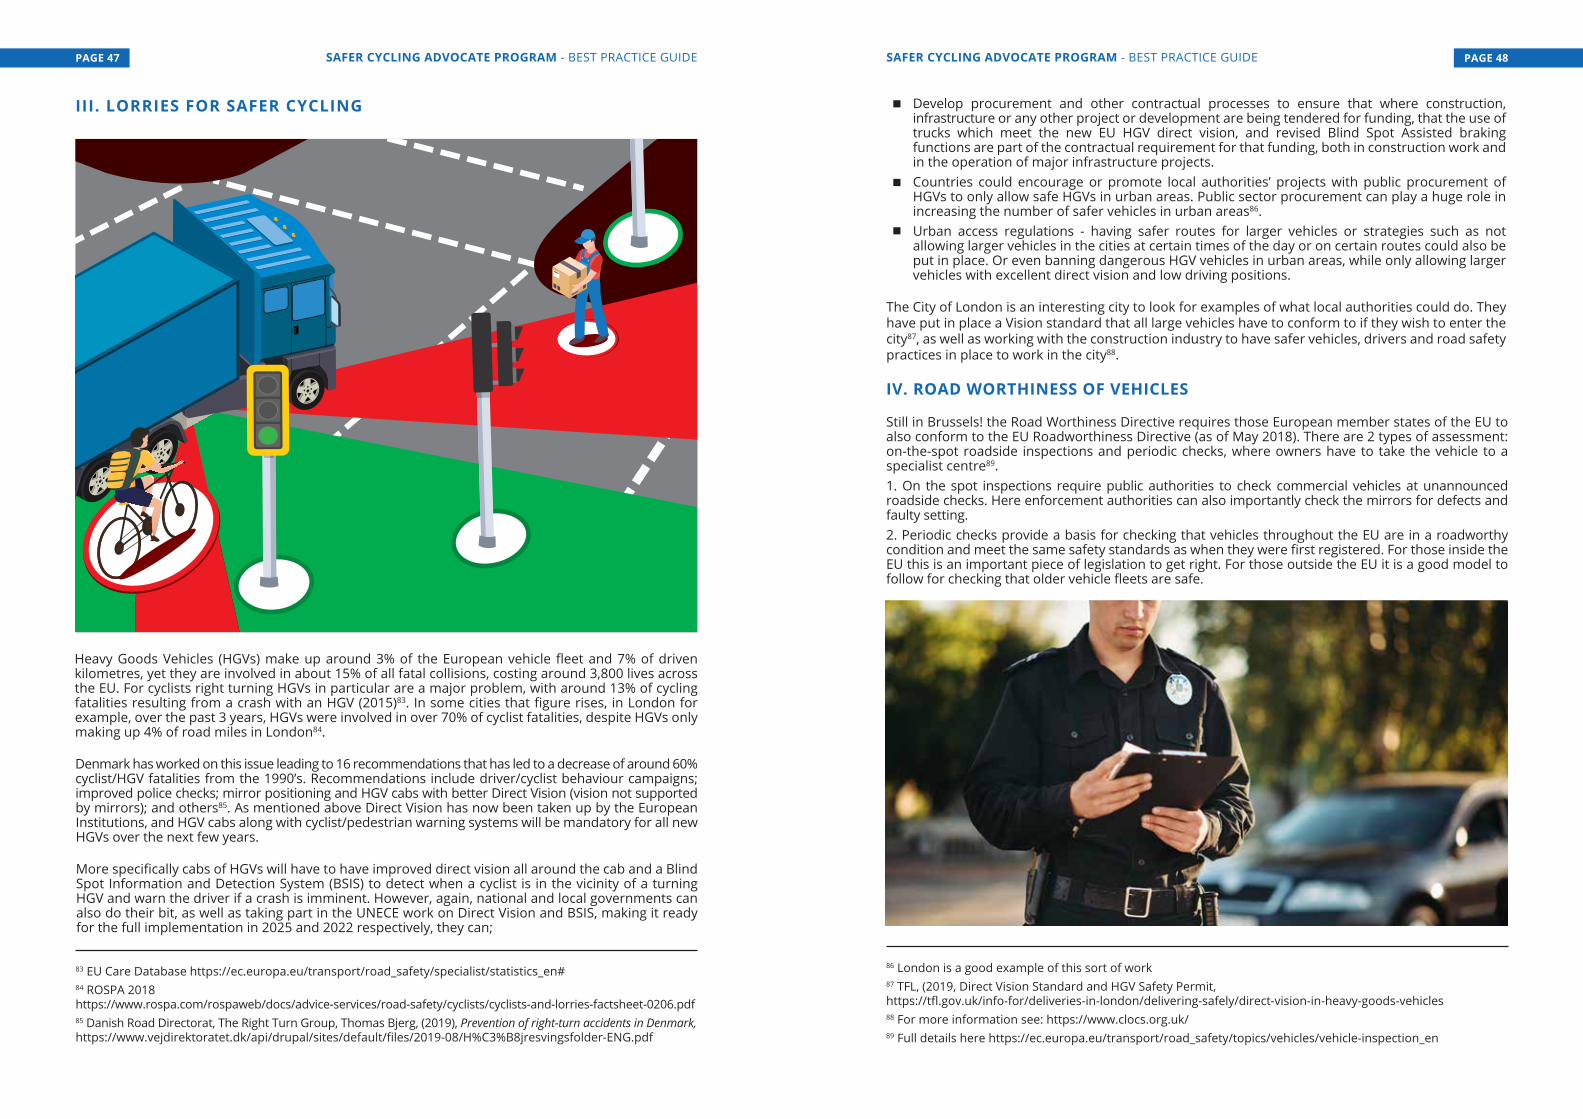
III. LORRIES FOR SAFER CYCLING
Heavy Goods Vehicles (HGVs) make up around 3% of the European vehicle fleet and 7% of driven kilometres, yet they are involved in about 15% of all fatal collisions, costing around 3,800 lives across the EU. For cyclists right turning HGVs in particular are a major problem, with around 13% of cycling fatalities resulting from a crash with an HGV (2015)83. In some cities that figure rises, in London for example, over the past 3 years, HGVs were involved in over 70% of cyclist fatalities, despite HGVs only making up 4% of road miles in London84.
Denmark has worked on this issue leading to 16 recommendations that has led to a decrease of around 60% cyclist/HGV fatalities from the 1990’s. Recommendations include driver/cyclist behaviour campaigns; improved police checks; mirror positioning and HGV cabs with better Direct Vision (vision not supported by mirrors); and others85. As mentioned above Direct Vision has now been taken up by the European Institutions, and HGV cabs along with cyclist/pedestrian warning systems will be mandatory for all new HGVs over the next few years.
More specifically cabs of HGVs will have to have improved direct vision all around the cab and a Blind Spot Information and Detection System (BSIS) to detect when a cyclist is in the vicinity of a turning HGV and warn the driver if a crash is imminent. However, again, national and local governments can also do their bit, as well as taking part in the UNECE work on Direct Vision and BSIS, making it ready for the full implementation in 2025 and 2022 respectively, they can;
Develop procurement and other contractual processes to ensure that where construction, infrastructure or any other project or development are being tendered for funding, that the use of trucks which meet the new EU HGV direct vision, and revised Blind Spot Assisted braking functions are part of the contractual requirement for that funding, both in construction work and in the operation of major infrastructure projects.Countries could encourage or promote local authorities’ projects with public procurement of HGVs to only allow safe HGVs in urban areas. Public sector procurement can play a huge role in increasing the number of safer vehicles in urban areas86.Urban access regulations - having safer routes for larger vehicles or strategies such as not allowing larger vehicles in the cities at certain times of the day or on certain routes could also be put in place. Or even banning dangerous HGV vehicles in urban areas, while only allowing larger vehicles with excellent direct vision and low driving positions.
The City of London is an interesting city to look for examples of what local authorities could do. They have put in place a Vision standard that all large vehicles have to conform to if they wish to enter the city87, as well as working with the construction industry to have safer vehicles, drivers and road safety practices in place to work in the city88.
IV. ROAD WORTHINESS OF VEHICLES
Still in Brussels! the Road Worthiness Directive requires those European member states of the EU to also conform to the EU Roadworthiness Directive (as of May 2018). There are 2 types of assessment: on-the-spot roadside inspections and periodic checks, where owners have to take the vehicle to a specialist centre89. 1. On the spot inspections require public authorities to check commercial vehicles at unannounced roadside checks. Here enforcement authorities can also importantly check the mirrors for defects and faulty setting. 2. Periodic checks provide a basis for checking that vehicles throughout the EU are in a roadworthy condition and meet the same safety standards as when they were first registered. For those inside the EU this is an important piece of legislation to get right. For those outside the EU it is a good model to follow for checking that older vehicle fleets are safe.
83 EU Care Database https://ec.europa.eu/transport/road_safety/specialist/statistics_en#84 ROSPA 2018 https://www.rospa.com/rospaweb/docs/advice-services/road-safety/cyclists/cyclists-and-lorries-factsheet-0206.pdf85 Danish Road Directorat, The Right Turn Group, Thomas Bjerg, (2019), Prevention of right-turn accidents in Denmark, https://www.vejdirektoratet.dk/api/drupal/sites/default/files/2019-08/H%C3%B8jresvingsfolder-ENG.pdf
86 London is a good example of this sort of work87 TFL, (2019, Direct Vision Standard and HGV Safety Permit, https://tfl.gov.uk/info-for/deliveries-in-london/delivering-safely/direct-vision-in-heavy-goods-vehicles 88 For more information see: https://www.clocs.org.uk/ 89 Full details here https://ec.europa.eu/transport/road_safety/topics/vehicles/vehicle-inspection_en
SAFER CYCLING ADVOCATE PROGRAM - BEST PRACTICE GUIDE PAGE 48PAGE 47 SAFER CYCLING ADVOCATE PROGRAM - BEST PRACTICE GUIDE

MANAGEMENTI. MONITORING AND EVALUATION
Good data is essential; cycling data is lacking in many countries across the EU, we need reliable fatality and serious injury figures as well as distance or time travelled per mode to find good exposure data to help track down and focus on areas of risk and help us understand where and how safety interventions are working. Of course, this data can also be useful for traffic management purposes, which can also be used to improve safety throughout the transport system. Although most cycling fatalities are as a result of crashes with motorised vehicles, there are many serious injuries are as a result of single bicycle accidents, it is important that we understand the reasons for this in order to find solutions.
Data collection examplesIn terms of crashes, in the Netherlands there is a national registration based on: insurers, police and hospital data (in particular Emergency and First Aid, but it is understood that cyclists are underrepresented in this). These are processed by, amongst others, www.fietsongevallen.oververkeer.nl. The series of figures (bicycle use, not as intensity on a network and crashes) are reported annually by Statistics Netherlands (CBS in terms of analysis, a lot is done by Via and Hastig).
Many local governments also do bicycle counts most of which are done with cables on the cycle path, like the picture right90. In the last years, more and more data has been collected by apps on mobile phones that cyclists use for navigation. What also is done a lot in the big cities, is counting the amount of parked bikes on a certain place. That is all manual work so costs a lot of time.
The Danish Road Directorate each year publish a report over traffic crashes based on the police’s registrations: https://www.vejdirektoratet.dk/side/trafikulykker-aret-2018
Statistics Denmark also gathers info on traffic crashes, as well based on the Police registration: https://www.dst.dk/en/Statistik/dokumentation/documentationofstatistics/road-traffic-accidents
Nowadays there are other more imaginative ways of also being able to collect good data. Public Bike Sharing, Free-floating bicycle schemes, e-Scooter schemes, and private cyclists’ apps, all collect a great deal of data which should be open to public authorities to use.
Public authorities should require any transport service that wishes to locate within a city to provide cities with accident/usage data as part of contracts permitting them to operate. Similarly, data collection conditions can be added to contracts when offering tenders for road construction/maintenance. However, a word of warning, it is important that gathered data is compliant with the General Data Protection Regulation (GDPR), and is done with a methodology that facilitates international comparisons and comparisons over time.
We would highly recommend that police data is crosschecked with hospital data, city service data and transport service data, which can all be brought together to get a better understanding of the impact on cyclists (and all road users) of infrastructure, highway rules and road user behaviour, as well as on fatality and serious injury figures. This is because it is often assumed that there are many unreported or misreported crash and injury data regarding cyclists91 and this is far from clear92. Non or misreported crashes are often single vehicle accidents, resulting from poor or faulty infrastructure design or implementation. It is important to understand these figures in order to better understand infrastructure requirements and development needs.
HIG
90 HIG, 2019, Fietssystem, https://hig.nl/traffic-systems/monitoring-registratie/fietssystemen91 EC, 2019, Data Considerations, https://ec.europa.eu/transport/road_safety/specialist/knowledge/pedestrians/crash_characteristics_where_and_how/data_considerations_en92 Mindell, J. S., Leslie, D., & Wardlaw, M. 2012. Exposure-based, ‘like-for-like’assessment of road safety by travel mode using routine health data. PloS one, 7(12), http://journals.plos.org/plosone/article?id=10.1371/journal.pone.0050606
SAFER CYCLING ADVOCATE PROGRAM - BEST PRACTICE GUIDEPAGE 49

Data collection recommendationsECF would recommend a target fatality rate to be introduced within Member States. Fatality target rates could be in line with current progress and would have to be coordinated with the overall EU fatality target that the EU has (Vision Zero 2050). Guidelines and recommendations for all EU member states on how to achieve this could be put forward by the Commission.
The European Cyclists’ Federation recommends a set of KPIs that EU member states should collect, which regardless of what the European Union mandates would be of very high benefit to promoting road safety. These indicators should first be collected by Member states with the assistance of the Commission (if necessary) but should then become targets to be reached by those leading Member States.
% of population in age range 8-18 with a safe cycling route between home and school
% of road network with speed limit 30 km/h or lower
% of road network equipped with cycle lanes
Safe cycling is particularly important amongst children & younger people as a way of building independence. Roads should be safe to cater for everyone. Safety for young people and children on the road acts as a proxy for the safety (and perception of safety) of the road infrastructure for cyclists
Alternative (for % of road network safe for cycling) set of more detailed indicators. Can be also used in connection with as sub-indicators
See section on changes to the Road Infrastructure Safety Management Directive. There are many areas along longer distance routes that are (or could be) popular with cyclists. There are many serious cyclist crashes outside of urban areas (around 40% of fatalities outside urban areas)
EuroVelo is a network of European long-distance cycle routes with well-defined and widely accepted certification criteria. This allows to measure not only the quantity but also the quality of cycle infrastructure on European level
Understanding crash opponents would be useful data to understand. Risk for third party crash opponents.
For good governance and continued focus on road safety improvements public authorities should have goals and outline how to achieve their goals
Number of crash opponents between and within modes of transport
Counting of national action plans
ECF is maintaining a database of EuroVelo routes, including information on certification status. The information is available down to a scale of 1 km
% of national (primary, strategic etc.) roads with signed alternative routes for cycling
• Equipped with cycle paths (separation from motorised traffic by construction)The definition might also include some quality requirements (e.g. paved surface, minimum width). It can also reference the cycling infrastructure guidance as described in section…The same definition should be applied consistently to indicators on % of network, % of population with access to safe cycling routes, % of children with safe route to school
% of road network equipped with cycle paths
% of national roads (including motorways, expressways etc.) with alternative long-distance routes for cycling
Member states with long term road safety programs including cycling action plan.
Total length of certified EuroVelo routes [km]
% of third party crashes by mode
Road user distance ortime travelled(for all modes)
Road user target fatality rate for member states
Exposure data (as mentioned in the data/statistics section) to help track down and focus on areas of risk & help us understand where & how safety interventions are working
Road user target fatality rate (to be used with exposure) to inspire individual Member States to reduce risk within the transport system
A ‘road satisfaction’ indicator, as a way of making sure that road safety measures are not simply moving road users from cycling to more protected modes. A road safety intervention can make cycling safer by reducing cycling numbers, but this should not be the intention. The perception of risk is also a good indicator for the success of road safety interventions
Basic indicator on whether the road network is safe for cyclists
As above, but with more importance given to roads in densely populated areas
Consider adapting a common framework for several indicators referring to safe network, safe routes etc. Simplest version would be to define a street section as safe for cycling, if it meets one of the following criteria:• Speed limit 30 km/h • Equipped with cycle lanes (separation from motorised traffic by horizontal markings only)
Survey of random sample from whole population not just cyclist as it will be important to include those thinking of cycling. Can be done on the road or junction (as is carried out in Copenhagen93)
Member State fatality figures along with exposure data measured above
Survey of random sample on travel behaviour or counting methods
% of cyclists& pedestrianswith a ‘feelingof safety’ or ‘feeling of danger’ while using theroads
% of road network safefor cycling
% of populationwith access to safe cycling network
SAFETYPERFORMANCEINDICATOR
JUSTIFICATION
THE EUROPEAN CYCLISTS’ FEDERATION CAN RECOMMEND THESE FOLLOWINGROAD SAFETY INDICATORS SPECIFICALLY FOR CYCLING
HOW TOMEASURE
93 Jensen, S.,Rosenkilde, C., Jensen, N., 2006, Road safety and perceived risk of cycle facilities in Copenhagen, https://nacto.org/wp-content/uploads/2010/08/Cycle_Tracks_Copenhagen.pdf
SAFER CYCLING ADVOCATE PROGRAM - BEST PRACTICE GUIDEPAGE 51 PAGE 52SAFER CYCLING ADVOCATE PROGRAM - BEST PRACTICE GUIDE
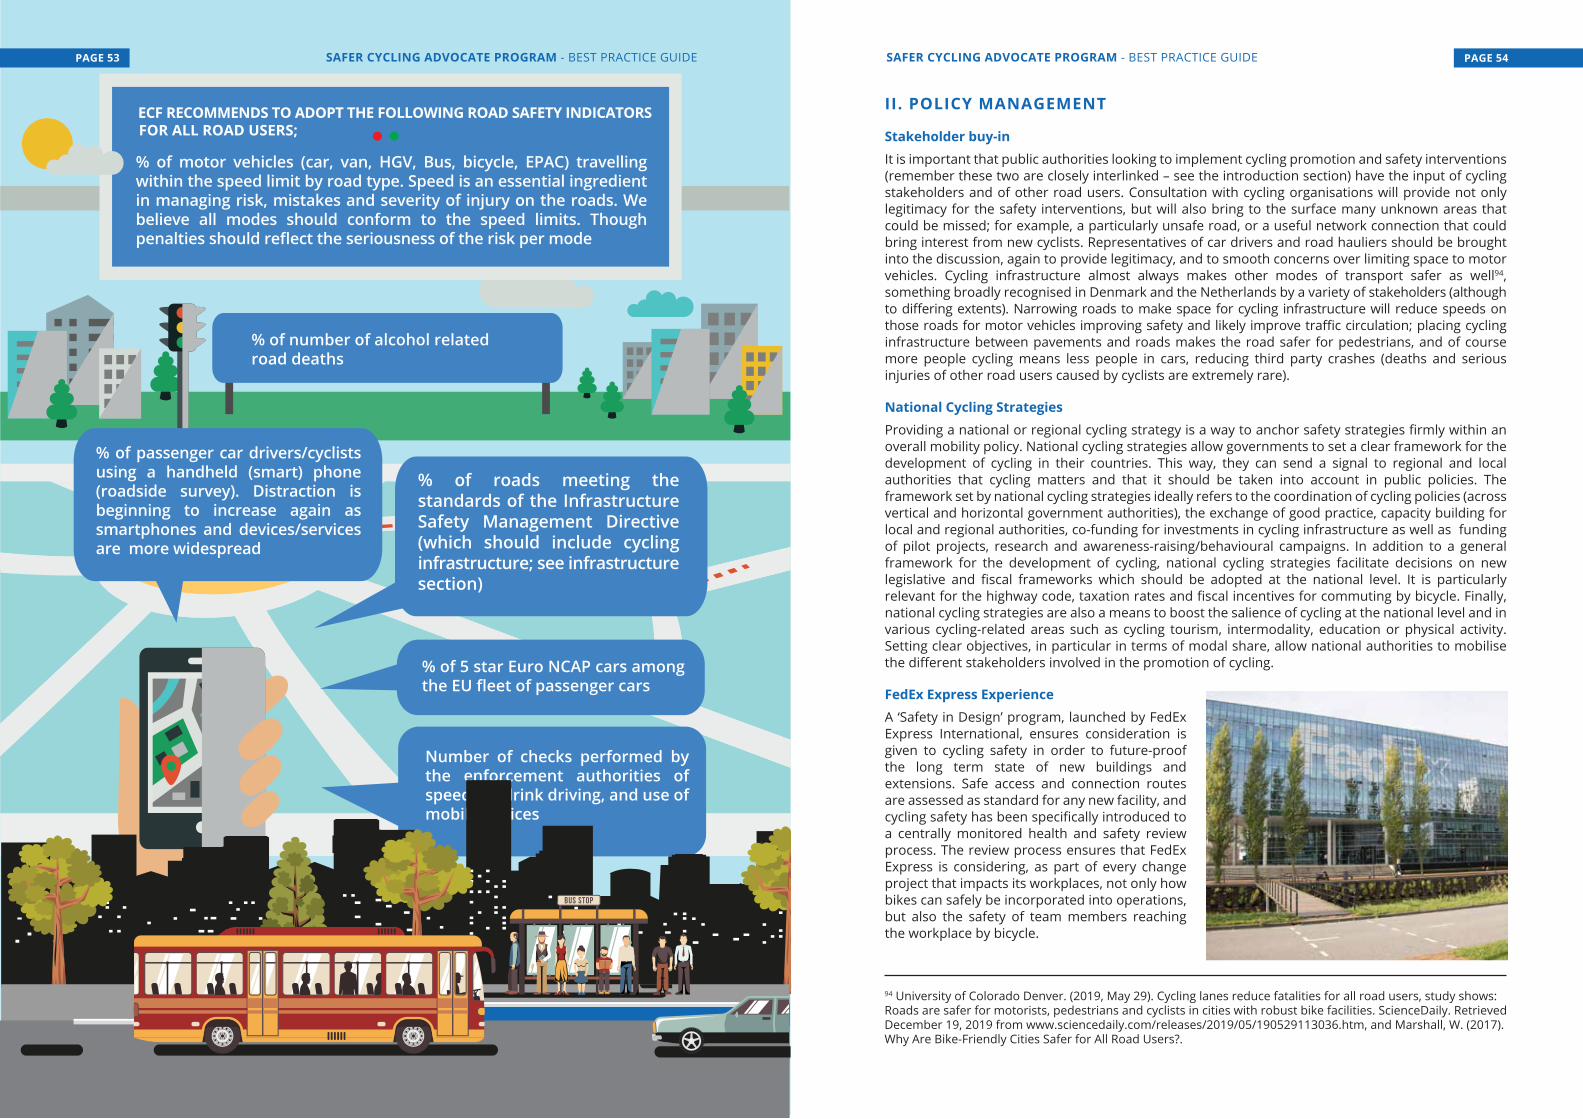
% of 5 star Euro NCAP cars among the EU fleet of passenger cars
% of roads meeting the standards of the Infrastructure Safety Management Directive (which should include cycling infrastructure; see infrastructure section)
% of number of alcohol related road deaths
ECF RECOMMENDS TO ADOPT THE FOLLOWING ROAD SAFETY INDICATORS FOR ALL ROAD USERS;
% of motor vehicles (car, van, HGV, Bus, bicycle, EPAC) travelling within the speed limit by road type. Speed is an essential ingredient in managing risk, mistakes and severity of injury on the roads. We believe all modes should conform to the speed limits. Though penalties should reflect the seriousness of the risk per mode
Number of checks performed by the enforcement authorities of speeding, drink driving, and use of mobile devices
% of passenger car drivers/cyclists using a handheld (smart) phone (roadside survey). Distraction is beginning to increase again as smartphones and devices/services are more widespread
94 University of Colorado Denver. (2019, May 29). Cycling lanes reduce fatalities for all road users, study shows: Roads are safer for motorists, pedestrians and cyclists in cities with robust bike facilities. ScienceDaily. Retrieved December 19, 2019 from www.sciencedaily.com/releases/2019/05/190529113036.htm, and Marshall, W. (2017). Why Are Bike-Friendly Cities Safer for All Road Users?.
SAFER CYCLING ADVOCATE PROGRAM - BEST PRACTICE GUIDE PAGE 54PAGE 53 SAFER CYCLING ADVOCATE PROGRAM - BEST PRACTICE GUIDE
II. POLICY MANAGEMENT
Stakeholder buy-inIt is important that public authorities looking to implement cycling promotion and safety interventions (remember these two are closely interlinked – see the introduction section) have the input of cycling stakeholders and of other road users. Consultation with cycling organisations will provide not only legitimacy for the safety interventions, but will also bring to the surface many unknown areas that could be missed; for example, a particularly unsafe road, or a useful network connection that could bring interest from new cyclists. Representatives of car drivers and road hauliers should be brought into the discussion, again to provide legitimacy, and to smooth concerns over limiting space to motor vehicles. Cycling infrastructure almost always makes other modes of transport safer as well94, something broadly recognised in Denmark and the Netherlands by a variety of stakeholders (although to differing extents). Narrowing roads to make space for cycling infrastructure will reduce speeds on those roads for motor vehicles improving safety and likely improve traffic circulation; placing cycling infrastructure between pavements and roads makes the road safer for pedestrians, and of course more people cycling means less people in cars, reducing third party crashes (deaths and serious injuries of other road users caused by cyclists are extremely rare).
National Cycling StrategiesProviding a national or regional cycling strategy is a way to anchor safety strategies firmly within an overall mobility policy. National cycling strategies allow governments to set a clear framework for the development of cycling in their countries. This way, they can send a signal to regional and local authorities that cycling matters and that it should be taken into account in public policies. The framework set by national cycling strategies ideally refers to the coordination of cycling policies (across vertical and horizontal government authorities), the exchange of good practice, capacity building for local and regional authorities, co-funding for investments in cycling infrastructure as well as funding of pilot projects, research and awareness-raising/behavioural campaigns. In addition to a general framework for the development of cycling, national cycling strategies facilitate decisions on new legislative and fiscal frameworks which should be adopted at the national level. It is particularly relevant for the highway code, taxation rates and fiscal incentives for commuting by bicycle. Finally, national cycling strategies are also a means to boost the salience of cycling at the national level and in various cycling-related areas such as cycling tourism, intermodality, education or physical activity. Setting clear objectives, in particular in terms of modal share, allow national authorities to mobilise the different stakeholders involved in the promotion of cycling.
FedEx Express ExperienceA ‘Safety in Design’ program, launched by FedEx Express International, ensures consideration is given to cycling safety in order to future-proof the long term state of new buildings and extensions. Safe access and connection routes are assessed as standard for any new facility, and cycling safety has been specifically introduced to a centrally monitored health and safety review process. The review process ensures that FedEx Express is considering, as part of every change project that impacts its workplaces, not only how bikes can safely be incorporated into operations, but also the safety of team members reaching the workplace by bicycle.