best practices for high concentration ultrafiltration applications subhasis banerjee, ph.d. group...
TRANSCRIPT

Best practices for high concentration Ultrafiltration Applications
Subhasis Banerjee, Ph.D.
Group Manager, BSN, Merck Millipore
Biowavers, Biologics & Biosimilar Conference; Hyderabad, Oct 2014

Overview
■ Driver for high protein concentration (HPC) in Biologics.
■ Challenges in processing HPC using UF.
■ New UF cassette development for HPC applications.
3
■ High patient doses required for biological products (mAbs):– ~1-3mg/kG (→ upto 10 mg/kg)
■ Intravenous (IV) infusion – traditional delivery method– Issues: Infusion side effects, cost, quality of life, patient compliance
High Concentration Drivers for Biologics
4
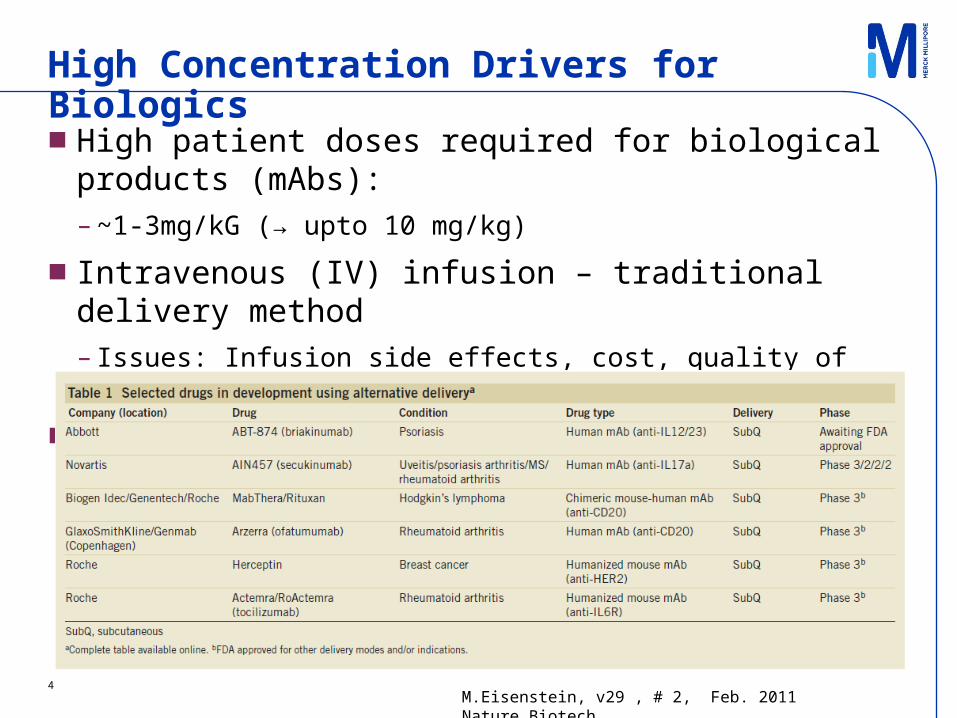
■ High patient doses required for biological products (mAbs):– ~1-3mg/kG (→ upto 10 mg/kg)
■ Intravenous (IV) infusion – traditional delivery method– Issues: Infusion side effects, cost, quality of life, patient compliance
■ Subcutaneous administration (Sub-Q) preferred by patients– Ease of Use, savings in time & cost, convenience, mitigate severe
after-effects of infusion
High Concentration Drivers for Biologics
M.Eisenstein, v29 , # 2, Feb. 2011 Nature Biotech
5
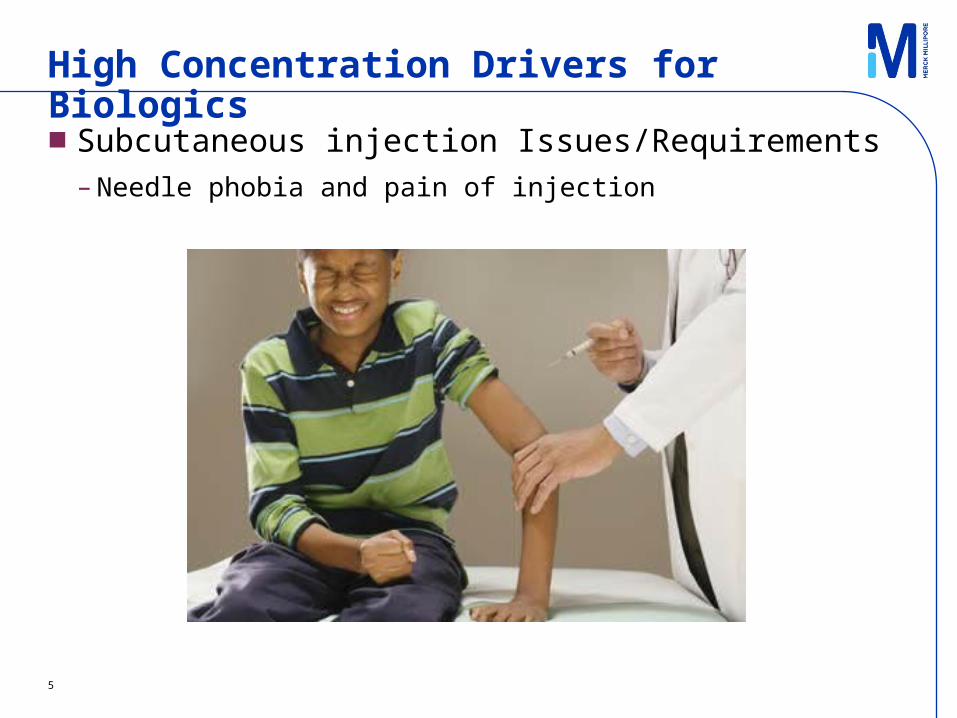
■ Subcutaneous injection Issues/Requirements– Needle phobia and pain of injection
High Concentration Drivers for Biologics

6
■ Subcutaneous injection Issues/Requirements– Needle phobia and pain of injection
► Studies show that increasing injection vol from 0.5 ml to 1 ml increases pain significantly
► Target injection vol < 1 ml
• For a 2-3 mg/kg dose, for a 70 kg person → 140-210 mg dose; if injectiion vol. needs to be less than 1 ml, we are talking about a protein concentration of > 140-210 g/L
Sub-Q injections require high conc. protein formulations
High Concentration Drivers for Biologics
7
■ Potentially significant changes in solution properties– Viscosity → mechanical processing, drug delivery
– Osmotic Pressure → max conc in a TFF process
– Thermodynamic properties (excluded volume, donnan) → impurity clearance in diafiltration
Challenges with High Concentration of Proteins
8
■ Viscosity and Osmotic effects may combine to limit the ‘Max’ achievable concentration in a TFF process
■ Let’s see how?
Challenges with High Concentration of Proteins
9
Viscosity Effects
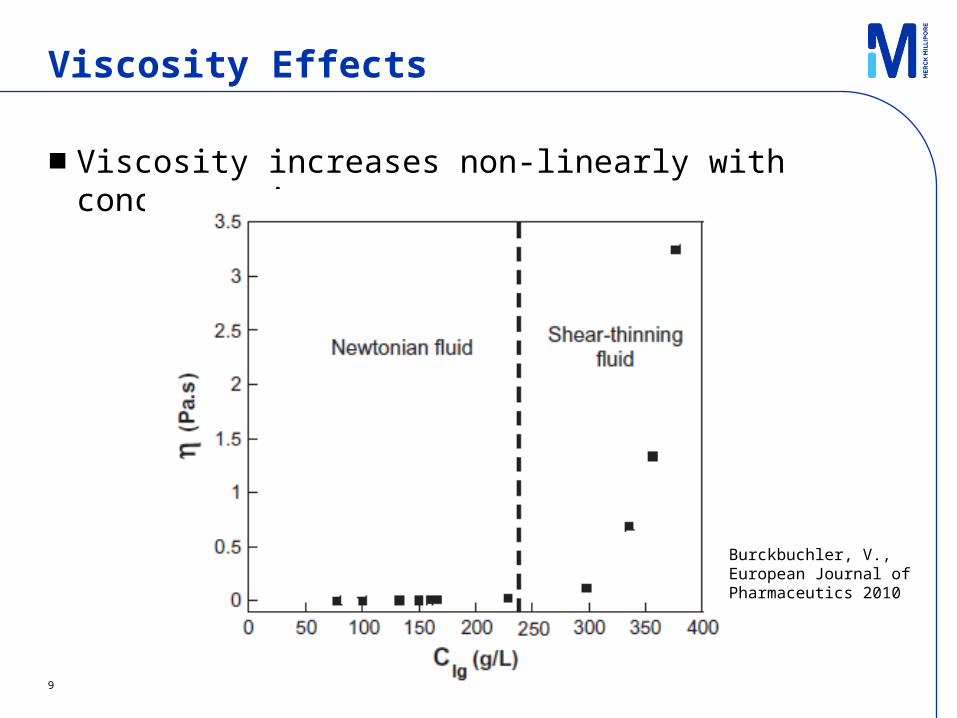
■ Viscosity increases non-linearly with concentration
Burckbuchler, V., European Journal of Pharmaceutics 2010
10
Viscosity Effects
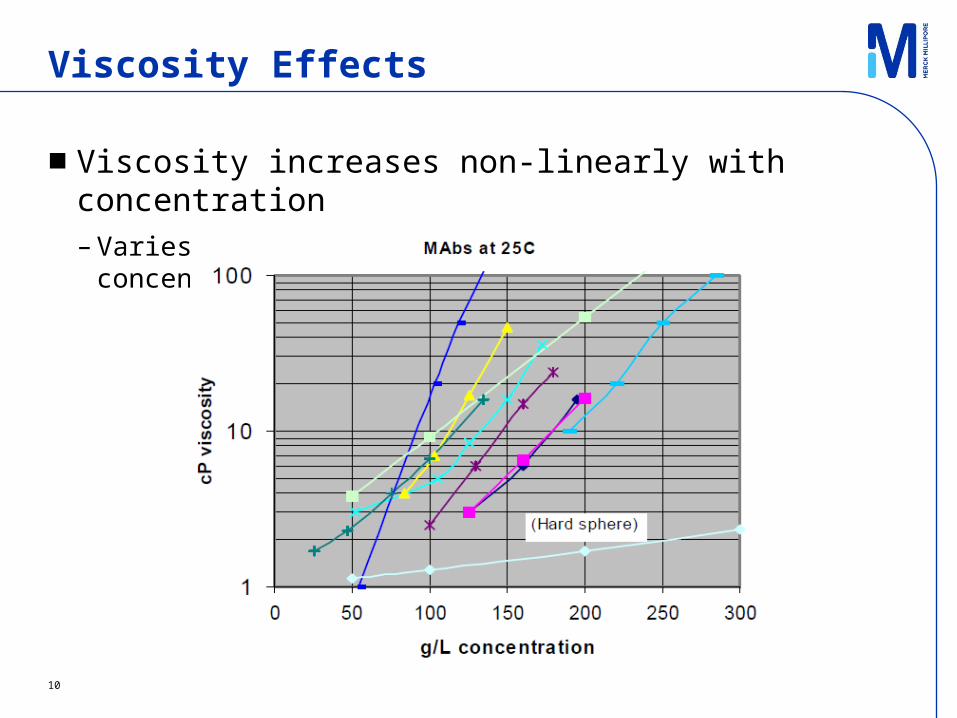
■ Viscosity increases non-linearly with concentration– Varies widely with mAb type for a given concentration

DPValve
TMP
DPM
11
Viscosity Effects – TFF Processing
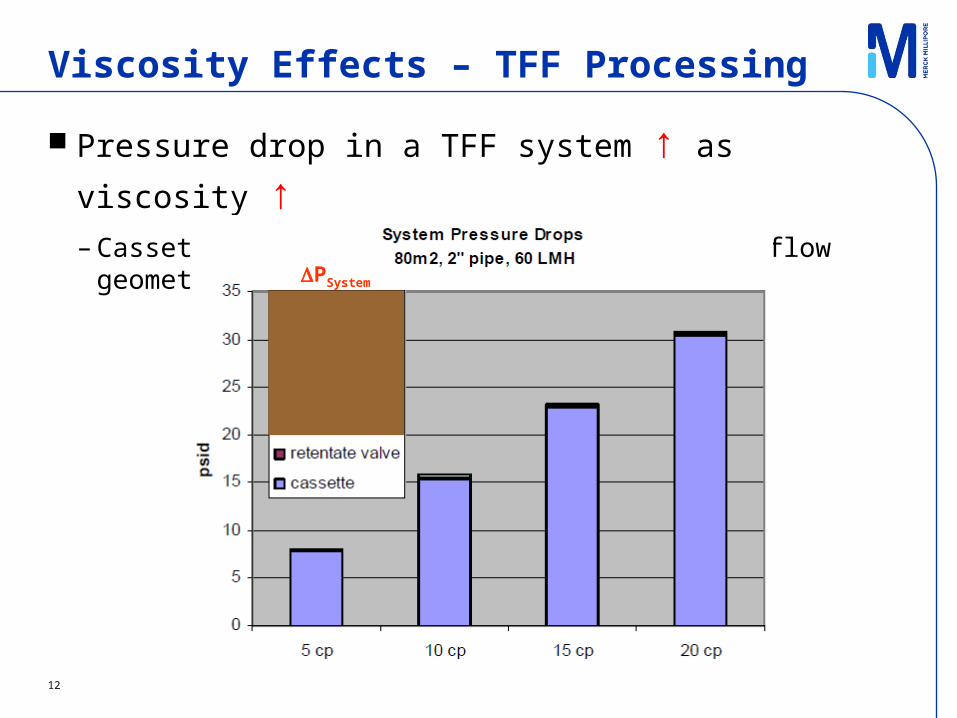
■ Pressure drop in a TFF system ↑ as viscosity ↑
QF
PF
PR
PP
Retentate valve
Permeate
Feed
QR
Diafiltration buffer
FeedTank
QP
Retentate
DPSystem
PSystemValveM P P P
2
P TMP
12
Viscosity Effects – TFF Processing
■ Pressure drop in a TFF system ↑ as viscosity ↑– Cassette resistance dominates for a given flow geometry
DPSystem
13
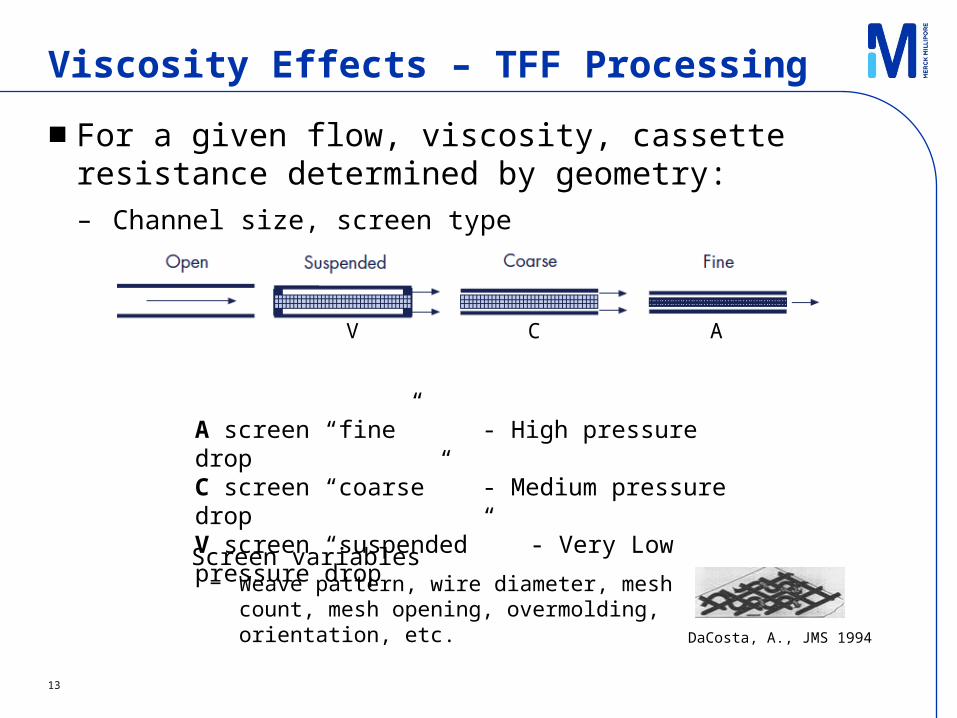
Viscosity Effects – TFF Processing
■ For a given flow, viscosity, cassette resistance determined by geometry:– Channel size, screen type
ACV
A screen “fine” - High pressure dropC screen “coarse” - Medium pressure dropV screen “suspended” - Very Low pressure drop
Screen variables− Weave pattern, wire diameter, mesh count,
mesh opening, overmolding, orientation, etc.DaCosta, A., JMS 1994

14
Viscosity Effects – TFF Processing
■ For a given flow, viscosity, cassette resistance determined by geometry:– Channel size, screen type
V-Screen
V-Screen @ 15L/min/m2
A-Screen
C-Screen
ACV

15
Osmotic Pressure Effects – TFF Processing
■ Osmotic pressure resulting from concentration difference between membrane wall (Cw) and permeate (Cf0)
Model PressureOsmotic .... ΔΠTMPLJ p
TMPLJ p Cb
Cw
membrane
k
Cf
Feed Retentate
Permeate TMP
■ Applied TMP must be > osmotic pressure to force permeate flow
− Modules and equipment limit maximum TMP

16
How do high viscosity & osmotic pressure affect TFF processing?
■ Permeate flux through a TFF membrane:– Is determined by excess TMP over osmotic pressure
– Depends on mass transfer coeff (flow, geom) and solute conc.
ΔΠTMPLJ p
)C
Ckln(J
bulk
gel
17
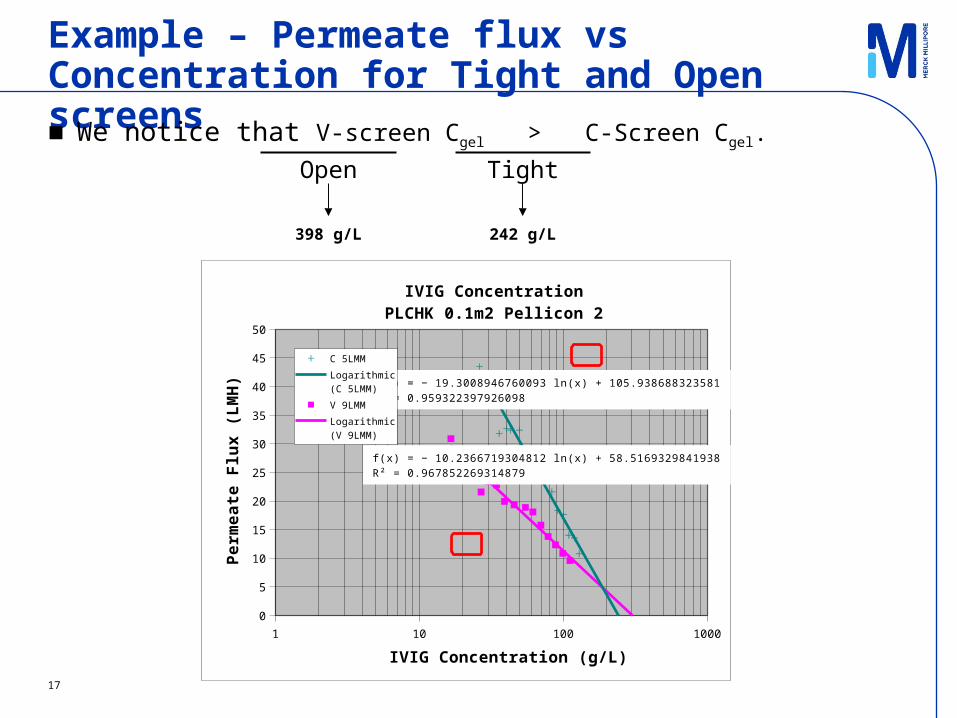
Example – Permeate flux vs Concentration for Tight and Open screens
■ We notice that V-screen Cgel > C-Screen Cgel.
1 10 100 1000
0
5
10
15
20
25
30
35
40
45
50
f(x) = − 10.2366719304812 ln(x) + 58.5169329841938R² = 0.96785226931488
f(x) = − 19.3008946760093 ln(x) + 105.938688323581R² = 0.959322397926098
IVIG ConcentrationPLCHK 0.1m2 Pellicon 2
C 5LMM
Logarithmic (C 5LMM)
V 9LMM
Logarithmic (V 9LMM)
IVIG Concentration (g/L)
Pe
rme
ate
Flu
x (
LM
H)
Open
398 g/L
Tight
242 g/L
18
Inference
■ High final concentrations achievable at lower feed flows and more open feed channel!
– Develop a more optimum feed channel for high conc (high viscosity) apps► Existing C-Screen too tight, V-Screen possibly too open → optimum probably in-
between
■ Trade-off: lower permeate flux, larger membrane area
19
High Viscosity Screen/Cassette Development
■ Product need:– What is the right screen size? What viscosity do we target?
20
Viscosity Target – Estimation
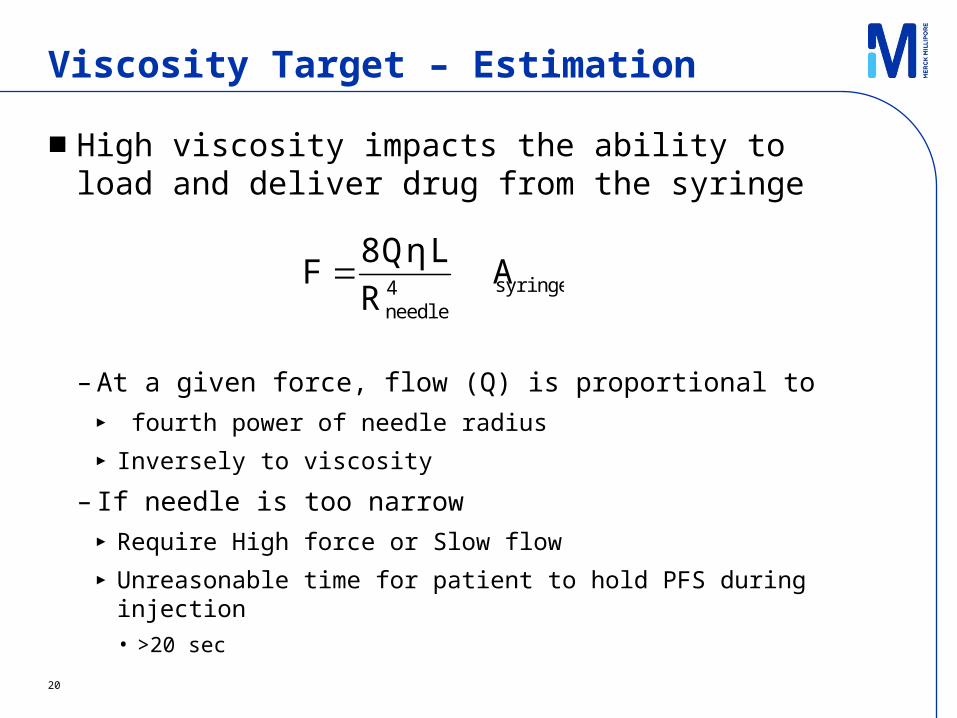
■ High viscosity impacts the ability to load and deliver drug from the syringe
– At a given force, flow (Q) is proportional to► fourth power of needle radius
► Inversely to viscosity
– If needle is too narrow► Require High force or Slow flow
► Unreasonable time for patient to hold PFS during injection
• >20 sec
syringe4needle
AR
L 8QηF
21
Viscosity Target – Estimation
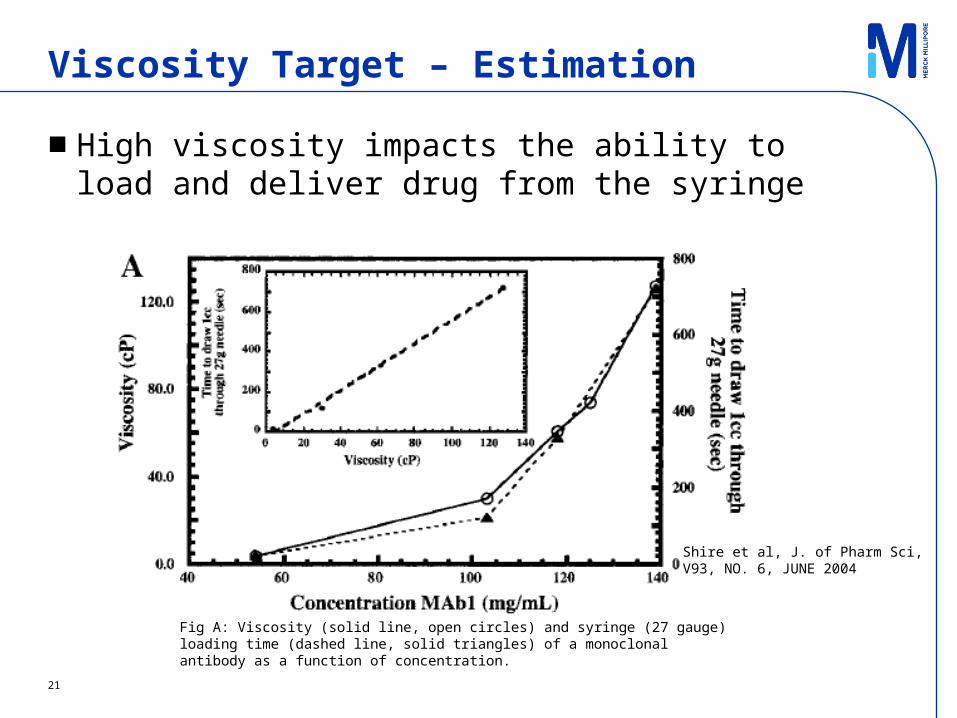
■ High viscosity impacts the ability to load and deliver drug from the syringe
Fig A: Viscosity (solid line, open circles) and syringe (27 gauge) loading time (dashed line, solid triangles) of a monoclonal antibody as a function of concentration.
Shire et al, J. of Pharm Sci, V93, NO. 6, JUNE 2004
30 Gauge
27 Gauge
26 Gauge
22
Viscosity Target – Estimation
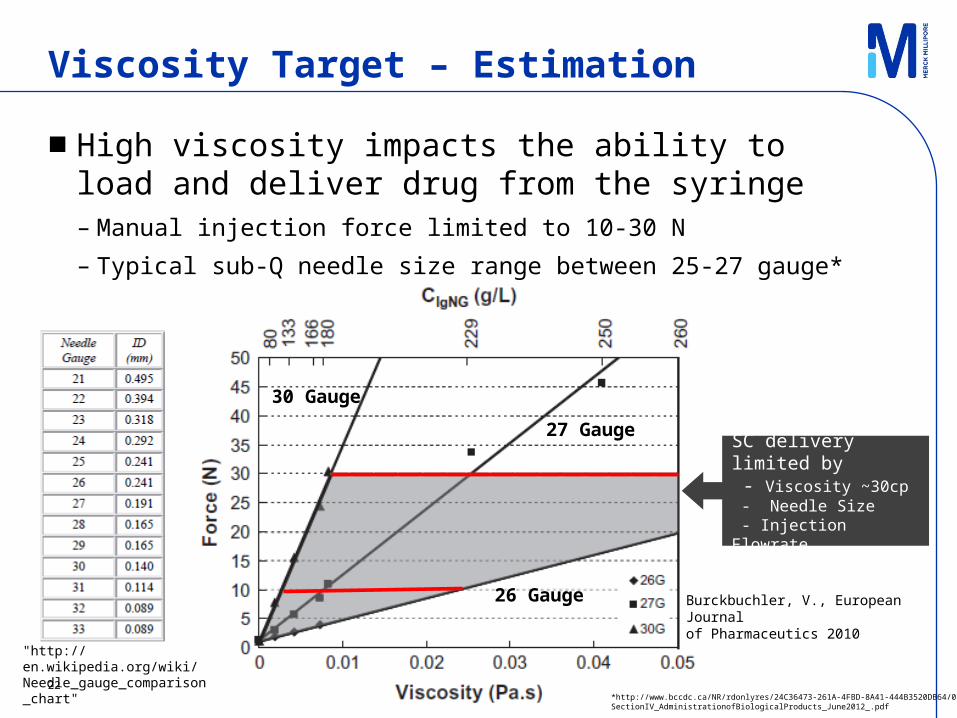
Burckbuchler, V., European Journal of Pharmaceutics 2010
■ High viscosity impacts the ability to load and deliver drug from the syringe– Manual injection force limited to 10-30 N
– Typical sub-Q needle size range between 25-27 gauge*
"http://en.wikipedia.org/wiki/Needle_gauge_comparison_chart"
*http://www.bccdc.ca/NR/rdonlyres/24C36473-261A-4FBD-8A41-444B3520DB64/0/SectionIV_AdministrationofBiologicalProducts_June2012_.pdf
SC delivery limited by - Viscosity ~30cp - Needle Size - Injection Flowrate
24
High Viscosity (Protein Conc) TFF Cassette
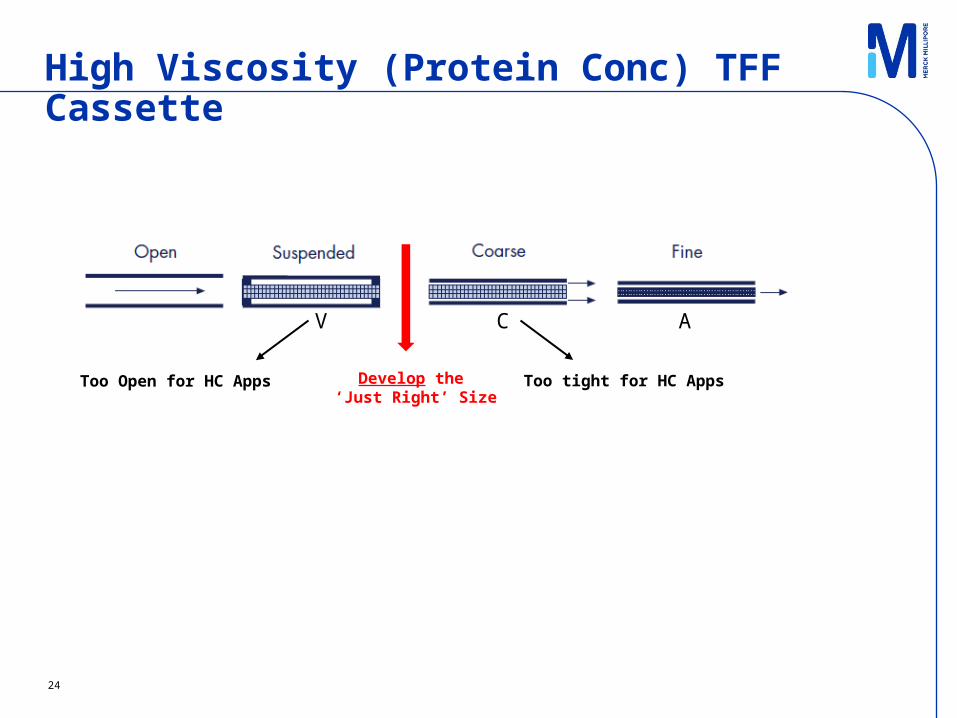
ACV
Too tight for HC AppsToo Open for HC Apps Develop the ‘Just Right’ Size
25
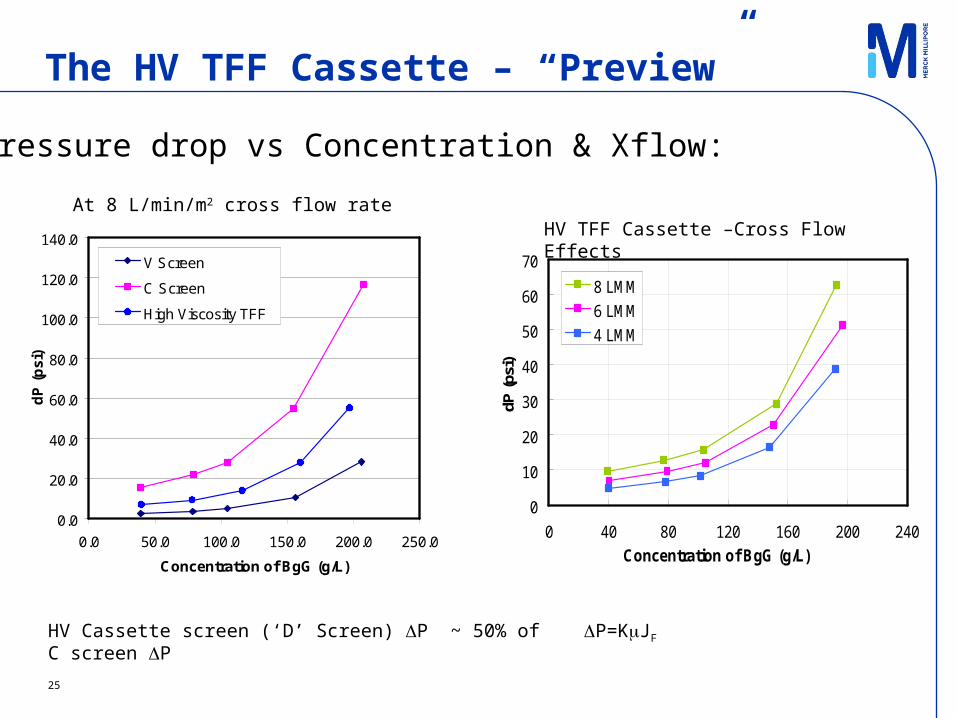
The HV TFF Cassette – “Preview”
At 8 L/min/m2 cross flow rate
0.0
20.0
40.0
60.0
80.0
100.0
120.0
140.0
0.0 50.0 100.0 150.0 200.0 250.0
Concentration of BgG (g/L)
dP
(p
si)
V Screen
C Screen
High Viscosity TFF
0
10
20
30
40
50
60
70
0 40 80 120 160 200 240
Concentration of BgG (g/L)
dP (p
si)
8 LMM
6 LMM
4 LMM
DP=KmJFHV Cassette screen (‘D’ Screen) DP ~ 50% of C screen DP
HV TFF Cassette –Cross Flow Effects
Pressure drop vs Concentration & Xflow:
26
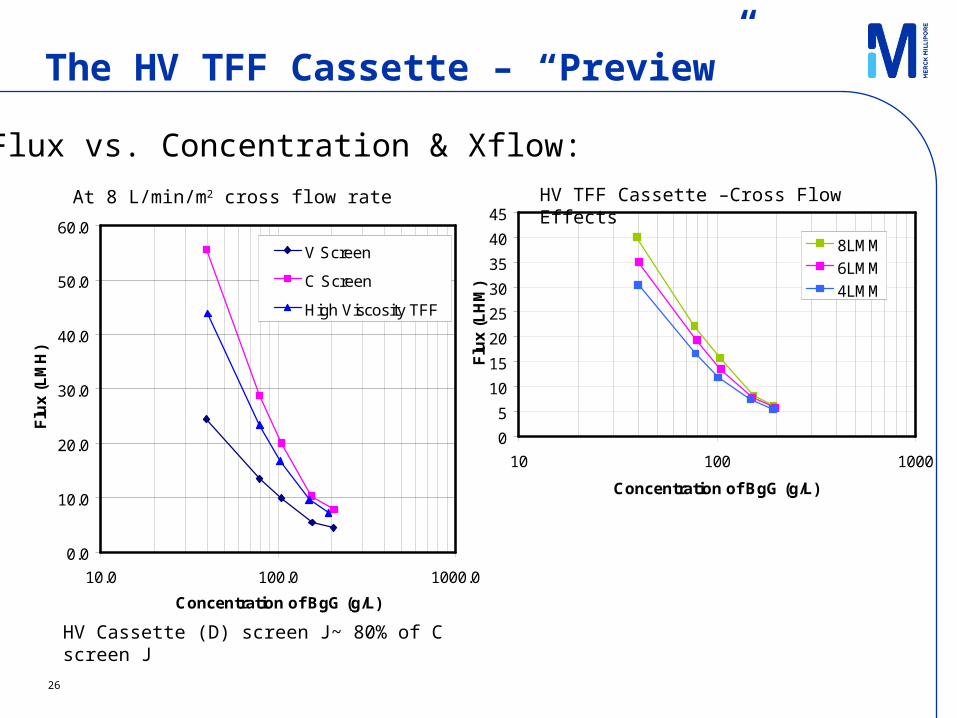
The HV TFF Cassette – “Preview”
At 8 L/min/m2 cross flow rate
0.0
10.0
20.0
30.0
40.0
50.0
60.0
10.0 100.0 1000.0
Concentration of BgG (g/L)
Flu
x (
LM
H)
V Screen
C Screen
High Viscosity TFF
0
5
10
15
20
25
30
35
40
45
10 100 1000
Concentration of BgG (g/L)F
lux
(L
HM
)
8LMM
6LMM
4LMM
HV Cassette (D) screen J~ 80% of C screen J
Flux vs. Concentration & Xflow:
HV TFF Cassette –Cross Flow Effects
27
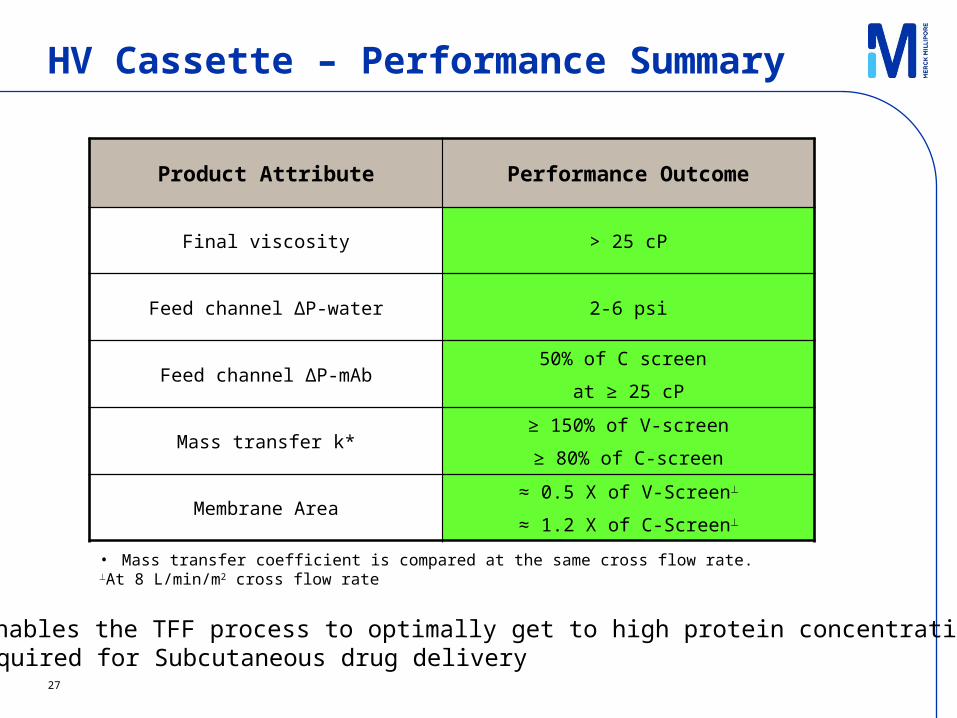
HV Cassette – Performance Summary
Product Attribute Performance Outcome
Final viscosity > 25 cP
Feed channel ΔP-water 2-6 psi
Feed channel ΔP-mAb50% of C screen
at ≥ 25 cP
Mass transfer k*≥ 150% of V-screen
≥ 80% of C-screen
Membrane Area≈ 0.5 X of V-Screen
≈ 1.2 X of C-Screen
• Mass transfer coefficient is compared at the same cross flow rate.At 8 L/min/m2 cross flow rate
Enables the TFF process to optimally get to high protein concentrationsrequired for Subcutaneous drug delivery
Thank You!
Acknowledgements
Herb Lutz
Joseph Parrella
Bala Raghunath
28