best practices for system management in the hyperscale...
TRANSCRIPT

Best Practices for System Management
in the Hyperscale Cloud
Michael Stumpf
Lead Solution Engineer
Dell’s PowerEdge C Server Line
MODERATOR
Curt Schwaderer,
Technology Editor - OpenSystems Media
Partnered with OpenSystems Media

Agenda
I. A quick tour of the viewer tools
II. Introduction
III. Presentation
IV. Questions and Answers
Partnered with OpenSystems Media

Data Center Solutions
Best Practices for System
Management in
Hyperscale Clouds
Michael Stumpf
System Management & Tools, PowerEdge-C

4 Data Center Solutions
Agenda
• Hyperscale cloud environments
• Techniques
• Command line tools
• Health monitoring
• Best practices
http://PowerEdgeC.com

5 Data Center Solutions
Cloud Computing
Yes, it’s the latest industry trend…
But this one isn’t all ponies and rainbows!
So, what does “Cloud Computing” actually mean?
• In a nutshell, the goal is to put together a lot of – Efficient– Cheap– Dense – Computing capability & storage
• That is “just manageable enough”
• Don’t pay for features you don’t need/won’t use
http://PowerEdgeC.com

6 Data Center Solutions
Cloud Computing Environments
• Failures will occur– Plan for them
– Minimize impact
– Minimize total cost
– Replace it; throw old one on the junk pile
• Failure is expected, so single points of failure are ok
• Software stack expects, detects, and handles failure– Hadoop
• Why pay 10x for 99.999% uptime?– Is 5.26 minutes per year downtime
realistic?
http://PowerEdgeC.com

7 Data Center Solutions
BMC (Baseboard Management Controller)
• BMC is really ideal for Cloud Computing– Cheap, bolt-on, auxiliary maintenance &
monitoring
– Out-of-band management
– Present on every server node
– Always-on
– Power host on/off
– Provides virtual KVM, media, serial port over IP
– Monitors server node health
– Allows for physical separation of management traffic
• Enables totally virtualized server management– Put BMC on the network,
– Then server is fully remotely manageable (Even bare metal!)
http://PowerEdgeC.com

8 Data Center Solutions
PowerEdge C6105 Server4 separate servers in 2UPower-efficient AMD Opteron 4000 processors4 separate BMCs
http://PowerEdgeC.com
9 Data Center Solutions
First Goals: The “Get My Server Manageable” Plan
• Get BMC on network – setup IP, or – collect MAC address and setup DHCP
daemon
• Access it remotely– IPMI over LAN– Serial-over-LAN (via BMC)– Virtual Console– Virtual Media– Serial port (physical; cheap!)– IP KVM ($$$$$)
Then,
• Configure it
• Remotely install an OS (kickstart file)– Or use a read-only, centralized network-
based PXE image (if practical!)
• Set up monitoring
http://PowerEdgeC.com

10 Data Center Solutions
PXE Boot (boot from Network)• Uses DHCP to get IP address
• MAC address is linked to a boot image
• PXE pulls boot image with TFTP
• It’s always a good idea to make PXE first boot device.– Can simply bypass with timeout and “localboot”– Helps mechanize discovery, provisioning, FA/crash cart
• Driven by symlinks on TFTP/PXE server– Newer approaches exist (iPXE)– They’re faster, sexy, and usually work– When they don’t, you’re in trouble– PXE will always work
• Construct states:1. Discovery/Inventory2. Test/Burn-in3. Update firmware (BIOS, BMC, Storage, Fans, etc)4. Provision (tailor to a purpose)5. OS Install6. Deprovision (prepare for removal)7. Failure Analysis
This approach scales
http://PowerEdgeC.com

11 Data Center Solutions
PXE Boot: Crowbar
• Dell’s Crowbar implements this strategy today– http://github.com/dellcloudedge/
crowbar/wiki
• Bare metal to fully functioning cloud in under 2 hours
• Open; Apache 2 license
• Not restricted to Dell hardware
• Embodies Dell’s Cloud experience
http://PowerEdgeC.com

12 Data Center Solutions
Configure the server (Provision)
• PXE image (runs out of ramdisk)– Mounts NFS share, or uses ftp (ncftp is handy) to pull over
your custom scripts
– Unbundles & runs scripts
– Optionally feed back results upstream
• Things to set:– Custom BIOS settings
– Custom BMC settings
– Custom Storage adapter settings
– Update firmwares (if needed)
– Storage configuration (array creation)
• After provisioning, a kickstart file will automate OS install– Warning: environment is very thin
– services like IPMI will not be available
– Recommended: do not combine OS install with Provisioning stage
http://PowerEdgeC.com

13 Data Center Solutions
IPMI Tools
Many choices. Each has a different focus.
• ipmitool – what I use & script. Easy to build. Good all-around.
• freeipmi – contains ipmiping; useful for probing
• ipmiutil – contains idiscover; useful for scanning a network
FAQ: How do I scan the network for BMCs?– Does it ping? + Does it respond to IPMI? This is a BMC
– BMC should be able to identify its host
– Useful for discovery, provisioning, detecting unexpected changes on network
FAQ: How do I encrypt IPMI traffic?– Force IPMI 2.0 mode. With ipmitool, add
argument “-Ilanplus”
http://PowerEdgeC.com

14 Data Center Solutions
IPMI Cheat Sheet
# Start IPMI service on a RHEL/CentOS-style server (usually installed, but not enabled)
service ipmi start
# Check power state; power on
ipmitool power status
ipmitool power on
# Issue ACPI shutdown (soft shutdown to OS)
ipmitool chassis power soft
# Reset the BMC itself (“management channel”)
ipmitool mc reset cold
# Activate serial-over-LAN (type ~? for help; type ~. to exit)
ipmitool sol activate
# Print the FRU (Who made this device? What is it? Model/Serial/etc)
ipmitool fru print
# View the SEL (System Event Log) (brief, or verbose)
ipmitool sel list
ipmitool sel list –v
# View the SDR (Sensor Data Repository) in different ways(including verbose)
ipmitool sensor
ipmitool sdr list
ipmitool sdr elist
ipmitool sdr list –v
http://PowerEdgeC.com

15 Data Center Solutions
IPMI Cheat Sheet, continued# See BMC LAN configuration
ipmitool lan print 1
# Change the BMC LAN configuration (DHCP/static IP, netmask, gateway, etc)
ipmitool lan set 1 ipsrc static
ipmitool lan set 1 ipaddr 192.168.0.5
ipmitool lan set 1 netmask 255.255.255.0
ipmitool lan set 1 defgw ipaddr 192.168.0.5
# User maintenance
ipmitool user list 1 # Show user list (channel #1)
ipmitool user set name 5 fred # Assign user #5 to login name “fred”
ipmitool user set password 5 fredpwd # Assign user #5 to have password “fredpwd”
ipmitool user priv 5 4 1 # Give user #5 to have full admin privileges
ipmitool user enable 5 # Activate the user, so they can issue commands remotely
# Blink the identification light
ipmitool chassis identify force # Turn light on
ipmitool chassis identify 0 # Turn it off
# Raw IPMI commands
ipmitool raw <<command>> # Standard IPMI: netfn command ...
http://PowerEdgeC.com

16 Data Center Solutions
IPMI Network Scanning
Recipes to determine if an IP is a BMC:
• ipmitool – slowest; ~20 seconds per IP
• ipmiping – fast, ~2 seconds per IP
• idiscover – very fast; uses broadcast or GetChannelAuthCap

17 Data Center Solutions
IPMI Network Scanning
Recipes to determine if an IP is a BMC:
• ipmitool – slowest; ~20 seconds per IP
• ipmiping – fast, ~2 seconds per IP
• idiscover – very fast; uses broadcast or GetChannelAuthCap

18 Data Center Solutions
Burn-inExplicit Stress/Validation Tools
• CPU: cpuburn: http://freecode.com/projects/cpuburn
• Memory: memtester: http://pyropus.ca/software/memtester/
• Memory: memtest86+: http://www.memtest.org/
• Memory/IO: stressapptest: http://code.google.com/p/stressapptest/# Allocate 256MB of memory and run 8 "warm copy" threads, and 8 cpu load threads. Exit after 20 seconds.
stressapptest -s 20 -M 256 -m 8 -C 8 –W
# Run 2 file IO threads, and autodetect memory size and core count to select
# allocated memory and memory copy threads.
stressapptest -f /tmp/file1 -f /tmp/file2
• Storage: badblocks: http://e2fsprogs.sourceforge.net/# Destructive test, 3 passes, test 128 blocks at once. Block size 4096.badblocks –v –w –s –c 128 –b 4096 –p 3 /dev/sda
• Storage: smartmontools: http://sourceforge.net/apps/trac/smartmontools# Usually worth a look. Reads SMART data. Can be hard to interpret; various hd vendors use it differently
Smartctl --all /dev/sda
Metering tools (that also create stress)
• Storage: bonnie++: http://www.coker.com.au/bonnie++/
• Storage: iometer: http://www.iometer.org/
• Networking: iperf: http://iperf.sourceforge.net/
http://PowerEdgeC.com

19 Data Center Solutions
Command Line ToolsSome people prefer GUIs…
• Give me Unix-style, single purpose tools that return success/failure– Scriptable & scale well– Easy to reconfigure & change– These are the instrumentation steps to plug into a GUI anyway
• Encapsulate common operations as small tools:– Server quick overview (1 line)– Server full state – Server inventory– Server healthy? (1 line: yes/no)– Server full health info, including sensor readings
• Once built, splice small script together to view projects or racks– hadoop-rackA1, hadoop-rackA2, etc
http://PowerEdgeC.com

20 Data Center Solutions
PowerEdge C tools: Inventory & State
Dashboard & Full View
Dashboard Script
http://PowerEdgeC.com
21 Data Center Solutions
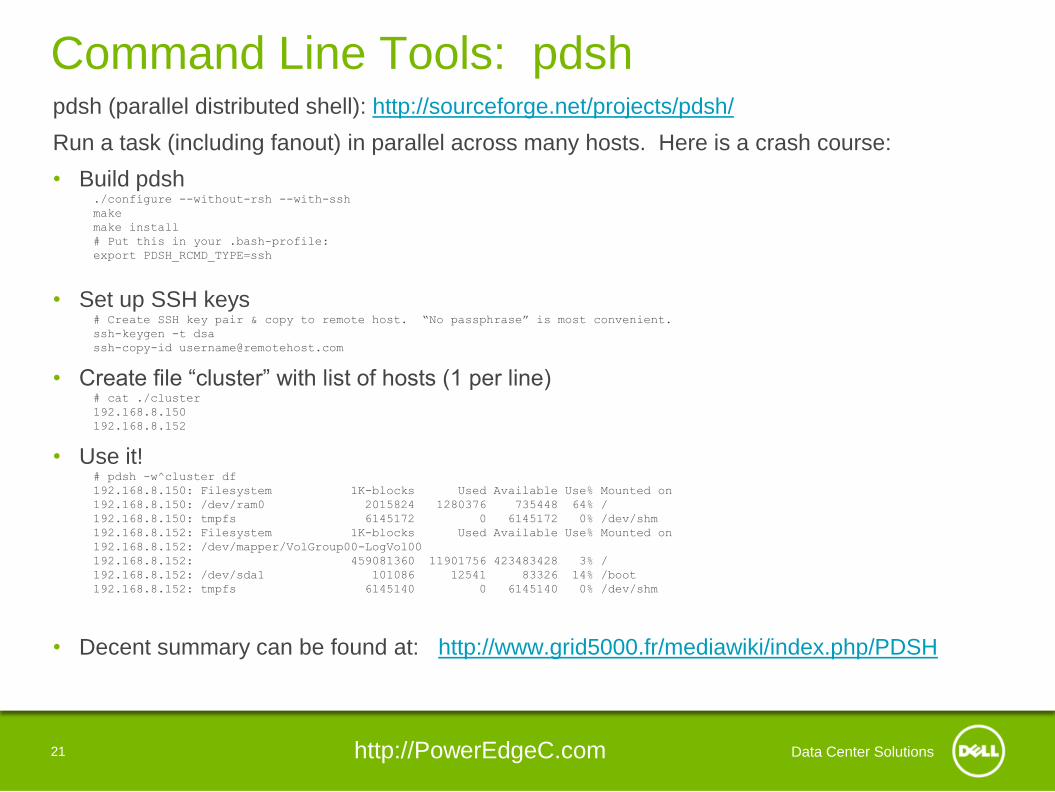
Command Line Tools: pdshpdsh (parallel distributed shell): http://sourceforge.net/projects/pdsh/
Run a task (including fanout) in parallel across many hosts. Here is a crash course:
• Build pdsh./configure --without-rsh --with-ssh
make
make install
# Put this in your .bash-profile:
export PDSH_RCMD_TYPE=ssh
• Set up SSH keys# Create SSH key pair & copy to remote host. “No passphrase” is most convenient.
ssh-keygen -t dsa
ssh-copy-id [email protected]
• Create file “cluster” with list of hosts (1 per line)# cat ./cluster
192.168.8.150
192.168.8.152
• Use it!# pdsh -w^cluster df
192.168.8.150: Filesystem 1K-blocks Used Available Use% Mounted on
192.168.8.150: /dev/ram0 2015824 1280376 735448 64% /
192.168.8.150: tmpfs 6145172 0 6145172 0% /dev/shm
192.168.8.152: Filesystem 1K-blocks Used Available Use% Mounted on
192.168.8.152: /dev/mapper/VolGroup00-LogVol00
192.168.8.152: 459081360 11901756 423483428 3% /
192.168.8.152: /dev/sda1 101086 12541 83326 14% /boot
192.168.8.152: tmpfs 6145140 0 6145140 0% /dev/shm
• Decent summary can be found at: http://www.grid5000.fr/mediawiki/index.php/PDSH
http://PowerEdgeC.com

22 Data Center Solutions
Health MonitoringMonitoring need not be complicated. Two options:
• Out-of-band– Very easy to setup– Completely agentless; OS agnostic– BMC watches sensors for issues– Monitor by polling (once/minute is enough)– Management traffic is physically separable– Impartial observer
• In-band– Agent runs on the production OS– A great example is collectd (http://collectd.org)– Can collect literally any data; utilization and app stats – May be “good enough” (hung apps require reset too)
• Either way, be sure to poll the SEL.– System Event Log shows permanent log of events as
they occur (assert/deassert)
• And monitor storage In-band (Agent-based)
Out-of-band (BMC-based)
http://PowerEdgeC.com

23 Data Center Solutions
BMC Health monitoring
Strategy:
- Issue this command
- Look for non “ok” or “ns” status
- Once per minute should be enough
http://PowerEdgeC.com

24 Data Center Solutions
Health Monitoring, ii (Bonus points)
• Nagios provides a graphical console front-end
• Bonus points if you – feed sensor data into a db, and
– Apply visualization tools like Cacti (uses RRDtool)
– May discover non-obvious trends (hot spots in the Data Center)
• A service-level monitor is also nice– OS can appear alive, but App stack is
dead
– Monitoring may be very app-specific
– Framework like Munin works well (http://munin-monitoring.org/)
http://PowerEdgeC.com

25 Data Center Solutions
Best Practice: Tuning & Incremental Rollout
• Build proof of concept rather than speculate– Theoretical knowledge only goes so far with such
complex systems
– Workload patterns drive the architecture
– Sometimes, impossible to know until you actually start
• If possible, scale up slowly (staged rollout)– 5%, 20%, 50%, 100%
– Shake out bugs & limit their impact
– Gives you opportunity to limit scope of physical changes, if required
– Will become apparent if ratios are right( CPU-cores :: amount of RAM :: Number/type of Hard Drive )
– Optimizations can be made for future orders
http://PowerEdgeC.com

26 Data Center Solutions
Best Practices, continued
• badblocks, 3 passes @ 100% clean saves a lot of trouble with drives (detect early mortality)
• If it’s not broken, don’t touch it– Old firmware is ok
– Unless it isn’t
– You’ll know if it isn’t
– Upgrades always carry risk
http://PowerEdgeC.com

27 Data Center Solutions
Updating Mass Numbers of Machines
Two Major Strategies: BMC or PXE
• BMC (manage by IPMI)– Managed out-of-band, from a central point
– Simple in concept
– Limited as to what it can do (settings, firmware)
– May be able to carry out updates without host reboots
• PXE image to carry out actions– More complicated
– Higher upfront effort, lower effort each use
– Tailored to each vendor’s hardware
– No limits on scope, or what can be done
– Requires reboots & some downtime
– Test on 1, then 5%, before rolling out to all
• pdsh / pdcp is great for small/simple tasks
http://PowerEdgeC.com

Questions and Answers
System Management in the
Hyperscale Cloud
Ask Dell’s Michael Stumpf
Partnered with OpenSystems Media

Thanks for joining us.
More information on AMD’s cloud offerings can be found at www.AMD.com/cloud
You’ll find an archive of this event at:
http://ecast.opensystemsmedia.com/
Send us your comments on the presentation:
Partnered with OpenSystems Media