best practices symposium - reaganconsulting.com
TRANSCRIPT

J a n u a r y 1 5 - 1 7 , 2 0 2 0 | N e w O r l e a n s , L A
BEST PRACTICES
SYMPOSIUM
WELCOME
Bobby Reagan and Tom DoranReagan Consulting

WiFi Information:
Network:
IIABA
Password (case sensitive):
bigimeet
3
Download the
BigIEvents
APP
Best Practices Symposium Password: BPS2020
Important Things to Know
Three Breakouts:
9 Separate Sessions
Cocktails and Dine-Arounds Tonight
Optional Devotional
Tuesday Morning
4
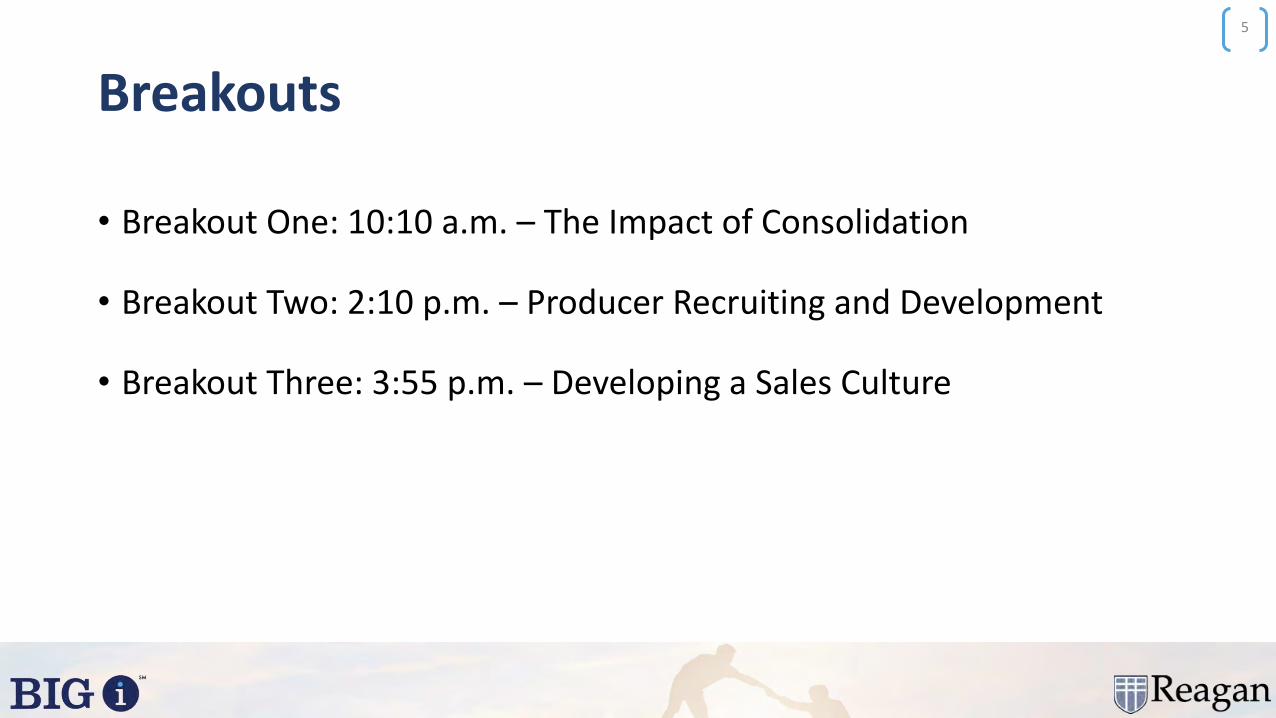
Breakouts
• Breakout One: 10:10 a.m. – The Impact of Consolidation
• Breakout Two: 2:10 p.m. – Producer Recruiting and Development
• Breakout Three: 3:55 p.m. – Developing a Sales Culture
5
Important Things to Know
Three Breakouts:
9 Separate Sessions
Cocktails and Dine-Arounds Tonight
Optional Devotional
Tuesday Morning
6
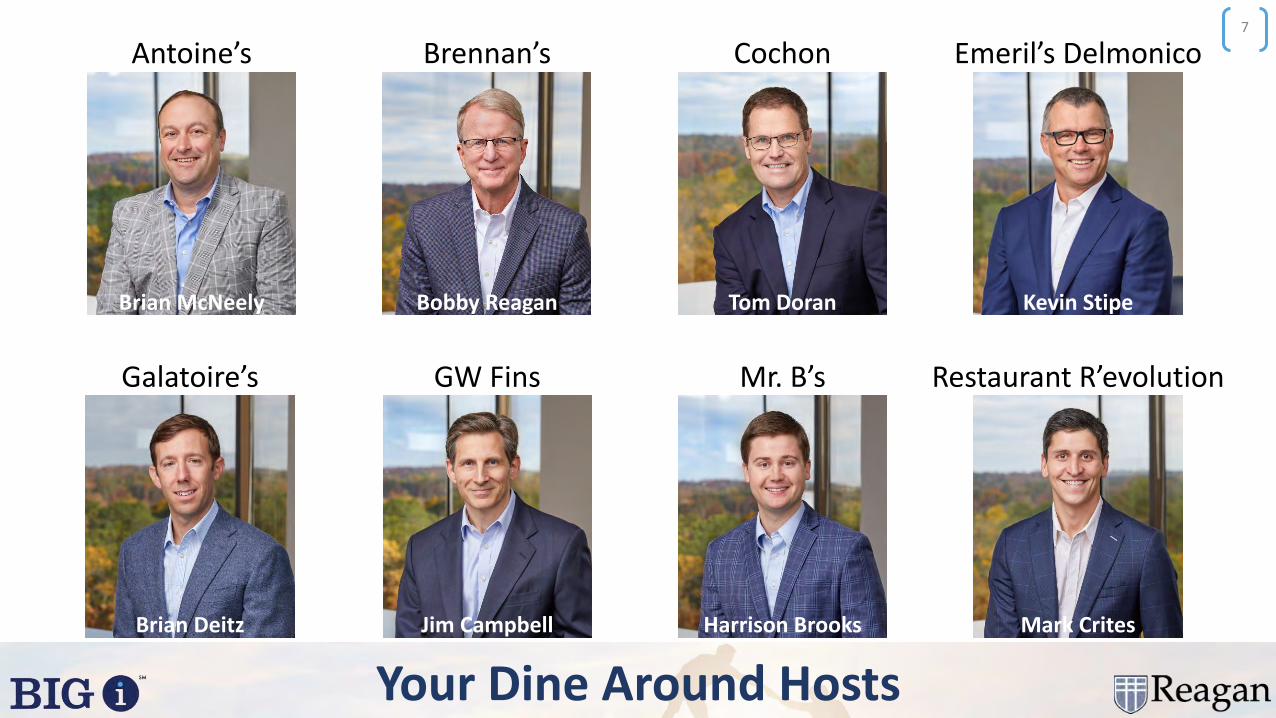
Your Dine Around Hosts
7
Antoine’s Brennan’s Cochon Emeril’s Delmonico
Galatoire’s GW Fins Mr. B’s Restaurant R’evolution
Brian McNeely Bobby Reagan Tom Doran Kevin Stipe
Brian Deitz Jim Campbell Harrison Brooks Mark Crites

Dinner Tonight – Dine Arounds
8
Keep your name badge on during dinner, please
Important Things to Know
Three Breakouts:
9 Separate Sessions
Cocktails and Dine-Arounds Tonight
Optional Devotional
Tuesday Morning
9
10
Friday Morning Devotional

We Want Your Input and Feedback!
Text to:
(747) 444-3548Message:
reagan
11
14
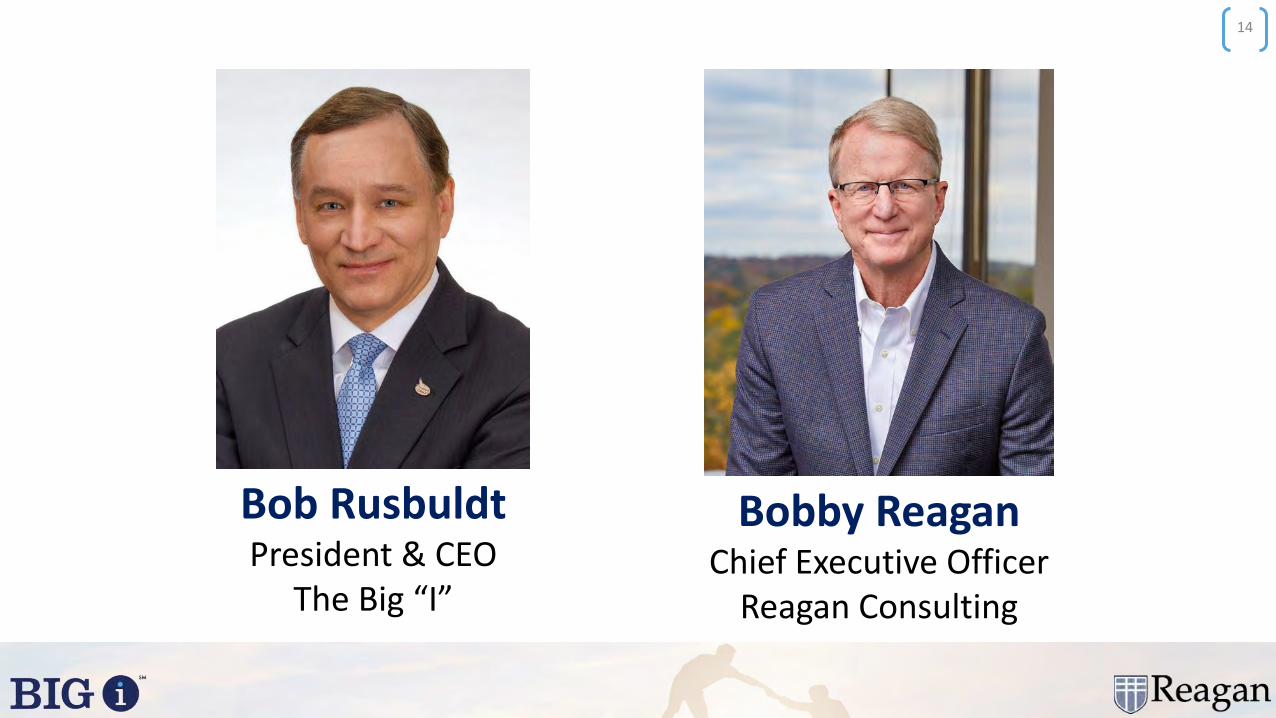
Bob RusbuldtPresident & CEO
The Big “I”
Bobby ReaganChief Executive Officer
Reagan Consulting

J a n u a r y 1 5 - 1 7 , 2 0 2 0 | N e w O r l e a n s , L A
BEST PRACTICES
SYMPOSIUM
We have come a long way……are we there yet?
Bobby ReaganReagan Consulting
16
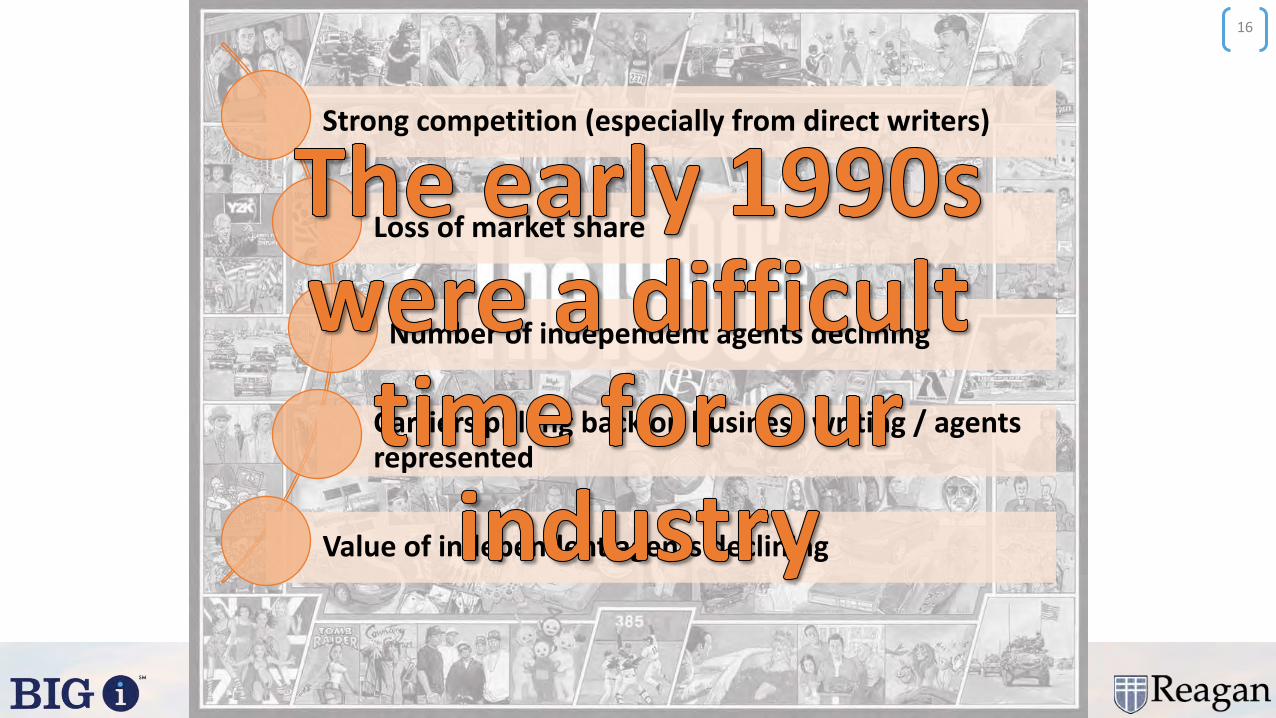
Strong competition (especially from direct writers)
Loss of market share
Number of independent agents declining
Carriers pulling back on business writing / agents represented
Value of independent agents declining
• The IIAA formed The Presidential Commission to Enhance Agency Values with three key objectives:
1) Improve efficiency of agency/company relations
2) Improve legislative and regulatory environment
3) Help agents operate more efficiently
In the early 1990s…
17
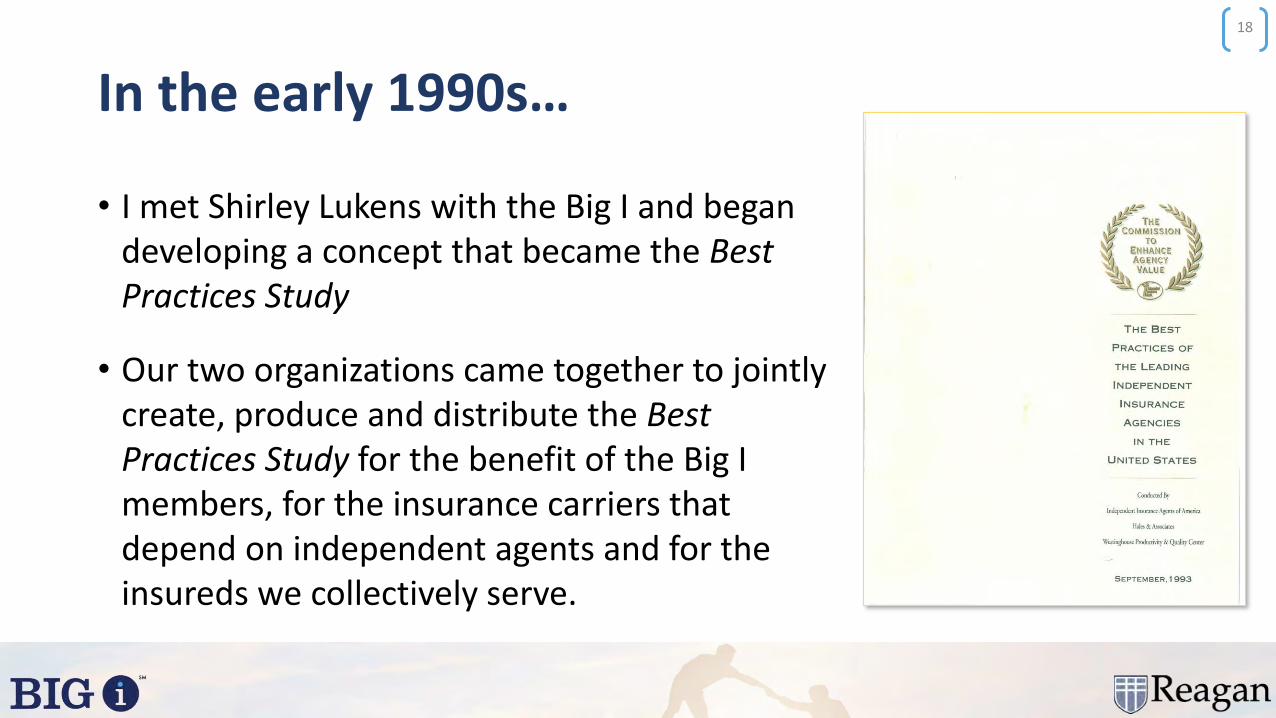
• I met Shirley Lukens with the Big I and began developing a concept that became the Best Practices Study
• Our two organizations came together to jointly create, produce and distribute the Best Practices Study for the benefit of the Big I members, for the insurance carriers that depend on independent agents and for the insureds we collectively serve.
In the early 1990s…
18
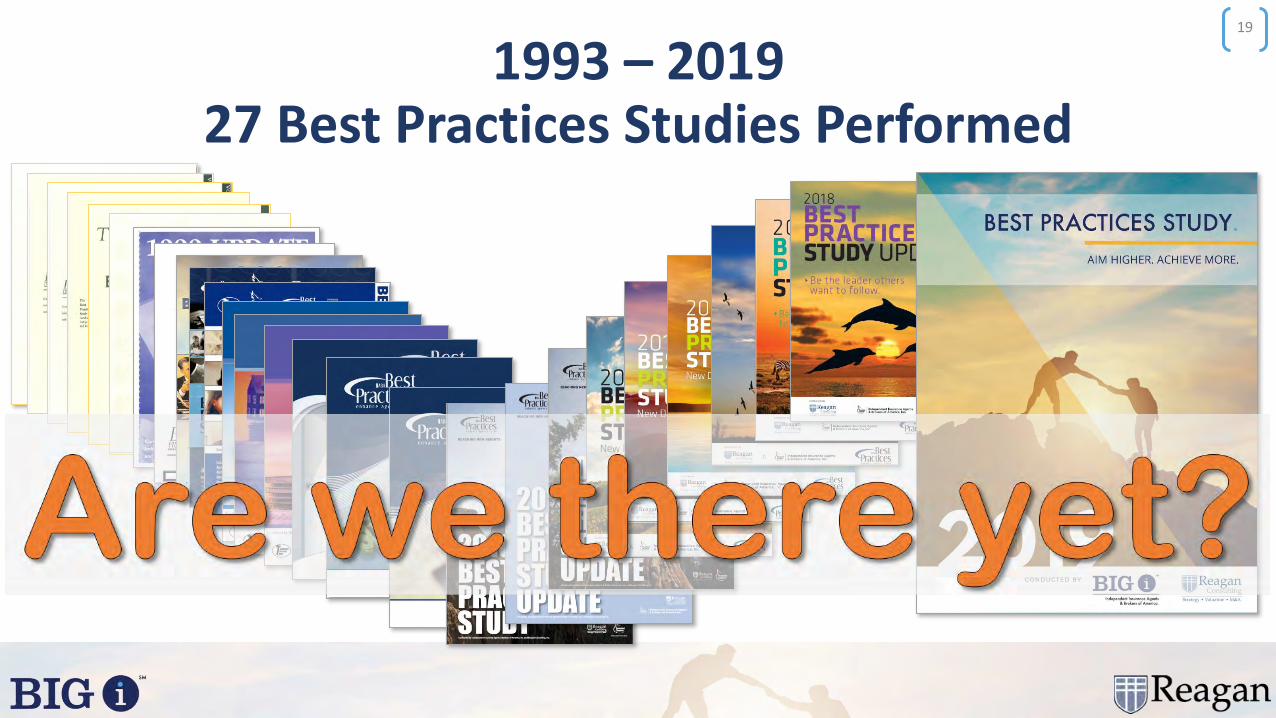
1993 – 201927 Best Practices Studies Performed
19

1993 – 2019: Are we there yet?
20
Pro Forma Profit
Revenue per Employee
Typical INTERNAL Agency Valuation(multiple of revenue)
Typical EXTERNAL Agency Valuation(multiple of revenue)
12% 27%
$80,793 $179,303
1.0x 1.6x
1.4x 2.5x
✓ Performance has improved tremendously
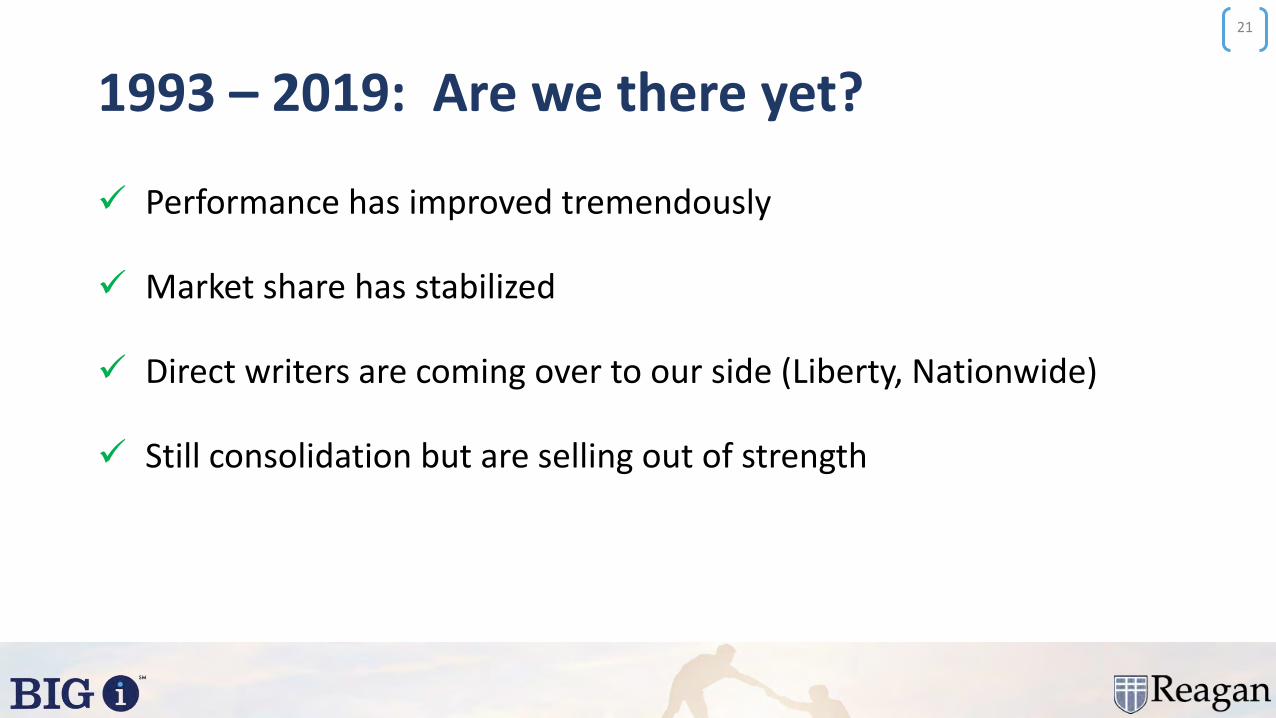
1993 – 2019: Are we there yet?
✓ Performance has improved tremendously
✓ Market share has stabilized
✓ Direct writers are coming over to our side (Liberty, Nationwide)
✓ Still consolidation but are selling out of strength
21

1993 – 2019: Are we there yet?
There is still room for improvement, even for those in this room (i.e., the Best)
Insureds’ needs and expectations are growing
Existing peers will begin to elevate their performance
New competitors will come onto the scene
Change will come even more rapidly than in the past
22
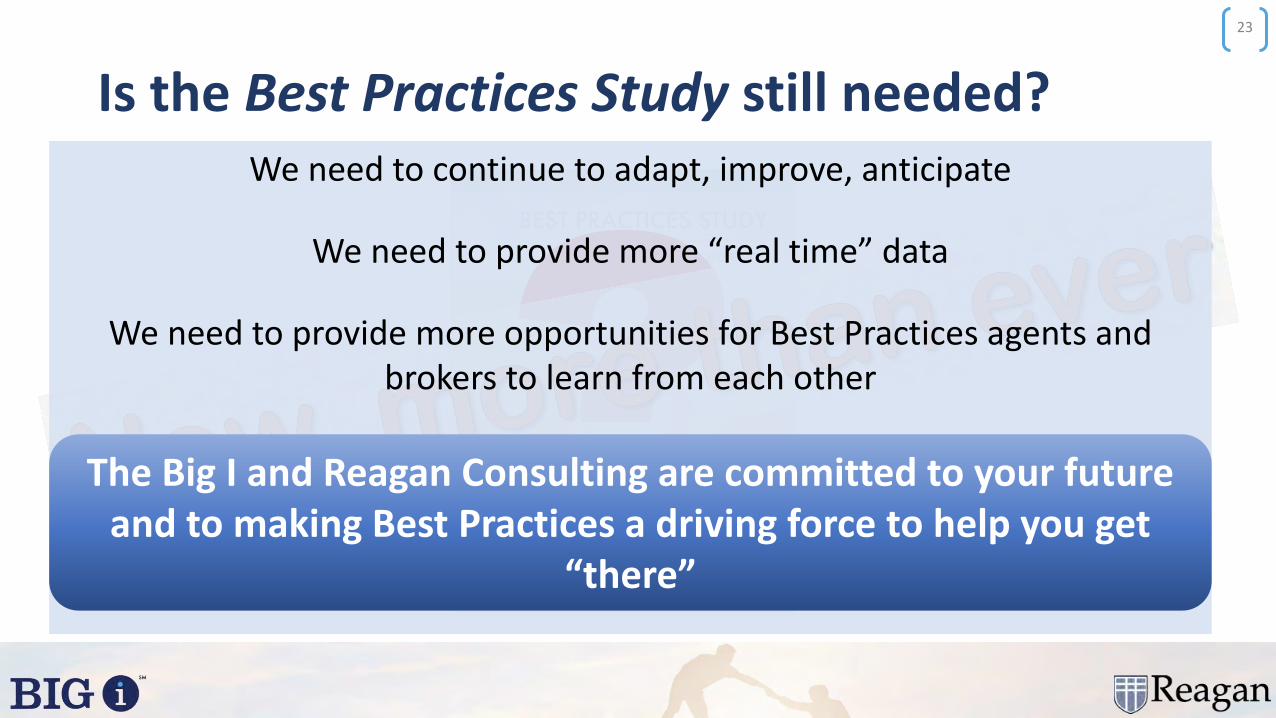
Is the Best Practices Study still needed?
23
We need to continue to adapt, improve, anticipate
We need to provide more “real time” data
We need to provide more opportunities for Best Practices agents and brokers to learn from each other
The Big I and Reagan Consulting are committed to your future and to making Best Practices a driving force to help you get
“there”

24
on being a Best Practices Agency

Our challenge to you is to get everything out of Best Practices and this Symposium that you can
25
New ideas or strategies for your agency
New personal relationships
New ways to help you personally

J a n u a r y 1 5 - 1 7 , 2 0 2 0 | N e w O r l e a n s , L A
BEST PRACTICES
SYMPOSIUM
The Impact of Consolidation
Kevin StipeReagan Consulting
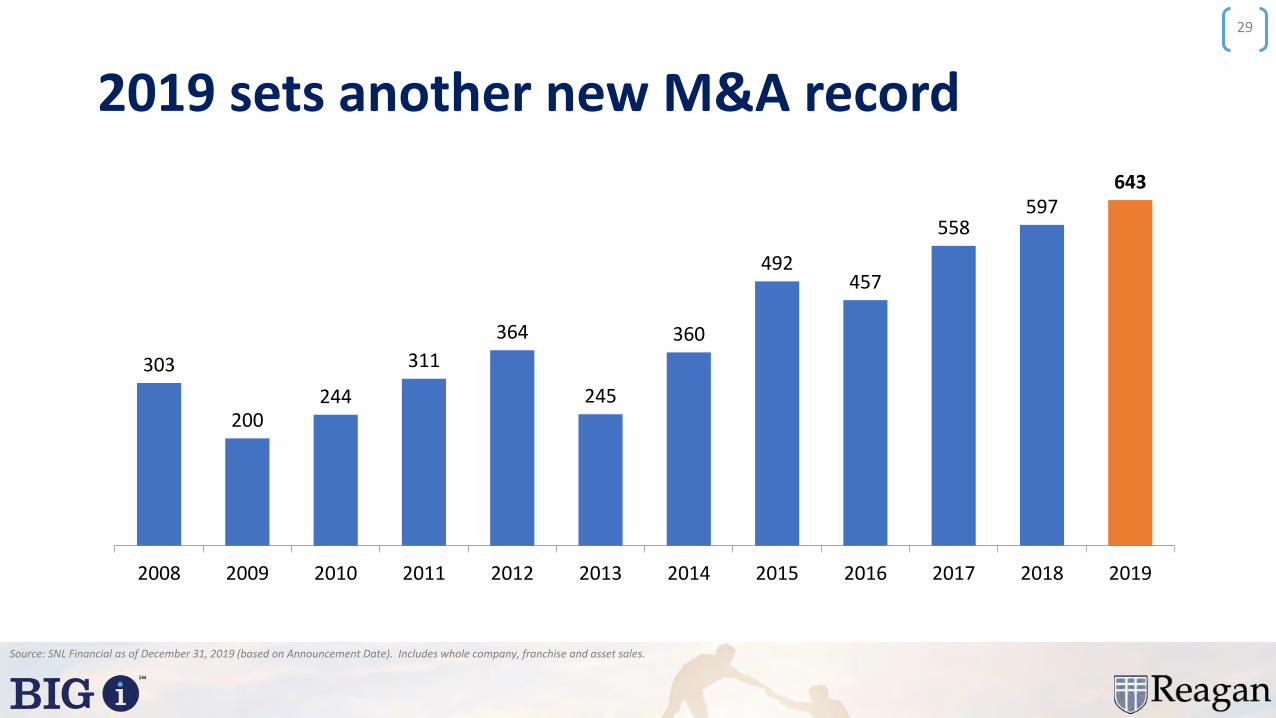
303
200244
311
364
245
360
492457
558597
643
2008 2009 2010 2011 2012 2013 2014 2015 2016 2017 2018 2019
2019 sets another new M&A record
Source: SNL Financial as of December 31, 2019 (based on Announcement Date). Includes whole company, franchise and asset sales.
29
Source: SNL Financial as of December 31, 2019 (based on Announcement Date). Includes whole company, franchise and asset sales.
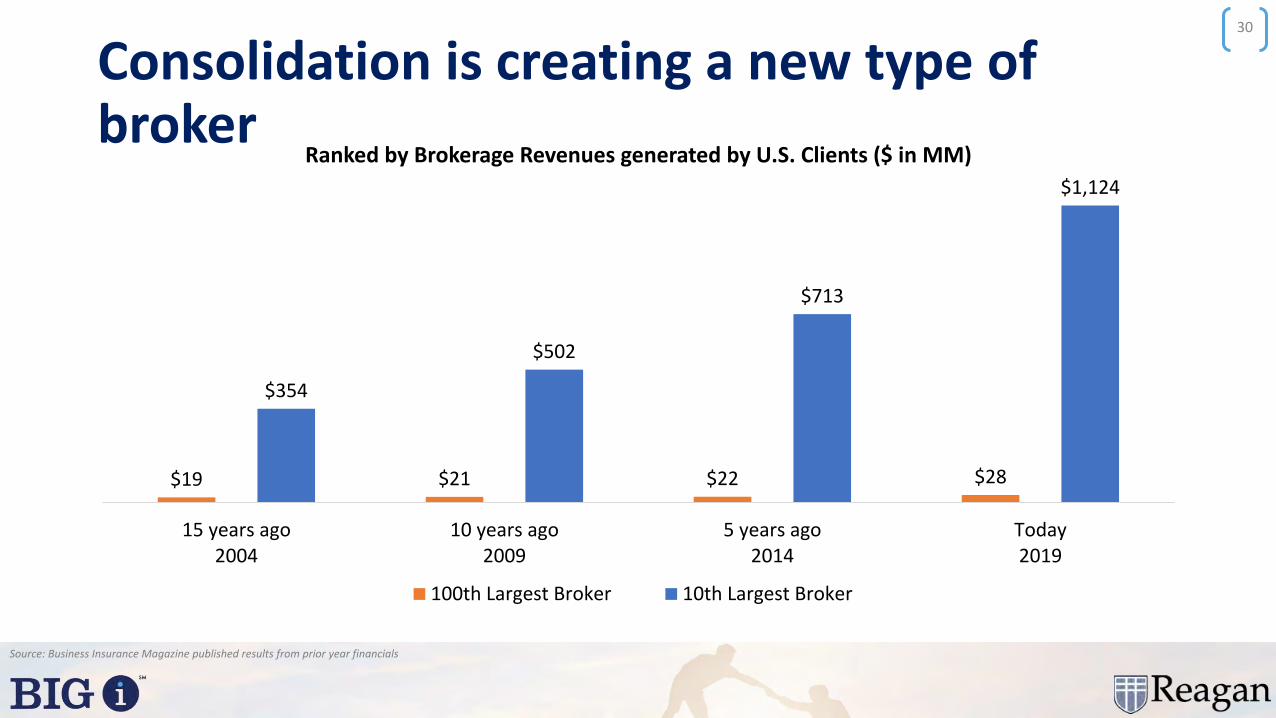
Consolidation is creating a new type of broker
30
$19 $21 $22 $28
$354
$502
$713
$1,124
15 years ago2004
10 years ago2009
5 years ago2014
Today2019
Ranked by Brokerage Revenues generated by U.S. Clients ($ in MM)
100th Largest Broker 10th Largest Broker
Source: Business Insurance Magazine published results from prior year financials

Billionaires Club – 1984Billionaires Club – 2013Billionaires Club – 2020
31
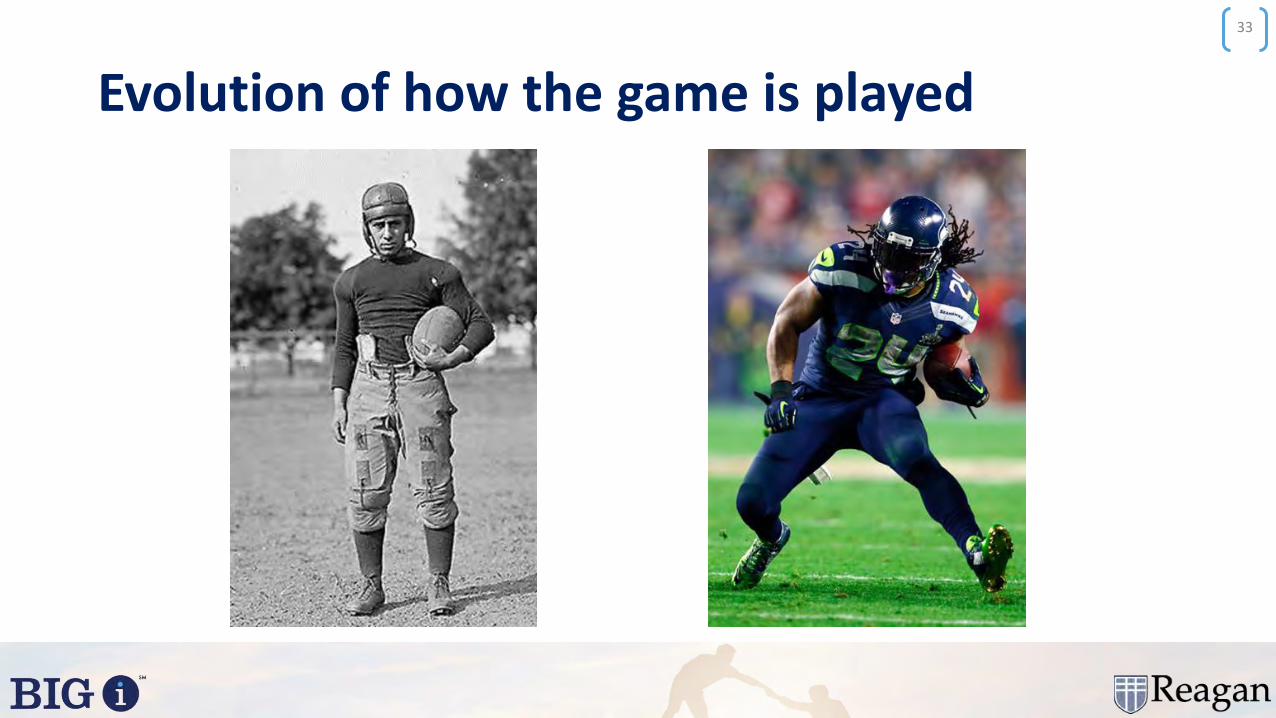
Evolution of how the game is played
33
Consolidation’s competing theories
34
Passing FadCatalyst for
Radical Change
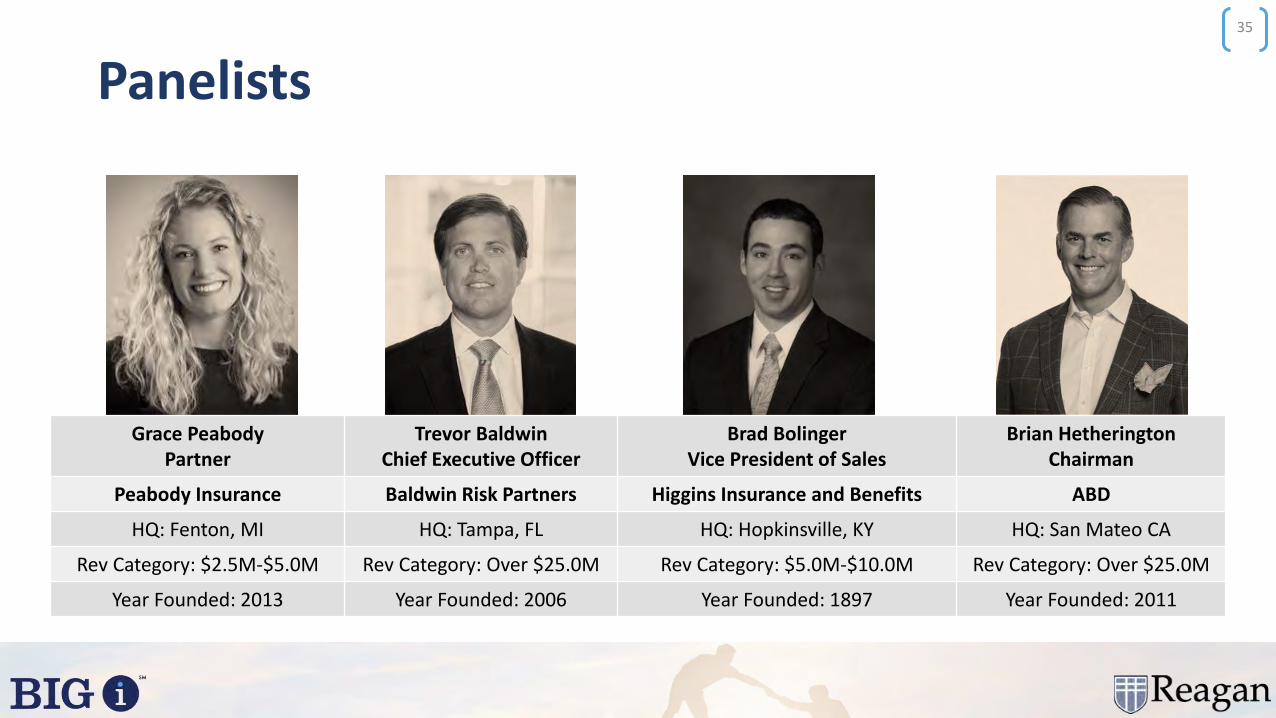
Panelists35
Grace PeabodyPartner
Trevor BaldwinChief Executive Officer
Brad BolingerVice President of Sales
Brian HetheringtonChairman
Peabody Insurance Baldwin Risk Partners Higgins Insurance and Benefits ABD
HQ: Fenton, MI HQ: Tampa, FL HQ: Hopkinsville, KY HQ: San Mateo CA
Rev Category: $2.5M-$5.0M Rev Category: Over $25.0M Rev Category: $5.0M-$10.0M Rev Category: Over $25.0M
Year Founded: 2013 Year Founded: 2006 Year Founded: 1897 Year Founded: 2011
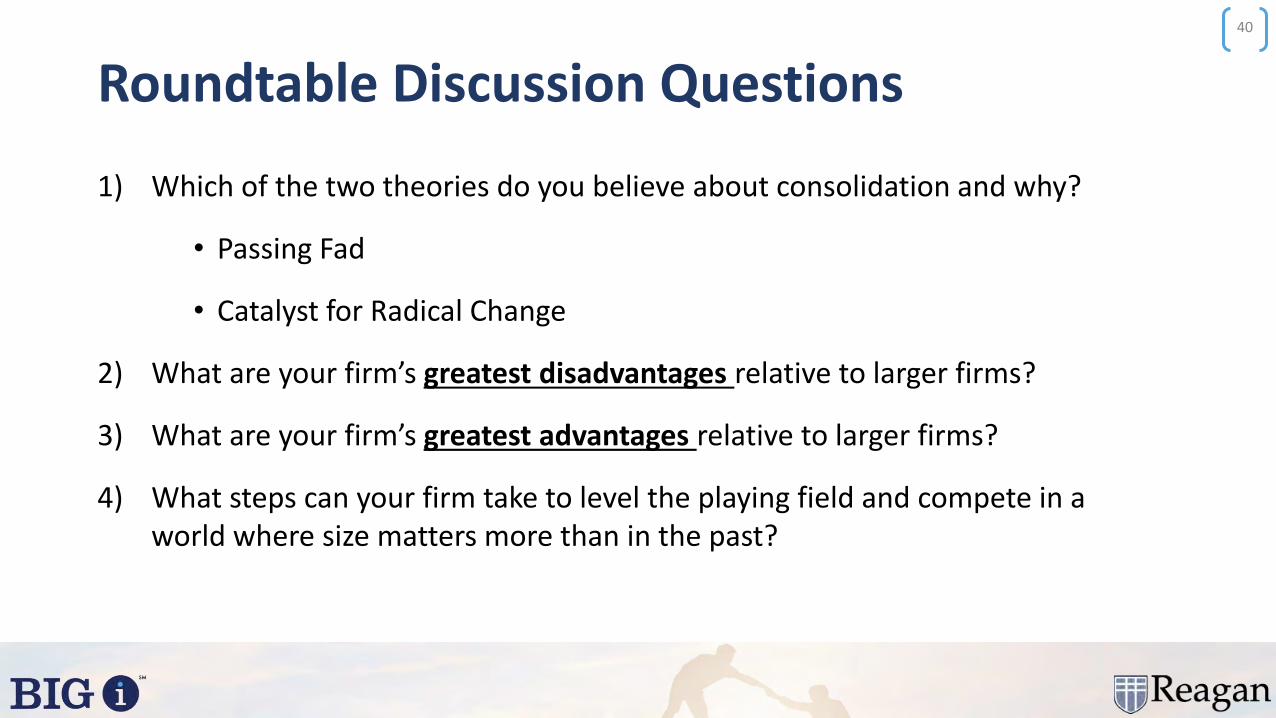
Roundtable Discussion Questions40
1) Which of the two theories do you believe about consolidation and why?
• Passing Fad
• Catalyst for Radical Change
2) What are your firm’s greatest disadvantages relative to larger firms?
3) What are your firm’s greatest advantages relative to larger firms?
4) What steps can your firm take to level the playing field and compete in a world where size matters more than in the past?

J a n u a r y 1 5 - 1 7 , 2 0 2 0 | N e w O r l e a n s , L A
BEST PRACTICES
SYMPOSIUM
Best Practices Awards Luncheon Banquet


J a n u a r y 1 5 - 1 7 , 2 0 2 0 | N e w O r l e a n s , L A
BEST PRACTICES
SYMPOSIUM
Top Performing Best Practices Agenciesby Revenue Category
Source:
20
2019 Highest Performing BPA:Under $1.25 Million in Revenue
Source:
Nelson Hatchett
2019 Highest Performing BPA:$1.25 - $2.5 Million in Revenue
Source:
Bob Klinger

2019 Highest Performing BPA:$2.5 - $5.0 Million in Revenue
Source:
Adam Yeager

2019 Highest Performing BPA:$5.0 - $10.0 Million in Revenue
Source:
J. R. Reilly
The Reilly Company

2019 Highest Performing BPA:$10.0 - $25.0 Million in Revenue
Source:
John Marek
2019 Highest Performing BPA:Over $25.0 Million in Revenue
Source:
Kurt de GroszBrian Heatherington
J a n u a r y 1 5 - 1 7 , 2 0 2 0 | N e w O r l e a n s , L A
BEST PRACTICES
SYMPOSIUM
Producer Recruiting & Development –Redefining the Issue
Brian Deitz & Mark CritesReagan Consulting
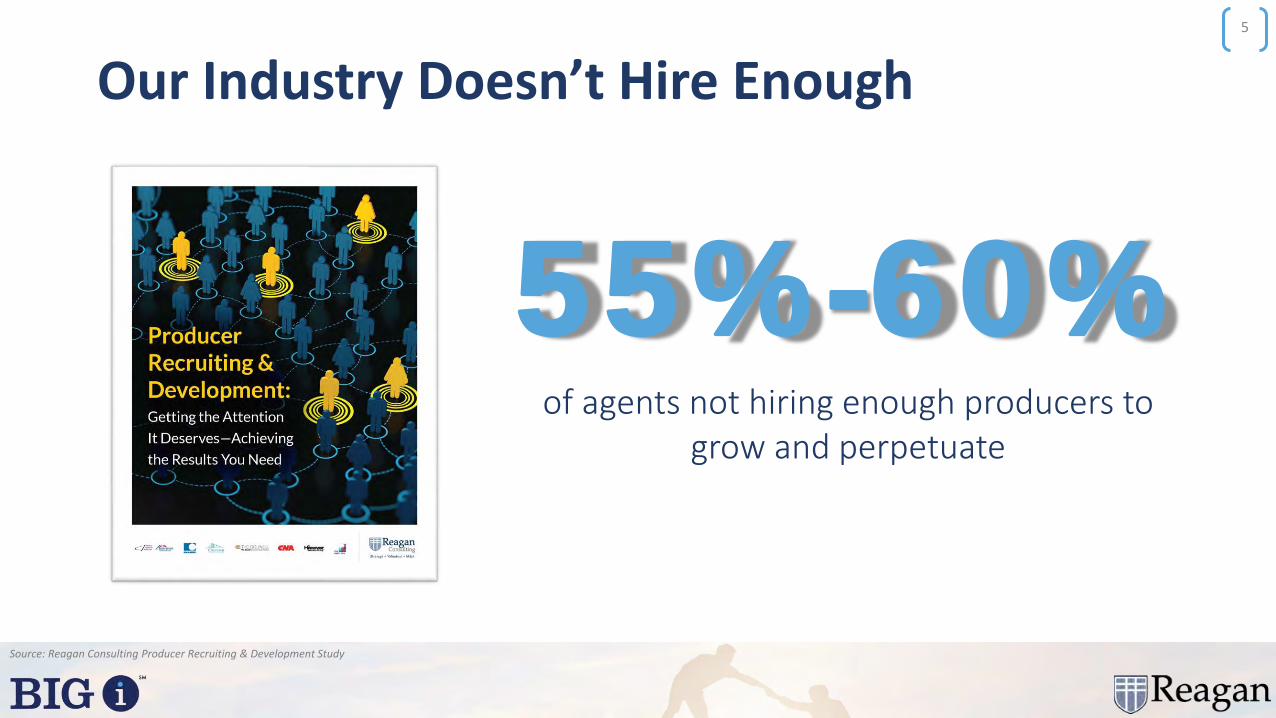
Our Industry Doesn’t Hire Enough
Source: Reagan Consulting Producer Recruiting & Development Study
5
55%-60%of agents not hiring enough producers to
grow and perpetuate
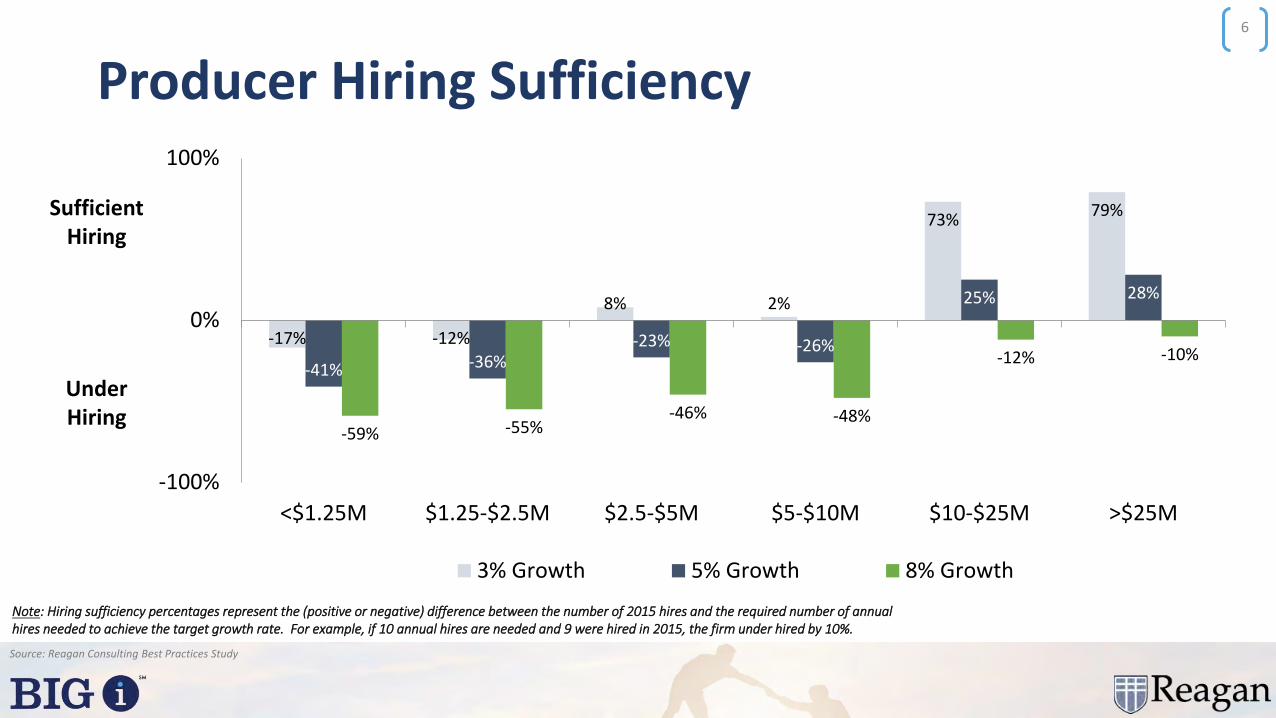
Source: Reagan Consulting Best Practices Study
6
Note: Hiring sufficiency percentages represent the (positive or negative) difference between the number of 2015 hires and the required number of annual hires needed to achieve the target growth rate. For example, if 10 annual hires are needed and 9 were hired in 2015, the firm under hired by 10%.
-17% -12%
8% 2%
73%79%
-41% -36%-23% -26%
25% 28%
-59% -55%-46% -48%
-12% -10%
-100%
0%
100%
<$1.25M $1.25-$2.5M $2.5-$5M $5-$10M $10-$25M >$25M
3% Growth 5% Growth 8% Growth
SufficientHiring
UnderHiring
Producer Hiring Sufficiency

Producer Success Rates
Source: Reagan Value Index
7
53.1%2008 Producer Hiring
Success Rate
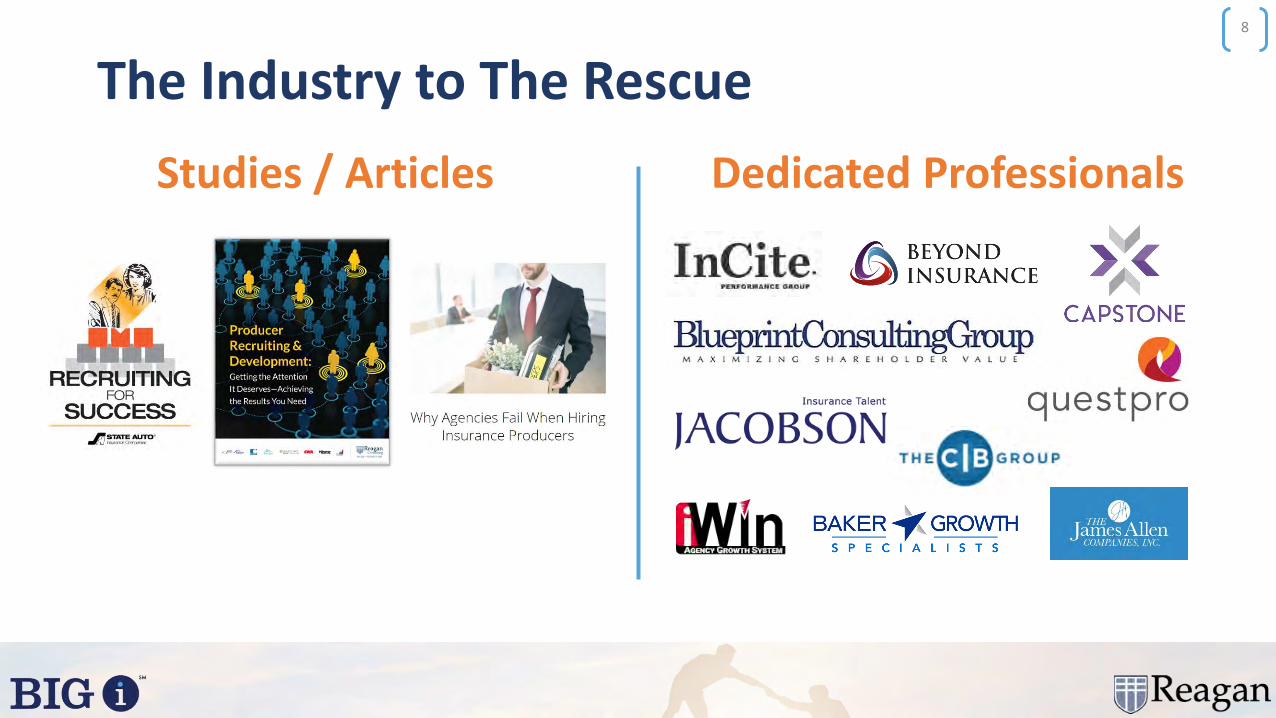
The Industry to The Rescue8
Studies / Articles Dedicated Professionals
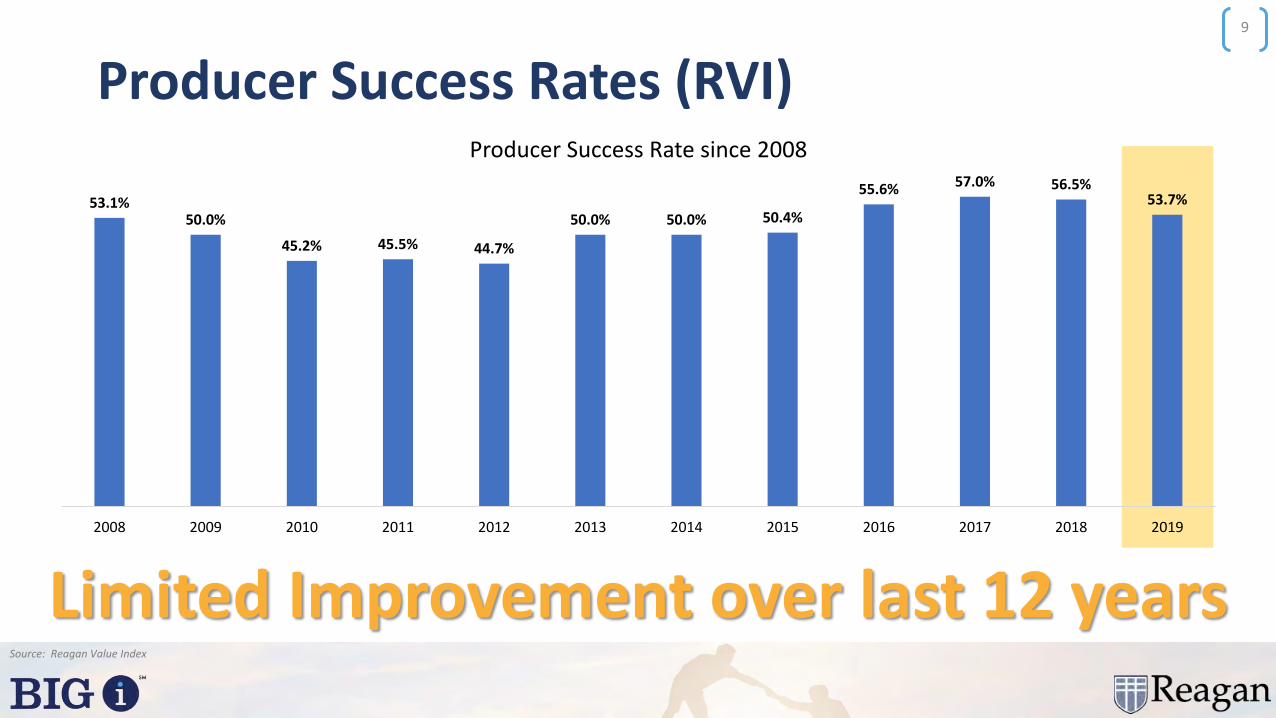
Producer Success Rates (RVI)
Source: Reagan Value Index
9
53.1%50.0%
45.2% 45.5% 44.7%
50.0% 50.0% 50.4%
55.6% 57.0% 56.5%53.7%
2008 2009 2010 2011 2012 2013 2014 2015 2016 2017 2018 2019
Producer Success Rate since 2008
Limited Improvement over last 12 years
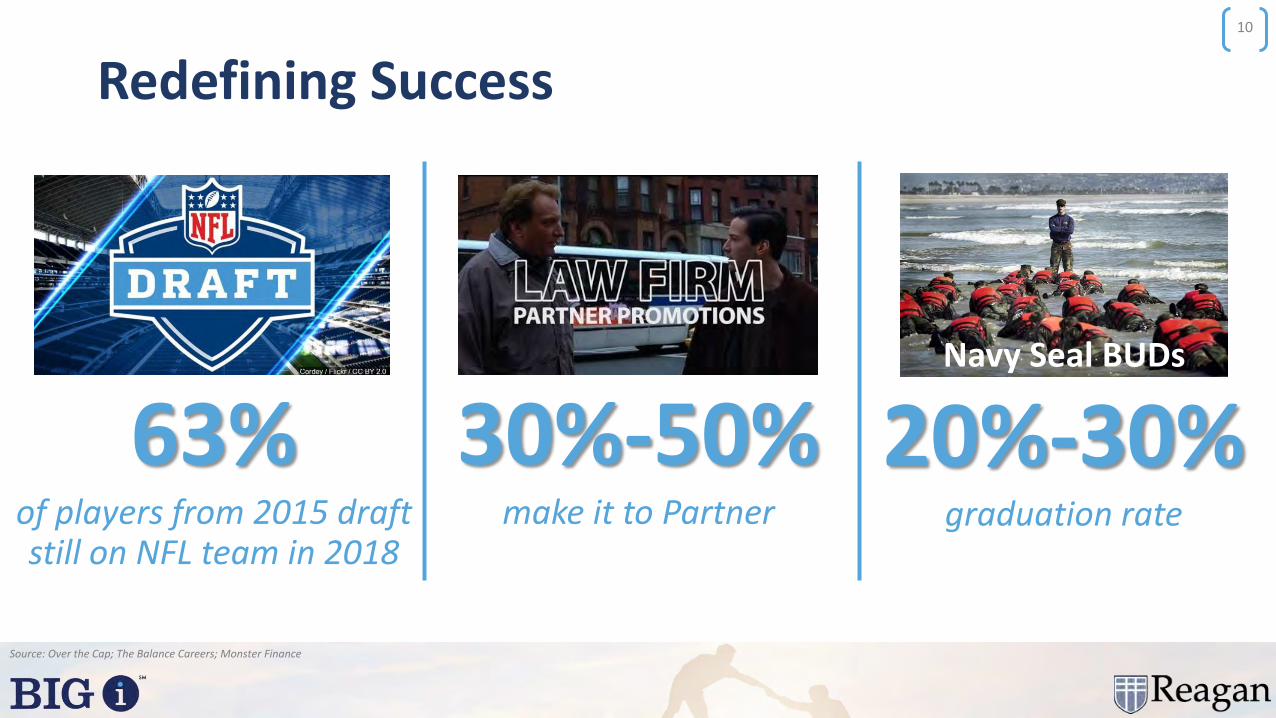
Redefining Success
Source: Over the Cap; The Balance Careers; Monster Finance
10
20%-30%graduation rate
30%-50%make it to Partner
Navy Seal BUDs
63%of players from 2015 draft still on NFL team in 2018

Is Being Successful Worth it?
Source: Reagan Consulting Producer Recruiting & Development Study; Reagan Consulting Analysis
12
Successful Producer Unsuccessful Producer
Starting Salary $60,000 $60,000
Year 2 Compensation $65,000 $32,500
Year 3 Compensation $70,000 $0
Year 4 Compensation Validated (40% / 30%) $0
Year 5 Compensation Validated (40% / 30%) $0
Year 1 Business Written $25,000 $0
Year 2 Business Written $50,000 $0
Year 3 Business Written $75,000 $0
Year 4 Business Written $90,000 $0
Year 5 Business Written $90,000 $0
Year 5 Book $306,000 $0
• The chart at right looks at basic assumptions for a typical producer hire
• We assumed a roughly 20% - 23% margin on the book of business in years 3 – 5
• The book of business is worth 1.5 x revenue - a standard internal valuation multiple
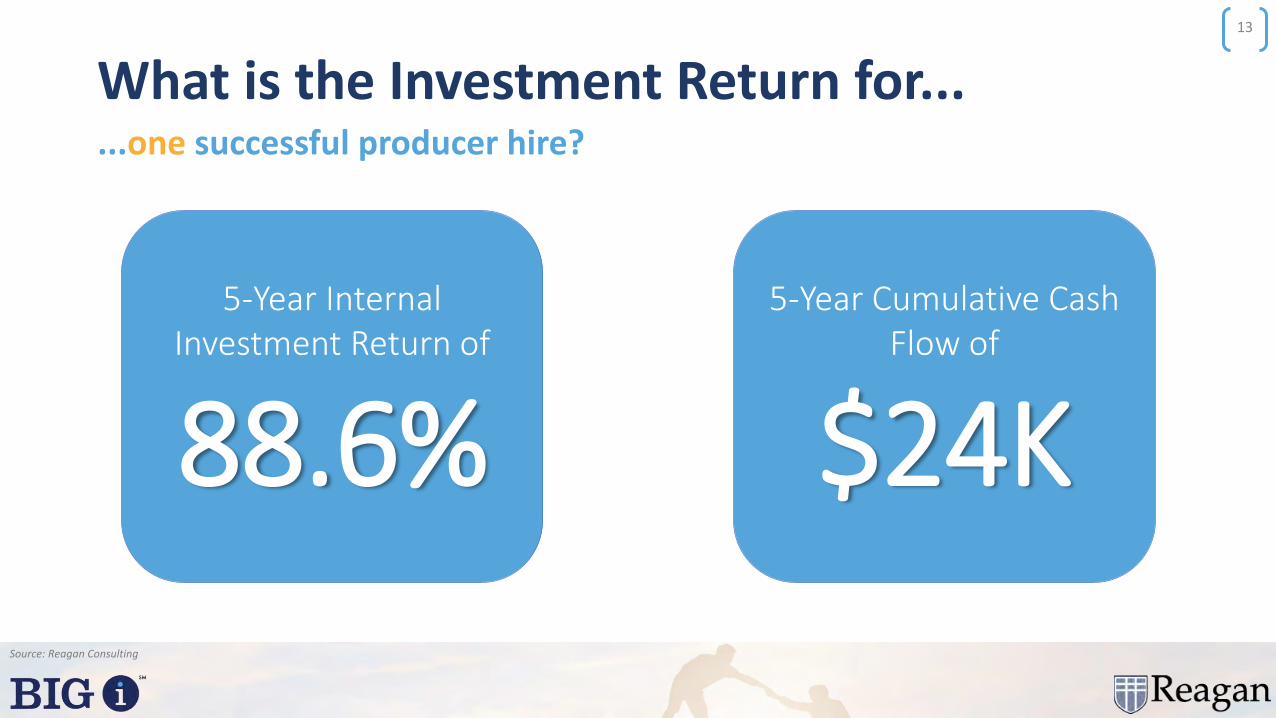
What is the Investment Return for...
Source: Reagan Consulting
13
...one successful producer hire?
5-Year Internal Investment Return of
88.6%
5-Year Cumulative Cash Flow of
$24K
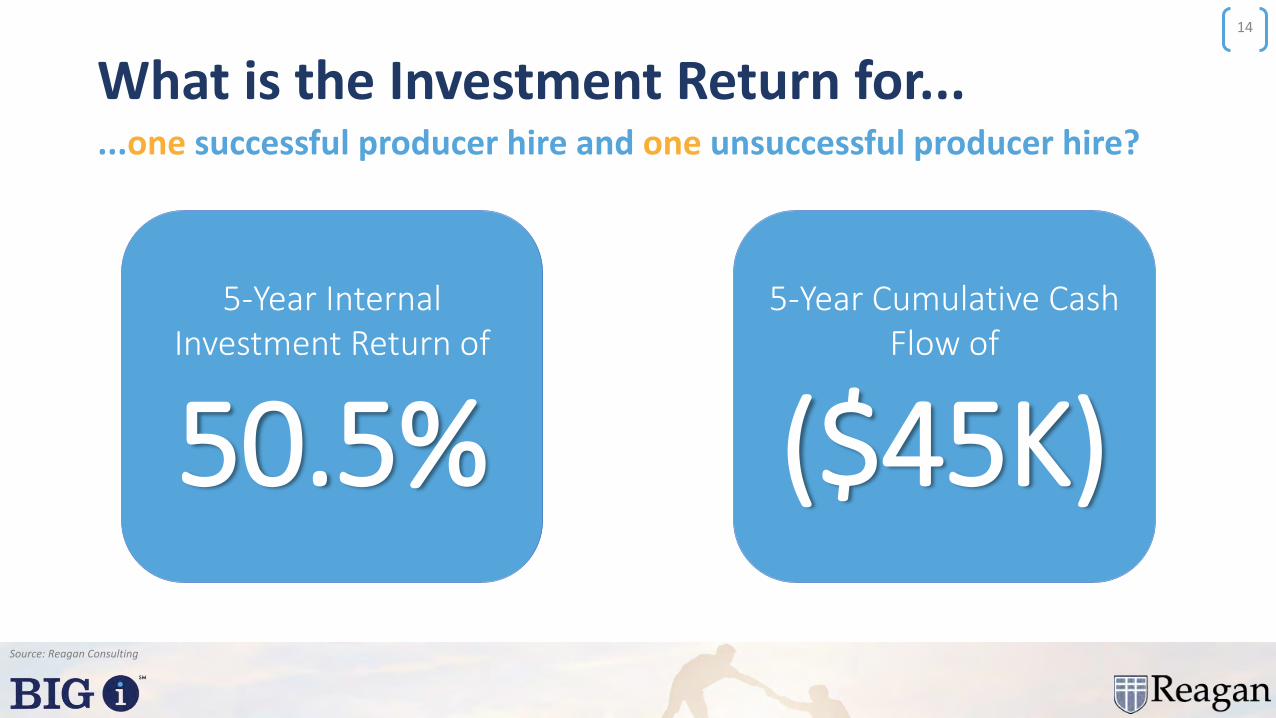
What is the Investment Return for...
Source: Reagan Consulting
14
...one successful producer hire and one unsuccessful producer hire?
5-Year Internal Investment Return of
50.5%
5-Year Cumulative Cash Flow of
($45K)
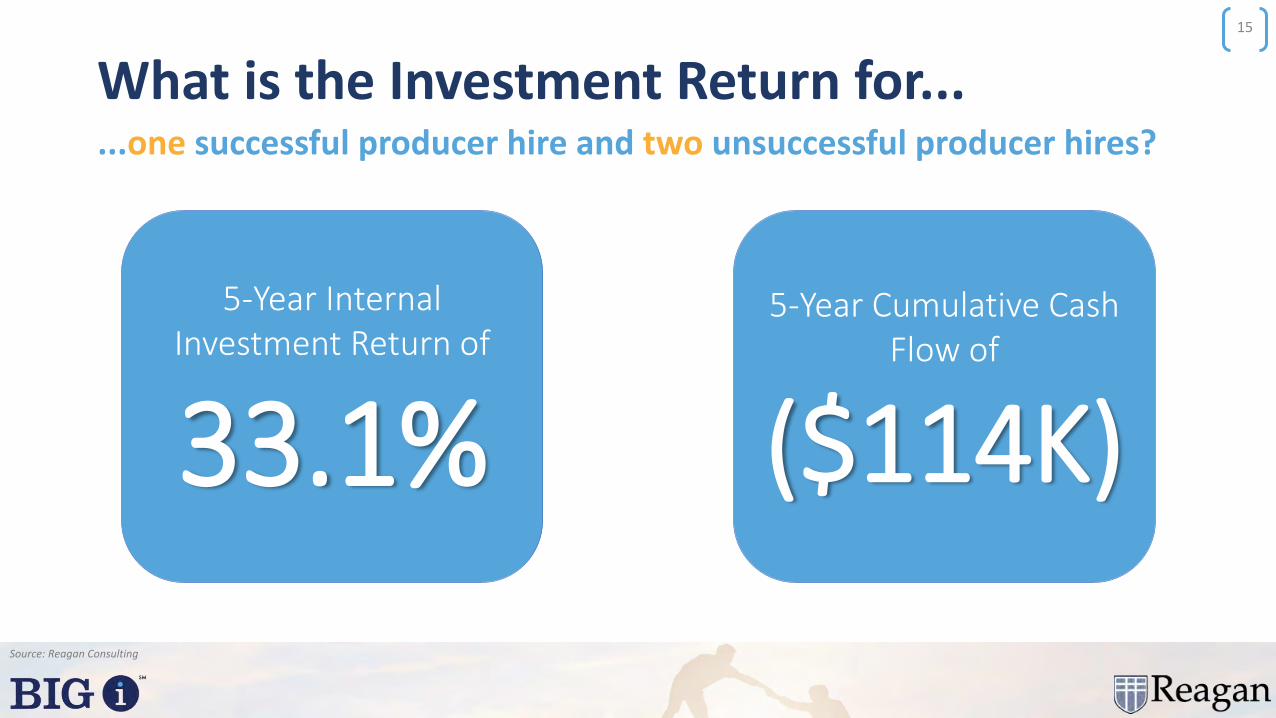
What is the Investment Return for...
Source: Reagan Consulting
15
...one successful producer hire and two unsuccessful producer hires?
5-Year Internal Investment Return of
33.1%
5-Year Cumulative Cash Flow of
($114K)

What is the Investment Return for...
Source: Reagan Consulting
16
...one successful producer hire and three unsuccessful producer hires?
5-Year Internal Investment Return of
22.2%
5-Year Cumulative Cash Flow of
($183K)
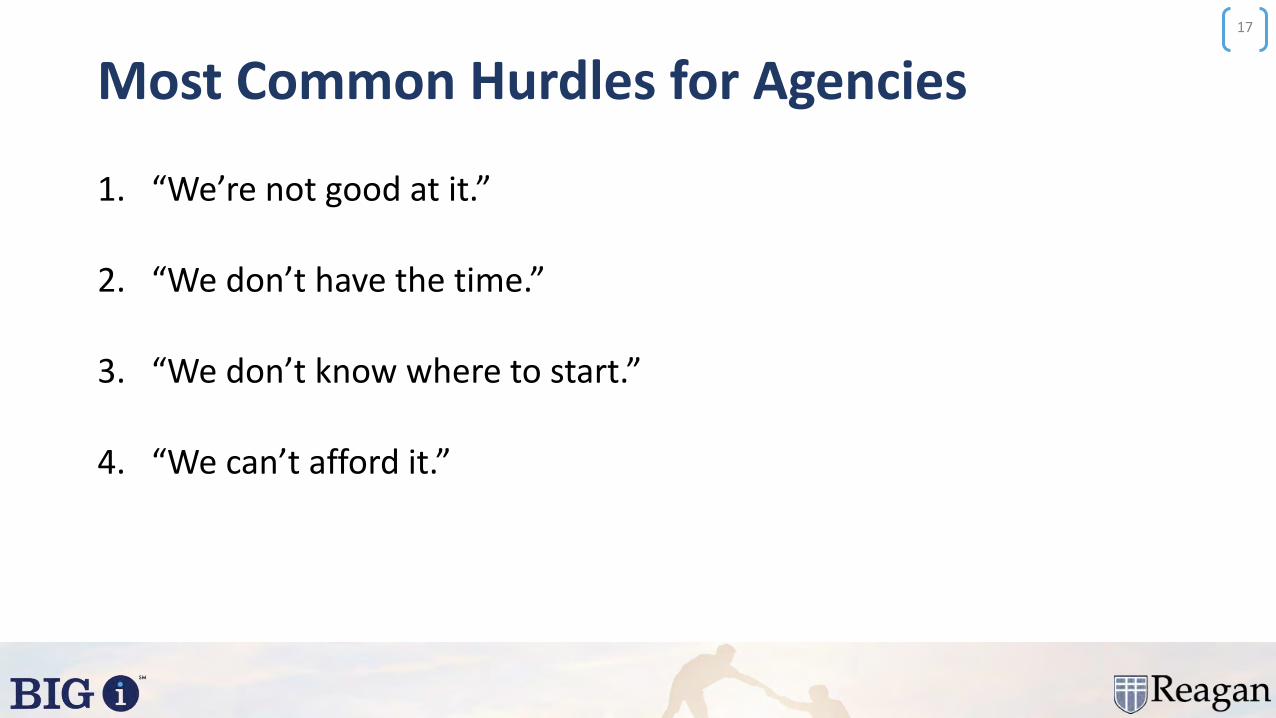
Most Common Hurdles for Agencies
1. “We’re not good at it.”
2. “We don’t have the time.”
3. “We don’t know where to start.”
4. “We can’t afford it.”
17
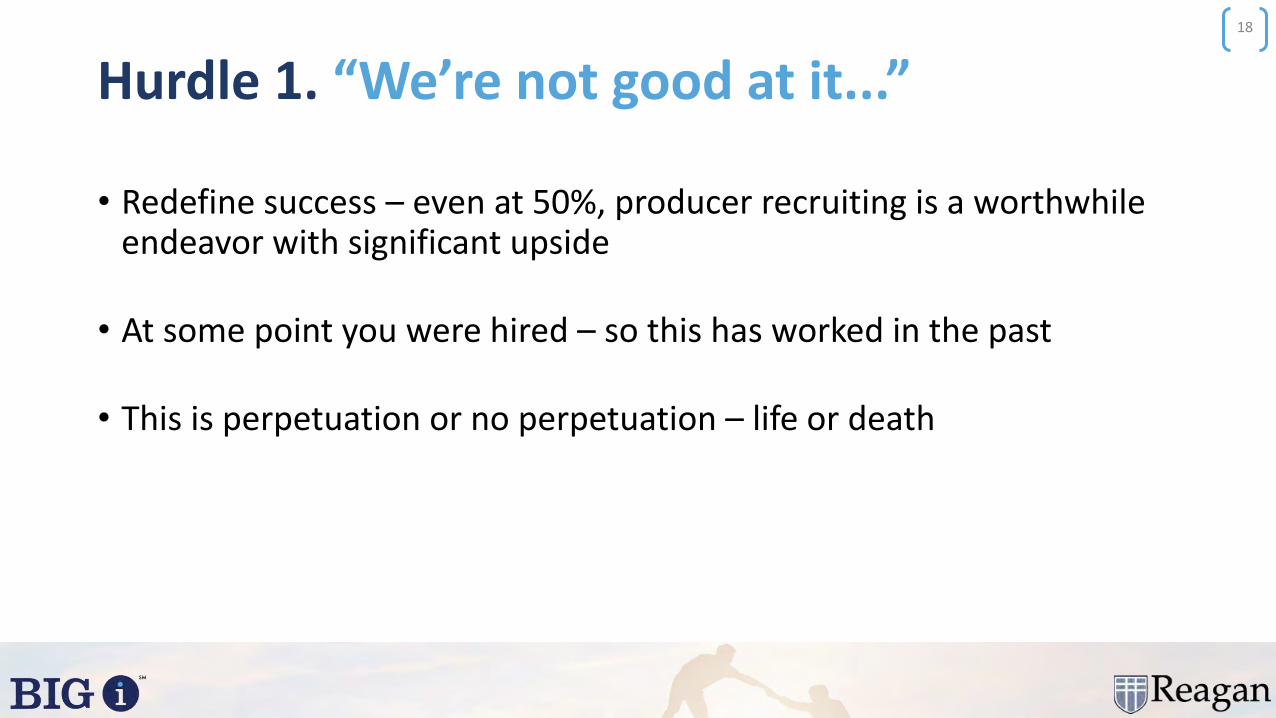
Hurdle 1. “We’re not good at it...”18
• Redefine success – even at 50%, producer recruiting is a worthwhile endeavor with significant upside
• At some point you were hired – so this has worked in the past
• This is perpetuation or no perpetuation – life or death
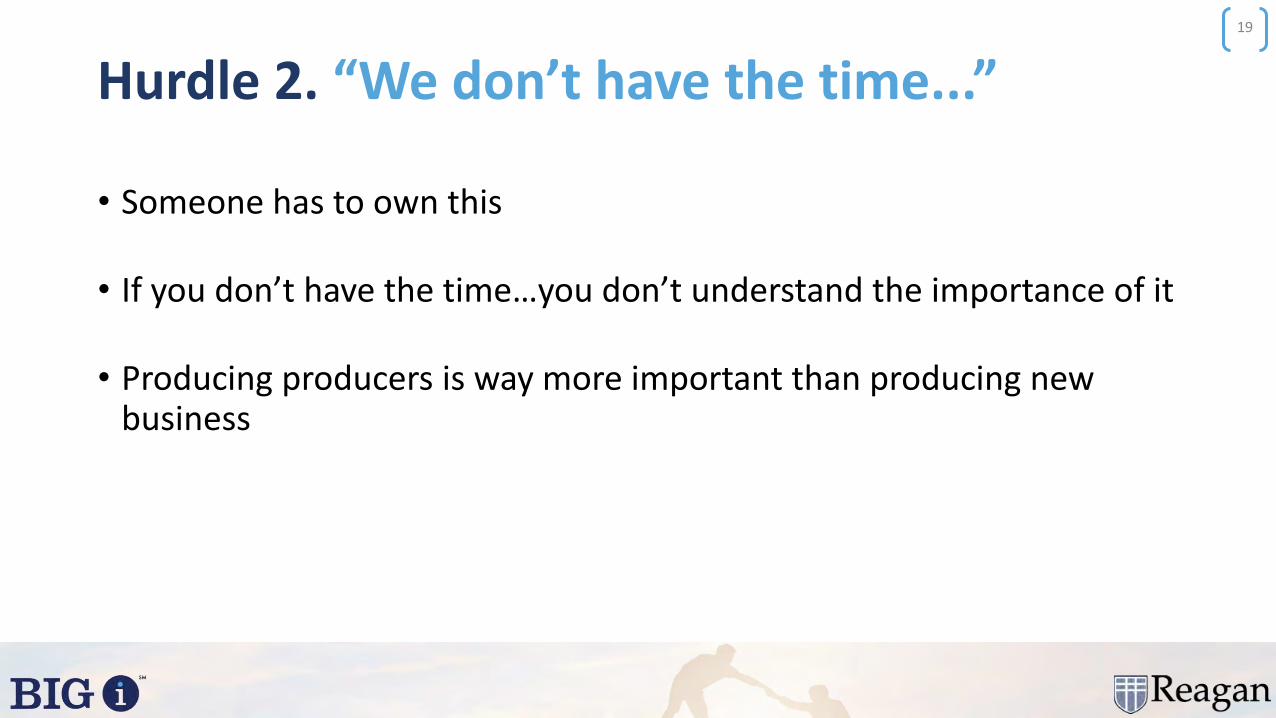
Hurdle 2. “We don’t have the time...”19
• Someone has to own this
• If you don’t have the time…you don’t understand the importance of it
• Producing producers is way more important than producing new business

20
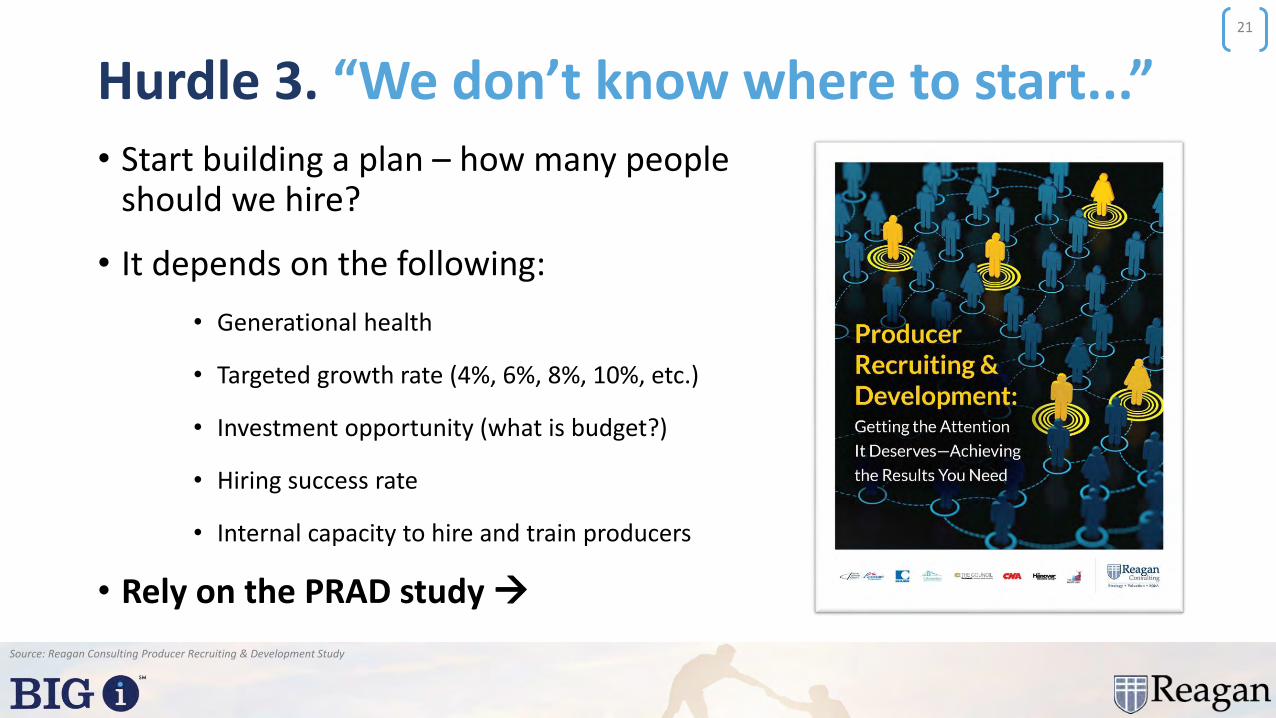
Hurdle 3. “We don’t know where to start...”
Source: Reagan Consulting Producer Recruiting & Development Study
21
• Start building a plan – how many people should we hire?
• It depends on the following:
• Generational health
• Targeted growth rate (4%, 6%, 8%, 10%, etc.)
• Investment opportunity (what is budget?)
• Hiring success rate
• Internal capacity to hire and train producers
• Rely on the PRAD study →

Hurdle 4. “We can’t afford it…”22
• Can you afford to remain independent?
• Who can’t afford it – the agency itself or agency owners?

The Importance of Recruiting: Three Lessons23
1. Industry standard success produces exceptional returns
2. It is rare that a run of value creation is not precipitated by producer hiring and development
3. You can’t afford to miss the big picture

Do We Have the Right Perspective?
“I don't know if I'm different from everybody else, but there's really only two things to me that are really, really important – recruiting good players in the program and developing those players once they get here.”
- Nick Saban
“That damn game cost me a week of recruiting.”
– Nick Saban, referring to the National Championship Game
24

Discussion Questions for Breakout1) Does your firm place the appropriate emphasis on producer recruiting? If
not, how would you change that?
2) What is stopping your firm from being more successful at producer hiring and development?
3) How does you firm create more time for producer recruiting?
4) Has your agency developed the profile of a successful producer recruit for your firm?
5) What are two things you can do in 2020 to focus on producer recruiting and development – the biggest challenge in our industry and the key to internal perpetuation?
25
J a n u a r y 1 5 - 1 7 , 2 0 2 0 | N e w O r l e a n s , L A
BEST PRACTICES
SYMPOSIUM
Developing a Sales Culture
Tom Doran and Jim CampbellReagan Consulting

“I know it when I see it.”
32
United States Supreme Court Justice Potter Stewart in 1964 when asked to define “obscenity” in Jacobellis v. Ohio
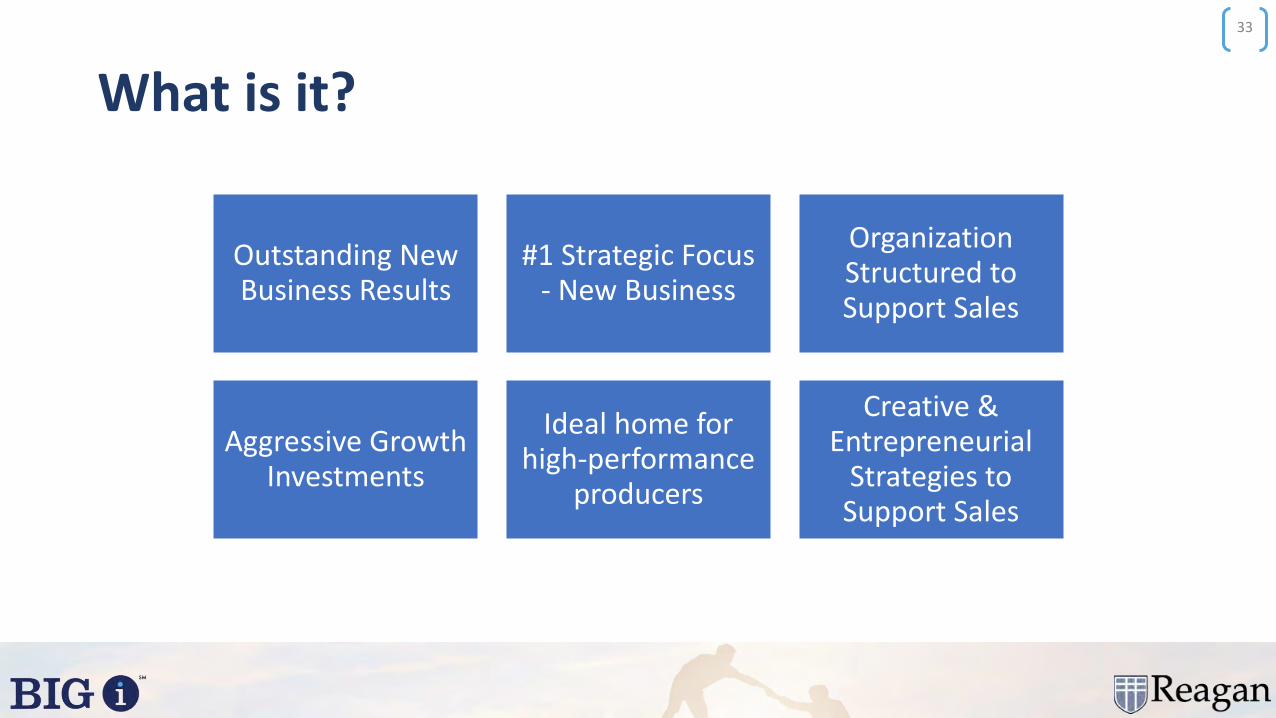
What is it?
What is it?
33
Outstanding New Business Results
#1 Strategic Focus - New Business
Organization Structured to Support Sales
Aggressive Growth Investments
Ideal home for high-performance
producers
Creative & Entrepreneurial
Strategies to Support Sales
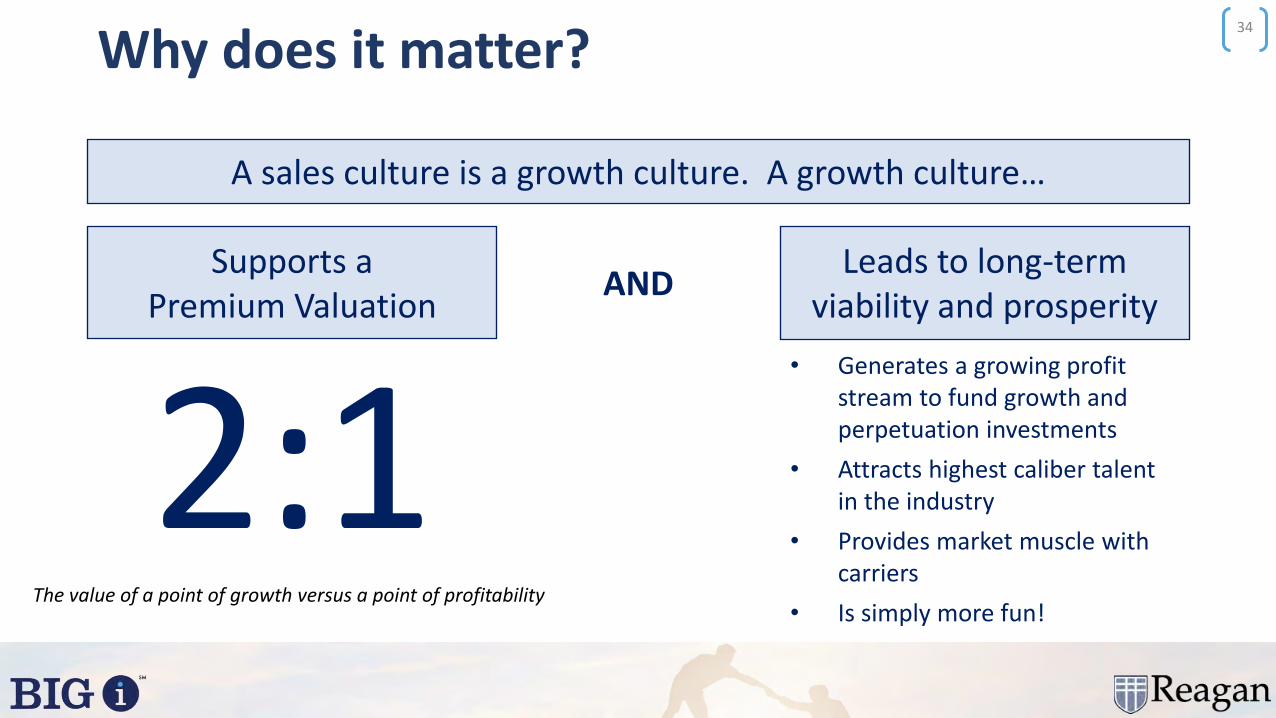
Why does it matter?34
A sales culture is a growth culture. A growth culture…
Supports a Premium Valuation
2:1AND
Leads to long-term viability and prosperity
• Generates a growing profit stream to fund growth and perpetuation investments
• Attracts highest caliber talent in the industry
• Provides market muscle with carriers
• Is simply more fun!The value of a point of growth versus a point of profitability

“Success leaves clues, and if you sow the same seeds, you’ll reap the same rewards.”
35
Author Brad Thor
How to measure it?
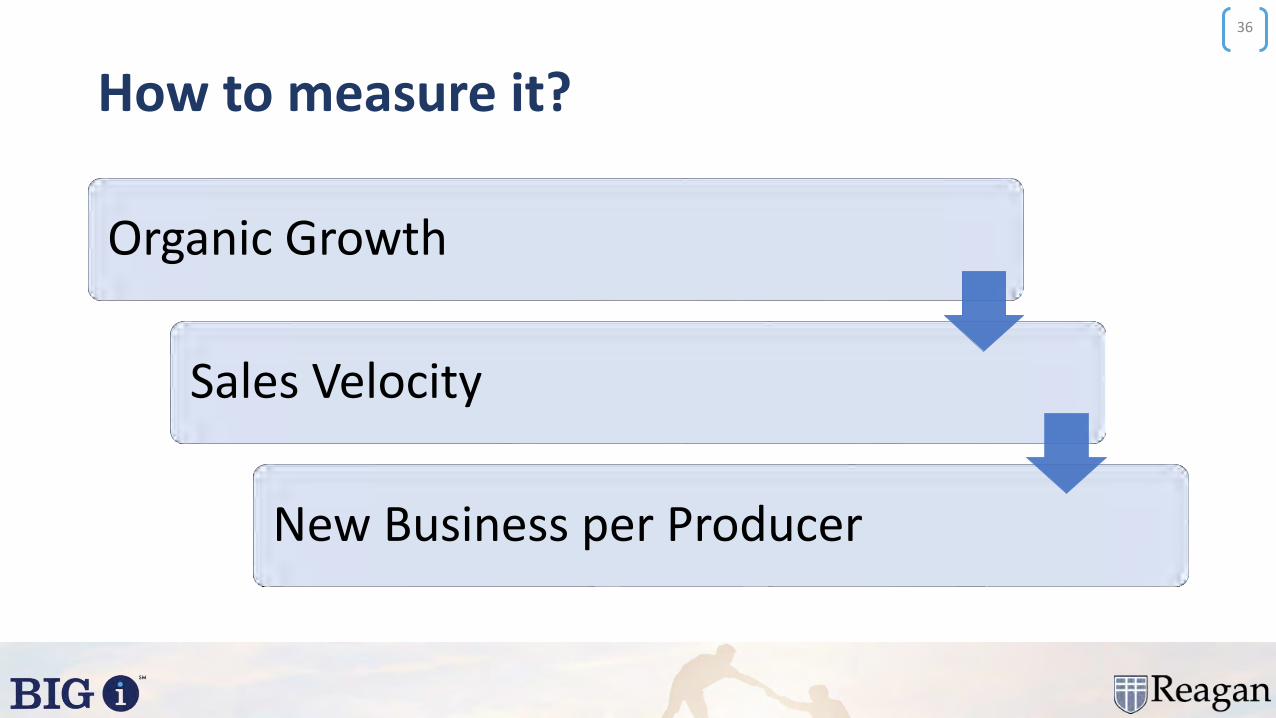
How to measure it?
Organic Growth
Sales Velocity
New Business per Producer
36

How to measure it?37
Organic Growth
2018Commission & Fee Income
$6,000,000
2019Commission & Fee Income
$7,100,00018.3%
($600,000) Book purchase
$6,500,000 Adjusted C&F Income
2018Commission & Fee Income
$6,000,000
2019Commission & Fee Income
$7,100,000
8.3%

Source: 2019 Best Practices Study
38
BPS Revenue Category Median Top Quartile
<$1.25M 9.6% 26.2%
$1.25M - $2.5M 7.9% 30.1%
$2.5M - $5.0M 7.9% 19.2%
$5.0M - $10.0M 7.5% 16.2%
$10.0M - $25.0M 7.1% 15.1%
>$25.0M 6.4% 11.9%
How to measure it?
Organic Growth
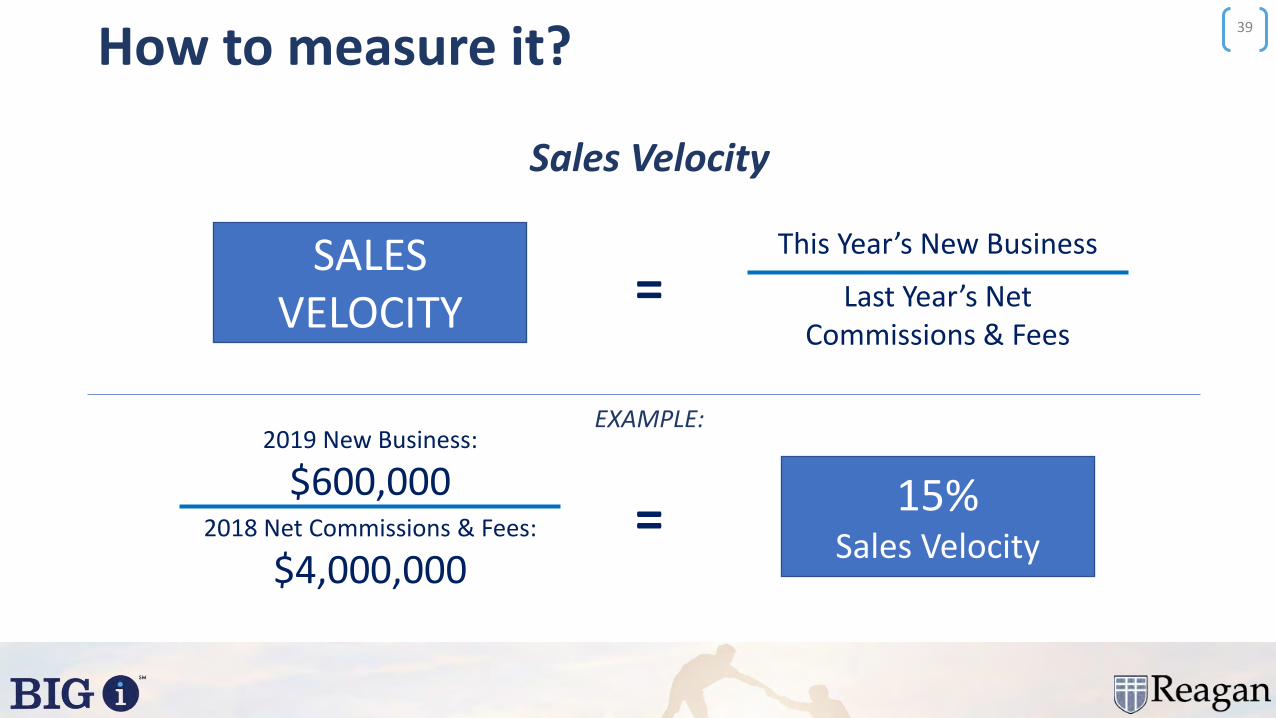
How to measure it?39
SALESVELOCITY
This Year’s New Business
Last Year’s Net Commissions & Fees
=
Sales Velocity
=
EXAMPLE:
15% Sales Velocity
2019 New Business:
$600,0002018 Net Commissions & Fees:
$4,000,000
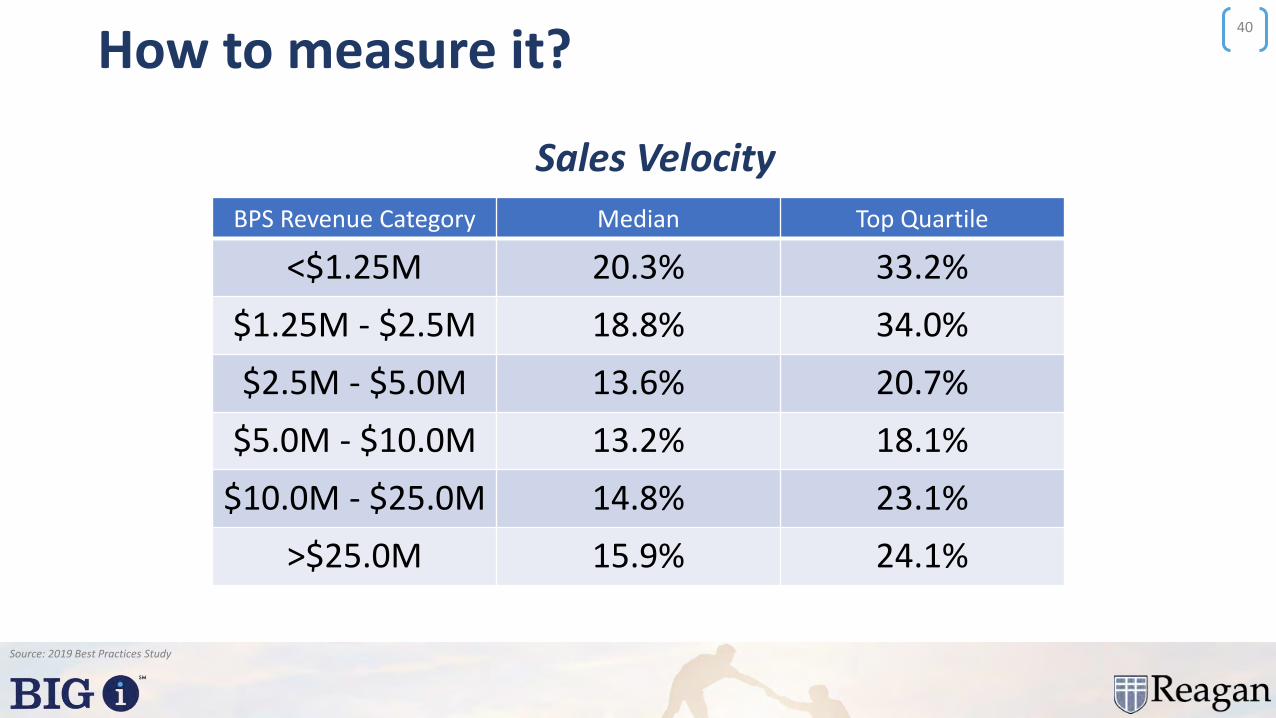
How to measure it?
Source: 2019 Best Practices Study
40
BPS Revenue Category Median Top Quartile
<$1.25M 20.3% 33.2%
$1.25M - $2.5M 18.8% 34.0%
$2.5M - $5.0M 13.6% 20.7%
$5.0M - $10.0M 13.2% 18.1%
$10.0M - $25.0M 14.8% 23.1%
>$25.0M 15.9% 24.1%
Sales Velocity
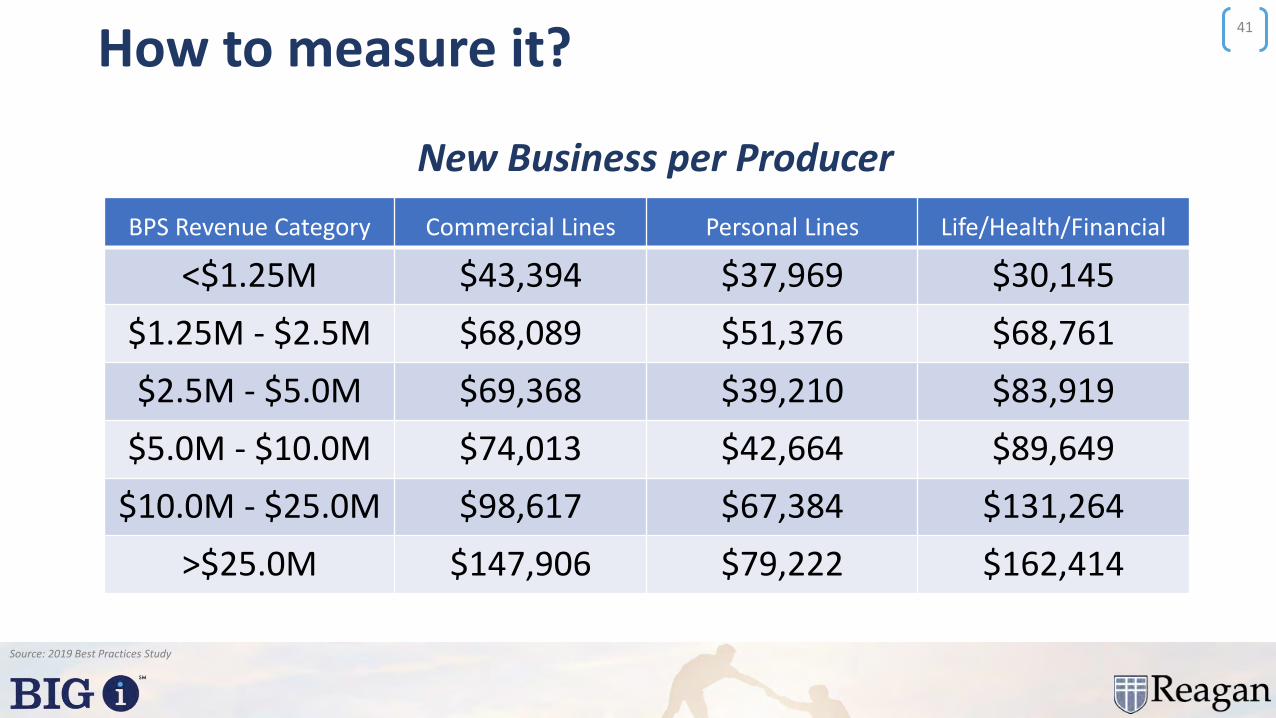
How to measure it?
Source: 2019 Best Practices Study
41
BPS Revenue Category Commercial Lines Personal Lines Life/Health/Financial
<$1.25M $43,394 $37,969 $30,145
$1.25M - $2.5M $68,089 $51,376 $68,761
$2.5M - $5.0M $69,368 $39,210 $83,919
$5.0M - $10.0M $74,013 $42,664 $89,649
$10.0M - $25.0M $98,617 $67,384 $131,264
>$25.0M $147,906 $79,222 $162,414
New Business per Producer

How?
42
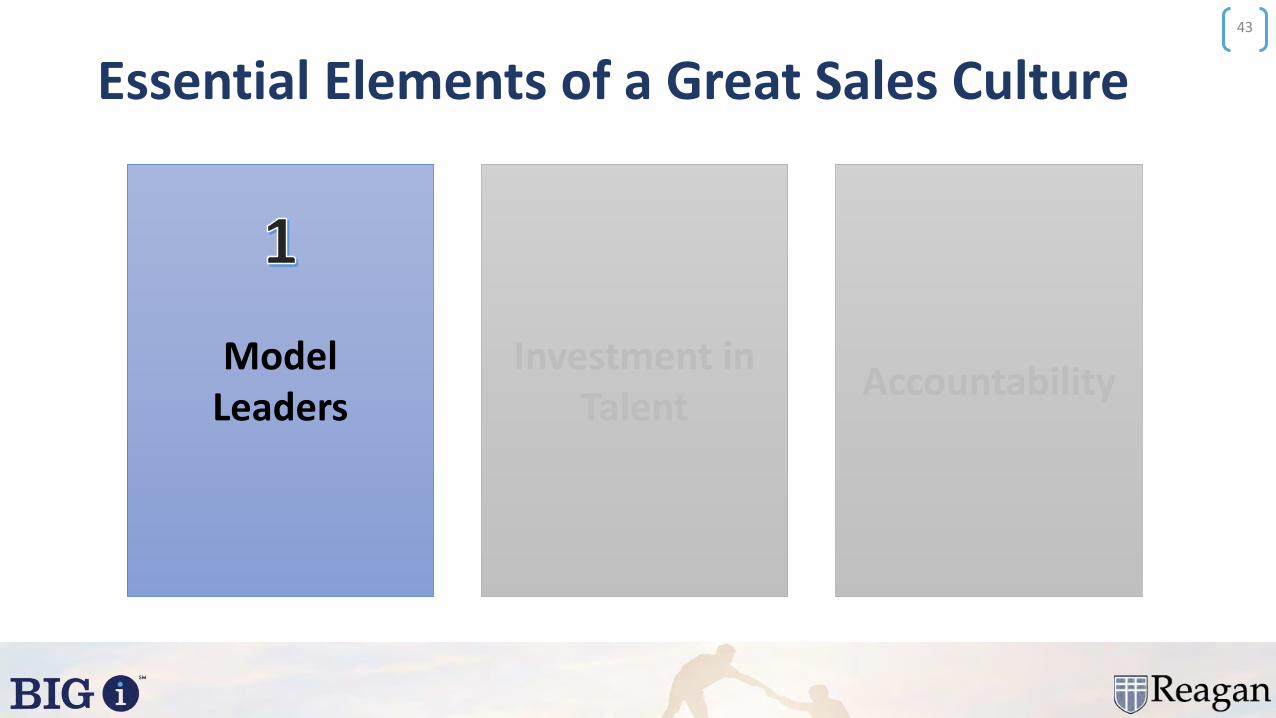
Essential Elements of a Great Sales Culture43
Model Leaders
Investment in Talent
Accountability

“At least if he had been walking with us, he would have had some moral authority.”
44
Lt. Gen. John R. Vines
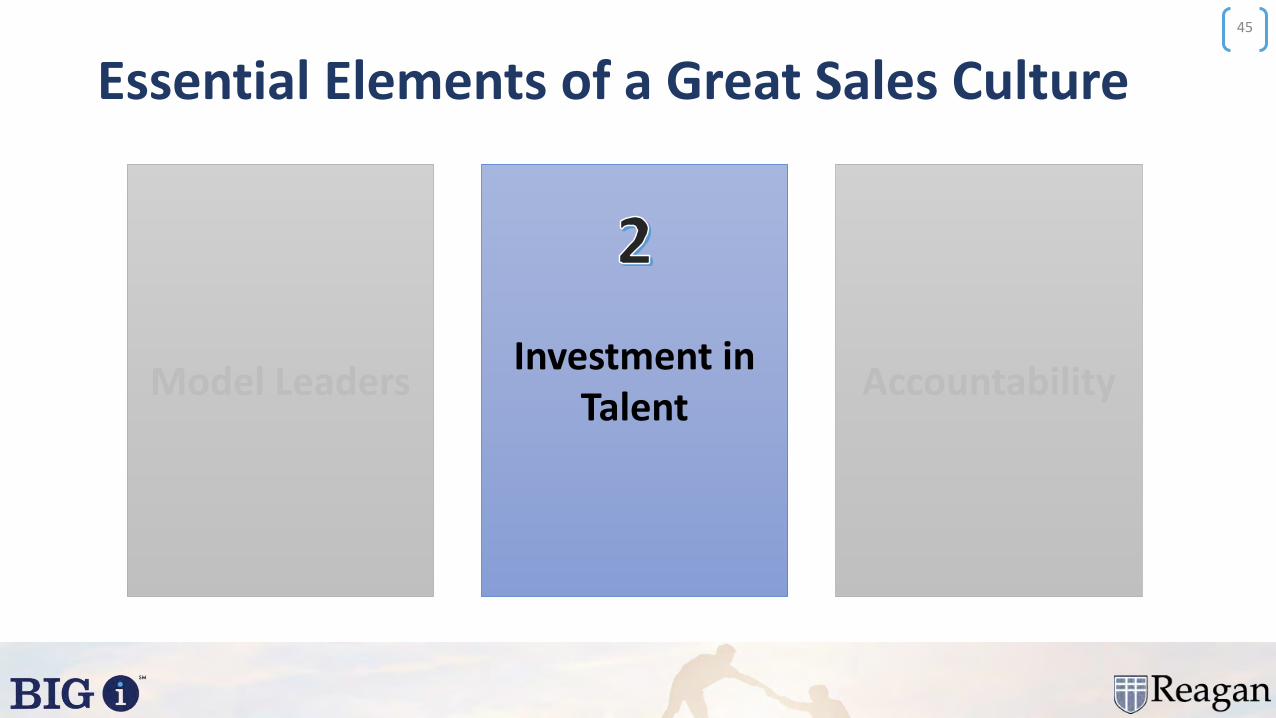
Essential Elements of a Great Sales Culture45
Model LeadersInvestment in
TalentAccountability

NUPP and Organic Growth
9.6%
7.9% 7.9% 7.5% 7.1%6.4%
15.5%
11.7%
9.0%8.3%
7.4%8.3%
<$1.25 $1.25-$2.5M
$2.5-$5.0M
$5.0-$10.0M
$10.0-$25.0M
>$25.0M
Do the Top Quartile NUPP firms have above average organic growth?
All BPS Firms' Median Organic Growth Top Quartile NUPP Firms' Median Organic Growth
Source: 2019 Best Practices Study
46
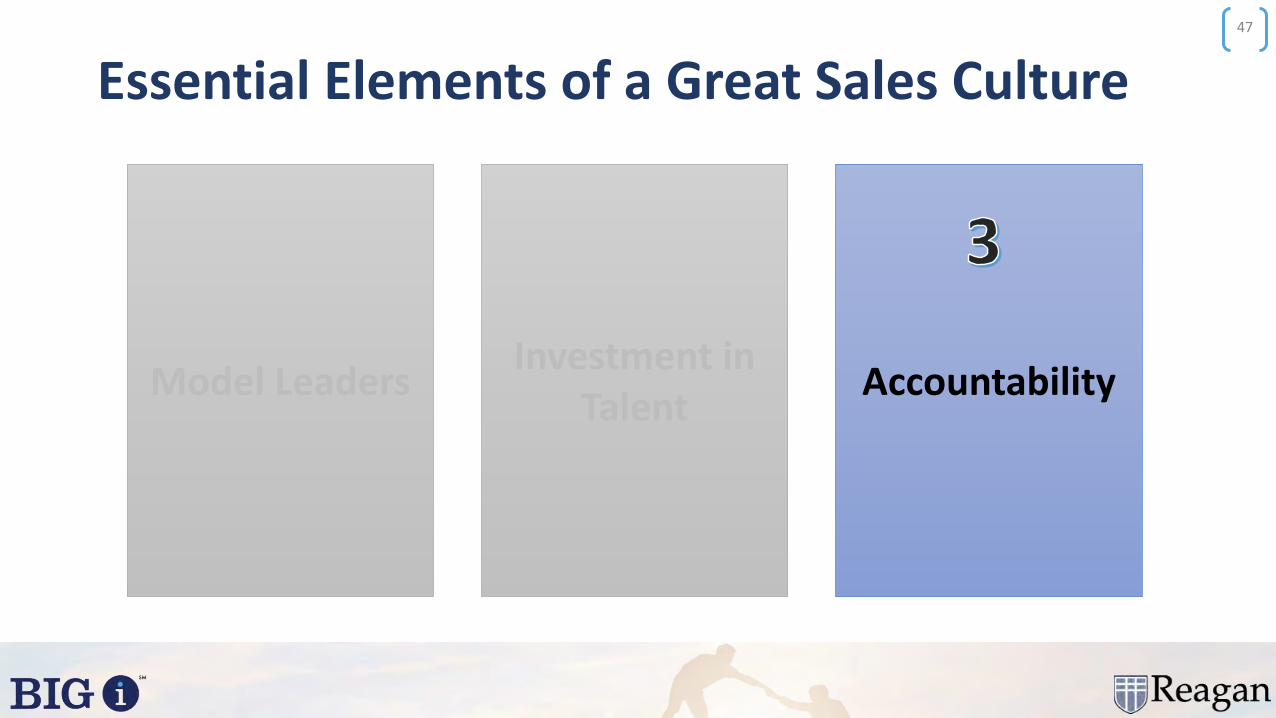
Essential Elements of a Great Sales Culture47
Model LeadersInvestment in
TalentAccountability
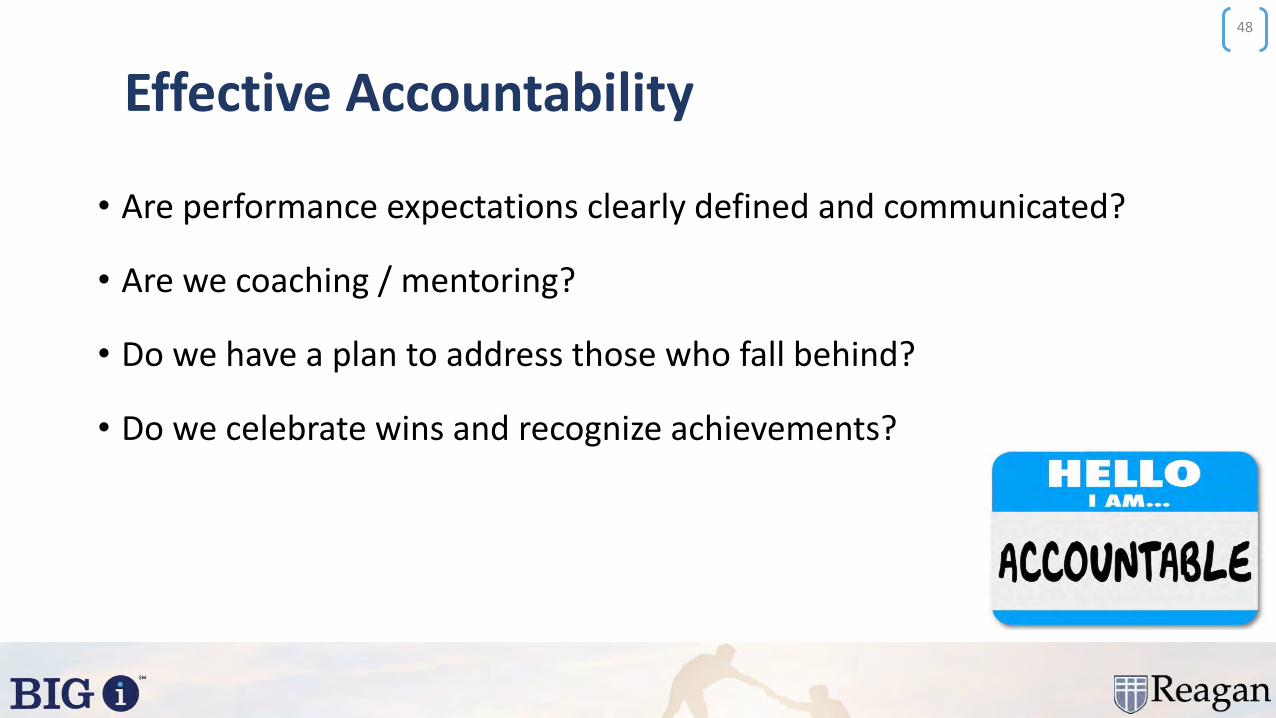
Effective Accountability
• Are performance expectations clearly defined and communicated?
• Are we coaching / mentoring?
• Do we have a plan to address those who fall behind?
• Do we celebrate wins and recognize achievements?
48
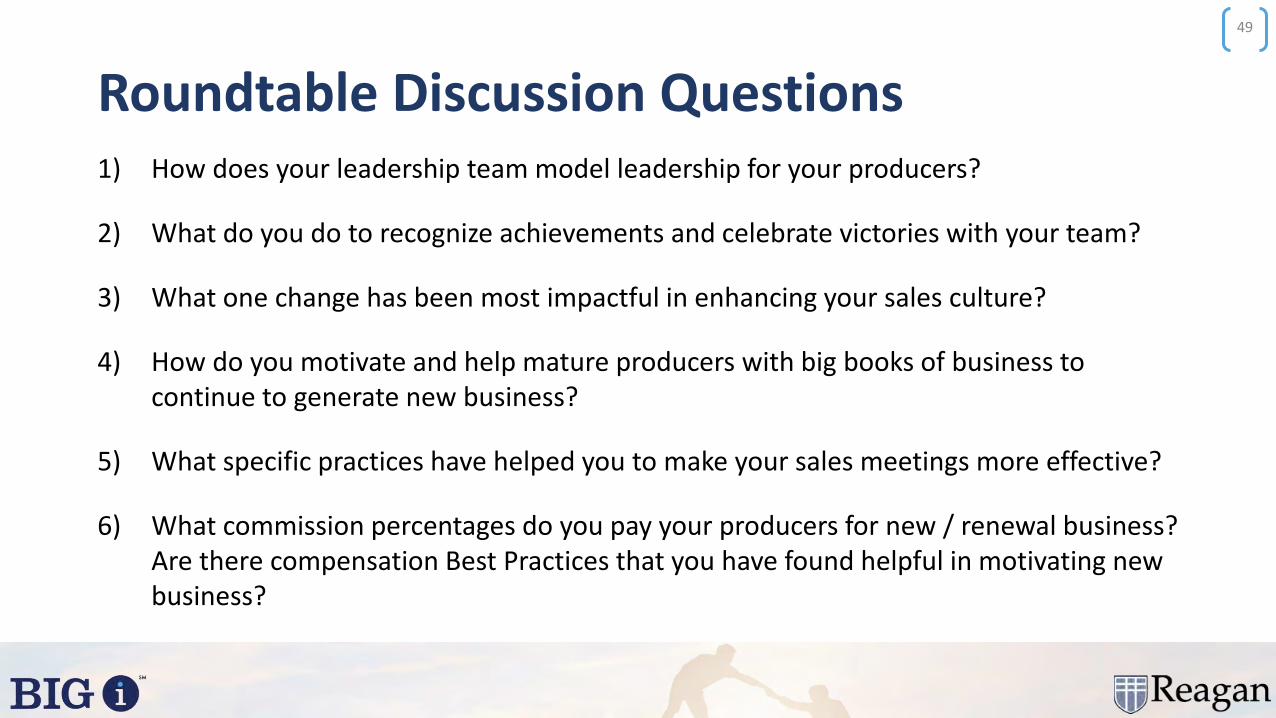
Roundtable Discussion Questions1) How does your leadership team model leadership for your producers?
2) What do you do to recognize achievements and celebrate victories with your team?
3) What one change has been most impactful in enhancing your sales culture?
4) How do you motivate and help mature producers with big books of business to continue to generate new business?
5) What specific practices have helped you to make your sales meetings more effective?
6) What commission percentages do you pay your producers for new / renewal business? Are there compensation Best Practices that you have found helpful in motivating new business?
49
J a n u a r y 1 5 - 1 7 , 2 0 2 0 | N e w O r l e a n s , L A
BEST PRACTICES
SYMPOSIUM
Staying Private
Brian McNeely and John MerrillReagan Consulting

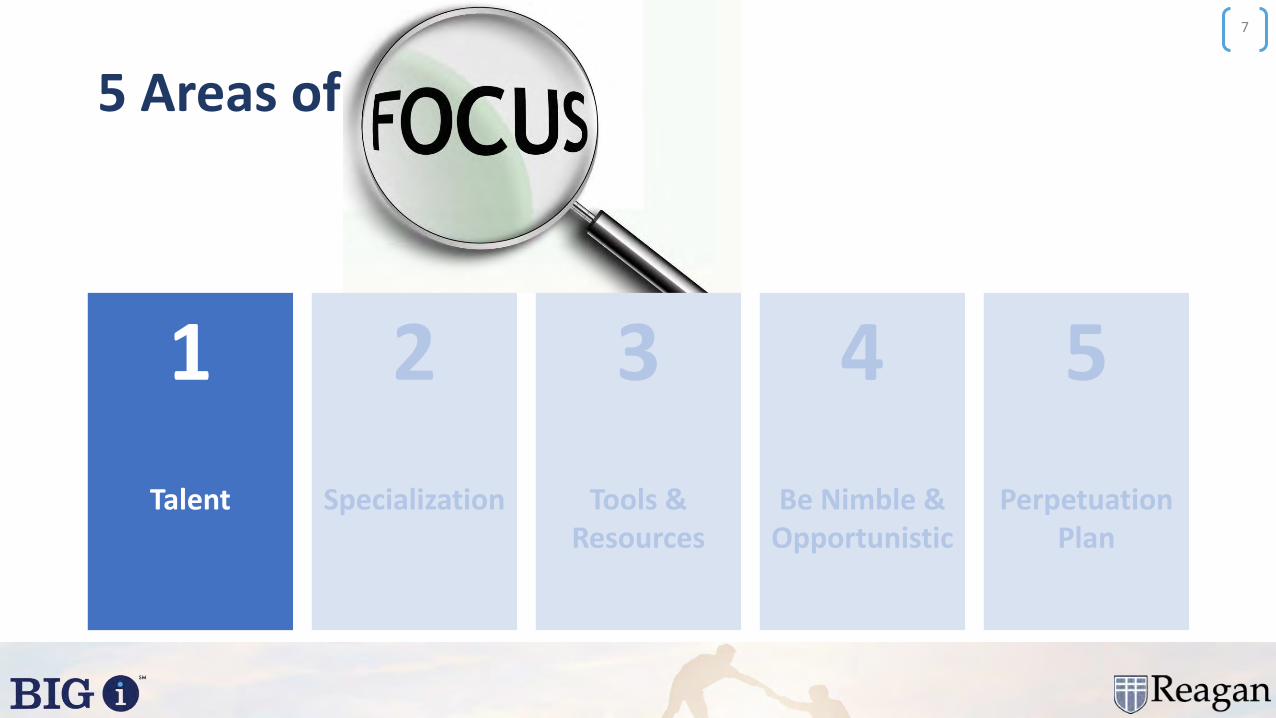
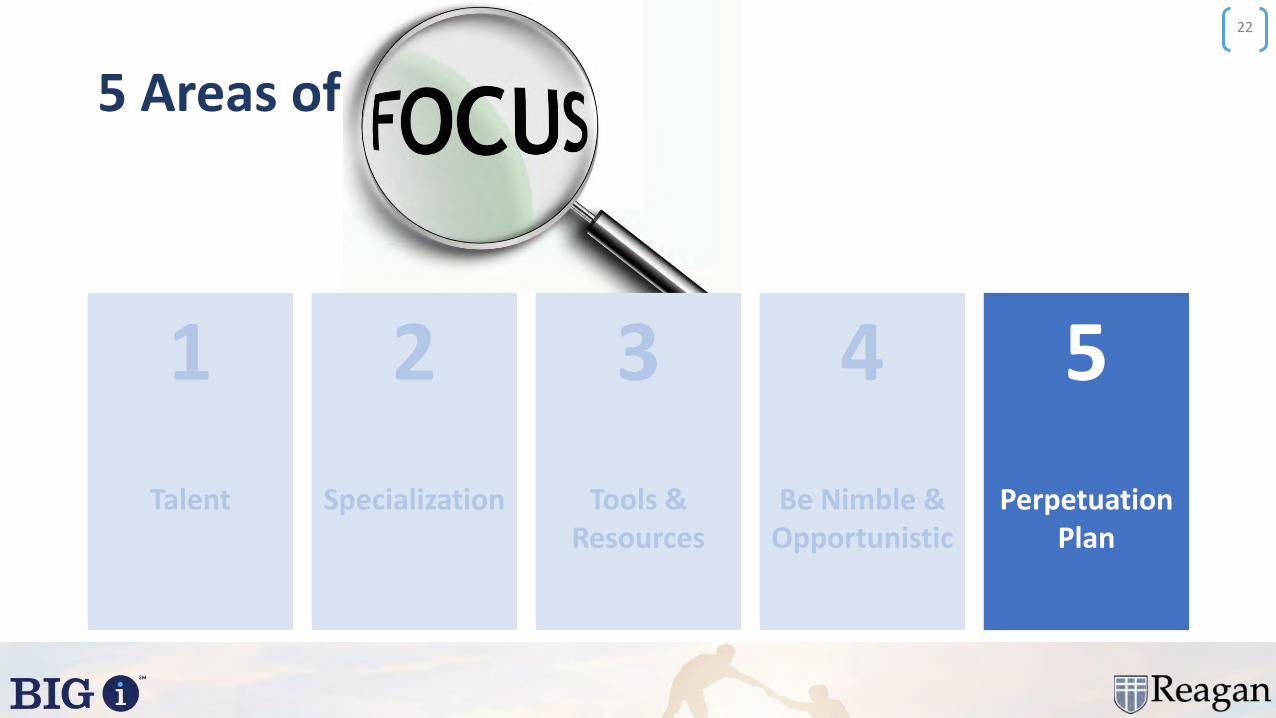
5 Areas of
1
Talent
2
Specialization
3
Tools & Resources
4
Be Nimble & Opportunistic
5
Perpetuation Plan
6
5 Areas of
1
Talent
2
Specialization
3
Tools & Resources
4
Be Nimble & Opportunistic
5
Perpetuation Plan
7
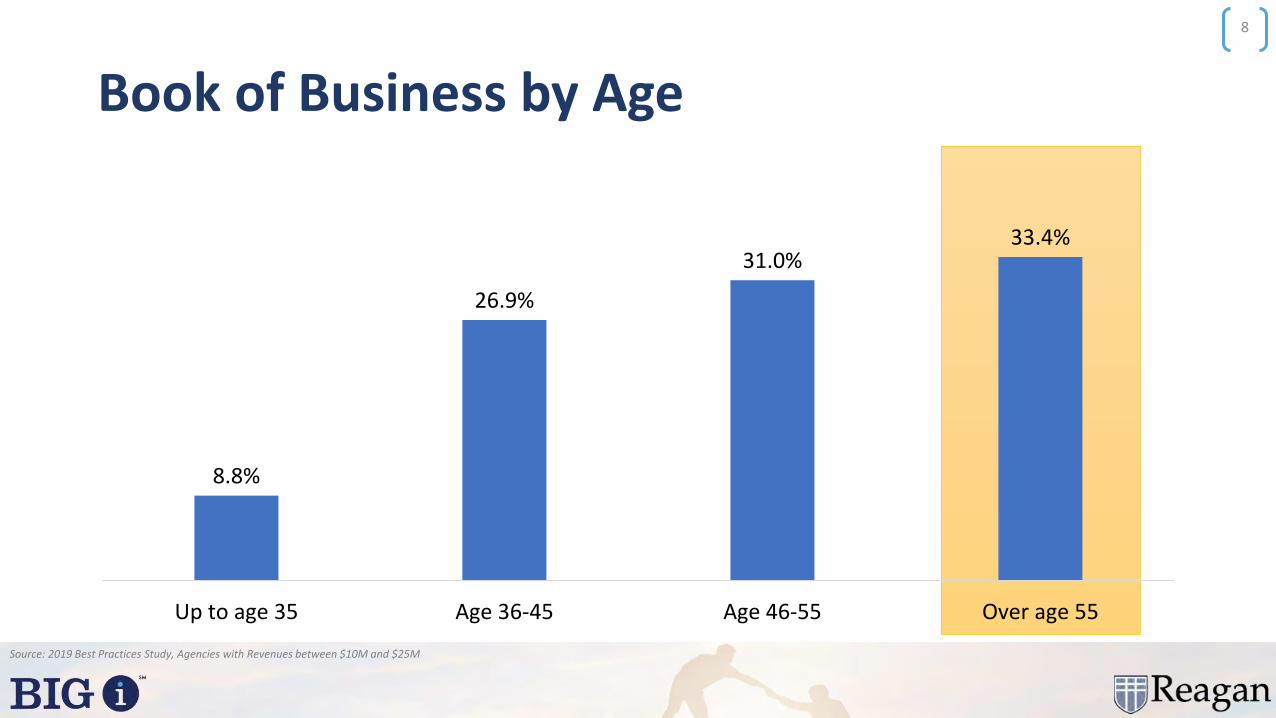
Book of Business by Age
8.8%
26.9%
31.0%33.4%
Up to age 35 Age 36-45 Age 46-55 Over age 55
8
Source: 2019 Best Practices Study, Agencies with Revenues between $10M and $25M
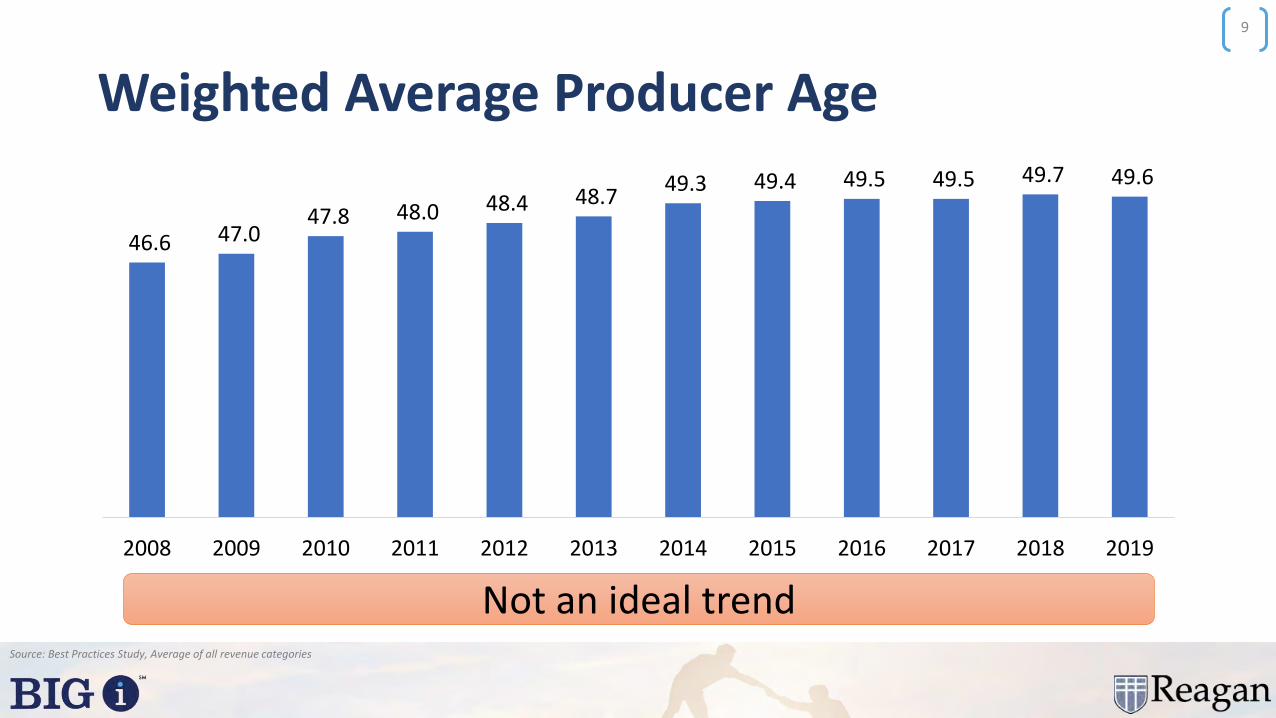
Weighted Average Producer Age
46.6 47.0 47.8 48.0 48.4 48.7
49.3 49.4 49.5 49.5 49.7 49.6
2008 2009 2010 2011 2012 2013 2014 2015 2016 2017 2018 2019
Source: Best Practices Study, Average of all revenue categories
9
Not an ideal trend
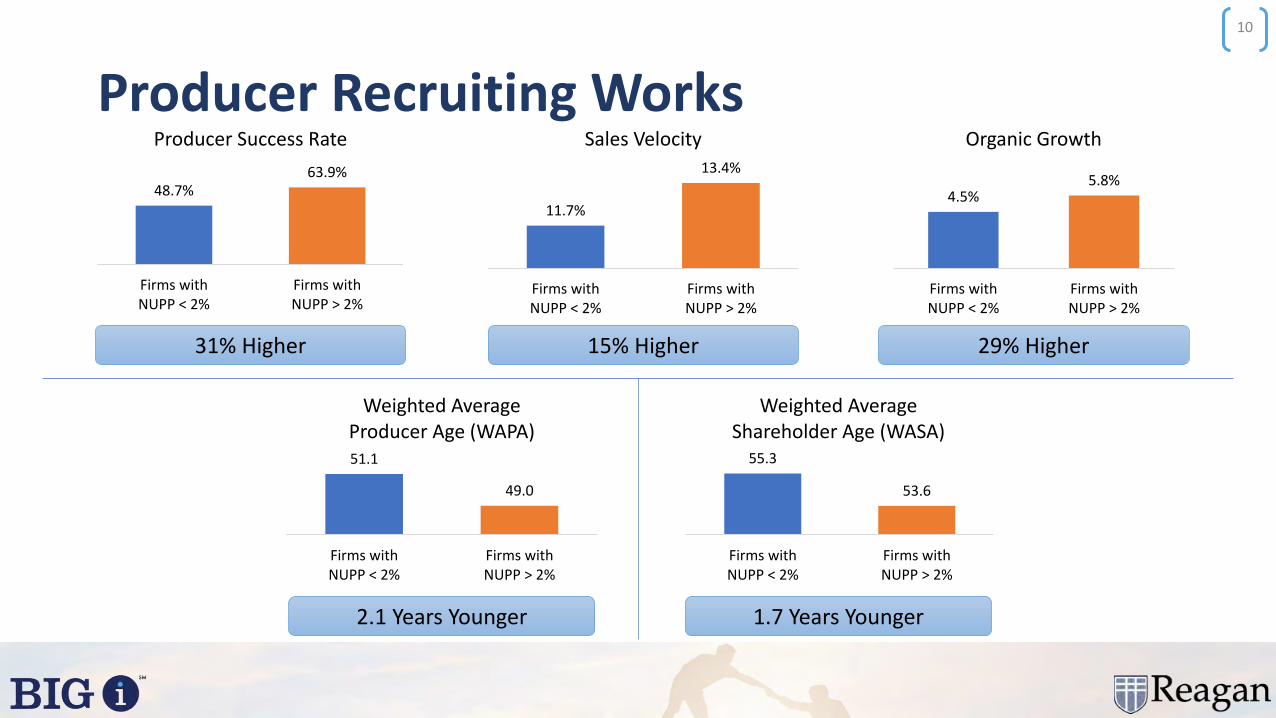
Producer Recruiting Works
10
48.7%63.9%
Firms withNUPP < 2%
Firms withNUPP > 2%
Producer Success Rate
51.1
49.0
Firms withNUPP < 2%
Firms withNUPP > 2%
Weighted Average Producer Age (WAPA)
4.5%5.8%
Firms withNUPP < 2%
Firms withNUPP > 2%
Organic Growth
11.7%
13.4%
Firms withNUPP < 2%
Firms withNUPP > 2%
Sales Velocity
55.3
53.6
Firms withNUPP < 2%
Firms withNUPP > 2%
Weighted Average Shareholder Age (WASA)
15% Higher 29% Higher
2.1 Years Younger 1.7 Years Younger
31% Higher

Non-Producer Average Age
Top Quartile Bottom Quartile
36 38 40 42 44 46 48 50
RVI
Average Age of Service/Sales Support Staff
MEDIAN:
Source: Reagan Value Index
11
It’s not just about production
5 Areas of
1
Talent
2
Specialization
3
Tools & Resources
4
Be Nimble & Opportunistic
5
Perpetuation Plan
12

FASTERGROWING &
MOREPROFITABLE
Why it Works
NOGEOGRAPHICBOUNDARIES
SIZE DOESN’T ALWAYS MATTER
13

What is Specialization?
14
In-depth industry / product knowledge
Concentrations of Business
Specialization is not . . .
Just Marketing
Restrictive
Specialization is . . .
Empowering
Difference-making for clients
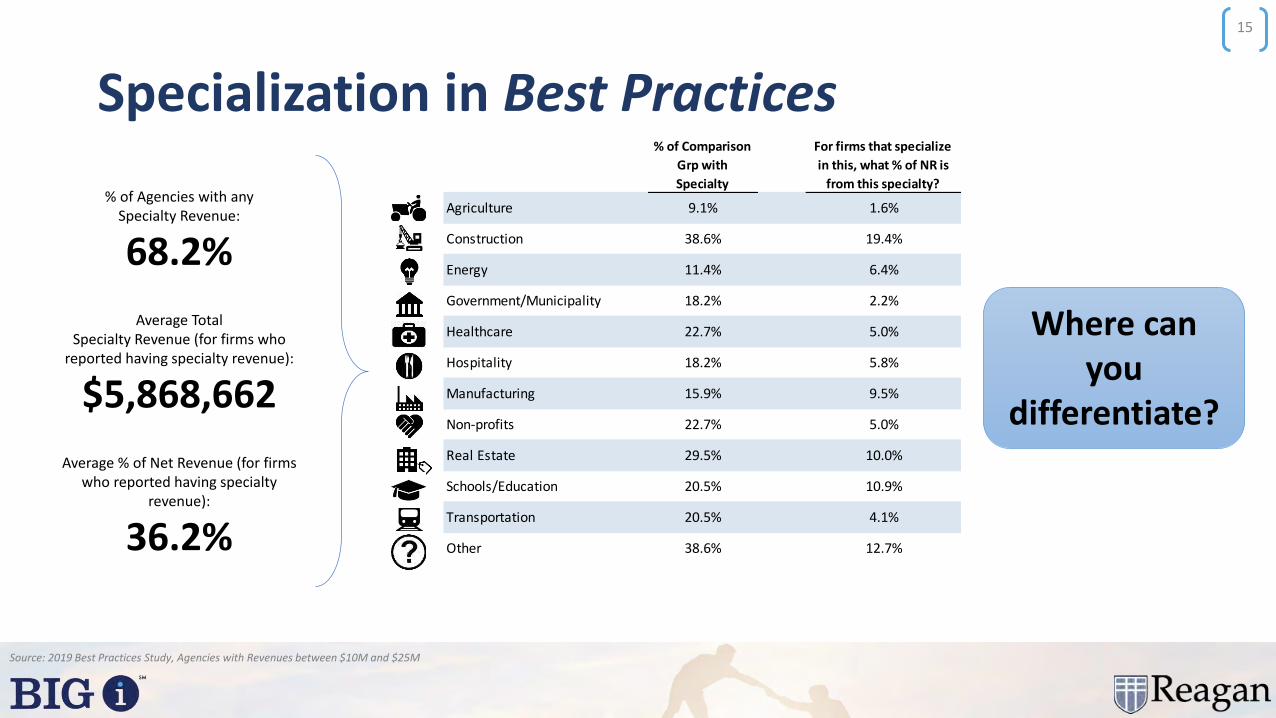
Specialization in Best Practices
Source: 2019 Best Practices Study, Agencies with Revenues between $10M and $25M
1.6%
Transportation
Other
19.4%
6.4%
2.2%
22.7%
18.2%
5.0%
18.2%
Healthcare
Hospitality
Manufacturing
5.0%
5.8%
9.5%
Energy
12.7%
Schools/Education
22.7%
29.5%
20.5%
20.5%
Real Estate
Construction
Non-profits
% of Comparison
Grp with
Specialty
Agriculture
38.6%
15.9%
10.9%
10.0%
For firms that specialize
in this, what % of NR is
from this specialty?
11.4%
9.1%
38.6%
Government/Municipality
4.1%
% of Agencies with any Specialty Revenue:
68.2%
Average Total Specialty Revenue (for firms who
reported having specialty revenue):
$5,868,662
Average % of Net Revenue (for firms who reported having specialty
revenue):
36.2%
15
Where can you
differentiate?
5 Areas of
1
Talent
2
Specialization
3
Tools & Resources
4
Be Nimble & Opportunistic
5
Perpetuation Plan
16

Tools & Resources
17
What the customer wants…
Risk Modeling
Loss Control
Risk Mitigation
Risk Transfer
Training
Claims Advocacy
Call Center Support
Compliance Support & Oversight
Billing Consolidation
HR Administration
Administrative Assistance
World Class Local Touch
Health Promotion
Employee Communication
Strategic Forecast Model
Data Analytics & Informatics
Pharmacy Management
ACA Impact Analysis
Digital Solutions
Online Learning
Actuarial and Underwriting
Appraisal Services
Client-Focused Attention
Personal Asset Protection Services
Multi-Generational PlanningClaims Advocates
Industry SpecializationProprietary Products
Market Insight
Benchmarking & Business Analytics
Online Tools with 24/7 Access
Executive & Professional Specialty Practice
Safety & Health Management Environmental ConsultingInternational ResourcesPrivate Equity
Industry Specialization
Educational Seminars
Auto & Exotic Vehicle Insurance
High Net Worth
Collectibles
Farms & Ranches
Homeowners Life & Disability Insurance
Contract Surety
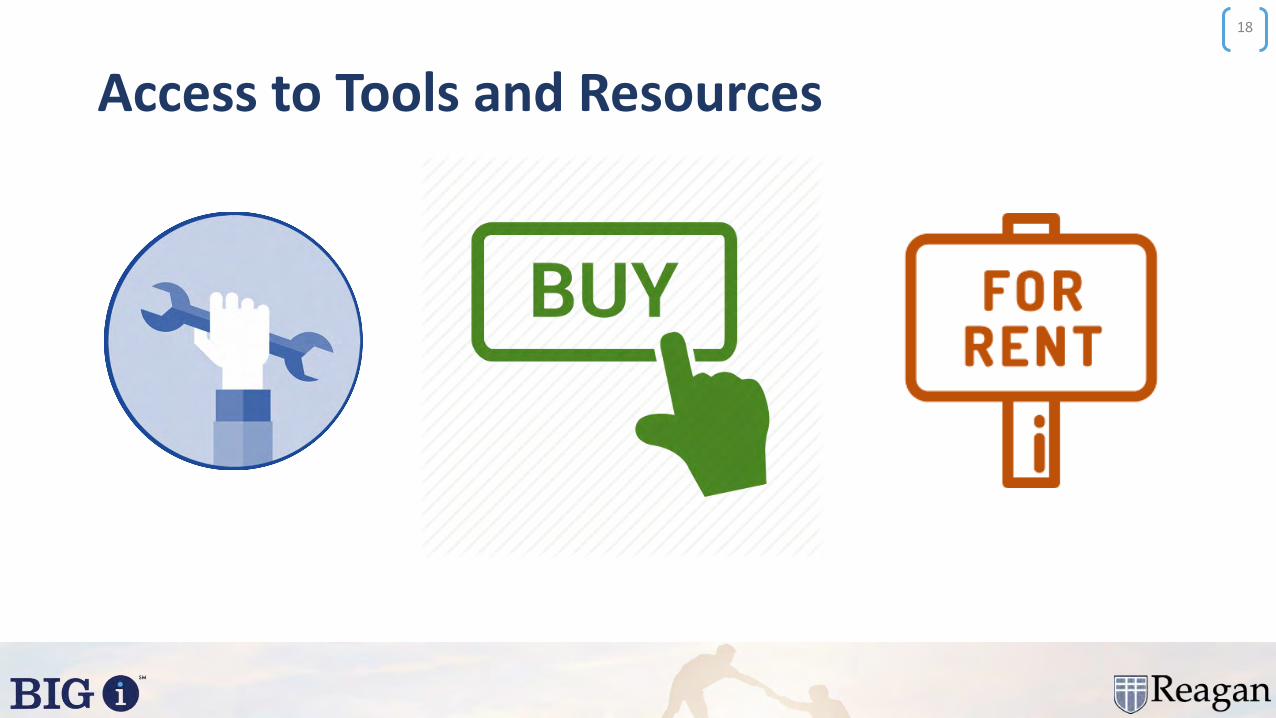
Access to Tools and Resources
18

5 Areas of
1
Talent
2
Specialization
3
Tools & Resources
4
Be Nimble & Opportunistic
5
Perpetuation Plan
19

M&A Activity
14% 15%23% 27% 30%
42% 41%46%
55% 54%59%
20%28%
32%29%
28%
26% 28%24%
21% 22%19%
22%
28%
15% 16% 13%
10% 10%14%
10% 11% 9%
24%
17% 17% 15% 20%13% 15% 9% 9% 8% 10%20%
14% 13% 14% 10% 9% 6% 8% 5% 6% 3%
2008 2009 2010 2011 2012 2013 2014 2015 2016 2017 2018
Private Equity Private Brokers Other Public Brokers Banks
Source: SNL Financial as of June 30, 2019 (based on Announcement Date). Includes whole company, franchise and asset sales.
53%59%
24%22%
10%9%
8%7%
5% 3%
H1 2018 H1 2019
20

Producer lift outsThe Free Agent Opportunity in Our Industry
INSURANCE
I need resources and a
platform for growing
my business.
I need to find a new
home for me and my
book of business.
21
5 Areas of
1
Talent
2
Specialization
3
Tools & Resources
4
Be Nimble & Opportunistic
5
Perpetuation Plan
22

The Four Pillars of Perpetuation
23
ReasonableSellers

Current Market Pricing
Source: Good quality agents and brokers, $3-$10 million in revenue
24
6.0x 5.8x 6.0x 6.3x 6.5x 6.8x 7.0x 7.5x 8.0x 8.0x 9.0x
3.0x 3.0x 2.5x 2.5x 2.5x 3.0x 3.0x
3.0x 3.0x 3.0x
3.0x
-
2.0x
4.0x
6.0x
8.0x
10.0x
12.0x
2008 2009 2010 2011 2012 2013 2014 2015 2016 2017 2018
Typical Guaranteed Price Earn-Out Opportunity

5 Areas of
1
Talent
2
Specialization
3
Tools & Resources
4
Be Nimble & Opportunistic
5
Perpetuation Plan
25

Debt
% of Firms that have Identified Debt 62.7%
Average Total Debt
Total Leverage (Total Debt / Pro Forma EBITDA)
Average Effective Interest Rate
Average Term (Years to Maturity) 5.5
$4,131,024
1.2x
4.3%
Source: 2019 Best Practices Study, Agencies with Revenues between $10M and $25M
26

A debt averse industry
>6.0x
2.5x
1.2x
PrivateEquity
Public Brokers
BPS Firms($10-$25M in Rev)
Debt to EBITDA Ratio
Source: 2019 Best Practices Study, Agencies with Revenues between $10M and $25M
27
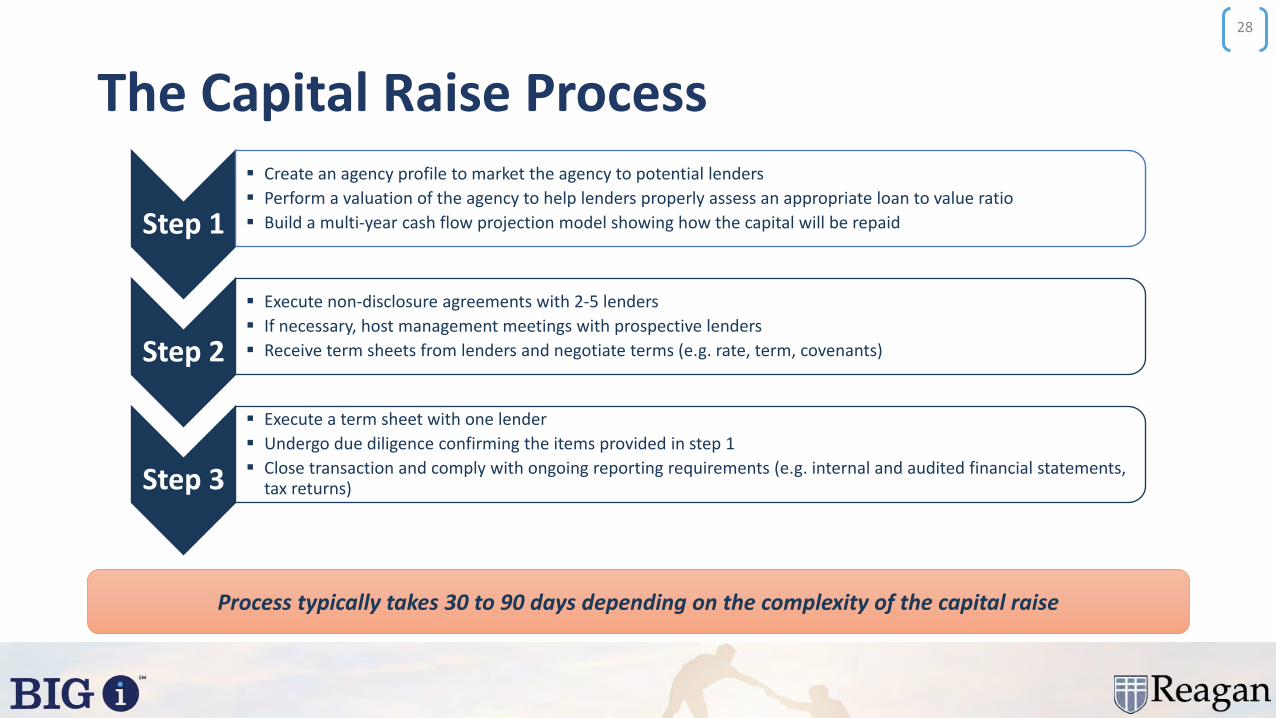
The Capital Raise Process
28
Step 1
▪ Create an agency profile to market the agency to potential lenders
▪ Perform a valuation of the agency to help lenders properly assess an appropriate loan to value ratio
▪ Build a multi-year cash flow projection model showing how the capital will be repaid
Step 2
▪ Execute non-disclosure agreements with 2-5 lenders
▪ If necessary, host management meetings with prospective lenders
▪ Receive term sheets from lenders and negotiate terms (e.g. rate, term, covenants)
Step 3
▪ Execute a term sheet with one lender
▪ Undergo due diligence confirming the items provided in step 1
▪ Close transaction and comply with ongoing reporting requirements (e.g. internal and audited financial statements, tax returns)
Process typically takes 30 to 90 days depending on the complexity of the capital raise
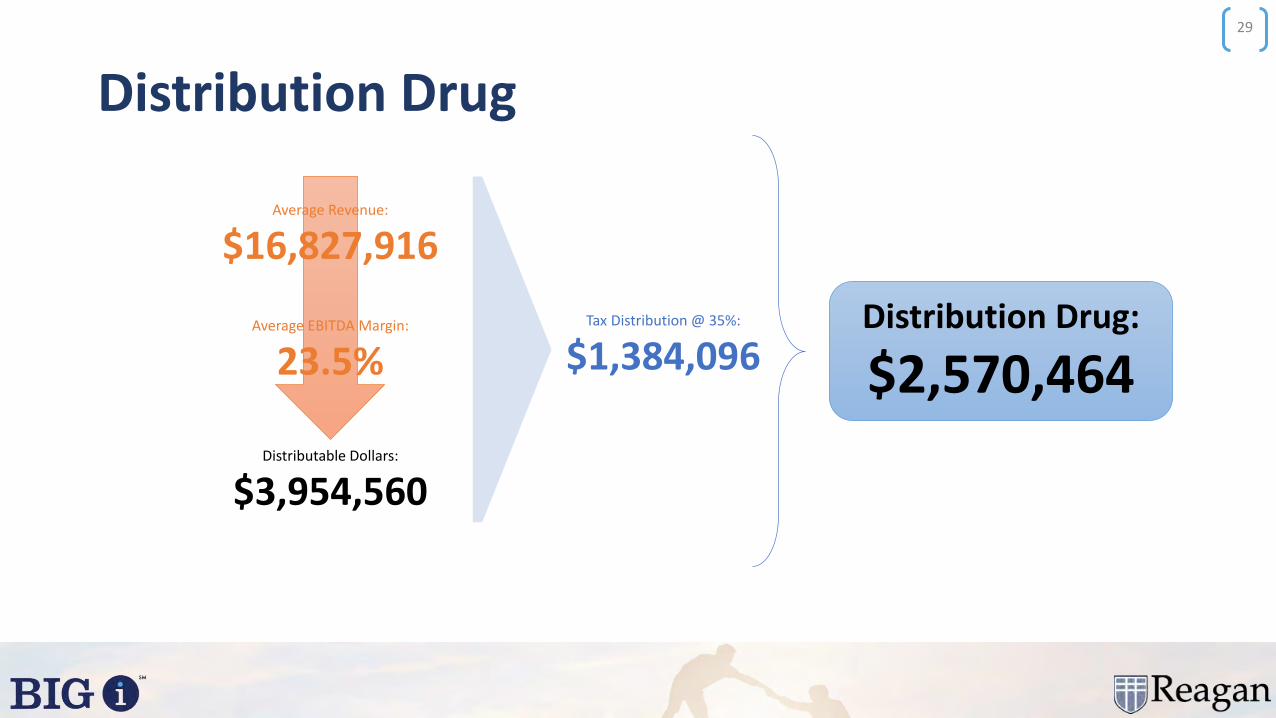
Distribution Drug
29
Average Revenue:
$16,827,916
Average EBITDA Margin:
23.5%Distribution Drug:
$2,570,464Distributable Dollars:
$3,954,560
Tax Distribution @ 35%:
$1,384,096

Distribution Drug
30
Obviously reinvesting might mean taking a pay cut if you’re the owner, but that’s how a company progresses.
Forbes
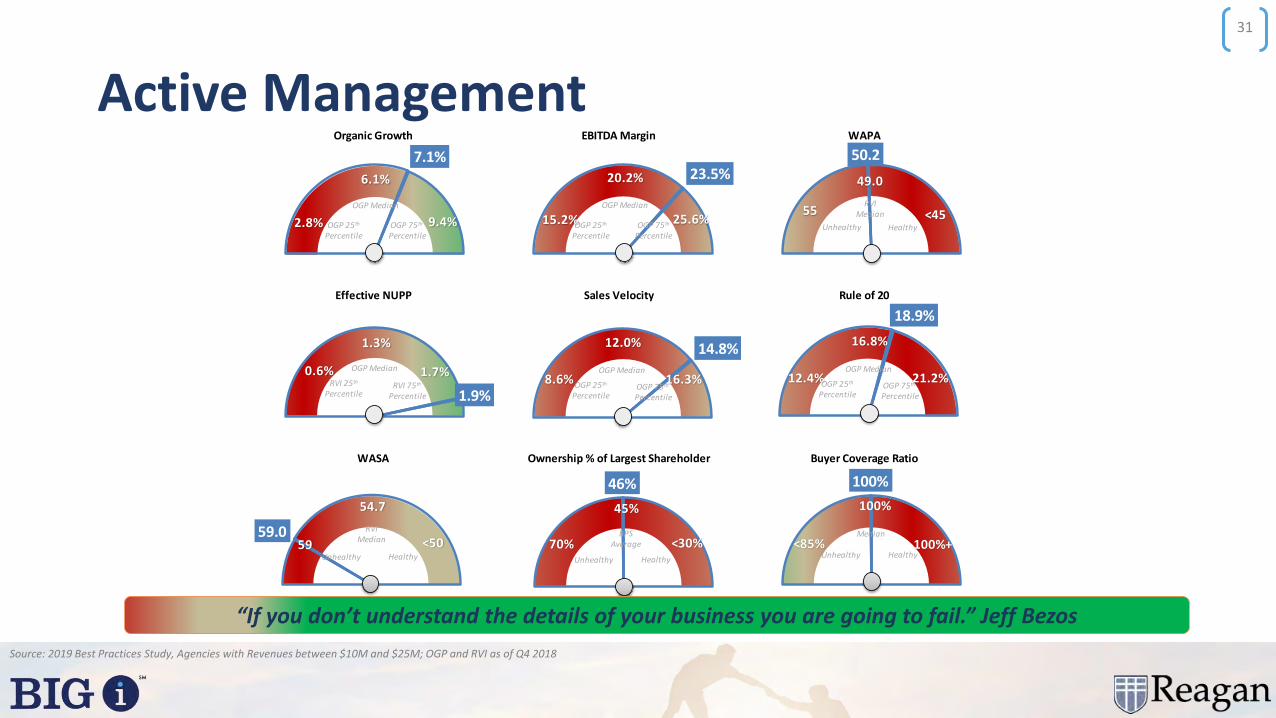
Active Management
31
Organic Growth EBITDA Margin WAPA
Effective NUPP Sales Velocity Rule of 20
WASA Ownership % of Largest Shareholder Buyer Coverage Ratio
46%
18.9%
14.8%
23.5%50.2
1.9%
7.1%20.2% 49.0
2.8%
6.1%
9.4%OGP 75th
PercentileOGP 25th
Percentile
15.2% 25.6%OGP 75th
Percentile
OGP Median
OGP 25th
Percentile
<45Healthy
RVI Median
Unhealthy
0.6%
1.3%
1.7%RVI 75th
Percentile
RVI 25th
Percentile
8.6%
12.0%
16.3%OGP 75th
Percentile
OGP 25th
Percentile
55
Healthy
BPSAverage
Unhealthy
100%
<85%
100%
100%+Median
HealthyUnhealthy
OGP Median
OGP MedianOGP Median
70%
45%
<30%
12.4%
16.8%
21.2%OGP 75th
Percentile
OGP 25th
Percentile
OGP Median
59.0
54.7
59 <50Healthy
RVI Median
Unhealthy
Source: 2019 Best Practices Study, Agencies with Revenues between $10M and $25M; OGP and RVI as of Q4 2018
“If you don’t understand the details of your business you are going to fail.” Jeff Bezos
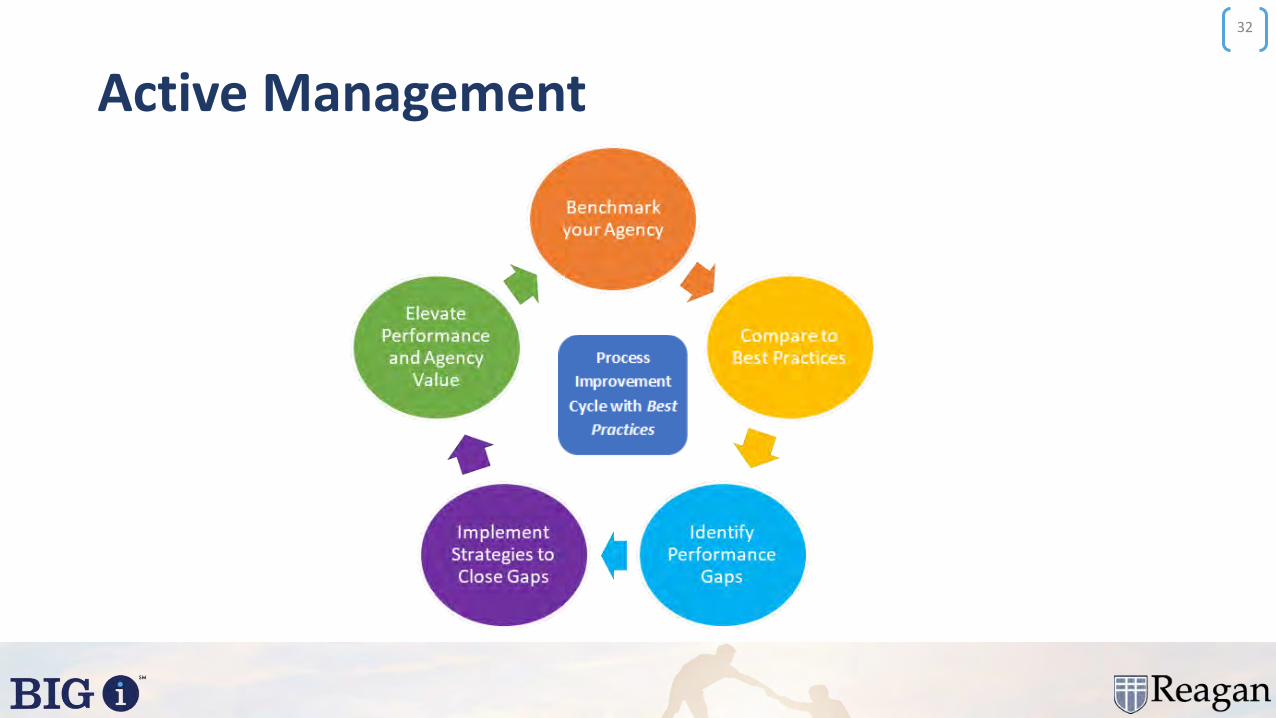
Active Management
32
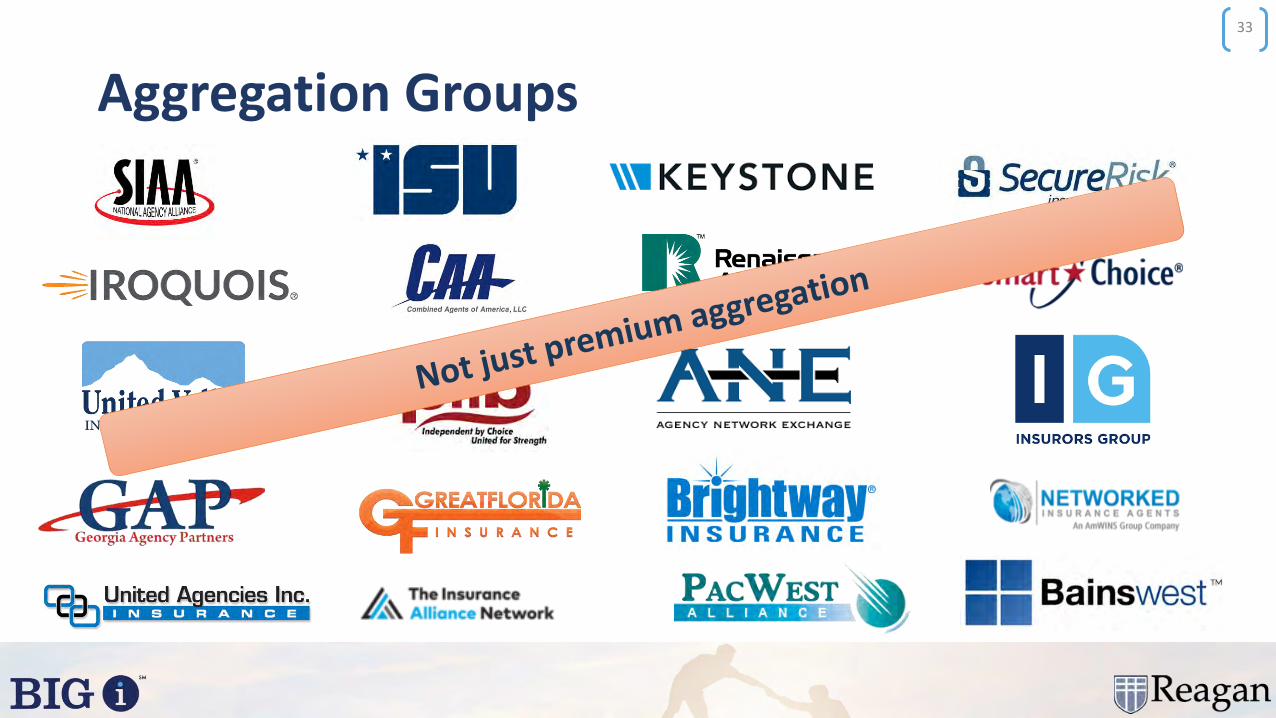
Aggregation Groups
33

5 Areas of
1
Talent
2
Specialization
3
Tools & Resources
4
Be Nimble & Opportunistic
5
Perpetuation Plan
34
J a n u a r y 1 5 - 1 7 , 2 0 2 0 | N e w O r l e a n s , L A
BEST PRACTICES
SYMPOSIUM
Value Creation: Who Does it Best and How They Do It
Bobby Reagan and Mitchell GentryReagan Consulting
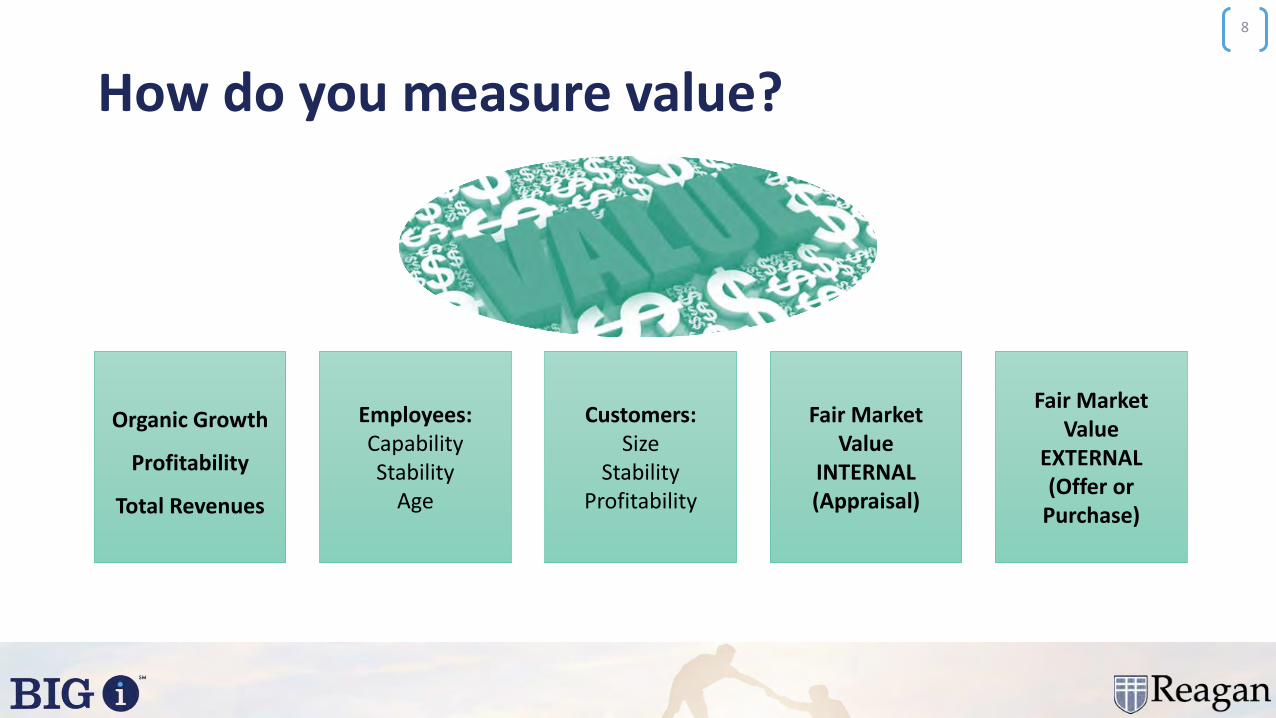
How do you measure value?
8
Organic Growth
Profitability
Total Revenues
Employees:CapabilityStability
Age
Customers:Size
StabilityProfitability
Fair Market Value
INTERNAL(Appraisal)
Fair Market Value
EXTERNAL(Offer or
Purchase)
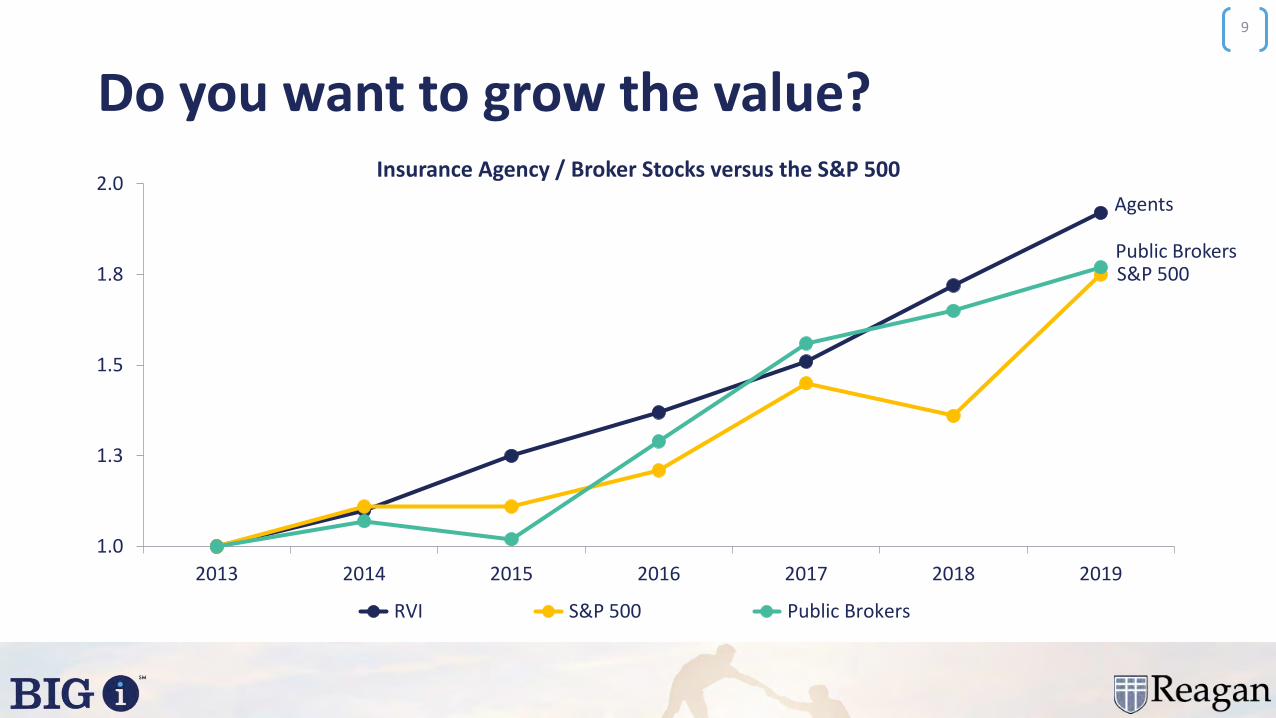
Do you want to grow the value?
9
Insurance Agency / Broker Stocks versus the S&P 500
1.0
1.3
1.5
1.8
2.0
2013 2014 2015 2016 2017 2018 2019
RVI S&P 500 Public Brokers
Agents
Public BrokersS&P 500
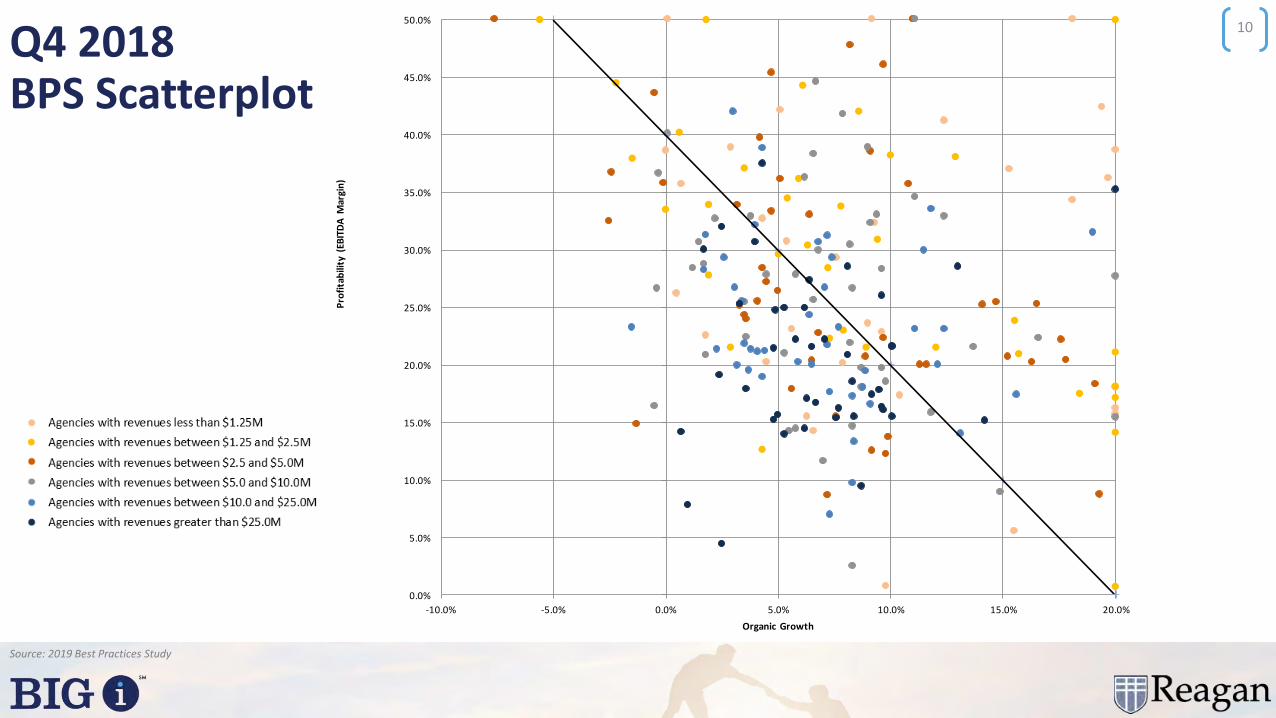
Q4 2018 BPS Scatterplot
Source: 2019 Best Practices Study
10
0.0%
5.0%
10.0%
15.0%
20.0%
25.0%
30.0%
35.0%
40.0%
45.0%
50.0%
-10.0% -5.0% 0.0% 5.0% 10.0% 15.0% 20.0%
Pro
fita
bili
ty (
EBIT
DA
Mar
gin
)
Organic Growth
Agencies with revenues less than $1.25M Agencies with revenues between $1.25 and $2.5M

Value Creation over the next decade
• How are you going to do it?
• Should you maximize profits? Organic Growth? Both?
• Which is more important: profit or growth?
• If you make investments, how and where should they be made?
11

Who is most successfully growing value?• We scored Best Practices firms with $5 to $25 million in revenues
based on their performance across 10 metrics, including organic growth, EBITDA margin and Rule of 20 score, among others.
• We then compared the performance of 15 “top-performing” firms to that of the 15 firms with the lowest composite score across 19 variables that could potentially drive value creation.
• We would emphasize that, while this data is limited to 2018 performance, most of the selected firms are continually excelling relative to their peers.
12
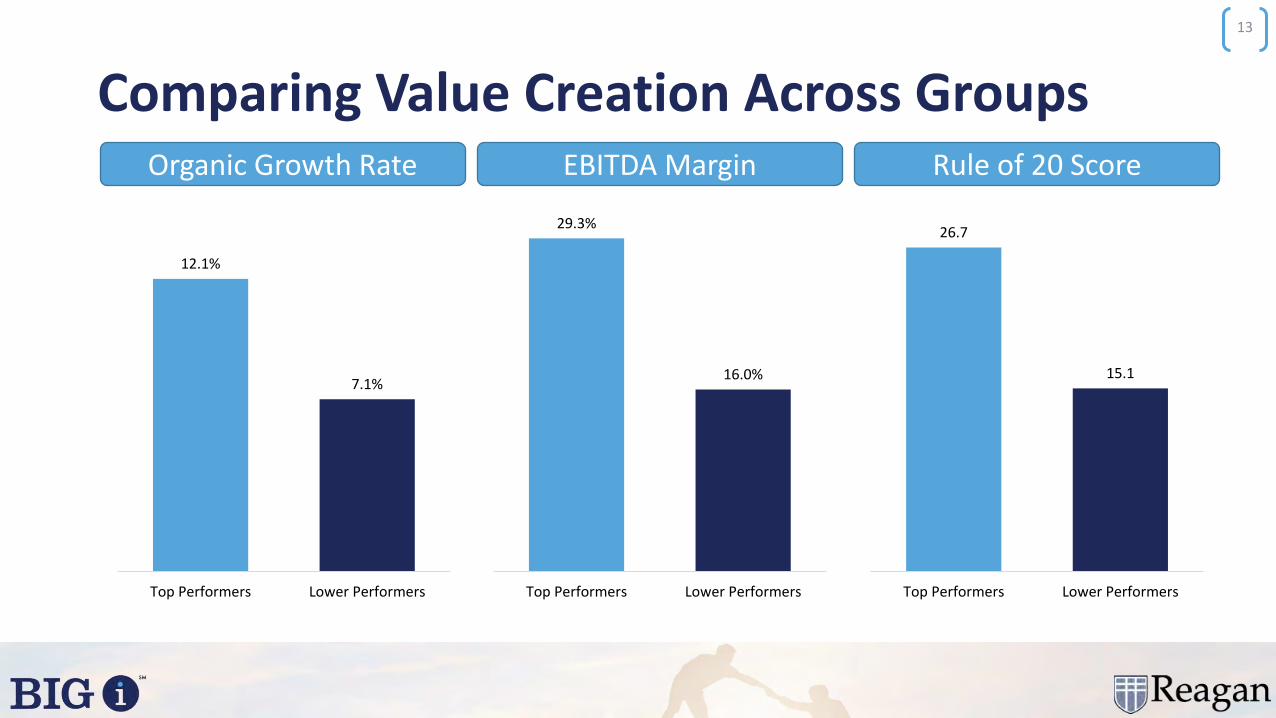
Comparing Value Creation Across Groups
13
Organic Growth Rate
12.1%
7.1%
Top Performers Lower Performers
EBITDA Margin Rule of 20 Score
29.3%
16.0%
Top Performers Lower Performers
26.7
15.1
Top Performers Lower Performers

What does BPS data suggest creates value?
• According to the Best Practices data, outsized performance in the following metrics plays a meaningful role in value creation:
14
Sales Velocity
Producer book size
Weighted average shareholder age (WASA)
Revenue per employee
Spread per employee
Specialization (% of revenue)
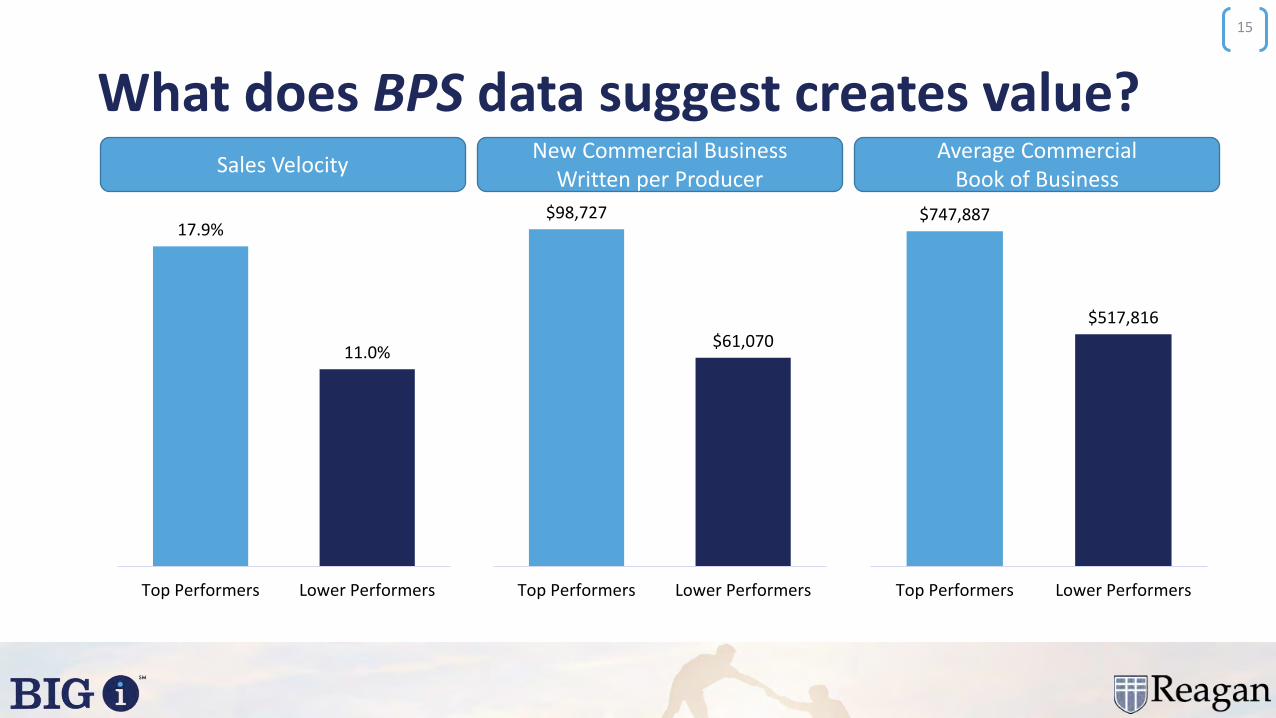
What does BPS data suggest creates value?
15
Sales Velocity
17.9%
11.0%
Top Performers Lower Performers
New Commercial Business Written per Producer
Average Commercial Book of Business
$98,727
$61,070
Top Performers Lower Performers
$747,887
$517,816
Top Performers Lower Performers

What does BPS data suggest creates value?
16
Revenue per Employee
41.8%
33.5%
Top Performers Lower Performers
Spread per Employee Spread as a % of Revenue
$220,460
$170,635
Top Performers Lower Performers
$92,243
$55,426
Top Performers Lower Performers
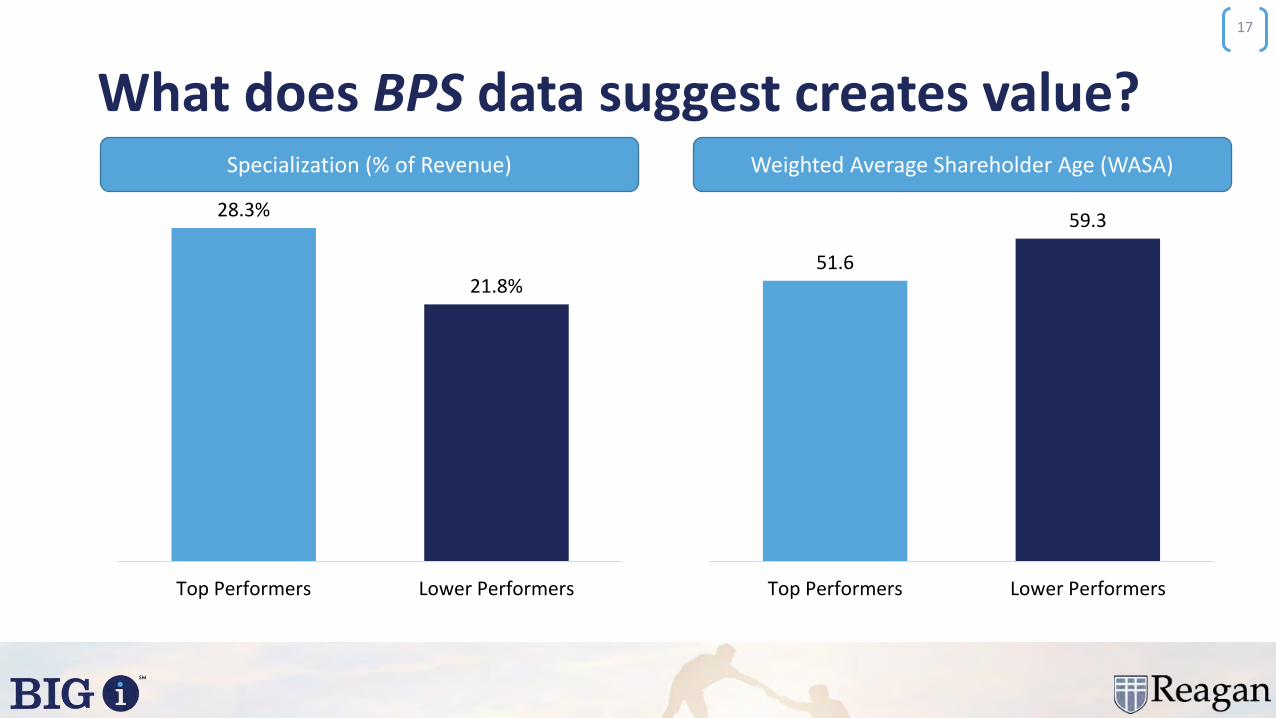
What does BPS data suggest creates value?
17
Specialization (% of Revenue)
28.3%
21.8%
Top Performers Lower Performers
Weighted Average Shareholder Age (WASA)
51.6
59.3
Top Performers Lower Performers

This BPS data is helpful and is clear evidence of higher value creation, but…
18
It does not answer the question of the steps that need to be taken or the strategic path to superior value creation.
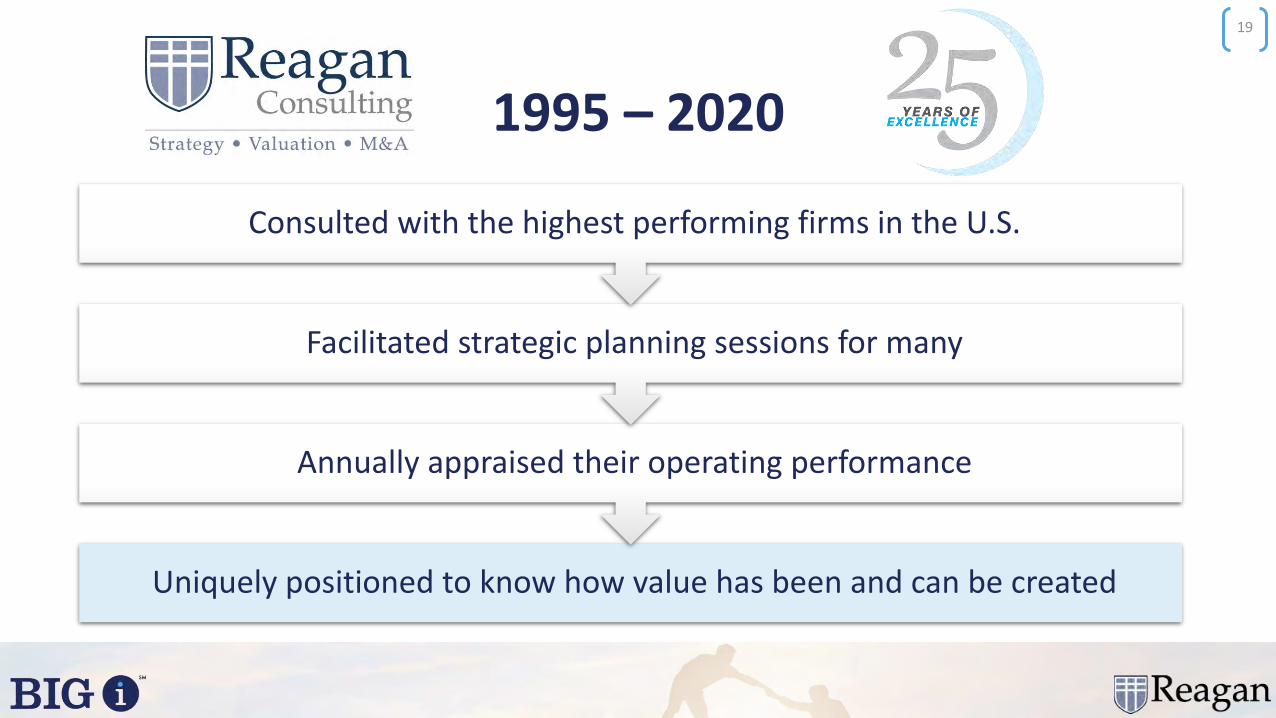
1995 – 2020
19
Uniquely positioned to know how value has been and can be created
Annually appraised their operating performance
Facilitated strategic planning sessions for many
Consulted with the highest performing firms in the U.S.
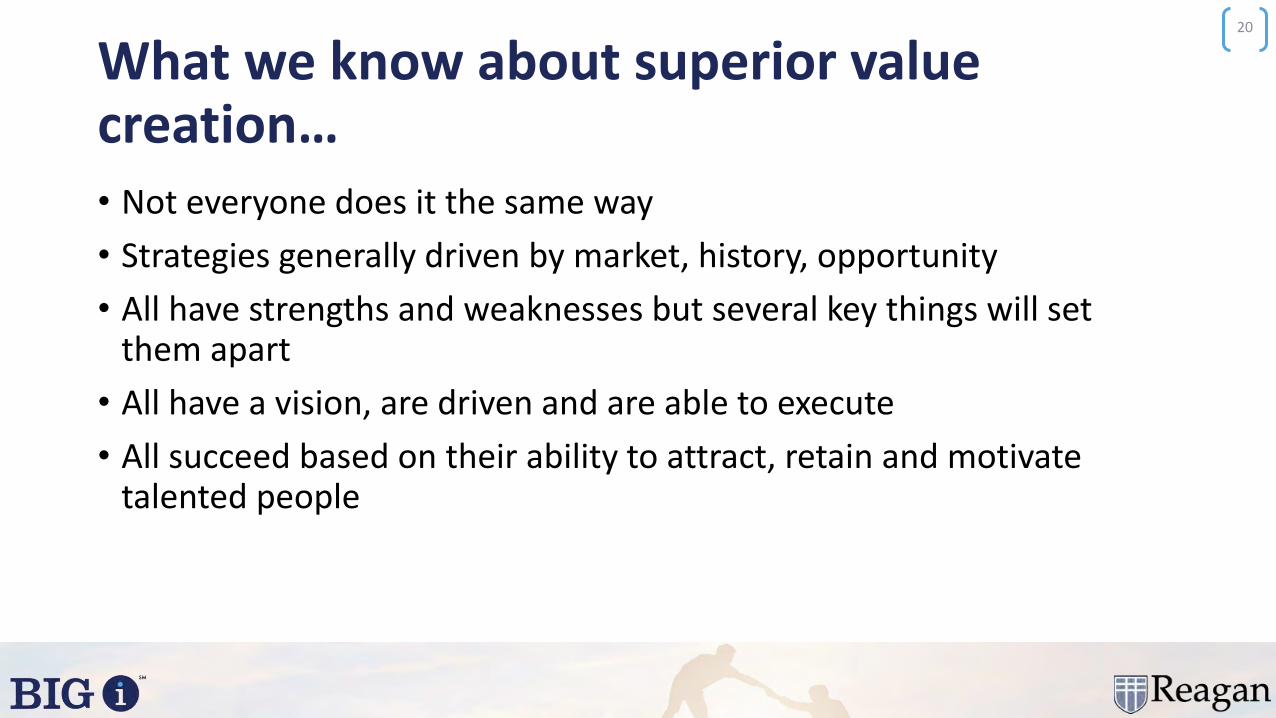
What we know about superior value creation…• Not everyone does it the same way
• Strategies generally driven by market, history, opportunity
• All have strengths and weaknesses but several key things will set them apart
• All have a vision, are driven and are able to execute
• All succeed based on their ability to attract, retain and motivate talented people
20

How the most successful are growing value:
1) Superior leadership and management
2) Superior producers, sales process and sales leadership
3) Gaining competitive advantage
4) Superior operations, efficiency and customer service
5) Superior ownership, perpetuation and sustainability model
6) Successful acquisition strategy
21
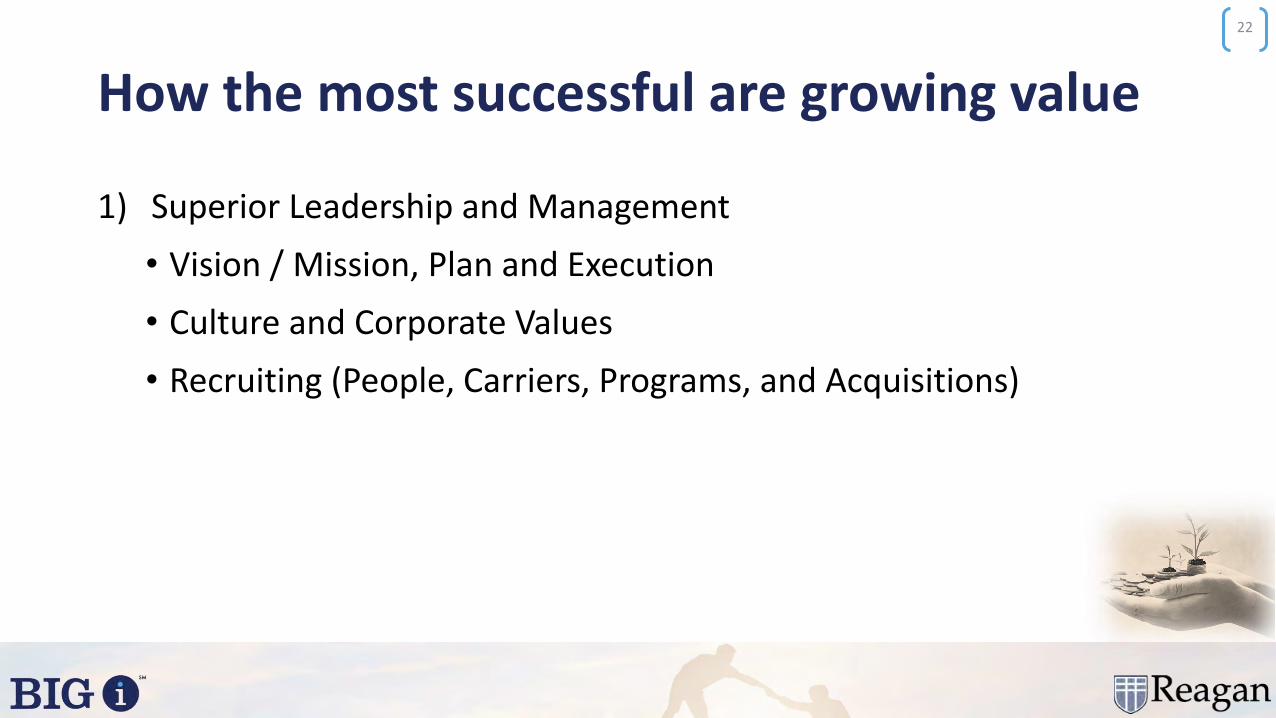
How the most successful are growing value
1) Superior Leadership and Management
• Vision / Mission, Plan and Execution
• Culture and Corporate Values
• Recruiting (People, Carriers, Programs, and Acquisitions)
22

How the most successful are growing value
2) Superior Producers, Sales Process, and Sales Leadership
• Better people, recruiting, training
• Better sales culture
• Better sales tools and resources
• Better sales process
• More accountability and sales leadership
• Level of producer hiring aligned with objectives and needs
23
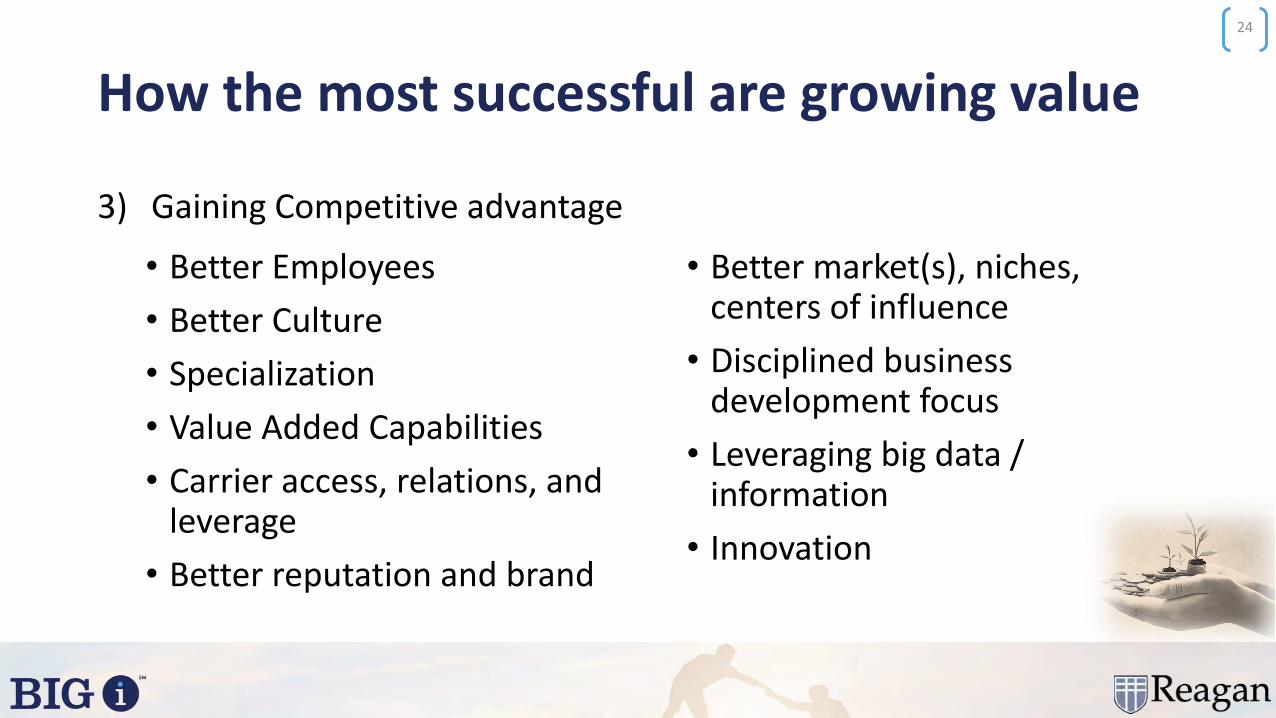
How the most successful are growing value
3) Gaining Competitive advantage
24
• Better Employees
• Better Culture
• Specialization
• Value Added Capabilities
• Carrier access, relations, and leverage
• Better reputation and brand
• Better market(s), niches, centers of influence
• Disciplined business development focus
• Leveraging big data / information
• Innovation
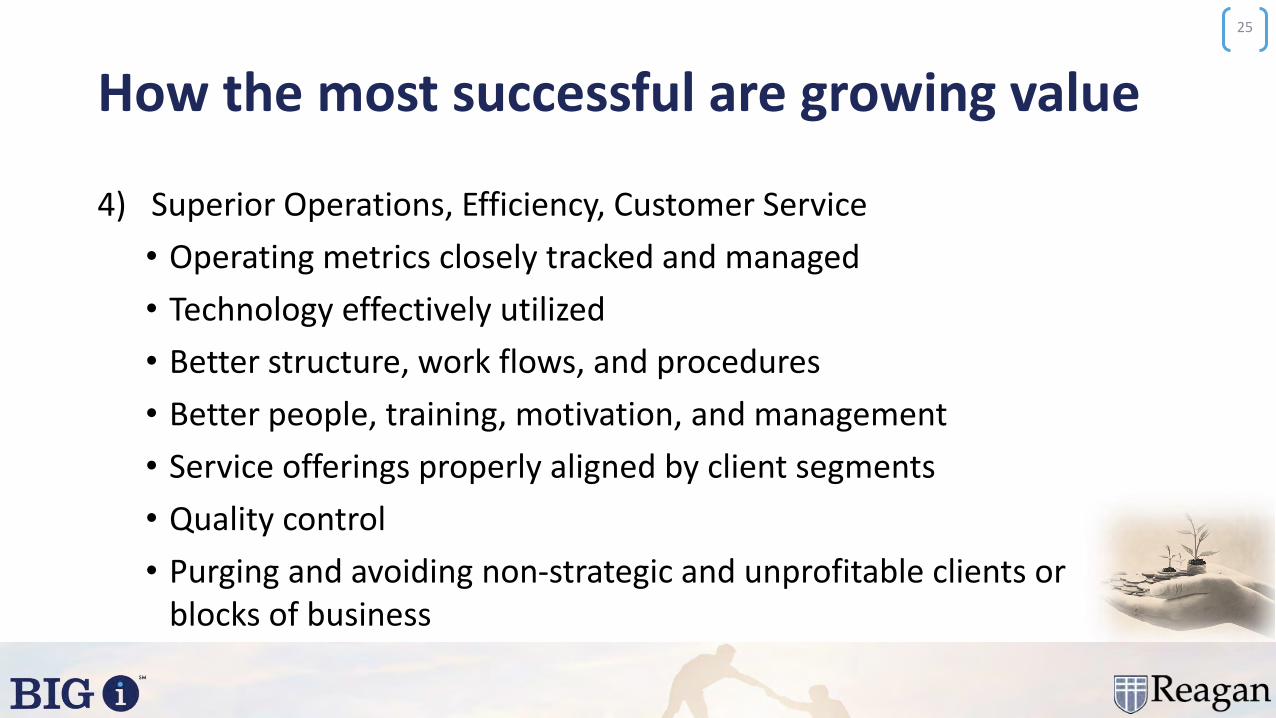
How the most successful are growing value
4) Superior Operations, Efficiency, Customer Service
• Operating metrics closely tracked and managed
• Technology effectively utilized
• Better structure, work flows, and procedures
• Better people, training, motivation, and management
• Service offerings properly aligned by client segments
• Quality control
• Purging and avoiding non-strategic and unprofitable clients or blocks of business
25

How the most successful are growing value
5) Superior Ownership, Perpetuation and Sustainability Model
• Healthy investment in hiring and people development
• Agency equity property valued and owned
• Plan in place for the perpetuation of ownership and operations
• Ownership used to attract, retain and motivate key employees
• Proper shareholder and employment agreements in place
26
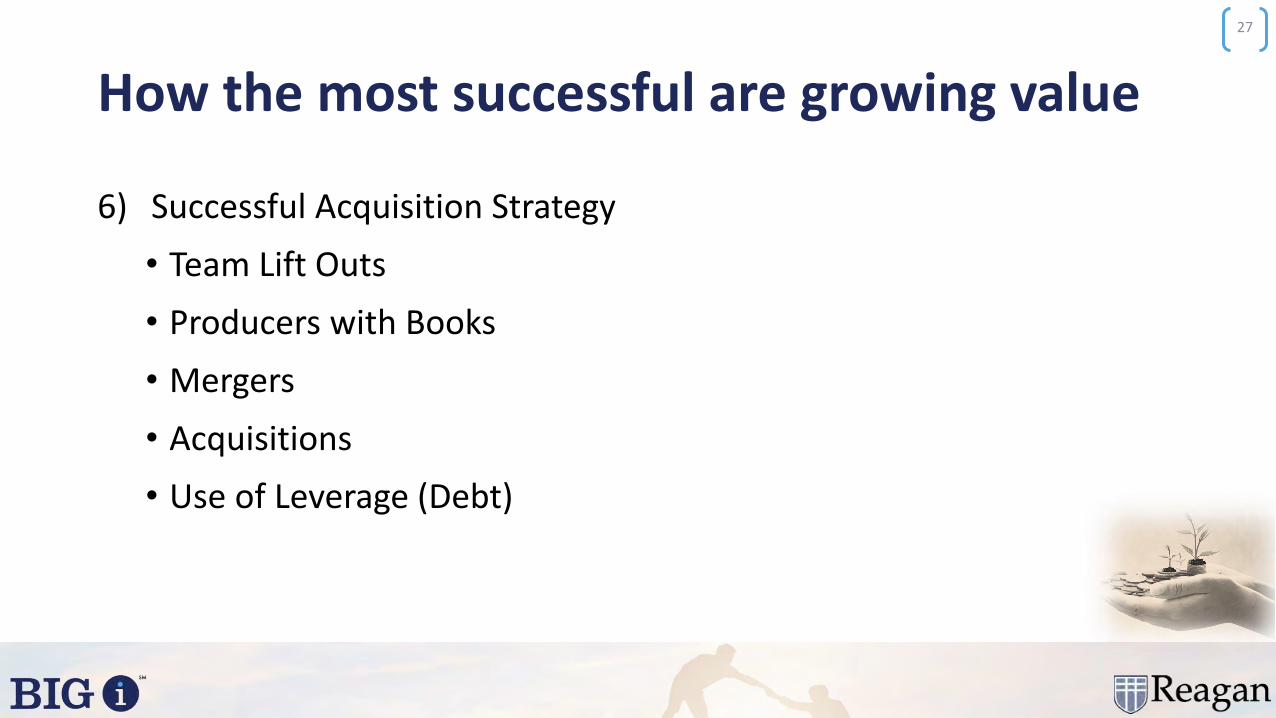
How the most successful are growing value
6) Successful Acquisition Strategy
• Team Lift Outs
• Producers with Books
• Mergers
• Acquisitions
• Use of Leverage (Debt)
27
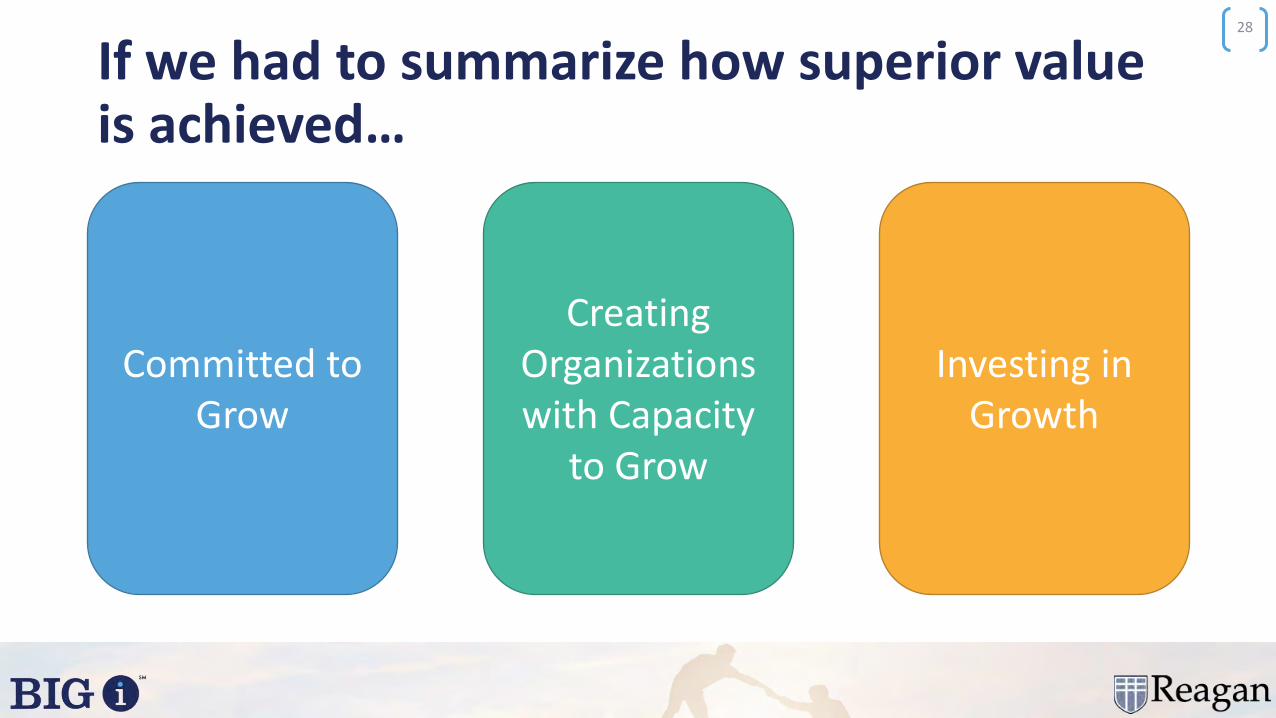
If we had to summarize how superior value is achieved…
28
Committed to Grow
Creating Organizations with Capacity
to Grow
Investing in Growth
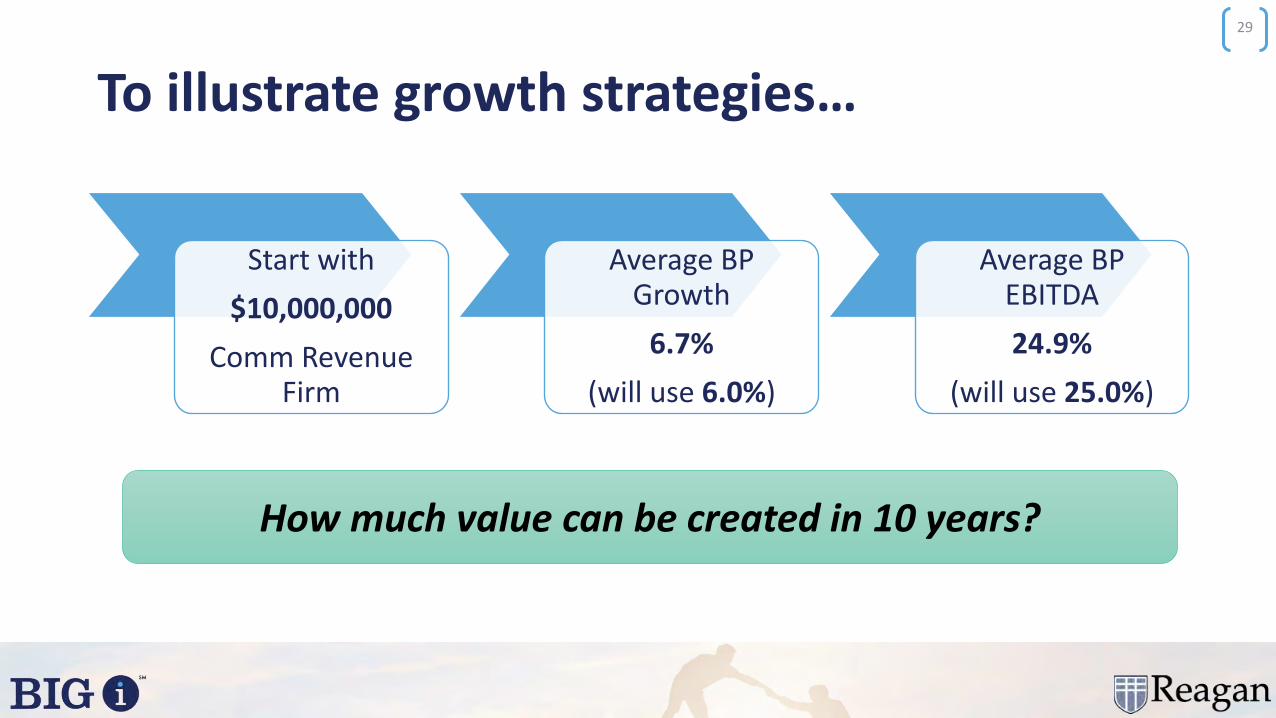
To illustrate growth strategies…
29
Start with
$10,000,000
Comm Revenue Firm
Average BP Growth
6.7%
(will use 6.0%)
Average BP EBITDA
24.9%
(will use 25.0%)
How much value can be created in 10 years?
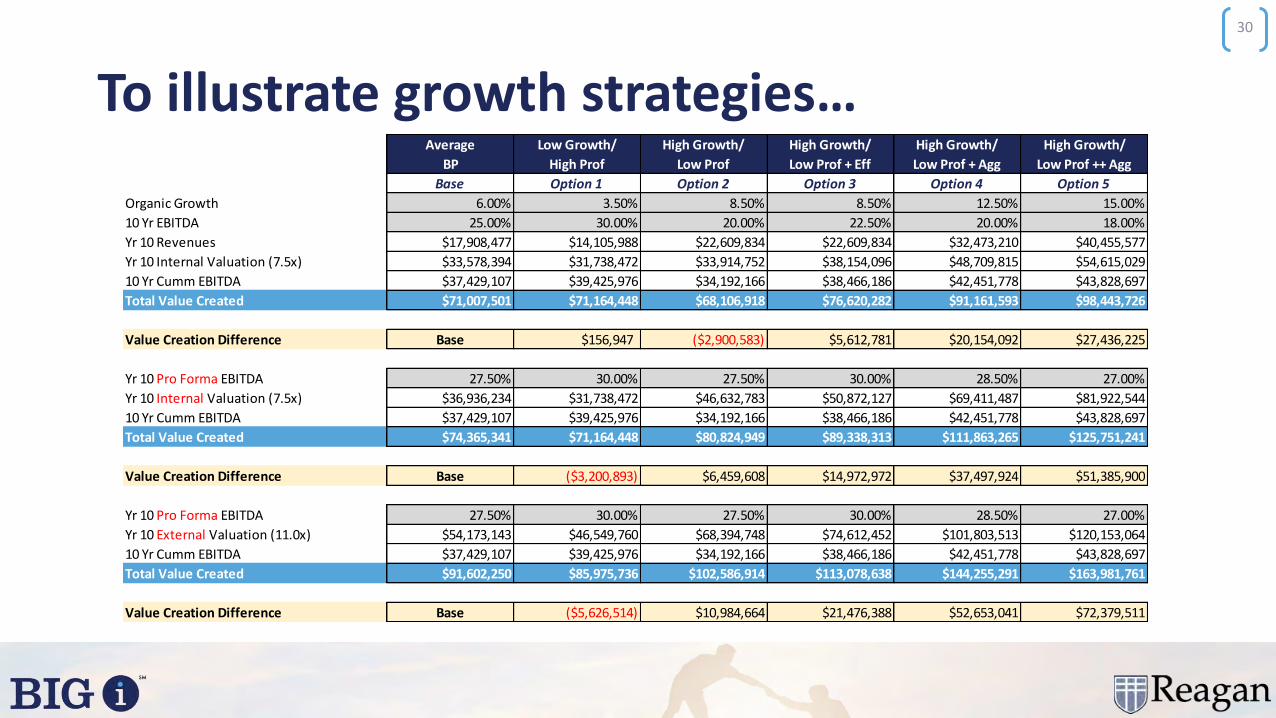
To illustrate growth strategies…
30
Average
BP
Base
Organic Growth 6.00%
10 Yr EBITDA 25.00%
Yr 10 Revenues $17,908,477
Yr 10 Internal Valuation (7.5x) $33,578,394
10 Yr Cumm EBITDA $37,429,107
Total Value Created $71,007,501
Value Creation Difference Base
Yr 10 Pro Forma EBITDA 27.50%
Yr 10 Internal Valuation (7.5x) $36,936,234
10 Yr Cumm EBITDA $37,429,107
Total Value Created $74,365,341
Value Creation Difference Base
Yr 10 Pro Forma EBITDA 27.50%
Yr 10 External Valuation (11.0x) $54,173,143
10 Yr Cumm EBITDA $37,429,107
Total Value Created $91,602,250
Value Creation Difference Base
Average
BP
Low Growth/
High Prof
High Growth/
Low Prof
High Growth/
Low Prof + Eff
High Growth/
Low Prof + Agg
High Growth/
Low Prof ++ Agg
Base Option 1 Option 2 Option 3 Option 4 Option 5
Organic Growth 6.00% 3.50% 8.50% 8.50% 12.50% 15.00%
10 Yr EBITDA 25.00% 30.00% 20.00% 22.50% 20.00% 18.00%
Yr 10 Revenues $17,908,477 $14,105,988 $22,609,834 $22,609,834 $32,473,210 $40,455,577
Yr 10 Internal Valuation (7.5x) $33,578,394 $31,738,472 $33,914,752 $38,154,096 $48,709,815 $54,615,029
10 Yr Cumm EBITDA $37,429,107 $39,425,976 $34,192,166 $38,466,186 $42,451,778 $43,828,697
Total Value Created $71,007,501 $71,164,448 $68,106,918 $76,620,282 $91,161,593 $98,443,726
Value Creation Difference Base $156,947 ($2,900,583) $5,612,781 $20,154,092 $27,436,225
Yr 10 Pro Forma EBITDA 27.50% 30.00% 27.50% 30.00% 28.50% 27.00%
Yr 10 Internal Valuation (7.5x) $36,936,234 $31,738,472 $46,632,783 $50,872,127 $69,411,487 $81,922,544
10 Yr Cumm EBITDA $37,429,107 $39,425,976 $34,192,166 $38,466,186 $42,451,778 $43,828,697
Total Value Created $74,365,341 $71,164,448 $80,824,949 $89,338,313 $111,863,265 $125,751,241
Value Creation Difference Base ($3,200,893) $6,459,608 $14,972,972 $37,497,924 $51,385,900
Yr 10 Pro Forma EBITDA 27.50% 30.00% 27.50% 30.00% 28.50% 27.00%
Yr 10 External Valuation (11.0x) $54,173,143 $46,549,760 $68,394,748 $74,612,452 $101,803,513 $120,153,064
10 Yr Cumm EBITDA $37,429,107 $39,425,976 $34,192,166 $38,466,186 $42,451,778 $43,828,697
Total Value Created $91,602,250 $85,975,736 $102,586,914 $113,078,638 $144,255,291 $163,981,761
Value Creation Difference Base ($5,626,514) $10,984,664 $21,476,388 $52,653,041 $72,379,511

10 Year Value Creation
$7
1,0
07
,50
1
$7
1,1
64
,44
8
$6
8,1
06
,91
8
$7
6,6
20
,28
2
$9
1,1
61
,59
3
$9
8,4
43
,72
6
$7
4,3
65
,34
1
$7
1,1
64
,44
8
$8
0,8
24
,94
9
$8
9,3
38
,31
3
$1
11
,86
3,2
65
$1
25
,75
1,2
41
$9
1,6
02
,25
0
$8
5,9
75
,73
6
$1
02
,58
6,9
14
$1
13
,07
8,6
38
$1
44
,25
5,2
91
$1
63
,98
1,7
61
$0
$20,000,000
$40,000,000
$60,000,000
$80,000,000
$100,000,000
$120,000,000
$140,000,000
$160,000,000
$180,000,000
Base Option 1 Option2 Option3 Option4 Option5
10 Year Internal Value Created 10 Yr Pro Forma Internal Value Created 10 Yr Pro Forma External Value Created
31
Organic Growth 6.0% 3.5% 8.5% 8.5% 12.5% 15.0%
EBITDA 25.0% 30.0% 20.0% 22.5% 20.0% 18.0%
Pro Forma EBITDA 27.5% 30.0% 27.5% 30.0% 28.5% 27.0%
Base Option 1 Option 2 Option 3 Option 4 Option 5

An Actual Client’s Value Creation Strategy
1) Changed the firm’s governance and with that their culture
2) Addressed some problem employees
3) Addressed their ownership perpetuation model – got it working for them
4) Got younger – brought in the next generation (especially producers)
5) Merged with another firm to achieve scale
6) Started planning – got aggressive – effectively executed deals
32
Value Creation
There is a huge opportunity in front of you
Build on your strengths / Address your weaknesses
Decide where some wise investments can be made
Sell your team on a value creation vision that they will benefit from and be rewarded by
Source:
33

J a n u a r y 1 5 - 1 7 , 2 0 2 0 | N e w O r l e a n s , L A
BEST PRACTICES
SYMPOSIUM
PTI – Buy / Sell the Industry
Brian Deitz and Harrison BrooksReagan Consulting

Consulting

Seven industries that will be disrupted in the next 10 years
THREAT: SINGLE PAYER
THREAT: USER EXPERIENCE
LANDSCAPE / FUNDAMENTALS
THREAT: VALUATION BUBBLE
OPPORTUNITY: YOUNG TALENT
OPPORTUNITY: RELATIONSHIP
THREAT: VALUE CHAIN
OPPORTUNITY: NEW RISK
BUY / SELL
Financial Services Healthcare Fashion Clothing
Legal Services Moving Industry Home Furnishings
Insurance
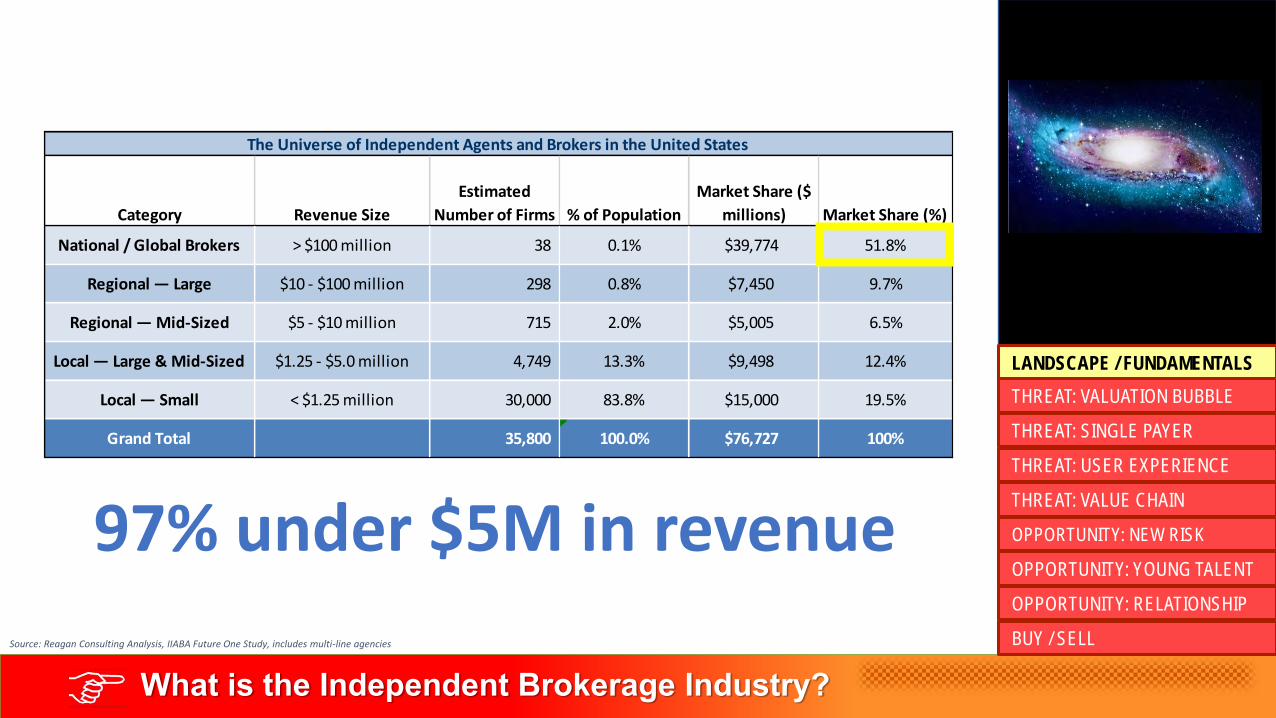
What is the Independent Brokerage Industry?Source: Reagan Consulting Analysis, IIABA Future One Study, includes multi-line agencies
Category Revenue Size
Estimated
Number of Firms % of Population
Market Share ($
millions) Market Share (%)
National / Global Brokers > $100 million 38 0.1% $39,774 51.8%
Regional — Large $10 - $100 million 298 0.8% $7,450 9.7%
Regional — Mid-Sized $5 - $10 million 715 2.0% $5,005 6.5%
Local — Large & Mid-Sized $1.25 - $5.0 million 4,749 13.3% $9,498 12.4%
Local — Small < $1.25 million 30,000 83.8% $15,000 19.5%
Grand Total 35,800 100.0% $76,727 100%
The Universe of Independent Agents and Brokers in the United States
97% under $5M in revenue
THREAT: SINGLE PAYER
THREAT: USER EXPERIENCE
LANDSCAPE / FUNDAMENTALS
THREAT: VALUATION BUBBLE
OPPORTUNITY: YOUNG TALENT
OPPORTUNITY: RELATIONSHIP
THREAT: VALUE CHAIN
OPPORTUNITY: NEW RISK
BUY / SELL

What is the Independent Brokerage Industry?
35,000+ AGENCIES
Average Revenue by Source (across all revenue categories)
60%25%
15%Commercial P&C
Personal P&C
Life/Health/Financial
Median OGP Organic Growth Rate:
6.1%
Median OGP EBITDA Margin:
23.5%
Source: Reagan Consulting Organic Growth and Profitability Survey, Q3 2019
70%
30% Direct Writers
Independent Channel
30%
70%
PERSONAL P&C Market Share
COMMERCIAL P&CMarket Share
THREAT: SINGLE PAYER
THREAT: USER EXPERIENCE
LANDSCAPE / FUNDAMENTALS
THREAT: VALUATION BUBBLE
OPPORTUNITY: YOUNG TALENT
OPPORTUNITY: RELATIONSHIP
THREAT: VALUE CHAIN
OPPORTUNITY: NEW RISK
BUY / SELL
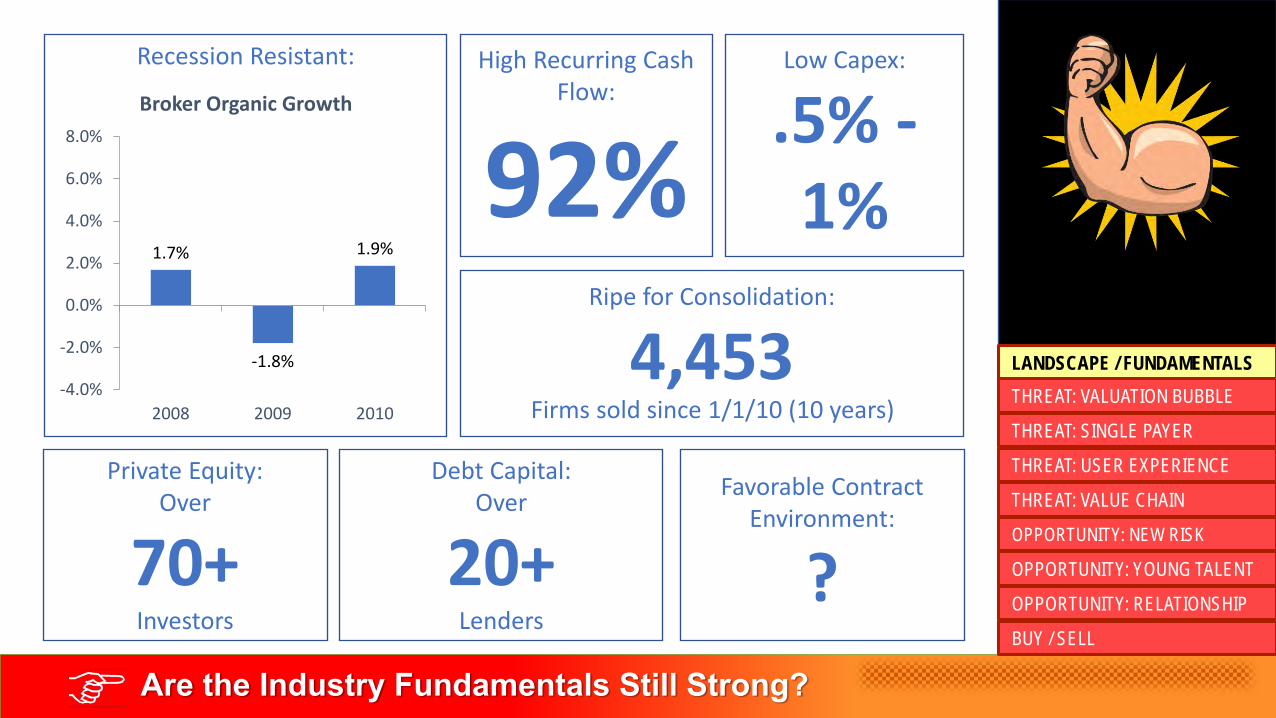
Are the Industry Fundamentals Still Strong?
1.7%
-1.8%
1.9%
-4.0%
-2.0%
0.0%
2.0%
4.0%
6.0%
8.0%
2008 2009 2010
Broker Organic Growth
Recession Resistant: High Recurring Cash Flow:
92%
Low Capex:
.5% -1%
Ripe for Consolidation:
4,453Firms sold since 1/1/10 (10 years)
Private Equity:Over
70+Investors
Debt Capital:Over
20+Lenders
Favorable Contract Environment:
?
THREAT: SINGLE PAYER
THREAT: USER EXPERIENCE
LANDSCAPE / FUNDAMENTALS
THREAT: VALUATION BUBBLE
OPPORTUNITY: YOUNG TALENT
OPPORTUNITY: RELATIONSHIP
THREAT: VALUE CHAIN
OPPORTUNITY: NEW RISK
BUY / SELL

Are the Industry Fundamentals Still Strong?
THREAT: SINGLE PAYER
THREAT: USER EXPERIENCE
LANDSCAPE / FUNDAMENTALS
THREAT: VALUATION BUBBLE
OPPORTUNITY: YOUNG TALENT
OPPORTUNITY: RELATIONSHIP
THREAT: VALUE CHAIN
OPPORTUNITY: NEW RISK
BUY / SELL

Are the Industry Fundamentals Still Strong?
THREAT: SINGLE PAYER
THREAT: USER EXPERIENCE
LANDSCAPE / FUNDAMENTALS
THREAT: VALUATION BUBBLE
OPPORTUNITY: YOUNG TALENT
OPPORTUNITY: RELATIONSHIP
THREAT: VALUE CHAIN
OPPORTUNITY: NEW RISK
BUY / SELL

What will burst the valuation bubble?
6.5x 6.0x 5.8x 6.0x 6.3x 6.5x 6.8x 7.0x 7.5x 8.0x 8.0x 9.0x 9.5x
3.5x
3.0x 3.0x 2.5x 2.5x 2.5x 3.0x 3.0x
3.0x 3.0x 3.0x
3.0x 3.0x
-
2.0x
4.0x
6.0x
8.0x
10.0x
12.0x
2007 2008 2009 2010 2011 2012 2013 2014 2015 2016 2017 2018 2019
Typical Guaranteed Price Earn-Out Opportunity
M&A Valuations in the Brokerage Industry
Source: Reagan Consulting Analysis. Includes high-quality $3-$10 million firms.
THREAT: SINGLE PAYER
THREAT: USER EXPERIENCE
LANDSCAPE / FUNDAMENTALS
THREAT: VALUATION BUBBLE
OPPORTUNITY: YOUNG TALENT
OPPORTUNITY: RELATIONSHIP
THREAT: VALUE CHAIN
OPPORTUNITY: NEW RISK
BUY / SELL
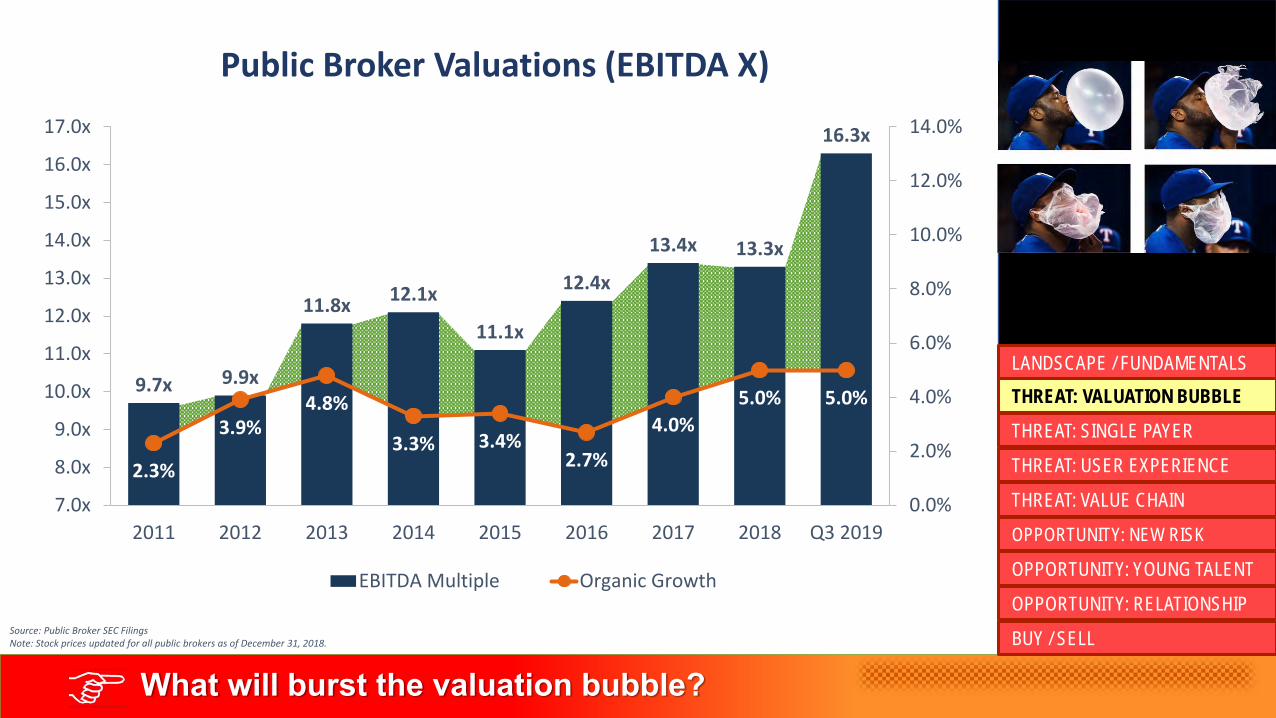
9.7x 9.9x
11.8x12.1x
11.1x
12.4x
13.4x 13.3x
16.3x
2.3%
3.9%4.8%
3.3% 3.4%2.7%
4.0%
5.0% 5.0%
0.0%
2.0%
4.0%
6.0%
8.0%
10.0%
12.0%
14.0%
7.0x
8.0x
9.0x
10.0x
11.0x
12.0x
13.0x
14.0x
15.0x
16.0x
17.0x
2011 2012 2013 2014 2015 2016 2017 2018 Q3 2019
EBITDA Multiple Organic Growth
What will burst the valuation bubble?
Source: Public Broker SEC FilingsNote: Stock prices updated for all public brokers as of December 31, 2018.
Public Broker Valuations (EBITDA X)
THREAT: SINGLE PAYER
THREAT: USER EXPERIENCE
LANDSCAPE / FUNDAMENTALS
THREAT: VALUATION BUBBLE
OPPORTUNITY: YOUNG TALENT
OPPORTUNITY: RELATIONSHIP
THREAT: VALUE CHAIN
OPPORTUNITY: NEW RISK
BUY / SELL
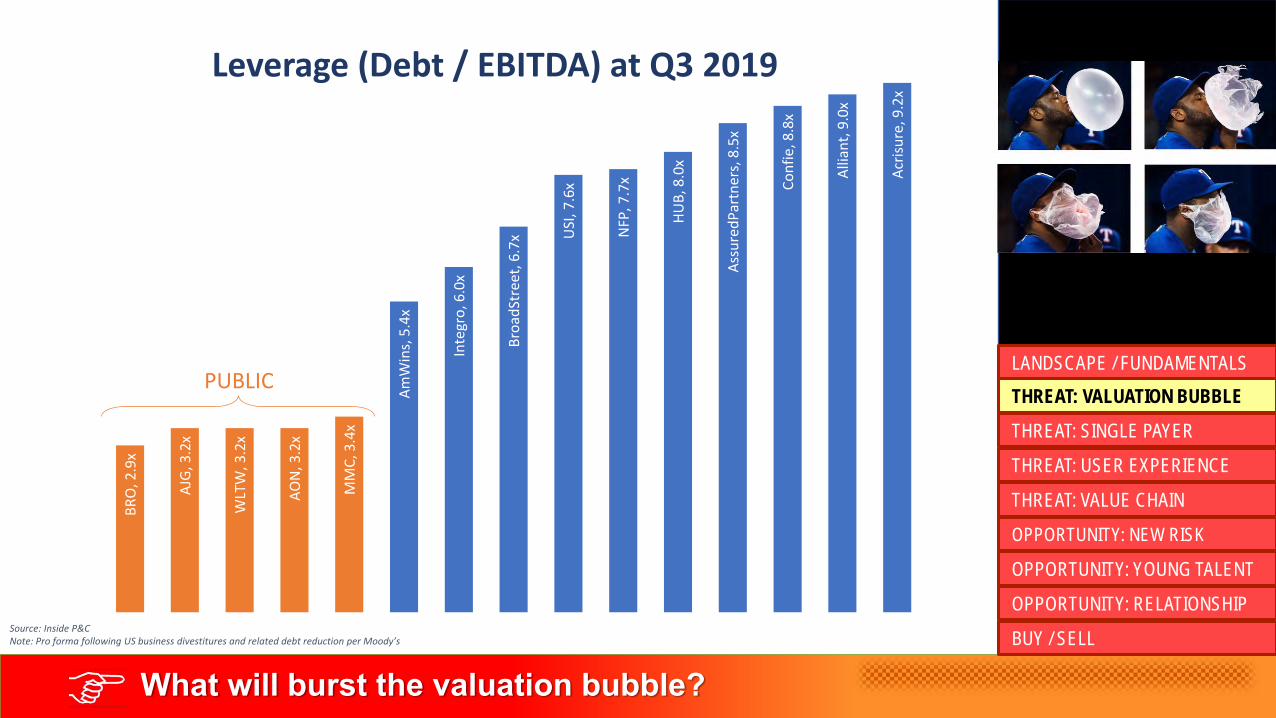
What will burst the valuation bubble?
BR
O, 2
.9x
AJG
, 3.2
x
WLT
W, 3
.2x
AO
N, 3
.2x
MM
C, 3
.4x
Am
Win
s, 5
.4x
Inte
gro
, 6.0
x
Bro
adSt
reet
, 6.7
x USI
, 7.6
x
NFP
, 7.7
x
HU
B, 8
.0x
Ass
ure
dP
artn
ers,
8.5
x
Co
nfi
e, 8
.8x
Alli
ant,
9.0
x
Acr
isu
re, 9
.2x
PUBLIC
Source: Inside P&CNote: Pro forma following US business divestitures and related debt reduction per Moody’s
Leverage (Debt / EBITDA) at Q3 2019
THREAT: SINGLE PAYER
THREAT: USER EXPERIENCE
LANDSCAPE / FUNDAMENTALS
THREAT: VALUATION BUBBLE
OPPORTUNITY: YOUNG TALENT
OPPORTUNITY: RELATIONSHIP
THREAT: VALUE CHAIN
OPPORTUNITY: NEW RISK
BUY / SELL

What will burst the valuation bubble?
What is the Outlook for Corporate Taxes?
THREAT: SINGLE PAYER
THREAT: USER EXPERIENCE
LANDSCAPE / FUNDAMENTALS
THREAT: VALUATION BUBBLE
OPPORTUNITY: YOUNG TALENT
OPPORTUNITY: RELATIONSHIP
THREAT: VALUE CHAIN
OPPORTUNITY: NEW RISK
BUY / SELL
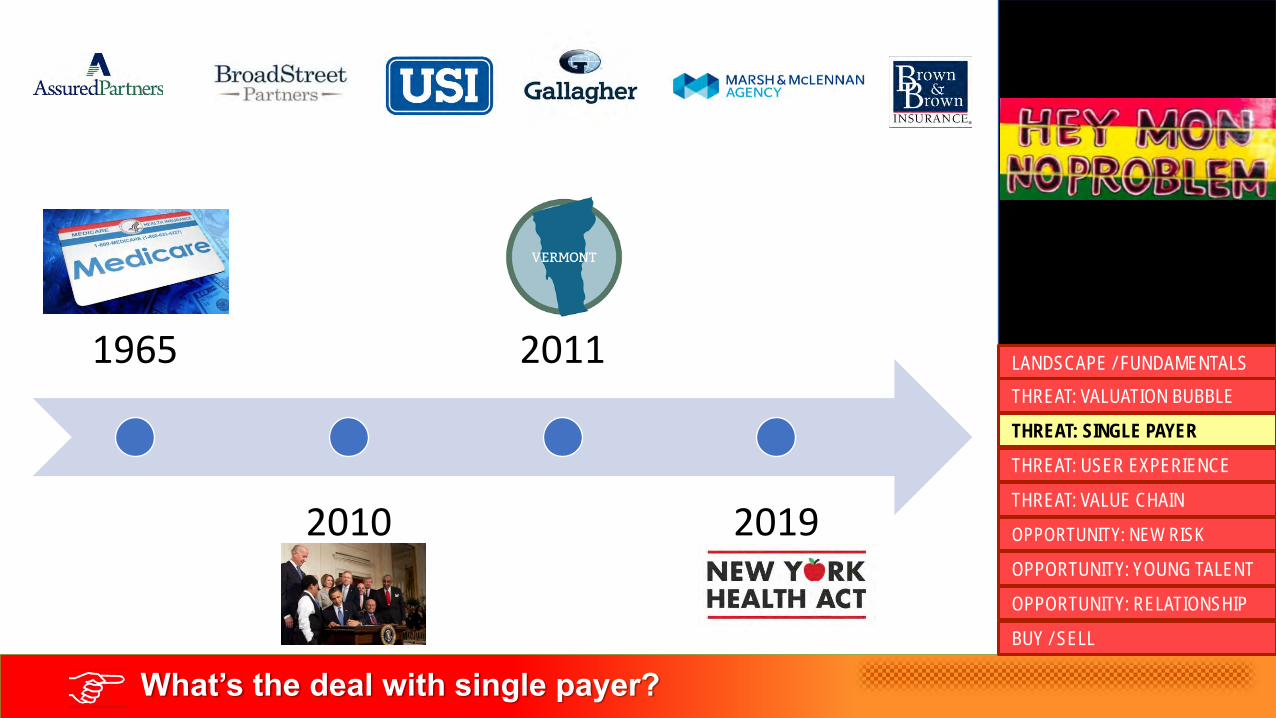
1965
2010
2011
2019
What’s the deal with single payer?
THREAT: SINGLE PAYER
THREAT: USER EXPERIENCE
LANDSCAPE / FUNDAMENTALS
THREAT: VALUATION BUBBLE
OPPORTUNITY: YOUNG TALENT
OPPORTUNITY: RELATIONSHIP
THREAT: VALUE CHAIN
OPPORTUNITY: NEW RISK
BUY / SELL

What’s the deal with single payer?
THREAT: SINGLE PAYER
THREAT: USER EXPERIENCE
LANDSCAPE / FUNDAMENTALS
THREAT: VALUATION BUBBLE
OPPORTUNITY: YOUNG TALENT
OPPORTUNITY: RELATIONSHIP
THREAT: VALUE CHAIN
OPPORTUNITY: NEW RISK
BUY / SELL

What’s the deal with single payer?
THREAT: SINGLE PAYER
THREAT: USER EXPERIENCE
LANDSCAPE / FUNDAMENTALS
THREAT: VALUATION BUBBLE
OPPORTUNITY: YOUNG TALENT
OPPORTUNITY: RELATIONSHIP
THREAT: VALUE CHAIN
OPPORTUNITY: NEW RISK
BUY / SELL
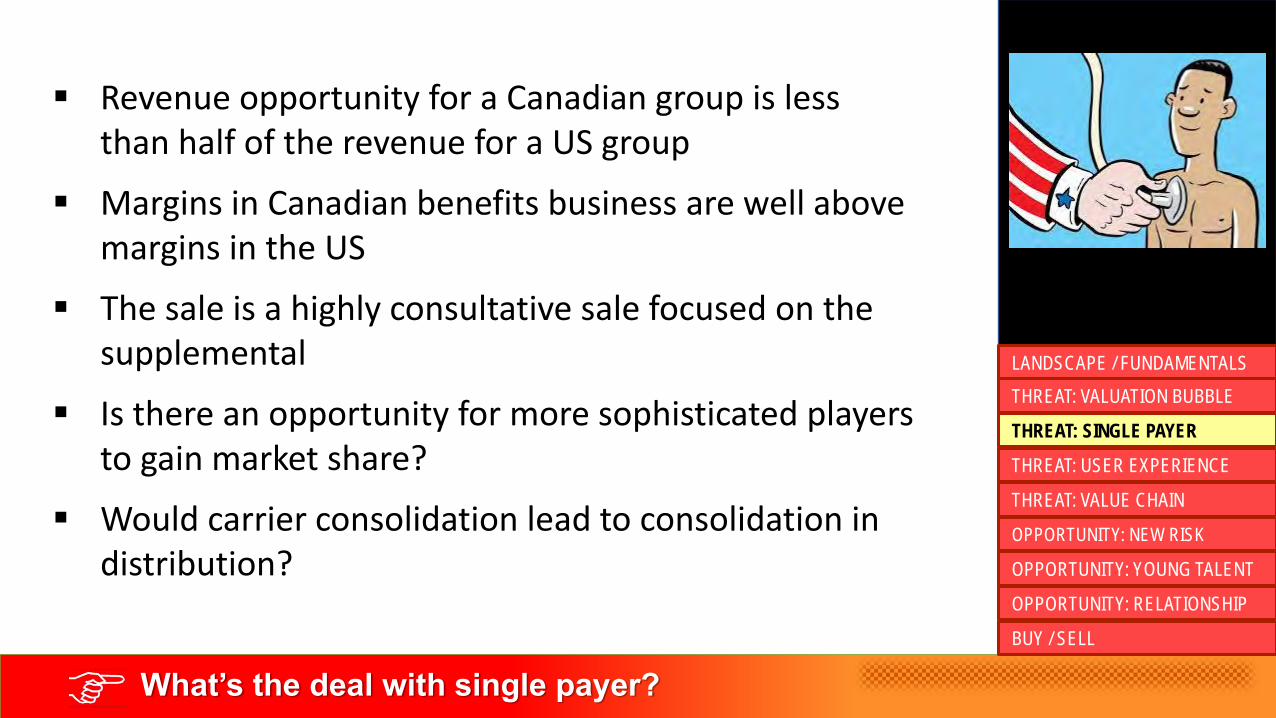
What’s the deal with single payer?
▪ Revenue opportunity for a Canadian group is less than half of the revenue for a US group
▪ Margins in Canadian benefits business are well above margins in the US
▪ The sale is a highly consultative sale focused on the supplemental
▪ Is there an opportunity for more sophisticated players to gain market share?
▪ Would carrier consolidation lead to consolidation in distribution?
THREAT: SINGLE PAYER
THREAT: USER EXPERIENCE
LANDSCAPE / FUNDAMENTALS
THREAT: VALUATION BUBBLE
OPPORTUNITY: YOUNG TALENT
OPPORTUNITY: RELATIONSHIP
THREAT: VALUE CHAIN
OPPORTUNITY: NEW RISK
BUY / SELL
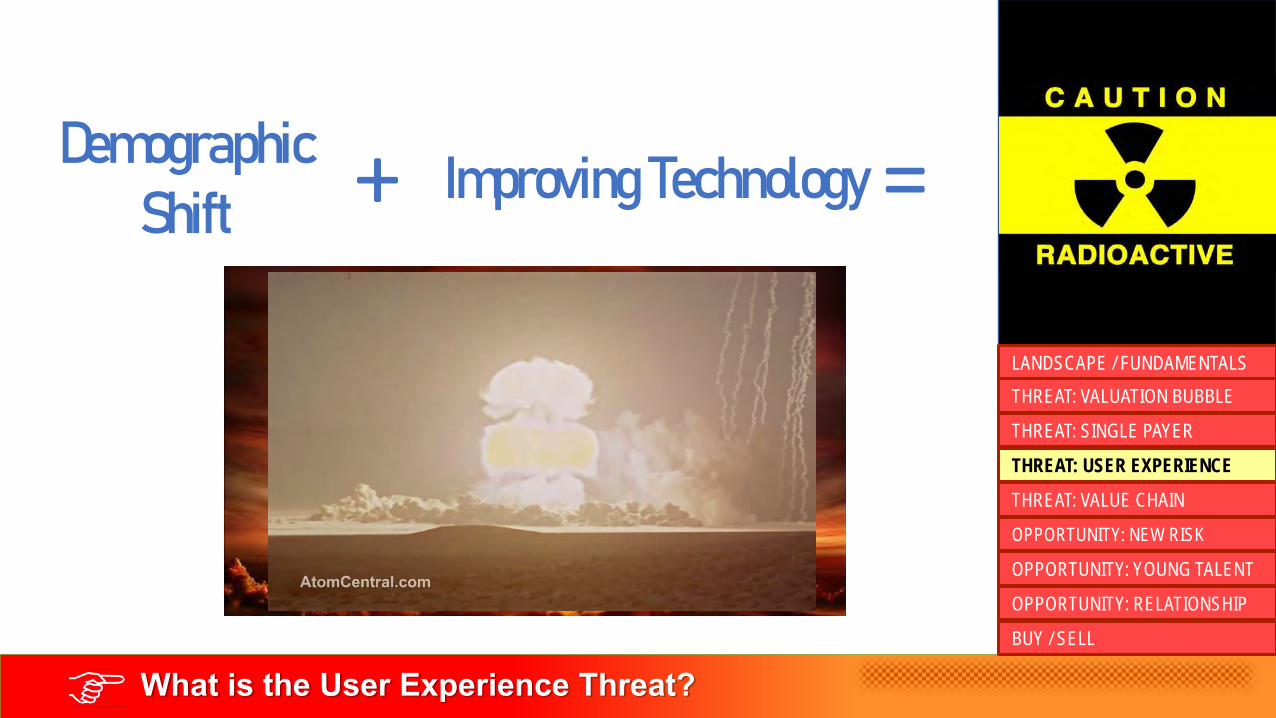
What is the User Experience Threat?
Demographic Shift
Improving Technology+ =
THREAT: SINGLE PAYER
THREAT: USER EXPERIENCE
LANDSCAPE / FUNDAMENTALS
THREAT: VALUATION BUBBLE
OPPORTUNITY: YOUNG TALENT
OPPORTUNITY: RELATIONSHIP
THREAT: VALUE CHAIN
OPPORTUNITY: NEW RISK
BUY / SELL
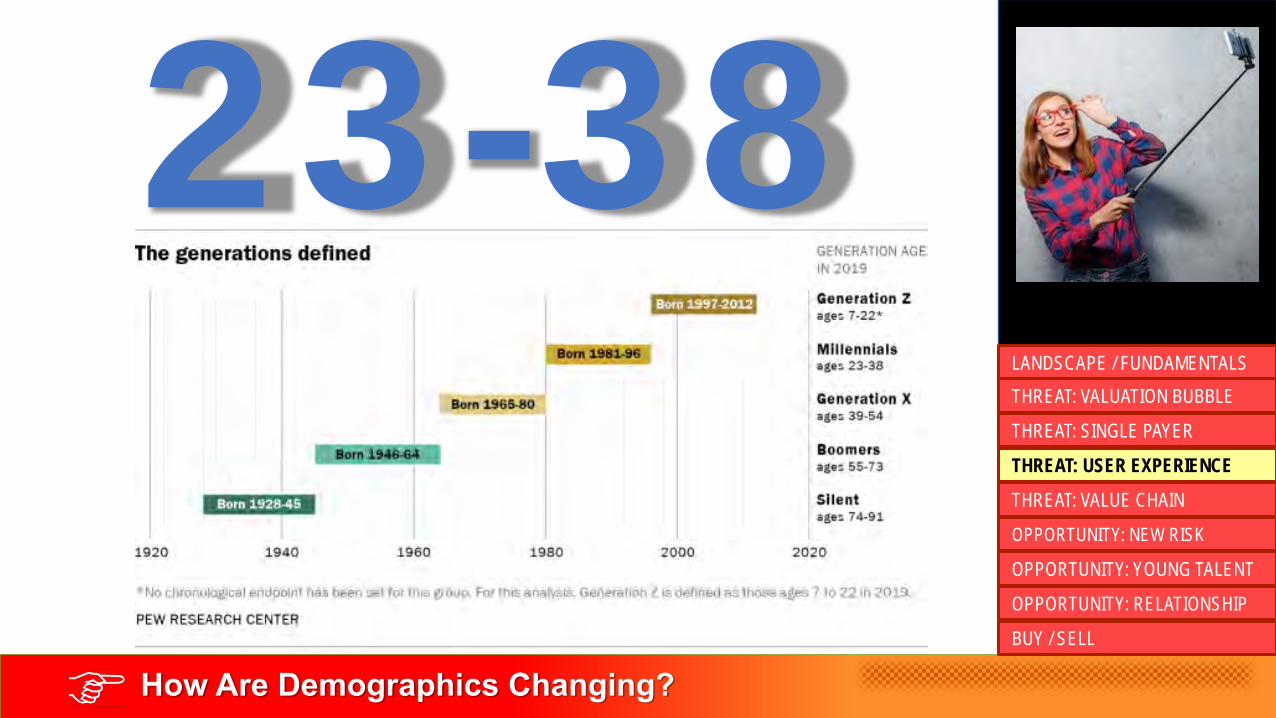
How Are Demographics Changing?
23-38THREAT: SINGLE PAYER
THREAT: USER EXPERIENCE
LANDSCAPE / FUNDAMENTALS
THREAT: VALUATION BUBBLE
OPPORTUNITY: YOUNG TALENT
OPPORTUNITY: RELATIONSHIP
THREAT: VALUE CHAIN
OPPORTUNITY: NEW RISK
BUY / SELL

Is Technology Evolving Fast Enough?
THREAT: SINGLE PAYER
THREAT: USER EXPERIENCE
LANDSCAPE / FUNDAMENTALS
THREAT: VALUATION BUBBLE
OPPORTUNITY: YOUNG TALENT
OPPORTUNITY: RELATIONSHIP
THREAT: VALUE CHAIN
OPPORTUNITY: NEW RISK
BUY / SELL
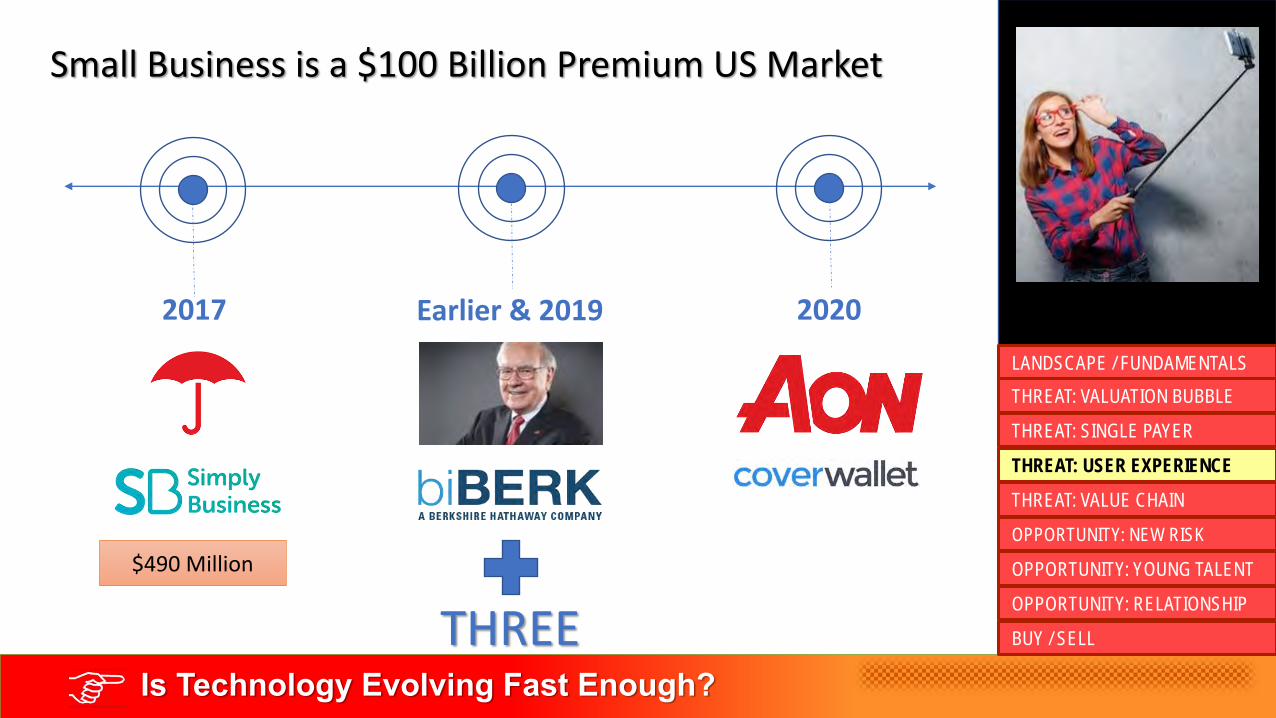
Is Technology Evolving Fast Enough?
Small Business is a $100 Billion Premium US Market
2017 Earlier & 2019
$490 Million
2020
THREE
THREAT: SINGLE PAYER
THREAT: USER EXPERIENCE
LANDSCAPE / FUNDAMENTALS
THREAT: VALUATION BUBBLE
OPPORTUNITY: YOUNG TALENT
OPPORTUNITY: RELATIONSHIP
THREAT: VALUE CHAIN
OPPORTUNITY: NEW RISK
BUY / SELL

How do Brokers Respond?
THREAT: SINGLE PAYER
THREAT: USER EXPERIENCE
LANDSCAPE / FUNDAMENTALS
THREAT: VALUATION BUBBLE
OPPORTUNITY: YOUNG TALENT
OPPORTUNITY: RELATIONSHIP
THREAT: VALUE CHAIN
OPPORTUNITY: NEW RISK
BUY / SELL

What is the impact of the consolidating carrier landscape?
Capital Markets
Carrier Broker Insured
THREAT: SINGLE PAYER
THREAT: USER EXPERIENCE
LANDSCAPE / FUNDAMENTALS
THREAT: VALUATION BUBBLE
OPPORTUNITY: YOUNG TALENT
OPPORTUNITY: RELATIONSHIP
THREAT: VALUE CHAIN
OPPORTUNITY: NEW RISK
BUY / SELL
Capital Markets
Carrier Broker Insured
Capital Markets
Carrier Broker Insured
Capital Markets
Carrier Broker Insured
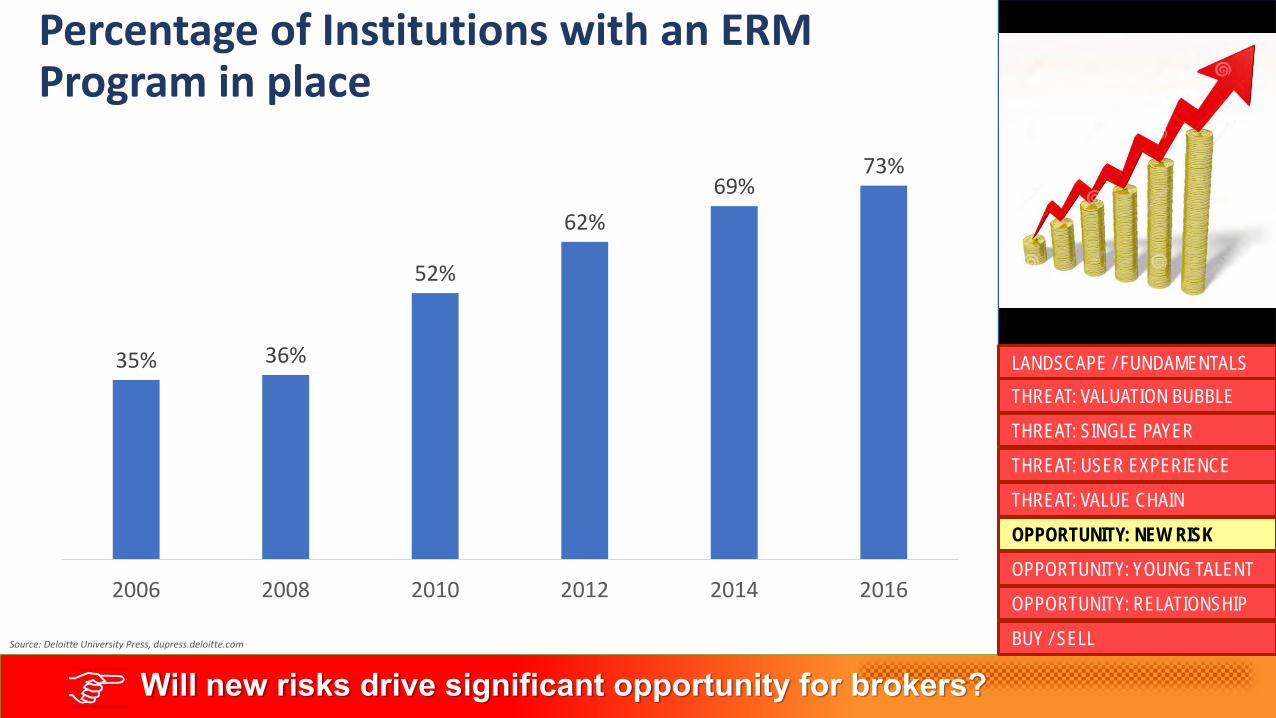
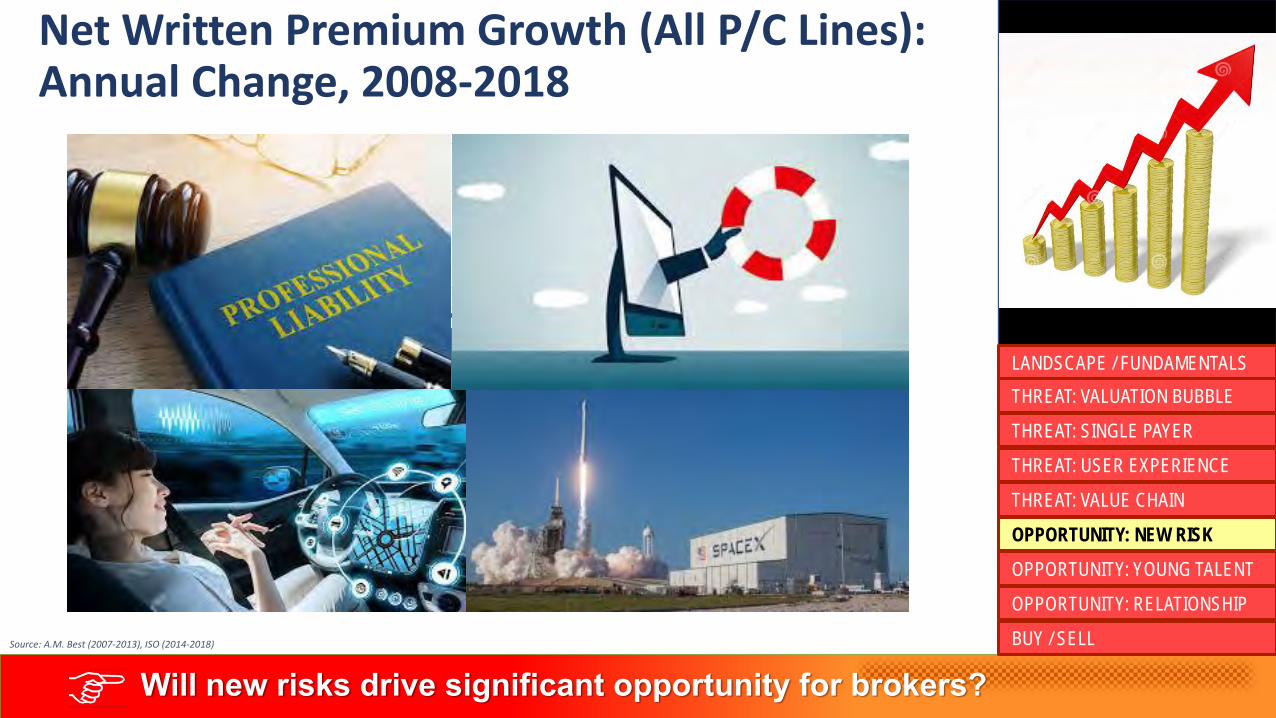
Will new risks drive significant opportunity for brokers?
THREAT: SINGLE PAYER
THREAT: USER EXPERIENCE
LANDSCAPE / FUNDAMENTALS
THREAT: VALUATION BUBBLE
OPPORTUNITY: YOUNG TALENT
OPPORTUNITY: RELATIONSHIP
THREAT: VALUE CHAIN
OPPORTUNITY: NEW RISK
BUY / SELLSource: Deloitte University Press, dupress.deloitte.com
Percentage of Institutions with an ERM Program in place
35% 36%
52%
62%
69%73%
2006 2008 2010 2012 2014 2016
Will new risks drive significant opportunity for brokers?
THREAT: SINGLE PAYER
THREAT: USER EXPERIENCE
LANDSCAPE / FUNDAMENTALS
THREAT: VALUATION BUBBLE
OPPORTUNITY: YOUNG TALENT
OPPORTUNITY: RELATIONSHIP
THREAT: VALUE CHAIN
OPPORTUNITY: NEW RISK
BUY / SELLSource: A.M. Best (2007-2013), ISO (2014-2018)
-2.0%
-4.2%
0.9%
3.3%
4.3% 4.6%4.1%
3.4%2.7%
4.6%
10.8%
-6.0%
-4.0%
-2.0%
0.0%
2.0%
4.0%
6.0%
8.0%
10.0%
12.0%
2008 2009 2010 2011 2012 2013 2014 2015 2016 2017 2018
Net Written Premium Growth (All P/C Lines):Annual Change, 2008-2018
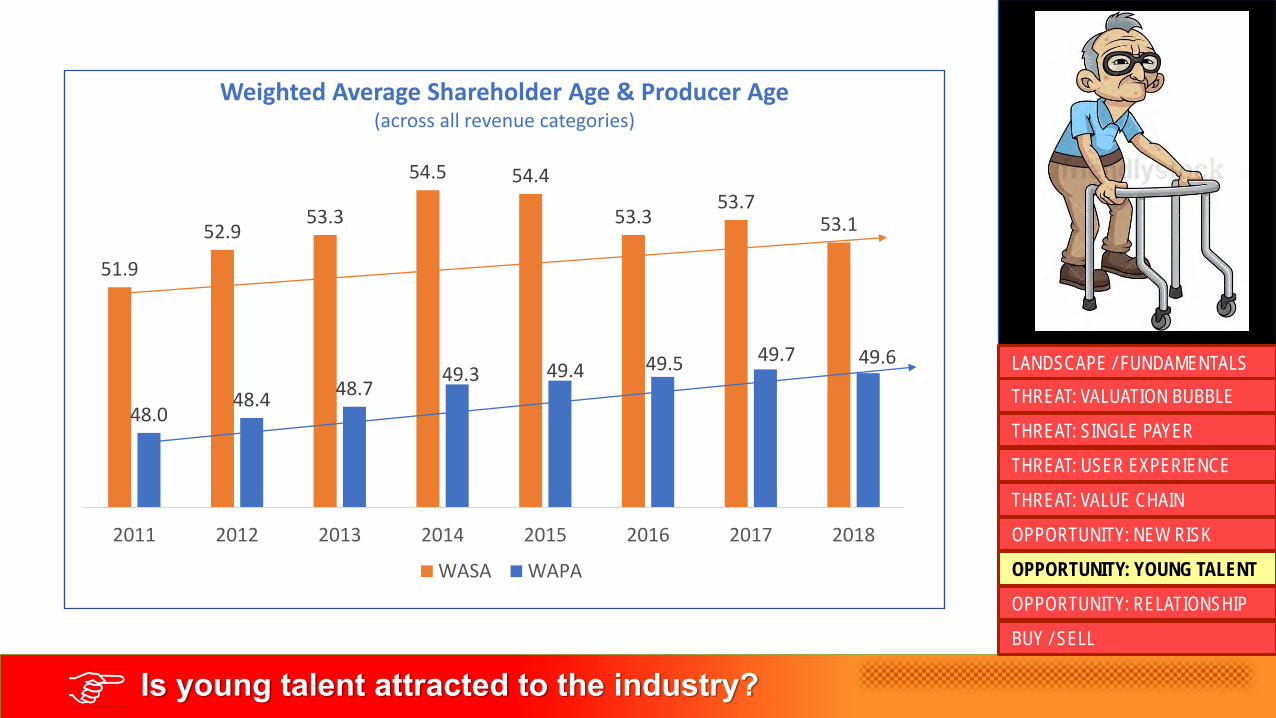
51.9
52.953.3
54.5 54.4
53.353.7
53.1
48.048.4
48.749.3 49.4 49.5 49.7 49.6
2011 2012 2013 2014 2015 2016 2017 2018
WASA WAPA
Is young talent attracted to the industry?
Weighted Average Shareholder Age & Producer Age(across all revenue categories)
THREAT: SINGLE PAYER
THREAT: USER EXPERIENCE
LANDSCAPE / FUNDAMENTALS
THREAT: VALUATION BUBBLE
OPPORTUNITY: YOUNG TALENT
OPPORTUNITY: RELATIONSHIP
THREAT: VALUE CHAIN
OPPORTUNITY: NEW RISK
BUY / SELL

Is young talent attracted to the industry?
THREAT: SINGLE PAYER
THREAT: USER EXPERIENCE
LANDSCAPE / FUNDAMENTALS
THREAT: VALUATION BUBBLE
OPPORTUNITY: YOUNG TALENT
OPPORTUNITY: RELATIONSHIP
THREAT: VALUE CHAIN
OPPORTUNITY: NEW RISK
BUY / SELL

Is young talent attracted to the industry?
THREAT: SINGLE PAYER
THREAT: USER EXPERIENCE
LANDSCAPE / FUNDAMENTALS
THREAT: VALUATION BUBBLE
OPPORTUNITY: YOUNG TALENT
OPPORTUNITY: RELATIONSHIP
THREAT: VALUE CHAIN
OPPORTUNITY: NEW RISK
BUY / SELL
@Appalachian State University
We have a Risk Management Program
Tweet
@Baylor University
Us TooTweet
@ButlerUniversity
Us Too
Tweet@California State University Fullerton
Us Too
Tweet@East Carolina University
Us Too
Tweet
@Eastern Kentucky University
Us Too
Tweet
@Florida State University
Us Too
Tweet
@Gannon University
Us TooTweet
@Georgia State University
Us TooTweet
@Howard University
Us Too
Tweet
@Illinois State University
Us TooTweet
@Baylor University
Us TooTweet
@Indiana State University
Us TooTweet
@Middle Tennessee State University
Us TooTweet
@Mississippi State University
Us TooTweet
@LaSalle University
Us TooTweet
@Missouri State University
Us TooTweet
@New Mexico State University
Us Too
Tweet
@Northern Michigan University
Us TooTweet
@Old Dominion University
Us TooTweet
@Olivet College
Us TooTweet
@St. John’s University
Us TooTweet
@St. Joseph’s University
Us TooTweet
@St. Mary’s University
Us TooTweet
@Temple University
Us TooTweet
@University of Akron
Us TooTweet
@University of Alabama
Us TooTweet
@University of Central Arkansas
Us TooTweet
@University of Cincinnati
Us TooTweet
@University of Colorado Denver
Us TooTweet
@University of Georgia
Us TooTweet
@University of Hartford
Us TooTweet
@University of Hawaii
Us TooTweet
@University of Houston Downtown
Us TooTweet
@University of Iowa
Us TooTweet
@California State University Northridge
Us TooTweet
@California State University Sacramento
Us TooTweet
@Ferris State University
Us TooTweet
@University of Louisiana Lafayette
Us TooTweet
@University of Louisiana Monroe
Us TooTweet
@University of Minnesota
Us TooTweet
@University of Mississippi
Us TooTweet
@University of Missouri
Us TooTweet
@University of North Carolina Charlotte
Us TooTweet
@University of North Texas
Us TooTweet
@University of South Carolina
Us TooTweet
@University of Southern Maine
Us TooTweet
@University of Texas Dallas
Us TooTweet
@University of Wisconsin Madison
Us TooTweet
@Virginia Commonwealth University
Us TooTweet

Does the broker control the customer relationship?
THREAT: SINGLE PAYER
THREAT: USER EXPERIENCE
LANDSCAPE / FUNDAMENTALS
THREAT: VALUATION BUBBLE
OPPORTUNITY: YOUNG TALENT
OPPORTUNITY: RELATIONSHIP
THREAT: VALUE CHAIN
OPPORTUNITY: NEW RISK
BUY / SELL

Are you buying or selling the industry?
➢Fewer agencies
➢More competition
➢More technology
➢Smarter underwriting
➢Enhanced client expectations of services offered and speed of information
➢Increased reliance on knowledge as risks grow more complex
THREAT: SINGLE PAYER
THREAT: USER EXPERIENCE
LANDSCAPE / FUNDAMENTALS
THREAT: VALUATION BUBBLE
OPPORTUNITY: YOUNG TALENT
OPPORTUNITY: RELATIONSHIP
THREAT: VALUE CHAIN
OPPORTUNITY: NEW RISK
BUY / SELL
Predictions
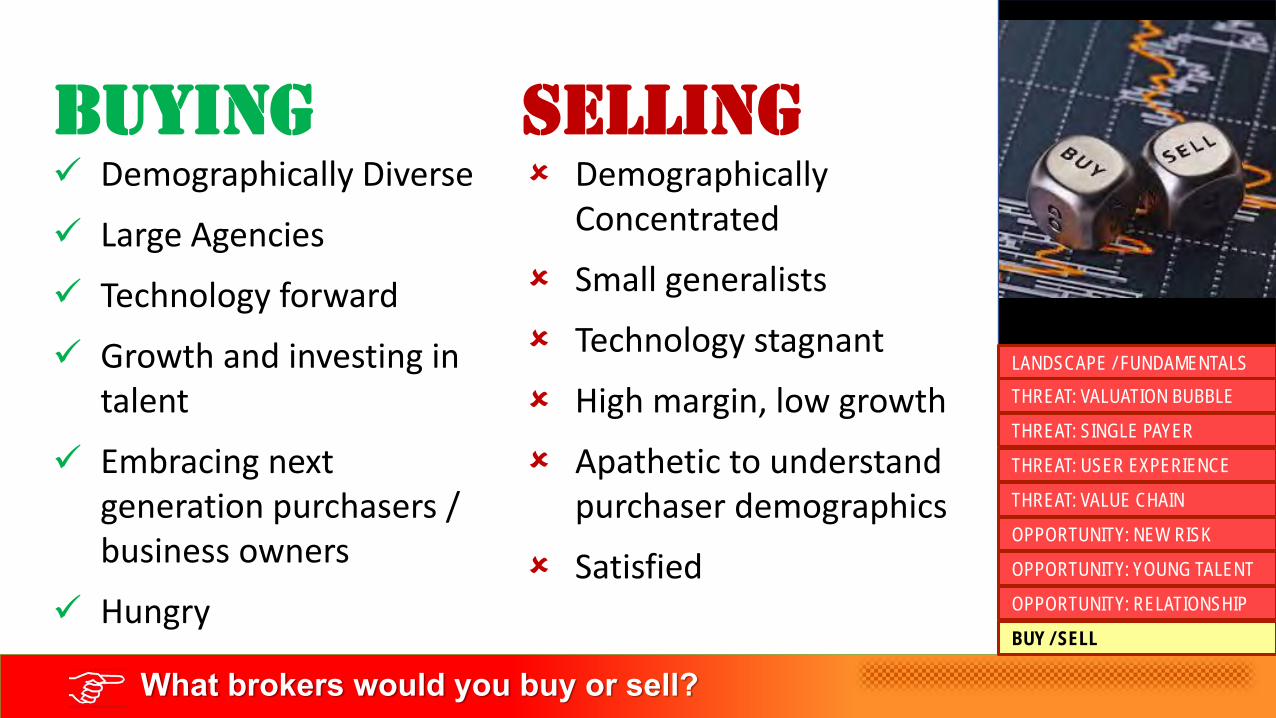
What brokers would you buy or sell?
✓ Demographically Diverse
✓ Large Agencies
✓ Technology forward
✓ Growth and investing in talent
✓ Embracing next generation purchasers / business owners
✓ Hungry
Demographically Concentrated
Small generalists
Technology stagnant
High margin, low growth
Apathetic to understand purchaser demographics
Satisfied
Buying selling
THREAT: SINGLE PAYER
THREAT: USER EXPERIENCE
LANDSCAPE / FUNDAMENTALS
THREAT: VALUATION BUBBLE
OPPORTUNITY: YOUNG TALENT
OPPORTUNITY: RELATIONSHIP
THREAT: VALUE CHAIN
OPPORTUNITY: NEW RISK
BUY / SELL

Consulting