beta-myrcene may not be listed as a proposition 65 ... · pdf filemyrcene may not be listed as...
TRANSCRIPT
-Myrcene
May Not be Listed as a Proposition 65 Carcinogen
Pursuant to the Authoritative Bodies Listing Process
Comments of
Flavor and Extract Manufacturers Association of the United States
Consumer Healthcare Products Association
International Fragrance Association, North America
Juice Products Association
Personal Care Products Council
and
Renewable Citrus Products Association
Submitted to the
Office of Environmental Health Hazard Assessment
by
F. Jay Murray
Gary M. Roberts
March 24, 2014
i
TABLE OF CONTENTSPage
I. Introduction.............................................................................................................................. 1
II. Myrcene should not be listed because the NTP has not found “sufficient evidence” ofcarcinogenicity in animals. ...................................................................................................... 2
A. OEHHA cannot rely on the Summary section cited in support of the proposedlisting................................................................................................................................ 4
1. The Summary section statement that -myrcene "caused kidney cancers" ispatently erroneous ..................................................................................................... 4
2. The Summary section statement that "liver tumors in female rats may havebeen related to -myrcene" is plainly wrong ............................................................ 7
3. The Summary was not peer reviewed, nor does it have any of the otherindicia of reliability cited in section 25306(d)(2)...................................................... 8
4. Other Technical Report Summary sections also contain troubling errors ................ 9
5. The Summary section must receive no weight........................................................ 11
B. None of the NTP statements OEHHA cites reflect a "sufficient evidence"conclusion by NTP and thus OEHHA is not authorized to list -myrcenethrough the authoritative bodies listing process. ............................................................ 11
1. NTP did not formally identify -myrcene "as causing cancer" because it didnot express any opinion about whether "sufficient evidence ofcarcinogenicity exists" from "studies" (plural) in "experimental animals"(plural). .................................................................................................................... 12
2. NTP's "clear evidence" conclusion regarding rat kidney "neoplasms" maynot have depended upon a cancer finding. .............................................................. 17
C. OEHHA's assertions of compliance with section 25306 are unpersuasive. ................... 19
1. Two separate, limited conclusions about male rats and male mice are not a"sufficient evidence" conclusion that can support an authoritative bodylisting. ...................................................................................................................... 19
2. The human relevance of mouse liver tumors is suspect, so these tumorscannot per se be the basis for OEHHA to conclude that clear evidence ofmouse liver tumors supports a sufficient evidence of carcinogenicityfinding. .................................................................................................................... 25
3. The human relevance of male rat kidney tumors is suspect, so these tumorscannot per se be the basis for OEHHA to conclude that clear evidence ofmale rat kidney tumors supports a sufficient evidence of carcinogenicityfinding. .................................................................................................................... 28
III. Conclusion ............................................................................................................................. 30
1
I. Introduction
OEHHA's Notice of Intent to List -myrcene as a carcinogen pursuant to the
authoritative bodies listing process is not consistent with OEHHA's obligations under
Proposition 65 and should be withdrawn.1 OEHHA claims that the National Toxicology
Program (NTP), through the publication of its final report of studies that it sponsored,
has found that "sufficient evidence of carcinogenicity exists" in experimental animals for
-myrcene. OEHHA's conclusion is not supported by the facts and the statements it
cites.
The NTP Technical Report at issue (NTP TR-557 or "Report") does not make a
"sufficient evidence" finding concerning animal carcinogenicity, and OEHHA cannot
analyze the data to make its own "sufficient evidence" finding in support of a listing.
Accordingly, the Flavor and Extract Manufacturers Association of the United States, the
Consumer Healthcare Products Association, the International Fragrance Association,
North America, the Juice Products Association, the Personal Care Products Council,
and the Renewable Citrus Products Association (the Associations) oppose the listing of
-myrcene and respectfully request that OEHHA withdraw its February 7, 2014, Notice
of Intent to List -myrcene ("Notice") through the authoritative bodies process.
OEHHA’s intent to list -myrcene based on the cited Technical Report is unauthorized,
illegal, and does not represent a sound scientific approach.
1All references to "OEHHA" are to the California Office of Environmental Health Hazard Assessment. All
references to "NTP" are to the United States National Toxicology Program. All references to "Proposition65" are to California Health and Safety Code §§ 25249.5 - 25249.13. OEHHA refers to -myrcene as"beta-Myrcene," CAS No. 123-35-3. All references to "CCR" are to the California Code of Regulations.
2
II. Myrcene should not be listed because the NTP has not found “sufficient
evidence” of carcinogenicity in animals.
OEHHA lacks authority to list -myrcene as a carcinogen because the NTP did
not “conclude” that -myrcene “causes cancer” in animals.2 The “primary” Proposition
65 listing mechanism for candidate carcinogens is review by the “state’s qualified
experts,” the Carcinogen Identification Committee (“CIC”).3 The “authoritative body”
listing mechanism is intended to be an abbreviated listing process, allowing listing
without CIC review where an authoritative body has already done the work that the CIC
would otherwise be required to do4 and definitely concluded that "sufficient evidence of
carcinogenicity exists" in experimental animals.5
The authoritative bodies listing mechanism may be employed by OEHHA only
when a chemical has been “formally identified by an authoritative body as causing
cancer” in a report which “concludes” that “[s]ufficient evidence of carcinogenicity exists
from studies in experimental animals.”6 To constitute a “sufficient evidence” finding, the
authoritative body’s formal “report” must “conclude[]” that “studies in experimental
animals indicate that there is an increased incidence of" malignant or combined tumors
under certain circumstances.7 OEHHA is not authorized to substantively evaluate the
data on -myrcene and conclude on its own that “sufficient evidence” of carcinogenicity
exists. OEHHA’s role is limited by regulation to the “ministerial” task of reviewing the
227 CCR § 25306(a), (d)(1), and (e)(2).
3See Final Statement of Reasons (“FSR”) for 27 CCR § 25306 (then 22 CCR § 12306) at 8.
4Id. at 5, 8.
527 CCR § 25306(a), (d)(1), (e)(2).
6Id.
727 CCR § 25306(e)(2).
3
authoritative body’s formal reports and determining whether the authoritative body has,
itself, issued a qualifying sufficient evidence “conclu[sion].”8
The record on -myrcene demonstrates that NTP has never “conclude[d]” that
“sufficient evidence of carcinogenicity exists from studies in experimental animals”
within the meaning of section 25306. OEHHA has identified three NTP statements that
OEHHA claims represent a "sufficient evidence" conclusion within the meaning of
section 25306. None of these three statements, however, satisfy the section 25306
requirement that NTP, rather than OEHHA, articulate a "sufficient evidence" conclusion
in order to support an authoritative body conclusion.
First, OEHHA noted that the Summary section of the Report states:
“We conclude that -myrcene caused kidney cancers inmale rats and liver cancer in male mice . . . .”9
Second, OEHHA noted that NTP states the following in the Conclusion section of
the Report's Abstract :
“Under the conditions of these 2-year gavage studies, therewas clear evidence of carcinogenic activity of -myrcene inmale F344/N rats based on increased incidences of renaltubule neoplasms."10
Third, OEHHA noted that the body of the Report states:
"There was clear evidence of carcinogenic activity of -myrcene in male B6C3F1 mice based on increasedincidences of hepatocellular adenoma, hepatocellularcarcinoma, and hepatoblastoma.”11
8FSR at 8.
9NTP TR-557 at 5.
10Notice, quoting TR-557 at 9 (emphasis in original) (mistakenly described by OEHHA as page 8).
11Id., quoting TR-557 at 63 (emphasis in original).
4
These statements do not demonstrate that NTP “concluded” -myrcene “causes”
cancer in animals for purposes of the authoritative bodies listing process because: (1)
the clause in the Summary is inaccurate and not scientifically reliable, (2) none of the
three passages cited by OEHHA reflect the necessary overall evaluation of animal
carcinogenicity that is the bare minimum for a legally adequate "sufficient evidence"
conclusion, and (3) the overall context of the NTP Report, reporting on discrete studies
it sponsored rather than assessing the larger picture of what “studies in experimental
animals indicate” does not support a listing.
A. OEHHA cannot rely on the Summary section cited in support of the
proposed listing
The sentence in the Summary section cited by OEHHA contains significant
factual errors that render it wholly unreliable. Furthermore, other NTP Technical Report
Summary sections also contain troubling errors, thereby confirming the unreliability of
the Summary section. Interestingly, OEHHA's February 10, 2012 "Request for Relevant
Information" on -myrcene did not rely on the statement in the Summary section.12
OEHHA may not do so now.
1. The Summary section statement that -myrcene "caused
kidney cancers" is patently erroneous
The Summary section incorrectly states that -myrcene “caused kidney cancers
in male rats." -Myrcene caused a statistically significant increase in benign kidney
tumors, not malignant kidney tumors (i.e., kidney cancer) in male F344/N rats. OEHHA
does not have the authority to list a chemical through the authoritative bodies process
12OEHHA, "Request for Relevant Information on Chemicals Being Considered for Listing by the
Authoritative Bodies Mechanism: Isopyrazam, Beta-myrcene, Pulegone, and 3,3',4,4'-Tetrachloroazobenzene," February 10, 2012.
5
based on benign tumors. Recognizing this, OEHHA normally does not list a chemical
as a carcinogen unless it has sufficient evidence of increases in malignant tumors.
Contrary to the Summary section cited by OEHHA, the relevant sentences in the
Abstract and Conclusions sections (also cited by OEHHA) both state: “Under the
conditions of these 2-year gavage studies, there was clear evidence of carcinogenic
activity of -myrcene in male F344/N rats based on increased incidences of renal
tubule neoplasms.”13 The difference between the Summary statement and the other
two statements is significant because “kidney cancers” and “renal tubule neoplasms”
are very different. The term “kidney cancers” describes malignant tumors of the kidney.
The term “renal tubule neoplasms” includes both benign tumors and malignant tumors
(cancer) of the kidney.
Describing the -myrcene data as reflecting that the chemical causes kidney
cancers in male rats is clearly erroneous. Among the male rats exposed to -myrcene,
the incidences of benign kidney tumors were statistically significantly increased. In
contrast, the incidences of malignant kidney tumors (i.e., kidney cancers) were very low,
did not reflect any dose response, and certainly were not statistically significantly
increased at any dose level. The incidence of combined benign and malignant kidney
tumors was statistically significantly increased, but this increase is due to the increase in
benign, not malignant, kidney tumors. The incidence of renal tubule carcinoma among
male rats was 0/50, 3/50, 1/50, and 0/50 at 0, 250, 500 and 1000 mg/kg of -myrcene,
13NTP TR-557 at 9, 63 (bold emphasis added).
6
respectively.14 Thus, the Summary is patently inaccurate and does not reflect either the
data or the conclusions in the Report.
Not only did the Summary section incorrectly describe benign tumors as cancer,
the Summary also asserted that -myrcene caused more than one type of cancer --
"cancers." The use of the plural in this sentence also was clearly mistaken.15 As noted
earlier, -myrcene did not cause a statistically significant increase in any type of
malignant kidney tumor. The Report described three different types of malignant tumors
appearing in the kidney of the male rats: "renal tubule carcinoma," “kidney,
mesenchymal tumor malignant”, and “kidney, transitional epithelium, carcinoma.”16 The
incidence of “kidney, mesenchymal tumor malignant” among male rats was 0/50, 1/50,
0/50 and 0/50 at 0, 250, 500 and 1000 mg/kg of -myrcene, respectively.17 The
incidence of “kidney, transitional epithelium, carcinoma” among male rats was 1/50,
0/50, 0/50 and 0/50 at 0, 250, 500 and 1000 mg/kg of -myrcene, respectively.18 The
incidence of renal tubule carcinoma is described above. These data clearly refute the
Summary section statement that “-myrcene caused kidney cancers in male rats.”19
Not surprisingly, therefore, NTP did not conclude that “-myrcene caused kidney
14Id. at Table A-1. NTP did not include (appropriately) the results at 1000 mg/kg in its statistical
evaluation of the tumor data because the Maximum Tolerated Dose (MTD) was clearly exceeded.However, the results at all four dose levels are presented in this paragraph and throughout thissubmission for the sake of completeness, as well as to illustrate the difficulty in interpreting the tumordose-response relationship when the MTD has been exceeded.15
The Summary also mistakenly uses the singular for liver cancers in male mice when two types of livertumors were significantly increased in male mice exposed to -myrcene. Again, this series of mistakescalls into question the competence of the author of the Summary section and his or her familiarity with theresults of the study.16
NTP TR-557, Table A-1.17
Id.18
Id.19
Id. at 5.
7
cancers in male rats” in the relevant conclusion sections, nor was any such conclusion
discussed in any public peer review process.
2. The Summary section statement that "liver tumors in female
rats may have been related to -myrcene" is plainly wrong
The full sentence in the Summary section from which OEHHA drew the clause
discussed above contains yet another error. The complete sentence states:
“We conclude that -myrcene caused kidney cancers inmale rats and liver cancer in male mice, and the occurrenceof kidney tumors in female rats and liver tumors in femalerats may have been related to -myrcene administration.”20
This sentence wrongly states that “liver tumors in female rats may have been related to
-myrcene administration.”21 In contrast, the substantive conclusion regarding female
rats expressed in the conclusion sections of the Abstract and the overall Report states:
“There was equivocal evidence of carcinogenic activity of -myrcene in female F344/N rats based on increasedincidences of renal tubule adenoma.”22
Thus, the conclusion in the Abstract and Conclusions sections does not mention
an increase in liver tumors in female rats. Further, the actual study results do not
support a conclusion that liver tumors in female rats may have been related to -
myrcene administration. The incidences of hepatocellular carcinoma among female rats
were 0/50, 1/50, 0/50, and 0/50 at 0, 250, 500 and 1000 mg/kg, respectively. Similarly,
the incidences of hepatocellular adenoma among female rats were 0/50, 0/50, 0/50, and
1/50 at 0, 250, 500 and 1000 mg/kg, respectively.
20Id. at 5 (bold emphasis added).
21Id.
22Id. at 9, 63 (emphasis in original).
8
In contrast to the erroneous sentence in the Summary, in the Abstract and
Conclusions sections of the report, NTP states:
“There was equivocal evidence of carcinogenic activity of -myrcene in female B6C3F1 mice on marginally increasedincidences of hepatocellular adenoma and carcinoma.”23
Discussing only rats, the Summary makes no mention of an increase in liver
tumors among female mice. The incidences of hepatocellular carcinoma among female
mice were 1/50, 7/50, 2/50, and 1/50, at 0, 250, 500 and 1000 mg/kg, respectively.
Similarly, the incidences of hepatocellular adenoma among female mice were 6/50,
13/50, 6/50, and 7/50 at 0, 250, 500 and 1000 mg/kg, respectively.
The sentence in the Summary section falsely reported that “liver tumors in female
rats may have been related to -myrcene” when, in fact, the marginally increased
incidences of liver tumors was considered “equivocal evidence of carcinogenic activity”
in female mice, not female rats. An error of this magnitude discredits all of the
statements in the Summary not corroborated elsewhere in the Report. It appears that
the person who wrote the Summary was not qualified to do so.
3. The Summary was not peer reviewed, nor does it have any of
the other indicia of reliability cited in section 25306(d)(2).
The Summary section of the Report, including the clause OEHHA cites in its
Notice, did not receive any external peer-review, whether by the NTP Board of Scientific
Counselors (BSC) or otherwise. Moreover, it does not appear that the Summary
section received any internal peer review either. “We conclude that -myrcene caused
kidney cancers in male rats and liver cancer in male mice …” does not appear
23Id. at 9 and 63 (bold emphasis added).
9
anywhere in the draft Technical Report reviewed by the public and the BSC Technical
Reports Review Subcommittee. The BSC peer reviewed the draft Technical Report at
its meeting on February 25, 2009. We attach a copy of the draft Technical Report
reviewed by the public and the BSC at its February 25, 2009, meeting. Indeed, the draft
Technical Report did not contain a Summary section at all. The language of the
Summary section that differs from the conclusions in the Abstract and Conclusions
sections does not reflect the recommendations of the BSC Subcommittee or the
public.24 Moreover, the Summary section is not published in a publication such as the
Federal Register, signed, set forth in an official document used for regulatory purposes,
or adopted as a final rule. Thus, none of the indicia of reliability discussed in section
25306(d)(2) apply to the Summary section.
4. Other Technical Report Summary sections also contain
troubling errors
The -myrcene Technical Report is not the only example of a significant
inconsistency between the conclusions in the Summary and those in the main body of a
NTP Technical Report. Other recent NTP Technical Reports contain similar
inconsistencies between the conclusions in the Summary section and the conclusions in
the Abstract and Conclusions sections. For example, the Summary section of the
Technical Report (TR-538) for methyl isobutyl ketone (MIBK) contains a sentence
similar to the sentence that appears in the Summary section of the Technical Report on
-myrcene:
24See TR-557 at 14-15.
10
“We conclude that methyl isobutyl ketone caused cancer ofthe kidney in male rats and of the liver in male and femalemice."25
Yet, there was no “clear evidence of carcinogenic activity” in male rats, female
rats, male mice or female mice in the conclusions in the Abstract and Conclusions
sections of the Technical Report:
“Under the conditions of these 2-year studies, there wassome evidence of carcinogenic activity* of methyl isobutylketone in male F344/N rats based on increased incidencesof renal tubule neoplasms. Increased incidences ofmononuclear cell leukemia in 1,800 ppm male F344/N ratsmay have been related to methyl isobutyl ketone exposure.There was equivocal evidence of carcinogenic activity ofmethyl isobutyl ketone in female F344/N rats based on theoccurrence of renal mesenchymal tumors in the 1,800 ppmgroup. There was some evidence of carcinogenic activity ofmethyl isobutyl ketone in male and female B6C3F
1mice
based on increased incidences of liver neoplasms.”26
Thus, the sentence in the Summary section of the Technical Report concludes
that MIBK “caused cancer” in animals based on no more than “some evidence of
carcinogenic activity.” If MIBK had been listed based upon the sentence in the
Summary section of the NTP Technical Report, MIBK would have been listed with no
“clear evidence of carcinogenic activity.” Historically, for a NTP Technical Report,
OEHHA has taken the position that “clear evidence of carcinogenic activity” is
necessary to list a chemical under the authoritative bodies regulations. This is further
evidence that OEHHA should not rely on a conflicting and contrary sentence in the
Summary section of an NTP Technical Report for purposes of an authoritative bodies
listing.
25NTP TR-538, "Toxicology and Carcinogenesis Studies of Methyl Isobutyl Ketone, (February 2007) at 5.
26Id. at 8, 46 (emphasis in original).
11
5. The Summary section must receive no weight.
In determining whether the section 25306 criteria have been met, OEHHA may
not “cherry pick” an inaccurate clause from the Summary section of the -myrcene
Report, especially when the clause appears in a sentence riddled with errors and not
characterized by any indicia of reliability.
OEHHA therefore should place no weight on the statement in the Summary
section of the Report. Alternatively, OEHHA should pause the authoritative body listing
process for -myrcene in order to confer with the Proposition 65 Carcinogen
Identification Committee (CIC) concerning whether the Summary section of a NTP
Technical Report should be considered “authoritative.”
OEHHA notes that, in 1998, the Carcinogen Identification Committee (CIC)
considered and affirmatively retained NTP Technical Reports as “authoritative”.
However, it is difficult to imagine that the CIC would be comfortable with a situation
where an inaccurate sentence in the Summary section of the Technical Report, which is
in conflict with the main conclusions in the Abstract and Conclusions sections of the
Technical Report, and which was not the subject of scientific peer review, is used as
part or all of the basis for an authoritative bodies listing.
B. None of the NTP statements OEHHA cites reflect a "sufficient
evidence" conclusion by NTP and thus OEHHA is not authorized to
list -myrcene through the authoritative bodies listing process.
NTP never "conclude[d]" that "sufficient evidence of carcinogenicity exists from
studies in experimental animals" within the meaning of section 25306 for -myrcene.
The inaccurate and unreliable Summary section is not a sufficient evidence conclusion.
Similarly, the two separate and limited conclusions OEHHA cites about carcinogenic
12
activity in one strain of mice and one strain of rats under the conditions of NTP's
experiment are not “sufficient evidence” conclusions either.
These two sentences fail to support listing under the authoritative bodies
mechanism for two independent reasons. First, NTP made no overall conclusion that
"sufficient evidence of carcinogenicity exists" from "studies" in "experimental animals."
Second, the sentence concerning the rat data is ambiguous because one cannot
determine how much or how little the carcinomas, as opposed to the adenomas,
contributed to the NTP's "clear evidence" conclusion.
1. NTP did not formally identify -myrcene "as causing cancer"
because it did not express any opinion about whether
"sufficient evidence of carcinogenicity exists" from "studies"
(plural) in "experimental animals" (plural).
The plain language of section 25306 equates “sufficient evidence” with what
“studies in experimental animals indicate” generally, and the regulatory history makes
clear that this standard was intended to mirror the scientific consensus on sufficient
evidence reflected in the language California borrowed directly from the EPA’s 1986
Guidelines for Carcinogen Risk Assessment.27 Those Guidelines require consideration
of all relevant studies, not just individual studies in isolation. OEHHA’s interpretation
would require it to list a chemical based on a single positive study—even if other
Technical Reports summarize equally valid, or more valid, data that undermines the
single positive study. NTP almost certainly would not agree in those circumstances that
“studies in experimental animals indicate that there is an increased incidence of
[cancer],” 27 CCR § 25306(e)(2).
2727 CCR § 25306(e)(2); Final Statement of Reasons (FSR) for Section 12306, February 1990 at 15
(language drawn from EPA Guidelines) (Section 12306 of title 22 was moved without substantive changeto 27 CCR § 25306).
13
It is undisputed that section 25306(e)’s “causing cancer” definition regarding
animal evidence is the well known “sufficient evidence” test taken from the EPA’s 1986
Guidelines for Carcinogen Risk Assessment, with the “same or substantially similar
criteria” used by the NTP, the authoritative body in question.28 The FSR explains the
regulation, repeatedly emphasizing that “sufficient evidence” is not a novel standard for
OEHHA scientists to administer or for industry scientists and observers to understand,
but instead an existing standard authoritative bodies already employed to make their
own cancer causing determinations. The FSR states:
Subsection (e) provides that, for purposes of section 12306[now 25306], the phrase “as causing cancer” means thateither of two scientific criteria have been satisfied.Generally, the authoritative body may rely on either studiesin humans or studies in animals. These criteria areconsistent with the criteria the Panel presently uses inevaluating chemicals for listing. The Panel utilizes the EPA’sClassification System for Categorizing Weight of Evidencefor Carcinogens From Humans and Animal Studies (51 Fed.Reg. 33992-34003 (Sept. 24, 1986)). The same, orsubstantially similar criteria have been adopted by manyregulatory agencies and scientific organizations involved inhazard identification. The use of these criteria will ensurethat the standards applied by an authoritative body are thesame as or substantially similar to those used by the Panelto evaluate chemicals. (FSR at 15 (emphasis added)).
* * * *It is not the intention of the Agency to substitute its scientificjudgment for that of the authoritative body. The Agency’sinquiry will be limited to whether the authoritative body reliedupon scientific data in an amount sufficient to conclude thatthe chemical causes cancer. . . . Because the body isconsidered authoritative, and the body utilizes the same orsubstantially the same criteria as set forth in section (e), itwill be assumed that the data relied upon is scientificallyvalid. The Agency will look to determine whether the
28Compare 27 CCR § 25306(e)(2) with 1986 EPA Cancer Guidelines, 51 Fed. Reg. 33992-34003 (Sept.
24, 1986) at 33999.
14
authoritative body relied upon animal or human data in anamount sufficient to satisfy the criteria. If so, the chemicalwill be proposed for listing.29
These FSR passages confirm that the California Health and Welfare Agency,
which wrote the regulation, expected the sufficient evidence standard would be
“applied” by the authoritative body to “conclude that the chemical causes cancer.”
These two passages emphasize that the authoritative body (not OEHHA) is expected to
exercise judgment in making the ultimate “causing cancer” conclusion using
substantially the same criteria as set forth in paragraph (e).
The 1986 EPA Guidelines for Carcinogen Risk Assessment provide that a
“sufficient evidence” determination cannot be based on the results of individual animal
studies considered in isolation, but must be based on a broader review of relevant data.
EPA summarizes its standard as follows: “At various points in the above discussion,
EPA has emphasized the need for an overall, balanced judgment of the totality of the
available evidence.”30 The EPA Guidelines also state that “[r]eplicate negative studies
that are essentially identical in all other respects to a positive study may indicate that
the positive results are spurious.”31, 32
Thus, the EPA cancer risk assessment guidelines, from which section (e)(2) was
taken, require that all relevant “studies” be considered as a whole in making a “sufficient
evidence” determination, whether based on animal or human data. Section (e)(2) was
29FSR at 18 (emphasis added).
3051 Fed. Reg. 33992-34003 (September 24,1986).
31Id. at 33995.
32The EPA Guidelines also state expressly that the classification scheme “is not meant to be applied
rigidly or mechanically,” whenever there questionable positive data, but instead provides that “Resultsand conclusions concerning the agent, derived from different types of information, whether indicatingpositive or negative responses, are melded together….” Id. at 33996 (left column), 33994 (left column).
15
intended to implement the same standard. The regulation’s copied language and the
FSR make this abundantly clear. The NTP has not yet performed that overall analysis
for -myrcene , and thus its Technical Report does not contain a “sufficient evidence”
determination required to support an authoritative body listing, or to render the CIC’s
consideration of -myrcene unnecessary.
The NTP did not make a “sufficient evidence” finding with regard to -myrcene.
The Technical Report expresses carcinogenicity conclusions limited to “the conditions of
these 2-year feed studies.”33 It does not render an overall conclusion about what
“studies in experimental animals indicate," nor does it analyze the implications of the
likely species-specific tumors for hazard identification. The Technical Report warns that
its conclusions are not to be extrapolated “to other species, including characterization of
hazards and risks to humans” because doing so would require “analyses beyond the
intent” of the Report.34 Moreover, NTP made clear in the Report that the effect seen
was species specific, which further emphasizes the limited nature of the NTP
statements and the absence of a “sufficient evidence” finding. NTP stated that “[t]he
interpretative conclusions presented in NTP Technical Reports are based only on the
results of these NTP studies. Extrapolation of these results to other species requires
analyses beyond the intent of these reports.” NTP does evaluate chemicals for
“sufficient evidence” of carcinogenicity in experimental animals in the Technical
Reports, applying a standard equivalent to section 25306(e)(2), but its current practice
is to do so when evaluating chemicals for inclusion in its “Report on Carcinogens.”
33TR-557 at 9.
34TR 577 at Foreword.
16
The Final Statement of Reasons expressly confirms, twice, that the “sufficient
evidence” standard of section 25306(e) is meant to embody the standard that NTP
applies when conducting a “reasonably anticipated” analysis for determining whether a
chemical should be placed on the Report on Carcinogens:
This [(e)(2)] definition of “sufficient evidence” is also well-established in the scientific community, and severalreferences to this concept are further offered by way ofillustration in the bibliography. Under these references,chemicals having sufficient evidence from animal studieshave been identified as chemicals ‘reasonably anticipated tobe carcinogens’ (NTP) . . . . When the evidence fromexperimental animals concerning the carcinogenicity of achemical is not sufficient, the NTP list of carcinogens doesnot include it.35
When a chemical is nominated for the Report on Carcinogens, and thus
evaluated to see if the evidence of carcinogenicity is “sufficient,” the NTP makes a
detailed evaluation, weighing all available information, accepting public comment, and
subjecting its conclusions to peer review. First, the NTP “initially evaluates each
nomination to determine whether the scientific information available for a nomination
justifies its formal review and consideration.” The NTP then announces which
nominations are “proposed for review and solicits public comments through
announcements in the Federal Register and NTP publications.”36 After receiving and
responding to public and agency comments on the substances proposed for review, the
NTP’s formal evaluation process begins.37 As part of that process, NTP scientists
prepare additional evaluations, subject those evaluations to multiple rounds of peer
35FSR at 18-19.
36Id.
37Id.
17
review (both internal and external), and convene a round of public hearings.38 Only
then does the NTP reach a preliminary determination about whether a substance
satisfies the “sufficient evidence of carcinogenicity” standards required for listing in the
Report on Carcinogens.39 -myrcene was not subjected to this comprehensive NTP
“sufficient evidence” review process. Importantly for -myrcene , the Report on
Carcinogens is the document in which the NTP analyzes issues such as unique, likely
species-specific mouse liver tumors and rat kidney tumors.
If “sufficient evidence” were a conclusion expressed explicitly or inferentially by
the NTP in the Technical Report, the NTP would not need to undertake its thorough
review of all relevant animal studies as part of its Report on Carcinogens process.
Instead, it simply could add chemicals to the Report on Carcinogens based on its work
in the Technical Report. That is not at all what happens, however.
2. NTP's "clear evidence" conclusion regarding rat kidney
"neoplasms" may not have depended upon a cancer finding.
Proposition 65 requires that a chemical be demonstrated to "cause cancer," not
just benign tumors, before listing. The data indicates that the male rat "clear evidence"
statement by NTP may not have been materially influenced by the very few malignant
tumors observed in the study. These tumors were not statistically significant at any
dose or by trend, did not exhibit dose-response, and were not noted by NTP as being
biologically important. Indeed, NTP's male rat "clear evidence" finding might have been
the same even if no malignant tumors were present. One can reasonably infer from the
NTP conclusion, which does not mention malignancy at all (the “clear evidence of
38Id.
39Id.
18
carcinogenic activity” in male rats was “based on increased incidences of renal tubule
neoplasms”), that the "clear evidence" determination may have been the same if there
were no malignant tumors present.40 NTP's criteria specifically permit this:
"Clear evidence of carcinogenic activity is demonstrated bystudies that are interpreted as showing a dose-related . . .(iii) marked increase of benign neoplasms if there is anindication from this or other studies of the ability of suchtumors to progress to malignancy."41
Confirming this, “clear evidence” conclusions in NTP Technical Reports have
been based on increased incidences of renal tubule adenomas alone. For example, in
its evaluation of tris(2-chloroethyl)phosphate in TR-391, NTP stated: “Under the
conditions of these 2-year gavage studies, there was clear evidence of carcinogenic
activity for male and female F344/N rats receiving tris(2-chloroethyl)phosphate as
shown by increased incidences of renal tubule adenomas.”42
Since NTP's conclusion may well have been the same even if no malignancies
were observed, NTP's "clear evidence" statement on male rat liver tumors cannot
contribute to a Proposition 65 "authoritative bodies" listing.
We recognize that NTP conducted statistical analyses on the incidences of
benign (only), malignant (only), and combined malignant and benign renal tubule tumors
among both male and female rats. A statistically significant increase in benign renal
tubule tumors (but not malignant renal tubule tumors) was observed in male rats
exposed to -myrcene. The incidence of combined malignant and benign renal tubule
tumors was also increased among male rats, but this was accounted for by the
40See, e.g., NTP TR-391.
41NTP TR-557 at 12.
42NTP TR-391 at 6, 54. Of note, unlike some other NTP Technical Reports, NTP TR-391 did not contain
a “Summary” section.
19
statistically significant increase in benign tumors. If there had been no carcinomas
among the male rats, there would have still been a marked, statistically significant
increase in combined malignant and benign renal tubule tumors.
C. OEHHA's assertions of compliance with section 25306 are
unpersuasive.
Our prior comments, submitted in April 2012, expressed essentially the same
substantive concerns presented above in section II.B.1.43 OEHHA's response to those
comments is unpersuasive for the reasons set forth below.
1. Two separate, limited conclusions about male rats and male
mice are not a "sufficient evidence" conclusion that can
support an authoritative body listing.
Our April 2012 comments note that section 25306 requires that the authoritative
body, the NTP, make the "sufficient evidence" finding, not OEHHA. OEHHA asserts
that the Technical Report "concludes that the chemical causes cancer," but OEHHA's
basis for this assertion is inadequate. Section 25306(a) states, in relevant part, that:
(a) Pursuant to section 25249.8(b) of the Act, a chemical isknown to the state to cause cancer . . . if the lead agencydetermines that an authoritative body has formally identifiedthe chemical as causing cancer . . . as specified in thissection. (emphasis added)
Section 25306(e)(2) defines what "as causing cancer" means for this section. In
relevant part:
"as causing cancer" means that . . . sufficient evidence ofcarcinogenicity exists from studies in experimental animals.For purposes of this paragraph, "sufficient evidence" meansstudies in experimental animals indicate that there is an
43"-Myrcene Should Not be Listed as a Proposition 65 Carcinogen Pursuant to the Authoritative Bodies
Listing Process," Flavor and Extract Manufacturers Association and others, April 2012. These comments(hereafter, Associations' April 2012 Comments) are fully incorporated herein by reference.
20
increased incidence of malignant tumors or combinedmalignant and benign tumors in multiple species or strains,in multiple experiments . . . , or, to an unusual degree, in asingle experiment with regard to high incidence, site or typeof tumor, or age at onset.
NTP must make the overall assessment of what "studies in experimental animals
indicate," and NTP has not done this.
OEHHA does not address this point head on. Instead, it simply repeats the
inadequate statement that "clear evidence" was found when certain rat data was
examined in isolation and when other mouse data was examined in isolation.44 OEHHA
admits "that the NTP Technical Report on -myrcene expressed separate conclusions
about four individual experiments"; thus recognizing that NTP did not make an overall
assessment of the sufficiency of the evidence. Rather than responding to the legal
deficiency of this situation, OEHHA instead notes that the Carcinogen Identification
Committee (CIC) in 1998 declined a request to limit the authoritative status of NTP to
what it says in the Report on Carcinogens. The CIC in 1998, however, did not directly
confront the issue of whether NTP makes an overall "sufficient evidence" finding which
would authorize OEHHA to conclude, pursuant to section 25306(a), that the NTP has
identified -myrcene "as causing cancer." The CIC has not made any finding that the
Technical Reports make a "sufficient evidence" conclusion as is required.
In response to our earlier comments, OEHHA interpreted the cautionary
statement in the Forward about not extrapolating the NTP Technical Report findings to
44OEHHA, "Response to Comments Pertaining to the Request for Relevant Information on -myrcene as
Causing Cancer under Proposition 65," February 2014, pp. 2-3 (hereafter "OEHHA Response toComments").
21
other species and another sentence in the Explanation of Levels of Evidence of
Carcinogenic Activity on page 12 of the Technical Report as follows:
Thus NTP is explaining that additional analyses are neededfor inter-species extrapolation and characterization ofhazards and risks (i.e., quantitative risk analysis), but thatpositive results demonstrate that the chemical iscarcinogenic in laboratory animals and poses a potentialcancer hazard to humans. Listing under Proposition 65concerns only identification of chemicals that cause cancer,as provided in Section 25306. Under Proposition 65, thequantitative assessment of human risk occurs during a laterphase of the process during the development of a “NoSignificant Risk Level” for chemicals listed as causingcancer.45
We respectfully disagree with OEHHA’s interpretation of NTP’s statement in the
Forward to the Technical Report. First, OEHHA has cited sentences from two sections
of the NTP Technical Report out of context. The full paragraph in the Forward states:
The Technical Report series began in 1976 withcarcinogenesis studies conducted by the National CancerInstitute. In 1981, this bioassay program was transferred tothe NTP. The studies described in the Technical Reportseries are designed and conducted to characterize andevaluate the toxicologic potential, including carcinogenicactivity, of selected substances in laboratory animals(usually two species, rats and mice). Substances selectedfor NTP toxicity and carcinogenicity studies are chosenprimarily on the basis of human exposure, level ofproduction, and chemical structure. The interpretiveconclusions presented in NTP Technical Reports are basedonly on the results of these NTP studies. Extrapolation ofthese results to other species, including characterization ofhazards and risks to humans, requires analyses beyond theintent of these reports. Selection per se is not an indicator ofa substance’s carcinogenic potential.46
45OEHHA Response to Comments at 5.
46NTP TR-557 at Foreword.
22
Thus, NTP is explaining that the conclusions in these reports are based only on
the results of the NTP studies and that extrapolation of these results to human hazard
identification and risk assessment is beyond the intent of the Technical reports. It is
noteworthy that NTP does not limit its statement to risk assessment. It states “hazards
and risks to humans.” [emphasis added] NTP clearly communicates that both human
hazard identification and human risk assessment are beyond the scope of these
reports. Nothing in the levels of evidence passage noted by OEHHA is inconsistent with
NTP's clear statement that the assessment of "hazards to humans" is beyond the scope
of the Technical Report. Saying that certain data "indicate that exposure to the
chemical has the potential for hazard to humans" is consistent with saying that when
one undertakes a hazard identification assessment, these data will be relevant but not
necessarily sufficient. "Potential for hazard" does not a "known carcinogen" make.
Proposition 65 cases have consistently said that chemicals placed on the list must be
known carcinogens, not suspected ones. "Although we concluded in Deukmejian that
both human and animal carcinogens must be included on the Proposition 65 list, we
cautioned that the standard remains known carcinogens." Styrene Information and
Research Center v. OEHHA, 210 Cal.App.4th 1082, 1094 (emphasis in original) (2012)
(referring to AFL-CIO v. Deukmejian, 212 Cal.App.3d 425 (1989)).
Moreover, OEHHA's reliance on the "potential for hazard to humans" is not
consistent with OEHHA's actions or common sense. The "potential for hazard to
humans" statement applies equally to "clear evidence" and "some evidence" chemicals,
and not even OEHHA has suggested, ever, that a "some evidence" call by NTP is a
proper basis for an authoritative body listing.
23
Proposition 65 is designed to protect humans, not rats and mice, from cancer
hazards. It is appropriate that animal studies are allowed to form the basis for certain
listings under Proposition 65 because certain animal studies (and increases in certain
tumors) have the ability to predict a cancer hazard to humans. However, NTP (and the
scientific community) recognize that not every chemical that causes cancer or tumors in
mice or rats poses a "sufficient" cancer hazard to humans to constitute a "known
carcinogen" for purposes of Proposition 65. It is well understood that certain chemicals
cause cancer in laboratory animals by mechanisms not considered relevant to humans.
NTP indicates that it is not considering all the available information, including existing
data on the relevance of specific animal tumors to human hazard identification, in its
Technical Reports. NTP is simply reporting the results of its animal study “under the
conditions of the study,” nothing more. To evaluate whether a chemical is a “known
carcinogen,” one must consider what is known about the human relevance of specific
tumors increased in animals, as well as other factors.
Distinguishing between chemicals that pose a carcinogenic hazard to humans
and those that don’t is beyond the scope of the NTP Technical Reports.47
47It is illustrative to consider what would happen if NTP had conducted a 2-year carcinogenicity study of
the artificial sweetener, saccharin. Numerous studies in rats have shown an increased incidence ofurinary bladder cancer at high doses of saccharin, particularly in male rats. If NTP had conducted such astudy, the most likely outcome would be “clear evidence of carcinogenic activity” in male and female ratsdue to increased incidences of urinary bladder cancer. In identifying the level of “carcinogenic activity” inits Technical Report of saccharin, NTP would not have considered the questionable relevance of thesetumors because “characterization of hazards and risks to humans, requires analyses beyond the intent ofthese reports.” However, according to the National Cancer Institute, mechanistic studies have shownthat these results with saccharin apply only to rats. (National Cancer Institute. Fact Sheet. ArtificialSweeteners and Cancer. http://www.cancer.gov/cancertopics/factsheet/Risk/artificial-sweeteners).Human epidemiology studies have shown no consistent evidence that saccharin is associated withbladder cancer incidence in humans. Because the bladder tumors seen in rats are due to a mechanismnot relevant to humans and because there is no clear evidence that saccharin causes cancer in humans,saccharin was removed in 2000 from the U.S. National Toxicology Program’s Report on Carcinogens,where it had been listed since 1981 as a substance “reasonably anticipated to be a human carcinogen.”Yet, by OEHHA’s interpretation of statements in the NTP Technical Report, if saccharin had been the
24
OEHHA has dismissed the difference between NTP Technical Reports and the
NTP Report on Carcinogens (RoC) as “as separate and distinct” activities. This is an
over-simplification that does not recognize the differences between the two activities.
The RoC considers the weight of the scientific evidence, including studies not
conducted by NTP, and the human relevance of findings in animal studies, whereas the
Technical Report does not.
Although it clearly has the authority to do so, and has done so with respect to
many other chemicals, NTP has not even nominated -myrcene for evaluation as a
substance “reasonably anticipated to be a human carcinogen” in its RoC. Yet,
Congress mandates that NTP list in its RoC “all substances (1) which either are known
to be human carcinogens or may reasonably be anticipated to be human carcinogens
and (2) to which a significant number of persons residing in the United States are
exposed.” Clearly, a significant number of persons residing in the United States are
exposed to -myrcene. Presumably, -myrcene was not nominated for inclusion in the
RoC because NTP neither assumes nor concludes that the “clear evidence of
carcinogenic activity” in its Technical Report on -myrcene indicates a cancer hazard to
humans. In other words, NTP does not consider every substance found to cause
cancer in laboratory animals in the NTP Technical Reports as “reasonably anticipated to
be a human carcinogen.” While the RoC may be a “separate and distinct” activity, it
sheds light on NTP’s evaluation of -myrcene. If NTP had actually identified -myrcene
as causing cancer in the Technical Report, it would have been obligated to nominate if
subject of a NTP bioassay, the Technical Report would have triggered an authoritative bodies listing ofsaccharin because the study would have provided “clear evidence of carcinogenic activity” in rats, eventhough it poses no cancer hazard to humans.
25
for and include it in the RoC. The absence of -myrcene in the RoC indicates that NTP
did not identify -myrcene “as causing cancer.”
OEHHA further argues at page 6 of its 2014 Response to Comments that it is
sufficient for OEHHA to stitch together the separate and limited findings that NTP made
in its Technical Report and call that a "sufficient evidence" finding that satisfies section
25306. This assertion defies standard rules of statutory construction, does not address
the interpretive points made above, and fails to explain the Final Statement of Reasons
statements that NTP must make the sufficient evidence finding. This constitutes
OEHHA asserting it is authorized to make the ultimate "sufficient evidence"
determination supporting an authoritative body listing. OEHHA does not have that
authority.
2. The human relevance of mouse liver tumors is suspect, so
these tumors cannot per se be the basis for OEHHA to
conclude that clear evidence of mouse liver tumors supports a
sufficient evidence of carcinogenicity finding.
Our 2012 comments on -myrcene spent six pages explaining that the human
relevance of mouse liver tumors has been seriously questioned, particularly when the
chemical is not genotoxic (as is the case for -myrcene). 48 We also noted that such
tumors, if relevant at all, require additional expert analysis before any "sufficient
evidence" finding or statement about hazard identification can be made. Among other
things, we noted that a significant body of scientific literature has criticized the relevance
of mouse liver tumors for cancer hazard identification, and the European Food Safety
48Associations' April 2012 Comments at 8-13.
26
Authority and Commonwealth of Australia have taken a consistent approach to
considering such liver tumors not relevant to humans.49
OEHHA's response concerning mouse liver tumors can be summarized as
follows:
NTP is aware of the high background incidence of livertumors typically observed in studies with the male B6C3F1mouse, and the widely recognized susceptibility of thismouse strain to hepatocarcinogenesis. . . . [¶] Although thesensitivity of mouse liver has been widely discussed, it hasnot led to discounting of hepatic tumors in mice. Mouse livertumors are considered relevant for cancer hazardidentification by the NTP and other bodies designated asauthoritative . . . under Proposition 65. . . . [¶] . . . Neither theEuropean Food Safety Authority nor the National IndustrialChemical Notification Assessment Scheme of Australia areconsidered "authoritative" under Proposition 65.50
OEHHA's response is not adequate to establish that clear evidence of mouse
liver tumors for a non-genotoxic chemical is per se adequate to establish one positive
experiment or one positive strain for purposes of a "sufficient evidence of
carcinogenicity" determination in the view of NTP. First, OEHHA cites no support for its
statement that the NTP considers mouse liver tumors relevant for cancer hazard
identification without any “discounting.” Indeed, OEHHA does not address the
published statements by NTP scientists (e.g., Maronpot et al., 1987; Velazquez et al.,
1996) questioning the relevance to humans of mouse liver tumors. Moreover, neither of
the two references cited elsewhere in OEHHA's discussion of mouse liver tumors
support this proposition.
49Id. at 8-9.
50OEHHA Response to Comments at 13-14.
27
Second, “relevance” alone is not necessarily adequate for a sufficient evidence
finding. Indeed, the phrase "sufficient evidence" would not be meaningful unless some
evidence is not sufficient; OEHHA has offered no basis to conclude that NTP considers
all mouse liver tumors adequate to support one half of a "sufficient evidence"
conclusion. OEHHA neither states the proposition nor supports the proposition that
NTP considers all mouse liver tumor results adequate to form half of a "sufficient
evidence" conclusion.
The Associations have put forward significant, credible evidence that not all
mouse liver tumors add sufficient weight to comprise half of a "sufficient evidence"
conclusion. OEHHA has not directly addressed most of that evidence.
Absent a clear basis for OEHHA to conclude that NTP considers all mouse liver
tumors adequate to support one-half of a sufficient evidence conclusion, and absent
NTP affirming that view as it relates to -myrcene, the listing of -myrcene cannot
proceed pursuant to the authoritative bodies listing process. The Associations do not
dispute that the NTP is an authoritative body and that it still uses B6C3F1 mice for its
cancer bioassays. Those facts, however, are wholly inadequate to support the
conclusion that NTP considers mouse liver tumors for non-genotoxic chemicals
adequate to support a sufficient evidence conclusion. Likewise, it is not the
Associations' burden to establish that mouse liver tumors are irrelevant to hazard
identification. Given the significant literature and regulatory concern that mouse liver
tumors are of less value to cancer hazard identification than other tumors, OEHHA must
identify where in the Technical Report NTP concludes that the -myrcene liver tumors
are enough to support half of a "sufficient evidence" conclusion. A finding of "clear
28
evidence" of liver tumors is not sufficient for a variety of reasons, including that it does
not describe what weight NTP assigns those tumors in cancer hazard identification.
OEHHA cites to AFL-CIO v Deukmejian (1989) as evidence that causing cancer
in animals is sufficient to list. However, what constitutes sufficient evidence was not at
issue in that case. The case clearly does not stand for the proposition that all animal
evidence, however its human relevance has been questioned, is "sufficient" evidence.
3. The human relevance of male rat kidney tumors is suspect, so
these tumors cannot per se be the basis for OEHHA to
conclude that clear evidence of male rat kidney tumors
supports a sufficient evidence of carcinogenicity finding.
As noted in our earlier comments, male rat kidney tumors are of questionable
relevance for cancer hazard identification, since they appear to be a species- and sex-
specific response. While renal tubule tumors are uncommon spontaneous tumors in
rats, there is an increasingly large number of substances (e.g., d-limonene, 1,4-
dichlorobenzene, isophorone, pinene) that have been reported to produce increases in
renal tubule neoplasms in rats, particularly male rats. Some of these substances act
through 2u-globulin, a mode of action which is specific to the male rat. NTP noted that
there is evidence that this mechanism plays a role in the increased incidence of renal
tubule neoplasms observed in male rats exposed to -myrcene. Others act through
exacerbation of chronic progressive nephropathy (CPN), to which male rats are
particularly susceptible.
OEHHA responded to this point by noting that NTP concluded “several lines of
evidence suggest that -myrcene might cause nephrotoxicity by a mechanism other
than, or in addition to, 2u-globulin nephropathy” and that “the presence of renal
29
neoplasms in female rats also suggests a mechanism of carcinogenesis that may be
related to the nephrosis and is distinct from the 2u-globulin mechanism.” However,
even if 2u-globulin is not the sole mechanism of action, the other most likely
mechanism of action involves chronic progressive nephropathy (CPN).
NTP discussed the likelihood that CPN may play a role in the induction of rat
kidney tumors. Of note, male rats are more susceptible to CPN than are female rats.
And the kidney tumor data in rats in the NTP bioassay of -myrcene are consistent with
CPN playing a significant role in kidney tumor induction. But, CPN, like 2u-globulin, is
a mechanism of action considered by many not to be relevant to humans.51
OEHHA responded that “NTP took this information [its discussion of the
mechanism(s) of action] into account when concluding that -myrcene showed ‘clear
evidence of carcinogenic activity’ in male rats.” However, OEHHA provided no support
for this statement. To the contrary, in its Technical Report, NTP identified the level of
carcinogenic activity without regard to the relevance of the tumors for purposes of
human hazard identification. The NTP’s own explanation of the levels of carcinogenic
activity fully rebuts OEHHA’s unsupported assertion.52 The levels of carcinogenic
activity are clearly limited to an analysis of the strength of the neoplastic response, not
the processes in the rat not present in humans that likely led to the neoplastic
response.53 Regardless of whether NTP considered the renal tubule tumors to be
relevant to human hazard identification, the level of carcinogenic activity would be the
51Id. Hard, GC, et al., “Consideration of rat chronic progressive nephropathy in regulatory evaluations for
carcinogenicity. Toxicol. Sci., Apr. 2013, pp. 268-75.52
NTP TR-557 at 12.53
Id.
30
81984359\V-10
same. NTP does not consider the relevance of tumors to human hazard identification
when determining the level of carcinogenic activity in the NTP Technical Report.
III. Conclusion
For the reasons stated above, the Associations respectfully submit that OEHHA
does not have the authority to list -myrcene through the authoritative bodies listing
process based on the current record and request that OEHHA withdraw the Notice of
Intent to List.

NTP TECHNICAL REPORT
ON THE
TOXICOLOGY AND CARCINOGENESIS
STUDIES OF β-MYRCENE
(CAS NO. 123-35-3)
IN F344/N RATS AND B6C3F1 MICE
(GAVAGE STUDIES)
Scheduled Peer Review Date: February 25, 2009
NOTICE
This DRAFT Technical Report is distributed solely for the purpose of predissemination peer review under the applicable information quality guidelines. It has not been formally disseminated by the NTP. It does not represent and should not be construed to represent NTP determination or policy.
NTP TR 557
NIH Publication No. 09-5898
National Toxicology Program
National Institutes of HealthPublic Health Service
U.S. DEPARTMENT OF HEALTH AND HUMAN SERVICES
FOREWORD
The National Toxicology Program (NTP) is an interagency program within the Public Health Service (PHS) of the Department of Health and Human Services (HHS) and is headquartered at the National Institute of Environmental Health Sciences of the National Institutes of Health (NIEHS/NIH). Three agencies contribute resources to the program: NIEHS/NIH, the National Institute for Occupational Safety and Health of the Centers for Disease Control and Prevention (NIOSH/CDC), and the National Center for Toxicological Research of the Food and Drug Administration (NCTR/FDA). Established in 1978, the NTP is charged with coordinating toxicological testing activities, strengthening the science base in toxicology, developing and validating improved testing methods, and providing information about potentially toxic substances to health regulatory and research agencies, scientific and medical communities, and the public.
The Technical Report series began in 1976 with carcinogenesis studies conducted by the National Cancer Institute. In 1981, this bioassay program was transferred to the NTP. The studies described in the Technical Report series are designed and conducted to characterize and evaluate the toxicologic potential, including carcinogenic activity, of selected substances in laboratory animals (usually two species, rats and mice). Substances selected for NTP toxicity and carcinogenicity studies are chosen primarily on the basis of human exposure, level of production, and chemical structure. The interpretive conclusions presented in NTP Technical Reports are based only on the results of these NTP studies. Extrapolation of these results to other species, including characterization of hazards and risks to humans, requires analyses beyond the intent of these reports. Selection per se is not an indicator of a substance’s carcinogenic potential.
The NTP conducts its studies in compliance with its laboratory health and safety guidelines and FDA Good Laboratory Practice Regulations and must meet or exceed all applicable federal, state, and local health and safety regulations. Animal care and use are in accordance with the Public Health Service Policy on Humane Care and Use of Animals. Studies are subjected to retrospective quality assurance audits before being presented for public review.
NTP Technical Reports are indexed in the NIH/NLM PubMed database and are available free of charge electronically on the NTP website (http://ntp.niehs.nih.gov) or in hardcopy upon request from the NTP Central Data Management group at [email protected] or (919) 541-3419.
NTP TECHNICAL REPORT
ON THE
TOXICOLOGY AND CARCINOGENESIS
STUDIES OF β-MYRCENE
(CAS NO. 123-35-3)
IN F344/N RATS AND B6C3F1 MICE
(GAVAGE STUDIES)
Scheduled Peer Review Date: February 25, 2009
NOTICE
This DRAFT Technical Report is distributed solely for the purpose of predissemination peer review under the applicable information quality guidelines. It has not been formally disseminated by the NTP. It does not represent and should not be construed to represent NTP determination or policy.
NTP TR 557
NIH Publication No. 09-5898
National Toxicology Program
National Institutes of HealthPublic Health Service
U.S. DEPARTMENT OF HEALTH AND HUMAN SERVICES
22
NOT FOR DISTRIBUTION OR ATTRIBUTION Board DraftNOT FOR DISTRIBUTION OR ATTRIBUTION Board Draft
CONTRIBUTORS
National Toxicology ProgramEvaluated and interpreted results and reported findings
P.C. Chan, Ph.D., Study Scientist
M.F. Cesta, D.V.M., Study Pathologist
R.C. Sills, D.V.M., Ph.D., Study Pathologist
J.B. Bishop, Ph.D.D.W. Bristol, Ph.D.J.R. Bucher, Ph.D.R.S. Chhabra, Ph.D.P.M. Foster, Ph.D.R.A. Herbert, D.V.M., Ph.D.M.J. Hooth, Ph.D.A.P. King-Herbert, D.V.M.G.E. Kissling, Ph.D.D.E. Malarkey, D.V.M., Ph.D.J.H. Roycroft, Ph.D.J.M. Sanders, Ph.D.C.S. Smith, Ph.D.G.S. Travlos, D.V.M.N.J. Walker, Ph.D.K.L. Witt, M.S.
Battelle Columbus OperationsConducted studies and evaluated pathology findings
M.R. Hejtmancik, Ph.D., Principal Investigator
M.J. Ryan, D.V.M., Ph.D.D.Y. Vasconcelos, D.V.M., M. Vet. Sci., Ph.D.
Experimental Pathology Laboratories, Inc.Provided pathology review
M.H. Hamlin, II, D.V.M., Principal Investigator
K.J. Cimon, D.V.M., M.S.J.C. Peckham, D.V.M., M.S., Ph.D.
TherImmune Research CorporationProvided SMVCE analysis
G.W. Wolfe, Ph.D., Principal Investigator
H.S. Seung, M.S.
Dynamac CorporationPrepared quality assessment audits
S. Brecher, Ph.D., Principal Investigator
S. Iyer, B.S.V.S. Tharakan, D.V.M.
β-Myrcene, NTP TR 557 3
NOT FOR DISTRIBUTION OR ATTRIBUTIONBoard Draft
NTP Pathology Working GroupEvaluated slides and contributed to pathology report on rats(May 11, 2006)
J.T. Boyce, D.V.M., Ph.D., Coordinator Pathology Associates, A Charles River Company
W.G. Lieuallen, D.V.M., Ph.D., Coordinator Pathology Associates, A Charles River Company
K.J. Cimon, D.V.M., M.S. Experimental Pathology Laboratories, Inc.
S.A. Elmore, D.V.M., M.S. National Toxicology Program
R.A. Herbert, D.V.M., Ph.D. National Toxicology Program
D.E. Malarkey, D.V.M., Ph.D. National Toxicology Program
J.C. Peckham, D.V.M., M.S., Ph.D. Experimental Pathology Laboratories, Inc.
R.C. Sills, D.V.M., Ph.D. National Toxicology Program
A.W. Suttie, B.V.Sc., Ph.D. ILS, Inc.
Evaluated slides and contributed to pathology report on mice(June 1, 2006)
J.C. Turnier, B.S., V.M.D., Coordinator Pathology Associates, A Charles River Company
K.J. Cimon, D.V.M., M.S. Experimental Pathology Laboratories, Inc.
S.A. Elmore, D.V.M., M.S. National Toxicology Program
B.-S. Han, D.V.M., Ph.D., Observer Korean National Institute of Toxicologic Research
R.A. Herbert, D.V.M., Ph.D. National Toxicology Program
D.E. Malarkey, D.V.M., Ph.D. National Toxicology Program
J.C. Peckham, D.V.M., M.S., Ph.D. Experimental Pathology Laboratories, Inc.
A.K. Remick, D.V.M., Observer National Toxicology Program
R.C. Sills, D.V.M., Ph.D. National Toxicology Program
N. Wakamatsu, D.V.M., Ph.D., Observer
National Toxicology Program
SRA International, Inc.Provided statistical analyses
P.W. Crockett, Ph.D., Principal Investigator
L.J. Betz, M.S.K.P. McGowan, M.B.A.
Biotechnical Services, Inc.Prepared Technical Report
S.R. Gunnels, M.A., Principal Investigator
K.K. Coker, Ph.D.P.A. Gideon, B.A.B.F. Hall, M.S.L.M. Harper, B.S.J.I. Powers, M.A.P.D.C. Serbus, Ph.D.
β-Myrcene, NTP TR 557 4
NOT FOR DISTRIBUTION OR ATTRIBUTION Board Draft
CONTENTS
ABSTRACT . . . . . . . . . . . . . . . . . . . . . . . . . . . . . . . . . . . . . . . . . . . . . . . . . . . . . . . . . . . . . . . . . . . . . . . . . . . . . 5
EXPLANATION OF LEVELS OF EVIDENCE OF CARCINOGENIC ACTIVITY. . . . . . . . . . . . . . . . . 12
TECHNICAL REPORTS REVIEW SUBCOMMITTEE. . . . . . . . . . . . . . . . . . . . . . . . . . . . . . . . . . . . . . . . 13
SUMMARY OF TECHNICAL REPORTS REVIEW SUBCOMMITTEE COMMENTS. . . . . . . . . . . . . 14
INTRODUCTION . . . . . . . . . . . . . . . . . . . . . . . . . . . . . . . . . . . . . . . . . . . . . . . . . . . . . . . . . . . . . . . . . . . . . . . . 15
MATERIALS AND METHODS . . . . . . . . . . . . . . . . . . . . . . . . . . . . . . . . . . . . . . . . . . . . . . . . . . . . . . . . . . . . 25
RESULTS . . . . . . . . . . . . . . . . . . . . . . . . . . . . . . . . . . . . . . . . . . . . . . . . . . . . . . . . . . . . . . . . . . . . . . . . . . . . . . . 41
DISCUSSION AND CONCLUSIONS. . . . . . . . . . . . . . . . . . . . . . . . . . . . . . . . . . . . . . . . . . . . . . . . . . . . . . . . 79
REFERENCES. . . . . . . . . . . . . . . . . . . . . . . . . . . . . . . . . . . . . . . . . . . . . . . . . . . . . . . . . . . . . . . . . . . . . . . . . . . 85
Appendix A Summary of Lesions in Male Rats in the 2-Year Gavage Study of β-Myrcene . . . . . . . . A-1
Appendix B Summary of Lesions in Female Rats in the 2-Year Gavage Study of β-Myrcene . . . . . . B-1
Appendix C Summary of Lesions in Male Mice in the 2-Year Gavage Study of β-Myrcene . . . . . . . . C-1
Appendix d Summary of Lesions in Female Mice in the 2-Year Gavage Study of β-Myrcene . . . . . . D-1
Appendix e Genetic Toxicology . . . . . . . . . . . . . . . . . . . . . . . . . . . . . . . . . . . . . . . . . . . . . . . . . . . . . . . . . E-1
Appendix F Clinical Pathology Results . . . . . . . . . . . . . . . . . . . . . . . . . . . . . . . . . . . . . . . . . . . . . . . . . . . F-1
Appendix G Organ Weights and Organ-Weight-to-Body-Weight Ratios . . . . . . . . . . . . . . . . . . . . . . . G-1
Appendix H Reproductive Tissue Evaluations and Estrous Cycle Characterization . . . . . . . . . . . . . . H-1
Appendix i Chemical Characterization and Dose Formulation Studies . . . . . . . . . . . . . . . . . . . . . . . . I-1
Appendix J Ingredients, Nutrient Composition, and Contaminant Levels in NTP-2000 Rat and Mouse Ration . . . . . . . . . . . . . . . . . . . . . . . . . . . . . . . . . . . . . . . . . . . J-1
Appendix K Sentinel Animal Program. . . . . . . . . . . . . . . . . . . . . . . . . . . . . . . . . . . . . . . . . . . . . . . . . . . . K-1
NOT FOR DISTRIBUTION OR ATTRIBUTIONBoard Draft NOT FOR DISTRIBUTION OR ATTRIBUTIONBoard Draft
55
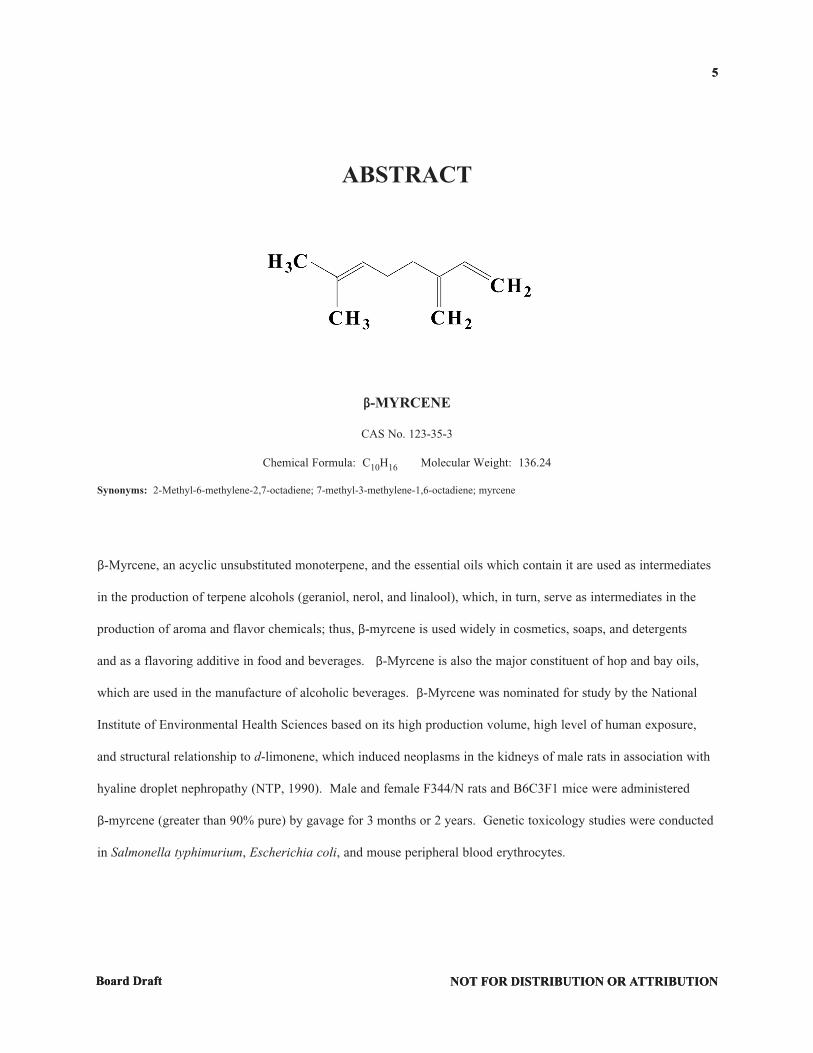
ABSTRACT
β-MYRCENE
CAS No. 123-35-3
Chemical Formula: C10H16 Molecular Weight: 136.24
Synonyms: 2-Methyl-6-methylene-2,7-octadiene; 7-methyl-3-methylene-1,6-octadiene; myrcene
β-Myrcene, an acyclic unsubstituted monoterpene, and the essential oils which contain it are used as intermediates
in the production of terpene alcohols (geraniol, nerol, and linalool), which, in turn, serve as intermediates in the
production of aroma and flavor chemicals; thus, β-myrcene is used widely in cosmetics, soaps, and detergents
and as a flavoring additive in food and beverages. β-Myrcene is also the major constituent of hop and bay oils,
which are used in the manufacture of alcoholic beverages. β-Myrcene was nominated for study by the National
Institute of Environmental Health Sciences based on its high production volume, high level of human exposure,
and structural relationship to d-limonene, which induced neoplasms in the kidneys of male rats in association with
hyaline droplet nephropathy (NTP, 1990). Male and female F344/N rats and B6C3F1 mice were administered
β-myrcene (greater than 90% pure) by gavage for 3 months or 2 years. Genetic toxicology studies were conducted
in Salmonella typhimurium, Escherichia coli, and mouse peripheral blood erythrocytes.
β-Myrcene, NTP TR 557 6
NOT FOR DISTRIBUTION OR ATTRIBUTION Board Draft
3-Month Study in RatS
Groups of 10 male and 10 female rats were administered 0, 0.25, 0.5, 1, 2, or 4 g β-myrcene/kg body weight in
corn oil by gavage, 5 days per week for 14 weeks. Additional groups of 10 male and 10 female special study rats
were administered the same doses for 22 days. All core study rats in the 4 g/kg groups died during the first week
of the study except one male that died on day 11. One to three rats in the 1 and 2 g/kg groups and one 0.5 g/kg
male died by week 9 of the study. One 2 g/kg female died during the last week of the study. Except for lesion
incidence data in groups administered 2 g/kg or less, data from rats that died early were excluded from the analysis
and summary tables. Mean body weights were significantly decreased in the 0.5, 1, and 2 g/kg groups. Special
study rats in the 4 g/kg groups died by the end of the first week. Dose-related clinical findings in animals that died
early included thinness, lethargy, abnormal breathing, and ruffled fur. Right kidney and liver weights of dosed
males and females were generally significantly greater than those of the vehicle controls.
In special study rats evaluated on day 23, the incidences and severities of chronic progressive nephropathy (CPN)
and renal tubule necrosis were increased in 2 g/kg males. At the end of the 3-month study, the incidences of renal
tubule necrosis were significantly increased in all dosed groups of males and females.
At 3 months, the incidences of olfactory epithelium degeneration in 2 g/kg males and females were significantly
increased, and the severities were increased. The incidences of chronic inflammation in 1 and 2 g/kg males and
females were significantly increased. All 2 g/kg males and females had splenic atrophy. In the mesenteric lymph
node, significantly increased incidences of atrophy occurred in 2 g/kg males and 1 and 2 g/kg females. Acute
inflammation of the forestomach occurred in four 2 g/kg females. The incidences of porphyrin pigmentation in the
Harderian gland of males administered 0.5 g/kg or greater were significantly increased.
β-Myrcene, NTP TR 557 7
NOT FOR DISTRIBUTION OR ATTRIBUTIONBoard Draft
3-Month Study in Mice
Groups of 10 male and 10 female mice were administered 0, 0.25, 0.5, 1, 2, or 4 g β-myrcene/kg body weight in
corn oil by gavage, 5 days per week for 14 weeks. All 4 g/kg male and female mice died during week 1; nine
2 g/kg males and eight 2 g/kg females died by week 4. The mean body weights of 1 g/kg males and 0.5 and
2 g/kg females were significantly less than those of the vehicle controls. Clinical findings in animals that did not
survive to the end of the study included thinness, lethargy, and abnormal breathing. The right kidney weights
of 1 g/kg females and the liver weights of females administered 0.5 or 1 g/kg were significantly increased. No
histopathology changes were observed in mice administered 1 g/kg or less. The 2 and 4 g/kg mice were not
evaluated due to early deaths.
2-yeaR Study in RatS
Groups of 50 male and 50 female rats were administered 0, 0.25, 0.5, or 1 g β-myrcene/kg body weight in corn
oil by gavage, 5 days per week for 105 weeks. All 1 g/kg male rats died before the end of the study due to renal
toxicity. Compared to vehicle controls, the mean body weights of 0.25 and 0.5 g/kg males were slightly greater,
and mean body weights of 1 g/kg females were slightly less at the end of the study.
In the standard evaluation of the kidney, the incidence of renal tubule adenoma was significantly increased in
0.5 g/kg male rats, and the combined incidences of renal tubule adenoma or carcinoma were significantly increased
in 0.25 and 0.5 g/kg males. In both the extended evaluation and the combined standard and extended evaluations,
the incidences of renal tubule adenoma and the combined incidences of renal tubule adenoma or carcinoma
were significantly increased in the 0.25 and 0.5 g/kg groups of males. The incidences of renal tubule nephrosis
(nephrosis) were markedly increased in all dosed groups of both sexes except in 0.25 g/kg females. The incidences
of papillary mineralization in 0.25 and 0.5 g/kg males were significantly increased. Significantly increased
incidences of nephropathy occurred in dosed females, and the severity was increased in the 0.5 and 1 g/kg males
and females. The incidences of hyperplasia of the transitional epithelium lining the pelvis and overlying the renal
β-Myrcene, NTP TR 557 8
NOT FOR DISTRIBUTION OR ATTRIBUTION Board Draft
papilla were significantly increased in all dosed groups of males and females. In male rats, the incidences of focal
suppurative inflammation were significantly increased in the 0.25 and 0.5 g/kg groups.
A significantly increased incidence of chronic active inflammation of the nose occurred in 0.5 g/kg males. Also in
0.5 g/kg males, the incidence of chronic active inflammation of the forestomach was increased.
2-yeaR Study in Mice
Groups of 50 male and 50 female mice were administered 0, 0.25, 0.5, or 1 g β-myrcene/kg body weight in
corn oil by gavage, 5 days per week for 104 or 105 weeks. Survival of 1 g/kg mice was significantly less than that
of the vehicle controls; the cause of the deaths was uncertain. Mean body weights of 1 g/kg males were 8% less
than those of the vehicle controls after week 8. Mean body weights of 0.5 g/kg females were 7% less than those of
the vehicle controls after week 17, and those of 1 g/kg females were 8% less after week 11.
The incidences of liver neoplasms were significantly increased in 0.25 and/or 0.5 g/kg males and 0.25 g/kg
females. Liver neoplasms included hepatocellular adenoma and hepatocellular carcinoma in males and females
and hepatoblastoma in males. The incidences of hepatocellular hypertrophy were significantly increased in
0.5 g/kg males and females, as was the incidence of mixed cell focus in 0.5 g/kg females.
The incidences of bone marrow atrophy and lymph node follicle atrophy in the spleen were significantly increased
in 0.5 g/kg females. In the forestomach, there were significantly increased incidences of inflammation and
epithelial hyperplasia in 0.5 g/kg females.
β-Myrcene, NTP TR 557
NOT FOR DISTRIBUTION OR ATTRIBUTIONBoard Draft
9
Genetic toxicoloGy
β-Myrcene did not show evidence of genotoxicity in assays conducted by the NTP. No mutagenicity was
observed in any of several strains of Salmonella typhimurium or Escherichia coli in two independent Ames assays
conducted with and without exogenous metabolic activation. In addition, no significant increase in frequency
of micronucleated normochromatic erythrocytes, biomarkers of chromosomal damage, was observed in male or
female mice administered β-myrcene for 3 months by gavage.
concluSionS
Under the conditions of these 2-year gavage studies, there was clear evidence of carcinogenic activity of
β-myrcene in male F344/N rats based on increased incidences of renal tubule neoplasms. There was equivocal
evidence of carcinogenic activity of β-myrcene in female F344/N rats based on increased incidences of renal
tubule adenoma. There was clear evidence of carcinogenic activity of β-myrcene in male B6C3F1 mice based on
increased incidences of liver neoplasms. There was equivocal evidence of carcinogenic activity of β-myrcene in
female B6C3F1 mice based on marginally increased incidences of hepatocellular neoplasms.
Administration of β-myrcene induced nonneoplastic lesions in the kidney of male and female rats, nose of male
rats, and liver of male and female mice.
__________
* Explanation of Levels of Evidence of Carcinogenic Activity is on page 12.

β-Myrcene, NTP TR 557 10
NOT FOR DISTRIBUTION OR ATTRIBUTION Board Draft
Summary of the 2-Year Carcinogenesis and Genetic Toxicology Studies of β-Myrcenea
Male Female Male Female F344/N Rats F344/N Rats B6C3F1 Mice B6C3F1 Mice
Doses in corn oil by gavage
Body weights
Survival rates
Nonneoplastic effects
Neoplastic effects
Equivocal findings
0, 0.25, 0.5, 1 g/kg
0.25 and 0.5 g/kg groups greater than vehicle control group after week 81
29/50, 36/50, 28/50, 0/50
Kidney: renal tubule, nephrosis (0/50, 42/50, 46/50); papilla, mineralization (1/50, 48/50, 40/50); severity of nephropathy (1.2, 2.0, 2.6); transitional epithelium, hyperplasia (0/50, 21/50, 19/50); inflammation, suppurative, focal (1/50, 22/50, 22/50)
Nose: inflammation, chronic active (14/50, 19/50, 27/50)
Kidney: renal tubule adenoma (standard evaluation - 0/50, 4/50, 8/50; extended evaluation - 0/50, 8/50, 7/50; standard and extended evaluations combined - 0/50, 12/50, 13/50); renal tubule adenoma or carcinoma (standard evaluation - 0/50, 7/50, 9/50; extended evaluation - 0/50, 10/50, 7/50; standard and extended evaluations combined - 0/50, 14/50, 13/50)
None
0, 0.25, 0.5, 1 g/kg
1 g/kg group less than vehicle control group after week 13
31/50, 33/50, 28/50, 33/50
Kidney: renal tubule, nephrosis (0/50, 2/50, 27/50, 45/50); nephropathy (26/50, 43/50, 41/50, 44/50); severity of nephropathy (1.0, 1.0, 1.3, 1.7); transitional epithelium, hyperplasia (1/50, 12/50, 15/50, 19/50)
None
Kidney: renal tubule adenoma (standard evaluation - 0/50, 1/50, 0/50, 2/50; extended evaluation - 0/50, 1/50, 1/50, 2/50; standard and extended evaluation - 0/50, 2/50, 1/50, 3/50)
0, 0.25, 0.5, 1 g/kg
1 g/kg group less than vehicle control group after week 8
35/50, 35/50, 31/50, 21/50
Liver: hepatocyte, hypertrophy (1/50, 2/50, 16/50)
Liver: hepatocellular adenoma (26/50, 41/50, 43/50); hepatocellular carcinoma (14/50, 20/50, 28/50); hepatocellular adenoma or carcinoma (33/50, 44/50, 48/50); hepatoblastoma (4/50, 6/50, 11/50); hepatocellular adenoma, hepatocellular carcinoma, or hepatoblastoma (34/50, 45/50, 48/50)
None
0, 0.25, 0.5, 1 g/kg
1 g/kg group less than vehicle control group after week 11; 0.5 g/kg group less than vehicle control group after week 17
39/50, 34/50, 35/50, 17/50
Liver: hepatocyte, hypertrophy (0/50, 0/50, 6/50); mixed cell focus (1/50, 4/50, 6/50)
None
Liver: hepatocellular adenoma (6/50, 13/50, 6/50); hepatocellular carcinoma (1/50, 7/50, 2/50); hepatocellular adenoma or carcinoma (7/50, 18/50, 8/50)
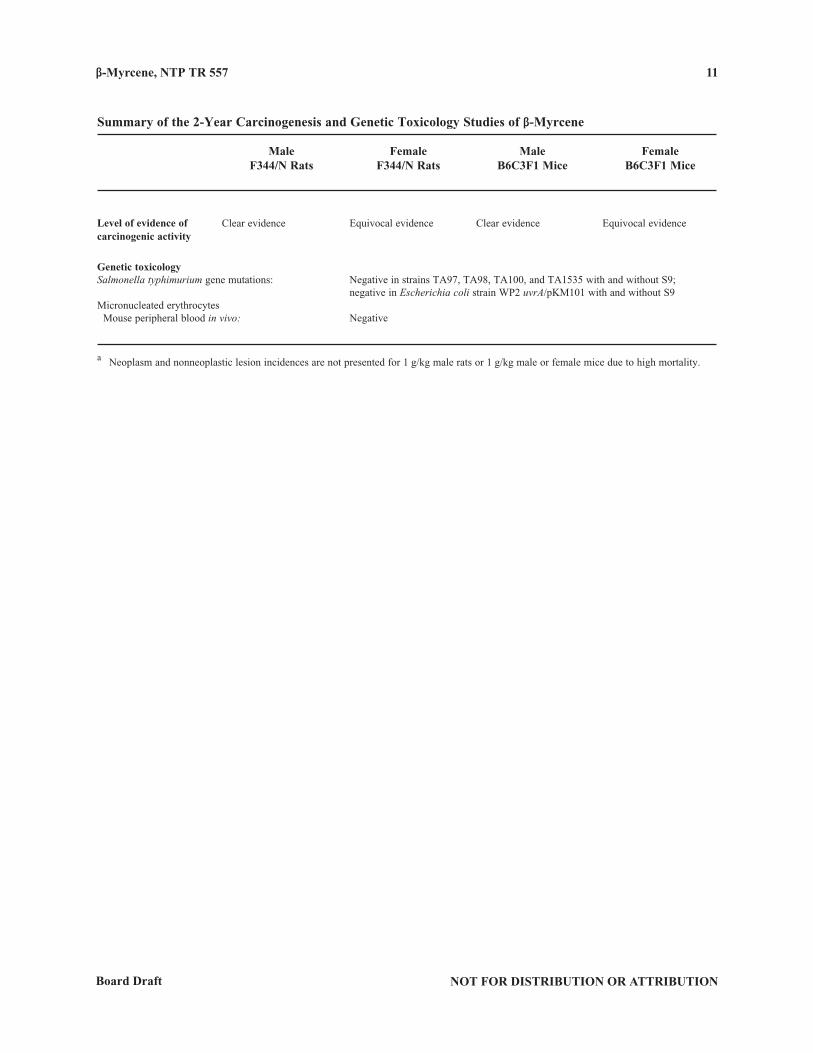
β-Myrcene, NTP TR 557
NOT FOR DISTRIBUTION OR ATTRIBUTIONBoard Draft
11
Summary of the 2-Year Carcinogenesis and Genetic Toxicology Studies of β-Myrcene
Male Female Male Female F344/N Rats F344/N Rats B6C3F1 Mice B6C3F1 Mice
Negative in strains TA97, TA98, TA100, and TA1535 with and without S9; negative in Escherichia coli strain WP2 uvrA/pKM101 with and without S9
Negative
Genetic toxicologySalmonella typhimurium gene mutations:
Micronucleated erythrocytes Mouse peripheral blood in vivo:
a Neoplasm and nonneoplastic lesion incidences are not presented for 1 g/kg male rats or 1 g/kg male or female mice due to high mortality.
Equivocal evidenceClear evidenceEquivocal evidenceClear evidenceLevel of evidence of carcinogenic activity
β-Myrcene, NTP TR 557 12
NOT FOR DISTRIBUTION OR ATTRIBUTION Board Draft
EXPLANATION OF LEVELS OF EVIDENCE OF CARCINOGENIC ACTIVITY
The National Toxicology Program describes the results of individual experiments on a chemical agent and notes the strength of the evidence for conclusions regarding each study. Negative results, in which the study animals do not have a greater incidence of neoplasia than control animals, do not necessarily mean that a chemical is not a carcinogen, inasmuch as the experiments are conducted under a limited set of conditions. Positive results demonstrate that a chemical is carcinogenic for laboratory animals under the conditions of the study and indicate that exposure to the chemical has the potential for hazard to humans. Other organizations, such as the International Agency for Research on Cancer, assign a strength of evidence for conclusions based on an examination of all available evidence, including animal studies such as those conducted by the NTP, epidemiologic studies, and estimates of exposure. Thus, the actual determination of risk to humans from chemicals found to be carcinogenic in laboratory animals requires a wider analysis that extends beyond the purview of these studies.
Five categories of evidence of carcinogenic activity are used in the Technical Report series to summarize the strength of the evidence observed in each experiment: two categories for positive results (clear evidence and some evidence); one category for uncertain findings (equivocal evidence); one category for no observable effects (no evidence); and one category for experiments that cannot be evaluated because of major flaws (inadequate study). These categories of interpretative conclusions were first adopted in June 1983 and then revised in March 1986 for use in the Technical Report series to incorporate more specifically the concept of actual weight of evidence of carcinogenic activity. For each separate experiment (male rats, female rats, male mice, female mice), one of the following five categories is selected to describe the findings. These categories refer to the strength of the experimental evidence and not to potency or mechanism.
• Clear evidence of carcinogenic activity is demonstrated by studies that are interpreted as showing a dose-related (i) increase of malignant neoplasms, (ii) increase of a combination of malignant and benign neoplasms, or (iii) marked increase of benign neoplasms if there is an indication from this or other studies of the ability of such tumors to progress to malignancy. • Some evidence of carcinogenic activity is demonstrated by studies that are interpreted as showing a chemical-related increased incidence of neoplasms (malignant, benign, or combined) in which the strength of the response is less than that required for clear evidence. • Equivocal evidence of carcinogenic activity is demonstrated by studies that are interpreted as showing a marginal increase of neoplasms that may be chemical related. • No evidence of carcinogenic activity is demonstrated by studies that are interpreted as showing no chemical-related increases in malignant or benign neoplasms. • Inadequate study of carcinogenic activity is demonstrated by studies that, because of major qualitative or quantitative limitations, cannot be interpreted as valid for showing either the presence or absence of carcinogenic activity.
For studies showing multiple chemical-related neoplastic effects that if considered individually would be assigned to different levels of evidence categories, the following convention has been adopted to convey completely the study results. In a study with clear evidence of carcinogenic activity at some tissue sites, other responses that alone might be deemed some evidence are indicated as “were also related” to chemical exposure. In studies with clear or some evidence of carcinogenic activity, other responses that alone might be termed equivocal evidence are indicated as “may have been” related to chemical exposure.
When a conclusion statement for a particular experiment is selected, consideration must be given to key factors that would extend the actual boundary of an individual category of evidence. Such consideration should allow for incorporation of scientific experience and current understanding of long-term carcinogenesis studies in laboratory animals, especially for those evaluations that may be on the borderline between two adjacent levels. These considerations should include:
• adequacyoftheexperimentaldesignandconduct; • occurrenceofcommonversusuncommonneoplasia; • progression(orlackthereof)frombenigntomalignantneoplasiaaswellasfrompreneoplastictoneoplasticlesions; • somebenignneoplasmshavethecapacitytoregressbutothers(ofthesamemorphologictype)progress.Atpresent,itisimpossibleto identify the difference. Therefore, where progression is known to be a possibility, the most prudent course is to assume that benign neoplasms of those types have the potential to become malignant; • combiningbenignandmalignanttumorincidenceknownorthoughttorepresentstagesofprogressioninthesameorganortissue; • latencyintumorinduction; • multiplicityinsite-specificneoplasia; • metastases; • supportinginformationfromproliferativelesions(hyperplasia)inthesamesiteofneoplasiaorinotherexperiments(samelesionin another sex or species); • presenceorabsenceofdoserelationships; • statisticalsignificanceoftheobservedtumorincrease; • concurrentcontroltumorincidenceaswellasthehistoricalcontrolrateandvariabilityforaspecificneoplasm; • survival-adjustedanalysesandfalsepositiveorfalsenegativeconcerns; • structure-activitycorrelations;and • insomecases,genetictoxicology.
β-Myrcene, NTP TR 557
NOT FOR DISTRIBUTION OR ATTRIBUTIONBoard Draft
13
NATIONAL TOXICOLOGY PROGRAM BOARD OF SCIENTIFIC COUNSELORSTECHNICAL REPORTS REVIEW SUBCOMMITTEE
The members of the Technical Reports Review Subcommittee who evaluated the draft NTP Technical Report on β-myrcene on February 25, 2009, are listed below. Subcommittee members serve as independent scientists, not as representatives of any institution, company, or governmental agency. In this capacity, subcommittee members have five major responsibilities in reviewing the NTP studies:
• toascertainthatallrelevantliteraturedatahavebeenadequatelycitedandinterpreted, • todetermineifthedesignandconditionsoftheNTPstudieswereappropriate, • toensurethattheTechnicalReportpresentstheexperimentalresultsandconclusionsfullyandclearly, • tojudgethesignificanceoftheexperimentalresultsbyscientificcriteria,and • toassesstheevaluationoftheevidenceofcarcinogenicactivityandotherobservedtoxicresponses.
Raymond F. Novak, Ph.D., Chairperson Institute of Environmental Health Sciences Wayne State University Detroit, MI
Tracie E. Bunton, D.V.M., Ph.D. Toxicology Consultant Eicarte LLC Gettysburg, PA
Russell C. Cattley, V.M.D., Ph.D. Amgen Thousand Oaks, CA
Michael V. Pino, D.V.M., Ph.D. Drug Safety Evaluation Sanofi-aventis Alfortville, France
Kenneth M. Portier, Ph.D. American Cancer Society Atlanta, GA
Jim E. Riviere, D.V.M., Ph.D. College of Veterinary Medicine North Carolina State University Raleigh, NC
Special Ad Hoc Reviewers
David A. Eastmond, Ph.D. Department of Cell Biology and Neuroscience University of California Riverside, CA
Stephen W. Looney, Ph.D. Department of Biostatistics Medical College of Georgia Augusta, GA
Mitzi Nagarkatti, Ph.D. Department of Pathology, Microbiology, and Immunology University of South Carolina School of Medicine Columbia, SC
James L. Sherley, M.D., Ph.D. Programs in Regenerative Biology and Cancer Boston Biomedical Research Institute Watertown, MA
Justin G. Teeguarden, Ph.D. Pacific Northwest National Laboratory Richland, WA
β-Myrcene, NTP TR 557 14
NOT FOR DISTRIBUTION OR ATTRIBUTION Board Draft
SUMMARY OF TECHNICAL REPORTS REVIEW SUBCOMMITTEE COMMENTS
NOTE: A summary of the Technical Reports Review Subcommittee’s remarks will appear in a future draft of this
report.
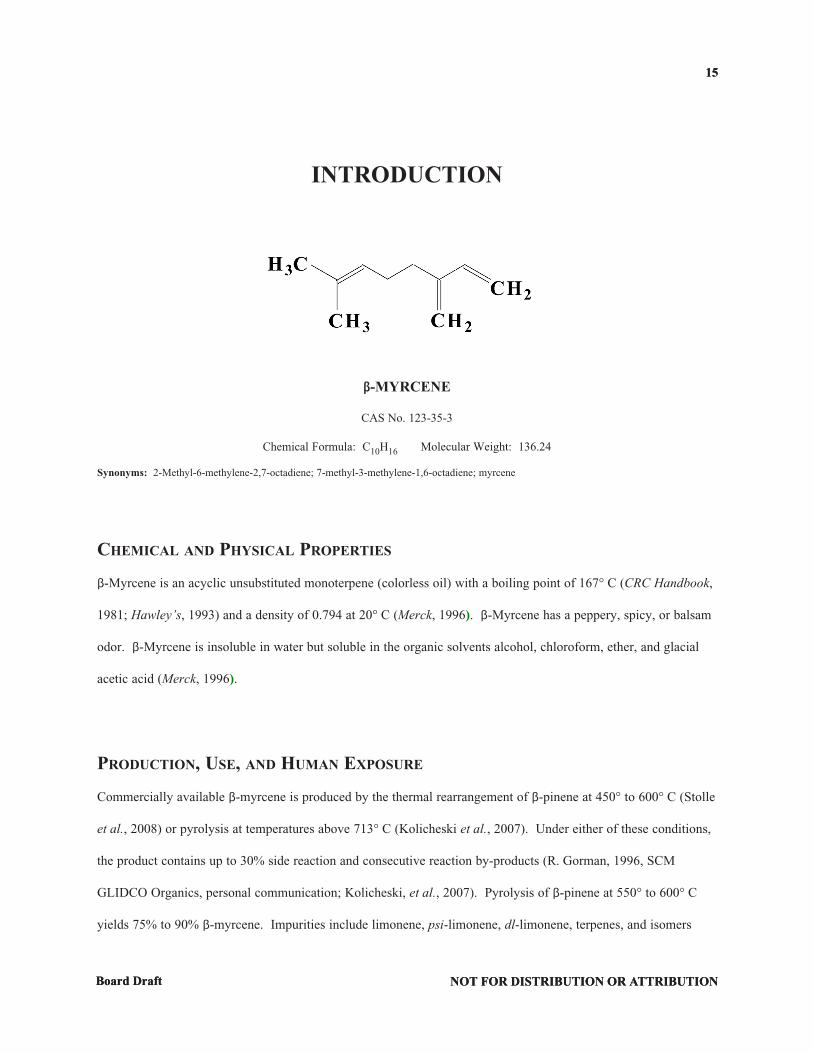
NOT FOR DISTRIBUTION OR ATTRIBUTIONBoard Draft NOT FOR DISTRIBUTION OR ATTRIBUTIONBoard Draft
1515
INTRODUCTION
β-MYRCENE
CAS No. 123‑35‑3
Chemical Formula: C10H16 Molecular Weight: 136.24
Synonyms: 2‑Methyl‑6‑methylene‑2,7‑octadiene; 7‑methyl‑3‑methylene‑1,6‑octadiene; myrcene
ChemiCal and PhysiCal ProPerties
β‑Myrcene is an acyclic unsubstituted monoterpene (colorless oil) with a boiling point of 167° C (CRC Handbook,
1981; Hawley’s, 1993) and a density of 0.794 at 20° C (Merck, 1996). β‑Myrcene has a peppery, spicy, or balsam
odor. β‑Myrcene is insoluble in water but soluble in the organic solvents alcohol, chloroform, ether, and glacial
acetic acid (Merck, 1996).
ProduCtion, use, and human exPosure
Commercially available β‑myrcene is produced by the thermal rearrangement of β‑pinene at 450° to 600° C (Stolle
et al., 2008) or pyrolysis at temperatures above 713° C (Kolicheski et al., 2007). Under either of these conditions,
the product contains up to 30% side reaction and consecutive reaction by‑products (R. Gorman, 1996, SCM
GLIDCO Organics, personal communication; Kolicheski, et al., 2007). Pyrolysis of β‑pinene at 550° to 600° C
yields 75% to 90% β‑myrcene. Impurities include limonene, psi‑limonene, dl‑limonene, terpenes, and isomers
β-Myrcene, NTP TR 557 16
NOT FOR DISTRIBUTION OR ATTRIBUTION Board Draft
and dimers of β‑myrcene (R. Gorman, 1996, SCM GLIDCO Organics, personal communication; Kolicheski et al.,
2007; Stolle et al., 2008). A polymerization inhibitor such as butylhydroxytoluene or tenox propyl gallate is
normally added to crude or high purity myrcene during shipment or extended storage.
Production volume of β‑myrcene is large, but reliable production figures are unavailable (SRI International, 1996).
SCM GLIDCO Organics (Jacksonville, FL) was listed as the only producer of β‑myrcene in the United States in
1996 (SRI International, 1996).
β‑Myrcene is found in verbena oil, galbanum oil, and lemongrass oil (Guenther et al., 1994). In commercial
production, β‑myrcene and the essential oils that contain it are used as intermediates in the production of terpene
alcohols (geraniol, nerol, and linalool), which, in turn, serve as intermediates in the production of aroma and flavor
chemicals (Kuney, 1994); thus, β‑myrcene is used widely in cosmetics, soaps, and detergents and as a flavoring
additive in food and beverages (Lorente et al., 1989; Delgado et al., 1993a). Furthermore, β‑myrcene is the
major constituent of hop and bay oils, which are used in the manufacture of alcoholic beverages (Madyastha and
Srivatsan, 1987).
β‑Myrcene is the chief ingredient in lemongrass tea used in Brazilian folk medicine to treat gastrointestinal
disturbances and as a sedative and antipyretic (Delgado et al., 1993b). It acts as a peripheral analgesic (Lorenzetti
et al., 1991; Delgado et al., 1993b).
Consumers are exposed to β‑myrcene via inhalation, oral routes, and dermal contact. Occupational exposure is via
inhalation and dermal contact.
β‑Myrcene has been identified in over 200 plants, in emission samples from plywood veneer dryers (up to
38.6 mg/m3; Cronn et al., 1983), in emissions by many tree species (up to 3 :g/g per hour; Guenther et al., 1994),
β-Myrcene, NTP TR 557 17
NOT FOR DISTRIBUTION OR ATTRIBUTIONBoard Draft
in household waste (Wilt et al., 1988; Wilkins, 1994; Wilkins and Larsen, 1995), and in indoor air (Wilkins, 1994;
Kostiainen, 1995).
β‑Myrcene is generally recognized as a safe substance in food both in its naturally occurring form in essential oils
(21 CFR § 172.510) and as a synthetic substance (21 CFR § 172.515). β‑Myrcene in effluents is not regulated by
the United States Environmental Protection Agency (40 CFR § 414.101).
absorPtion, distribution, metabolism, and exCretion
Experimental Animals
β‑Myrcene was well absorbed through the skin of rats (Opdyke, 1976). In female rats administered 1 g/kg body
weight orally, the blood level of β‑myrcene at 60 minutes was 14.1 ± 3.0 :g/mL, and the elimination half‑life
was 285 minutes (Delgado et al., 1993b). In that study, the parent chemical was detected in adipose tissue,
brain, liver, kidney, and testis. β‑Myrcene was primarily metabolized to 10‑hydroxylinalool (II) by rat liver
microsomes as shown in Figure 1 (Madyastha and Srivatsan, 1987). The rate of metabolism was significantly
greater in microsomal preparations from phenobarbital (PB)‑treated rats than in 3‑methylcholanthrene‑treated
rats, indicating that β‑myrcene was preferentially metabolized by CYP2B. Induction of CYP2B isozymes by
β‑myrcene was indicated after repeated oral treatment (daily for 14 days) of 1 g/kg of β‑myrcene to rats resulted in
a marked decrease in pentobarbital sleeping time (Freitas et al., 1993). Further, increased levels of CYP2B1/2 and
pentoxy‑resorufin‑O‑dealkylation were observed in liver microsomes of female Wistar rats receiving three daily
oral doses of the same concentration (De‑Oliveira et al., 1997). In contrast, Madyastha and Srivatsan (1987) and
Austin et al. (1988) detected no changes in the amount of PB‑inducible CYP450 in rat liver microsomes of rats
administered β‑myrcene. Male rats receiving 800 mg/kg per day for 20 days metabolized and excreted β‑myrcene
in urine as 10‑hydroxylinalool (II), 7‑methyl‑3‑methylele‑oct‑6‑ene‑1,2‑diol (IV), 1‑hydroxymethyl‑4‑isopropenyl
cyclohexanol (VI), 10‑carboxylinalool (III), and 2‑hydroxy‑7‑methyl‑3‑methylene‑oct‑6‑enoic acid (V) as shown
in Figure 1. 10‑Hydroxylinalool [II and also myrcene‑3(10)‑glycol], arising through apparent formation of a
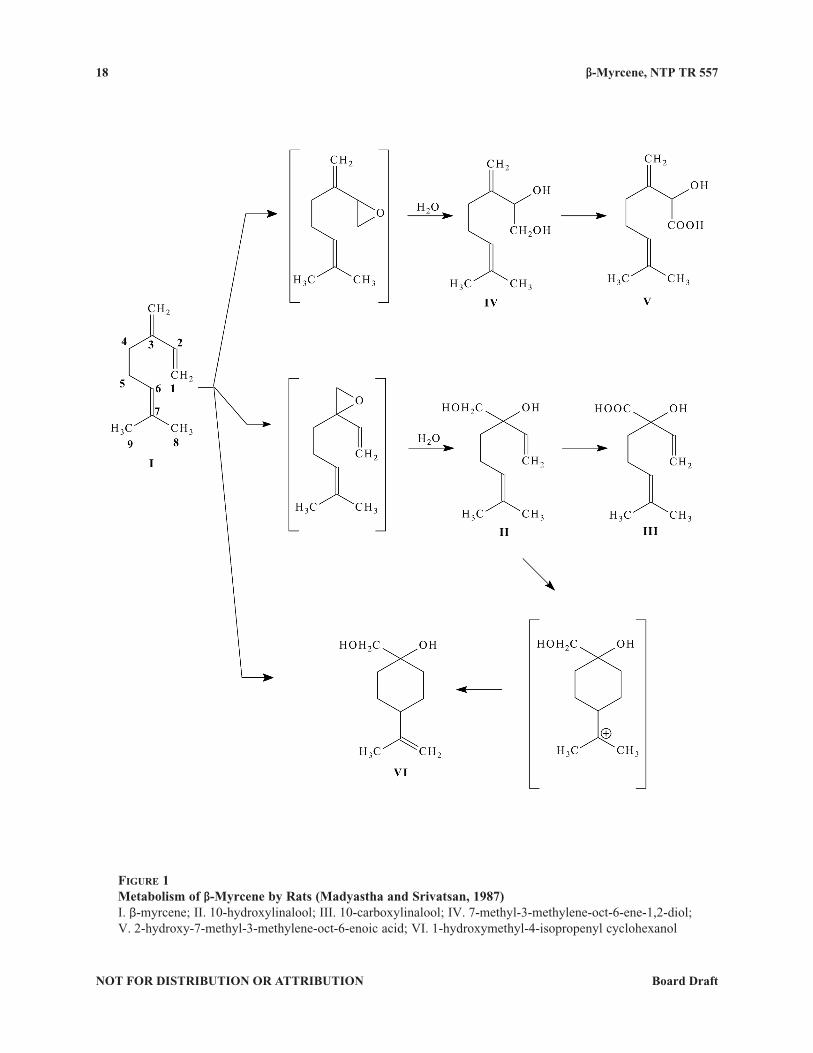
β-Myrcene, NTP TR 557 18
NOT FOR DISTRIBUTION OR ATTRIBUTION Board Draft
Figure 1Metabolism of β-Myrcene by Rats (Madyastha and Srivatsan, 1987)I. β‑myrcene; II. 10‑hydroxylinalool; III. 10‑carboxylinalool; IV. 7‑methyl‑3‑methylene‑oct‑6‑ene‑1,2‑diol; V. 2‑hydroxy‑7‑methyl‑3‑methylene‑oct‑6‑enoic acid; VI. 1‑hydroxymethyl‑4‑isopropenyl cyclohexanol
β-Myrcene, NTP TR 557
NOT FOR DISTRIBUTION OR ATTRIBUTIONBoard Draft
19
3,10‑epoxide, was the major metabolite detected in the urine of rabbits receiving β‑myrcene by gavage (Ishida
et al., 1981). β‑Myrcene was preferentially metabolized to 10‑hydroxylinalool by larvae of the common cutworm
Spodoptera litura (Miyazawa and Murata, 2000). The acidic metabolite, 10‑carboxylinalool (III) arising from II
in rats was detected in rabbits, but not cutworms (Ishida et al., 1981; Madyastha and Srivatsan, 1987). Oxidation
of the 1,2‑double bond led to formation, through a 1,2‑epoxide intermediate, of 7‑methyl‑3‑methylele‑oct‑6‑ene‑
1,2‑diol (IV; myrcene‑1,2‑glycol) in all three species, and formation of the acidic metabolite V in rats and rabbits
(Ishida et al., 1981; Madyastha and Srivatsan, 1987; Miyazawa and Murata, 2000). Preferential oxidation occurred
at the 3,10‑double bond in these studies. Bond formation between C1 and C6 of β‑myrcene resulted in ring
closure and excretion of uroterpenol in rabbit (not shown) and metabolite VI in rat urine (Figure 1).
β‑Myrcene shares similarities in epoxide formation with d‑limonene, a rat kidney carcinogen (NTP, 1990).
A major component in some essential oils of citrus fruits, d‑limonene was metabolized by CYPs in rat liver
microsomes to the glycols, d‑limonene‑8,9‑diol (major metabolite) and d‑limonene‑1,2‑diol, through the respective
8,9‑ and 1,2‑epoxide intermediates (Watabe et al., 1980). Neither epoxide was mutagenic to Salmonella
typhimurium strain TA100. However, interaction between cis‑d‑limonene‑1,2‑oxide and "2u‑globulin is the
apparent causal factor in nephrotoxicity and nephrocarcinogenicity specific to male rats exposed to d‑limonene
(Lehman‑McKeeman et al., 1989). 8,9‑Diol metabolites have been detected in rat, guinea pig, hamster, dog, and
humans exposed to d‑limonene (Kodama et al., 1976). Uroterpenol, identified as a metabolite of β‑myrcene in
rabbits is an 8,9‑diol metabolite of d‑limonene (Kodama et al., 1976; Ishida et al., 1981). The partial structure
of β‑myrcene containing C1, C2, C3, and C10 is similar to 1,3‑butadiene, a carcinogen in rodents and humans
(Melnick and Sills, 2001) and is a site for potential formation of a diepoxide. 1,3‑Butadiene is metabolized to two
monoepoxides (1,2‑epoxy‑3‑butene and 3,4‑epoxy‑1,2‑butanediol) and also forms diepoxybutane (NTP, 1993).
Diepoxybutane and 1,2‑epoxy‑3‑butene have been shown to be mutagenic to S. typhimurium strains TA98 and/
or TA100 (Gervasi et al., 1985). Further, DNA adduct studies suggest that 3,4‑epoxy‑1,2‑butanediol is the major
epoxide involved in the mutagenesis and carcinogenesis of 1,3‑butadiene (Melnick, 2002). The partial structure
of β‑myrcene containing C1, C2, C3, C4, and C10 is similar to isoprene, also known to form monoexpoxides and
β-Myrcene, NTP TR 557 20
NOT FOR DISTRIBUTION OR ATTRIBUTION Board Draft
a diepoxide (Watson et al., 2001). Mutagenic activity was observed for the diepoxide, but not the monoepoxides,
of isoprene in S. typhimurium strains TA98 and TA100 (Gervasi et al., 1985). Isoprene was not mutagenic to
various strains of S. typhimurium in studies conducted by the NTP (1999), but inhalation exposure to the chemical
did result in evidence of carcinogenicity in both male and female F344/N rats. Epoxide formation is suspected
as a causal factor in toxicity related to isoprene exposure, and it is suggested that sex‑ and species‑dependent
differences in the stereochemistry of these metabolites influence their reactivity (Watson et al., 2001). Further,
steric hindrance of the additional methyl group of isoprene may result in less potential cross‑linking of the isoprene
diepoxide than for the 1,3‑butadiene diepoxide. Formation of a β‑myrcene‑derived diepoxide is unproven, and the
potential for reactivity of the β‑myrcene‑derived monoepoxides with either "2u‑globulin or DNA is uncertain.
Humans
No studies on absorption, distribution, metabolism, or excretion of β‑Myrcene in humans were found in the
literature.
toxiCity
Experimental Animals
The oral approximate lethal doses in mice and rats were 5.06 g/kg and 11.39 g/kg, respectively; an oral dose of
10.5 g/kg was not lethal to rats. Intraperitoneal approximate lethal doses in mice and rats were 2.25 g/kg and
5.06 g/kg, respectively (Paumgartten et al., 1990).
Humans
β‑Myrcene is an irritant; in humans, β‑myrcene exposure induces dermatitis, conjunctivitis, somnolence, and
asthma‑like symptoms (Newmark, 1978).
β-Myrcene, NTP TR 557
NOT FOR DISTRIBUTION OR ATTRIBUTIONBoard Draft
21
reProduCtive and develoPmental toxiCity
Experimental Animals
β‑Myrcene administered orally to pregnant Wistar rats induced reduction in maternal weight gain at 1.2 g/kg per
day (Delgado et al., 1993b) and mortality (33%) at 1.5 g/kg per day (Delgado et al., 1993a). Embryo toxicity was
also seen at the maternal toxic dose of 1.2 g/kg. The no‑observed‑adverse‑effect level (NOAEL) was 0.5 g/kg per
day for embryo‑fetotoxicity (Delgado et al., 1993b) and 0.25 g/kg per day for peri‑ and postnatal development
(Delgado et al., 1993a).
Humans
No reproductive or developmental toxicity data for humans exposed to β‑Myrcene were found in the literature.
other biologiCal eFFeCts
β‑Myrcene is analgesic in mice; the ED50 is 16 mg/kg orally (Lorenzetti et al., 1991). Mice treated with
β‑myrcene exhibited an increased antinociceptive activity (hot plate test) (Rao et al., 1990). At 1 g/kg,
β‑myrcene had no effects on exploratory or emotional behavior, anxiolytic activity in a plus maze, nor inhibition
of conditioned avoidance (da‑Silva et al., 1991). This same study found that β‑myrcene did not protect against
pentylenetetrazol‑induced seizures in mice.
β‑Myrcene (0.8 g/kg per day per os for 4 days or 40 mg/kg per day intraperitoneally for 3 days) did not elevate
liver drug metabolizing enzyme activity in rats (Madyastha and Srivatsan, 1987; Austin et al., 1988). However, it
was shown that β‑myrcene at 1.0 g/kg per os interferes with pentobarbital metabolism by increasing sleeping time
in rats (Freitas et al., 1993).
β‑Myrcene at 1 mM and 3 mM inhibits 20% and 18%, respectively, 21 to 26 kDa protein, a family of
isoprenylated proteins consisting of the ras superfamily of small G proteins, in HT–29 colon carcinoma cells
β-Myrcene, NTP TR 557 22
NOT FOR DISTRIBUTION OR ATTRIBUTION Board Draft
(Crowell et al., 1994). Its ability to inhibit post‑translational isoprenylation of small G proteins is more potent than
that of limonene. β‑Myrcene at 1% in the diet had no effect on 7,12‑dimethylbenzanthracene (DMBA) induction
of mammary tumors in Sprague‑Dawley rats (Russin et al., 1989).
CarCinogeniCity
No carcinogenicity studies of β‑myrcene in experimental animals or epidemiology studies in humans were found in
a review of the literature.
genetiC toxiCity
No mutagenic activity has been observed with β‑myrcene in bacterial or mammalian test systems. No increase
in mutant colonies was observed in Salmonella typhimurium strains TA100, TA1535, TA98, or TA97a treated
with up to 1,500 :g/plate β‑myrcene, with or without induced rat liver S9 activation enzymes; "‑terpinene and
(‑)‑"‑pinene, two other monoterpenes, were also negative in this Salmonella mutagenicity assay (Gomes‑Carneiro
et al., 2005). No increases in the frequency of hprt mutations were reported in hamster V79 cells incubated
with up to 1,000 :g/mL β‑myrcene, with and without S9, and no increase in chromosomal aberrations or sister
chromatid exchanges were seen in V79 cells exposed to β‑myrcene (Kauderer et al., 1991). No increases in
chromosomal aberrations were reported in bone marrow cells of male or female Wistar rats sampled 24 or 48 hours
after administration of β‑myrcene (up to 1 g/kg) by corn oil gavage (Zamith et al., 1993).
No mutagenic activity has been observed with d‑limonene, which is structurally related to β‑myrcene, in
S. typhimurium (Haworth et al., 1983), cultured mouse lymphoma cells (Myhr et al., 1990; NTP, 1990), or
Big BlueTM mice (Turner et al., 2001). In addition, d‑limonene did not increase the frequency of chromosomal
aberrations or sister chromatid exchanges in cultured Chinese hamster ovary cells (Anderson et al., 1990;
NTP, 1990).
β-Myrcene, NTP TR 557
NOT FOR DISTRIBUTION OR ATTRIBUTIONBoard Draft
23
study rationale
β‑Myrcene was nominated by NIEHS for carcinogenicity studies. β‑Myrcene was nominated for study based
on its high production volume, high level of human exposure, and structural relationship to d‑limonene, which
induced tumors in the kidneys of male rats in association with hyaline droplet nephropathy (NTP, 1990).

β-Myrcene, NTP TR 557 24
NOT FOR DISTRIBUTION OR ATTRIBUTION Board Draft
NOT FOR DISTRIBUTION OR ATTRIBUTIONBoard Draft NOT FOR DISTRIBUTION OR ATTRIBUTIONBoard Draft
2525
Procurement and characterization of β-myrcene
β-Myrcene was obtained from Millennium Specialty Chemicals (Jacksonville, FL) in two lots (0LB410 for
3-month studies and 1WB503 for 2-year studies). Identity and purity studies were performed by the analytical
chemistry laboratory at Battelle Columbus Operations (Chemistry Support Services, Columbus, OH), Galbraith
Laboratories, Inc. (Knoxville, TN), and the study laboratory at Battelle Columbus Operations (Columbus, OH);
Karl Fischer titration was performed by Galbraith Laboratories, Inc. (Appendix I). Reports on analyses performed
in support of the β-myrcene studies are on file at the National Institute of Environmental Health Sciences.
Both lots of the chemical, a clear to slightly yellow liquid, were identified as β-myrcene by infrared, proton,
and carbon-13 nuclear magnetic resonance (NMR) spectroscopy and by boiling point determinations. The
water content of each lot was determined by Karl Fischer titration. The purity of each lot was determined by
elemental analyses, gas chromatography with flame ionization detection (GC-FID), and high-performance liquid
chromatography (HPLC).
For lot 0LB410, Karl Fischer titration indicated a water content of less than 0.016%, and elemental analyses of
carbon and hydrogen were generally consistent with the theoretical values. HPLC revealed a major peak and
one impurity with a peak area of 0.36%. GC-FID indicated one major peak, nine impurity peaks with areas of
0.1% or greater, and a total peak area for all impurities of 9.55%. The largest peak (4.4% of total peak area) was
identified as psi-limonene. The second largest impurity (1.4% of total peak area) was tentatively identified as
dl-limonene. The other seven impurity peaks, small by comparison, were chiefly terpene hydrocarbons and were
tentatively identified as isomers and dimers of β-myrcene. The overall purity of lot 0LB410 was determined to be
greater than 90%.
MATERIALS AND METHODS
β-Myrcene, NTP TR 557 26
NOT FOR DISTRIBUTION OR ATTRIBUTION Board Draft
For lot 1WB503, Karl Fischer titration indicated a water content of less than 0.06%, and elemental analyses of
carbon and hydrogen were generally consistent with the theoretical values. HPLC revealed a major peak and one
impurity with a peak area of 0.4%. GC-FID indicated one major peak, 12 impurities with areas of 0.1% or greater,
a total peak area for all impurities of 6.5%. The largest impurity in β-myrcene was identified as psi-limonene
(approximately 5%). The other 11 impurity peaks, small by comparison, were chiefly the same as in the earlier lot,
tentatively identified as isomers and dimers of β-myrcene. The overall purity of lot 1WB503 was determined to be
greater than 93%.
To ensure stability, the bulk chemical was stored in amber glass bottles sealed with Teflon®-lined lids at less than
or equal to –20° C. Stability was monitored during the 3-month and 2-year studies using GC-FID; no degradation
of the bulk chemical was detected.
PreParation and analysis of dose formulations
The dose formulations were prepared by mixing β-myrcene (lot 0LB410 for 3-month studies and lot 1WB503
for 2-year studies) with corn oil (Table I1). Stability studies of a 50 mg/mL β-myrcene (lot 09116TQ obtained
from Aldrich Chemical Company, Milwaukee, WI) dose formulation were performed by the analytical chemistry
laboratory using GC-FID. Stability was confirmed for at least 37 days for dose formulations stored in amber
glass bottles sealed with Teflon®-lined lids at temperatures up to room temperature, and for up to 3 hours under
simulated animal room conditions.
Periodic analyses of the dose formulations of β-myrcene were conducted by the study laboratory using GC-FID.
During the 3-month studies, the dose formulations were analyzed at the beginning, midpoint, and end of the
studies; all 13 dose formulations analyzed for rats and all 15 for mice were within 10% of the target concentrations
(Table I2). Animal room samples of these dose formulations were also analyzed; all 13 animal room samples
β-Myrcene, NTP TR 557 27
NOT FOR DISTRIBUTION OR ATTRIBUTIONBoard Draft
for rats and mice were within 10% of the target concentrations. During the 2-year studies, the dose formulations
were analyzed approximately every 3 months; animal room samples were also analyzed (Table I3). All 27 dose
formulations for rats and mice were within 10% of the target concentrations; all nine animal room samples for
rats and mice were within 10% of the target concentrations. Periodic analyses of the corn oil vehicle by the study
laboratory demonstrated peroxide concentrations below the acceptable limit of 3 mEq/kg.
3-month studies
The 3-month studies were conducted to evaluate the cumulative toxic effects of repeated exposure to β-myrcene
and to determine the appropriate doses to be used in the 2-year studies.
Male and female F344/N rats and B6C3F1 mice were obtained from Taconic Farms, Inc. (Germantown, NY). On
receipt, the mice were approximately 3 to 4 weeks old. Animals were quarantined for 11 to 14 days and were
approximately 5 to 6 weeks old on the first day of the study. Before the studies began, five male and five female
mice were randomly selected for parasite evaluation and gross observation for evidence of disease. At 1 month
and at the end of the studies, serologic analyses were performed on five male and five female sentinel rats and
mice using the protocols of the NTP Sentinel Animal Program (Appendix K).
Groups of 10 male and 10 female rats and mice were administered β-myrcene in corn oil by gavage at doses of
0.25, 0.5, 1, 2, or 4 g/kg body weight 5 days per week for 14 weeks. Groups of 10 male and 10 female rats and
mice received the corn oil vehicle alone and served as controls. The dose levels were selected based on published
acute toxicity data. Additional groups of 10 male and 10 female special study rats were administered the same
doses for 22 days. Feed and water were available ad libitum. All rats and female mice were housed five per
cage. Male mice were housed individually. Clinical findings were recorded and core study animals were weighed
initially, weekly, and at the end of the studies. Details of the study design and animal maintenance are summarized
in Table 1.
β-Myrcene, NTP TR 557 28
NOT FOR DISTRIBUTION OR ATTRIBUTION Board Draft
Blood was collected from the retroorbital sinus of special study rats on day 23 and core study rats and mice
at the end of the studies for hematology (rats and mice) and clinical chemistry (rats) analyses. Animals were
anesthetized with a mixture of CO2/O2. Blood samples for hematology were put into microcollection tubes
containing EDTA as the anticoagulant. Erythrocyte, platelet, and leukocyte counts; hematocrit value; hemoglobin
concentration; and mean cell volume, hemoglobin, and hemoglobin concentration were measured using a Cell-Dyn
3500 hematology analyzer and reagents from Abbott Diagnostics (Abbott Park, IL). Samples for clinical chemistry
analyses were collected into microcollection separator tubes and allowed to clot at room temperature; serum
was obtained by centrifugation. Samples were analyzed using a Hitachi 911® chemistry analyzer (Boehringer
Mannheim Diagnostics, Indianapolis, IN) with reagents supplied by the manufacturer. The parameters measured
are listed in Table 1.
At the end of the 3-month studies, samples were collected for sperm morphology and vaginal cytology evaluations
on core study rats and mice administered 0, 0.25, 0.5, or 1 g/kg. The parameters evaluated are listed in Table 1.
For 12 consecutive days prior to scheduled terminal sacrifice, the vaginal vaults of the females were moistened
with saline, if necessary, and samples of vaginal fluid and cells were stained. Relative numbers of leukocytes,
nucleated epithelial cells, and large squamous epithelial cells were determined and used to ascertain estrous cycle
stage (i.e., diestrus, proestrus, estrus, and metestrus). Male animals were evaluated for sperm count and motility.
The left testis and left epididymis were isolated and weighed. The tail of the epididymis (cauda epididymis) was
then removed from the epididymal body (corpus epididymis) and weighed. Test yolk (rats) or modified Tyrode’s
buffer (mice) was applied to slides, and a small incision was made at the distal border of the cauda epididymis.
The sperm effluxing from the incision were dispersed in the buffer on the slides, and the numbers of motile
and nonmotile spermatozoa were counted for five fields per slide by two observers. Following completion of
sperm motility estimates, each left cauda epididymis was placed in buffered saline solution. Caudae were finely
minced, and the tissue was incubated in the saline solution and then heat fixed at 65° C. Sperm density was then
determined microscopically with the aid of a hemacytometer. Four sperm morphology slides were prepared for
each animal evaluated. An aliquot of killed sperm suspension was stained in a test tube, spread on a microscope
β-Myrcene, NTP TR 557
NOT FOR DISTRIBUTION OR ATTRIBUTIONBoard Draft
29
slide under a coverslip, and examined for sperm count and motility. To quantify spermatogenesis, the testicular
spermatid head count was determined by removing the tunica albuginea and homogenizing the left testis in
phosphate-buffered saline containing 10% dimethyl sulfoxide. Homogenization-resistant spermatid nuclei were
counted with a hemacytometer.
Necropsies were performed on all core study animals. The heart, right kidney, liver, lung, right testis, and thymus
were weighed. Tissues for microscopic examination were fixed and preserved in 10% neutral buffered formalin
(except eyes were fixed in Davidson’s solution), processed and trimmed, embedded in paraffin, sectioned to a
thickness of 4 to 6 µm, and stained with hematoxylin and eosin. Complete histopathologic examinations were
performed on all core study vehicle control, 2, and 4 g/kg rats; vehicle control, 1, 2, and 4 g/kg mice; and all early
death animals. Tissues were examined in the remaining core study groups to a no-effect level. Right kidneys of
special study and core study rats were also examined for hyaline droplets using the Mallory Heidenhain technique.
Tissues examined microscopically are listed in Table 1.
2-year studies
Study Design
Groups of 50 male and 50 female rats and mice received β-myrcene in corn oil by gavage at doses of 0.25, 0.5,
and 1 g/kg body weight 5 days per week for 104 (female mice) or 105 weeks (rats and male mice). Groups of
50 male and 50 female vehicle control rats and mice received the corn oil vehicle alone.
Source and Specification of Animals
Male and female F344/N rats and B6C3F1 mice were obtained from Taconic Farms, Inc. (Germantown, NY), for
use in the 2-year studies. Rats were quarantined for 11 (males) or 12 (females) days, and mice were quarantined
for 13 (females) or 14 (males) days before the beginning of the studies. Five male and five female rats and mice
were randomly selected for parasite evaluation and gross observation of disease. Rats were 5 to 6 weeks old, and
β-Myrcene, NTP TR 557 30
NOT FOR DISTRIBUTION OR ATTRIBUTION Board Draft
mice were 6 to 7 weeks old at the beginning of the studies. The health of the animals was monitored during the
studies according to the protocols of the NTP Sentinel Animal Program (Appendix K).
Animal Maintenance
Male rats were housed three per cage; female rats and mice were housed five per cage, and male mice were housed
individually. Feed and water were available ad libitum. Cages and racks were rotated every 2 weeks. Further
details of animal maintenance are given in Table 1. Information on feed composition and contaminants is provided
in Appendix J.
Clinical Examinations and Pathology
All animals were observed twice daily. Body weights were recorded on study day 1, weekly for the first 13 weeks,
at 4-week intervals thereafter, and at study termination. Clinical findings were recorded at study week 5, at
4-week intervals thereafter, and at study termination.
Complete necropsies and microscopic examinations were performed on all rats and mice. At necropsy, all
organs and tissues were examined for grossly visible lesions, and all major tissues were fixed and preserved in
10% neutral buffered formalin (except eyes, which were fixed in Davidson’s solution before being transferred
to 10% neutral buffered formalin), processed and trimmed, embedded in paraffin, sectioned to a thickness of
4 to 6 µm, and stained with hematoxylin and eosin for microscopic examination. For all paired organs (e.g.,
adrenal gland, kidney, ovary), samples from each organ were examined. For extended evaluation of renal
proliferative lesions, kidneys were step sectioned at approximately 1 mm intervals and three to four additional
sections were obtained from each kidney. Tissues examined microscopically are listed in Table 1.
Microscopic evaluations were completed by the study laboratory pathologist, and the pathology data were entered
into the Toxicology Data Management System. The slides, paraffin blocks, and residual wet tissues were sent
to the NTP Archives for inventory, slide/block match, and wet tissue audit. The slides, individual animal data
records, and pathology tables were evaluated by an independent quality assessment laboratory. The individual
β-Myrcene, NTP TR 557
NOT FOR DISTRIBUTION OR ATTRIBUTIONBoard Draft
31
animal records and tables were compared for accuracy; the slide and tissue counts were verified, and the
histotechnique was evaluated. For the 2-year studies, a quality assessment pathologist evaluated slides from all
tumors and all potential target organs, which included the forestomach, kidney, liver, and spleen of rats and mice;
nose of rats and female mice; eye of male rats; thyroid gland and uterus of female rats; bone marrow, heart, lung,
and mesenteric lymph node of male and female mice; adrenal cortex, esophagus, mandibular lymph node, and
testis of male mice; and thymus of female mice.
The quality assessment report and the reviewed slides were submitted to the NTP Pathology Working Group
(PWG) coordinator, who reviewed the selected tissues and addressed any inconsistencies in the diagnoses made
by the laboratory and quality assessment pathologists. Representative histopathology slides containing examples
of lesions related to chemical administration, examples of disagreements in diagnoses between the laboratory and
quality assessment pathologists, or lesions of general interest were presented by the coordinator to the PWG for
review. The PWG consisted of the quality assessment pathologist and other pathologists experienced in rodent
toxicologic pathology. This group examined the tissues without any knowledge of dose groups or previously
rendered diagnoses. When the PWG consensus differed from the opinion of the laboratory pathologist, the
diagnosis was changed. Final diagnoses for reviewed lesions represent a consensus between the laboratory
pathologist, reviewing pathologist(s), and the PWG. Details of these review procedures have been described, in
part, by Maronpot and Boorman (1982) and Boorman et al. (1985). For subsequent analyses of the pathology data,
the decision of whether to evaluate the diagnosed lesions for each tissue type separately or combined was generally
based on the guidelines of McConnell et al. (1986).
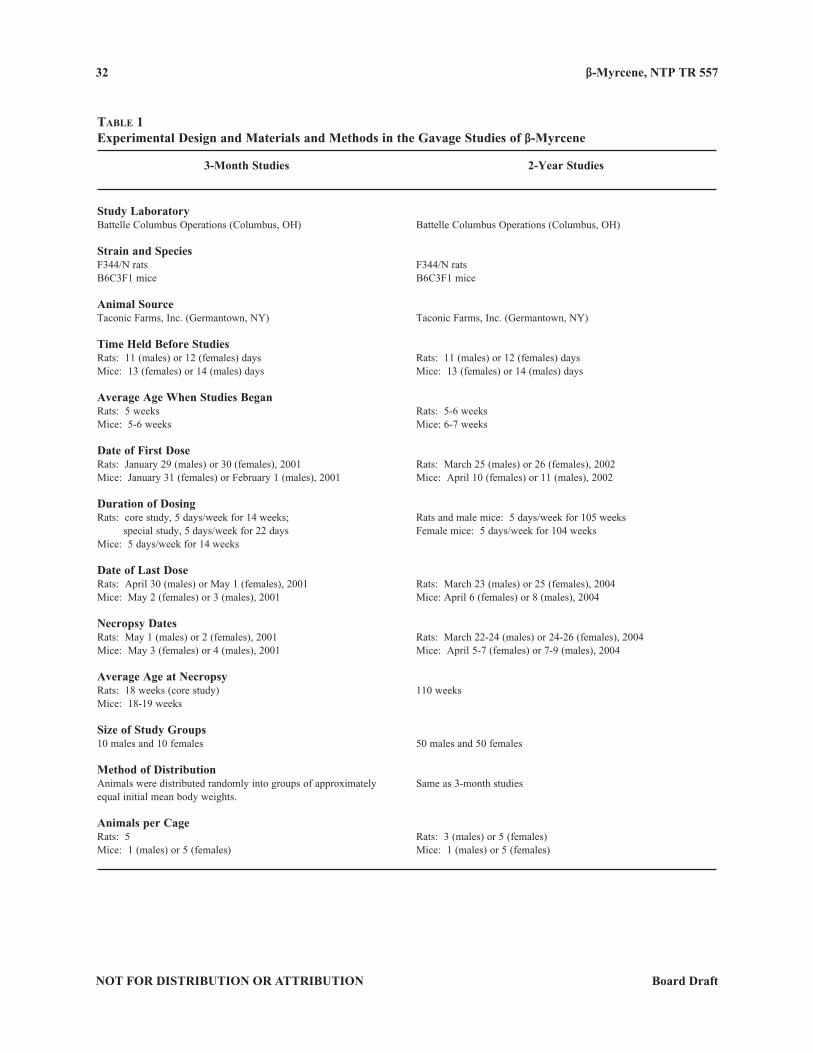
β-Myrcene, NTP TR 557 32
NOT FOR DISTRIBUTION OR ATTRIBUTION Board Draft
table 1Experimental Design and Materials and Methods in the Gavage Studies of β-Myrcene
3-Month Studies 2-Year Studies
Study LaboratoryBattelle Columbus Operations (Columbus, OH)
Strain and SpeciesF344/N ratsB6C3F1 mice
Animal SourceTaconic Farms, Inc. (Germantown, NY)
Time Held Before StudiesRats: 11 (males) or 12 (females) daysMice: 13 (females) or 14 (males) days
Average Age When Studies BeganRats: 5 weeksMice: 5-6 weeks
Date of First DoseRats: January 29 (males) or 30 (females), 2001Mice: January 31 (females) or February 1 (males), 2001
Duration of DosingRats: core study, 5 days/week for 14 weeks; special study, 5 days/week for 22 daysMice: 5 days/week for 14 weeks
Date of Last DoseRats: April 30 (males) or May 1 (females), 2001Mice: May 2 (females) or 3 (males), 2001
Necropsy DatesRats: May 1 (males) or 2 (females), 2001Mice: May 3 (females) or 4 (males), 2001
Average Age at NecropsyRats: 18 weeks (core study)Mice: 18-19 weeks
Size of Study Groups10 males and 10 females
Method of DistributionAnimals were distributed randomly into groups of approximately equal initial mean body weights.
Animals per CageRats: 5Mice: 1 (males) or 5 (females)
Battelle Columbus Operations (Columbus, OH)
F344/N ratsB6C3F1 mice
Taconic Farms, Inc. (Germantown, NY)
Rats: 11 (males) or 12 (females) daysMice: 13 (females) or 14 (males) days
Rats: 5-6 weeksMice: 6-7 weeks
Rats: March 25 (males) or 26 (females), 2002Mice: April 10 (females) or 11 (males), 2002
Rats and male mice: 5 days/week for 105 weeksFemale mice: 5 days/week for 104 weeks
Rats: March 23 (males) or 25 (females), 2004Mice: April 6 (females) or 8 (males), 2004
Rats: March 22-24 (males) or 24-26 (females), 2004Mice: April 5-7 (females) or 7-9 (males), 2004
110 weeks
50 males and 50 females
Same as 3-month studies
Rats: 3 (males) or 5 (females)Mice: 1 (males) or 5 (females)
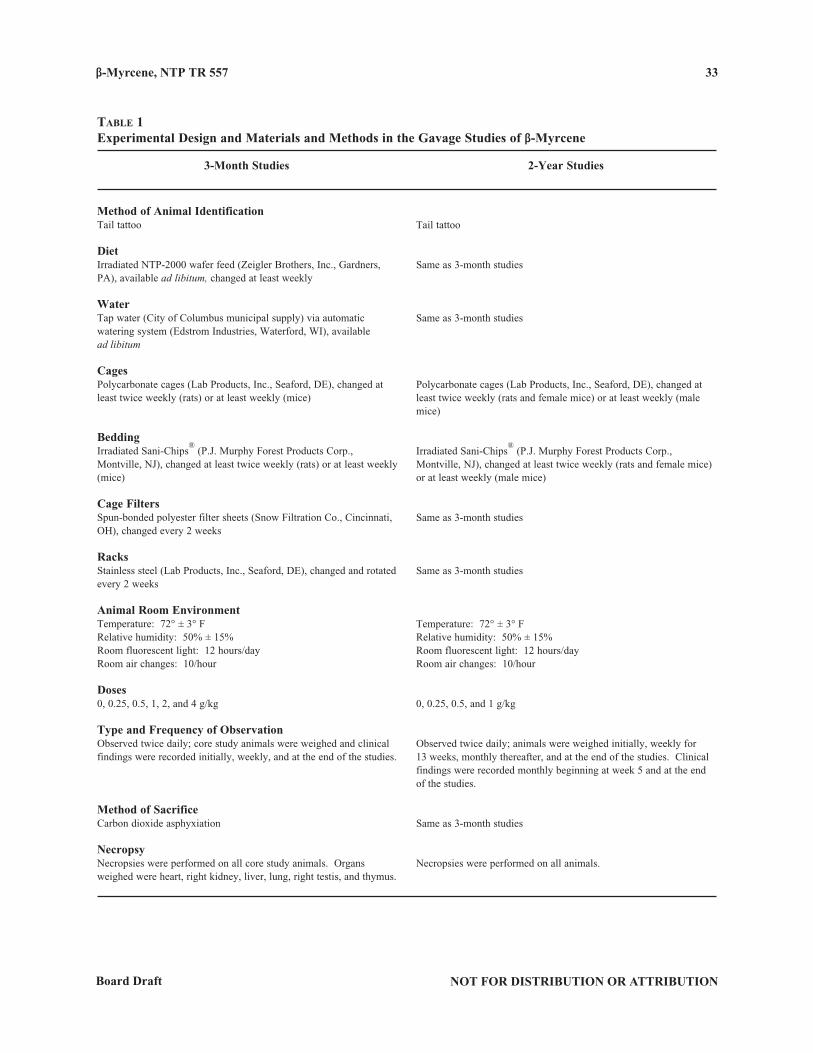
β-Myrcene, NTP TR 557
NOT FOR DISTRIBUTION OR ATTRIBUTIONBoard Draft
33
table 1Experimental Design and Materials and Methods in the Gavage Studies of β-Myrcene
3-Month Studies 2-Year Studies
Method of Animal IdentificationTail tattoo
DietIrradiated NTP-2000 wafer feed (Zeigler Brothers, Inc., Gardners, PA), available ad libitum, changed at least weekly
WaterTap water (City of Columbus municipal supply) via automatic watering system (Edstrom Industries, Waterford, WI), available ad libitum
CagesPolycarbonate cages (Lab Products, Inc., Seaford, DE), changed at least twice weekly (rats) or at least weekly (mice)
BeddingIrradiated Sani-Chips
® (P.J. Murphy Forest Products Corp.,
Montville, NJ), changed at least twice weekly (rats) or at least weekly (mice)
Cage FiltersSpun-bonded polyester filter sheets (Snow Filtration Co., Cincinnati, OH), changed every 2 weeks
RacksStainless steel (Lab Products, Inc., Seaford, DE), changed and rotated every 2 weeks
Animal Room EnvironmentTemperature: 72° ± 3° FRelative humidity: 50% ± 15%Room fluorescent light: 12 hours/dayRoom air changes: 10/hour
Doses0, 0.25, 0.5, 1, 2, and 4 g/kg
Type and Frequency of ObservationObserved twice daily; core study animals were weighed and clinical findings were recorded initially, weekly, and at the end of the studies.
Method of SacrificeCarbon dioxide asphyxiation
NecropsyNecropsies were performed on all core study animals. Organs weighed were heart, right kidney, liver, lung, right testis, and thymus.
Tail tattoo
Same as 3-month studies
Same as 3-month studies
Polycarbonate cages (Lab Products, Inc., Seaford, DE), changed at least twice weekly (rats and female mice) or at least weekly (male mice)
Irradiated Sani-Chips®
(P.J. Murphy Forest Products Corp., Montville, NJ), changed at least twice weekly (rats and female mice) or at least weekly (male mice)
Same as 3-month studies
Same as 3-month studies
Temperature: 72° ± 3° FRelative humidity: 50% ± 15%Room fluorescent light: 12 hours/dayRoom air changes: 10/hour
0, 0.25, 0.5, and 1 g/kg
Observed twice daily; animals were weighed initially, weekly for 13 weeks, monthly thereafter, and at the end of the studies. Clinical findings were recorded monthly beginning at week 5 and at the end of the studies.
Same as 3-month studies
Necropsies were performed on all animals.
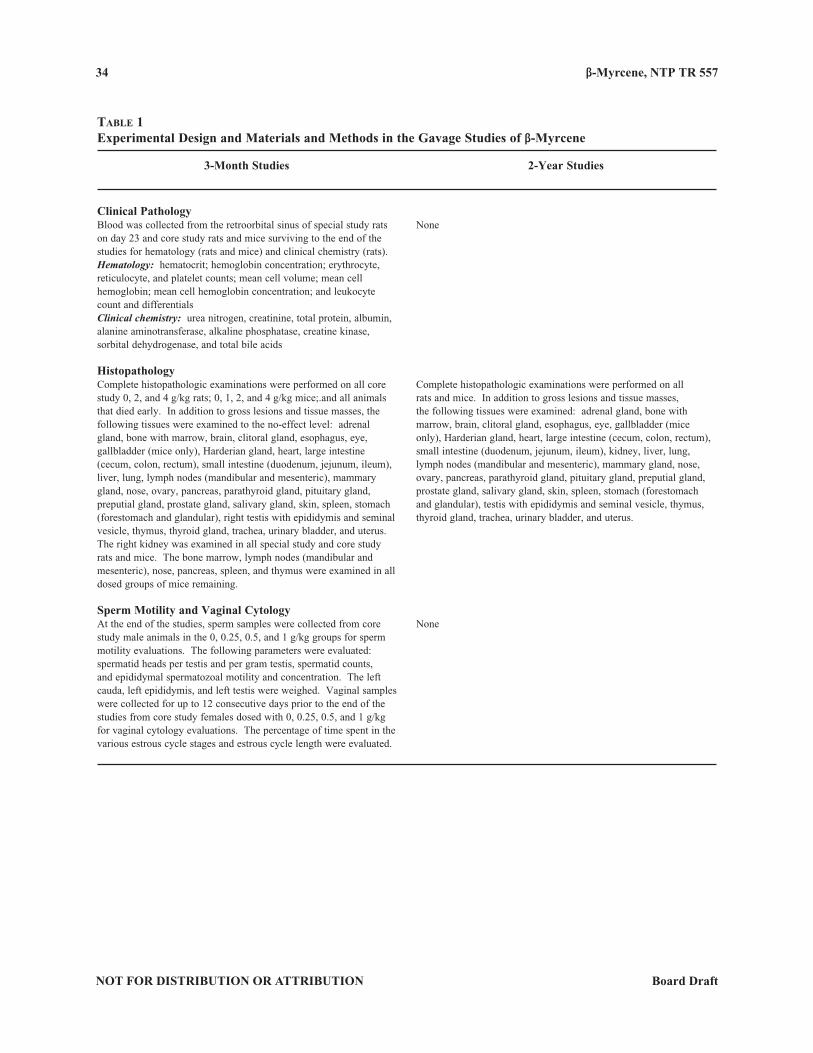
β-Myrcene, NTP TR 557 34
NOT FOR DISTRIBUTION OR ATTRIBUTION Board Draft
table 1Experimental Design and Materials and Methods in the Gavage Studies of β-Myrcene
3-Month Studies 2-Year Studies
Clinical PathologyBlood was collected from the retroorbital sinus of special study rats on day 23 and core study rats and mice surviving to the end of the studies for hematology (rats and mice) and clinical chemistry (rats).Hematology: hematocrit; hemoglobin concentration; erythrocyte, reticulocyte, and platelet counts; mean cell volume; mean cell hemoglobin; mean cell hemoglobin concentration; and leukocyte count and differentialsClinical chemistry: urea nitrogen, creatinine, total protein, albumin, alanine aminotransferase, alkaline phosphatase, creatine kinase, sorbital dehydrogenase, and total bile acids
HistopathologyComplete histopathologic examinations were performed on all core study 0, 2, and 4 g/kg rats; 0, 1, 2, and 4 g/kg mice;.and all animals that died early. In addition to gross lesions and tissue masses, the following tissues were examined to the no-effect level: adrenal gland, bone with marrow, brain, clitoral gland, esophagus, eye, gallbladder (mice only), Harderian gland, heart, large intestine (cecum, colon, rectum), small intestine (duodenum, jejunum, ileum), liver, lung, lymph nodes (mandibular and mesenteric), mammary gland, nose, ovary, pancreas, parathyroid gland, pituitary gland, preputial gland, prostate gland, salivary gland, skin, spleen, stomach (forestomach and glandular), right testis with epididymis and seminal vesicle, thymus, thyroid gland, trachea, urinary bladder, and uterus. The right kidney was examined in all special study and core study rats and mice. The bone marrow, lymph nodes (mandibular and mesenteric), nose, pancreas, spleen, and thymus were examined in all dosed groups of mice remaining.
Sperm Motility and Vaginal CytologyAt the end of the studies, sperm samples were collected from core study male animals in the 0, 0.25, 0.5, and 1 g/kg groups for sperm motility evaluations. The following parameters were evaluated: spermatid heads per testis and per gram testis, spermatid counts, and epididymal spermatozoal motility and concentration. The left cauda, left epididymis, and left testis were weighed. Vaginal samples were collected for up to 12 consecutive days prior to the end of the studies from core study females dosed with 0, 0.25, 0.5, and 1 g/kg for vaginal cytology evaluations. The percentage of time spent in the various estrous cycle stages and estrous cycle length were evaluated.
None
Complete histopathologic examinations were performed on all rats and mice. In addition to gross lesions and tissue masses, the following tissues were examined: adrenal gland, bone with marrow, brain, clitoral gland, esophagus, eye, gallbladder (mice only), Harderian gland, heart, large intestine (cecum, colon, rectum), small intestine (duodenum, jejunum, ileum), kidney, liver, lung, lymph nodes (mandibular and mesenteric), mammary gland, nose, ovary, pancreas, parathyroid gland, pituitary gland, preputial gland, prostate gland, salivary gland, skin, spleen, stomach (forestomach and glandular), testis with epididymis and seminal vesicle, thymus, thyroid gland, trachea, urinary bladder, and uterus.
None
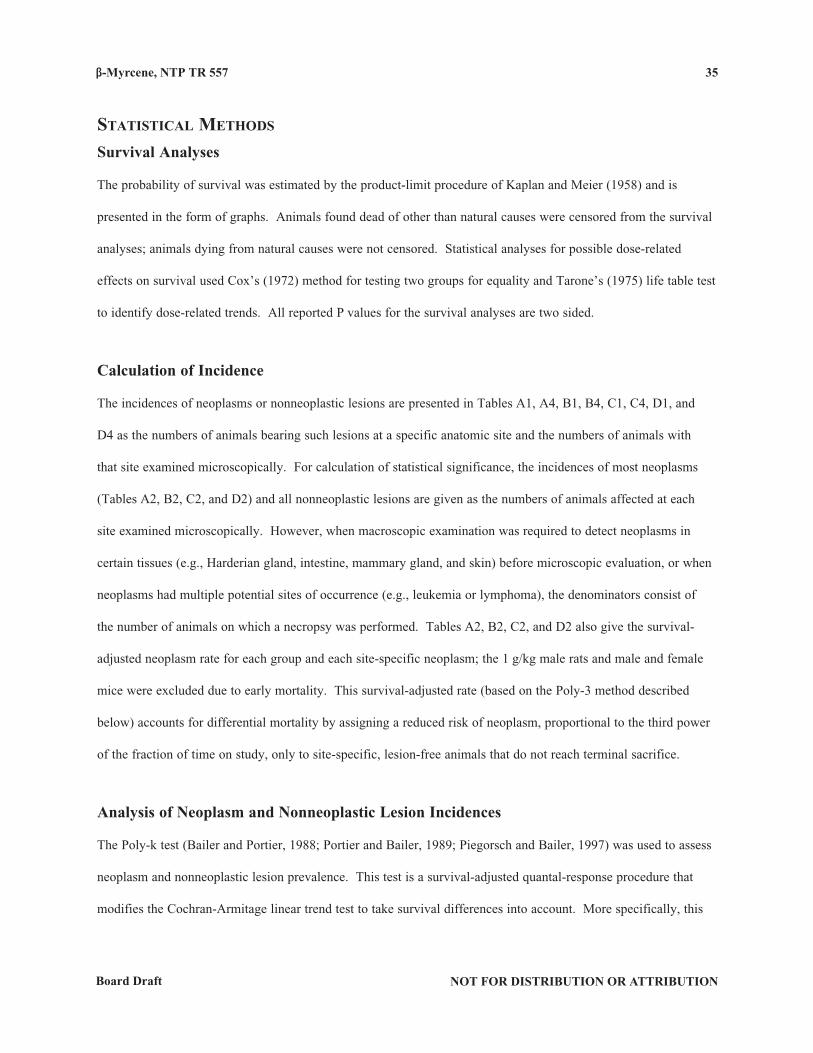
β-Myrcene, NTP TR 557
NOT FOR DISTRIBUTION OR ATTRIBUTIONBoard Draft
35
statistical methods
Survival Analyses
The probability of survival was estimated by the product-limit procedure of Kaplan and Meier (1958) and is
presented in the form of graphs. Animals found dead of other than natural causes were censored from the survival
analyses; animals dying from natural causes were not censored. Statistical analyses for possible dose-related
effects on survival used Cox’s (1972) method for testing two groups for equality and Tarone’s (1975) life table test
to identify dose-related trends. All reported P values for the survival analyses are two sided.
Calculation of Incidence
The incidences of neoplasms or nonneoplastic lesions are presented in Tables A1, A4, B1, B4, C1, C4, D1, and
D4 as the numbers of animals bearing such lesions at a specific anatomic site and the numbers of animals with
that site examined microscopically. For calculation of statistical significance, the incidences of most neoplasms
(Tables A2, B2, C2, and D2) and all nonneoplastic lesions are given as the numbers of animals affected at each
site examined microscopically. However, when macroscopic examination was required to detect neoplasms in
certain tissues (e.g., Harderian gland, intestine, mammary gland, and skin) before microscopic evaluation, or when
neoplasms had multiple potential sites of occurrence (e.g., leukemia or lymphoma), the denominators consist of
the number of animals on which a necropsy was performed. Tables A2, B2, C2, and D2 also give the survival-
adjusted neoplasm rate for each group and each site-specific neoplasm; the 1 g/kg male rats and male and female
mice were excluded due to early mortality. This survival-adjusted rate (based on the Poly-3 method described
below) accounts for differential mortality by assigning a reduced risk of neoplasm, proportional to the third power
of the fraction of time on study, only to site-specific, lesion-free animals that do not reach terminal sacrifice.
Analysis of Neoplasm and Nonneoplastic Lesion Incidences
The Poly-k test (Bailer and Portier, 1988; Portier and Bailer, 1989; Piegorsch and Bailer, 1997) was used to assess
neoplasm and nonneoplastic lesion prevalence. This test is a survival-adjusted quantal-response procedure that
modifies the Cochran-Armitage linear trend test to take survival differences into account. More specifically, this
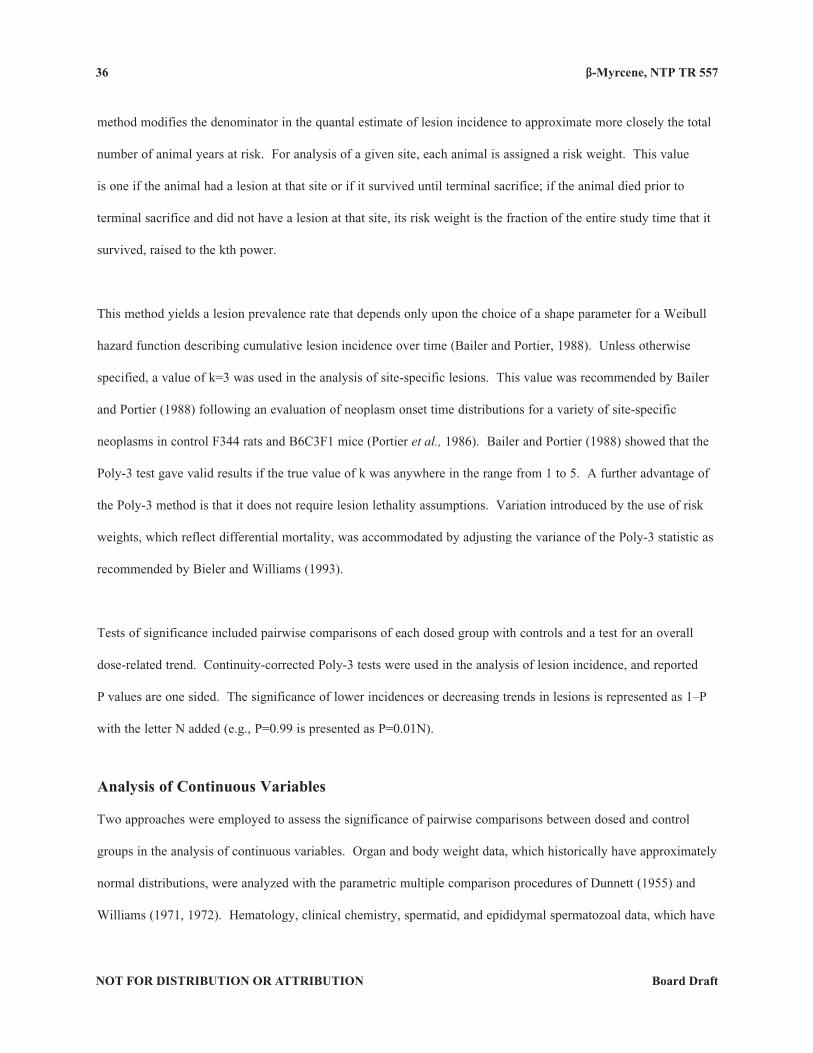
β-Myrcene, NTP TR 557 36
NOT FOR DISTRIBUTION OR ATTRIBUTION Board Draft
method modifies the denominator in the quantal estimate of lesion incidence to approximate more closely the total
number of animal years at risk. For analysis of a given site, each animal is assigned a risk weight. This value
is one if the animal had a lesion at that site or if it survived until terminal sacrifice; if the animal died prior to
terminal sacrifice and did not have a lesion at that site, its risk weight is the fraction of the entire study time that it
survived, raised to the kth power.
This method yields a lesion prevalence rate that depends only upon the choice of a shape parameter for a Weibull
hazard function describing cumulative lesion incidence over time (Bailer and Portier, 1988). Unless otherwise
specified, a value of k=3 was used in the analysis of site-specific lesions. This value was recommended by Bailer
and Portier (1988) following an evaluation of neoplasm onset time distributions for a variety of site-specific
neoplasms in control F344 rats and B6C3F1 mice (Portier et al., 1986). Bailer and Portier (1988) showed that the
Poly-3 test gave valid results if the true value of k was anywhere in the range from 1 to 5. A further advantage of
the Poly-3 method is that it does not require lesion lethality assumptions. Variation introduced by the use of risk
weights, which reflect differential mortality, was accommodated by adjusting the variance of the Poly-3 statistic as
recommended by Bieler and Williams (1993).
Tests of significance included pairwise comparisons of each dosed group with controls and a test for an overall
dose-related trend. Continuity-corrected Poly-3 tests were used in the analysis of lesion incidence, and reported
P values are one sided. The significance of lower incidences or decreasing trends in lesions is represented as 1–P
with the letter N added (e.g., P=0.99 is presented as P=0.01N).
Analysis of Continuous Variables
Two approaches were employed to assess the significance of pairwise comparisons between dosed and control
groups in the analysis of continuous variables. Organ and body weight data, which historically have approximately
normal distributions, were analyzed with the parametric multiple comparison procedures of Dunnett (1955) and
Williams (1971, 1972). Hematology, clinical chemistry, spermatid, and epididymal spermatozoal data, which have
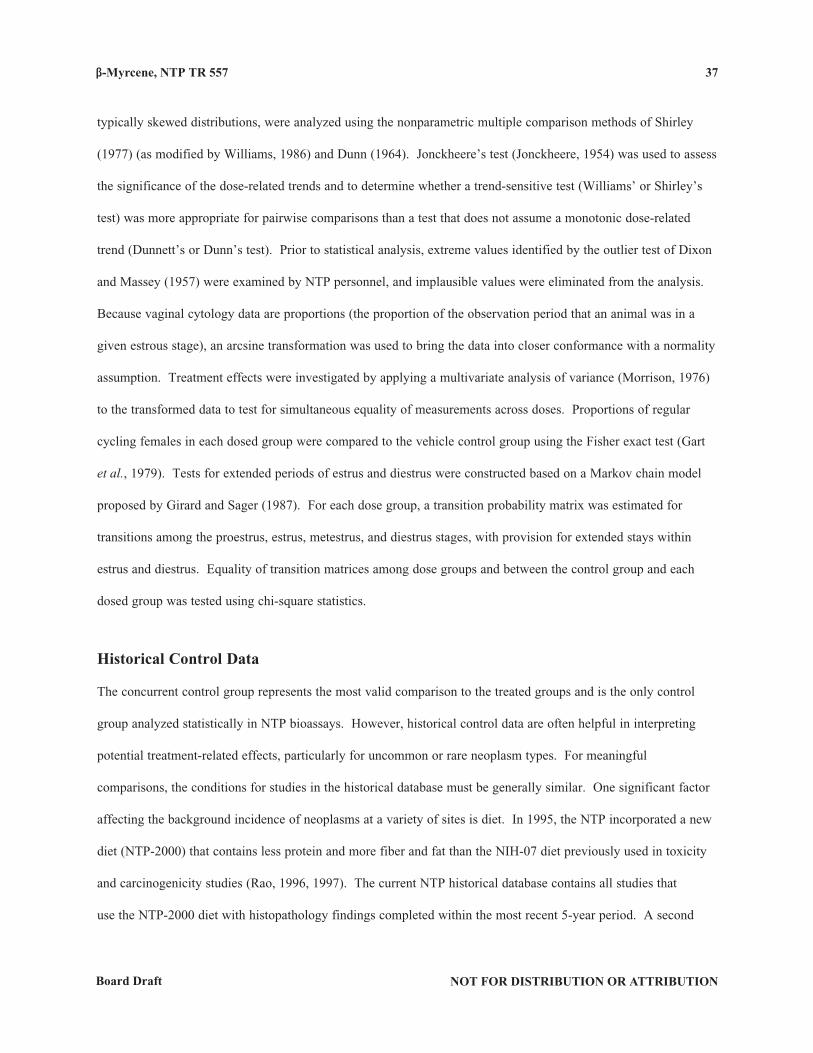
β-Myrcene, NTP TR 557
NOT FOR DISTRIBUTION OR ATTRIBUTIONBoard Draft
37
typically skewed distributions, were analyzed using the nonparametric multiple comparison methods of Shirley
(1977) (as modified by Williams, 1986) and Dunn (1964). Jonckheere’s test (Jonckheere, 1954) was used to assess
the significance of the dose-related trends and to determine whether a trend-sensitive test (Williams’ or Shirley’s
test) was more appropriate for pairwise comparisons than a test that does not assume a monotonic dose-related
trend (Dunnett’s or Dunn’s test). Prior to statistical analysis, extreme values identified by the outlier test of Dixon
and Massey (1957) were examined by NTP personnel, and implausible values were eliminated from the analysis.
Because vaginal cytology data are proportions (the proportion of the observation period that an animal was in a
given estrous stage), an arcsine transformation was used to bring the data into closer conformance with a normality
assumption. Treatment effects were investigated by applying a multivariate analysis of variance (Morrison, 1976)
to the transformed data to test for simultaneous equality of measurements across doses. Proportions of regular
cycling females in each dosed group were compared to the vehicle control group using the Fisher exact test (Gart
et al., 1979). Tests for extended periods of estrus and diestrus were constructed based on a Markov chain model
proposed by Girard and Sager (1987). For each dose group, a transition probability matrix was estimated for
transitions among the proestrus, estrus, metestrus, and diestrus stages, with provision for extended stays within
estrus and diestrus. Equality of transition matrices among dose groups and between the control group and each
dosed group was tested using chi-square statistics.
Historical Control Data
The concurrent control group represents the most valid comparison to the treated groups and is the only control
group analyzed statistically in NTP bioassays. However, historical control data are often helpful in interpreting
potential treatment-related effects, particularly for uncommon or rare neoplasm types. For meaningful
comparisons, the conditions for studies in the historical database must be generally similar. One significant factor
affecting the background incidence of neoplasms at a variety of sites is diet. In 1995, the NTP incorporated a new
diet (NTP-2000) that contains less protein and more fiber and fat than the NIH-07 diet previously used in toxicity
and carcinogenicity studies (Rao, 1996, 1997). The current NTP historical database contains all studies that
use the NTP-2000 diet with histopathology findings completed within the most recent 5-year period. A second
β-Myrcene, NTP TR 557 38
NOT FOR DISTRIBUTION OR ATTRIBUTION Board Draft
potential source of variability is route of administration. In general, the historical database for a given study will
include studies using the same route of administration, and the overall incidences of neoplasms for all routes of
administration are included for comparison, including the present study.
Quality assurance methods
The 3-month and 2-year studies were conducted in compliance with Food and Drug Administration Good
Laboratory Practice Regulations (21 CFR, Part 58). In addition, as records from the 2-year studies were submitted
to the NTP Archives, these studies were audited retrospectively by an independent quality assurance contractor.
Separate audits covered completeness and accuracy of the pathology data, pathology specimens, final pathology
tables, and a draft of this NTP Technical Report. Audit procedures and findings are presented in the reports
and are on file at NIEHS. The audit findings were reviewed and assessed by NTP staff, and all comments were
resolved or otherwise addressed during the preparation of this Technical Report.
Genetic toxicoloGy
The genetic toxicity of β-myrcene was assessed by testing the ability of the chemical to induce mutations in
various strains of Salmonella typhimurium and Escherichia coli and increases in the frequency of micronucleated
erythrocytes in mouse peripheral blood. Micronuclei (literally “small nuclei” or Howell-Jolly bodies) are
biomarkers of induced structural or numerical chromosomal alterations and are formed when acentric fragments
or whole chromosomes fail to incorporate into either of two daughter nuclei during cell division (Schmid, 1975;
Heddle et al., 1983). The protocols for these studies and the results are given in Appendix E.
The genetic toxicity studies have evolved from an earlier effort by the NTP to develop a comprehensive database
permitting a critical anticipation of a chemical’s carcinogenicity in experimental animals based on numerous
considerations, including the molecular structure of the chemical and its observed effects in short-term in vitro and
in vivo genetic toxicity tests (structure-activity relationships). The short-term tests were originally developed to
β-Myrcene, NTP TR 557
NOT FOR DISTRIBUTION OR ATTRIBUTIONBoard Draft
39
clarify proposed mechanisms of chemical-induced DNA damage based on the relationship between electrophilicity
and mutagenicity (Miller and Miller, 1977) and the somatic mutation theory of cancer (Straus, 1981; Crawford,
1985). However, it should be noted that not all cancers arise through genotoxic mechanisms.
DNA reactivity combined with Salmonella mutagenicity is highly correlated with induction of carcinogenicity in
multiple species/sexes of rodents and at multiple tissue sites (Ashby and Tennant, 1991). A positive response in
the Salmonella test was shown to be the most predictive in vitro indicator for rodent carcinogenicity (89% of the
Salmonella mutagens are rodent carcinogens) (Tennant et al., 1987; Zeiger et al., 1990). Additionally, no battery
of tests that included the Salmonella test improved the predictivity of the Salmonella test alone. However, these
other tests can provide useful information on the types of DNA and chromosomal damage induced by the chemical
under investigation.
The predictivity for carcinogenicity of a positive response in acute in vivo bone marrow chromosome aberration or
micronucleus tests appears to be less than that in the Salmonella test (Shelby et al., 1993; Shelby and Witt, 1995).
However, clearly positive results in long-term peripheral blood micronucleus tests have high predictivity for
rodent carcinogenicity (Witt et al., 2000); negative results in this assay do not correlate well with either negative
or positive results in rodent carcinogenicity studies. Because of the theoretical and observed associations between
induced genetic damage and adverse effects in somatic and germ cells, the determination of in vivo genetic effects
is important to the overall understanding of the risks associated with exposure to a particular chemical. Most
organic chemicals that are identified by the International Agency for Research on Cancer as human carcinogens,
other than hormones, are genotoxic. The vast majority of these are detected by both the Salmonella assay and
rodent bone marrow cytogenetics tests (Shelby, 1988; Shelby and Zeiger, 1990).

β-Myrcene, NTP TR 557 40
NOT FOR DISTRIBUTION OR ATTRIBUTION Board Draft
NOT FOR DISTRIBUTION OR ATTRIBUTIONBoard Draft NOT FOR DISTRIBUTION OR ATTRIBUTIONBoard Draft
4141
RESULTS
Rats
3‑Month study
Male and female rats administered 0.25 g/kg and females administered 0.5 g/kg or less survived until the end of
the study (Table 2). All core study female rats in the 4 g/kg group died within the first week of the study; all 4 g/
kg male rats died within 4 days of dosing except for one male that died on study day 11. One (0.5 and 1 g/kg) and
two (2 g/kg) males died before the end of the study, and one (1 g/kg) and four (2 g/kg) females died before the
end of the study. Vehicle control rats survived to the end of the study. Final mean body weights and mean body
weight gains of males and females administered 0.5 g/kg or greater were significantly less than those of the vehicle
controls. Except for lesion incidence data in groups administered 2 g/kg or less, data from rats that died early
were excluded from the analysis and summary tables. Similarly, survival of special study rats in the 0.25, 0.5,
and 1 g/kg groups of both sexes was similar to that of the vehicle controls. Survival of special study rats in the
2 g/kg group was significantly decreased during the third week of the study. Special study male and female rats
in the 4 g/kg groups died by the end of the first week; their kidneys were not evaluated. No dose-related clinical
findings were noted in animals surviving to the end of study. The dose-related clinical findings that occurred in
animals that died early (some by moribund sacrifice) included thinness, lethargy, abnormal breathing, and ruffled
fur. The cause of death of animals that died early was not determined. No clinical findings were seen in either sex
receiving 1 g/kg or less.
In special study rats on day 23, a decrease (approximately 25%) in leukocyte counts, characterized by a decrease
in lymphocytes, occurred in 2 g/kg males and females and was consistent with a transient, physiological
(corticosteroid-induced-type) response (Tables 3 and F1). Such a response is consistent with the decreases in
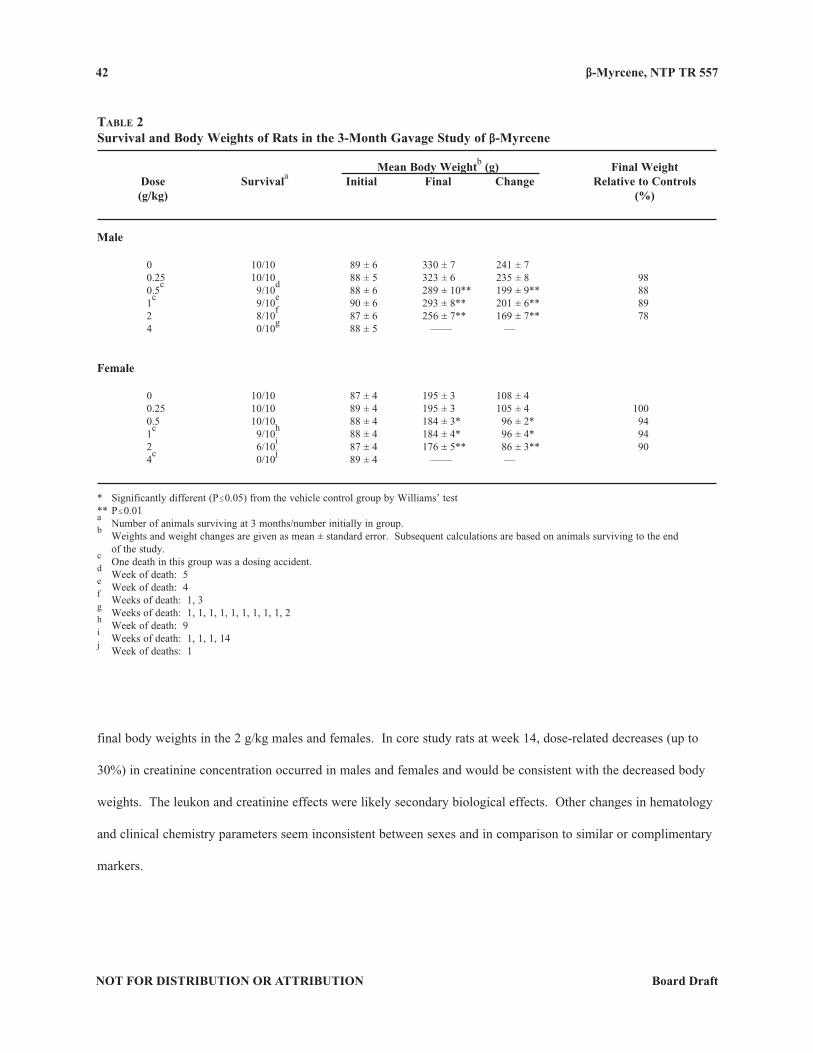
β-Myrcene, NTP TR 557 42
NOT FOR DISTRIBUTION OR ATTRIBUTION Board Draft
table 2Survival and Body Weights of Rats in the 3-Month Gavage Study of β-Myrcene
Mean Body Weightb (g) Final Weight Dose Survivala Initial Final Change Relative to Controls (g/kg) (%)
Male
0 10/10 89 ± 6 330 ± 7 241 ± 7 0.25 10/10 88 ± 5 323 ± 6 235 ± 8 98 0.5
c 9/10
d 88 ± 6 289 ± 10** 199 ± 9** 88
1c 9/10
e 90 ± 6 293 ± 8** 201 ± 6** 89
2 8/10f 87 ± 6 256 ± 7** 169 ± 7** 78
4 0/10g 88 ± 5 — — —
Female
0 10/10 87 ± 4 195 ± 3 108 ± 4 0.25 10/10 89 ± 4 195 ± 3 105 ± 4 100 0.5 10/10 88 ± 4 184 ± 3* 96 ± 2* 94 1
c 9/10
h 88 ± 4 184 ± 4* 96 ± 4* 94
2 6/10i 87 ± 4 176 ± 5** 86 ± 3** 90
4c 0/10
j 89 ± 4 — — —
* Significantly different (P#0.05) from the vehicle control group by Williams’ test** P#0.01a Number of animals surviving at 3 months/number initially in group.
b Weights and weight changes are given as mean ± standard error. Subsequent calculations are based on animals surviving to the end
of the study.c One death in this group was a dosing accident.
d Week of death: 5
e Week of death: 4
f Weeks of death: 1, 3
g Weeks of death: 1, 1, 1, 1, 1, 1, 1, 1, 1, 2
h Week of death: 9
i Weeks of death: 1, 1, 1, 14
j Week of deaths: 1
final body weights in the 2 g/kg males and females. In core study rats at week 14, dose-related decreases (up to
30%) in creatinine concentration occurred in males and females and would be consistent with the decreased body
weights. The leukon and creatinine effects were likely secondary biological effects. Other changes in hematology
and clinical chemistry parameters seem inconsistent between sexes and in comparison to similar or complimentary
markers.
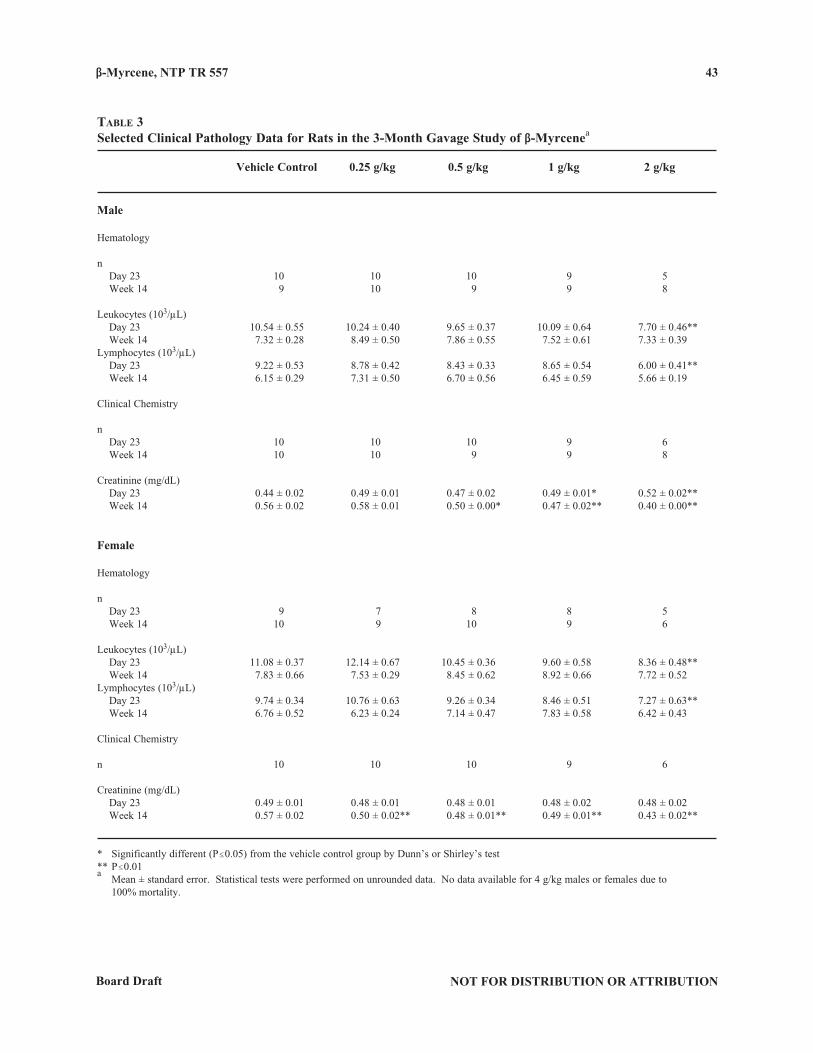
β-Myrcene, NTP TR 557 43
NOT FOR DISTRIBUTION OR ATTRIBUTIONBoard Draft
table 3Selected Clinical Pathology Data for Rats in the 3-Month Gavage Study of β-Myrcenea
Vehicle Control 0.25 g/kg 0.5 g/kg 1 g/kg 2 g/kg
Male
Hematology
n Day 23 10 10 10 9 5 Week 14 9 10 9 9 8
Leukocytes (103/µL) Day 23 10.54 ± 0.55 10.24 ± 0.40 9.65 ± 0.37 10.09 ± 0.64 7.70 ± 0.46** Week 14 7.32 ± 0.28 8.49 ± 0.50 7.86 ± 0.55 7.52 ± 0.61 7.33 ± 0.39Lymphocytes (103/µL) Day 23 9.22 ± 0.53 8.78 ± 0.42 8.43 ± 0.33 8.65 ± 0.54 6.00 ± 0.41** Week 14 6.15 ± 0.29 7.31 ± 0.50 6.70 ± 0.56 6.45 ± 0.59 5.66 ± 0.19
Clinical Chemistry
n Day 23 10 10 10 9 6 Week 14 10 10 9 9 8
Creatinine (mg/dL) Day 23 0.44 ± 0.02 0.49 ± 0.01 0.47 ± 0.02 0.49 ± 0.01* 0.52 ± 0.02** Week 14 0.56 ± 0.02 0.58 ± 0.01 0.50 ± 0.00* 0.47 ± 0.02** 0.40 ± 0.00**
Female
Hematology
n Day 23 9 7 8 8 5 Week 14 10 9 10 9 6
Leukocytes (103/µL) Day 23 11.08 ± 0.37 12.14 ± 0.67 10.45 ± 0.36 9.60 ± 0.58 8.36 ± 0.48** Week 14 7.83 ± 0.66 7.53 ± 0.29 8.45 ± 0.62 8.92 ± 0.66 7.72 ± 0.52Lymphocytes (103/µL) Day 23 9.74 ± 0.34 10.76 ± 0.63 9.26 ± 0.34 8.46 ± 0.51 7.27 ± 0.63** Week 14 6.76 ± 0.52 6.23 ± 0.24 7.14 ± 0.47 7.83 ± 0.58 6.42 ± 0.43
Clinical Chemistry
n 10 10 10 9 6
Creatinine (mg/dL) Day 23 0.49 ± 0.01 0.48 ± 0.01 0.48 ± 0.01 0.48 ± 0.02 0.48 ± 0.02 Week 14 0.57 ± 0.02 0.50 ± 0.02** 0.48 ± 0.01** 0.49 ± 0.01** 0.43 ± 0.02**
* Significantly different (P#0.05) from the vehicle control group by Dunn’s or Shirley’s test** P#0.01a
Mean ± standard error. Statistical tests were performed on unrounded data. No data available for 4 g/kg males or females due to 100% mortality.
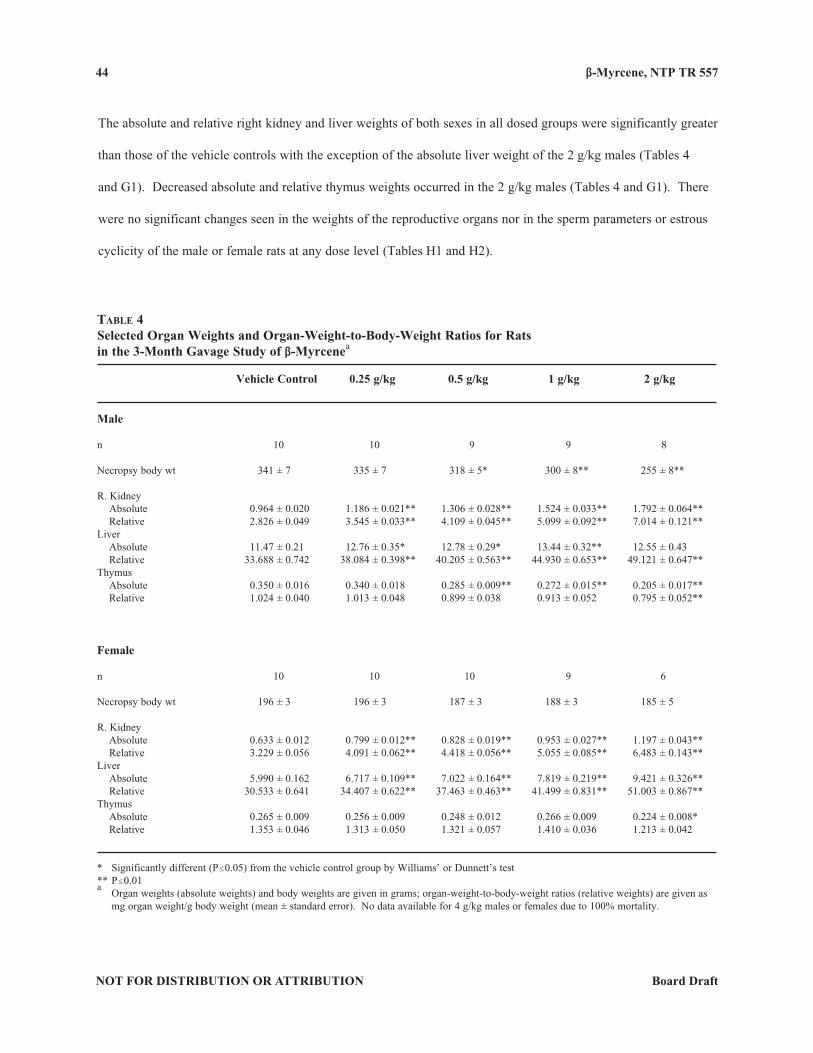
β-Myrcene, NTP TR 557 44
NOT FOR DISTRIBUTION OR ATTRIBUTION Board Draft
The absolute and relative right kidney and liver weights of both sexes in all dosed groups were significantly greater
than those of the vehicle controls with the exception of the absolute liver weight of the 2 g/kg males (Tables 4
and G1). Decreased absolute and relative thymus weights occurred in the 2 g/kg males (Tables 4 and G1). There
were no significant changes seen in the weights of the reproductive organs nor in the sperm parameters or estrous
cyclicity of the male or female rats at any dose level (Tables H1 and H2).
table 4Selected Organ Weights and Organ-Weight-to-Body-Weight Ratios for Ratsin the 3-Month Gavage Study of β-Myrcenea
Vehicle Control 0.25 g/kg 0.5 g/kg 1 g/kg 2 g/kg
Male
n 10 10 9 9 8
Necropsy body wt 341 ± 7 335 ± 7 318 ± 5* 300 ± 8** 255 ± 8**
R. Kidney Absolute 0.964 ± 0.020 1.186 ± 0.021** 1.306 ± 0.028** 1.524 ± 0.033** 1.792 ± 0.064** Relative 2.826 ± 0.049 3.545 ± 0.033** 4.109 ± 0.045** 5.099 ± 0.092** 7.014 ± 0.121**Liver Absolute 11.47 ± 0.21 12.76 ± 0.35* 12.78 ± 0.29* 13.44 ± 0.32** 12.55 ± 0.43 Relative 33.688 ± 0.742 38.084 ± 0.398** 40.205 ± 0.563** 44.930 ± 0.653** 49.121 ± 0.647**Thymus Absolute 0.350 ± 0.016 0.340 ± 0.018 0.285 ± 0.009** 0.272 ± 0.015** 0.205 ± 0.017** Relative 1.024 ± 0.040 1.013 ± 0.048 0.899 ± 0.038 0.913 ± 0.052 0.795 ± 0.052**
Female
n 10 10 10 9 6
Necropsy body wt 196 ± 3 196 ± 3 187 ± 3 188 ± 3 185 ± 5
R. Kidney Absolute 0.633 ± 0.012 0.799 ± 0.012** 0.828 ± 0.019** 0.953 ± 0.027** 1.197 ± 0.043** Relative 3.229 ± 0.056 4.091 ± 0.062** 4.418 ± 0.056** 5.055 ± 0.085** 6.483 ± 0.143**Liver Absolute 5.990 ± 0.162 6.717 ± 0.109** 7.022 ± 0.164** 7.819 ± 0.219** 9.421 ± 0.326** Relative 30.533 ± 0.641 34.407 ± 0.622** 37.463 ± 0.463** 41.499 ± 0.831** 51.003 ± 0.867**Thymus Absolute 0.265 ± 0.009 0.256 ± 0.009 0.248 ± 0.012 0.266 ± 0.009 0.224 ± 0.008* Relative 1.353 ± 0.046 1.313 ± 0.050 1.321 ± 0.057 1.410 ± 0.036 1.213 ± 0.042
* Significantly different (P#0.05) from the vehicle control group by Williams’ or Dunnett’s test** P#0.01a Organ weights (absolute weights) and body weights are given in grams; organ-weight-to-body-weight ratios (relative weights) are given as
mg organ weight/g body weight (mean ± standard error). No data available for 4 g/kg males or females due to 100% mortality.
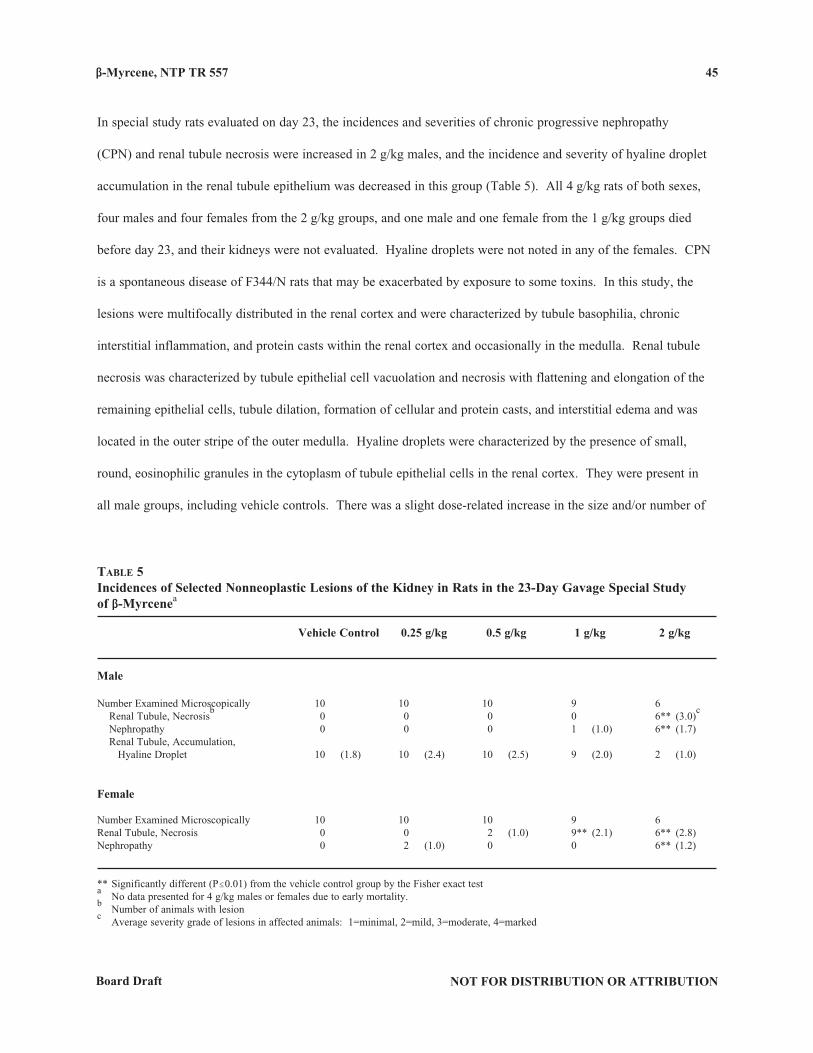
β-Myrcene, NTP TR 557
NOT FOR DISTRIBUTION OR ATTRIBUTIONBoard Draft
45
In special study rats evaluated on day 23, the incidences and severities of chronic progressive nephropathy
(CPN) and renal tubule necrosis were increased in 2 g/kg males, and the incidence and severity of hyaline droplet
accumulation in the renal tubule epithelium was decreased in this group (Table 5). All 4 g/kg rats of both sexes,
four males and four females from the 2 g/kg groups, and one male and one female from the 1 g/kg groups died
before day 23, and their kidneys were not evaluated. Hyaline droplets were not noted in any of the females. CPN
is a spontaneous disease of F344/N rats that may be exacerbated by exposure to some toxins. In this study, the
lesions were multifocally distributed in the renal cortex and were characterized by tubule basophilia, chronic
interstitial inflammation, and protein casts within the renal cortex and occasionally in the medulla. Renal tubule
necrosis was characterized by tubule epithelial cell vacuolation and necrosis with flattening and elongation of the
remaining epithelial cells, tubule dilation, formation of cellular and protein casts, and interstitial edema and was
located in the outer stripe of the outer medulla. Hyaline droplets were characterized by the presence of small,
round, eosinophilic granules in the cytoplasm of tubule epithelial cells in the renal cortex. They were present in
all male groups, including vehicle controls. There was a slight dose-related increase in the size and/or number of
table 5Incidences of Selected Nonneoplastic Lesions of the Kidney in Rats in the 23-Day Gavage Special Study of β-Myrcenea
Vehicle Control 0.25 g/kg 0.5 g/kg 1 g/kg 2 g/kg
Male
Number Examined Microscopically 10 10 10 9 6 Renal Tubule, Necrosis
b 0 0 0 0 6** (3.0)
c
Nephropathy 0 0 0 1 (1.0) 6** (1.7) Renal Tubule, Accumulation, Hyaline Droplet 10 (1.8) 10 (2.4) 10 (2.5) 9 (2.0) 2 (1.0)
Female
Number Examined Microscopically 10 10 10 9 6Renal Tubule, Necrosis 0 0 2 (1.0) 9** (2.1) 6** (2.8)Nephropathy 0 2 (1.0) 0 0 6** (1.2)
** Significantly different (P#0.01) from the vehicle control group by the Fisher exact testa No data presented for 4 g/kg males or females due to early mortality.
b Number of animals with lesion
c Average severity grade of lesions in affected animals: 1=minimal, 2=mild, 3=moderate, 4=marked
β-Myrcene, NTP TR 557 46
NOT FOR DISTRIBUTION OR ATTRIBUTION Board Draft
hyaline droplets in the 0.25, 0.5, and 1 g/kg groups relative to the vehicle controls. However, in 2 g/kg males, the
incidence of hyaline droplet accumulation was decreased and the droplets were typically fewer, smaller, and more
uniformly round than those in vehicle controls; in vehicle controls and 0.25, 0.5, and 1 g/kg groups, the droplets
were often elliptical or brick shaped.
The renal response to β-myrcene administration is complex, having multiple manifestations. At the end of the
3-month study, the only treatment-related gross lesion was a granular appearance of the kidney in the core study
2 g/kg males. Microscopically, the incidences of renal tubule necrosis were significantly increased in all dosed
groups of males and females, but this lesion did not occur in the vehicle controls (Table 6). Slight increases in
the incidence of CPN in 1 g/kg females and the severity of CPN in 2 g/kg males were found as well as significant
increases in the incidences of nephrosis in 1 and 2 g/kg males and females. Additionally, there was an increase
in the severity of nephrosis in the 2 g/kg males. Renal tubule necrosis was characterized by tubule epithelial cell
vacuolation and necrosis (evidenced by occasional karyorrhectic and karyolytic tubule epithelium) with flattening
and elongation of the remaining epithelial cells, tubule dilation, and interstitial edema. Nephrosis was originally
diagnosed in the 2-year study of β-myrcene in rats as a constellation of related lesions (see description in the
results section for the 2-year study in rats). An early nephrosis lesion, characterized by nuclear enlargement of the
renal tubule cells and, in the more severe cases, minimal dilation of the tubules, was subsequently identified in the
subchronic study during a reexamination of the slides. The nephrosis was restricted to the outer stripe of the outer
medulla. CPN was characterized as described for the special study animals on day 23.
Treatment-related increases in the incidences and severities of hyaline droplet accumulation were found in 0.25,
0.5, and 1 g/kg males; hyaline droplet accumulation was not observed in the 2 g/kg males. No evidence of hyaline
droplet accumulation was found in any female rats. In males, the severity of the hyaline droplet accumulation
was greatest in the 0.5 g/kg group, but the severity of nephrosis was greatest at 2 g/kg. In the core study, the term
hyaline droplet accumulation reflected not only an increase in the number of cells containing hyaline droplets
but also a change in the normal pattern of the hyaline droplets in the proximal renal tubule epithelial cells and the
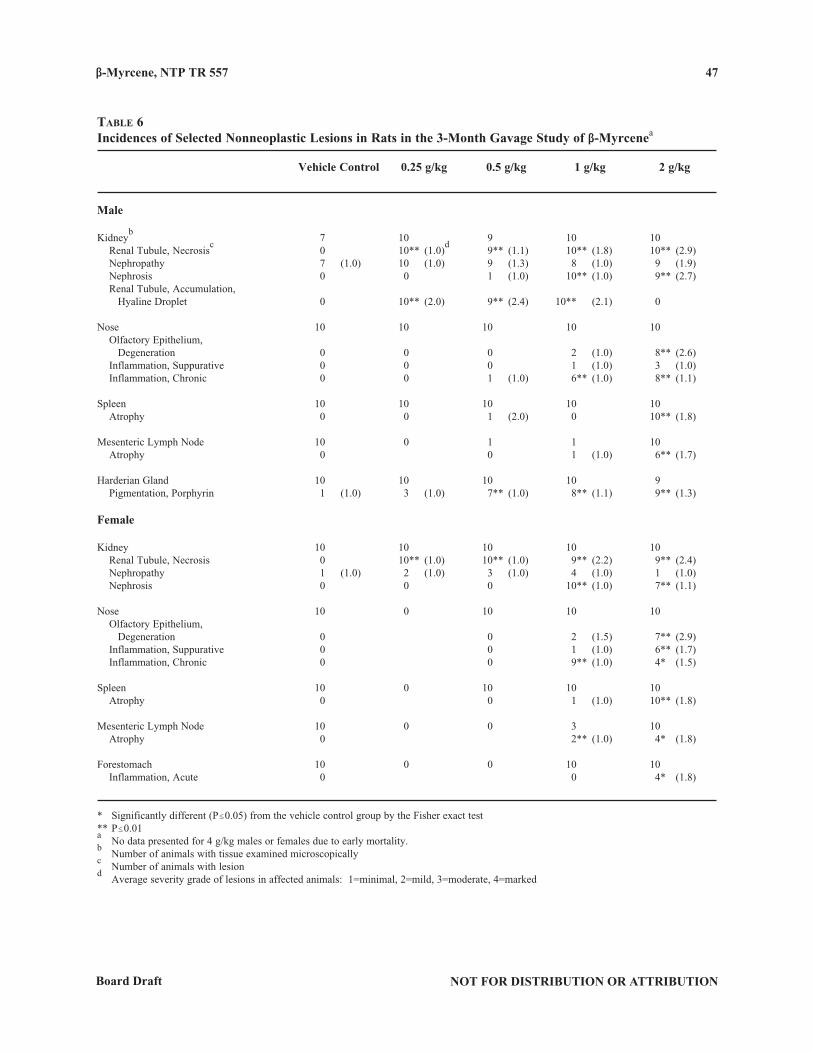
β-Myrcene, NTP TR 557
NOT FOR DISTRIBUTION OR ATTRIBUTIONBoard Draft
47
table 6Incidences of Selected Nonneoplastic Lesions in Rats in the 3-Month Gavage Study of β-Myrcenea
Vehicle Control 0.25 g/kg 0.5 g/kg 1 g/kg 2 g/kg
Male
Kidneyb 7 10 9 10 10
Renal Tubule, Necrosisc 0 10** (1.0)
d 9** (1.1) 10** (1.8) 10** (2.9)
Nephropathy 7 (1.0) 10 (1.0) 9 (1.3) 8 (1.0) 9 (1.9) Nephrosis 0 0 1 (1.0) 10** (1.0) 9** (2.7) Renal Tubule, Accumulation, Hyaline Droplet 0 10** (2.0) 9** (2.4) 10** (2.1) 0
Nose 10 10 10 10 10 Olfactory Epithelium, Degeneration 0 0 0 2 (1.0) 8** (2.6) Inflammation, Suppurative 0 0 0 1 (1.0) 3 (1.0) Inflammation, Chronic 0 0 1 (1.0) 6** (1.0) 8** (1.1)
Spleen 10 10 10 10 10 Atrophy 0 0 1 (2.0) 0 10** (1.8)
Mesenteric Lymph Node 10 0 1 1 10 Atrophy 0 0 1 (1.0) 6** (1.7)
Harderian Gland 10 10 10 10 9 Pigmentation, Porphyrin 1 (1.0) 3 (1.0) 7** (1.0) 8** (1.1) 9** (1.3)
Female
Kidney 10 10 10 10 10 Renal Tubule, Necrosis 0 10** (1.0) 10** (1.0) 9** (2.2) 9** (2.4) Nephropathy 1 (1.0) 2 (1.0) 3 (1.0) 4 (1.0) 1 (1.0) Nephrosis 0 0 0 10** (1.0) 7** (1.1)
Nose 10 0 10 10 10 Olfactory Epithelium, Degeneration 0 0 2 (1.5) 7** (2.9) Inflammation, Suppurative 0 0 1 (1.0) 6** (1.7) Inflammation, Chronic 0 0 9** (1.0) 4* (1.5)
Spleen 10 0 10 10 10 Atrophy 0 0 1 (1.0) 10** (1.8)
Mesenteric Lymph Node 10 0 0 3 10 Atrophy 0 2** (1.0) 4* (1.8)
Forestomach 10 0 0 10 10 Inflammation, Acute 0 0 4* (1.8)
* Significantly different (P#0.05) from the vehicle control group by the Fisher exact test** P#0.01a No data presented for 4 g/kg males or females due to early mortality.
b Number of animals with tissue examined microscopically
c Number of animals with lesion
d Average severity grade of lesions in affected animals: 1=minimal, 2=mild, 3=moderate, 4=marked
β-Myrcene, NTP TR 557 48
NOT FOR DISTRIBUTION OR ATTRIBUTION Board Draft
presence of granular casts or developing granular casts in the outer medulla. These lesions are consistent with
"2u-globulin nephropathy (Hard et al., 1993). The change in the hyaline droplet pattern consisted of decreased
numbers of cells with apical accumulations of hyaline droplets and increased numbers of large, angular, crystalloid
droplets. In addition to hematoxylin and eosin, kidney sections were stained using the Mallory-Heidenhain method
in order to better visualize and assess hyaline droplet accumulation.
The chemical-related lesions of the nose were degeneration of the olfactory epithelium, necrosis of the respiratory
epithelium, suppurative inflammation, and chronic inflammation (Table 6). The incidences and severities of
olfactory epithelial degeneration were greater in the 2 g/kg males and females than in the vehicle controls. The
incidence of respiratory epithelial necrosis was slightly increased in 2 g/kg females. The incidences of suppurative
inflammation in the nose were greater in the 2 g/kg males and females than in the vehicle controls, and the increase
was significant in 2 g/kg females. The incidences of chronic inflammation in 1 and 2 g/kg males and females were
significantly increased compared to the vehicle controls. Olfactory epithelial degeneration was characterized by
decreased cellularity, disorganization of epithelial cells, and nuclear pyknosis. Respiratory epithelial necrosis was
characterized by decreased cellularity, disorganization of epithelial cells, nuclear pyknosis, erosions and ulcers,
and focal accumulation of inflammatory cells. A decrease in the size of the glands associated with the respiratory
epithelium and a change from columnar cells to cuboidal or flattened cells within the glands were also noted. Both
lesions primarily involved the dorsal to middle septum and turbinates.
The incidences of splenic atrophy were significantly increased in the 2 g/kg groups of both sexes (Table 6). One
male and three females in the 2 g/kg groups had thymic necrosis. In the mesenteric lymph node, the incidences of
atrophy were increased in 2 g/kg males and 1 and 2 g/kg females. Splenic atrophy was distinguished by an overall
decrease in splenic size due to lymphoid depletion with focal areas of lymphocytic necrosis and loss of red pulp.
In the thymus, necrosis was characterized by multifocal pyknosis of cortical lymphocytes. In the mesenteric lymph
node, atrophy was characterized by lymphoid depletion. The lymphoid changes in these organs are considered
secondary to morbidity rather than a direct toxic effect of β-myrcene.
β-Myrcene, NTP TR 557
NOT FOR DISTRIBUTION OR ATTRIBUTIONBoard Draft
49
The incidence of acute inflammation of the forestomach, characterized by neutrophilic infiltration of the
forestomach epithelium, was significantly increased in 2 g/kg females (Table 6).
The incidences of porphyrin pigment in the Harderian gland of males from the 0.5 g/kg or greater groups were
significantly increased in comparison to the vehicle control incidences. While porphyrin pigment is normally
found in the Harderian gland, the increased amounts of pigment were distinguished by the intracytoplasmic
accumulation of brownish-gold, granular material (concretions) beyond that seen in vehicle controls.
Dose Selection Rationale: Based on decreased survival and body weight gains of the 2 and 4 g/kg groups, the
highest dose selected for the 2-year gavage study in rats was 1 g/kg. The severity of the renal tubule necrosis
seen in the 1 g/kg rats was not considered sufficient to adversely affect survival in a 2-year study. Lack of clinical
chemistry abnormalities at 1 g/kg also suggested that the morphologic changes were not impairing renal function.
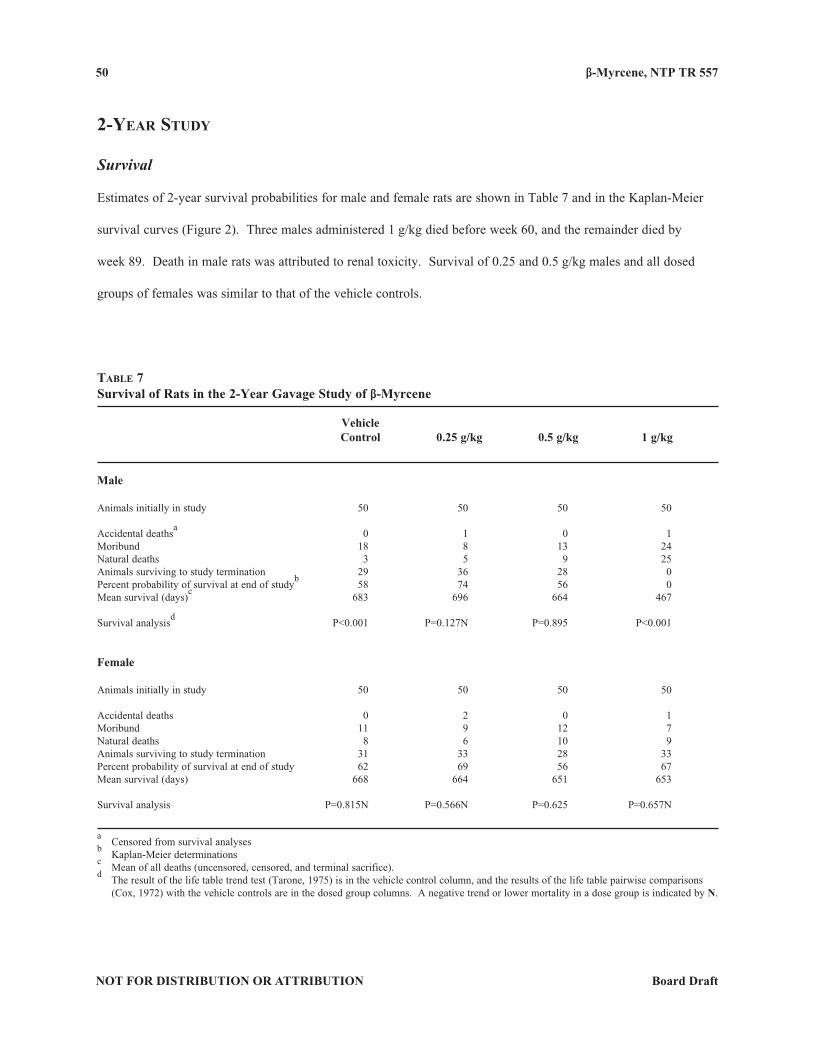
β-Myrcene, NTP TR 557 50
NOT FOR DISTRIBUTION OR ATTRIBUTION Board Draft
2‑yeaR study
Survival
Estimates of 2-year survival probabilities for male and female rats are shown in Table 7 and in the Kaplan-Meier
survival curves (Figure 2). Three males administered 1 g/kg died before week 60, and the remainder died by
week 89. Death in male rats was attributed to renal toxicity. Survival of 0.25 and 0.5 g/kg males and all dosed
groups of females was similar to that of the vehicle controls.
table 7Survival of Rats in the 2-Year Gavage Study of β-Myrcene
Vehicle Control 0.25 g/kg 0.5 g/kg 1 g/kg
Male
Animals initially in study 50 50 50 50
Accidental deathsa 0 1 0 1
Moribund 18 8 13 24Natural deaths 3 5 9 25Animals surviving to study termination 29 36 28 0Percent probability of survival at end of study
b 58 74 56 0
Mean survival (days)c 683 696 664 467
Survival analysisd P<0.001 P=0.127N P=0.895 P<0.001
Female
Animals initially in study 50 50 50 50
Accidental deaths 0 2 0 1Moribund 11 9 12 7Natural deaths 8 6 10 9Animals surviving to study termination 31 33 28 33Percent probability of survival at end of study 62 69 56 67Mean survival (days) 668 664 651 653
Survival analysis P=0.815N P=0.566N P=0.625 P=0.657N
a Censored from survival analyses
b Kaplan-Meier determinations
c Mean of all deaths (uncensored, censored, and terminal sacrifice).
d The result of the life table trend test (Tarone, 1975) is in the vehicle control column, and the results of the life table pairwise comparisons
(Cox, 1972) with the vehicle controls are in the dosed group columns. A negative trend or lower mortality in a dose group is indicated by N.
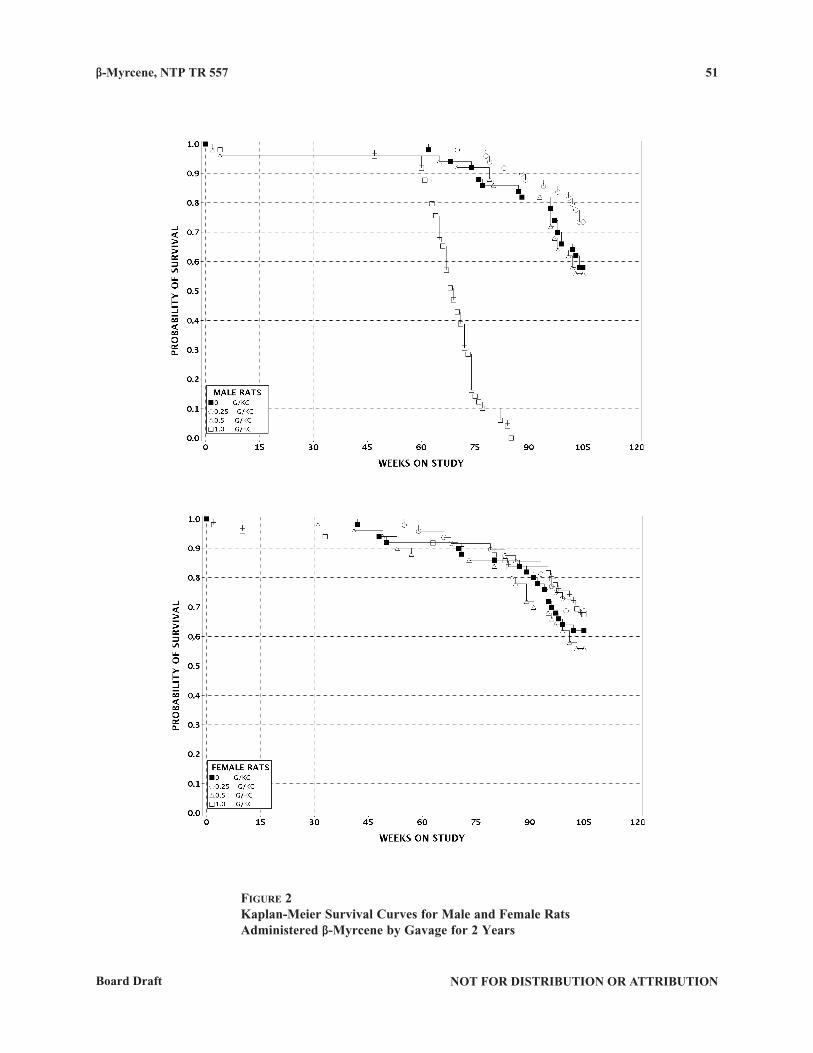
β-Myrcene, NTP TR 557
NOT FOR DISTRIBUTION OR ATTRIBUTIONBoard Draft
51
FiguRe 2Kaplan-Meier Survival Curves for Male and Female Rats Administered β-Myrcene by Gavage for 2 Years
β-Myrcene, NTP TR 557 52
NOT FOR DISTRIBUTION OR ATTRIBUTION Board Draft
Body Weights and Clinical Findings
Mean body weights of 0.25 g/kg females were similar to those of the vehicle controls (Figure 3; Tables 8 and 9).
The mean body weights of 1 g/kg males and females were less than those of the vehicle controls after weeks 7 and
13, respectively. The mean body weights of 0.25 and 0.5 g/kg males were slightly greater than those of the vehicle
controls late in the study. The mean body weights of 0.5 g/kg females were less than those of the vehicle controls
during much of the study but were similar by the end of the study. Approximately 22% of the 1 g/kg males were
thin after approximately week 60 of the study. The most frequent toxicologically relevant clinical observations
were thinness, lethargy, ruffled fur, and ocular and nasal discharge.
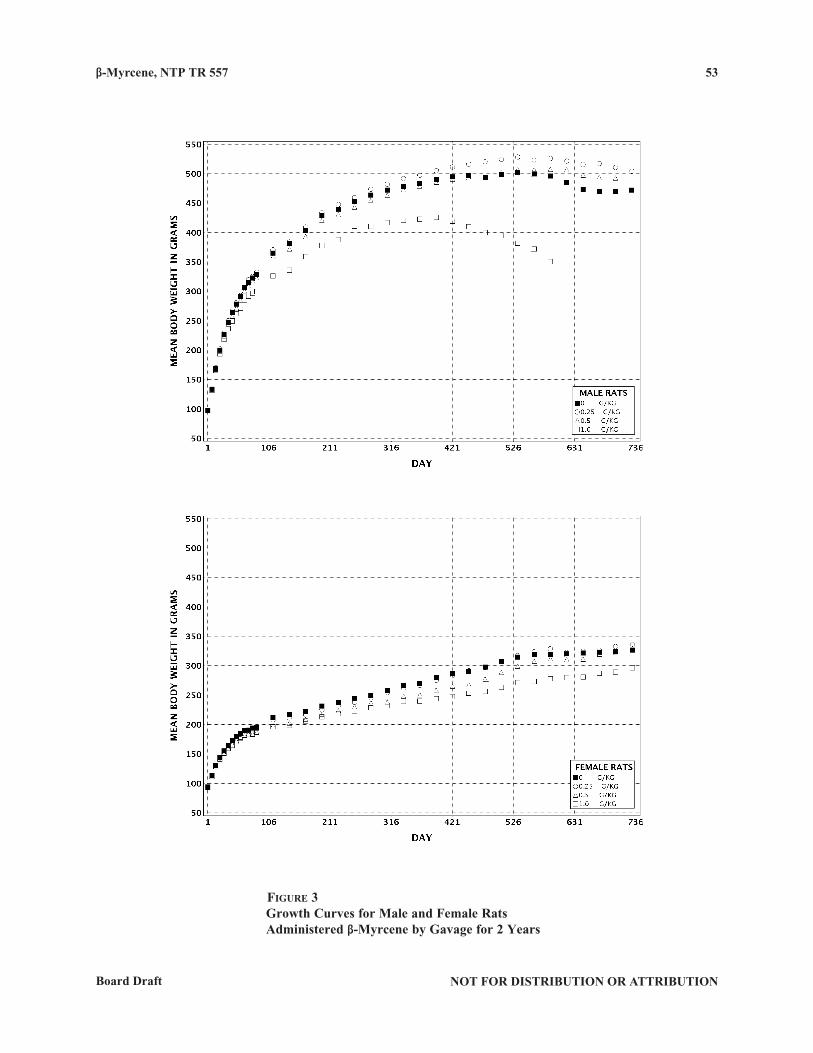
β-Myrcene, NTP TR 557
NOT FOR DISTRIBUTION OR ATTRIBUTIONBoard Draft
53
FiguRe 3Growth Curves for Male and Female Rats Administered β-Myrcene by Gavage for 2 Years
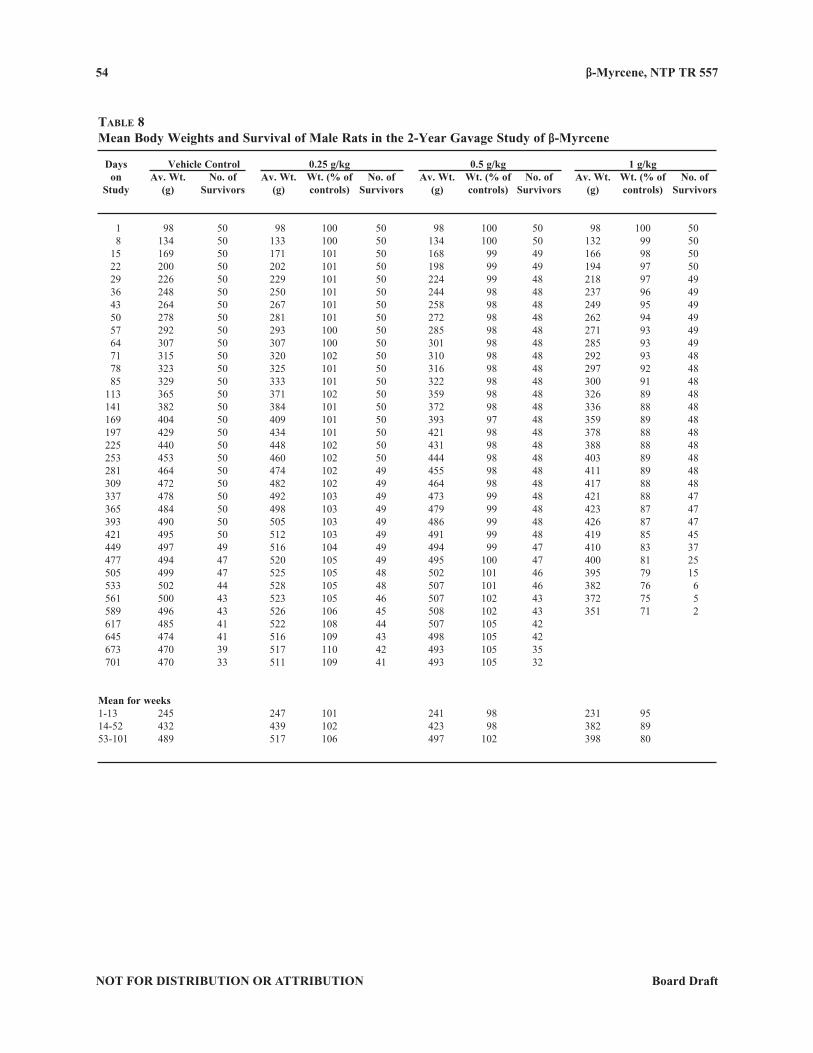
β-Myrcene, NTP TR 557 54
NOT FOR DISTRIBUTION OR ATTRIBUTION Board Draft
table 8Mean Body Weights and Survival of Male Rats in the 2-Year Gavage Study of β-Myrcene
Days Vehicle Control 0.25 g/kg 0.5 g/kg 1 g/kg on Av. Wt. No. of Av. Wt. Wt. (% of No. of Av. Wt. Wt. (% of No. of Av. Wt. Wt. (% of No. of Study (g) Survivors (g) controls) Survivors (g) controls) Survivors (g) controls) Survivors
1 98 50 98 100 50 98 100 50 98 100 50 8 134 50 133 100 50 134 100 50 132 99 50 15 169 50 171 101 50 168 99 49 166 98 50 22 200 50 202 101 50 198 99 49 194 97 50 29 226 50 229 101 50 224 99 48 218 97 49 36 248 50 250 101 50 244 98 48 237 96 49 43 264 50 267 101 50 258 98 48 249 95 49 50 278 50 281 101 50 272 98 48 262 94 49 57 292 50 293 100 50 285 98 48 271 93 49 64 307 50 307 100 50 301 98 48 285 93 49 71 315 50 320 102 50 310 98 48 292 93 48 78 323 50 325 101 50 316 98 48 297 92 48 85 329 50 333 101 50 322 98 48 300 91 48 113 365 50 371 102 50 359 98 48 326 89 48 141 382 50 384 101 50 372 98 48 336 88 48 169 404 50 409 101 50 393 97 48 359 89 48 197 429 50 434 101 50 421 98 48 378 88 48 225 440 50 448 102 50 431 98 48 388 88 48 253 453 50 460 102 50 444 98 48 403 89 48 281 464 50 474 102 49 455 98 48 411 89 48 309 472 50 482 102 49 464 98 48 417 88 48 337 478 50 492 103 49 473 99 48 421 88 47 365 484 50 498 103 49 479 99 48 423 87 47 393 490 50 505 103 49 486 99 48 426 87 47 421 495 50 512 103 49 491 99 48 419 85 45 449 497 49 516 104 49 494 99 47 410 83 37 477 494 47 520 105 49 495 100 47 400 81 25 505 499 47 525 105 48 502 101 46 395 79 15 533 502 44 528 105 48 507 101 46 382 76 6 561 500 43 523 105 46 507 102 43 372 75 5 589 496 43 526 106 45 508 102 43 351 71 2 617 485 41 522 108 44 507 105 42 645 474 41 516 109 43 498 105 42 673 470 39 517 110 42 493 105 35 701 470 33 511 109 41 493 105 32
Mean for weeks1-13 245 247 101 241 98 231 9514-52 432 439 102 423 98 382 8953-101 489 517 106 497 102 398 80
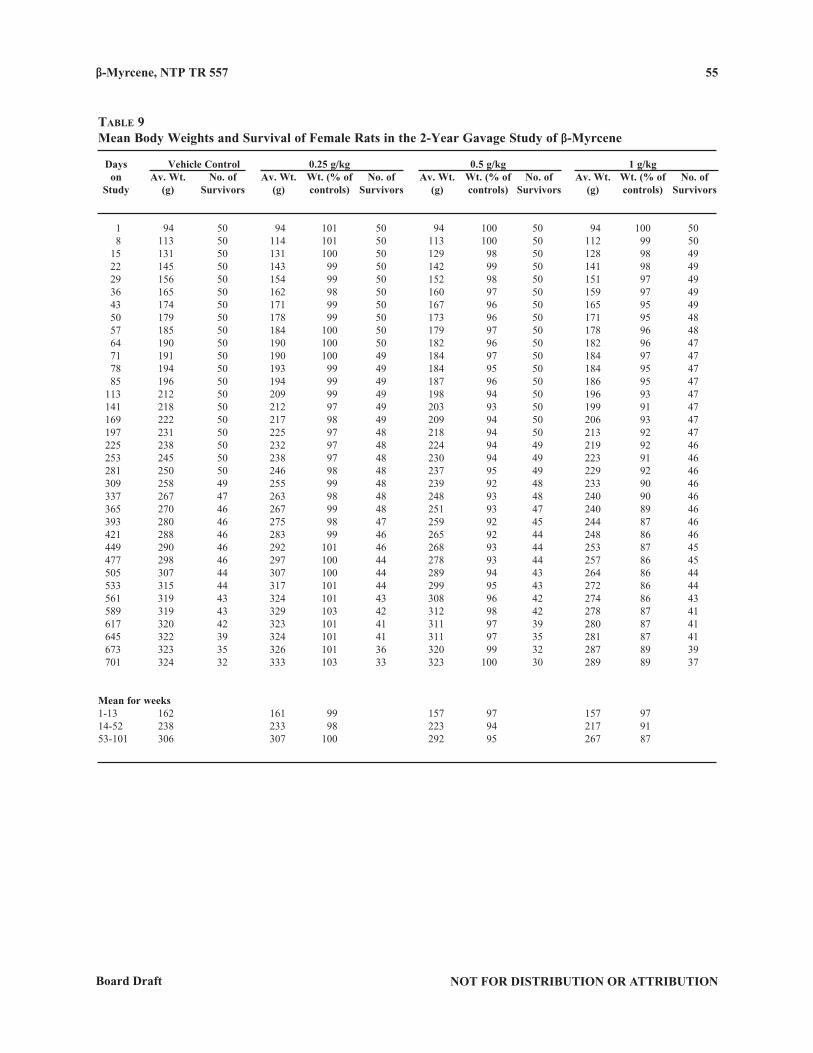
β-Myrcene, NTP TR 557
NOT FOR DISTRIBUTION OR ATTRIBUTIONBoard Draft
55
table 9Mean Body Weights and Survival of Female Rats in the 2-Year Gavage Study of β-Myrcene
Days Vehicle Control 0.25 g/kg 0.5 g/kg 1 g/kg on Av. Wt. No. of Av. Wt. Wt. (% of No. of Av. Wt. Wt. (% of No. of Av. Wt. Wt. (% of No. of Study (g) Survivors (g) controls) Survivors (g) controls) Survivors (g) controls) Survivors
1 94 50 94 101 50 94 100 50 94 100 50 8 113 50 114 101 50 113 100 50 112 99 50 15 131 50 131 100 50 129 98 50 128 98 49 22 145 50 143 99 50 142 99 50 141 98 49 29 156 50 154 99 50 152 98 50 151 97 49 36 165 50 162 98 50 160 97 50 159 97 49 43 174 50 171 99 50 167 96 50 165 95 49 50 179 50 178 99 50 173 96 50 171 95 48 57 185 50 184 100 50 179 97 50 178 96 48 64 190 50 190 100 50 182 96 50 182 96 47 71 191 50 190 100 49 184 97 50 184 97 47 78 194 50 193 99 49 184 95 50 184 95 47 85 196 50 194 99 49 187 96 50 186 95 47 113 212 50 209 99 49 198 94 50 196 93 47 141 218 50 212 97 49 203 93 50 199 91 47 169 222 50 217 98 49 209 94 50 206 93 47 197 231 50 225 97 48 218 94 50 213 92 47 225 238 50 232 97 48 224 94 49 219 92 46 253 245 50 238 97 48 230 94 49 223 91 46 281 250 50 246 98 48 237 95 49 229 92 46 309 258 49 255 99 48 239 92 48 233 90 46 337 267 47 263 98 48 248 93 48 240 90 46 365 270 46 267 99 48 251 93 47 240 89 46 393 280 46 275 98 47 259 92 45 244 87 46 421 288 46 283 99 46 265 92 44 248 86 46 449 290 46 292 101 46 268 93 44 253 87 45 477 298 46 297 100 44 278 93 44 257 86 45 505 307 44 307 100 44 289 94 43 264 86 44 533 315 44 317 101 44 299 95 43 272 86 44 561 319 43 324 101 43 308 96 42 274 86 43 589 319 43 329 103 42 312 98 42 278 87 41 617 320 42 323 101 41 311 97 39 280 87 41 645 322 39 324 101 41 311 97 35 281 87 41 673 323 35 326 101 36 320 99 32 287 89 39 701 324 32 333 103 33 323 100 30 289 89 37
Mean for weeks1-13 162 161 99 157 97 157 9714-52 238 233 98 223 94 217 9153-101 306 307 100 292 95 267 87
β-Myrcene, NTP TR 557 56
NOT FOR DISTRIBUTION OR ATTRIBUTION Board Draft
Pathology and Statistical Analyses
This section describes the statistically significant or biologically noteworthy changes in the incidences of
neoplasms and/or nonneoplastic lesions of the kidney, liver, lung, nose, forestomach, thyroid gland, and uterus.
Due to the early mortality in 1 g/kg male rats, data from this group are not presented in this section. Summaries of
the incidences of neoplasms and nonneoplastic lesions, statistical analyses of primary neoplasms that occurred with
an incidence of at least 5% in at least one animal group, and historical incidences for the neoplasms mentioned in
this section are presented in Appendix A for male rats and Appendix B for female rats.
Kidney: In the original kidney sections, renal tubule adenoma occurred with a positive trend in males, and
the incidence was significantly increased in 0.5 g/kg males (Tables 10, A1, and A2). Though not significantly
different from the vehicle controls, the incidences of renal tubule adenoma and renal tubule carcinoma in 0.25 g/
kg males exceeded the historical control means from all routes of administration. When compared to vehicle
control males, the incidences of renal tubule adenoma or carcinoma (combined) were significantly increased in
0.25 and 0.5 g/kg males; and the combined incidences occurred with a positive trend. Two renal tubule adenomas
occurred in 1 g/kg females, and this incidence was higher than the historical control mean from all routes of study
(Tables 10, B1, and B3). Renal tubule hyperplasia occurred in only two 0.5 g/kg males and one 1 g/kg female
(Tables 10, A4, and B4).
In the kidney, renal tubule hyperplasia, adenoma, and carcinoma are thought to represent a continuum of renal
tubule proliferative lesions. The renal tubule adenomas were well-circumscribed, variably sized masses composed
of large, polygonal cells with well defined borders, abundant, well developed, basophilic cytoplasm, and variably
sized nuclei with large nucleoli (Plates 1 and 2). The adenomas often exhibited growth of blood vessels and/or
fibroblasts into the tumors. Mitotic figures, small areas of central necrosis, and pleomorphism of the neoplastic
cells occasionally characterized the adenomas, particularly the larger ones. Small adenomas were differentiated
from renal tubule hyperplasia by extension beyond the confines of a single renal tubule. Generally, lesions
with greater than seven small lobules, too many to be consistent with the convolutions of a single tubule, were
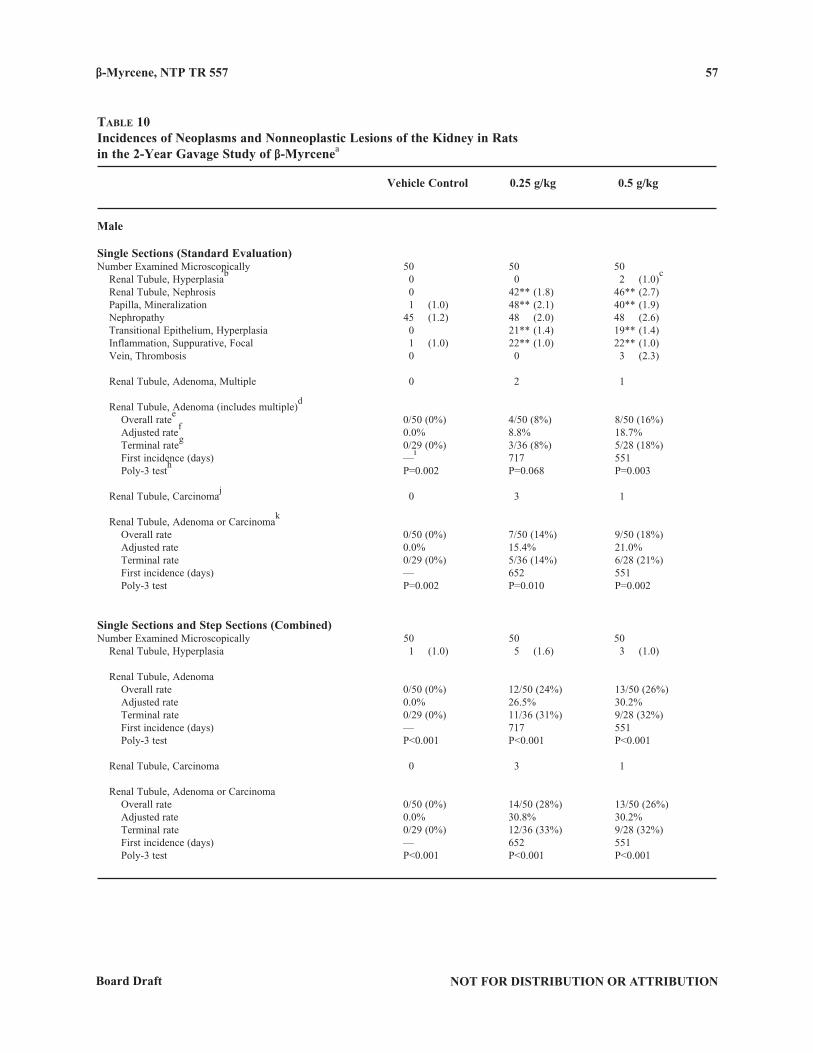
β-Myrcene, NTP TR 557
NOT FOR DISTRIBUTION OR ATTRIBUTIONBoard Draft
57
table 10Incidences of Neoplasms and Nonneoplastic Lesions of the Kidney in Rats in the 2-Year Gavage Study of β-Myrcenea
Vehicle Control 0.25 g/kg 0.5 g/kg
Male
Single Sections (Standard Evaluation)Number Examined Microscopically 50 50 50 Renal Tubule, Hyperplasia
b 0 0 2 (1.0)
c
Renal Tubule, Nephrosis 0 42** (1.8) 46** (2.7) Papilla, Mineralization 1 (1.0) 48** (2.1) 40** (1.9) Nephropathy 45 (1.2) 48 (2.0) 48 (2.6) Transitional Epithelium, Hyperplasia 0 21** (1.4) 19** (1.4) Inflammation, Suppurative, Focal 1 (1.0) 22** (1.0) 22** (1.0) Vein, Thrombosis 0 0 3 (2.3)
Renal Tubule, Adenoma, Multiple 0 2 1
Renal Tubule, Adenoma (includes multiple)d
Overall ratee 0/50 (0%) 4/50 (8%) 8/50 (16%)
Adjusted ratef 0.0% 8.8% 18.7%
Terminal rateg 0/29 (0%) 3/36 (8%) 5/28 (18%)
First incidence (days) —i 717 551
Poly-3 testh P=0.002 P=0.068 P=0.003
Renal Tubule, Carcinomaj 0 3 1
Renal Tubule, Adenoma or Carcinomak
Overall rate 0/50 (0%) 7/50 (14%) 9/50 (18%) Adjusted rate 0.0% 15.4% 21.0% Terminal rate 0/29 (0%) 5/36 (14%) 6/28 (21%) First incidence (days) — 652 551 Poly-3 test P=0.002 P=0.010 P=0.002
Single Sections and Step Sections (Combined)Number Examined Microscopically 50 50 50 Renal Tubule, Hyperplasia 1 (1.0) 5 (1.6) 3 (1.0)
Renal Tubule, Adenoma Overall rate 0/50 (0%) 12/50 (24%) 13/50 (26%) Adjusted rate 0.0% 26.5% 30.2% Terminal rate 0/29 (0%) 11/36 (31%) 9/28 (32%) First incidence (days) — 717 551 Poly-3 test P<0.001 P<0.001 P<0.001
Renal Tubule, Carcinoma 0 3 1
Renal Tubule, Adenoma or Carcinoma Overall rate 0/50 (0%) 14/50 (28%) 13/50 (26%) Adjusted rate 0.0% 30.8% 30.2% Terminal rate 0/29 (0%) 12/36 (33%) 9/28 (32%) First incidence (days) — 652 551 Poly-3 test P<0.001 P<0.001 P<0.001
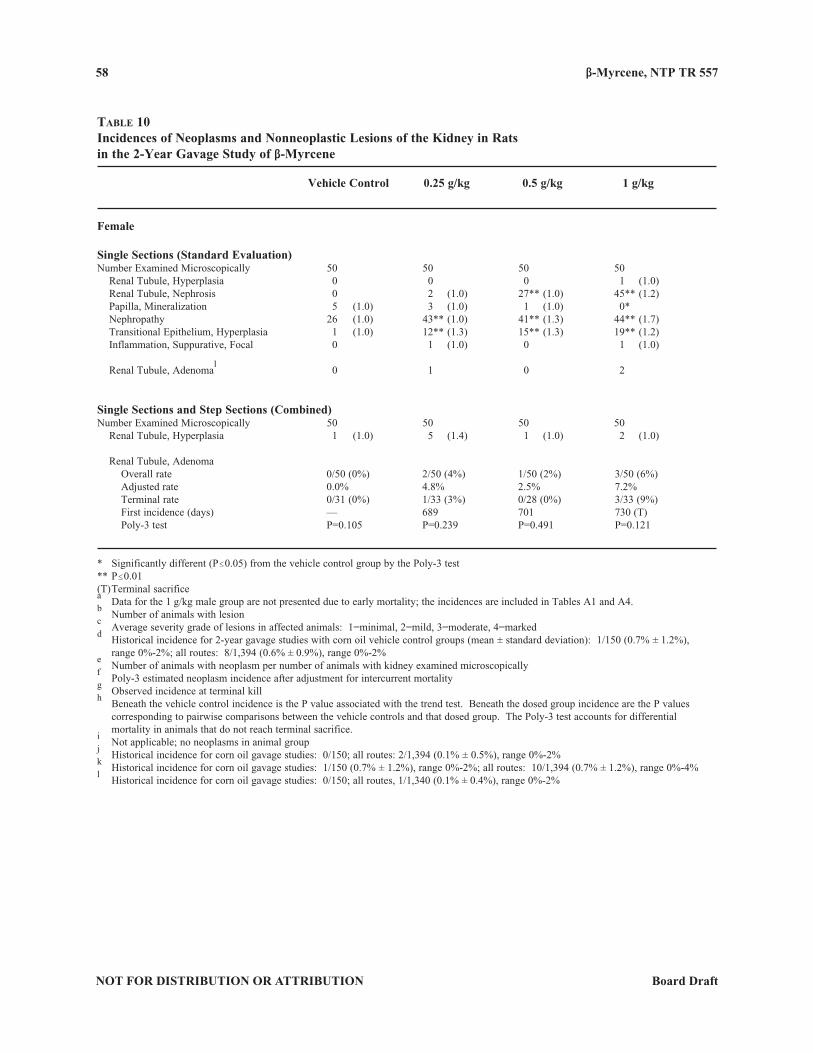
β-Myrcene, NTP TR 557 58
NOT FOR DISTRIBUTION OR ATTRIBUTION Board Draft
table 10Incidences of Neoplasms and Nonneoplastic Lesions of the Kidney in Rats in the 2-Year Gavage Study of β-Myrcene
Vehicle Control 0.25 g/kg 0.5 g/kg 1 g/kg
Female
Single Sections (Standard Evaluation)Number Examined Microscopically 50 50 50 50 Renal Tubule, Hyperplasia 0 0 0 1 (1.0) Renal Tubule, Nephrosis 0 2 (1.0) 27** (1.0) 45** (1.2) Papilla, Mineralization 5 (1.0) 3 (1.0) 1 (1.0) 0* Nephropathy 26 (1.0) 43** (1.0) 41** (1.3) 44** (1.7) Transitional Epithelium, Hyperplasia 1 (1.0) 12** (1.3) 15** (1.3) 19** (1.2) Inflammation, Suppurative, Focal 0 1 (1.0) 0 1 (1.0)
Renal Tubule, Adenomal 0 1 0 2
Single Sections and Step Sections (Combined)Number Examined Microscopically 50 50 50 50 Renal Tubule, Hyperplasia 1 (1.0) 5 (1.4) 1 (1.0) 2 (1.0)
Renal Tubule, Adenoma Overall rate 0/50 (0%) 2/50 (4%) 1/50 (2%) 3/50 (6%) Adjusted rate 0.0% 4.8% 2.5% 7.2% Terminal rate 0/31 (0%) 1/33 (3%) 0/28 (0%) 3/33 (9%) First incidence (days) — 689 701 730 (T) Poly-3 test P=0.105 P=0.239 P=0.491 P=0.121
* Significantly different (P#0.05) from the vehicle control group by the Poly-3 test** P#0.01(T) Terminal sacrificea Data for the 1 g/kg male group are not presented due to early mortality; the incidences are included in Tables A1 and A4.
b Number of animals with lesion
c Average severity grade of lesions in affected animals: 1=minimal, 2=mild, 3=moderate, 4=marked
d Historical incidence for 2-year gavage studies with corn oil vehicle control groups (mean ± standard deviation): 1/150 (0.7% ± 1.2%),
range 0%-2%; all routes: 8/1,394 (0.6% ± 0.9%), range 0%-2%e Number of animals with neoplasm per number of animals with kidney examined microscopically
f Poly-3 estimated neoplasm incidence after adjustment for intercurrent mortality
g Observed incidence at terminal kill
h Beneath the vehicle control incidence is the P value associated with the trend test. Beneath the dosed group incidence are the P values
corresponding to pairwise comparisons between the vehicle controls and that dosed group. The Poly-3 test accounts for differential mortality in animals that do not reach terminal sacrifice.i Not applicable; no neoplasms in animal group
j Historical incidence for corn oil gavage studies: 0/150; all routes: 2/1,394 (0.1% ± 0.5%), range 0%-2%
k Historical incidence for corn oil gavage studies: 1/150 (0.7% ± 1.2%), range 0%-2%; all routes: 10/1,394 (0.7% ± 1.2%), range 0%-4%
l Historical incidence for corn oil gavage studies: 0/150; all routes, 1/1,340 (0.1% ± 0.4%), range 0%-2%
β-Myrcene, NTP TR 557
NOT FOR DISTRIBUTION OR ATTRIBUTIONBoard Draft
59
considered adenomas (Hard and Seely, 2005). Renal tubule carcinomas had cellular features similar to adenomas
but with more marked pleomorphism. They also had more mitotic figures, were larger, had much more extensive
central necrosis, and occasionally had invaded adjacent tissue.
In contrast, renal tubule hyperplasia (not associated with nephropathy or nephrosis), a putative preneoplastic lesion,
had cellular features similar to adenomas but with fewer mitotic figures and rare cellular pleomorphism (Plates 3
and 4). They also lacked ingrowth of fibroblasts and blood vessels and did not extend beyond the confines of a
single renal tubule. Two important features of this type of renal tubule hyperplasia that distinguished it from the
hyperplasia associated with nephrosis and nephropathy were a rim of fibroblasts in intimate contact with the rim of
the expansile lesion and a glassy, basophilic sheen that was characteristic of the hyperplastic cells (Hard and Seely,
2005) (Plate 3).
Due to the dose-related increase in renal tubule proliferative lesions found in the standard evaluations, extended
evaluations of 3 to 4 additional step sections of kidney from each animal were performed. The extended
evaluation substantiated the results of the standard evaluation. In both the extended evaluation and the combined
standard and extended evaluations, the incidences of renal tubule adenoma and of renal tubule adenoma or
carcinoma (combined) were significantly increased in all dosed groups of males (Tables 10 and A2). The
incidence of renal tubule hyperplasia was slightly increased in 0.25 g/kg males and females in the extended
evaluation.
The incidences of renal tubule nephrosis (nephrosis) were markedly increased compared to vehicle controls
in all dosed groups of both sexes except the 0.25 g/kg females (Tables 10, A4, and B4). Additionally, a dose-
related increase in the severity of nephrosis was observed in males. A spectrum of related histologic lesions
constitutes nephrosis: renal tubule dilatation, renal tubule karyomegaly (of tubule epithelial cells), renal tubule
hyperplasia, collecting duct hyperplasia, interstitial fibrosis, and renal tubule atrophy (Plates 5 to 9). Tubule
dilatation and karyomegaly were the predominant histologic changes and began in the outer stripe of the outer
β-Myrcene, NTP TR 557 60
NOT FOR DISTRIBUTION OR ATTRIBUTION Board Draft
medulla (Plates 5, 6, and 9). In more severe cases, the tubular dilation also affected some cortical tubules. Renal
tubule hyperplasia, which differed from the preneoplastic renal tubule hyperplasia previously described, was
widespread in more severely affected animals and was evident in both cortical tubules and collecting ducts. The
cells of the hyperplastic tubules were generally enlarged; had granular to slightly vacuolated cytoplasm that lacked
the basophilic sheen of the preneoplastic hyperplasias; and were generally surrounded by eosinophilic, fibrillar
material (fibrosis). The fibrotic regions, which often contained scattered fibroblasts and mononuclear cells, often
surrounded and separated dilated and hyperplastic tubules. Interstitial fibrosis and tubule atrophy were prominent
in some rats but were multifocal in others (Plates 5 and 7). In mid- and low-dose male rats, dose-related changes
were noted in all of the parameters used to assess nephrosis. In female rats, tubule dilatation and karyomegaly,
predominantly affecting the outer stripe of the outer medulla, were the most remarkable changes and exhibited a
dose-related increase in severity, though the severity was reduced compared to the males. The other components
of nephrosis were present sporadically and to a lesser degree in the female rats.
In the males, the incidences and severities of papillary mineralization were significantly increased in the 0.25 and
0.5 g/kg groups (Tables 10 and A4). There were no increases in the incidence of papillary mineralization in the
dosed female rats compared to vehicle controls (Tables 10 and B4). The papillary mineralization was identified
by linear accumulations of angular to stippled basophilic material within the loops of Henle in the renal papilla.
Epithelial changes ranged from complete loss of the epithelial lining to flattening and elongation of the epithelial
cells. Occasionally, necrotic cells could be seen within the tubules. This type of renal mineralization is considered
a chronic manifestation of "2u-globulin nephropathy (Hard et al., 1993).
The incidences of CPN were significantly increased in dosed females, and the severity was increased in the 0.5 and
1 g/kg groups (Tables 10 and B4). CPN was observed in virtually all males, and the severity was increased in the
dosed groups (Tables 10 and A4). CPN is an age-related disease process characterized by a spectrum of tubule,
glomerular, and interstitial lesions. The tubule lesions include varying degrees of tubule dilation; proteinaceous
tubule casts; thickening of tubule basement membrane; and atrophy, degeneration, regeneration, and hypertrophy
β-Myrcene, NTP TR 557
NOT FOR DISTRIBUTION OR ATTRIBUTIONBoard Draft
61
of the tubule epithelium (Plate 10). Glomerular lesions include thickening of glomerular basement membrane;
glomerular mesangial proliferation; adhesions between the glomerular tuft and the wall of Bowman’s capsule;
glomerular parietal and visceral epithelial hyperplasia and hypertrophy; and glomerulosclerosis. Interstitial
lesions include fibrosis and infiltration by varying numbers and aggregates of mononuclear inflammatory cells.
Minimal CPN was characterized by a few scattered foci of tubule regeneration. These regenerative tubules had
increased numbers of more intensely stained basophilic cells. Basement membranes, both in glomeruli and
around tubules, were slightly thickened. As CPN became more severe, tubule dilatation, proteinaceous casts, and
interstitial fibrosis were evident along with glomerular changes including periglomerular fibrosis and thickening
of glomerular basement membranes, hyperplasia of parietal and visceral epithelial cells, and adhesions of the
glomerular tufts to Bowman’s capsule. Many of these lesions are listed above as components of nephrosis; and
indeed, it was often difficult to differentiate between the two lesions, particularly in the high dose males. The
main differentiating factors were the presence of proteinaceous tubule casts and thickened basement membranes
around hyperplastic, dilated, and atrophic tubules which are both characteristic of CPN; and the character and
cellular features of the hyperplastic and dilated tubules, which, when associated with CPN, tended to be more
basophilic and have more crowded nuclei.
The incidences of hyperplasia of the transitional epithelium lining the pelvis and overlying the renal papilla in all
dosed groups of both sexes were significantly increased relative to the vehicle controls (Tables 10, A4, and B4).
This lesion frequently accompanies severe nephropathy, and the increased incidences may reflect the enhanced
nephropathy (Plates 8 and 10).
In the male rats, the incidences of focal suppurative inflammation, which was typically within renal tubules, was
significantly increased in the 0.25 and 0.5 g/kg groups compared to the vehicle controls (Tables 10 and A4).
Three male rats in the 0.5 g/kg group had venous thrombosis compared to none in the vehicle controls (Tables 10
and A4).
β-Myrcene, NTP TR 557 62
NOT FOR DISTRIBUTION OR ATTRIBUTION Board Draft
Liver: The incidences of all forms of hepatic foci in male rats were decreased, with statistically significant
decreases in basophilic focus and mixed cell focus at 0.25 and 0.5 g/kg (Table A4). In the females, the incidence
of basophilic focus was decreased in the 1 g/kg group compared to vehicle controls, but the incidences of
eosinophilic focus were increased in the 0.5 and 1 g/kg groups (Table B4). The incidence of chronic inflammation
was decreased in the 0.5 g/kg male group, and negative trends for incidences of chronic inflammation were found
in both sexes. A negative trend in the incidences of bile duct hyperplasia in the liver was found in the male rats.
Bile duct hyperplasia is a common lesion in aged rats.
Other Findings: In the lung, the incidence of alveolar/bronchiolar adenoma in the 0.25 g/kg males (Table A2)
exceeded the control means from NTP 2-year studies using corn oil gavage [6/150 (4%)] and all routes [34/1,399
(2%)]. In the nose, the incidence of chronic active inflammation of the nose was significantly increased in the
0.5 g/kg males (Table A4). This irritation is likely a secondary effect on the nasal epithelium due to regurgitation
of β-myrcene into the nasal cavity during the gavage procedure, but a hematogenous effect of β-myrcene on the
nose cannot be ruled out. In the forestomach, the incidence of chronic active inflammation in 0.5 g/kg males
was increased relative to the vehicle control incidence (Table A4), suggesting that the chemical is an irritant.
In females, the incidence of thyroid gland C-cell adenoma was significantly increased in the 0.25 g/kg group;
the incidences did not increase with increasing dose (Tables B1 and B2). The incidence of cystic endometrial
hyperplasia of the uterus was significantly increased in the 1 g/kg group (Table B4).
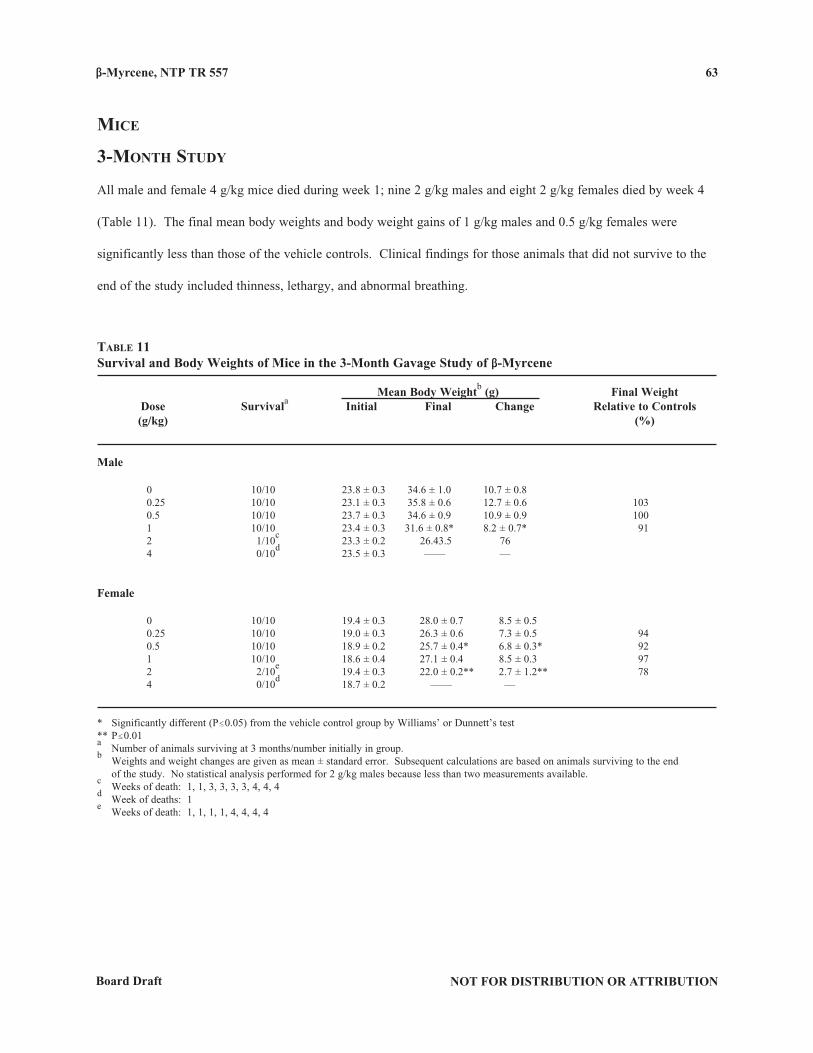
β-Myrcene, NTP TR 557
NOT FOR DISTRIBUTION OR ATTRIBUTIONBoard Draft
63
Mice
3‑Month study
All male and female 4 g/kg mice died during week 1; nine 2 g/kg males and eight 2 g/kg females died by week 4
(Table 11). The final mean body weights and body weight gains of 1 g/kg males and 0.5 g/kg females were
significantly less than those of the vehicle controls. Clinical findings for those animals that did not survive to the
end of the study included thinness, lethargy, and abnormal breathing.
table 11Survival and Body Weights of Mice in the 3-Month Gavage Study of β-Myrcene
Mean Body Weightb (g) Final Weight Dose Survivala Initial Final Change Relative to Controls (g/kg) (%)
Male
0 10/10 23.8 ± 0.3 34.6 ± 1.0 10.7 ± 0.8 0.25 10/10 23.1 ± 0.3 35.8 ± 0.6 12.7 ± 0.6 103 0.5 10/10 23.7 ± 0.3 34.6 ± 0.9 10.9 ± 0.9 100 1 10/10 23.4 ± 0.3 31.6 ± 0.8* 8.2 ± 0.7* 91 2 1/10
c 23.3 ± 0.2 26.4 3.5 76
4 0/10d 23.5 ± 0.3 — — —
Female
0 10/10 19.4 ± 0.3 28.0 ± 0.7 8.5 ± 0.5 0.25 10/10 19.0 ± 0.3 26.3 ± 0.6 7.3 ± 0.5 94 0.5 10/10 18.9 ± 0.2 25.7 ± 0.4* 6.8 ± 0.3* 92 1 10/10 18.6 ± 0.4 27.1 ± 0.4 8.5 ± 0.3 97 2 2/10
e 19.4 ± 0.3 22.0 ± 0.2** 2.7 ± 1.2** 78
4 0/10d 18.7 ± 0.2 — — —
* Significantly different (P#0.05) from the vehicle control group by Williams’ or Dunnett’s test** P#0.01a Number of animals surviving at 3 months/number initially in group.
b Weights and weight changes are given as mean ± standard error. Subsequent calculations are based on animals surviving to the end
of the study. No statistical analysis performed for 2 g/kg males because less than two measurements available.c Weeks of death: 1, 1, 3, 3, 3, 3, 4, 4, 4
d Week of deaths: 1
e Weeks of death: 1, 1, 1, 1, 4, 4, 4, 4
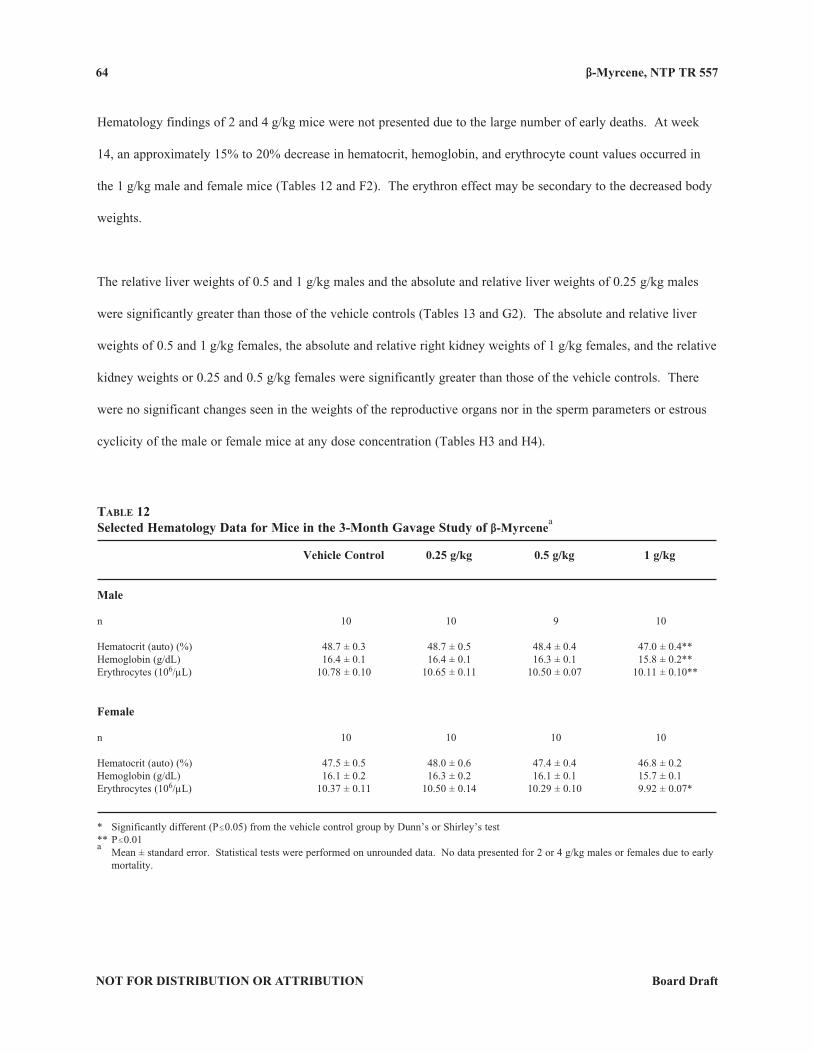
β-Myrcene, NTP TR 557 64
NOT FOR DISTRIBUTION OR ATTRIBUTION Board Draft
Hematology findings of 2 and 4 g/kg mice were not presented due to the large number of early deaths. At week
14, an approximately 15% to 20% decrease in hematocrit, hemoglobin, and erythrocyte count values occurred in
the 1 g/kg male and female mice (Tables 12 and F2). The erythron effect may be secondary to the decreased body
weights.
The relative liver weights of 0.5 and 1 g/kg males and the absolute and relative liver weights of 0.25 g/kg males
were significantly greater than those of the vehicle controls (Tables 13 and G2). The absolute and relative liver
weights of 0.5 and 1 g/kg females, the absolute and relative right kidney weights of 1 g/kg females, and the relative
kidney weights or 0.25 and 0.5 g/kg females were significantly greater than those of the vehicle controls. There
were no significant changes seen in the weights of the reproductive organs nor in the sperm parameters or estrous
cyclicity of the male or female mice at any dose concentration (Tables H3 and H4).
table 12Selected Hematology Data for Mice in the 3-Month Gavage Study of β-Myrcene
a
Vehicle Control 0.25 g/kg 0.5 g/kg 1 g/kg
Male
n 10 10 9 10
Hematocrit (auto) (%) 48.7 ± 0.3 48.7 ± 0.5 48.4 ± 0.4 47.0 ± 0.4**Hemoglobin (g/dL) 16.4 ± 0.1 16.4 ± 0.1 16.3 ± 0.1 15.8 ± 0.2**Erythrocytes (106/µL) 10.78 ± 0.10 10.65 ± 0.11 10.50 ± 0.07 10.11 ± 0.10**
Female
n 10 10 10 10
Hematocrit (auto) (%) 47.5 ± 0.5 48.0 ± 0.6 47.4 ± 0.4 46.8 ± 0.2Hemoglobin (g/dL) 16.1 ± 0.2 16.3 ± 0.2 16.1 ± 0.1 15.7 ± 0.1Erythrocytes (106/µL) 10.37 ± 0.11 10.50 ± 0.14 10.29 ± 0.10 9.92 ± 0.07*
* Significantly different (P#0.05) from the vehicle control group by Dunn’s or Shirley’s test** P#0.01a Mean ± standard error. Statistical tests were performed on unrounded data. No data presented for 2 or 4 g/kg males or females due to early
mortality.
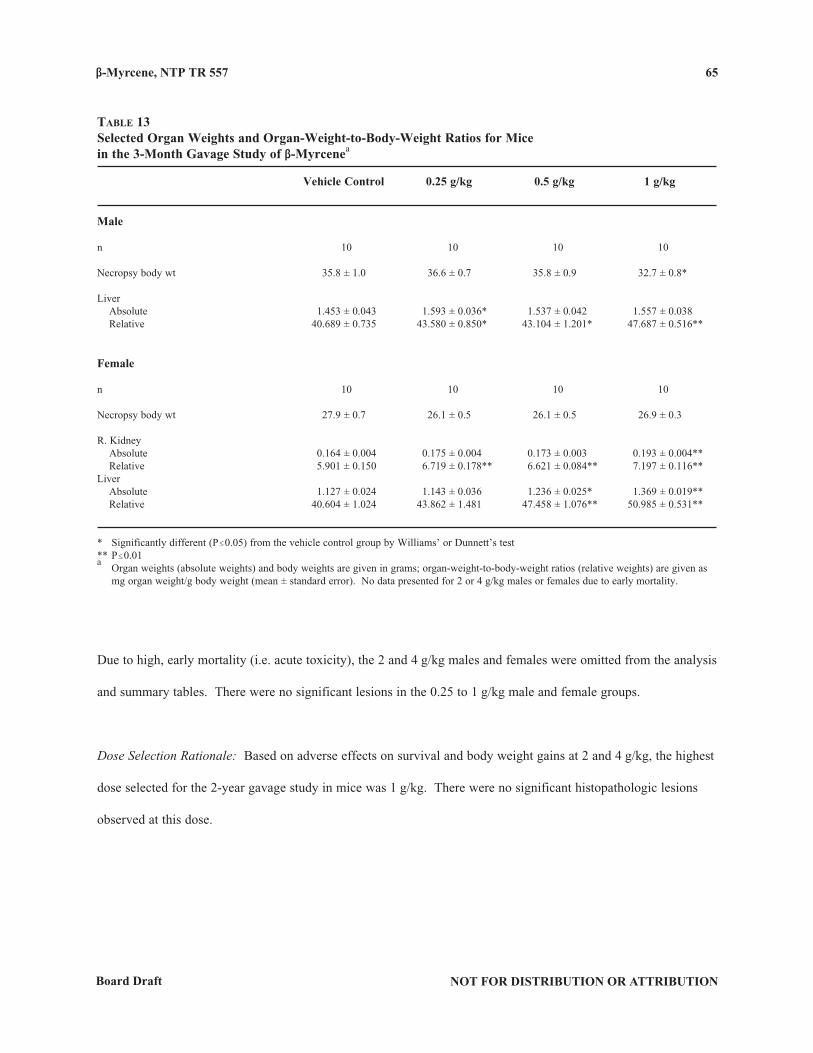
β-Myrcene, NTP TR 557
NOT FOR DISTRIBUTION OR ATTRIBUTIONBoard Draft
65
Due to high, early mortality (i.e. acute toxicity), the 2 and 4 g/kg males and females were omitted from the analysis
and summary tables. There were no significant lesions in the 0.25 to 1 g/kg male and female groups.
Dose Selection Rationale: Based on adverse effects on survival and body weight gains at 2 and 4 g/kg, the highest
dose selected for the 2-year gavage study in mice was 1 g/kg. There were no significant histopathologic lesions
observed at this dose.
table 13Selected Organ Weights and Organ-Weight-to-Body-Weight Ratios for Micein the 3-Month Gavage Study of β-Myrcenea
Vehicle Control 0.25 g/kg 0.5 g/kg 1 g/kg
Male
n 10 10 10 10
Necropsy body wt 35.8 ± 1.0 36.6 ± 0.7 35.8 ± 0.9 32.7 ± 0.8*
Liver Absolute 1.453 ± 0.043 1.593 ± 0.036* 1.537 ± 0.042 1.557 ± 0.038 Relative 40.689 ± 0.735 43.580 ± 0.850* 43.104 ± 1.201* 47.687 ± 0.516**
Female
n 10 10 10 10
Necropsy body wt 27.9 ± 0.7 26.1 ± 0.5 26.1 ± 0.5 26.9 ± 0.3
R. Kidney Absolute 0.164 ± 0.004 0.175 ± 0.004 0.173 ± 0.003 0.193 ± 0.004** Relative 5.901 ± 0.150 6.719 ± 0.178** 6.621 ± 0.084** 7.197 ± 0.116**Liver Absolute 1.127 ± 0.024 1.143 ± 0.036 1.236 ± 0.025* 1.369 ± 0.019** Relative 40.604 ± 1.024 43.862 ± 1.481 47.458 ± 1.076** 50.985 ± 0.531**
* Significantly different (P#0.05) from the vehicle control group by Williams’ or Dunnett’s test** P#0.01a Organ weights (absolute weights) and body weights are given in grams; organ-weight-to-body-weight ratios (relative weights) are given as
mg organ weight/g body weight (mean ± standard error). No data presented for 2 or 4 g/kg males or females due to early mortality.
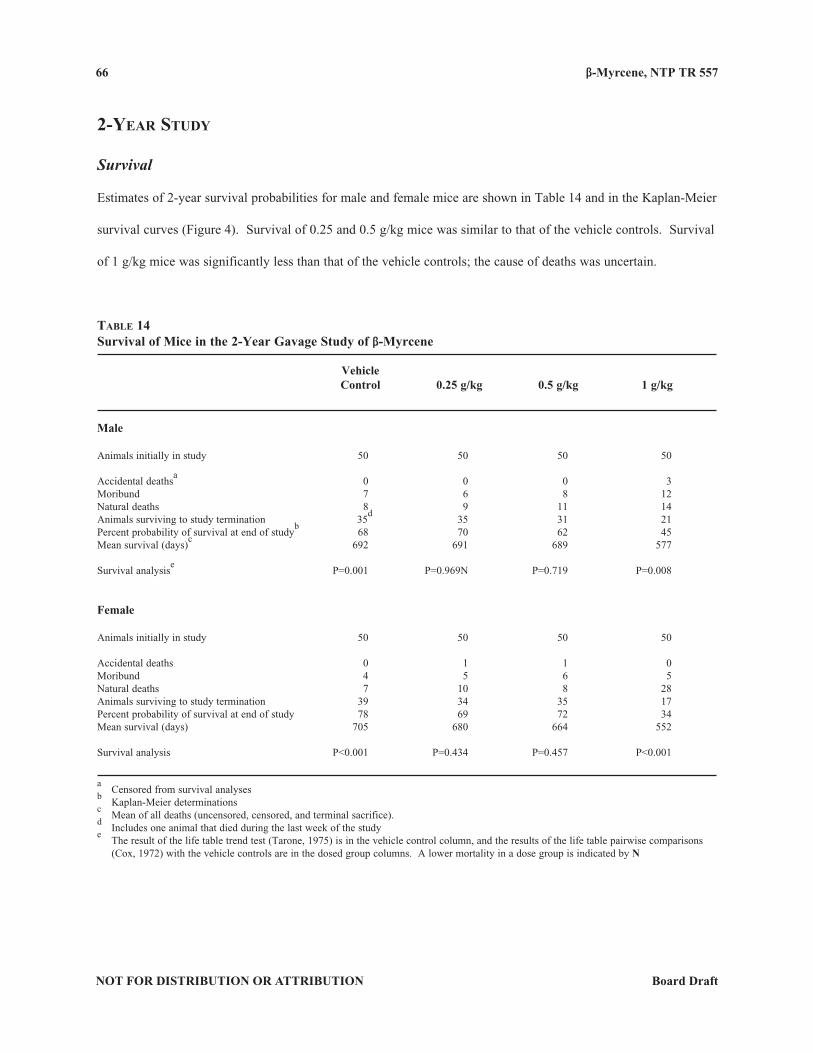
β-Myrcene, NTP TR 557 66
NOT FOR DISTRIBUTION OR ATTRIBUTION Board Draft
table 14Survival of Mice in the 2-Year Gavage Study of β-Myrcene
Vehicle Control 0.25 g/kg 0.5 g/kg 1 g/kg
Male
Animals initially in study 50 50 50 50
Accidental deathsa 0 0 0 3
Moribund 7 6 8 12Natural deaths 8 9 11 14Animals surviving to study termination 35
d 35 31 21
Percent probability of survival at end of studyb 68 70 62 45
Mean survival (days)c 692 691 689 577
Survival analysise P=0.001 P=0.969N P=0.719 P=0.008
Female
Animals initially in study 50 50 50 50
Accidental deaths 0 1 1 0Moribund 4 5 6 5Natural deaths 7 10 8 28Animals surviving to study termination 39 34 35 17Percent probability of survival at end of study 78 69 72 34Mean survival (days) 705 680 664 552
Survival analysis P<0.001 P=0.434 P=0.457 P<0.001
a Censored from survival analyses
b Kaplan-Meier determinations
c Mean of all deaths (uncensored, censored, and terminal sacrifice).
d Includes one animal that died during the last week of the study
e The result of the life table trend test (Tarone, 1975) is in the vehicle control column, and the results of the life table pairwise comparisons
(Cox, 1972) with the vehicle controls are in the dosed group columns. A lower mortality in a dose group is indicated by N
2‑yeaR study
Survival
Estimates of 2-year survival probabilities for male and female mice are shown in Table 14 and in the Kaplan-Meier
survival curves (Figure 4). Survival of 0.25 and 0.5 g/kg mice was similar to that of the vehicle controls. Survival
of 1 g/kg mice was significantly less than that of the vehicle controls; the cause of deaths was uncertain.
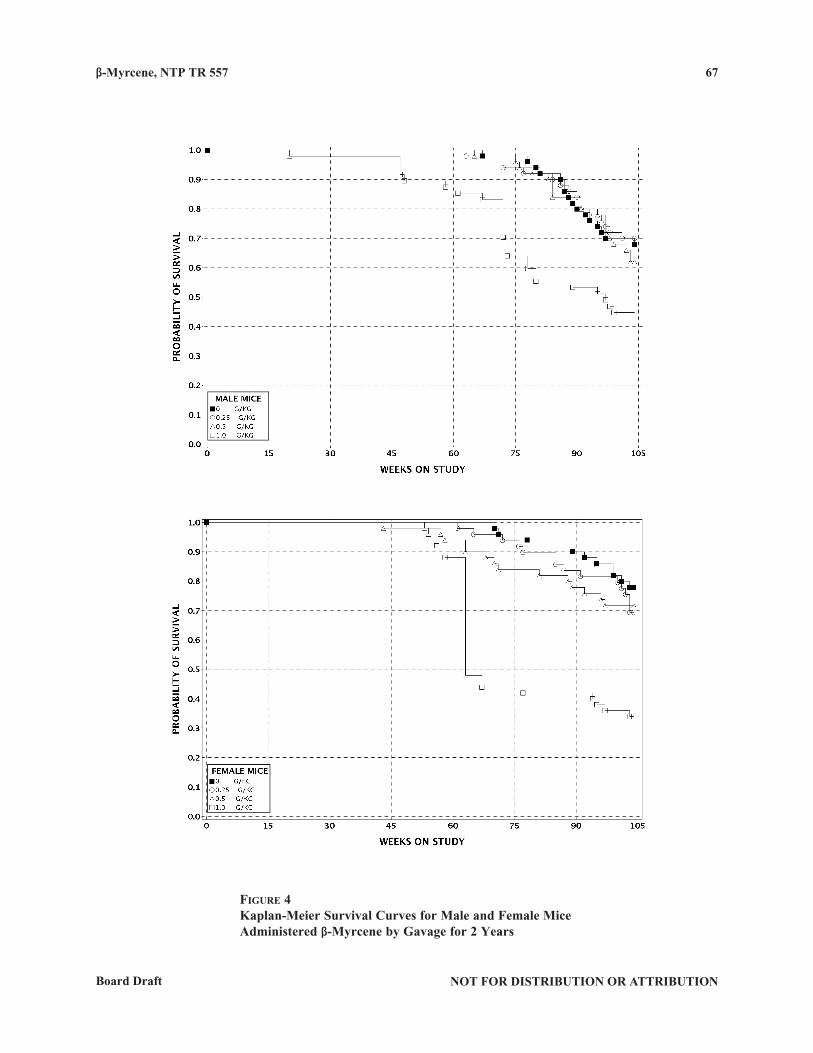
β-Myrcene, NTP TR 557
NOT FOR DISTRIBUTION OR ATTRIBUTIONBoard Draft
67
FiguRe 4Kaplan-Meier Survival Curves for Male and Female Mice Administered β-Myrcene by Gavage for 2 Years
β-Myrcene, NTP TR 557 68
NOT FOR DISTRIBUTION OR ATTRIBUTION Board Draft
Body Weights and Clinical Findings
Mean body weights of 0.25 g/kg males and females and 0.5 g/kg males were generally similar to vehicle controls
throughout the study (Figure 5; Tables 15 and 16). Mean body weights of 1 g/kg males, 0.5 g/kg females, and
1 g/kg females were less than those of the vehicle controls after weeks 8, 17, and 11, respectively. No clinical
findings related to β-myrcene administration were observed.
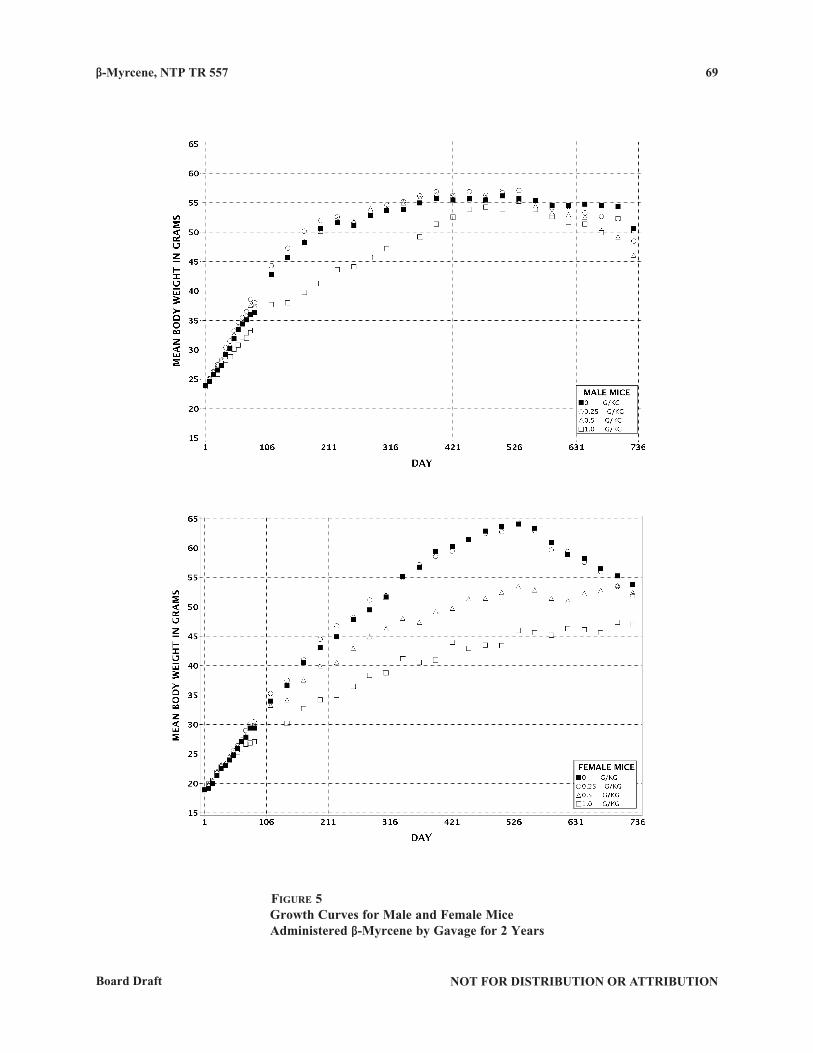
β-Myrcene, NTP TR 557
NOT FOR DISTRIBUTION OR ATTRIBUTIONBoard Draft
69
FiguRe 5Growth Curves for Male and Female Mice Administered β-Myrcene by Gavage for 2 Years
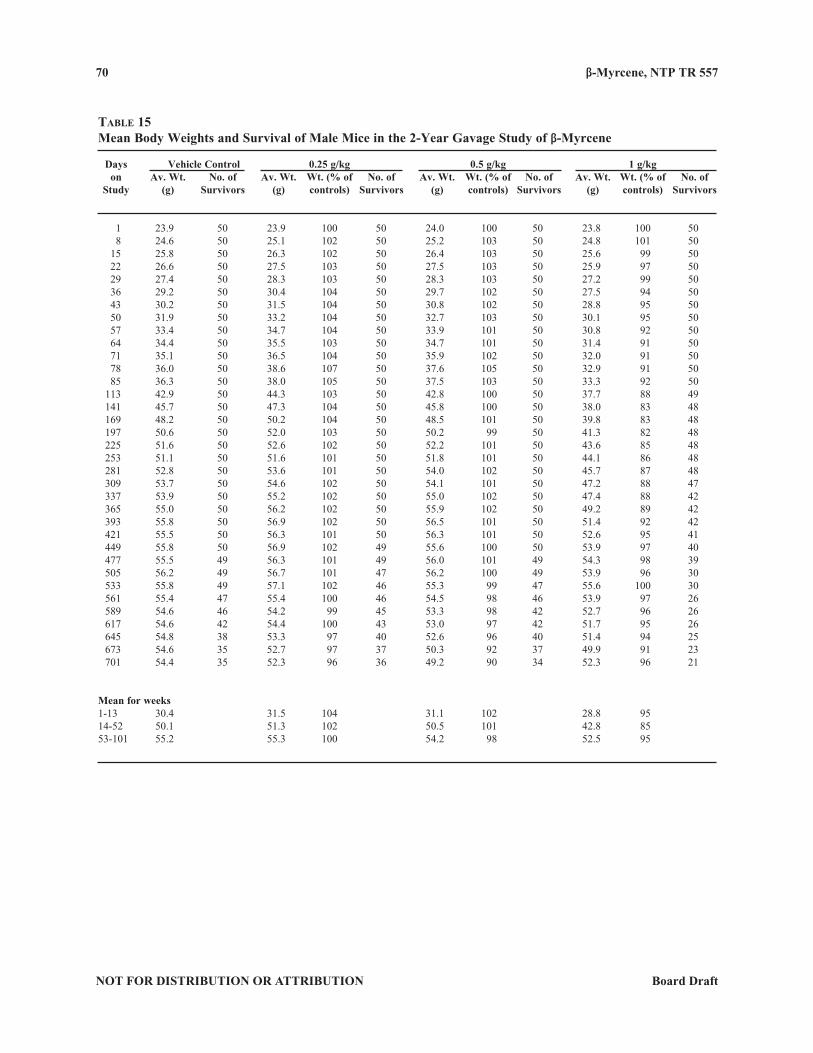
β-Myrcene, NTP TR 557 70
NOT FOR DISTRIBUTION OR ATTRIBUTION Board Draft
table 15Mean Body Weights and Survival of Male Mice in the 2-Year Gavage Study of β-Myrcene
Days Vehicle Control 0.25 g/kg 0.5 g/kg 1 g/kg on Av. Wt. No. of Av. Wt. Wt. (% of No. of Av. Wt. Wt. (% of No. of Av. Wt. Wt. (% of No. of Study (g) Survivors (g) controls) Survivors (g) controls) Survivors (g) controls) Survivors
1 23.9 50 23.9 100 50 24.0 100 50 23.8 100 50 8 24.6 50 25.1 102 50 25.2 103 50 24.8 101 50 15 25.8 50 26.3 102 50 26.4 103 50 25.6 99 50 22 26.6 50 27.5 103 50 27.5 103 50 25.9 97 50 29 27.4 50 28.3 103 50 28.3 103 50 27.2 99 50 36 29.2 50 30.4 104 50 29.7 102 50 27.5 94 50 43 30.2 50 31.5 104 50 30.8 102 50 28.8 95 50 50 31.9 50 33.2 104 50 32.7 103 50 30.1 95 50 57 33.4 50 34.7 104 50 33.9 101 50 30.8 92 50 64 34.4 50 35.5 103 50 34.7 101 50 31.4 91 50 71 35.1 50 36.5 104 50 35.9 102 50 32.0 91 50 78 36.0 50 38.6 107 50 37.6 105 50 32.9 91 50 85 36.3 50 38.0 105 50 37.5 103 50 33.3 92 50 113 42.9 50 44.3 103 50 42.8 100 50 37.7 88 49 141 45.7 50 47.3 104 50 45.8 100 50 38.0 83 48 169 48.2 50 50.2 104 50 48.5 101 50 39.8 83 48 197 50.6 50 52.0 103 50 50.2 99 50 41.3 82 48 225 51.6 50 52.6 102 50 52.2 101 50 43.6 85 48 253 51.1 50 51.6 101 50 51.8 101 50 44.1 86 48 281 52.8 50 53.6 101 50 54.0 102 50 45.7 87 48 309 53.7 50 54.6 102 50 54.1 101 50 47.2 88 47 337 53.9 50 55.2 102 50 55.0 102 50 47.4 88 42 365 55.0 50 56.2 102 50 55.9 102 50 49.2 89 42 393 55.8 50 56.9 102 50 56.5 101 50 51.4 92 42 421 55.5 50 56.3 101 50 56.3 101 50 52.6 95 41 449 55.8 50 56.9 102 49 55.6 100 50 53.9 97 40 477 55.5 49 56.3 101 49 56.0 101 49 54.3 98 39 505 56.2 49 56.7 101 47 56.2 100 49 53.9 96 30 533 55.8 49 57.1 102 46 55.3 99 47 55.6 100 30 561 55.4 47 55.4 100 46 54.5 98 46 53.9 97 26 589 54.6 46 54.2 99 45 53.3 98 42 52.7 96 26 617 54.6 42 54.4 100 43 53.0 97 42 51.7 95 26 645 54.8 38 53.3 97 40 52.6 96 40 51.4 94 25 673 54.6 35 52.7 97 37 50.3 92 37 49.9 91 23 701 54.4 35 52.3 96 36 49.2 90 34 52.3 96 21
Mean for weeks1-13 30.4 31.5 104 31.1 102 28.8 9514-52 50.1 51.3 102 50.5 101 42.8 8553-101 55.2 55.3 100 54.2 98 52.5 95
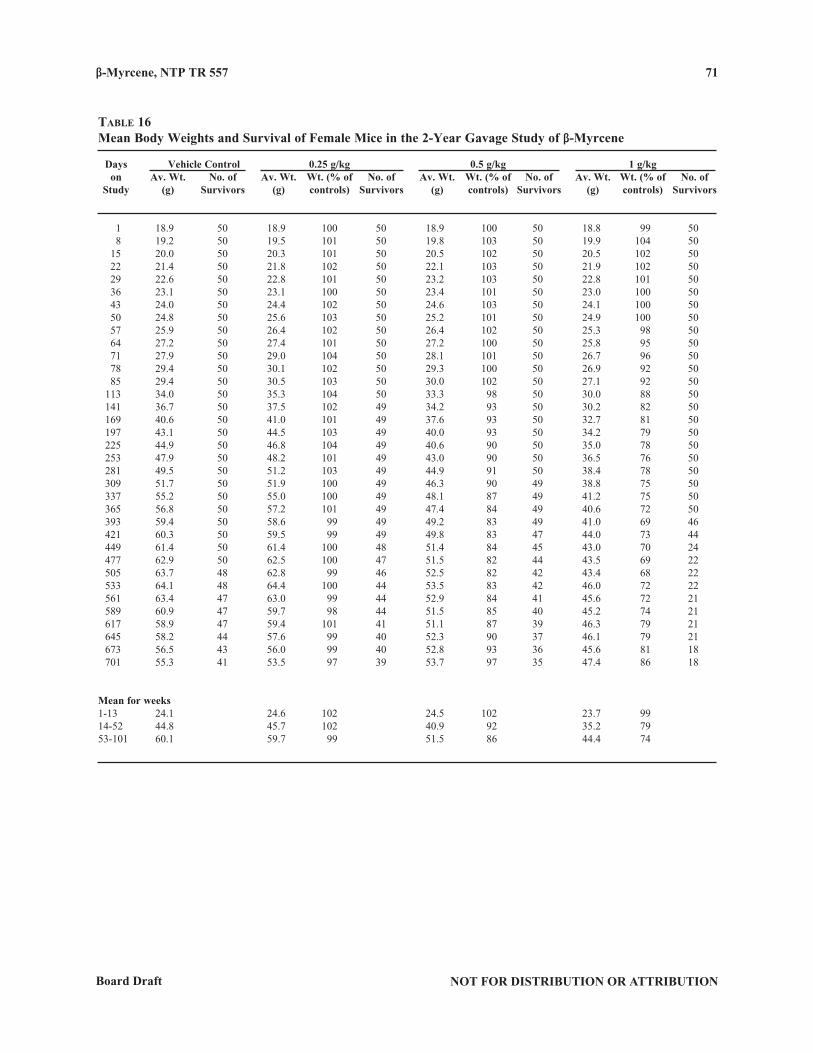
β-Myrcene, NTP TR 557
NOT FOR DISTRIBUTION OR ATTRIBUTIONBoard Draft
71
table 16Mean Body Weights and Survival of Female Mice in the 2-Year Gavage Study of β-Myrcene
Days Vehicle Control 0.25 g/kg 0.5 g/kg 1 g/kg on Av. Wt. No. of Av. Wt. Wt. (% of No. of Av. Wt. Wt. (% of No. of Av. Wt. Wt. (% of No. of Study (g) Survivors (g) controls) Survivors (g) controls) Survivors (g) controls) Survivors
1 18.9 50 18.9 100 50 18.9 100 50 18.8 99 50 8 19.2 50 19.5 101 50 19.8 103 50 19.9 104 50 15 20.0 50 20.3 101 50 20.5 102 50 20.5 102 50 22 21.4 50 21.8 102 50 22.1 103 50 21.9 102 50 29 22.6 50 22.8 101 50 23.2 103 50 22.8 101 50 36 23.1 50 23.1 100 50 23.4 101 50 23.0 100 50 43 24.0 50 24.4 102 50 24.6 103 50 24.1 100 50 50 24.8 50 25.6 103 50 25.2 101 50 24.9 100 50 57 25.9 50 26.4 102 50 26.4 102 50 25.3 98 50 64 27.2 50 27.4 101 50 27.2 100 50 25.8 95 50 71 27.9 50 29.0 104 50 28.1 101 50 26.7 96 50 78 29.4 50 30.1 102 50 29.3 100 50 26.9 92 50 85 29.4 50 30.5 103 50 30.0 102 50 27.1 92 50 113 34.0 50 35.3 104 50 33.3 98 50 30.0 88 50 141 36.7 50 37.5 102 49 34.2 93 50 30.2 82 50 169 40.6 50 41.0 101 49 37.6 93 50 32.7 81 50 197 43.1 50 44.5 103 49 40.0 93 50 34.2 79 50 225 44.9 50 46.8 104 49 40.6 90 50 35.0 78 50 253 47.9 50 48.2 101 49 43.0 90 50 36.5 76 50 281 49.5 50 51.2 103 49 44.9 91 50 38.4 78 50 309 51.7 50 51.9 100 49 46.3 90 49 38.8 75 50 337 55.2 50 55.0 100 49 48.1 87 49 41.2 75 50 365 56.8 50 57.2 101 49 47.4 84 49 40.6 72 50 393 59.4 50 58.6 99 49 49.2 83 49 41.0 69 46 421 60.3 50 59.5 99 49 49.8 83 47 44.0 73 44 449 61.4 50 61.4 100 48 51.4 84 45 43.0 70 24 477 62.9 50 62.5 100 47 51.5 82 44 43.5 69 22 505 63.7 48 62.8 99 46 52.5 82 42 43.4 68 22 533 64.1 48 64.4 100 44 53.5 83 42 46.0 72 22 561 63.4 47 63.0 99 44 52.9 84 41 45.6 72 21 589 60.9 47 59.7 98 44 51.5 85 40 45.2 74 21 617 58.9 47 59.4 101 41 51.1 87 39 46.3 79 21 645 58.2 44 57.6 99 40 52.3 90 37 46.1 79 21 673 56.5 43 56.0 99 40 52.8 93 36 45.6 81 18 701 55.3 41 53.5 97 39 53.7 97 35 47.4 86 18
Mean for weeks1-13 24.1 24.6 102 24.5 102 23.7 9914-52 44.8 45.7 102 40.9 92 35.2 7953-101 60.1 59.7 99 51.5 86 44.4 74
β-Myrcene, NTP TR 557 72
NOT FOR DISTRIBUTION OR ATTRIBUTION Board Draft
Pathology and Statistical Analyses
This section describes the statistically significant or biologically noteworthy changes in the incidences of
neoplasms and/or nonneoplastic lesions of the liver, bone marrow, spleen, mandibular lymph node, forestomach,
pancreatic islets, and uterus. Due to the early mortality in 1 g/kg mice, data from this group are not presented in
this section. Summaries of the incidences of neoplasms and nonneoplastic lesions, statistical analyses of primary
neoplasms that occurred with an incidence of at least 5% in at least one animal group, and historical incidences for
neoplasms mentioned in this section are presented in Appendix C for male mice and Appendix D for female mice.
Liver: In male mice, the incidences of hepatocellular adenoma in the 0.25 and 0.5 g/kg groups and hepatocellular
carcinoma and hepatoblastoma in the 0.5 g/kg group were significantly greater than the vehicle control incidences
(Tables 17 and C1). The combined incidences of hepatocellular adenoma or hepatocellular carcinoma and
of hepatocellular adenoma, hepatocellular carcinoma, or hepatoblastoma in the 0.25 and 0.5 g/kg males were
significantly greater than those in the vehicle controls. A significantly increased incidence of hepatocellular
carcinoma or hepatoblastoma (combined) also occurred in 0.5 g/kg males.
In female mice, significantly increased incidences of hepatocellular adenoma, hepatocellular carcinoma, and
hepatocellular adenoma or carcinoma (combined) occurred in the 0.25 g/kg group compared to those in the vehicle
controls (Tables 17 and D1).
A significantly decreased incidence of mixed cell focus occurred in the 0.25 g/kg males, and a significantly
increased incidence of mixed cell focus occurred in the 0.5 g/kg females (Tables 17, C4, and D4).
Foci of cellular alteration are putative preneoplastic lesions, and these lesions had an appearance typical of
that seen in B6C3F1 mice. Mixed foci were small to moderately large lesions composed of hepatocytes with
eosinophilic, basophilic, or clear cytoplasm. The hepatocytes were arranged in normal hepatic cords that merged
with the surrounding normal hepatocytes. Most foci had little or no compression of the surrounding normal
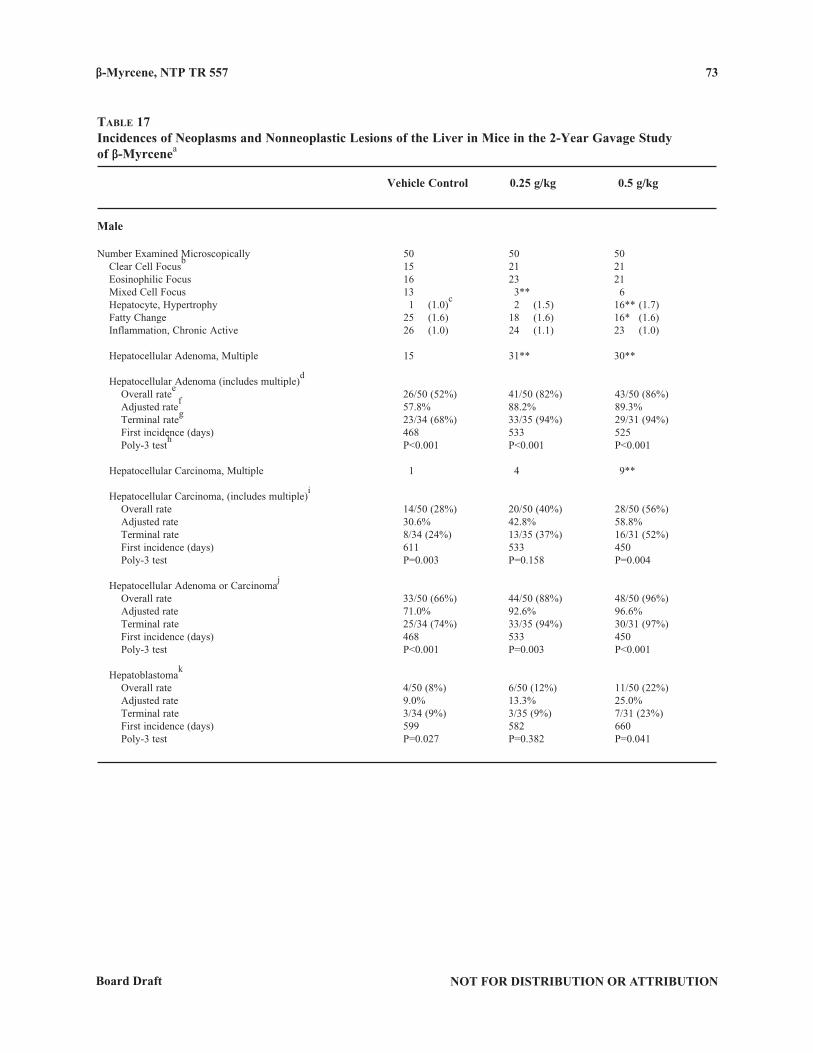
β-Myrcene, NTP TR 557
NOT FOR DISTRIBUTION OR ATTRIBUTIONBoard Draft
73
table 17Incidences of Neoplasms and Nonneoplastic Lesions of the Liver in Mice in the 2-Year Gavage Study of β-Myrcenea
Vehicle Control 0.25 g/kg 0.5 g/kg
Male
Number Examined Microscopically 50 50 50 Clear Cell Focus
b 15 21 21
Eosinophilic Focus 16 23 21 Mixed Cell Focus 13 3** 6 Hepatocyte, Hypertrophy 1 (1.0)
c 2 (1.5) 16** (1.7)
Fatty Change 25 (1.6) 18 (1.6) 16* (1.6) Inflammation, Chronic Active 26 (1.0) 24 (1.1) 23 (1.0)
Hepatocellular Adenoma, Multiple 15 31** 30**
Hepatocellular Adenoma (includes multiple)d
Overall ratee 26/50 (52%) 41/50 (82%) 43/50 (86%)
Adjusted ratef 57.8% 88.2% 89.3%
Terminal rateg 23/34 (68%) 33/35 (94%) 29/31 (94%)
First incidence (days) 468 533 525 Poly-3 test
h P<0.001 P<0.001 P<0.001
Hepatocellular Carcinoma, Multiple 1 4 9**
Hepatocellular Carcinoma, (includes multiple)i
Overall rate 14/50 (28%) 20/50 (40%) 28/50 (56%) Adjusted rate 30.6% 42.8% 58.8% Terminal rate 8/34 (24%) 13/35 (37%) 16/31 (52%) First incidence (days) 611 533 450 Poly-3 test P=0.003 P=0.158 P=0.004
Hepatocellular Adenoma or Carcinomaj
Overall rate 33/50 (66%) 44/50 (88%) 48/50 (96%) Adjusted rate 71.0% 92.6% 96.6% Terminal rate 25/34 (74%) 33/35 (94%) 30/31 (97%) First incidence (days) 468 533 450 Poly-3 test P<0.001 P=0.003 P<0.001
Hepatoblastomak
Overall rate 4/50 (8%) 6/50 (12%) 11/50 (22%) Adjusted rate 9.0% 13.3% 25.0% Terminal rate 3/34 (9%) 3/35 (9%) 7/31 (23%) First incidence (days) 599 582 660 Poly-3 test P=0.027 P=0.382 P=0.041
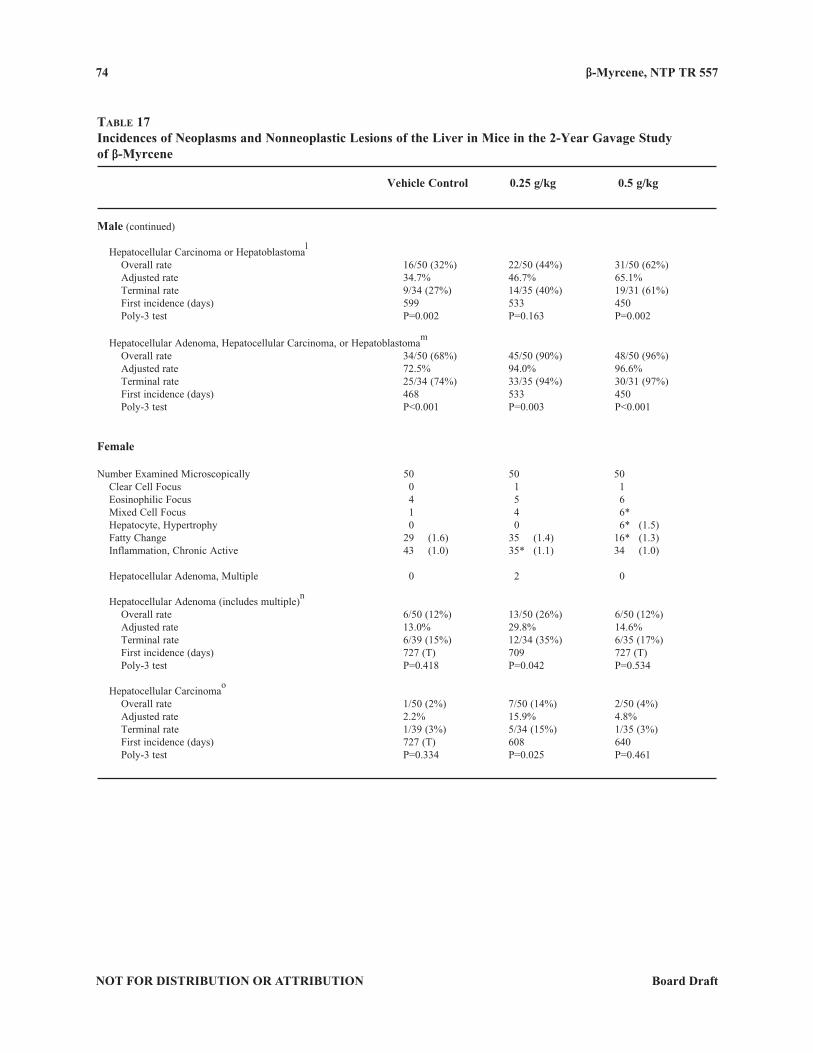
β-Myrcene, NTP TR 557 74
NOT FOR DISTRIBUTION OR ATTRIBUTION Board Draft
table 17Incidences of Neoplasms and Nonneoplastic Lesions of the Liver in Mice in the 2-Year Gavage Study of β-Myrcene
Vehicle Control 0.25 g/kg 0.5 g/kg
Male (continued)
Hepatocellular Carcinoma or Hepatoblastomal
Overall rate 16/50 (32%) 22/50 (44%) 31/50 (62%) Adjusted rate 34.7% 46.7% 65.1% Terminal rate 9/34 (27%) 14/35 (40%) 19/31 (61%) First incidence (days) 599 533 450 Poly-3 test P=0.002 P=0.163 P=0.002
Hepatocellular Adenoma, Hepatocellular Carcinoma, or Hepatoblastomam
Overall rate 34/50 (68%) 45/50 (90%) 48/50 (96%) Adjusted rate 72.5% 94.0% 96.6% Terminal rate 25/34 (74%) 33/35 (94%) 30/31 (97%) First incidence (days) 468 533 450 Poly-3 test P<0.001 P=0.003 P<0.001
Female
Number Examined Microscopically 50 50 50 Clear Cell Focus 0 1 1 Eosinophilic Focus 4 5 6 Mixed Cell Focus 1 4 6* Hepatocyte, Hypertrophy 0 0 6* (1.5) Fatty Change 29 (1.6) 35 (1.4) 16* (1.3) Inflammation, Chronic Active 43 (1.0) 35* (1.1) 34 (1.0)
Hepatocellular Adenoma, Multiple 0 2 0
Hepatocellular Adenoma (includes multiple)n
Overall rate 6/50 (12%) 13/50 (26%) 6/50 (12%) Adjusted rate 13.0% 29.8% 14.6% Terminal rate 6/39 (15%) 12/34 (35%) 6/35 (17%) First incidence (days) 727 (T) 709 727 (T) Poly-3 test P=0.418 P=0.042 P=0.534
Hepatocellular Carcinomao
Overall rate 1/50 (2%) 7/50 (14%) 2/50 (4%) Adjusted rate 2.2% 15.9% 4.8% Terminal rate 1/39 (3%) 5/34 (15%) 1/35 (3%) First incidence (days) 727 (T) 608 640 Poly-3 test P=0.334 P=0.025 P=0.461
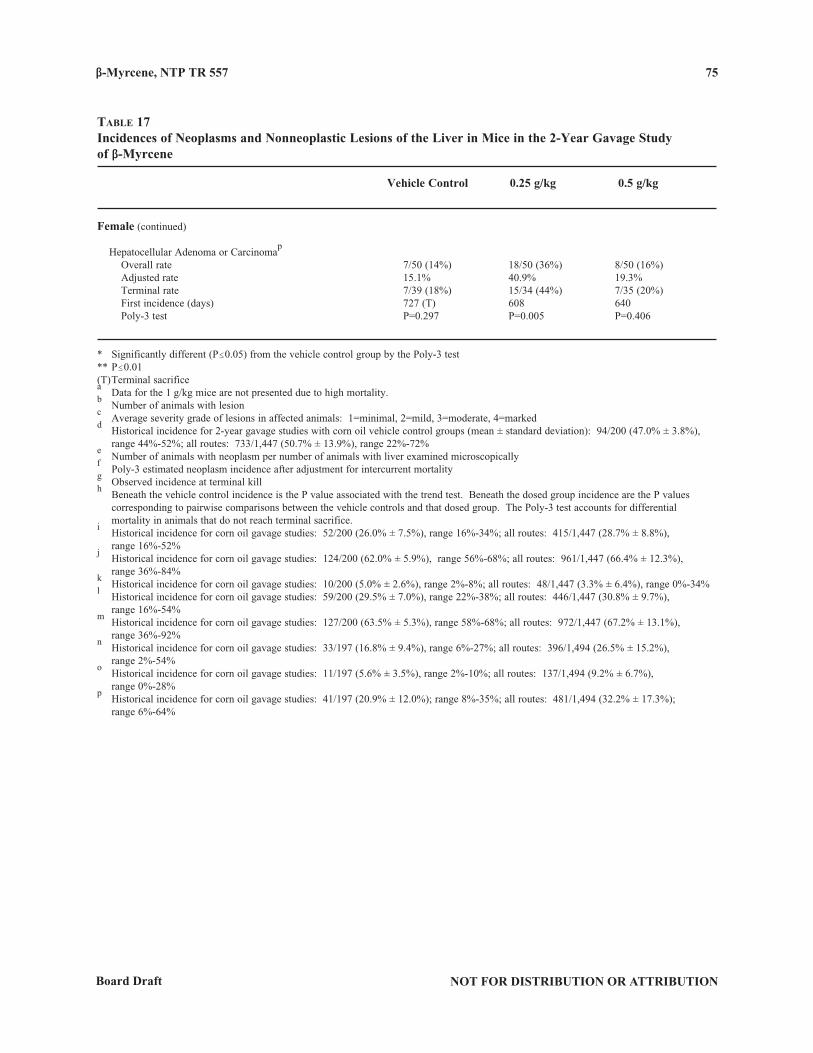
β-Myrcene, NTP TR 557
NOT FOR DISTRIBUTION OR ATTRIBUTIONBoard Draft
75
table 17Incidences of Neoplasms and Nonneoplastic Lesions of the Liver in Mice in the 2-Year Gavage Study of β-Myrcene
Vehicle Control 0.25 g/kg 0.5 g/kg
Female (continued)
Hepatocellular Adenoma or Carcinomap
Overall rate 7/50 (14%) 18/50 (36%) 8/50 (16%) Adjusted rate 15.1% 40.9% 19.3% Terminal rate 7/39 (18%) 15/34 (44%) 7/35 (20%) First incidence (days) 727 (T) 608 640 Poly-3 test P=0.297 P=0.005 P=0.406
* Significantly different (P#0.05) from the vehicle control group by the Poly-3 test** P#0.01(T) Terminal sacrificea Data for the 1 g/kg mice are not presented due to high mortality.
b Number of animals with lesion
c Average severity grade of lesions in affected animals: 1=minimal, 2=mild, 3=moderate, 4=marked
d Historical incidence for 2-year gavage studies with corn oil vehicle control groups (mean ± standard deviation): 94/200 (47.0% ± 3.8%),
range 44%-52%; all routes: 733/1,447 (50.7% ± 13.9%), range 22%-72%e Number of animals with neoplasm per number of animals with liver examined microscopically
f Poly-3 estimated neoplasm incidence after adjustment for intercurrent mortality
g Observed incidence at terminal kill
h Beneath the vehicle control incidence is the P value associated with the trend test. Beneath the dosed group incidence are the P values
corresponding to pairwise comparisons between the vehicle controls and that dosed group. The Poly-3 test accounts for differential mortality in animals that do not reach terminal sacrifice.i Historical incidence for corn oil gavage studies: 52/200 (26.0% ± 7.5%), range 16%-34%; all routes: 415/1,447 (28.7% ± 8.8%), range 16%-52%j Historical incidence for corn oil gavage studies: 124/200 (62.0% ± 5.9%), range 56%-68%; all routes: 961/1,447 (66.4% ± 12.3%), range 36%-84% k Historical incidence for corn oil gavage studies: 10/200 (5.0% ± 2.6%), range 2%-8%; all routes: 48/1,447 (3.3% ± 6.4%), range 0%-34%
l Historical incidence for corn oil gavage studies: 59/200 (29.5% ± 7.0%), range 22%-38%; all routes: 446/1,447 (30.8% ± 9.7%), range 16%-54%m
Historical incidence for corn oil gavage studies: 127/200 (63.5% ± 5.3%), range 58%-68%; all routes: 972/1,447 (67.2% ± 13.1%), range 36%-92% n Historical incidence for corn oil gavage studies: 33/197 (16.8% ± 9.4%), range 6%-27%; all routes: 396/1,494 (26.5% ± 15.2%),
range 2%-54%o Historical incidence for corn oil gavage studies: 11/197 (5.6% ± 3.5%), range 2%-10%; all routes: 137/1,494 (9.2% ± 6.7%),
range 0%-28%p Historical incidence for corn oil gavage studies: 41/197 (20.9% ± 12.0%); range 8%-35%; all routes: 481/1,494 (32.2% ± 17.3%);
range 6%-64%
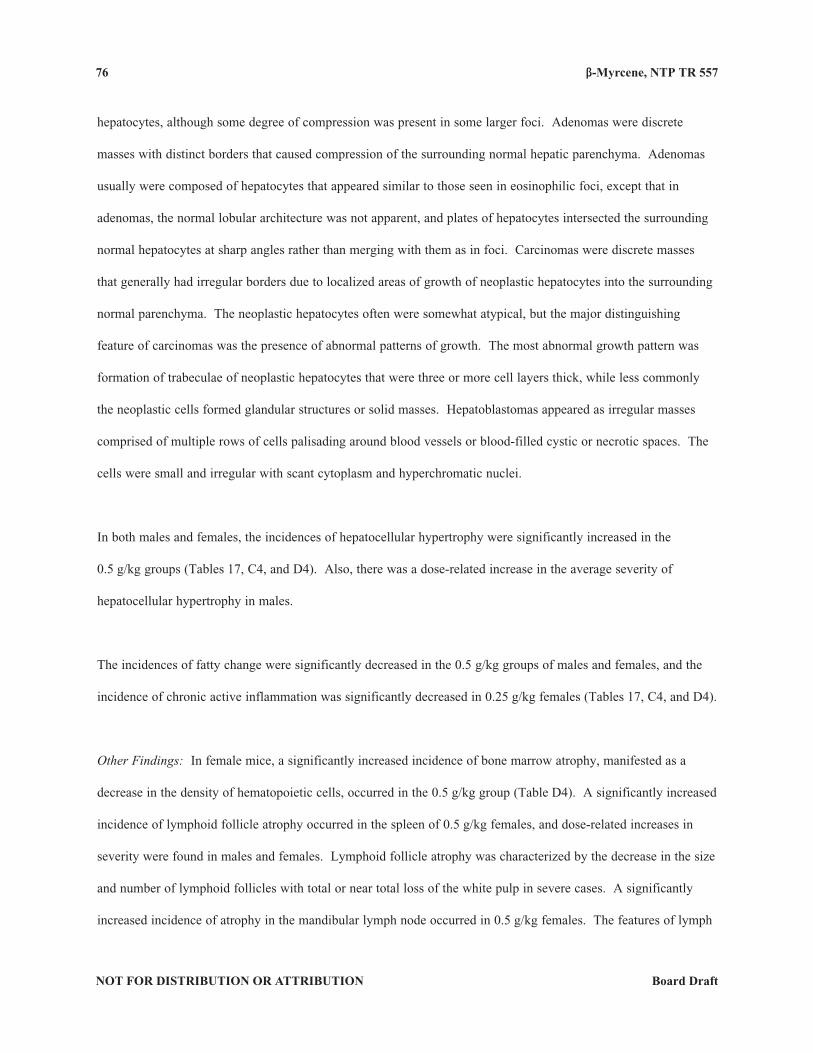
β-Myrcene, NTP TR 557 76
NOT FOR DISTRIBUTION OR ATTRIBUTION Board Draft
hepatocytes, although some degree of compression was present in some larger foci. Adenomas were discrete
masses with distinct borders that caused compression of the surrounding normal hepatic parenchyma. Adenomas
usually were composed of hepatocytes that appeared similar to those seen in eosinophilic foci, except that in
adenomas, the normal lobular architecture was not apparent, and plates of hepatocytes intersected the surrounding
normal hepatocytes at sharp angles rather than merging with them as in foci. Carcinomas were discrete masses
that generally had irregular borders due to localized areas of growth of neoplastic hepatocytes into the surrounding
normal parenchyma. The neoplastic hepatocytes often were somewhat atypical, but the major distinguishing
feature of carcinomas was the presence of abnormal patterns of growth. The most abnormal growth pattern was
formation of trabeculae of neoplastic hepatocytes that were three or more cell layers thick, while less commonly
the neoplastic cells formed glandular structures or solid masses. Hepatoblastomas appeared as irregular masses
comprised of multiple rows of cells palisading around blood vessels or blood-filled cystic or necrotic spaces. The
cells were small and irregular with scant cytoplasm and hyperchromatic nuclei.
In both males and females, the incidences of hepatocellular hypertrophy were significantly increased in the
0.5 g/kg groups (Tables 17, C4, and D4). Also, there was a dose-related increase in the average severity of
hepatocellular hypertrophy in males.
The incidences of fatty change were significantly decreased in the 0.5 g/kg groups of males and females, and the
incidence of chronic active inflammation was significantly decreased in 0.25 g/kg females (Tables 17, C4, and D4).
Other Findings: In female mice, a significantly increased incidence of bone marrow atrophy, manifested as a
decrease in the density of hematopoietic cells, occurred in the 0.5 g/kg group (Table D4). A significantly increased
incidence of lymphoid follicle atrophy occurred in the spleen of 0.5 g/kg females, and dose-related increases in
severity were found in males and females. Lymphoid follicle atrophy was characterized by the decrease in the size
and number of lymphoid follicles with total or near total loss of the white pulp in severe cases. A significantly
increased incidence of atrophy in the mandibular lymph node occurred in 0.5 g/kg females. The features of lymph
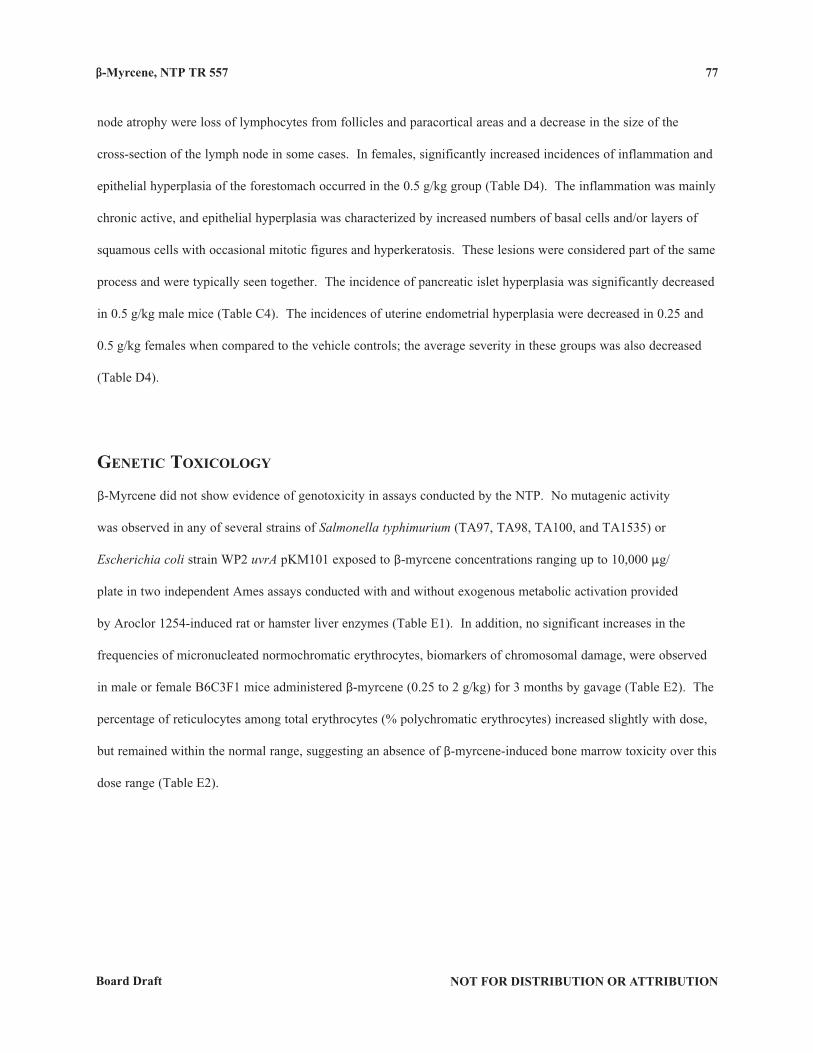
β-Myrcene, NTP TR 557
NOT FOR DISTRIBUTION OR ATTRIBUTIONBoard Draft
77
node atrophy were loss of lymphocytes from follicles and paracortical areas and a decrease in the size of the
cross-section of the lymph node in some cases. In females, significantly increased incidences of inflammation and
epithelial hyperplasia of the forestomach occurred in the 0.5 g/kg group (Table D4). The inflammation was mainly
chronic active, and epithelial hyperplasia was characterized by increased numbers of basal cells and/or layers of
squamous cells with occasional mitotic figures and hyperkeratosis. These lesions were considered part of the same
process and were typically seen together. The incidence of pancreatic islet hyperplasia was significantly decreased
in 0.5 g/kg male mice (Table C4). The incidences of uterine endometrial hyperplasia were decreased in 0.25 and
0.5 g/kg females when compared to the vehicle controls; the average severity in these groups was also decreased
(Table D4).
genetic toxicology
β-Myrcene did not show evidence of genotoxicity in assays conducted by the NTP. No mutagenic activity
was observed in any of several strains of Salmonella typhimurium (TA97, TA98, TA100, and TA1535) or
Escherichia coli strain WP2 uvrA pKM101 exposed to β-myrcene concentrations ranging up to 10,000 :g/
plate in two independent Ames assays conducted with and without exogenous metabolic activation provided
by Aroclor 1254-induced rat or hamster liver enzymes (Table E1). In addition, no significant increases in the
frequencies of micronucleated normochromatic erythrocytes, biomarkers of chromosomal damage, were observed
in male or female B6C3F1 mice administered β-myrcene (0.25 to 2 g/kg) for 3 months by gavage (Table E2). The
percentage of reticulocytes among total erythrocytes (% polychromatic erythrocytes) increased slightly with dose,
but remained within the normal range, suggesting an absence of β-myrcene-induced bone marrow toxicity over this
dose range (Table E2).

β-Myrcene, NTP TR 557 78
NOT FOR DISTRIBUTION OR ATTRIBUTION Board Draft
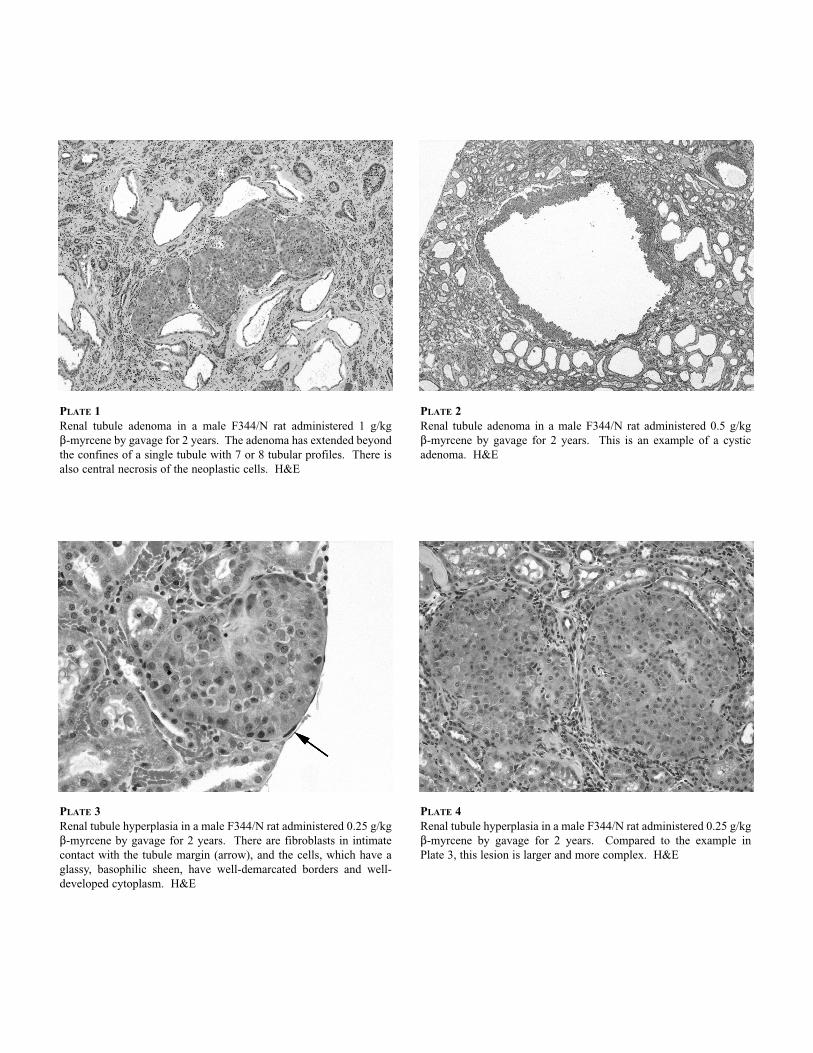
PLATE 1Renal tubule adenoma in a male F344/N rat administered 1 g/kg$-myrcene by gavage for 2 years. The adenoma has extended beyondthe confines of a single tubule with 7 or 8 tubular profiles. There isalso central necrosis of the neoplastic cells. H&E
PLATE 2Renal tubule adenoma in a male F344/N rat administered 0.5 g/kg$-myrcene by gavage for 2 years. This is an example of a cysticadenoma. H&E
PLATE 3Renal tubule hyperplasia in a male F344/N rat administered 0.25 g/kg$-myrcene by gavage for 2 years. There are fibroblasts in intimatecontact with the tubule margin (arrow), and the cells, which have aglassy, basophilic sheen, have well-demarcated borders and well-developed cytoplasm. H&E
PLATE 4Renal tubule hyperplasia in a male F344/N rat administered 0.25 g/kg$-myrcene by gavage for 2 years. Compared to the example inPlate 3, this lesion is larger and more complex. H&E
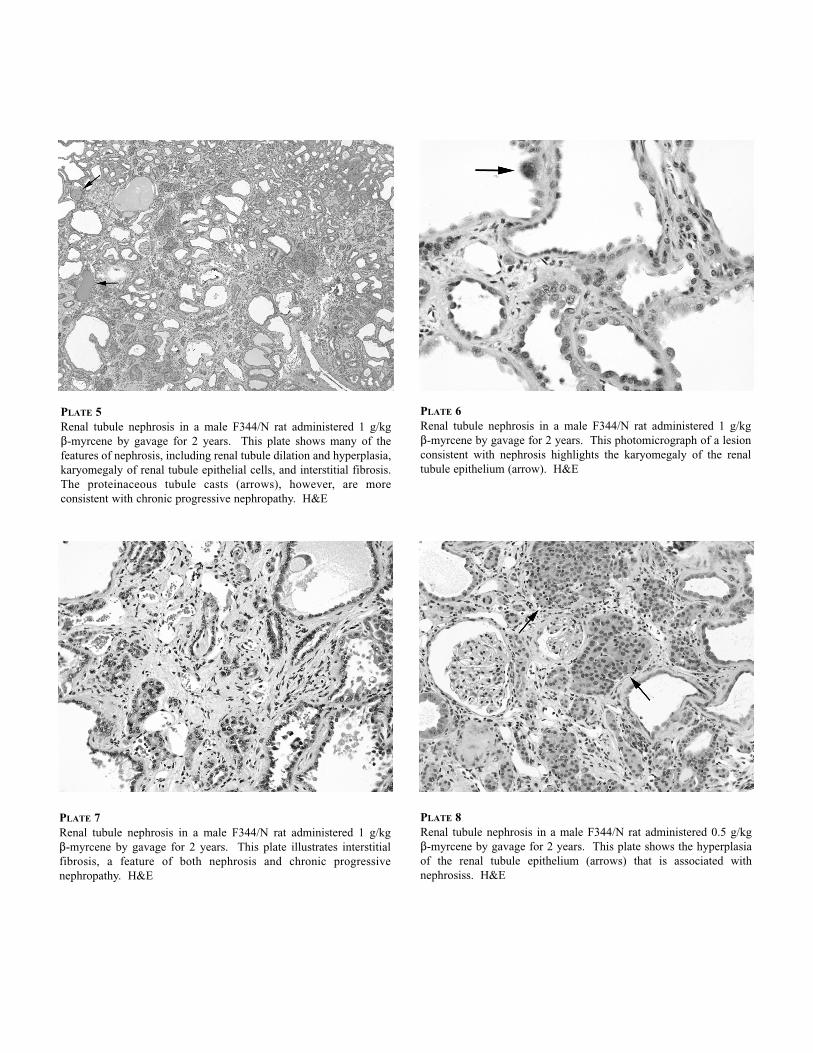
PLATE 5Renal tubule nephrosis in a male F344/N rat administered 1 g/kg$-myrcene by gavage for 2 years. This plate shows many of thefeatures of nephrosis, including renal tubule dilation and hyperplasia,karyomegaly of renal tubule epithelial cells, and interstitial fibrosis.The proteinaceous tubule casts (arrows), however, are moreconsistent with chronic progressive nephropathy. H&E
PLATE 6Renal tubule nephrosis in a male F344/N rat administered 1 g/kg$-myrcene by gavage for 2 years. This photomicrograph of a lesionconsistent with nephrosis highlights the karyomegaly of the renaltubule epithelium (arrow). H&E
PLATE 7Renal tubule nephrosis in a male F344/N rat administered 1 g/kg$-myrcene by gavage for 2 years. This plate illustrates interstitialfibrosis, a feature of both nephrosis and chronic progressivenephropathy. H&E
PLATE 8Renal tubule nephrosis in a male F344/N rat administered 0.5 g/kg$-myrcene by gavage for 2 years. This plate shows the hyperplasiaof the renal tubule epithelium (arrows) that is associated withnephrosiss. H&E
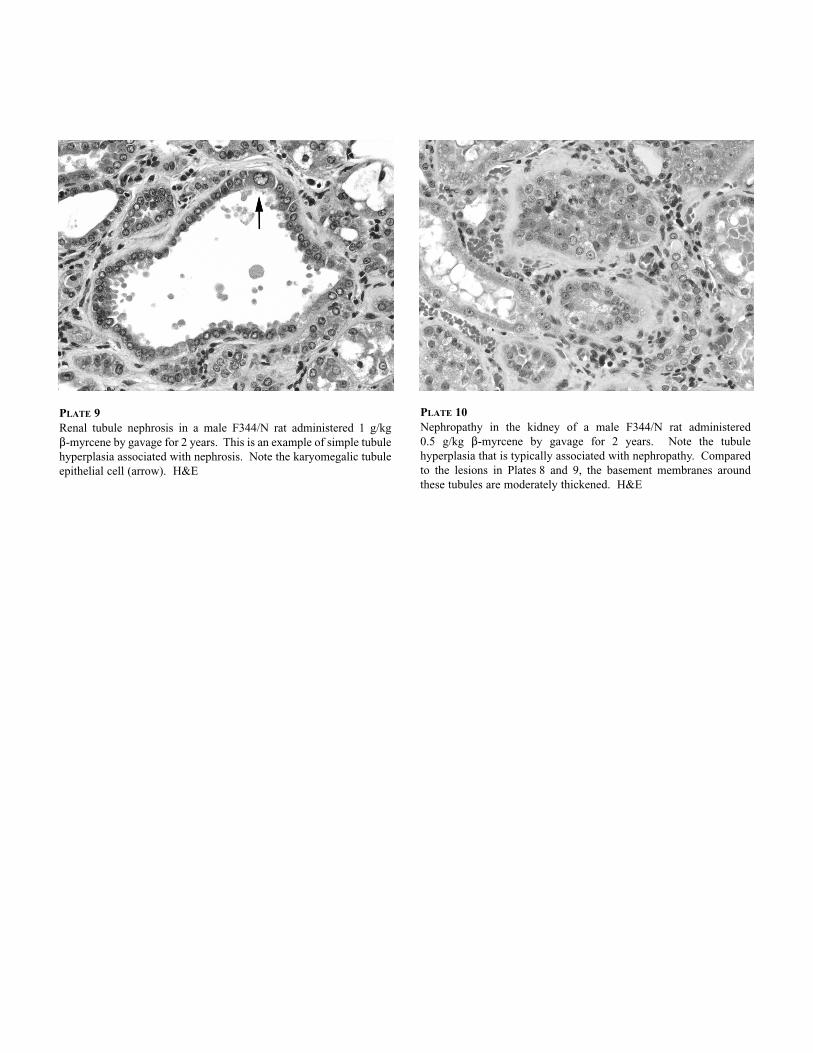
PLATE 9Renal tubule nephrosis in a male F344/N rat administered 1 g/kg$-myrcene by gavage for 2 years. This is an example of simple tubulehyperplasia associated with nephrosis. Note the karyomegalic tubuleepithelial cell (arrow). H&E
PLATE 10Nephropathy in the kidney of a male F344/N rat administered0.5 g/kg $-myrcene by gavage for 2 years. Note the tubulehyperplasia that is typically associated with nephropathy. Comparedto the lesions in Plates 8 and 9, the basement membranes aroundthese tubules are moderately thickened. H&E
NOT FOR DISTRIBUTION OR ATTRIBUTIONBoard Draft NOT FOR DISTRIBUTION OR ATTRIBUTIONBoard Draft
7979
DISCUSSION AND CONCLUSIONS
β‑Myrcene is a ubiquitous chemical in the environment produced by many plant species. It is found in verbena,
galbanum, and lemongrass oils and is the major constituent of hop and bay oils used as flavoring additives in food
and alcoholic beverages (Madyastha and Srivatsan, 1987; Lorente et al., 1989; Delgado et al., 1993b). It is used
commercially as an intermediate in the production of terpene alcohols (geraniol, nerol, and linalool), which serve
as intermediates for the production of scents in cosmetics, soaps, and detergents (Kuney, 1994). β‑myrcene was
nominated for study based on its estimated high production volume, widespread human exposure, and lack of
toxicity and carcinogenicity data. It is structurally related to d‑limonene, which induced neoplasms in the kidneys
of male rats in association with "2u‑globulin (hyaline droplet) nephropathy (NTP, 1990).
The 3‑month toxicity studies were conducted without any preceding dose‑range‑finding studies; the highest dose
concentration was selected based on the published toxicity information for β‑myrcene. In the absence of a range‑
finding study, it was expected that there would be frank toxicity at the high dose concentration and a gradation
of adverse effects at the lower dose concentrations. However, all 4 g/kg rats and mice, most 2 g/kg mice, and a
few 2 g/kg rats died by week 4, most during week 1. At 1 g/kg, one male and one female rat died due to dosing
accidents. The final mean body weights of the surviving 1 g/kg male and female rats were 89% and 94%,
respectively, relative to those of the vehicle controls; those of the 1 g/kg male and female mice were 91% and
97%, respectively, relative to those of the vehicle controls. The renal tubule necrosis observed in the 1 g/kg male
and female rats in the 3‑month study was considered mild and not life threatening to the animals. Thus, 1 g/kg
was selected as the high dose concentration for rats and mice in the 2‑year studies.
In the 2‑year studies, all 1 g/kg male rats died early, and survival of 1 g/kg male and female mice was significantly
decreased. Early deaths occurred primarily between 60 weeks and 85 weeks of administration. Deaths were
β-Myrcene, NTP TR 557 80
NOT FOR DISTRIBUTION OR ATTRIBUTION Board Draft
attributed to renal toxicity [nephrosis and chronic progressive nephropathy (CPN)] for male rats, but the cause of
deaths for male and female mice was uncertain. Mortality in the 1 g/kg mice was not predicted based on the data
from the corresponding 3‑month studies. The 1 g/kg dose in the 2‑year studies was considered to have exceeded
the maximum tolerated dose for male rats and male and female mice.
In the 3‑month and 2‑year rat studies, the kidney was a primary target of β‑myrcene‑induced toxicity and
carcinogenicity. Nephrotoxicity was not observed in male or female mice in the 3‑month or 2‑year studies. Three
distinct renal lesions occurred in the male rats, including "2u‑globulin nephropathy, CPN, and nephrosis. The
latter two renal lesions were also observed in female rats. "2u‑Globulin nephropathy is a renal syndrome in male
rats characterized by the accumulation of a protein, "2u‑globulin, in the form of brightly stained eosinophilic
hyaline droplets in the cytoplasm of the proximal tubule epithelium (Swenberg et al., 1989; Hard et al., 1993;
Swenberg and Lehman‑McKeeman, 1999). The proposed sequence of events in the pathogenesis of "2u‑globulin
nephropathy involves binding of a chemical or its metabolites to "2u‑globulin, which changes the conformation
of the protein and decreases the rate of or prevents its degradation, ultimately resulting in accumulation within
phagolysosomes of the renal tubule epithelial cells. The accumulation of "2u‑globulin is thought to cause
lysosomal dysfunction and subsequent release of lysosomal enzymes into the cytoplasm, resulting in a cycle
of cytotoxicity, cell death, and a compensatory increase in cell proliferation that, if chronic, may lead to the
promotion of neoplastic lesions (Swenberg et al., 1989; Borghoff et al., 1990). Female F344/N rats and mice of
either sex do not produce "2u‑globulin and thus do not develop "2u‑globulin nephropathy (MacInnes et al., 1986;
Chatterjee et al., 1989; Lehman‑McKeeman and Caudill, 1992). CPN is one of the most commonly observed
spontaneous lesions in the rat and as a syndrome is more prevalent and severe in male rats (Seely et al., 2002).
However, this syndrome can be exacerbated by chemical exposure resulting in increased incidences and average
severities (Lock and Hard, 2004). Nephrosis is an uncommon lesion defined as renal tubule epithelial degeneration
and regeneration.
β-Myrcene, NTP TR 557 81
NOT FOR DISTRIBUTION OR ATTRIBUTIONBoard Draft
In the 3‑month β‑myrcene studies, hyaline droplets were observed in the renal tubule epithelium of all vehicle
controls and dose groups of male rats on day 23 when kidneys were stained with the Mallory‑Heidenhain method.
The histopathologic changes in the kidneys of these animals, including the amount of hyaline droplets and the
changes in the hyaline droplet pattern, were consistent with "2u‑globulin (hyaline droplet) nephropathy (Hard
et al., 1993; Hard, 2008). Hyaline droplets were not observed in female rats or male or female mice. The rats
from the 4 g/kg dose group died prior to the end of the study and were not evaluated. In the 2 g/kg male rats from
both studies, the incidence of hyaline droplet accumulation and the size and number of the hyaline droplets in the
renal tubule epithelium were decreased, suggesting that the renal lesions in the 2 g/kg and greater groups were not
related to hyaline droplet nephropathy or an "2u‑globulin‑associated mechanism.
In the 21‑day d‑limonene studies (NTP, 1990), there was a dose‑related increase in the incidences of hyaline
droplet accumulation in the kidneys of male rats as well as changes in the hyaline droplet pattern similar to those
seen in the current β‑myrcene studies. In the 3‑month studies, there was no increase in the incidences of hyaline
droplets in the dosed male rats compared to the vehicle controls; but there were other changes in these animals
consistent with hyaline droplet nephropathy, including granular casts in the outer medulla and degeneration and
regeneration of the epithelium of the convoluted tubules (NTP, 1990; Hard et al., 1993). The droplets in the
d‑limonene study stained immunohistochemically for "2u‑globulin (NTP, 1990). d‑Limonene induced renal
neoplasms in male rats only, presumably through an "2u‑globulin‑associated mechanism (NTP, 1990; Hard et al.,
1993).
In the 2‑year rat study, there was clear evidence of carcinogenic activity of β‑myrcene in male rats based on
the increased incidences of renal tubule adenoma or carcinoma (combined) in the 0.25 and 0.5 g/kg groups. In
the females, the incidence of renal tubule adenoma was not significantly increased relative to controls, but was
slightly above the historical control range in the 1 g/kg group. In females, the marginally increased incidence of
renal tubule adenoma was considered to be equivocal evidence of carcinogenicity. β‑Myrcene administration also
resulted in the increased incidence and/or severity of a number of nonneoplastic renal lesions, including nephrosis
β-Myrcene, NTP TR 557 82
NOT FOR DISTRIBUTION OR ATTRIBUTION Board Draft
and exacerbation of CPN in both sexes, and papillary mineralization in the males. The papillary mineralization
had a linear appearance and was found in the loops of Henle in the medulla. This type of mineralization, which
is considered a chronic manifestation of "2u‑globulin nephropathy, was also seen in NTP chronic studies of the
structurally related compound d‑limonene (NTP, 1990; Hard et al., 1993).
Nephrosis was a unique lesion in the 2‑year study of β‑myrcene in rats and was more severe in males than in
females. The pathogenesis of this lesion is unknown, but the colocalization of this lesion with the renal tubule
necrosis in the outer stripe of the outer medulla (in the 3‑month study) and the proliferative nature of the nephrosis
(as evidenced by the karyomegaly and tubule hyperplasia) suggest that it is an unusual response to repeated renal
tubule epithelial cell injury, primarily in the P3 segment of the proximal tubules. Whether or not this unusual
regenerative response could lead ultimately to neoplasia, either directly or through exacerbation of CPN, is not
clear. Nephrosis was not seen in the d‑limonene studies, nor was renal tubule necrosis seen in the outer stripe of
the outer medulla (NTP, 1990).
The mechanism of β‑myrcene‑induced renal carcinogenesis in male and female rats is not clear. The observation
of "2u‑globulin nephropathy and linear papillary mineralization in male rats suggests this syndrome as one
potential mechanism of carcinogenesis. However, several lines of evidence suggest that β‑myrcene might
cause nephrotoxicity by a mechanism other than, or in addition to, "2u‑globulin nephropathy. The incidence
and severity of linear papillary mineralization were greatest in the 0.25 g/kg males but slightly decreased in the
0.5 g/kg males; this response is consistent with the decrease in the incidences of hyaline droplet accumulation
seen in the 3‑month study. Additionally, there were dose‑related increases in the incidence and severity of CPN
and nephrosis in both the male and female rats. The presence of renal neoplasms in female rats also suggests
a mechanism of carcinogenesis that may be related to the nephrosis and is distinct from the "2u‑globulin
mechanism.
In male and female mice, the liver was a primary target of β‑myrcene toxicity. In the 3‑month study, absolute and
relative liver weights were increased in male and female mice. In the 2‑year study, there was clear evidence of
β-Myrcene, NTP TR 557
NOT FOR DISTRIBUTION OR ATTRIBUTIONBoard Draft
83
carcinogenicity in male mice based on increased incidences of liver neoplasms. The incidences of hepatocellular
adenoma were significantly increased in 0.25 and 0.5 g/kg males, and the incidences of hepatocellular carcinoma
and of hepatoblastoma were significantly increased in the 0.5 g/kg group. When these neoplasm types were
combined, the increases were statistically significant in the 0.25 and 0.5 g/kg groups.
In female mice, the incidence of hepatocellular adenoma or carcinoma (combined) was increased in the 0.25 g/kg
group compared to the vehicle controls, while those in the 0.5 g/kg group were similar to vehicle controls. The
incidences of these neoplasms were within or slightly higher than the historical control range for 2‑year corn oil
gavage studies. The lack of a dose‑response in the 1 g/kg group is likely due to the reduction in body weight gain
combined with somewhat shorter survival in this dose group. The marginally increased incidence in the 0.5 g/kg
group was considered to be equivocal evidence of carcinogenicity in female mice. In contrast, administration of
d‑limonene did not induce liver lesions in mice in the 3‑month study, nor did it induce significant increases in liver
neoplasms in the 2‑year study (NTP, 1990).
β‑Myrcene appears to be more irritating and toxic than d‑limonene (NTP, 1990) in rats. β‑Myrcene‑induced
lesions in the nose (olfactory epithelium degeneration, suppurative inflammation, and chronic inflammation) of
male and female rats and forestomach inflammation of female rats in the 3‑month study and inflammation in the
nose and forestomach of male rats in the 2‑year study; these lesions were not seen in the d‑limonene study (NTP,
1990).
Further studies are needed to understand the mechanism of action of β‑myrcene‑induced toxicity and
carcinogenesis in rats and mice. β‑Myrcene and d‑limonene are not mutagenic nor clastogenic. d‑Limonene
interacts with "2u‑globulin to induce kidney neoplasms in male rats (NTP, 1990). There is no evidence that
d‑limonene reacts with DNA and induces neoplasms at any other organ site. β‑Myrcene may be metabolized by
P450 to an epoxide, which may have the ability to alkylate DNA. The NTP could not procure labeled β‑myrcene,
and no disposition or metabolism studies were conducted.
β-Myrcene, NTP TR 557 84
NOT FOR DISTRIBUTION OR ATTRIBUTION Board Draft
ConClusions
Under the conditions of these 2‑year gavage studies, there was clear evidence of carcinogenic activity of
β‑myrcene in male F344/N rats based on increased incidences of renal tubule neoplasms. There was equivocal
evidence of carcinogenic activity of β‑myrcene in female F344/N rats based on increased incidences of renal
tubule adenoma. There was clear evidence of carcinogenic activity of β‑myrcene in male B6C3F1 mice based on
increased incidences of liver neoplasms. There was equivocal evidence of carcinogenic activity of β‑myrcene in
female B6C3F1 mice based on marginally increased incidences of hepatocellular neoplasms.
Administration of β‑myrcene induced nonneoplastic lesions in the kidney of male and female rats, nose of male
rats, and liver of male and female mice.
__________
* Explanation of Levels of Evidence of Carcinogenic Activity is on page 12.
NOT FOR DISTRIBUTION OR ATTRIBUTIONBoard Draft NOT FOR DISTRIBUTION OR ATTRIBUTIONBoard Draft
8585
REFERENCES
The Aldrich Library of 13C and 1H FT‑NMR Spectra (1992). 2nd ed. (C.J. Pouchert and J. Behnke, Eds.), Spectrum 41B. Aldrich Chemical Company, Inc., Milwaukee, WI.
The Aldrich Library of FT‑IR Spectra (1997). 2nd ed., Vol II, Spectrum I: 46B. Aldrich Chemical Company, Inc., Milwaukee, WI.
Anderson, B.E., Zeiger, E., Shelby, M.D., Resnick, M.A., Gulati, D.K., Ivett, J.L., and Loveday, K.S. (1990). Chromosome aberration and sister chromatid exchange test results with 42 chemicals. Environ. Mol. Mutagen. 16 (Suppl. 18), 55‑137.
Ashby, J., and Tennant, R.W. (1991). Definitive relationships among chemical structure, carcinogenicity and mutagenicity for 301 chemicals tested by the U.S. NTP. Mutat. Res. 257, 229‑306.
Austin, C.A., Shephard, E.A., Pike, S.F., Rabin, B.R., and Phillips, I.R. (1988). The effect of terpenoid compounds on cytochrome P‑450 levels in rat liver. Biochem. Pharmacol. 37, 2223‑2229.
Bailer, A.J., and Portier, C.J. (1988). Effects of treatment‑induced mortality and tumor‑induced mortality on tests for carcinogenicity in small samples. Biometrics 44, 417‑431.
Bieler, G.S., and Williams, R.L. (1993). Ratio estimates, the delta method, and quantal response tests for increased carcinogenicity. Biometrics 49, 793‑801.
Boorman, G.A., Montgomery, C.A., Jr., Eustis, S.L., Wolfe, M.J., McConnell, E.E., and Hardisty, J.F. (1985). Quality assurance in pathology for rodent carcinogenicity studies. In Handbook of Carcinogen Testing (H.A. Milman and E.K. Weisburger, Eds.), pp. 345‑357. Noyes Publications, Park Ridge, NJ.
Borghoff, S.J., Short, B.G., and Swenberg, J.A. (1990). Biochemical mechanisms and pathobiology of alpha 2u‑globulin nephropathy. Annu. Rev. Pharmacol. Toxicol. 30, 349‑367.
Chatterjee, B., Demyan, W.F., Song, C.S., Garg, B.D., and Roy, A.K. (1989). Loss of androgenic induction of alpha 2u‑globulin gene family in the liver of NIH black rats. Endocrinology 125, 1385‑1388.
Code of Federal Regulations (CFR) 21, Part 58.
Code of Federal Regulations (CFR) 21, § 172.510.
Code of Federal Regulations (CFR) 21, § 172.515.
Code of Federal Regulations (CFR) 40, § 414.101.
Cox, D.R. (1972). Regression models and life‑tables. J. R. Stat. Soc. B34, 187‑220.
β-Myrcene, NTP TR 557 86
NOT FOR DISTRIBUTION OR ATTRIBUTION Board Draft
Crawford, B.D. (1985). Perspectives on the somatic mutation model of carcinogenesis. In Advances in Modern Environmental Toxicology. Mechanisms and Toxicity of Chemical Carcinogens and Mutagens (M.A. Mehlman, W.G. Flamm, and R.J. Lorentzen, Eds.), pp. 13‑59. Princeton Scientific Publishing Co., Inc., Princeton, NJ.
CRC Handbook of Chemistry and Physics (1981). 62nd ed. (R.C. Weast and M.J. Astle, Eds.), p. C‑378. CRC Press, Inc. Boca Raton, FL.
Cronn, P.L., Truitt, S.G., and Campbell, M.J. (1983). Chemical characterization of plywood veneer dryer emissions. Atmos. Environ. 17, 201‑212.
Crowell, P.L., Ren, Z., Lin, S., Vedejs, E., and Gould, M.N. (1994). Structure‑activity relationships among monoterpene inhibitors of protein isoprenylation and cell proliferation. Biochem. Pharmacol. 47, 1405‑1415.
da‑Silva, V.A., de‑Freitas, J.C., Mattos, A.P., Paiva‑Gouvea, W., Presgrave, O.A., Fingola, F.F., Menezes, M.A., and Paumgartten, F.J. (1991). Neurobehavioral study of the effect of beta‑myrcene on rodents. Braz. J. Med. Biol. Res. 24, 827‑831.
Delgado, I.F., Nogueira, A.C., Souza, C.A., Costa, A.M., Figueiredo, L.H., Mattos, A.P., Chahoud, I., and Paumgartten, F.J. (1993a). Peri‑ and postnatal developmental toxicity of beta‑myrcene in the rat. Food Chem. Toxicol. 31, 623‑628.
Delgado, I.F., Carvalho, R.R., Nogueira, A.C., Mattos, A.P., Figueiredo, L.H., Oliveira, S.H., Chahoud, I., and Paumgartten, F.J. (1993b). Study on embryo‑foetotoxicity of beta‑myrcene in the rat. Food Chem. Toxicol. 31, 31‑35.
De‑Oliveira, A.C.A.X., Ribeiro‑Pinta, L.F., Otto, S.S., Goncalves, A., and Paumgartten, F.J.R. (1997). Induction of liver monooxygenases by β‑myrcene. Toxicology 124, 135‑140.
Dixon, W.J., and Massey, F.J., Jr. (1957). Introduction to Statistical Analysis, 2nd ed., pp. 276‑278, 412. McGraw‑Hill Book Company, Inc., New York.
Dunn, O.J. (1964). Multiple comparisons using rank sums. Technometrics 6, 241‑252.
Dunnett, C.W. (1955). A multiple comparison procedure for comparing several treatments with a control. J. Am. Stat. Assoc. 50, 1096‑1121.
Freitas, J.C.B., Presgrave, O.A.F., Fingola, F.F., Menezes, M.A., and Paumgartten, F.J. (1993). Effect of beta‑myrcene on pentobarbital sleeping time. Braz. J. Med. Biol. Res. 26, 519‑523.
Gart, J.J., Chu, K.C., and Tarone, R.E. (1979). Statistical issues in interpretation of chronic bioassay tests for carcinogenicity. JNCI 62, 957‑974.
Gervasi, P.G., Citti, L., Del Monte, M., Longo, V., and Benetti, D. (1985). Mutagenicity and chemical reactivity of epoxidic intermediates of the isoprene metabolism and other structurally related compounds. Mutat. Res. 156, 77‑82.
Girard, D.M., and Sager, D.B. (1987). The use of Markov chains to detect subtle variation in reproductive cycling. Biometrics 43, 225‑234.
β-Myrcene, NTP TR 557
NOT FOR DISTRIBUTION OR ATTRIBUTIONBoard Draft
87
Gomes‑Carneiro, M.R., Viana, M.E.S., Felzenszwalb, I., and Paumgartten, F.J.R. (2005). Evaluation of β‑myrcene, "‑terpinene and (+)‑ and (‑)‑"‑pinene in the Salmonella/microsome assay. Food Chem. Toxicol. 43, 247‑252.
Guenther, A., Zimmerman, P., and Wildermuth, M. (1994). Natural volatile organic compound emission rate estimates for U.S. woodland landscapes. Atmos. Environ. 28, 1197‑1210.
Hard, G.C. (2008). Some aids to histological recognition of hyaline droplet nephropathy in 90‑day toxicity studies. Toxicol. Pathol. 36, 1014‑1017.
Hard, G.C., and Seely, J.C. (2005). Recommendations for the interpretation of renal tubule proliferative lesions occurring in rat kidneys with advanced chronic progressive nephropathy (CPN). Toxicol. Pathol. 33, 641‑649.
Hard, G.C., Rodgers, I.S., Baetcke, K.P., Richards, W.L., McGaughy, R.E., and Valcovic, L.R. (1993). Hazard evaluation of chemicals that cause accumulation of alpha 2u‑globulin, hyaline droplet nephropathy, and tubule neoplasia in the kidneys of male rats. Environ. Health Perspect. 99, 313‑349.
Hawley’s Condensed Chemical Dictionary (1993). 12th ed. (R.J. Lewis, Sr., Ed.). Van Nostrand Reinhold, New York.
Haworth, S., Lawlor, T. Mortelmans, K., Speck, W., and Zeiger, E. (1983). Salmonella mutagenicity test results for 250 chemicals. Environ. Mutagen. 5 (Suppl. 1), 3‑142.
Heddle, J.A., Hite, M., Kirkhart, B., Mavournin, K., MacGregor, J.T., Newell, G.W., and Salamone, M.F. (1983). The induction of micronuclei as a measure of genotoxicity. A report of the U.S. Environmental Protection Agency Gene‑Tox Program. Mutat. Res. 123, 61‑118.
Integrated Laboratory Systems (ILS) (1990). Micronucleus Data Management and Statistical Analysis Software, Version 1.4. ILS, Inc., P.O. Box 13501, Research Triangle Park, NC 27707.
Ishida, T., Asakawa, Y., Takemoto, T., and Aratani, T. (1981). Terpenoids biotransformation in mammals. III: Biotransformation of "‑pinene, β‑pinene, pinane, 3‑carene, carane, myrcene, and p‑cymene in rabbits. J. Pharm. Sci. 70, 406‑415.
Jonckheere, A.R. (1954). A distribution‑free k‑sample test against ordered alternatives. Biometrika 41, 133‑145.
Kaplan, E.L., and Meier, P. (1958). Nonparametric estimation from incomplete observations. J. Am. Stat. Assoc. 53, 457‑481.
Kauderer, B., Zamith, H., Paumgartten, F.J.R., and Speit, G. (1991). Evaluation of the mutagenicity of β‑myrcene in mammalian cells in vitro. Environ. Mol. Mutagen. 18, 29‑34.
Kodama, R., Yano, T., Furukawa, K., Noda, K., and Ide, H. (1976). Studies on the metabolism of d‑limonene (p‑mentha‑1,8‑diene). IV. Isolation and characterization of new metabolites and species differences in metabolism. Xenobiotica 6, 377‑389.
Kolicheski, M.B., Cocco, L.C., Mitchell, D.A., and Kaminski, M. (2007.) Synthesis of myrcene by pyrolysis of β‑pinene: Analysis of decomposition reactions. J. Analyt. Appl. Pyrolysis 80, 92‑100.
β-Myrcene, NTP TR 557 88
NOT FOR DISTRIBUTION OR ATTRIBUTION Board Draft
Kostiainen, R. (1995). Volatile organic compounds in the indoor air of normal and sick houses. Atmos. Environ. 29, 693‑702.
Kuney, J.H. (1994). Chemcyclopedia 1995. American Chemical Society, Washington, D.C.
Lehman‑McKeeman, L.D., and Caudill, D. (1992).
Lehman‑McKeeman, L.D., Rodriguez, P.A., Takigiku, R., Caudill, D., and Fey, M.L. (1989). d‑Limonene‑induced male rat‑specific nephrotoxicity: Evaluation of the association between d‑limonene and "2u‑globulin. Toxicol. Appl. Pharmacol. 99, 250‑259.
Lock, E.A., and Hard, G.C. (2004). Chemically induced renal tubule tumors in the laboratory rat and mouse: Review of the NCI/NTP database and categorization of renal carcinogens based on mechanistic information. Crit. Rev. Toxicol. 34, 211‑299.
Lorente, I., Ocete, M.A., Zarzuelo, A., Cabo, M.M., and Jimenez, J. (1989). Bioactivity of the essential oil of Bupleurum fruticosum. J. Nat. Prod. 52, 267‑272.
Lorenzetti, B.B., Souza, G.E., Sarti, S.J., Santos Filho, D., and Ferreira, S.H. (1991). Myrcene mimics the peripheral analgesic activity of lemongrass tea. J. Ethnopharmacol. 34, 43‑48.
McConnell, E.E., Solleveld, H.A., Swenberg, J.A., and Boorman, G.A. (1986). Guidelines for combining neoplasms for evaluation of rodent carcinogenesis studies. JNCI 76, 283‑289.
MacGregor, J.T., Wehr, C.M., Henika, P.R., and Shelby, M.D. (1990). The in vivo erythrocyte micronucleus test: Measurement at steady state increases assay efficiency and permits integration with toxicity studies. Fundam. Appl. Toxicol. 14, 513‑522.
MacInnes, J.I., Nozik, E.S., and Kurtz, D.T. (1986). Tissue‑specific expression of the rat alpha 2u globulin gene family. Mol. Cell Biol. 6, 3563‑3567.
Madyastha, K.M., and Srivatsan, V. (1987). Metabolism of β‑myrcene in vivo and in vitro: Its effects on rat liver microsomal enzymes. Xenobiotica 17, 539‑549.
Maronpot, R.R., and Boorman, G.A. (1982). Interpretation of rodent hepatocellular proliferative alterations and hepatocellular tumors in chemical safety assessment. Toxicol. Pathol. 10, 71‑80.
Melnick, R.L. (2002). Carcinogenicity and mechanistic insights on the behavior of epoxides and epoxide‑forming chemicals. Ann. N.Y. Acad. Sci. 982, 177‑189.
Melnick, R.L., and Sills, R.C. (2001). Comparative carcinogenicity of 1,3‑butadiene, isoprene, and chloroprene in rats and mice. Chem. Biol. Interact. 135-136, 27‑42.
The Merck Index (1996). 12th ed. (S. Budavari, Ed.), p. 1085. Merck and Company, Whitehouse Station, NJ.
Miller, J.A., and Miller, E.C. (1977). Ultimate chemical carcinogens as reactive mutagenic electrophiles. In Origins of Human Cancer (H.H. Hiatt, J.D. Watson, and J.A. Winsten, Eds.), pp. 605‑627. Cold Spring Harbor Laboratory, Cold Spring Harbor, NY.
Miyazawa, M., and Murata, T. (2000). Biotransformation of β‑myrcene by the larvae of common cutworm (Spodoptera litura). J. Agric. Food Chem. 48, 123‑125.
β-Myrcene, NTP TR 557
NOT FOR DISTRIBUTION OR ATTRIBUTIONBoard Draft
89
Morrison, D.F. (1976). Multivariate Statistical Methods, 2nd ed., pp. 170‑179. McGraw‑Hill Book Company, New York.
Myhr, B., McGregor, D., Bowers, L., Riach, C., Brown, A.G., Edwards, I., McBride, D., Martin R., and Caspary, W.J. (1990). L5178Y mouse lymphoma cell mutation assay results with 41 compounds. Environ. Mol. Mutagen. 16 (Suppl. 18), 138‑167.
National Toxicology Program (NTP) (1990). Toxicology and Carcinogenesis Studies of d‑Limonene (CAS No. 5989‑27‑5) in F344/N Rats and B6C3F1 Mice (Gavage Studies). Technical Report Series No. 347. NIH Publication No. 90‑2802. U.S. Department of Health and Human Services, Public Health Service, National Institutes of Health, Research Triangle Park, NC.
National Toxicology Program (NTP) (1993). Toxicology and Carcinogenesis Studies of 1,3‑Butadiene (CAS No. 106‑99‑0) in B6C3F1 Mice (Inhalation Studies). Technical Report Series No. 434. NIH Publication No. 93‑3165. U.S. Department of Health and Human Services, Public Health Service, National Institutes of Health, Research Triangle Park, NC.
Newmark, F.M. (1978). Hops allergy and terpene sensitivity: An occupational disease. Ann. Allergy 41, 311‑312.
Opdyke, D.L.J. (1976). Fragrance raw materials monographs: β‑myrcene. Food Cosmet. Toxicol. 14, 615.
Paumgartten, F.J., Delgado, I.F., Alves, E.N., Nogueira, A.C., de‑Farias, R.C., and Neubert D. (1990). Single dose toxicity study of beta‑myrcene, a natural analgesic substance. Braz. J. Med. Biol. Res. 23, 873‑877.
Piegorsch, W.W., and Bailer, A.J. (1997). Statistics for Environmental Biology and Toxicology, Section 6.3.2. Chapman and Hall, London.
Portier, C.J., and Bailer, A.J. (1989). Testing for increased carcinogenicity using a survival‑adjusted quantal response test. Fundam. Appl. Toxicol. 12, 731‑737.
Portier, C.J., Hedges, J.C., and Hoel, D.G. (1986). Age‑specific models of mortality and tumor onset for historical control animals in the National Toxicology Program’s carcinogenicity experiments. Cancer Res. 46, 4372‑4378.
Rao, G.N. (1996). New diet (NTP‑2000) for rats in the National Toxicology Program toxicity and carcinogenicity studies. Fundam. Appl. Toxicol. 32, 102‑108.
Rao, G.N. (1997). New nonpurified diet (NTP‑2000) for rodents in the National Toxicology Program’s toxicology and carcinogenesis studies. J. Nutr. 127, 842s‑846s.
Rao, V.S.N., Menezes, A.M.S., and Viana, G.S.B. (1990). Effect of myrcene on nociception in mice. J. Pharm. Pharmacol. 42, 877‑878.
Russin, W.A., Hoesly, J.D., Elson, C.E., Tanner, M.A., and Gould, M.N. (1989). Inhibition of rat mammary carcinogenesis by monoterpenoids. Carcinogenesis 10, 2161‑2164.
Schmid, W. (1975). The micronucleus test. Mutat. Res. 31, 9‑15.
Seely, J.C., Haseman, J.K., Nyska, A., Wolf, D.C., Everitt, J.I., and Hailey, J.R. (2002). The effect of chronic progressive nephropathy on the incidence of renal tubule cell neoplasms in control Male F344 rats. Toxicol. Pathol. 30, 681‑686.
β-Myrcene, NTP TR 557 90
NOT FOR DISTRIBUTION OR ATTRIBUTION Board Draft
Shelby, M.D. (1988). The genetic toxicity of human carcinogens and its implications. Mutat. Res. 204, 3‑15.
Shelby, M.D., and Witt, K.L. (1995). Comparison of results from mouse bone marrow chromosome aberration and micronucleus tests. Environ. Mol. Mutagen. 25, 302‑313.
Shelby, M.D., and Zeiger, E. (1990). Activity of human carcinogens in the Salmonella and rodent bone‑marrow cytogenetics tests. Mutat. Res. 234, 257‑261.
Shelby, M.D., Erexson, G.L., Hook, G.J., and Tice, R.R. (1993). Evaluation of a three‑exposure mouse bone marrow micronucleus protocol: Results with 49 chemicals. Environ. Mol. Mutagen. 21, 160‑179.
Shirley, E. (1977). A non‑parametric equivalent of Williams’ test for contrasting increasing dose levels of a treatment. Biometrics 33, 386‑389.
SRI International (1996). Directory of Chemical Producers, United States, 1996. SRI International, Menlo Park, CA.
Stolle, A., Bonrath, W., and Ondruschka, B. (2008). Kinetic and mechanistic aspects of myrcene production via thermal‑induced β‑pinene rearrangement. J. Analyt. Appl. Pyrolysis 83, 26‑36.
Straus, D.S. (1981). Somatic mutation, cellular differentiation, and cancer causation. JNCI 67, 233‑241.
Swenberg, J.A., and Lehman‑McKeeman, L.D. (1999). Alpha 2‑urinary globulin‑associated nephropathy as a mechanism of renal tubule cell carcinogenesis in male rats. IARC Sci. Publ. 147, 95‑118.
Swenberg, J.A., Short, B., Borghoff, S., Strasser, J., and Charbonneau, M. (1989). The comparative pathobiology of "2u‑globulin nephropathy. Toxicol. Appl. Pharmacol. 97, 35‑46.
Tarone, R.E. (1975). Tests for trend in life table analysis. Biometrika 62, 679‑682.
Tennant, R.W., Margolin, B.H., Shelby, M.D., Zeiger, E., Haseman, J.K., Spalding, J., Caspary, W., Resnick, M., Stasiewicz, S., Anderson, B., and Minor, R. (1987). Prediction of chemical carcinogenicity in rodents from in vitro genetic toxicity assays. Science 236, 933‑941.
Turner, S.D., Tinwell, H., Piegorsch, W., Schmezer, P., and Ashby, J. (2001). The male rat carcinogens limonene and sodium saccharin are not mutagenic to male Big Blue rats. Mutagenesis. 17, 329‑332.
Watabe, T., Hiratsuka, A., Isobe, M., and Ozawa, N. (1980). Metabolism of d‑limonene by hepatic microsomes to nonmutagenic epoxides toward Salmonella typhimurium. Biochem. Pharmacol. 29, 1068‑1071.
Watson, W.P., Cottrell, L., Zhang, D., and Golding, B.T. (2001). Metabolism and molecular toxicology of isoprene. Chem. Biol. Interact. 135-136, 223‑238.
Wilkins, C.K., and Larsen, K. (1995). Identification of volatile (micro) biological compounds from household waste and building materials by thermal desorption‑capillary gas chromatography‑mass spectroscopy. J. High Resolut. Chromatogr. 18, 373‑377.
Wilkins, K. (1994). Volatile organic compounds from household waste. Chemosphere 29, 47‑53.
β-Myrcene, NTP TR 557
NOT FOR DISTRIBUTION OR ATTRIBUTIONBoard Draft
91
Williams, D.A. (1971). A test for differences between treatment means when several dose levels are compared with a zero dose control. Biometrics 27, 103‑117.
Williams, D.A. (1972). The comparison of several dose levels with a zero dose control. Biometrics 28, 519‑531.
Williams, D.A. (1986). A note on Shirley’s nonparametric test for comparing several dose levels with a zero‑dose control. Biometrics 42, 183‑186.
Wilt, F.M., Miller, G.C., and Everett, R.L. (1988). Monoterpene concentrations in litter and soil of single‑leaf pinyon woodlands of the western Great Basin U.S.A. Great Basin Nat. 48, 228‑231.
Witt, K.L., Knapton, A., Wehr, C.M., Hook, G.J., Mirsalis, J., Shelby, M.D., and MacGregor, J.T. (2000). Micronucleated erythrocyte frequency in peripheral blood of B6C3F1 mice from short‑term, prechronic, and chronic studies of the NTP Carcinogenesis Bioassay Program. Environ. Mol. Mutagen. 36, 163‑194.
Zamith, H.P., Vidal, M.N., Speit, G., and Paumgartten, F.J. (1993). Absence of genotoxic activity of beta‑myrcene in the in vivo cytogenetic bone marrow assay. Braz. J. Med. Biol. Res. 26, 93‑98.
Zeiger, E., Haseman, J.K., Shelby, M.D., Margolin, B.H., and Tennant, R.W. (1990). Evaluation of four in vitro genetic toxicity tests for predicting rodent carcinogenicity: Confirmation of earlier results with 41 additional chemicals. Environ. Mol. Mutagen. 16 (Suppl. 18), 1‑14.
Zeiger, E., Anderson, B., Haworth, S., Lawlor, T., and Mortelmans, K. (1992). Salmonella mutagenicity tests: V. Results from the testing of 311 chemicals. Environ. Mol. Mutagen. 19 (Suppl. 21), 2‑141.

β-Myrcene, NTP TR 557 92
NOT FOR DISTRIBUTION OR ATTRIBUTION Board Draft
NOT FOR DISTRIBUTION OR ATTRIBUTIONBoard Draft
A-1
APPENDIX ASUMMARY OF LESIONS IN MALE RATS
IN THE 2-YEAR GAVAGE STUDYOF β-MYRCENE
Table a1 Summary of the Incidence of Neoplasms in Male Rats in the 2-Year Gavage Study of β-Myrcene . . . . . . . . . . . . . . . . . . . . . . . . . . . . . . . . . . . . . . . . A-2Table a2 Statistical Analysis of Primary Neoplasms in Male Rats in the 2-Year Gavage Study of β-Myrcene . . . . . . . . . . . . . . . . . . . . . . . . . . . . . . . . . . . . . . . . A-6Table a3 Historical Incidence of Renal Tubule Neoplasms in Control Male F344/N Rats . . . . . . . . . A-10Table a4 Summary of the Incidence of Nonneoplastic Lesions in Male Rats in the 2-Year Gavage Study of β-Myrcene . . . . . . . . . . . . . . . . . . . . . . . . . . . . . . . . . . . . . . . . A-11
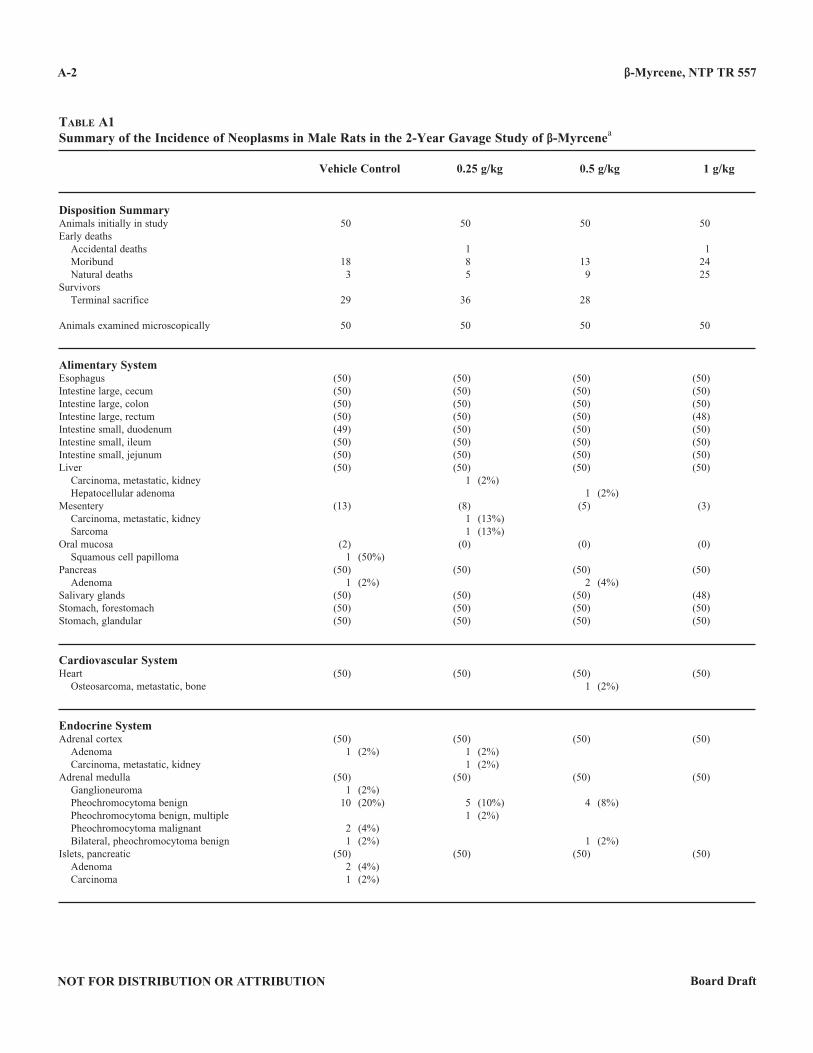
β-Myrcene, NTP TR 557 A-2
NOT FOR DISTRIBUTION OR ATTRIBUTION Board Draft
Table a1Summary of the Incidence of Neoplasms in Male Rats in the 2-Year Gavage Study of β-Myrcenea
Vehicle Control 0 .25 g/kg 0 .5 g/kg 1 g/kg
Disposition SummaryAnimals initially in study 50 50 50 50Early deaths Accidental deaths 1 1 Moribund 18 8 13 24 Natural deaths 3 5 9 25Survivors Terminal sacrifice 29 36 28
Animals examined microscopically 50 50 50 50
Alimentary SystemEsophagus (50) (50) (50) (50)Intestine large, cecum (50) (50) (50) (50)Intestine large, colon (50) (50) (50) (50)Intestine large, rectum (50) (50) (50) (48)Intestine small, duodenum (49) (50) (50) (50)Intestine small, ileum (50) (50) (50) (50)Intestine small, jejunum (50) (50) (50) (50)Liver (50) (50) (50) (50) Carcinoma, metastatic, kidney 1 (2%) Hepatocellular adenoma 1 (2%)Mesentery (13) (8) (5) (3) Carcinoma, metastatic, kidney 1 (13%) Sarcoma 1 (13%)Oral mucosa (2) (0) (0) (0) Squamous cell papilloma 1 (50%)Pancreas (50) (50) (50) (50) Adenoma 1 (2%) 2 (4%)Salivary glands (50) (50) (50) (48)Stomach, forestomach (50) (50) (50) (50)Stomach, glandular (50) (50) (50) (50)
Cardiovascular SystemHeart (50) (50) (50) (50) Osteosarcoma, metastatic, bone 1 (2%)
Endocrine SystemAdrenal cortex (50) (50) (50) (50) Adenoma 1 (2%) 1 (2%) Carcinoma, metastatic, kidney 1 (2%)Adrenal medulla (50) (50) (50) (50) Ganglioneuroma 1 (2%) Pheochromocytoma benign 10 (20%) 5 (10%) 4 (8%) Pheochromocytoma benign, multiple 1 (2%) Pheochromocytoma malignant 2 (4%) Bilateral, pheochromocytoma benign 1 (2%) 1 (2%)Islets, pancreatic (50) (50) (50) (50) Adenoma 2 (4%) Carcinoma 1 (2%)
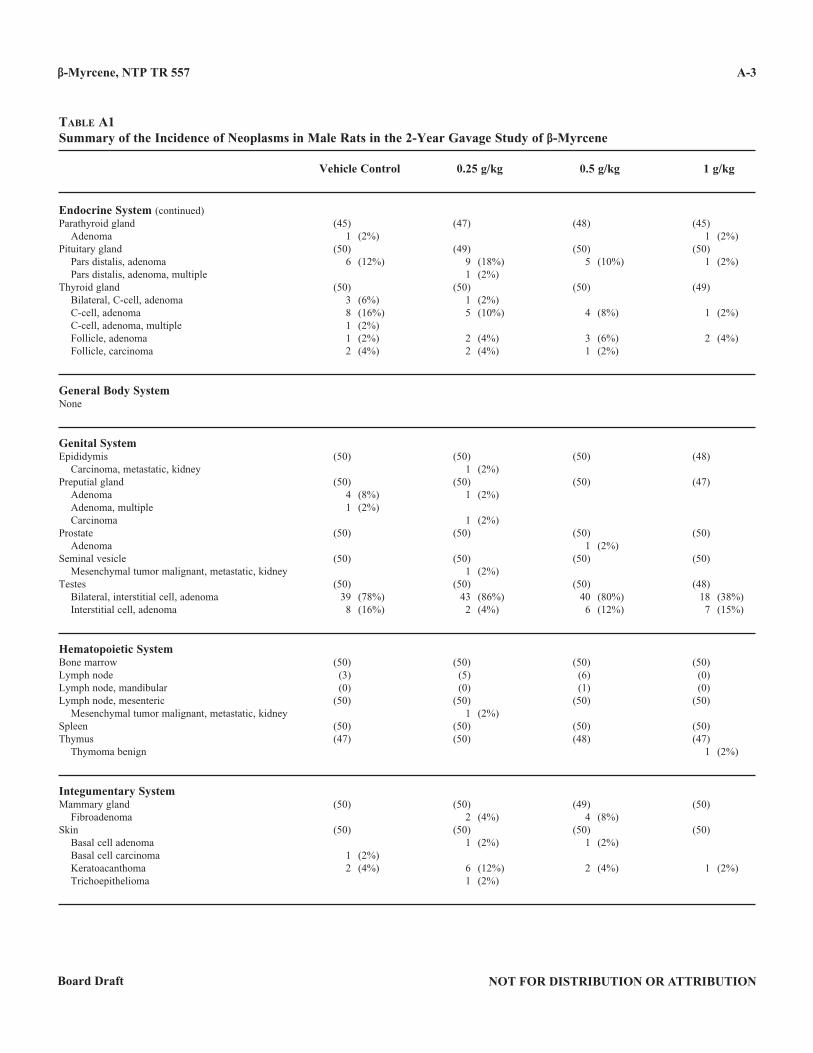
β-Myrcene, NTP TR 557 A-3
NOT FOR DISTRIBUTION OR ATTRIBUTIONBoard Draft
Table a1Summary of the Incidence of Neoplasms in Male Rats in the 2-Year Gavage Study of β-Myrcene
Vehicle Control 0 .25 g/kg 0 .5 g/kg 1 g/kg
Endocrine System (continued)Parathyroid gland (45) (47) (48) (45) Adenoma 1 (2%) 1 (2%)Pituitary gland (50) (49) (50) (50) Pars distalis, adenoma 6 (12%) 9 (18%) 5 (10%) 1 (2%) Pars distalis, adenoma, multiple 1 (2%)Thyroid gland (50) (50) (50) (49) Bilateral, C-cell, adenoma 3 (6%) 1 (2%) C-cell, adenoma 8 (16%) 5 (10%) 4 (8%) 1 (2%) C-cell, adenoma, multiple 1 (2%) Follicle, adenoma 1 (2%) 2 (4%) 3 (6%) 2 (4%) Follicle, carcinoma 2 (4%) 2 (4%) 1 (2%)
General Body SystemNone
Genital SystemEpididymis (50) (50) (50) (48) Carcinoma, metastatic, kidney 1 (2%)Preputial gland (50) (50) (50) (47) Adenoma 4 (8%) 1 (2%) Adenoma, multiple 1 (2%) Carcinoma 1 (2%)Prostate (50) (50) (50) (50) Adenoma 1 (2%)Seminal vesicle (50) (50) (50) (50) Mesenchymal tumor malignant, metastatic, kidney 1 (2%)Testes (50) (50) (50) (48) Bilateral, interstitial cell, adenoma 39 (78%) 43 (86%) 40 (80%) 18 (38%) Interstitial cell, adenoma 8 (16%) 2 (4%) 6 (12%) 7 (15%)
Hematopoietic SystemBone marrow (50) (50) (50) (50)Lymph node (3) (5) (6) (0)Lymph node, mandibular (0) (0) (1) (0)Lymph node, mesenteric (50) (50) (50) (50) Mesenchymal tumor malignant, metastatic, kidney 1 (2%)Spleen (50) (50) (50) (50)Thymus (47) (50) (48) (47) Thymoma benign 1 (2%)
Integumentary SystemMammary gland (50) (50) (49) (50) Fibroadenoma 2 (4%) 4 (8%)Skin (50) (50) (50) (50) Basal cell adenoma 1 (2%) 1 (2%) Basal cell carcinoma 1 (2%) Keratoacanthoma 2 (4%) 6 (12%) 2 (4%) 1 (2%) Trichoepithelioma 1 (2%)
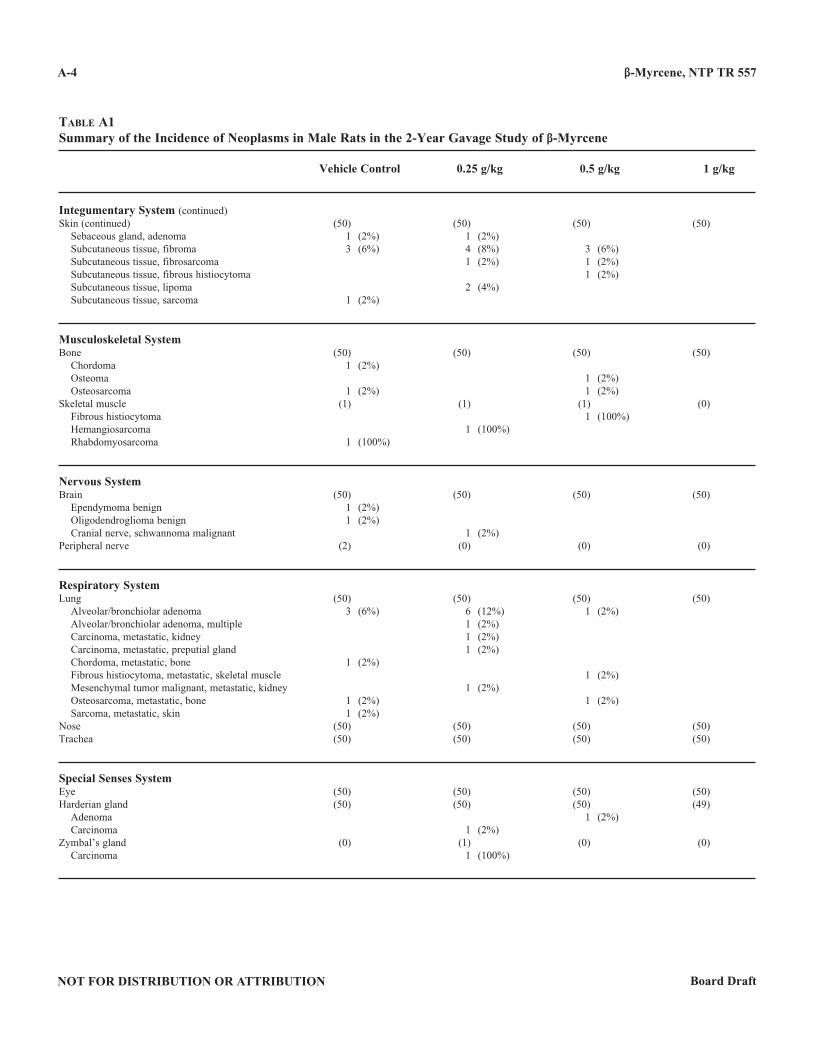
β-Myrcene, NTP TR 557
NOT FOR DISTRIBUTION OR ATTRIBUTION Board Draft
A-4
Table a1Summary of the Incidence of Neoplasms in Male Rats in the 2-Year Gavage Study of β-Myrcene
Vehicle Control 0 .25 g/kg 0 .5 g/kg 1 g/kg
Integumentary System (continued)Skin (continued) (50) (50) (50) (50) Sebaceous gland, adenoma 1 (2%) 1 (2%) Subcutaneous tissue, fibroma 3 (6%) 4 (8%) 3 (6%) Subcutaneous tissue, fibrosarcoma 1 (2%) 1 (2%) Subcutaneous tissue, fibrous histiocytoma 1 (2%) Subcutaneous tissue, lipoma 2 (4%) Subcutaneous tissue, sarcoma 1 (2%)
Musculoskeletal SystemBone (50) (50) (50) (50) Chordoma 1 (2%) Osteoma 1 (2%) Osteosarcoma 1 (2%) 1 (2%)Skeletal muscle (1) (1) (1) (0) Fibrous histiocytoma 1 (100%) Hemangiosarcoma 1 (100%) Rhabdomyosarcoma 1 (100%)
Nervous SystemBrain (50) (50) (50) (50) Ependymoma benign 1 (2%) Oligodendroglioma benign 1 (2%) Cranial nerve, schwannoma malignant 1 (2%)Peripheral nerve (2) (0) (0) (0)
Respiratory SystemLung (50) (50) (50) (50) Alveolar/bronchiolar adenoma 3 (6%) 6 (12%) 1 (2%) Alveolar/bronchiolar adenoma, multiple 1 (2%) Carcinoma, metastatic, kidney 1 (2%) Carcinoma, metastatic, preputial gland 1 (2%) Chordoma, metastatic, bone 1 (2%) Fibrous histiocytoma, metastatic, skeletal muscle 1 (2%) Mesenchymal tumor malignant, metastatic, kidney 1 (2%) Osteosarcoma, metastatic, bone 1 (2%) 1 (2%) Sarcoma, metastatic, skin 1 (2%)Nose (50) (50) (50) (50)Trachea (50) (50) (50) (50)
Special Senses SystemEye (50) (50) (50) (50)Harderian gland (50) (50) (50) (49) Adenoma 1 (2%) Carcinoma 1 (2%)Zymbal’s gland (0) (1) (0) (0) Carcinoma 1 (100%)
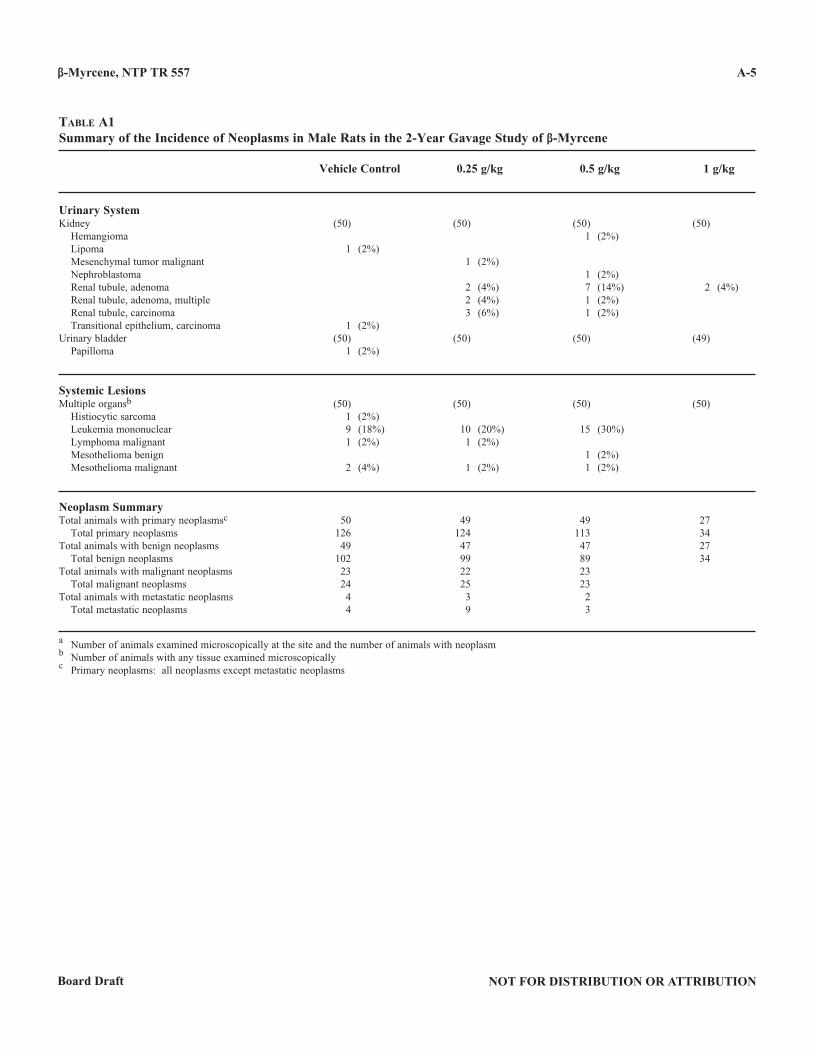
β-Myrcene, NTP TR 557
NOT FOR DISTRIBUTION OR ATTRIBUTIONBoard Draft
A-5
Table a1Summary of the Incidence of Neoplasms in Male Rats in the 2-Year Gavage Study of β-Myrcene
Vehicle Control 0 .25 g/kg 0 .5 g/kg 1 g/kg
Urinary SystemKidney (50) (50) (50) (50) Hemangioma 1 (2%) Lipoma 1 (2%) Mesenchymal tumor malignant 1 (2%) Nephroblastoma 1 (2%) Renal tubule, adenoma 2 (4%) 7 (14%) 2 (4%) Renal tubule, adenoma, multiple 2 (4%) 1 (2%) Renal tubule, carcinoma 3 (6%) 1 (2%) Transitional epithelium, carcinoma 1 (2%)Urinary bladder (50) (50) (50) (49) Papilloma 1 (2%)
Systemic LesionsMultiple organsb (50) (50) (50) (50) Histiocytic sarcoma 1 (2%) Leukemia mononuclear 9 (18%) 10 (20%) 15 (30%) Lymphoma malignant 1 (2%) 1 (2%) Mesothelioma benign 1 (2%) Mesothelioma malignant 2 (4%) 1 (2%) 1 (2%)
Neoplasm SummaryTotal animals with primary neoplasmsc 50 49 49 27 Total primary neoplasms 126 124 113 34Total animals with benign neoplasms 49 47 47 27 Total benign neoplasms 102 99 89 34Total animals with malignant neoplasms 23 22 23 Total malignant neoplasms 24 25 23Total animals with metastatic neoplasms 4 3 2 Total metastatic neoplasms 4 9 3
a Number of animals examined microscopically at the site and the number of animals with neoplasmb Number of animals with any tissue examined microscopicallyc Primary neoplasms: all neoplasms except metastatic neoplasms
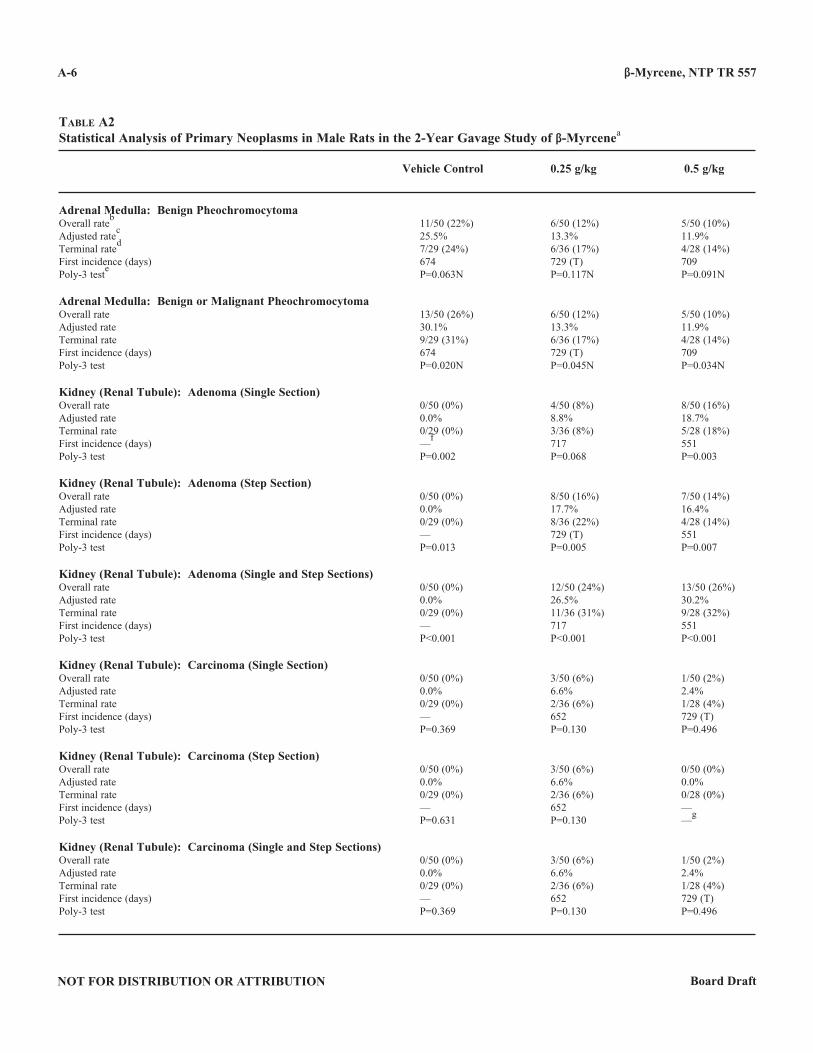
β-Myrcene, NTP TR 557
NOT FOR DISTRIBUTION OR ATTRIBUTION Board Draft
A-6
Table a2Statistical Analysis of Primary Neoplasms in Male Rats in the 2-Year Gavage Study of β-Myrcenea
Vehicle Control 0 .25 g/kg 0 .5 g/kg
Adrenal Medulla: Benign PheochromocytomaOverall rate
b 11/50 (22%) 6/50 (12%) 5/50 (10%)
Adjusted ratec 25.5% 13.3% 11.9%
Terminal rated 7/29 (24%) 6/36 (17%) 4/28 (14%)
First incidence (days) 674 729 (T) 709Poly-3 test
e P=0.063N P=0.117N P=0.091N
Adrenal Medulla: Benign or Malignant PheochromocytomaOverall rate 13/50 (26%) 6/50 (12%) 5/50 (10%)Adjusted rate 30.1% 13.3% 11.9%Terminal rate 9/29 (31%) 6/36 (17%) 4/28 (14%)First incidence (days) 674 729 (T) 709Poly-3 test P=0.020N P=0.045N P=0.034N
Kidney (Renal Tubule): Adenoma (Single Section)Overall rate 0/50 (0%) 4/50 (8%) 8/50 (16%)Adjusted rate 0.0% 8.8% 18.7%Terminal rate 0/29 (0%) 3/36 (8%) 5/28 (18%)First incidence (days) —
f 717 551
Poly-3 test P=0.002 P=0.068 P=0.003
Kidney (Renal Tubule): Adenoma (Step Section)Overall rate 0/50 (0%) 8/50 (16%) 7/50 (14%)Adjusted rate 0.0% 17.7% 16.4%Terminal rate 0/29 (0%) 8/36 (22%) 4/28 (14%)First incidence (days) — 729 (T) 551Poly-3 test P=0.013 P=0.005 P=0.007
Kidney (Renal Tubule): Adenoma (Single and Step Sections)Overall rate 0/50 (0%) 12/50 (24%) 13/50 (26%)Adjusted rate 0.0% 26.5% 30.2%Terminal rate 0/29 (0%) 11/36 (31%) 9/28 (32%)First incidence (days) — 717 551Poly-3 test P<0.001 P<0.001 P<0.001
Kidney (Renal Tubule): Carcinoma (Single Section)Overall rate 0/50 (0%) 3/50 (6%) 1/50 (2%)Adjusted rate 0.0% 6.6% 2.4%Terminal rate 0/29 (0%) 2/36 (6%) 1/28 (4%)First incidence (days) — 652 729 (T)Poly-3 test P=0.369 P=0.130 P=0.496
Kidney (Renal Tubule): Carcinoma (Step Section)Overall rate 0/50 (0%) 3/50 (6%) 0/50 (0%)Adjusted rate 0.0% 6.6% 0.0%Terminal rate 0/29 (0%) 2/36 (6%) 0/28 (0%)First incidence (days) — 652 —Poly-3 test P=0.631 P=0.130 —
g
Kidney (Renal Tubule): Carcinoma (Single and Step Sections)Overall rate 0/50 (0%) 3/50 (6%) 1/50 (2%)Adjusted rate 0.0% 6.6% 2.4%Terminal rate 0/29 (0%) 2/36 (6%) 1/28 (4%)First incidence (days) — 652 729 (T)Poly-3 test P=0.369 P=0.130 P=0.496
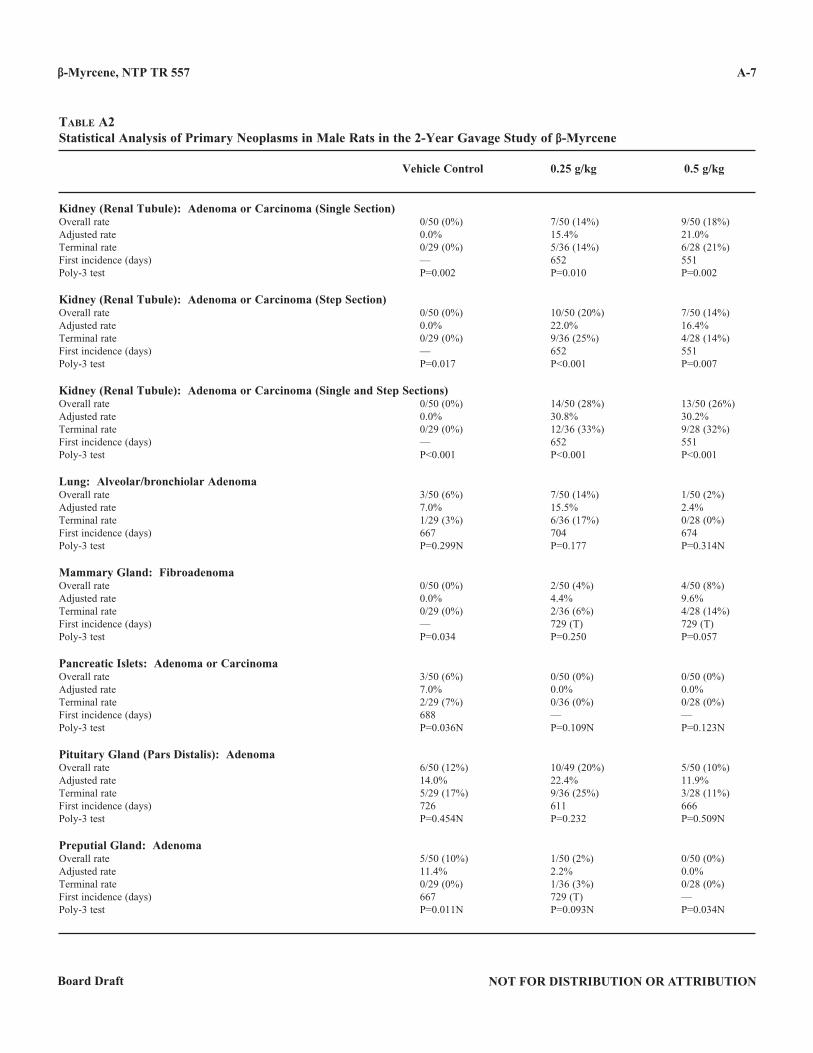
β-Myrcene, NTP TR 557
NOT FOR DISTRIBUTION OR ATTRIBUTIONBoard Draft
A-7
Table a2Statistical Analysis of Primary Neoplasms in Male Rats in the 2-Year Gavage Study of β-Myrcene
Vehicle Control 0 .25 g/kg 0 .5 g/kg
Kidney (Renal Tubule): Adenoma or Carcinoma (Single Section)Overall rate 0/50 (0%) 7/50 (14%) 9/50 (18%)Adjusted rate 0.0% 15.4% 21.0%Terminal rate 0/29 (0%) 5/36 (14%) 6/28 (21%)First incidence (days) — 652 551Poly-3 test P=0.002 P=0.010 P=0.002
Kidney (Renal Tubule): Adenoma or Carcinoma (Step Section)Overall rate 0/50 (0%) 10/50 (20%) 7/50 (14%)Adjusted rate 0.0% 22.0% 16.4%Terminal rate 0/29 (0%) 9/36 (25%) 4/28 (14%)First incidence (days) — 652 551Poly-3 test P=0.017 P<0.001 P=0.007
Kidney (Renal Tubule): Adenoma or Carcinoma (Single and Step Sections)Overall rate 0/50 (0%) 14/50 (28%) 13/50 (26%)Adjusted rate 0.0% 30.8% 30.2%Terminal rate 0/29 (0%) 12/36 (33%) 9/28 (32%)First incidence (days) — 652 551Poly-3 test P<0.001 P<0.001 P<0.001
Lung: Alveolar/bronchiolar AdenomaOverall rate 3/50 (6%) 7/50 (14%) 1/50 (2%)Adjusted rate 7.0% 15.5% 2.4%Terminal rate 1/29 (3%) 6/36 (17%) 0/28 (0%)First incidence (days) 667 704 674Poly-3 test P=0.299N P=0.177 P=0.314N
Mammary Gland: FibroadenomaOverall rate 0/50 (0%) 2/50 (4%) 4/50 (8%)Adjusted rate 0.0% 4.4% 9.6%Terminal rate 0/29 (0%) 2/36 (6%) 4/28 (14%)First incidence (days) — 729 (T) 729 (T)Poly-3 test P=0.034 P=0.250 P=0.057
Pancreatic Islets: Adenoma or CarcinomaOverall rate 3/50 (6%) 0/50 (0%) 0/50 (0%)Adjusted rate 7.0% 0.0% 0.0%Terminal rate 2/29 (7%) 0/36 (0%) 0/28 (0%)First incidence (days) 688 — —Poly-3 test P=0.036N P=0.109N P=0.123N
Pituitary Gland (Pars Distalis): AdenomaOverall rate 6/50 (12%) 10/49 (20%) 5/50 (10%)Adjusted rate 14.0% 22.4% 11.9%Terminal rate 5/29 (17%) 9/36 (25%) 3/28 (11%)First incidence (days) 726 611 666Poly-3 test P=0.454N P=0.232 P=0.509N
Preputial Gland: AdenomaOverall rate 5/50 (10%) 1/50 (2%) 0/50 (0%)Adjusted rate 11.4% 2.2% 0.0%Terminal rate 0/29 (0%) 1/36 (3%) 0/28 (0%)First incidence (days) 667 729 (T) —Poly-3 test P=0.011N P=0.093N P=0.034N
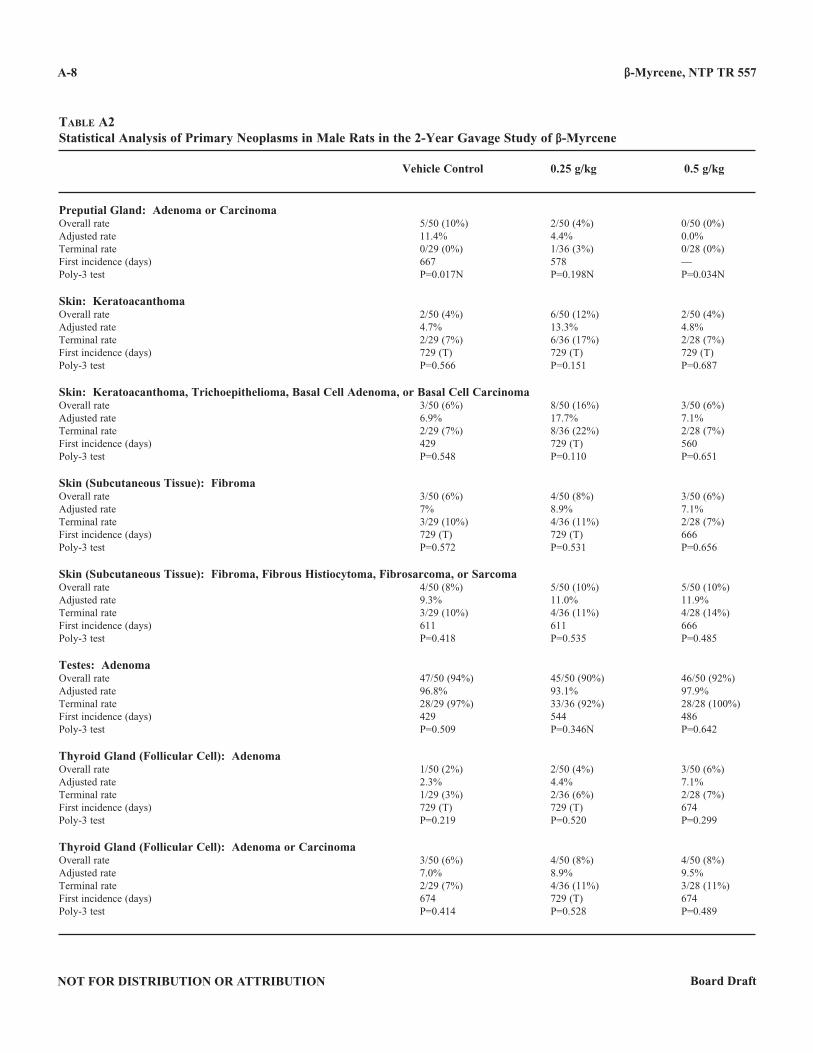
β-Myrcene, NTP TR 557
NOT FOR DISTRIBUTION OR ATTRIBUTION Board Draft
A-8
Table a2Statistical Analysis of Primary Neoplasms in Male Rats in the 2-Year Gavage Study of β-Myrcene
Vehicle Control 0 .25 g/kg 0 .5 g/kg
Preputial Gland: Adenoma or CarcinomaOverall rate 5/50 (10%) 2/50 (4%) 0/50 (0%)Adjusted rate 11.4% 4.4% 0.0%Terminal rate 0/29 (0%) 1/36 (3%) 0/28 (0%)First incidence (days) 667 578 —Poly-3 test P=0.017N P=0.198N P=0.034N
Skin: KeratoacanthomaOverall rate 2/50 (4%) 6/50 (12%) 2/50 (4%)Adjusted rate 4.7% 13.3% 4.8%Terminal rate 2/29 (7%) 6/36 (17%) 2/28 (7%)First incidence (days) 729 (T) 729 (T) 729 (T)Poly-3 test P=0.566 P=0.151 P=0.687
Skin: Keratoacanthoma, Trichoepithelioma, Basal Cell Adenoma, or Basal Cell CarcinomaOverall rate 3/50 (6%) 8/50 (16%) 3/50 (6%)Adjusted rate 6.9% 17.7% 7.1%Terminal rate 2/29 (7%) 8/36 (22%) 2/28 (7%)First incidence (days) 429 729 (T) 560Poly-3 test P=0.548 P=0.110 P=0.651
Skin (Subcutaneous Tissue): FibromaOverall rate 3/50 (6%) 4/50 (8%) 3/50 (6%)Adjusted rate 7% 8.9% 7.1%Terminal rate 3/29 (10%) 4/36 (11%) 2/28 (7%)First incidence (days) 729 (T) 729 (T) 666Poly-3 test P=0.572 P=0.531 P=0.656
Skin (Subcutaneous Tissue): Fibroma, Fibrous Histiocytoma, Fibrosarcoma, or SarcomaOverall rate 4/50 (8%) 5/50 (10%) 5/50 (10%)Adjusted rate 9.3% 11.0% 11.9%Terminal rate 3/29 (10%) 4/36 (11%) 4/28 (14%)First incidence (days) 611 611 666Poly-3 test P=0.418 P=0.535 P=0.485
Testes: AdenomaOverall rate 47/50 (94%) 45/50 (90%) 46/50 (92%)Adjusted rate 96.8% 93.1% 97.9%Terminal rate 28/29 (97%) 33/36 (92%) 28/28 (100%)First incidence (days) 429 544 486Poly-3 test P=0.509 P=0.346N P=0.642
Thyroid Gland (Follicular Cell): AdenomaOverall rate 1/50 (2%) 2/50 (4%) 3/50 (6%)Adjusted rate 2.3% 4.4% 7.1%Terminal rate 1/29 (3%) 2/36 (6%) 2/28 (7%)First incidence (days) 729 (T) 729 (T) 674Poly-3 test P=0.219 P=0.520 P=0.299
Thyroid Gland (Follicular Cell): Adenoma or CarcinomaOverall rate 3/50 (6%) 4/50 (8%) 4/50 (8%)Adjusted rate 7.0% 8.9% 9.5%Terminal rate 2/29 (7%) 4/36 (11%) 3/28 (11%)First incidence (days) 674 729 (T) 674Poly-3 test P=0.414 P=0.528 P=0.489
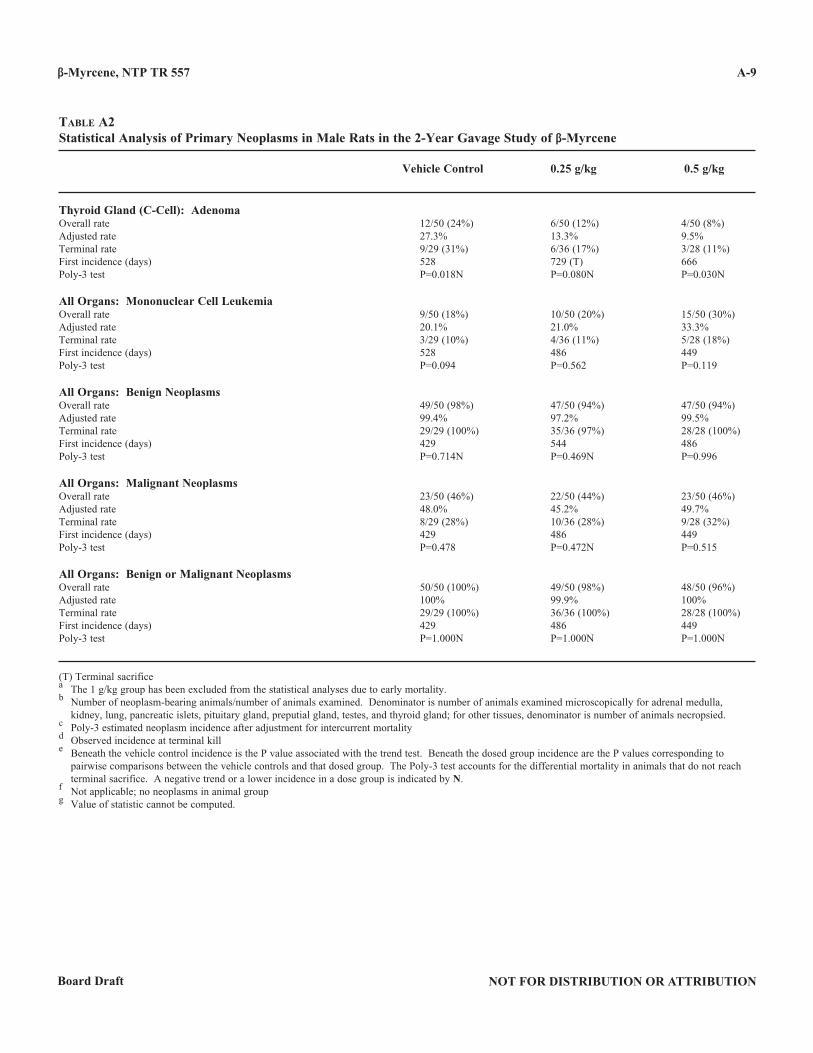
β-Myrcene, NTP TR 557
NOT FOR DISTRIBUTION OR ATTRIBUTIONBoard Draft
A-9
Table a2Statistical Analysis of Primary Neoplasms in Male Rats in the 2-Year Gavage Study of β-Myrcene
Vehicle Control 0 .25 g/kg 0 .5 g/kg
Thyroid Gland (C-Cell): AdenomaOverall rate 12/50 (24%) 6/50 (12%) 4/50 (8%)Adjusted rate 27.3% 13.3% 9.5%Terminal rate 9/29 (31%) 6/36 (17%) 3/28 (11%)First incidence (days) 528 729 (T) 666Poly-3 test P=0.018N P=0.080N P=0.030N
All Organs: Mononuclear Cell LeukemiaOverall rate 9/50 (18%) 10/50 (20%) 15/50 (30%)Adjusted rate 20.1% 21.0% 33.3%Terminal rate 3/29 (10%) 4/36 (11%) 5/28 (18%)First incidence (days) 528 486 449Poly-3 test P=0.094 P=0.562 P=0.119
All Organs: Benign NeoplasmsOverall rate 49/50 (98%) 47/50 (94%) 47/50 (94%)Adjusted rate 99.4% 97.2% 99.5%Terminal rate 29/29 (100%) 35/36 (97%) 28/28 (100%)First incidence (days) 429 544 486Poly-3 test P=0.714N P=0.469N P=0.996
All Organs: Malignant NeoplasmsOverall rate 23/50 (46%) 22/50 (44%) 23/50 (46%)Adjusted rate 48.0% 45.2% 49.7%Terminal rate 8/29 (28%) 10/36 (28%) 9/28 (32%)First incidence (days) 429 486 449Poly-3 test P=0.478 P=0.472N P=0.515
All Organs: Benign or Malignant NeoplasmsOverall rate 50/50 (100%) 49/50 (98%) 48/50 (96%)Adjusted rate 100% 99.9% 100%Terminal rate 29/29 (100%) 36/36 (100%) 28/28 (100%)First incidence (days) 429 486 449Poly-3 test P=1.000N P=1.000N P=1.000N
(T) Terminal sacrificea The 1 g/kg group has been excluded from the statistical analyses due to early mortality.b Number of neoplasm-bearing animals/number of animals examined. Denominator is number of animals examined microscopically for adrenal medulla, kidney, lung, pancreatic islets, pituitary gland, preputial gland, testes, and thyroid gland; for other tissues, denominator is number of animals necropsied.c Poly-3 estimated neoplasm incidence after adjustment for intercurrent mortalityd Observed incidence at terminal kille Beneath the vehicle control incidence is the P value associated with the trend test. Beneath the dosed group incidence are the P values corresponding to pairwise comparisons between the vehicle controls and that dosed group. The Poly-3 test accounts for the differential mortality in animals that do not reach terminal sacrifice. A negative trend or a lower incidence in a dose group is indicated by N.f Not applicable; no neoplasms in animal groupg Value of statistic cannot be computed.
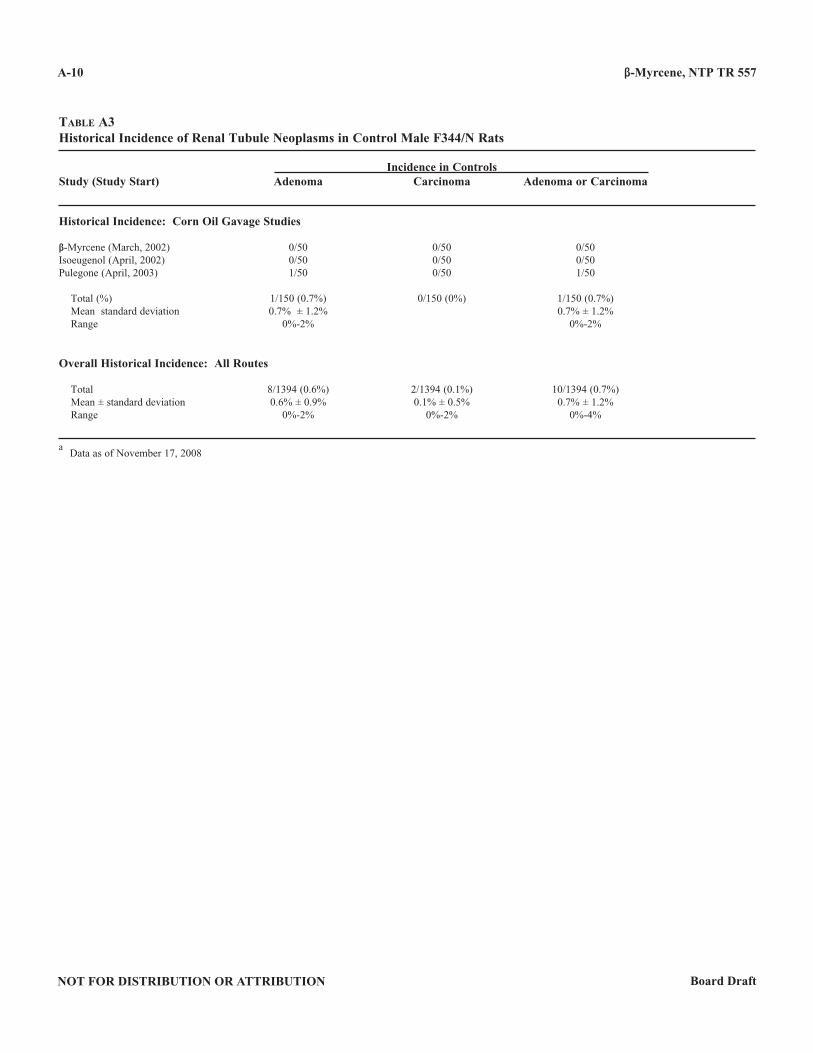
β-Myrcene, NTP TR 557
NOT FOR DISTRIBUTION OR ATTRIBUTION Board Draft
A-10
Table a3Historical Incidence of Renal Tubule Neoplasms in Control Male F344/N Rats
Incidence in ControlsStudy (Study Start) Adenoma Carcinoma Adenoma or Carcinoma
Historical Incidence: Corn Oil Gavage Studies
β-Myrcene (March, 2002) 0/50 0/50 0/50Isoeugenol (April, 2002) 0/50 0/50 0/50Pulegone (April, 2003) 1/50 0/50 1/50
Total (%) 1/150 (0.7%) 0/150 (0%) 1/150 (0.7%) Mean standard deviation 0.7% ± 1.2% 0.7% ± 1.2% Range 0%-2% 0%-2%
Overall Historical Incidence: All Routes
Total 8/1394 (0.6%) 2/1394 (0.1%) 10/1394 (0.7%) Mean ± standard deviation 0.6% ± 0.9% 0.1% ± 0.5% 0.7% ± 1.2% Range 0%-2% 0%-2% 0%-4%
a Data as of November 17, 2008
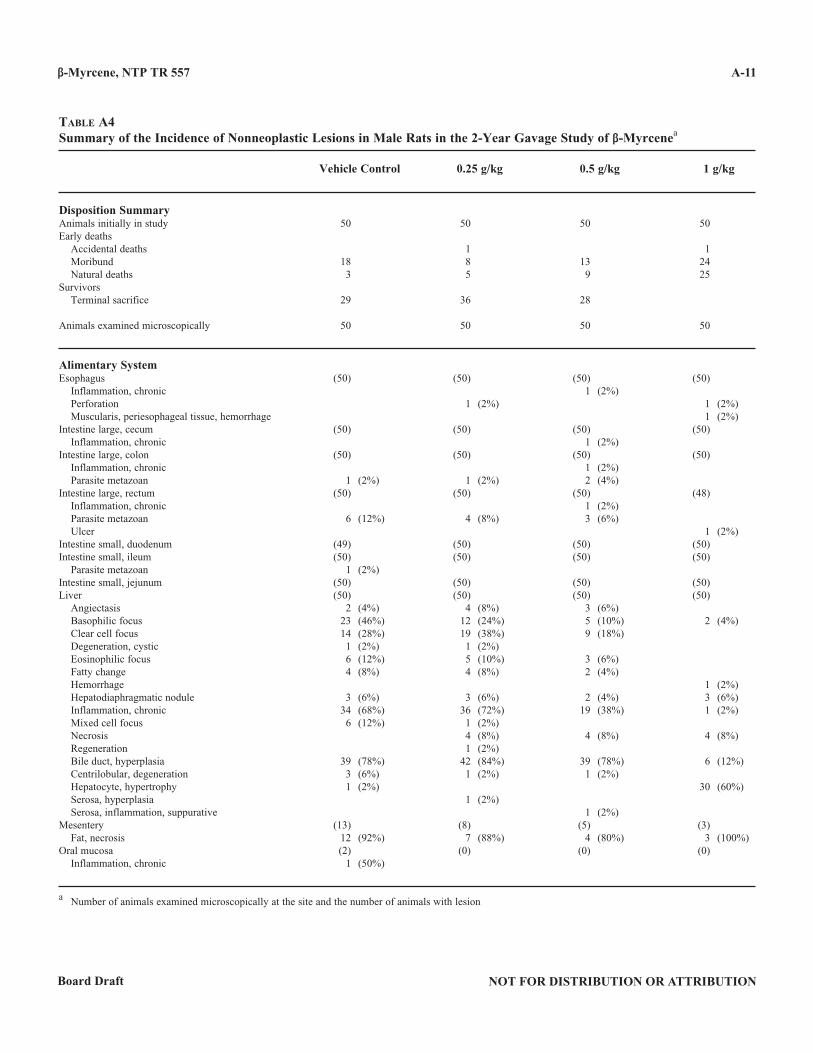
β-Myrcene, NTP TR 557
NOT FOR DISTRIBUTION OR ATTRIBUTIONBoard Draft
A-11
Table a4Summary of the Incidence of Nonneoplastic Lesions in Male Rats in the 2-Year Gavage Study of β-Myrcenea
Vehicle Control 0 .25 g/kg 0 .5 g/kg 1 g/kg
Disposition SummaryAnimals initially in study 50 50 50 50Early deaths Accidental deaths 1 1 Moribund 18 8 13 24 Natural deaths 3 5 9 25Survivors Terminal sacrifice 29 36 28
Animals examined microscopically 50 50 50 50
Alimentary SystemEsophagus (50) (50) (50) (50) Inflammation, chronic 1 (2%) Perforation 1 (2%) 1 (2%) Muscularis, periesophageal tissue, hemorrhage 1 (2%)Intestine large, cecum (50) (50) (50) (50) Inflammation, chronic 1 (2%)Intestine large, colon (50) (50) (50) (50) Inflammation, chronic 1 (2%) Parasite metazoan 1 (2%) 1 (2%) 2 (4%)Intestine large, rectum (50) (50) (50) (48) Inflammation, chronic 1 (2%) Parasite metazoan 6 (12%) 4 (8%) 3 (6%) Ulcer 1 (2%)Intestine small, duodenum (49) (50) (50) (50)Intestine small, ileum (50) (50) (50) (50) Parasite metazoan 1 (2%)Intestine small, jejunum (50) (50) (50) (50)Liver (50) (50) (50) (50) Angiectasis 2 (4%) 4 (8%) 3 (6%) Basophilic focus 23 (46%) 12 (24%) 5 (10%) 2 (4%) Clear cell focus 14 (28%) 19 (38%) 9 (18%) Degeneration, cystic 1 (2%) 1 (2%) Eosinophilic focus 6 (12%) 5 (10%) 3 (6%) Fatty change 4 (8%) 4 (8%) 2 (4%) Hemorrhage 1 (2%) Hepatodiaphragmatic nodule 3 (6%) 3 (6%) 2 (4%) 3 (6%) Inflammation, chronic 34 (68%) 36 (72%) 19 (38%) 1 (2%) Mixed cell focus 6 (12%) 1 (2%) Necrosis 4 (8%) 4 (8%) 4 (8%) Regeneration 1 (2%) Bile duct, hyperplasia 39 (78%) 42 (84%) 39 (78%) 6 (12%) Centrilobular, degeneration 3 (6%) 1 (2%) 1 (2%) Hepatocyte, hypertrophy 1 (2%) 30 (60%) Serosa, hyperplasia 1 (2%) Serosa, inflammation, suppurative 1 (2%)Mesentery (13) (8) (5) (3) Fat, necrosis 12 (92%) 7 (88%) 4 (80%) 3 (100%)Oral mucosa (2) (0) (0) (0) Inflammation, chronic 1 (50%)
a Number of animals examined microscopically at the site and the number of animals with lesion
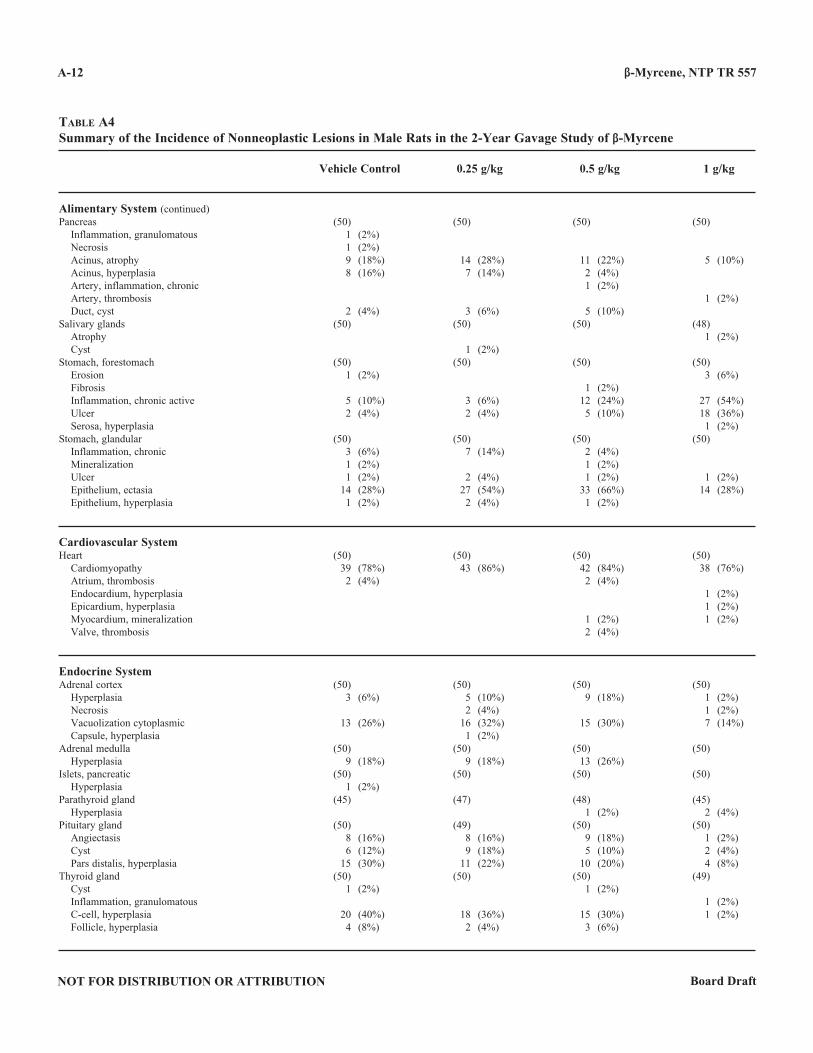
β-Myrcene, NTP TR 557
NOT FOR DISTRIBUTION OR ATTRIBUTION Board Draft
A-12
Table a4Summary of the Incidence of Nonneoplastic Lesions in Male Rats in the 2-Year Gavage Study of β-Myrcene
Vehicle Control 0 .25 g/kg 0 .5 g/kg 1 g/kg
Alimentary System (continued)Pancreas (50) (50) (50) (50) Inflammation, granulomatous 1 (2%) Necrosis 1 (2%) Acinus, atrophy 9 (18%) 14 (28%) 11 (22%) 5 (10%) Acinus, hyperplasia 8 (16%) 7 (14%) 2 (4%) Artery, inflammation, chronic 1 (2%) Artery, thrombosis 1 (2%) Duct, cyst 2 (4%) 3 (6%) 5 (10%)Salivary glands (50) (50) (50) (48) Atrophy 1 (2%) Cyst 1 (2%)Stomach, forestomach (50) (50) (50) (50) Erosion 1 (2%) 3 (6%) Fibrosis 1 (2%) Inflammation, chronic active 5 (10%) 3 (6%) 12 (24%) 27 (54%) Ulcer 2 (4%) 2 (4%) 5 (10%) 18 (36%) Serosa, hyperplasia 1 (2%)Stomach, glandular (50) (50) (50) (50) Inflammation, chronic 3 (6%) 7 (14%) 2 (4%) Mineralization 1 (2%) 1 (2%) Ulcer 1 (2%) 2 (4%) 1 (2%) 1 (2%) Epithelium, ectasia 14 (28%) 27 (54%) 33 (66%) 14 (28%) Epithelium, hyperplasia 1 (2%) 2 (4%) 1 (2%)
Cardiovascular SystemHeart (50) (50) (50) (50) Cardiomyopathy 39 (78%) 43 (86%) 42 (84%) 38 (76%) Atrium, thrombosis 2 (4%) 2 (4%) Endocardium, hyperplasia 1 (2%) Epicardium, hyperplasia 1 (2%) Myocardium, mineralization 1 (2%) 1 (2%) Valve, thrombosis 2 (4%)
Endocrine SystemAdrenal cortex (50) (50) (50) (50) Hyperplasia 3 (6%) 5 (10%) 9 (18%) 1 (2%) Necrosis 2 (4%) 1 (2%) Vacuolization cytoplasmic 13 (26%) 16 (32%) 15 (30%) 7 (14%) Capsule, hyperplasia 1 (2%)Adrenal medulla (50) (50) (50) (50) Hyperplasia 9 (18%) 9 (18%) 13 (26%)Islets, pancreatic (50) (50) (50) (50) Hyperplasia 1 (2%)Parathyroid gland (45) (47) (48) (45) Hyperplasia 1 (2%) 2 (4%)Pituitary gland (50) (49) (50) (50) Angiectasis 8 (16%) 8 (16%) 9 (18%) 1 (2%) Cyst 6 (12%) 9 (18%) 5 (10%) 2 (4%) Pars distalis, hyperplasia 15 (30%) 11 (22%) 10 (20%) 4 (8%)Thyroid gland (50) (50) (50) (49) Cyst 1 (2%) 1 (2%) Inflammation, granulomatous 1 (2%) C-cell, hyperplasia 20 (40%) 18 (36%) 15 (30%) 1 (2%) Follicle, hyperplasia 4 (8%) 2 (4%) 3 (6%)
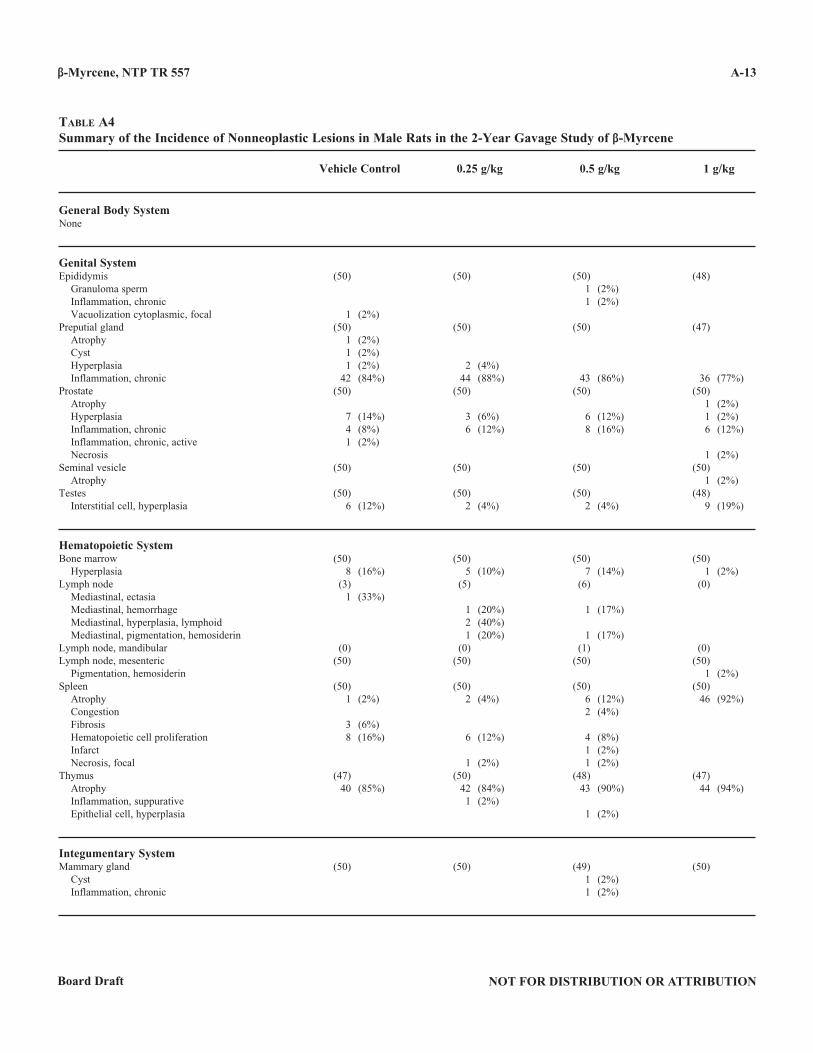
β-Myrcene, NTP TR 557
NOT FOR DISTRIBUTION OR ATTRIBUTIONBoard Draft
A-13
Table a4Summary of the Incidence of Nonneoplastic Lesions in Male Rats in the 2-Year Gavage Study of β-Myrcene
Vehicle Control 0 .25 g/kg 0 .5 g/kg 1 g/kg
General Body SystemNone
Genital SystemEpididymis (50) (50) (50) (48) Granuloma sperm 1 (2%) Inflammation, chronic 1 (2%) Vacuolization cytoplasmic, focal 1 (2%)Preputial gland (50) (50) (50) (47) Atrophy 1 (2%) Cyst 1 (2%) Hyperplasia 1 (2%) 2 (4%) Inflammation, chronic 42 (84%) 44 (88%) 43 (86%) 36 (77%)Prostate (50) (50) (50) (50) Atrophy 1 (2%) Hyperplasia 7 (14%) 3 (6%) 6 (12%) 1 (2%) Inflammation, chronic 4 (8%) 6 (12%) 8 (16%) 6 (12%) Inflammation, chronic, active 1 (2%) Necrosis 1 (2%)Seminal vesicle (50) (50) (50) (50) Atrophy 1 (2%)Testes (50) (50) (50) (48) Interstitial cell, hyperplasia 6 (12%) 2 (4%) 2 (4%) 9 (19%)
Hematopoietic SystemBone marrow (50) (50) (50) (50) Hyperplasia 8 (16%) 5 (10%) 7 (14%) 1 (2%)Lymph node (3) (5) (6) (0) Mediastinal, ectasia 1 (33%) Mediastinal, hemorrhage 1 (20%) 1 (17%) Mediastinal, hyperplasia, lymphoid 2 (40%) Mediastinal, pigmentation, hemosiderin 1 (20%) 1 (17%)Lymph node, mandibular (0) (0) (1) (0)Lymph node, mesenteric (50) (50) (50) (50) Pigmentation, hemosiderin 1 (2%)Spleen (50) (50) (50) (50) Atrophy 1 (2%) 2 (4%) 6 (12%) 46 (92%) Congestion 2 (4%) Fibrosis 3 (6%) Hematopoietic cell proliferation 8 (16%) 6 (12%) 4 (8%) Infarct 1 (2%) Necrosis, focal 1 (2%) 1 (2%)Thymus (47) (50) (48) (47) Atrophy 40 (85%) 42 (84%) 43 (90%) 44 (94%) Inflammation, suppurative 1 (2%) Epithelial cell, hyperplasia 1 (2%)
Integumentary SystemMammary gland (50) (50) (49) (50) Cyst 1 (2%) Inflammation, chronic 1 (2%)
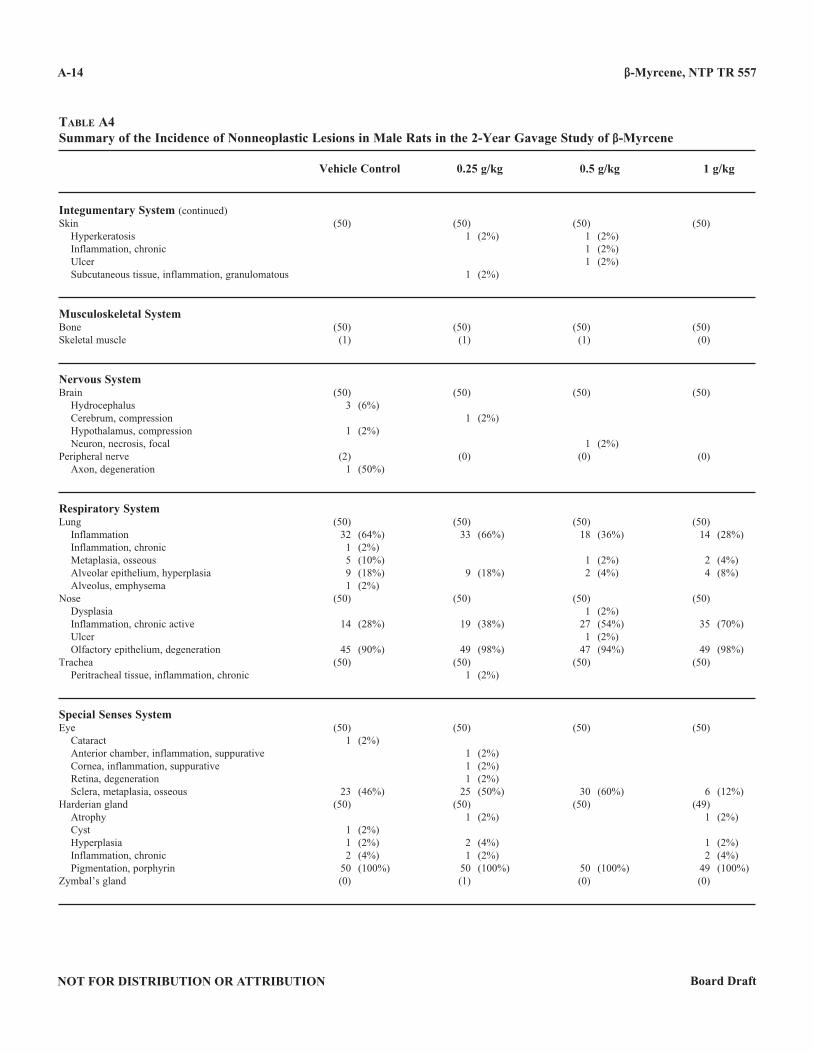
β-Myrcene, NTP TR 557
NOT FOR DISTRIBUTION OR ATTRIBUTION Board Draft
A-14
Table a4Summary of the Incidence of Nonneoplastic Lesions in Male Rats in the 2-Year Gavage Study of β-Myrcene
Vehicle Control 0 .25 g/kg 0 .5 g/kg 1 g/kg
Integumentary System (continued)Skin (50) (50) (50) (50) Hyperkeratosis 1 (2%) 1 (2%) Inflammation, chronic 1 (2%) Ulcer 1 (2%) Subcutaneous tissue, inflammation, granulomatous 1 (2%)
Musculoskeletal SystemBone (50) (50) (50) (50)Skeletal muscle (1) (1) (1) (0)
Nervous SystemBrain (50) (50) (50) (50) Hydrocephalus 3 (6%) Cerebrum, compression 1 (2%) Hypothalamus, compression 1 (2%) Neuron, necrosis, focal 1 (2%)Peripheral nerve (2) (0) (0) (0) Axon, degeneration 1 (50%)
Respiratory SystemLung (50) (50) (50) (50) Inflammation 32 (64%) 33 (66%) 18 (36%) 14 (28%) Inflammation, chronic 1 (2%) Metaplasia, osseous 5 (10%) 1 (2%) 2 (4%) Alveolar epithelium, hyperplasia 9 (18%) 9 (18%) 2 (4%) 4 (8%) Alveolus, emphysema 1 (2%)Nose (50) (50) (50) (50) Dysplasia 1 (2%) Inflammation, chronic active 14 (28%) 19 (38%) 27 (54%) 35 (70%) Ulcer 1 (2%) Olfactory epithelium, degeneration 45 (90%) 49 (98%) 47 (94%) 49 (98%)Trachea (50) (50) (50) (50) Peritracheal tissue, inflammation, chronic 1 (2%)
Special Senses SystemEye (50) (50) (50) (50) Cataract 1 (2%) Anterior chamber, inflammation, suppurative 1 (2%) Cornea, inflammation, suppurative 1 (2%) Retina, degeneration 1 (2%) Sclera, metaplasia, osseous 23 (46%) 25 (50%) 30 (60%) 6 (12%)Harderian gland (50) (50) (50) (49) Atrophy 1 (2%) 1 (2%) Cyst 1 (2%) Hyperplasia 1 (2%) 2 (4%) 1 (2%) Inflammation, chronic 2 (4%) 1 (2%) 2 (4%) Pigmentation, porphyrin 50 (100%) 50 (100%) 50 (100%) 49 (100%)Zymbal’s gland (0) (1) (0) (0)
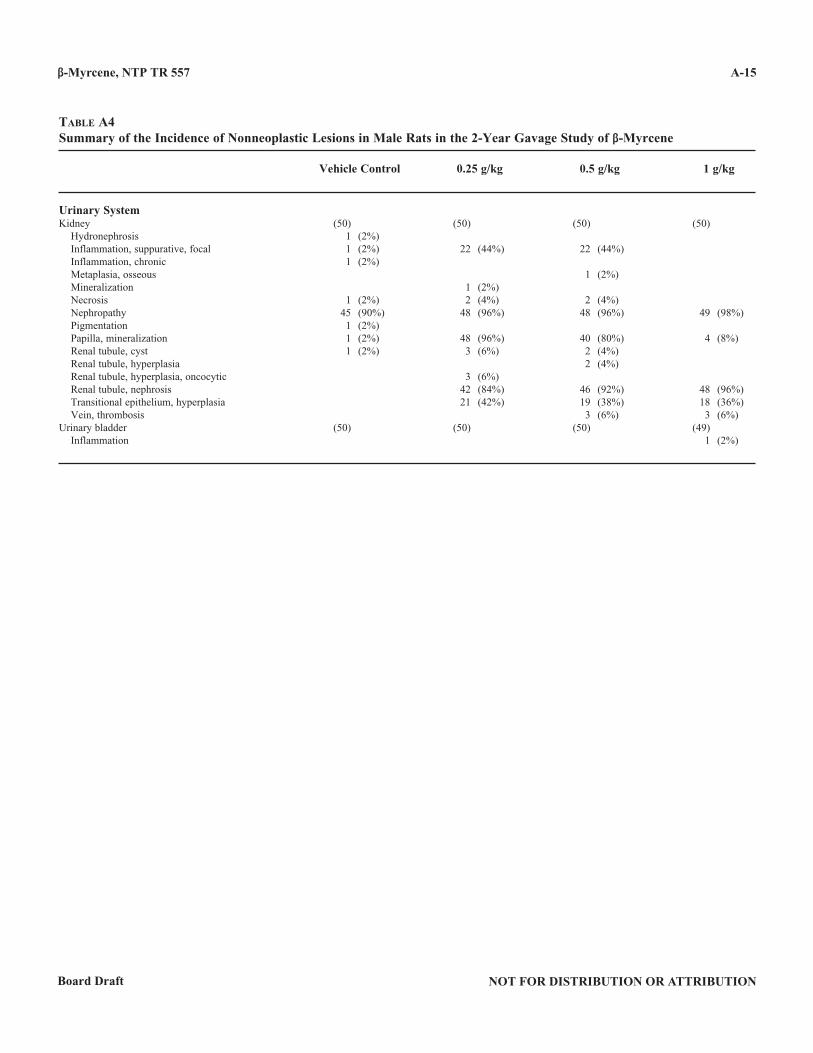
β-Myrcene, NTP TR 557
NOT FOR DISTRIBUTION OR ATTRIBUTIONBoard Draft
A-15
Table a4Summary of the Incidence of Nonneoplastic Lesions in Male Rats in the 2-Year Gavage Study of β-Myrcene
Vehicle Control 0 .25 g/kg 0 .5 g/kg 1 g/kg
Urinary SystemKidney (50) (50) (50) (50) Hydronephrosis 1 (2%) Inflammation, suppurative, focal 1 (2%) 22 (44%) 22 (44%) Inflammation, chronic 1 (2%) Metaplasia, osseous 1 (2%) Mineralization 1 (2%) Necrosis 1 (2%) 2 (4%) 2 (4%) Nephropathy 45 (90%) 48 (96%) 48 (96%) 49 (98%) Pigmentation 1 (2%) Papilla, mineralization 1 (2%) 48 (96%) 40 (80%) 4 (8%) Renal tubule, cyst 1 (2%) 3 (6%) 2 (4%) Renal tubule, hyperplasia 2 (4%) Renal tubule, hyperplasia, oncocytic 3 (6%) Renal tubule, nephrosis 42 (84%) 46 (92%) 48 (96%) Transitional epithelium, hyperplasia 21 (42%) 19 (38%) 18 (36%) Vein, thrombosis 3 (6%) 3 (6%)Urinary bladder (50) (50) (50) (49) Inflammation 1 (2%)

β-Myrcene, NTP TR 557
NOT FOR DISTRIBUTION OR ATTRIBUTION Board Draft
A-16
NOT FOR DISTRIBUTION OR ATTRIBUTIONBoard Draft
B-1
APPENDIX BSUMMARY OF LESIONS IN FEMALE RATS
IN THE 2-YEAR GAVAGE STUDYOF β-MYRCENE
Table b1 Summary of the Incidence of Neoplasms in Female Rats in the 2-Year Gavage Study of β-Myrcene . . . . . . . . . . . . . . . . . . . . . . . . . . . . . . . . . . . . . . . . B-2Table b2 Statistical Analysis of Primary Neoplasms in Female Rats in the 2-Year Gavage Study of β-Myrcene . . . . . . . . . . . . . . . . . . . . . . . . . . . . . . . . . . . . . . . . B-5Table b3 Historical Incidence of Renal Tubule Adenoma in Control Female F344/N Rats . . . . . . . . B-8Table b4 Summary of the Incidence of Nonneoplastic Lesions in Female Rats in the 2-Year Gavage Study of β-Myrcene . . . . . . . . . . . . . . . . . . . . . . . . . . . . . . . . . . . . . . . . B-9
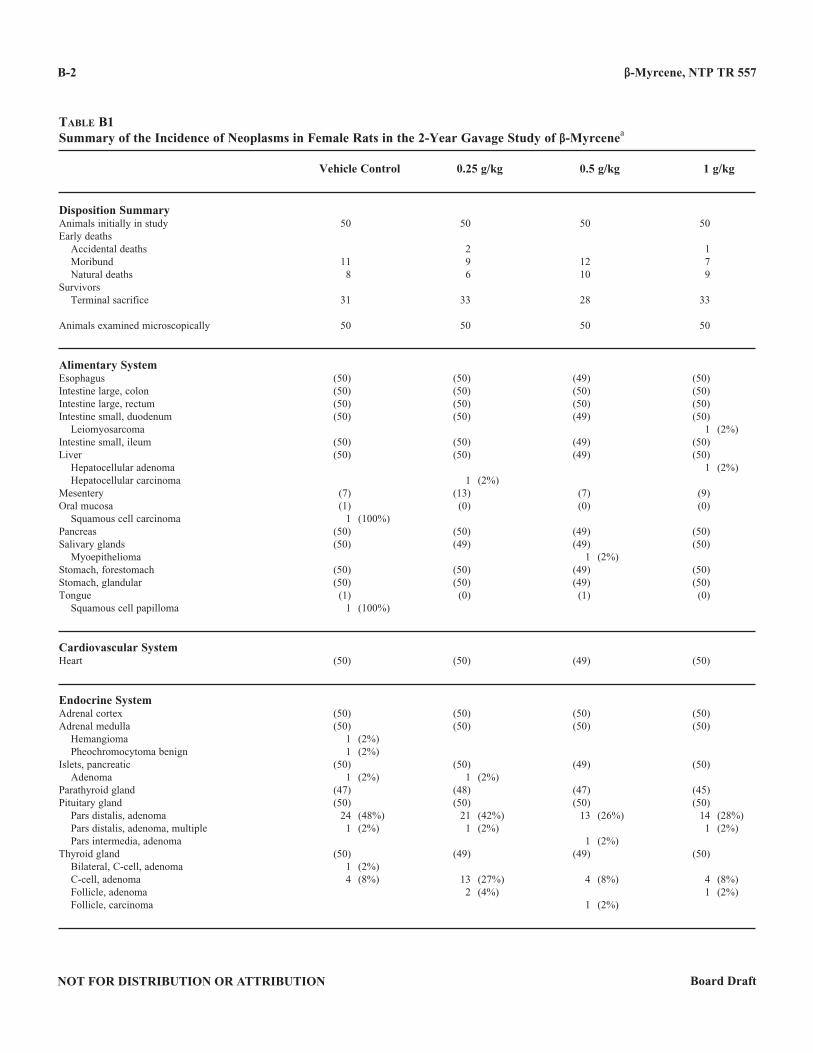
β-Myrcene, NTP TR 557
NOT FOR DISTRIBUTION OR ATTRIBUTION Board Draft
B-2
Table b1Summary of the Incidence of Neoplasms in Female Rats in the 2-Year Gavage Study of β-Myrcenea
Vehicle Control 0 .25 g/kg 0 .5 g/kg 1 g/kg
Disposition SummaryAnimals initially in study 50 50 50 50Early deaths Accidental deaths 2 1 Moribund 11 9 12 7 Natural deaths 8 6 10 9Survivors Terminal sacrifice 31 33 28 33
Animals examined microscopically 50 50 50 50
Alimentary SystemEsophagus (50) (50) (49) (50)Intestine large, colon (50) (50) (50) (50)Intestine large, rectum (50) (50) (50) (50)Intestine small, duodenum (50) (50) (49) (50) Leiomyosarcoma 1 (2%)Intestine small, ileum (50) (50) (49) (50)Liver (50) (50) (49) (50) Hepatocellular adenoma 1 (2%) Hepatocellular carcinoma 1 (2%)Mesentery (7) (13) (7) (9)Oral mucosa (1) (0) (0) (0) Squamous cell carcinoma 1 (100%)Pancreas (50) (50) (49) (50)Salivary glands (50) (49) (49) (50) Myoepithelioma 1 (2%)Stomach, forestomach (50) (50) (49) (50)Stomach, glandular (50) (50) (49) (50)Tongue (1) (0) (1) (0) Squamous cell papilloma 1 (100%)
Cardiovascular SystemHeart (50) (50) (49) (50)
Endocrine SystemAdrenal cortex (50) (50) (50) (50)Adrenal medulla (50) (50) (50) (50) Hemangioma 1 (2%) Pheochromocytoma benign 1 (2%)Islets, pancreatic (50) (50) (49) (50) Adenoma 1 (2%) 1 (2%)Parathyroid gland (47) (48) (47) (45)Pituitary gland (50) (50) (50) (50) Pars distalis, adenoma 24 (48%) 21 (42%) 13 (26%) 14 (28%) Pars distalis, adenoma, multiple 1 (2%) 1 (2%) 1 (2%) Pars intermedia, adenoma 1 (2%)Thyroid gland (50) (49) (49) (50) Bilateral, C-cell, adenoma 1 (2%) C-cell, adenoma 4 (8%) 13 (27%) 4 (8%) 4 (8%) Follicle, adenoma 2 (4%) 1 (2%) Follicle, carcinoma 1 (2%)
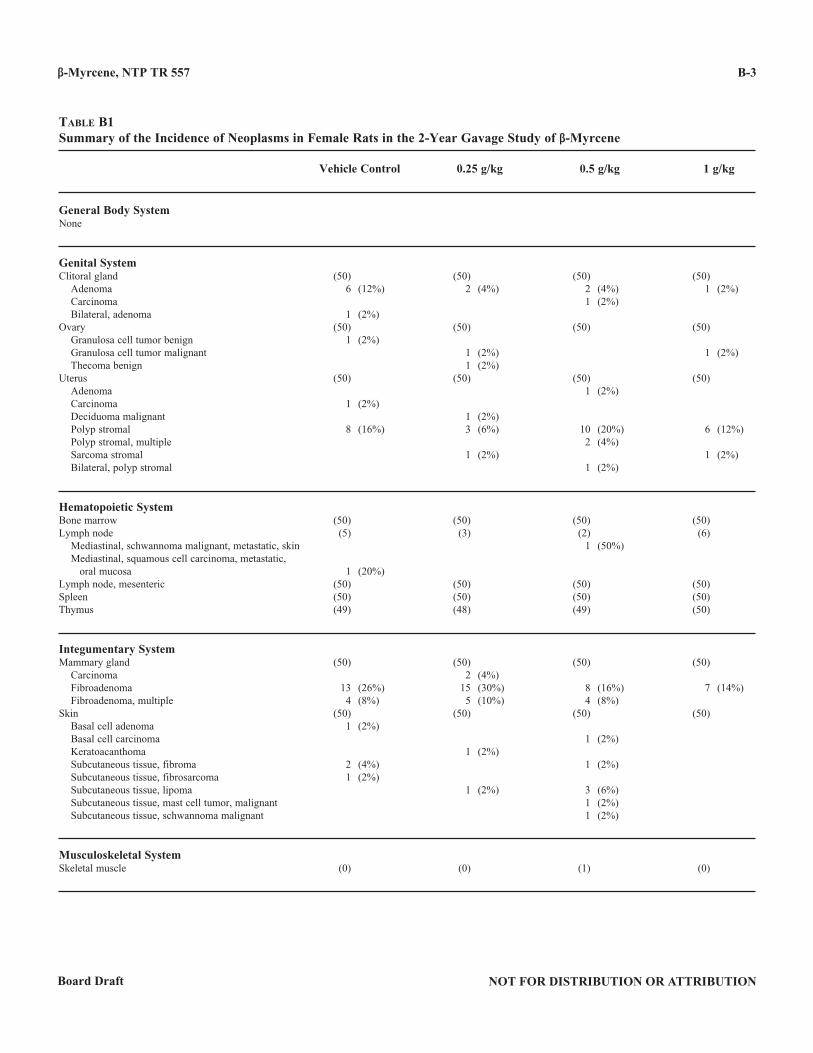
β-Myrcene, NTP TR 557
NOT FOR DISTRIBUTION OR ATTRIBUTIONBoard Draft
B-3
Table b1Summary of the Incidence of Neoplasms in Female Rats in the 2-Year Gavage Study of β-Myrcene
Vehicle Control 0 .25 g/kg 0 .5 g/kg 1 g/kg
General Body SystemNone
Genital SystemClitoral gland (50) (50) (50) (50) Adenoma 6 (12%) 2 (4%) 2 (4%) 1 (2%) Carcinoma 1 (2%) Bilateral, adenoma 1 (2%)Ovary (50) (50) (50) (50) Granulosa cell tumor benign 1 (2%) Granulosa cell tumor malignant 1 (2%) 1 (2%) Thecoma benign 1 (2%)Uterus (50) (50) (50) (50) Adenoma 1 (2%) Carcinoma 1 (2%) Deciduoma malignant 1 (2%) Polyp stromal 8 (16%) 3 (6%) 10 (20%) 6 (12%) Polyp stromal, multiple 2 (4%) Sarcoma stromal 1 (2%) 1 (2%) Bilateral, polyp stromal 1 (2%)
Hematopoietic SystemBone marrow (50) (50) (50) (50)Lymph node (5) (3) (2) (6) Mediastinal, schwannoma malignant, metastatic, skin 1 (50%) Mediastinal, squamous cell carcinoma, metastatic, oral mucosa 1 (20%)Lymph node, mesenteric (50) (50) (50) (50)Spleen (50) (50) (50) (50)Thymus (49) (48) (49) (50)
Integumentary SystemMammary gland (50) (50) (50) (50) Carcinoma 2 (4%) Fibroadenoma 13 (26%) 15 (30%) 8 (16%) 7 (14%) Fibroadenoma, multiple 4 (8%) 5 (10%) 4 (8%)Skin (50) (50) (50) (50) Basal cell adenoma 1 (2%) Basal cell carcinoma 1 (2%) Keratoacanthoma 1 (2%) Subcutaneous tissue, fibroma 2 (4%) 1 (2%) Subcutaneous tissue, fibrosarcoma 1 (2%) Subcutaneous tissue, lipoma 1 (2%) 3 (6%) Subcutaneous tissue, mast cell tumor, malignant 1 (2%) Subcutaneous tissue, schwannoma malignant 1 (2%)
Musculoskeletal SystemSkeletal muscle (0) (0) (1) (0)
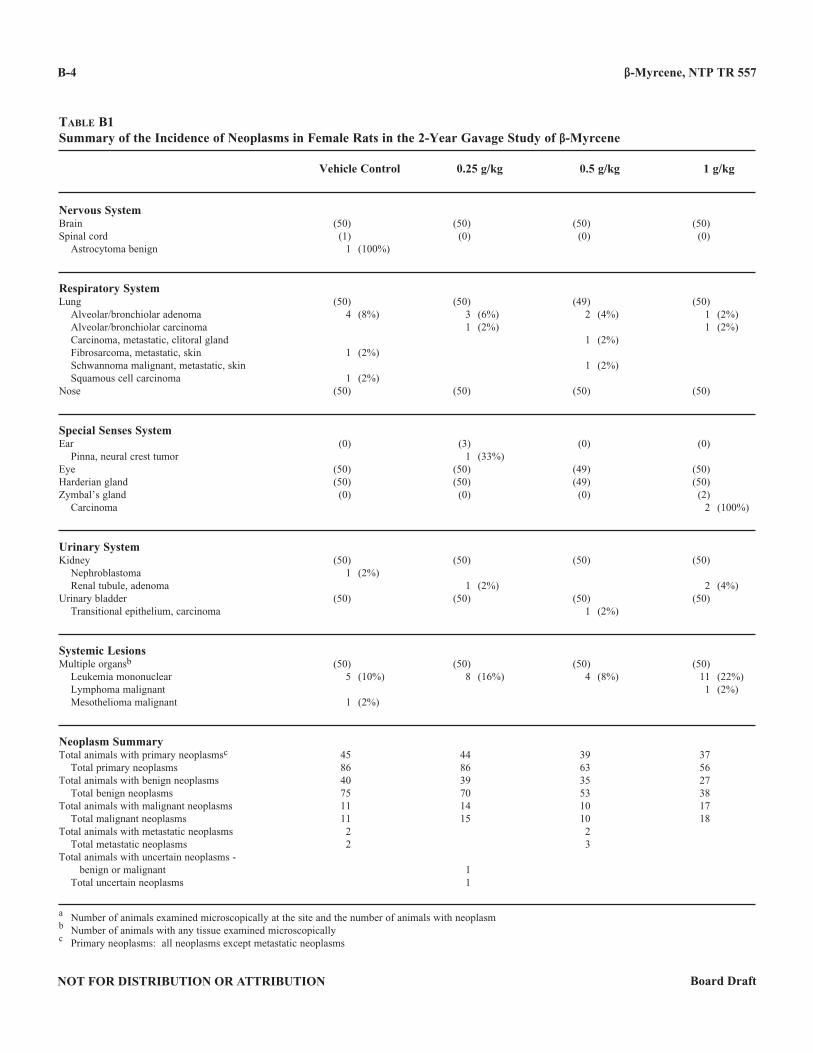
β-Myrcene, NTP TR 557
NOT FOR DISTRIBUTION OR ATTRIBUTION Board Draft
B-4
Table b1Summary of the Incidence of Neoplasms in Female Rats in the 2-Year Gavage Study of β-Myrcene
Vehicle Control 0 .25 g/kg 0 .5 g/kg 1 g/kg
Nervous SystemBrain (50) (50) (50) (50)Spinal cord (1) (0) (0) (0) Astrocytoma benign 1 (100%)
Respiratory SystemLung (50) (50) (49) (50) Alveolar/bronchiolar adenoma 4 (8%) 3 (6%) 2 (4%) 1 (2%) Alveolar/bronchiolar carcinoma 1 (2%) 1 (2%) Carcinoma, metastatic, clitoral gland 1 (2%) Fibrosarcoma, metastatic, skin 1 (2%) Schwannoma malignant, metastatic, skin 1 (2%) Squamous cell carcinoma 1 (2%)Nose (50) (50) (50) (50)
Special Senses SystemEar (0) (3) (0) (0) Pinna, neural crest tumor 1 (33%)Eye (50) (50) (49) (50)Harderian gland (50) (50) (49) (50)Zymbal’s gland (0) (0) (0) (2) Carcinoma 2 (100%)
Urinary SystemKidney (50) (50) (50) (50) Nephroblastoma 1 (2%) Renal tubule, adenoma 1 (2%) 2 (4%)Urinary bladder (50) (50) (50) (50) Transitional epithelium, carcinoma 1 (2%)
Systemic LesionsMultiple organsb (50) (50) (50) (50) Leukemia mononuclear 5 (10%) 8 (16%) 4 (8%) 11 (22%) Lymphoma malignant 1 (2%) Mesothelioma malignant 1 (2%)
Neoplasm SummaryTotal animals with primary neoplasmsc 45 44 39 37 Total primary neoplasms 86 86 63 56Total animals with benign neoplasms 40 39 35 27 Total benign neoplasms 75 70 53 38Total animals with malignant neoplasms 11 14 10 17 Total malignant neoplasms 11 15 10 18Total animals with metastatic neoplasms 2 2 Total metastatic neoplasms 2 3Total animals with uncertain neoplasms - benign or malignant 1 Total uncertain neoplasms 1
a Number of animals examined microscopically at the site and the number of animals with neoplasmb Number of animals with any tissue examined microscopicallyc Primary neoplasms: all neoplasms except metastatic neoplasms
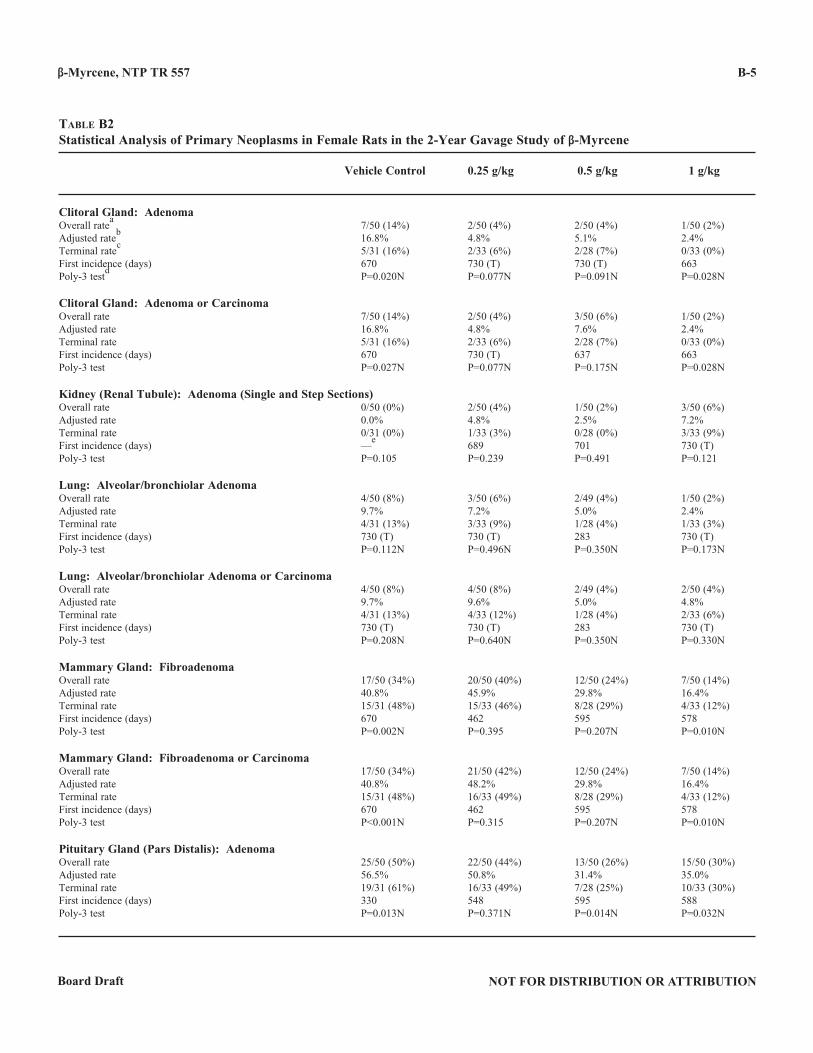
β-Myrcene, NTP TR 557
NOT FOR DISTRIBUTION OR ATTRIBUTIONBoard Draft
B-5
Table b2Statistical Analysis of Primary Neoplasms in Female Rats in the 2-Year Gavage Study of β-Myrcene
Vehicle Control 0 .25 g/kg 0 .5 g/kg 1 g/kg
Clitoral Gland: AdenomaOverall rate
a 7/50 (14%) 2/50 (4%) 2/50 (4%) 1/50 (2%)
Adjusted rateb 16.8% 4.8% 5.1% 2.4%
Terminal ratec 5/31 (16%) 2/33 (6%) 2/28 (7%) 0/33 (0%)
First incidence (days) 670 730 (T) 730 (T) 663Poly-3 test
d P=0.020N P=0.077N P=0.091N P=0.028N
Clitoral Gland: Adenoma or CarcinomaOverall rate 7/50 (14%) 2/50 (4%) 3/50 (6%) 1/50 (2%)Adjusted rate 16.8% 4.8% 7.6% 2.4%Terminal rate 5/31 (16%) 2/33 (6%) 2/28 (7%) 0/33 (0%)First incidence (days) 670 730 (T) 637 663Poly-3 test P=0.027N P=0.077N P=0.175N P=0.028N
Kidney (Renal Tubule): Adenoma (Single and Step Sections)Overall rate 0/50 (0%) 2/50 (4%) 1/50 (2%) 3/50 (6%)Adjusted rate 0.0% 4.8% 2.5% 7.2%Terminal rate 0/31 (0%) 1/33 (3%) 0/28 (0%) 3/33 (9%)First incidence (days) —
e 689 701 730 (T)
Poly-3 test P=0.105 P=0.239 P=0.491 P=0.121
Lung: Alveolar/bronchiolar AdenomaOverall rate 4/50 (8%) 3/50 (6%) 2/49 (4%) 1/50 (2%)Adjusted rate 9.7% 7.2% 5.0% 2.4%Terminal rate 4/31 (13%) 3/33 (9%) 1/28 (4%) 1/33 (3%)First incidence (days) 730 (T) 730 (T) 283 730 (T)Poly-3 test P=0.112N P=0.496N P=0.350N P=0.173N
Lung: Alveolar/bronchiolar Adenoma or CarcinomaOverall rate 4/50 (8%) 4/50 (8%) 2/49 (4%) 2/50 (4%)Adjusted rate 9.7% 9.6% 5.0% 4.8%Terminal rate 4/31 (13%) 4/33 (12%) 1/28 (4%) 2/33 (6%)First incidence (days) 730 (T) 730 (T) 283 730 (T)Poly-3 test P=0.208N P=0.640N P=0.350N P=0.330N
Mammary Gland: FibroadenomaOverall rate 17/50 (34%) 20/50 (40%) 12/50 (24%) 7/50 (14%)Adjusted rate 40.8% 45.9% 29.8% 16.4%Terminal rate 15/31 (48%) 15/33 (46%) 8/28 (29%) 4/33 (12%)First incidence (days) 670 462 595 578Poly-3 test P=0.002N P=0.395 P=0.207N P=0.010N
Mammary Gland: Fibroadenoma or CarcinomaOverall rate 17/50 (34%) 21/50 (42%) 12/50 (24%) 7/50 (14%)Adjusted rate 40.8% 48.2% 29.8% 16.4%Terminal rate 15/31 (48%) 16/33 (49%) 8/28 (29%) 4/33 (12%)First incidence (days) 670 462 595 578Poly-3 test P<0.001N P=0.315 P=0.207N P=0.010N
Pituitary Gland (Pars Distalis): AdenomaOverall rate 25/50 (50%) 22/50 (44%) 13/50 (26%) 15/50 (30%)Adjusted rate 56.5% 50.8% 31.4% 35.0%Terminal rate 19/31 (61%) 16/33 (49%) 7/28 (25%) 10/33 (30%)First incidence (days) 330 548 595 588Poly-3 test P=0.013N P=0.371N P=0.014N P=0.032N
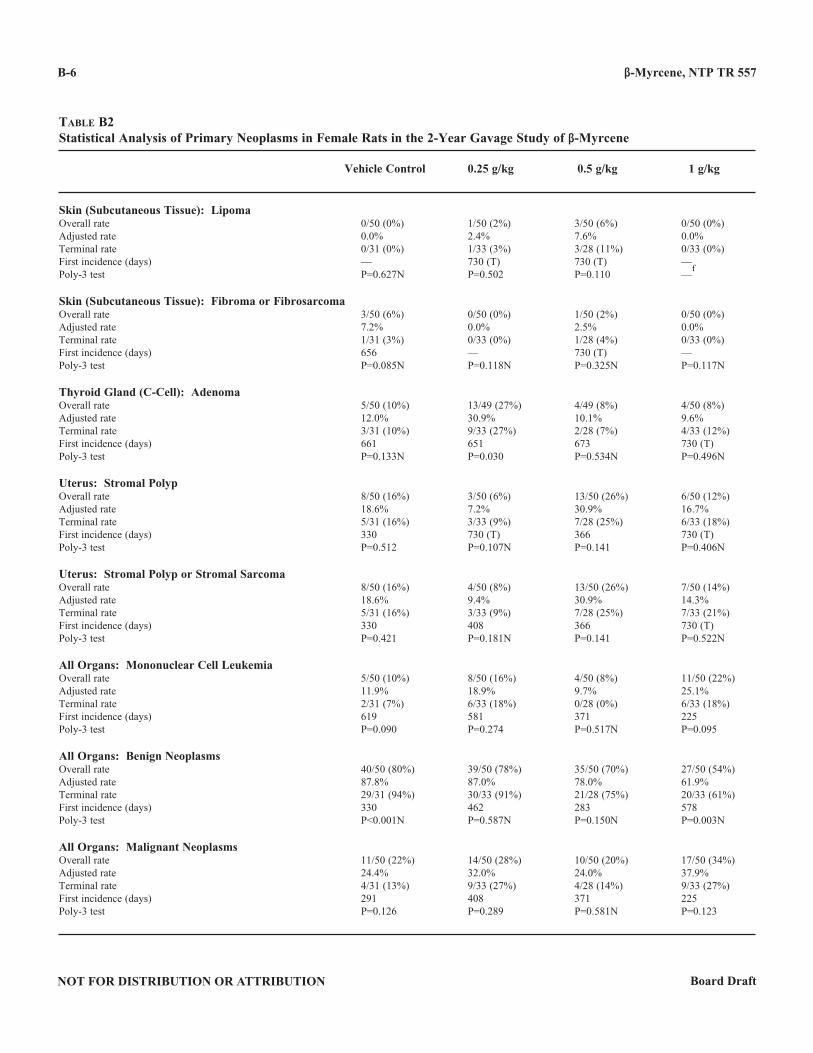
β-Myrcene, NTP TR 557
NOT FOR DISTRIBUTION OR ATTRIBUTION Board Draft
B-6
Table b2Statistical Analysis of Primary Neoplasms in Female Rats in the 2-Year Gavage Study of β-Myrcene
Vehicle Control 0 .25 g/kg 0 .5 g/kg 1 g/kg
Skin (Subcutaneous Tissue): LipomaOverall rate 0/50 (0%) 1/50 (2%) 3/50 (6%) 0/50 (0%)Adjusted rate 0.0% 2.4% 7.6% 0.0%Terminal rate 0/31 (0%) 1/33 (3%) 3/28 (11%) 0/33 (0%)First incidence (days) — 730 (T) 730 (T) —Poly-3 test P=0.627N P=0.502 P=0.110 —
f
Skin (Subcutaneous Tissue): Fibroma or FibrosarcomaOverall rate 3/50 (6%) 0/50 (0%) 1/50 (2%) 0/50 (0%)Adjusted rate 7.2% 0.0% 2.5% 0.0%Terminal rate 1/31 (3%) 0/33 (0%) 1/28 (4%) 0/33 (0%)First incidence (days) 656 — 730 (T) —Poly-3 test P=0.085N P=0.118N P=0.325N P=0.117N
Thyroid Gland (C-Cell): AdenomaOverall rate 5/50 (10%) 13/49 (27%) 4/49 (8%) 4/50 (8%)Adjusted rate 12.0% 30.9% 10.1% 9.6%Terminal rate 3/31 (10%) 9/33 (27%) 2/28 (7%) 4/33 (12%)First incidence (days) 661 651 673 730 (T)Poly-3 test P=0.133N P=0.030 P=0.534N P=0.496N
Uterus: Stromal PolypOverall rate 8/50 (16%) 3/50 (6%) 13/50 (26%) 6/50 (12%)Adjusted rate 18.6% 7.2% 30.9% 16.7%Terminal rate 5/31 (16%) 3/33 (9%) 7/28 (25%) 6/33 (18%)First incidence (days) 330 730 (T) 366 730 (T)Poly-3 test P=0.512 P=0.107N P=0.141 P=0.406N
Uterus: Stromal Polyp or Stromal SarcomaOverall rate 8/50 (16%) 4/50 (8%) 13/50 (26%) 7/50 (14%)Adjusted rate 18.6% 9.4% 30.9% 14.3%Terminal rate 5/31 (16%) 3/33 (9%) 7/28 (25%) 7/33 (21%)First incidence (days) 330 408 366 730 (T)Poly-3 test P=0.421 P=0.181N P=0.141 P=0.522N
All Organs: Mononuclear Cell LeukemiaOverall rate 5/50 (10%) 8/50 (16%) 4/50 (8%) 11/50 (22%)Adjusted rate 11.9% 18.9% 9.7% 25.1%Terminal rate 2/31 (7%) 6/33 (18%) 0/28 (0%) 6/33 (18%)First incidence (days) 619 581 371 225Poly-3 test P=0.090 P=0.274 P=0.517N P=0.095
All Organs: Benign NeoplasmsOverall rate 40/50 (80%) 39/50 (78%) 35/50 (70%) 27/50 (54%)Adjusted rate 87.8% 87.0% 78.0% 61.9%Terminal rate 29/31 (94%) 30/33 (91%) 21/28 (75%) 20/33 (61%)First incidence (days) 330 462 283 578Poly-3 test P<0.001N P=0.587N P=0.150N P=0.003N
All Organs: Malignant NeoplasmsOverall rate 11/50 (22%) 14/50 (28%) 10/50 (20%) 17/50 (34%)Adjusted rate 24.4% 32.0% 24.0% 37.9%Terminal rate 4/31 (13%) 9/33 (27%) 4/28 (14%) 9/33 (27%)First incidence (days) 291 408 371 225Poly-3 test P=0.126 P=0.289 P=0.581N P=0.123
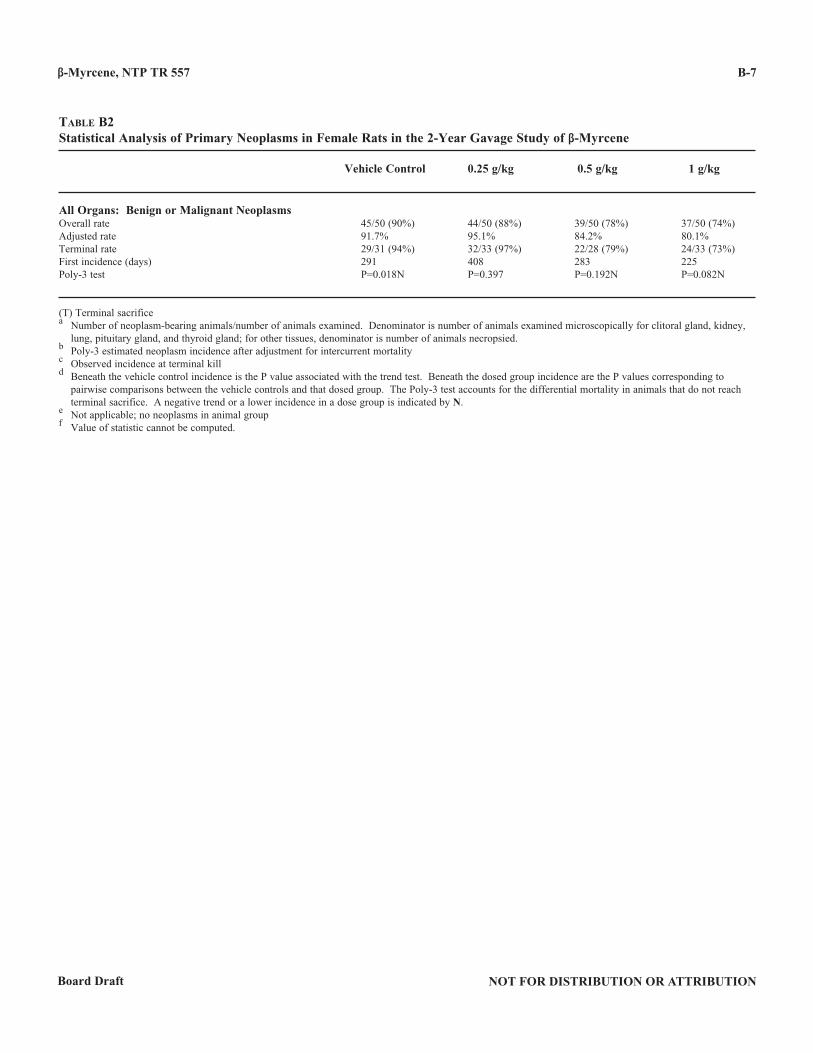
β-Myrcene, NTP TR 557
NOT FOR DISTRIBUTION OR ATTRIBUTIONBoard Draft
B-7
Table b2Statistical Analysis of Primary Neoplasms in Female Rats in the 2-Year Gavage Study of β-Myrcene
Vehicle Control 0 .25 g/kg 0 .5 g/kg 1 g/kg
All Organs: Benign or Malignant NeoplasmsOverall rate 45/50 (90%) 44/50 (88%) 39/50 (78%) 37/50 (74%)Adjusted rate 91.7% 95.1% 84.2% 80.1%Terminal rate 29/31 (94%) 32/33 (97%) 22/28 (79%) 24/33 (73%)First incidence (days) 291 408 283 225Poly-3 test P=0.018N P=0.397 P=0.192N P=0.082N
(T) Terminal sacrificea Number of neoplasm-bearing animals/number of animals examined. Denominator is number of animals examined microscopically for clitoral gland, kidney, lung, pituitary gland, and thyroid gland; for other tissues, denominator is number of animals necropsied.b Poly-3 estimated neoplasm incidence after adjustment for intercurrent mortalityc Observed incidence at terminal killd Beneath the vehicle control incidence is the P value associated with the trend test. Beneath the dosed group incidence are the P values corresponding to pairwise comparisons between the vehicle controls and that dosed group. The Poly-3 test accounts for the differential mortality in animals that do not reach terminal sacrifice. A negative trend or a lower incidence in a dose group is indicated by N.e Not applicable; no neoplasms in animal groupf Value of statistic cannot be computed.
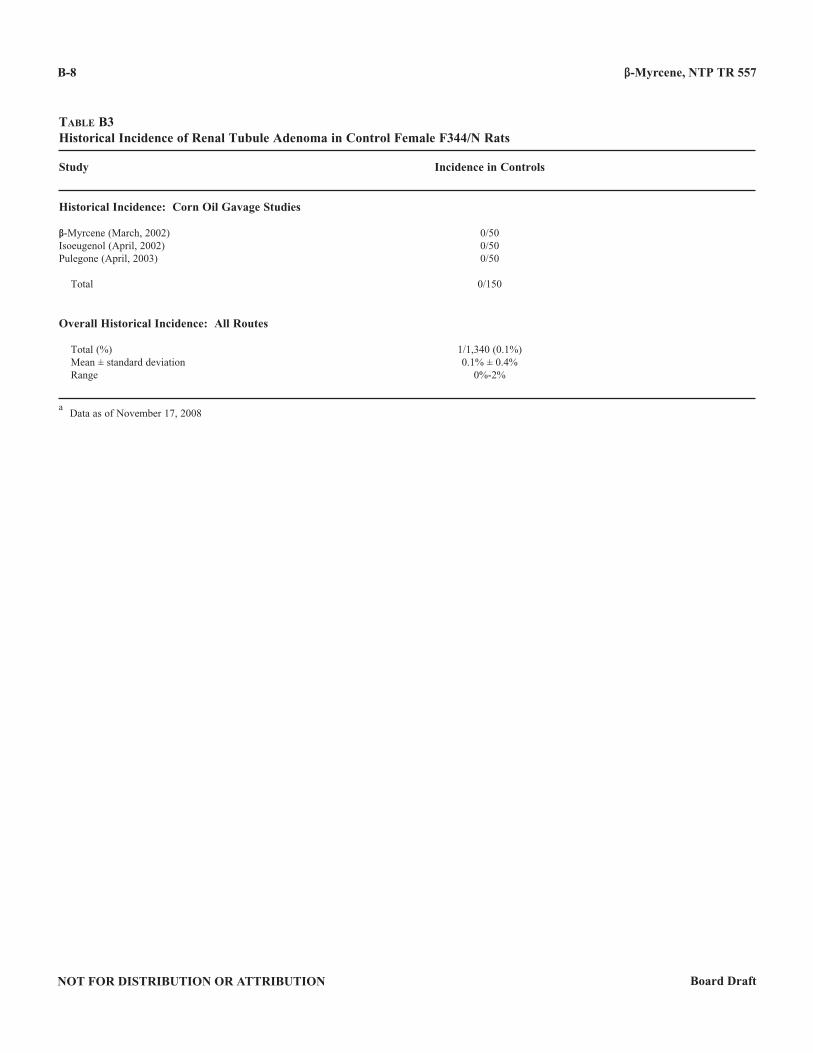
β-Myrcene, NTP TR 557
NOT FOR DISTRIBUTION OR ATTRIBUTION Board Draft
B-8
Table b3Historical Incidence of Renal Tubule Adenoma in Control Female F344/N Rats
Study Incidence in Controls
Historical Incidence: Corn Oil Gavage Studies
β-Myrcene (March, 2002) 0/50Isoeugenol (April, 2002) 0/50Pulegone (April, 2003) 0/50
Total 0/150
Overall Historical Incidence: All Routes
Total (%) 1/1,340 (0.1%) Mean ± standard deviation 0.1% ± 0.4% Range 0%-2%
a Data as of November 17, 2008
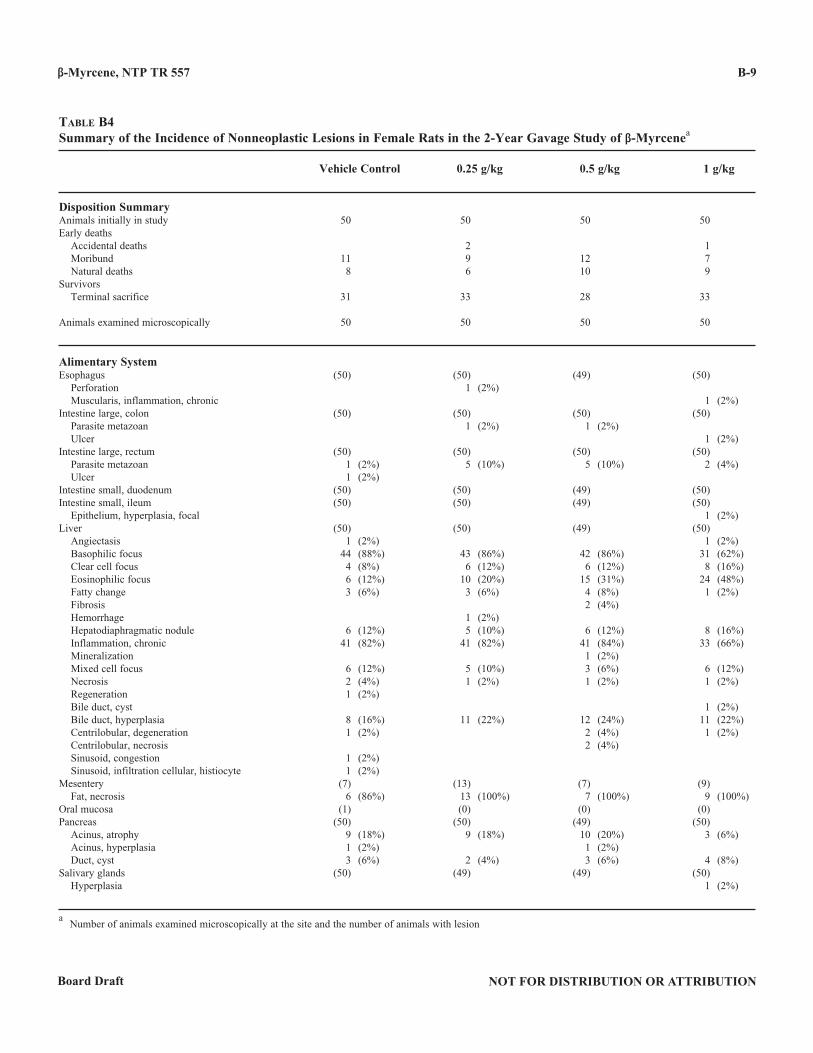
β-Myrcene, NTP TR 557
NOT FOR DISTRIBUTION OR ATTRIBUTIONBoard Draft
B-9
Table b4Summary of the Incidence of Nonneoplastic Lesions in Female Rats in the 2-Year Gavage Study of β-Myrcenea
Vehicle Control 0 .25 g/kg 0 .5 g/kg 1 g/kg
Disposition SummaryAnimals initially in study 50 50 50 50Early deaths Accidental deaths 2 1 Moribund 11 9 12 7 Natural deaths 8 6 10 9Survivors Terminal sacrifice 31 33 28 33
Animals examined microscopically 50 50 50 50
Alimentary SystemEsophagus (50) (50) (49) (50) Perforation 1 (2%) Muscularis, inflammation, chronic 1 (2%)Intestine large, colon (50) (50) (50) (50) Parasite metazoan 1 (2%) 1 (2%) Ulcer 1 (2%)Intestine large, rectum (50) (50) (50) (50) Parasite metazoan 1 (2%) 5 (10%) 5 (10%) 2 (4%) Ulcer 1 (2%)Intestine small, duodenum (50) (50) (49) (50)Intestine small, ileum (50) (50) (49) (50) Epithelium, hyperplasia, focal 1 (2%)Liver (50) (50) (49) (50) Angiectasis 1 (2%) 1 (2%) Basophilic focus 44 (88%) 43 (86%) 42 (86%) 31 (62%) Clear cell focus 4 (8%) 6 (12%) 6 (12%) 8 (16%) Eosinophilic focus 6 (12%) 10 (20%) 15 (31%) 24 (48%) Fatty change 3 (6%) 3 (6%) 4 (8%) 1 (2%) Fibrosis 2 (4%) Hemorrhage 1 (2%) Hepatodiaphragmatic nodule 6 (12%) 5 (10%) 6 (12%) 8 (16%) Inflammation, chronic 41 (82%) 41 (82%) 41 (84%) 33 (66%) Mineralization 1 (2%) Mixed cell focus 6 (12%) 5 (10%) 3 (6%) 6 (12%) Necrosis 2 (4%) 1 (2%) 1 (2%) 1 (2%) Regeneration 1 (2%) Bile duct, cyst 1 (2%) Bile duct, hyperplasia 8 (16%) 11 (22%) 12 (24%) 11 (22%) Centrilobular, degeneration 1 (2%) 2 (4%) 1 (2%) Centrilobular, necrosis 2 (4%) Sinusoid, congestion 1 (2%) Sinusoid, infiltration cellular, histiocyte 1 (2%)Mesentery (7) (13) (7) (9) Fat, necrosis 6 (86%) 13 (100%) 7 (100%) 9 (100%)Oral mucosa (1) (0) (0) (0)Pancreas (50) (50) (49) (50) Acinus, atrophy 9 (18%) 9 (18%) 10 (20%) 3 (6%) Acinus, hyperplasia 1 (2%) 1 (2%) Duct, cyst 3 (6%) 2 (4%) 3 (6%) 4 (8%)Salivary glands (50) (49) (49) (50) Hyperplasia 1 (2%)
a Number of animals examined microscopically at the site and the number of animals with lesion
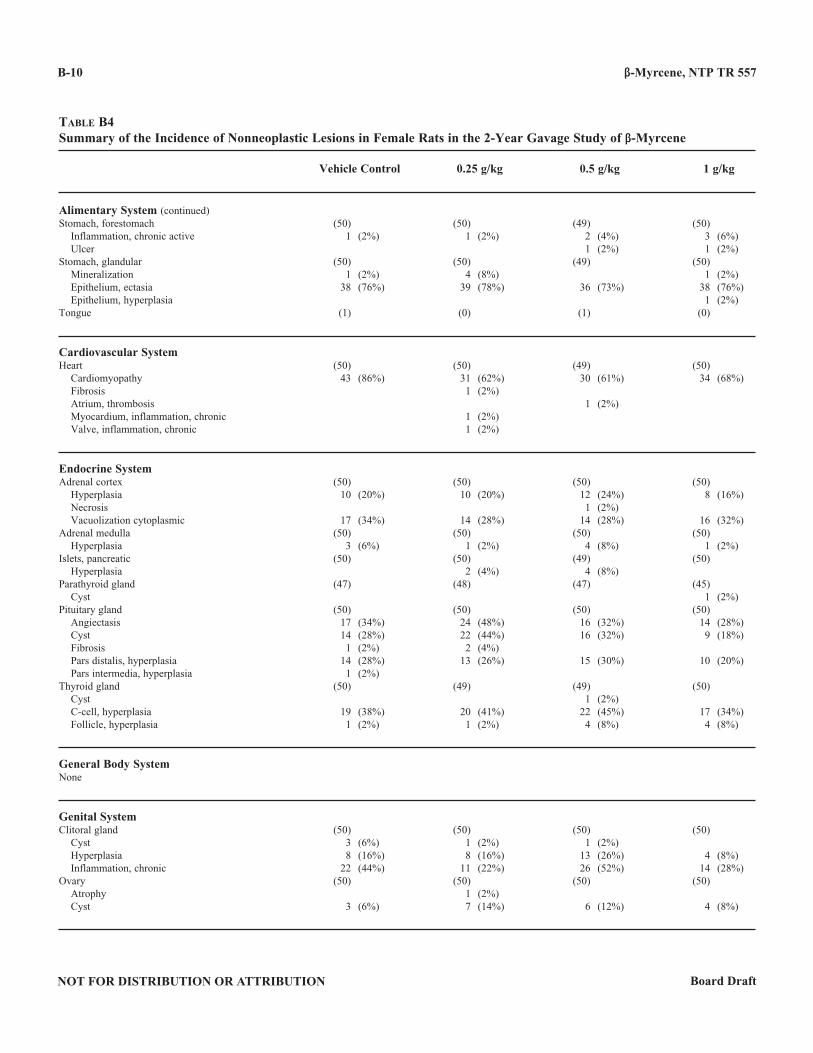
β-Myrcene, NTP TR 557
NOT FOR DISTRIBUTION OR ATTRIBUTION Board Draft
B-10
Table b4Summary of the Incidence of Nonneoplastic Lesions in Female Rats in the 2-Year Gavage Study of β-Myrcene
Vehicle Control 0 .25 g/kg 0 .5 g/kg 1 g/kg
Alimentary System (continued)Stomach, forestomach (50) (50) (49) (50) Inflammation, chronic active 1 (2%) 1 (2%) 2 (4%) 3 (6%) Ulcer 1 (2%) 1 (2%)Stomach, glandular (50) (50) (49) (50) Mineralization 1 (2%) 4 (8%) 1 (2%) Epithelium, ectasia 38 (76%) 39 (78%) 36 (73%) 38 (76%) Epithelium, hyperplasia 1 (2%)Tongue (1) (0) (1) (0)
Cardiovascular SystemHeart (50) (50) (49) (50) Cardiomyopathy 43 (86%) 31 (62%) 30 (61%) 34 (68%) Fibrosis 1 (2%) Atrium, thrombosis 1 (2%) Myocardium, inflammation, chronic 1 (2%) Valve, inflammation, chronic 1 (2%)
Endocrine SystemAdrenal cortex (50) (50) (50) (50) Hyperplasia 10 (20%) 10 (20%) 12 (24%) 8 (16%) Necrosis 1 (2%) Vacuolization cytoplasmic 17 (34%) 14 (28%) 14 (28%) 16 (32%)Adrenal medulla (50) (50) (50) (50) Hyperplasia 3 (6%) 1 (2%) 4 (8%) 1 (2%)Islets, pancreatic (50) (50) (49) (50) Hyperplasia 2 (4%) 4 (8%)Parathyroid gland (47) (48) (47) (45) Cyst 1 (2%)Pituitary gland (50) (50) (50) (50) Angiectasis 17 (34%) 24 (48%) 16 (32%) 14 (28%) Cyst 14 (28%) 22 (44%) 16 (32%) 9 (18%) Fibrosis 1 (2%) 2 (4%) Pars distalis, hyperplasia 14 (28%) 13 (26%) 15 (30%) 10 (20%) Pars intermedia, hyperplasia 1 (2%)Thyroid gland (50) (49) (49) (50) Cyst 1 (2%) C-cell, hyperplasia 19 (38%) 20 (41%) 22 (45%) 17 (34%) Follicle, hyperplasia 1 (2%) 1 (2%) 4 (8%) 4 (8%)
General Body SystemNone
Genital SystemClitoral gland (50) (50) (50) (50) Cyst 3 (6%) 1 (2%) 1 (2%) Hyperplasia 8 (16%) 8 (16%) 13 (26%) 4 (8%) Inflammation, chronic 22 (44%) 11 (22%) 26 (52%) 14 (28%)Ovary (50) (50) (50) (50) Atrophy 1 (2%) Cyst 3 (6%) 7 (14%) 6 (12%) 4 (8%)
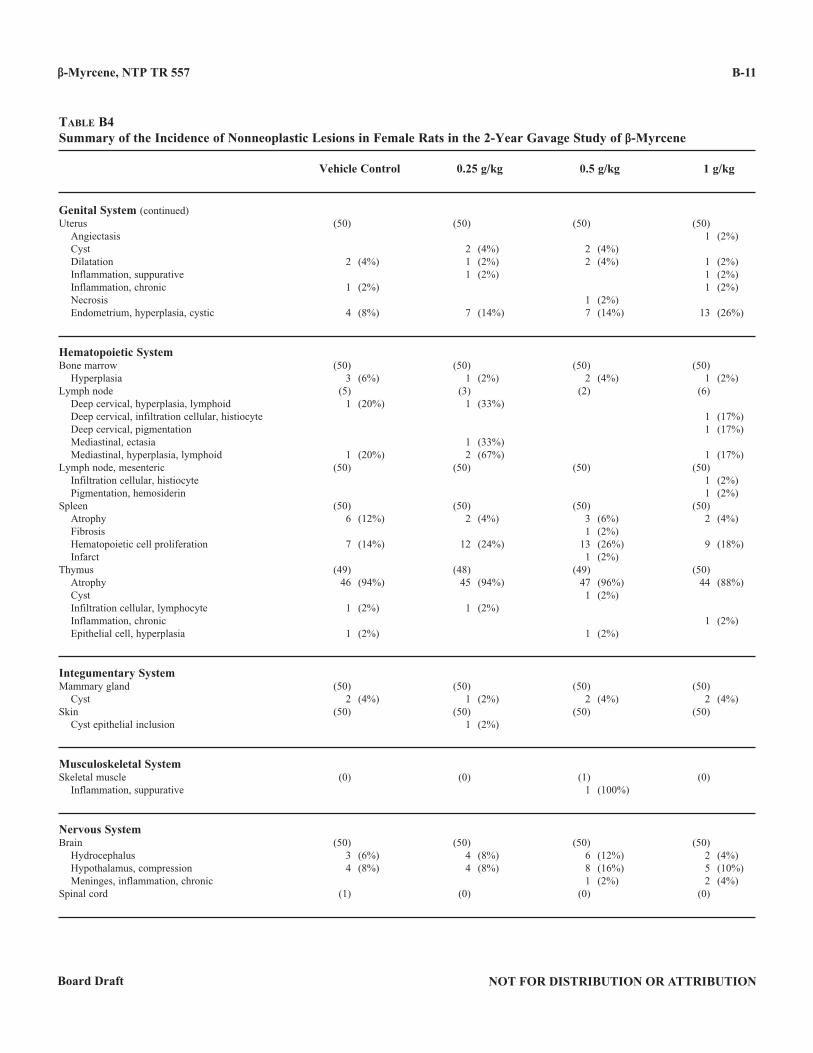
β-Myrcene, NTP TR 557
NOT FOR DISTRIBUTION OR ATTRIBUTIONBoard Draft
B-11
Table b4Summary of the Incidence of Nonneoplastic Lesions in Female Rats in the 2-Year Gavage Study of β-Myrcene
Vehicle Control 0 .25 g/kg 0 .5 g/kg 1 g/kg
Genital System (continued)Uterus (50) (50) (50) (50) Angiectasis 1 (2%) Cyst 2 (4%) 2 (4%) Dilatation 2 (4%) 1 (2%) 2 (4%) 1 (2%) Inflammation, suppurative 1 (2%) 1 (2%) Inflammation, chronic 1 (2%) 1 (2%) Necrosis 1 (2%) Endometrium, hyperplasia, cystic 4 (8%) 7 (14%) 7 (14%) 13 (26%)
Hematopoietic SystemBone marrow (50) (50) (50) (50) Hyperplasia 3 (6%) 1 (2%) 2 (4%) 1 (2%)Lymph node (5) (3) (2) (6) Deep cervical, hyperplasia, lymphoid 1 (20%) 1 (33%) Deep cervical, infiltration cellular, histiocyte 1 (17%) Deep cervical, pigmentation 1 (17%) Mediastinal, ectasia 1 (33%) Mediastinal, hyperplasia, lymphoid 1 (20%) 2 (67%) 1 (17%)Lymph node, mesenteric (50) (50) (50) (50) Infiltration cellular, histiocyte 1 (2%) Pigmentation, hemosiderin 1 (2%)Spleen (50) (50) (50) (50) Atrophy 6 (12%) 2 (4%) 3 (6%) 2 (4%) Fibrosis 1 (2%) Hematopoietic cell proliferation 7 (14%) 12 (24%) 13 (26%) 9 (18%) Infarct 1 (2%)Thymus (49) (48) (49) (50) Atrophy 46 (94%) 45 (94%) 47 (96%) 44 (88%) Cyst 1 (2%) Infiltration cellular, lymphocyte 1 (2%) 1 (2%) Inflammation, chronic 1 (2%) Epithelial cell, hyperplasia 1 (2%) 1 (2%)
Integumentary SystemMammary gland (50) (50) (50) (50) Cyst 2 (4%) 1 (2%) 2 (4%) 2 (4%)Skin (50) (50) (50) (50) Cyst epithelial inclusion 1 (2%)
Musculoskeletal SystemSkeletal muscle (0) (0) (1) (0) Inflammation, suppurative 1 (100%)
Nervous SystemBrain (50) (50) (50) (50) Hydrocephalus 3 (6%) 4 (8%) 6 (12%) 2 (4%) Hypothalamus, compression 4 (8%) 4 (8%) 8 (16%) 5 (10%) Meninges, inflammation, chronic 1 (2%) 2 (4%)Spinal cord (1) (0) (0) (0)
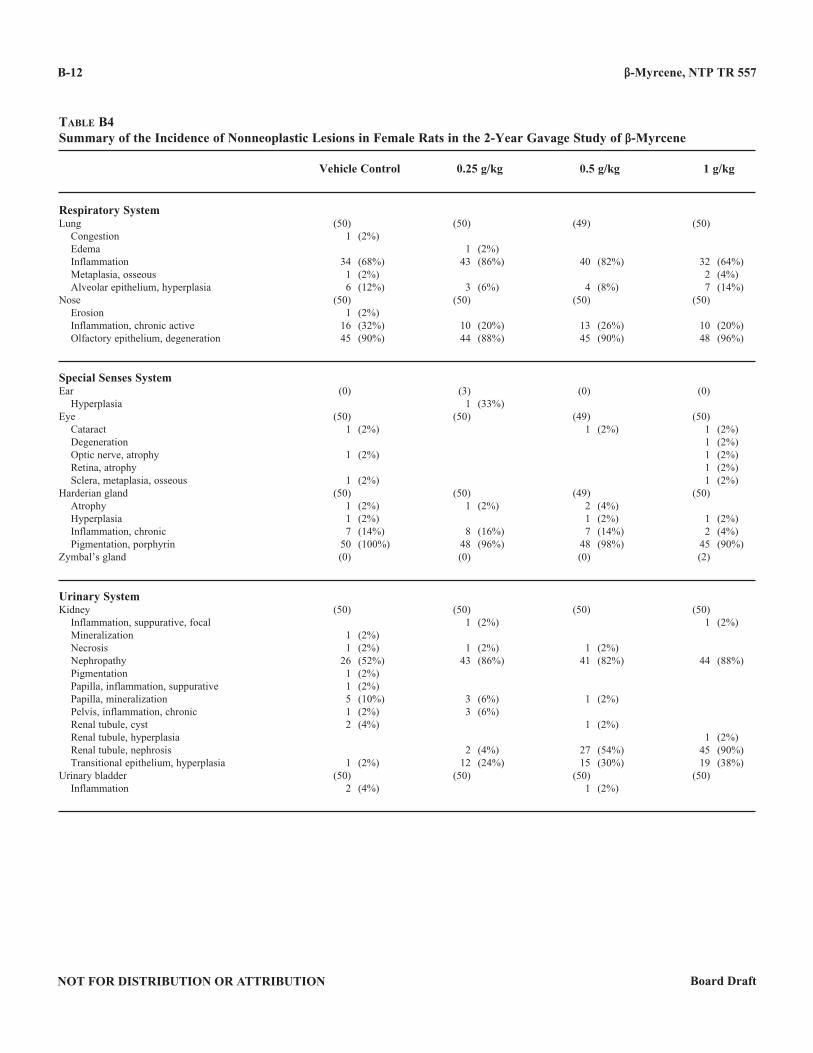
β-Myrcene, NTP TR 557
NOT FOR DISTRIBUTION OR ATTRIBUTION Board Draft
B-12
Table b4Summary of the Incidence of Nonneoplastic Lesions in Female Rats in the 2-Year Gavage Study of β-Myrcene
Vehicle Control 0 .25 g/kg 0 .5 g/kg 1 g/kg
Respiratory SystemLung (50) (50) (49) (50) Congestion 1 (2%) Edema 1 (2%) Inflammation 34 (68%) 43 (86%) 40 (82%) 32 (64%) Metaplasia, osseous 1 (2%) 2 (4%) Alveolar epithelium, hyperplasia 6 (12%) 3 (6%) 4 (8%) 7 (14%)Nose (50) (50) (50) (50) Erosion 1 (2%) Inflammation, chronic active 16 (32%) 10 (20%) 13 (26%) 10 (20%) Olfactory epithelium, degeneration 45 (90%) 44 (88%) 45 (90%) 48 (96%)
Special Senses SystemEar (0) (3) (0) (0) Hyperplasia 1 (33%)Eye (50) (50) (49) (50) Cataract 1 (2%) 1 (2%) 1 (2%) Degeneration 1 (2%) Optic nerve, atrophy 1 (2%) 1 (2%) Retina, atrophy 1 (2%) Sclera, metaplasia, osseous 1 (2%) 1 (2%)Harderian gland (50) (50) (49) (50) Atrophy 1 (2%) 1 (2%) 2 (4%) Hyperplasia 1 (2%) 1 (2%) 1 (2%) Inflammation, chronic 7 (14%) 8 (16%) 7 (14%) 2 (4%) Pigmentation, porphyrin 50 (100%) 48 (96%) 48 (98%) 45 (90%)Zymbal’s gland (0) (0) (0) (2)
Urinary SystemKidney (50) (50) (50) (50) Inflammation, suppurative, focal 1 (2%) 1 (2%) Mineralization 1 (2%) Necrosis 1 (2%) 1 (2%) 1 (2%) Nephropathy 26 (52%) 43 (86%) 41 (82%) 44 (88%) Pigmentation 1 (2%) Papilla, inflammation, suppurative 1 (2%) Papilla, mineralization 5 (10%) 3 (6%) 1 (2%) Pelvis, inflammation, chronic 1 (2%) 3 (6%) Renal tubule, cyst 2 (4%) 1 (2%) Renal tubule, hyperplasia 1 (2%) Renal tubule, nephrosis 2 (4%) 27 (54%) 45 (90%) Transitional epithelium, hyperplasia 1 (2%) 12 (24%) 15 (30%) 19 (38%)Urinary bladder (50) (50) (50) (50) Inflammation 2 (4%) 1 (2%)
NOT FOR DISTRIBUTION OR ATTRIBUTIONBoard Draft
C-1
APPENDIX CSUMMARY OF LESIONS IN MALE MICE
IN THE 2-YEAR GAVAGE STUDYOF β-MYRCENE
Table C1 Summary of the Incidence of Neoplasms in Male Mice in the 2-Year Gavage Study of β-Myrcene . . . . . . . . . . . . . . . . . . . . . . . . . . . . . . . . . . . . . . . . C-2Table C2 Statistical Analysis of Primary Neoplasms in Male Mice in the 2-Year Gavage Study of β-Myrcene . . . . . . . . . . . . . . . . . . . . . . . . . . . . . . . . . . . . . . . . C-6Table C3 Historical Incidence of Liver Neoplasms in Control Male B6C3F1 Mice . . . . . . . . . . . . . . . C-9Table C4 Summary of the Incidence of Nonneoplastic Lesions in Male Mice in the 2-Year Gavage Study of β-Myrcene . . . . . . . . . . . . . . . . . . . . . . . . . . . . . . . . . . . . . . . . C-10
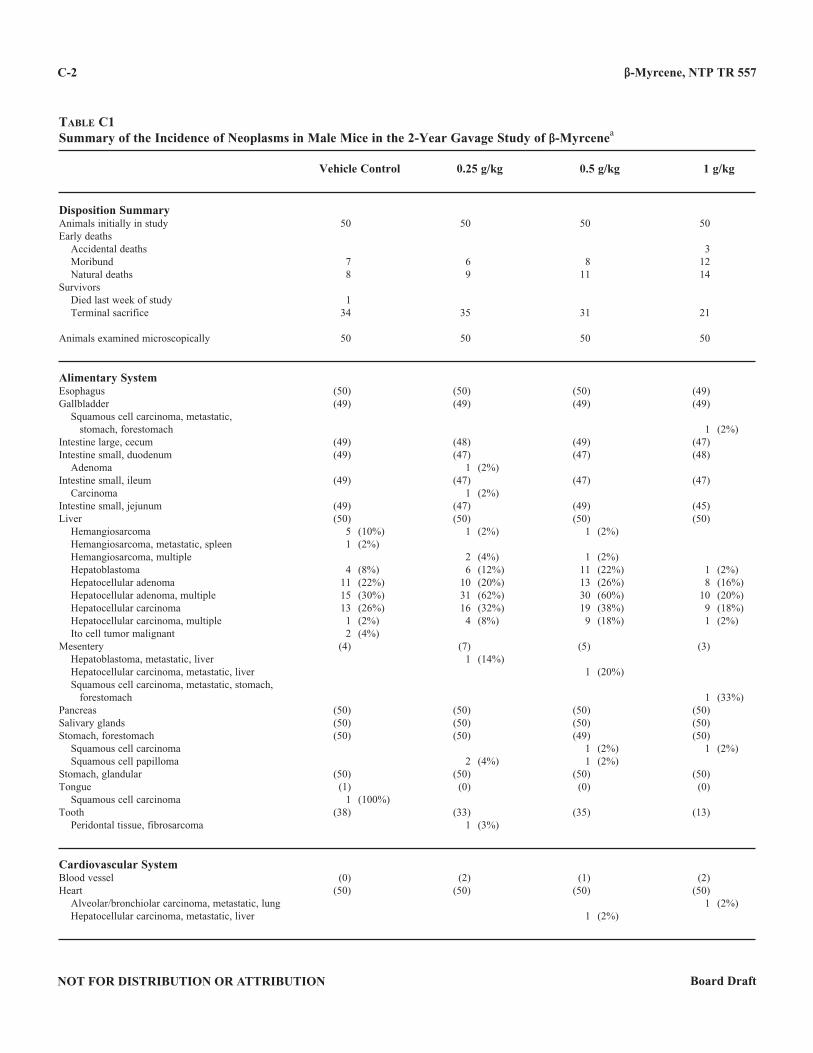
β-Myrcene, NTP TR 557
NOT FOR DISTRIBUTION OR ATTRIBUTION Board Draft
C-2
Table C1Summary of the Incidence of Neoplasms in Male Mice in the 2-Year Gavage Study of β-Myrcenea
Vehicle Control 0 .25 g/kg 0 .5 g/kg 1 g/kg
Disposition SummaryAnimals initially in study 50 50 50 50Early deaths Accidental deaths 3 Moribund 7 6 8 12 Natural deaths 8 9 11 14Survivors Died last week of study 1 Terminal sacrifice 34 35 31 21
Animals examined microscopically 50 50 50 50
Alimentary SystemEsophagus (50) (50) (50) (49)Gallbladder (49) (49) (49) (49) Squamous cell carcinoma, metastatic, stomach, forestomach 1 (2%)Intestine large, cecum (49) (48) (49) (47)Intestine small, duodenum (49) (47) (47) (48) Adenoma 1 (2%)Intestine small, ileum (49) (47) (47) (47) Carcinoma 1 (2%)Intestine small, jejunum (49) (47) (49) (45)Liver (50) (50) (50) (50) Hemangiosarcoma 5 (10%) 1 (2%) 1 (2%) Hemangiosarcoma, metastatic, spleen 1 (2%) Hemangiosarcoma, multiple 2 (4%) 1 (2%) Hepatoblastoma 4 (8%) 6 (12%) 11 (22%) 1 (2%) Hepatocellular adenoma 11 (22%) 10 (20%) 13 (26%) 8 (16%) Hepatocellular adenoma, multiple 15 (30%) 31 (62%) 30 (60%) 10 (20%) Hepatocellular carcinoma 13 (26%) 16 (32%) 19 (38%) 9 (18%) Hepatocellular carcinoma, multiple 1 (2%) 4 (8%) 9 (18%) 1 (2%) Ito cell tumor malignant 2 (4%)Mesentery (4) (7) (5) (3) Hepatoblastoma, metastatic, liver 1 (14%) Hepatocellular carcinoma, metastatic, liver 1 (20%) Squamous cell carcinoma, metastatic, stomach, forestomach 1 (33%)Pancreas (50) (50) (50) (50)Salivary glands (50) (50) (50) (50)Stomach, forestomach (50) (50) (49) (50) Squamous cell carcinoma 1 (2%) 1 (2%) Squamous cell papilloma 2 (4%) 1 (2%)Stomach, glandular (50) (50) (50) (50)Tongue (1) (0) (0) (0) Squamous cell carcinoma 1 (100%)Tooth (38) (33) (35) (13) Peridontal tissue, fibrosarcoma 1 (3%)
Cardiovascular SystemBlood vessel (0) (2) (1) (2)Heart (50) (50) (50) (50) Alveolar/bronchiolar carcinoma, metastatic, lung 1 (2%) Hepatocellular carcinoma, metastatic, liver 1 (2%)
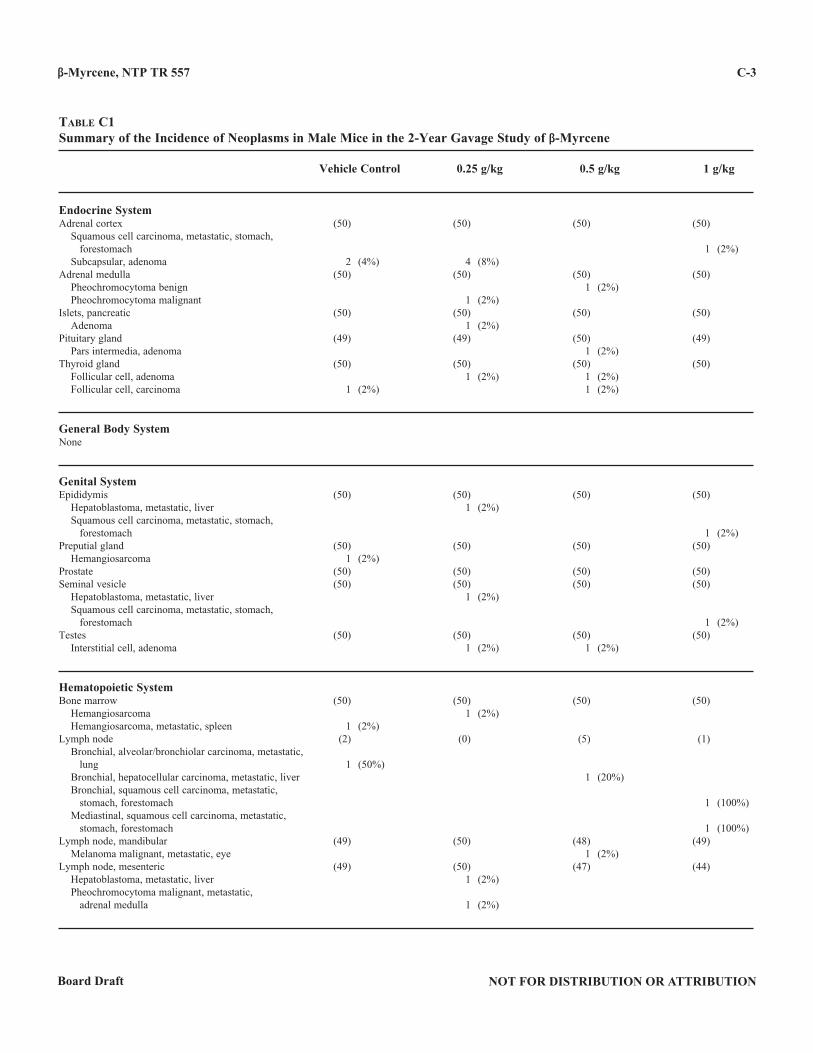
β-Myrcene, NTP TR 557
NOT FOR DISTRIBUTION OR ATTRIBUTIONBoard Draft
C-3
Table C1Summary of the Incidence of Neoplasms in Male Mice in the 2-Year Gavage Study of β-Myrcene
Vehicle Control 0 .25 g/kg 0 .5 g/kg 1 g/kg
Endocrine SystemAdrenal cortex (50) (50) (50) (50) Squamous cell carcinoma, metastatic, stomach, forestomach 1 (2%) Subcapsular, adenoma 2 (4%) 4 (8%)Adrenal medulla (50) (50) (50) (50) Pheochromocytoma benign 1 (2%) Pheochromocytoma malignant 1 (2%)Islets, pancreatic (50) (50) (50) (50) Adenoma 1 (2%)Pituitary gland (49) (49) (50) (49) Pars intermedia, adenoma 1 (2%)Thyroid gland (50) (50) (50) (50) Follicular cell, adenoma 1 (2%) 1 (2%) Follicular cell, carcinoma 1 (2%) 1 (2%)
General Body SystemNone
Genital SystemEpididymis (50) (50) (50) (50) Hepatoblastoma, metastatic, liver 1 (2%) Squamous cell carcinoma, metastatic, stomach, forestomach 1 (2%)Preputial gland (50) (50) (50) (50) Hemangiosarcoma 1 (2%)Prostate (50) (50) (50) (50)Seminal vesicle (50) (50) (50) (50) Hepatoblastoma, metastatic, liver 1 (2%) Squamous cell carcinoma, metastatic, stomach, forestomach 1 (2%)Testes (50) (50) (50) (50) Interstitial cell, adenoma 1 (2%) 1 (2%)
Hematopoietic SystemBone marrow (50) (50) (50) (50) Hemangiosarcoma 1 (2%) Hemangiosarcoma, metastatic, spleen 1 (2%)Lymph node (2) (0) (5) (1) Bronchial, alveolar/bronchiolar carcinoma, metastatic, lung 1 (50%) Bronchial, hepatocellular carcinoma, metastatic, liver 1 (20%) Bronchial, squamous cell carcinoma, metastatic, stomach, forestomach 1 (100%) Mediastinal, squamous cell carcinoma, metastatic, stomach, forestomach 1 (100%)Lymph node, mandibular (49) (50) (48) (49) Melanoma malignant, metastatic, eye 1 (2%)Lymph node, mesenteric (49) (50) (47) (44) Hepatoblastoma, metastatic, liver 1 (2%) Pheochromocytoma malignant, metastatic, adrenal medulla 1 (2%)
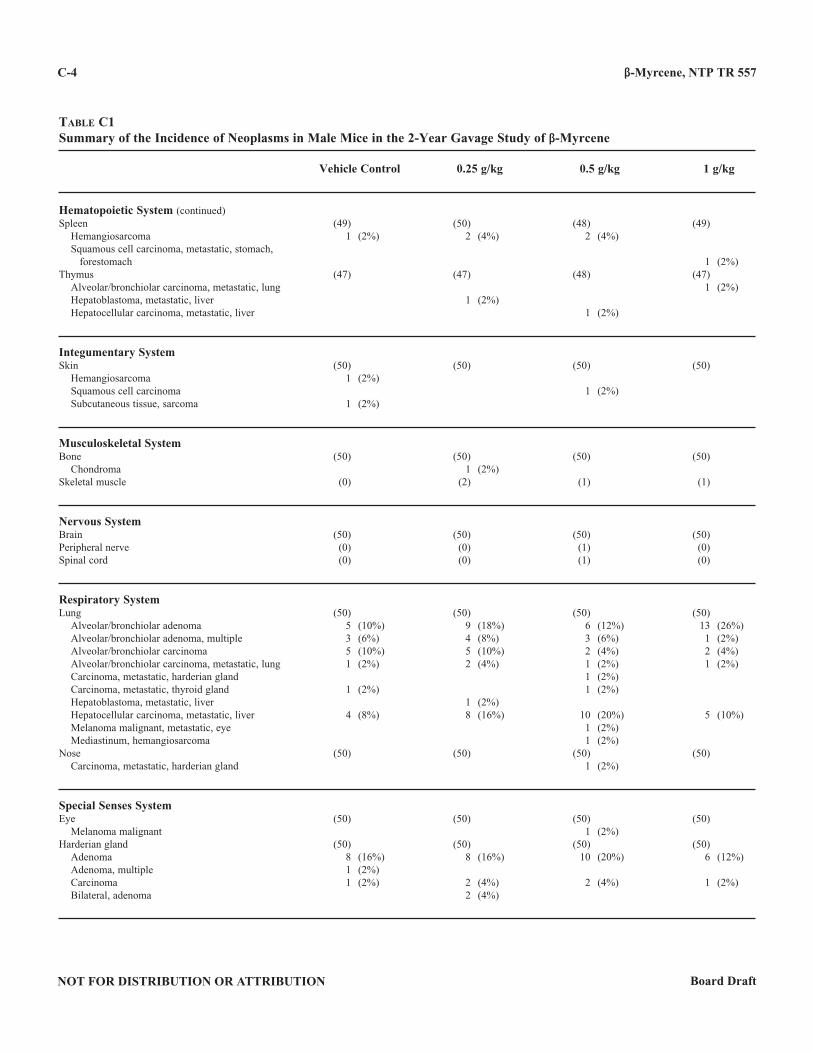
β-Myrcene, NTP TR 557
NOT FOR DISTRIBUTION OR ATTRIBUTION Board Draft
C-4
Table C1Summary of the Incidence of Neoplasms in Male Mice in the 2-Year Gavage Study of β-Myrcene
Vehicle Control 0 .25 g/kg 0 .5 g/kg 1 g/kg
Hematopoietic System (continued)Spleen (49) (50) (48) (49) Hemangiosarcoma 1 (2%) 2 (4%) 2 (4%) Squamous cell carcinoma, metastatic, stomach, forestomach 1 (2%)Thymus (47) (47) (48) (47) Alveolar/bronchiolar carcinoma, metastatic, lung 1 (2%) Hepatoblastoma, metastatic, liver 1 (2%) Hepatocellular carcinoma, metastatic, liver 1 (2%)
Integumentary SystemSkin (50) (50) (50) (50) Hemangiosarcoma 1 (2%) Squamous cell carcinoma 1 (2%) Subcutaneous tissue, sarcoma 1 (2%)
Musculoskeletal SystemBone (50) (50) (50) (50) Chondroma 1 (2%)Skeletal muscle (0) (2) (1) (1)
Nervous SystemBrain (50) (50) (50) (50)Peripheral nerve (0) (0) (1) (0)Spinal cord (0) (0) (1) (0)
Respiratory SystemLung (50) (50) (50) (50) Alveolar/bronchiolar adenoma 5 (10%) 9 (18%) 6 (12%) 13 (26%) Alveolar/bronchiolar adenoma, multiple 3 (6%) 4 (8%) 3 (6%) 1 (2%) Alveolar/bronchiolar carcinoma 5 (10%) 5 (10%) 2 (4%) 2 (4%) Alveolar/bronchiolar carcinoma, metastatic, lung 1 (2%) 2 (4%) 1 (2%) 1 (2%) Carcinoma, metastatic, harderian gland 1 (2%) Carcinoma, metastatic, thyroid gland 1 (2%) 1 (2%) Hepatoblastoma, metastatic, liver 1 (2%) Hepatocellular carcinoma, metastatic, liver 4 (8%) 8 (16%) 10 (20%) 5 (10%) Melanoma malignant, metastatic, eye 1 (2%) Mediastinum, hemangiosarcoma 1 (2%)Nose (50) (50) (50) (50) Carcinoma, metastatic, harderian gland 1 (2%)
Special Senses SystemEye (50) (50) (50) (50) Melanoma malignant 1 (2%)Harderian gland (50) (50) (50) (50) Adenoma 8 (16%) 8 (16%) 10 (20%) 6 (12%) Adenoma, multiple 1 (2%) Carcinoma 1 (2%) 2 (4%) 2 (4%) 1 (2%) Bilateral, adenoma 2 (4%)
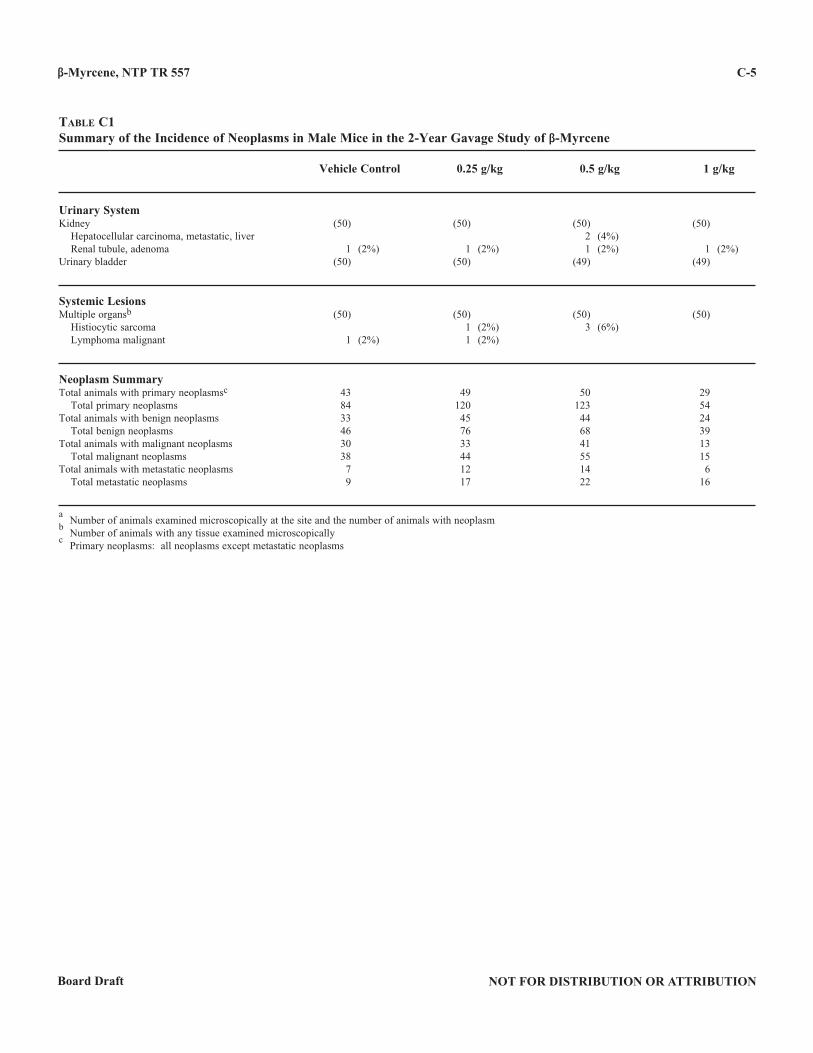
β-Myrcene, NTP TR 557
NOT FOR DISTRIBUTION OR ATTRIBUTIONBoard Draft
C-5
Table C1Summary of the Incidence of Neoplasms in Male Mice in the 2-Year Gavage Study of β-Myrcene
Vehicle Control 0 .25 g/kg 0 .5 g/kg 1 g/kg
Urinary SystemKidney (50) (50) (50) (50) Hepatocellular carcinoma, metastatic, liver 2 (4%) Renal tubule, adenoma 1 (2%) 1 (2%) 1 (2%) 1 (2%)Urinary bladder (50) (50) (49) (49)
Systemic LesionsMultiple organsb (50) (50) (50) (50) Histiocytic sarcoma 1 (2%) 3 (6%) Lymphoma malignant 1 (2%) 1 (2%)
Neoplasm SummaryTotal animals with primary neoplasmsc 43 49 50 29 Total primary neoplasms 84 120 123 54Total animals with benign neoplasms 33 45 44 24 Total benign neoplasms 46 76 68 39Total animals with malignant neoplasms 30 33 41 13 Total malignant neoplasms 38 44 55 15Total animals with metastatic neoplasms 7 12 14 6 Total metastatic neoplasms 9 17 22 16
a Number of animals examined microscopically at the site and the number of animals with neoplasm
b Number of animals with any tissue examined microscopically
c Primary neoplasms: all neoplasms except metastatic neoplasms
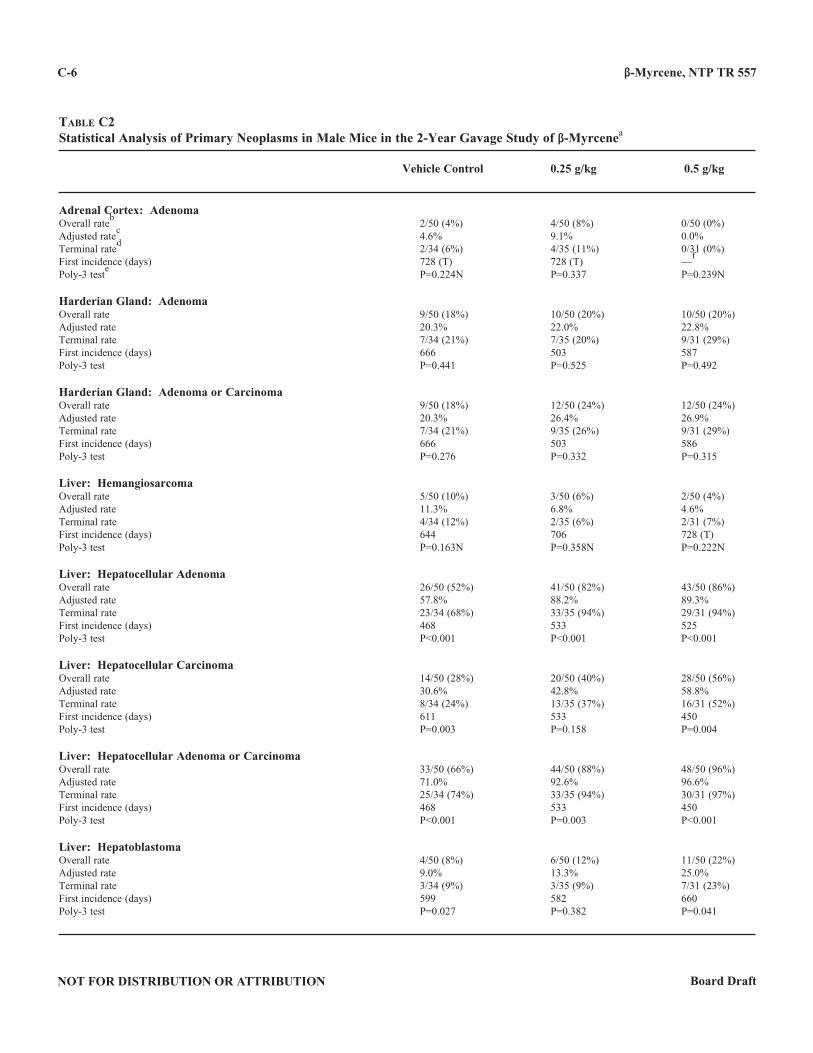
β-Myrcene, NTP TR 557
NOT FOR DISTRIBUTION OR ATTRIBUTION Board Draft
C-6
Table C2Statistical Analysis of Primary Neoplasms in Male Mice in the 2-Year Gavage Study of β-Myrcenea
Vehicle Control 0 .25 g/kg 0 .5 g/kg
Adrenal Cortex: AdenomaOverall rate
b 2/50 (4%) 4/50 (8%) 0/50 (0%)
Adjusted ratec 4.6% 9.1% 0.0%
Terminal rated 2/34 (6%) 4/35 (11%) 0/31 (0%)
First incidence (days) 728 (T) 728 (T) —f
Poly-3 teste P=0.224N P=0.337 P=0.239N
Harderian Gland: AdenomaOverall rate 9/50 (18%) 10/50 (20%) 10/50 (20%)Adjusted rate 20.3% 22.0% 22.8%Terminal rate 7/34 (21%) 7/35 (20%) 9/31 (29%)First incidence (days) 666 503 587Poly-3 test P=0.441 P=0.525 P=0.492
Harderian Gland: Adenoma or CarcinomaOverall rate 9/50 (18%) 12/50 (24%) 12/50 (24%)Adjusted rate 20.3% 26.4% 26.9%Terminal rate 7/34 (21%) 9/35 (26%) 9/31 (29%)First incidence (days) 666 503 586Poly-3 test P=0.276 P=0.332 P=0.315
Liver: HemangiosarcomaOverall rate 5/50 (10%) 3/50 (6%) 2/50 (4%)Adjusted rate 11.3% 6.8% 4.6%Terminal rate 4/34 (12%) 2/35 (6%) 2/31 (7%)First incidence (days) 644 706 728 (T)Poly-3 test P=0.163N P=0.358N P=0.222N
Liver: Hepatocellular AdenomaOverall rate 26/50 (52%) 41/50 (82%) 43/50 (86%)Adjusted rate 57.8% 88.2% 89.3%Terminal rate 23/34 (68%) 33/35 (94%) 29/31 (94%)First incidence (days) 468 533 525Poly-3 test P<0.001 P<0.001 P<0.001
Liver: Hepatocellular CarcinomaOverall rate 14/50 (28%) 20/50 (40%) 28/50 (56%)Adjusted rate 30.6% 42.8% 58.8%Terminal rate 8/34 (24%) 13/35 (37%) 16/31 (52%)First incidence (days) 611 533 450Poly-3 test P=0.003 P=0.158 P=0.004
Liver: Hepatocellular Adenoma or CarcinomaOverall rate 33/50 (66%) 44/50 (88%) 48/50 (96%)Adjusted rate 71.0% 92.6% 96.6%Terminal rate 25/34 (74%) 33/35 (94%) 30/31 (97%)First incidence (days) 468 533 450Poly-3 test P<0.001 P=0.003 P<0.001
Liver: HepatoblastomaOverall rate 4/50 (8%) 6/50 (12%) 11/50 (22%)Adjusted rate 9.0% 13.3% 25.0%Terminal rate 3/34 (9%) 3/35 (9%) 7/31 (23%)First incidence (days) 599 582 660Poly-3 test P=0.027 P=0.382 P=0.041
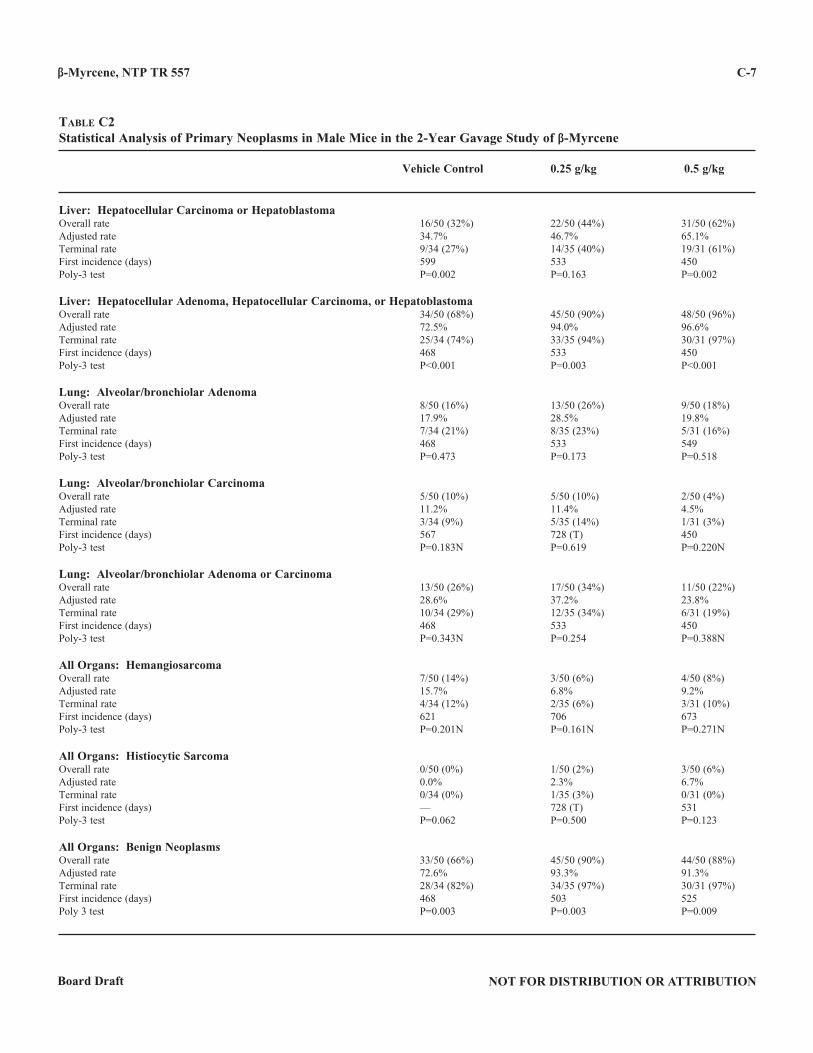
β-Myrcene, NTP TR 557
NOT FOR DISTRIBUTION OR ATTRIBUTIONBoard Draft
C-7
Table C2Statistical Analysis of Primary Neoplasms in Male Mice in the 2-Year Gavage Study of β-Myrcene
Vehicle Control 0 .25 g/kg 0 .5 g/kg
Liver: Hepatocellular Carcinoma or HepatoblastomaOverall rate 16/50 (32%) 22/50 (44%) 31/50 (62%)Adjusted rate 34.7% 46.7% 65.1%Terminal rate 9/34 (27%) 14/35 (40%) 19/31 (61%)First incidence (days) 599 533 450Poly-3 test P=0.002 P=0.163 P=0.002
Liver: Hepatocellular Adenoma, Hepatocellular Carcinoma, or HepatoblastomaOverall rate 34/50 (68%) 45/50 (90%) 48/50 (96%)Adjusted rate 72.5% 94.0% 96.6%Terminal rate 25/34 (74%) 33/35 (94%) 30/31 (97%)First incidence (days) 468 533 450Poly-3 test P<0.001 P=0.003 P<0.001
Lung: Alveolar/bronchiolar AdenomaOverall rate 8/50 (16%) 13/50 (26%) 9/50 (18%)Adjusted rate 17.9% 28.5% 19.8%Terminal rate 7/34 (21%) 8/35 (23%) 5/31 (16%)First incidence (days) 468 533 549Poly-3 test P=0.473 P=0.173 P=0.518
Lung: Alveolar/bronchiolar CarcinomaOverall rate 5/50 (10%) 5/50 (10%) 2/50 (4%)Adjusted rate 11.2% 11.4% 4.5%Terminal rate 3/34 (9%) 5/35 (14%) 1/31 (3%)First incidence (days) 567 728 (T) 450Poly-3 test P=0.183N P=0.619 P=0.220N
Lung: Alveolar/bronchiolar Adenoma or CarcinomaOverall rate 13/50 (26%) 17/50 (34%) 11/50 (22%)Adjusted rate 28.6% 37.2% 23.8%Terminal rate 10/34 (29%) 12/35 (34%) 6/31 (19%)First incidence (days) 468 533 450Poly-3 test P=0.343N P=0.254 P=0.388N
All Organs: HemangiosarcomaOverall rate 7/50 (14%) 3/50 (6%) 4/50 (8%)Adjusted rate 15.7% 6.8% 9.2%Terminal rate 4/34 (12%) 2/35 (6%) 3/31 (10%)First incidence (days) 621 706 673Poly-3 test P=0.201N P=0.161N P=0.271N
All Organs: Histiocytic SarcomaOverall rate 0/50 (0%) 1/50 (2%) 3/50 (6%)Adjusted rate 0.0% 2.3% 6.7%Terminal rate 0/34 (0%) 1/35 (3%) 0/31 (0%)First incidence (days) — 728 (T) 531Poly-3 test P=0.062 P=0.500 P=0.123
All Organs: Benign NeoplasmsOverall rate 33/50 (66%) 45/50 (90%) 44/50 (88%)Adjusted rate 72.6% 93.3% 91.3%Terminal rate 28/34 (82%) 34/35 (97%) 30/31 (97%)First incidence (days) 468 503 525Poly 3 test P=0.003 P=0.003 P=0.009
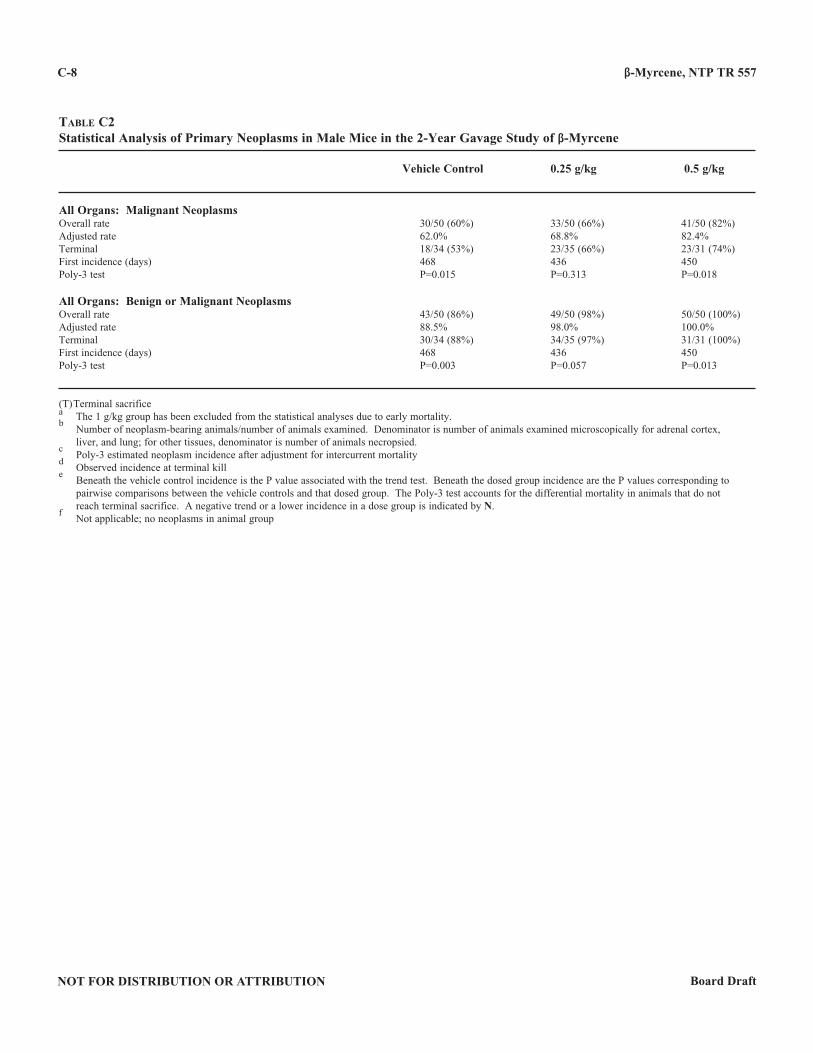
β-Myrcene, NTP TR 557
NOT FOR DISTRIBUTION OR ATTRIBUTION Board Draft
C-8
Table C2Statistical Analysis of Primary Neoplasms in Male Mice in the 2-Year Gavage Study of β-Myrcene
Vehicle Control 0 .25 g/kg 0 .5 g/kg
All Organs: Malignant NeoplasmsOverall rate 30/50 (60%) 33/50 (66%) 41/50 (82%)Adjusted rate 62.0% 68.8% 82.4%Terminal 18/34 (53%) 23/35 (66%) 23/31 (74%)First incidence (days) 468 436 450Poly-3 test P=0.015 P=0.313 P=0.018
All Organs: Benign or Malignant NeoplasmsOverall rate 43/50 (86%) 49/50 (98%) 50/50 (100%)Adjusted rate 88.5% 98.0% 100.0%Terminal 30/34 (88%) 34/35 (97%) 31/31 (100%)First incidence (days) 468 436 450Poly-3 test P=0.003 P=0.057 P=0.013
(T) Terminal sacrificea The 1 g/kg group has been excluded from the statistical analyses due to early mortality.b Number of neoplasm-bearing animals/number of animals examined. Denominator is number of animals examined microscopically for adrenal cortex,
liver, and lung; for other tissues, denominator is number of animals necropsied.c Poly-3 estimated neoplasm incidence after adjustment for intercurrent mortality
d Observed incidence at terminal kill
e Beneath the vehicle control incidence is the P value associated with the trend test. Beneath the dosed group incidence are the P values corresponding to
pairwise comparisons between the vehicle controls and that dosed group. The Poly-3 test accounts for the differential mortality in animals that do not reach terminal sacrifice. A negative trend or a lower incidence in a dose group is indicated by N.f Not applicable; no neoplasms in animal group
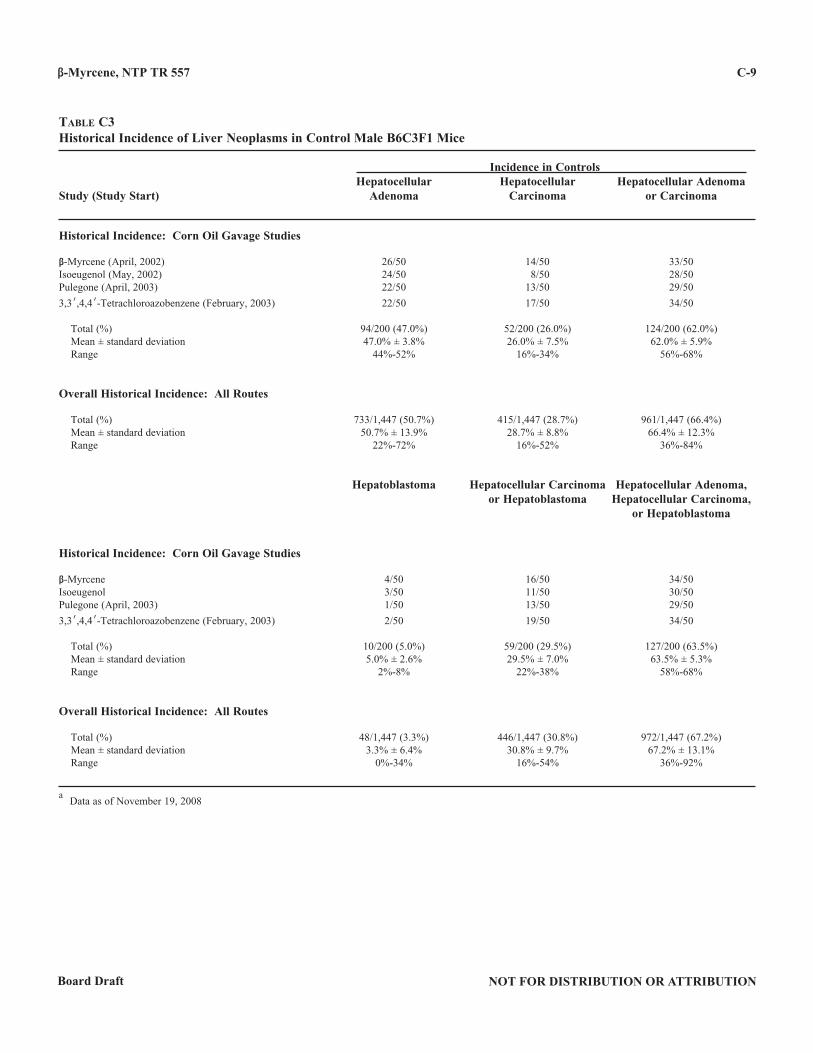
β-Myrcene, NTP TR 557
NOT FOR DISTRIBUTION OR ATTRIBUTIONBoard Draft
C-9
Table C3Historical Incidence of Liver Neoplasms in Control Male B6C3F1 Mice
Incidence in Controls Hepatocellular Hepatocellular Hepatocellular AdenomaStudy (Study Start) Adenoma Carcinoma or Carcinoma
Historical Incidence: Corn Oil Gavage Studies
β-Myrcene (April, 2002) 26/50 14/50 33/50Isoeugenol (May, 2002) 24/50 8/50 28/50Pulegone (April, 2003) 22/50 13/50 29/50
3,3N,4,4N-Tetrachloroazobenzene (February, 2003) 22/50 17/50 34/50
Total (%) 94/200 (47.0%) 52/200 (26.0%) 124/200 (62.0%) Mean ± standard deviation 47.0% ± 3.8% 26.0% ± 7.5% 62.0% ± 5.9% Range 44%-52% 16%-34% 56%-68%
Overall Historical Incidence: All Routes
Total (%) 733/1,447 (50.7%) 415/1,447 (28.7%) 961/1,447 (66.4%) Mean ± standard deviation 50.7% ± 13.9% 28.7% ± 8.8% 66.4% ± 12.3% Range 22%-72% 16%-52% 36%-84%
Hepatoblastoma Hepatocellular Carcinoma Hepatocellular Adenoma, or Hepatoblastoma Hepatocellular Carcinoma, or Hepatoblastoma
Historical Incidence: Corn Oil Gavage Studies
β-Myrcene 4/50 16/50 34/50Isoeugenol 3/50 11/50 30/50Pulegone (April, 2003) 1/50 13/50 29/50
3,3N,4,4N-Tetrachloroazobenzene (February, 2003) 2/50 19/50 34/50
Total (%) 10/200 (5.0%) 59/200 (29.5%) 127/200 (63.5%) Mean ± standard deviation 5.0% ± 2.6% 29.5% ± 7.0% 63.5% ± 5.3% Range 2%-8% 22%-38% 58%-68%
Overall Historical Incidence: All Routes
Total (%) 48/1,447 (3.3%) 446/1,447 (30.8%) 972/1,447 (67.2%) Mean ± standard deviation 3.3% ± 6.4% 30.8% ± 9.7% 67.2% ± 13.1% Range 0%-34% 16%-54% 36%-92%
a Data as of November 19, 2008
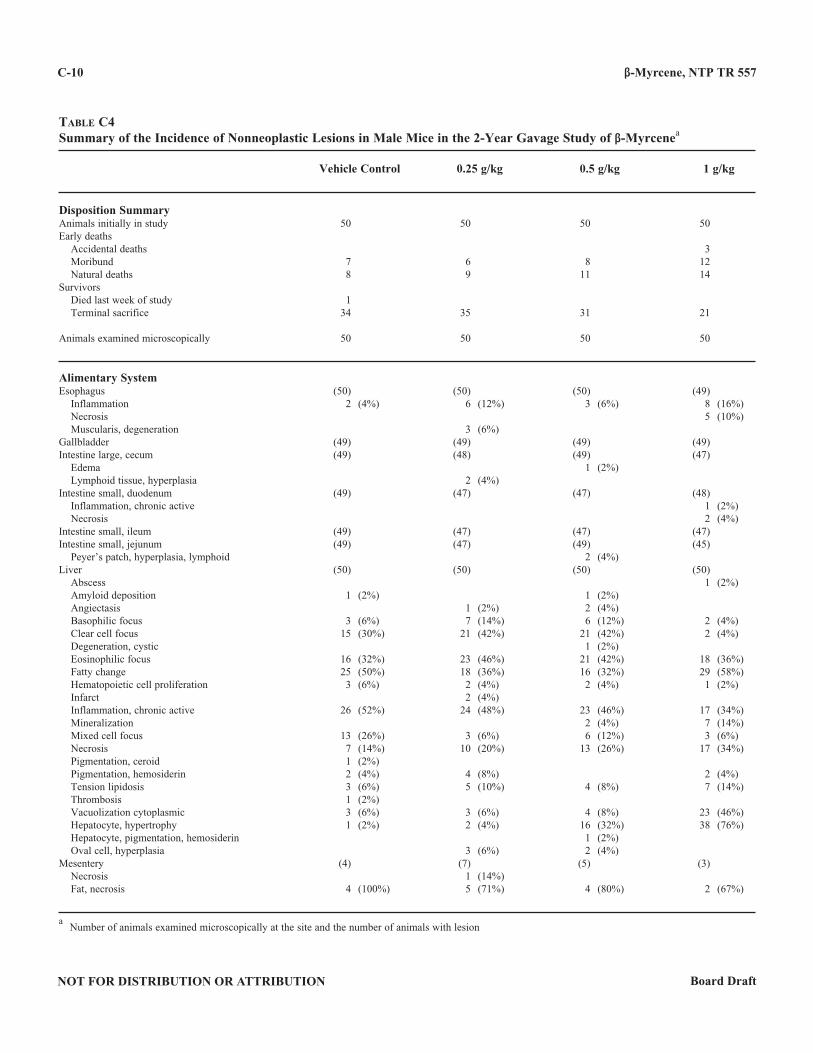
β-Myrcene, NTP TR 557
NOT FOR DISTRIBUTION OR ATTRIBUTION Board Draft
C-10
Table C4Summary of the Incidence of Nonneoplastic Lesions in Male Mice in the 2-Year Gavage Study of β-Myrcenea
Vehicle Control 0 .25 g/kg 0 .5 g/kg 1 g/kg
Disposition SummaryAnimals initially in study 50 50 50 50Early deaths Accidental deaths 3 Moribund 7 6 8 12 Natural deaths 8 9 11 14Survivors Died last week of study 1 Terminal sacrifice 34 35 31 21
Animals examined microscopically 50 50 50 50
Alimentary SystemEsophagus (50) (50) (50) (49) Inflammation 2 (4%) 6 (12%) 3 (6%) 8 (16%) Necrosis 5 (10%) Muscularis, degeneration 3 (6%)Gallbladder (49) (49) (49) (49)Intestine large, cecum (49) (48) (49) (47) Edema 1 (2%) Lymphoid tissue, hyperplasia 2 (4%)Intestine small, duodenum (49) (47) (47) (48) Inflammation, chronic active 1 (2%) Necrosis 2 (4%)Intestine small, ileum (49) (47) (47) (47)Intestine small, jejunum (49) (47) (49) (45) Peyer’s patch, hyperplasia, lymphoid 2 (4%)Liver (50) (50) (50) (50) Abscess 1 (2%) Amyloid deposition 1 (2%) 1 (2%) Angiectasis 1 (2%) 2 (4%) Basophilic focus 3 (6%) 7 (14%) 6 (12%) 2 (4%) Clear cell focus 15 (30%) 21 (42%) 21 (42%) 2 (4%) Degeneration, cystic 1 (2%) Eosinophilic focus 16 (32%) 23 (46%) 21 (42%) 18 (36%) Fatty change 25 (50%) 18 (36%) 16 (32%) 29 (58%) Hematopoietic cell proliferation 3 (6%) 2 (4%) 2 (4%) 1 (2%) Infarct 2 (4%) Inflammation, chronic active 26 (52%) 24 (48%) 23 (46%) 17 (34%) Mineralization 2 (4%) 7 (14%) Mixed cell focus 13 (26%) 3 (6%) 6 (12%) 3 (6%) Necrosis 7 (14%) 10 (20%) 13 (26%) 17 (34%) Pigmentation, ceroid 1 (2%) Pigmentation, hemosiderin 2 (4%) 4 (8%) 2 (4%) Tension lipidosis 3 (6%) 5 (10%) 4 (8%) 7 (14%) Thrombosis 1 (2%) Vacuolization cytoplasmic 3 (6%) 3 (6%) 4 (8%) 23 (46%) Hepatocyte, hypertrophy 1 (2%) 2 (4%) 16 (32%) 38 (76%) Hepatocyte, pigmentation, hemosiderin 1 (2%) Oval cell, hyperplasia 3 (6%) 2 (4%)Mesentery (4) (7) (5) (3) Necrosis 1 (14%) Fat, necrosis 4 (100%) 5 (71%) 4 (80%) 2 (67%)
a Number of animals examined microscopically at the site and the number of animals with lesion
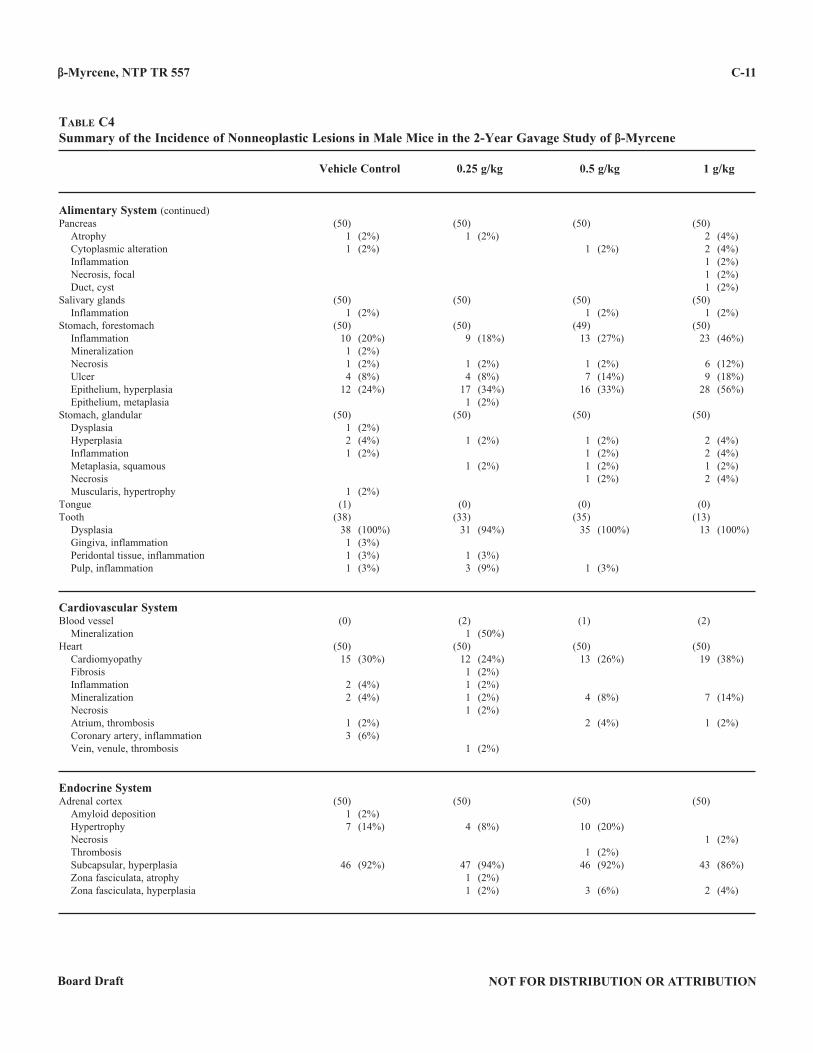
β-Myrcene, NTP TR 557
NOT FOR DISTRIBUTION OR ATTRIBUTIONBoard Draft
C-11
Table C4Summary of the Incidence of Nonneoplastic Lesions in Male Mice in the 2-Year Gavage Study of β-Myrcene
Vehicle Control 0 .25 g/kg 0 .5 g/kg 1 g/kg
Alimentary System (continued)Pancreas (50) (50) (50) (50) Atrophy 1 (2%) 1 (2%) 2 (4%) Cytoplasmic alteration 1 (2%) 1 (2%) 2 (4%) Inflammation 1 (2%) Necrosis, focal 1 (2%) Duct, cyst 1 (2%)Salivary glands (50) (50) (50) (50) Inflammation 1 (2%) 1 (2%) 1 (2%)Stomach, forestomach (50) (50) (49) (50) Inflammation 10 (20%) 9 (18%) 13 (27%) 23 (46%) Mineralization 1 (2%) Necrosis 1 (2%) 1 (2%) 1 (2%) 6 (12%) Ulcer 4 (8%) 4 (8%) 7 (14%) 9 (18%) Epithelium, hyperplasia 12 (24%) 17 (34%) 16 (33%) 28 (56%) Epithelium, metaplasia 1 (2%)Stomach, glandular (50) (50) (50) (50) Dysplasia 1 (2%) Hyperplasia 2 (4%) 1 (2%) 1 (2%) 2 (4%) Inflammation 1 (2%) 1 (2%) 2 (4%) Metaplasia, squamous 1 (2%) 1 (2%) 1 (2%) Necrosis 1 (2%) 2 (4%) Muscularis, hypertrophy 1 (2%)Tongue (1) (0) (0) (0)Tooth (38) (33) (35) (13) Dysplasia 38 (100%) 31 (94%) 35 (100%) 13 (100%) Gingiva, inflammation 1 (3%) Peridontal tissue, inflammation 1 (3%) 1 (3%) Pulp, inflammation 1 (3%) 3 (9%) 1 (3%)
Cardiovascular SystemBlood vessel (0) (2) (1) (2) Mineralization 1 (50%)Heart (50) (50) (50) (50) Cardiomyopathy 15 (30%) 12 (24%) 13 (26%) 19 (38%) Fibrosis 1 (2%) Inflammation 2 (4%) 1 (2%) Mineralization 2 (4%) 1 (2%) 4 (8%) 7 (14%) Necrosis 1 (2%) Atrium, thrombosis 1 (2%) 2 (4%) 1 (2%) Coronary artery, inflammation 3 (6%) Vein, venule, thrombosis 1 (2%)
Endocrine SystemAdrenal cortex (50) (50) (50) (50) Amyloid deposition 1 (2%) Hypertrophy 7 (14%) 4 (8%) 10 (20%) Necrosis 1 (2%) Thrombosis 1 (2%) Subcapsular, hyperplasia 46 (92%) 47 (94%) 46 (92%) 43 (86%) Zona fasciculata, atrophy 1 (2%) Zona fasciculata, hyperplasia 1 (2%) 3 (6%) 2 (4%)
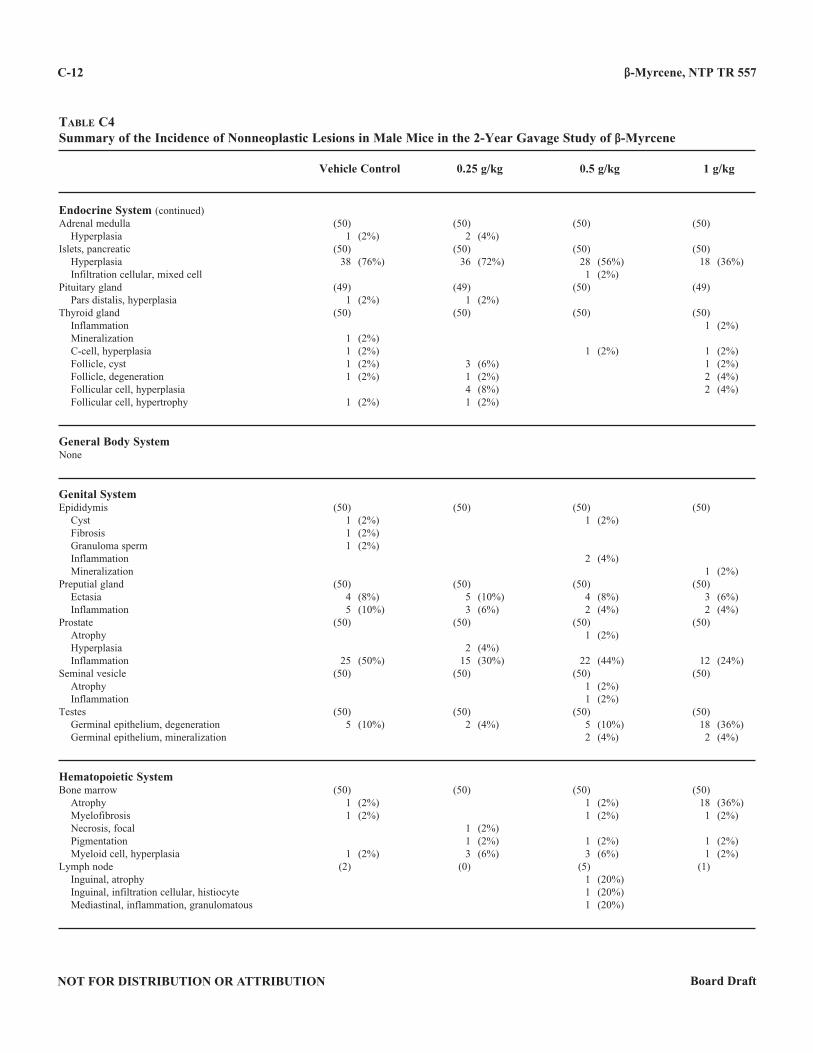
β-Myrcene, NTP TR 557
NOT FOR DISTRIBUTION OR ATTRIBUTION Board Draft
C-12
Table C4Summary of the Incidence of Nonneoplastic Lesions in Male Mice in the 2-Year Gavage Study of β-Myrcene
Vehicle Control 0 .25 g/kg 0 .5 g/kg 1 g/kg
Endocrine System (continued)Adrenal medulla (50) (50) (50) (50) Hyperplasia 1 (2%) 2 (4%)Islets, pancreatic (50) (50) (50) (50) Hyperplasia 38 (76%) 36 (72%) 28 (56%) 18 (36%) Infiltration cellular, mixed cell 1 (2%)Pituitary gland (49) (49) (50) (49) Pars distalis, hyperplasia 1 (2%) 1 (2%)Thyroid gland (50) (50) (50) (50) Inflammation 1 (2%) Mineralization 1 (2%) C-cell, hyperplasia 1 (2%) 1 (2%) 1 (2%) Follicle, cyst 1 (2%) 3 (6%) 1 (2%) Follicle, degeneration 1 (2%) 1 (2%) 2 (4%) Follicular cell, hyperplasia 4 (8%) 2 (4%) Follicular cell, hypertrophy 1 (2%) 1 (2%)
General Body SystemNone
Genital SystemEpididymis (50) (50) (50) (50) Cyst 1 (2%) 1 (2%) Fibrosis 1 (2%) Granuloma sperm 1 (2%) Inflammation 2 (4%) Mineralization 1 (2%)Preputial gland (50) (50) (50) (50) Ectasia 4 (8%) 5 (10%) 4 (8%) 3 (6%) Inflammation 5 (10%) 3 (6%) 2 (4%) 2 (4%)Prostate (50) (50) (50) (50) Atrophy 1 (2%) Hyperplasia 2 (4%) Inflammation 25 (50%) 15 (30%) 22 (44%) 12 (24%)Seminal vesicle (50) (50) (50) (50) Atrophy 1 (2%) Inflammation 1 (2%)Testes (50) (50) (50) (50) Germinal epithelium, degeneration 5 (10%) 2 (4%) 5 (10%) 18 (36%) Germinal epithelium, mineralization 2 (4%) 2 (4%)
Hematopoietic SystemBone marrow (50) (50) (50) (50) Atrophy 1 (2%) 1 (2%) 18 (36%) Myelofibrosis 1 (2%) 1 (2%) 1 (2%) Necrosis, focal 1 (2%) Pigmentation 1 (2%) 1 (2%) 1 (2%) Myeloid cell, hyperplasia 1 (2%) 3 (6%) 3 (6%) 1 (2%)Lymph node (2) (0) (5) (1) Inguinal, atrophy 1 (20%) Inguinal, infiltration cellular, histiocyte 1 (20%) Mediastinal, inflammation, granulomatous 1 (20%)
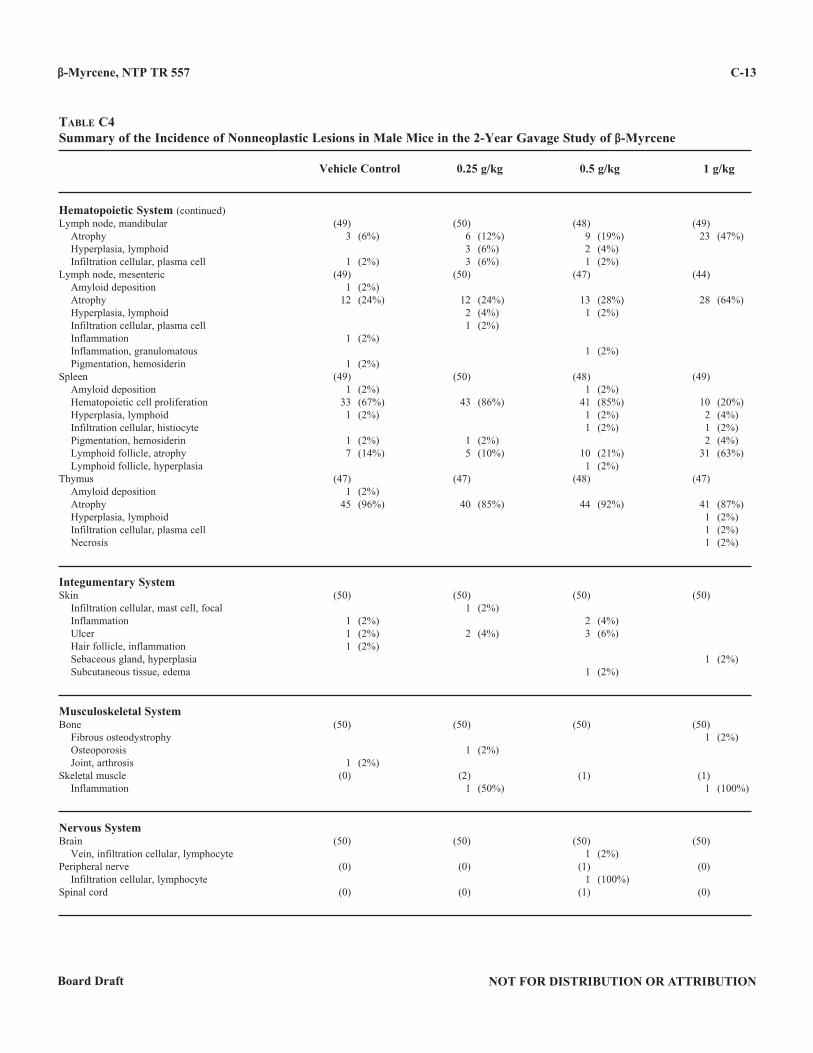
β-Myrcene, NTP TR 557
NOT FOR DISTRIBUTION OR ATTRIBUTIONBoard Draft
C-13
Table C4Summary of the Incidence of Nonneoplastic Lesions in Male Mice in the 2-Year Gavage Study of β-Myrcene
Vehicle Control 0 .25 g/kg 0 .5 g/kg 1 g/kg
Hematopoietic System (continued)Lymph node, mandibular (49) (50) (48) (49) Atrophy 3 (6%) 6 (12%) 9 (19%) 23 (47%) Hyperplasia, lymphoid 3 (6%) 2 (4%) Infiltration cellular, plasma cell 1 (2%) 3 (6%) 1 (2%)Lymph node, mesenteric (49) (50) (47) (44) Amyloid deposition 1 (2%) Atrophy 12 (24%) 12 (24%) 13 (28%) 28 (64%) Hyperplasia, lymphoid 2 (4%) 1 (2%) Infiltration cellular, plasma cell 1 (2%) Inflammation 1 (2%) Inflammation, granulomatous 1 (2%) Pigmentation, hemosiderin 1 (2%)Spleen (49) (50) (48) (49) Amyloid deposition 1 (2%) 1 (2%) Hematopoietic cell proliferation 33 (67%) 43 (86%) 41 (85%) 10 (20%) Hyperplasia, lymphoid 1 (2%) 1 (2%) 2 (4%) Infiltration cellular, histiocyte 1 (2%) 1 (2%) Pigmentation, hemosiderin 1 (2%) 1 (2%) 2 (4%) Lymphoid follicle, atrophy 7 (14%) 5 (10%) 10 (21%) 31 (63%) Lymphoid follicle, hyperplasia 1 (2%)Thymus (47) (47) (48) (47) Amyloid deposition 1 (2%) Atrophy 45 (96%) 40 (85%) 44 (92%) 41 (87%) Hyperplasia, lymphoid 1 (2%) Infiltration cellular, plasma cell 1 (2%) Necrosis 1 (2%)
Integumentary SystemSkin (50) (50) (50) (50) Infiltration cellular, mast cell, focal 1 (2%) Inflammation 1 (2%) 2 (4%) Ulcer 1 (2%) 2 (4%) 3 (6%) Hair follicle, inflammation 1 (2%) Sebaceous gland, hyperplasia 1 (2%) Subcutaneous tissue, edema 1 (2%)
Musculoskeletal SystemBone (50) (50) (50) (50) Fibrous osteodystrophy 1 (2%) Osteoporosis 1 (2%) Joint, arthrosis 1 (2%)Skeletal muscle (0) (2) (1) (1) Inflammation 1 (50%) 1 (100%)
Nervous SystemBrain (50) (50) (50) (50) Vein, infiltration cellular, lymphocyte 1 (2%)Peripheral nerve (0) (0) (1) (0) Infiltration cellular, lymphocyte 1 (100%)Spinal cord (0) (0) (1) (0)
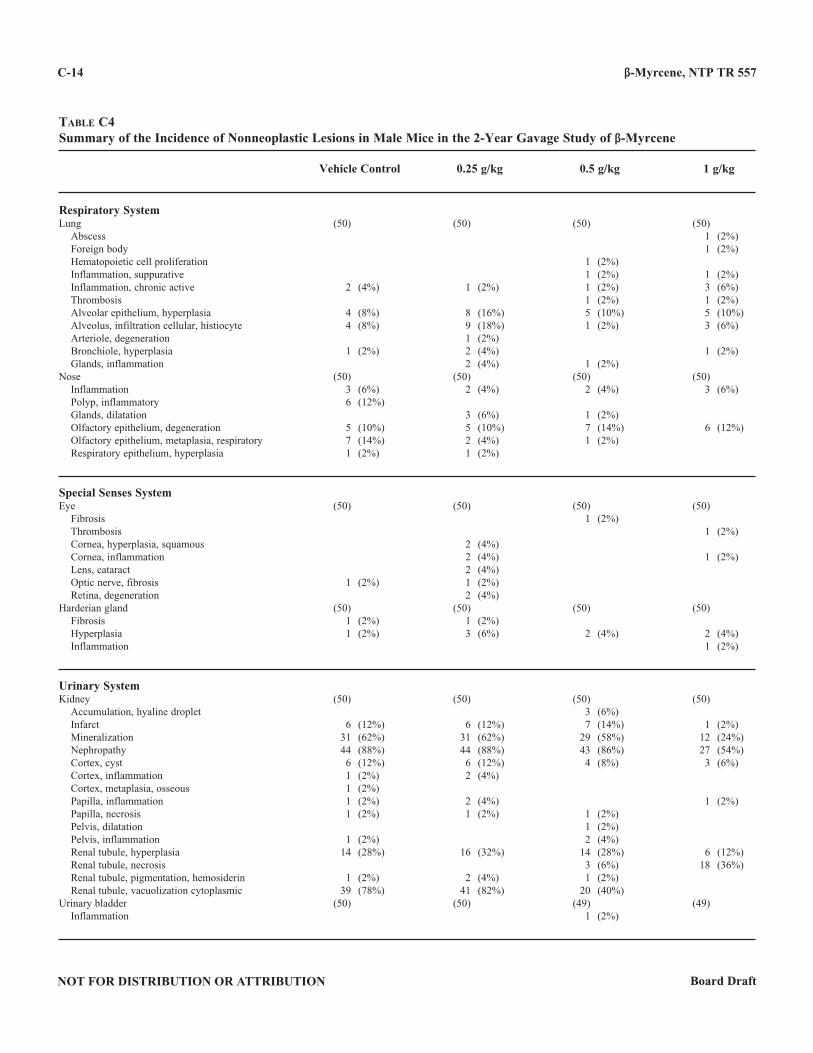
β-Myrcene, NTP TR 557
NOT FOR DISTRIBUTION OR ATTRIBUTION Board Draft
C-14
Table C4Summary of the Incidence of Nonneoplastic Lesions in Male Mice in the 2-Year Gavage Study of β-Myrcene
Vehicle Control 0 .25 g/kg 0 .5 g/kg 1 g/kg
Respiratory SystemLung (50) (50) (50) (50) Abscess 1 (2%) Foreign body 1 (2%) Hematopoietic cell proliferation 1 (2%) Inflammation, suppurative 1 (2%) 1 (2%) Inflammation, chronic active 2 (4%) 1 (2%) 1 (2%) 3 (6%) Thrombosis 1 (2%) 1 (2%) Alveolar epithelium, hyperplasia 4 (8%) 8 (16%) 5 (10%) 5 (10%) Alveolus, infiltration cellular, histiocyte 4 (8%) 9 (18%) 1 (2%) 3 (6%) Arteriole, degeneration 1 (2%) Bronchiole, hyperplasia 1 (2%) 2 (4%) 1 (2%) Glands, inflammation 2 (4%) 1 (2%)Nose (50) (50) (50) (50) Inflammation 3 (6%) 2 (4%) 2 (4%) 3 (6%) Polyp, inflammatory 6 (12%) Glands, dilatation 3 (6%) 1 (2%) Olfactory epithelium, degeneration 5 (10%) 5 (10%) 7 (14%) 6 (12%) Olfactory epithelium, metaplasia, respiratory 7 (14%) 2 (4%) 1 (2%) Respiratory epithelium, hyperplasia 1 (2%) 1 (2%)
Special Senses SystemEye (50) (50) (50) (50) Fibrosis 1 (2%) Thrombosis 1 (2%) Cornea, hyperplasia, squamous 2 (4%) Cornea, inflammation 2 (4%) 1 (2%) Lens, cataract 2 (4%) Optic nerve, fibrosis 1 (2%) 1 (2%) Retina, degeneration 2 (4%)Harderian gland (50) (50) (50) (50) Fibrosis 1 (2%) 1 (2%) Hyperplasia 1 (2%) 3 (6%) 2 (4%) 2 (4%) Inflammation 1 (2%)
Urinary SystemKidney (50) (50) (50) (50) Accumulation, hyaline droplet 3 (6%) Infarct 6 (12%) 6 (12%) 7 (14%) 1 (2%) Mineralization 31 (62%) 31 (62%) 29 (58%) 12 (24%) Nephropathy 44 (88%) 44 (88%) 43 (86%) 27 (54%) Cortex, cyst 6 (12%) 6 (12%) 4 (8%) 3 (6%) Cortex, inflammation 1 (2%) 2 (4%) Cortex, metaplasia, osseous 1 (2%) Papilla, inflammation 1 (2%) 2 (4%) 1 (2%) Papilla, necrosis 1 (2%) 1 (2%) 1 (2%) Pelvis, dilatation 1 (2%) Pelvis, inflammation 1 (2%) 2 (4%) Renal tubule, hyperplasia 14 (28%) 16 (32%) 14 (28%) 6 (12%) Renal tubule, necrosis 3 (6%) 18 (36%) Renal tubule, pigmentation, hemosiderin 1 (2%) 2 (4%) 1 (2%) Renal tubule, vacuolization cytoplasmic 39 (78%) 41 (82%) 20 (40%)Urinary bladder (50) (50) (49) (49) Inflammation 1 (2%)
NOT FOR DISTRIBUTION OR ATTRIBUTIONBoard Draft
D-1
APPENDIX DSUMMARY OF LESIONS IN FEMALE MICE
IN THE 2-YEAR GAVAGE STUDYOF β-MYRCENE
Table D1 Summary of the Incidence of Neoplasms in Female Mice in the 2-Year Gavage Study of β-Myrcene . . . . . . . . . . . . . . . . . . . . . . . . . . . . . . . . . . . . . . . . D-2Table D2 Statistical Analysis of Primary Neoplasms in Female Mice in the 2-Year Gavage Study of β-Myrcene . . . . . . . . . . . . . . . . . . . . . . . . . . . . . . . . . . . . . . . . D-6Table D3 Historical Incidence of Hepatocellular Neoplasms in Control Female B6C3F1 Mice . . . . . D-8Table D4 Summary of the Incidence of Nonneoplastic Lesions in Female Mice in the 2-Year Gavage Study of β-Myrcene . . . . . . . . . . . . . . . . . . . . . . . . . . . . . . . . . . . . . . . . D-9
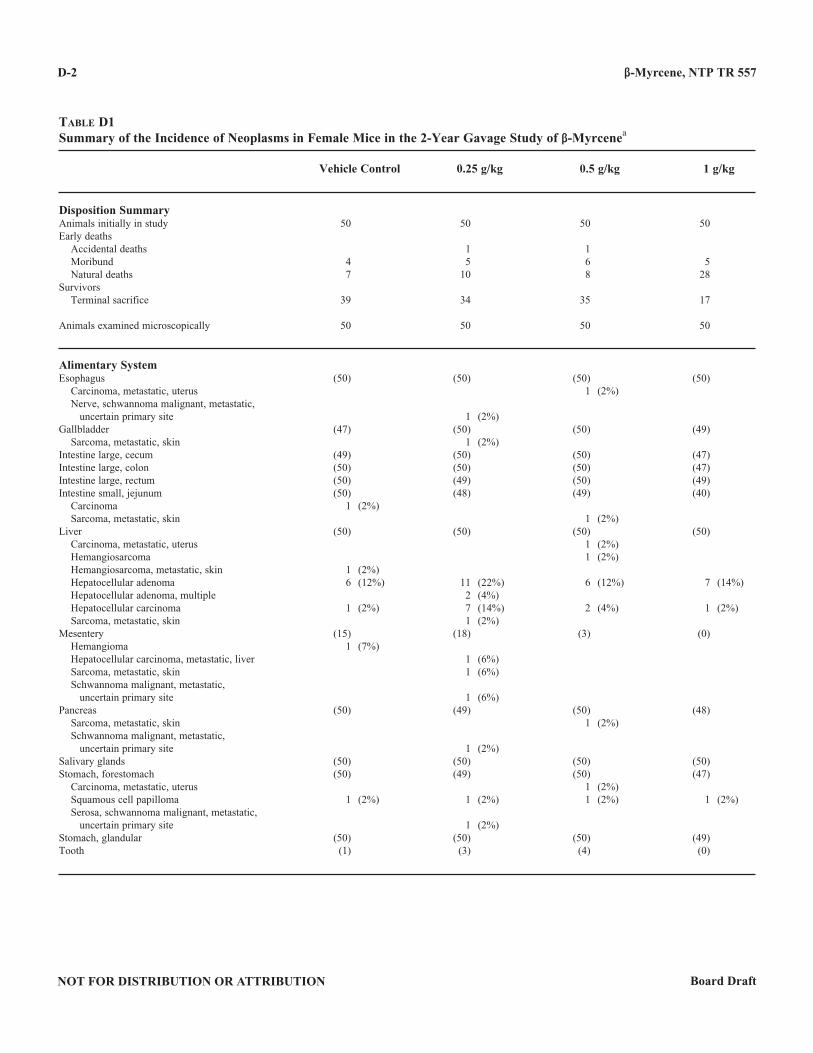
β-Myrcene, NTP TR 557
NOT FOR DISTRIBUTION OR ATTRIBUTION Board Draft
D-2
Table D1Summary of the Incidence of Neoplasms in Female Mice in the 2-Year Gavage Study of β-Myrcenea
Vehicle Control 0 .25 g/kg 0 .5 g/kg 1 g/kg
Disposition SummaryAnimals initially in study 50 50 50 50Early deaths Accidental deaths 1 1 Moribund 4 5 6 5 Natural deaths 7 10 8 28Survivors Terminal sacrifice 39 34 35 17
Animals examined microscopically 50 50 50 50
Alimentary SystemEsophagus (50) (50) (50) (50) Carcinoma, metastatic, uterus 1 (2%) Nerve, schwannoma malignant, metastatic, uncertain primary site 1 (2%)Gallbladder (47) (50) (50) (49) Sarcoma, metastatic, skin 1 (2%)Intestine large, cecum (49) (50) (50) (47)Intestine large, colon (50) (50) (50) (47)Intestine large, rectum (50) (49) (50) (49)Intestine small, jejunum (50) (48) (49) (40) Carcinoma 1 (2%) Sarcoma, metastatic, skin 1 (2%)Liver (50) (50) (50) (50) Carcinoma, metastatic, uterus 1 (2%) Hemangiosarcoma 1 (2%) Hemangiosarcoma, metastatic, skin 1 (2%) Hepatocellular adenoma 6 (12%) 11 (22%) 6 (12%) 7 (14%) Hepatocellular adenoma, multiple 2 (4%) Hepatocellular carcinoma 1 (2%) 7 (14%) 2 (4%) 1 (2%) Sarcoma, metastatic, skin 1 (2%)Mesentery (15) (18) (3) (0) Hemangioma 1 (7%) Hepatocellular carcinoma, metastatic, liver 1 (6%) Sarcoma, metastatic, skin 1 (6%) Schwannoma malignant, metastatic, uncertain primary site 1 (6%)Pancreas (50) (49) (50) (48) Sarcoma, metastatic, skin 1 (2%) Schwannoma malignant, metastatic, uncertain primary site 1 (2%)Salivary glands (50) (50) (50) (50)Stomach, forestomach (50) (49) (50) (47) Carcinoma, metastatic, uterus 1 (2%) Squamous cell papilloma 1 (2%) 1 (2%) 1 (2%) 1 (2%) Serosa, schwannoma malignant, metastatic, uncertain primary site 1 (2%)Stomach, glandular (50) (50) (50) (49)Tooth (1) (3) (4) (0)
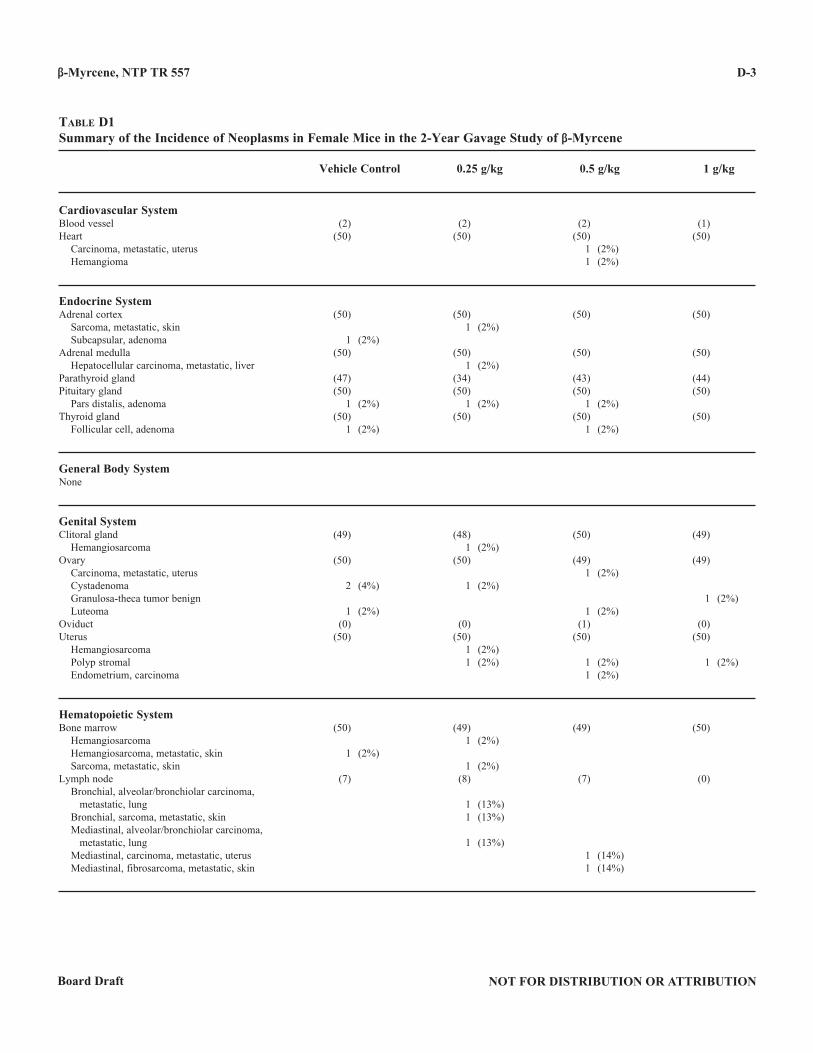
β-Myrcene, NTP TR 557
NOT FOR DISTRIBUTION OR ATTRIBUTIONBoard Draft
D-3
Table D1Summary of the Incidence of Neoplasms in Female Mice in the 2-Year Gavage Study of β-Myrcene
Vehicle Control 0 .25 g/kg 0 .5 g/kg 1 g/kg
Cardiovascular SystemBlood vessel (2) (2) (2) (1)Heart (50) (50) (50) (50) Carcinoma, metastatic, uterus 1 (2%) Hemangioma 1 (2%)
Endocrine SystemAdrenal cortex (50) (50) (50) (50) Sarcoma, metastatic, skin 1 (2%) Subcapsular, adenoma 1 (2%)Adrenal medulla (50) (50) (50) (50) Hepatocellular carcinoma, metastatic, liver 1 (2%)Parathyroid gland (47) (34) (43) (44)Pituitary gland (50) (50) (50) (50) Pars distalis, adenoma 1 (2%) 1 (2%) 1 (2%)Thyroid gland (50) (50) (50) (50) Follicular cell, adenoma 1 (2%) 1 (2%)
General Body SystemNone
Genital SystemClitoral gland (49) (48) (50) (49) Hemangiosarcoma 1 (2%)Ovary (50) (50) (49) (49) Carcinoma, metastatic, uterus 1 (2%) Cystadenoma 2 (4%) 1 (2%) Granulosa-theca tumor benign 1 (2%) Luteoma 1 (2%) 1 (2%)Oviduct (0) (0) (1) (0)Uterus (50) (50) (50) (50) Hemangiosarcoma 1 (2%) Polyp stromal 1 (2%) 1 (2%) 1 (2%) Endometrium, carcinoma 1 (2%)
Hematopoietic SystemBone marrow (50) (49) (49) (50) Hemangiosarcoma 1 (2%) Hemangiosarcoma, metastatic, skin 1 (2%) Sarcoma, metastatic, skin 1 (2%)Lymph node (7) (8) (7) (0) Bronchial, alveolar/bronchiolar carcinoma, metastatic, lung 1 (13%) Bronchial, sarcoma, metastatic, skin 1 (13%) Mediastinal, alveolar/bronchiolar carcinoma, metastatic, lung 1 (13%) Mediastinal, carcinoma, metastatic, uterus 1 (14%) Mediastinal, fibrosarcoma, metastatic, skin 1 (14%)
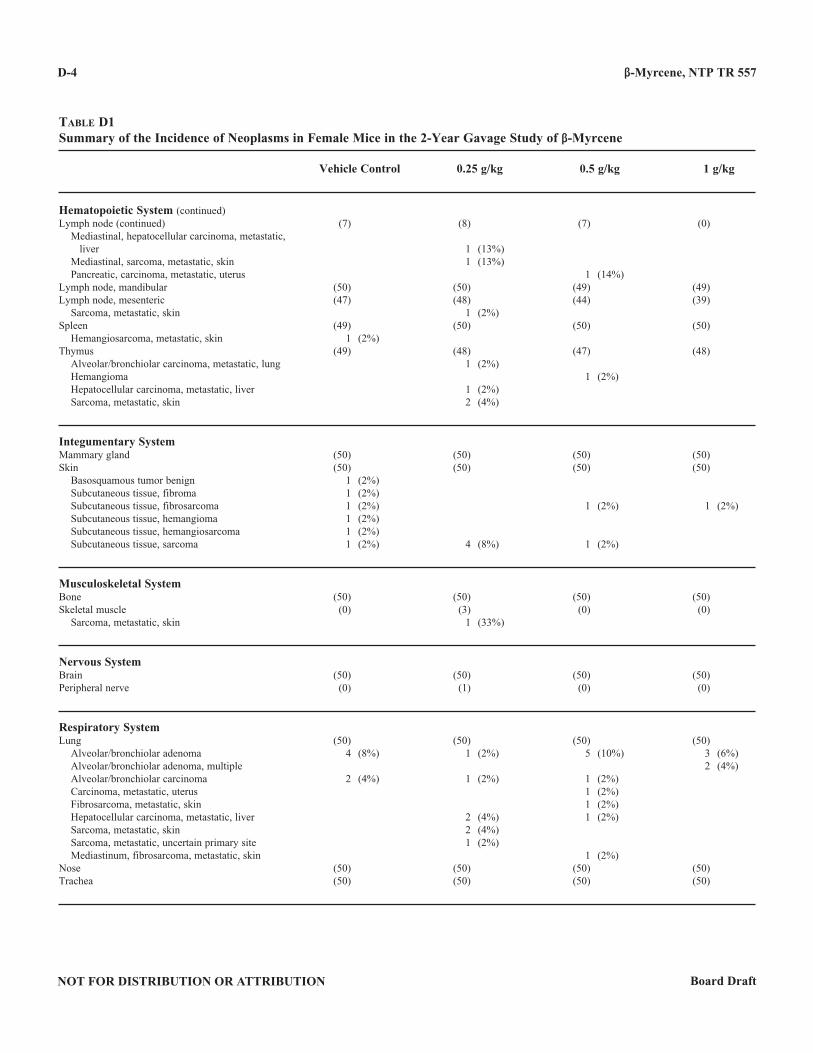
β-Myrcene, NTP TR 557
NOT FOR DISTRIBUTION OR ATTRIBUTION Board Draft
D-4
Table D1Summary of the Incidence of Neoplasms in Female Mice in the 2-Year Gavage Study of β-Myrcene
Vehicle Control 0 .25 g/kg 0 .5 g/kg 1 g/kg
Hematopoietic System (continued)Lymph node (continued) (7) (8) (7) (0) Mediastinal, hepatocellular carcinoma, metastatic, liver 1 (13%) Mediastinal, sarcoma, metastatic, skin 1 (13%) Pancreatic, carcinoma, metastatic, uterus 1 (14%)Lymph node, mandibular (50) (50) (49) (49)Lymph node, mesenteric (47) (48) (44) (39) Sarcoma, metastatic, skin 1 (2%)Spleen (49) (50) (50) (50) Hemangiosarcoma, metastatic, skin 1 (2%)Thymus (49) (48) (47) (48) Alveolar/bronchiolar carcinoma, metastatic, lung 1 (2%) Hemangioma 1 (2%) Hepatocellular carcinoma, metastatic, liver 1 (2%) Sarcoma, metastatic, skin 2 (4%)
Integumentary SystemMammary gland (50) (50) (50) (50)Skin (50) (50) (50) (50) Basosquamous tumor benign 1 (2%) Subcutaneous tissue, fibroma 1 (2%) Subcutaneous tissue, fibrosarcoma 1 (2%) 1 (2%) 1 (2%) Subcutaneous tissue, hemangioma 1 (2%) Subcutaneous tissue, hemangiosarcoma 1 (2%) Subcutaneous tissue, sarcoma 1 (2%) 4 (8%) 1 (2%)
Musculoskeletal SystemBone (50) (50) (50) (50)Skeletal muscle (0) (3) (0) (0) Sarcoma, metastatic, skin 1 (33%)
Nervous SystemBrain (50) (50) (50) (50)Peripheral nerve (0) (1) (0) (0)
Respiratory SystemLung (50) (50) (50) (50) Alveolar/bronchiolar adenoma 4 (8%) 1 (2%) 5 (10%) 3 (6%) Alveolar/bronchiolar adenoma, multiple 2 (4%) Alveolar/bronchiolar carcinoma 2 (4%) 1 (2%) 1 (2%) Carcinoma, metastatic, uterus 1 (2%) Fibrosarcoma, metastatic, skin 1 (2%) Hepatocellular carcinoma, metastatic, liver 2 (4%) 1 (2%) Sarcoma, metastatic, skin 2 (4%) Sarcoma, metastatic, uncertain primary site 1 (2%) Mediastinum, fibrosarcoma, metastatic, skin 1 (2%)Nose (50) (50) (50) (50)Trachea (50) (50) (50) (50)
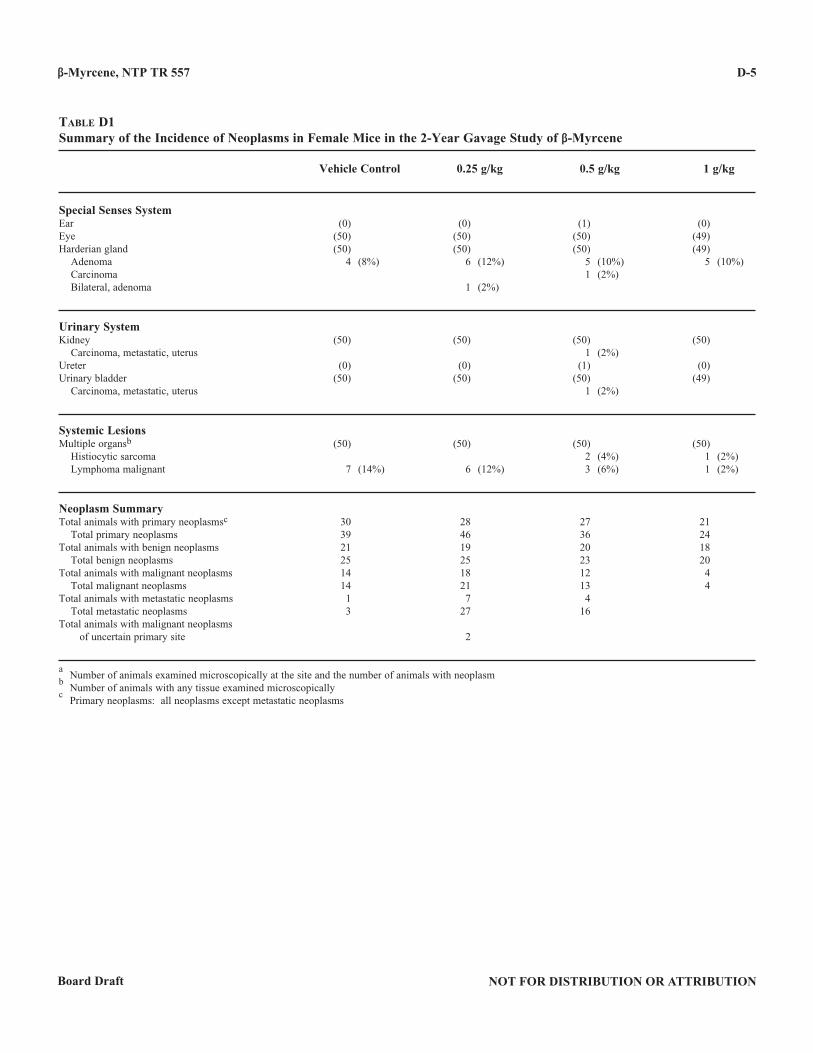
β-Myrcene, NTP TR 557
NOT FOR DISTRIBUTION OR ATTRIBUTIONBoard Draft
D-5
Table D1Summary of the Incidence of Neoplasms in Female Mice in the 2-Year Gavage Study of β-Myrcene
Vehicle Control 0 .25 g/kg 0 .5 g/kg 1 g/kg
Special Senses SystemEar (0) (0) (1) (0)Eye (50) (50) (50) (49)Harderian gland (50) (50) (50) (49) Adenoma 4 (8%) 6 (12%) 5 (10%) 5 (10%) Carcinoma 1 (2%) Bilateral, adenoma 1 (2%)
Urinary SystemKidney (50) (50) (50) (50) Carcinoma, metastatic, uterus 1 (2%)Ureter (0) (0) (1) (0)Urinary bladder (50) (50) (50) (49) Carcinoma, metastatic, uterus 1 (2%)
Systemic LesionsMultiple organsb (50) (50) (50) (50) Histiocytic sarcoma 2 (4%) 1 (2%) Lymphoma malignant 7 (14%) 6 (12%) 3 (6%) 1 (2%)
Neoplasm SummaryTotal animals with primary neoplasmsc 30 28 27 21 Total primary neoplasms 39 46 36 24Total animals with benign neoplasms 21 19 20 18 Total benign neoplasms 25 25 23 20Total animals with malignant neoplasms 14 18 12 4 Total malignant neoplasms 14 21 13 4Total animals with metastatic neoplasms 1 7 4 Total metastatic neoplasms 3 27 16Total animals with malignant neoplasms of uncertain primary site 2
a Number of animals examined microscopically at the site and the number of animals with neoplasm
b Number of animals with any tissue examined microscopically
c Primary neoplasms: all neoplasms except metastatic neoplasms
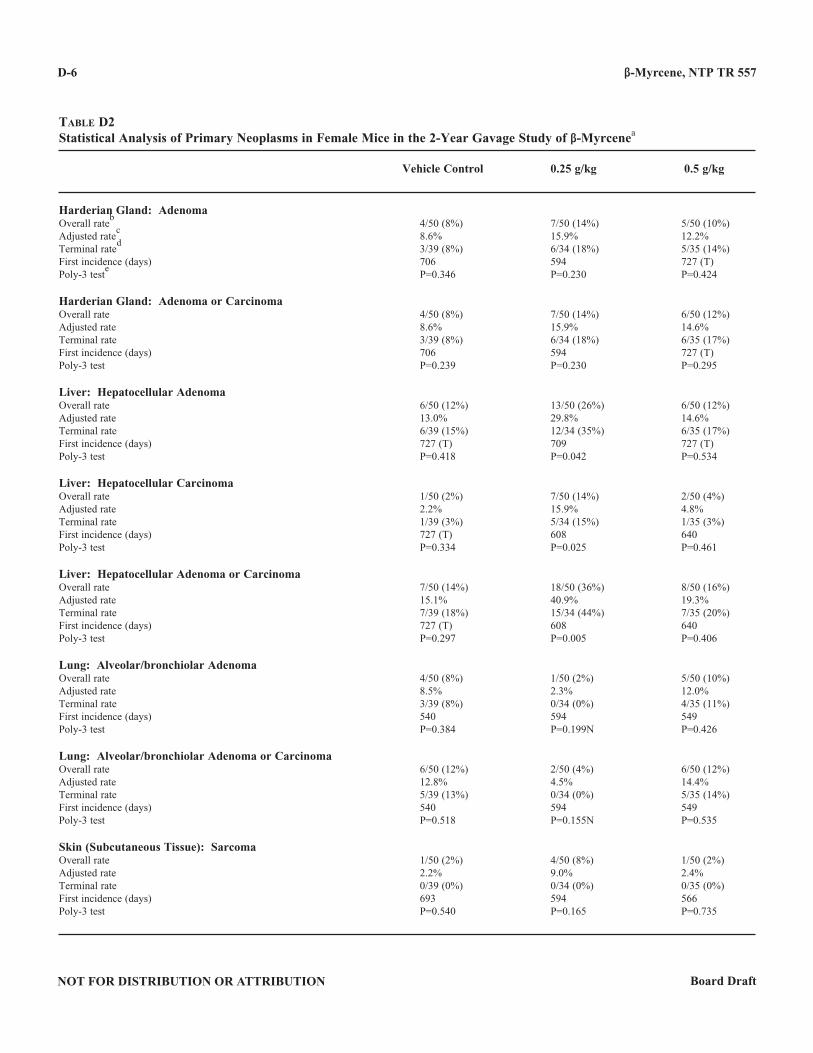
β-Myrcene, NTP TR 557
NOT FOR DISTRIBUTION OR ATTRIBUTION Board Draft
D-6
Table D2Statistical Analysis of Primary Neoplasms in Female Mice in the 2-Year Gavage Study of β-Myrcenea
Vehicle Control 0 .25 g/kg 0 .5 g/kg
Harderian Gland: AdenomaOverall rate
b 4/50 (8%) 7/50 (14%) 5/50 (10%)
Adjusted ratec 8.6% 15.9% 12.2%
Terminal rated 3/39 (8%) 6/34 (18%) 5/35 (14%)
First incidence (days) 706 594 727 (T)Poly-3 test
e P=0.346 P=0.230 P=0.424
Harderian Gland: Adenoma or CarcinomaOverall rate 4/50 (8%) 7/50 (14%) 6/50 (12%)Adjusted rate 8.6% 15.9% 14.6%Terminal rate 3/39 (8%) 6/34 (18%) 6/35 (17%)First incidence (days) 706 594 727 (T)Poly-3 test P=0.239 P=0.230 P=0.295
Liver: Hepatocellular AdenomaOverall rate 6/50 (12%) 13/50 (26%) 6/50 (12%)Adjusted rate 13.0% 29.8% 14.6%Terminal rate 6/39 (15%) 12/34 (35%) 6/35 (17%)First incidence (days) 727 (T) 709 727 (T)Poly-3 test P=0.418 P=0.042 P=0.534
Liver: Hepatocellular CarcinomaOverall rate 1/50 (2%) 7/50 (14%) 2/50 (4%)Adjusted rate 2.2% 15.9% 4.8%Terminal rate 1/39 (3%) 5/34 (15%) 1/35 (3%)First incidence (days) 727 (T) 608 640Poly-3 test P=0.334 P=0.025 P=0.461
Liver: Hepatocellular Adenoma or CarcinomaOverall rate 7/50 (14%) 18/50 (36%) 8/50 (16%)Adjusted rate 15.1% 40.9% 19.3%Terminal rate 7/39 (18%) 15/34 (44%) 7/35 (20%)First incidence (days) 727 (T) 608 640Poly-3 test P=0.297 P=0.005 P=0.406
Lung: Alveolar/bronchiolar AdenomaOverall rate 4/50 (8%) 1/50 (2%) 5/50 (10%)Adjusted rate 8.5% 2.3% 12.0%Terminal rate 3/39 (8%) 0/34 (0%) 4/35 (11%)First incidence (days) 540 594 549Poly-3 test P=0.384 P=0.199N P=0.426
Lung: Alveolar/bronchiolar Adenoma or CarcinomaOverall rate 6/50 (12%) 2/50 (4%) 6/50 (12%)Adjusted rate 12.8% 4.5% 14.4%Terminal rate 5/39 (13%) 0/34 (0%) 5/35 (14%)First incidence (days) 540 594 549Poly-3 test P=0.518 P=0.155N P=0.535
Skin (Subcutaneous Tissue): SarcomaOverall rate 1/50 (2%) 4/50 (8%) 1/50 (2%)Adjusted rate 2.2% 9.0% 2.4%Terminal rate 0/39 (0%) 0/34 (0%) 0/35 (0%)First incidence (days) 693 594 566Poly-3 test P=0.540 P=0.165 P=0.735
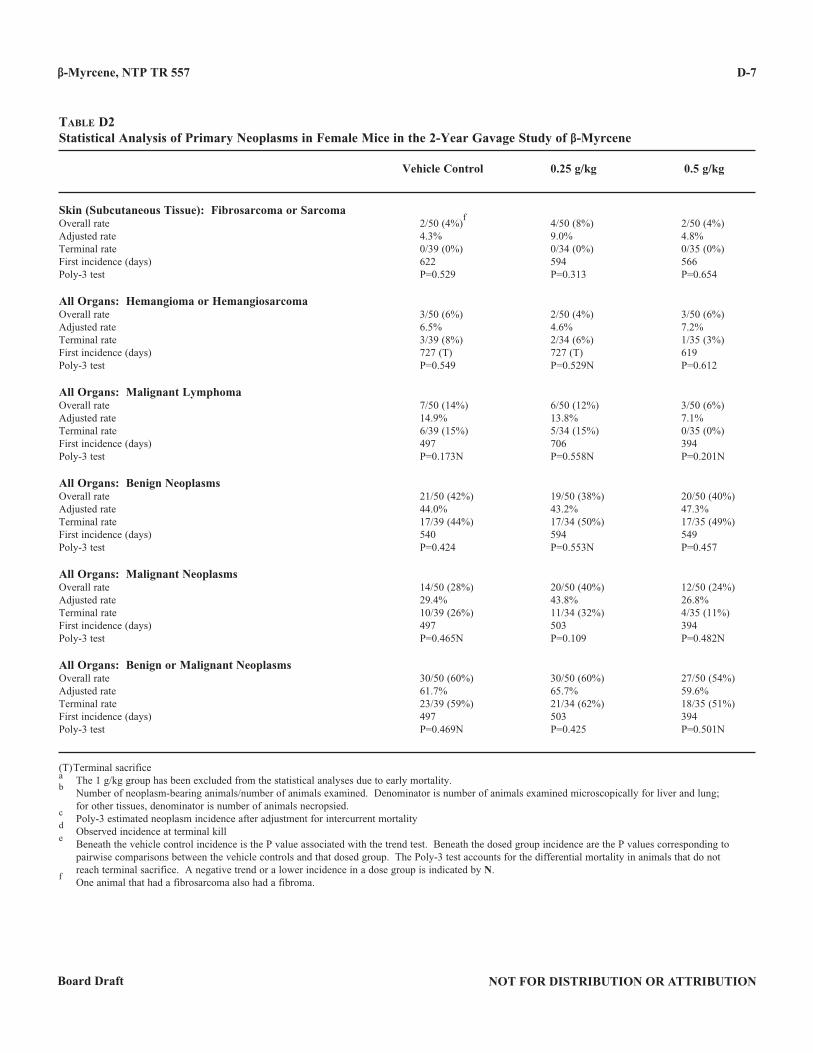
β-Myrcene, NTP TR 557
NOT FOR DISTRIBUTION OR ATTRIBUTIONBoard Draft
D-7
Table D2Statistical Analysis of Primary Neoplasms in Female Mice in the 2-Year Gavage Study of β-Myrcene
Vehicle Control 0 .25 g/kg 0 .5 g/kg
Skin (Subcutaneous Tissue): Fibrosarcoma or SarcomaOverall rate 2/50 (4%)
f 4/50 (8%) 2/50 (4%)
Adjusted rate 4.3% 9.0% 4.8%Terminal rate 0/39 (0%) 0/34 (0%) 0/35 (0%)First incidence (days) 622 594 566Poly-3 test P=0.529 P=0.313 P=0.654
All Organs: Hemangioma or HemangiosarcomaOverall rate 3/50 (6%) 2/50 (4%) 3/50 (6%)Adjusted rate 6.5% 4.6% 7.2%Terminal rate 3/39 (8%) 2/34 (6%) 1/35 (3%)First incidence (days) 727 (T) 727 (T) 619Poly-3 test P=0.549 P=0.529N P=0.612
All Organs: Malignant LymphomaOverall rate 7/50 (14%) 6/50 (12%) 3/50 (6%)Adjusted rate 14.9% 13.8% 7.1%Terminal rate 6/39 (15%) 5/34 (15%) 0/35 (0%)First incidence (days) 497 706 394Poly-3 test P=0.173N P=0.558N P=0.201N
All Organs: Benign NeoplasmsOverall rate 21/50 (42%) 19/50 (38%) 20/50 (40%)Adjusted rate 44.0% 43.2% 47.3%Terminal rate 17/39 (44%) 17/34 (50%) 17/35 (49%)First incidence (days) 540 594 549Poly-3 test P=0.424 P=0.553N P=0.457
All Organs: Malignant NeoplasmsOverall rate 14/50 (28%) 20/50 (40%) 12/50 (24%)Adjusted rate 29.4% 43.8% 26.8%Terminal rate 10/39 (26%) 11/34 (32%) 4/35 (11%)First incidence (days) 497 503 394Poly-3 test P=0.465N P=0.109 P=0.482N
All Organs: Benign or Malignant NeoplasmsOverall rate 30/50 (60%) 30/50 (60%) 27/50 (54%)Adjusted rate 61.7% 65.7% 59.6%Terminal rate 23/39 (59%) 21/34 (62%) 18/35 (51%)First incidence (days) 497 503 394Poly-3 test P=0.469N P=0.425 P=0.501N
(T) Terminal sacrificea The 1 g/kg group has been excluded from the statistical analyses due to early mortality.b Number of neoplasm-bearing animals/number of animals examined. Denominator is number of animals examined microscopically for liver and lung;
for other tissues, denominator is number of animals necropsied.c Poly-3 estimated neoplasm incidence after adjustment for intercurrent mortality
d Observed incidence at terminal kill
e Beneath the vehicle control incidence is the P value associated with the trend test. Beneath the dosed group incidence are the P values corresponding to
pairwise comparisons between the vehicle controls and that dosed group. The Poly-3 test accounts for the differential mortality in animals that do not reach terminal sacrifice. A negative trend or a lower incidence in a dose group is indicated by N.f One animal that had a fibrosarcoma also had a fibroma.
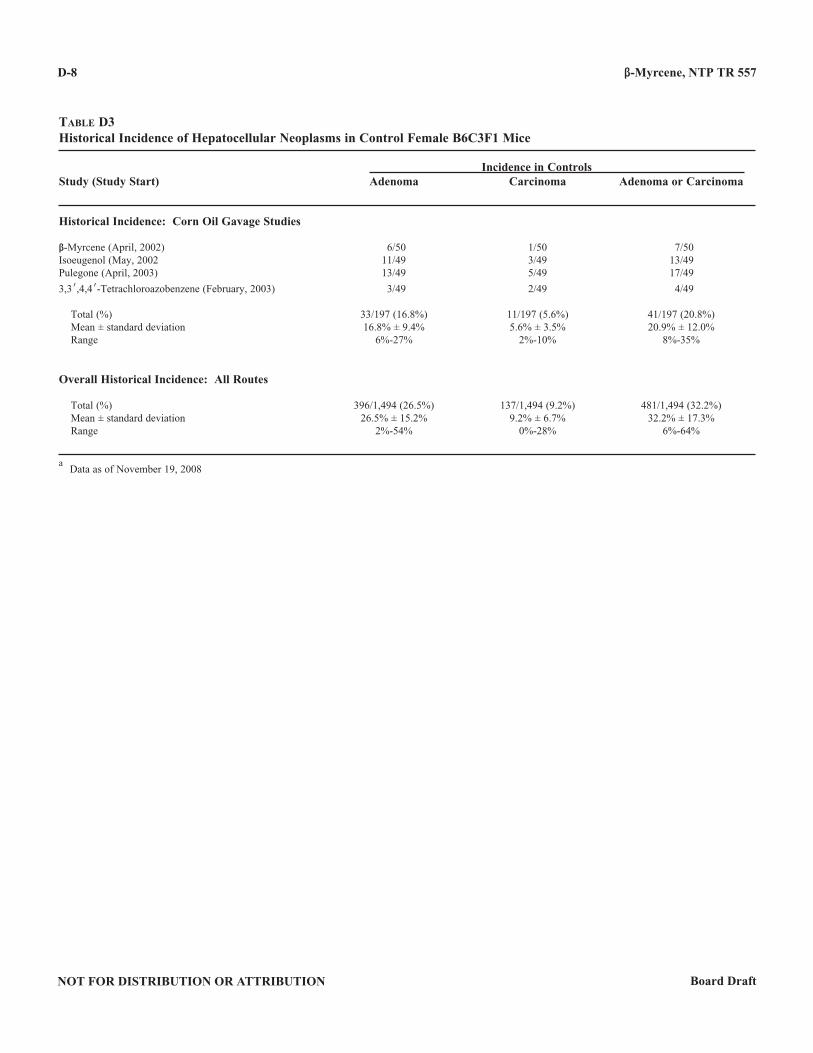
β-Myrcene, NTP TR 557
NOT FOR DISTRIBUTION OR ATTRIBUTION Board Draft
D-8
Table D3Historical Incidence of Hepatocellular Neoplasms in Control Female B6C3F1 Mice
Incidence in ControlsStudy (Study Start) Adenoma Carcinoma Adenoma or Carcinoma
Historical Incidence: Corn Oil Gavage Studies
β-Myrcene (April, 2002) 6/50 1/50 7/50Isoeugenol (May, 2002 11/49 3/49 13/49Pulegone (April, 2003) 13/49 5/49 17/49
3,3N,4,4N-Tetrachloroazobenzene (February, 2003) 3/49 2/49 4/49
Total (%) 33/197 (16.8%) 11/197 (5.6%) 41/197 (20.8%) Mean ± standard deviation 16.8% ± 9.4% 5.6% ± 3.5% 20.9% ± 12.0% Range 6%-27% 2%-10% 8%-35%
Overall Historical Incidence: All Routes
Total (%) 396/1,494 (26.5%) 137/1,494 (9.2%) 481/1,494 (32.2%) Mean ± standard deviation 26.5% ± 15.2% 9.2% ± 6.7% 32.2% ± 17.3% Range 2%-54% 0%-28% 6%-64%
a Data as of November 19, 2008
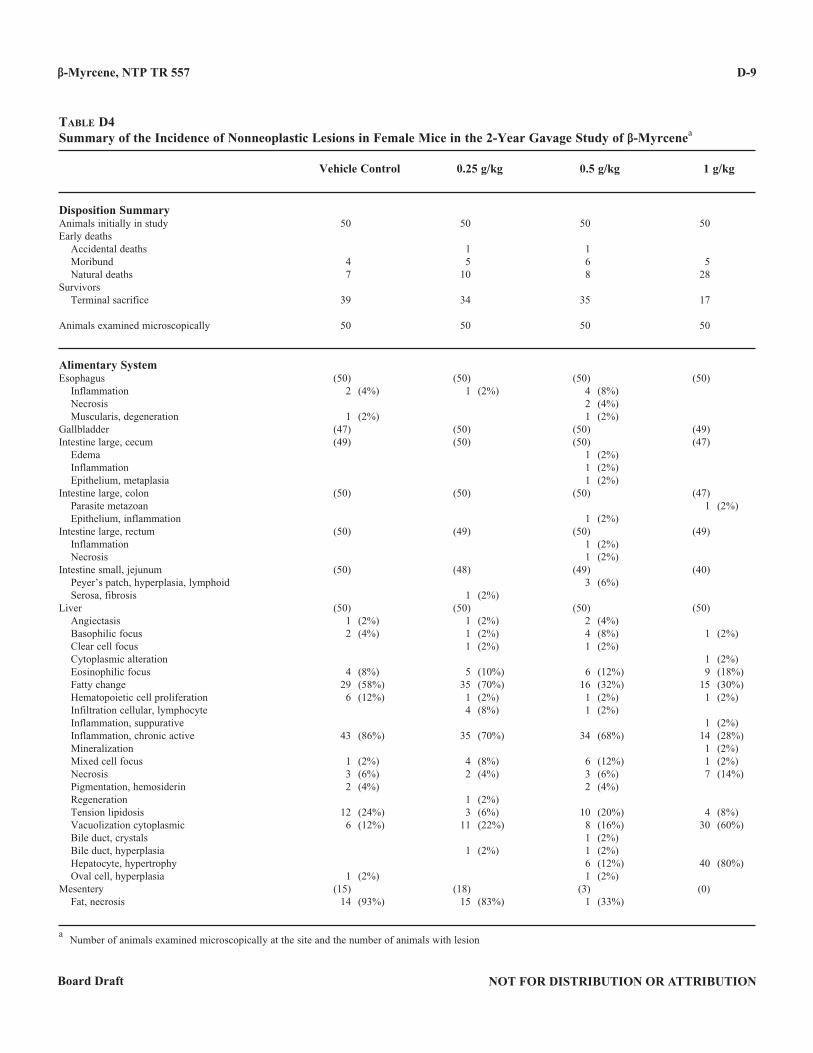
β-Myrcene, NTP TR 557
NOT FOR DISTRIBUTION OR ATTRIBUTIONBoard Draft
D-9
Table D4Summary of the Incidence of Nonneoplastic Lesions in Female Mice in the 2-Year Gavage Study of β-Myrcenea
Vehicle Control 0 .25 g/kg 0 .5 g/kg 1 g/kg
Disposition SummaryAnimals initially in study 50 50 50 50Early deaths Accidental deaths 1 1 Moribund 4 5 6 5 Natural deaths 7 10 8 28Survivors Terminal sacrifice 39 34 35 17
Animals examined microscopically 50 50 50 50
Alimentary SystemEsophagus (50) (50) (50) (50) Inflammation 2 (4%) 1 (2%) 4 (8%) Necrosis 2 (4%) Muscularis, degeneration 1 (2%) 1 (2%)Gallbladder (47) (50) (50) (49)Intestine large, cecum (49) (50) (50) (47) Edema 1 (2%) Inflammation 1 (2%) Epithelium, metaplasia 1 (2%)Intestine large, colon (50) (50) (50) (47) Parasite metazoan 1 (2%) Epithelium, inflammation 1 (2%)Intestine large, rectum (50) (49) (50) (49) Inflammation 1 (2%) Necrosis 1 (2%)Intestine small, jejunum (50) (48) (49) (40) Peyer’s patch, hyperplasia, lymphoid 3 (6%) Serosa, fibrosis 1 (2%)Liver (50) (50) (50) (50) Angiectasis 1 (2%) 1 (2%) 2 (4%) Basophilic focus 2 (4%) 1 (2%) 4 (8%) 1 (2%) Clear cell focus 1 (2%) 1 (2%) Cytoplasmic alteration 1 (2%) Eosinophilic focus 4 (8%) 5 (10%) 6 (12%) 9 (18%) Fatty change 29 (58%) 35 (70%) 16 (32%) 15 (30%) Hematopoietic cell proliferation 6 (12%) 1 (2%) 1 (2%) 1 (2%) Infiltration cellular, lymphocyte 4 (8%) 1 (2%) Inflammation, suppurative 1 (2%) Inflammation, chronic active 43 (86%) 35 (70%) 34 (68%) 14 (28%) Mineralization 1 (2%) Mixed cell focus 1 (2%) 4 (8%) 6 (12%) 1 (2%) Necrosis 3 (6%) 2 (4%) 3 (6%) 7 (14%) Pigmentation, hemosiderin 2 (4%) 2 (4%) Regeneration 1 (2%) Tension lipidosis 12 (24%) 3 (6%) 10 (20%) 4 (8%) Vacuolization cytoplasmic 6 (12%) 11 (22%) 8 (16%) 30 (60%) Bile duct, crystals 1 (2%) Bile duct, hyperplasia 1 (2%) 1 (2%) Hepatocyte, hypertrophy 6 (12%) 40 (80%) Oval cell, hyperplasia 1 (2%) 1 (2%)Mesentery (15) (18) (3) (0) Fat, necrosis 14 (93%) 15 (83%) 1 (33%)
a Number of animals examined microscopically at the site and the number of animals with lesion
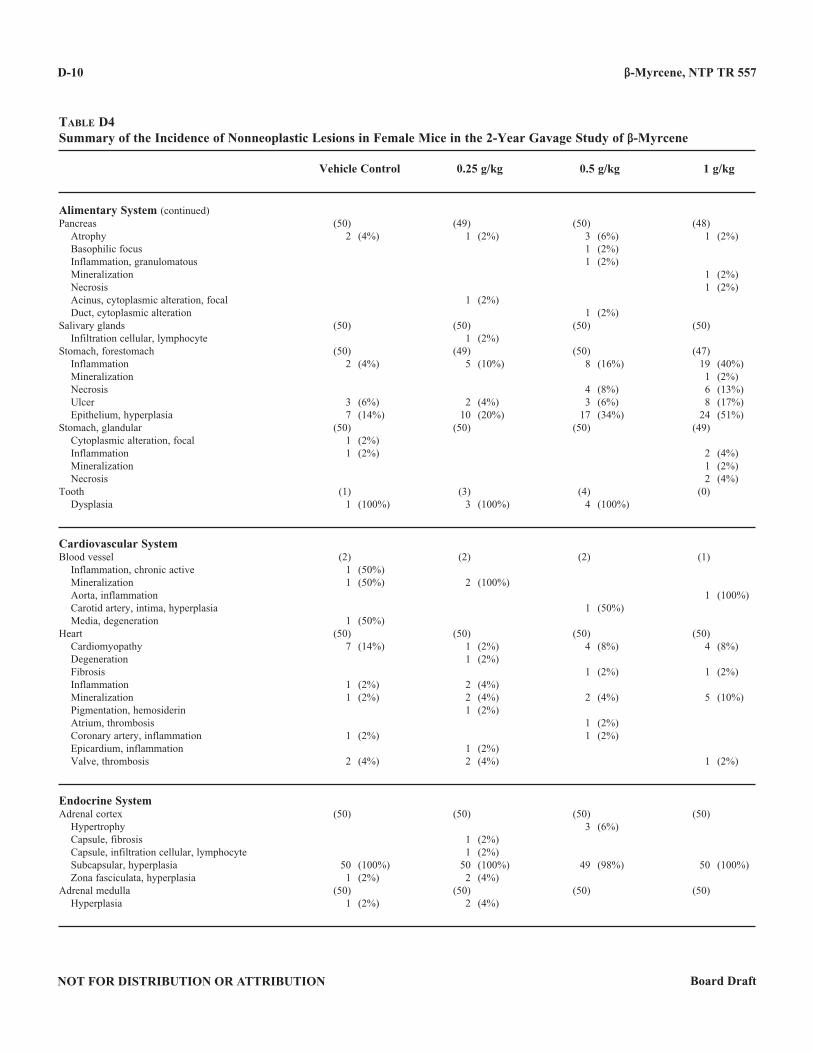
β-Myrcene, NTP TR 557
NOT FOR DISTRIBUTION OR ATTRIBUTION Board Draft
D-10
Table D4Summary of the Incidence of Nonneoplastic Lesions in Female Mice in the 2-Year Gavage Study of β-Myrcene
Vehicle Control 0 .25 g/kg 0 .5 g/kg 1 g/kg
Alimentary System (continued)Pancreas (50) (49) (50) (48) Atrophy 2 (4%) 1 (2%) 3 (6%) 1 (2%) Basophilic focus 1 (2%) Inflammation, granulomatous 1 (2%) Mineralization 1 (2%) Necrosis 1 (2%) Acinus, cytoplasmic alteration, focal 1 (2%) Duct, cytoplasmic alteration 1 (2%)Salivary glands (50) (50) (50) (50) Infiltration cellular, lymphocyte 1 (2%)Stomach, forestomach (50) (49) (50) (47) Inflammation 2 (4%) 5 (10%) 8 (16%) 19 (40%) Mineralization 1 (2%) Necrosis 4 (8%) 6 (13%) Ulcer 3 (6%) 2 (4%) 3 (6%) 8 (17%) Epithelium, hyperplasia 7 (14%) 10 (20%) 17 (34%) 24 (51%)Stomach, glandular (50) (50) (50) (49) Cytoplasmic alteration, focal 1 (2%) Inflammation 1 (2%) 2 (4%) Mineralization 1 (2%) Necrosis 2 (4%)Tooth (1) (3) (4) (0) Dysplasia 1 (100%) 3 (100%) 4 (100%)
Cardiovascular SystemBlood vessel (2) (2) (2) (1) Inflammation, chronic active 1 (50%) Mineralization 1 (50%) 2 (100%) Aorta, inflammation 1 (100%) Carotid artery, intima, hyperplasia 1 (50%) Media, degeneration 1 (50%)Heart (50) (50) (50) (50) Cardiomyopathy 7 (14%) 1 (2%) 4 (8%) 4 (8%) Degeneration 1 (2%) Fibrosis 1 (2%) 1 (2%) Inflammation 1 (2%) 2 (4%) Mineralization 1 (2%) 2 (4%) 2 (4%) 5 (10%) Pigmentation, hemosiderin 1 (2%) Atrium, thrombosis 1 (2%) Coronary artery, inflammation 1 (2%) 1 (2%) Epicardium, inflammation 1 (2%) Valve, thrombosis 2 (4%) 2 (4%) 1 (2%)
Endocrine SystemAdrenal cortex (50) (50) (50) (50) Hypertrophy 3 (6%) Capsule, fibrosis 1 (2%) Capsule, infiltration cellular, lymphocyte 1 (2%) Subcapsular, hyperplasia 50 (100%) 50 (100%) 49 (98%) 50 (100%) Zona fasciculata, hyperplasia 1 (2%) 2 (4%)Adrenal medulla (50) (50) (50) (50) Hyperplasia 1 (2%) 2 (4%)
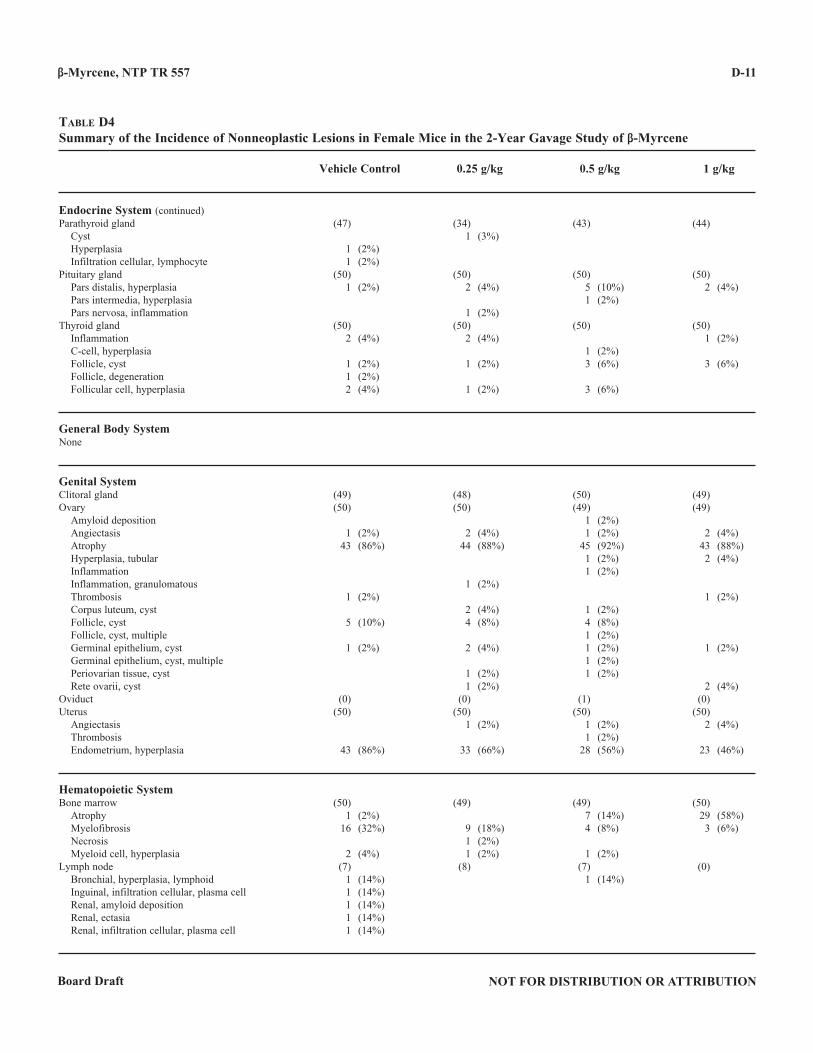
β-Myrcene, NTP TR 557
NOT FOR DISTRIBUTION OR ATTRIBUTIONBoard Draft
D-11
Table D4Summary of the Incidence of Nonneoplastic Lesions in Female Mice in the 2-Year Gavage Study of β-Myrcene
Vehicle Control 0 .25 g/kg 0 .5 g/kg 1 g/kg
Endocrine System (continued)Parathyroid gland (47) (34) (43) (44) Cyst 1 (3%) Hyperplasia 1 (2%) Infiltration cellular, lymphocyte 1 (2%)Pituitary gland (50) (50) (50) (50) Pars distalis, hyperplasia 1 (2%) 2 (4%) 5 (10%) 2 (4%) Pars intermedia, hyperplasia 1 (2%) Pars nervosa, inflammation 1 (2%)Thyroid gland (50) (50) (50) (50) Inflammation 2 (4%) 2 (4%) 1 (2%) C-cell, hyperplasia 1 (2%) Follicle, cyst 1 (2%) 1 (2%) 3 (6%) 3 (6%) Follicle, degeneration 1 (2%) Follicular cell, hyperplasia 2 (4%) 1 (2%) 3 (6%)
General Body SystemNone
Genital SystemClitoral gland (49) (48) (50) (49)Ovary (50) (50) (49) (49) Amyloid deposition 1 (2%) Angiectasis 1 (2%) 2 (4%) 1 (2%) 2 (4%) Atrophy 43 (86%) 44 (88%) 45 (92%) 43 (88%) Hyperplasia, tubular 1 (2%) 2 (4%) Inflammation 1 (2%) Inflammation, granulomatous 1 (2%) Thrombosis 1 (2%) 1 (2%) Corpus luteum, cyst 2 (4%) 1 (2%) Follicle, cyst 5 (10%) 4 (8%) 4 (8%) Follicle, cyst, multiple 1 (2%) Germinal epithelium, cyst 1 (2%) 2 (4%) 1 (2%) 1 (2%) Germinal epithelium, cyst, multiple 1 (2%) Periovarian tissue, cyst 1 (2%) 1 (2%) Rete ovarii, cyst 1 (2%) 2 (4%)Oviduct (0) (0) (1) (0)Uterus (50) (50) (50) (50) Angiectasis 1 (2%) 1 (2%) 2 (4%) Thrombosis 1 (2%) Endometrium, hyperplasia 43 (86%) 33 (66%) 28 (56%) 23 (46%)
Hematopoietic SystemBone marrow (50) (49) (49) (50) Atrophy 1 (2%) 7 (14%) 29 (58%) Myelofibrosis 16 (32%) 9 (18%) 4 (8%) 3 (6%) Necrosis 1 (2%) Myeloid cell, hyperplasia 2 (4%) 1 (2%) 1 (2%)Lymph node (7) (8) (7) (0) Bronchial, hyperplasia, lymphoid 1 (14%) 1 (14%) Inguinal, infiltration cellular, plasma cell 1 (14%) Renal, amyloid deposition 1 (14%) Renal, ectasia 1 (14%) Renal, infiltration cellular, plasma cell 1 (14%)
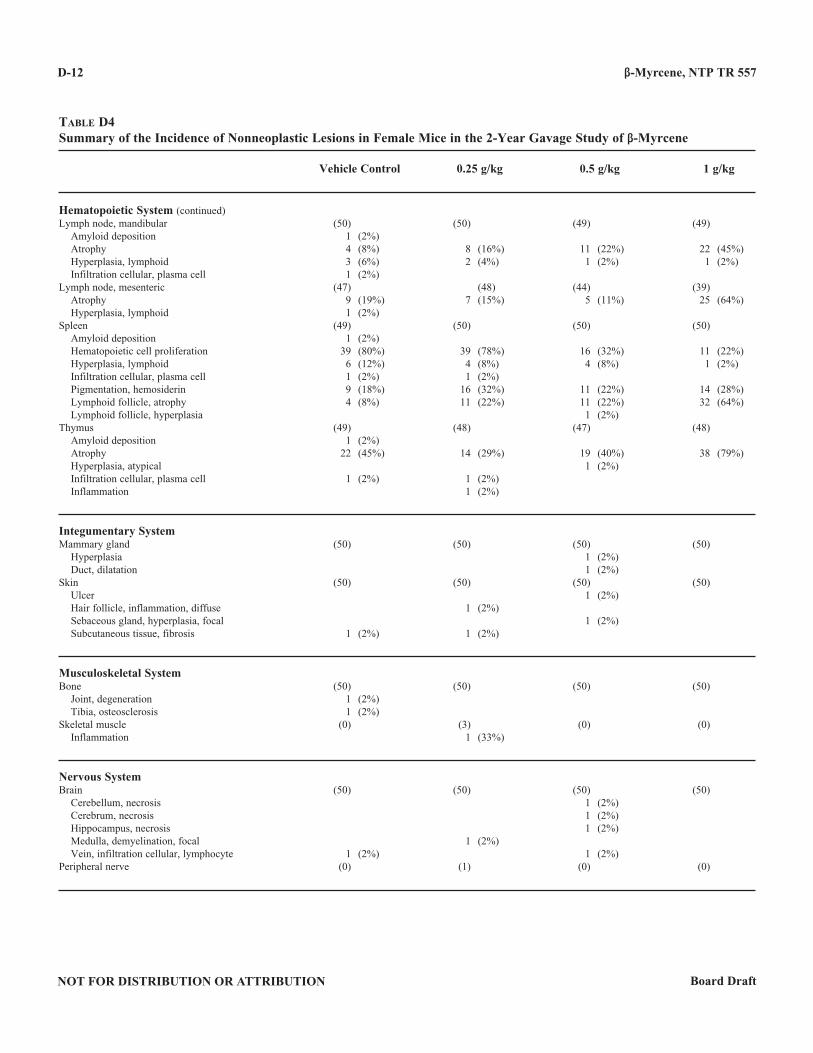
β-Myrcene, NTP TR 557
NOT FOR DISTRIBUTION OR ATTRIBUTION Board Draft
D-12
Table D4Summary of the Incidence of Nonneoplastic Lesions in Female Mice in the 2-Year Gavage Study of β-Myrcene
Vehicle Control 0 .25 g/kg 0 .5 g/kg 1 g/kg
Hematopoietic System (continued)Lymph node, mandibular (50) (50) (49) (49) Amyloid deposition 1 (2%) Atrophy 4 (8%) 8 (16%) 11 (22%) 22 (45%) Hyperplasia, lymphoid 3 (6%) 2 (4%) 1 (2%) 1 (2%) Infiltration cellular, plasma cell 1 (2%)Lymph node, mesenteric (47) (48) (44) (39) Atrophy 9 (19%) 7 (15%) 5 (11%) 25 (64%) Hyperplasia, lymphoid 1 (2%)Spleen (49) (50) (50) (50) Amyloid deposition 1 (2%) Hematopoietic cell proliferation 39 (80%) 39 (78%) 16 (32%) 11 (22%) Hyperplasia, lymphoid 6 (12%) 4 (8%) 4 (8%) 1 (2%) Infiltration cellular, plasma cell 1 (2%) 1 (2%) Pigmentation, hemosiderin 9 (18%) 16 (32%) 11 (22%) 14 (28%) Lymphoid follicle, atrophy 4 (8%) 11 (22%) 11 (22%) 32 (64%) Lymphoid follicle, hyperplasia 1 (2%)Thymus (49) (48) (47) (48) Amyloid deposition 1 (2%) Atrophy 22 (45%) 14 (29%) 19 (40%) 38 (79%) Hyperplasia, atypical 1 (2%) Infiltration cellular, plasma cell 1 (2%) 1 (2%) Inflammation 1 (2%)
Integumentary System Mammary gland (50) (50) (50) (50) Hyperplasia 1 (2%) Duct, dilatation 1 (2%)Skin (50) (50) (50) (50) Ulcer 1 (2%) Hair follicle, inflammation, diffuse 1 (2%) Sebaceous gland, hyperplasia, focal 1 (2%) Subcutaneous tissue, fibrosis 1 (2%) 1 (2%)
Musculoskeletal SystemBone (50) (50) (50) (50) Joint, degeneration 1 (2%) Tibia, osteosclerosis 1 (2%)Skeletal muscle (0) (3) (0) (0) Inflammation 1 (33%)
Nervous SystemBrain (50) (50) (50) (50) Cerebellum, necrosis 1 (2%) Cerebrum, necrosis 1 (2%) Hippocampus, necrosis 1 (2%) Medulla, demyelination, focal 1 (2%) Vein, infiltration cellular, lymphocyte 1 (2%) 1 (2%)Peripheral nerve (0) (1) (0) (0)
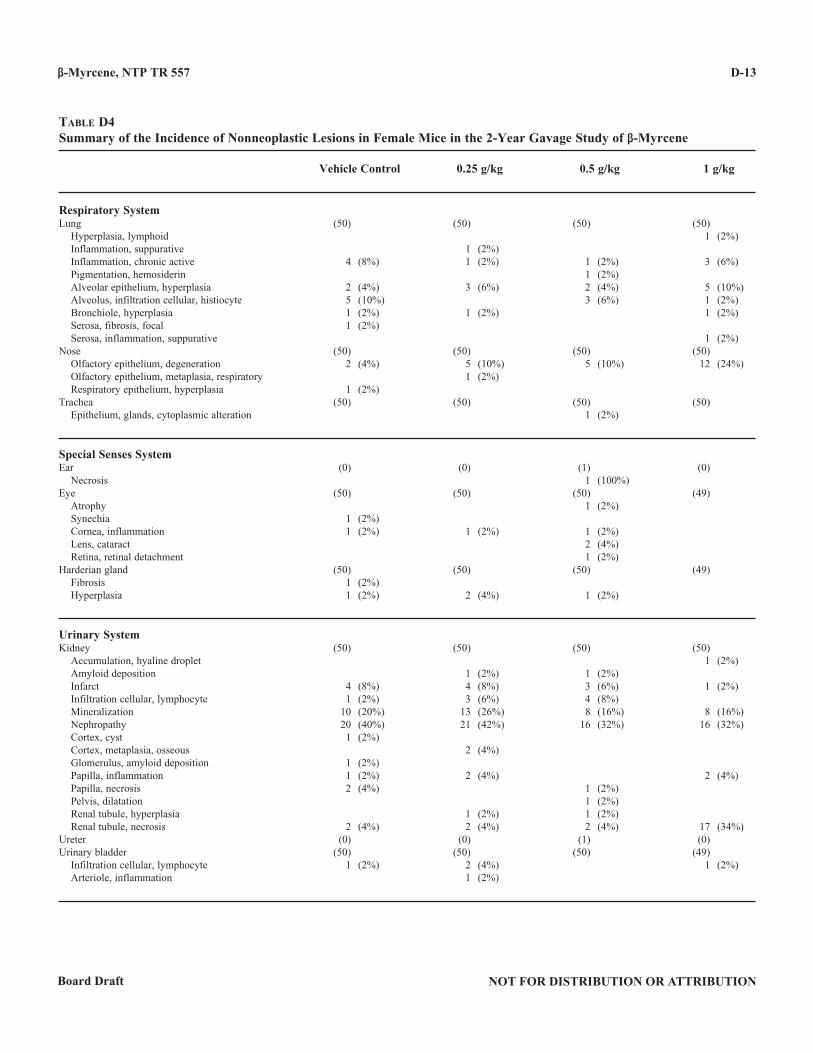
β-Myrcene, NTP TR 557
NOT FOR DISTRIBUTION OR ATTRIBUTIONBoard Draft
D-13
Table D4Summary of the Incidence of Nonneoplastic Lesions in Female Mice in the 2-Year Gavage Study of β-Myrcene
Vehicle Control 0 .25 g/kg 0 .5 g/kg 1 g/kg
Respiratory SystemLung (50) (50) (50) (50) Hyperplasia, lymphoid 1 (2%) Inflammation, suppurative 1 (2%) Inflammation, chronic active 4 (8%) 1 (2%) 1 (2%) 3 (6%) Pigmentation, hemosiderin 1 (2%) Alveolar epithelium, hyperplasia 2 (4%) 3 (6%) 2 (4%) 5 (10%) Alveolus, infiltration cellular, histiocyte 5 (10%) 3 (6%) 1 (2%) Bronchiole, hyperplasia 1 (2%) 1 (2%) 1 (2%) Serosa, fibrosis, focal 1 (2%) Serosa, inflammation, suppurative 1 (2%)Nose (50) (50) (50) (50) Olfactory epithelium, degeneration 2 (4%) 5 (10%) 5 (10%) 12 (24%) Olfactory epithelium, metaplasia, respiratory 1 (2%) Respiratory epithelium, hyperplasia 1 (2%)Trachea (50) (50) (50) (50) Epithelium, glands, cytoplasmic alteration 1 (2%)
Special Senses SystemEar (0) (0) (1) (0) Necrosis 1 (100%)Eye (50) (50) (50) (49) Atrophy 1 (2%) Synechia 1 (2%) Cornea, inflammation 1 (2%) 1 (2%) 1 (2%) Lens, cataract 2 (4%) Retina, retinal detachment 1 (2%)Harderian gland (50) (50) (50) (49) Fibrosis 1 (2%) Hyperplasia 1 (2%) 2 (4%) 1 (2%)
Urinary SystemKidney (50) (50) (50) (50) Accumulation, hyaline droplet 1 (2%) Amyloid deposition 1 (2%) 1 (2%) Infarct 4 (8%) 4 (8%) 3 (6%) 1 (2%) Infiltration cellular, lymphocyte 1 (2%) 3 (6%) 4 (8%) Mineralization 10 (20%) 13 (26%) 8 (16%) 8 (16%) Nephropathy 20 (40%) 21 (42%) 16 (32%) 16 (32%) Cortex, cyst 1 (2%) Cortex, metaplasia, osseous 2 (4%) Glomerulus, amyloid deposition 1 (2%) Papilla, inflammation 1 (2%) 2 (4%) 2 (4%) Papilla, necrosis 2 (4%) 1 (2%) Pelvis, dilatation 1 (2%) Renal tubule, hyperplasia 1 (2%) 1 (2%) Renal tubule, necrosis 2 (4%) 2 (4%) 2 (4%) 17 (34%)Ureter (0) (0) (1) (0)Urinary bladder (50) (50) (50) (49) Infiltration cellular, lymphocyte 1 (2%) 2 (4%) 1 (2%) Arteriole, inflammation 1 (2%)

β-Myrcene, NTP TR 557
NOT FOR DISTRIBUTION OR ATTRIBUTION Board Draft
D-14
NOT FOR DISTRIBUTION OR ATTRIBUTIONBoard Draft
E-1
APPENDIX EGENETIC TOXICOLOGY
Salmonella typhimurium MuTageniCiTy TesT ProToCol . . . . . . . . . . . . . . . . . . . . . . . . . . . . . . . . . . . . . . e-2Mouse PeriPheral blooD MiCronuCleus TesT ProToCol . . . . . . . . . . . . . . . . . . . . . . . . . . . . . . . . . . . . e-2evaluaTion ProToCol . . . . . . . . . . . . . . . . . . . . . . . . . . . . . . . . . . . . . . . . . . . . . . . . . . . . . . . . . . . . . . . . . . . e-3resulTs . . . . . . . . . . . . . . . . . . . . . . . . . . . . . . . . . . . . . . . . . . . . . . . . . . . . . . . . . . . . . . . . . . . . . . . . . . . . . . . e-3Table e1 Mutagenicity of β-Myrcene in Salmonella typhimurium . . . . . . . . . . . . . . . . . . . . . . . . . . . . . . E-4Table e2 Frequency of Micronuclei in Peripheral Blood Erythrocytes of Mice Following Administration of β-Myrcene by Gavage for 3 Months . . . . . . . . . . . . . . . . . . . . . E-6
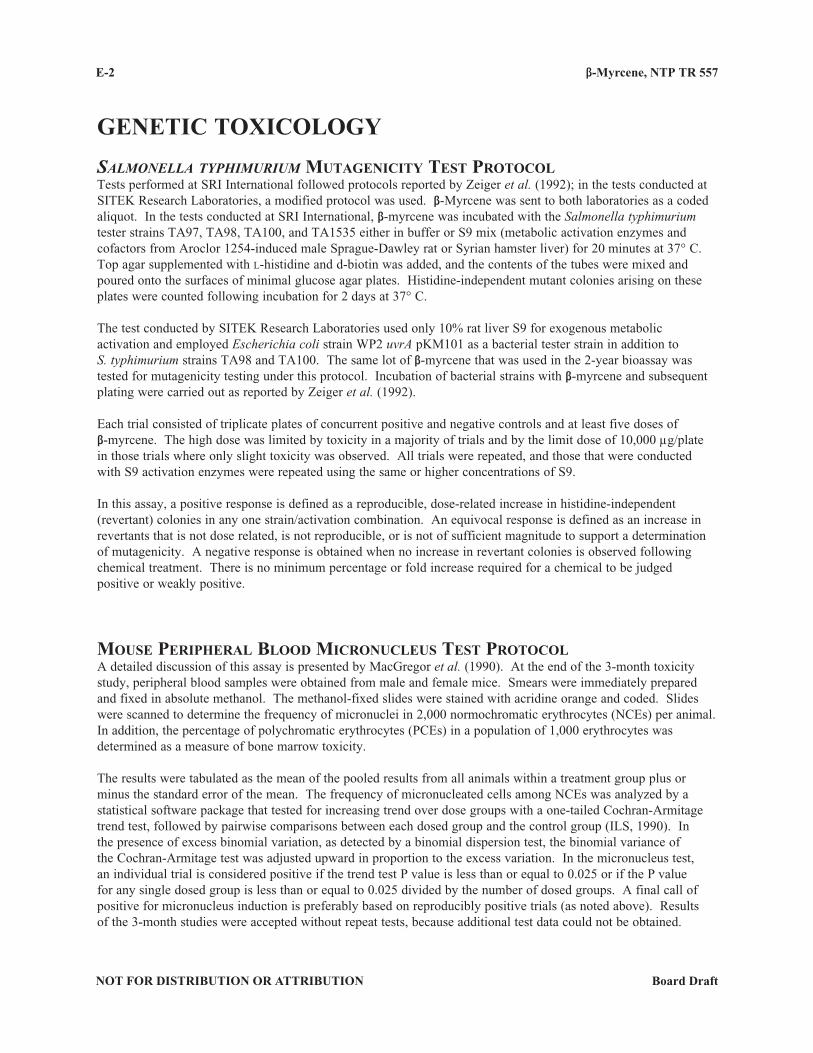
β-Myrcene, NTP TR 557 E-2
NOT FOR DISTRIBUTION OR ATTRIBUTION Board Draft
GENETIC TOXICOLOGY
Salmonella typhimurium MuTageniCiTy TesT ProToColTests performed at SRI International followed protocols reported by Zeiger et al. (1992); in the tests conducted at SITEK Research Laboratories, a modified protocol was used. β-Myrcene was sent to both laboratories as a coded aliquot. In the tests conducted at SRI International, β-myrcene was incubated with the Salmonella typhimurium tester strains TA97, TA98, TA100, and TA1535 either in buffer or S9 mix (metabolic activation enzymes and cofactors from Aroclor 1254-induced male Sprague-Dawley rat or Syrian hamster liver) for 20 minutes at 37° C. Top agar supplemented with l-histidine and d-biotin was added, and the contents of the tubes were mixed and poured onto the surfaces of minimal glucose agar plates. Histidine-independent mutant colonies arising on these plates were counted following incubation for 2 days at 37° C.
The test conducted by SITEK Research Laboratories used only 10% rat liver S9 for exogenous metabolic activation and employed Escherichia coli strain WP2 uvrA pKM101 as a bacterial tester strain in addition to S. typhimurium strains TA98 and TA100. The same lot of β-myrcene that was used in the 2-year bioassay was tested for mutagenicity testing under this protocol. Incubation of bacterial strains with β-myrcene and subsequent plating were carried out as reported by Zeiger et al. (1992).
Each trial consisted of triplicate plates of concurrent positive and negative controls and at least five doses of β-myrcene. The high dose was limited by toxicity in a majority of trials and by the limit dose of 10,000 µg/plate in those trials where only slight toxicity was observed. All trials were repeated, and those that were conducted with S9 activation enzymes were repeated using the same or higher concentrations of S9.
In this assay, a positive response is defined as a reproducible, dose-related increase in histidine-independent (revertant) colonies in any one strain/activation combination. An equivocal response is defined as an increase in revertants that is not dose related, is not reproducible, or is not of sufficient magnitude to support a determination of mutagenicity. A negative response is obtained when no increase in revertant colonies is observed following chemical treatment. There is no minimum percentage or fold increase required for a chemical to be judged positive or weakly positive.
Mouse PeriPheral blooD MiCronuCleus TesT ProToColA detailed discussion of this assay is presented by MacGregor et al. (1990). At the end of the 3-month toxicity study, peripheral blood samples were obtained from male and female mice. Smears were immediately prepared and fixed in absolute methanol. The methanol-fixed slides were stained with acridine orange and coded. Slides were scanned to determine the frequency of micronuclei in 2,000 normochromatic erythrocytes (NCEs) per animal. In addition, the percentage of polychromatic erythrocytes (PCEs) in a population of 1,000 erythrocytes was determined as a measure of bone marrow toxicity.
The results were tabulated as the mean of the pooled results from all animals within a treatment group plus or minus the standard error of the mean. The frequency of micronucleated cells among NCEs was analyzed by a statistical software package that tested for increasing trend over dose groups with a one-tailed Cochran-Armitage trend test, followed by pairwise comparisons between each dosed group and the control group (ILS, 1990). In the presence of excess binomial variation, as detected by a binomial dispersion test, the binomial variance of the Cochran-Armitage test was adjusted upward in proportion to the excess variation. In the micronucleus test, an individual trial is considered positive if the trend test P value is less than or equal to 0.025 or if the P value for any single dosed group is less than or equal to 0.025 divided by the number of dosed groups. A final call of positive for micronucleus induction is preferably based on reproducibly positive trials (as noted above). Results of the 3-month studies were accepted without repeat tests, because additional test data could not be obtained.
β-Myrcene, NTP TR 557 E-3
NOT FOR DISTRIBUTION OR ATTRIBUTIONBoard Draft
Ultimately, the final call is determined by the scientific staff after considering the results of statistical analyses, the reproducibility of any effects observed, and the magnitudes of those effects.
evaluaTion ProToColThese are the basic guidelines for arriving at an overall assay result for assays performed by the National Toxicology Program. Statistical as well as biological factors are considered. For an individual assay, the statistical procedures for data analysis have been described in the preceding protocols. There have been instances, however, in which multiple aliquots of a chemical were tested in the same assay, and different results were obtained among aliquots and/or among laboratories. Results from more than one aliquot or from more than one laboratory are not simply combined into an overall result. Rather, all the data are critically evaluated, particularly with regard to pertinent protocol variations, in determining the weight of evidence for an overall conclusion of chemical activity in an assay. In addition to multiple aliquots, the in vitro assays have another variable that must be considered in arriving at an overall test result. In vitro assays are conducted with and without exogenous metabolic activation. Results obtained in the absence of activation are not combined with results obtained in the presence of activation; each testing condition is evaluated separately. The summary table in the Abstract of this Technical Report presents a result that represents a scientific judgement of the overall evidence for activity of the chemical in an assay.
resulTsβ-Myrcene did not show evidence of genotoxicity in assays conducted by the NTP. No mutagenic activity was observed in any of several strains of S. typhimurium (TA97, TA98, TA100, and TA1535) or E. coli strain WP2 uvrA pKM101 exposed to β-myrcene concentrations ranging up to 10,000 µg/plate in two independent Ames assays conducted with and without exogenous metabolic activation provided by Aroclor 1254-induced rat or hamster liver enzymes (Table E1). In addition, no significant increases in the frequencies of micronucleated NCEs, biomarkers of chromosomal damage, were observed in male or female B6C3F1 mice administered β-myrcene (0.25 to 2 g/kg) for 3 months by gavage (Table E2). The percentage of reticulocytes among total erythrocytes (% PCEs) increased slightly with dose, but remained within the normal range, suggesting an absence of β-myrcene-induced bone marrow toxicity over this dose range (Table E2).
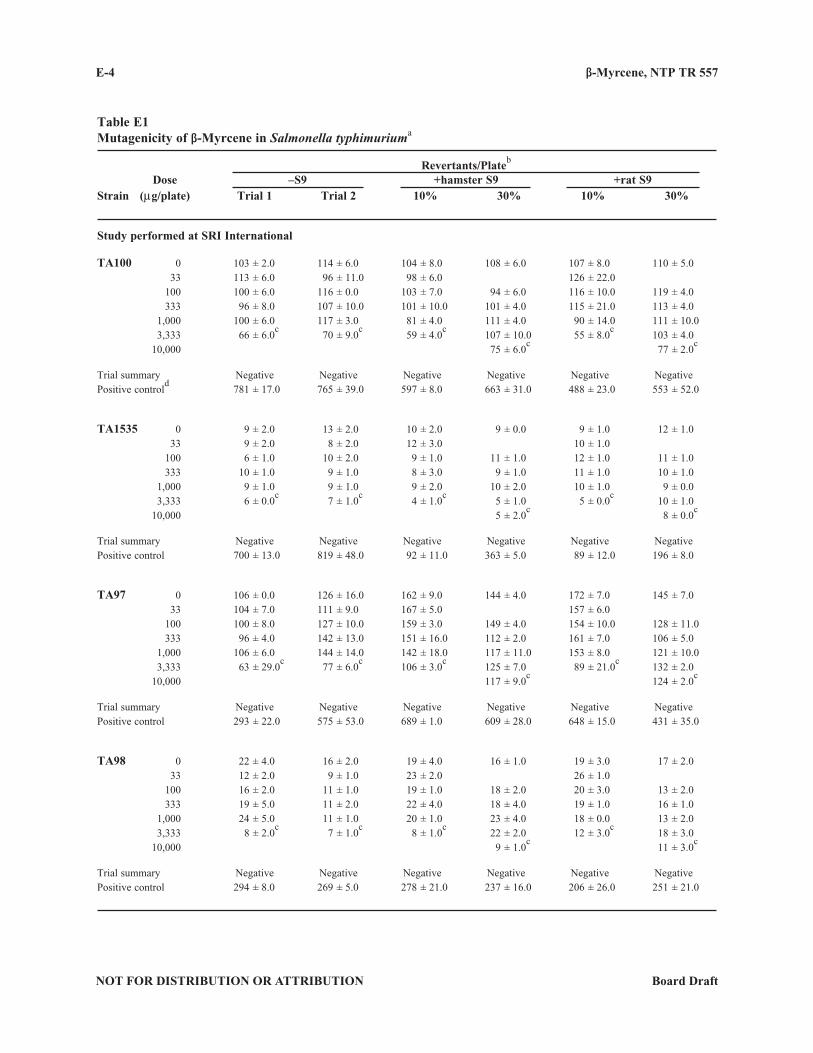
β-Myrcene, NTP TR 557 E-4
NOT FOR DISTRIBUTION OR ATTRIBUTION Board Draft
Table E1Mutagenicity of β-Myrcene in Salmonella typhimuriuma
Revertants/Plateb
Dose –S9 +hamster S9 +rat S9Strain (µg/plate) Trial 1 Trial 2 10% 30% 10% 30%
Study performed at SRI International
TA100 0 103 ± 2.0 114 ± 6.0 104 ± 8.0 108 ± 6.0 107 ± 8.0 110 ± 5.0 33 113 ± 6.0 96 ± 11.0 98 ± 6.0 126 ± 22.0 100 100 ± 6.0 116 ± 0.0 103 ± 7.0 94 ± 6.0 116 ± 10.0 119 ± 4.0 333 96 ± 8.0 107 ± 10.0 101 ± 10.0 101 ± 4.0 115 ± 21.0 113 ± 4.0 1,000 100 ± 6.0 117 ± 3.0 81 ± 4.0 111 ± 4.0 90 ± 14.0 111 ± 10.0 3,333 66 ± 6.0
c 70 ± 9.0
c 59 ± 4.0
c 107 ± 10.0 55 ± 8.0
c 103 ± 4.0
10,000 75 ± 6.0c
77 ± 2.0c
Trial summary Negative Negative Negative Negative Negative NegativePositive control
d 781 ± 17.0 765 ± 39.0 597 ± 8.0 663 ± 31.0 488 ± 23.0 553 ± 52.0
TA1535 0 9 ± 2.0 13 ± 2.0 10 ± 2.0 9 ± 0.0 9 ± 1.0 12 ± 1.0 33 9 ± 2.0 8 ± 2.0 12 ± 3.0 10 ± 1.0 100 6 ± 1.0 10 ± 2.0 9 ± 1.0 11 ± 1.0 12 ± 1.0 11 ± 1.0 333 10 ± 1.0 9 ± 1.0 8 ± 3.0 9 ± 1.0 11 ± 1.0 10 ± 1.0 1,000 9 ± 1.0 9 ± 1.0 9 ± 2.0 10 ± 2.0 10 ± 1.0 9 ± 0.0 3,333 6 ± 0.0
c 7 ± 1.0
c 4 ± 1.0
c 5 ± 1.0 5 ± 0.0
c 10 ± 1.0
10,000 5 ± 2.0c 8 ± 0.0
c
Trial summary Negative Negative Negative Negative Negative NegativePositive control 700 ± 13.0 819 ± 48.0 92 ± 11.0 363 ± 5.0 89 ± 12.0 196 ± 8.0
TA97 0 106 ± 0.0 126 ± 16.0 162 ± 9.0 144 ± 4.0 172 ± 7.0 145 ± 7.0 33 104 ± 7.0 111 ± 9.0 167 ± 5.0 157 ± 6.0 100 100 ± 8.0 127 ± 10.0 159 ± 3.0 149 ± 4.0 154 ± 10.0 128 ± 11.0 333 96 ± 4.0 142 ± 13.0 151 ± 16.0 112 ± 2.0 161 ± 7.0 106 ± 5.0 1,000 106 ± 6.0 144 ± 14.0 142 ± 18.0 117 ± 11.0 153 ± 8.0 121 ± 10.0 3,333 63 ± 29.0
c 77 ± 6.0
c 106 ± 3.0
c 125 ± 7.0 89 ± 21.0
c 132 ± 2.0
10,000 117 ± 9.0c 124 ± 2.0
c
Trial summary Negative Negative Negative Negative Negative NegativePositive control 293 ± 22.0 575 ± 53.0 689 ± 1.0 609 ± 28.0 648 ± 15.0 431 ± 35.0
TA98 0 22 ± 4.0 16 ± 2.0 19 ± 4.0 16 ± 1.0 19 ± 3.0 17 ± 2.0 33 12 ± 2.0 9 ± 1.0 23 ± 2.0 26 ± 1.0 100 16 ± 2.0 11 ± 1.0 19 ± 1.0 18 ± 2.0 20 ± 3.0 13 ± 2.0 333 19 ± 5.0 11 ± 2.0 22 ± 4.0 18 ± 4.0 19 ± 1.0 16 ± 1.0 1,000 24 ± 5.0 11 ± 1.0 20 ± 1.0 23 ± 4.0 18 ± 0.0 13 ± 2.0 3,333 8 ± 2.0
c 7 ± 1.0
c 8 ± 1.0
c 22 ± 2.0 12 ± 3.0
c 18 ± 3.0
10,000 9 ± 1.0c 11 ± 3.0
c
Trial summary Negative Negative Negative Negative Negative NegativePositive control 294 ± 8.0 269 ± 5.0 278 ± 21.0 237 ± 16.0 206 ± 26.0 251 ± 21.0
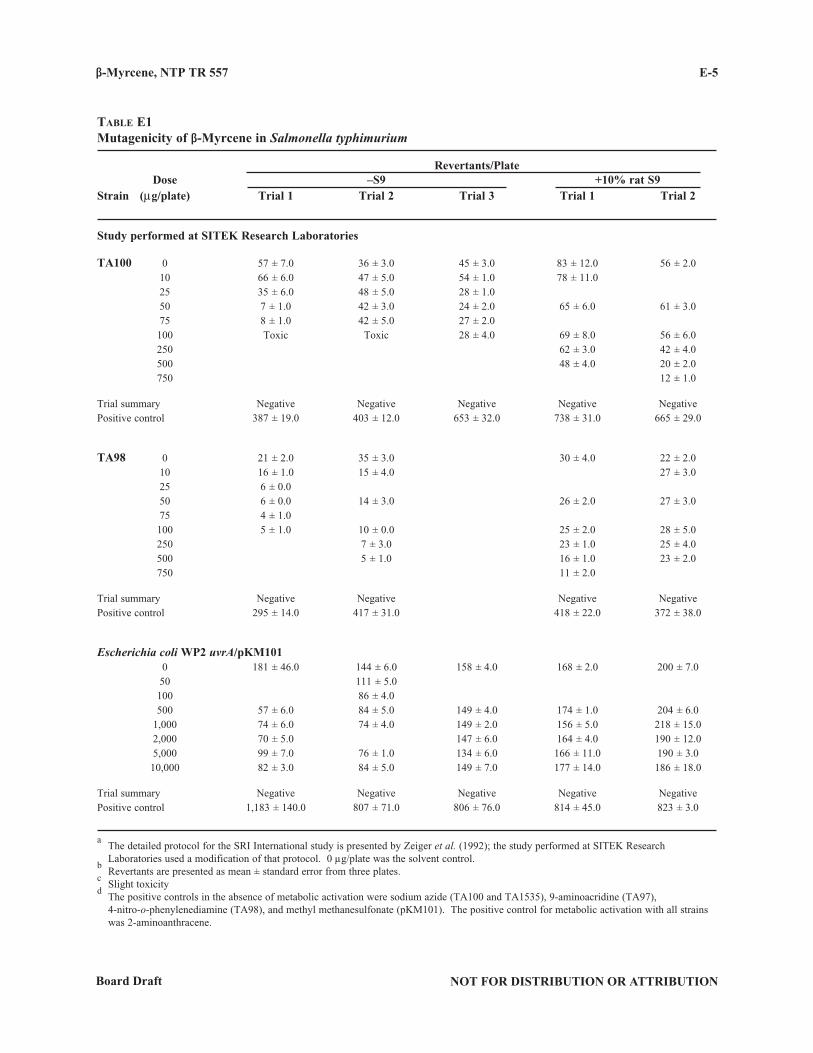
β-Myrcene, NTP TR 557
NOT FOR DISTRIBUTION OR ATTRIBUTIONBoard Draft
E-5
Table e1Mutagenicity of β-Myrcene in Salmonella typhimurium
Revertants/Plate Dose –S9 +10% rat S9Strain (µg/plate) Trial 1 Trial 2 Trial 3 Trial 1 Trial 2
Study performed at SITEK Research Laboratories
TA100 0 57 ± 7.0 36 ± 3.0 45 ± 3.0 83 ± 12.0 56 ± 2.0 10 66 ± 6.0 47 ± 5.0 54 ± 1.0 78 ± 11.0 25 35 ± 6.0 48 ± 5.0 28 ± 1.0 50 7 ± 1.0 42 ± 3.0 24 ± 2.0 65 ± 6.0 61 ± 3.0 75 8 ± 1.0 42 ± 5.0 27 ± 2.0 100 Toxic Toxic 28 ± 4.0 69 ± 8.0 56 ± 6.0 250 62 ± 3.0 42 ± 4.0 500 48 ± 4.0 20 ± 2.0 750 12 ± 1.0
Trial summary Negative Negative Negative Negative NegativePositive control 387 ± 19.0 403 ± 12.0 653 ± 32.0 738 ± 31.0 665 ± 29.0
TA98 0 21 ± 2.0 35 ± 3.0 30 ± 4.0 22 ± 2.0 10 16 ± 1.0 15 ± 4.0 27 ± 3.0 25 6 ± 0.0 50 6 ± 0.0 14 ± 3.0 26 ± 2.0 27 ± 3.0 75 4 ± 1.0 100 5 ± 1.0 10 ± 0.0 25 ± 2.0 28 ± 5.0 250 7 ± 3.0 23 ± 1.0 25 ± 4.0 500 5 ± 1.0 16 ± 1.0 23 ± 2.0 750 11 ± 2.0
Trial summary Negative Negative Negative NegativePositive control 295 ± 14.0 417 ± 31.0 418 ± 22.0 372 ± 38.0
Escherichia coli WP2 uvrA/pKM101 0 181 ± 46.0 144 ± 6.0 158 ± 4.0 168 ± 2.0 200 ± 7.0 50 111 ± 5.0 100 86 ± 4.0 500 57 ± 6.0 84 ± 5.0 149 ± 4.0 174 ± 1.0 204 ± 6.0 1,000 74 ± 6.0 74 ± 4.0 149 ± 2.0 156 ± 5.0 218 ± 15.0 2,000 70 ± 5.0 147 ± 6.0 164 ± 4.0 190 ± 12.0 5,000 99 ± 7.0 76 ± 1.0 134 ± 6.0 166 ± 11.0 190 ± 3.0 10,000 82 ± 3.0 84 ± 5.0 149 ± 7.0 177 ± 14.0 186 ± 18.0
Trial summary Negative Negative Negative Negative NegativePositive control 1,183 ± 140.0 807 ± 71.0 806 ± 76.0 814 ± 45.0 823 ± 3.0
a The detailed protocol for the SRI International study is presented by Zeiger et al. (1992); the study performed at SITEK Research
Laboratories used a modification of that protocol. 0 µg/plate was the solvent control.b Revertants are presented as mean ± standard error from three plates.
c Slight toxicity
d The positive controls in the absence of metabolic activation were sodium azide (TA100 and TA1535), 9-aminoacridine (TA97),
4-nitro-o-phenylenediamine (TA98), and methyl methanesulfonate (pKM101). The positive control for metabolic activation with all strains was 2-aminoanthracene.
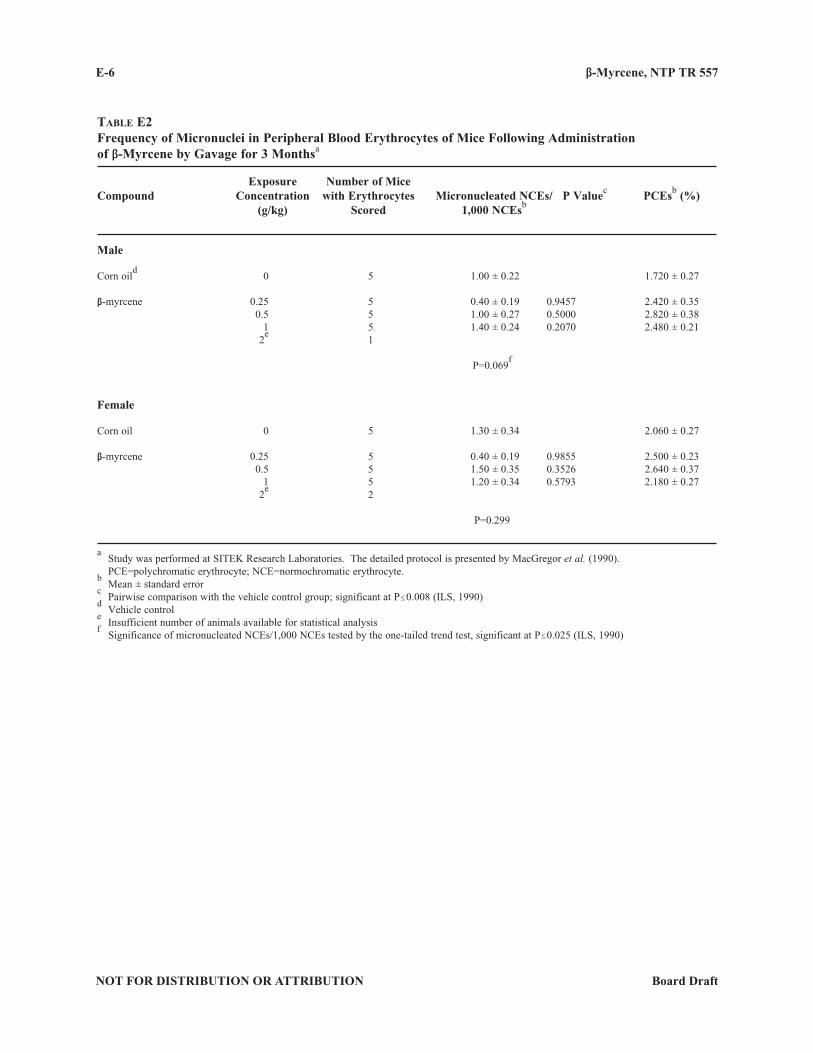
β-Myrcene, NTP TR 557 E-6
NOT FOR DISTRIBUTION OR ATTRIBUTION Board Draft
Table e2Frequency of Micronuclei in Peripheral Blood Erythrocytes of Mice Following Administration of β-Myrcene by Gavage for 3 Monthsa
Exposure Number of MiceCompound Concentration with Erythrocytes Micronucleated NCEs/ P Valuec PCEsb (%) (g/kg) Scored 1,000 NCEsb
Male
Corn oild 0 5 1.00 ± 0.22 1.720 ± 0.27
β-myrcene 0.25 5 0.40 ± 0.19 0.9457 2.420 ± 0.35 0.5 5 1.00 ± 0.27 0.5000 2.820 ± 0.38 1 5 1.40 ± 0.24 0.2070 2.480 ± 0.21 2
e 1
P=0.069f
Female
Corn oil 0 5 1.30 ± 0.34 2.060 ± 0.27
β-myrcene 0.25 5 0.40 ± 0.19 0.9855 2.500 ± 0.23 0.5 5 1.50 ± 0.35 0.3526 2.640 ± 0.37 1 5 1.20 ± 0.34 0.5793 2.180 ± 0.27 2
e 2
P=0.299
a Study was performed at SITEK Research Laboratories. The detailed protocol is presented by MacGregor et al. (1990).
PCE=polychromatic erythrocyte; NCE=normochromatic erythrocyte.b Mean ± standard error
c Pairwise comparison with the vehicle control group; significant at P#0.008 (ILS, 1990)
d Vehicle control
e Insufficient number of animals available for statistical analysis
f Significance of micronucleated NCEs/1,000 NCEs tested by the one-tailed trend test, significant at P#0.025 (ILS, 1990)
NOT FOR DISTRIBUTION OR ATTRIBUTIONBoard Draft
F-1
APPENDIX FCLINICAL PATHOLOGY RESULTS
Table F1 Hematology and Clinical Chemistry Data for Rats in the 3-Month Gavage Study of β-Myrcene . . . . . . . . . . . . . . . . . . . . . . . . . . . . . . . . . . . . . . . . . . . . . . . . . . . . . . . . . . . . . . . . . F-2Table F2 Hematology Data for Mice in the 3-Month Gavage Study of β-Myrcene . . . . . . . . . . . . . . . F-6
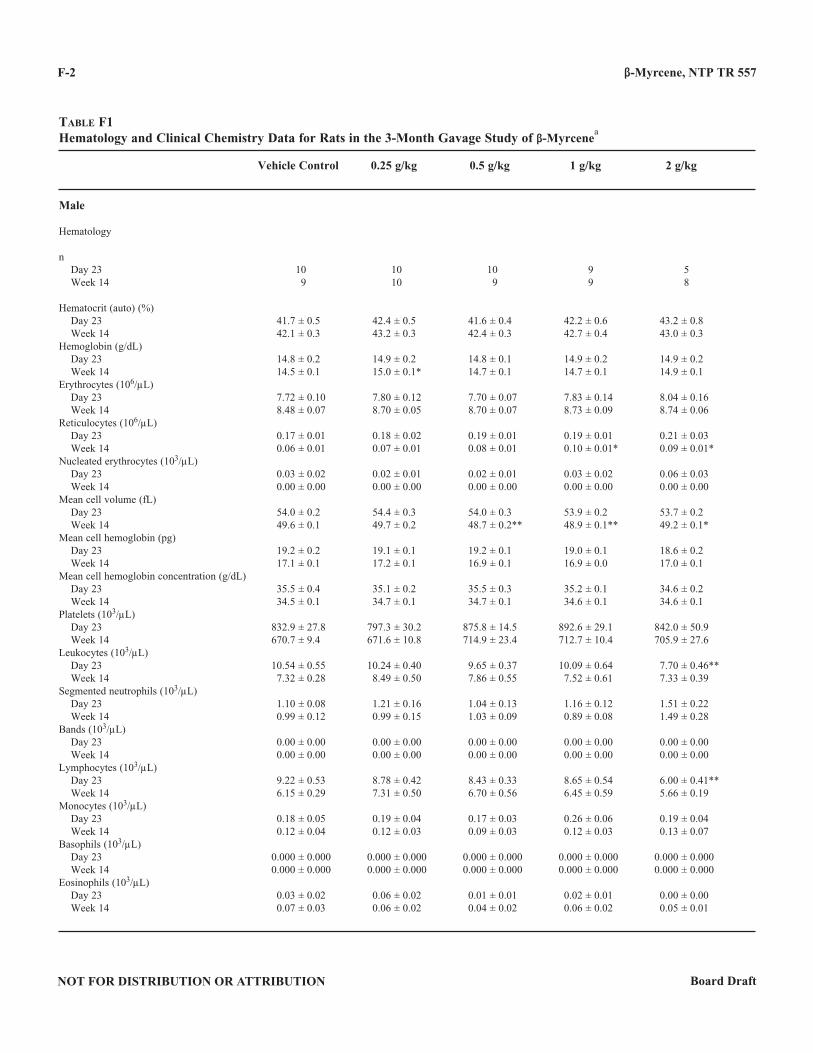
β-Myrcene, NTP TR 557
NOT FOR DISTRIBUTION OR ATTRIBUTION Board Draft
F-2
Table F1Hematology and Clinical Chemistry Data for Rats in the 3-Month Gavage Study of β-Myrcene
a
Vehicle Control 0 .25 g/kg 0 .5 g/kg 1 g/kg 2 g/kg
Male
Hematology
n Day 23 10 10 10 9 5 Week 14 9 10 9 9 8
Hematocrit (auto) (%) Day 23 41.7 ± 0.5 42.4 ± 0.5 41.6 ± 0.4 42.2 ± 0.6 43.2 ± 0.8 Week 14 42.1 ± 0.3 43.2 ± 0.3 42.4 ± 0.3 42.7 ± 0.4 43.0 ± 0.3Hemoglobin (g/dL) Day 23 14.8 ± 0.2 14.9 ± 0.2 14.8 ± 0.1 14.9 ± 0.2 14.9 ± 0.2 Week 14 14.5 ± 0.1 15.0 ± 0.1* 14.7 ± 0.1 14.7 ± 0.1 14.9 ± 0.1Erythrocytes (106/µL) Day 23 7.72 ± 0.10 7.80 ± 0.12 7.70 ± 0.07 7.83 ± 0.14 8.04 ± 0.16 Week 14 8.48 ± 0.07 8.70 ± 0.05 8.70 ± 0.07 8.73 ± 0.09 8.74 ± 0.06Reticulocytes (106/µL) Day 23 0.17 ± 0.01 0.18 ± 0.02 0.19 ± 0.01 0.19 ± 0.01 0.21 ± 0.03 Week 14 0.06 ± 0.01 0.07 ± 0.01 0.08 ± 0.01 0.10 ± 0.01* 0.09 ± 0.01*Nucleated erythrocytes (103/µL) Day 23 0.03 ± 0.02 0.02 ± 0.01 0.02 ± 0.01 0.03 ± 0.02 0.06 ± 0.03 Week 14 0.00 ± 0.00 0.00 ± 0.00 0.00 ± 0.00 0.00 ± 0.00 0.00 ± 0.00Mean cell volume (fL) Day 23 54.0 ± 0.2 54.4 ± 0.3 54.0 ± 0.3 53.9 ± 0.2 53.7 ± 0.2 Week 14 49.6 ± 0.1 49.7 ± 0.2 48.7 ± 0.2** 48.9 ± 0.1** 49.2 ± 0.1*Mean cell hemoglobin (pg) Day 23 19.2 ± 0.2 19.1 ± 0.1 19.2 ± 0.1 19.0 ± 0.1 18.6 ± 0.2 Week 14 17.1 ± 0.1 17.2 ± 0.1 16.9 ± 0.1 16.9 ± 0.0 17.0 ± 0.1Mean cell hemoglobin concentration (g/dL) Day 23 35.5 ± 0.4 35.1 ± 0.2 35.5 ± 0.3 35.2 ± 0.1 34.6 ± 0.2 Week 14 34.5 ± 0.1 34.7 ± 0.1 34.7 ± 0.1 34.6 ± 0.1 34.6 ± 0.1Platelets (103/µL) Day 23 832.9 ± 27.8 797.3 ± 30.2 875.8 ± 14.5 892.6 ± 29.1 842.0 ± 50.9 Week 14 670.7 ± 9.4 671.6 ± 10.8 714.9 ± 23.4 712.7 ± 10.4 705.9 ± 27.6Leukocytes (103/µL) Day 23 10.54 ± 0.55 10.24 ± 0.40 9.65 ± 0.37 10.09 ± 0.64 7.70 ± 0.46** Week 14 7.32 ± 0.28 8.49 ± 0.50 7.86 ± 0.55 7.52 ± 0.61 7.33 ± 0.39Segmented neutrophils (103/µL) Day 23 1.10 ± 0.08 1.21 ± 0.16 1.04 ± 0.13 1.16 ± 0.12 1.51 ± 0.22 Week 14 0.99 ± 0.12 0.99 ± 0.15 1.03 ± 0.09 0.89 ± 0.08 1.49 ± 0.28Bands (103/µL) Day 23 0.00 ± 0.00 0.00 ± 0.00 0.00 ± 0.00 0.00 ± 0.00 0.00 ± 0.00 Week 14 0.00 ± 0.00 0.00 ± 0.00 0.00 ± 0.00 0.00 ± 0.00 0.00 ± 0.00Lymphocytes (103/µL) Day 23 9.22 ± 0.53 8.78 ± 0.42 8.43 ± 0.33 8.65 ± 0.54 6.00 ± 0.41** Week 14 6.15 ± 0.29 7.31 ± 0.50 6.70 ± 0.56 6.45 ± 0.59 5.66 ± 0.19Monocytes (103/µL) Day 23 0.18 ± 0.05 0.19 ± 0.04 0.17 ± 0.03 0.26 ± 0.06 0.19 ± 0.04 Week 14 0.12 ± 0.04 0.12 ± 0.03 0.09 ± 0.03 0.12 ± 0.03 0.13 ± 0.07Basophils (103/µL) Day 23 0.000 ± 0.000 0.000 ± 0.000 0.000 ± 0.000 0.000 ± 0.000 0.000 ± 0.000 Week 14 0.000 ± 0.000 0.000 ± 0.000 0.000 ± 0.000 0.000 ± 0.000 0.000 ± 0.000Eosinophils (103/µL) Day 23 0.03 ± 0.02 0.06 ± 0.02 0.01 ± 0.01 0.02 ± 0.01 0.00 ± 0.00 Week 14 0.07 ± 0.03 0.06 ± 0.02 0.04 ± 0.02 0.06 ± 0.02 0.05 ± 0.01
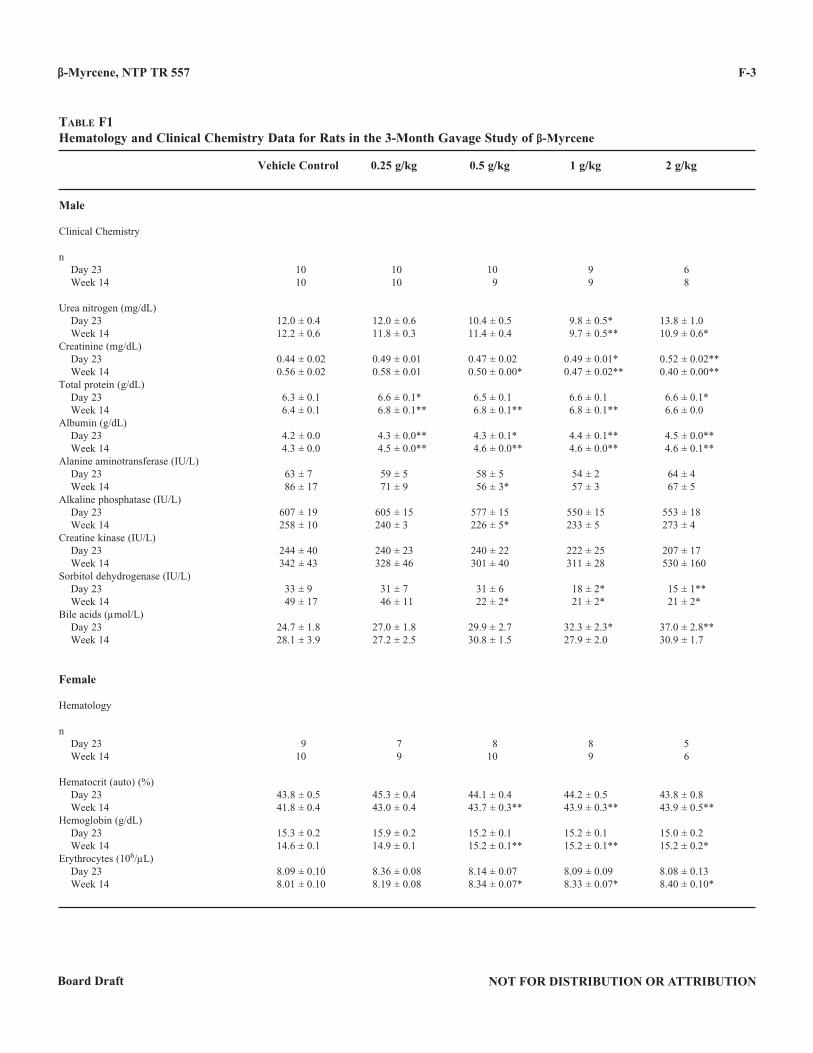
β-Myrcene, NTP TR 557
NOT FOR DISTRIBUTION OR ATTRIBUTIONBoard Draft
F-3
Table F1Hematology and Clinical Chemistry Data for Rats in the 3-Month Gavage Study of β-Myrcene
Vehicle Control 0 .25 g/kg 0 .5 g/kg 1 g/kg 2 g/kg
Male
Clinical Chemistry
n Day 23 10 10 10 9 6 Week 14 10 10 9 9 8
Urea nitrogen (mg/dL) Day 23 12.0 ± 0.4 12.0 ± 0.6 10.4 ± 0.5 9.8 ± 0.5* 13.8 ± 1.0 Week 14 12.2 ± 0.6 11.8 ± 0.3 11.4 ± 0.4 9.7 ± 0.5** 10.9 ± 0.6*Creatinine (mg/dL) Day 23 0.44 ± 0.02 0.49 ± 0.01 0.47 ± 0.02 0.49 ± 0.01* 0.52 ± 0.02** Week 14 0.56 ± 0.02 0.58 ± 0.01 0.50 ± 0.00* 0.47 ± 0.02** 0.40 ± 0.00**Total protein (g/dL) Day 23 6.3 ± 0.1 6.6 ± 0.1* 6.5 ± 0.1 6.6 ± 0.1 6.6 ± 0.1* Week 14 6.4 ± 0.1 6.8 ± 0.1** 6.8 ± 0.1** 6.8 ± 0.1** 6.6 ± 0.0Albumin (g/dL) Day 23 4.2 ± 0.0 4.3 ± 0.0** 4.3 ± 0.1* 4.4 ± 0.1** 4.5 ± 0.0** Week 14 4.3 ± 0.0 4.5 ± 0.0** 4.6 ± 0.0** 4.6 ± 0.0** 4.6 ± 0.1**Alanine aminotransferase (IU/L) Day 23 63 ± 7 59 ± 5 58 ± 5 54 ± 2 64 ± 4 Week 14 86 ± 17 71 ± 9 56 ± 3* 57 ± 3 67 ± 5Alkaline phosphatase (IU/L) Day 23 607 ± 19 605 ± 15 577 ± 15 550 ± 15 553 ± 18 Week 14 258 ± 10 240 ± 3 226 ± 5* 233 ± 5 273 ± 4Creatine kinase (IU/L) Day 23 244 ± 40 240 ± 23 240 ± 22 222 ± 25 207 ± 17 Week 14 342 ± 43 328 ± 46 301 ± 40 311 ± 28 530 ± 160Sorbitol dehydrogenase (IU/L) Day 23 33 ± 9 31 ± 7 31 ± 6 18 ± 2* 15 ± 1** Week 14 49 ± 17 46 ± 11 22 ± 2* 21 ± 2* 21 ± 2*Bile acids (µmol/L) Day 23 24.7 ± 1.8 27.0 ± 1.8 29.9 ± 2.7 32.3 ± 2.3* 37.0 ± 2.8** Week 14 28.1 ± 3.9 27.2 ± 2.5 30.8 ± 1.5 27.9 ± 2.0 30.9 ± 1.7
Female
Hematology
n Day 23 9 7 8 8 5 Week 14 10 9 10 9 6
Hematocrit (auto) (%) Day 23 43.8 ± 0.5 45.3 ± 0.4 44.1 ± 0.4 44.2 ± 0.5 43.8 ± 0.8 Week 14 41.8 ± 0.4 43.0 ± 0.4 43.7 ± 0.3** 43.9 ± 0.3** 43.9 ± 0.5**Hemoglobin (g/dL) Day 23 15.3 ± 0.2 15.9 ± 0.2 15.2 ± 0.1 15.2 ± 0.1 15.0 ± 0.2 Week 14 14.6 ± 0.1 14.9 ± 0.1 15.2 ± 0.1** 15.2 ± 0.1** 15.2 ± 0.2*Erythrocytes (106/µL) Day 23 8.09 ± 0.10 8.36 ± 0.08 8.14 ± 0.07 8.09 ± 0.09 8.08 ± 0.13 Week 14 8.01 ± 0.10 8.19 ± 0.08 8.34 ± 0.07* 8.33 ± 0.07* 8.40 ± 0.10*
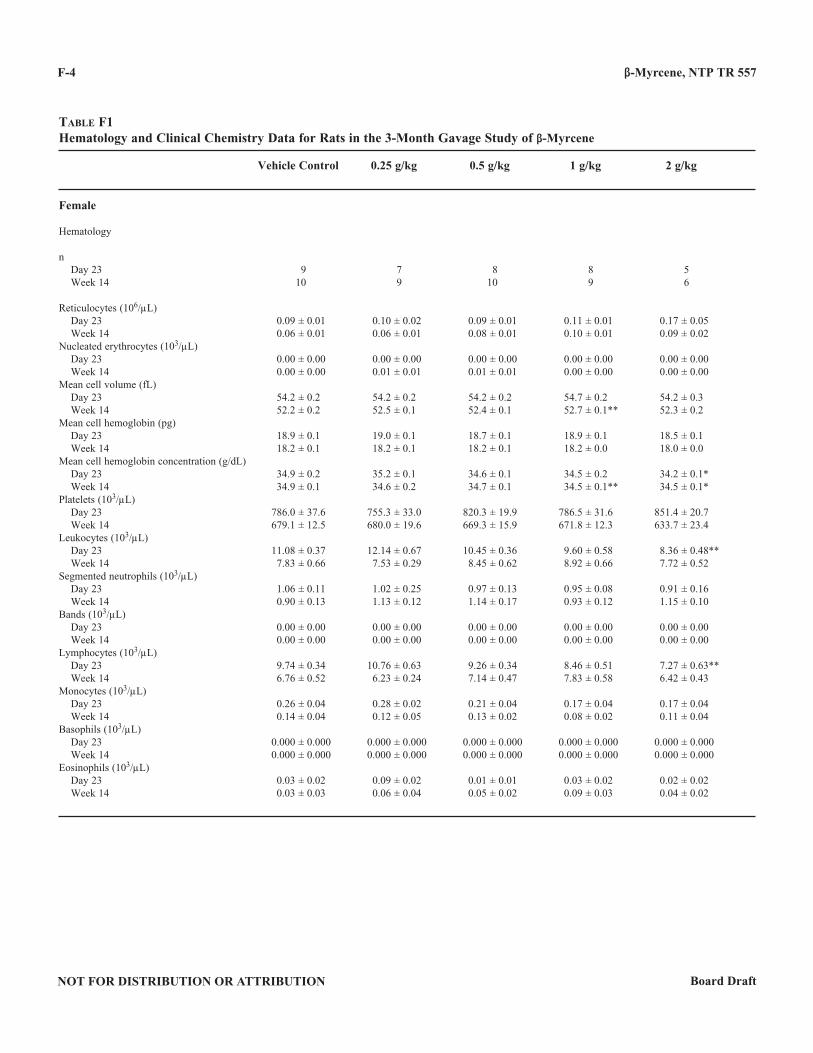
β-Myrcene, NTP TR 557
NOT FOR DISTRIBUTION OR ATTRIBUTION Board Draft
F-4
Table F1Hematology and Clinical Chemistry Data for Rats in the 3-Month Gavage Study of β-Myrcene
Vehicle Control 0 .25 g/kg 0 .5 g/kg 1 g/kg 2 g/kg
Female
Hematology
n Day 23 9 7 8 8 5 Week 14 10 9 10 9 6
Reticulocytes (106/µL) Day 23 0.09 ± 0.01 0.10 ± 0.02 0.09 ± 0.01 0.11 ± 0.01 0.17 ± 0.05 Week 14 0.06 ± 0.01 0.06 ± 0.01 0.08 ± 0.01 0.10 ± 0.01 0.09 ± 0.02Nucleated erythrocytes (103/µL) Day 23 0.00 ± 0.00 0.00 ± 0.00 0.00 ± 0.00 0.00 ± 0.00 0.00 ± 0.00 Week 14 0.00 ± 0.00 0.01 ± 0.01 0.01 ± 0.01 0.00 ± 0.00 0.00 ± 0.00Mean cell volume (fL) Day 23 54.2 ± 0.2 54.2 ± 0.2 54.2 ± 0.2 54.7 ± 0.2 54.2 ± 0.3 Week 14 52.2 ± 0.2 52.5 ± 0.1 52.4 ± 0.1 52.7 ± 0.1** 52.3 ± 0.2Mean cell hemoglobin (pg) Day 23 18.9 ± 0.1 19.0 ± 0.1 18.7 ± 0.1 18.9 ± 0.1 18.5 ± 0.1 Week 14 18.2 ± 0.1 18.2 ± 0.1 18.2 ± 0.1 18.2 ± 0.0 18.0 ± 0.0Mean cell hemoglobin concentration (g/dL) Day 23 34.9 ± 0.2 35.2 ± 0.1 34.6 ± 0.1 34.5 ± 0.2 34.2 ± 0.1* Week 14 34.9 ± 0.1 34.6 ± 0.2 34.7 ± 0.1 34.5 ± 0.1** 34.5 ± 0.1*Platelets (103/µL) Day 23 786.0 ± 37.6 755.3 ± 33.0 820.3 ± 19.9 786.5 ± 31.6 851.4 ± 20.7 Week 14 679.1 ± 12.5 680.0 ± 19.6 669.3 ± 15.9 671.8 ± 12.3 633.7 ± 23.4Leukocytes (103/µL) Day 23 11.08 ± 0.37 12.14 ± 0.67 10.45 ± 0.36 9.60 ± 0.58 8.36 ± 0.48** Week 14 7.83 ± 0.66 7.53 ± 0.29 8.45 ± 0.62 8.92 ± 0.66 7.72 ± 0.52Segmented neutrophils (103/µL) Day 23 1.06 ± 0.11 1.02 ± 0.25 0.97 ± 0.13 0.95 ± 0.08 0.91 ± 0.16 Week 14 0.90 ± 0.13 1.13 ± 0.12 1.14 ± 0.17 0.93 ± 0.12 1.15 ± 0.10Bands (103/µL) Day 23 0.00 ± 0.00 0.00 ± 0.00 0.00 ± 0.00 0.00 ± 0.00 0.00 ± 0.00 Week 14 0.00 ± 0.00 0.00 ± 0.00 0.00 ± 0.00 0.00 ± 0.00 0.00 ± 0.00Lymphocytes (103/µL) Day 23 9.74 ± 0.34 10.76 ± 0.63 9.26 ± 0.34 8.46 ± 0.51 7.27 ± 0.63** Week 14 6.76 ± 0.52 6.23 ± 0.24 7.14 ± 0.47 7.83 ± 0.58 6.42 ± 0.43Monocytes (103/µL) Day 23 0.26 ± 0.04 0.28 ± 0.02 0.21 ± 0.04 0.17 ± 0.04 0.17 ± 0.04 Week 14 0.14 ± 0.04 0.12 ± 0.05 0.13 ± 0.02 0.08 ± 0.02 0.11 ± 0.04Basophils (103/µL) Day 23 0.000 ± 0.000 0.000 ± 0.000 0.000 ± 0.000 0.000 ± 0.000 0.000 ± 0.000 Week 14 0.000 ± 0.000 0.000 ± 0.000 0.000 ± 0.000 0.000 ± 0.000 0.000 ± 0.000Eosinophils (103/µL) Day 23 0.03 ± 0.02 0.09 ± 0.02 0.01 ± 0.01 0.03 ± 0.02 0.02 ± 0.02 Week 14 0.03 ± 0.03 0.06 ± 0.04 0.05 ± 0.02 0.09 ± 0.03 0.04 ± 0.02
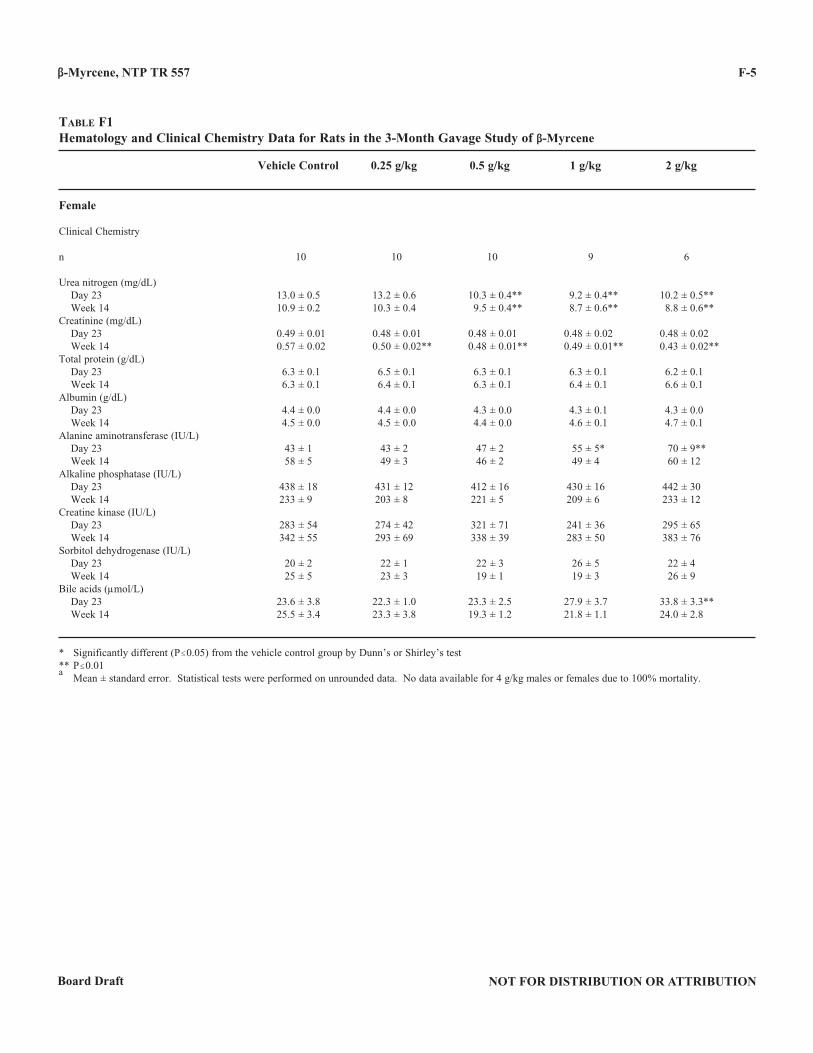
β-Myrcene, NTP TR 557
NOT FOR DISTRIBUTION OR ATTRIBUTIONBoard Draft
F-5
Table F1Hematology and Clinical Chemistry Data for Rats in the 3-Month Gavage Study of β-Myrcene
Vehicle Control 0 .25 g/kg 0 .5 g/kg 1 g/kg 2 g/kg
Female
Clinical Chemistry
n 10 10 10 9 6
Urea nitrogen (mg/dL) Day 23 13.0 ± 0.5 13.2 ± 0.6 10.3 ± 0.4** 9.2 ± 0.4** 10.2 ± 0.5** Week 14 10.9 ± 0.2 10.3 ± 0.4 9.5 ± 0.4** 8.7 ± 0.6** 8.8 ± 0.6**Creatinine (mg/dL) Day 23 0.49 ± 0.01 0.48 ± 0.01 0.48 ± 0.01 0.48 ± 0.02 0.48 ± 0.02 Week 14 0.57 ± 0.02 0.50 ± 0.02** 0.48 ± 0.01** 0.49 ± 0.01** 0.43 ± 0.02**Total protein (g/dL) Day 23 6.3 ± 0.1 6.5 ± 0.1 6.3 ± 0.1 6.3 ± 0.1 6.2 ± 0.1 Week 14 6.3 ± 0.1 6.4 ± 0.1 6.3 ± 0.1 6.4 ± 0.1 6.6 ± 0.1Albumin (g/dL) Day 23 4.4 ± 0.0 4.4 ± 0.0 4.3 ± 0.0 4.3 ± 0.1 4.3 ± 0.0 Week 14 4.5 ± 0.0 4.5 ± 0.0 4.4 ± 0.0 4.6 ± 0.1 4.7 ± 0.1Alanine aminotransferase (IU/L) Day 23 43 ± 1 43 ± 2 47 ± 2 55 ± 5* 70 ± 9** Week 14 58 ± 5 49 ± 3 46 ± 2 49 ± 4 60 ± 12Alkaline phosphatase (IU/L) Day 23 438 ± 18 431 ± 12 412 ± 16 430 ± 16 442 ± 30 Week 14 233 ± 9 203 ± 8 221 ± 5 209 ± 6 233 ± 12Creatine kinase (IU/L) Day 23 283 ± 54 274 ± 42 321 ± 71 241 ± 36 295 ± 65 Week 14 342 ± 55 293 ± 69 338 ± 39 283 ± 50 383 ± 76Sorbitol dehydrogenase (IU/L) Day 23 20 ± 2 22 ± 1 22 ± 3 26 ± 5 22 ± 4 Week 14 25 ± 5 23 ± 3 19 ± 1 19 ± 3 26 ± 9Bile acids (µmol/L) Day 23 23.6 ± 3.8 22.3 ± 1.0 23.3 ± 2.5 27.9 ± 3.7 33.8 ± 3.3** Week 14 25.5 ± 3.4 23.3 ± 3.8 19.3 ± 1.2 21.8 ± 1.1 24.0 ± 2.8
* Significantly different (P#0.05) from the vehicle control group by Dunn’s or Shirley’s test** P#0.01a Mean ± standard error. Statistical tests were performed on unrounded data. No data available for 4 g/kg males or females due to 100% mortality.
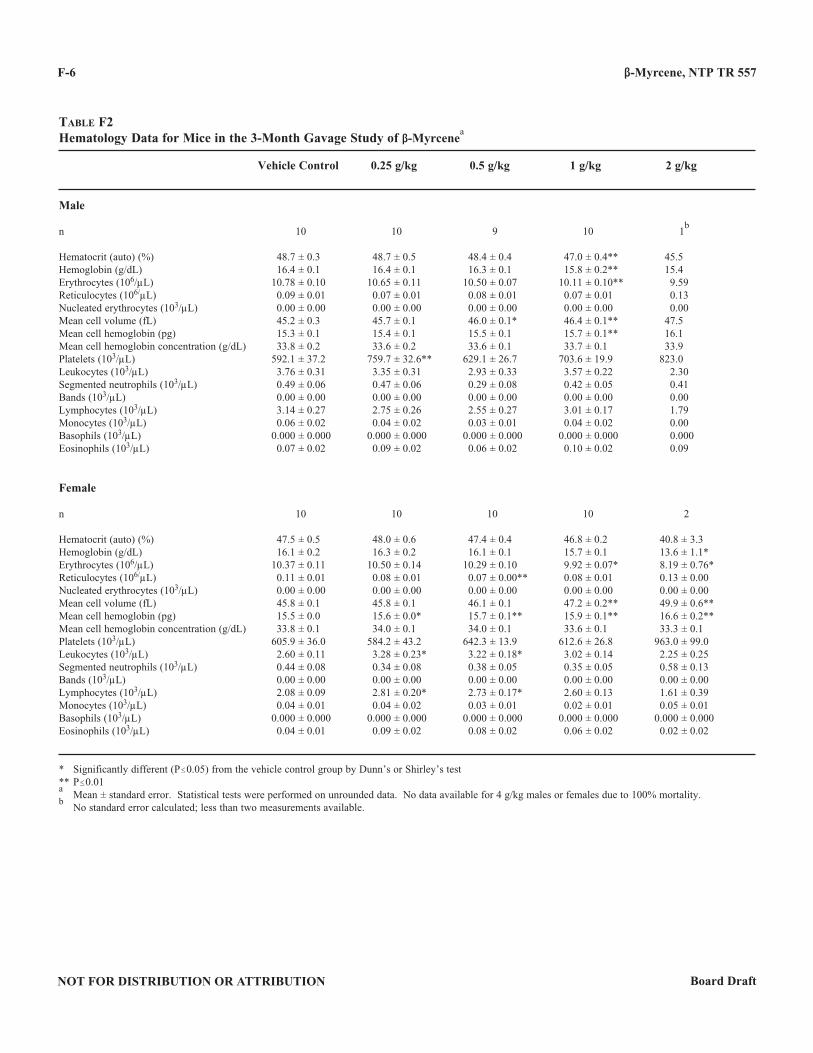
β-Myrcene, NTP TR 557
NOT FOR DISTRIBUTION OR ATTRIBUTION Board Draft
F-6
Table F2Hematology Data for Mice in the 3-Month Gavage Study of β-Myrcene
a
Vehicle Control 0 .25 g/kg 0 .5 g/kg 1 g/kg 2 g/kg
Male
n 10 10 9 10 1b
Hematocrit (auto) (%) 48.7 ± 0.3 48.7 ± 0.5 48.4 ± 0.4 47.0 ± 0.4** 45.5Hemoglobin (g/dL) 16.4 ± 0.1 16.4 ± 0.1 16.3 ± 0.1 15.8 ± 0.2** 15.4Erythrocytes (106/µL) 10.78 ± 0.10 10.65 ± 0.11 10.50 ± 0.07 10.11 ± 0.10** 9.59Reticulocytes (106/µL) 0.09 ± 0.01 0.07 ± 0.01 0.08 ± 0.01 0.07 ± 0.01 0.13Nucleated erythrocytes (103/µL) 0.00 ± 0.00 0.00 ± 0.00 0.00 ± 0.00 0.00 ± 0.00 0.00Mean cell volume (fL) 45.2 ± 0.3 45.7 ± 0.1 46.0 ± 0.1* 46.4 ± 0.1** 47.5Mean cell hemoglobin (pg) 15.3 ± 0.1 15.4 ± 0.1 15.5 ± 0.1 15.7 ± 0.1** 16.1Mean cell hemoglobin concentration (g/dL) 33.8 ± 0.2 33.6 ± 0.2 33.6 ± 0.1 33.7 ± 0.1 33.9Platelets (103/µL) 592.1 ± 37.2 759.7 ± 32.6** 629.1 ± 26.7 703.6 ± 19.9 823.0Leukocytes (103/µL) 3.76 ± 0.31 3.35 ± 0.31 2.93 ± 0.33 3.57 ± 0.22 2.30Segmented neutrophils (103/µL) 0.49 ± 0.06 0.47 ± 0.06 0.29 ± 0.08 0.42 ± 0.05 0.41Bands (103/µL) 0.00 ± 0.00 0.00 ± 0.00 0.00 ± 0.00 0.00 ± 0.00 0.00Lymphocytes (103/µL) 3.14 ± 0.27 2.75 ± 0.26 2.55 ± 0.27 3.01 ± 0.17 1.79Monocytes (103/µL) 0.06 ± 0.02 0.04 ± 0.02 0.03 ± 0.01 0.04 ± 0.02 0.00Basophils (103/µL) 0.000 ± 0.000 0.000 ± 0.000 0.000 ± 0.000 0.000 ± 0.000 0.000Eosinophils (103/µL) 0.07 ± 0.02 0.09 ± 0.02 0.06 ± 0.02 0.10 ± 0.02 0.09
Female
n 10 10 10 10 2
Hematocrit (auto) (%) 47.5 ± 0.5 48.0 ± 0.6 47.4 ± 0.4 46.8 ± 0.2 40.8 ± 3.3Hemoglobin (g/dL) 16.1 ± 0.2 16.3 ± 0.2 16.1 ± 0.1 15.7 ± 0.1 13.6 ± 1.1*Erythrocytes (106/µL) 10.37 ± 0.11 10.50 ± 0.14 10.29 ± 0.10 9.92 ± 0.07* 8.19 ± 0.76*Reticulocytes (106/µL) 0.11 ± 0.01 0.08 ± 0.01 0.07 ± 0.00** 0.08 ± 0.01 0.13 ± 0.00Nucleated erythrocytes (103/µL) 0.00 ± 0.00 0.00 ± 0.00 0.00 ± 0.00 0.00 ± 0.00 0.00 ± 0.00Mean cell volume (fL) 45.8 ± 0.1 45.8 ± 0.1 46.1 ± 0.1 47.2 ± 0.2** 49.9 ± 0.6**Mean cell hemoglobin (pg) 15.5 ± 0.0 15.6 ± 0.0* 15.7 ± 0.1** 15.9 ± 0.1** 16.6 ± 0.2**Mean cell hemoglobin concentration (g/dL) 33.8 ± 0.1 34.0 ± 0.1 34.0 ± 0.1 33.6 ± 0.1 33.3 ± 0.1Platelets (103/µL) 605.9 ± 36.0 584.2 ± 43.2 642.3 ± 13.9 612.6 ± 26.8 963.0 ± 99.0Leukocytes (103/µL) 2.60 ± 0.11 3.28 ± 0.23* 3.22 ± 0.18* 3.02 ± 0.14 2.25 ± 0.25Segmented neutrophils (103/µL) 0.44 ± 0.08 0.34 ± 0.08 0.38 ± 0.05 0.35 ± 0.05 0.58 ± 0.13Bands (103/µL) 0.00 ± 0.00 0.00 ± 0.00 0.00 ± 0.00 0.00 ± 0.00 0.00 ± 0.00Lymphocytes (103/µL) 2.08 ± 0.09 2.81 ± 0.20* 2.73 ± 0.17* 2.60 ± 0.13 1.61 ± 0.39Monocytes (103/µL) 0.04 ± 0.01 0.04 ± 0.02 0.03 ± 0.01 0.02 ± 0.01 0.05 ± 0.01Basophils (103/µL) 0.000 ± 0.000 0.000 ± 0.000 0.000 ± 0.000 0.000 ± 0.000 0.000 ± 0.000Eosinophils (103/µL) 0.04 ± 0.01 0.09 ± 0.02 0.08 ± 0.02 0.06 ± 0.02 0.02 ± 0.02
* Significantly different (P#0.05) from the vehicle control group by Dunn’s or Shirley’s test** P#0.01a Mean ± standard error. Statistical tests were performed on unrounded data. No data available for 4 g/kg males or females due to 100% mortality.
b No standard error calculated; less than two measurements available.
NOT FOR DISTRIBUTION OR ATTRIBUTIONBoard Draft
G-1
APPENDIX GORGAN WEIGHTS
AND ORGAN-WEIGHT-TO-BODY-WEIGHT RATIOS
Table g1 Organ Weights and Organ-Weight-to-Body-Weight Ratios for Rats in the 3-Month Gavage Study of β-Myrcene . . . . . . . . . . . . . . . . . . . . . . . . . . . . . . . . . . . . . . . G-2Table g2 Organ Weights and Organ-Weight-to-Body-Weight Ratios for Mice in the 3-Month Gavage Study of β-Myrcene . . . . . . . . . . . . . . . . . . . . . . . . . . . . . . . . . . . . . . . G-3
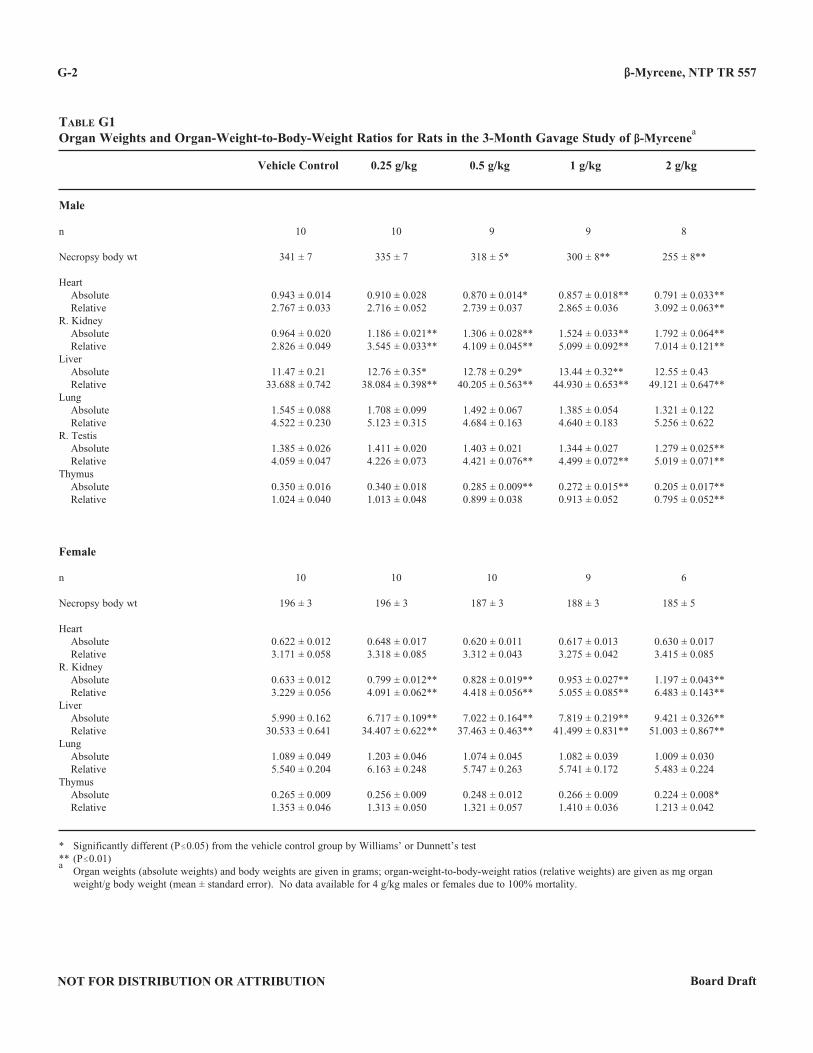
β-Myrcene, NTP TR 557
NOT FOR DISTRIBUTION OR ATTRIBUTION Board Draft
G-2
Table g1Organ Weights and Organ-Weight-to-Body-Weight Ratios for Rats in the 3-Month Gavage Study of β-Myrcene
a
Vehicle Control 0 .25 g/kg 0 .5 g/kg 1 g/kg 2 g/kg
Male
n 10 10 9 9 8
Necropsy body wt 341 ± 7 335 ± 7 318 ± 5* 300 ± 8** 255 ± 8**
Heart Absolute 0.943 ± 0.014 0.910 ± 0.028 0.870 ± 0.014* 0.857 ± 0.018** 0.791 ± 0.033** Relative 2.767 ± 0.033 2.716 ± 0.052 2.739 ± 0.037 2.865 ± 0.036 3.092 ± 0.063**R. Kidney Absolute 0.964 ± 0.020 1.186 ± 0.021** 1.306 ± 0.028** 1.524 ± 0.033** 1.792 ± 0.064** Relative 2.826 ± 0.049 3.545 ± 0.033** 4.109 ± 0.045** 5.099 ± 0.092** 7.014 ± 0.121**Liver Absolute 11.47 ± 0.21 12.76 ± 0.35* 12.78 ± 0.29* 13.44 ± 0.32** 12.55 ± 0.43 Relative 33.688 ± 0.742 38.084 ± 0.398** 40.205 ± 0.563** 44.930 ± 0.653** 49.121 ± 0.647**Lung Absolute 1.545 ± 0.088 1.708 ± 0.099 1.492 ± 0.067 1.385 ± 0.054 1.321 ± 0.122 Relative 4.522 ± 0.230 5.123 ± 0.315 4.684 ± 0.163 4.640 ± 0.183 5.256 ± 0.622R. Testis Absolute 1.385 ± 0.026 1.411 ± 0.020 1.403 ± 0.021 1.344 ± 0.027 1.279 ± 0.025** Relative 4.059 ± 0.047 4.226 ± 0.073 4.421 ± 0.076** 4.499 ± 0.072** 5.019 ± 0.071**Thymus Absolute 0.350 ± 0.016 0.340 ± 0.018 0.285 ± 0.009** 0.272 ± 0.015** 0.205 ± 0.017** Relative 1.024 ± 0.040 1.013 ± 0.048 0.899 ± 0.038 0.913 ± 0.052 0.795 ± 0.052**
Female
n 10 10 10 9 6
Necropsy body wt 196 ± 3 196 ± 3 187 ± 3 188 ± 3 185 ± 5
Heart Absolute 0.622 ± 0.012 0.648 ± 0.017 0.620 ± 0.011 0.617 ± 0.013 0.630 ± 0.017 Relative 3.171 ± 0.058 3.318 ± 0.085 3.312 ± 0.043 3.275 ± 0.042 3.415 ± 0.085R. Kidney Absolute 0.633 ± 0.012 0.799 ± 0.012** 0.828 ± 0.019** 0.953 ± 0.027** 1.197 ± 0.043** Relative 3.229 ± 0.056 4.091 ± 0.062** 4.418 ± 0.056** 5.055 ± 0.085** 6.483 ± 0.143**Liver Absolute 5.990 ± 0.162 6.717 ± 0.109** 7.022 ± 0.164** 7.819 ± 0.219** 9.421 ± 0.326** Relative 30.533 ± 0.641 34.407 ± 0.622** 37.463 ± 0.463** 41.499 ± 0.831** 51.003 ± 0.867**Lung Absolute 1.089 ± 0.049 1.203 ± 0.046 1.074 ± 0.045 1.082 ± 0.039 1.009 ± 0.030 Relative 5.540 ± 0.204 6.163 ± 0.248 5.747 ± 0.263 5.741 ± 0.172 5.483 ± 0.224Thymus Absolute 0.265 ± 0.009 0.256 ± 0.009 0.248 ± 0.012 0.266 ± 0.009 0.224 ± 0.008* Relative 1.353 ± 0.046 1.313 ± 0.050 1.321 ± 0.057 1.410 ± 0.036 1.213 ± 0.042
* Significantly different (P#0.05) from the vehicle control group by Williams’ or Dunnett’s test** (P#0.01)a Organ weights (absolute weights) and body weights are given in grams; organ-weight-to-body-weight ratios (relative weights) are given as mg organ
weight/g body weight (mean ± standard error). No data available for 4 g/kg males or females due to 100% mortality.
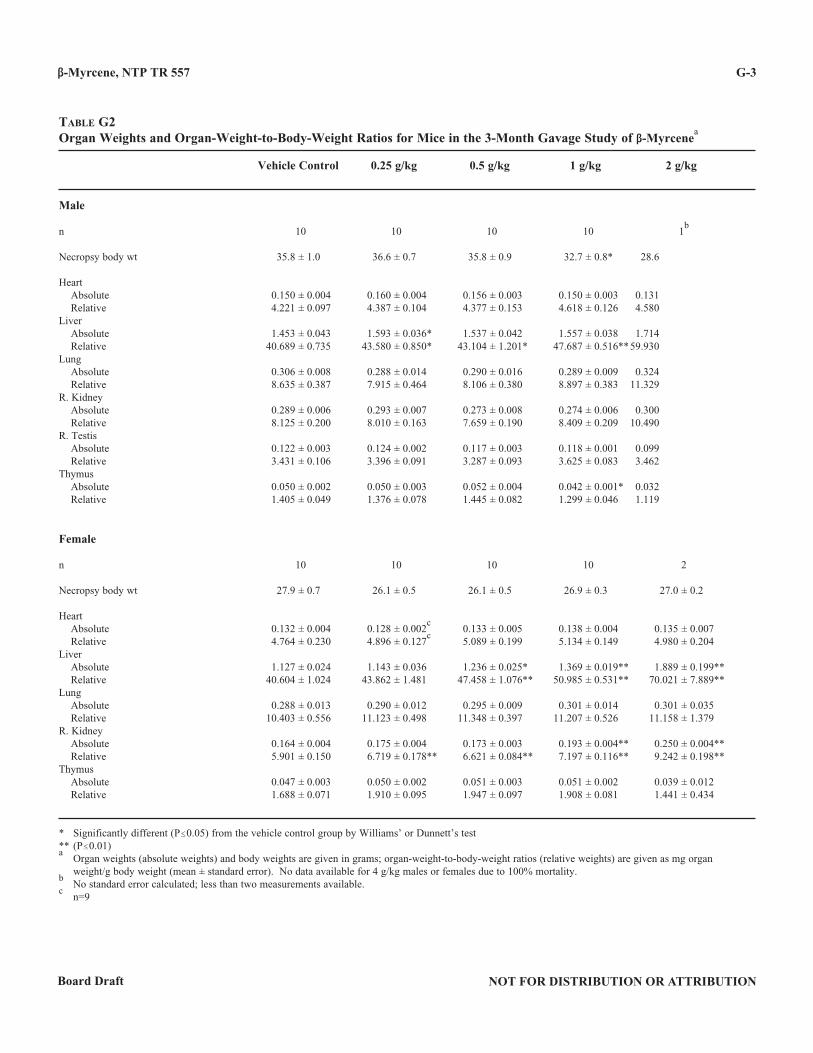
β-Myrcene, NTP TR 557
NOT FOR DISTRIBUTION OR ATTRIBUTIONBoard Draft
G-3
Table g2Organ Weights and Organ-Weight-to-Body-Weight Ratios for Mice in the 3-Month Gavage Study of β-Myrcene
a
Vehicle Control 0 .25 g/kg 0 .5 g/kg 1 g/kg 2 g/kg
Male
n 10 10 10 10 1b
Necropsy body wt 35.8 ± 1.0 36.6 ± 0.7 35.8 ± 0.9 32.7 ± 0.8* 28.6
Heart Absolute 0.150 ± 0.004 0.160 ± 0.004 0.156 ± 0.003 0.150 ± 0.003 0.131 Relative 4.221 ± 0.097 4.387 ± 0.104 4.377 ± 0.153 4.618 ± 0.126 4.580Liver Absolute 1.453 ± 0.043 1.593 ± 0.036* 1.537 ± 0.042 1.557 ± 0.038 1.714 Relative 40.689 ± 0.735 43.580 ± 0.850* 43.104 ± 1.201* 47.687 ± 0.516** 59.930Lung Absolute 0.306 ± 0.008 0.288 ± 0.014 0.290 ± 0.016 0.289 ± 0.009 0.324 Relative 8.635 ± 0.387 7.915 ± 0.464 8.106 ± 0.380 8.897 ± 0.383 11.329R. Kidney Absolute 0.289 ± 0.006 0.293 ± 0.007 0.273 ± 0.008 0.274 ± 0.006 0.300 Relative 8.125 ± 0.200 8.010 ± 0.163 7.659 ± 0.190 8.409 ± 0.209 10.490R. Testis Absolute 0.122 ± 0.003 0.124 ± 0.002 0.117 ± 0.003 0.118 ± 0.001 0.099 Relative 3.431 ± 0.106 3.396 ± 0.091 3.287 ± 0.093 3.625 ± 0.083 3.462Thymus Absolute 0.050 ± 0.002 0.050 ± 0.003 0.052 ± 0.004 0.042 ± 0.001* 0.032 Relative 1.405 ± 0.049 1.376 ± 0.078 1.445 ± 0.082 1.299 ± 0.046 1.119
Female
n 10 10 10 10 2
Necropsy body wt 27.9 ± 0.7 26.1 ± 0.5 26.1 ± 0.5 26.9 ± 0.3 27.0 ± 0.2
Heart Absolute 0.132 ± 0.004 0.128 ± 0.002
c 0.133 ± 0.005 0.138 ± 0.004 0.135 ± 0.007
Relative 4.764 ± 0.230 4.896 ± 0.127c 5.089 ± 0.199 5.134 ± 0.149 4.980 ± 0.204
Liver Absolute 1.127 ± 0.024 1.143 ± 0.036 1.236 ± 0.025* 1.369 ± 0.019** 1.889 ± 0.199** Relative 40.604 ± 1.024 43.862 ± 1.481 47.458 ± 1.076** 50.985 ± 0.531** 70.021 ± 7.889**Lung Absolute 0.288 ± 0.013 0.290 ± 0.012 0.295 ± 0.009 0.301 ± 0.014 0.301 ± 0.035 Relative 10.403 ± 0.556 11.123 ± 0.498 11.348 ± 0.397 11.207 ± 0.526 11.158 ± 1.379R. Kidney Absolute 0.164 ± 0.004 0.175 ± 0.004 0.173 ± 0.003 0.193 ± 0.004** 0.250 ± 0.004** Relative 5.901 ± 0.150 6.719 ± 0.178** 6.621 ± 0.084** 7.197 ± 0.116** 9.242 ± 0.198**Thymus Absolute 0.047 ± 0.003 0.050 ± 0.002 0.051 ± 0.003 0.051 ± 0.002 0.039 ± 0.012 Relative 1.688 ± 0.071 1.910 ± 0.095 1.947 ± 0.097 1.908 ± 0.081 1.441 ± 0.434
* Significantly different (P#0.05) from the vehicle control group by Williams’ or Dunnett’s test** (P#0.01)a Organ weights (absolute weights) and body weights are given in grams; organ-weight-to-body-weight ratios (relative weights) are given as mg organ
weight/g body weight (mean ± standard error). No data available for 4 g/kg males or females due to 100% mortality.b No standard error calculated; less than two measurements available.
c n=9

β-Myrcene, NTP TR 557
NOT FOR DISTRIBUTION OR ATTRIBUTION Board Draft
G-4
NOT FOR DISTRIBUTION OR ATTRIBUTIONBoard Draft
H-1
APPENDIX HREPRODUCTIVE TISSUE EVALUATIONS
AND ESTROUS CYCLE CHARACTERIZATION
Table h1 Summary of Reproductive Tissue Evaluations for Male Rats in the 3-Month Gavage Study of β-Myrcene . . . . . . . . . . . . . . . . . . . . . . . . . . . . . . . . . . . . . . . H-2Table h2 Estrous Cycle Characterization for Female Rats in the 3-Month Gavage Study of β-Myrcene . . . . . . . . . . . . . . . . . . . . . . . . . . . . . . . . . . . . . . . H-2Table h3 Summary of Reproductive Tissue Evaluations for Male Mice in the 3-Month Gavage Study of β-Myrcene . . . . . . . . . . . . . . . . . . . . . . . . . . . . . . . . . . . . . . . H-3Table h4 Estrous Cycle Characterization for Female Mice in the 3-Month Gavage Study of β-Myrcene . . . . . . . . . . . . . . . . . . . . . . . . . . . . . . . . . . . . . . . H-3
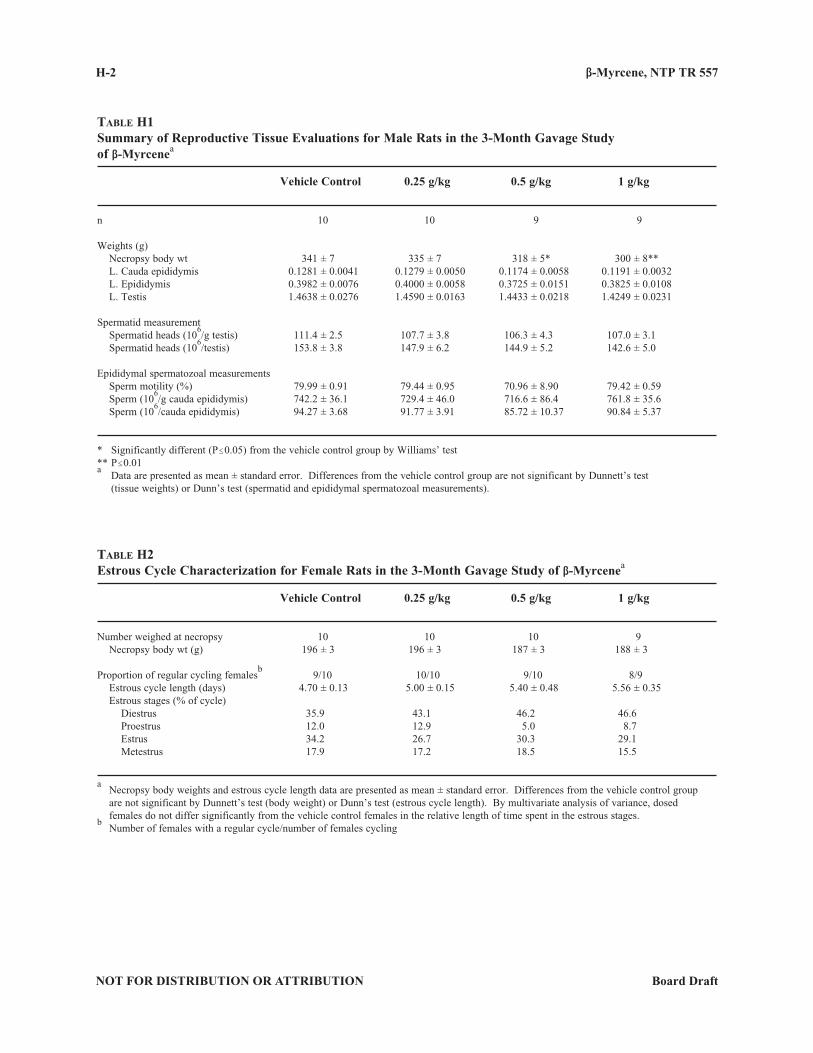
β-Myrcene, NTP TR 557 H-2
NOT FOR DISTRIBUTION OR ATTRIBUTION Board Draft
Table h1Summary of Reproductive Tissue Evaluations for Male Rats in the 3-Month Gavage Studyof β-Myrcenea
Vehicle Control 0 .25 g/kg 0 .5 g/kg 1 g/kg
n 10 10 9 9
Weights (g) Necropsy body wt 341 ± 7 335 ± 7 318 ± 5* 300 ± 8** L. Cauda epididymis 0.1281 ± 0.0041 0.1279 ± 0.0050 0.1174 ± 0.0058 0.1191 ± 0.0032 L. Epididymis 0.3982 ± 0.0076 0.4000 ± 0.0058 0.3725 ± 0.0151 0.3825 ± 0.0108 L. Testis 1.4638 ± 0.0276 1.4590 ± 0.0163 1.4433 ± 0.0218 1.4249 ± 0.0231
Spermatid measurement Spermatid heads (10
6/g testis) 111.4 ± 2.5 107.7 ± 3.8 106.3 ± 4.3 107.0 ± 3.1
Spermatid heads (106/testis) 153.8 ± 3.8 147.9 ± 6.2 144.9 ± 5.2 142.6 ± 5.0
Epididymal spermatozoal measurements Sperm motility (%) 79.99 ± 0.91 79.44 ± 0.95 70.96 ± 8.90 79.42 ± 0.59 Sperm (10
6/g cauda epididymis) 742.2 ± 36.1 729.4 ± 46.0 716.6 ± 86.4 761.8 ± 35.6
Sperm (106/cauda epididymis) 94.27 ± 3.68 91.77 ± 3.91 85.72 ± 10.37 90.84 ± 5.37
* Significantly different (P#0.05) from the vehicle control group by Williams’ test** P#0.01a Data are presented as mean ± standard error. Differences from the vehicle control group are not significant by Dunnett’s test
(tissue weights) or Dunn’s test (spermatid and epididymal spermatozoal measurements).
Table h2Estrous Cycle Characterization for Female Rats in the 3-Month Gavage Study of β-Myrcenea
Vehicle Control 0 .25 g/kg 0 .5 g/kg 1 g/kg
Number weighed at necropsy 10 10 10 9 Necropsy body wt (g) 196 ± 3 196 ± 3 187 ± 3 188 ± 3
Proportion of regular cycling femalesb 9/10 10/10 9/10 8/9
Estrous cycle length (days) 4.70 ± 0.13 5.00 ± 0.15 5.40 ± 0.48 5.56 ± 0.35 Estrous stages (% of cycle) Diestrus 35.9 43.1 46.2 46.6 Proestrus 12.0 12.9 5.0 8.7 Estrus 34.2 26.7 30.3 29.1 Metestrus 17.9 17.2 18.5 15.5
a Necropsy body weights and estrous cycle length data are presented as mean ± standard error. Differences from the vehicle control group
are not significant by Dunnett’s test (body weight) or Dunn’s test (estrous cycle length). By multivariate analysis of variance, dosed females do not differ significantly from the vehicle control females in the relative length of time spent in the estrous stages.b Number of females with a regular cycle/number of females cycling
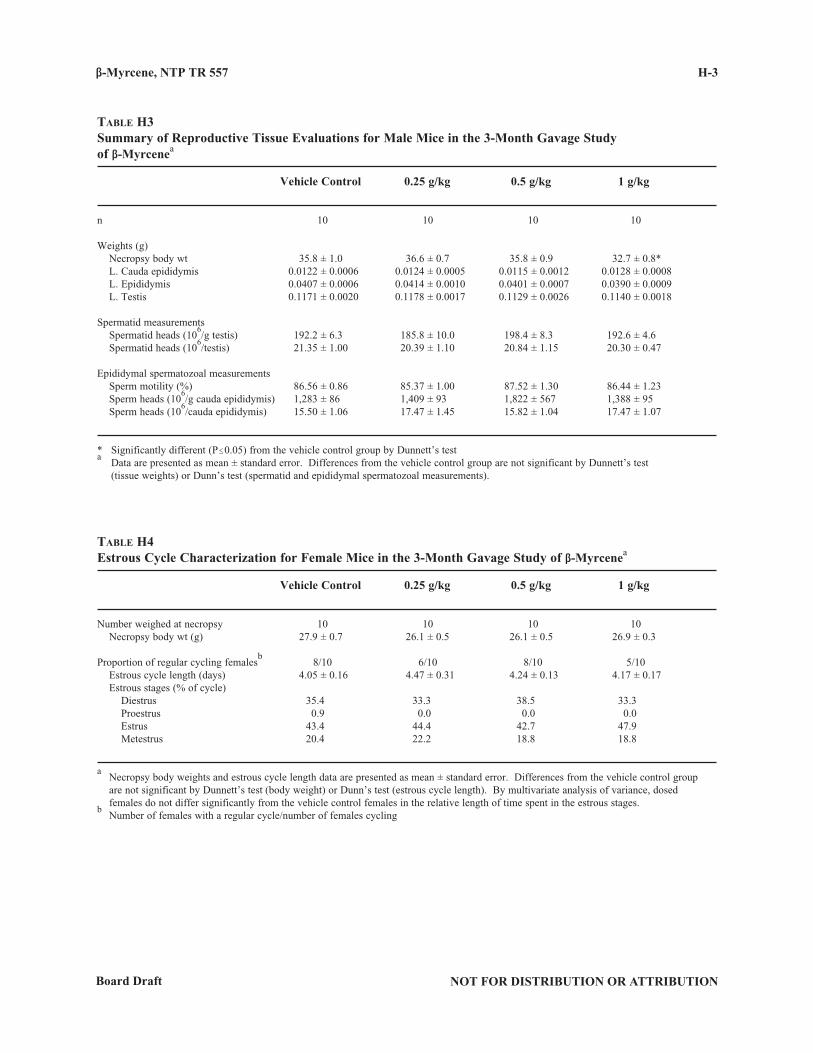
β-Myrcene, NTP TR 557
NOT FOR DISTRIBUTION OR ATTRIBUTIONBoard Draft
H-3
Table h3Summary of Reproductive Tissue Evaluations for Male Mice in the 3-Month Gavage Studyof β-Myrcenea
Vehicle Control 0 .25 g/kg 0 .5 g/kg 1 g/kg
n 10 10 10 10
Weights (g) Necropsy body wt 35.8 ± 1.0 36.6 ± 0.7 35.8 ± 0.9 32.7 ± 0.8* L. Cauda epididymis 0.0122 ± 0.0006 0.0124 ± 0.0005 0.0115 ± 0.0012 0.0128 ± 0.0008 L. Epididymis 0.0407 ± 0.0006 0.0414 ± 0.0010 0.0401 ± 0.0007 0.0390 ± 0.0009 L. Testis 0.1171 ± 0.0020 0.1178 ± 0.0017 0.1129 ± 0.0026 0.1140 ± 0.0018
Spermatid measurements Spermatid heads (10
6/g testis) 192.2 ± 6.3 185.8 ± 10.0 198.4 ± 8.3 192.6 ± 4.6
Spermatid heads (106/testis) 21.35 ± 1.00 20.39 ± 1.10 20.84 ± 1.15 20.30 ± 0.47
Epididymal spermatozoal measurements Sperm motility (%) 86.56 ± 0.86 85.37 ± 1.00 87.52 ± 1.30 86.44 ± 1.23 Sperm heads (10
6/g cauda epididymis) 1,283 ± 86 1,409 ± 93 1,822 ± 567 1,388 ± 95
Sperm heads (106/cauda epididymis) 15.50 ± 1.06 17.47 ± 1.45 15.82 ± 1.04 17.47 ± 1.07
* Significantly different (P#0.05) from the vehicle control group by Dunnett’s testa Data are presented as mean ± standard error. Differences from the vehicle control group are not significant by Dunnett’s test
(tissue weights) or Dunn’s test (spermatid and epididymal spermatozoal measurements).
Table h4Estrous Cycle Characterization for Female Mice in the 3-Month Gavage Study of β-Myrcenea
Vehicle Control 0 .25 g/kg 0 .5 g/kg 1 g/kg
Number weighed at necropsy 10 10 10 10 Necropsy body wt (g) 27.9 ± 0.7 26.1 ± 0.5 26.1 ± 0.5 26.9 ± 0.3
Proportion of regular cycling femalesb 8/10 6/10 8/10 5/10
Estrous cycle length (days) 4.05 ± 0.16 4.47 ± 0.31 4.24 ± 0.13 4.17 ± 0.17 Estrous stages (% of cycle) Diestrus 35.4 33.3 38.5 33.3 Proestrus 0.9 0.0 0.0 0.0 Estrus 43.4 44.4 42.7 47.9 Metestrus 20.4 22.2 18.8 18.8
a Necropsy body weights and estrous cycle length data are presented as mean ± standard error. Differences from the vehicle control group
are not significant by Dunnett’s test (body weight) or Dunn’s test (estrous cycle length). By multivariate analysis of variance, dosed females do not differ significantly from the vehicle control females in the relative length of time spent in the estrous stages.b Number of females with a regular cycle/number of females cycling

β-Myrcene, NTP TR 557 H-4
NOT FOR DISTRIBUTION OR ATTRIBUTION Board Draft
NOT FOR DISTRIBUTION OR ATTRIBUTIONBoard Draft
I-1
APPENDIX ICHEMICAL CHARACTERIZATION
AND DOSE FORMULATION STUDIES
ProCureMenT anD CharaCTerizaTion . . . . . . . . . . . . . . . . . . . . . . . . . . . . . . . . . . . . . . . . . . . . . . . . . . . . . i-2PreParaTion anD analysis oF Dose ForMulaTions . . . . . . . . . . . . . . . . . . . . . . . . . . . . . . . . . . . . . . . . . . . i-3Figure i1 Infrared Absorption Spectrum of β-Myrcene . . . . . . . . . . . . . . . . . . . . . . . . . . . . . . . . . . . . . . I-4Figure i2 Proton Nuclear Magnetic Resonance Spectrum of β-Myrcene . . . . . . . . . . . . . . . . . . . . . . . . I-5Figure i3 Carbon-13 Nuclear Magnetic Resonance Spectrum of β-Myrcene . . . . . . . . . . . . . . . . . . . . . I-6Table i1 Preparation and Storage of Dose Formulations in the Gavage Studies of β-Myrcene . . . . . . . . . . . . . . . . . . . . . . . . . . . . . . . . . . . . . . . . . . . . . . . . . . . . . . . . . . . . . . . . . I-7Table i2 Results of Analyses of Dose Formulations Administered to Rats and Mice in the 3-Month Gavage Studies of β-Myrcene . . . . . . . . . . . . . . . . . . . . . . . . . . . . . . . . . . . . . . I-8Table i3 Results of Analyses of Dose Formulations Administered to Rats and Mice in the 2-Year Gavage Studies of β-Myrcene . . . . . . . . . . . . . . . . . . . . . . . . . . . . . . . . . . . . . . . I-9
β-Myrcene, NTP TR 557 I-2
NOT FOR DISTRIBUTION OR ATTRIBUTION Board Draft
CHEMICAL CHARACTERIZATIONAND DOSE FORMULATION STUDIES
ProCureMenT anD CharaCTerizaTion β-Myrceneβ-Myrcene was obtained from Millennium Specialty Chemicals (Jacksonville, FL) in two lots (0LB410 and 1WB503). Lot 0LB410 was used in the 3-month studies and lot 1WB503 was used in the 2-year studies. Identity and purity studies were performed by the analytical chemistry laboratory at Battelle Columbus Operations (Chemistry Support Services, Columbus, OH), Galbraith Laboratories, Inc. (Knoxville, TN), and the study laboratory at Battelle Columbus Operations (Columbus, OH). Karl Fischer titration was performed by Galbraith Laboratories, Inc. Reports on analyses performed in support of the β-myrcene studies are on file at the National Institute of Environmental Health Sciences.
Both lots of the chemical, a clear to slightly yellow liquid, were identified as β-myrcene by the analytical chemistry laboratory using infrared (IR), proton, and carbon-13 nuclear magnetic resonance (NMR) spectroscopy and by Galbraith Laboratories, Inc., using boiling point determinations. In addition, the identity of both lots was confirmed by the study laboratory using IR spectroscopy. All spectra were consistent with literature spectra (Aldrich, 1992, 1997), spectra of frozen reference samples from each lot, computer-calculated spectra, and the structure of β-myrcene. Boiling point determinations were consistent with literature values of 167° C (CRC Handbook, 1981; Hawley’s, 1993). Representative IR, proton, and carbon-13 NMR spectra are presented in Figures I1, I2, and I3, respectively.
The purities of both lots were determined by the analytical chemistry laboratory using gas chromatography with flame ionization detection (GC-FID) and high-performance liquid chromatography (HPLC). GC-FID was performed on a Hewlett-Packard (Palo Alto, CA) system that included a Stabilwax
®-DA or Stabilwax
®
Crossbond®
30 m × 0.25 mm, 0.25-µm film thickness column (Restek, Bellefonte, PA), helium carrier gas at flow rates varying from 2 to 4 mL/minute, and an oven temperature program starting at 35° C for 5 minutes, then increased to 55° C at 2° C/minute, held for 1 minute, then increased to 230° C at 10° C/minute, and held for 1 to 3 minutes. HPLC was performed on a Waters (Milford, MA) system that included a 5-µm Prodigy ODS-3 150 mm × 4.6 mm column (Phenomenex, Torrance, CA), an isocratic mobile phase of 85:15 or 90:10 methanol:water, ultraviolet light detection at 225 nm, and a flow rate of 0.8 mL/minute.
For lot 0LB410, Karl Fischer titration indicated a water content of less than 0.016%. GC-FID by the analytical chemistry laboratory indicated one major peak and nine impurity peaks with areas of 0.1% or greater, with a total peak area for all impurities of 9.55%. HPLC analysis indicated one major peak and one impurity with a peak area of 0.36%. Elemental analyses of carbon and hydrogen were generally consistent with the theoretical values for β-myrcene. The largest peak (4.4% of total peak area) was identified as psi-limonene. The second largest impurity (1.4% of total peak area) was tentatively identified as dl-limonene. The other seven impurity peaks, small by comparison, were chiefly terpene hydrocarbons and were tentatively identified as isomers and dimers of β-myrcene. The overall purity of lot 0LB410 was determined to be greater than 90%.
For lot 1WB503, Karl Fischer titration indicated a water content of less than 0.06%. GC-FID by the analytical chemistry laboratory indicated one major peak and 12 impurities with areas of 0.1% or greater, with a total peak area for all impurities of 6.5%. HPLC analysis indicated one major peak and one impurity with a peak area of 0.4%. Elemental analyses of carbon and hydrogen were generally consistent with the theoretical values for β-myrcene. The largest impurity in β-myrcene was identified as psi-limonene (approximately 5%). The other 11 impurity peaks, small by comparison, were chiefly the same as in the earlier lot, tentatively identified as isomers and dimers of β-myrcene. The overall purity of lot 1WB503 was determined to be greater than 93%.
β-Myrcene, NTP TR 557
NOT FOR DISTRIBUTION OR ATTRIBUTIONBoard Draft
I-3
To ensure stability, the bulk chemical was stored in amber glass bottles sealed with Teflon®-lined lids at less than or equal to –20° C. Periodic reanalyses of the bulk chemical were performed during the 3-month and 2-year studies by the study laboratory using GC-FID by the method described above; no degradation of the bulk chemical was detected.
Corn OilUSP-grade corn oil was obtained in multiple lots from Spectrum Chemicals and Laboratory Products (Gardena, CA) and was used as the vehicle during the 3-month and 2-year studies. Periodic analyses of the corn oil vehicle performed by the study laboratory using potentiometric titration demonstrated peroxide concentrations below the acceptable limit of 3 mEq/kg.
PreParaTion anD analysis oF Dose ForMulaTionsThe dose formulations were prepared by mixing β-myrcene with corn oil to give the required concentrations (Table I1). Because all dose formulations in these studies were determined to be solutions, no homogeneity studies were required. The dose formulations were stored at room temperature in amber glass bottles sealed with Teflon®-lined lids for up to 37 days.
Stability studies of a 50 mg/mL β-myrcene dose formulation were performed by the analytical chemistry laboratory on lot 09116TQ obtained from Aldrich Chemical Company (Milwaukee, WI). Analyses were performed with a GC-FID Hewlett-Packard (Palo Alto, CA) system that included a Stabilwax® Crossbond® 30 m × 0.25 mm, 0.25-µm film thickness column (Restek), helium carrier gas at a flow rate of 1.5 mL/minute, and an oven temperature program starting at 40° C for 3 minutes and then increased to 220° C at 15° C/minute. Stability was confirmed for at least 37 days for dose formulations stored in amber glass bottles sealed with Teflon®-lined lids at temperatures up to room temperature, and for up to 3 hours under simulated animal room conditions.
Periodic analyses of the dose formulations of β-myrcene were conducted by the study laboratory using GC-FID by the system used for the purity analyses. During the 3-month studies, the dose formulations were analyzed at the beginning, midpoint, and end of the studies; all 13 dose formulations analyzed for rats and all 15 for mice were within 10% of the target concentrations (Table I2). Animal room samples of these dose formulations were also analyzed; all 13 animal room samples for rats and mice were within 10% of the target concentrations. During the 2-year studies, the dose formulations were analyzed approximately every 3 months; animal room samples were also analyzed (Table I3). All 27 dose formulations for rats and mice were within 10% of the target concentrations; all nine animal room samples for rats and mice were within 10% of the target concentrations.
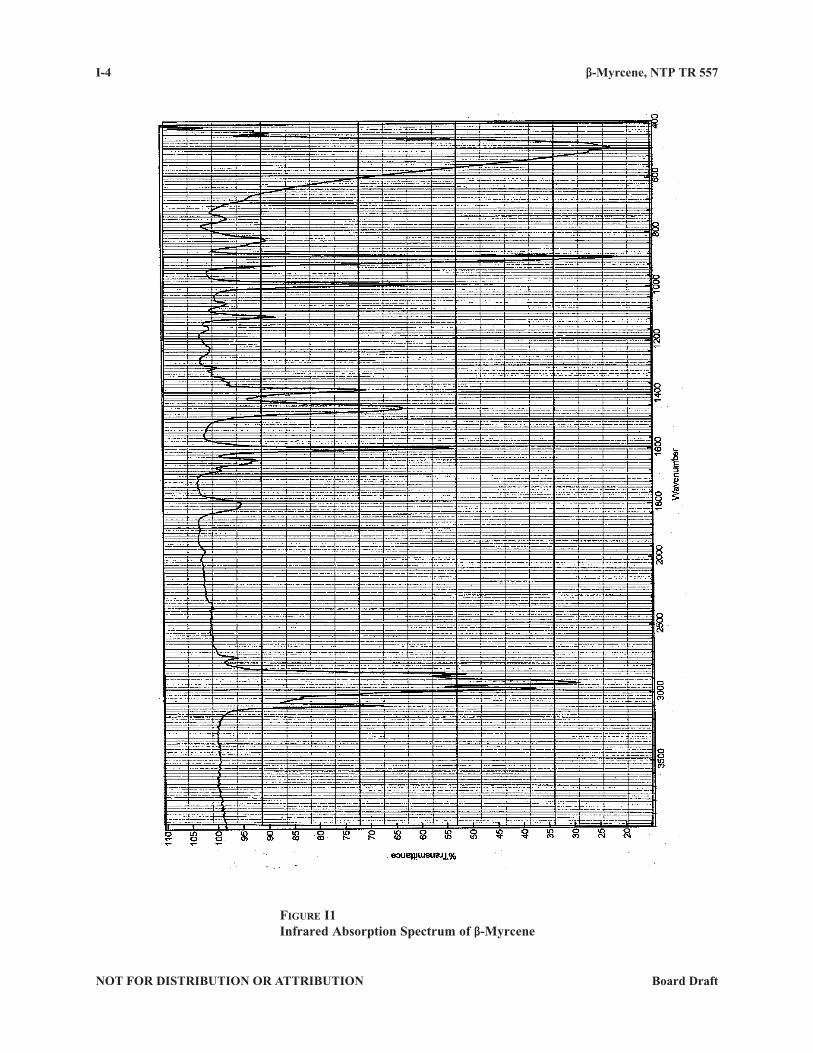
β-Myrcene, NTP TR 557 I-4
NOT FOR DISTRIBUTION OR ATTRIBUTION Board Draft
Figure i1Infrared Absorption Spectrum of β-Myrcene
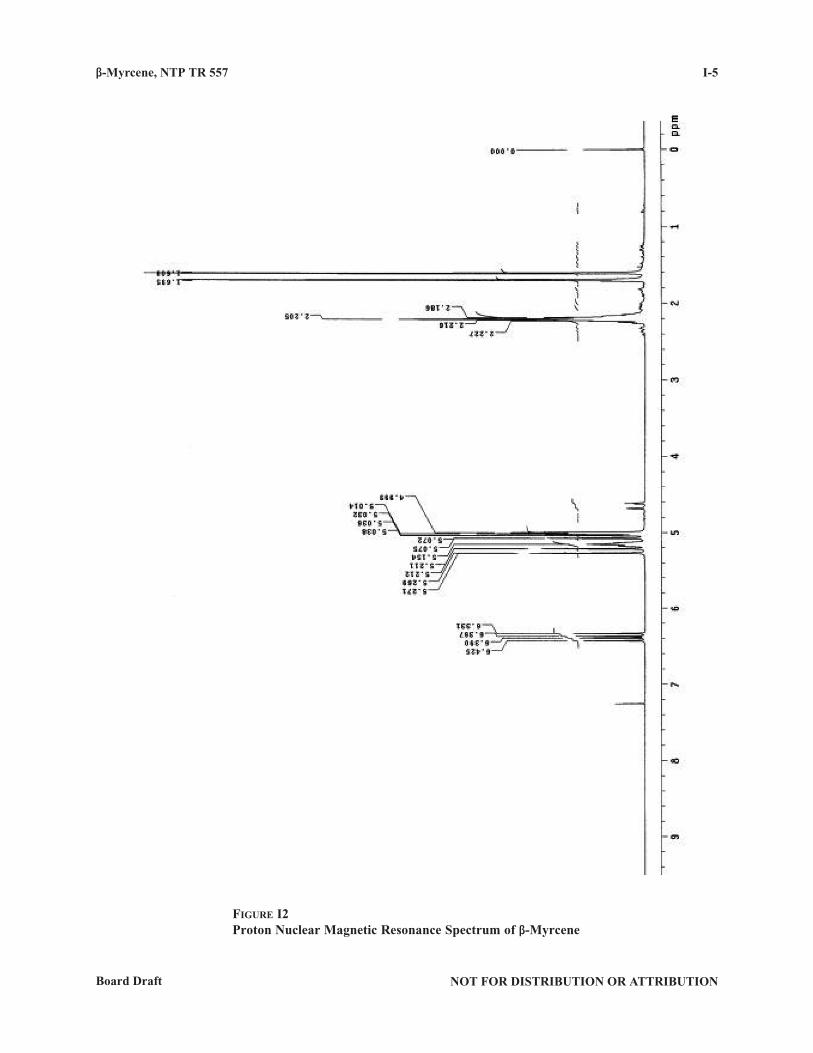
β-Myrcene, NTP TR 557
NOT FOR DISTRIBUTION OR ATTRIBUTIONBoard Draft
I-5
Figure i2Proton Nuclear Magnetic Resonance Spectrum of β-Myrcene
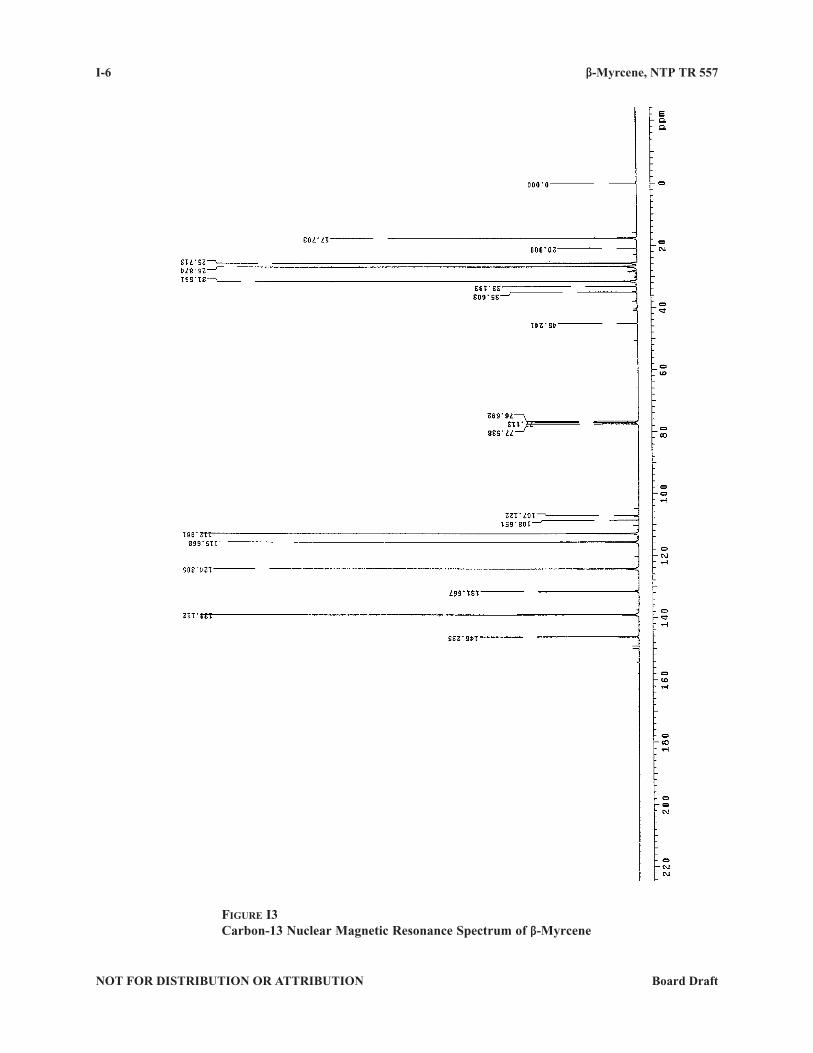
β-Myrcene, NTP TR 557 I-6
NOT FOR DISTRIBUTION OR ATTRIBUTION Board Draft
Figure i3Carbon-13 Nuclear Magnetic Resonance Spectrum of β-Myrcene
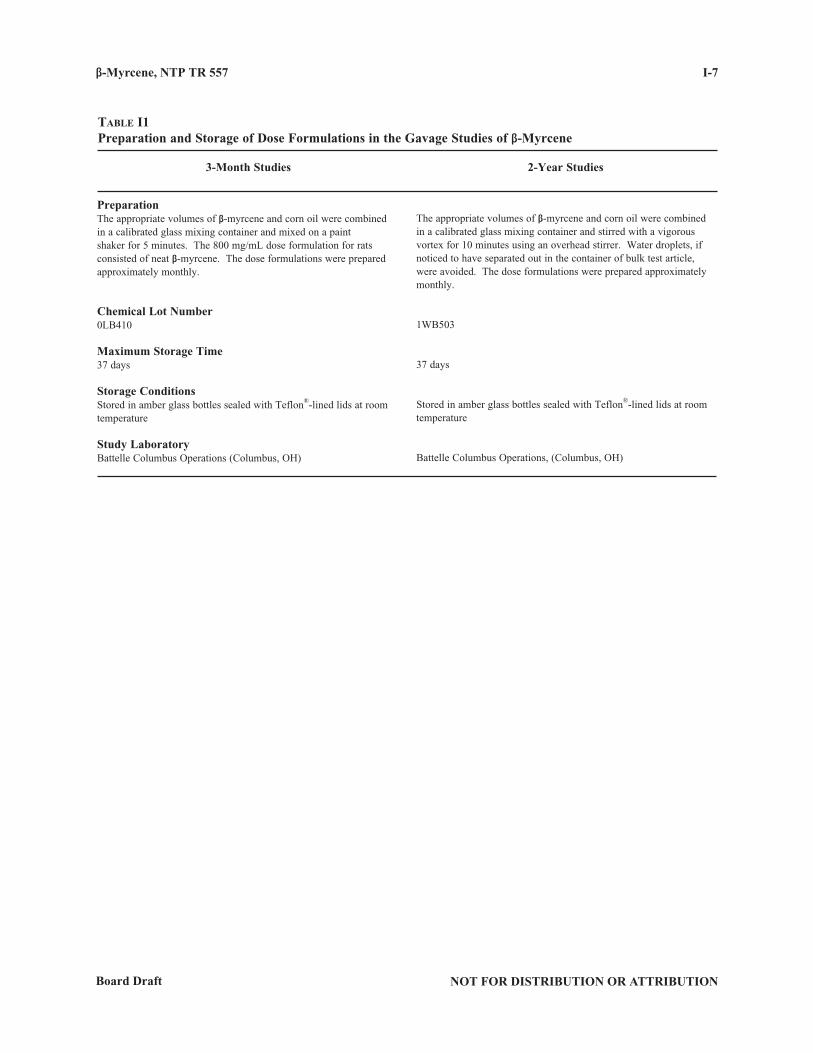
β-Myrcene, NTP TR 557
NOT FOR DISTRIBUTION OR ATTRIBUTIONBoard Draft
I-7
Table i1 Preparation and Storage of Dose Formulations in the Gavage Studies of β-Myrcene
3-Month Studies 2-Year Studies
PreparationThe appropriate volumes of β-myrcene and corn oil were combined in a calibrated glass mixing container and mixed on a paint shaker for 5 minutes. The 800 mg/mL dose formulation for rats consisted of neat β-myrcene. The dose formulations were prepared approximately monthly.
Chemical Lot Number0LB410
Maximum Storage Time37 days
Storage ConditionsStored in amber glass bottles sealed with Teflon®-lined lids at room temperature
Study LaboratoryBattelle Columbus Operations (Columbus, OH)
The appropriate volumes of β-myrcene and corn oil were combined in a calibrated glass mixing container and stirred with a vigorous vortex for 10 minutes using an overhead stirrer. Water droplets, if noticed to have separated out in the container of bulk test article, were avoided. The dose formulations were prepared approximately monthly.
1WB503
37 days
Stored in amber glass bottles sealed with Teflon®-lined lids at room temperature
Battelle Columbus Operations, (Columbus, OH)
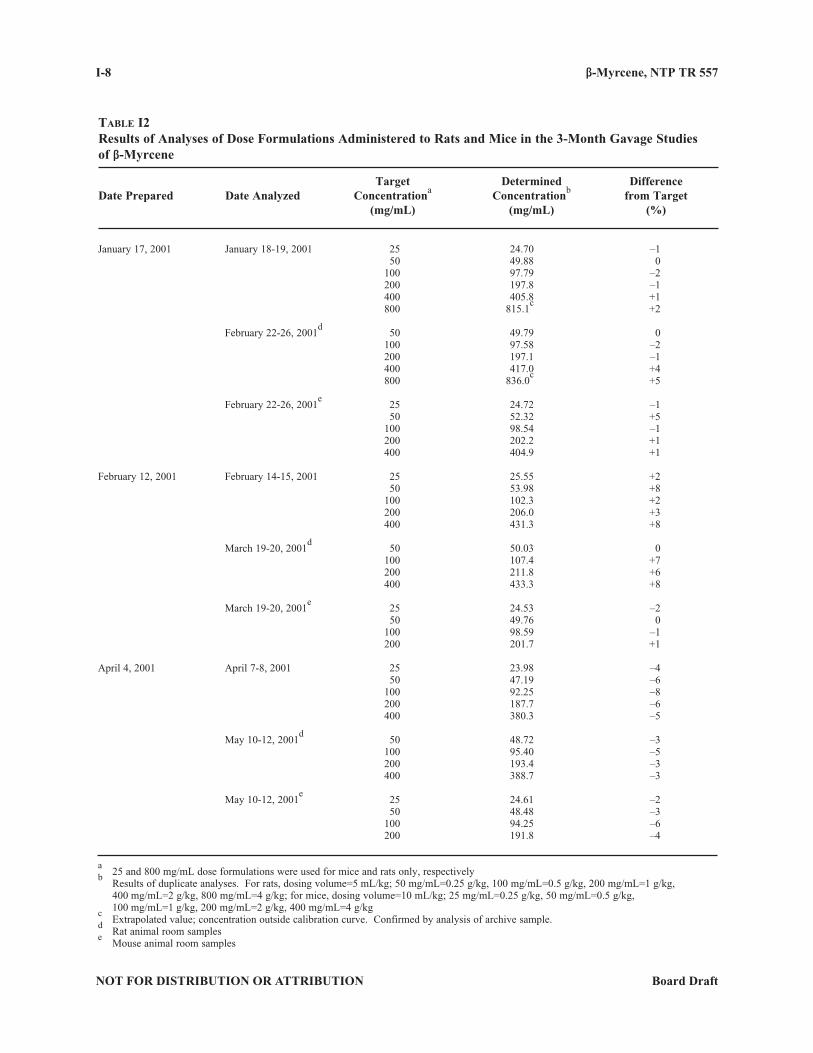
β-Myrcene, NTP TR 557 I-8
NOT FOR DISTRIBUTION OR ATTRIBUTION Board Draft
Table i2 Results of Analyses of Dose Formulations Administered to Rats and Mice in the 3-Month Gavage Studiesof β-Myrcene
Target Determined DifferenceDate Prepared Date Analyzed Concentrationa Concentrationb from Target (mg/mL) (mg/mL) (%)
January 17, 2001 January 18-19, 2001 25 24.70 –1 50 49.88 0 100 97.79 –2 200 197.8 –1 400 405.8 +1 800 815.1
c +2
February 22-26, 2001d 50 49.79 0
100 97.58 –2 200 197.1 –1 400 417.0 +4 800 836.0
c +5
February 22-26, 2001e 25 24.72 –1
50 52.32 +5 100 98.54 –1 200 202.2 +1 400 404.9 +1
February 12, 2001 February 14-15, 2001 25 25.55 +2 50 53.98 +8 100 102.3 +2 200 206.0 +3 400 431.3 +8
March 19-20, 2001d 50 50.03 0
100 107.4 +7 200 211.8 +6 400 433.3 +8
March 19-20, 2001e 25 24.53 –2
50 49.76 0 100 98.59 –1 200 201.7 +1 April 4, 2001 April 7-8, 2001 25 23.98 –4 50 47.19 –6 100 92.25 –8 200 187.7 –6 400 380.3 –5 May 10-12, 2001
d 50 48.72 –3
100 95.40 –5 200 193.4 –3 400 388.7 –3
May 10-12, 2001e 25 24.61 –2
50 48.48 –3 100 94.25 –6 200 191.8 –4
a 25 and 800 mg/mL dose formulations were used for mice and rats only, respectively
b Results of duplicate analyses. For rats, dosing volume=5 mL/kg; 50 mg/mL=0.25 g/kg, 100 mg/mL=0.5 g/kg, 200 mg/mL=1 g/kg,
400 mg/mL=2 g/kg, 800 mg/mL=4 g/kg; for mice, dosing volume=10 mL/kg; 25 mg/mL=0.25 g/kg, 50 mg/mL=0.5 g/kg, 100 mg/mL=1 g/kg, 200 mg/mL=2 g/kg, 400 mg/mL=4 g/kgc Extrapolated value; concentration outside calibration curve. Confirmed by analysis of archive sample.
d Rat animal room samples
e Mouse animal room samples
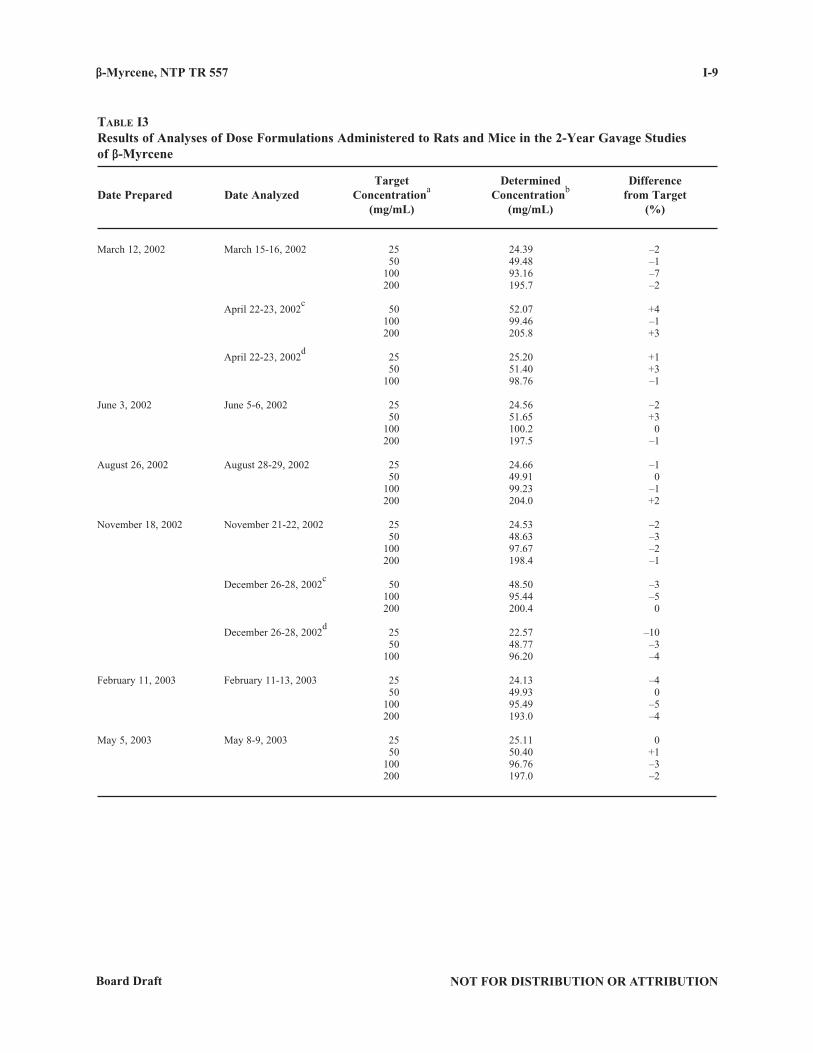
β-Myrcene, NTP TR 557
NOT FOR DISTRIBUTION OR ATTRIBUTIONBoard Draft
I-9
Table i3 Results of Analyses of Dose Formulations Administered to Rats and Mice in the 2-Year Gavage Studiesof β-Myrcene
Target Determined DifferenceDate Prepared Date Analyzed Concentrationa Concentrationb from Target (mg/mL) (mg/mL) (%)
March 12, 2002 March 15-16, 2002 25 24.39 –2 50 49.48 –1 100 93.16 –7 200 195.7 –2
April 22-23, 2002c 50 52.07 +4
100 99.46 –1 200 205.8 +3
April 22-23, 2002d 25 25.20 +1
50 51.40 +3 100 98.76 –1
June 3, 2002 June 5-6, 2002 25 24.56 –2 50 51.65 +3 100 100.2 0 200 197.5 –1
August 26, 2002 August 28-29, 2002 25 24.66 –1 50 49.91 0 100 99.23 –1 200 204.0 +2
November 18, 2002 November 21-22, 2002 25 24.53 –2 50 48.63 –3 100 97.67 –2 200 198.4 –1
December 26-28, 2002c 50 48.50 –3
100 95.44 –5 200 200.4 0
December 26-28, 2002d 25 22.57 –10
50 48.77 –3 100 96.20 –4
February 11, 2003 February 11-13, 2003 25 24.13 –4 50 49.93 0 100 95.49 –5 200 193.0 –4
May 5, 2003 May 8-9, 2003 25 25.11 0 50 50.40 +1 100 96.76 –3 200 197.0 –2
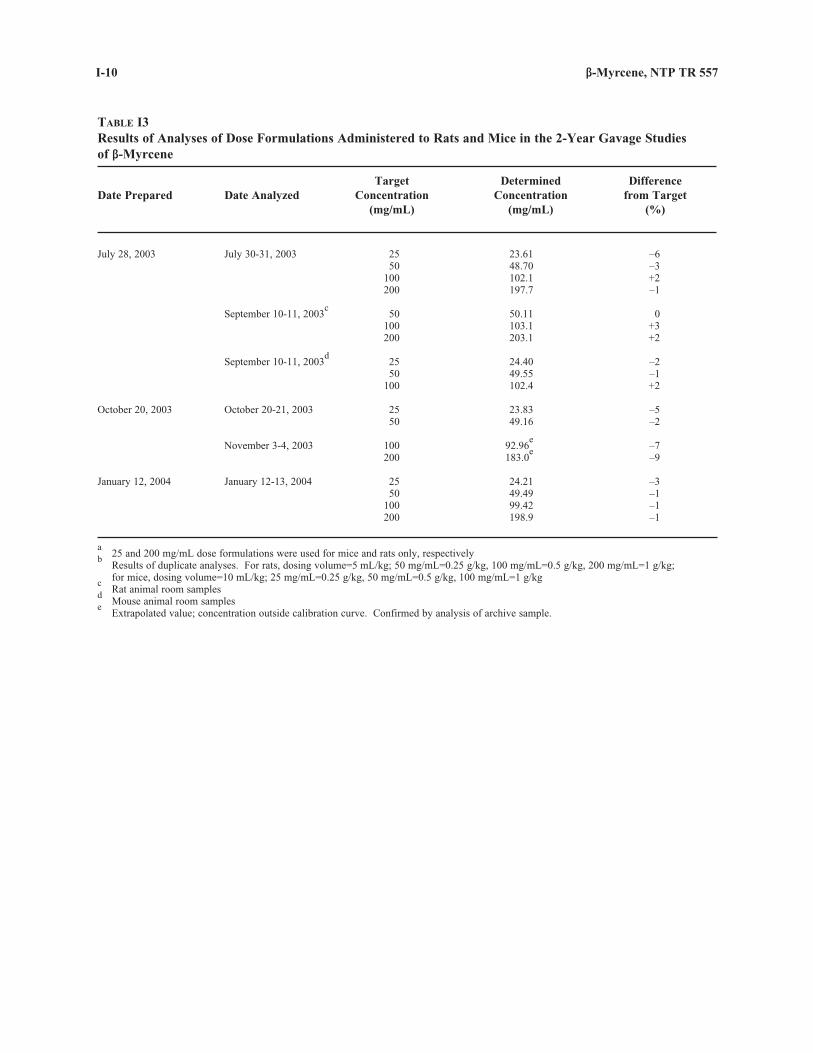
β-Myrcene, NTP TR 557 I-10
NOT FOR DISTRIBUTION OR ATTRIBUTION Board Draft
Table i3 Results of Analyses of Dose Formulations Administered to Rats and Mice in the 2-Year Gavage Studiesof β-Myrcene
Target Determined DifferenceDate Prepared Date Analyzed Concentration Concentration from Target (mg/mL) (mg/mL) (%)
July 28, 2003 July 30-31, 2003 25 23.61 –6 50 48.70 –3 100 102.1 +2 200 197.7 –1
September 10-11, 2003c 50 50.11 0
100 103.1 +3 200 203.1 +2
September 10-11, 2003d 25 24.40 –2
50 49.55 –1 100 102.4 +2
October 20, 2003 October 20-21, 2003 25 23.83 –5 50 49.16 –2
November 3-4, 2003 100 92.96e –7
200 183.0e –9
January 12, 2004 January 12-13, 2004 25 24.21 –3 50 49.49 –1 100 99.42 –1 200 198.9 –1
a 25 and 200 mg/mL dose formulations were used for mice and rats only, respectively
b Results of duplicate analyses. For rats, dosing volume=5 mL/kg; 50 mg/mL=0.25 g/kg, 100 mg/mL=0.5 g/kg, 200 mg/mL=1 g/kg;
for mice, dosing volume=10 mL/kg; 25 mg/mL=0.25 g/kg, 50 mg/mL=0.5 g/kg, 100 mg/mL=1 g/kgc Rat animal room samples
d Mouse animal room samples
e Extrapolated value; concentration outside calibration curve. Confirmed by analysis of archive sample.
NOT FOR DISTRIBUTION OR ATTRIBUTIONBoard Draft
J-1
APPENDIX JINGREDIENTS, NUTRIENT COMPOSITION,
AND CONTAMINANT LEVELSIN NTP-2000 RAT AND MOUSE RATION
Table J1 Ingredients of NTP-2000 Rat and Mouse Ration . . . . . . . . . . . . . . . . . . . . . . . . . . . . . . . . . . . J-2Table J2 Vitamins and Minerals in NTP-2000 Rat and Mouse Ration . . . . . . . . . . . . . . . . . . . . . . . . . J-2Table J3 Nutrient Composition of NTP-2000 Rat and Mouse Ration . . . . . . . . . . . . . . . . . . . . . . . . . . J-3Table J4 Contaminant Levels in NTP-2000 Rat and Mouse Ration . . . . . . . . . . . . . . . . . . . . . . . . . . . J-4
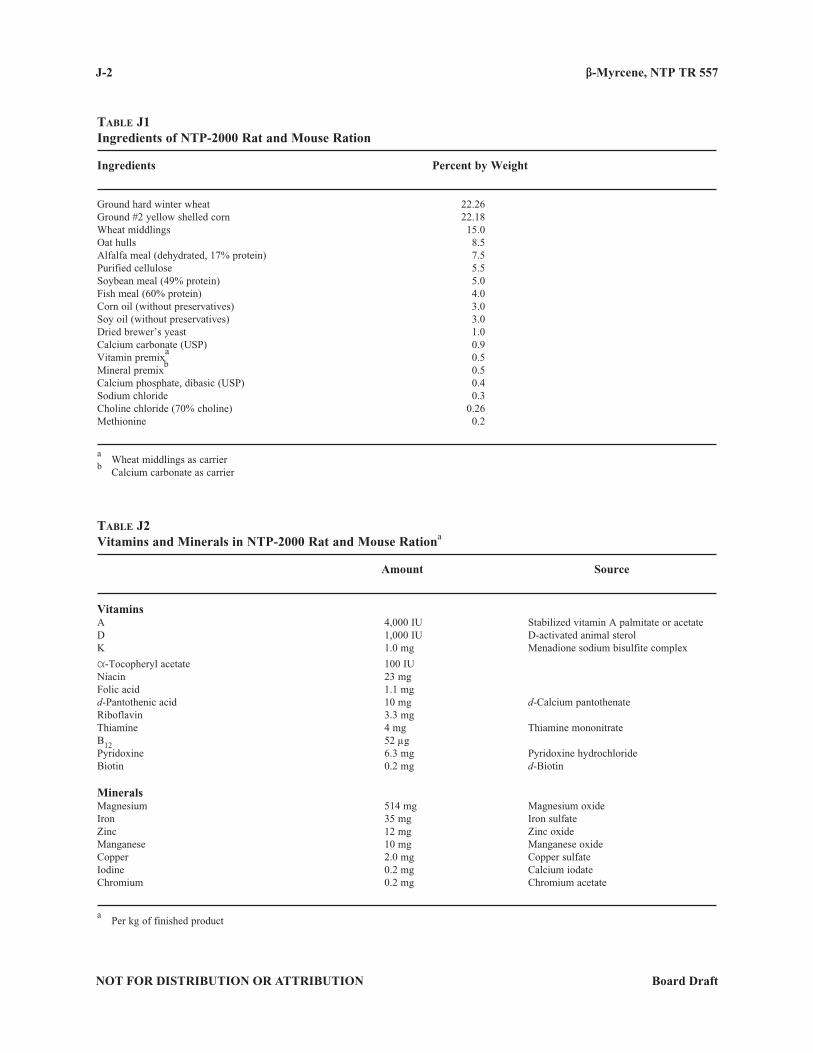
β-Myrcene, NTP TR 557 J-2
NOT FOR DISTRIBUTION OR ATTRIBUTION Board Draft
Table J1Ingredients of NTP-2000 Rat and Mouse Ration
Ingredients Percent by Weight
Ground hard winter wheat 22.26Ground #2 yellow shelled corn 22.18Wheat middlings 15.0Oat hulls 8.5Alfalfa meal (dehydrated, 17% protein) 7.5Purified cellulose 5.5Soybean meal (49% protein) 5.0Fish meal (60% protein) 4.0Corn oil (without preservatives) 3.0Soy oil (without preservatives) 3.0Dried brewer’s yeast 1.0Calcium carbonate (USP) 0.9Vitamin premix
a 0.5
Mineral premixb 0.5
Calcium phosphate, dibasic (USP) 0.4Sodium chloride 0.3Choline chloride (70% choline) 0.26Methionine 0.2
a Wheat middlings as carrier
b Calcium carbonate as carrier
Table J2Vitamins and Minerals in NTP-2000 Rat and Mouse Rationa
Amount Source
VitaminsA 4,000 IU Stabilized vitamin A palmitate or acetateD 1,000 IU D-activated animal sterolK 1.0 mg Menadione sodium bisulfite complex
"-Tocopheryl acetate 100 IUNiacin 23 mgFolic acid 1.1 mgd-Pantothenic acid 10 mg d-Calcium pantothenateRiboflavin 3.3 mgThiamine 4 mg Thiamine mononitrateB12 52 µg Pyridoxine 6.3 mg Pyridoxine hydrochlorideBiotin 0.2 mg d-Biotin
MineralsMagnesium 514 mg Magnesium oxideIron 35 mg Iron sulfateZinc 12 mg Zinc oxideManganese 10 mg Manganese oxideCopper 2.0 mg Copper sulfateIodine 0.2 mg Calcium iodateChromium 0.2 mg Chromium acetate
a Per kg of finished product
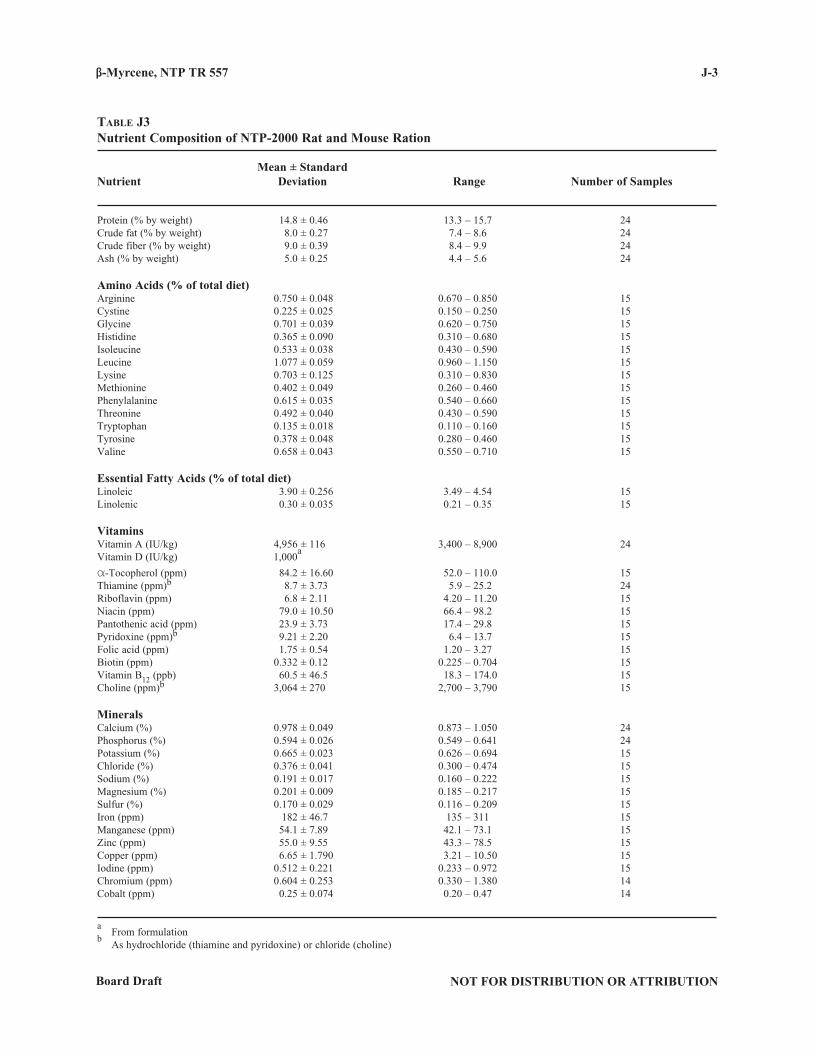
β-Myrcene, NTP TR 557
NOT FOR DISTRIBUTION OR ATTRIBUTIONBoard Draft
J-3
Table J3Nutrient Composition of NTP-2000 Rat and Mouse Ration
Mean ± StandardNutrient Deviation Range Number of Samples
Protein (% by weight) 14.8 ± 0.46 13.3 – 15.7 24Crude fat (% by weight) 8.0 ± 0.27 7.4 – 8.6 24Crude fiber (% by weight) 9.0 ± 0.39 8.4 – 9.9 24Ash (% by weight) 5.0 ± 0.25 4.4 – 5.6 24
Amino Acids (% of total diet)Arginine 0.750 ± 0.048 0.670 – 0.850 15Cystine 0.225 ± 0.025 0.150 – 0.250 15Glycine 0.701 ± 0.039 0.620 – 0.750 15Histidine 0.365 ± 0.090 0.310 – 0.680 15Isoleucine 0.533 ± 0.038 0.430 – 0.590 15Leucine 1.077 ± 0.059 0.960 – 1.150 15Lysine 0.703 ± 0.125 0.310 – 0.830 15Methionine 0.402 ± 0.049 0.260 – 0.460 15Phenylalanine 0.615 ± 0.035 0.540 – 0.660 15Threonine 0.492 ± 0.040 0.430 – 0.590 15Tryptophan 0.135 ± 0.018 0.110 – 0.160 15Tyrosine 0.378 ± 0.048 0.280 – 0.460 15Valine 0.658 ± 0.043 0.550 – 0.710 15
Essential Fatty Acids (% of total diet)Linoleic 3.90 ± 0.256 3.49 – 4.54 15Linolenic 0.30 ± 0.035 0.21 – 0.35 15
VitaminsVitamin A (IU/kg) 4,956 ± 116 3,400 – 8,900 24Vitamin D (IU/kg) 1,000
a
"-Tocopherol (ppm) 84.2 ± 16.60 52.0 – 110.0 15Thiamine (ppm)b 8.7 ± 3.73 5.9 – 25.2 24Riboflavin (ppm) 6.8 ± 2.11 4.20 – 11.20 15Niacin (ppm) 79.0 ± 10.50 66.4 – 98.2 15Pantothenic acid (ppm) 23.9 ± 3.73 17.4 – 29.8 15Pyridoxine (ppm)b 9.21 ± 2.20 6.4 – 13.7 15Folic acid (ppm) 1.75 ± 0.54 1.20 – 3.27 15Biotin (ppm) 0.332 ± 0.12 0.225 – 0.704 15Vitamin B12 (ppb) 60.5 ± 46.5 18.3 – 174.0 15Choline (ppm)b 3,064 ± 270 2,700 – 3,790 15
MineralsCalcium (%) 0.978 ± 0.049 0.873 – 1.050 24Phosphorus (%) 0.594 ± 0.026 0.549 – 0.641 24Potassium (%) 0.665 ± 0.023 0.626 – 0.694 15Chloride (%) 0.376 ± 0.041 0.300 – 0.474 15Sodium (%) 0.191 ± 0.017 0.160 – 0.222 15Magnesium (%) 0.201 ± 0.009 0.185 – 0.217 15Sulfur (%) 0.170 ± 0.029 0.116 – 0.209 15Iron (ppm) 182 ± 46.7 135 – 311 15Manganese (ppm) 54.1 ± 7.89 42.1 – 73.1 15Zinc (ppm) 55.0 ± 9.55 43.3 – 78.5 15Copper (ppm) 6.65 ± 1.790 3.21 – 10.50 15Iodine (ppm) 0.512 ± 0.221 0.233 – 0.972 15Chromium (ppm) 0.604 ± 0.253 0.330 – 1.380 14Cobalt (ppm) 0.25 ± 0.074 0.20 – 0.47 14
a From formulation
b As hydrochloride (thiamine and pyridoxine) or chloride (choline)
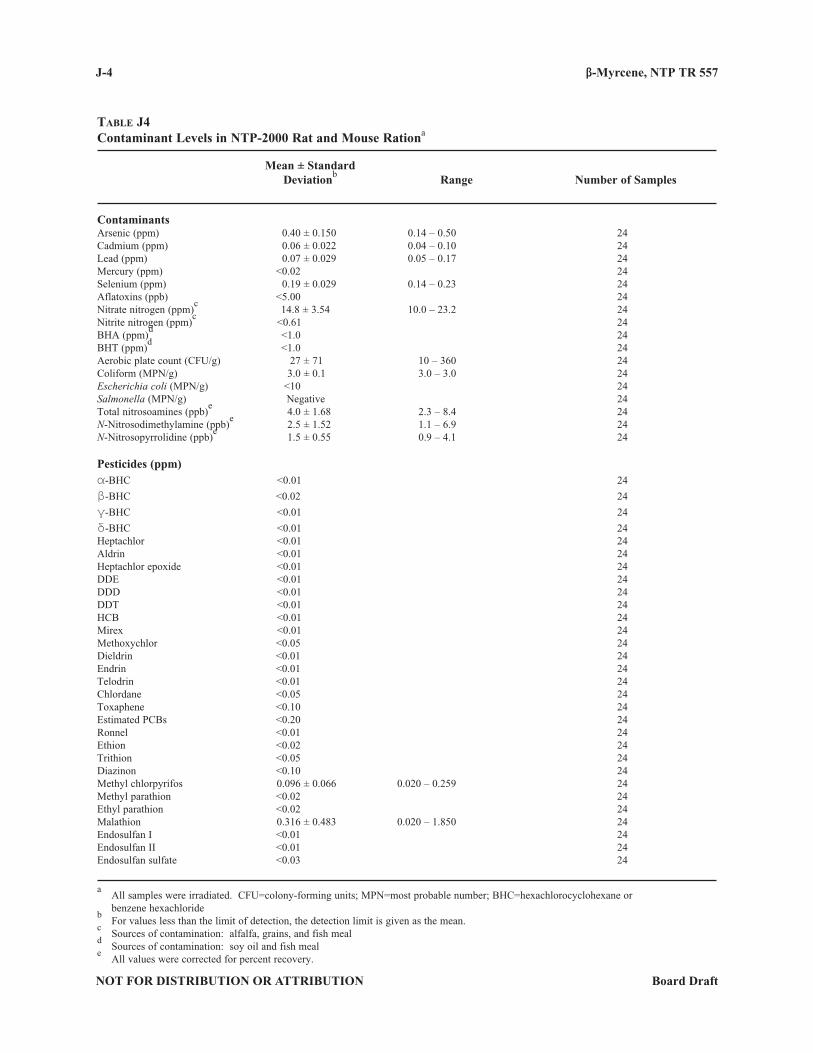
β-Myrcene, NTP TR 557 J-4
NOT FOR DISTRIBUTION OR ATTRIBUTION Board Draft
Table J4Contaminant Levels in NTP-2000 Rat and Mouse Rationa
Mean ± Standard Deviationb Range Number of Samples
ContaminantsArsenic (ppm) 0.40 ± 0.150 0.14 – 0.50 24Cadmium (ppm) 0.06 ± 0.022 0.04 – 0.10 24Lead (ppm) 0.07 ± 0.029 0.05 – 0.17 24Mercury (ppm) <0.02 24Selenium (ppm) 0.19 ± 0.029 0.14 – 0.23 24Aflatoxins (ppb) <5.00 24Nitrate nitrogen (ppm)
c 14.8 ± 3.54 10.0 – 23.2 24
Nitrite nitrogen (ppm)c <0.61 24
BHA (ppm)d <1.0 24
BHT (ppm)d <1.0 24
Aerobic plate count (CFU/g) 27 ± 71 10 – 360 24Coliform (MPN/g) 3.0 ± 0.1 3.0 – 3.0 24Escherichia coli (MPN/g) <10 24Salmonella (MPN/g) Negative 24Total nitrosoamines (ppb)
e 4.0 ± 1.68 2.3 – 8.4 24
N-Nitrosodimethylamine (ppb)e 2.5 ± 1.52 1.1 – 6.9 24
N-Nitrosopyrrolidine (ppb)e 1.5 ± 0.55 0.9 – 4.1 24
Pesticides (ppm)"-BHC <0.01 24
$-BHC <0.02 24
(-BHC <0.01 24
*-BHC <0.01 24Heptachlor <0.01 24Aldrin <0.01 24Heptachlor epoxide <0.01 24DDE <0.01 24DDD <0.01 24DDT <0.01 24HCB <0.01 24Mirex <0.01 24Methoxychlor <0.05 24Dieldrin <0.01 24Endrin <0.01 24Telodrin <0.01 24Chlordane <0.05 24Toxaphene <0.10 24Estimated PCBs <0.20 24Ronnel <0.01 24Ethion <0.02 24Trithion <0.05 24Diazinon <0.10 24Methyl chlorpyrifos 0.096 ± 0.066 0.020 – 0.259 24Methyl parathion <0.02 24Ethyl parathion <0.02 24Malathion 0.316 ± 0.483 0.020 – 1.850 24Endosulfan I <0.01 24Endosulfan II <0.01 24Endosulfan sulfate <0.03 24
a All samples were irradiated. CFU=colony-forming units; MPN=most probable number; BHC=hexachlorocyclohexane or
benzene hexachlorideb For values less than the limit of detection, the detection limit is given as the mean.
c Sources of contamination: alfalfa, grains, and fish meal
d Sources of contamination: soy oil and fish meal
e All values were corrected for percent recovery.
NOT FOR DISTRIBUTION OR ATTRIBUTIONBoard Draft
K-1
APPENDIX KSENTINEL ANIMAL PROGRAM
MeThoDs . . . . . . . . . . . . . . . . . . . . . . . . . . . . . . . . . . . . . . . . . . . . . . . . . . . . . . . . . . . . . . . . . . . . . . . . . . . . . . . K-2resulTs . . . . . . . . . . . . . . . . . . . . . . . . . . . . . . . . . . . . . . . . . . . . . . . . . . . . . . . . . . . . . . . . . . . . . . . . . . . . . . . . K-3
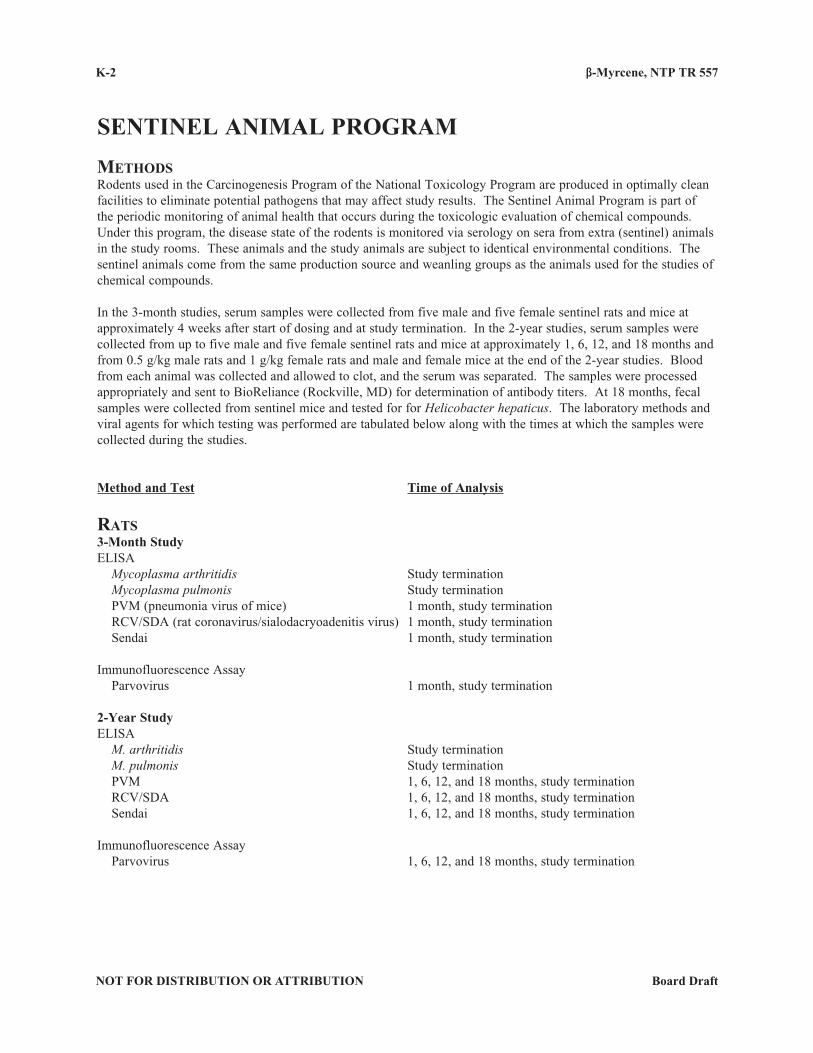
β-Myrcene, NTP TR 557 K-2
NOT FOR DISTRIBUTION OR ATTRIBUTION Board Draft
SENTINEL ANIMAL PROGRAM
MeThoDsRodents used in the Carcinogenesis Program of the National Toxicology Program are produced in optimally clean facilities to eliminate potential pathogens that may affect study results. The Sentinel Animal Program is part of the periodic monitoring of animal health that occurs during the toxicologic evaluation of chemical compounds. Under this program, the disease state of the rodents is monitored via serology on sera from extra (sentinel) animals in the study rooms. These animals and the study animals are subject to identical environmental conditions. The sentinel animals come from the same production source and weanling groups as the animals used for the studies of chemical compounds.
In the 3-month studies, serum samples were collected from five male and five female sentinel rats and mice at approximately 4 weeks after start of dosing and at study termination. In the 2-year studies, serum samples were collected from up to five male and five female sentinel rats and mice at approximately 1, 6, 12, and 18 months and from 0.5 g/kg male rats and 1 g/kg female rats and male and female mice at the end of the 2-year studies. Blood from each animal was collected and allowed to clot, and the serum was separated. The samples were processed appropriately and sent to BioReliance (Rockville, MD) for determination of antibody titers. At 18 months, fecal samples were collected from sentinel mice and tested for for Helicobacter hepaticus. The laboratory methods and viral agents for which testing was performed are tabulated below along with the times at which the samples were collected during the studies.
Method and Test Time of Analysis
raTs3-Month StudyELISA Mycoplasma arthritidis Study termination
Mycoplasma pulmonis Study termination PVM (pneumonia virus of mice) 1 month, study termination RCV/SDA (rat coronavirus/sialodacryoadenitis virus) 1 month, study termination
Sendai 1 month, study termination
Immunofluorescence Assay Parvovirus 1 month, study termination
2-Year StudyELISA M. arthritidis Study termination
M. pulmonis Study termination PVM 1, 6, 12, and 18 months, study termination RCV/SDA 1, 6, 12, and 18 months, study termination
Sendai 1, 6, 12, and 18 months, study termination
Immunofluorescence Assay Parvovirus 1, 6, 12, and 18 months, study termination
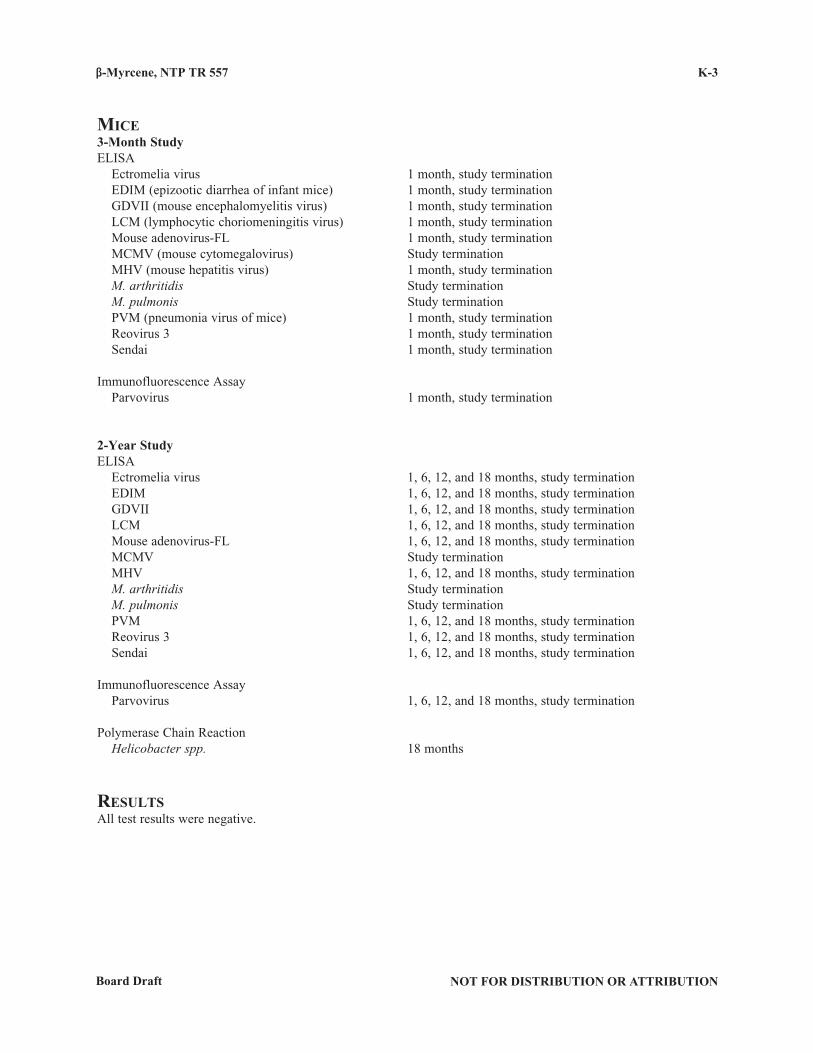
β-Myrcene, NTP TR 557
NOT FOR DISTRIBUTION OR ATTRIBUTIONBoard Draft
K-3
MiCe3-Month StudyELISA Ectromelia virus 1 month, study termination EDIM (epizootic diarrhea of infant mice) 1 month, study termination GDVII (mouse encephalomyelitis virus) 1 month, study termination LCM (lymphocytic choriomeningitis virus) 1 month, study termination Mouse adenovirus-FL 1 month, study termination MCMV (mouse cytomegalovirus) Study termination MHV (mouse hepatitis virus) 1 month, study termination M. arthritidis Study termination
M. pulmonis Study termination PVM (pneumonia virus of mice) 1 month, study termination Reovirus 3 1 month, study termination
Sendai 1 month, study termination
Immunofluorescence Assay Parvovirus 1 month, study termination
2-Year StudyELISA Ectromelia virus 1, 6, 12, and 18 months, study termination EDIM 1, 6, 12, and 18 months, study termination GDVII 1, 6, 12, and 18 months, study termination LCM 1, 6, 12, and 18 months, study termination Mouse adenovirus-FL 1, 6, 12, and 18 months, study termination MCMV Study termination MHV 1, 6, 12, and 18 months, study termination M. arthritidis Study termination
M. pulmonis Study termination PVM 1, 6, 12, and 18 months, study termination Reovirus 3 1, 6, 12, and 18 months, study termination
Sendai 1, 6, 12, and 18 months, study termination
Immunofluorescence Assay Parvovirus 1, 6, 12, and 18 months, study termination
Polymerase Chain Reaction Helicobacter spp. 18 months
resulTsAll test results were negative.

β-Myrcene, NTP TR 557 K-4
NOT FOR DISTRIBUTION OR ATTRIBUTION Board Draft