betsy lee, rn, bsn, msph inahq spring conference may 9, 2014 making indiana the safest state: the...
TRANSCRIPT
BETSY LEE, RN, BSN, MSPHINAHQ SPRING CONFERENCE
MAY 9 , 2014
Making Indiana the Safest State: The Challenge and
the Opportunity
Conflicts of Interest Disclosures
The speaker has nothing to disclose.

Session Objectives
Discuss the status of statewide patient safety improvement in Indiana compared to national benchmarks
Evaluate potential impact of the Partnership for Patients initiative on patient safety at the local level
Outline leadership strategies for engaging front line staff in addressing harm across the board

Indiana’s Bold Aim
To make Indiana the safest place to receive health care in the United States, if not the world
4
Inaugural Indiana Patient Safety Summit - March 2010
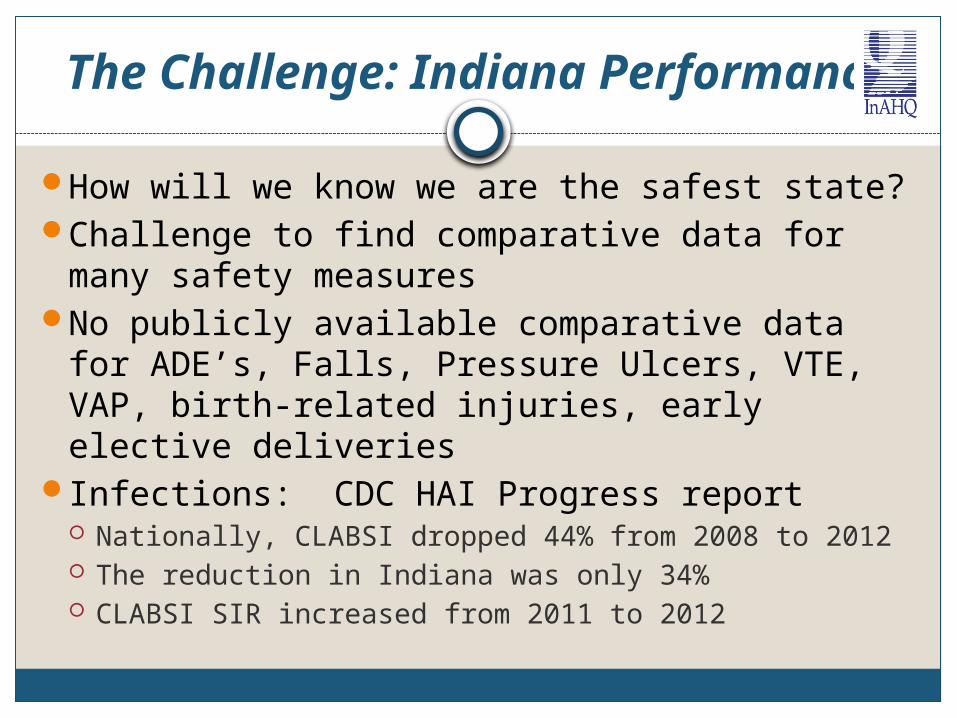
The Challenge: Indiana Performance
How will we know we are the safest state?Challenge to find comparative data for many
safety measuresNo publicly available comparative data for
ADE’s, Falls, Pressure Ulcers, VTE, VAP, birth-related injuries, early elective deliveries
Infections: CDC HAI Progress report Nationally, CLABSI dropped 44% from 2008 to 2012 The reduction in Indiana was only 34% CLABSI SIR increased from 2011 to 2012
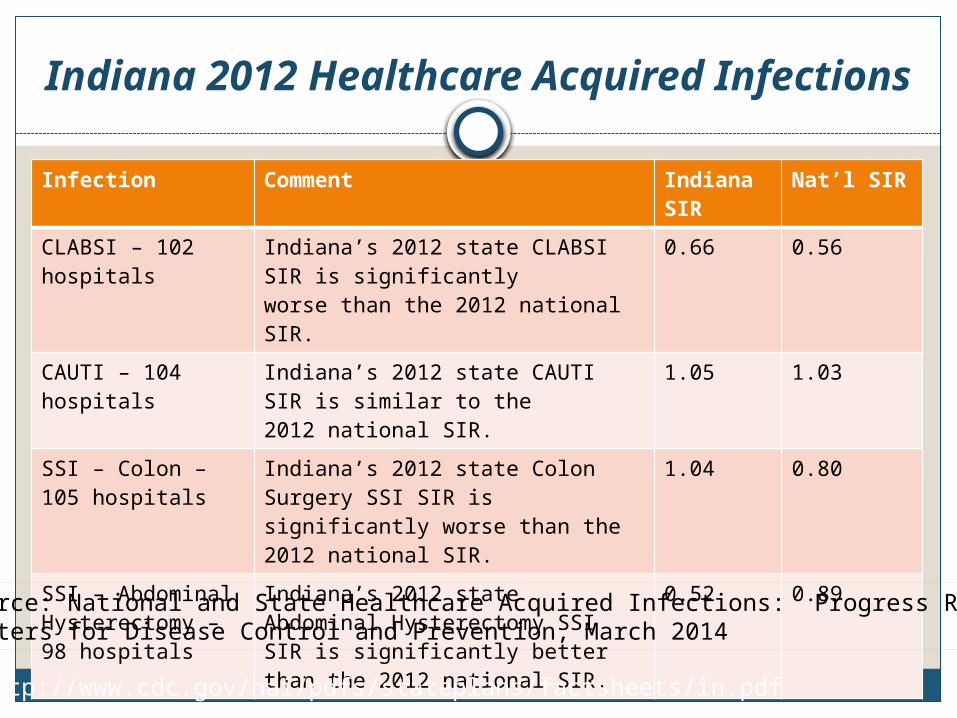
Indiana 2012 Healthcare Acquired Infections
Infection Comment Indiana SIR
Nat’l SIR
CLABSI – 102 hospitals
Indiana’s 2012 state CLABSI SIR is significantly worse than the 2012 national SIR.
0.66 0.56
CAUTI – 104 hospitals
Indiana’s 2012 state CAUTI SIR is similar to the 2012 national SIR.
1.05 1.03
SSI – Colon – 105 hospitals
Indiana’s 2012 state Colon Surgery SSI SIR is significantly worse than the 2012 national SIR.
1.04 0.80
SSI – Abdominal Hysterectomy – 98 hospitals
Indiana’s 2012 state Abdominal Hysterectomy SSI SIR is significantly better than the 2012 national SIR.
0.52 0.89
http://www.cdc.gov/hai/pdfs/stateplans/factsheets/in.pdf
Source: National and State Healthcare Acquired Infections: Progress ReportCenters for Disease Control and Prevention, March 2014
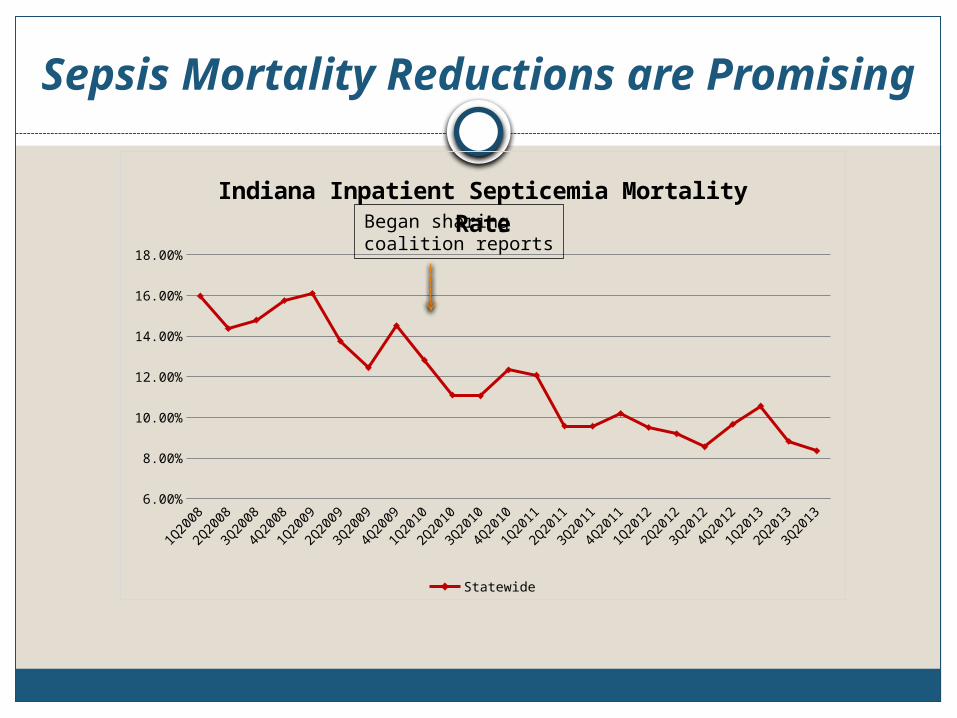
Sepsis Mortality Reductions are Promising
1Q20
08
2Q20
08
3Q20
08
4Q20
08
1Q20
09
2Q20
09
3Q20
09
4Q20
09
1Q20
10
2Q20
10
3Q20
10
4Q20
10
1Q20
11
2Q20
11
3Q20
11
4Q20
11
1Q20
12
2Q20
12
3Q20
12
4Q20
12
1Q20
13
2Q20
13
3Q20
136.00%
8.00%
10.00%
12.00%
14.00%
16.00%
18.00%
Indiana Inpatient Septicemia Mortality Rate
Statewide
Began sharing coalition reports
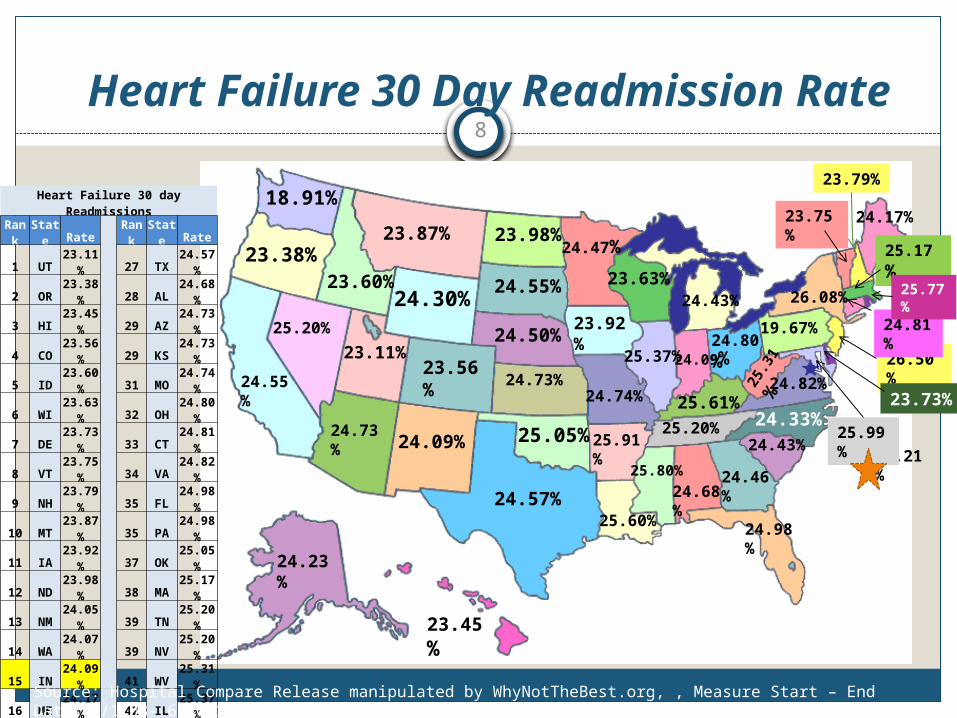
Heart Failure 30 Day Readmission Rate8
24.68%
24.23%
24.73%
25.91%
24.55%
23.56%
26.50%
24.81%
24.98%
24.46%
26.21%
23.45%
23.60%
25.20%
23.38%
18.91%
23.87%
24.30%
23.98%
24.55%
24.50%
24.73%
25.05%
24.57%
23.11%
24.09%
24.47%
23.92%
24.74%
23.63%
24.17%
26.08%
23.75%
23.79%
25.17%
23.73%
19.67%24.80%
25.3
1%
24.82%
25.99%
24.09%25.37%
25.61%25.20% 24.33%
24.43%
25.60%
25.80%
24.43%25.77%
Heart Failure 30 day ReadmissionsRank State Rate Rank State Rate
1 UT 23.11% 27 TX 24.57%2 OR 23.38% 28 AL 24.68%3 HI 23.45% 29 AZ 24.73%4 CO 23.56% 29 KS 24.73%5 ID 23.60% 31 MO 24.74%6 WI 23.63% 32 OH 24.80%7 DE 23.73% 33 CT 24.81%8 VT 23.75% 34 VA 24.82%9 NH 23.79% 35 FL 24.98%
10 MT 23.87% 35 PA 24.98%11 IA 23.92% 37 OK 25.05%12 ND 23.98% 38 MA 25.17%13 NM 24.05% 39 TN 25.20%14 WA 24.07% 39 NV 25.20%15 IN 24.09% 41 WV 25.31%16 ME 24.17% 42 IL 25.37%17 AK 24.23% 43 LA 25.60%18 WY 24.30% 44 KY 25.61%19 NC 24.33% 45 RI 25.77%20 SC 24.43% 46 MS 25.80%20 MI 24.43% 47 AR 25.91%22 GA 24.46% 48 MD 25.99%23 MN 24.47% 49 NY 26.08%24 NE 24.50% 50 DC 26.21%25 SD 24.55% 51 NJ 26.50%25 CA 24.55%
Source: Hospital Compare Release manipulated by WhyNotTheBest.org, , Measure Start – End Dates:7/1/08- 6/30/11
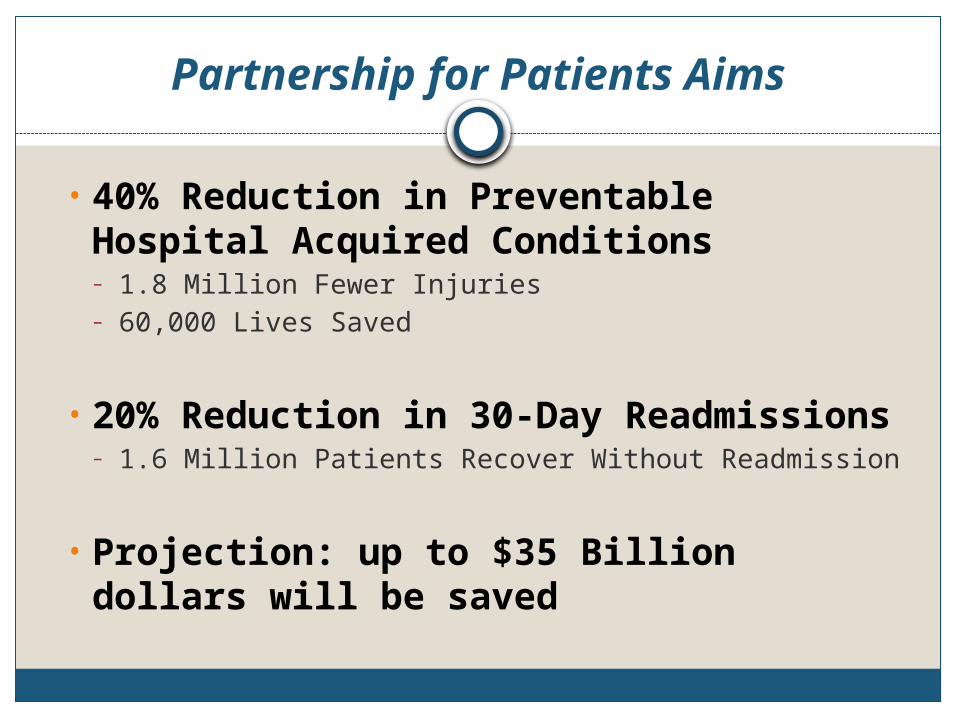
Partnership for Patients Aims
• 40% Reduction in Preventable Hospital Acquired Conditions – 1.8 Million Fewer Injuries – 60,000 Lives Saved
• 20% Reduction in 30-Day Readmissions – 1.6 Million Patients Recover Without Readmission
• Projection: up to $35 Billion dollars will be saved

Impact of Partnership for Patients
Large scale funded national initiative
Aims aligned with Indiana priorities
Takes statewide and regional improvement efforts to scale
Encourages local adaptation with the discipline of organized effort and measurement
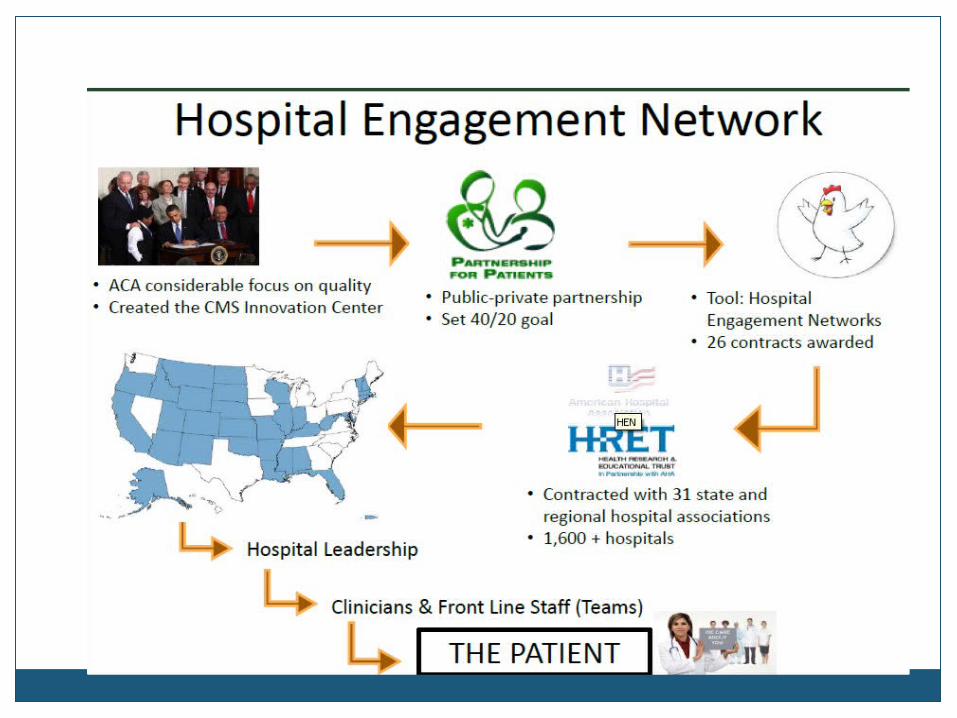
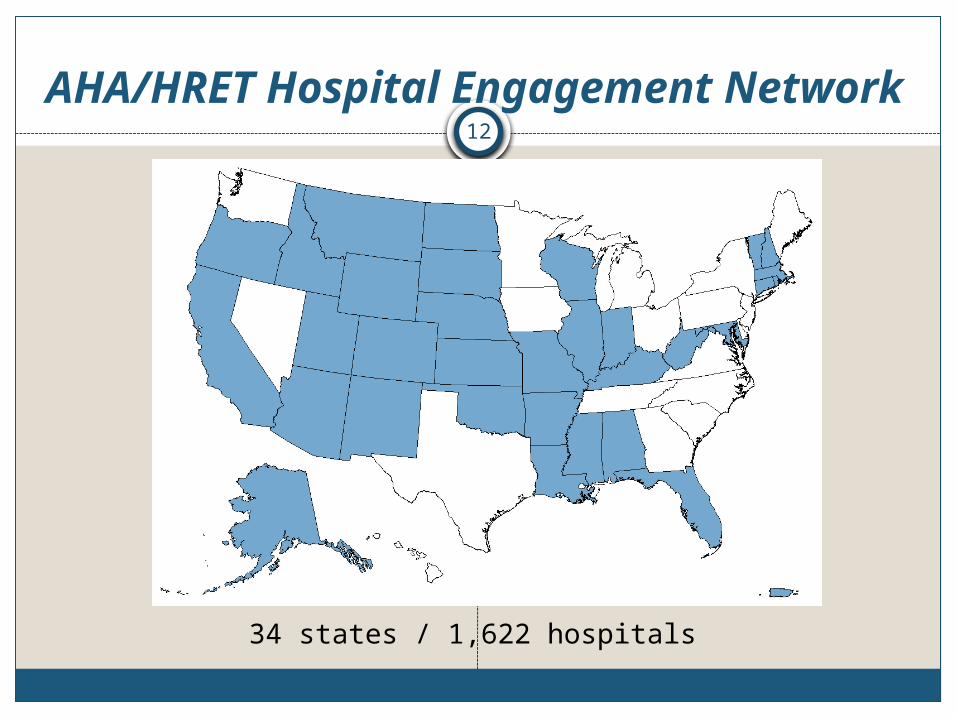
AHA/HRET Hospital Engagement Network
34 states / 1,622 hospitals
12

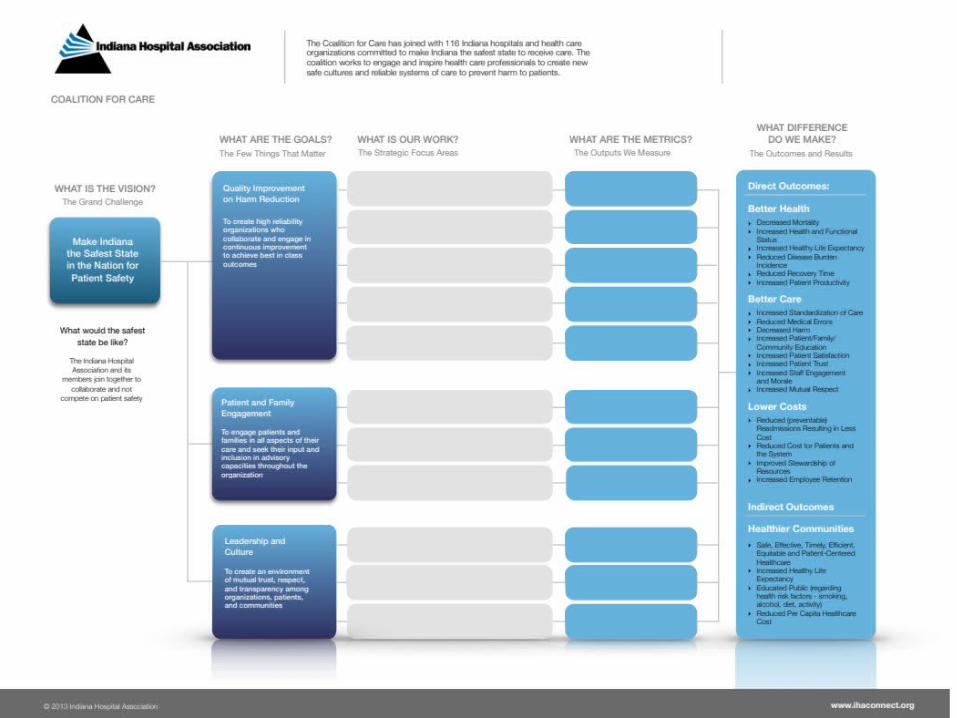
Coalition for Care

Partnership for Patients
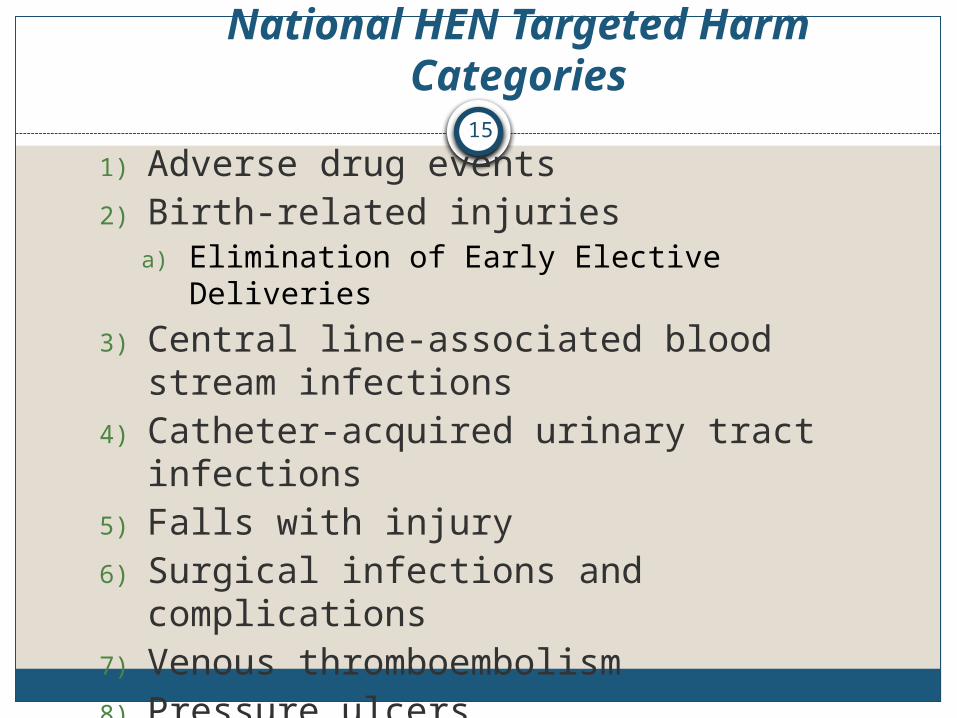
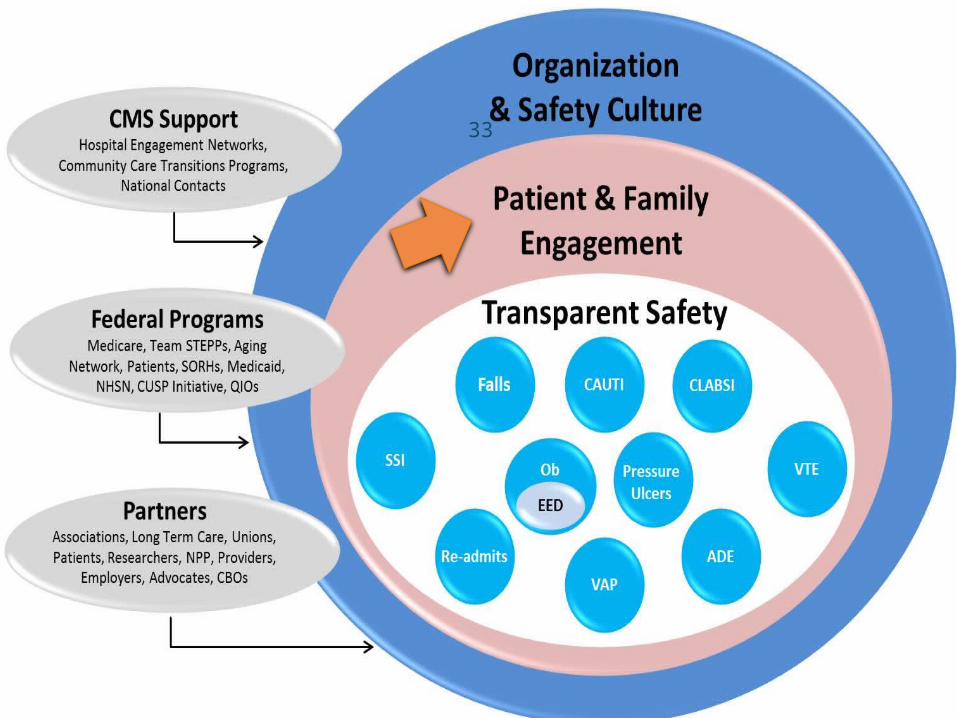
National HEN Targeted Harm Categories
1) Adverse drug events2) Birth-related injuries
a) Elimination of Early Elective Deliveries
3) Central line-associated blood stream infections
4) Catheter-acquired urinary tract infections5) Falls with injury6) Surgical infections and complications7) Venous thromboembolism8) Pressure ulcers9) Readmissions10) Ventilator-associated pneumonia
15

Additional Priorities
Leadership SystemsCulture of SafetyTeamwork and CommunicationsLean TrainingInnovation and Transformation Preventing Harm Across the BoardHealth Care Disparities
16
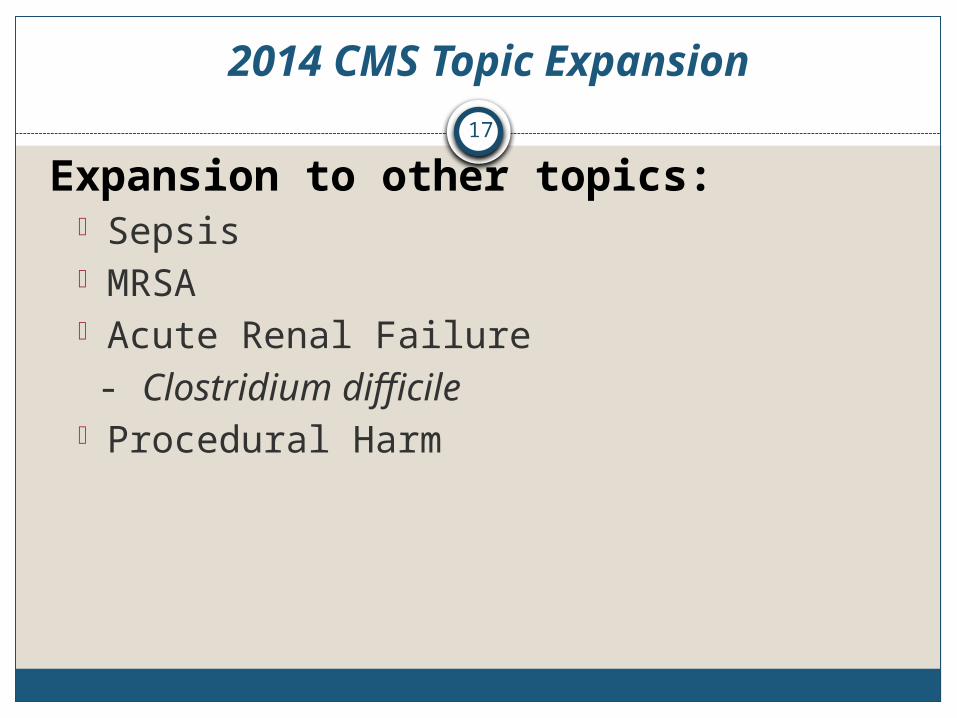
2014 CMS Topic Expansion
Expansion to other topics:- Sepsis- MRSA- Acute Renal Failure- Clostridium difficile
- Procedural Harm
17
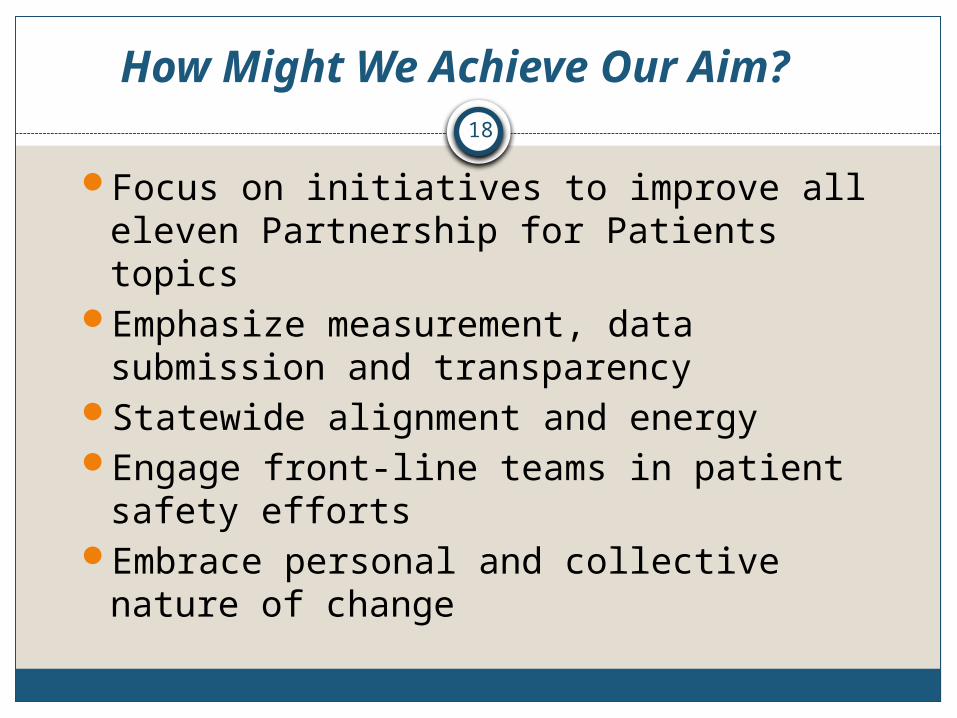
How Might We Achieve Our Aim?
Focus on initiatives to improve all eleven Partnership for Patients topics
Emphasize measurement, data submission and transparency
Statewide alignment and energyEngage front-line teams in patient safety
effortsEmbrace personal and collective nature of
change
18
National Content Development
Change packages for all 10 topic areas are now available at www.hret-hen.org.
National HRET conference calls and webinars to share evidence-based practice solutions
National CMS calls sharing ideas for change from hospitals around the country
Indiana learning opportunities for many topics
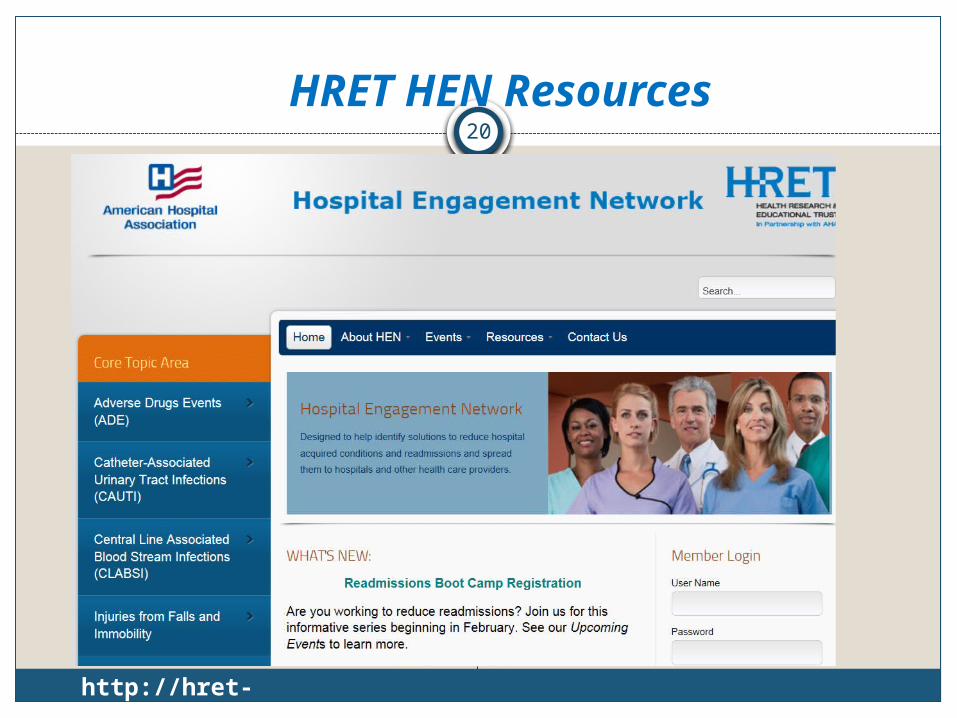
HRET HEN Resources20
http://hret-hen.org/
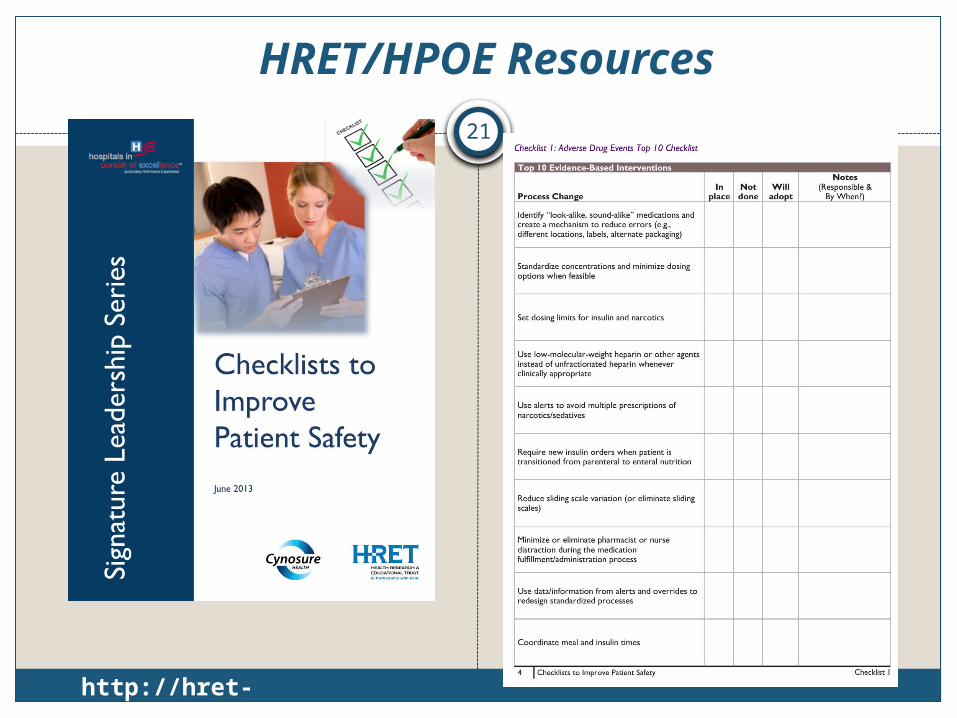
HRET/HPOE Resources
21
http://hret-hen.org/
Education and Technical Assistance
Improvement Leader Fellowship (HRET)
National Collaborative (HRET HEN Week)
National and Indiana webinars
Regional “Roadshows”Indiana Patient Safety
SummitsIHA Annual Meetings
Lean Six Sigma training Medication Safety Essentials courses (MSE 1.0 and advanced course MSE 2.0) - on-line, on-demand continuing education
Readmissions computerized simulation model
Communities of practiceSite visits and coaching

Special Focus: Adverse Drug Events
Significance:• About 1/3 of all hospital adverse events are related to
ADEs• LOS is prolonged by 1.7-4.6 days• ADEs affect 1.9 million hospital stays annually• Cost $4.2 billion annually• Responsible for about 100,000 emergent
hospitalizations in older Americans, annually4 • 2/3 result from just four medication classes:
o Warfarin, insulin, oral hypoglycemics, and oral antiplatelet agents
o 2/3 result from unintentional overdoses
1. Classen DC et al. Health Aff (Millwood) 2011;30:581–9.2. Agency for Healthcare Research and Quality, Rockville, MD, 2011 April. HCUP Statistical Brief #109.3. Classen DC et al. JAMA 997;277:301–6. Bates DW et al. JAMA 1997;277:307–11. 4. Budnitz, DS et al. N Engl J Med 2011:365:2002-12.

ADE Resources24
http://www.mnhospitals.org/Portals/0/Documents/ptsafety/ade/Medication-Safety-Gap-Analysis-Opioid.pdfhttp://patientsafetyauthority.org/EducationalTools/PatientSafetyTools/opioids/Documents/assessment.pdf
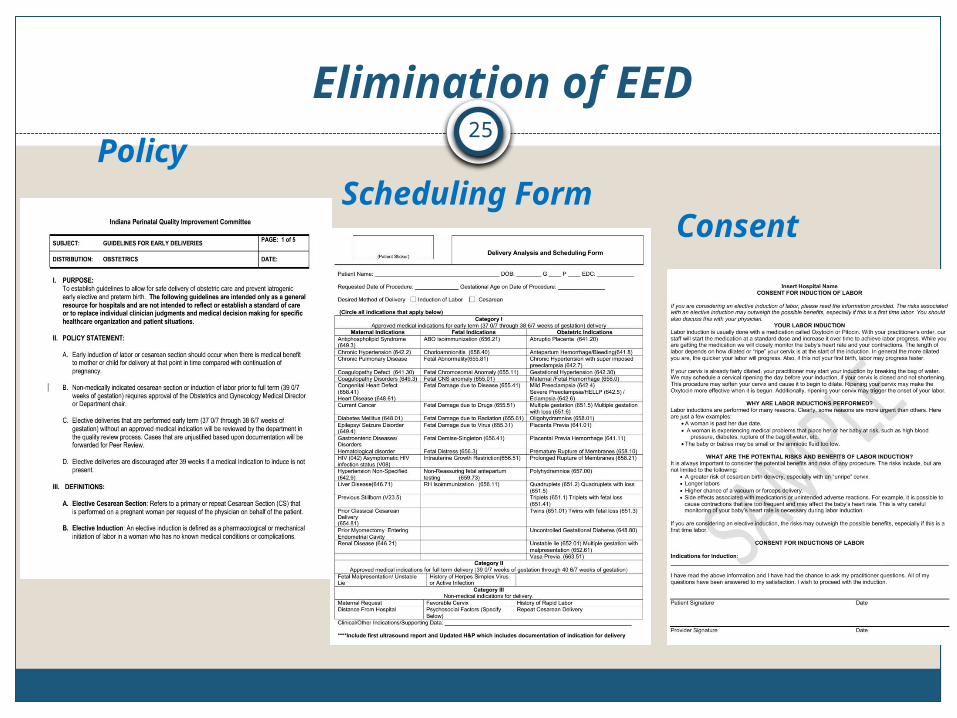
Elimination of EED
Scheduling Form
Policy
Consent
25
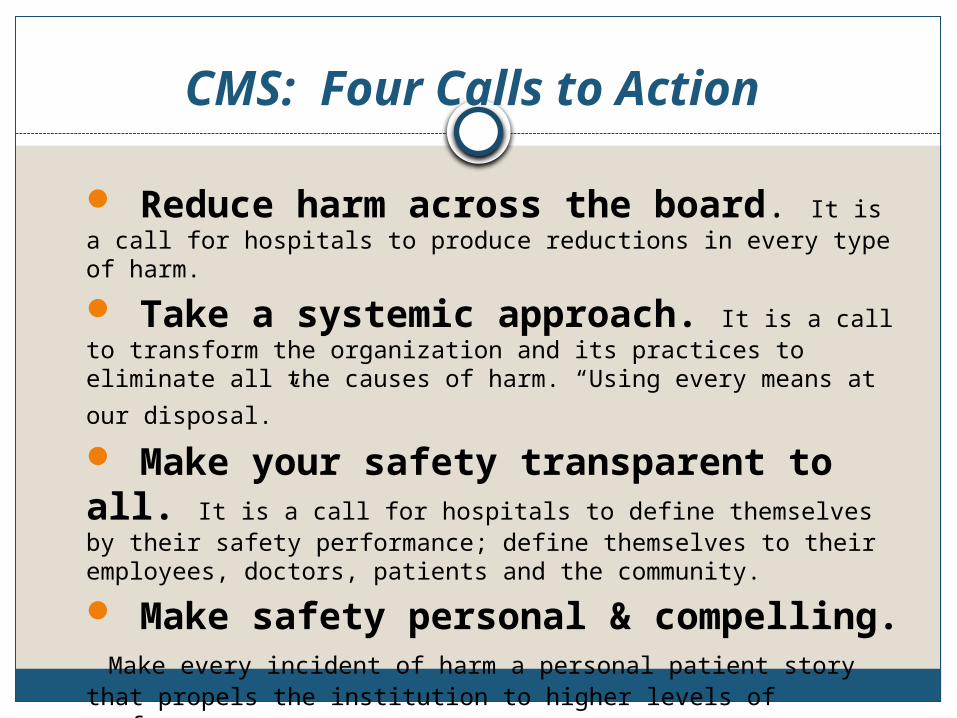
CMS: Four Calls to Action
Reduce harm across the board. It is a call for hospitals to produce reductions in every type of harm.
Take a systemic approach. It is a call to transform the organization and its practices to eliminate all the
causes of harm. “Using every means at our disposal.” Make your safety transparent to all. It is a call for hospitals to define themselves by their safety performance; define themselves to their employees, doctors, patients and the community.
Make safety personal & compelling. Make every incident of harm a personal patient story that propels the institution to higher levels of performance.
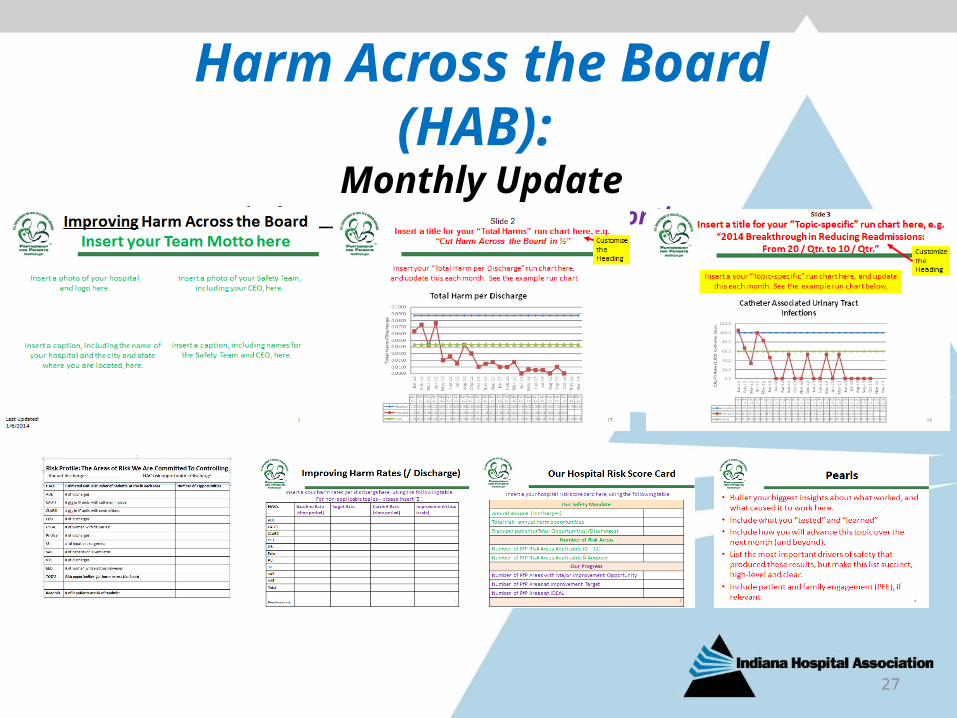
Harm Across the Board (HAB):
Monthly UpdateHospital: ________________ State: ______ Month: _________
27
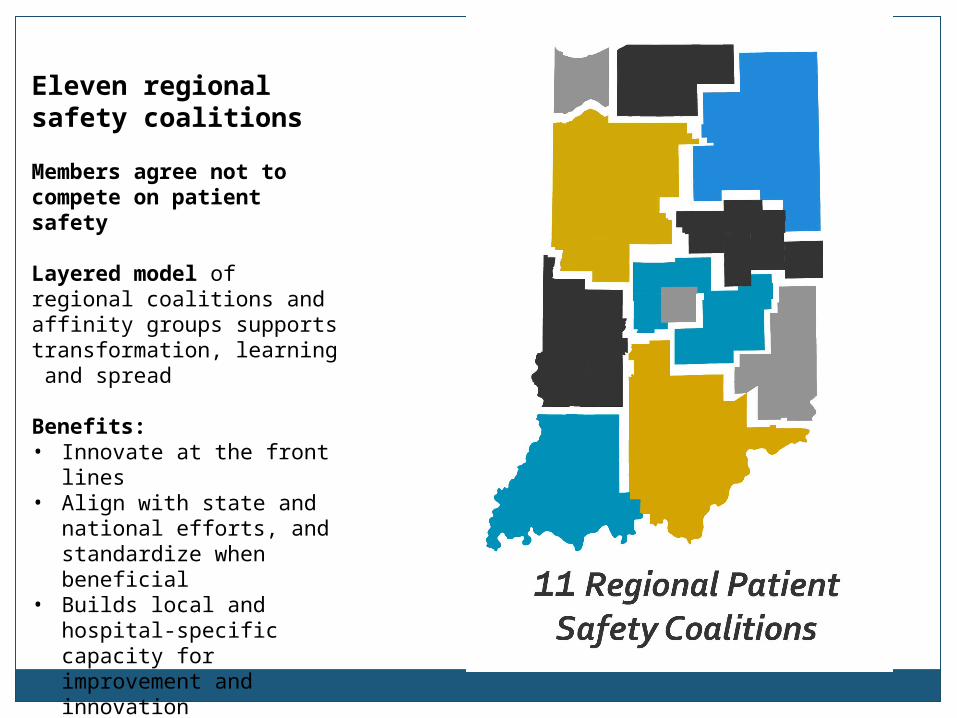
Eleven regional safety coalitions
Members agree not to compete on patient safety
Layered model of regional coalitions and affinity groups supports transformation, learning and spread
Benefits: • Innovate at the front lines• Align with state and
national efforts, and standardize when beneficial
• Builds local and hospital-specific capacity for improvement and innovation
• Encourages safety leadership at all levels across multiple professions
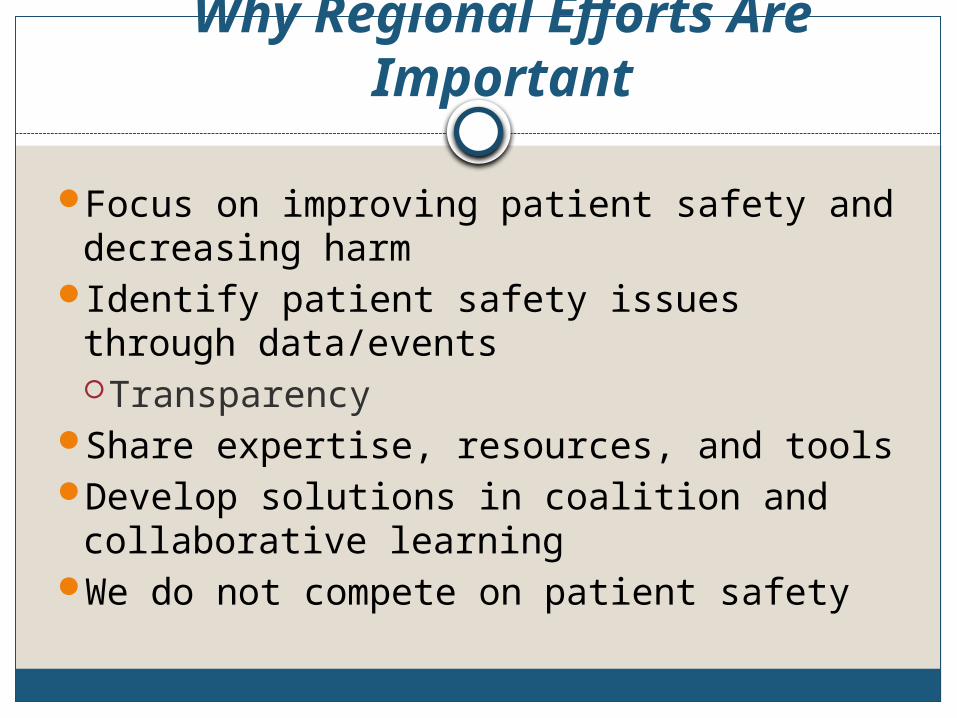
Why Regional Efforts Are Important
Focus on improving patient safety and decreasing harm
Identify patient safety issues through data/eventsTransparency
Share expertise, resources, and tools Develop solutions in coalition and
collaborative learningWe do not compete on patient safety
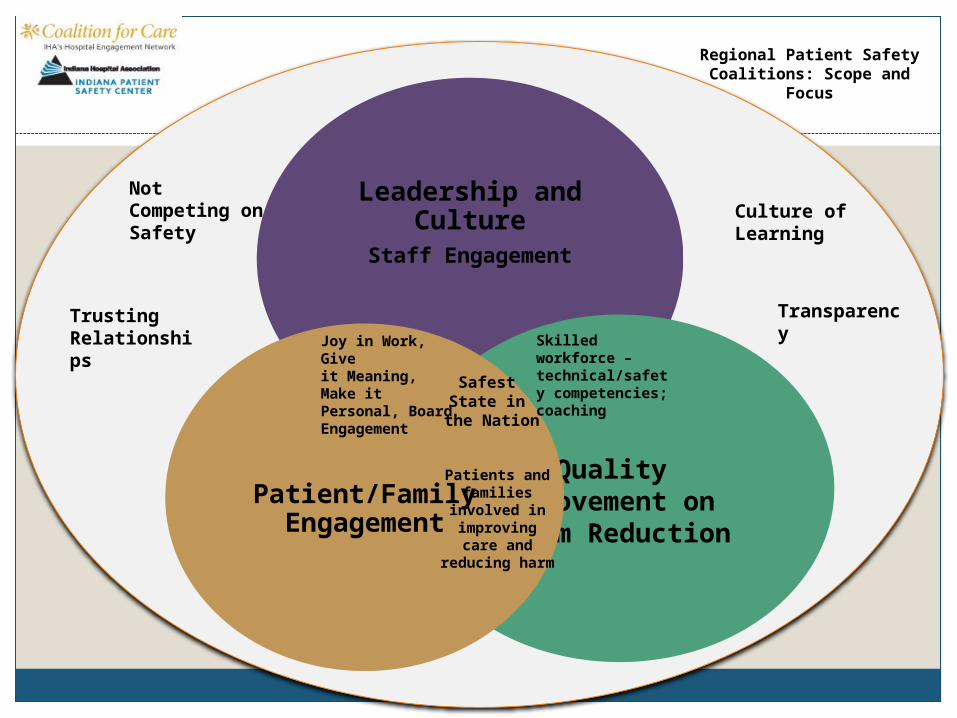
Leadership and CultureStaff Engagement
Quality Improvement on Harm Reduction
Patient/Family Engagement
Joy in Work, Give it Meaning, Make it Personal, Board Engagement
Safest State in
the Nation
Patients and families
involved in improving care and reducing
harm
Skilled workforce – technical/safety competencies; coaching
Not Competing on Safety
Trusting Relationships
Transparency
Culture of Learning
Regional Patient Safety Coalitions: Scope and Focus

Regional Coalition Transparency
ZHospital does not provide services related to this HAC
3 Demonstrating outstanding improvement
0 Not engaged in work related to HAC 4Demonstrating sustained high performance or a national benchmark
1Engaged in work related to HAC, but not submitting data
5 Potential Mentor Hospital
2Engaged in work related to HAC and submitting data
Hospital Name ADE VTEPressure
Ulcers EED OB Falls VAP CAUTICLABS
I SSIReadmissions
ABC Hospital 2 2 4 4 4 4 3 4 4 5 4General Hospital 1 1 4 2 4 2 2 4 4 3 2St. Elsewhere Health System 1 4 3 3 4 2 4 4 4 3 4County Health 4 3 5 4 4 5 3 5 5 3 5Memorial Hospital 0 2 2 2 3 2 3 2 4 2 2Critical Access Hospital 4 4 4 Z Z 2 Z 4 4 2 4
Partnership for Patients33
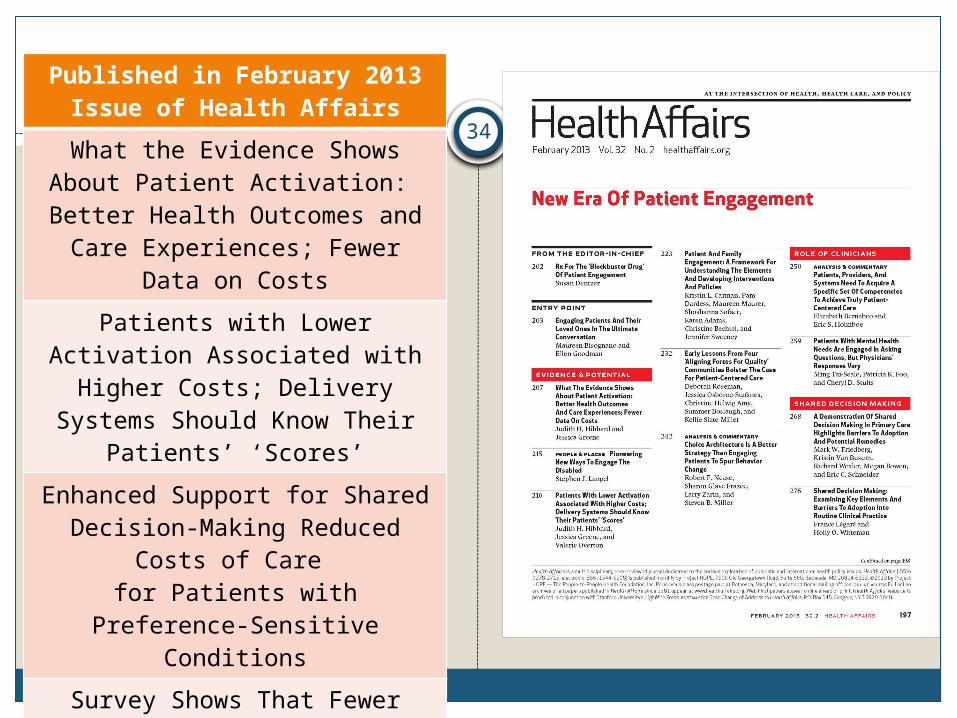
Published in February 2013 Issue of Health Affairs
What the Evidence Shows About Patient Activation: Better Health Outcomes and Care Experiences;
Fewer Data on Costs
Patients with Lower Activation Associated with Higher Costs; Delivery Systems Should Know
Their Patients’ ‘Scores’
Enhanced Support for Shared Decision-Making Reduced Costs
of Care for Patients with Preference-
Sensitive Conditions
Survey Shows That Fewer Than a Third of Patient-Centered Medical Home Practices Engage Patients
in Quality Improvement
34
“[T]here was an inverse relationship between [patient] participation [in their care] and
adverse events . . . [P]atients with high participation were half as
likely to have at least one adverse event during the admission. ”
35
Source: Weingart SN et al., Hospitalized patients’ participation and its impact on quality of care and patient safety, International Journal for Quality in Health Care 2011; 1-9.
Patient Engagement and Adverse Events

Partnership for Patients36
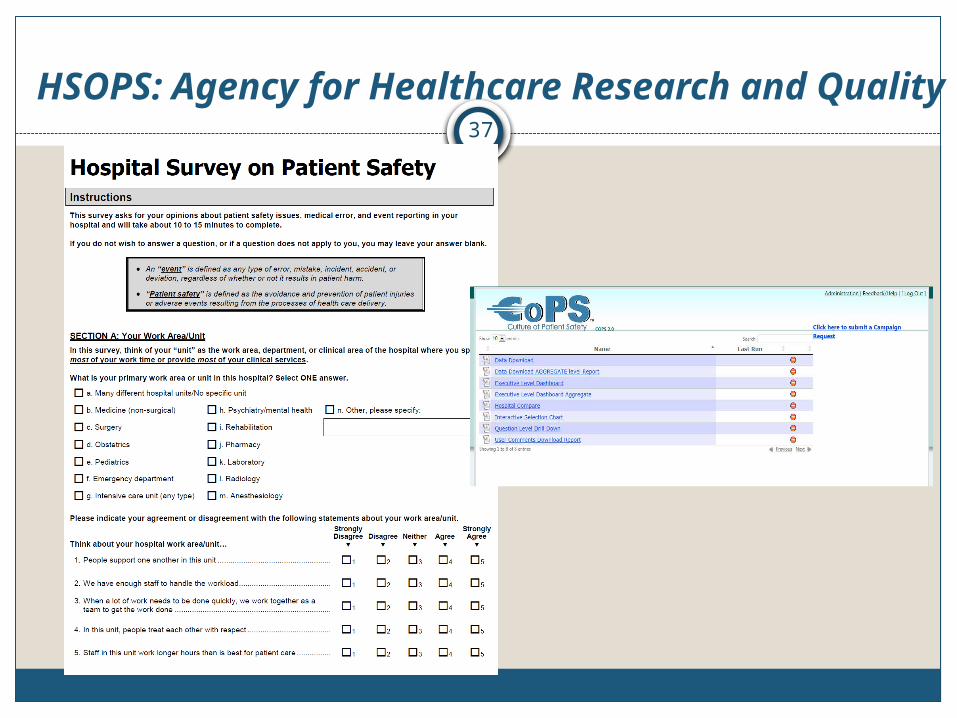
HSOPS: Agency for Healthcare Research and Quality
37

Indiana HSOPS ResultsT
eam
work
Wit
hin
Unit
s
Superv
isor/
Manager
Exp
ect
ati
ons
& A
ctio
ns
Pro
moti
ng P
ati
ent
Safe
ty
Org
aniz
ati
onal L
earn
ing--C
onti
nuous
Impro
vem
ent
Managem
ent
Support
for
Pati
ent
Safe
ty
Ove
rall P
erc
epti
ons
of
Pati
ent
Safe
ty
Feedback
& C
om
munic
ati
on A
bout
Err
or
Com
munic
ati
on O
penness
Fre
quency
of
Eve
nts
Report
ed
Team
work
Acr
oss
Unit
s
Sta
ffin
g
Handoff
s& T
ransi
tions
Nonpunit
ive R
esp
onse
to E
rrors
0.0%
20.0%
40.0%
60.0%
80.0%
100.0%
Survey of Patient Safety 2007 to 2013
2007 2008 20092010 2011 20122013 2012 AHRQ 90th Percentile 2012 AHRQ 75th Percentile
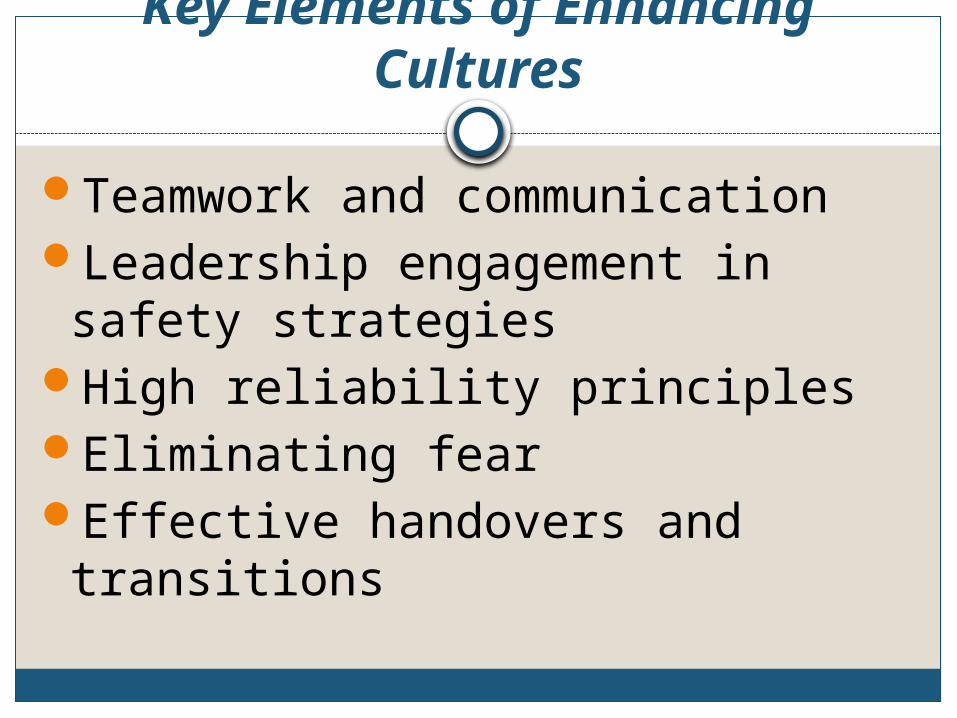
Key Elements of Enhancing Cultures
Teamwork and communicationLeadership engagement in safety strategies
High reliability principlesEliminating fearEffective handovers and transitions
AHRQ Culture of Safety Survey
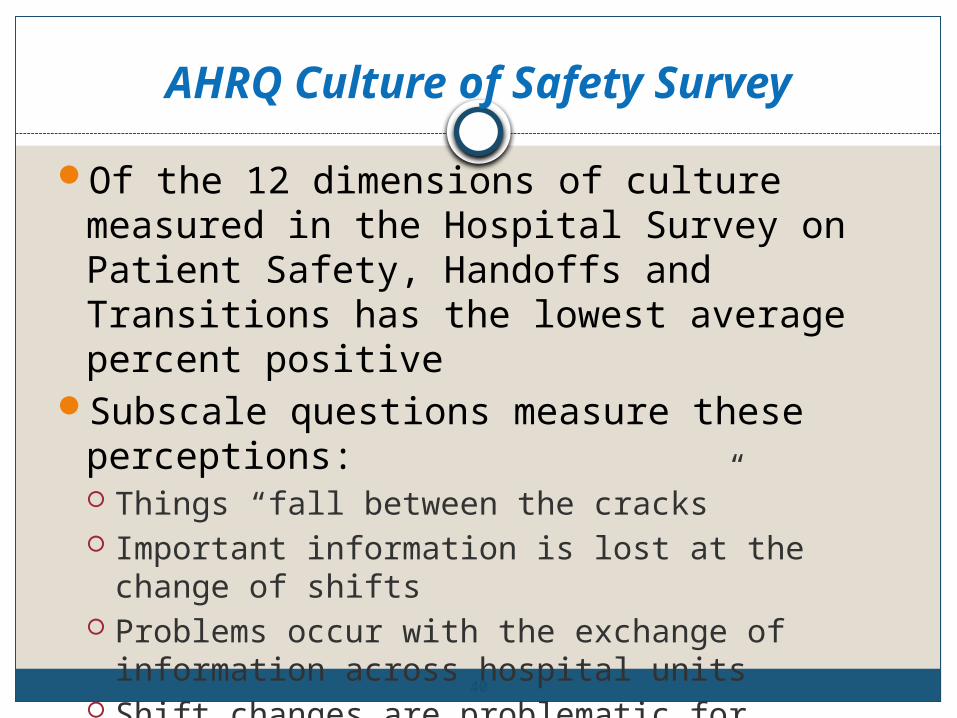
Of the 12 dimensions of culture measured in the Hospital Survey on Patient Safety, Handoffs and Transitions has the lowest average percent positive
Subscale questions measure these perceptions: Things “fall between the cracks” Important information is lost at the change of
shifts Problems occur with the exchange of
information across hospital units Shift changes are problematic for patients
40
What are hand-offs/handovers?
“The process of transferring primary
authority and responsibility for providing clinical care to a patient from one departing caregiver to one oncoming caregiver.”
Patterson & Wears, 2010
41

Characteristics of Effective Handovers
Face-to-face, verbal, and interactiveProviders come together and stay in a “zone of
readiness and attention” during information sharing Limit interruptions Limit initiation of actions
Not just about information exchange, but some type of written, structured tool is employed
Includes time for anticipation and foresightReceiver does read-back to verify contentGood teamwork as foundation
42
Handover Components
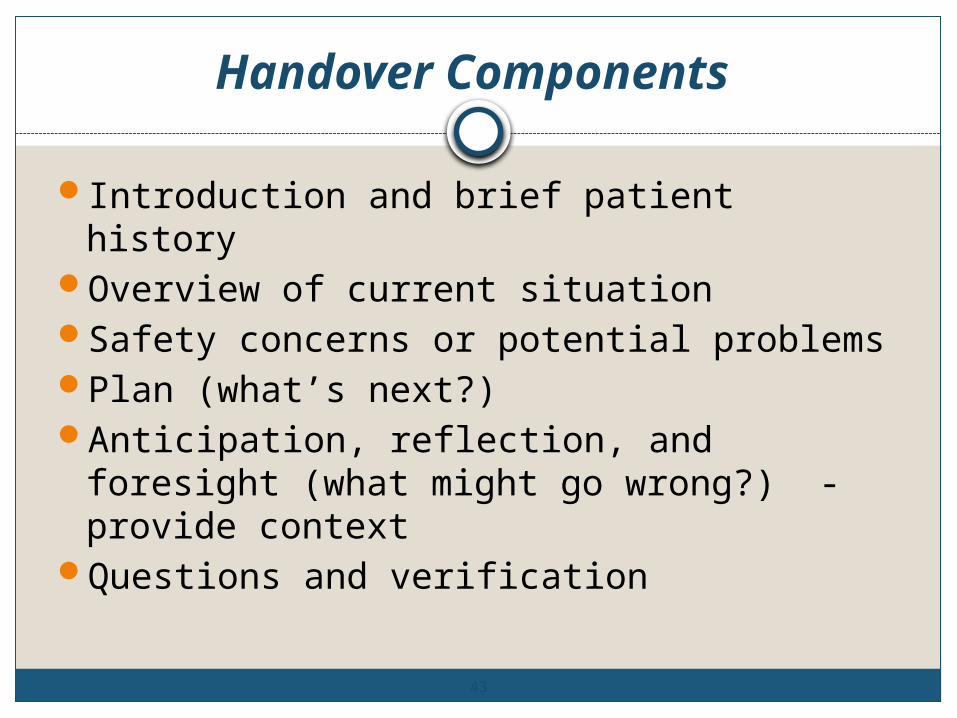
Introduction and brief patient historyOverview of current situationSafety concerns or potential problemsPlan (what’s next?)Anticipation, reflection, and foresight (what
might go wrong?) - provide contextQuestions and verification
43
Example: DRAW
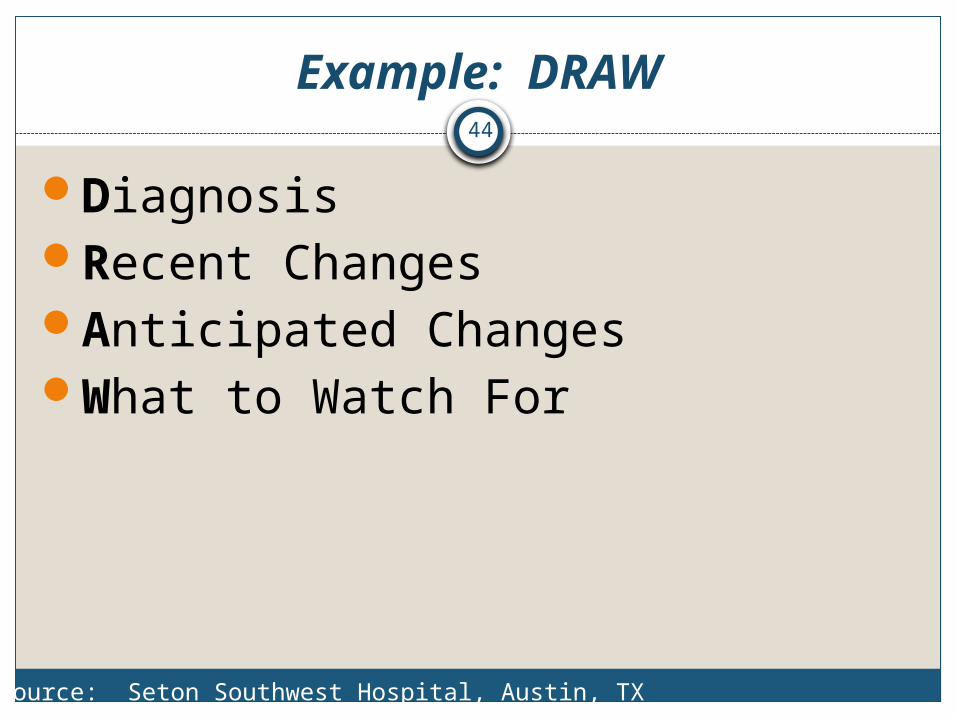
DiagnosisRecent ChangesAnticipated ChangesWhat to Watch For
44
Source: Seton Southwest Hospital, Austin, TX
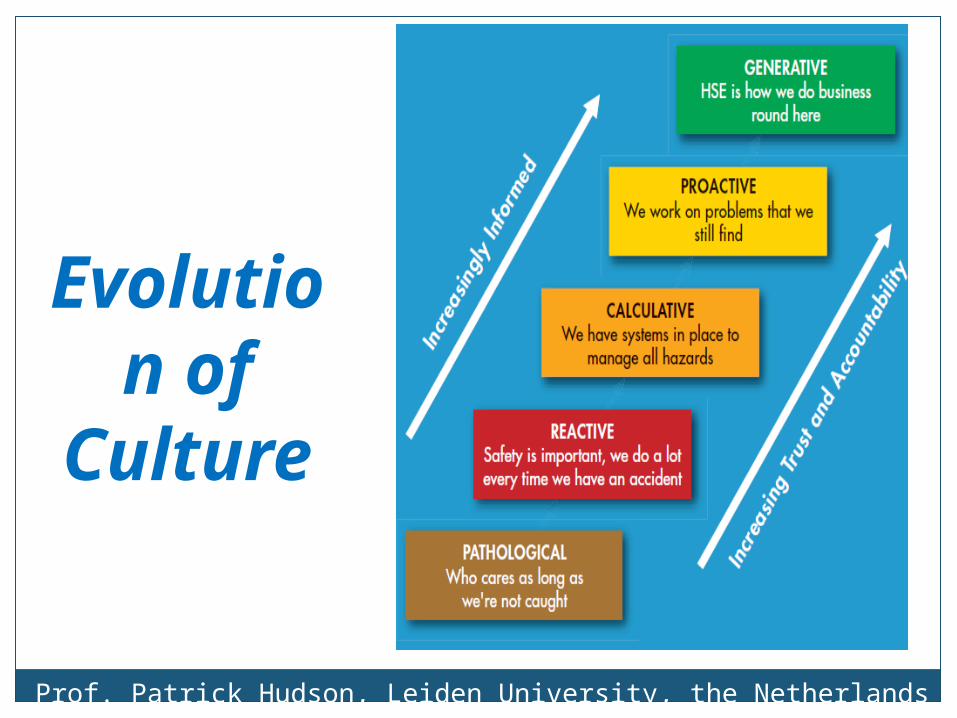
Prof. Patrick Hudson, Leiden University, the Netherlands (From Shell E & P)
Evolution of
Culture

Managing the Unexpected (Weick & Sutcliffe)
“Mindfulness”: Ability to see the significance of early and
weak signals and to take strong decisive action to prevent harm
“Sensemaking”: o Process of transforming experiences into
updated views of the system by “taking the time to make sense out of new and changing circumstances”
o “Trust is a product of sensemaking.” – J. Morath
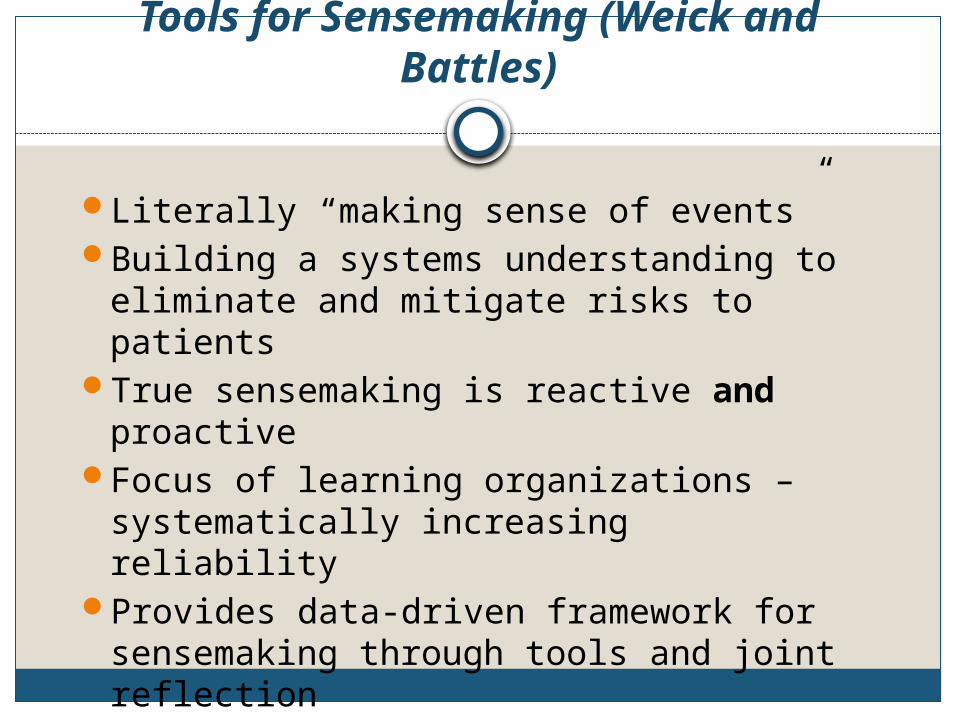
Tools for Sensemaking (Weick and Battles)
Literally “making sense of events”Building a systems understanding to
eliminate and mitigate risks to patientsTrue sensemaking is reactive and proactiveFocus of learning organizations –
systematically increasing reliabilityProvides data-driven framework for
sensemaking through tools and joint reflection
Importance of staff engagement and curiosity
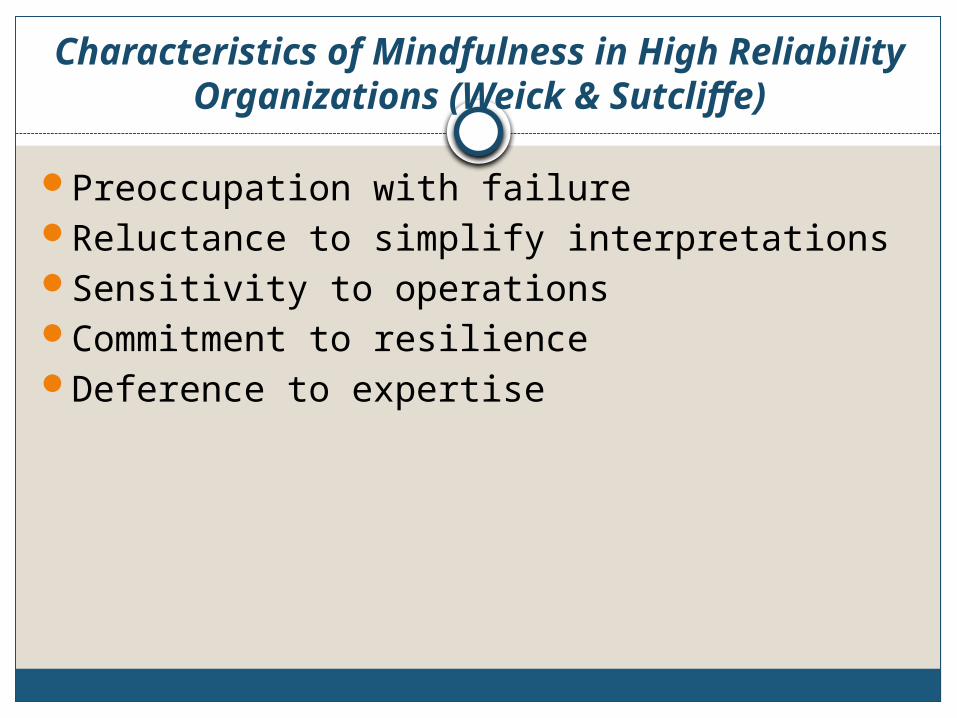
Characteristics of Mindfulness in High Reliability Organizations (Weick & Sutcliffe)
Preoccupation with failureReluctance to simplify interpretationsSensitivity to operationsCommitment to resilienceDeference to expertise
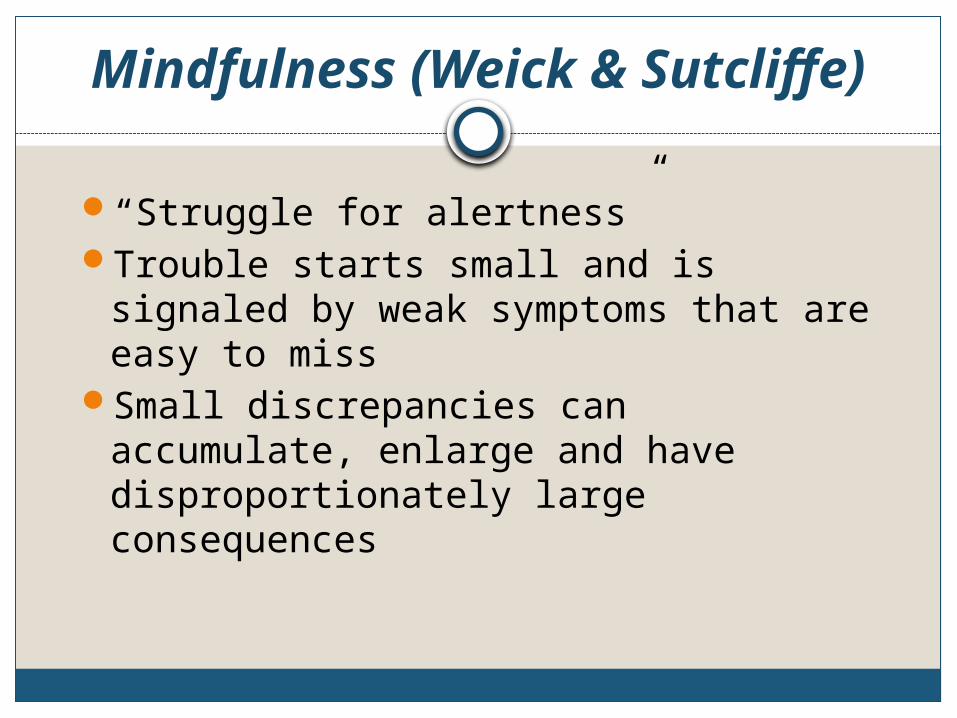
Mindfulness (Weick & Sutcliffe)
“Struggle for alertness”Trouble starts small and is signaled by
weak symptoms that are easy to miss Small discrepancies can accumulate,
enlarge and have disproportionately large consequences

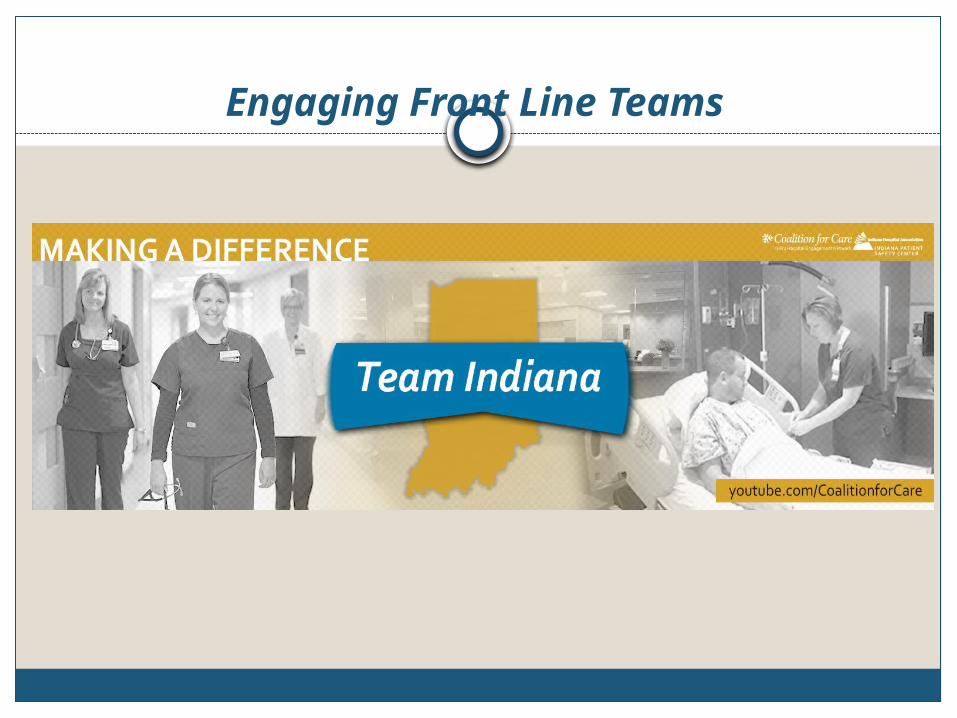
Engaging Front-Line Staff in Safety
Focus on the systems of care and on redesigning work processes
Must involve “sharp end” caregiversEducation and training alone will not
work – requires increased “mindfulness”Cultural change requires strong
leadershipMust improve reliability through new
approaches
50
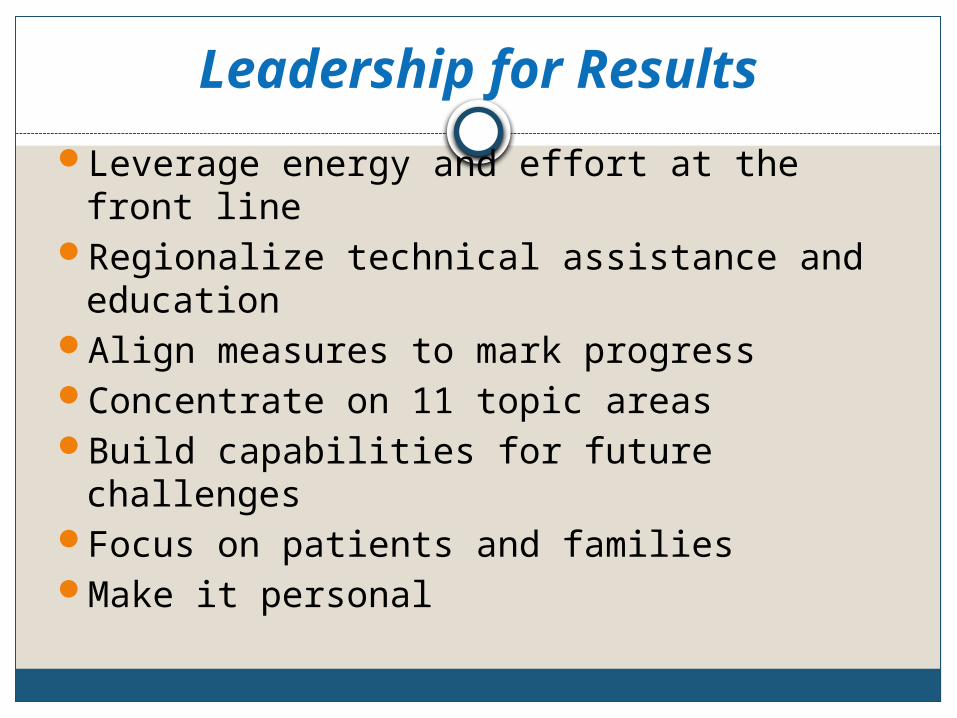
Leadership for Results
Leverage energy and effort at the front lineRegionalize technical assistance and
educationAlign measures to mark progressConcentrate on 11 topic areas Build capabilities for future challengesFocus on patients and familiesMake it personal
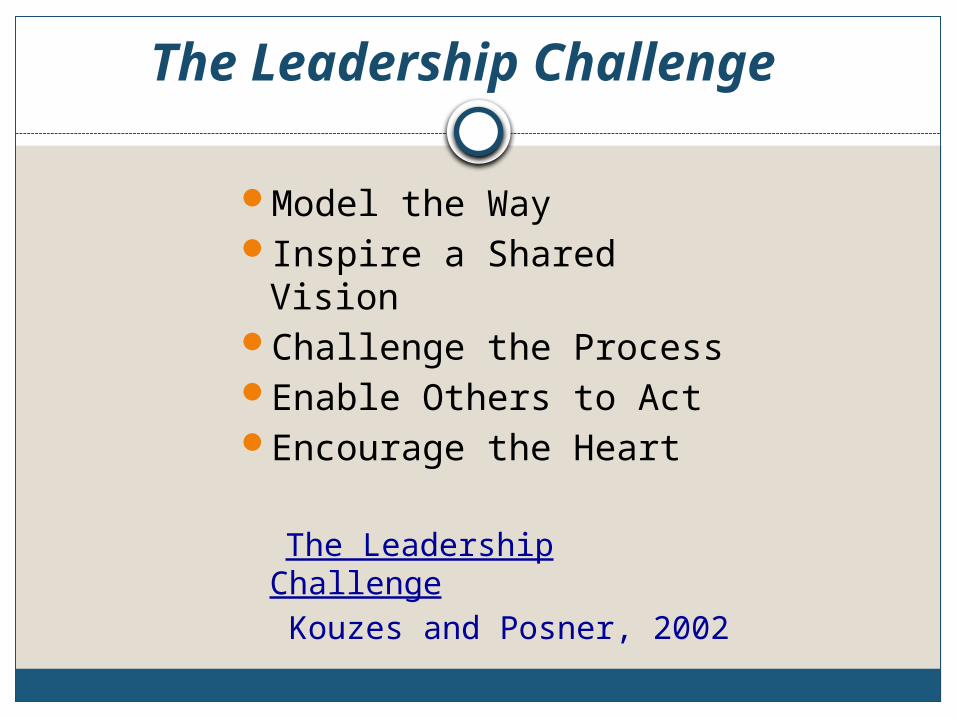
The Leadership Challenge
Model the WayInspire a Shared VisionChallenge the ProcessEnable Others to ActEncourage the Heart
The Leadership Challenge Kouzes and Posner, 2002
Contact
Betsy Lee, RN, BSN, MSPHDirector, Indiana Patient Safety CenterIndiana Hospital [email protected](317) 423-7795
54