better, faster, stronger - brookfieldinstitute.ca · bii+e, creig held research roles with toronto...
TRANSCRIPT
May
20
18Better, Faster, Stronger:
Maximizing the benefits of automation for Ontario’s firms and people

b e t t e r , f a s t e r , s t r o n g e r
C R E I G L A M B Senior Policy Analyst
Creig is a Senior Policy Analyst at the Brookfield Institute. Prior to joining BII+E, Creig held research roles with Toronto Artscape and Economic Development and Culture at the City of Toronto. Creig also worked for Public Works and Government Services Canada for several years, designing and implementing communications strategies and materials. Creig holds a Master of Public Policy from the University of Toronto and a Bachelor of Communications from the University of Ottawa.
A u t h o r S
D R . D A N I E L M U N R O Research Advisor
Dr. Daniel Munro is a Visiting Scholar in Innovation Studies and Director of Policy Projects in the Innovation Policy Lab at the Munk School of Global Affairs at the University of Toronto, and Researcher in Residence at Actua. Dan holds degrees in political science from the University of Toronto (B.A.), Western University (M.A.), and the Massachusetts Institute of Technology (Ph.D.).
The Brookfield Institute for Innovation + Entrepreneurship (BII+E) is a new, independent and nonpartisan institute, housed within Ryerson University, that is dedicated to making Canada the best country in the world to be an innovator or an entrepreneur.
BII+E supports this mission in three ways: insightful research and analysis; testing, piloting and prototyping projects; which informs BII+E’s leadership and advocacy on behalf of innovation and entrepreneurship across the country.
ISBN: 978-1-926769-88-2
For more information, visit brookfieldinstitute.ca
/BrookfieldIIE
@BrookfieldIIE
The Brookfield Institute for Innovation + Entrepreneurship
20 Dundas St. W, Suite 921 Toronto, ON M5G 2C2
V I E T V U Economist
Viet Vu is an Economist at the Brookfield Institute. Prior to joining BII+E Viet studied at the London School of Economics & Political Science where he taught Intermediate Microeconomics and worked on his thesis on the game theory of seller reputation. He holds a Master of Science in Economics from the London School of Economics & Political Science and a Bachelor of Arts in Economics from the University of British Columbia.
b e t t e r , f a s t e r , s t r o n g e r
A c k n o w l e d g e m e n t S
This report was supported by the Government of Ontario.
An expert advisory panel provided insights and guidance throughout this project. We are deeply grateful for their contribution.
Thank you to the many people who provided their time and insights to contribute to the development of this report.
SPECIAL THANKS
We would also like to thank Burning Glass Technologies who granted us access to their data.
CONTRIBUTORS
Sarah Doyle, Director of Policy + Research
Jane Farrow and the team at the Department of Words & Deeds
Annalise Huynh, Policy Analyst
Jon Medow, Project Advisor
Sean Mullin, Executive Director
Diana Rivera, Economist
Jessica Thornton, Senior Projects Designer
Sarah Villeneuve, Policy Assistant
EXPERT ADVISORY PANEL
Robert Carlyle, Senior Director, Strategic Workforce Management RBC
Rebecca Finlay, Vice President, Engagement and Public Policy, Canadian Institute for Advanced Research
Ryan Gariepy, Co-Founder and CTO, Clearpath Robotics
Avi Goldfarb, Professor, Rotman School of Management, University of Toronto
David Green, Professor and Director, Vancouver School of Economics, University of British Columbia
Sunil Johal, Director of Policy, The Mowat Centre
Krista Jones, Managing Director of Work and Learning, MaRS
Bob Magee, Chairman, Woodbridge Group
Colin McKay, Head of Public Policy and Government Relations, Google Canada
Bakhtiar Moazzami, Professor/Researcher, Department of Economics, Lakehead University
Jayson Myers, Former President, Canadian Manufacturers and Exporters
Graham Taylor, Co-Founder, Kindred.ai and Associate Professor, University of Guelph
Armine Yalnizyan, President, Canadian Association for Business Economics
Richard Zuroff, Director of Delivery and Customer Success, Element AI
1b e t t e r , f a s t e r , s t r o n g e r
t A b l e o f c o n t e n t S
Executive Summary 2
Introduction 17
Approach + Methodology 18
Automation, Technology + Labour 19
What is Automation? 19
Evidence of Automation: Literature Review 20
Models for Forecasting Automation Risk 21
A Framework for Understanding the Drivers + Impacts of Automation 25
Part 1: Drivers + Impacts of Automation (Firm-Level View) 25
Part 2: Factors Influencing the Impacts of Automation (Individual-Level View) 30
Automation: Evidence from Ontario 34
Technology Adoption Trends in Ontario 34
Job + Skills Trends in Ontario 35
Assessing Automation Susceptibility in Ontario 37
Citizen Perspectives on Labour Automation 40
Sector Analysis Framework 42
Sector Analysis: Manufacturing 44
Manufacturing Sector Profile 45
Employment + Output: Key Trends 53
Technology Adoption: Drivers, Barriers + Trends 53
Automation, Jobs + Skills Demands 57
Finance + Insurance Sector profile 70
Finance and Insurance Sector Profile 71
Employment + Output: Key Trends 79
Technology Adoption: Drivers, Barriers + Trends 79
Automation, Jobs + Skills Demands 85
Reconciling Firm + Worker Interests in the Context of Automation: Key Challenges + Opportunities 94
Maximizing the Benefits of Automation for Ontarians 100
Aiming for the optimal future scenario 100
A High-Level Strategy 100
Conclusion 105
Appendix: Burning Glass Technologies Data 106
Endnotes 107
Works Cited 111
2b e t t e r , f a s t e r , s t r o n g e r
e x e c u t i v e S u m m A r y
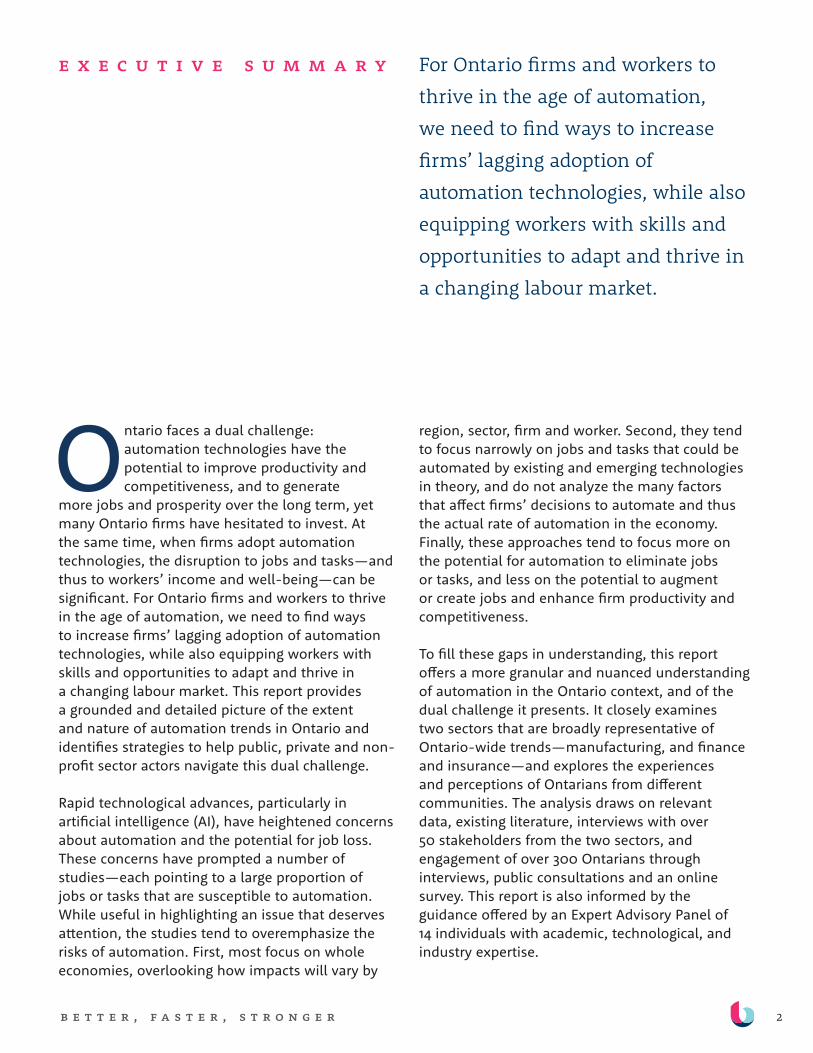
Ontario faces a dual challenge: automation technologies have the potential to improve productivity and competitiveness, and to generate
more jobs and prosperity over the long term, yet many Ontario firms have hesitated to invest. At the same time, when firms adopt automation technologies, the disruption to jobs and tasks—and thus to workers’ income and well-being—can be significant. For Ontario firms and workers to thrive in the age of automation, we need to find ways to increase firms’ lagging adoption of automation technologies, while also equipping workers with skills and opportunities to adapt and thrive in a changing labour market. This report provides a grounded and detailed picture of the extent and nature of automation trends in Ontario and identifies strategies to help public, private and non-profit sector actors navigate this dual challenge.
Rapid technological advances, particularly in artificial intelligence (AI), have heightened concerns about automation and the potential for job loss. These concerns have prompted a number of studies—each pointing to a large proportion of jobs or tasks that are susceptible to automation. While useful in highlighting an issue that deserves attention, the studies tend to overemphasize the risks of automation. First, most focus on whole economies, overlooking how impacts will vary by
region, sector, firm and worker. Second, they tend to focus narrowly on jobs and tasks that could be automated by existing and emerging technologies in theory, and do not analyze the many factors that affect firms’ decisions to automate and thus the actual rate of automation in the economy. Finally, these approaches tend to focus more on the potential for automation to eliminate jobs or tasks, and less on the potential to augment or create jobs and enhance firm productivity and competitiveness.
To fill these gaps in understanding, this report offers a more granular and nuanced understanding of automation in the Ontario context, and of the dual challenge it presents. It closely examines two sectors that are broadly representative of Ontario-wide trends—manufacturing, and finance and insurance—and explores the experiences and perceptions of Ontarians from different communities. The analysis draws on relevant data, existing literature, interviews with over 50 stakeholders from the two sectors, and engagement of over 300 Ontarians through interviews, public consultations and an online survey. This report is also informed by the guidance offered by an Expert Advisory Panel of 14 individuals with academic, technological, and industry expertise.
For Ontario firms and workers to
thrive in the age of automation,
we need to find ways to increase
firms’ lagging adoption of
automation technologies, while also
equipping workers with skills and
opportunities to adapt and thrive in
a changing labour market.
3b e t t e r , f a s t e r , s t r o n g e r
THE RELATIONSHIP BETWEEN AUTOMATION + LABOUR
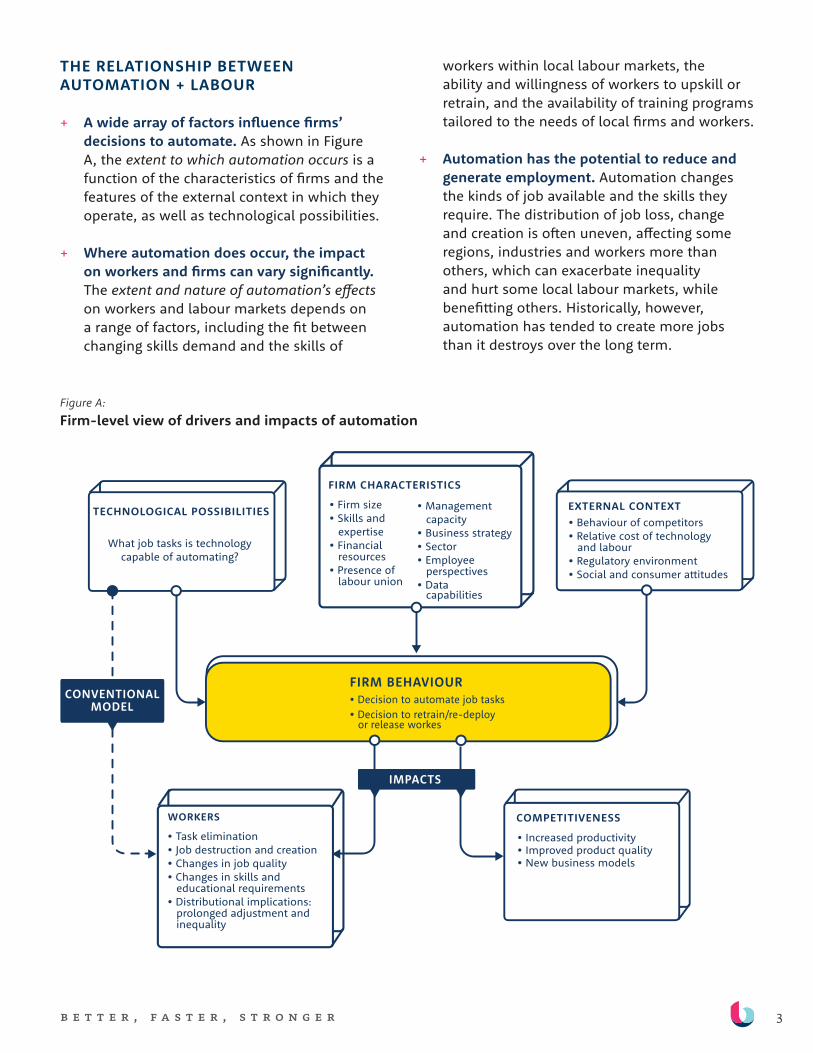
+ A wide array of factors influence firms’ decisions to automate. As shown in Figure A, the extent to which automation occurs is a function of the characteristics of firms and the features of the external context in which they operate, as well as technological possibilities.
+ Where automation does occur, the impact on workers and firms can vary significantly. The extent and nature of automation’s effects on workers and labour markets depends on a range of factors, including the fit between changing skills demand and the skills of
workers within local labour markets, the ability and willingness of workers to upskill or retrain, and the availability of training programs tailored to the needs of local firms and workers.
+ Automation has the potential to reduce and generate employment. Automation changes the kinds of job available and the skills they require. The distribution of job loss, change and creation is often uneven, affecting some regions, industries and workers more than others, which can exacerbate inequality and hurt some local labour markets, while benefitting others. Historically, however, automation has tended to create more jobs than it destroys over the long term.
TECHNOLOGICAL POSSIBILITIES EXTERNAL CONTEXT
WORKERS COMPETITIVENESS
• Behaviour of competitors • Relative cost of technology and labour • Regulatory environment • Social and consumer a�itudes
What job tasks is technology capable of automating?
FIRM BEHAVIOUR• Decision to automate job tasks • Decision to retrain/re-deploy or release workes
• Increased productivity• Improved product quality • New business models
• Task elimination• Job destruction and creation• Changes in job quality• Changes in skills and educational requirements• Distributional implications: prolonged adjustment and inequality
FIRM CHARACTERISTICS
• Firm size • Skills and expertise • Financial resources• Presence of labour union
• Management capacity• Business strategy • Sector• Employee perspectives• Data capabilities
IMPACTS
CONVENTIONAL MODEL
Figure A: Firm-level view of drivers and impacts of automation
4b e t t e r , f a s t e r , s t r o n g e r
FIRM BEHAVIOUR• Decision to automate job tasks • Decision to retrain/re-deploy
or release workes
OCCUPATIONS
• Task elimination• Job destruction and creation• Changes in job quality• Changes in skills and
educational requirements• Distributional implications:
prolonged adjustment andinequality
WHO IS AFFECTED?
• Individuals in school• Individuals entering the labour market• Individuals in the labour market• Individuals not in the labour market
FACTORS TO CONSIDER WHEN DESIGNING RESPONSES• Education, skills, and credentials• Income level• Age• Sex• Place of residence• Number of people employed in jobs
vulnerable to automation• Concentration of employment within
particular regions/communities andsectors/industries
• Forecasted demand/supply• Opportunities to enter or switch into
programs teaching in-demand skills• Opportunities to enter in-demand jobs
with current education and/or upskilling• Opportunities to transition within or
between jobs• Opportunities to gain in-demand skillsand transition into the labour market
Factors in�uencing worker and community resilience, vulnerability and needs—for consideration when designing tailored policies and programs aimed at mitigating potential negative transition impacts, if automation occurs.
IMPACTS
• Possession of or ability to gainin-demand skills in the context ofbroader job-seeking and placementsupports
• Access to relevant training, job seeking,and placement supports
• Awareness of and willingness to enterprograms supplying in-demand skills
• Possession or ability to gain requiredquali�cations/prerequisites to enterprograms
• Availability of pathways to jobs inin-demand areas of the economywith current skills and credentials
• Ability to upskill or add to existingcredentials
• Possession of or ability to gain in-demand skills• Opportunity to upskill within an existing job• Availability of pathways to jobs with similar skill
and experience requirements that pay more andare less vulnerable to potential automation thatworkers could transition into with relative ease
• Availability of pathways to jobs in areas of theeconomy that are experiencing or have thepotential to experience high growth, and whichmay require a more signi�cant investment inretraining.
• Access to and awareness of existing supports tohelp a worker transition
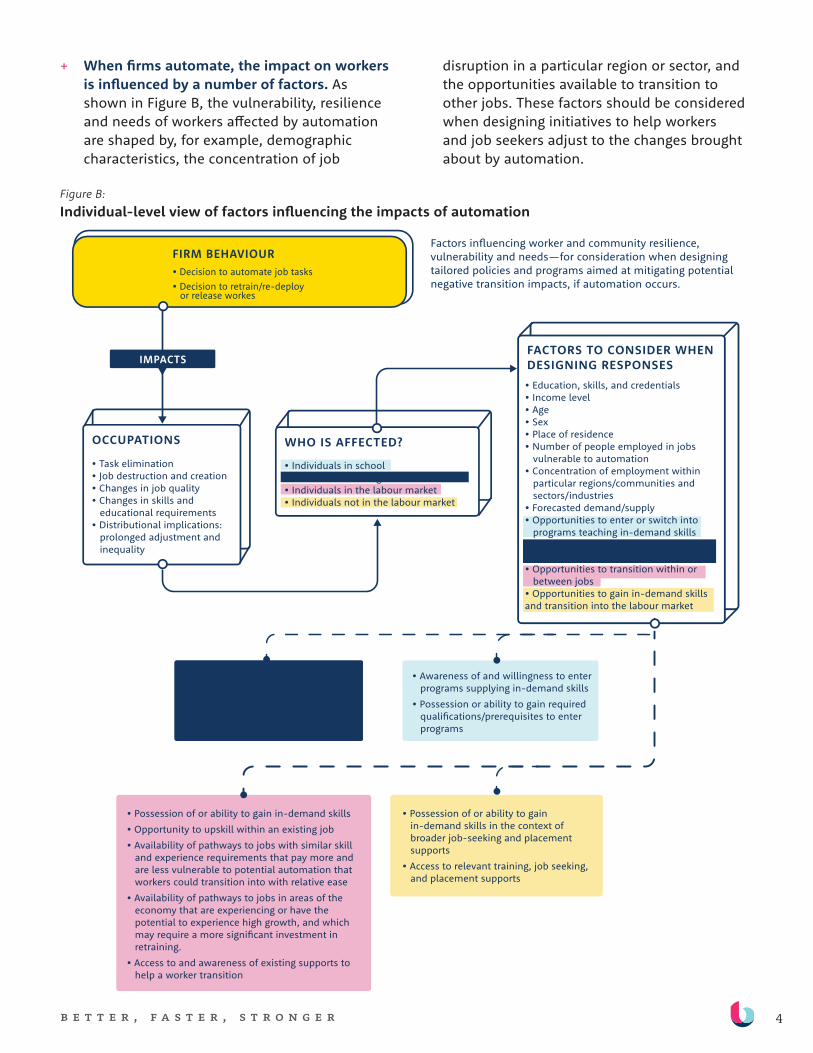
+ When firms automate, the impact on workers is influenced by a number of factors. As shown in Figure B, the vulnerability, resilience and needs of workers affected by automation are shaped by, for example, demographic characteristics, the concentration of job
disruption in a particular region or sector, and the opportunities available to transition to other jobs. These factors should be considered when designing initiatives to help workers and job seekers adjust to the changes brought about by automation.
Figure B: Individual-level view of factors influencing the impacts of automation

5b e t t e r , f a s t e r , s t r o n g e r
AUTOMATION TRENDS FOR ONTARIO AS A WHOLE
+ Technology adoption in Ontario is low. Compared to peer jurisdictions, Ontario firms lag on technology adoption, which is likely inhibiting productivity gains and growth, and putting both firms and workers at a long-term disadvantage.
+ Skills demands are changing across the province. Despite this lag, the automation that is occurring in Ontario is contributing to changes in the kinds and nature jobs available and the skills and knowledge that employers need. Job growth is largely in non-routine work that is either manual—such as cleaning services—or cognitively demanding—such
Figure C: Employment Growth, Ontario, 1987–2017
as management. More routine-oriented occupations, which are often easier to define and codify using technology, have experienced decline or stagnation. Figure C shows these shifts in employment over time.
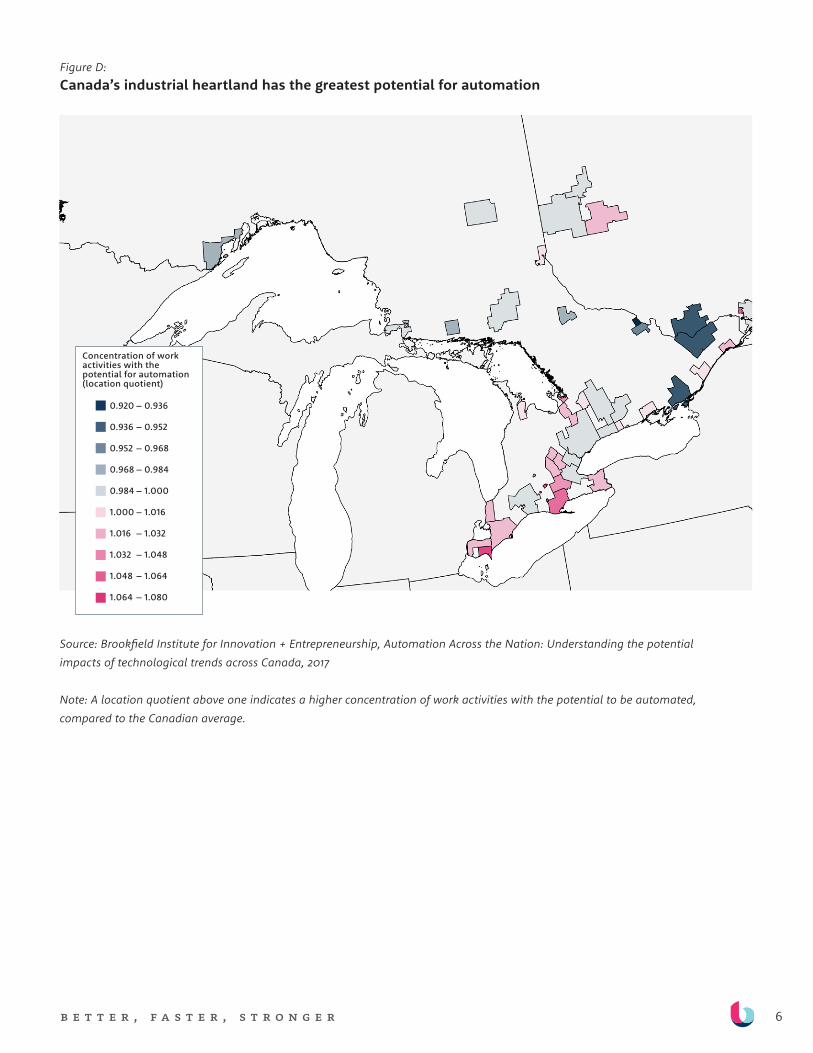
+ If technology investments grow, the impacts of automation on Ontario’s labour market could become more significant. Automation has the potential to cause substantial short- to medium-term disruption in labour markets and employment, especially in Ontario towns and cities in the southwest that specialize in manufacturing, as shown in Figure D. While the relatively lower rates of automation in Ontario’s firms will likely delay or temper job disruption, they could negatively affect employment in the long-term, by inhibiting firm competitiveness and increasing risks of firm failure.
6b e t t e r , f a s t e r , s t r o n g e r
Figure D: Canada’s industrial heartland has the greatest potential for automation
Source: Brookfield Institute for Innovation + Entrepreneurship, Automation Across the Nation: Understanding the potential impacts of technological trends across Canada, 2017
Note: A location quotient above one indicates a higher concentration of work activities with the potential to be automated, compared to the Canadian average.
0.920 – 0.936
0.936 – 0.952
0.952 – 0.968
0.968 – 0.984
0.984 – 1.000
1.000 – 1.016
1.016 – 1.032
1.032 – 1.048
1.048 – 1.064
1.064 – 1.080
Concentration of work activities with the potential for automation (location quotient)
7b e t t e r , f a s t e r , s t r o n g e r
WHAT WE HEARD FROM ONTARIANS
+ “Adapt or perish”. Among those interviewed, there is a general sense that automation is happening, that its scope is increasing, and that it will disrupt many sectors and change how Ontarians work.
+ Some automated job tasks are ones that people don’t want to perform. We heard that automation often replaces human labour when work is unsafe, when it involves repetitive or routine tasks, and when working conditions are such that jobs are hard to fill reliably.
+ A range of perspectives. Some workers feel that automation has reduced their jobs to “button-pushing” and devalued certain skills. For others, automation has made jobs safer, allowed them to focus on more interesting tasks and/or provided them with greater flexibility.
+ There are growing gaps between the skills of existing workers and those employers are seeking. While some workers are eager to learn new skills and adapt to changes in the workplace, others are not. This applies across all age groups, although mid-career workers who have not been working in offices and have few computer skills may have the hardest time adapting or finding new employment.
“People are equally scared, hopeful, don’t know, or don’t care. They are hopeful that with automation work can become more interesting, less physical, less dangerous. But they also fear their own ability to adapt—and if they will even be given the opportunity to adapt. It sparks a lot of emotional reactions.” — university researcher in Kingston
“Some people are learners, and want a challenge. There are some 55-year-olds who are like that. Others say ‘I’m out of here, I can’t learn that’, and they leave. Then we lose process knowledge, product knowledge, and company knowledge.” — manufacturing sector stakeholder
8b e t t e r , f a s t e r , s t r o n g e r
MANUFACTURING SECTOR INSIGHTS
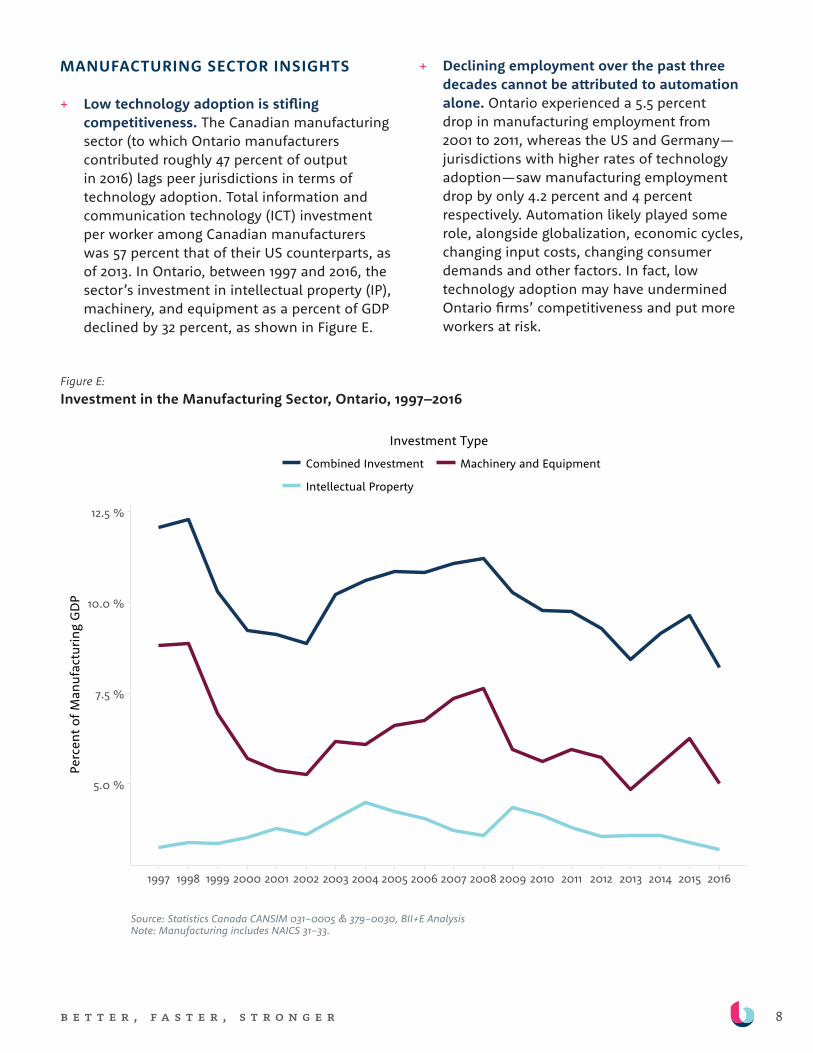
+ Low technology adoption is stifling competitiveness. The Canadian manufacturing sector (to which Ontario manufacturers contributed roughly 47 percent of output in 2016) lags peer jurisdictions in terms of technology adoption. Total information and communication technology (ICT) investment per worker among Canadian manufacturers was 57 percent that of their US counterparts, as of 2013. In Ontario, between 1997 and 2016, the sector’s investment in intellectual property (IP), machinery, and equipment as a percent of GDP declined by 32 percent, as shown in Figure E.
+ Declining employment over the past three decades cannot be attributed to automation alone. Ontario experienced a 5.5 percent drop in manufacturing employment from 2001 to 2011, whereas the US and Germany—jurisdictions with higher rates of technology adoption—saw manufacturing employment drop by only 4.2 percent and 4 percent respectively. Automation likely played some role, alongside globalization, economic cycles, changing input costs, changing consumer demands and other factors. In fact, low technology adoption may have undermined Ontario firms’ competitiveness and put more workers at risk.
Figure E: Investment in the Manufacturing Sector, Ontario, 1997–2016
9b e t t e r , f a s t e r , s t r o n g e r
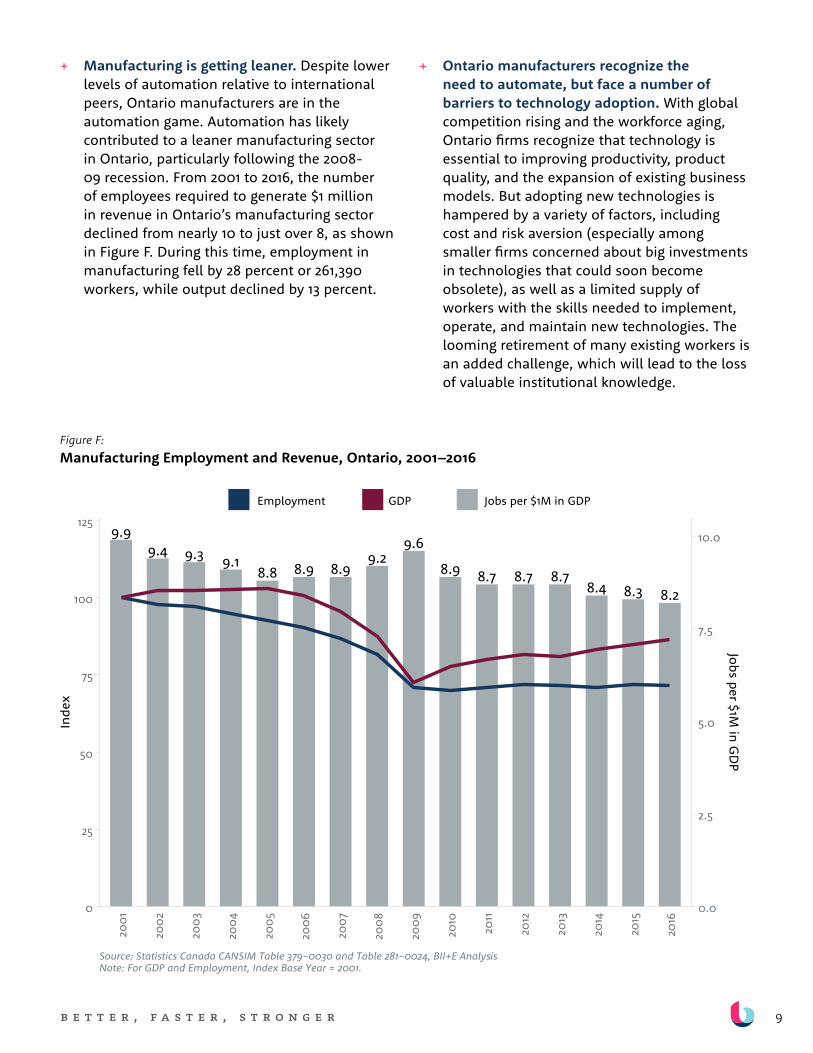
+ Manufacturing is getting leaner. Despite lower levels of automation relative to international peers, Ontario manufacturers are in the automation game. Automation has likely contributed to a leaner manufacturing sector in Ontario, particularly following the 2008-09 recession. From 2001 to 2016, the number of employees required to generate $1 million in revenue in Ontario’s manufacturing sector declined from nearly 10 to just over 8, as shown in Figure F. During this time, employment in manufacturing fell by 28 percent or 261,390 workers, while output declined by 13 percent.
+ Ontario manufacturers recognize the need to automate, but face a number of barriers to technology adoption. With global competition rising and the workforce aging, Ontario firms recognize that technology is essential to improving productivity, product quality, and the expansion of existing business models. But adopting new technologies is hampered by a variety of factors, including cost and risk aversion (especially among smaller firms concerned about big investments in technologies that could soon become obsolete), as well as a limited supply of workers with the skills needed to implement, operate, and maintain new technologies. The looming retirement of many existing workers is an added challenge, which will lead to the loss of valuable institutional knowledge.
Figure F: Manufacturing Employment and Revenue, Ontario, 2001–2016
10b e t t e r , f a s t e r , s t r o n g e r
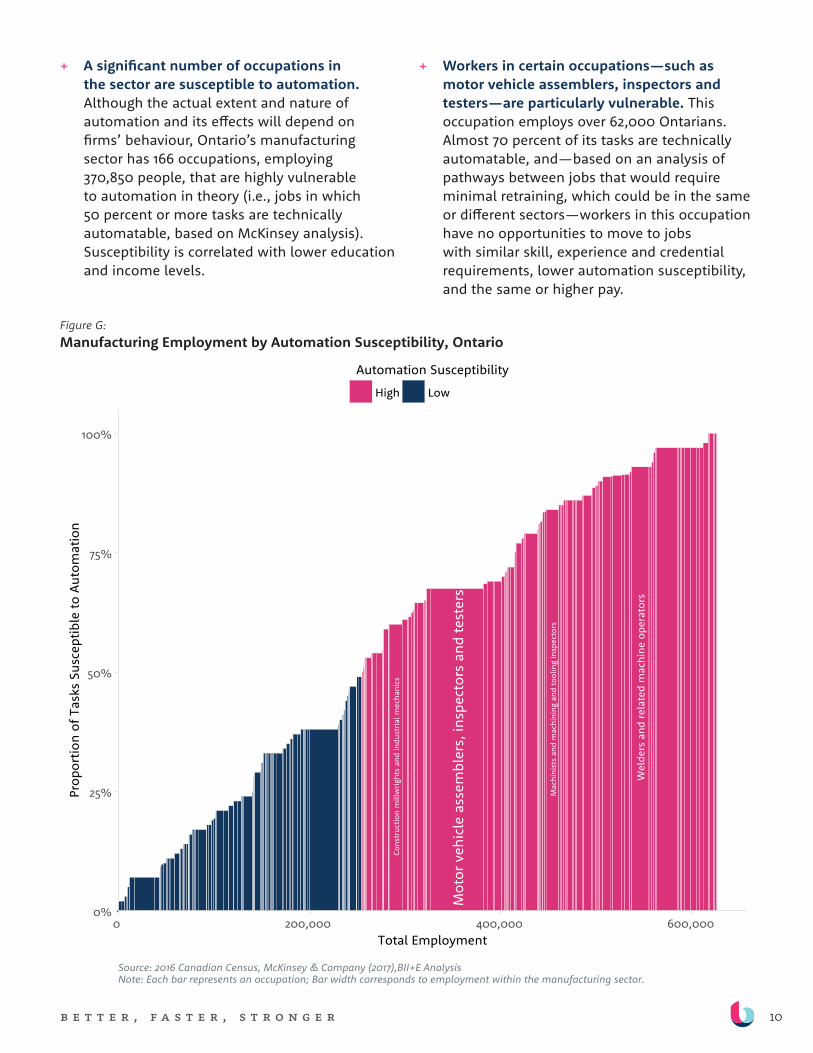
+ A significant number of occupations in the sector are susceptible to automation. Although the actual extent and nature of automation and its effects will depend on firms’ behaviour, Ontario’s manufacturing sector has 166 occupations, employing 370,850 people, that are highly vulnerable to automation in theory (i.e., jobs in which 50 percent or more tasks are technically automatable, based on McKinsey analysis). Susceptibility is correlated with lower education and income levels.
+ Workers in certain occupations—such as motor vehicle assemblers, inspectors and testers—are particularly vulnerable. This occupation employs over 62,000 Ontarians. Almost 70 percent of its tasks are technically automatable, and—based on an analysis of pathways between jobs that would require minimal retraining, which could be in the same or different sectors—workers in this occupation have no opportunities to move to jobs with similar skill, experience and credential requirements, lower automation susceptibility, and the same or higher pay.
Figure G: Manufacturing Employment by Automation Susceptibility, Ontario
11b e t t e r , f a s t e r , s t r o n g e r
FINANCE AND INSURANCE SECTOR INSIGHTS
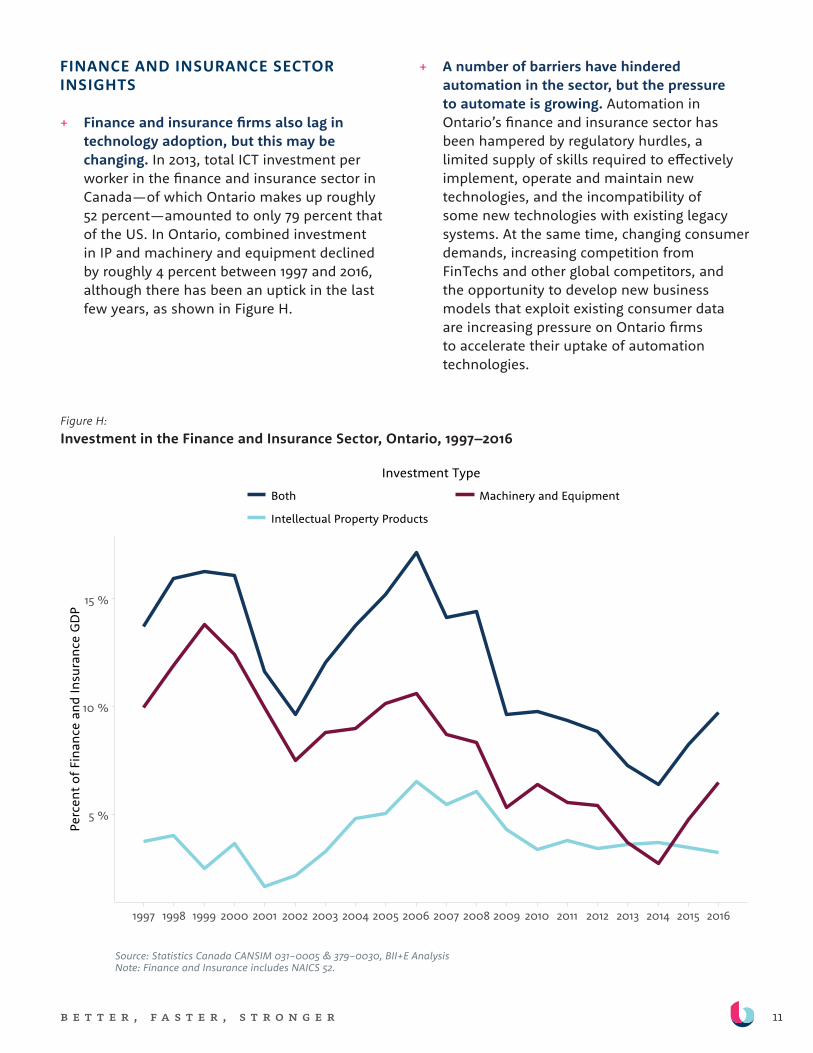
+ Finance and insurance firms also lag in technology adoption, but this may be changing. In 2013, total ICT investment per worker in the finance and insurance sector in Canada—of which Ontario makes up roughly 52 percent—amounted to only 79 percent that of the US. In Ontario, combined investment in IP and machinery and equipment declined by roughly 4 percent between 1997 and 2016, although there has been an uptick in the last few years, as shown in Figure H.
+ A number of barriers have hindered automation in the sector, but the pressure to automate is growing. Automation in Ontario’s finance and insurance sector has been hampered by regulatory hurdles, a limited supply of skills required to effectively implement, operate and maintain new technologies, and the incompatibility of some new technologies with existing legacy systems. At the same time, changing consumer demands, increasing competition from FinTechs and other global competitors, and the opportunity to develop new business models that exploit existing consumer data are increasing pressure on Ontario firms to accelerate their uptake of automation technologies.
Figure H: Investment in the Finance and Insurance Sector, Ontario, 1997–2016
12b e t t e r , f a s t e r , s t r o n g e r
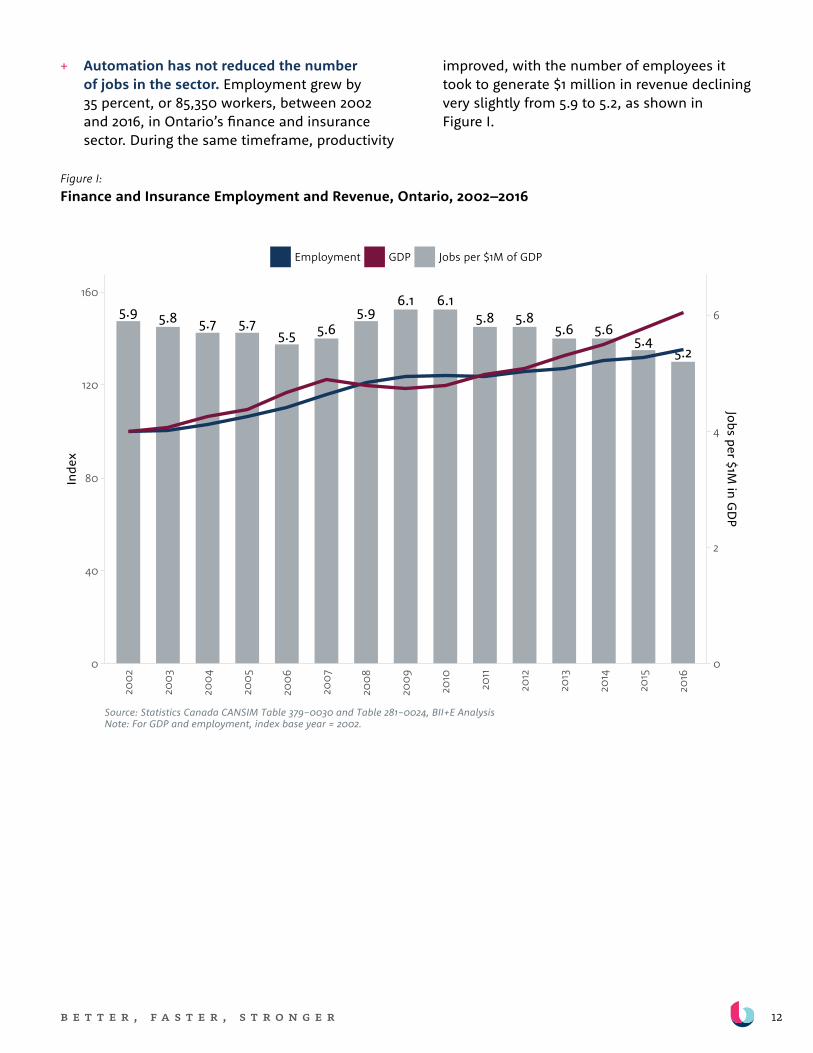
+ Automation has not reduced the number of jobs in the sector. Employment grew by 35 percent, or 85,350 workers, between 2002 and 2016, in Ontario’s finance and insurance sector. During the same timeframe, productivity
improved, with the number of employees it took to generate $1 million in revenue declining very slightly from 5.9 to 5.2, as shown in Figure I.
Figure I: Finance and Insurance Employment and Revenue, Ontario, 2002–2016
5.9 5.8 5.7 5.75.5 5.6
5.96.1 6.1
5.8 5.85.6 5.6
5.45.2
0
40
80
120
160
0
2
4
6
2002
2003
2004
2005
2006
2007
2008
2009
2010
2011
2012
2013
2014
2015
2016
Inde
xJobs per $1M
in GD
P
Employment GDP Jobs per $1M of GDP
Finance and Insurance Employment and Revenue, Ontario, 2002−2016Figure 7.11
Source: Statistics Canada CANSIM Table 379−0030 and Table 281−0024, BII+E Analysis Note: For GDP and employment, index base year = 2002.
13b e t t e r , f a s t e r , s t r o n g e r
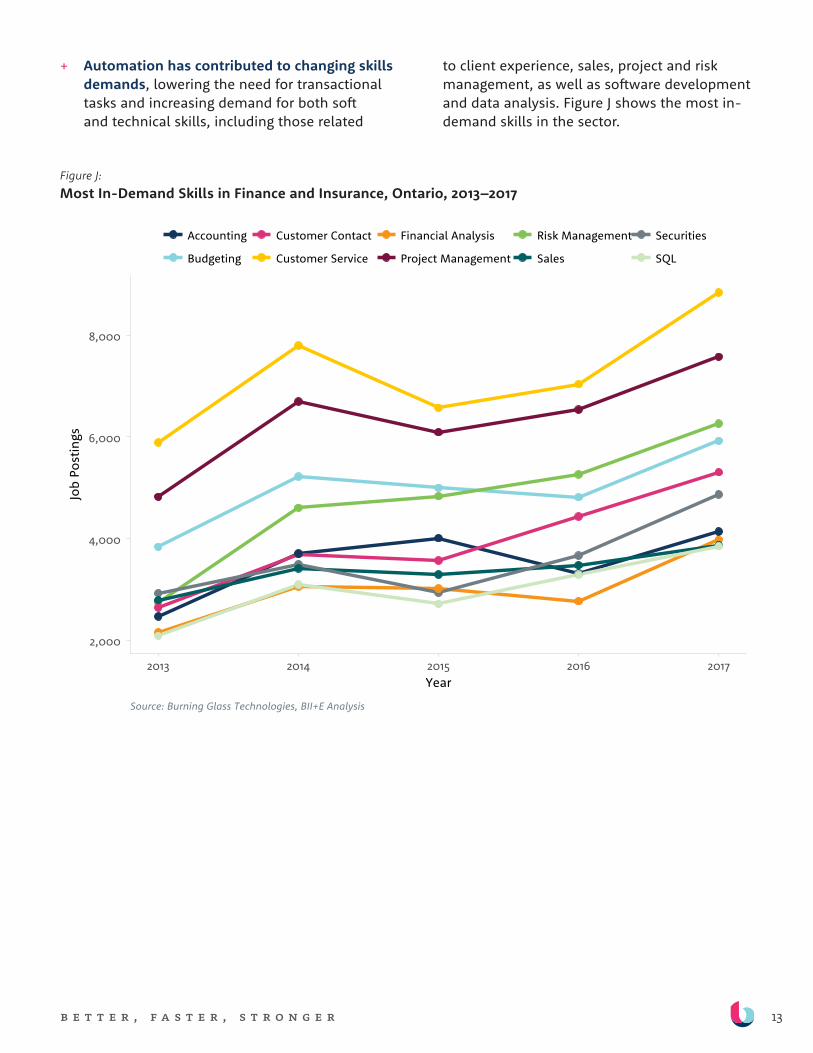
+ Automation has contributed to changing skills demands, lowering the need for transactional tasks and increasing demand for both soft and technical skills, including those related
to client experience, sales, project and risk management, as well as software development and data analysis. Figure J shows the most in-demand skills in the sector.
Figure J: Most In-Demand Skills in Finance and Insurance, Ontario, 2013–2017
14b e t t e r , f a s t e r , s t r o n g e r
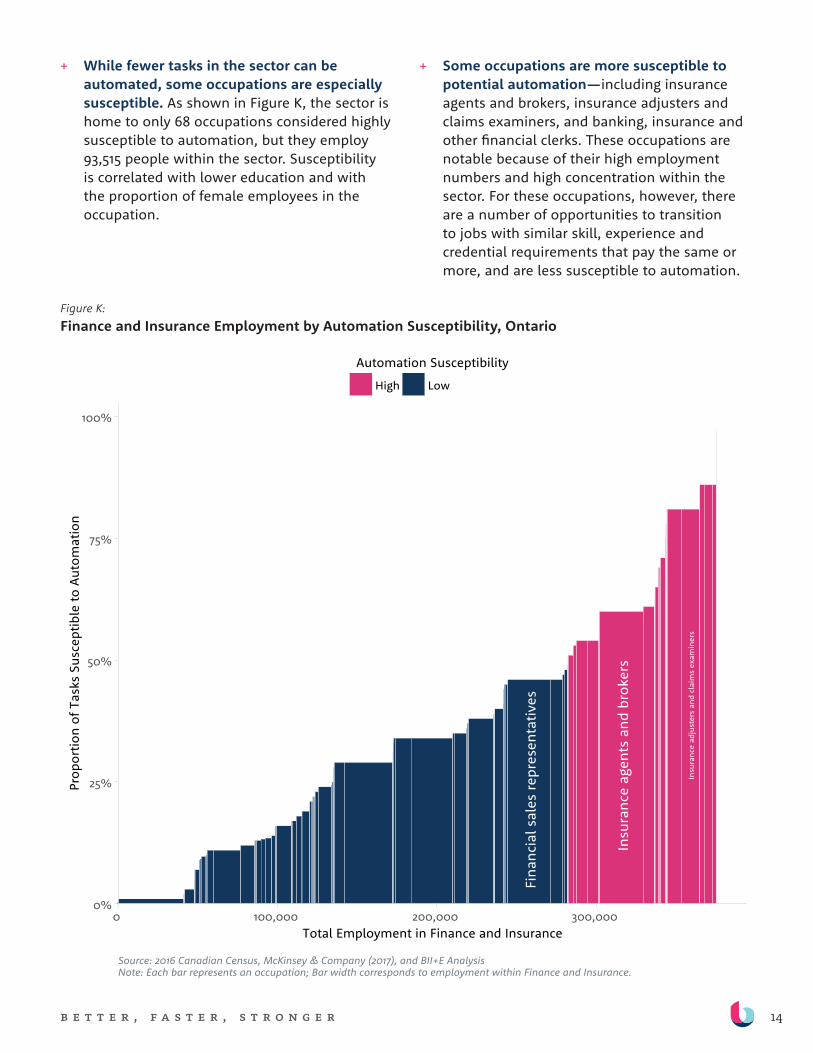
+ While fewer tasks in the sector can be automated, some occupations are especially susceptible. As shown in Figure K, the sector is home to only 68 occupations considered highly susceptible to automation, but they employ 93,515 people within the sector. Susceptibility is correlated with lower education and with the proportion of female employees in the occupation.
+ Some occupations are more susceptible to potential automation—including insurance agents and brokers, insurance adjusters and claims examiners, and banking, insurance and other financial clerks. These occupations are notable because of their high employment numbers and high concentration within the sector. For these occupations, however, there are a number of opportunities to transition to jobs with similar skill, experience and credential requirements that pay the same or more, and are less susceptible to automation.
Figure K: Finance and Insurance Employment by Automation Susceptibility, Ontario
15b e t t e r , f a s t e r , s t r o n g e r
ONTARIO’S DUAL CHALLENGE
+ To date, efforts to promote innovation and technology adoption, and efforts to train workers, have existed largely in parallel. Yet Ontario faces a dual challenge: to stimulate technology adoption among businesses to improve competitiveness, while simultaneously ensuring that workers have the skills to adapt to—and even drive—this change.
A HIGH-LEVEL STRATEGY
+ Responding to this dual challenge in a way that benefits both firms and workers demands more than incremental change. It requires a strong vision and leadership, better collaboration among the public, private and non-profit sectors, and fundamental changes to education and training models, firm behaviour, and established labour market tools. Specifically, it will require:
1. Investment in tech R&D and adoption. Achieving the productivity and competitiveness benefits of automation—and long-term job creation—requires the development, adoption, and effective use of relevant technologies. The governments of Ontario and Canada have already made substantial investments to support the development and adoption of automation technologies. These investments should be monitored, to determine whether they are having their intended effects or require augmentation.
2. A system for lifelong education that offers a wide array of relevant and accessible retraining and upskilling programs. While our education system has continued to evolve to meet changing needs, it has not kept pace with technological change. Ontarians require a robust system for lifelong education that matches the scale of earlier efforts to support the shift from farm to factory and office. This modernized system requires:
– Modular, stackable training programs that are more tailored to tasks and skills than occupations, and that could be combined in different ways.
– Flexible programs that can accommodate a variety of schedules and allow for working while training, reflecting the fact that, for many, it is neither practical nor desirable to go back to school for months or years.
– Task-based skills recognition models, such as micro-credentials.
– A review of regulatory frameworks and public funding mechanisms to ensure they do not inadvertently inhibit lifelong education. Ultimately, the shift to a system of lifelong education may require dedicated funding that reflects the size of this ambition.
– Participation and input from all stakeholders—including students and workers, employers, colleges, universities, private and non-profit training organizations, unions, and governments.
3. A coordinated, cooperative approach to firm and worker success. Firm and worker success are closely intertwined. Firms succeed when they have workers with skills that meet their needs, support innovation, and enable and complement specific technology changes. Workers succeed when their skill sets meet employer needs, provide a foundation for lifelong learning, and contribute to their resilience in the face of technological and labour market change. Responding to firm and worker needs requires collaboration between businesses, post-secondary institutions and other training organizations and, in some cases, unions. Governments have an important role to play in fostering this collaboration. This can take a few forms, notably:
– Consortia models, specific to an industry and region, can help to pool the costs and risks of training among multiple employers,
16b e t t e r , f a s t e r , s t r o n g e r
deliver training that is employer-informed and responsive to particular industry needs, and help workers adapt with changing skills demands. Firms may also collaborate on some aspects of R&D and tech adoption. There are promising consortia models that could be expanded or learned from, such as the Hamilton Skilled Trades and Apprenticeship Consortium, which brings together several manufacturing employers, Mohawk college and the steelworkers union. Ontario’s federally-supported advanced manufacturing “supercluster” also presents an opportunity to embed a collaborative approach to training within a broader innovation agenda.
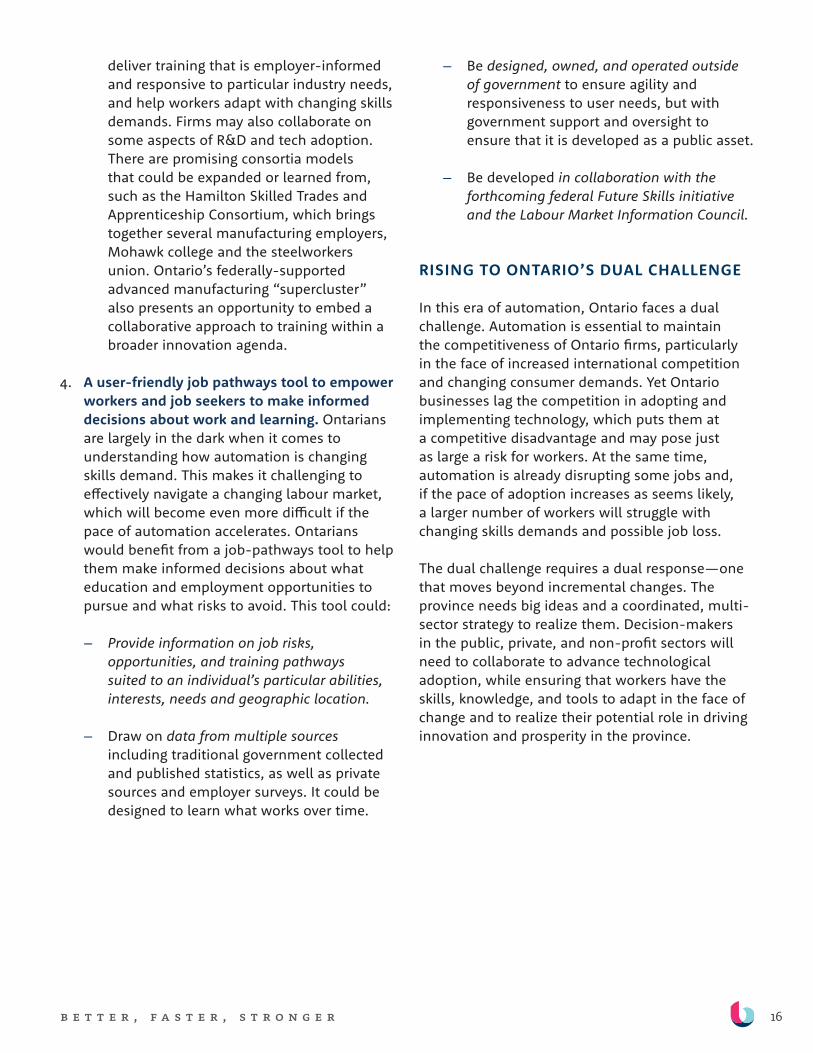
4. A user-friendly job pathways tool to empower workers and job seekers to make informed decisions about work and learning. Ontarians are largely in the dark when it comes to understanding how automation is changing skills demand. This makes it challenging to effectively navigate a changing labour market, which will become even more difficult if the pace of automation accelerates. Ontarians would benefit from a job-pathways tool to help them make informed decisions about what education and employment opportunities to pursue and what risks to avoid. This tool could:
– Provide information on job risks, opportunities, and training pathways suited to an individual’s particular abilities, interests, needs and geographic location.
– Draw on data from multiple sources including traditional government collected and published statistics, as well as private sources and employer surveys. It could be designed to learn what works over time.
– Be designed, owned, and operated outside of government to ensure agility and responsiveness to user needs, but with government support and oversight to ensure that it is developed as a public asset.
– Be developed in collaboration with the forthcoming federal Future Skills initiative and the Labour Market Information Council.
RISING TO ONTARIO’S DUAL CHALLENGE
In this era of automation, Ontario faces a dual challenge. Automation is essential to maintain the competitiveness of Ontario firms, particularly in the face of increased international competition and changing consumer demands. Yet Ontario businesses lag the competition in adopting and implementing technology, which puts them at a competitive disadvantage and may pose just as large a risk for workers. At the same time, automation is already disrupting some jobs and, if the pace of adoption increases as seems likely, a larger number of workers will struggle with changing skills demands and possible job loss.
The dual challenge requires a dual response—one that moves beyond incremental changes. The province needs big ideas and a coordinated, multi-sector strategy to realize them. Decision-makers in the public, private, and non-profit sectors will need to collaborate to advance technological adoption, while ensuring that workers have the skills, knowledge, and tools to adapt in the face of change and to realize their potential role in driving innovation and prosperity in the province.
17b e t t e r , f a s t e r , s t r o n g e r
i n t r o d u c t i o n The goals of this study are to provide
decision makers across the public,
private and non-profit sectors with
a more granular, nuanced picture
of how automation is unfolding in
particular sectors and communities
across Ontario.
In the face of rapid technological advancements, global competition, and changing consumer demands, Ontario businesses, across the economy, are turning to automation to maintain
their competitive footing. These investments in technology have the potential to profoundly shape their growth and competitiveness and the employment prospects of people, in both positive and negative ways. To ensure that automation is beneficial to Ontario businesses and workers, the province must do two things in concert: 1) find ways to encourage and enable technology adoption, and 2) take steps to prepare workers for changing roles and occupations and mitigate the negative impacts of automation on people and communities most at risk.
Throughout history, technology has had significant and varying impacts on the labour market. Modern digital technologies have pervaded the economy, changing the nature of skills demand, unbundling jobs into discrete tasks, contributing to the rise of the gig economy and precarious employment, and enabling decentralization and offshoring of production. The impacts on workers—both positive and negative—are substantial and include changes in income, security, flexibility, job safety, how interesting jobs are, and both the creation and destruction of certain occupations.1,2
This report focuses on the impact of one area of technological change on Ontario’s economy—automation. Automation’s impacts can be significant. For business, it can increase productivity and competitiveness; for workers, it can lead to new job opportunities, disruption and labour substitution.3,4
Previous studies on the potential impact of automation focus mainly on jurisdictions other than Ontario or Canada, or on the economy as a whole rather than individual sectors. Moreover, much of the literature emphasizes the potential negative impact of automation on workers in general, while largely ignoring the distribution of risks and benefits for different people and communities, as well as the opportunities it might present for employers and workers alike.
The goals of this study are to provide decision makers across the public, private and non-profit sectors with a more granular, nuanced picture of how automation is unfolding in particular sectors and communities across Ontario, and to highlight strategies for realizing the benefits of automation while mitigating its drawbacks for certain people and communities.
18b e t t e r , f a s t e r , s t r o n g e r
APPROACH + METHODOLOGY
To unpack the impact of automation on workers in Ontario we examined economy-wide trends, closely analyzed two sectors that are broadly representative of how automation is affecting workers in the province, and explored the experiences and perceptions of Ontarians from different communities.
We have employed a mixed methods approach involving a number of interrelated research streams:
Drawing on a review of existing literature, an examination of relevant data, and semi-structured interviews with over 50 individuals (representing labour, businesses, and developers of technology in both sectors), we examined and analyzed the impact of automation on the economy writ large, as well as in two sectors in the Ontario economy—manufacturing, and finance and insurance.
We also conducted a two-phase citizen engagement process to deepen our understanding of the impacts of automation on Ontario’s labour force and to gather insights on how automation is playing out in different parts of the province, how it is perceived, and what forms of support may be needed to help workers adjust. Phase 1 involved 120 participants from 36 cities across Ontario. Phase 2 involved 12 public and stakeholder workshops in Sudbury, Woodstock, Windsor, Chatham, London and Kingston, as well as a public survey, completed by 122 participants, aimed at allowing those unable to participate in person to share their insights.
In addition, we convened an Expert Advisory Panel of 14 individuals with academic, technological and industry expertise. Their role was to oversee this research, advise on sectors for analysis, and provide advice and feedback on the methodology, structure, framing and content of the report. The Panel met three times over the course of the project.
This report focuses on the implications of private sector organizations’ decisions to automate, recognizing that automation drivers, barriers and impacts differ for public and non-profit sector organizations.
19b e t t e r , f a s t e r , s t r o n g e r
A u t o m A t i o n ,
t e c h n o l o g y +
l A b o u r
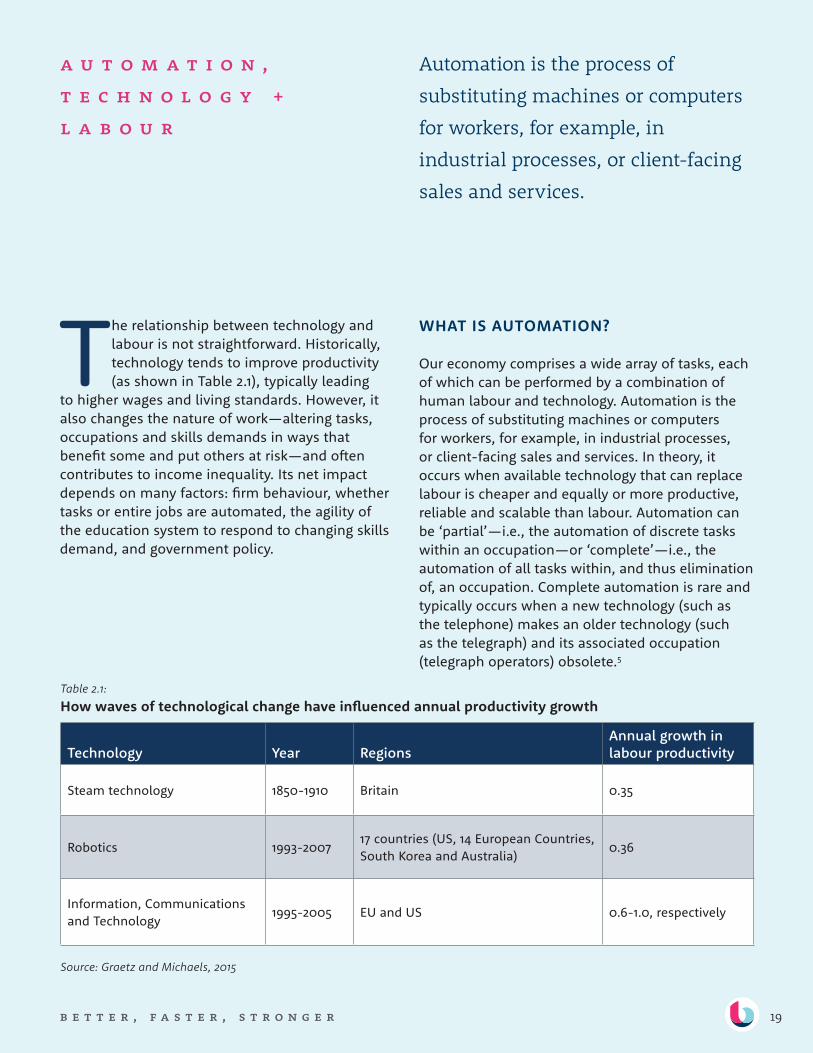
The relationship between technology and labour is not straightforward. Historically, technology tends to improve productivity (as shown in Table 2.1), typically leading
to higher wages and living standards. However, it also changes the nature of work—altering tasks, occupations and skills demands in ways that benefit some and put others at risk—and often contributes to income inequality. Its net impact depends on many factors: firm behaviour, whether tasks or entire jobs are automated, the agility of the education system to respond to changing skills demand, and government policy.
WHAT IS AUTOMATION?
Our economy comprises a wide array of tasks, each of which can be performed by a combination of human labour and technology. Automation is the process of substituting machines or computers for workers, for example, in industrial processes, or client-facing sales and services. In theory, it occurs when available technology that can replace labour is cheaper and equally or more productive, reliable and scalable than labour. Automation can be ‘partial’—i.e., the automation of discrete tasks within an occupation—or ‘complete’—i.e., the automation of all tasks within, and thus elimination of, an occupation. Complete automation is rare and typically occurs when a new technology (such as the telephone) makes an older technology (such as the telegraph) and its associated occupation (telegraph operators) obsolete.5
Table 2.1: How waves of technological change have influenced annual productivity growth
Technology Year RegionsAnnual growth in labour productivity
Steam technology 1850-1910 Britain 0.35
Robotics 1993-200717 countries (US, 14 European Countries, South Korea and Australia)
0.36
Information, Communications and Technology
1995-2005 EU and US 0.6-1.0, respectively
Source: Graetz and Michaels, 2015
Automation is the process of
substituting machines or computers
for workers, for example, in
industrial processes, or client-facing
sales and services.
20b e t t e r , f a s t e r , s t r o n g e r
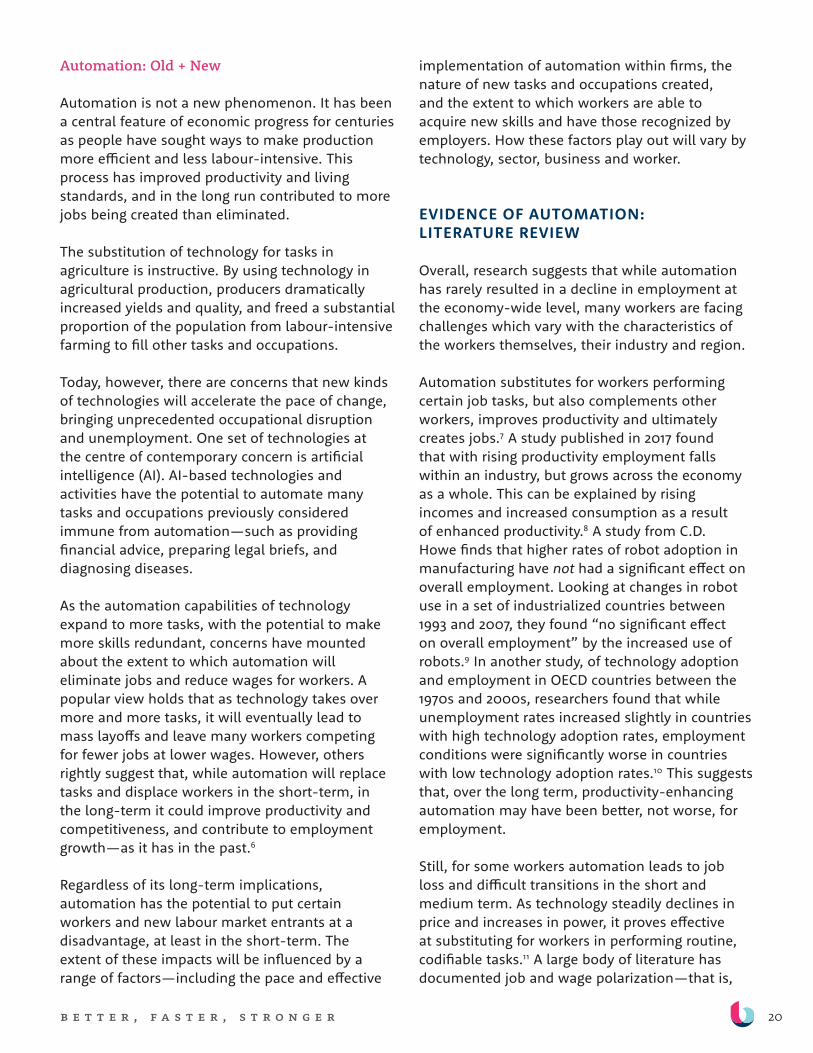
Automation: Old + New
Automation is not a new phenomenon. It has been a central feature of economic progress for centuries as people have sought ways to make production more efficient and less labour-intensive. This process has improved productivity and living standards, and in the long run contributed to more jobs being created than eliminated.
The substitution of technology for tasks in agriculture is instructive. By using technology in agricultural production, producers dramatically increased yields and quality, and freed a substantial proportion of the population from labour-intensive farming to fill other tasks and occupations.
Today, however, there are concerns that new kinds of technologies will accelerate the pace of change, bringing unprecedented occupational disruption and unemployment. One set of technologies at the centre of contemporary concern is artificial intelligence (AI). AI-based technologies and activities have the potential to automate many tasks and occupations previously considered immune from automation—such as providing financial advice, preparing legal briefs, and diagnosing diseases.
As the automation capabilities of technology expand to more tasks, with the potential to make more skills redundant, concerns have mounted about the extent to which automation will eliminate jobs and reduce wages for workers. A popular view holds that as technology takes over more and more tasks, it will eventually lead to mass layoffs and leave many workers competing for fewer jobs at lower wages. However, others rightly suggest that, while automation will replace tasks and displace workers in the short-term, in the long-term it could improve productivity and competitiveness, and contribute to employment growth—as it has in the past.6
Regardless of its long-term implications, automation has the potential to put certain workers and new labour market entrants at a disadvantage, at least in the short-term. The extent of these impacts will be influenced by a range of factors—including the pace and effective
implementation of automation within firms, the nature of new tasks and occupations created, and the extent to which workers are able to acquire new skills and have those recognized by employers. How these factors play out will vary by technology, sector, business and worker.
EVIDENCE OF AUTOMATION: LITERATURE REVIEW
Overall, research suggests that while automation has rarely resulted in a decline in employment at the economy-wide level, many workers are facing challenges which vary with the characteristics of the workers themselves, their industry and region.
Automation substitutes for workers performing certain job tasks, but also complements other workers, improves productivity and ultimately creates jobs.7 A study published in 2017 found that with rising productivity employment falls within an industry, but grows across the economy as a whole. This can be explained by rising incomes and increased consumption as a result of enhanced productivity.8 A study from C.D. Howe finds that higher rates of robot adoption in manufacturing have not had a significant effect on overall employment. Looking at changes in robot use in a set of industrialized countries between 1993 and 2007, they found “no significant effect on overall employment” by the increased use of robots.9 In another study, of technology adoption and employment in OECD countries between the 1970s and 2000s, researchers found that while unemployment rates increased slightly in countries with high technology adoption rates, employment conditions were significantly worse in countries with low technology adoption rates.10 This suggests that, over the long term, productivity-enhancing automation may have been better, not worse, for employment.
Still, for some workers automation leads to job loss and difficult transitions in the short and medium term. As technology steadily declines in price and increases in power, it proves effective at substituting for workers in performing routine, codifiable tasks.11 A large body of literature has documented job and wage polarization—that is,
21b e t t e r , f a s t e r , s t r o n g e r
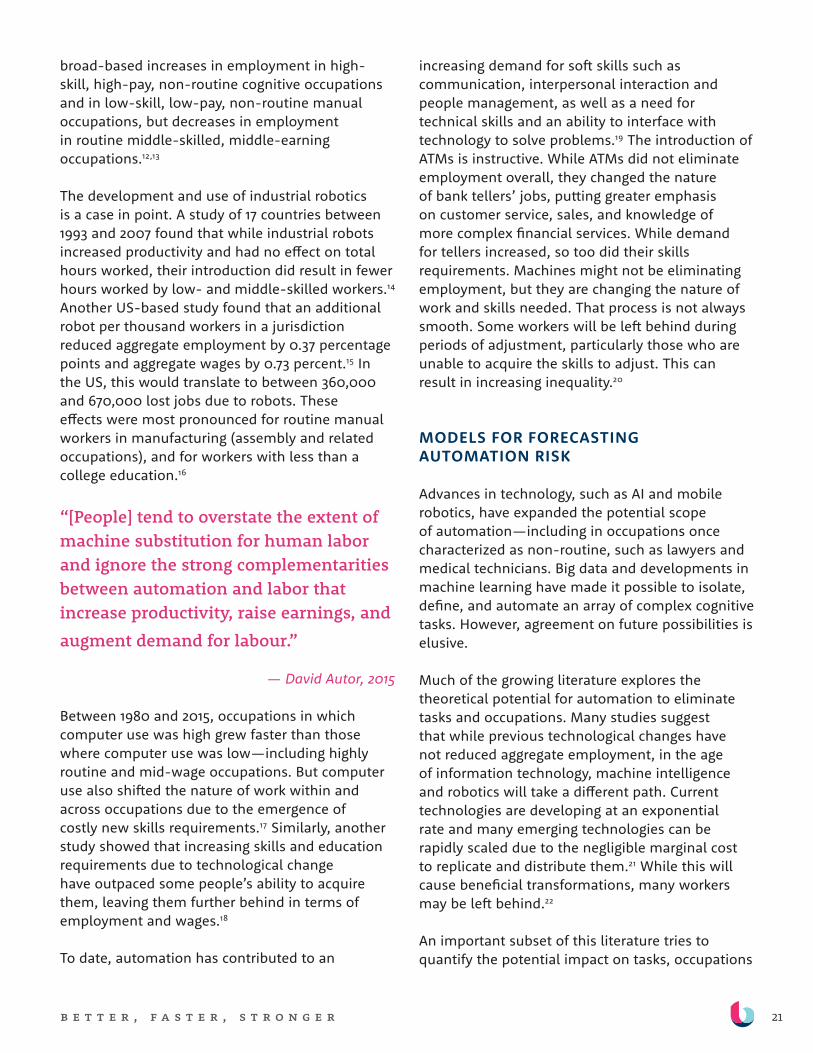
broad-based increases in employment in high-skill, high-pay, non-routine cognitive occupations and in low-skill, low-pay, non-routine manual occupations, but decreases in employment in routine middle-skilled, middle-earning occupations.12,13
The development and use of industrial robotics is a case in point. A study of 17 countries between 1993 and 2007 found that while industrial robots increased productivity and had no effect on total hours worked, their introduction did result in fewer hours worked by low- and middle-skilled workers.14 Another US-based study found that an additional robot per thousand workers in a jurisdiction reduced aggregate employment by 0.37 percentage points and aggregate wages by 0.73 percent.15 In the US, this would translate to between 360,000 and 670,000 lost jobs due to robots. These effects were most pronounced for routine manual workers in manufacturing (assembly and related occupations), and for workers with less than a college education.16
“[People] tend to overstate the extent of machine substitution for human labor and ignore the strong complementarities between automation and labor that increase productivity, raise earnings, and
augment demand for labour.”
— David Autor, 2015
Between 1980 and 2015, occupations in which computer use was high grew faster than those where computer use was low—including highly routine and mid-wage occupations. But computer use also shifted the nature of work within and across occupations due to the emergence of costly new skills requirements.17 Similarly, another study showed that increasing skills and education requirements due to technological change have outpaced some people’s ability to acquire them, leaving them further behind in terms of employment and wages.18
To date, automation has contributed to an
increasing demand for soft skills such as communication, interpersonal interaction and people management, as well as a need for technical skills and an ability to interface with technology to solve problems.19 The introduction of ATMs is instructive. While ATMs did not eliminate employment overall, they changed the nature of bank tellers’ jobs, putting greater emphasis on customer service, sales, and knowledge of more complex financial services. While demand for tellers increased, so too did their skills requirements. Machines might not be eliminating employment, but they are changing the nature of work and skills needed. That process is not always smooth. Some workers will be left behind during periods of adjustment, particularly those who are unable to acquire the skills to adjust. This can result in increasing inequality.20
MODELS FOR FORECASTING AUTOMATION RISK
Advances in technology, such as AI and mobile robotics, have expanded the potential scope of automation—including in occupations once characterized as non-routine, such as lawyers and medical technicians. Big data and developments in machine learning have made it possible to isolate, define, and automate an array of complex cognitive tasks. However, agreement on future possibilities is elusive.
Much of the growing literature explores the theoretical potential for automation to eliminate tasks and occupations. Many studies suggest that while previous technological changes have not reduced aggregate employment, in the age of information technology, machine intelligence and robotics will take a different path. Current technologies are developing at an exponential rate and many emerging technologies can be rapidly scaled due to the negligible marginal cost to replicate and distribute them.21 While this will cause beneficial transformations, many workers may be left behind.22
An important subset of this literature tries to quantify the potential impact on tasks, occupations
22b e t t e r , f a s t e r , s t r o n g e r
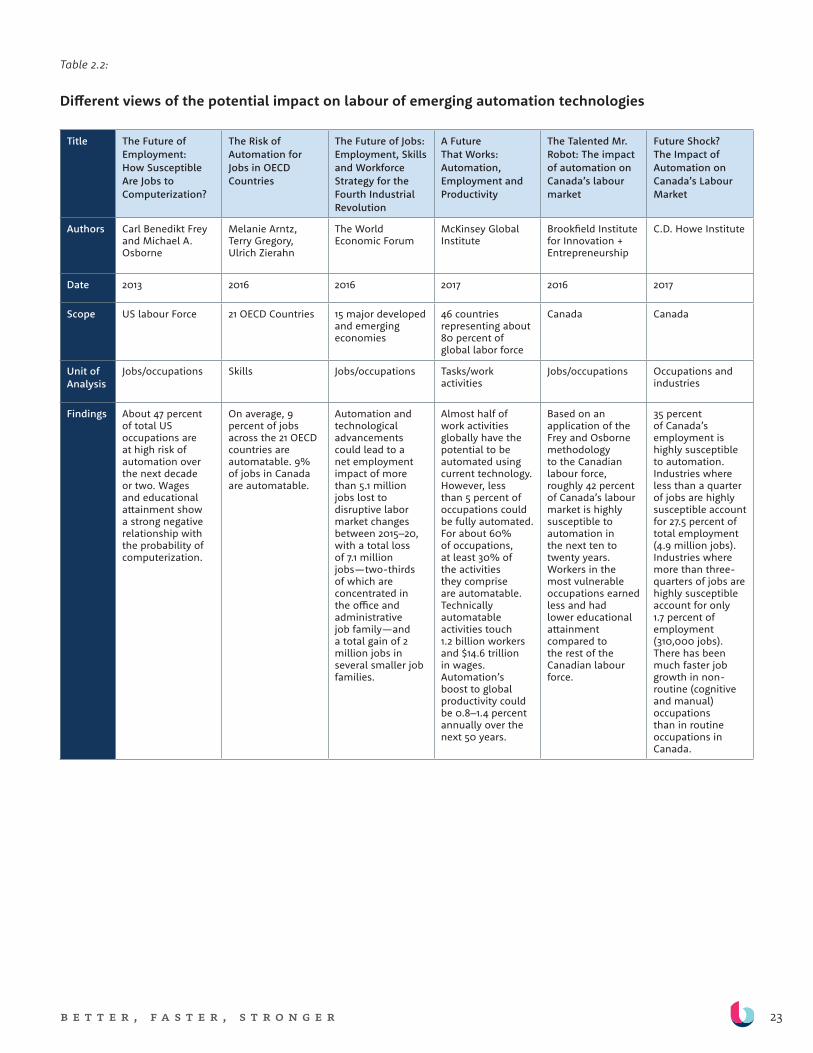
and employment of new and emerging automation technologies (see Table 2). Each of these studies takes a different approach and focuses on a different unit of analysis: tasks, occupations, or employment more broadly. All focus on the interaction between technological capabilities, the tasks and skills that can be automated, and the distribution of those tasks and skills in the labour force. The core message in most of these studies is that automation poses a risk for a substantial share of workers across the economy.
These models offer valuable insight into the potential magnitude of automation’s impact on work, as well as which workers are slated to benefit or lose out as a result of automation. However, they rely on an assessment of automation potential that is based on existing technology, and tend to place less emphasis on other factors that may influence the likelihood, nature or extent of these effects.
For this report, we use McKinsey’s model to quantify automation susceptibility. While its model, like others, looks only at the technical possibility of automation, its task-based approach allows for more granular analysis. McKinsey’s approach recognizes that a job comprises a variety of tasks, and that automation is much more likely to replace certain tasks in a job, rather than the job in its entirety. We also supplement these findings by examining the internal and external contexts that influence a firm’s decision to automate job tasks and to either reduce or retrain their existing workforce.
“There’s never been a better time to be a worker with special skills or the right education because these people can use technology to create and capture value.” However, “there’s never been a worse time to be a worker with only ‘ordinary’ skills and abilities to offer, because computers, robots and other digital technologies are acquiring these skills and abilities at an extraordinary rate”
— Erik Brynjolfsson and Andrew McAfee, 2014
23b e t t e r , f a s t e r , s t r o n g e r
Table 2.2:
Different views of the potential impact on labour of emerging automation technologies
Title The Future of Employment: How Susceptible Are Jobs to Computerization?
The Risk of Automation for Jobs in OECD Countries
The Future of Jobs: Employment, Skills and Workforce Strategy for the Fourth Industrial Revolution
A Future That Works: Automation, Employment and Productivity
The Talented Mr. Robot: The impact of automation on Canada’s labour market
Future Shock? The Impact of Automation on Canada’s Labour Market
Authors Carl Benedikt Frey and Michael A. Osborne
Melanie Arntz, Terry Gregory, Ulrich Zierahn
The World Economic Forum
McKinsey Global Institute
Brookfield Institute for Innovation + Entrepreneurship
C.D. Howe Institute
Date 2013 2016 2016 2017 2016 2017
Scope US labour Force 21 OECD Countries 15 major developed and emerging economies
46 countries representing about 80 percent of global labor force
Canada Canada
Unit of Analysis
Jobs/occupations Skills Jobs/occupations Tasks/work activities
Jobs/occupations Occupations and industries
Findings About 47 percent of total US occupations are at high risk of automation over the next decade or two. Wages and educational attainment show a strong negative relationship with the probability of computerization.
On average, 9 percent of jobs across the 21 OECD countries are automatable. 9% of jobs in Canada are automatable.
Automation and technological advancements could lead to a net employment impact of more than 5.1 million jobs lost to disruptive labor market changes between 2015–20, with a total loss of 7.1 million jobs—two-thirds of which are concentrated in the office and administrative job family—and a total gain of 2 million jobs in several smaller job families.
Almost half of work activities globally have the potential to be automated using current technology. However, less than 5 percent of occupations could be fully automated. For about 60% of occupations, at least 30% of the activities they comprise are automatable. Technically automatable activities touch 1.2 billion workers and $14.6 trillion in wages. Automation’s boost to global productivity could be 0.8–1.4 percent annually over the next 50 years.
Based on an application of the Frey and Osborne methodology to the Canadian labour force, roughly 42 percent of Canada’s labour market is highly susceptible to automation in the next ten to twenty years. Workers in the most vulnerable occupations earned less and had lower educational attainment compared to the rest of the Canadian labour force.
35 percent of Canada’s employment is highly susceptible to automation. Industries where less than a quarter of jobs are highly susceptible account for 27.5 percent of total employment (4.9 million jobs). Industries where more than three-quarters of jobs are highly susceptible account for only 1.7 percent of employment (310,000 jobs). There has been much faster job growth in non-routine (cognitive and manual) occupations than in routine occupations in Canada.
24b e t t e r , f a s t e r , s t r o n g e r
ARTIFICIAL INTELLIGENCE:
A NEW GENERAL PURPOSE TECHNOLOGY ?Recent Developments in Artificial Intelligence
Recent Developments in Artificial Intelligence (AI)AI is an area of computer science that aims to use machines and data to perform tasks associated with human intelligence—such as seeing, sorting, predicting and creating. An especially interesting variant of AI is machine learning, whereby machines move beyond simply sorting and analyzing data based on static algorithms defined by people to developing new processes and rules for analysis and decision-making based on what machines learn from data and the mistakes they make in early iterations of analysis.
The AI Threat to Tasks and OccupationsAI largely performs a prediction function by identifying relationships in large datasets to anticipate outcomes. It has the potential to replace people in tasks that involve sorting and analyzing data and making predictions based on large datasets. This includes job tasks such as disease diagnosis and identifying and monitoring risks (cybersecurity, infrastructure, financial investing, actuarial analysis, etc.). However, as AI reduces the cost of prediction, it will also increase the value and demand for human judgment.23
A New General Purpose Technology?What may separate AI from other recent technological breakthroughs is its potential to become a general purpose technology (GPT). Examples of past waves of GPTs include electricity and the internal combustion engine. GPTs are pervasive, steadily improve over time, and give rise to a wide-array of complementary innovations. Machine learning algorithms have the potential to be widely applicable across sectors, are designed to consistently improve themselves over time, and are positioned to give rise to a broad array of complementary innovations— for instance self-driving cars.24 Should AI emerge as a GPT, its potential for disruption will be widespread.25
The State of AI Investment and AdoptionAlthough AI has the potential to disrupt tasks and occupations, its actual impact will depend on the state of AI development and, critically, on the extent to which businesses implement and use AI technologies effectively.
Current AI systems depend on access to and use of large, labeled training datasets, which are not readily available to all firms.26 However, recent advances in ‘few-shot’ or ‘one-shot’ learning have the potential to reduce data requirements, enabling wider application of AI.
Investment in AI research and development (R&D) is substantial. Internal investment in AI by large companies in 2016 is estimated at between $18 and $27 billion. AI also attracted 2 to 3 percent of all global venture capital funding in 2016. But, according to a 2017 McKinsey survey, only 20 percent of C-Suite respondents said that their companies have adopted one or more AI-related technologies at scale or in a core part of their business.27 While AI’s potential to disrupt tasks and occupations looms, development and implementation suggest that substantial disruption is likely still years away.

25b e t t e r , f a s t e r , s t r o n g e r
A f r A m e w o r k f o r
u n d e r S t A n d i n g t h e
d r i v e r S + i m p A c t S
o f A u t o m A t i o n
To get a clearer picture of the probability and potential effects of automation, we have supplemented conventional models with a more extensive framework that
includes the factors that shape a firm’s decision to automate and the impact those decisions have on different businesses and different people. This framework guides our analysis throughout the report. While it is beyond the scope of this paper—and of available data—to explore all of these relationships in depth, or to build a fully tractable model to quantify the likelihood and impact of automation based on this broader array of factors, nonetheless mapping these relationships affords important insights.
PART 1: DRIVERS + IMPACTS OF AUTOMATION (FIRM-LEVEL VIEW)
Missing from most predictive models of automation’s impacts is a structured examination of firm-level decision-making and behaviour. A more comprehensive and accurate model should incorporate a focus on the extent to which businesses actually adopt and use automation technologies, the factors that shape those decisions and the subsequent outcomes for workers and the economy. The key advantage of looking at firm-level behaviour is that it allows
us to move beyond simple analyses of how automation technologies could replace tasks and occupations to more robust analyses of the extent to which such technologies are actually being adopted and concretely affecting labour and productivity.28
In our framework, understanding the impact of automation technology on labour and productivity depends, first, on examining whether and to what extent firms adopt such technologies. This requires us to examine the external context in which firms operate, including competitive pressures, the relative cost of technology and labour, the regulatory environment, and social and consumer attitudes. It also requires us to examine characteristics of the firm—including its size, sector, available skills, expertise, and capacities, resources, strategy, union involvement, and employee perspectives. If and when certain technologies are adopted, the impact on labour and productivity is then understood as a function of how those specific technologies affect business activities, what new skills are needed as a result and the existing skill profiles of the firm’s workforce and the broader labour market.
Our framework focuses specifically on private sector organizations. Those in the public and non-profit sectors face different external and internal pressures.
We have supplemented existing
models estimating the potential
effects of automation, with a more
extensitve framework that includes
1) the factors that shape a firm’s
decision to automate and 2) the
impact those decisions have on
different businesses and people.
26b e t t e r , f a s t e r , s t r o n g e r
TECHNOLOGICAL POSSIBILITIES EXTERNAL CONTEXT
WORKERS COMPETITIVENESS
• Behaviour of competitors • Relative cost of technology and labour • Regulatory environment • Social and consumer a�itudes
What job tasks is technology capable of automating?
FIRM BEHAVIOUR• Decision to automate job tasks • Decision to retrain/re-deploy or release workes
• Increased productivity• Improved product quality • New business models
• Task elimination• Job destruction and creation• Changes in job quality• Changes in skills and educational requirements• Distributional implications: prolonged adjustment and inequality
FIRM CHARACTERISTICS
• Firm size • Skills and expertise • Financial resources• Presence of labour union
• Management capacity• Business strategy • Sector• Employee perspectives• Data capabilities
IMPACTS
CONVENTIONAL MODEL
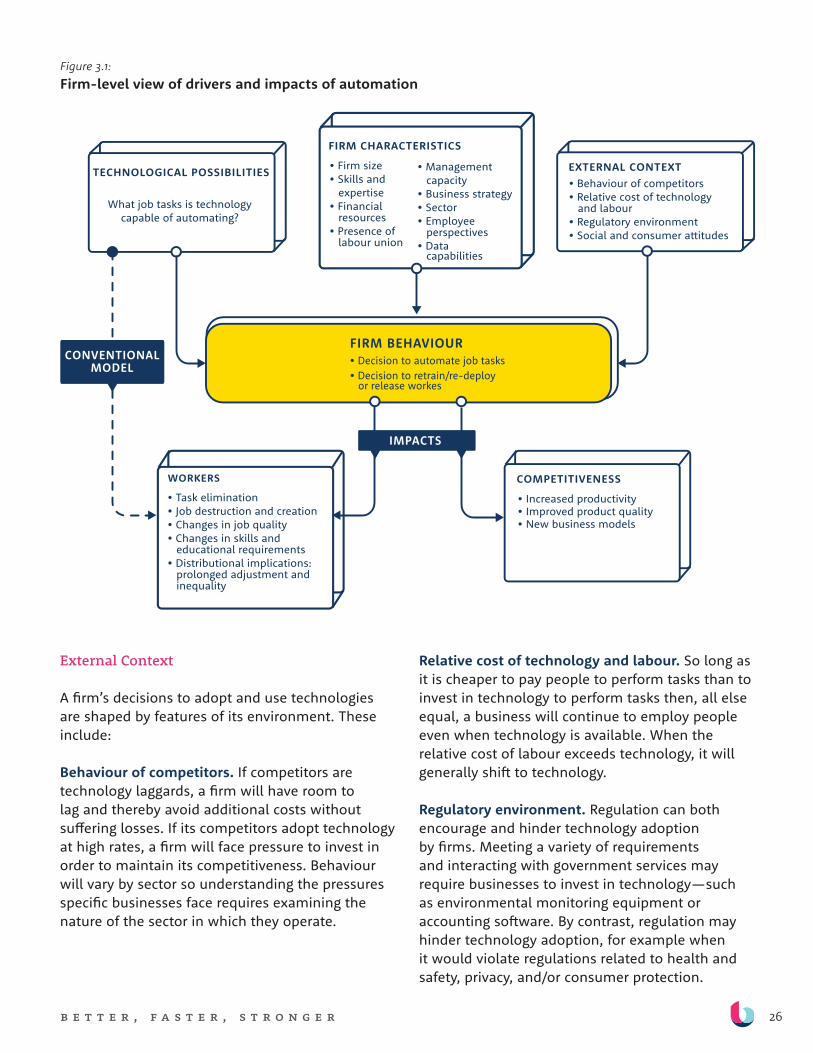
Figure 3.1: Firm-level view of drivers and impacts of automation
External Context
A firm’s decisions to adopt and use technologies are shaped by features of its environment. These include:
Behaviour of competitors. If competitors are technology laggards, a firm will have room to lag and thereby avoid additional costs without suffering losses. If its competitors adopt technology at high rates, a firm will face pressure to invest in order to maintain its competitiveness. Behaviour will vary by sector so understanding the pressures specific businesses face requires examining the nature of the sector in which they operate.
Relative cost of technology and labour. So long as it is cheaper to pay people to perform tasks than to invest in technology to perform tasks then, all else equal, a business will continue to employ people even when technology is available. When the relative cost of labour exceeds technology, it will generally shift to technology.
Regulatory environment. Regulation can both encourage and hinder technology adoption by firms. Meeting a variety of requirements and interacting with government services may require businesses to invest in technology—such as environmental monitoring equipment or accounting software. By contrast, regulation may hinder technology adoption, for example when it would violate regulations related to health and safety, privacy, and/or consumer protection.
27b e t t e r , f a s t e r , s t r o n g e r
Social and consumer attitudes. Although some technologies have the potential to improve customer experience, lower costs and enhance quality, some consumers may balk at interacting with certain technologies. While some firms may have the resources to adopt technologies and shift consumer attitudes, others will delay until a more receptive consumer market emerges.
Characteristics of Firms
A firm’s decisions to adopt and use technologies are also shaped by its characteristics. This includes:
Firm size and financial resources. Smaller businesses may find it harder to implement new technologies due to cost and the disruption to day-to-day activities that a small workforce must simultaneously manage.
Skills, expertise and management capacity. Implementing and operating new technologies requires people with appropriate technical skills and expertise, and managers with the vision, knowledge and people skills to facilitate the change and ensure an adequate return on investment.
Sector, business strategy and data capabilities. Businesses vary in their strategies and operating models, some of which are more conducive to investing and implementing automation technologies than others. For certain firms, it does not make business sense to invest in automation. For example, small artisanal businesses, predicated on providing hand-crafted, customized products and services, may be less likely to invest significantly in labour saving technology. Additionally, certain businesses do not collect the kinds of data, or have the data strategies in place, to implement and effectively use emerging technologies such as AI. And, in some cases, firms might have existing legacy systems that are not compatible with emerging technologies and which they cannot easily replace.
Employee perspectives. Incentives to automate will also vary at different levels in an organization. For example, a push for automation at the
executive level may be met with significant resistance at the middle management level. By contrast, employees in certain functions might benefit from the adoption of certain technologies about which executives are skeptical or show resistance.
Presence of labour unions. The presence of labour unions may influence the decisions that firms make with respect to retraining, deploying or releasing workers.
Impact on Workers + Firm Competitiveness
Among firms and sectors that adopt automation technologies, two kinds of impact can emerge: impact on productivity and competitiveness, and impact on workers and labour markets. Within each of those categories, diverse effects are possible.
Potential Impact on Productivity and CompetitivenessAs businesses face increasing competition and consumer demands, automation may contribute to their survival and growth. For some, automation can help:
+ Increase productivity. By substituting certain job tasks for faster and more reliable technology, firms can produce more goods and services much more efficiently, ultimately increasing margins and revenue.
+ Improve product quality. Automation can also increase the consistency, accuracy and customization of products and services. This can enable firms to better meet consumer demands.
+ Develop new business models. Automation can enable firms to engage in vertical integration, incorporating new processes and practices and reducing reliance on external suppliers. Additionally, firms can leverage automation to identify and establish new business models, for example, by drawing on existing datasets.
28b e t t e r , f a s t e r , s t r o n g e r
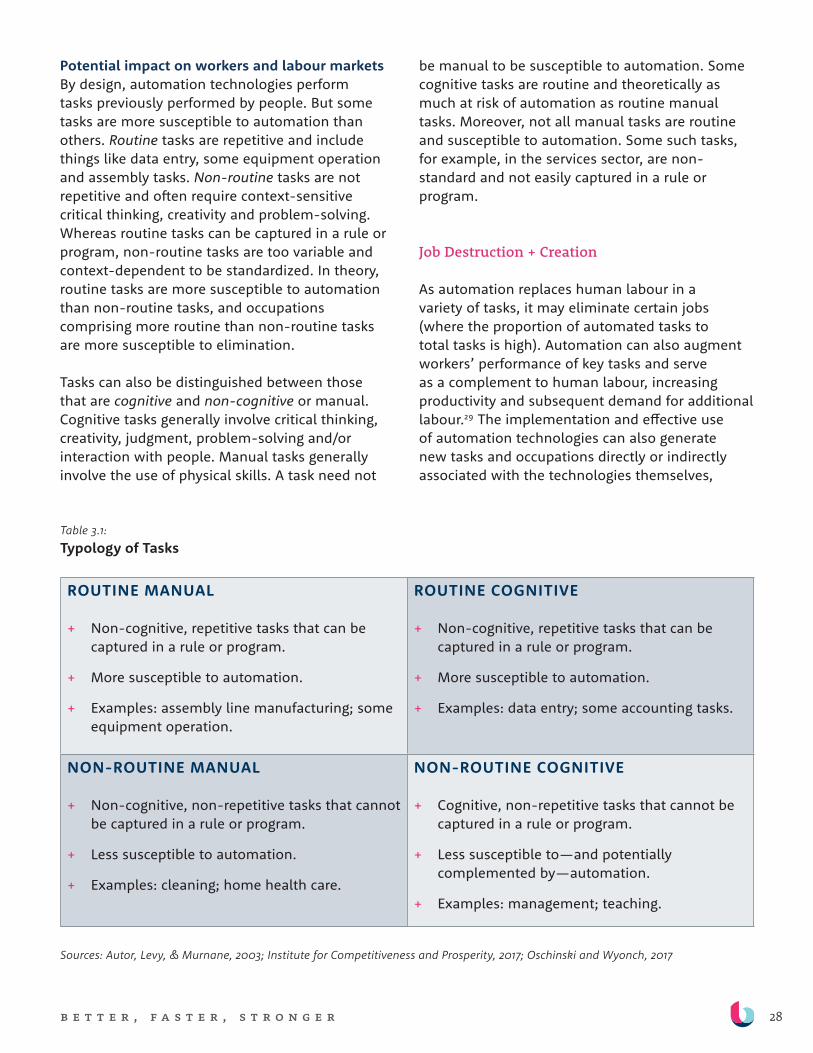
Potential impact on workers and labour markets By design, automation technologies perform tasks previously performed by people. But some tasks are more susceptible to automation than others. Routine tasks are repetitive and include things like data entry, some equipment operation and assembly tasks. Non-routine tasks are not repetitive and often require context-sensitive critical thinking, creativity and problem-solving. Whereas routine tasks can be captured in a rule or program, non-routine tasks are too variable and context-dependent to be standardized. In theory, routine tasks are more susceptible to automation than non-routine tasks, and occupations comprising more routine than non-routine tasks are more susceptible to elimination.
Tasks can also be distinguished between those that are cognitive and non-cognitive or manual. Cognitive tasks generally involve critical thinking, creativity, judgment, problem-solving and/or interaction with people. Manual tasks generally involve the use of physical skills. A task need not
be manual to be susceptible to automation. Some cognitive tasks are routine and theoretically as much at risk of automation as routine manual tasks. Moreover, not all manual tasks are routine and susceptible to automation. Some such tasks, for example, in the services sector, are non-standard and not easily captured in a rule or program.
Job Destruction + Creation
As automation replaces human labour in a variety of tasks, it may eliminate certain jobs (where the proportion of automated tasks to total tasks is high). Automation can also augment workers’ performance of key tasks and serve as a complement to human labour, increasing productivity and subsequent demand for additional labour.29 The implementation and effective use of automation technologies can also generate new tasks and occupations directly or indirectly associated with the technologies themselves,
Table 3.1: Typology of Tasks
ROUTINE MANUAL
+ Non-cognitive, repetitive tasks that can be captured in a rule or program.
+ More susceptible to automation.
+ Examples: assembly line manufacturing; some equipment operation.
ROUTINE COGNITIVE
+ Non-cognitive, repetitive tasks that can be captured in a rule or program.
+ More susceptible to automation.
+ Examples: data entry; some accounting tasks.
NON-ROUTINE MANUAL
+ Non-cognitive, non-repetitive tasks that cannot be captured in a rule or program.
+ Less susceptible to automation.
+ Examples: cleaning; home health care.
NON-ROUTINE COGNITIVE
+ Cognitive, non-repetitive tasks that cannot be captured in a rule or program.
+ Less susceptible to—and potentially complemented by—automation.
+ Examples: management; teaching.
Sources: Autor, Levy, & Murnane, 2003; Institute for Competitiveness and Prosperity, 2017; Oschinski and Wyonch, 2017
29b e t t e r , f a s t e r , s t r o n g e r
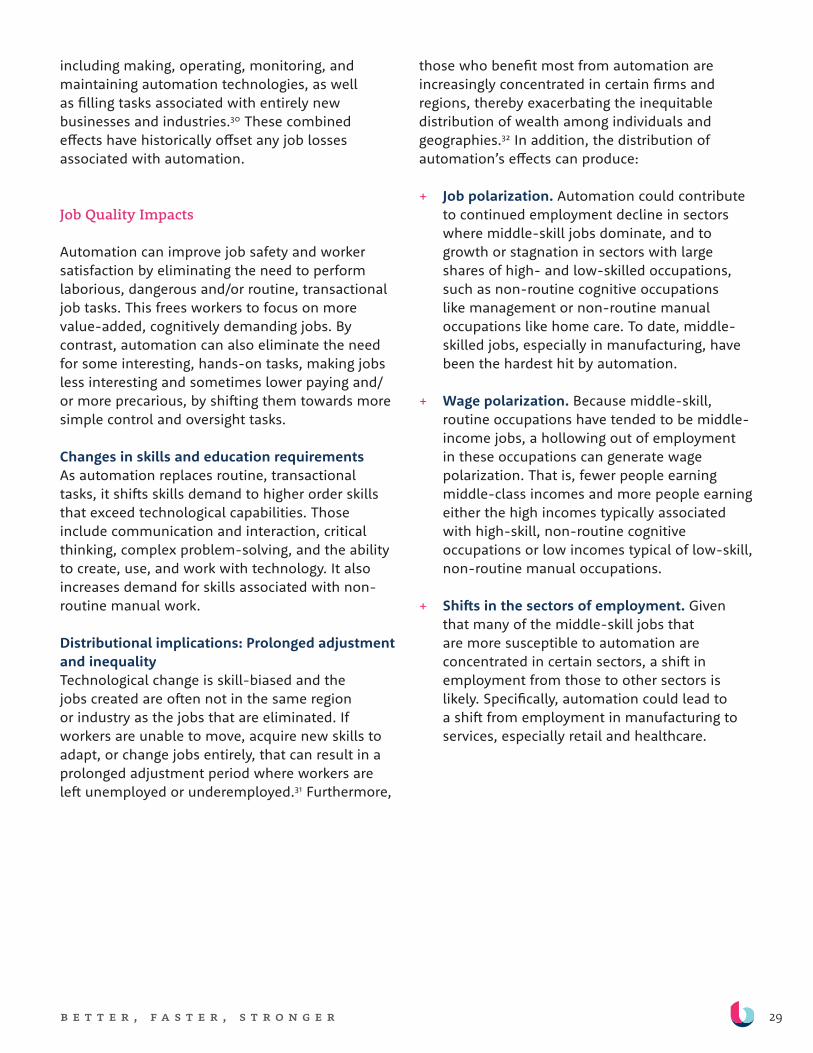
including making, operating, monitoring, and maintaining automation technologies, as well as filling tasks associated with entirely new businesses and industries.30 These combined effects have historically offset any job losses associated with automation.
Job Quality Impacts
Automation can improve job safety and worker satisfaction by eliminating the need to perform laborious, dangerous and/or routine, transactional job tasks. This frees workers to focus on more value-added, cognitively demanding jobs. By contrast, automation can also eliminate the need for some interesting, hands-on tasks, making jobs less interesting and sometimes lower paying and/or more precarious, by shifting them towards more simple control and oversight tasks.
Changes in skills and education requirementsAs automation replaces routine, transactional tasks, it shifts skills demand to higher order skills that exceed technological capabilities. Those include communication and interaction, critical thinking, complex problem-solving, and the ability to create, use, and work with technology. It also increases demand for skills associated with non-routine manual work.
Distributional implications: Prolonged adjustment and inequality Technological change is skill-biased and the jobs created are often not in the same region or industry as the jobs that are eliminated. If workers are unable to move, acquire new skills to adapt, or change jobs entirely, that can result in a prolonged adjustment period where workers are left unemployed or underemployed.31 Furthermore,
those who benefit most from automation are increasingly concentrated in certain firms and regions, thereby exacerbating the inequitable distribution of wealth among individuals and geographies.32 In addition, the distribution of automation’s effects can produce:
+ Job polarization. Automation could contribute to continued employment decline in sectors where middle-skill jobs dominate, and to growth or stagnation in sectors with large shares of high- and low-skilled occupations, such as non-routine cognitive occupations like management or non-routine manual occupations like home care. To date, middle-skilled jobs, especially in manufacturing, have been the hardest hit by automation.
+ Wage polarization. Because middle-skill, routine occupations have tended to be middle-income jobs, a hollowing out of employment in these occupations can generate wage polarization. That is, fewer people earning middle-class incomes and more people earning either the high incomes typically associated with high-skill, non-routine cognitive occupations or low incomes typical of low-skill, non-routine manual occupations.
+ Shifts in the sectors of employment. Given that many of the middle-skill jobs that are more susceptible to automation are concentrated in certain sectors, a shift in employment from those to other sectors is likely. Specifically, automation could lead to a shift from employment in manufacturing to services, especially retail and healthcare.
30b e t t e r , f a s t e r , s t r o n g e r
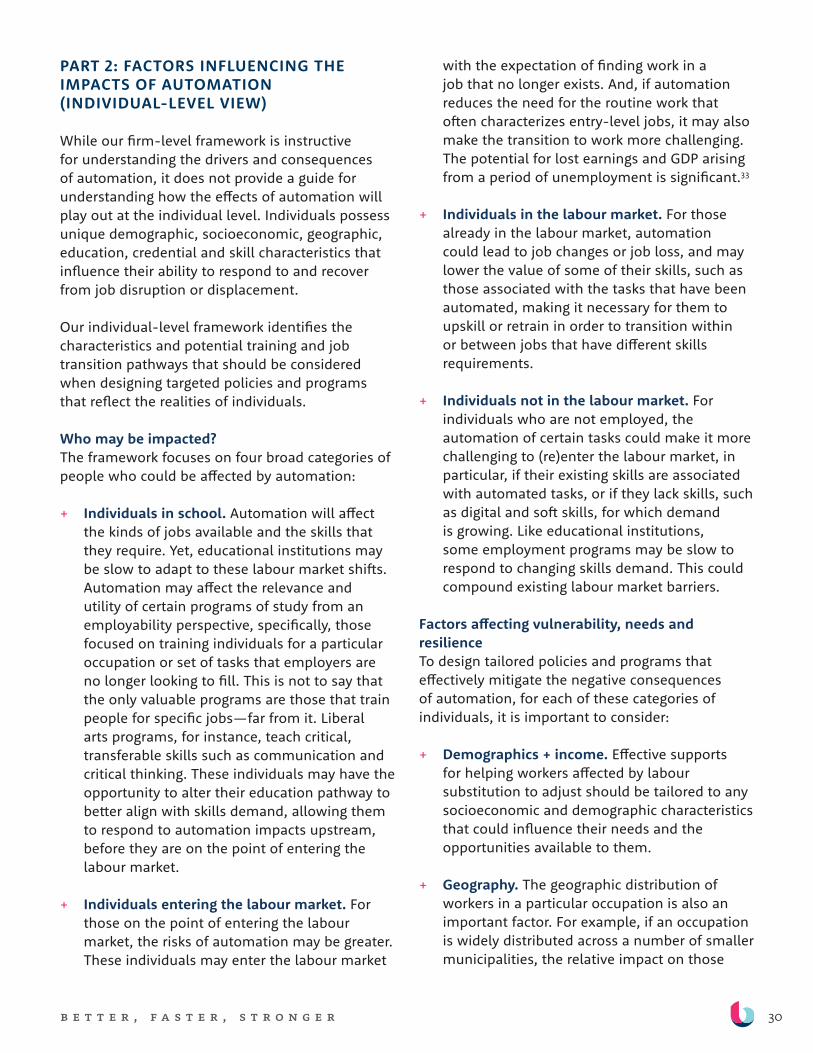
PART 2: FACTORS INFLUENCING THE IMPACTS OF AUTOMATION (INDIVIDUAL-LEVEL VIEW)
While our firm-level framework is instructive for understanding the drivers and consequences of automation, it does not provide a guide for understanding how the effects of automation will play out at the individual level. Individuals possess unique demographic, socioeconomic, geographic, education, credential and skill characteristics that influence their ability to respond to and recover from job disruption or displacement.
Our individual-level framework identifies the characteristics and potential training and job transition pathways that should be considered when designing targeted policies and programs that reflect the realities of individuals.
Who may be impacted? The framework focuses on four broad categories of people who could be affected by automation:
+ Individuals in school. Automation will affect the kinds of jobs available and the skills that they require. Yet, educational institutions may be slow to adapt to these labour market shifts. Automation may affect the relevance and utility of certain programs of study from an employability perspective, specifically, those focused on training individuals for a particular occupation or set of tasks that employers are no longer looking to fill. This is not to say that the only valuable programs are those that train people for specific jobs—far from it. Liberal arts programs, for instance, teach critical, transferable skills such as communication and critical thinking. These individuals may have the opportunity to alter their education pathway to better align with skills demand, allowing them to respond to automation impacts upstream, before they are on the point of entering the labour market.
+ Individuals entering the labour market. For those on the point of entering the labour market, the risks of automation may be greater. These individuals may enter the labour market
with the expectation of finding work in a job that no longer exists. And, if automation reduces the need for the routine work that often characterizes entry-level jobs, it may also make the transition to work more challenging. The potential for lost earnings and GDP arising from a period of unemployment is significant.33
+ Individuals in the labour market. For those already in the labour market, automation could lead to job changes or job loss, and may lower the value of some of their skills, such as those associated with the tasks that have been automated, making it necessary for them to upskill or retrain in order to transition within or between jobs that have different skills requirements.
+ Individuals not in the labour market. For individuals who are not employed, the automation of certain tasks could make it more challenging to (re)enter the labour market, in particular, if their existing skills are associated with automated tasks, or if they lack skills, such as digital and soft skills, for which demand is growing. Like educational institutions, some employment programs may be slow to respond to changing skills demand. This could compound existing labour market barriers.
Factors affecting vulnerability, needs and resilienceTo design tailored policies and programs that effectively mitigate the negative consequences of automation, for each of these categories of individuals, it is important to consider:
+ Demographics + income. Effective supports for helping workers affected by labour substitution to adjust should be tailored to any socioeconomic and demographic characteristics that could influence their needs and the opportunities available to them.
+ Geography. The geographic distribution of workers in a particular occupation is also an important factor. For example, if an occupation is widely distributed across a number of smaller municipalities, the relative impact on those
31b e t t e r , f a s t e r , s t r o n g e r
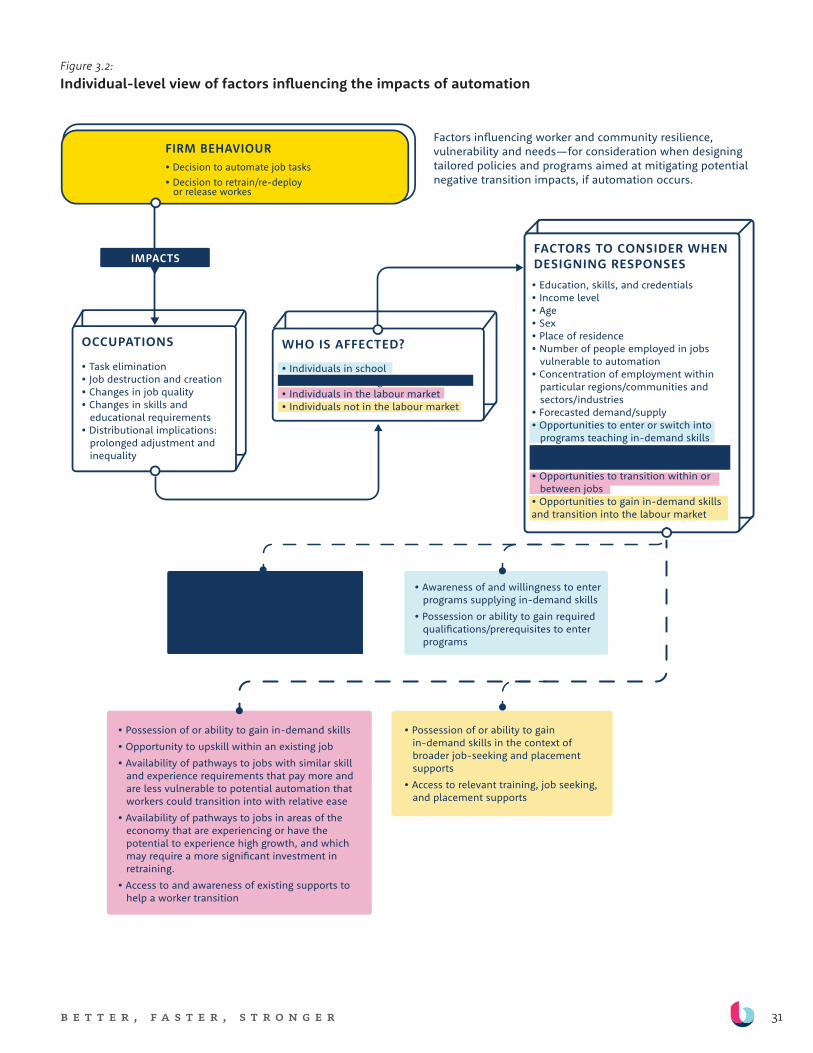
Figure 3.2: Individual-level view of factors influencing the impacts of automation
FIRM BEHAVIOUR• Decision to automate job tasks • Decision to retrain/re-deploy or release workes
OCCUPATIONS
• Task elimination• Job destruction and creation• Changes in job quality• Changes in skills and educational requirements• Distributional implications: prolonged adjustment and inequality
WHO IS AFFECTED?
• Individuals in school • Individuals entering the labour market • Individuals in the labour market • Individuals not in the labour market
FACTORS TO CONSIDER WHEN DESIGNING RESPONSES• Education, skills, and credentials • Income level • Age • Sex • Place of residence • Number of people employed in jobs vulnerable to automation • Concentration of employment within particular regions/communities and sectors/industries • Forecasted demand/supply• Opportunities to enter or switch into programs teaching in-demand skills • Opportunities to enter in-demand jobs with current education and/or upskilling • Opportunities to transition within or between jobs• Opportunities to gain in-demand skills and transition into the labour market
Factors in�uencing worker and community resilience, vulnerability and needs—for consideration when designing tailored policies and programs aimed at mitigating potential negative transition impacts, if automation occurs.
IMPACTS
• Possession of or ability to gain in-demand skills in the context of broader job-seeking and placement supports• Access to relevant training, job seeking, and placement supports
• Awareness of and willingness to enter programs supplying in-demand skills• Possession or ability to gain required quali�cations/prerequisites to enter programs
• Availability of pathways to jobs in in-demand areas of the economy with current skills and credentials • Ability to upskill or add to existing credentials
• Possession of or ability to gain in-demand skills • Opportunity to upskill within an existing job • Availability of pathways to jobs with similar skill and experience requirements that pay more and are less vulnerable to potential automation that workers could transition into with relative ease • Availability of pathways to jobs in areas of the economy that are experiencing or have the potential to experience high growth, and which may require a more signi�cant investment in retraining. • Access to and awareness of existing supports to help a worker transition
32b e t t e r , f a s t e r , s t r o n g e r
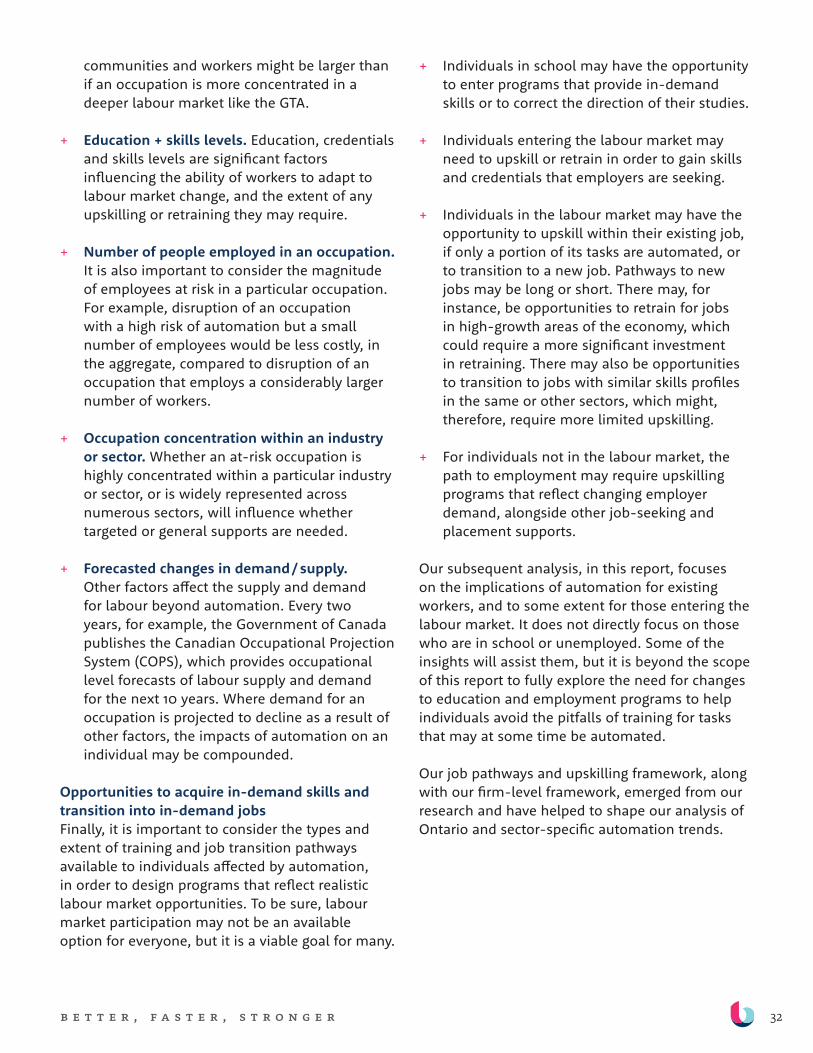
communities and workers might be larger than if an occupation is more concentrated in a deeper labour market like the GTA.
+ Education + skills levels. Education, credentials and skills levels are significant factors influencing the ability of workers to adapt to labour market change, and the extent of any upskilling or retraining they may require.
+ Number of people employed in an occupation. It is also important to consider the magnitude of employees at risk in a particular occupation. For example, disruption of an occupation with a high risk of automation but a small number of employees would be less costly, in the aggregate, compared to disruption of an occupation that employs a considerably larger number of workers.
+ Occupation concentration within an industry or sector. Whether an at-risk occupation is highly concentrated within a particular industry or sector, or is widely represented across numerous sectors, will influence whether targeted or general supports are needed.
+ Forecasted changes in demand / supply. Other factors affect the supply and demand for labour beyond automation. Every two years, for example, the Government of Canada publishes the Canadian Occupational Projection System (COPS), which provides occupational level forecasts of labour supply and demand for the next 10 years. Where demand for an occupation is projected to decline as a result of other factors, the impacts of automation on an individual may be compounded.
Opportunities to acquire in-demand skills and transition into in-demand jobs Finally, it is important to consider the types and extent of training and job transition pathways available to individuals affected by automation, in order to design programs that reflect realistic labour market opportunities. To be sure, labour market participation may not be an available option for everyone, but it is a viable goal for many.
+ Individuals in school may have the opportunity to enter programs that provide in-demand skills or to correct the direction of their studies.
+ Individuals entering the labour market may need to upskill or retrain in order to gain skills and credentials that employers are seeking.
+ Individuals in the labour market may have the opportunity to upskill within their existing job, if only a portion of its tasks are automated, or to transition to a new job. Pathways to new jobs may be long or short. There may, for instance, be opportunities to retrain for jobs in high-growth areas of the economy, which could require a more significant investment in retraining. There may also be opportunities to transition to jobs with similar skills profiles in the same or other sectors, which might, therefore, require more limited upskilling.
+ For individuals not in the labour market, the path to employment may require upskilling programs that reflect changing employer demand, alongside other job-seeking and placement supports.
Our subsequent analysis, in this report, focuses on the implications of automation for existing workers, and to some extent for those entering the labour market. It does not directly focus on those who are in school or unemployed. Some of the insights will assist them, but it is beyond the scope of this report to fully explore the need for changes to education and employment programs to help individuals avoid the pitfalls of training for tasks that may at some time be automated.
Our job pathways and upskilling framework, along with our firm-level framework, emerged from our research and have helped to shape our analysis of Ontario and sector-specific automation trends.
33b e t t e r , f a s t e r , s t r o n g e r
MAPPING PATHWAYS TO JOBS WITH SIMIL AR SKILL PROFILES
While our subsequent analysis does not examine all the factors described in our individual-level framework, we have started to explore one approach, using the US O*NET Career Changers Matrix, to identify pathways to jobs with similar skill profiles.34 For any given occupation, there exists a number of other occupations that have similar underlying characteristics, such as skills, experience and credential requirements.
To assess the extent of the opportunities available to individuals in at-risk jobs to transition to jobs with similar skills profiles, we propose the following steps:
1. Occupations with Similar Skills Profiles. For each occupation, identify the list of occupations that have similar skills, experience and credential requirements.
2. Adjust for Automation Risk. Remove occupations from the list with 50 percent or more tasks that could technically be automated, based on McKinsey’s analysis.
3. Adjust for Wage Levels. Remove occupations from the list that have an equivalent or lower annual wage than the original occupation, recognizing that a job may need to pay the same or more compared to the original job to be an attractive, viable option.
4. Number of Jobs with Similar Skills Profiles. The number of workers employed in all of the occupations remaining represents the total number of jobs with similar skills profiles that are potential transition opportunities.
5. Job Transition Opportunity Score. Ratio of the number of jobs with similar skills profiles to the number of workers currently employed in the occupation. This score provides a measurement of the relative size of the transition opportunity for a particular occupation, allowing for comparison across occupations.
More broadly, this analysis could be used to identify workers who may have fewer pathways
available to them to jobs with similar skills. These workers may require more significant support, to find work in occupations requiring different skills sets. It could also be used to identify transition pathways that would benefit a significant number of people and that may warrant the design of targeted upskilling programs.
This approach is partially inspired by recent work of the World Economic Forum which, drawing on data from Burning Glass Technologies and the US Department of Labour Statistics, proposes a data-driven approach to identifying job transition and upskilling opportunities.35
This type of analysis is critical to respond to information failures in the labour market resulting from a focus on jobs rather than skills, which can obscure opportunities to apply skills sets to different jobs.
Limitations + Further WorkThis analysis admittedly does not address broader labour market dynamics which, for instance, may mean that if a large number of people are displaced from their jobs due to automation and look for work in other parts of the economy, there may be downward pressure on wages in destination occupations. It also does not take into account the long-term growth prospects of job transition pathways.
In addition, the assumption that job transitions—even to occupations with minimal differences in skills, experience or credential requirements—are easily achieved is optimistic and does not reflect the considerable frictions involved in labour market transitions. For example, workers are not entirely mobile and there will be geographic limitations on job transitions. To properly identify occupations that a worker can easily transition into, it may be important to assess whether or not these jobs are within a reasonable commuting distance.
We will continue to refine this approach in future work, and welcome comments and critiques from others working in this area.
34b e t t e r , f a s t e r , s t r o n g e r
A u t o m A t i o n :
e v i d e n c e f r o m
o n t A r i o
Over the past several decades, Ontario has witnessed job and wage polarization, and a shift in employment from manufacturing to services—precisely
the effects that automation theory predicts. But it is not clear that automation is the sole or even primary agent, particularly given the low rates of technology adoption among firms in Ontario compared to peer jurisdictions.
To be sure, automation has the potential to significantly disrupt labour markets and employment in some areas, notably in Ontario towns and cities specializing in manufacturing, particularly in the southwest. However, the relatively lower rates of automation in Ontario’s firms will likely temper its employment impacts. In fact, an equal or greater challenge facing the province’s economy may be the already weak rate of automation in businesses, which is likely inhibiting productivity gains and growth.
Ontario faces a dual challenge: to stimulate technology adoption among businesses to improve their competitiveness, while simultaneously managing the disruptive effects of automation on workers. This section will apply elements of our firm-level framework for understanding the drivers and impacts of automation on the Ontario economy.
TECHNOLOGY ADOPTION TRENDS IN ONTARIO
The extent to which communities and workers actually experience the effects of automation on employment depends on the behaviour of firms—that is, whether they invest in automation technologies. The track record of technology investment by businesses in Ontario suggests that large-scale disruption caused by automation may not yet be around the corner.
Ontario firms’ investment in machinery, equipment and ICT is weak, and there is evidence to suggest that this is adversely impacting Ontario’s productivity and economic performance relative to other jurisdictions such as the US.36,37
Between 2008 and 2014, the gap between Canadian and US ICT investment grew from 31.6 percent to 43.7 percent.38 While the gap between Ontario and the US is not quite as large, it is substantial and has grown in recent years.39 In 2015, Ontario firms’ annual ICT investment was 2.39 percent as a share of GDP versus 3.15 percent for the US and 2.16 for Canada as a whole.40 Only a portion of this gap is the result of industrial mix and lower income per capita; the vast majority can be explained by industry-specific differences in ICT investment.41,42
Ontario faces a dual challenge:
to stimulate technology adoption
among businesses to improve
their competitiveness, while
simultaneously managing the
disruptive effects of automation on
workers.
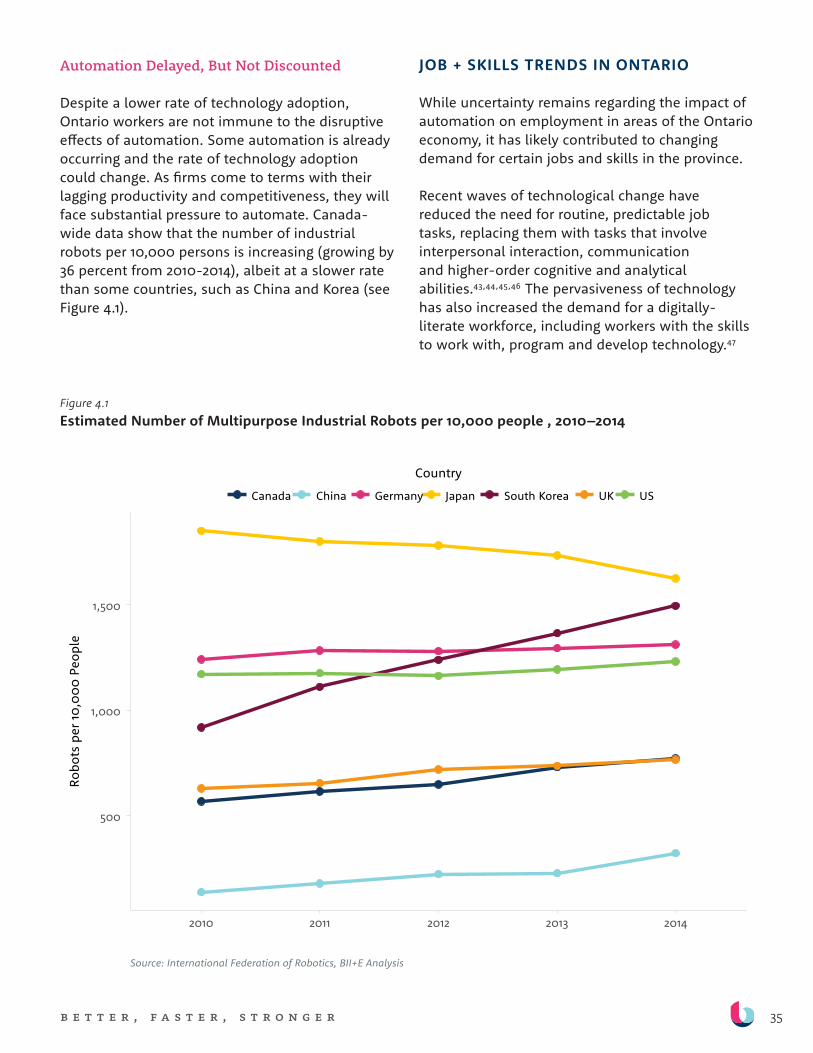
35b e t t e r , f a s t e r , s t r o n g e r
Automation Delayed, But Not Discounted
Despite a lower rate of technology adoption, Ontario workers are not immune to the disruptive effects of automation. Some automation is already occurring and the rate of technology adoption could change. As firms come to terms with their lagging productivity and competitiveness, they will face substantial pressure to automate. Canada-wide data show that the number of industrial robots per 10,000 persons is increasing (growing by 36 percent from 2010-2014), albeit at a slower rate than some countries, such as China and Korea (see Figure 4.1).
JOB + SKILLS TRENDS IN ONTARIO
While uncertainty remains regarding the impact of automation on employment in areas of the Ontario economy, it has likely contributed to changing demand for certain jobs and skills in the province.
Recent waves of technological change have reduced the need for routine, predictable job tasks, replacing them with tasks that involve interpersonal interaction, communication and higher-order cognitive and analytical abilities.43,44,45,46 The pervasiveness of technology has also increased the demand for a digitally-literate workforce, including workers with the skills to work with, program and develop technology.47
Figure 4.1 Estimated Number of Multipurpose Industrial Robots per 10,000 people , 2010–2014
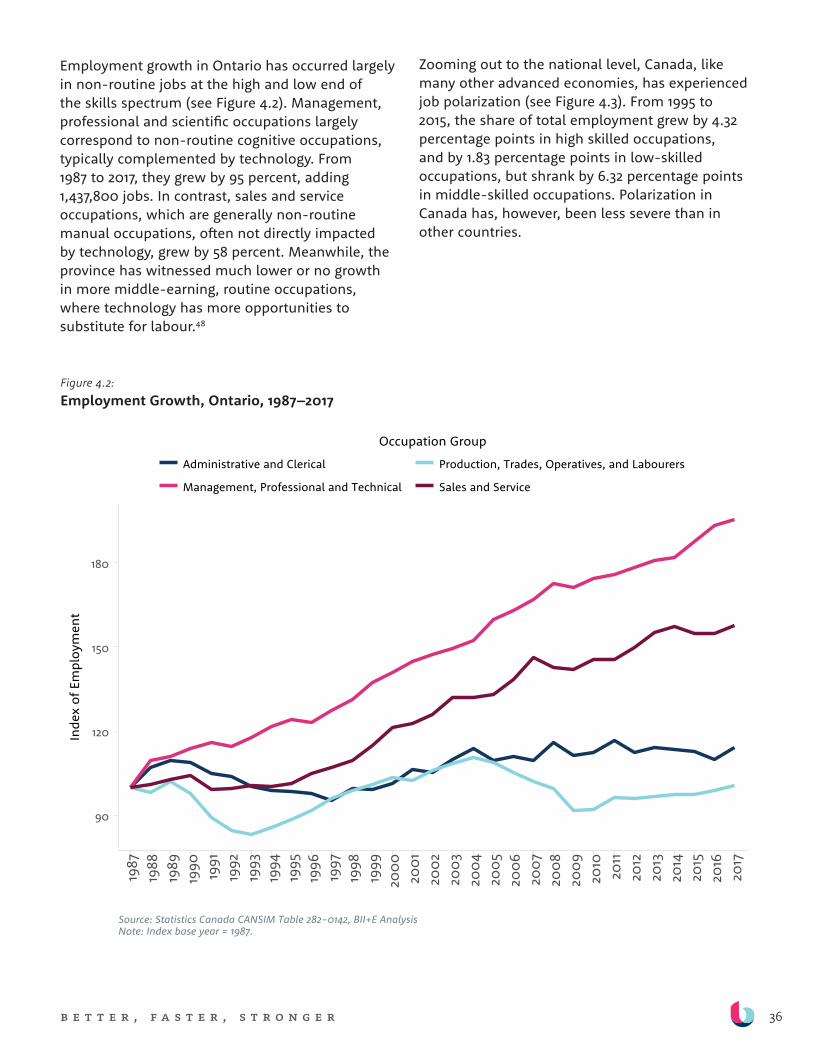
36b e t t e r , f a s t e r , s t r o n g e r
Employment growth in Ontario has occurred largely in non-routine jobs at the high and low end of the skills spectrum (see Figure 4.2). Management, professional and scientific occupations largely correspond to non-routine cognitive occupations, typically complemented by technology. From 1987 to 2017, they grew by 95 percent, adding 1,437,800 jobs. In contrast, sales and service occupations, which are generally non-routine manual occupations, often not directly impacted by technology, grew by 58 percent. Meanwhile, the province has witnessed much lower or no growth in more middle-earning, routine occupations, where technology has more opportunities to substitute for labour.48
Zooming out to the national level, Canada, like many other advanced economies, has experienced job polarization (see Figure 4.3). From 1995 to 2015, the share of total employment grew by 4.32 percentage points in high skilled occupations, and by 1.83 percentage points in low-skilled occupations, but shrank by 6.32 percentage points in middle-skilled occupations. Polarization in Canada has, however, been less severe than in other countries.
Figure 4.2:Employment Growth, Ontario, 1987–2017
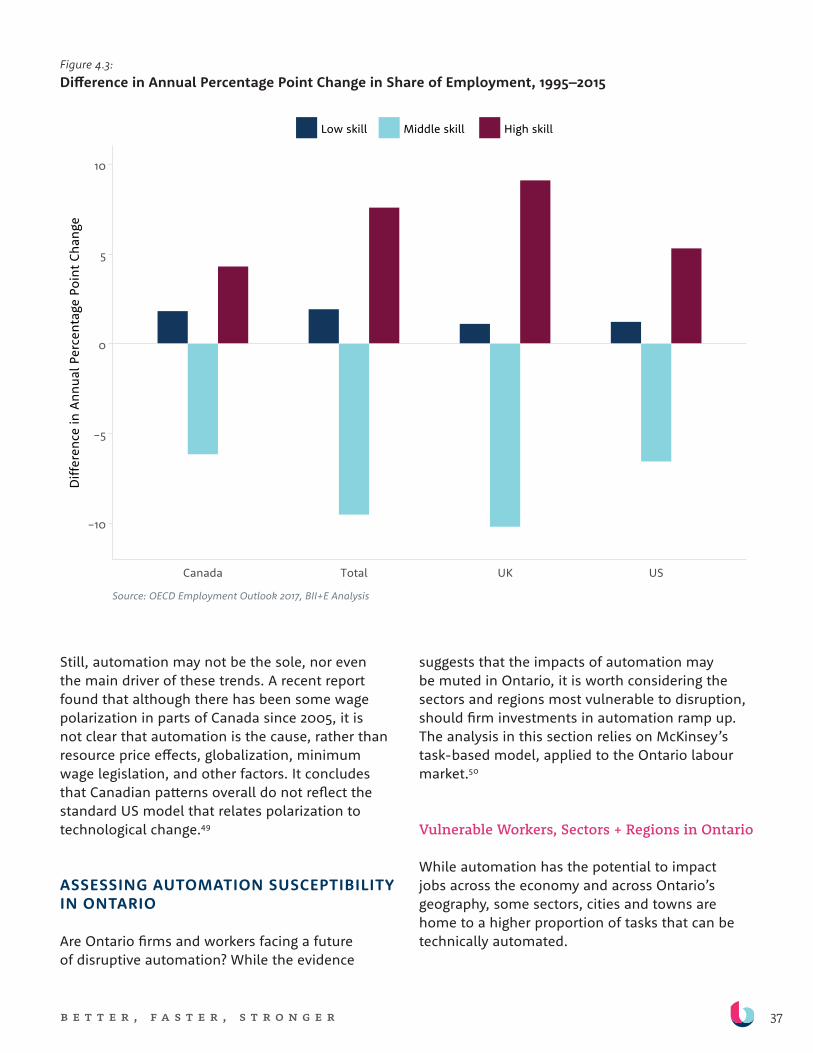
37b e t t e r , f a s t e r , s t r o n g e r
Figure 4.3:Difference in Annual Percentage Point Change in Share of Employment, 1995–2015
suggests that the impacts of automation may be muted in Ontario, it is worth considering the sectors and regions most vulnerable to disruption, should firm investments in automation ramp up. The analysis in this section relies on McKinsey’s task-based model, applied to the Ontario labour market.50
Vulnerable Workers, Sectors + Regions in Ontario
While automation has the potential to impact jobs across the economy and across Ontario’s geography, some sectors, cities and towns are home to a higher proportion of tasks that can be technically automated.
Still, automation may not be the sole, nor even the main driver of these trends. A recent report found that although there has been some wage polarization in parts of Canada since 2005, it is not clear that automation is the cause, rather than resource price effects, globalization, minimum wage legislation, and other factors. It concludes that Canadian patterns overall do not reflect the standard US model that relates polarization to technological change.49
ASSESSING AUTOMATION SUSCEPTIBILITY IN ONTARIO
Are Ontario firms and workers facing a future of disruptive automation? While the evidence
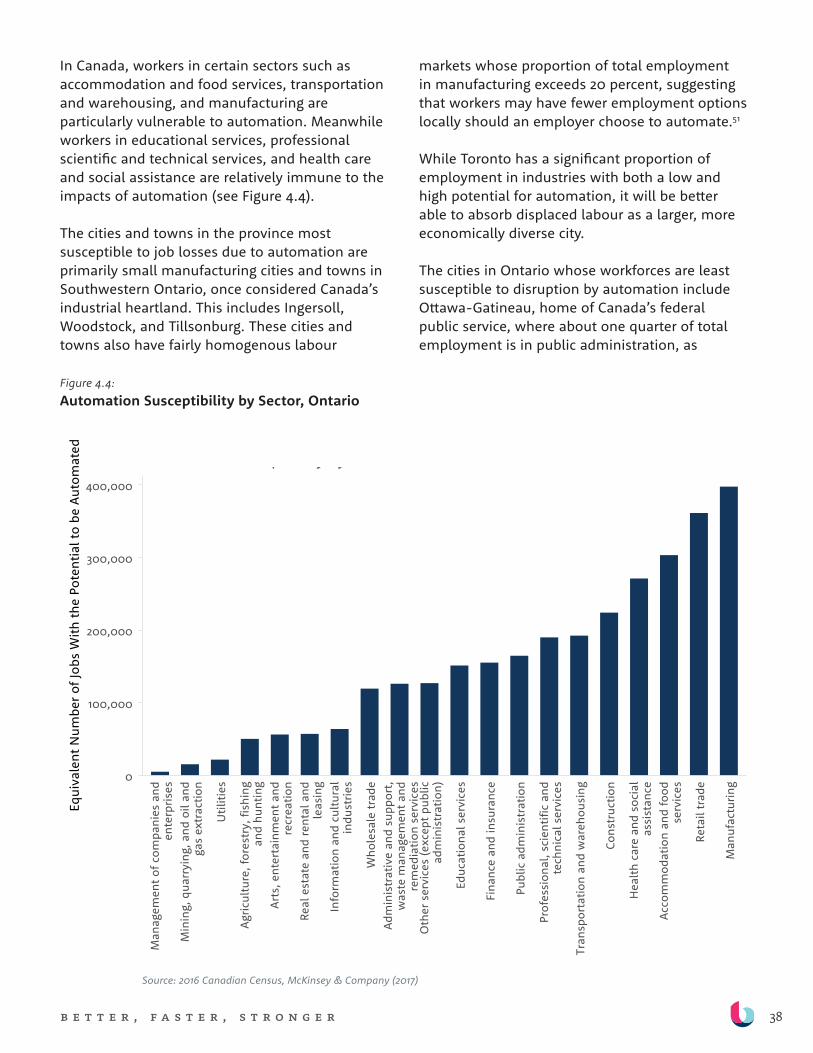
38b e t t e r , f a s t e r , s t r o n g e r
In Canada, workers in certain sectors such as accommodation and food services, transportation and warehousing, and manufacturing are particularly vulnerable to automation. Meanwhile workers in educational services, professional scientific and technical services, and health care and social assistance are relatively immune to the impacts of automation (see Figure 4.4).
The cities and towns in the province most susceptible to job losses due to automation are primarily small manufacturing cities and towns in Southwestern Ontario, once considered Canada’s industrial heartland. This includes Ingersoll, Woodstock, and Tillsonburg. These cities and towns also have fairly homogenous labour
markets whose proportion of total employment in manufacturing exceeds 20 percent, suggesting that workers may have fewer employment options locally should an employer choose to automate.51
While Toronto has a significant proportion of employment in industries with both a low and high potential for automation, it will be better able to absorb displaced labour as a larger, more economically diverse city.
The cities in Ontario whose workforces are least susceptible to disruption by automation include Ottawa-Gatineau, home of Canada’s federal public service, where about one quarter of total employment is in public administration, as
Figure 4.4:Automation Susceptibility by Sector, Ontario
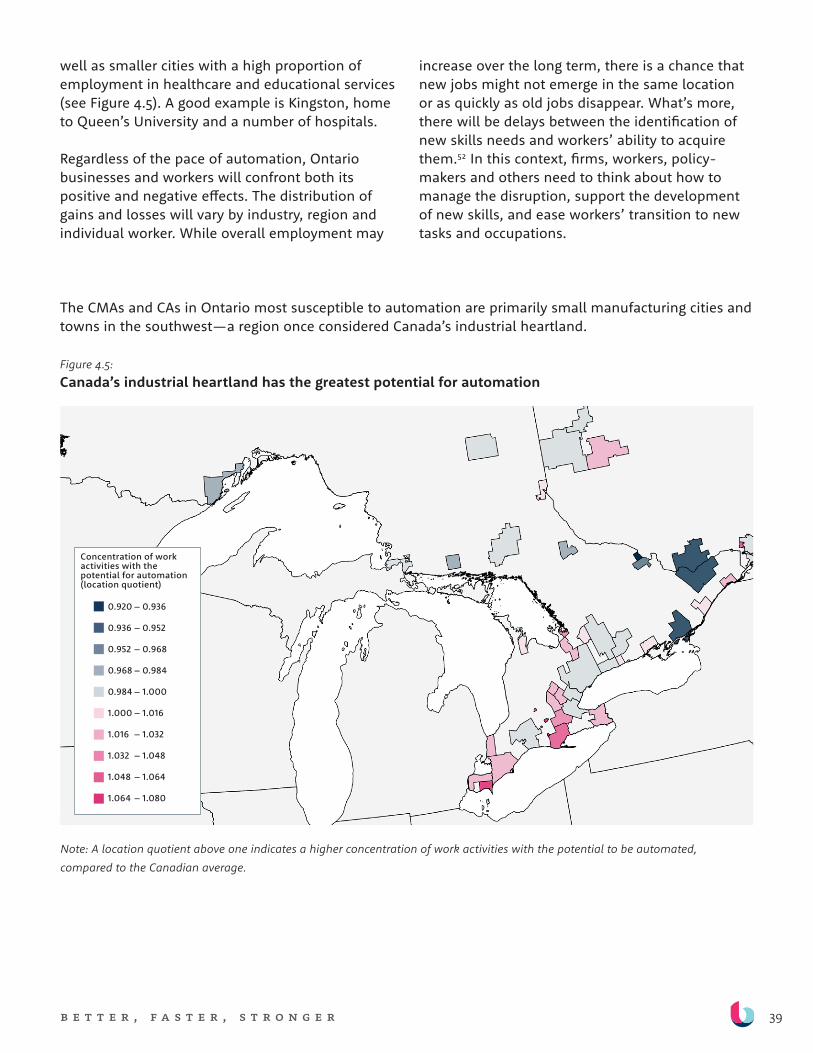
39b e t t e r , f a s t e r , s t r o n g e r
well as smaller cities with a high proportion of employment in healthcare and educational services (see Figure 4.5). A good example is Kingston, home to Queen’s University and a number of hospitals.
Regardless of the pace of automation, Ontario businesses and workers will confront both its positive and negative effects. The distribution of gains and losses will vary by industry, region and individual worker. While overall employment may
increase over the long term, there is a chance that new jobs might not emerge in the same location or as quickly as old jobs disappear. What’s more, there will be delays between the identification of new skills needs and workers’ ability to acquire them.52 In this context, firms, workers, policy-makers and others need to think about how to manage the disruption, support the development of new skills, and ease workers’ transition to new tasks and occupations.
The CMAs and CAs in Ontario most susceptible to automation are primarily small manufacturing cities and towns in the southwest—a region once considered Canada’s industrial heartland.
Figure 4.5: Canada’s industrial heartland has the greatest potential for automation
Note: A location quotient above one indicates a higher concentration of work activities with the potential to be automated, compared to the Canadian average.
0.920 – 0.936
0.936 – 0.952
0.952 – 0.968
0.968 – 0.984
0.984 – 1.000
1.000 – 1.016
1.016 – 1.032
1.032 – 1.048
1.048 – 1.064
1.064 – 1.080
Concentration of work activities with the potential for automation (location quotient)
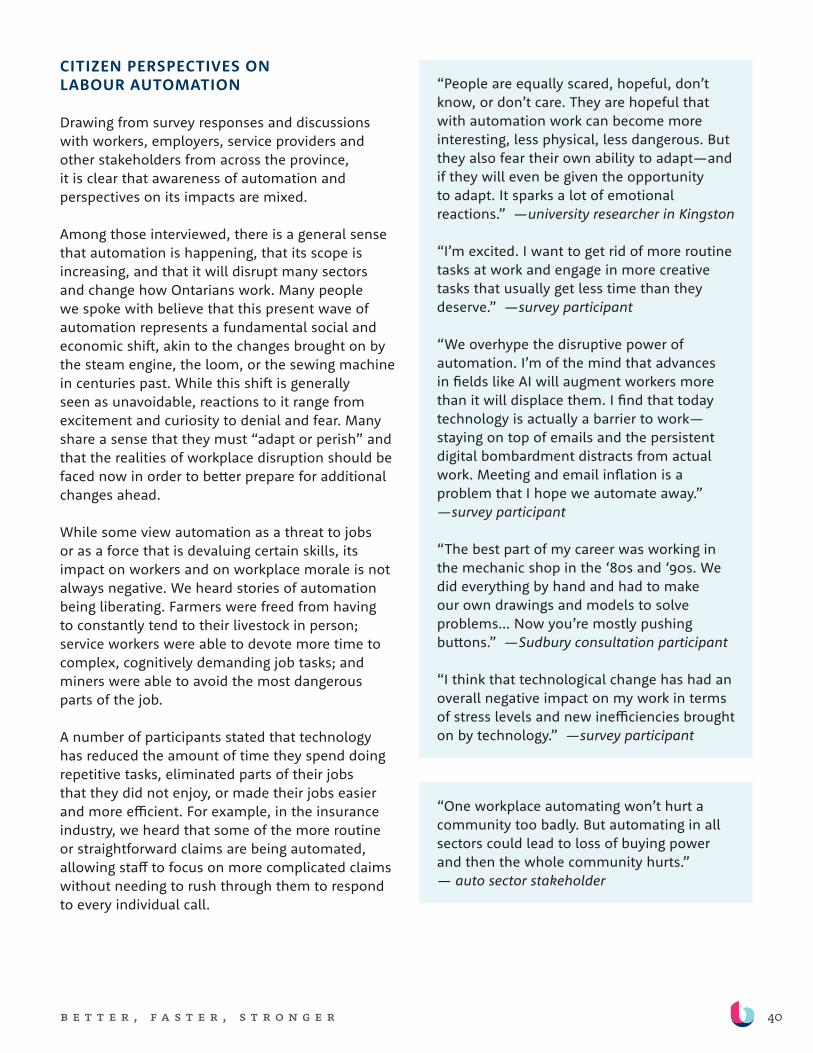
40b e t t e r , f a s t e r , s t r o n g e r
CITIZEN PERSPECTIVES ON LABOUR AUTOMATION
Drawing from survey responses and discussions with workers, employers, service providers and other stakeholders from across the province, it is clear that awareness of automation and perspectives on its impacts are mixed.
Among those interviewed, there is a general sense that automation is happening, that its scope is increasing, and that it will disrupt many sectors and change how Ontarians work. Many people we spoke with believe that this present wave of automation represents a fundamental social and economic shift, akin to the changes brought on by the steam engine, the loom, or the sewing machine in centuries past. While this shift is generally seen as unavoidable, reactions to it range from excitement and curiosity to denial and fear. Many share a sense that they must “adapt or perish” and that the realities of workplace disruption should be faced now in order to better prepare for additional changes ahead.
While some view automation as a threat to jobs or as a force that is devaluing certain skills, its impact on workers and on workplace morale is not always negative. We heard stories of automation being liberating. Farmers were freed from having to constantly tend to their livestock in person; service workers were able to devote more time to complex, cognitively demanding job tasks; and miners were able to avoid the most dangerous parts of the job.
A number of participants stated that technology has reduced the amount of time they spend doing repetitive tasks, eliminated parts of their jobs that they did not enjoy, or made their jobs easier and more efficient. For example, in the insurance industry, we heard that some of the more routine or straightforward claims are being automated, allowing staff to focus on more complicated claims without needing to rush through them to respond to every individual call.
“People are equally scared, hopeful, don’t know, or don’t care. They are hopeful that with automation work can become more interesting, less physical, less dangerous. But they also fear their own ability to adapt—and if they will even be given the opportunity to adapt. It sparks a lot of emotional reactions.” —university researcher in Kingston
“I’m excited. I want to get rid of more routine tasks at work and engage in more creative tasks that usually get less time than they deserve.” —survey participant
“We overhype the disruptive power of automation. I’m of the mind that advances in fields like AI will augment workers more than it will displace them. I find that today technology is actually a barrier to work—staying on top of emails and the persistent digital bombardment distracts from actual work. Meeting and email inflation is a problem that I hope we automate away.” —survey participant
“The best part of my career was working in the mechanic shop in the ‘80s and ‘90s. We did everything by hand and had to make our own drawings and models to solve problems… Now you’re mostly pushing buttons.” —Sudbury consultation participant
“I think that technological change has had an overall negative impact on my work in terms of stress levels and new inefficiencies brought on by technology.” —survey participant
“One workplace automating won’t hurt a community too badly. But automating in all sectors could lead to loss of buying power and then the whole community hurts.” — auto sector stakeholder
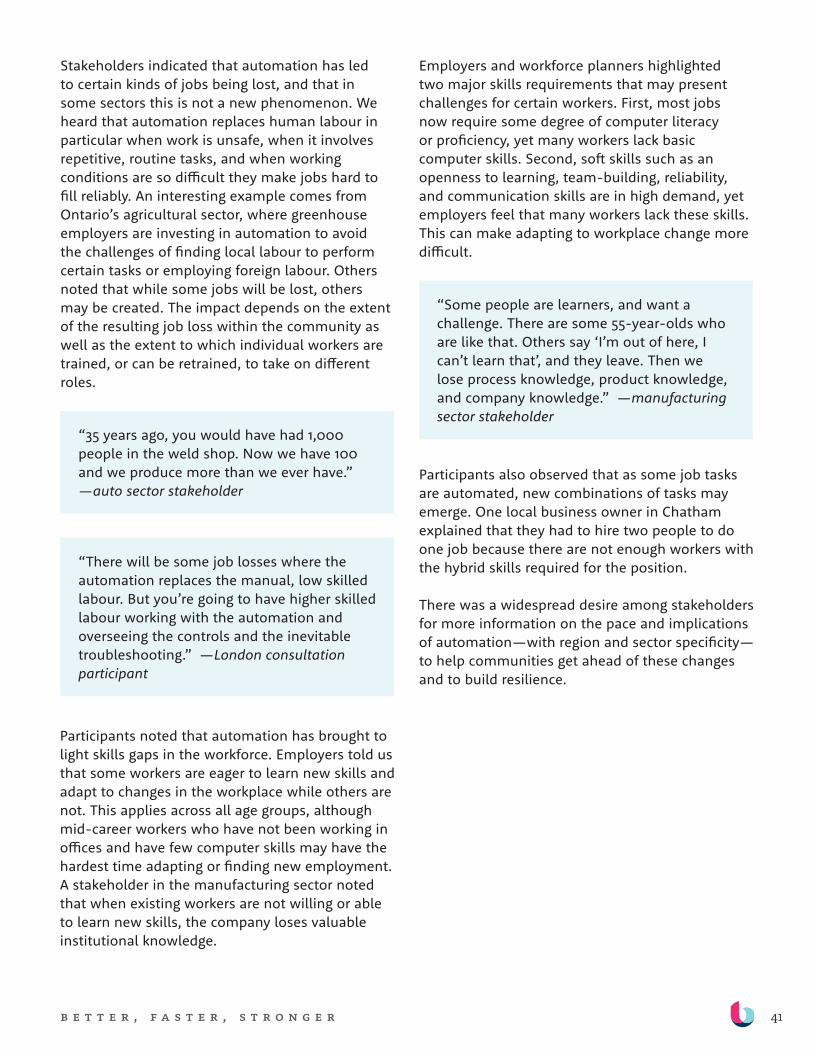
41b e t t e r , f a s t e r , s t r o n g e r
Stakeholders indicated that automation has led to certain kinds of jobs being lost, and that in some sectors this is not a new phenomenon. We heard that automation replaces human labour in particular when work is unsafe, when it involves repetitive, routine tasks, and when working conditions are so difficult they make jobs hard to fill reliably. An interesting example comes from Ontario’s agricultural sector, where greenhouse employers are investing in automation to avoid the challenges of finding local labour to perform certain tasks or employing foreign labour. Others noted that while some jobs will be lost, others may be created. The impact depends on the extent of the resulting job loss within the community as well as the extent to which individual workers are trained, or can be retrained, to take on different roles.
“35 years ago, you would have had 1,000 people in the weld shop. Now we have 100 and we produce more than we ever have.” —auto sector stakeholder
“There will be some job losses where the automation replaces the manual, low skilled labour. But you’re going to have higher skilled labour working with the automation and overseeing the controls and the inevitable troubleshooting.” —London consultation participant
Employers and workforce planners highlighted two major skills requirements that may present challenges for certain workers. First, most jobs now require some degree of computer literacy or proficiency, yet many workers lack basic computer skills. Second, soft skills such as an openness to learning, team-building, reliability, and communication skills are in high demand, yet employers feel that many workers lack these skills. This can make adapting to workplace change more difficult.
“Some people are learners, and want a challenge. There are some 55-year-olds who are like that. Others say ‘I’m out of here, I can’t learn that’, and they leave. Then we lose process knowledge, product knowledge, and company knowledge.” —manufacturing sector stakeholder
Participants noted that automation has brought to light skills gaps in the workforce. Employers told us that some workers are eager to learn new skills and adapt to changes in the workplace while others are not. This applies across all age groups, although mid-career workers who have not been working in offices and have few computer skills may have the hardest time adapting or finding new employment. A stakeholder in the manufacturing sector noted that when existing workers are not willing or able to learn new skills, the company loses valuable institutional knowledge.
Participants also observed that as some job tasks are automated, new combinations of tasks may emerge. One local business owner in Chatham explained that they had to hire two people to do one job because there are not enough workers with the hybrid skills required for the position.
There was a widespread desire among stakeholders for more information on the pace and implications of automation—with region and sector specificity—to help communities get ahead of these changes and to build resilience.
42b e t t e r , f a s t e r , s t r o n g e r
S e c t o r A n A l y S i S
f r A m e w o r k
To get a clearer understanding of the forces driving automation and, in turn, how automation is affecting Ontario’s labour market, we took a closer look at
two sectors: manufacturing, and finance and insurance. These sectors were identified by the Expert Advisory Panel as complementary cases that are broadly representative of automation trends in Ontario’s economy as a whole.
These sectors both have long histories of investing in digital technologies and are poised to experience substantial changes if they follow global trends in AI investment. A McKinsey survey shows that, globally, the manufacturing (automotive and assembly) and financial services sectors trail only the high tech and telecommunications sector in terms of AI investment.53
For each sector, we provide:
+ A sector profile (see Tables 6.1 and 7.1), including statistics on GDP, employment and income, as well as the location, age, occupation concentration, and educational attainment of the sector’s workforce;
+ An account of technology trends in the sector;
+ An exploration of the impact of automation on occupations, employment, skills, and sector performance;
+ This includes an analysis of data from Burning Glass Technologies, which provides real-time labour market information collected from millions of job postings worldwide (see Appendix A for an explanation of the data);
+ An examination of the workers in the sector most vulnerable to potential automation, and key factors to consider when designing interventions to support them. This analysis involves a number of steps:
– We examined how the proportion of tasks in an occupation that can be technically automated relates to sex, income, and education.
– We identified the specific occupations most vulnerable to automation and with the largest potential impact for the sector. This involved identifying the occupations where 75 percent or more of all workers in Ontario are found in the sector. Among these sector-specific occupations, we
Manufacturing and finance and
insurance have long histories of
investing in digital technologies and
are poised to experience substantial
changes if they follow global trends
in AI investment.
43b e t t e r , f a s t e r , s t r o n g e r
identified those with the highest proportion of tasks that are technically automatable (50 percent or more tasks that can be technically automated using McKinsey 2017 data). As well, we identified those that employ a significant number of workers, selecting only those with more employees than the mean employment level in the sector.
– For each of these occupations we examined key socioeconomic and demographic characteristics.
– We identified the cities and towns across Ontario where the workers in these vulnerable occupations are the most concentrated, and where impacts may therefore be more significant. This analysis uses Statistics Canada Census Metropolitan Areas (CMAs) and Census Agglomerations (CAs).
– For each vulnerable occupation, we identified the number of occupations and associated jobs with similar skill, experience and credential requirements, and with the same or higher wages and lower automation risk, across sectors, to identify available opportunities to change jobs with minimal upskilling (based on the approach described in section 3.2).
As the sector analyses reveal, the impacts of automation vary by sector, occupation, region, and other variables. The extent of automation and its impact in Ontario’s manufacturing and finance and insurance sectors appear less severe than among international peers. However, while Ontarians working in jobs that are ripe for automation may seem to have more time to adjust than their global peers, businesses in both sectors are putting themselves at a competitive disadvantage and thereby potentially jeopardizing both their, and their employees’, futures.
44b e t t e r , f a s t e r , s t r o n g e r
S e c t o r A n A l y S i S :
m A n u f A c t u r i n g
Ontario’s manufacturing sector has faced major challenges over the past three decades, leading to substantial job losses.54 Although new technologies have
likely affected the total number of manufacturing jobs and increased skills requirements, other factors, including offshoring production to jurisdictions with lower labour costs and persistently weak productivity, have likely also contributed to employment losses. In fact, low rates of technology adoption may be putting Ontario manufacturers at a long-term competitive disadvantage and thus their employees’ jobs at risk.
When and where automation eventually occurs within the sector, some workers are likely to be more vulnerable to job disruption than others. Many of the tasks performed by motor vehicle assemblers, inspectors and testers, for example, are technically automatable and workers in these jobs have more limited options to transition into other jobs with similar skill requirements.
While automation is necessary to build a leaner, more competitive manufacturing sector, and to replace an aging workforce, in Ontario, skills shortages and other factors are slowing the pace of this change. There is, therefore, a simultaneous need to pursue technology adoption strategies to support the growth and competitiveness of the sector, and to get ahead of potential job disruption impacts to position workers to adjust.
There is a simultaneous need
to pursue technology adoption
strategies to support the growth
and competitiveness of the sector,
and to position workers to adjust.
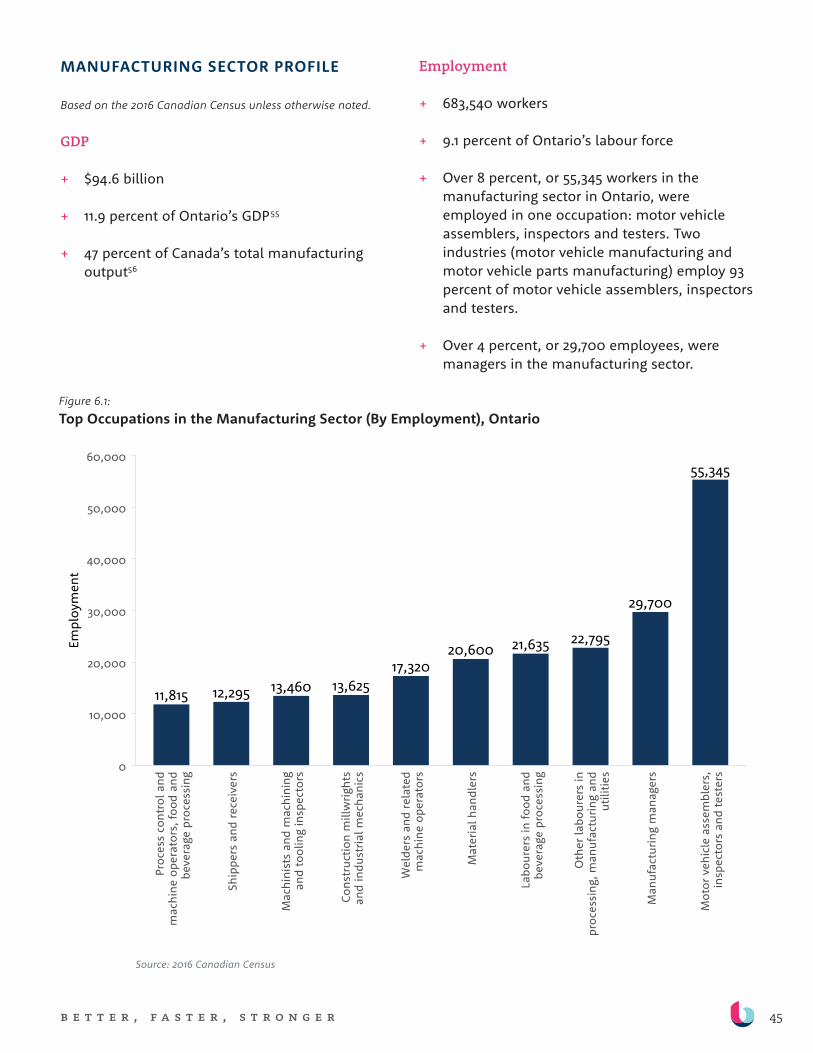
45b e t t e r , f a s t e r , s t r o n g e r
Figure 6.1:Top Occupations in the Manufacturing Sector (By Employment), Ontario
MANUFACTURING SECTOR PROFILE
Based on the 2016 Canadian Census unless otherwise noted.
GDP
+ $94.6 billion
+ 11.9 percent of Ontario’s GDP55
+ 47 percent of Canada’s total manufacturing output56
Employment
+ 683,540 workers
+ 9.1 percent of Ontario’s labour force
+ Over 8 percent, or 55,345 workers in the manufacturing sector in Ontario, were employed in one occupation: motor vehicle assemblers, inspectors and testers. Two industries (motor vehicle manufacturing and motor vehicle parts manufacturing) employ 93 percent of motor vehicle assemblers, inspectors and testers.
+ Over 4 percent, or 29,700 employees, were managers in the manufacturing sector.
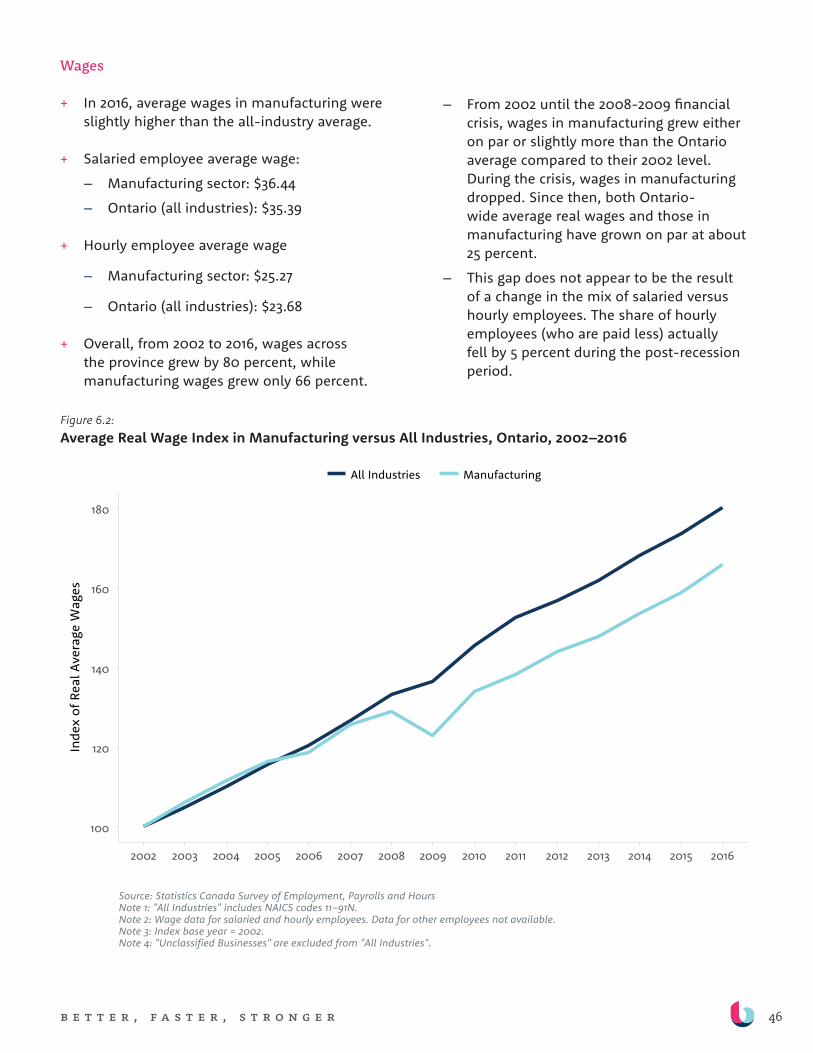
46b e t t e r , f a s t e r , s t r o n g e r
Wages
+ In 2016, average wages in manufacturing were slightly higher than the all-industry average.
+ Salaried employee average wage:
– Manufacturing sector: $36.44
– Ontario (all industries): $35.39
+ Hourly employee average wage
– Manufacturing sector: $25.27
– Ontario (all industries): $23.68
+ Overall, from 2002 to 2016, wages across the province grew by 80 percent, while manufacturing wages grew only 66 percent.
– From 2002 until the 2008-2009 financial crisis, wages in manufacturing grew either on par or slightly more than the Ontario average compared to their 2002 level. During the crisis, wages in manufacturing dropped. Since then, both Ontario-wide average real wages and those in manufacturing have grown on par at about 25 percent.
– This gap does not appear to be the result of a change in the mix of salaried versus hourly employees. The share of hourly employees (who are paid less) actually fell by 5 percent during the post-recession period.
Figure 6.2:Average Real Wage Index in Manufacturing versus All Industries, Ontario, 2002–2016

47b e t t e r , f a s t e r , s t r o n g e r
Location
+ Toronto has the highest number of manufacturing employees, with 272,695 in 2016. However, manufacturing accounts for a small proportion of total employment in the city.
Figure 6.3:Share of Total Workers Employed in Manufacturing, Ontario
+ Cities and towns in southwestern Ontario have lower absolute numbers of manufacturing employees, but the proportion of such jobs in these cities’ labour markets is much higher. These include Tillsonburg, Ingersoll, Woodstock, Stratford, Guelph, and Kitchener-Waterloo.
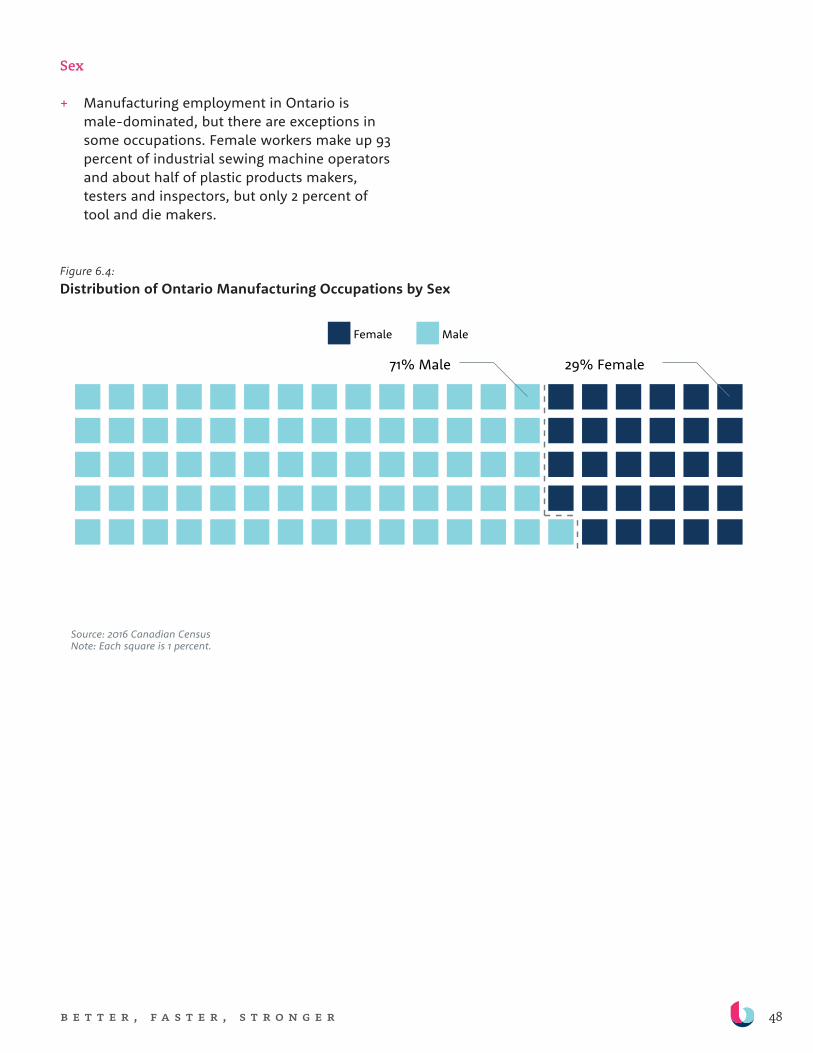
48b e t t e r , f a s t e r , s t r o n g e r
Sex
+ Manufacturing employment in Ontario is male-dominated, but there are exceptions in some occupations. Female workers make up 93 percent of industrial sewing machine operators and about half of plastic products makers, testers and inspectors, but only 2 percent of tool and die makers.
Figure 6.4:Distribution of Ontario Manufacturing Occupations by Sex
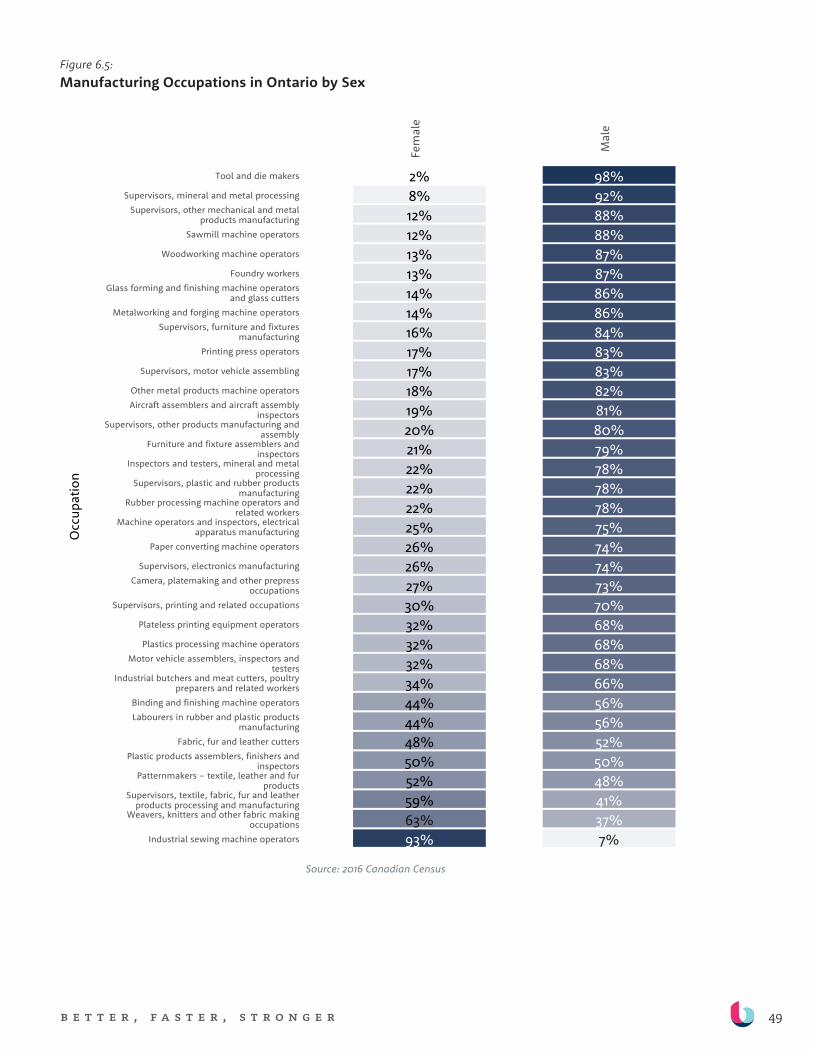
49b e t t e r , f a s t e r , s t r o n g e r
Figure 6.5:Manufacturing Occupations in Ontario by Sex
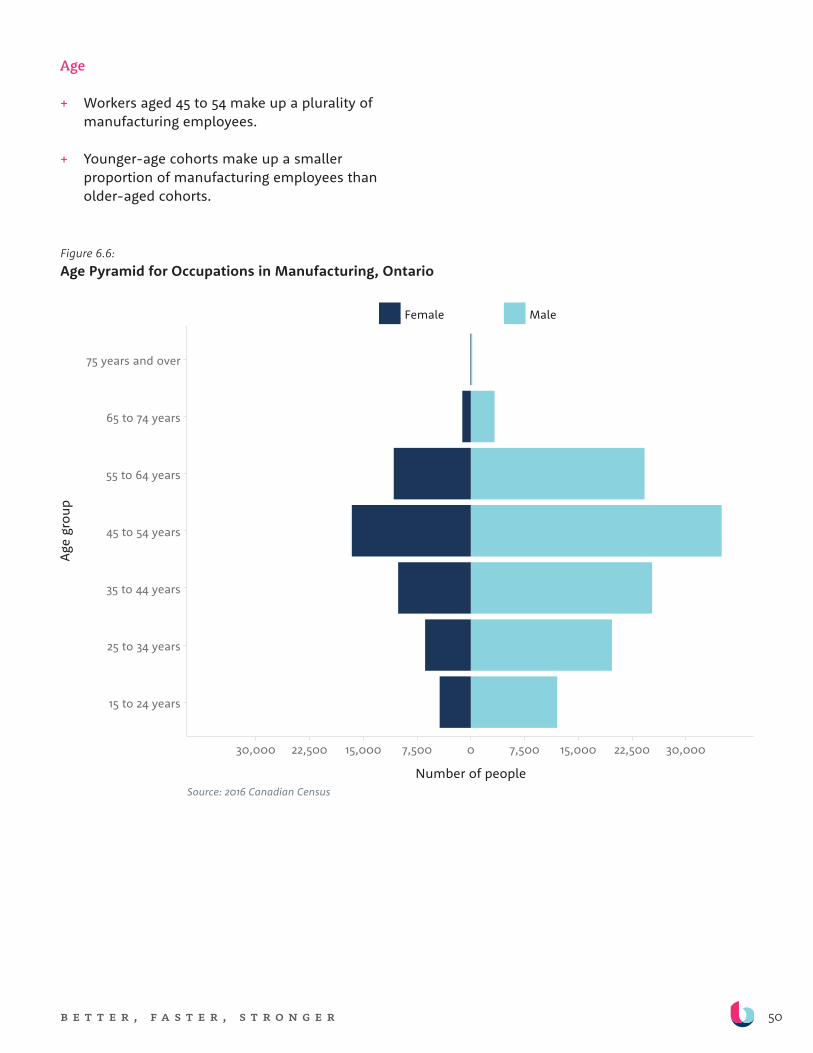
50b e t t e r , f a s t e r , s t r o n g e r
Age
+ Workers aged 45 to 54 make up a plurality of manufacturing employees.
+ Younger-age cohorts make up a smaller proportion of manufacturing employees than older-aged cohorts.
Figure 6.6:Age Pyramid for Occupations in Manufacturing, Ontario
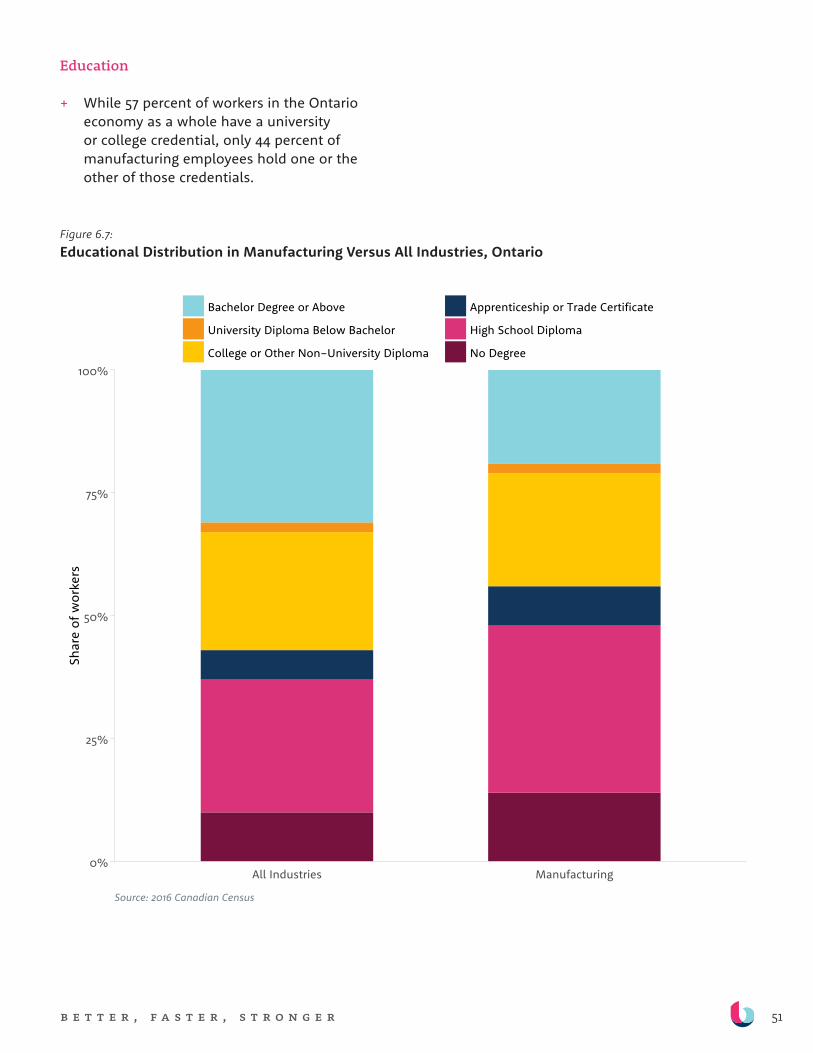
51b e t t e r , f a s t e r , s t r o n g e r
Education
+ While 57 percent of workers in the Ontario economy as a whole have a university or college credential, only 44 percent of manufacturing employees hold one or the other of those credentials.
Figure 6.7:Educational Distribution in Manufacturing Versus All Industries, Ontario
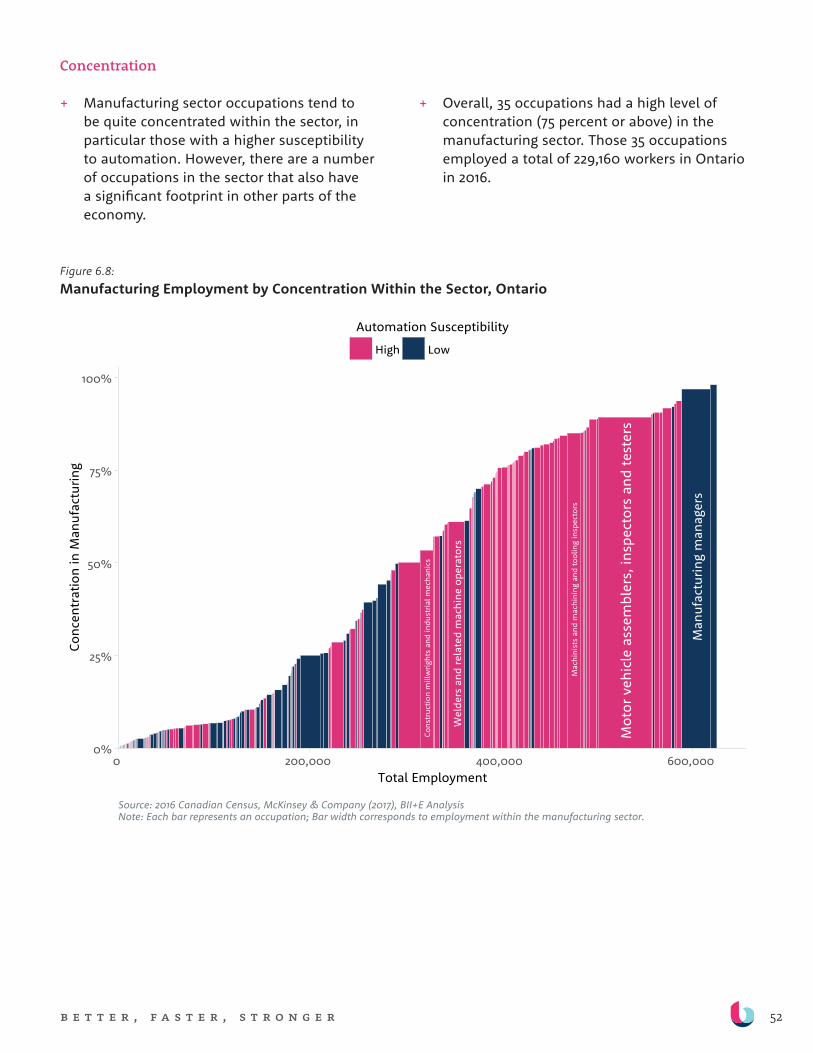
52b e t t e r , f a s t e r , s t r o n g e r
Concentration
+ Manufacturing sector occupations tend to be quite concentrated within the sector, in particular those with a higher susceptibility to automation. However, there are a number of occupations in the sector that also have a significant footprint in other parts of the economy.
+ Overall, 35 occupations had a high level of concentration (75 percent or above) in the manufacturing sector. Those 35 occupations employed a total of 229,160 workers in Ontario in 2016.
Figure 6.8:Manufacturing Employment by Concentration Within the Sector, Ontario
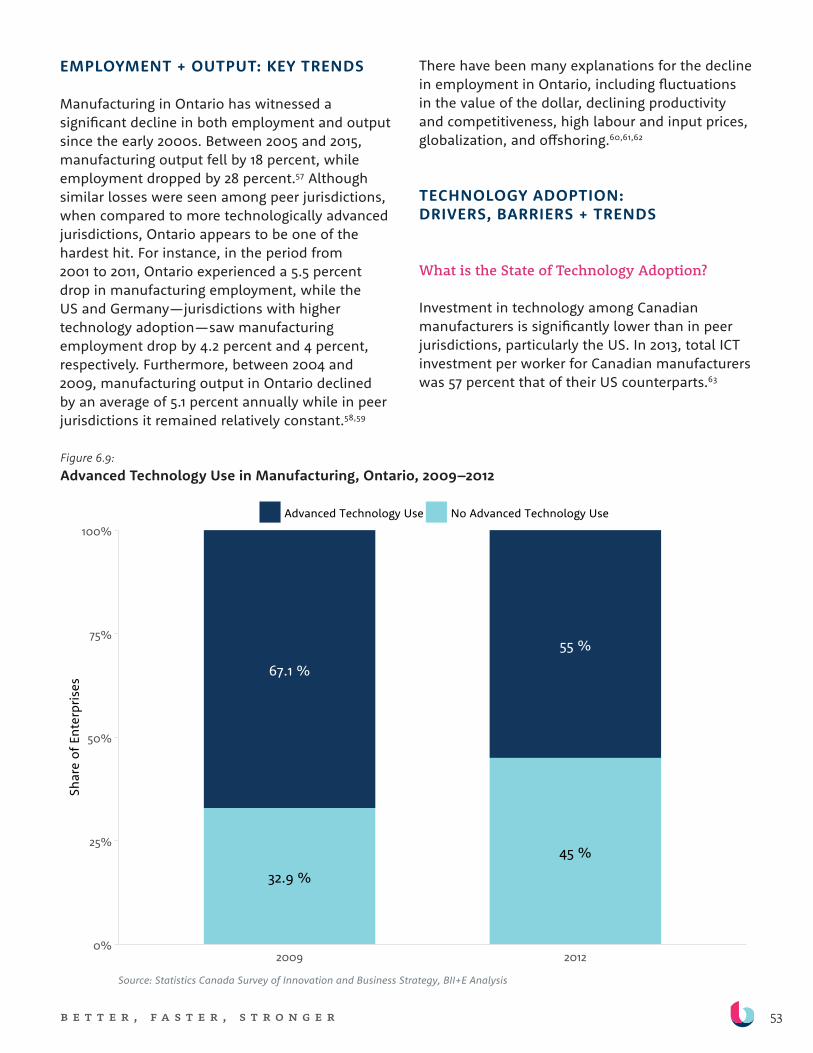
53b e t t e r , f a s t e r , s t r o n g e r
EMPLOYMENT + OUTPUT: KEY TRENDS
Manufacturing in Ontario has witnessed a significant decline in both employment and output since the early 2000s. Between 2005 and 2015, manufacturing output fell by 18 percent, while employment dropped by 28 percent.57 Although similar losses were seen among peer jurisdictions, when compared to more technologically advanced jurisdictions, Ontario appears to be one of the hardest hit. For instance, in the period from 2001 to 2011, Ontario experienced a 5.5 percent drop in manufacturing employment, while the US and Germany—jurisdictions with higher technology adoption—saw manufacturing employment drop by 4.2 percent and 4 percent, respectively. Furthermore, between 2004 and 2009, manufacturing output in Ontario declined by an average of 5.1 percent annually while in peer jurisdictions it remained relatively constant.58,59
There have been many explanations for the decline in employment in Ontario, including fluctuations in the value of the dollar, declining productivity and competitiveness, high labour and input prices, globalization, and offshoring.60,61,62
TECHNOLOGY ADOPTION: DRIVERS, BARRIERS + TRENDS
What is the State of Technology Adoption?
Investment in technology among Canadian manufacturers is significantly lower than in peer jurisdictions, particularly the US. In 2013, total ICT investment per worker for Canadian manufacturers was 57 percent that of their US counterparts.63
Figure 6.9:Advanced Technology Use in Manufacturing, Ontario, 2009–2012
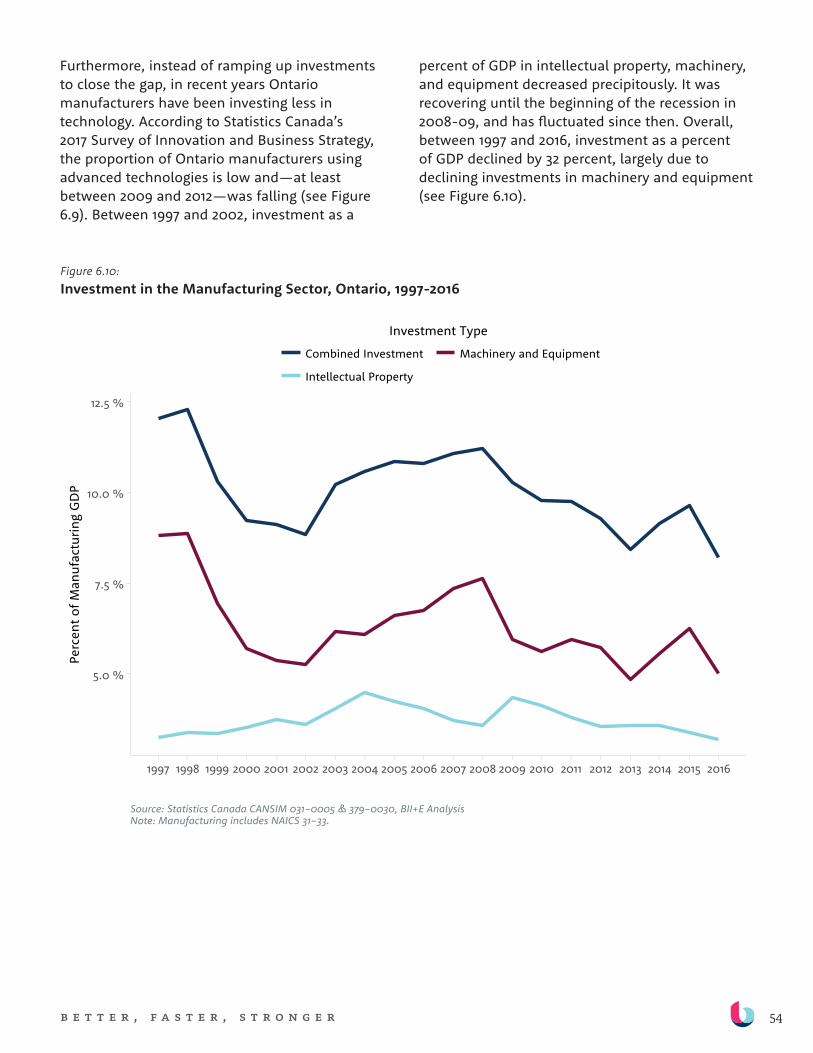
54b e t t e r , f a s t e r , s t r o n g e r
Furthermore, instead of ramping up investments to close the gap, in recent years Ontario manufacturers have been investing less in technology. According to Statistics Canada’s 2017 Survey of Innovation and Business Strategy, the proportion of Ontario manufacturers using advanced technologies is low and—at least between 2009 and 2012—was falling (see Figure 6.9). Between 1997 and 2002, investment as a
percent of GDP in intellectual property, machinery, and equipment decreased precipitously. It was recovering until the beginning of the recession in 2008-09, and has fluctuated since then. Overall, between 1997 and 2016, investment as a percent of GDP declined by 32 percent, largely due to declining investments in machinery and equipment (see Figure 6.10).
Figure 6.10:Investment in the Manufacturing Sector, Ontario, 1997-2016
55b e t t e r , f a s t e r , s t r o n g e r
Technology trends in manufacturingWhile manufacturing in Ontario has already witnessed significant adoption of industrial robotics and the automation of processes, manufacturers are now leveraging AI and the internet-of-things (IOT) to improve vertical integration and integrate existing disconnected “islands of automation”.
To date, robots have largely been relegated to performing tasks in highly controlled environments. As industrial robotics become increasingly sophisticated and integrated with AI, they are able to perform tasks that are less structured and much more uncertain.
Increasingly, analytics are being leveraged to optimize production and improve planning, process monitoring, and decision making. Advances in AI will enable firms to collect and use data to optimize production in real time, shortening development cycles, preventing errors, increasing safety, reducing inventory costs with better supply and demand planning, as well as increasing revenue through price optimization.64
Technology will also continue to reshape globally connected supply chains, making them more interconnected through digitization and combining highly automated “mass-production” plants with more customer-centric plants that are close to higher-end markets and can produce a limited range of products at a competitive cost.65
What Factors are Influencing Technology Adoption?
Our research and interviews with Ontario manufacturers reveal mixed messages: on the one hand, strong interest in adopting technologies to improve competitiveness; on the other, a catalogue of challenges and barriers to doing so. We found that Ontario manufacturing concerns’ decisions about technology are affected by a number of external factors and firm characteristics.
Competitive pressures. Ontario manufacturers told us that the main impetus for automation has and will continue to be the need to improve products, reduce costs, and improve efficiency in order to compete in global markets. Firms that fail to enlist technology in efforts to improve will be left behind and ultimately may not survive. Indeed, while low-labour cost jurisdictions have had a substantial impact on Ontario manufacturers in the past, many interviewees noted that their main competitive threats now are from other advanced manufacturing jurisdictions where technology use is high. Of note, some low-labour cost jurisdictions such as China are increasingly embracing technology and automation, which could augment these competitive pressures. These pressures are on the radar of Ontario businesses, but not all are responding.
“What we’re trying to do is leverage our technology and sophistication including automation in order to get a larger portion of the worldwide market. The world is small now: we compete with China, India, Portugal, etc. Our competitors are not down the street. We have a larger pot of gold to go after and the better we get at tech and automation, the market share will increase.” —Ontario manufacturer
Cost + risk aversion. The cost of technology has been identified by many organizations as a barrier to technology adoption. Combined with a concern that costly equipment could become obsolete rather quickly, many companies are balking at technology investment. For smaller businesses, cost barriers and concerns about obsolescence are even more prohibitive. Compounding the cost challenges is a concern that the return on investment of any technology is hard to measure, making it difficult to make a solid business case for investment.
Capital versus labour cost. Compared to other jurisdictions, Ontario also has lower labour-to-capital cost ratios, which means that it costs Ontario firms less to rely on people to perform tasks than to buy, implement, and operate
56b e t t e r , f a s t e r , s t r o n g e r
technology. Part of the reason for that is the historically lower value of the Canadian dollar which makes imported technologies more expensive.66 That can increase reliance on labour and reduce reliance on technology. However, increases in the cost of labour could change this ratio.
A recent report by the Canadian Skills & Training Coalition (CSTEC) and the Canadian Manufacturers and Exporters (CME) showed that over the next three years 75 percent of Canadian manufacturers expect their businesses to grow, yet 86 percent face challenges in hiring the kinds of skilled workers they need, particularly as they expect to replace over 22 percent of their workforce over the next 10 years because of retirement.67
Skills + expertise. Most interviewees report that demand for highly skilled workers and managers to use and manage new technology is increasing. New technologies require new skills to implement, operate, and maintain them, but those skills are often in short supply. When skilled workers cannot be found, firms delay adopting technology. Compounding the challenge is the looming retirement of aging manufacturing employees, especially managers who may have the experience and wisdom to manage change in general, even if they lack expert understanding of specific technologies. There is also a perception that the education system fails to properly encourage young people to consider careers in manufacturing and the skilled trades, or to produce job-ready candidates.
One interviewee reported that many businesses in Ontario fail to properly harness their talent to enable them to adopt new technologies. Some firms lack basic tools such as employee skills inventories. That can lead to adopting technology without either the relevant skills in the workforce to use it efficiently, or an effective rollout plan to minimize inefficiencies and foster productivity gains.
“Adopting lean manufacturing methodologies and principles, when applied consistently throughout a firm, can result in significant positive impacts on productivity, cost, quality and workforce engagement.
“Successful automation and innovation among companies in the manufacturing sector will depend on engaging workers at all levels and on leaders’ recognition and respect for the employees who do the actual work. A lean organization is committed from top-to-bottom to an organized and continuous process of improving processes and employee engagement. When these practices are combined with advanced technology, organizations will be positioned to gain a competitive advantage in the manufacturing sector.” —Bob Magee, Chairman of the Woodbridge Group
Research & development (R&D) intensity. We heard that low R&D intensity among Ontario manufacturers may be contributing to low rates of technology adoption. While Canada’s relatively low R&D intensity is likely driven by the manufacturing sector, the R&D challenge facing the sector may be less about low investment among firms, and more about the declining share of highly R&D intensive manufacturing industries in the Canadian economy, compared to the US. 68, 69
Aging workforce. While not explicitly mentioned in interviews, as the manufacturing workforce in Ontario continues to age, firms may be forced to automate to maintain output levels. There is evidence that an increasing ratio of older and middle-aged workers to younger workers is associated with increased adoption of robots and other automation technologies.70

57b e t t e r , f a s t e r , s t r o n g e r
AUTOMATION, JOBS + SKILLS DEMANDS
Although Ontario manufacturing firms lag on automation, they are still in the race—and the distance they manage to cover will have substantial effects on the nature of jobs and in-demand skills. When automation does occur, it will disproportionately target certain tasks, jobs, and workers and will drastically shift the skills employers demand.
Impact on Employment
To uncover the role that automation may have had on employment trends in Ontario manufacturing, we examined the relationship between output and employment in the sector. Overall, from 2001 to 2016, the number of employees required to generate $1 million in revenue declined from nearly 10 to just over 8. During this time, employment
in manufacturing fell by 28 percent or 261,390 workers, while output declined by 13 percent. While automation is not the sole contributor to job loss in the sector, it has enabled manufacturers in Ontario to generate more output per worker.71
However, that does not tell the full story. While GDP and employment fell prior to 2009, technology adoption increased during that period. Post-2009, there was effectively no change in employment, while GDP increased, suggesting greater productivity. Despite this, post-2009, technology investment in the sector declined. One possible explanation is that firms did benefit from technology adoption, but only after the 2008-09 recession were they able to realize the benefits. However, such trends may also be explained by increasing demand following the recession and by firms’ unwillingness to hire more employees after the downturn (see Figure 6.11).
Figure 6.11:Manufacturing Employment and Revenue, Ontario, 2001–2016
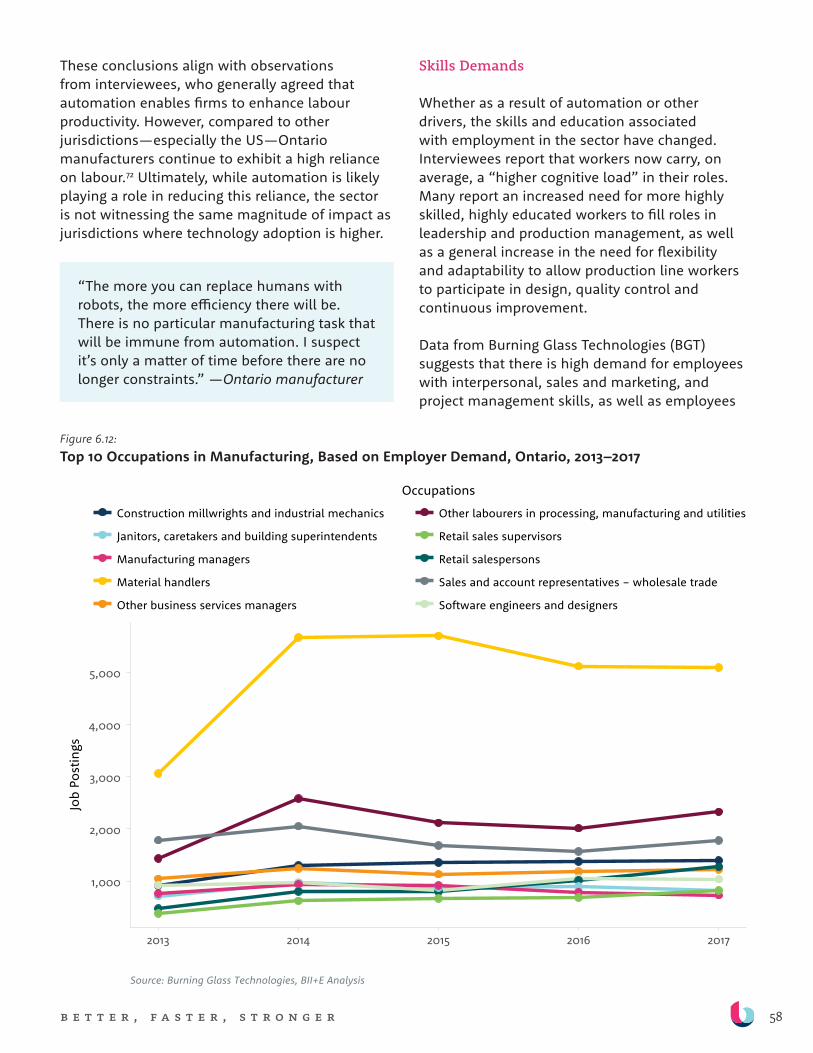
58b e t t e r , f a s t e r , s t r o n g e r
These conclusions align with observations from interviewees, who generally agreed that automation enables firms to enhance labour productivity. However, compared to other jurisdictions—especially the US—Ontario manufacturers continue to exhibit a high reliance on labour.72 Ultimately, while automation is likely playing a role in reducing this reliance, the sector is not witnessing the same magnitude of impact as jurisdictions where technology adoption is higher.
“The more you can replace humans with robots, the more efficiency there will be. There is no particular manufacturing task that will be immune from automation. I suspect it’s only a matter of time before there are no longer constraints.” —Ontario manufacturer
Skills Demands
Whether as a result of automation or other drivers, the skills and education associated with employment in the sector have changed. Interviewees report that workers now carry, on average, a “higher cognitive load” in their roles. Many report an increased need for more highly skilled, highly educated workers to fill roles in leadership and production management, as well as a general increase in the need for flexibility and adaptability to allow production line workers to participate in design, quality control and continuous improvement.
Data from Burning Glass Technologies (BGT) suggests that there is high demand for employees with interpersonal, sales and marketing, and project management skills, as well as employees
Figure 6.12:Top 10 Occupations in Manufacturing, Based on Employer Demand, Ontario, 2013–2017
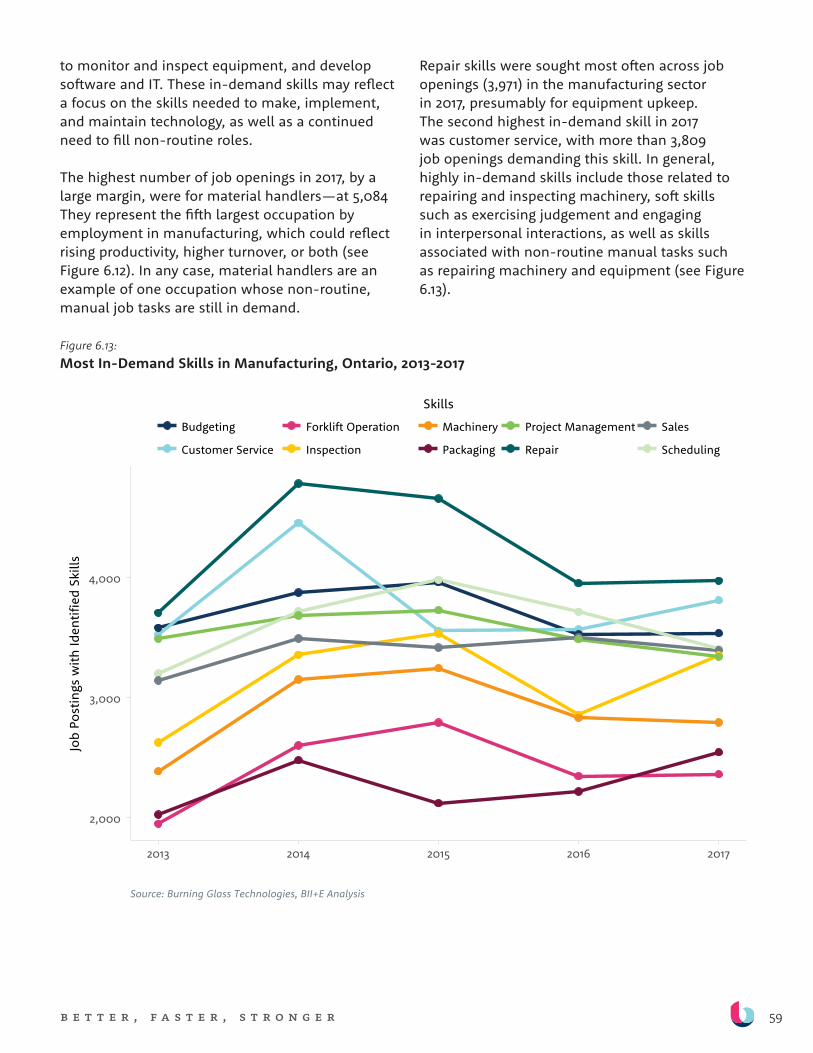
59b e t t e r , f a s t e r , s t r o n g e r
to monitor and inspect equipment, and develop software and IT. These in-demand skills may reflect a focus on the skills needed to make, implement, and maintain technology, as well as a continued need to fill non-routine roles.
The highest number of job openings in 2017, by a large margin, were for material handlers—at 5,084 They represent the fifth largest occupation by employment in manufacturing, which could reflect rising productivity, higher turnover, or both (see Figure 6.12). In any case, material handlers are an example of one occupation whose non-routine, manual job tasks are still in demand.
Repair skills were sought most often across job openings (3,971) in the manufacturing sector in 2017, presumably for equipment upkeep. The second highest in-demand skill in 2017 was customer service, with more than 3,809 job openings demanding this skill. In general, highly in-demand skills include those related to repairing and inspecting machinery, soft skills such as exercising judgement and engaging in interpersonal interactions, as well as skills associated with non-routine manual tasks such as repairing machinery and equipment (see Figure 6.13).
Figure 6.13:Most In-Demand Skills in Manufacturing, Ontario, 2013-2017
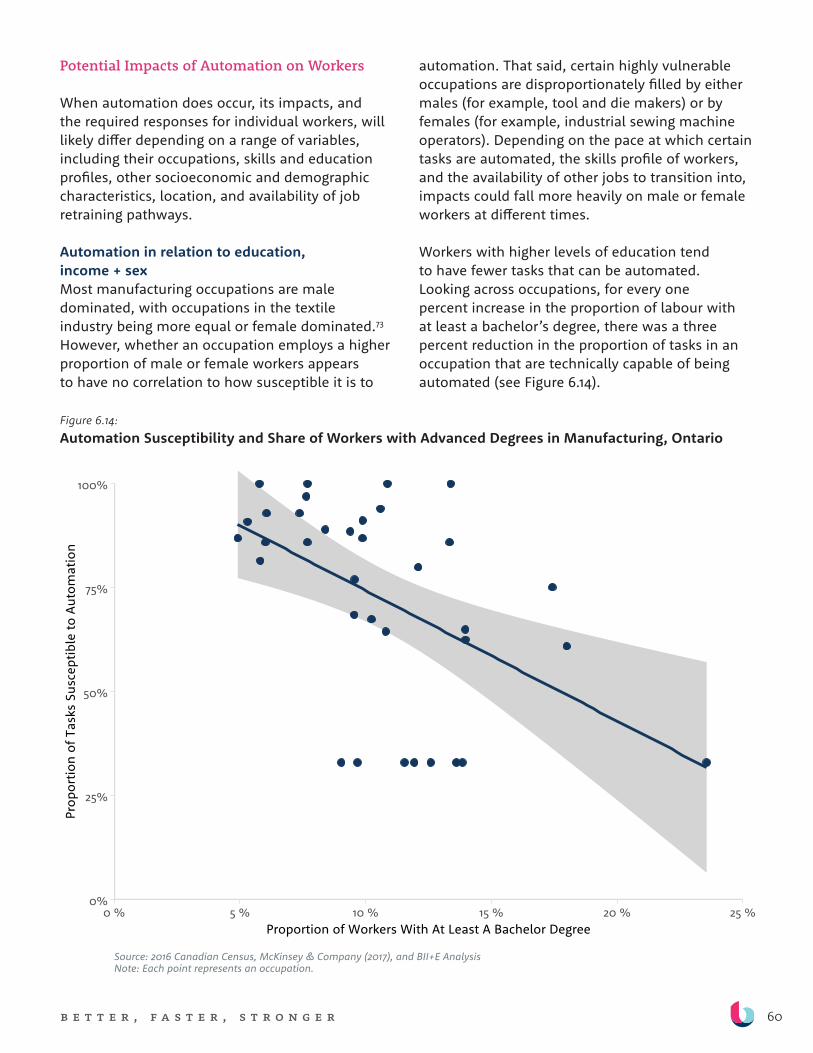
60b e t t e r , f a s t e r , s t r o n g e r
Potential Impacts of Automation on Workers
When automation does occur, its impacts, and the required responses for individual workers, will likely differ depending on a range of variables, including their occupations, skills and education profiles, other socioeconomic and demographic characteristics, location, and availability of job retraining pathways.
Automation in relation to education, income + sexMost manufacturing occupations are male dominated, with occupations in the textile industry being more equal or female dominated.73 However, whether an occupation employs a higher proportion of male or female workers appears to have no correlation to how susceptible it is to
automation. That said, certain highly vulnerable occupations are disproportionately filled by either males (for example, tool and die makers) or by females (for example, industrial sewing machine operators). Depending on the pace at which certain tasks are automated, the skills profile of workers, and the availability of other jobs to transition into, impacts could fall more heavily on male or female workers at different times.
Workers with higher levels of education tend to have fewer tasks that can be automated. Looking across occupations, for every one percent increase in the proportion of labour with at least a bachelor’s degree, there was a three percent reduction in the proportion of tasks in an occupation that are technically capable of being automated (see Figure 6.14).
Figure 6.14:Automation Susceptibility and Share of Workers with Advanced Degrees in Manufacturing, Ontario
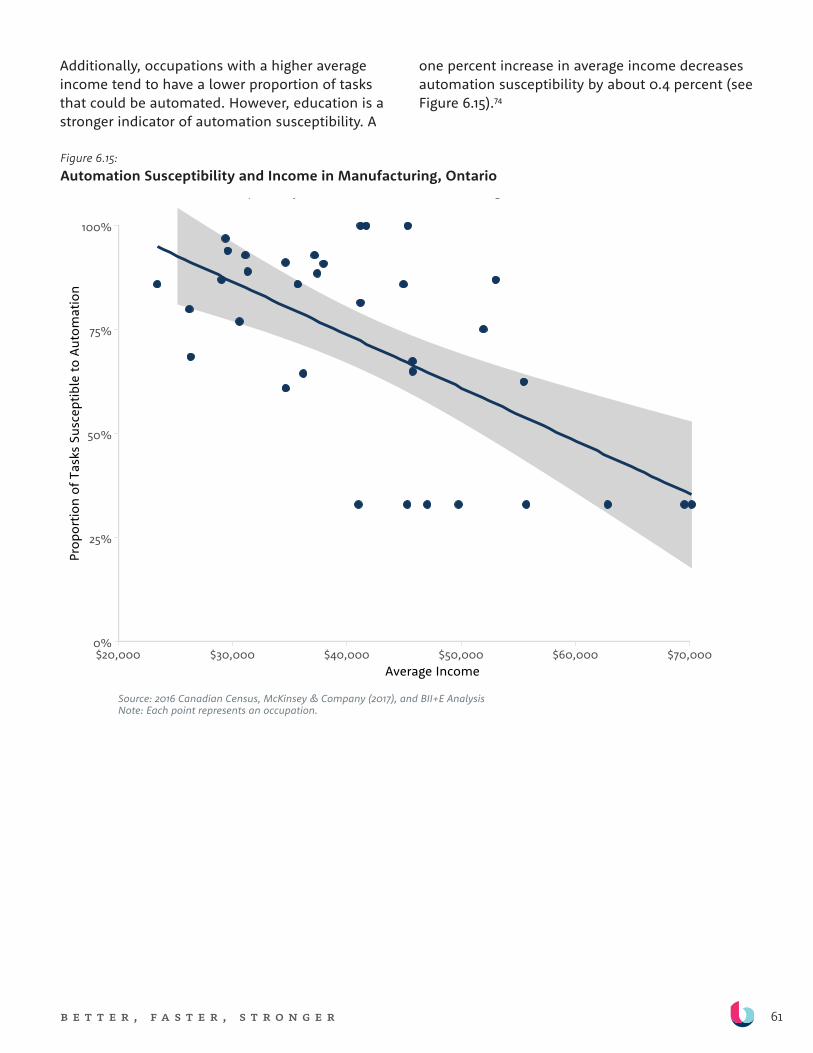
61b e t t e r , f a s t e r , s t r o n g e r
Additionally, occupations with a higher average income tend to have a lower proportion of tasks that could be automated. However, education is a stronger indicator of automation susceptibility. A
one percent increase in average income decreases automation susceptibility by about 0.4 percent (see Figure 6.15).74
Figure 6.15:Automation Susceptibility and Income in Manufacturing, Ontario

62b e t t e r , f a s t e r , s t r o n g e r
The workers most vulnerable to automationIn total, the manufacturing sector is home to 166 occupations that we consider highly vulnerable to
automation (with 50 percent or more tasks that technically can be automated), employing 370,850 people within the sector (see Figure 6.16).
Figure 6.16:Manufacturing Employment by Automation Susceptibility, Ontario
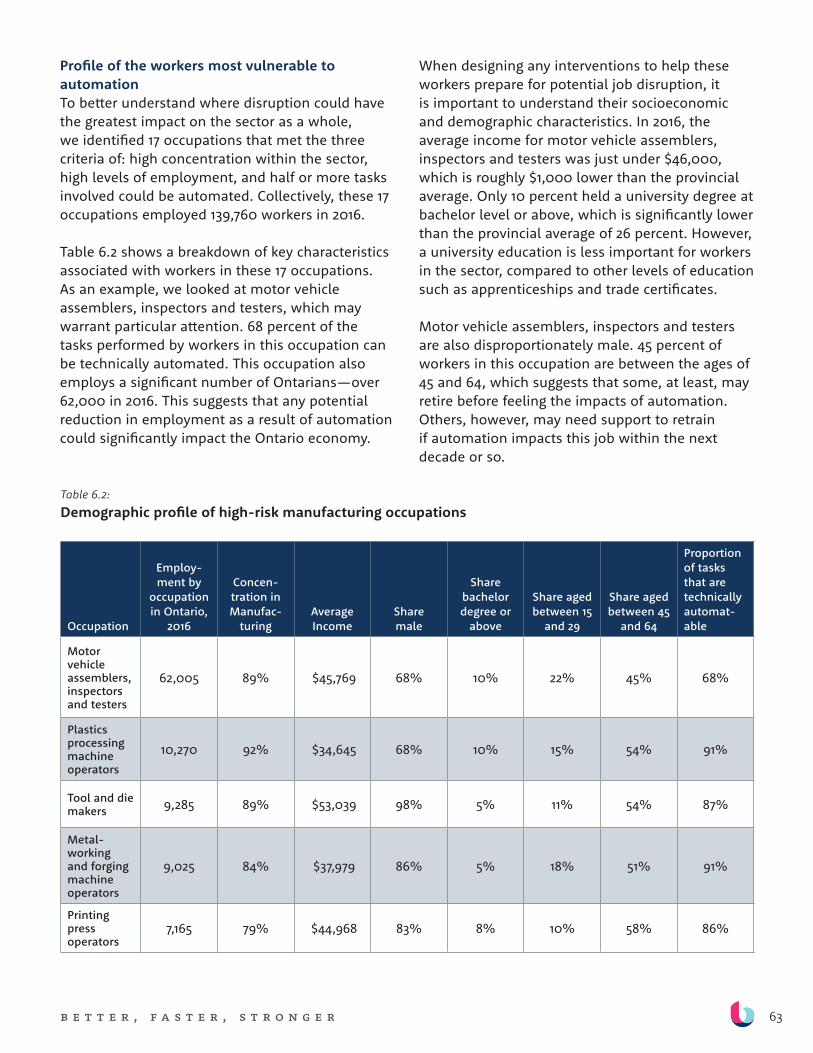
63b e t t e r , f a s t e r , s t r o n g e r
Profile of the workers most vulnerable to automationTo better understand where disruption could have the greatest impact on the sector as a whole, we identified 17 occupations that met the three criteria of: high concentration within the sector, high levels of employment, and half or more tasks involved could be automated. Collectively, these 17 occupations employed 139,760 workers in 2016.
Table 6.2 shows a breakdown of key characteristics associated with workers in these 17 occupations. As an example, we looked at motor vehicle assemblers, inspectors and testers, which may warrant particular attention. 68 percent of the tasks performed by workers in this occupation can be technically automated. This occupation also employs a significant number of Ontarians—over 62,000 in 2016. This suggests that any potential reduction in employment as a result of automation could significantly impact the Ontario economy.
When designing any interventions to help these workers prepare for potential job disruption, it is important to understand their socioeconomic and demographic characteristics. In 2016, the average income for motor vehicle assemblers, inspectors and testers was just under $46,000, which is roughly $1,000 lower than the provincial average. Only 10 percent held a university degree at bachelor level or above, which is significantly lower than the provincial average of 26 percent. However, a university education is less important for workers in the sector, compared to other levels of education such as apprenticeships and trade certificates.
Motor vehicle assemblers, inspectors and testers are also disproportionately male. 45 percent of workers in this occupation are between the ages of 45 and 64, which suggests that some, at least, may retire before feeling the impacts of automation. Others, however, may need support to retrain if automation impacts this job within the next decade or so.
Table 6.2: Demographic profile of high-risk manufacturing occupations
Occupation
Employ-ment by
occupation in Ontario,
2016
Concen-tration in Manufac-
turingAverage Income
Share male
Share bachelor degree or
above
Share aged between 15
and 29
Share aged between 45
and 64
Proportion of tasks that are technically automat-able
Motor vehicle assemblers, inspectors and testers
62,005 89% $45,769 68% 10% 22% 45% 68%
Plastics processing machine operators
10,270 92% $34,645 68% 10% 15% 54% 91%
Tool and die makers 9,285 89% $53,039 98% 5% 11% 54% 87%
Metal-working and forging machine operators
9,025 84% $37,979 86% 5% 18% 51% 91%
Printing press operators
7,165 79% $44,968 83% 8% 10% 58% 86%
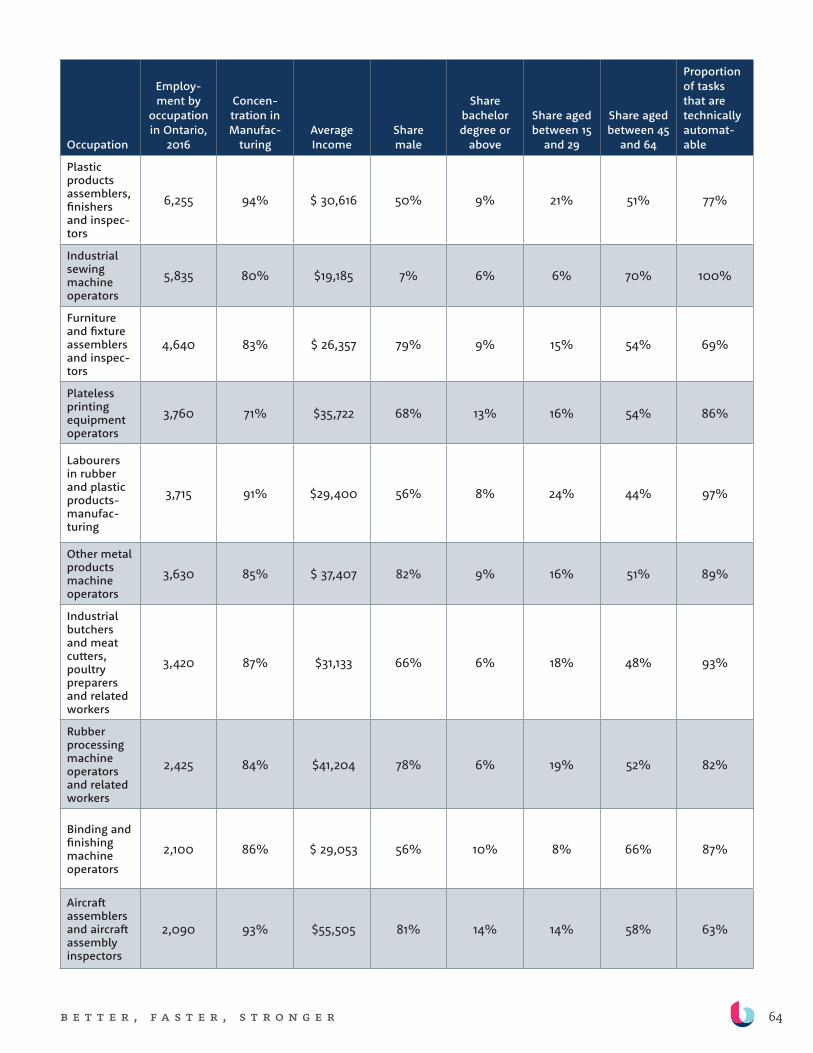
64b e t t e r , f a s t e r , s t r o n g e r
Occupation
Employ-ment by
occupation in Ontario,
2016
Concen-tration in Manufac-
turingAverage Income
Share male
Share bachelor degree or
above
Share aged between 15
and 29
Share aged between 45
and 64
Proportion of tasks that are technically automat-able
Plastic products assemblers, finishers and inspec-tors
6,255 94% $ 30,616 50% 9% 21% 51% 77%
Industrial sewing machine operators
5,835 80% $19,185 7% 6% 6% 70% 100%
Furniture and fixture assemblers and inspec-tors
4,640 83% $ 26,357 79% 9% 15% 54% 69%
Plateless printing equipment operators
3,760 71% $35,722 68% 13% 16% 54% 86%
Labourers in rubber and plastic products-manufac-turing
3,715 91% $29,400 56% 8% 24% 44% 97%
Other metal products machine operators
3,630 85% $ 37,407 82% 9% 16% 51% 89%
Industrial butchers and meat cutters, poultry preparers and related workers
3,420 87% $31,133 66% 6% 18% 48% 93%
Rubber processing machine operators and related workers
2,425 84% $41,204 78% 6% 19% 52% 82%
Binding and finishing machine operators
2,100 86% $ 29,053 56% 10% 8% 66% 87%
Aircraft assemblers and aircraft assembly inspectors
2,090 93% $55,505 81% 14% 14% 58% 63%
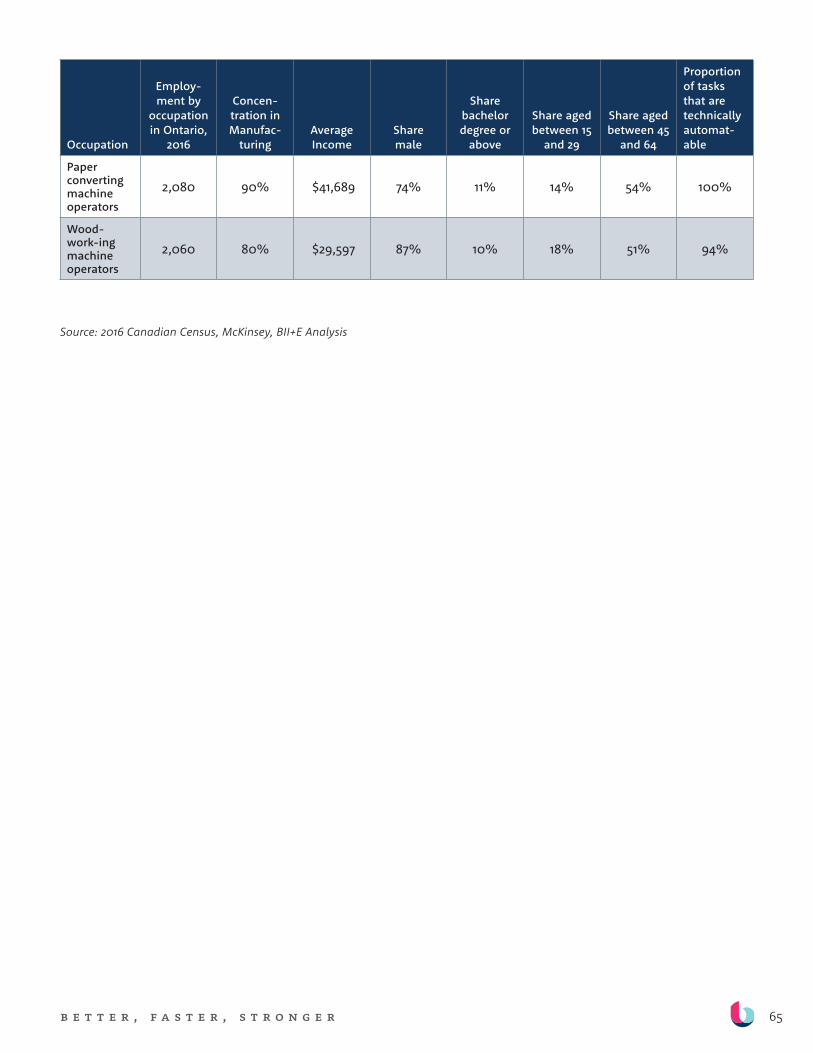
65b e t t e r , f a s t e r , s t r o n g e r
Occupation
Employ-ment by
occupation in Ontario,
2016
Concen-tration in Manufac-
turingAverage Income
Share male
Share bachelor degree or
above
Share aged between 15
and 29
Share aged between 45
and 64
Proportion of tasks that are technically automat-able
Paper converting machine operators
2,080 90% $41,689 74% 11% 14% 54% 100%
Wood-work-ing machine operators
2,060 80% $29,597 87% 10% 18% 51% 94%
Source: 2016 Canadian Census, McKinsey, BII+E Analysis

66b e t t e r , f a s t e r , s t r o n g e r
Geographic distribution of vulnerability Cities and towns in southwestern Ontario, notably Windsor, Midland, Leamington, and Tillsonburg, have particularly high concentrations of workers in the 17 high-risk occupations. Other areas such
as Owen Sound and Belleville also employ a high proportion of vulnerable workers (see Figure 6.17). This suggests that should manufacturing firms decide to automate, these cities and towns could be adversely affected.
Figure 6.17Geographic Concentration of Manufacturing Occupations Highly Susceptible to Automation, Ontario
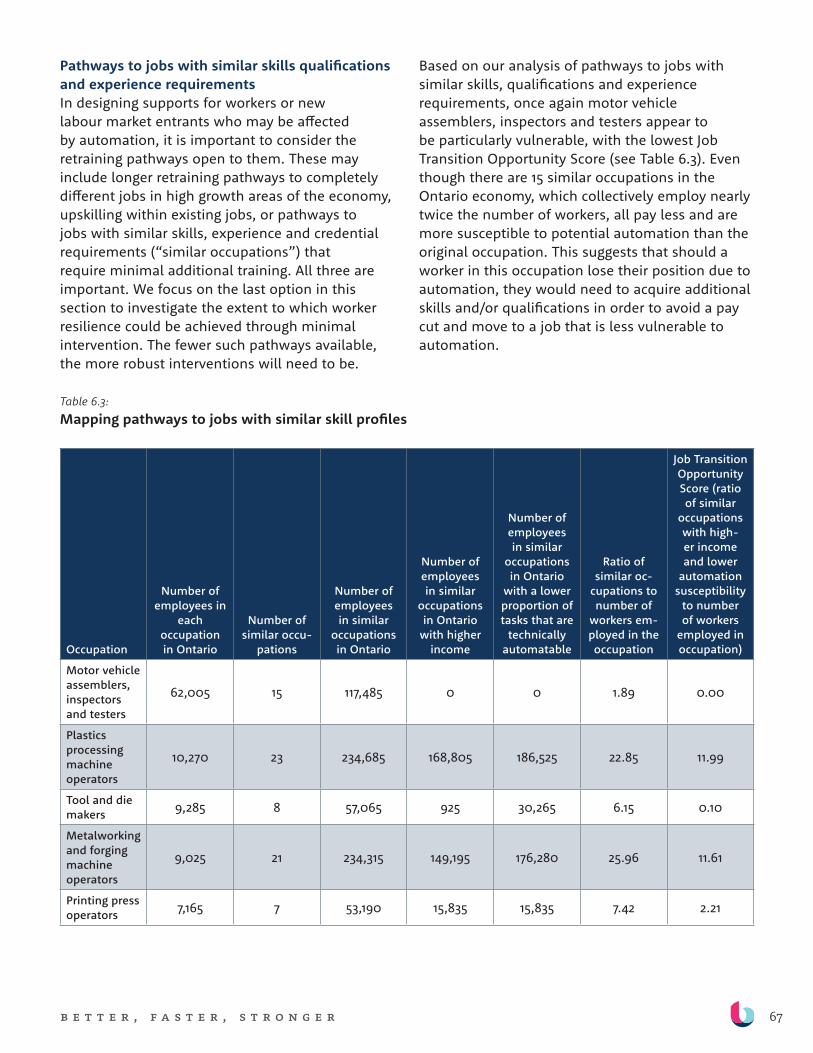
67b e t t e r , f a s t e r , s t r o n g e r
Pathways to jobs with similar skills qualifications and experience requirementsIn designing supports for workers or new labour market entrants who may be affected by automation, it is important to consider the retraining pathways open to them. These may include longer retraining pathways to completely different jobs in high growth areas of the economy, upskilling within existing jobs, or pathways to jobs with similar skills, experience and credential requirements (“similar occupations”) that require minimal additional training. All three are important. We focus on the last option in this section to investigate the extent to which worker resilience could be achieved through minimal intervention. The fewer such pathways available, the more robust interventions will need to be.
Based on our analysis of pathways to jobs with similar skills, qualifications and experience requirements, once again motor vehicle assemblers, inspectors and testers appear to be particularly vulnerable, with the lowest Job Transition Opportunity Score (see Table 6.3). Even though there are 15 similar occupations in the Ontario economy, which collectively employ nearly twice the number of workers, all pay less and are more susceptible to potential automation than the original occupation. This suggests that should a worker in this occupation lose their position due to automation, they would need to acquire additional skills and/or qualifications in order to avoid a pay cut and move to a job that is less vulnerable to automation.
Table 6.3: Mapping pathways to jobs with similar skill profiles
Occupation
Number of employees in
each occupation in Ontario
Number of similar occu-
pations
Number of employees in similar
occupations in Ontario
Number of employees in similar
occupations in Ontario
with higher income
Number of employees in similar
occupations in Ontario
with a lower proportion of tasks that are
technically automatable
Ratio of similar oc-
cupations to number of
workers em-ployed in the occupation
Job Transition Opportunity Score (ratio of similar
occupations with high-er income and lower
automation susceptibility
to number of workers
employed in occupation)
Motor vehicle assemblers, inspectors and testers
62,005 15 117,485 0 0 1.89 0.00
Plastics processing machine operators
10,270 23 234,685 168,805 186,525 22.85 11.99
Tool and die makers 9,285 8 57,065 925 30,265 6.15 0.10
Metalworking and forging machine operators
9,025 21 234,315 149,195 176,280 25.96 11.61
Printing press operators 7,165 7 53,190 15,835 15,835 7.42 2.21
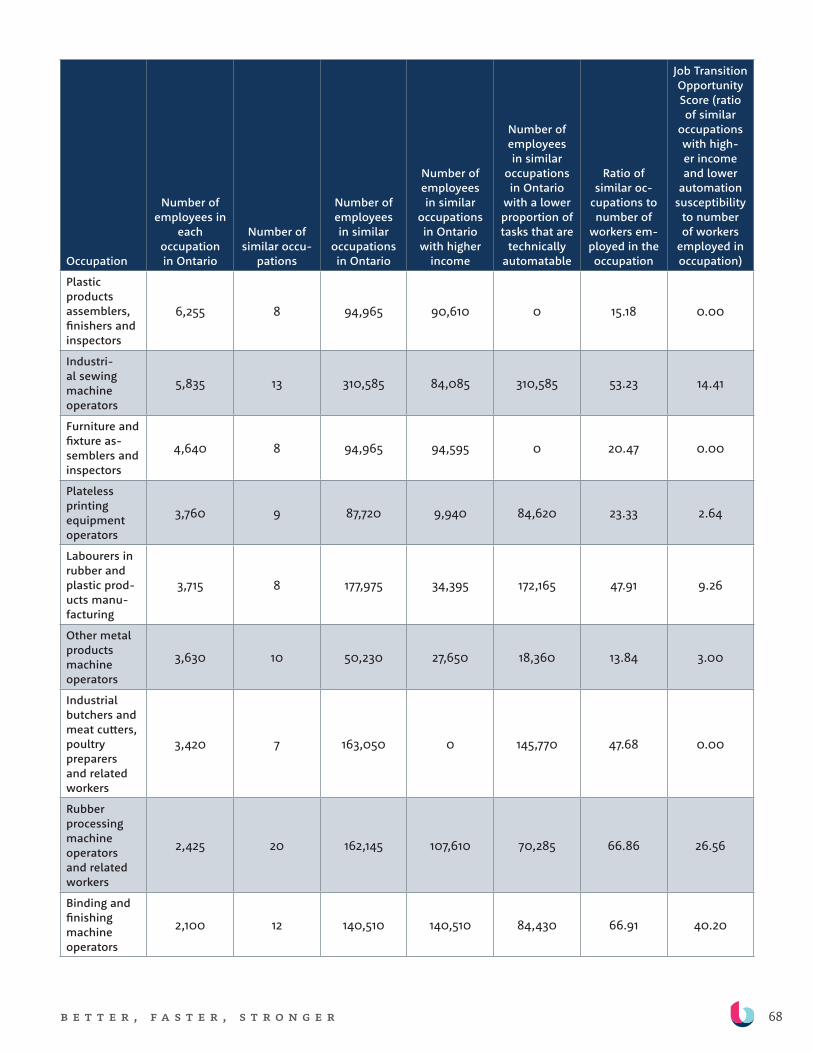
68b e t t e r , f a s t e r , s t r o n g e r
Occupation
Number of employees in
each occupation in Ontario
Number of similar occu-
pations
Number of employees in similar
occupations in Ontario
Number of employees in similar
occupations in Ontario
with higher income
Number of employees in similar
occupations in Ontario
with a lower proportion of tasks that are
technically automatable
Ratio of similar oc-
cupations to number of
workers em-ployed in the occupation
Job Transition Opportunity Score (ratio of similar
occupations with high-er income and lower
automation susceptibility
to number of workers
employed in occupation)
Plastic products assemblers, finishers and inspectors
6,255 8 94,965 90,610 0 15.18 0.00
Industri-al sewing machine operators
5,835 13 310,585 84,085 310,585 53.23 14.41
Furniture and fixture as-semblers and inspectors
4,640 8 94,965 94,595 0 20.47 0.00
Plateless printing equipment operators
3,760 9 87,720 9,940 84,620 23.33 2.64
Labourers in rubber and plastic prod-ucts manu-facturing
3,715 8 177,975 34,395 172,165 47.91 9.26
Other metal products machine operators
3,630 10 50,230 27,650 18,360 13.84 3.00
Industrial butchers and meat cutters, poultry preparers and related workers
3,420 7 163,050 0 145,770 47.68 0.00
Rubber processing machine operators and related workers
2,425 20 162,145 107,610 70,285 66.86 26.56
Binding and finishing machine operators
2,100 12 140,510 140,510 84,430 66.91 40.20
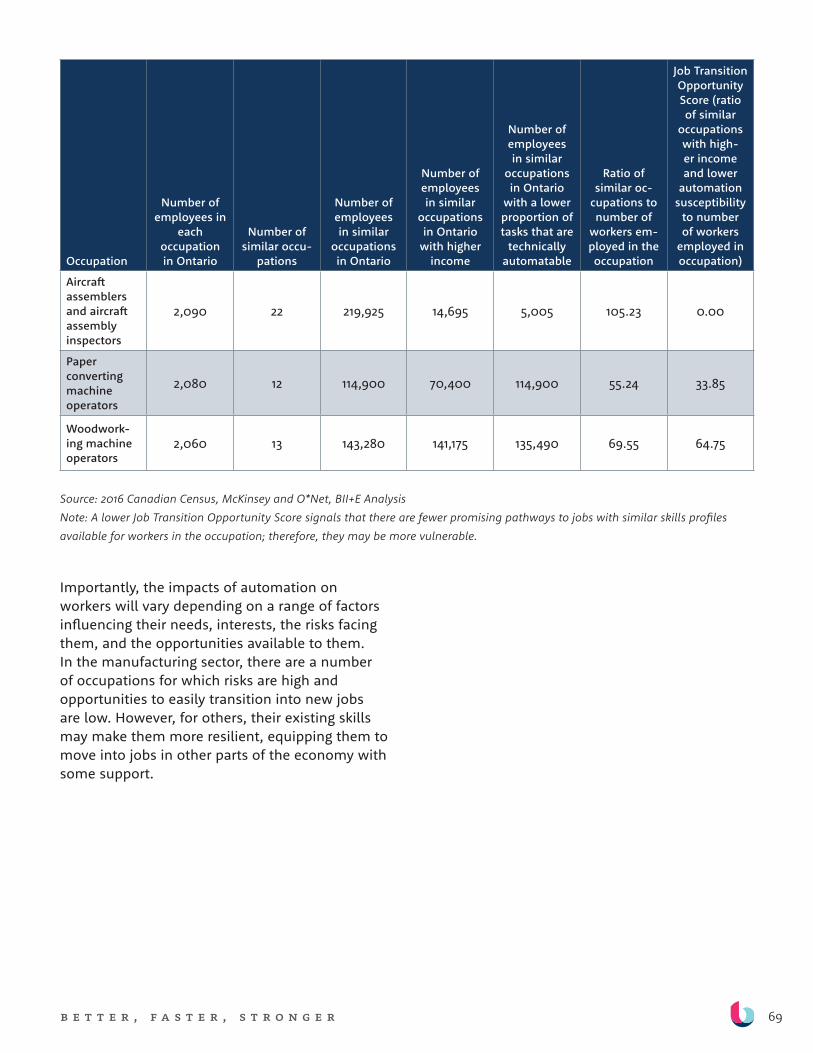
69b e t t e r , f a s t e r , s t r o n g e r
Occupation
Number of employees in
each occupation in Ontario
Number of similar occu-
pations
Number of employees in similar
occupations in Ontario
Number of employees in similar
occupations in Ontario
with higher income
Number of employees in similar
occupations in Ontario
with a lower proportion of tasks that are
technically automatable
Ratio of similar oc-
cupations to number of
workers em-ployed in the occupation
Job Transition Opportunity Score (ratio of similar
occupations with high-er income and lower
automation susceptibility
to number of workers
employed in occupation)
Aircraft assemblers and aircraft assembly inspectors
2,090 22 219,925 14,695 5,005 105.23 0.00
Paper converting machine operators
2,080 12 114,900 70,400 114,900 55.24 33.85
Woodwork-ing machine operators
2,060 13 143,280 141,175 135,490 69.55 64.75
Source: 2016 Canadian Census, McKinsey and O*Net, BII+E AnalysisNote: A lower Job Transition Opportunity Score signals that there are fewer promising pathways to jobs with similar skills profiles available for workers in the occupation; therefore, they may be more vulnerable.
Importantly, the impacts of automation on workers will vary depending on a range of factors influencing their needs, interests, the risks facing them, and the opportunities available to them. In the manufacturing sector, there are a number of occupations for which risks are high and opportunities to easily transition into new jobs are low. However, for others, their existing skills may make them more resilient, equipping them to move into jobs in other parts of the economy with some support.

70b e t t e r , f a s t e r , s t r o n g e r
f i n A n c e +
i n S u r A n c e S e c t o r
p r o f i l e
Finance and insurance firms have long been at the forefront of technology adoption and, in recent years, the division between traditional financial institutions and tech firms has
blurred. Technological changes are being driven by consumer demands, increased competition, and the need and desire to develop new business models. Consumers are demanding the same kinds of seamless, customized digital experiences that they get elsewhere in the economy. The sector has also experienced a rapid influx of FinTech startups that use technology and advanced data analysis to offer complementary and competitive services.
However, as with manufacturers, financial and insurance firms face a number of challenges that inhibit more robust technology adoption in the sector. For example, challenges relate to technical issues, talent gaps, and regulations.
To date automation in the sector has not led to a reduction in the total number of jobs.
Employment in Ontario’s finance and insurance sector has grown substantially over the past two decades. However, automation has impacted the kinds of skills employers are looking for—lowering the number of transactional tasks that workers perform, freeing employees up for more complex tasks, and giving firms space to work with customers and data to develop new products and services and expand their customer base.
While in absolute terms, occupations in the finance and insurance sector have a relatively low proportion of tasks that can technically be automated, there are a number of core finance occupations whose fates might be different, including insurance agents and brokers; insurance adjusters and claims examiners; and banking, insurance, and other financial clerks. Workers in these occupations are highly concentrated in Kitchener-Waterloo and London, and may require skills upgrades should firms decide to invest in automation and reduce employment.
Automation has impacted the
kinds of skills employers are
looking for—lowering the number
of transactional tasks that workers
perform, freeing employees up for
more complex tasks.
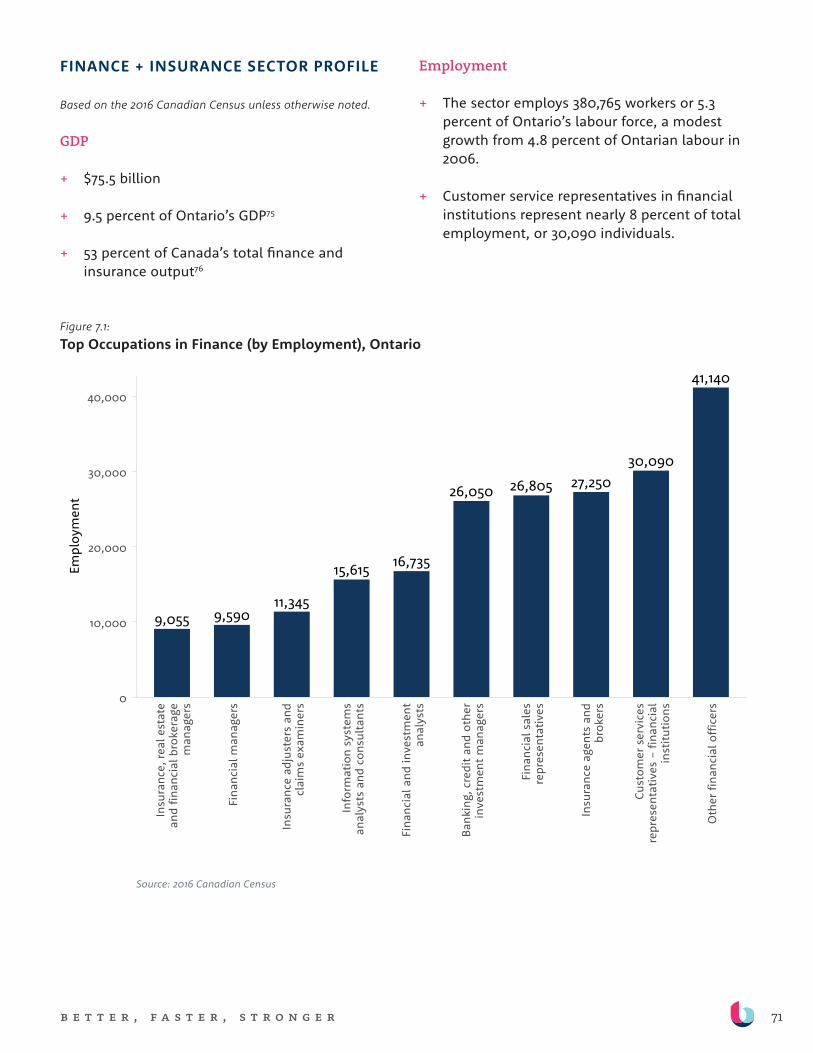
71b e t t e r , f a s t e r , s t r o n g e r
FINANCE + INSURANCE SECTOR PROFILE
Based on the 2016 Canadian Census unless otherwise noted.
GDP
+ $75.5 billion
+ 9.5 percent of Ontario’s GDP75
+ 53 percent of Canada’s total finance and insurance output76
Employment
+ The sector employs 380,765 workers or 5.3 percent of Ontario’s labour force, a modest growth from 4.8 percent of Ontarian labour in 2006.
+ Customer service representatives in financial institutions represent nearly 8 percent of total employment, or 30,090 individuals.
Figure 7.1:Top Occupations in Finance (by Employment), Ontario
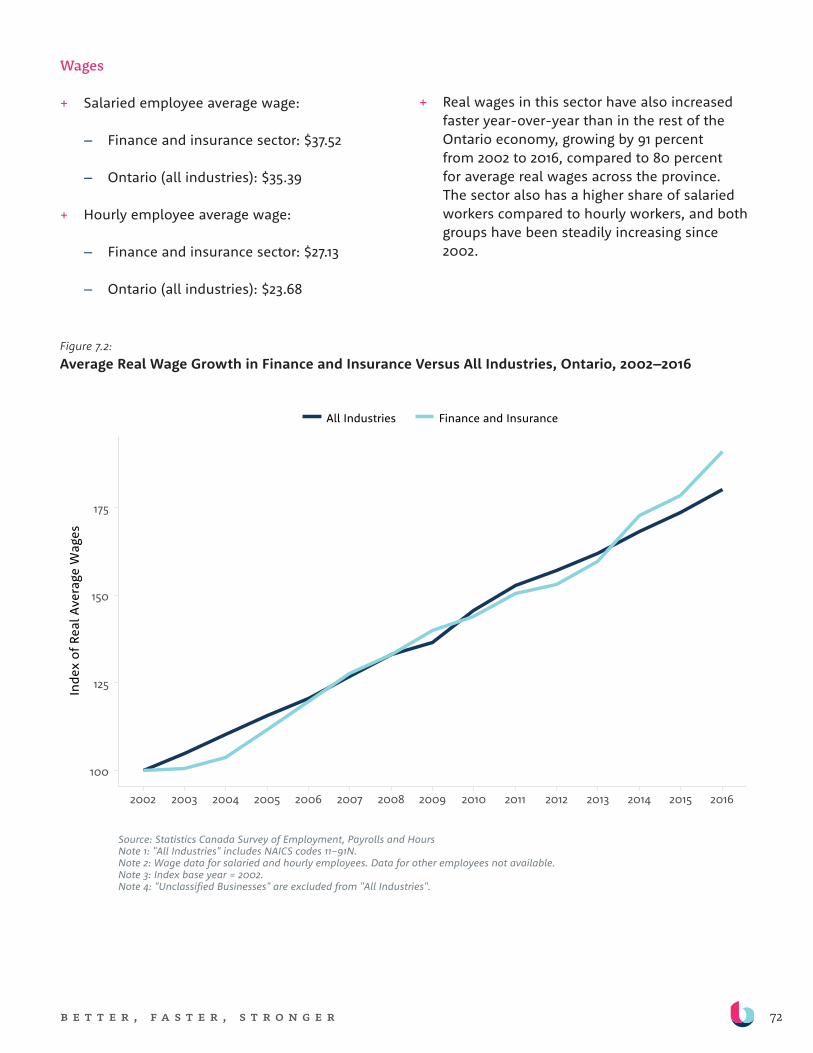
72b e t t e r , f a s t e r , s t r o n g e r
Wages
+ Salaried employee average wage:
– Finance and insurance sector: $37.52
– Ontario (all industries): $35.39
+ Hourly employee average wage:
– Finance and insurance sector: $27.13
– Ontario (all industries): $23.68
+ Real wages in this sector have also increased faster year-over-year than in the rest of the Ontario economy, growing by 91 percent from 2002 to 2016, compared to 80 percent for average real wages across the province. The sector also has a higher share of salaried workers compared to hourly workers, and both groups have been steadily increasing since 2002.
Figure 7.2:Average Real Wage Growth in Finance and Insurance Versus All Industries, Ontario, 2002–2016
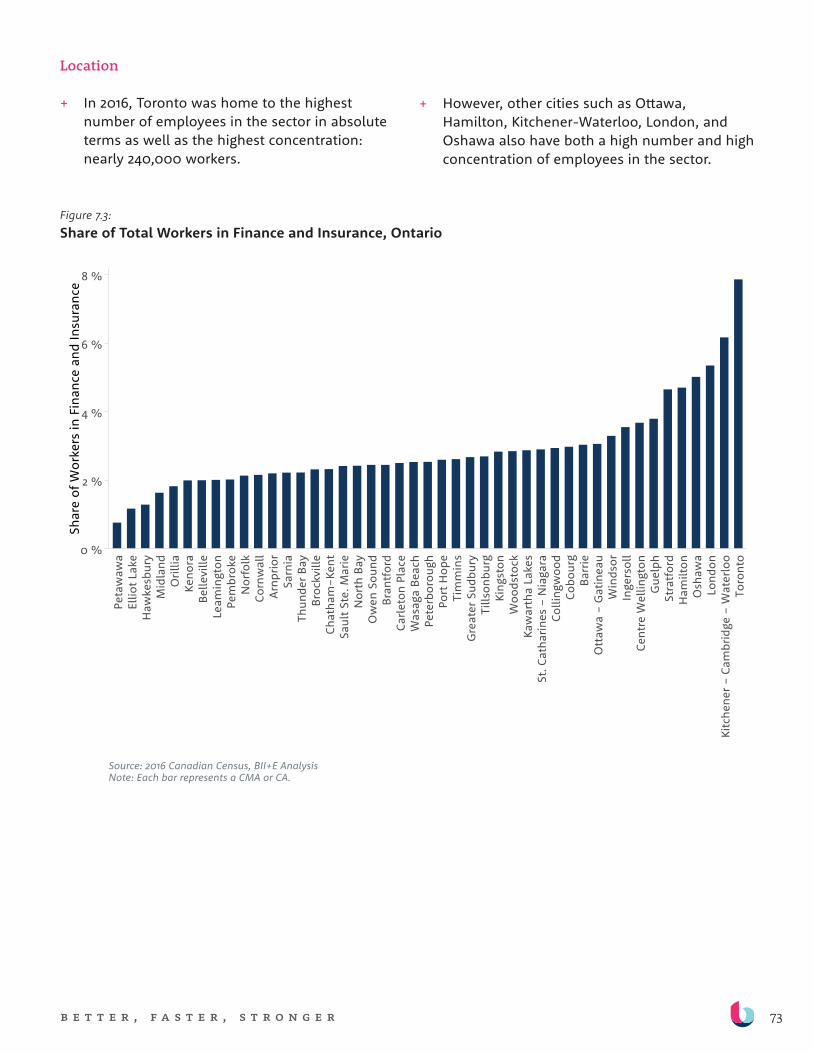
73b e t t e r , f a s t e r , s t r o n g e r
Location
+ In 2016, Toronto was home to the highest number of employees in the sector in absolute terms as well as the highest concentration: nearly 240,000 workers.
Figure 7.3:Share of Total Workers in Finance and Insurance, Ontario
+ However, other cities such as Ottawa, Hamilton, Kitchener-Waterloo, London, and Oshawa also have both a high number and high concentration of employees in the sector.
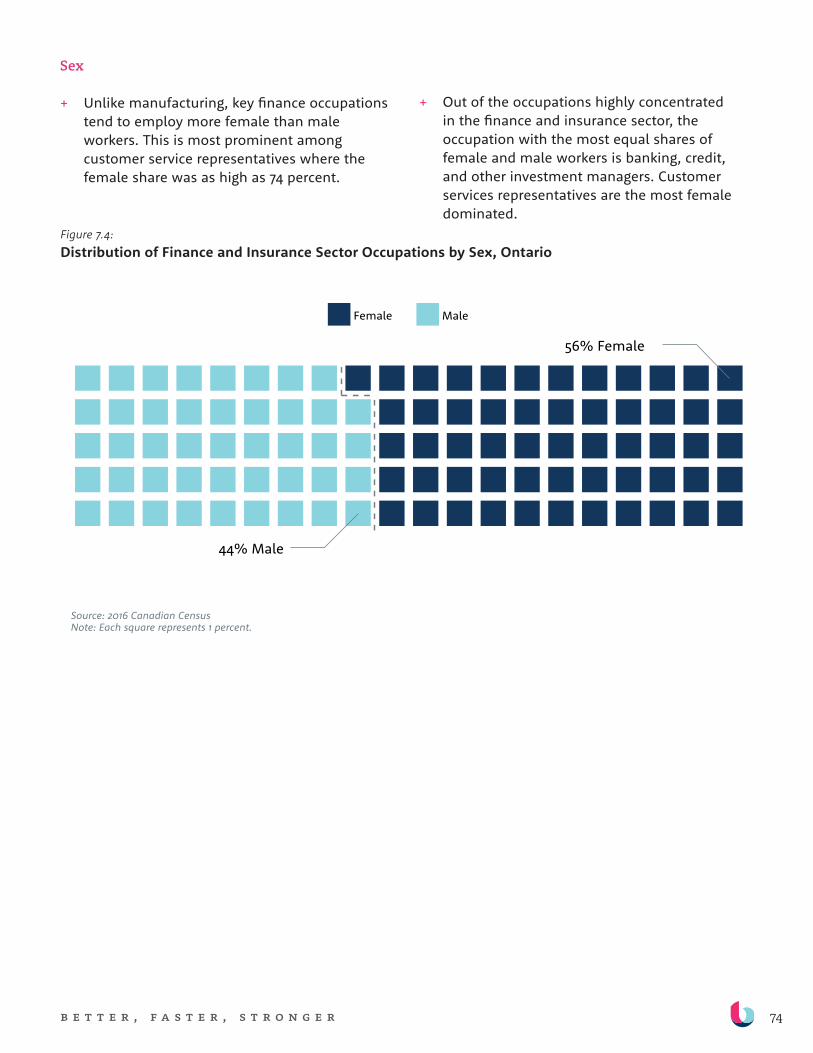
74b e t t e r , f a s t e r , s t r o n g e r
Sex
+ Unlike manufacturing, key finance occupations tend to employ more female than male workers. This is most prominent among customer service representatives where the female share was as high as 74 percent.
+ Out of the occupations highly concentrated in the finance and insurance sector, the occupation with the most equal shares of female and male workers is banking, credit, and other investment managers. Customer services representatives are the most female dominated.
Figure 7.4:Distribution of Finance and Insurance Sector Occupations by Sex, Ontario
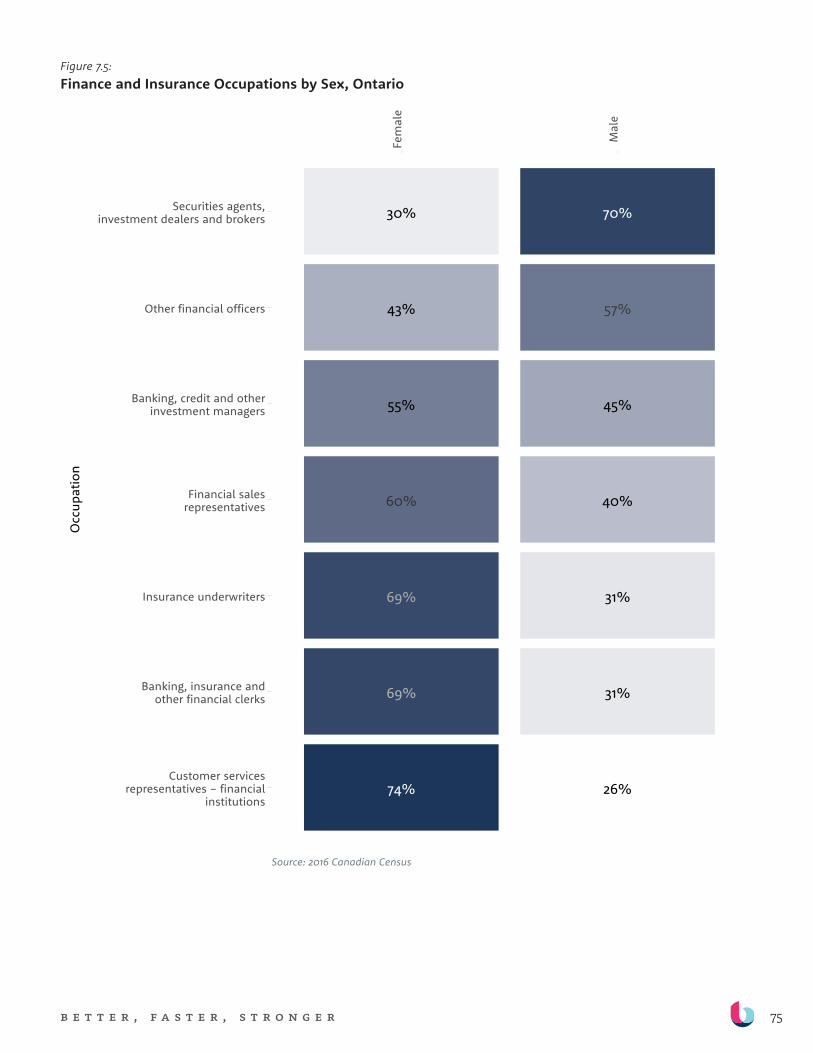
75b e t t e r , f a s t e r , s t r o n g e r
Figure 7.5:Finance and Insurance Occupations by Sex, Ontario
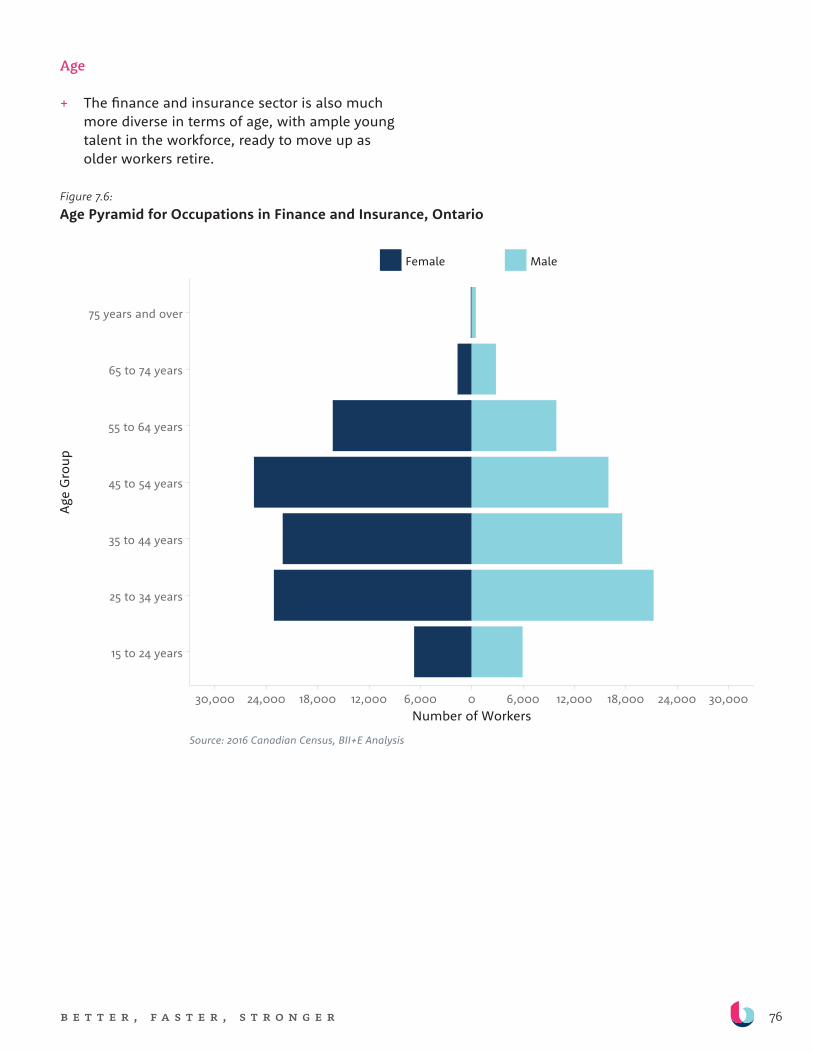
76b e t t e r , f a s t e r , s t r o n g e r
Age
+ The finance and insurance sector is also much more diverse in terms of age, with ample young talent in the workforce, ready to move up as older workers retire.
Figure 7.6:Age Pyramid for Occupations in Finance and Insurance, Ontario
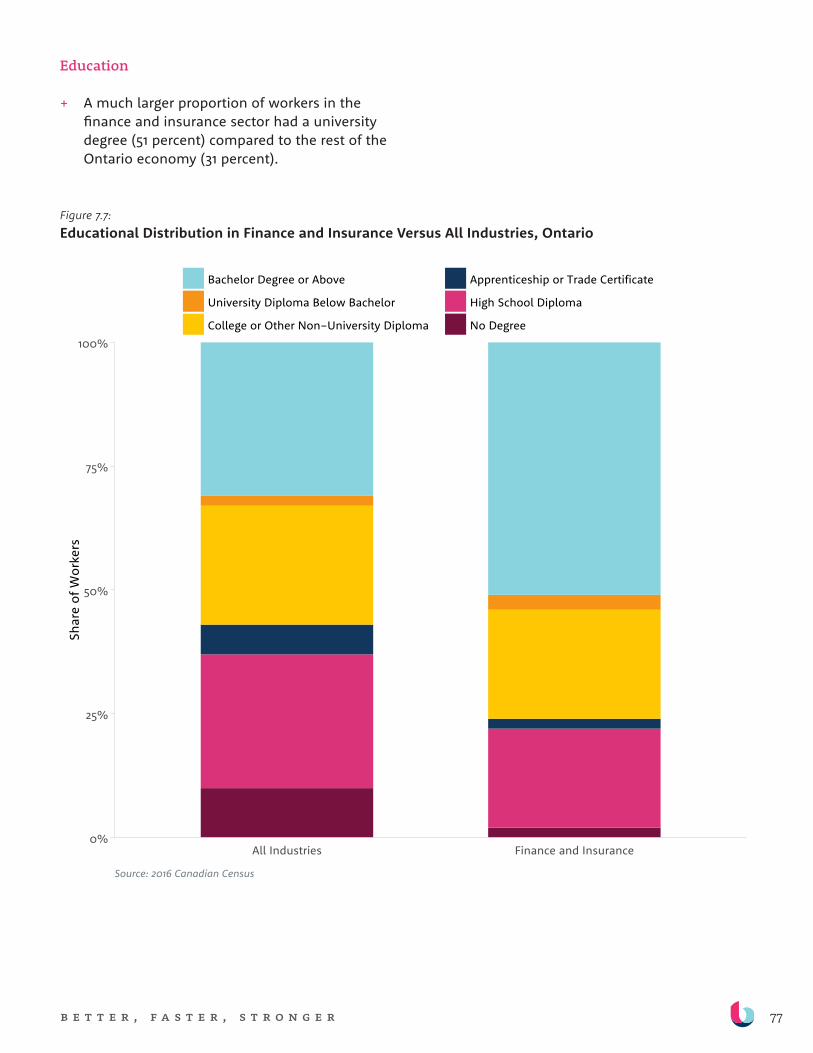
77b e t t e r , f a s t e r , s t r o n g e r
Education
+ A much larger proportion of workers in the finance and insurance sector had a university degree (51 percent) compared to the rest of the Ontario economy (31 percent).
Figure 7.7:Educational Distribution in Finance and Insurance Versus All Industries, Ontario
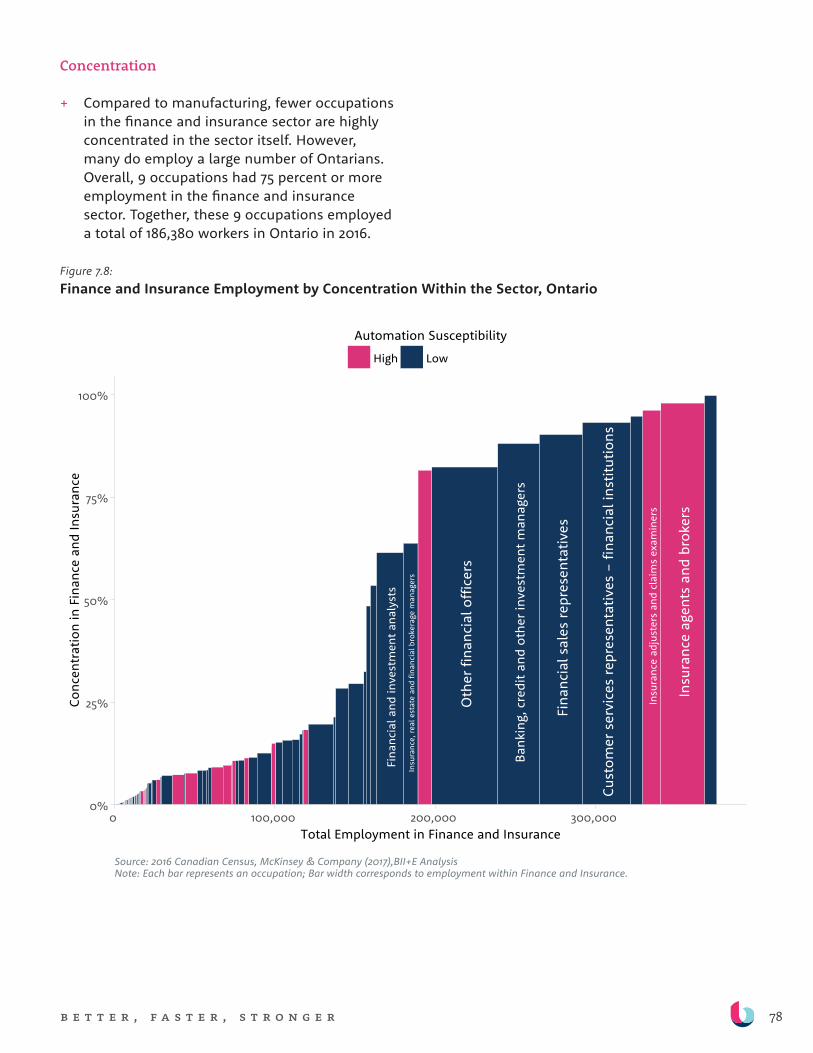
78b e t t e r , f a s t e r , s t r o n g e r
Concentration
+ Compared to manufacturing, fewer occupations in the finance and insurance sector are highly concentrated in the sector itself. However, many do employ a large number of Ontarians. Overall, 9 occupations had 75 percent or more employment in the finance and insurance sector. Together, these 9 occupations employed a total of 186,380 workers in Ontario in 2016.
Figure 7.8:Finance and Insurance Employment by Concentration Within the Sector, Ontario
79b e t t e r , f a s t e r , s t r o n g e r
EMPLOYMENT + OUTPUT: KEY TRENDS
The finance and insurance sector in Canada is highly consolidated and regulated. These institutions and structures helped Canadian banks to emerge relatively unscathed from the global financial crisis of 2008-09, unlike their counterparts in the US and elsewhere in the world.77
As Ontario constitutes about half of employment in Canada’s finance and insurance sector and serves as the headquarters for many of the country’s finance and insurance companies, examining employment and output trends in Canadian finance and insurance overall is instructive. Employment in the sector in Canada has increased substantially over the past decade, growing by 10.5 percent from 2006 to 2016—slower than only a few sectors (mining, oil and gas, healthcare, and professional services).
By 2016, the sector accounted for 4.5 percent of Canadian employment overall (808,100 jobs). Ontario’s share in 2016 was nearly half that: more than 380,000 jobs. 78, 79
Between 2006 and 2016, Canada’s finance and insurance sector experienced a 28 percent growth in GDP, nearly double the average for the Canadian economy as a whole. In Ontario, the sector contributes $62.7 billion, or 9.9 percent, to the province’s GDP.”80
Our analysis discovered that although the sector lags behind international peers on technology adoption, it has experienced technological changes that have affected the nature of work. However, those changes seem to have supported, rather than detracted from, employment and output growth in the sector.
TECHNOLOGY ADOPTION: DRIVERS, BARRIERS + TRENDS
Ontario’s finance and insurance sector is embracing technological developments in areas such as digital platforms, AI, and blockchain. The emergence of FinTech startups with the potential to chip away at the business models of large incumbents is prompting these larger institutions to consider greater technology investment.
However, historically, finance and insurance firms in the province have adopted technologies gradually, owing to a range of barriers and challenges that face both incumbents and startups alike. As with the manufacturing sector, the challenge facing finance and insurance is a dual one: to overcome barriers to technology adoption, while also ensuring that workers can be retrained and redeployed.
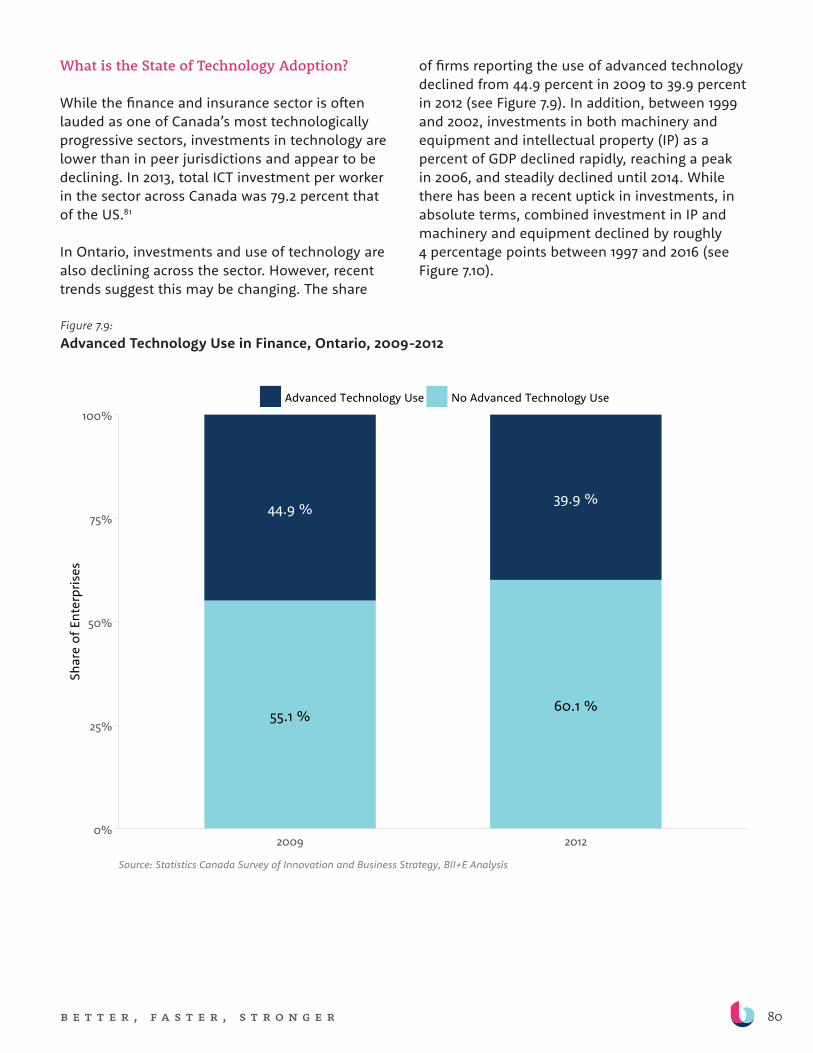
80b e t t e r , f a s t e r , s t r o n g e r
What is the State of Technology Adoption?
While the finance and insurance sector is often lauded as one of Canada’s most technologically progressive sectors, investments in technology are lower than in peer jurisdictions and appear to be declining. In 2013, total ICT investment per worker in the sector across Canada was 79.2 percent that of the US.81
In Ontario, investments and use of technology are also declining across the sector. However, recent trends suggest this may be changing. The share
of firms reporting the use of advanced technology declined from 44.9 percent in 2009 to 39.9 percent in 2012 (see Figure 7.9). In addition, between 1999 and 2002, investments in both machinery and equipment and intellectual property (IP) as a percent of GDP declined rapidly, reaching a peak in 2006, and steadily declined until 2014. While there has been a recent uptick in investments, in absolute terms, combined investment in IP and machinery and equipment declined by roughly 4 percentage points between 1997 and 2016 (see Figure 7.10).
Figure 7.9:Advanced Technology Use in Finance, Ontario, 2009-2012

81b e t t e r , f a s t e r , s t r o n g e r
A report commissioned by the Toronto Financial Services Alliance found that Toronto and Greater Toronto Area firms in the finance and insurance sector have many opportunities to adopt new technologies, especially in the FinTech space. However, these firms are not pursuing such opportunities with much intensity.82 As these
developments will have a profound impact on the future of the sector, this lagging adoption is concerning. Indeed, as with the manufacturing sector, while a slower adoption of technology might insulate some workers from changes in the short term, it will undermine firms’ competitiveness over the long term, leading to potential job reduction in the future.
Figure 7.10:Investment in the Finance and Insurance Sector, Ontario, 1997–2016
82b e t t e r , f a s t e r , s t r o n g e r
TECHNOLOGY TRENDS IN FINANCE + INSURANCE
AI. For the finance and insurance sector, AI will enable the increased collection and use of real-time data from consumers. It is predicted that by 2020 there will be 20 times more usable data than in 2016.83 We heard that technological adoption will be driven by the desire to create new revenue models and service offerings as a result of big data and advances in AI. These services will be continuously improved as machine learning algorithms become faster, more accurate and require less training data.
FinTechs. Consumer-facing FinTechs are projected to drive disruption in the sector. At more than $12 billion, global investments in FinTech more than tripled in 2014.84 According to the PwC Global FinTech survey in 2016, up to 28 percent of the global business models for banking and payment firms and up to 22 percent of the business models for insurance, asset, and wealth management firms are at risk of being disrupted by 2020.85
There are a number of financial technologies being actively explored by FinTechs in Canada. These can be broadly categorized as:
1. Retail payments: a number of new payment service providers (PSPs) have been providing consumers with instant, convenient, digital payment options. Mobile wallets, for example, enable consumers to make payments with their phones. Other entrants have launched closed-loop systems for paying and transferring funds, making the traditional financial institution’s role invisible to consumers.
2. Lending + equity crowdfunding: As credit markets tightened following the 2008-2009 financial crisis, many SMEs have experienced difficulties accessing traditional financing options. Nearly half of Canadian SMEs rely on informal sources of financing. FinTechs have responded
to this trend, offering alternative forms of financing, in particular, peer-to-peer lending and equity crowdfunding.
3. Investment dealing + advice: Perhaps the most well-known area of FinTech intervention comes from technologically-enabled portfolio managers and financial advisors, colloquially referred to as “robo-advisors”. These platforms offer personalized, convenient financial services at a much lower cost than traditional advisors.86
Blockchain. Blockchain technology also has the potential to significantly disrupt the sector. This distributed ledger system can remove the need for traditional institutions to confirm authenticity, which could drastically reduce the infrastructure costs for financial services firms and could be used for everything from financial transactions to automated contractual agreements. By the start of 2016, blockchain companies had raised over a billion dollars in funding for R&D efforts.87
Cybersecurity. Additionally, the increasing reliance on personalized data and cloud services will increase the need for stringent cyber security measures and technologies. In PwC’s 19th annual Global CEO Survey in 2016, 69 percent of financial services’ CEOs reported that they are either somewhat or extremely concerned about cyber-threats, 8 percentage points higher than across all other sectors.
83b e t t e r , f a s t e r , s t r o n g e r
What Factors are Influencing Technology Adoption?
As in other sectors, firms’ decisions to automate in this sector are shaped by a range of external factors and firm characteristics. However, the finance and insurance sector appears to face unique regulatory considerations and consumer expectations that shape automation decisions. In particular, the decisions of finance and insurance firms to automate are influenced by:
Competitive pressures. Large financial institutions are facing increased competition from FinTech startups and other non-traditional global competitors.88 In some cases, large financial institutions are developing partnerships with, or acquiring, FinTech startups to gain access to technology and talent, and to bring would-be competitors under their umbrella. In Ontario, some prominent examples include Wave (RBC partnership), Borrowell (CIBC partnership), and Layer 6 AI (acquired by TD). Some major insurance companies have set up venture capital arms to invest in “next generation” insurance companies. One interviewee reported that, in insurance, global competition is also driving the need to adopt technology. Canadian firms are increasingly competing with foreign companies that are becoming larger, acquiring more market share, and moving faster.
New business models. Technological adoption and the vast array of data available in financial institutions is also driving a desire to establish new business models. Some firms are experimenting with business models that are not “solely related to the receipt of a specific product or service,” according to one interviewee. Some new FinTechs are entering into areas like payments and insurance, not for the business itself, but rather for the data that it generates and the value of continuous interaction with consumers. Financial services executives from Toronto recognize that properly capturing and leveraging data will become a major competitive advantage in the future.89
Consumer expectations. Interviewees revealed that customers expect mobility, speed, and
customization in the services they receive, which generates pressure for firms in the sector to adopt new technologies to meet those demands. Some firms are using AI and big data to enable a kind of “intimacy” with customers—that is, knowing their unique needs and behaviours rather than simply offering off-the-shelf standard solutions. Changes in consumer demand will be complicated by demographic shifts, with aging workers expecting more complex estate planning, and younger workers exploring alternative financial service models.90
At the same time, consumers have exhibited anxiety about privacy, security, and the decline of service from people rather than technology. Some interviewees believe that, relative to other jurisdictions, Canadian consumers are conservative when it comes to using new technologies and tend to stick with traditional financial services providers. Consumers want confidence that financial services are safe and secure. Navigating these different and changing demands is an ongoing challenge for firms in the sector and may help to explain their gradual, as opposed to rapid, adoption of new technologies.
Regulation. Firms that want to implement and benefit from new technologies often face substantial regulatory hurdles. Financial services regulation in Canada is comprehensive and involves departments and agencies across the federal and provincial governments, broadly falling into four categories: anti-money laundering, securities, payment, and other rules not exclusive to the sector, such as those related to privacy and data protection.91
FinTech firms in particular report that regulatory compliance costs are high, constitute significant barriers to entry in the sector, and largely favour incumbents over startups. At the same time, the regulatory “moat” that effectively protects incumbents might be making those incumbents less competitive and, says University of Toronto’s Munk Chair of Innovation Studies Dan Breznitz, “more vulnerable to unbundling and disintermediation” in the long term.92 To be sure, incumbents and emerging FinTech firms face the

84b e t t e r , f a s t e r , s t r o n g e r
same regulations, but because the latter are more likely to adopt technology-driven platforms and models, the effective burden falls more heavily on them.
Privacy laws, such as Canada’s federal Bank Act, which regulates the use and disclosure of personal financial information by federally regulated financial institutions, are another regulatory factor. In this case, the Act can inhibit the implementation of technology in incumbent institutions and limit the kind of services provided by FinTechs. The growing concern around security and the use of cloud computing and storage may add further complexity.93 None of this is to say that finance and insurance regulation is unwarranted or that the current regulatory regime is inappropriate; rather, the current regulatory environment offers a partial explanation for lagging technology adoption in the sector.
Skills, expertise, + legacy technology. Some firms that could implement new technologies face a set of firm-level challenges that hinder their ability to do so. In some cases, firms simply lack the necessary skills and expertise to implement, operate, and maintain new technologies. Traditional finance and insurance firms are also competing with growing international service providers to attract top talent from around the globe.94 Additionally, some firms are hesitant to adopt new technology in light of concerns about compatibility with, or ability to seamlessly replace, legacy systems and dated infrastructure.
Adapting regulation
A number of initiatives have been launched in Ontario and Canada to help regulatory environments keep pace with technology and new business models. The Ontario Securities Commission launched the OSC LaunchPad, which engages with FinTechs to help them navigate regulations and accelerate time-to-market, while continuing to protect consumers and investors. They also work to ensure that regulation adjusts to rapid technological change. In certain cases, the OSC will consider time-limited exemptions for new firms to test the viability of their products. Similarly, the Canadian Securities Administrators (CSA) launched the CSA Regulatory Sandbox to better understand the impacts of technological change and regulation and identify how securities regulations can be updated to better accommodate FinTechs. They, too, offer time-limited, exemptive relief for firms to test products and services.
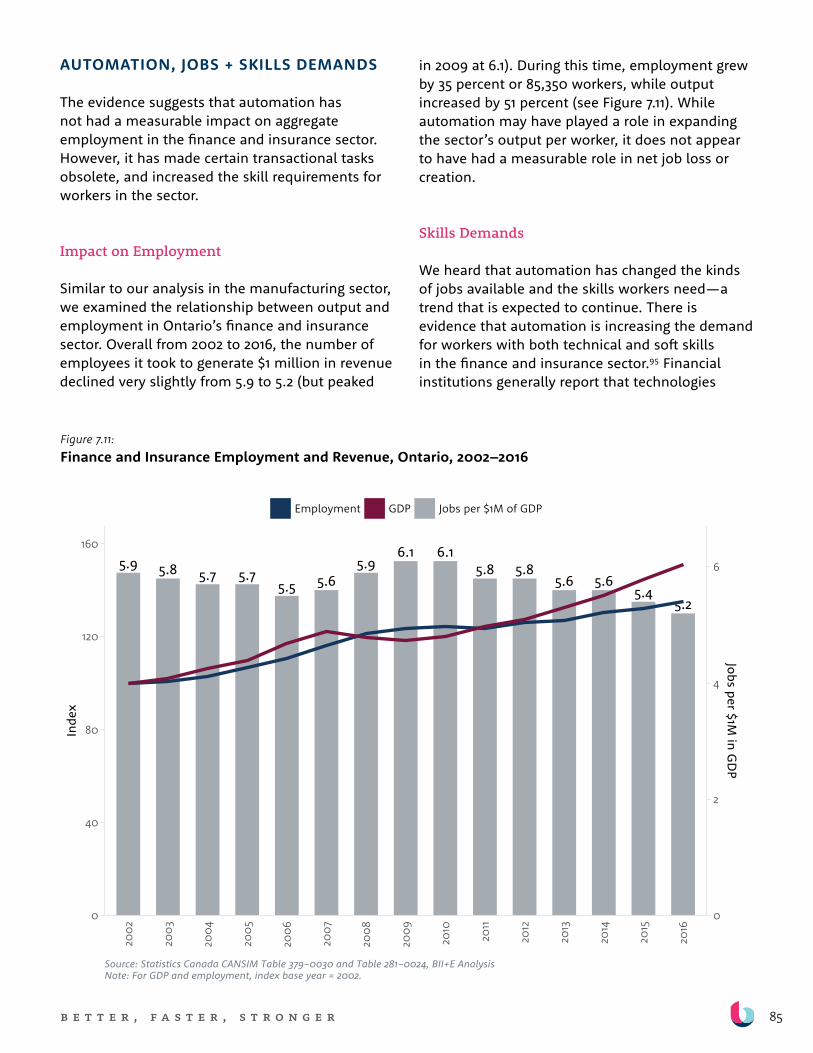
85b e t t e r , f a s t e r , s t r o n g e r
AUTOMATION, JOBS + SKILLS DEMANDS
The evidence suggests that automation has not had a measurable impact on aggregate employment in the finance and insurance sector. However, it has made certain transactional tasks obsolete, and increased the skill requirements for workers in the sector.
Impact on Employment
Similar to our analysis in the manufacturing sector, we examined the relationship between output and employment in Ontario’s finance and insurance sector. Overall from 2002 to 2016, the number of employees it took to generate $1 million in revenue declined very slightly from 5.9 to 5.2 (but peaked
in 2009 at 6.1). During this time, employment grew by 35 percent or 85,350 workers, while output increased by 51 percent (see Figure 7.11). While automation may have played a role in expanding the sector’s output per worker, it does not appear to have had a measurable role in net job loss or creation.
Skills Demands
We heard that automation has changed the kinds of jobs available and the skills workers need—a trend that is expected to continue. There is evidence that automation is increasing the demand for workers with both technical and soft skills in the finance and insurance sector.95 Financial institutions generally report that technologies
5.9 5.8 5.7 5.75.5 5.6
5.96.1 6.1
5.8 5.85.6 5.6
5.45.2
0
40
80
120
160
0
2
4
6
2002
2003
2004
2005
2006
2007
2008
2009
2010
2011
2012
2013
2014
2015
2016
Inde
xJobs per $1M
in GD
P
Employment GDP Jobs per $1M of GDP
Finance and Insurance Employment and Revenue, Ontario, 2002−2016Figure 7.11
Source: Statistics Canada CANSIM Table 379−0030 and Table 281−0024, BII+E Analysis Note: For GDP and employment, index base year = 2002.
Figure 7.11:Finance and Insurance Employment and Revenue, Ontario, 2002–2016
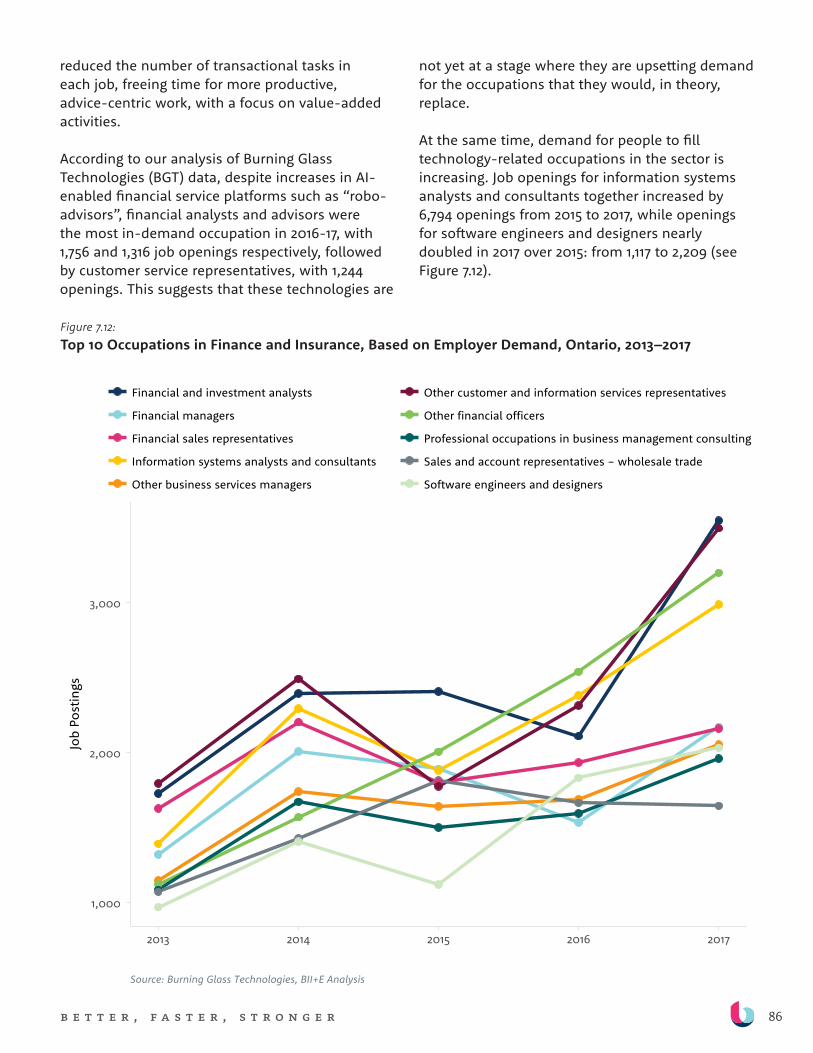
86b e t t e r , f a s t e r , s t r o n g e r
reduced the number of transactional tasks in each job, freeing time for more productive, advice-centric work, with a focus on value-added activities.
According to our analysis of Burning Glass Technologies (BGT) data, despite increases in AI-enabled financial service platforms such as “robo-advisors”, financial analysts and advisors were the most in-demand occupation in 2016-17, with 1,756 and 1,316 job openings respectively, followed by customer service representatives, with 1,244 openings. This suggests that these technologies are
not yet at a stage where they are upsetting demand for the occupations that they would, in theory, replace.
At the same time, demand for people to fill technology-related occupations in the sector is increasing. Job openings for information systems analysts and consultants together increased by 6,794 openings from 2015 to 2017, while openings for software engineers and designers nearly doubled in 2017 over 2015: from 1,117 to 2,209 (see Figure 7.12).
Figure 7.12:Top 10 Occupations in Finance and Insurance, Based on Employer Demand, Ontario, 2013–2017
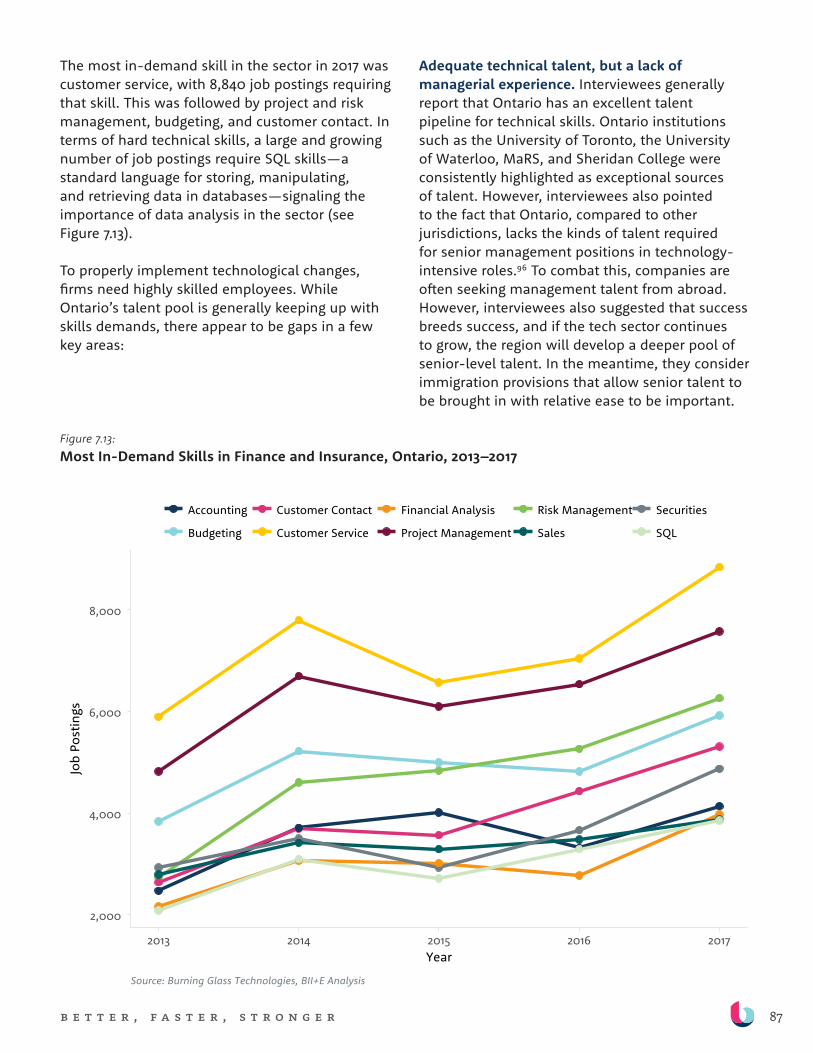
87b e t t e r , f a s t e r , s t r o n g e r
The most in-demand skill in the sector in 2017 was customer service, with 8,840 job postings requiring that skill. This was followed by project and risk management, budgeting, and customer contact. In terms of hard technical skills, a large and growing number of job postings require SQL skills—a standard language for storing, manipulating, and retrieving data in databases—signaling the importance of data analysis in the sector (see Figure 7.13).
To properly implement technological changes, firms need highly skilled employees. While Ontario’s talent pool is generally keeping up with skills demands, there appear to be gaps in a few key areas:
Adequate technical talent, but a lack of managerial experience. Interviewees generally report that Ontario has an excellent talent pipeline for technical skills. Ontario institutions such as the University of Toronto, the University of Waterloo, MaRS, and Sheridan College were consistently highlighted as exceptional sources of talent. However, interviewees also pointed to the fact that Ontario, compared to other jurisdictions, lacks the kinds of talent required for senior management positions in technology-intensive roles.96 To combat this, companies are often seeking management talent from abroad. However, interviewees also suggested that success breeds success, and if the tech sector continues to grow, the region will develop a deeper pool of senior-level talent. In the meantime, they consider immigration provisions that allow senior talent to be brought in with relative ease to be important.
Figure 7.13:Most In-Demand Skills in Finance and Insurance, Ontario, 2013–2017
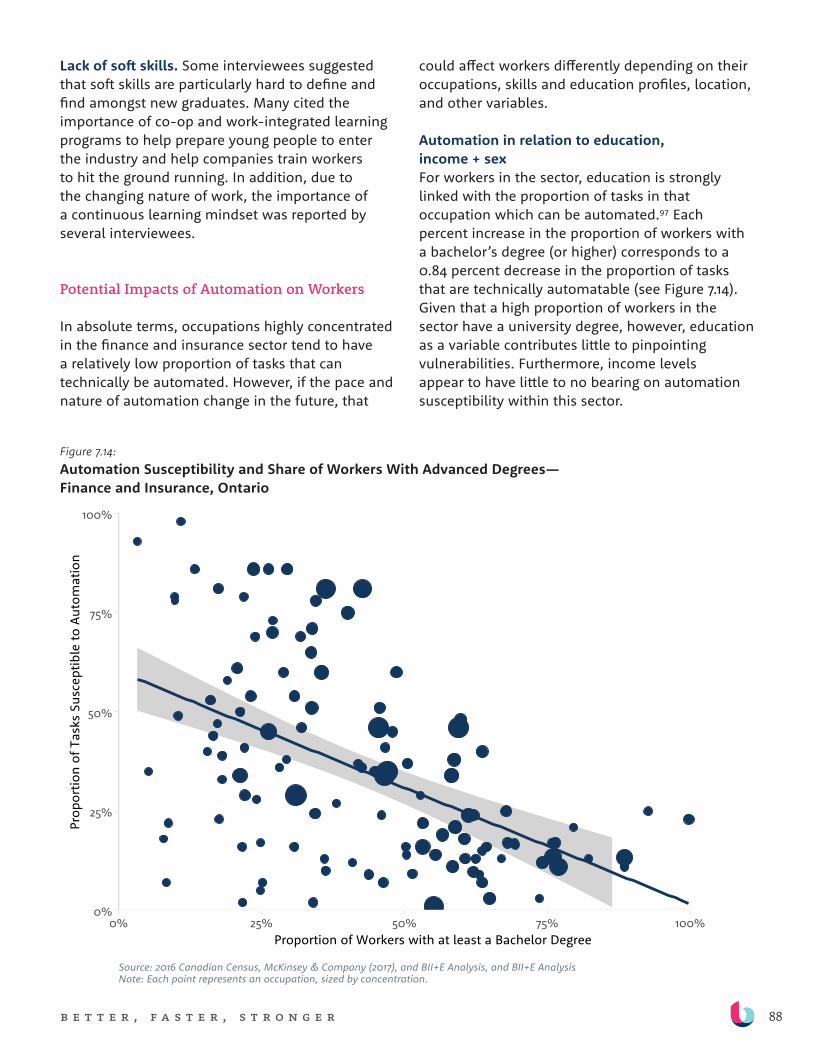
88b e t t e r , f a s t e r , s t r o n g e r
Lack of soft skills. Some interviewees suggested that soft skills are particularly hard to define and find amongst new graduates. Many cited the importance of co-op and work-integrated learning programs to help prepare young people to enter the industry and help companies train workers to hit the ground running. In addition, due to the changing nature of work, the importance of a continuous learning mindset was reported by several interviewees.
Potential Impacts of Automation on Workers
In absolute terms, occupations highly concentrated in the finance and insurance sector tend to have a relatively low proportion of tasks that can technically be automated. However, if the pace and nature of automation change in the future, that
could affect workers differently depending on their occupations, skills and education profiles, location, and other variables.
Automation in relation to education, income + sexFor workers in the sector, education is strongly linked with the proportion of tasks in that occupation which can be automated.97 Each percent increase in the proportion of workers with a bachelor’s degree (or higher) corresponds to a 0.84 percent decrease in the proportion of tasks that are technically automatable (see Figure 7.14). Given that a high proportion of workers in the sector have a university degree, however, education as a variable contributes little to pinpointing vulnerabilities. Furthermore, income levels appear to have little to no bearing on automation susceptibility within this sector.
Figure 7.14:Automation Susceptibility and Share of Workers With Advanced Degrees— Finance and Insurance, Ontario
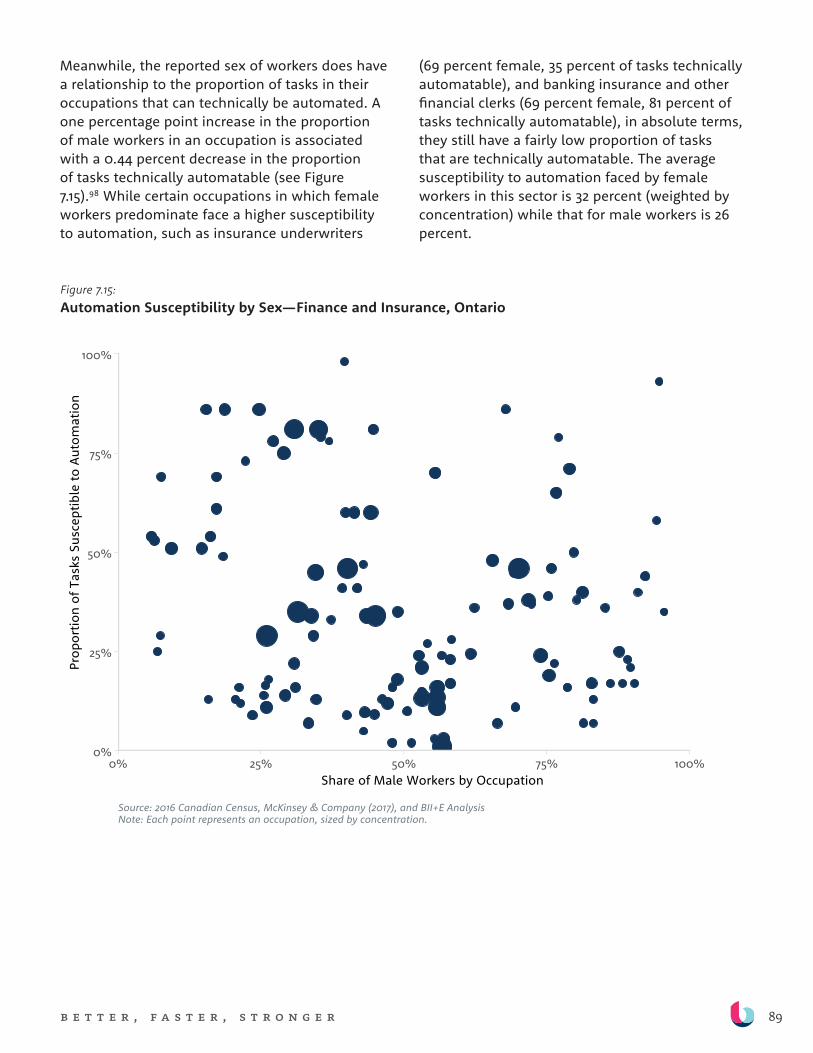
89b e t t e r , f a s t e r , s t r o n g e r
Meanwhile, the reported sex of workers does have a relationship to the proportion of tasks in their occupations that can technically be automated. A one percentage point increase in the proportion of male workers in an occupation is associated with a 0.44 percent decrease in the proportion of tasks technically automatable (see Figure 7.15).98 While certain occupations in which female workers predominate face a higher susceptibility to automation, such as insurance underwriters
(69 percent female, 35 percent of tasks technically automatable), and banking insurance and other financial clerks (69 percent female, 81 percent of tasks technically automatable), in absolute terms, they still have a fairly low proportion of tasks that are technically automatable. The average susceptibility to automation faced by female workers in this sector is 32 percent (weighted by concentration) while that for male workers is 26 percent.
Figure 7.15:Automation Susceptibility by Sex—Finance and Insurance, Ontario
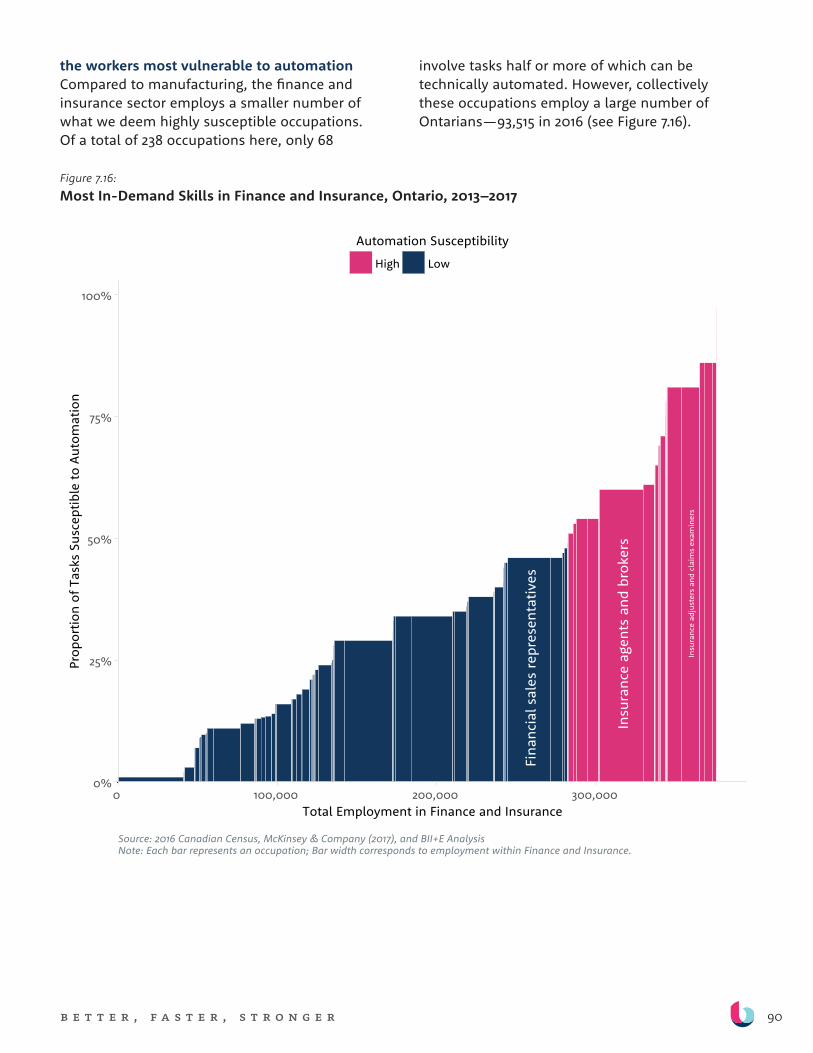
90b e t t e r , f a s t e r , s t r o n g e r
the workers most vulnerable to automationCompared to manufacturing, the finance and insurance sector employs a smaller number of what we deem highly susceptible occupations. Of a total of 238 occupations here, only 68
Figure 7.16:Most In-Demand Skills in Finance and Insurance, Ontario, 2013–2017
involve tasks half or more of which can be technically automated. However, collectively these occupations employ a large number of Ontarians—93,515 in 2016 (see Figure 7.16).
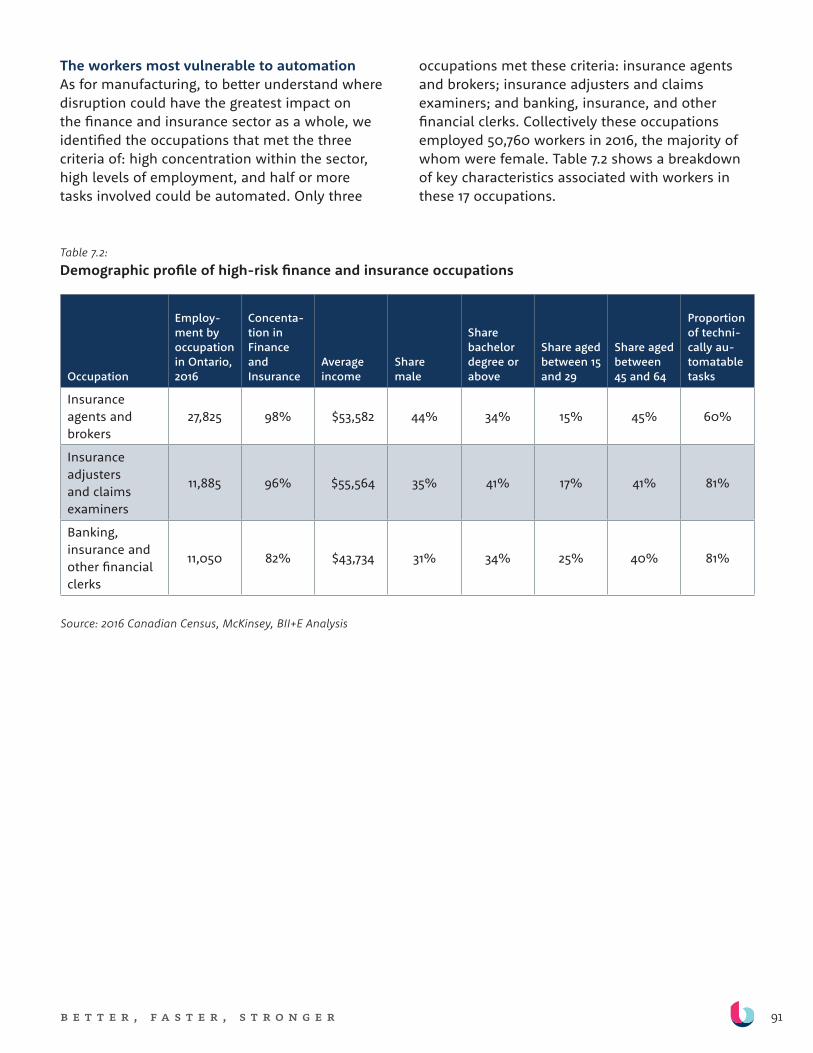
91b e t t e r , f a s t e r , s t r o n g e r
The workers most vulnerable to automationAs for manufacturing, to better understand where disruption could have the greatest impact on the finance and insurance sector as a whole, we identified the occupations that met the three criteria of: high concentration within the sector, high levels of employment, and half or more tasks involved could be automated. Only three
occupations met these criteria: insurance agents and brokers; insurance adjusters and claims examiners; and banking, insurance, and other financial clerks. Collectively these occupations employed 50,760 workers in 2016, the majority of whom were female. Table 7.2 shows a breakdown of key characteristics associated with workers in these 17 occupations.
Table 7.2: Demographic profile of high-risk finance and insurance occupations
Occupation
Employ-ment by occupation in Ontario, 2016
Concenta-tion in Finance and Insurance
Average income
Share male
Share bachelor degree or above
Share aged between 15 and 29
Share aged between 45 and 64
Proportion of techni-cally au-tomatable tasks
Insurance agents and brokers
27,825 98% $53,582 44% 34% 15% 45% 60%
Insurance adjusters and claims examiners
11,885 96% $55,564 35% 41% 17% 41% 81%
Banking, insurance and other financial clerks
11,050 82% $43,734 31% 34% 25% 40% 81%
Source: 2016 Canadian Census, McKinsey, BII+E Analysis

92b e t t e r , f a s t e r , s t r o n g e r
Geographic distribution of vulnerability Employment in these three occupations is most concentrated in Kitchener-Waterloo and London (see Figure 7.17). This suggests that should
Figure 7.17:Geographic Concentration of Finance and Insurance Occupations Highly Susceptible to Automation, Ontario
employers make a decision to automate all or parts of these jobs, the impact could be more significant in these areas.
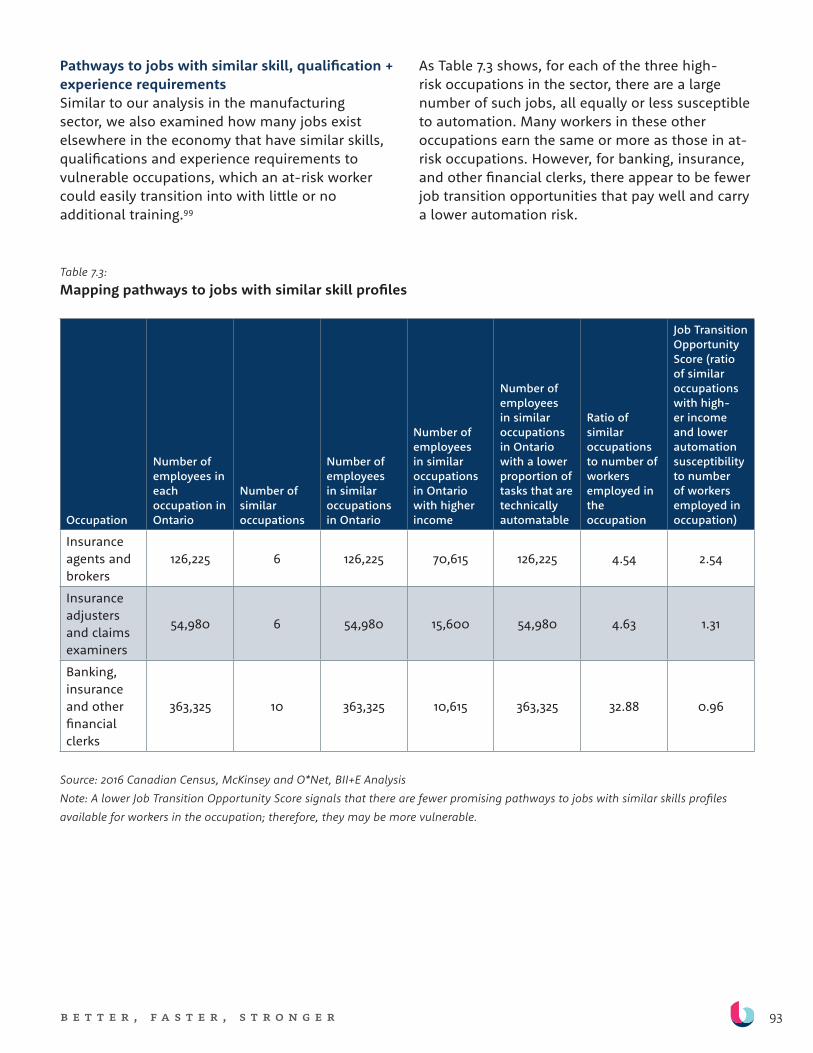
93b e t t e r , f a s t e r , s t r o n g e r
Pathways to jobs with similar skill, qualification + experience requirementsSimilar to our analysis in the manufacturing sector, we also examined how many jobs exist elsewhere in the economy that have similar skills, qualifications and experience requirements to vulnerable occupations, which an at-risk worker could easily transition into with little or no additional training.99
As Table 7.3 shows, for each of the three high-risk occupations in the sector, there are a large number of such jobs, all equally or less susceptible to automation. Many workers in these other occupations earn the same or more as those in at-risk occupations. However, for banking, insurance, and other financial clerks, there appear to be fewer job transition opportunities that pay well and carry a lower automation risk.
Table 7.3: Mapping pathways to jobs with similar skill profiles
Occupation
Number of employees in each occupation in Ontario
Number of similar occupations
Number of employees in similar occupations in Ontario
Number of employees in similar occupations in Ontario with higher income
Number of employees in similar occupations in Ontario with a lower proportion of tasks that are technically automatable
Ratio of similar occupations to number of workers employed in the occupation
Job Transition Opportunity Score (ratio of similar occupations with high-er income and lower automation susceptibility to number of workers employed in occupation)
Insurance agents and brokers
126,225 6 126,225 70,615 126,225 4.54 2.54
Insurance adjusters and claims examiners
54,980 6 54,980 15,600 54,980 4.63 1.31
Banking, insurance and other financial clerks
363,325 10 363,325 10,615 363,325 32.88 0.96
Source: 2016 Canadian Census, McKinsey and O*Net, BII+E Analysis Note: A lower Job Transition Opportunity Score signals that there are fewer promising pathways to jobs with similar skills profiles available for workers in the occupation; therefore, they may be more vulnerable.
94b e t t e r , f a s t e r , s t r o n g e r
r e c o n c i l i n g f i r m + w o r k e r i n t e r e S t S i n t h e c o n t e x t o f A u t o m A t i o n : k e y c h A l l e n g e S + o p p o r t u n i t i e S
Businesses across Ontario’s manufacturing and finance and insurance sectors are turning to automation, but doing so at a relatively slow pace compared to some of
their competition. Although intensifying adoption of automation technologies could improve productivity and competitiveness, it will also generate challenges for workers. At the same time, if businesses continue to lag in this area, they will put themselves and their employees at risk. Ontario’s aim, therefore, should be to support technology adoption while enabling Ontarians to navigate a changing labour market.
This section summarizes some of the biggest challenges and opportunities associated with pursuing this agenda, drawing insights from our sector analyses and citizen engagement initiative.
Barriers to Technology Adoption
A number of barriers to technology adoption exist, ranging from the relatively low cost of labour compared to technology, to stringent regulations in the finance and insurance sector. But while many of these barriers constitute ongoing disincentives,
the opportunity cost of not investing while global competitors are surging ahead is growing. At some point, the productive inefficiencies of relying on labour while competitors turn to technology will make investment in technology an unavoidable option for businesses that want to survive and grow.
Talent Gaps + Insufficient Opportunities for Retraining
Talent gaps inhibit the ability of organizations to successfully roll out automation technologies. Firms need employees who are skilled in: developing and building new technologies, integrating these technologies into their operations, and working in automated environments. They also require managers with the capacity and vision to properly engage employees in implementing technology in a way that will ensure a return on investment. Interviewees acknowledged the importance of co-op and work-integrated learning models to produce more job-ready graduates, as well as the need for ongoing training and skill upgrades to help workers adapt to technological change. However, they felt that the
Although intensifying adoption
of automation technologies
could improve productivity and
competitiveness, it will also generate
challenges for workers. At the same
time, if businesses continue to lag in
this area, they will put themselves
and their employees at risk.
95b e t t e r , f a s t e r , s t r o n g e r
expense and risk of investing in training was too high for businesses to absorb alone.
There is a broadly identified need for upskilling and retraining programs with short time frames, targeted to specific skills and tasks. This was reflected in the insights shared by citizen engagement participants, who also emphasized the value of on-the-job training and of training that accommodates different schedules.
Some participants cited St. Clair College’s Skilled Trades Regional Training Centre as an example of a responsive training program. Based in Windsor, St. Clair College offers multiple programs that combine six weeks of in-class learning, with between 26 and 36 weeks of on-the-job training. This program was designed to respond to the changing needs of the local manufacturing sector. Since launching, it has placed over 400 students in 36 industries.
Participants had positive comments on programs funded by the Ontario government, including Second Career, the Canada-Ontario Job Grant, and SkillsAdvance Ontario. The main criticisms of these programs related to the need for increased flexibility to better suit the needs of individual workers and employers. For example, participants suggested that eligibility requirements for Second Career make the program inaccessible for some people who could benefit from it.
“Big companies will train whether they get the grants or not but the grants allow them to do more. When government grants are restrictive, it restricts the amount of training that happens.” —manufacturing sector participant
“Small industries struggle more with training. They’re very focused on where the ball is going, but we need to focus on how that institutional knowledge is being transferred to the young people in the facility. To do this, a senior guy [sic] has to hold a young guy’s [sic] hand which decreases productivity and is expensive. They need grants for that kind of training.” —economic development worker
As automation becomes more and more pervasive, firms will increasingly demand highly technical talent. Several interviewees were optimistic about the Ontario government’s 2017 commitment to invest $30 million to grow the number of professional applied master’s graduates in AI, with the aim of producing 1,000 graduates within five years.100
Limited Information on Labour Market Opportunities + Risks
Stakeholders in workforce planning organizations felt that having access to better data would help them prepare for the changes that may arise through workplace automation. Particularly helpful data, according to these stakeholders, would, for example, identify the industries undergoing automation, how graduates from different educational fields are faring, and which college programs are in highest demand among students and employers.
A number of participants felt that the government should play a more proactive role in spreading awareness of workplace automation, either through education or by collecting and sharing data related to workplace change.
Misaligned Incentives
Businesses have greater incentives to invest in training when the tasks are specific to a firm’s activities and business model and where there is a low risk that employees will leave for other

96b e t t e r , f a s t e r , s t r o n g e r
opportunities. Businesses have weak incentives to invest in training when the skills are more general and, therefore, easier for employees to take with them to other jobs. For small and medium-sized enterprises (SMEs), in particular, the benefits of investing in training may not outweigh the costs and risks. In the case of automation, firms have low incentives to invest in training except where doing so would prepare certain employees to implement, operate, and maintain the technologies they need. They have almost no economic incentives to help workers who may be displaced by automation to seek employment elsewhere.
Colleges, universities, and other training organizations have been established, at least in part, to address the market failure in worker training. Yet, that is not their only role, nor are they always well-equipped to deliver on it. These institutions face challenges related to keeping up with changing technology and skills demand, and developing and delivering non-traditional training programs that support rapid upskilling or re-training and offer flexibility in terms of where and when they are offered.
Some interviewees advocated for initiatives that would incentivize employers to invest in training, such as social procurement policies, tax credits, or tax penalties for underinvestment.
Quebec Act to Promote Workforce Skills Development + Recognition
One interviewee suggested that, similar to Quebec, every employer should be required to spend at least one percent of their payroll on training. If they do not meet this requirement, this one percent becomes an additional tax, which the Government of Quebec uses to fund training initiatives.101
Many interviewees and participants in citizen engagement activities advocated for increased collaboration between businesses, colleges, and unions to ensure talent needs are met. Tripartite firm-employee-education approaches to training, such as those employed by the Canadian Skills Training and Employment Coalition (CSTEC), were highlighted as having had some success, particularly with respect to apprenticeship training in industrial trades. Interviewees suggested that these approaches should be expanded to support a broader range of skills development needs.
Collaborative training models can be leveraged to allow firms that face the same challenges in terms of specific technology adoption, workforce automation impacts, and changing skills needs to pool the costs of retraining and develop programs tailored to niche industry topics. These models reduce the incentive to poach trained employees from other businesses since those employers collaborate to train a pool of talent. They may also facilitate sharing best practices regarding training, technology adoption, and broadening awareness of existing incentives. While these models are not government-led, government support or incentives may be needed to expand on existing models and make this approach more systemic.
However, one interviewee close to an existing training consortia stressed that these arrangements only work by acknowledging that “we are not Germany” and that there is no tradition in Canada of organized employer collaboration. Training consortia in Ontario need to provide material benefits and incentives for participation,
One participant shared the example of a manufacturing company in Almonte, Ontario, which was considering laying off several employees who did not have the digital skills to upgrade into new jobs. Instead, they partnered with a local service provider, the TR Leger School of Adult, Alternative and Continuing Education, to develop programs to train existing employees in basic computer skills. As a result, job loss was avoided and the company retained experienced staff.
97b e t t e r , f a s t e r , s t r o n g e r
while managing competitive dynamics between businesses and between educational institutions. Such efforts have failed in Ontario, this interviewee contended, when invited participants have been too closely competitive.
Canadian Skills Training and Employment Coalition (CSTEC)
CSTEC was founded 28 years ago as a partnership between the Canadian Steel Industry and the Steelworkers Union. Today, CSTEC is headquartered in Toronto, with regional coordinators in Hamilton, Sault St. Marie, and Regina to support multi-stakeholder solutions to talent and training issues facing the broader manufacturing, mining, and forestry sectors, with a focus on essential skills training, apprenticeship and technical training, needs assessments, labour market information, and labour adjustment for youth and the unemployed.
CSTEC works with employers and educational institutions to encourage joint workplace training and adjustment committees. It has, for example, delivered a skills training program that involved partnerships with 20 colleges/CEGEPs in Canadian steelmaking communities to develop computer-based training courses for employed workers to gain college-level credits.
Hamilton Skilled Trades and Apprenticeship Consortium (HSTAC)
The HSTAC, a regional program of the CSTEC, combines resources from a range of local steelmaking stakeholders to support mutually beneficial apprenticeship issues. The goal of the HSTAC is to foster the talent needs of the sector by providing direct supports for youth entering the profession.
HSTAC’s membership includes 30 employers, including SMEs, colleges, government training consultants, United Steelworkers representatives, and the Canadian Skills Training & Employment Coalition. While participation from a range of stakeholders is critical, the program would not be possible without participation from an anchor college, in this case, Mohawk College. Mohawk College students enrolled in the Co-op Diploma Apprenticeship or Mechanical Techniques programs are eligible to participate, and alternate between classroom learning and work placements. Students in turn graduate with years of work experience, and in many cases, placements become permanent positions. Since 2014 over 140 HSTAC-sponsored youth have participated in the program.102
Instead of each company competing for apprentices, HSTAC allows companies to sponsor apprentices collectively. This has been successful largely due to the understood economic benefits of supporting well-trained talent, paired with the geographic concentration of the steel industry. In addition, through membership in the consortium, colleges are able to see first-hand what is required from their programs in order to meet the changing needs of employers and students.103
Siloed Approaches to Technology and Training
Businesses’ automation imperative and the need for workforce training are frequently discussed as distinct challenges that require distinct responses. In reality, firms’ technology needs and workers’ skills and employment opportunities are closely intertwined. For example:
+ Automation is critical for business competitiveness and productivity which, in turn, is vital for employment over the long
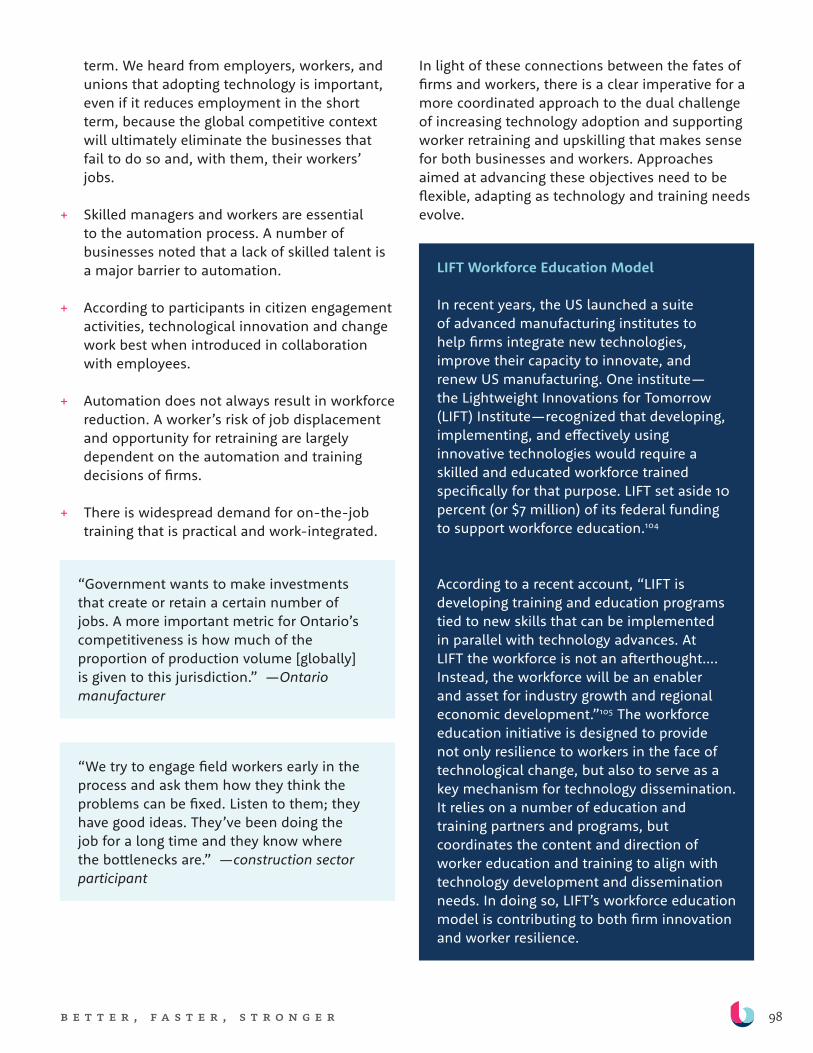
98b e t t e r , f a s t e r , s t r o n g e r
term. We heard from employers, workers, and unions that adopting technology is important, even if it reduces employment in the short term, because the global competitive context will ultimately eliminate the businesses that fail to do so and, with them, their workers’ jobs.
+ Skilled managers and workers are essential to the automation process. A number of businesses noted that a lack of skilled talent is a major barrier to automation.
+ According to participants in citizen engagement activities, technological innovation and change work best when introduced in collaboration with employees.
+ Automation does not always result in workforce reduction. A worker’s risk of job displacement and opportunity for retraining are largely dependent on the automation and training decisions of firms.
+ There is widespread demand for on-the-job training that is practical and work-integrated.
“Government wants to make investments that create or retain a certain number of jobs. A more important metric for Ontario’s competitiveness is how much of the proportion of production volume [globally] is given to this jurisdiction.” —Ontario manufacturer
“We try to engage field workers early in the process and ask them how they think the problems can be fixed. Listen to them; they have good ideas. They’ve been doing the job for a long time and they know where the bottlenecks are.” —construction sector participant
In light of these connections between the fates of firms and workers, there is a clear imperative for a more coordinated approach to the dual challenge of increasing technology adoption and supporting worker retraining and upskilling that makes sense for both businesses and workers. Approaches aimed at advancing these objectives need to be flexible, adapting as technology and training needs evolve.
LIFT Workforce Education Model
In recent years, the US launched a suite of advanced manufacturing institutes to help firms integrate new technologies, improve their capacity to innovate, and renew US manufacturing. One institute—the Lightweight Innovations for Tomorrow (LIFT) Institute—recognized that developing, implementing, and effectively using innovative technologies would require a skilled and educated workforce trained specifically for that purpose. LIFT set aside 10 percent (or $7 million) of its federal funding to support workforce education.104
According to a recent account, “LIFT is developing training and education programs tied to new skills that can be implemented in parallel with technology advances. At LIFT the workforce is not an afterthought….Instead, the workforce will be an enabler and asset for industry growth and regional economic development.”105 The workforce education initiative is designed to provide not only resilience to workers in the face of technological change, but also to serve as a key mechanism for technology dissemination. It relies on a number of education and training partners and programs, but coordinates the content and direction of worker education and training to align with technology development and dissemination needs. In doing so, LIFT’s workforce education model is contributing to both firm innovation and worker resilience.
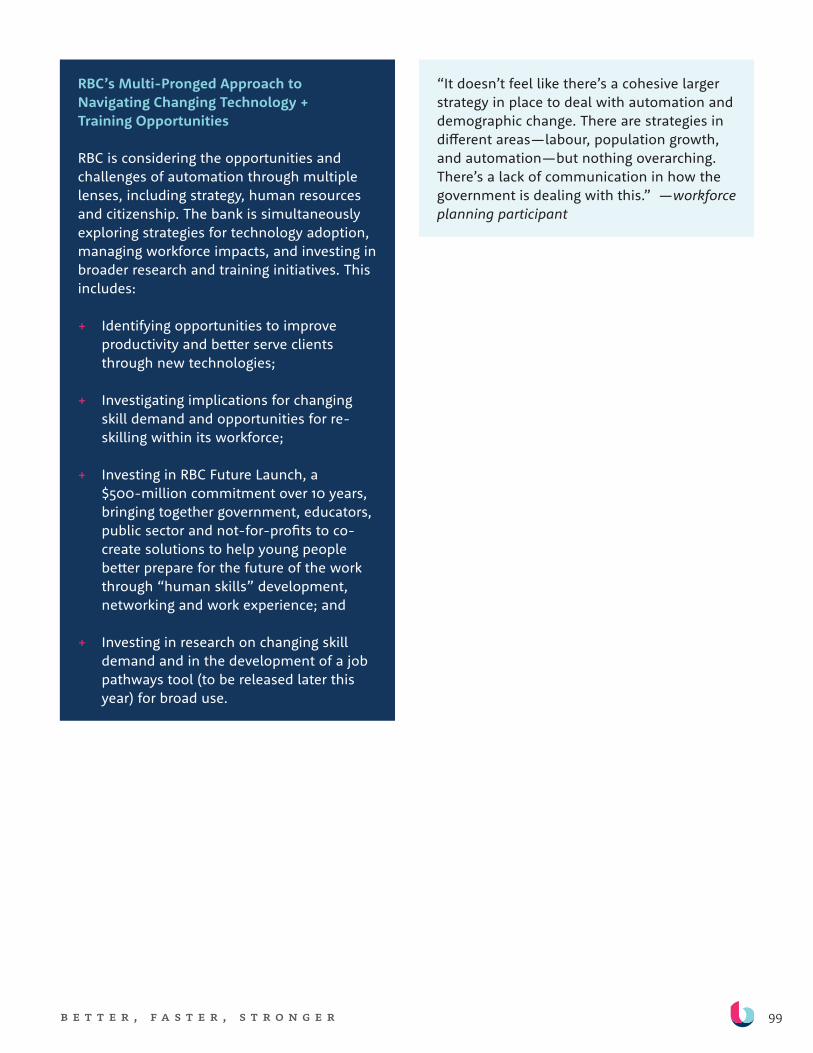
99b e t t e r , f a s t e r , s t r o n g e r
RBC’s Multi-Pronged Approach to Navigating Changing Technology + Training Opportunities
RBC is considering the opportunities and challenges of automation through multiple lenses, including strategy, human resources and citizenship. The bank is simultaneously exploring strategies for technology adoption, managing workforce impacts, and investing in broader research and training initiatives. This includes:
+ Identifying opportunities to improve productivity and better serve clients through new technologies;
+ Investigating implications for changing skill demand and opportunities for re-skilling within its workforce;
+ Investing in RBC Future Launch, a $500-million commitment over 10 years, bringing together government, educators, public sector and not-for-profits to co-create solutions to help young people better prepare for the future of the work through “human skills” development, networking and work experience; and
+ Investing in research on changing skill demand and in the development of a job pathways tool (to be released later this year) for broad use.
“It doesn’t feel like there’s a cohesive larger strategy in place to deal with automation and demographic change. There are strategies in different areas—labour, population growth, and automation—but nothing overarching. There’s a lack of communication in how the government is dealing with this.” —workforce planning participant
100b e t t e r , f a s t e r , s t r o n g e r
m A x i m i z i n g t h e
b e n e f i t S o f
A u t o m A t i o n f o r
o n t A r i A n S
AIMING FOR THE OPTIMAL FUTURE SCENARIO
To date, efforts to promote innovation and technology adoption, and efforts to train workers, have existed largely in parallel. Yet, automation presents a dual challenge, requiring simultaneous support for technology adoption and for ensuring that workers have the skills to adapt to—and even drive—this change. Businesses face an imperative to automate to remain competitive. If they fail in this aim, workers may suffer. If automation ramps up, however, risks faced by Ontario workers will increase, affecting some more than others.
Ontario faces many possible futures. Which particular future emerges will depend in large part on how businesses, governments, unions, and education and training providers respond to this dual challenge.
Possible Futures
Status quo. Ontario’s future could be one in which firms continue to underinvest in technology, exacerbating persistent weakness in productivity and competitiveness, and, ultimately, leading to slower economic growth, lower employment, more limited tax revenue, and weaker socioeconomic outcomes for Ontarians. This is not a preferred scenario.
Sink or swim. Alternatively, firms might choose to automate a range of work tasks, enhancing productivity and competitiveness, leading to improved growth and prosperity for some. But changes in the nature of work and the labour and skills required could leave some workers behind, experiencing long-term unemployment, lower incomes, and declining prospects. In the absence of policies and programs to help workers adjust, this scenario would see greater economic inequality and social fragmentation. This is also not a preferred scenario.
Proactive change. A third scenario is one in which firms invest in automation and other forms of technology, generating new and different kinds of good jobs that workers are prepared to fill thanks to a suite of modern, flexible programs and policies that help them adjust. This scenario would ensure that businesses maintain a competitive position and that workers are not only able to adjust but are in a position to take advantage of new opportunities and to play an active role in driving technological change. This is the optimal future for Ontario and Ontarians.
A HIGH-LEVEL STRATEGY
This optimal future requires more than incremental change. It requires a strong vision and leadership, better collaboration among the public, private and
Businesses face an imperative to
automate to remain competitive.
If they fail in this aim, workers
may suffer. If automation ramps
up, however, risks faced by Ontario
workers will increase, affecting some
more than others.
101b e t t e r , f a s t e r , s t r o n g e r
non-profit sectors, and fundamental changes to education and training models, firm behaviour, and established labour market tools. Specifically, it will require:
1. Investment in tech R&D and adoption. Achieving the productivity and competitiveness benefits of automation—and long-term job creation—requires the development, adoption, and effective use of relevant technologies. Ultimately, this depends on the decisions of businesses—including those that produce automation technologies and those that buy and use them. But there are opportunities for other stakeholders to provide advice and assistance. The Government of Ontario has already made substantial investments in supporting firms that develop a range of technologies, including artificial intelligence, robotics, and autonomous vehicles.106,107 Along with the federal government, it also assists firms in identifying, adopting, and effectively using technologies to improve their performance. Striking the right balance between supporting developers and adopters, and managing the effects on workers, will be an ongoing challenge. It is beyond the scope of this report to provide more targeted advice on technology R&D and adoption. Nevertheless, taking on the challenge will be essential to Ontario’s long-term prosperity.
2. A system for lifelong education that makes a wide array of retraining and upskilling programs accessible. While our education system has continued to evolve to meet changing needs, it has not kept up to date with the pace of technological change. With some exceptions, it has been largely designed on the assumption that a person moves from education into a lifelong career. Employers reinforce this assumption, relying on traditional credentials, which typically require years of study, as proxies for skills. Yet automation and related technology trends are changing the task makeup of jobs as well as the skills employers are seeking at a fast pace, and this is likely to continue. Examples exist of promising models for retraining and upskilling. However,
the landscape is fragmented and insufficient to meet current, let alone future demand. Ontarians need a comprehensive system of supports to help them adjust as skills and job demands change.
Overcoming these challenges will require the introduction of a system for lifelong education that rivals the introduction of mandatory secondary schools in the US during the early 20th century, which helped to drive the shift from farm to factory and office work.108
While radical changes may not yet be upon us, educational institutions and the frameworks they operate within are slow to change. Therefore, a redesign of our education system should start now.
Considerations
+ A system of lifelong education would include modular, stackable training programs that are tailored to tasks and skills, rather than to occupations or careers, and that could be combined in different ways. Emphasis should be on tasks and skills that are less susceptible to automation as well as those that provide a foundation for lifelong learning. Certain in-demand technical skills that may be susceptible to automation in the future should still be taught, but to improve worker resilience, these should be complemented with transferable, foundational skills.
+ In terms of delivery, training programs should be flexible enough to allow for a variety of schedules and for working while training, reflecting the fact that, for many, it is not practical or desirable to go back to school for months or years.
+ While traditional degrees, diplomas, and other certifications are valuable, they can be a barrier to re-deploying talent from jobs impacted by automation to jobs that
102b e t t e r , f a s t e r , s t r o n g e r
are less susceptible. A system of lifelong education that would complement rather than replace traditional credentials could incorporate task-based skills recognition models, such as micro-credentials.109 To be effective, such models would need to offer hiring managers an easy and trusted way to identify prospective employees with the specific skills they need.
+ Current regulatory frameworks and public funding mechanisms may inadvertently inhibit lifelong education. There are signs of change. The federal and Ontario governments recently decided to allow Employment Insurance recipients to access the Ontario Student Assistance Program (OSAP) and Ontario’s 2018 budget included investments in more responsive, flexible skills training. However, gaps remain. These could be addressed, at least in part, through a comprehensive review and redesign (where needed) of regulatory frameworks and existing grants, tuition subsidies, and other funding sources. However, the shift to a system of lifelong education may not happen without dedicated funding that reflects the size of this ambition.
+ Designing an effective lifelong education system requires participation and input from all stakeholders—including students and workers, employers, colleges, universities, private and non-profit training organizations, unions, and governments.
3. A coordinated, cooperative approach to firm+ worker success. Firm and worker success areclosely intertwined. To remain resilient, workersrequire skills to adopt and use technology.Meanwhile, firms require this talent to remaincompetitive. Therefore, responding to firmand worker needs will require collaborationbetween businesses, post-secondaryinstitutions and other training organizationsand, in some cases, unions. Governmentshave an important role to play in fostering thiscollaboration.
Even with ongoing shifts in the education system to better respond to worker and employer needs, there is a critical role for businesses in informing, designing and delivering training—particularly firm and industry-specific training—to ensure that it keeps pace with changing technology and skills demand.
Incentives for businesses to invest in retraining are weak. Even when they see a need to invest, many—particularly SMEs—face barriers, including cost, long lags between investment and return, difficulty releasing workers from daily jobs to pursue training or provide mentoring, and the risk of talent poaching. This, in turn, has an adverse impact on their ability to adopt automation technologies because they lack the skilled talent needed to implement, operate, and maintain the technologies.
While existing programs, such as the Canada-Ontario Job Grant, are helping to incentivize training, overcoming these hurdles will require closer coordination and collaboration at the industry and regional levels, to respond to the specific skills and training needs of employers and workers while also supporting innovation and technology adoption goals.
Considerations
+ Consortia models, specific to an industry and region, can help to pool the costs and risks of training among multiple employers, deliver training that is employer-informed and responsive to particular industry skills needs, and help workers to become more resilient and contribute to technological dissemination.
– Governments and unions have a roleto play in instigating and funding thestartup of consortia.
– Post-secondary institutions and othertraining organizations have a role to
103b e t t e r , f a s t e r , s t r o n g e r
play in providing curriculum design and delivery expertise and capacity. Ideally, consortia would plug into a lifelong education system that is already set up to provide targeted, time-limited programs that are convenient for workers and recognized by employers.
– There are promising models that could be expanded or learned from, such as the Canadian Skills Training and Employment Coalition, a multi-stakeholder training initiative led by the Canadian Steel Industry and the Steelworkers Union (see section 8 for more information). Ontario’s federally-supported advanced manufacturing “supercluster” presents another significant opportunity to embed a collaborative approach to training within a broader innovation agenda.
– Within a consortium model, firms may also collaborate on some aspects of R&D and technology adoption, where the benefits of cost sharing and information sharing outweigh the potential risks of opening up elements of IP or losing a competitive edge.
+ Government policies aimed at encouraging the development and adoption of new technologies could at the same time include requirements and support for training aimed at building talent that will facilitate the adoption and effective rollout of new technologies.
+ Other incentives to encourage employer investments in training could also be considered, including in procurement policy (for example, by awarding points for investments in training when evaluating bids for government contracts), and tax policy (for example, by requiring that firms pay a contribution to a skills development fund, through their taxes, if their own training expenditure falls below a certain percent of payroll, as in Quebec).
4. A user-friendly job pathways tool to empower workers and job seekers to make informed decisions about work + learning. Ontarians are largely in the dark when it comes to understanding how automation is changing skills demand. This inhibits informed decisions about education, employment, retraining and upskilling and makes it challenging for them to effectively navigate a changing labour market. This will become even more difficult if the pace of automation speeds up.
Our current labour market information tools lack many key elements: 1) granular skill data; 2) context-specific information on skill and job demand suited to an individual’s skills, credentials, interests and location; and 3) timely updates in response to shifts in labour market conditions, including information on growth areas of the local economy as well as on the susceptibility of jobs or tasks to automation and other drivers of change.
Ontarians who are in school, just entering the labour market, or mid-career would all benefit from a job-pathways tool to help them make informed decisions about what education and employment opportunities to pursue and what risks to avoid. This tool could be designed to complement a system of lifelong education, pointing users in the direction of training modules that align with their goals.
Considerations
+ To enable informed decisions, this tool would need to provide information on job risks, opportunities, and training pathways suited to an individual’s particular abilities, interests, and needs. This would include, for example:
– Changes over time in skills, credentials and occupation demand;
– Changes over time in the task composition of occupations;
– Jobs and skills requirements in high-
104b e t t e r , f a s t e r , s t r o n g e r
growth areas of the economy;
– Opportunities to upskill within jobs;
– Jobs or tasks that have requirements similar to a person’s current skills, experience and credentials (based on the individual rather than on their occupational history), and which may, therefore, involve a shorter retraining pathway;
– The availability of training programs and the length of retraining time required to transition to potential new jobs or tasks, based on an individual’s current skills, experience, education, and credentials;
– The proximity of a job to an individual’s place of residence;
– The wages, benefits, and security associated with a job, and the difference between current or past jobs and potential new jobs in these respects; and
– Some measure of the susceptibility of a job or task to automation, offshoring, and other drivers of change.
+ This information could draw on data from multiple sources that extend beyond traditional government collected and published statistics, including private sources and employer surveys. Going a step further, it could potentially draw on and link existing, anonymized publicly-held datasets, for instance, related to post-secondary and income tax data, and use machine learning to discover what works over time, to build more realistic training and employment pathways.
+ This tool could be designed, owned, and operated outside of government to ensure agility and responsiveness to user needs, but with government support and oversight to ensure that it is developed as a public asset that is, for example, openly accessible, based on transparent methodology, reflective of appropriate data use standards, and structured with open application programming interfaces (APIs). To ensure usability and accessibility, the design of this tool should go through robust user-testing.
+ In collaboration with the forthcoming federal Future Skills initiative and the Labour Market Information Council, the Government of Ontario could work with federal, provincial, and territorial governments to promote a national version of this tool.
While further work is needed to detail next steps, this high-level strategy is intended to orient actions on the part of the Ontario government, firms, post-secondary institutions, unions and other stakeholders. Collectively, these proposed responses would position Ontario to realize and distribute the benefits of automation across industries, regions and demographic groups, reflecting the dual objective of helping firms and workers stay competitive.
105b e t t e r , f a s t e r , s t r o n g e r
c o n c l u S i o n
Perspectives on technological change tend to be polarized. For some, technology’s seemingly limitless possibilities bring us closer to a utopian future of abundance
and leisure. For others, technological change gives rise to concerns about automation and a jobless future. Which view is correct? The truth likely lies somewhere in the middle.
Those foreseeing a jobless future often ignore the role of automation in enhancing productivity and competitiveness, improving living standards, and creating jobs. Throughout history, automation has created more jobs than it has eliminated. Those who envisage a technological utopia often ignore the disruptive power of automation and the uneven distribution of technology’s costs and benefits. Both perspectives overlook the extent to which the actual impact of automation depends on business decisions, and not only on technological possibilities. A range of internal and external factors will influence a firm’s decision to automate, and its subsequent decisions about whether to reduce or retrain its workforce.
In this most recent era of automation, Ontario faces a dual challenge. Automation is essential to maintain the competitiveness of Ontario firms, particularly in the face of increased international competition and growing consumer demands. Yet Ontario businesses lag behind their competition in adopting and implementing technology, which may pose just as large a risk for workers as for them. At the same time, automation is already disrupting some jobs and, if the pace of adoption increases as seems likely, a larger number of workers will struggle with changing skills demands and possible job loss.
The dual challenge requires a dual response—one that moves beyond incremental changes. The province needs big ideas and a coordinated, multi-sector strategy to realize them. Decision makers in the public, private, and non-profit sectors will need to collaborate to advance technological adoption, while ensuring that workers have the skills, knowledge, and tools to adapt in the face of change and to realize their potential role in driving innovation and prosperity in the province.
Decision makers in the public,
private, and non-profit sectors will
need to collaborate to advance
technological adoption, while
ensuring that workers have the skills,
knowledge, and tools to adapt in the
face of change and to realize their
potential role in driving innovation
and prosperity in the province.
106b e t t e r , f a s t e r , s t r o n g e r
A p p e n d i x :
b u r n i n g g l A S S
t e c h n o l o g i e S d A t A
Throughout this report, we use data obtained from Burning Glass Technologies (BGT). BGT is a private labour insight company that uses web crawlers to scrape
job posting level data from job ad sites, recruiter websites and business websites on the internet. It is likely one of the most comprehensive sources of data on job openings. BGT parses the raw text of job postings to extract key attributes such as the occupational group it is hiring in, the skill composition required, as well as qualification and experience requested. The coding process was deemed to be at least 80 percent accurate by an independent audit conducted in 2016.110
Our research used aggregated data covering job postings in Ontario from 2013 to 2017.
There are, however, some limitations worth noting. BGT data only covers job openings that are posted online and excludes jobs that are only advertised
in print or informally. While an increasing number of job openings are posted online, this qualifies to some extent how representative the data is of labour market demand.
To assess representativeness, we compared Ontario job opening data for 2015 to 2017 from BGT with Statistics Canada’s Job Vacancy and Wage Survey (JVWS) data. While there are some occupations for which there is an over-representation (such as senior management occupations) or under-representation (such as harvesting, landscaping and natural resources labourers) within BGT data, as compared to the JVWS, overall, the distribution of BGT and JVWS matches reasonably well, with a Pearson correlation coefficient of 0.56 at the 4 level National Occupational Classification (NOC) and 0.66 at the 2 level NOC and a very small (<0.00001) p value. This is a sign that, on average, BGT job postings are reasonably representative.
107b e t t e r , f a s t e r , s t r o n g e r
e n d n o t e S
1. Policy Horizons Canada, 2016, p.1.
2. Murray, 2017, P. i
3. Dao, Das, Koczan, & Lian , 2017, P. 11
4. Graetz & Michaels, 2015, P. 4.
5. Bessem, 2016, Pp.4-5
6. Acemoglu & Restrepo, 2017; Autor, 2015; Bessen, 2016; Brynjolfsson & McAffee, 2014; Ford, 2016; Elliott, 2017
7. Duernecker, 2014; Oschinski & Wyonch, 2017; Autor and Solomons, 2017
8. Autor & Salomons, 2017
9. Oschinski & Wyonch, 2017, P. 5
10. Duernecker, 2014
11. Autor Levy & Murnane, 2003; Frey & Osborne, 2013; Institute for Competitiveness and Prosperity, 2017; Chui, Manyika, & Miremadi, 2015
12. Technology complements human labour in non-routine analytical and interactive tasks, such as professional and managerial positions. For example, when it comes to the information communications technology (ICT) sector, workers are able to increase the scope of data and analytical tools available to them, therefore, spending less time performing routine tasks, and in fact amplifying their comparative advantage. As a result, they tend to experience increasing productivity, wages, and demand. Non-routine manual tasks have historically had limited opportunities for either substitution or complementarity; however, as wages among the middle and upper income classes rise, demand for these work activities will increase.
13. Goos & Manning, 2007; Acemoglu & Autor, 2011; Autor & Dorn, 2013; Goos, Manning & Salomons, 2014; Autor, 2015; Mann & Püttmann, 2017
14. Graetz & ichaels, 2015, Pp. 3-4
15. Acemoglu & Restrepo, 2017, P. 36
16. Ibid.
17. Bessen, 2016
18. Goldin & Katz, 2007
19. Tambe, & Hitt, 2012; Michaels, Rauch, & Redding, 2013; Berger & Frey, 2016
20. Bessen, 2016; Goldin and Katz, 2007
21. Bonvillian & Singer, 2018, Pp. 245-6
22. Brynjolfsson & McAfee, 2014
23. Agrawal, Gans, & Goldfarb, 2017.
24. Brynjolfsson, Rock, & Syverson, 2017, Pp. 19-21)
25. Trajtenberg, 2018, P.p. 2-3
26. Chui, Manyika, & Miremadi, 2018
27. Bughin, et al., 2017, Brief
28. Including an enterprise-level lens is consistent with the Council of Canadian Academies’ framework for understanding business innovation in Canada. By putting companies’ decision-making at the centre of analysis, the CCA’s reports reveal how features of the Canadian economy and individual firms’ characteristics help to explain why Canadian business is not as innovative as economic theory would predict. If we see automation as a potential innovation strategy for business, then an enterprise-centered innovation framework can provide clear insights. (Innovation, 2009; Investments, 2013).
29. Autor & Salomons, 2017
30. Acemoglu & Restrepo, 2016
31. Goldin & Katz, 2007
32. Aghion et al., 2015; Autor, 2015
33. TD Economics, 2013
34. For this analysis we leveraged the US O*NET Career Changers Matrix which identifies occupations that
108b e t t e r , f a s t e r , s t r o n g e r
require similar skills and experience, ensuring a worker from one occupation can transfer into a related occupation with minimal additional preparation.
35. World Economic Forum, 2018
36. Sharpe & Arsenault, 2008, P.3; Oschinski & Chan,2014, P. 7
37. Conference Board of Canada 2015; Oschinski &Chan 2014
38. Thomas, 2016
39. Oschinski & Chan 2014
40. Conference Board, “ICT Investment” (forthcoming,May 2018).
41. Thomas, 2016
42. Explanations for lower within-industry investmentin ICT between Canada and the US range fromlower educational attainment, to higher rates ofunionization, higher nominal labour compensation,managerial experience and education, as well as ahigher instance of small and medium-sized firms.
43. Berger & Frey, 2016
44. Michaels, Rauch, & Redding, 2013
45. Tambe & Hitt, 2012
46. Bakhshi, Downing , Osborne, & Schneider, 2017
47. Burning Glass Technologies, 2016.
48. Administrative and clerical (14 percent growth).Production, trades, operatives and labourers (0percent growth).
49. Green & Sand, 2015, Pp. 612 and 641
50. Manyika, et. al., 2017
51. Lamb & Lo, 2017
52. Elliott, 2017; Autor, Dorn & Hanson, 2016
53. Bughin, et. al., 2017, P. 15
54. Institute for Competitiveness and Prosperity, 2017;the DEEP Centre, 2015; Jobs & Prosperity Council2012; Oschinski & Chan 2014
55. Ontario Ministry of Finance, 2017
56. Statistics Canada Cansim Table 379-0030
57. McKitrick & Aliakbari, 2017, P.i
58. Oschinski & Chan, 2014, Pp. 8-9
59. Oschinski & Chan, 2014, P. 4
60. Murray, 2017
61. Spiro, 2013
62. Dragicevic, 2014
63. Centre for the Study of Living Standards, 2015
64. Bughin, et. al., 2017, Pp. 53-57
65. Ibid.
66. Conference Board of Canada, 2012; KPMG, 2010
67. Canadian Manufacturers and Exporters & CanadianSkills Training and Employment Coalition, 2017
68. Conference Board of Canada, 2013
69. The Expert Panel on the State of Industrial R&D inCanada, 2013, P. 30 & 93
70. Acemoglu & Restrepo, 2018
71. However, it was also suggested that certainstatistics surrounding productivity and employmentin the manufacturing sector may be misleading.Currently, the data often suggest that profitmargins and productivity are rising much morequickly than labour costs. But problems arisebecause the sector may not be accurately capturedby Statistics Canada data. According to StatisticsCanada, to be classified in a manufacturingindustry, at least the majority of labour costs mustbe in manufacturing. The issue is that more andmore manufacturers are automating traditionalmanufacturing roles and more employeesare becoming service oriented. Therefore,organizations are often classified as engineering
109b e t t e r , f a s t e r , s t r o n g e r
or services companies. It was suggested that if you include the services that manufacturing operations are producing, the labour cost growth may be much closer to profit and productivity.
72. Muro & Liu, 2016
73. Due to lack of available demographic data at the occupation-industry level, we first used the occupation-industry employment data from Canada’s 2016 census to calculate the occupational concentration in each industry. Then, we selected the set of occupations with greater than or equal to 75 percent concentration in either of the industries as the set of “manufacturing occupations” or “finance occupations” to analyze the demographic aspects of these occupations, using 2016 census data. For finance, however, using this procedure only produced 5 occupations. As a result, we used the full set of occupations in the finance demographic analysis, using concentration level as weights. As a result, this analysis misses the peripheral occupations (where the occupational concentration is low) as well as senior management occupations (as they are scattered amongst many industries.) However, we believe this approach is appropriate as it still allows us to gain an understanding of how demographic factors affect some of the core occupations within each of the industries.
74. This analysis used a level-log specification, which is simple but misses some crucial factors. For example, it doesn’t examine the causal channel between education and automation risk. As well, there may be reverse causality present.
75. Ontario Ministry of Finance, 2017
76. Statistics Canada Cansim Table 379-0030
77. Belsie, 2018
78. Statistics Canada Cansim Table 281-0024
79. Burt & Forbes, 2017
80. Burt & Forbes, 2017
81. Centre for the Study of Living Standards, 2015
82. Breznitz, Breznitz & Wolfe, 2015
83. PwC, 2016
84. Ibid.
85. Ibid.
86. Competition Bureau of Canada, 2017
87. PwC, 2016
88. Toronto Financial Services Alliance, 2018, P.8
89. Toronto Financial Services Alliance, 2018, P.9
90. Toronto Financial Services Alliance, 2018, P.8
91. Competition Bureau of Canada, 2017
92. Breznitz, Breznitz & Wolfe, 2016
93. Office of the Privacy Commissioner of Canada, 2018
94. Toronto Financial Services Alliance, 2018, P.8
95. Toronto Financial Services Alliance, 2018, Pp. 14-15
96. Lazaridis Institute, 2016
97. We examined the full set of occupations employed in finance, given the low number of occupations that are highly concentrated in the sector. To assess the initial relationship between income, education, and automation risk, we used a weighted linear model, given that the error term for occupations not concentrated in finance will likely be higher in variance than occupations highly concentrated in finance. In normal instances, both a more rigorous analysis of and an estimation of the error structure are used in weighted linear regressions. However, we argue that the demographic characteristics of an entire occupation constitute a more precise proxy for the demographic characteristics of an occupation within an industry when that occupation is highly concentrated. The assumption here, then, is that the underlying error structure is a multiple of the concentration structure. In a manner, we’re using the concentration weights as a measure of sampling probability: the higher the concentration, the higher the chance that the data we use represent that population.
98. When a weighted linear univariate model is performed.
110b e t t e r , f a s t e r , s t r o n g e r
99. For this analysis, we leveraged the US O*NET Career Changers Matrix which identifies occupations that require similar skills and experience, ensuring a worker from one occupation can transfer into a related occupation with minimal additional preparation.
100. Ministry of Economic Development and Growth, 2017
101. Légis Québec, 2017
102. Delaney, 2015
103. CSTEC interview
104. LIFT: Lightweight Innovations, 2018
105. Bonvillian & Singer, 2018
106. Government of Ontario, 2017
107. Government of Ontario, 2018
108. Goldin & Katz, 2007
109. Micro-credentials, also known as digital badges, are awarded for mastery of skills associated with discrete tasks, at a more granular level than a traditional degree.
110. Hershbein & Kahn, 2016
111b e t t e r , f a s t e r , s t r o n g e r
w o r k S c i t e d
Acemoglu, D., & Autor, D. (2011). Skills, tasks and technologies: Implications for employment and earnings. In Handbook of labor economics (pp. 1043-1171). Elsevier.
Acemoglu, D., & Restrepo, P. (2017). Robots and Jobs: Evidence from US Labor Markets. MIT.
Acemoglu, D., & Restrepo, P. (2018). Demographics and Automation. NBER.
Aghion, P., Akcigit, U., Bergeaud, A., Blundell, R., & Hémous, D. (2015). Innovation and Top Income Inequality. National Bureau of Economic Research.
Agrawal, A., Gans, J., & Goldfarb, A. (2017). How AI Will Change the Way We Make Decisions. Harvard Business Review.
Agrawal, A., Gans, J., & Goldfarb, A. (2017). The Trade-Off Every AI Company Will Face. Harvard Business Review.
Autor, D. H. (2015, Summer). Why Are There Still So Many Jobs? The History and Future of Workplace Automation. Journal of Economic Perspectives, 3-30.
Autor, D. H., Dorn, D., & Hanson, G. (2016). The China Shock: Learning from Labor Market Adjustment to Large Changes in Trade. NBER.
Autor, D. H., Levy, F., & Murnane, R. J. (2003). The Skill Content of Recent Technological Change: An Empircal Exploration. The Quarterly Journal of Economics, 1279-1333.
Autor, D., & Dorn, D. (2013). The Growth of Low-Skill Service Jobs and the Polarization of the US Labor Market. American Economic Review, 103(5), 1553-1597.
Autor, D., & Salomons, A. (2017). Robocalypse Now—Does Productivity Growth Threaten Employment? ECB Forum on Central Banking.
Bakhshi, H., Downing , J., Osborne, M., & Schneider, P. (2017). The Future of Skills: Employment in 2030. Nesta.
Belsie, L. (2018). Why Canada Didn’t Have a Banking Crisis in 2008. Retrieved from NBER: http://www.nber.org/digest/dec11/w17312.html
Berger, T., & Frey, C. B. (2016). Did the Computer Revolution shift the fortunes of U.S. cities? Technology shocks and the geography of new jobs. Regional Science and Urban Economics, 57(C), 38-45.
Berger, T., & Frey, C. B. (2016). Structural Transformation in the OECD: Digitalisation, Deindustrialisation and the Future of Work. Paris: OECD Social, Employment and Migration Working Papers, No. 193.
Bessen, J. E. (2016). How Computer Automation Affects Occupations: Technology, Jobs, and Skills. Boston Univ. School of Law, Law and Economics Research Paper No. 15-49.
Bonvillian, W. B., & Singer, P. (2018). Advanced Manufacturing: The New American Innovation Policies. MIT Press.
Breznitz, D., Breznitz, S., & Wolfe, D. (2015). Current State of the Financial Technology Innovation Ecosystem in the Toronto Region. The Innovation Policy Lab.
Brynjolfsson, E., & Mcafee, A. (2014). The Second Machine Age: Work Progress And Prosperity In A Time Of Brilliant Technologies. New York: W.W. Norton & Company.
112b e t t e r , f a s t e r , s t r o n g e r
Brynjolfsson, E., Rock, D., & Syverson, C. (2017). Artificial Intelligence and the Modern Productivity Paradox: A Clash of Expectations and Statistics. NBER.
Bughin, J., Hazan, E., Ramaswamy , S., Chui , M., Allas, T., Dahlström , P., . . . Trench, M. (2017). Artificial Intelligence: The Next Digital Frontier. McKinsey Global Institute.
Burning Glass Technologies. (2016). Beyond Point and Click: The Expanding Demand for Coding Skills.
Burt, M., & Forbes, R. (2017). Partners in Growth: 2017 Report Card on Canada and Toronto’s Financial Services Sector. Conference Board of Canada.
Canadian Manufacturers and Exporters & Canadian Skills Training and Employment Coalition. (2017). The Future of the Manufacturing Labour Force in Canada.
Chui, M., Manyika, J., & Miremadi, M. (2015). Four fundamentals of workplace automation. McKinsey & Company.
Chui, M., Manyika, J., & Miremadi, M. (2018). What AI can and can’t do (yet) for your business. McKinsey Quarterly.
Competition Bureau of Canada. (2017). Technology-Led Innovation in the Canadian Financial Services Sector.
Conference Board of Canada. (2012). Investment and Productivity: Why is M&E investment important to labour productivity? Retrieved from How Canada Performs: http://www.conferenceboard.ca/hcp/hot-topics/investProd.aspx
Conference Board of Canada. (2013). Business Enterprise R&D Spending. Retrieved from How Canada Performs: http://www.conferenceboard.ca/hcp/Details/Innovation/berd.aspx
Conference Board of Canada. (2015). ICT Investment. Retrieved from How Canada Performs: http://www.conferenceboard.ca/hcp/provincial/innovation/ict.aspx
Dao, M. C., Das, M., Koczan, Z., & Lian , W. (2017). Why Is Labor Receiving a Smaller Share of Global Income? Theory and Empirical Evidence. IMF.
Delaney, K. (2015). HSTAC & Other Training Consortia in Ontario.
Dragicevic, N. (2014). How Ontario lost 300,000 manufacturing jobs (and why most aren’t coming back). Mowat Centre.
Duernecker, G. (2014). Technology Adoption, Turbulence and the Dynamics of Unemployment. Journal of the European Economic Association, 12(3), 724-754.
Elliott, S. W. (2017). Computers and the Future of Skill Demand. Paris: OECD Publishing.
Ford, M. (2016). Rise of the Robots: Technology and the Threat of a Jobless Future . Basic Books.
Goldin, C., & Katz, L. (2007). The Race between Education and Technology: The Evolution of U.S. Educational Wage Differentials, 1890 to 2005. NBER.
Goos, M., & Manning, A. (2007). Lousy and Lovely Jobs: The Rising Polarization of Work in Britain. The Review of Economics and Statistics, 89(1), 118-133.
Goos, M., Manning, A., & Salomons, A. (2014). Explaining Job Polarization: Routine-Biased Technological Change and Offshoring. American Economic Review, 104(8), 2509-2526.
Graetz, G., & Michaels, G. (2015). Robots at Work. Centre for Economic Performance.
Green, D. A., & Sand, B. (2015). Has the Canadian Labour Market Polarized? IRPP.
Hershbein, B., & Kahn, L. (2016). Do Recessions Accelerate Routine-Biased Technological Change? Evidence from Vacancy Postings. NBER.
Innovation, T. E. (2009). Innovation and Business Strategy: Why Canada Falls Short. Ottawa: Canada Council of Academies.
Institute for Competitiveness and Prosperity. (2017). The Labour Market Shift: Training a Highly Skilled and Resilient Workforce in Ontario.
Investments, T. E.-e. (2013). Innovation Impacts: Measurement and Assessment. Ottawa: Council of Canadian Academies.
Jobs and Prosperity Council. (2012). Advantage Ontario.
KPMG. (2010). Competitive Alternatives: KPMG’s Guide to International Business Location 2010 Edition.
Lamb, C., & Lo, M. (2017). Automation Across the Nation: Understanding the potential impacts of technological trends across Canada. The Brookfield Institute for Innovation + Entrepreneurship.
Lazaridis Institute. (2016). Scaling Success: Tackling the Management Gap in Canada’s Technology Sector.
Légis Québec. (2017). Retrieved from Act to Promote Workforce Skills Development and Recognition: http://legisquebec.gouv.qc.ca/en/ShowDoc/cs/D-8.3
LIFT: Lightweight Innovations. (2018). About LIFT: Lightweight Innovations for Tomorrow. Retrieved from https://lift.technology/about/
Mann, K., & Püttmann, L. (2017). Benign Effects of Automation: New Evidence from Patent Texts. SSRN.
Manyika, J., Chui, M., Miremadi, M., Bughin , J., George, K., Willmott , P., & Dewhurst, M. (2017). A Future That Works: Automation, Employment and Productivity. McKinsey Global Institute.
McKitrick, R., & Aliakbari, E. (2017). Rising Electricity Costs and Declining Employment in Ontario’s Manufacturing Sector. Fraser Institute.
Michaels, G., Rauch, F., & Redding, S. (2017). Task Specialization in U.S. Cities from 1880-2000. NBER.
Ministry of Economic Development and Growth. (2017). Ontario Boosting the Number of Graduates in Science, Tech, Engineering, Mathematics and Artificial Intelligence. Retrieved from Newsroom Ontario: https://news.ontario.ca/medg/en/2017/10/ontario-boosting-the-number-of-graduates-in-science-tech-engineering-mathematics-and-artificial-inte.html
Muro, M., & Liu, S. (2016). Why Trump’s factory job promises won’t pan out—in one chart. Retrieved from Brookings Institute: https://www.brookings.edu/blog/the-avenue/2016/11/21/why-trumps-factory-job-promises-wont-pan-out-in-one-chart/
Murray, A. (2017). The Effect of Import Competition on Employment in Canada: Evidence from the ‘China Shock’. Centre for the Study of Living Standards.
Murray, A. (2017). The Effect of Import Competition on Employment in Canada: Evidence from the ‘China Shock’. Ottawa: Centre for the Study of Living Standards.
114b e t t e r , f a s t e r , s t r o n g e r
Office of the Privacy Commissioner of Canada. (2018). Summary of Privacy Laws in Canada. Retrieved from https://www.priv.gc.ca/en/privacy-topics/privacy-laws-in-canada/02_05_d_15/
Ontario. (2017). 2017 Ontario Budget: A Stronger, Healthier Ontario.
Ontario Ministry of Finance. (2017). Ontatio Economic Accounts: Third Quarter of 2017.
Oschinski, M., & Chan, K. (2014). Ontario Made: Rethinking Manufacturing in the 21st Century. Mowat Centre.
Oschinski, M., & Wyonch, R. (2017). Future Shock? The Impact of Automation on Canada’s Labour Market. C.D. Howe Institute.
Policy Horizons Canada. (2016). Canada and the Changing. Government of Canada.
PwC. (2016). Financial Services Technology 2020 and Beyond: Embracing Disruption.
Sharpe, A., & Arsenault, J.-F. (2008). ICT Investment and Productivity: A Provincial Perspective. Ottawa: Centre for the Study of Living Standards.
Spiro, P. S. (2013). A Sectoral Analysis of Ontario’s Weak Productivity Growth. Ottawa: Centre for the Study of Living Standards.
Tambe, P., & Hitt, L. (2012). Now IT’s Personal: Offshoring and the Shifting Skill Composition of the U.S. Information Technology Workforce. Management Science, 58(4), 678-695.
TD Economics. (2013). Assessing the Long Term Cost of Youth Unemployment.
The DEEP Centre. (2015). The Future of Manufacturing in Onario: New Tecnologies, New Challenges and New Opportunities.
The Expert Panel on the State of Industrial R&D in Canada. (2013). The State of Industrial R&D in Canada. Council of Canadian Academies.
Thomas, J. (2016). Explaining Industry Differences in IT Investment Per Worker Between Canada and the United States, 2002-2013. Ottawa: Centre for the Study of Living Standards.
Thomas, J. (2016). New Evidence on the Canada-U.S. ICT Investment Gap, 1976-2014. Ottawa: Centre for the Study of Living Standards.
Toronto Financial Services Alliance. (2018). Unlocking the human opportunity: Future-proof skills to move financial services forward.
Trajtenberg, M. (2018). AI as the next GPT: a Political-Economy Perspective. NBER.
World Economic Forum. (2018). Towards a Reskilling Revolution: A Future of Jobs for All. Geneva.