better preanalysis plans through design declaration
TRANSCRIPT

Better preanalysis plans through design declaration & diagnosisGraeme Blair, UCLAJoint work with Jasper Cooper, Alexander Coppock, and Macartan Humphreys
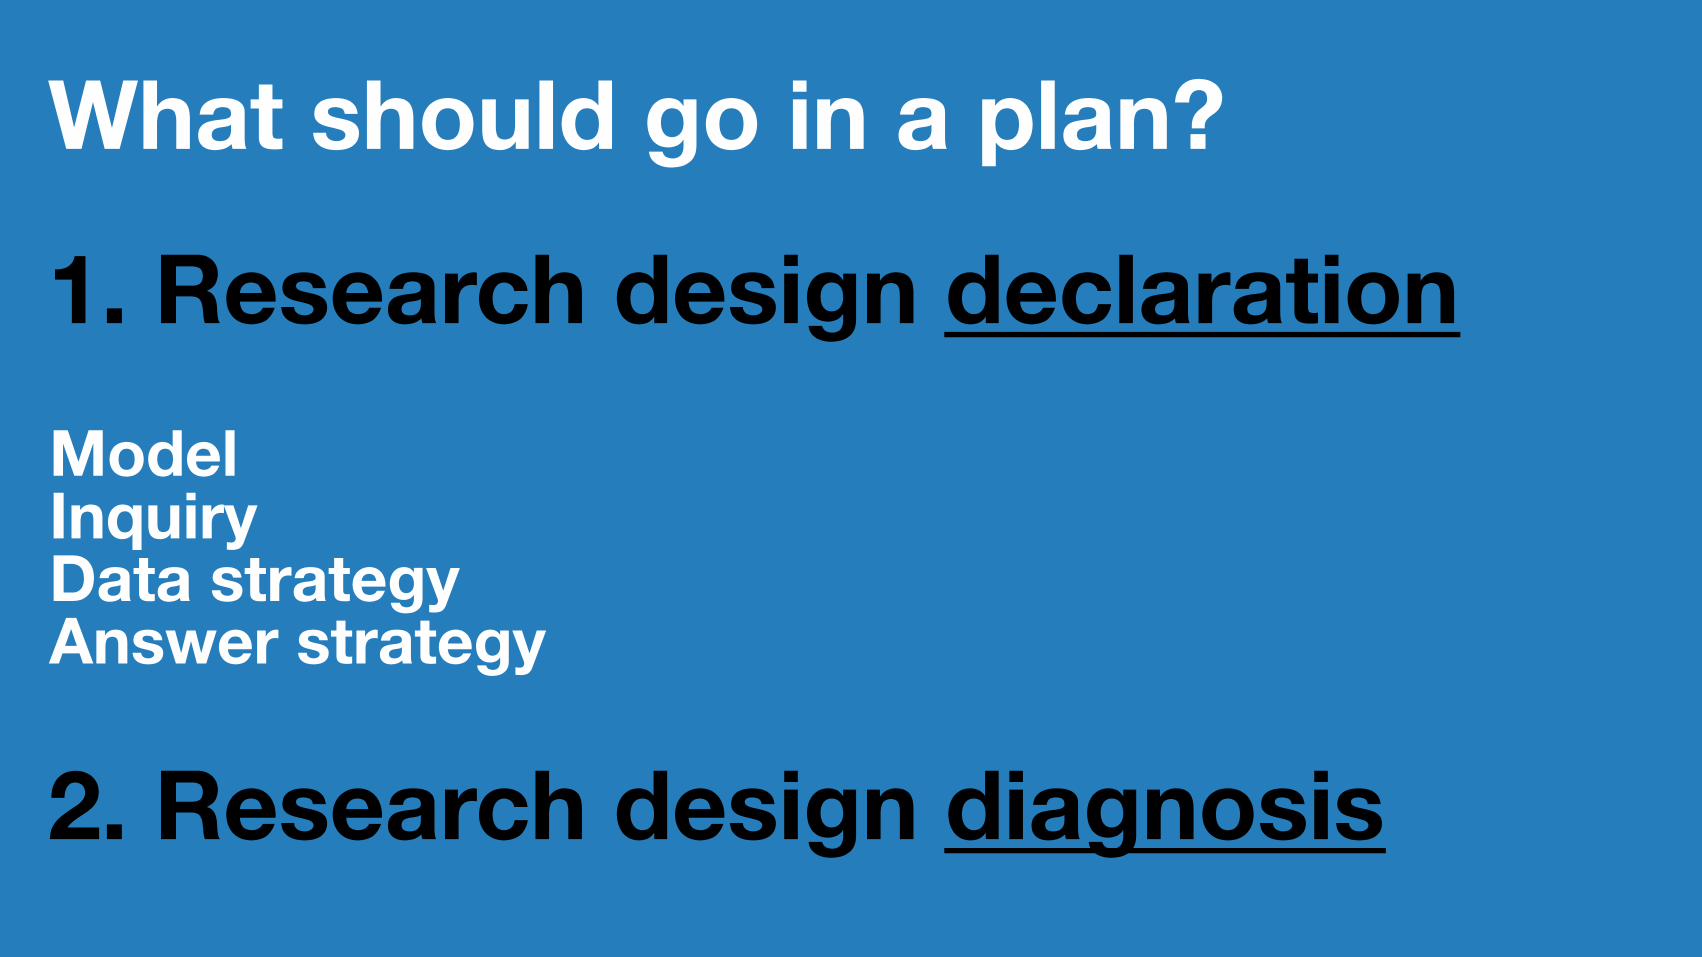
What should go in a plan?
1. Research design declarationModelInquiryData strategyAnswer strategy
2. Research design diagnosis

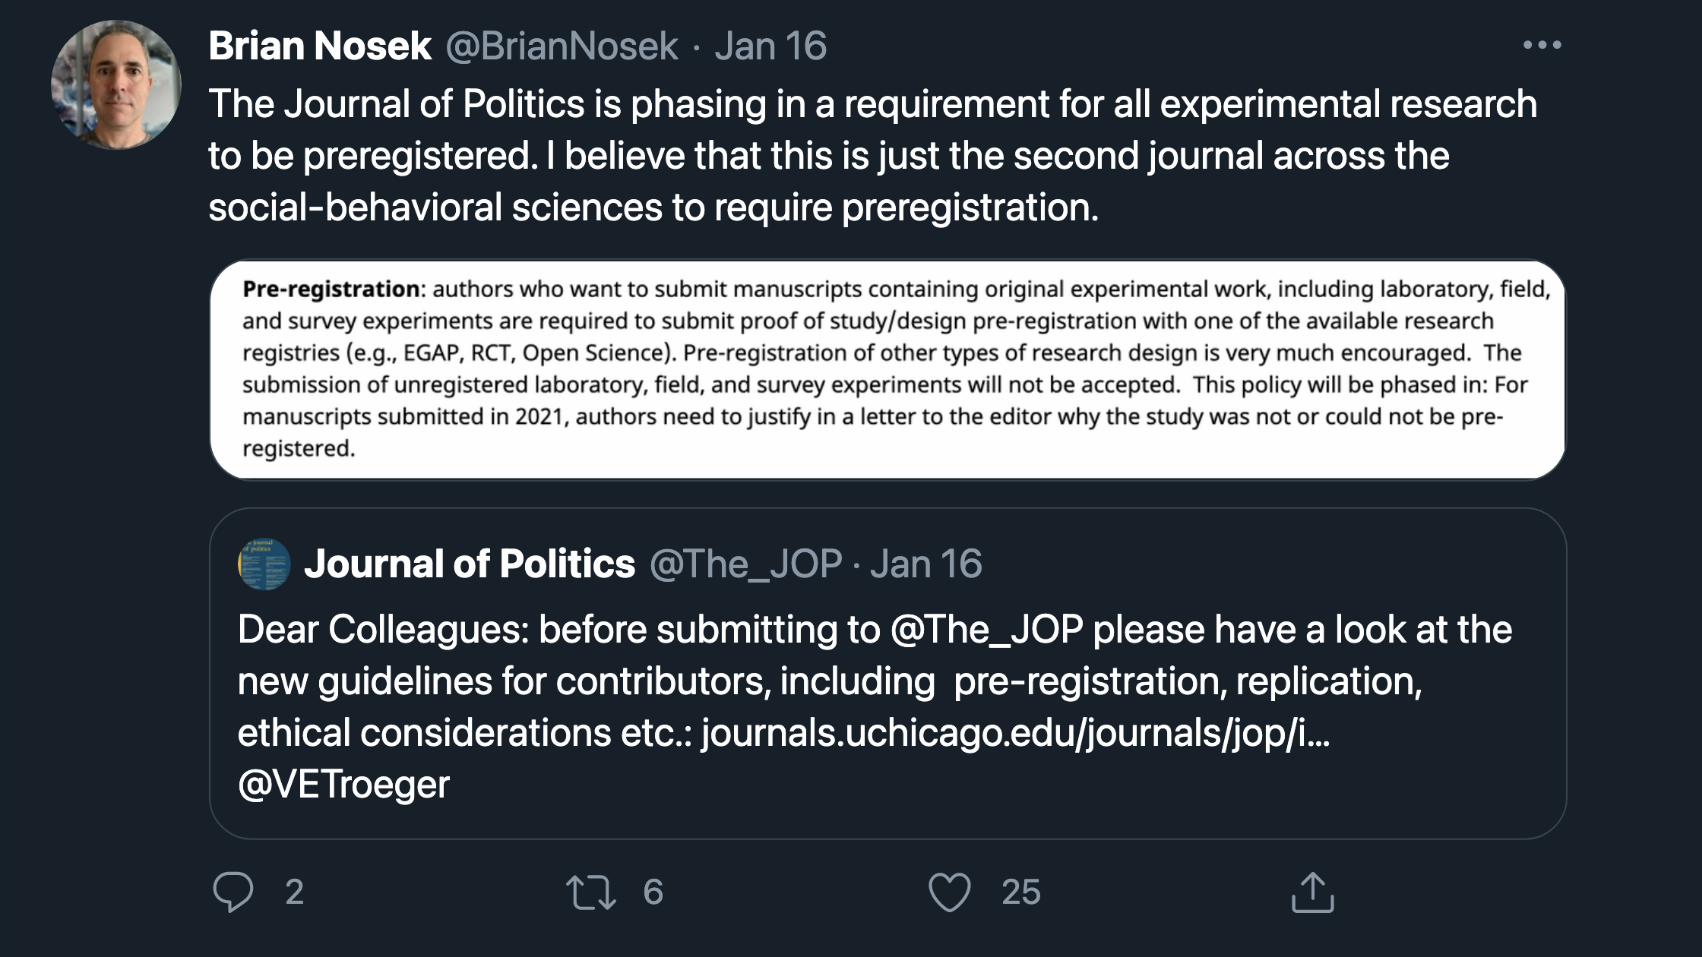
What is apreanalysis plan?What are your hypotheses?How will you test them?
Timestamped publicly

Why preanalysis plans?Clarify what you thought before, (in the middle), and after
What tests are confirmatory vs. exploratory


Writing planschanges plans

What goes in a plan?As Predicted: 9 itemsMcKenzie (2012): 10 itemsAEA registry: ~ 30 itemsEGAP registry: ~ 30 itemsJournal of Development Economics: 44 itemsGanimian (2018): 60 items

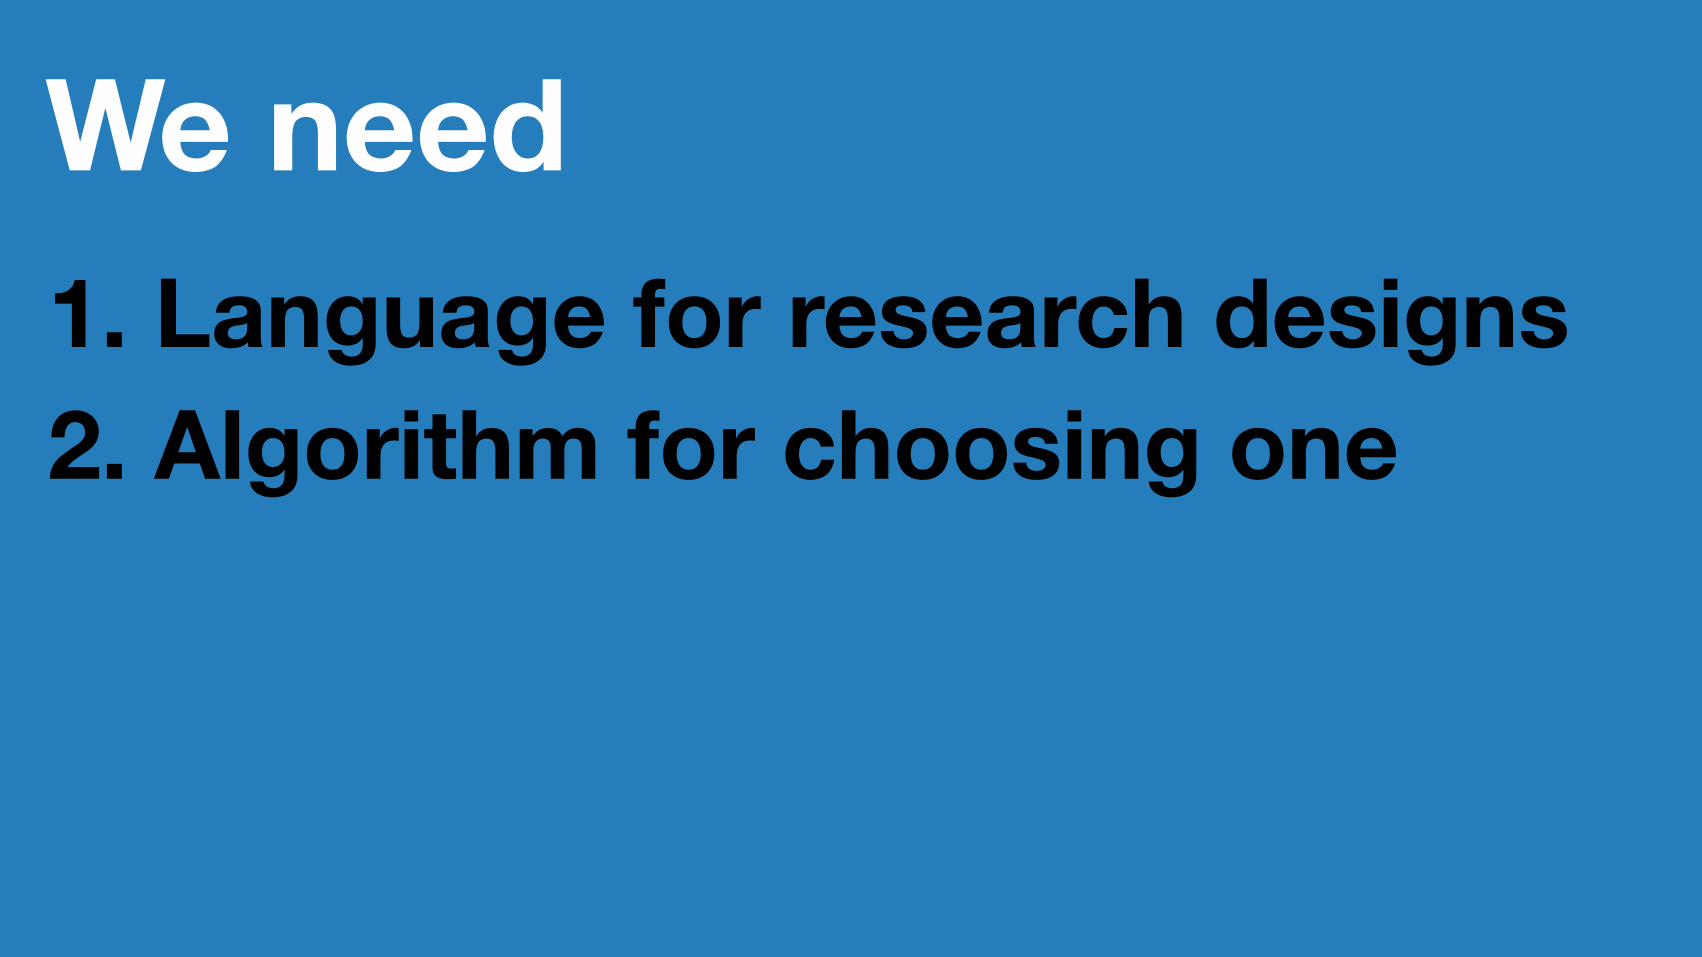
We need1. Language for research designs 2. Algorithm for choosing one
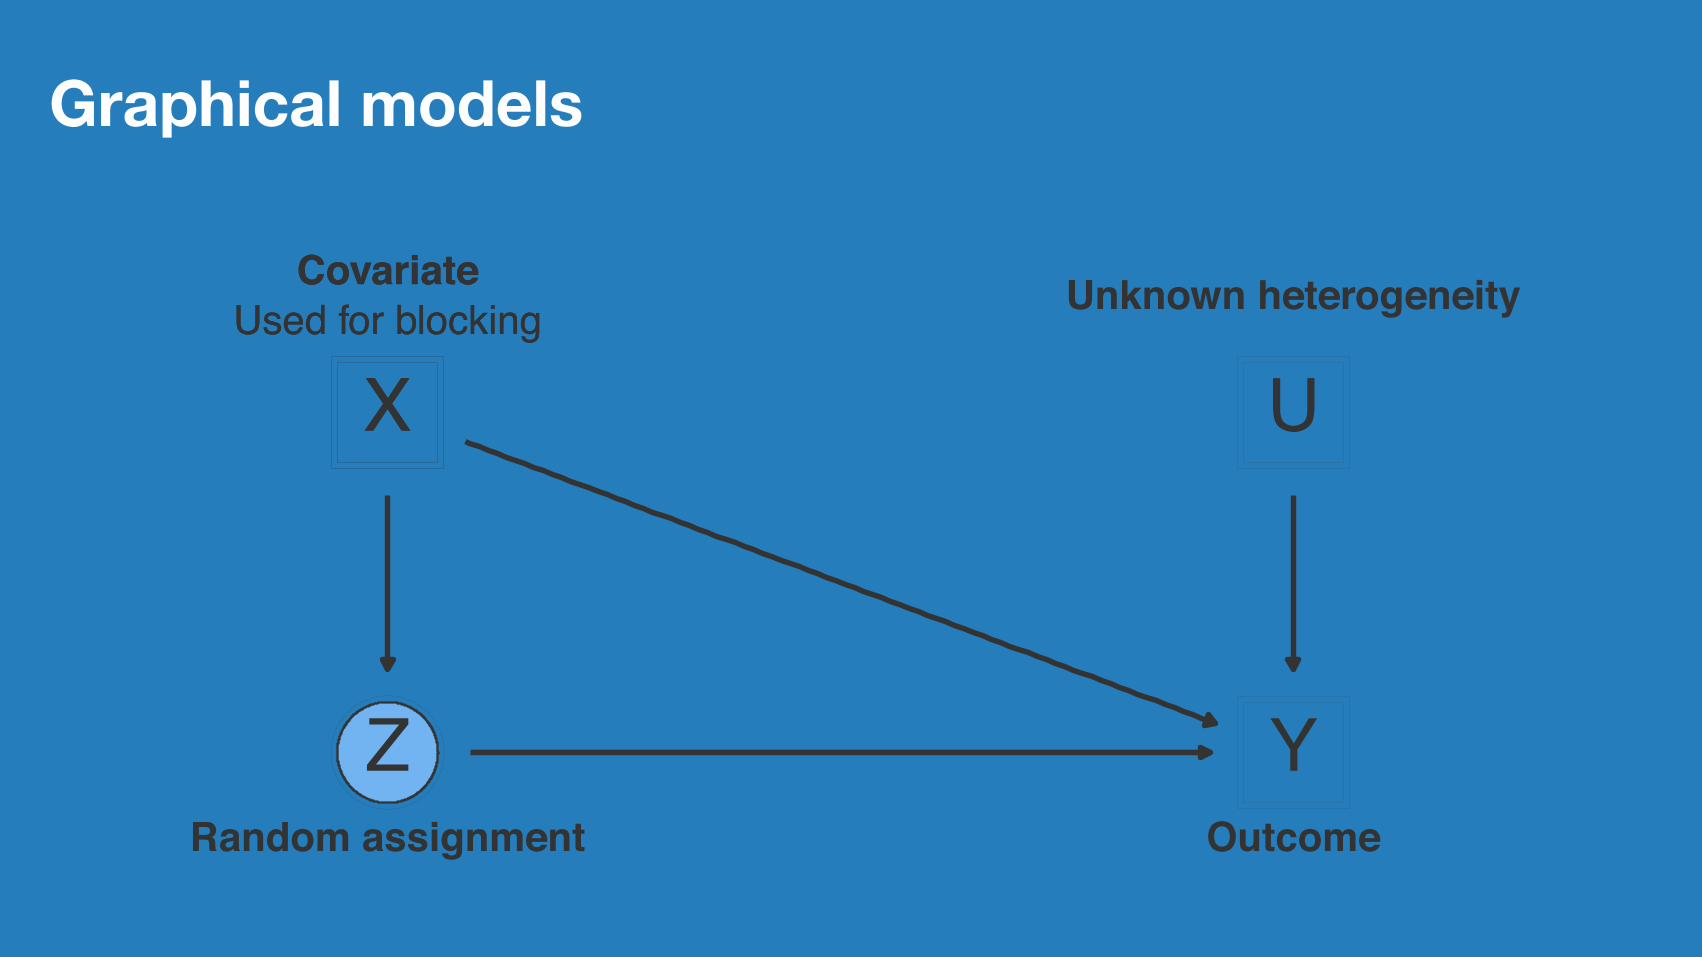
Graphical models
UXX
Z Y
Unknown heterogeneityCovariateUsed for blocking
CovariateUsed for blocking
Random assignment Outcome
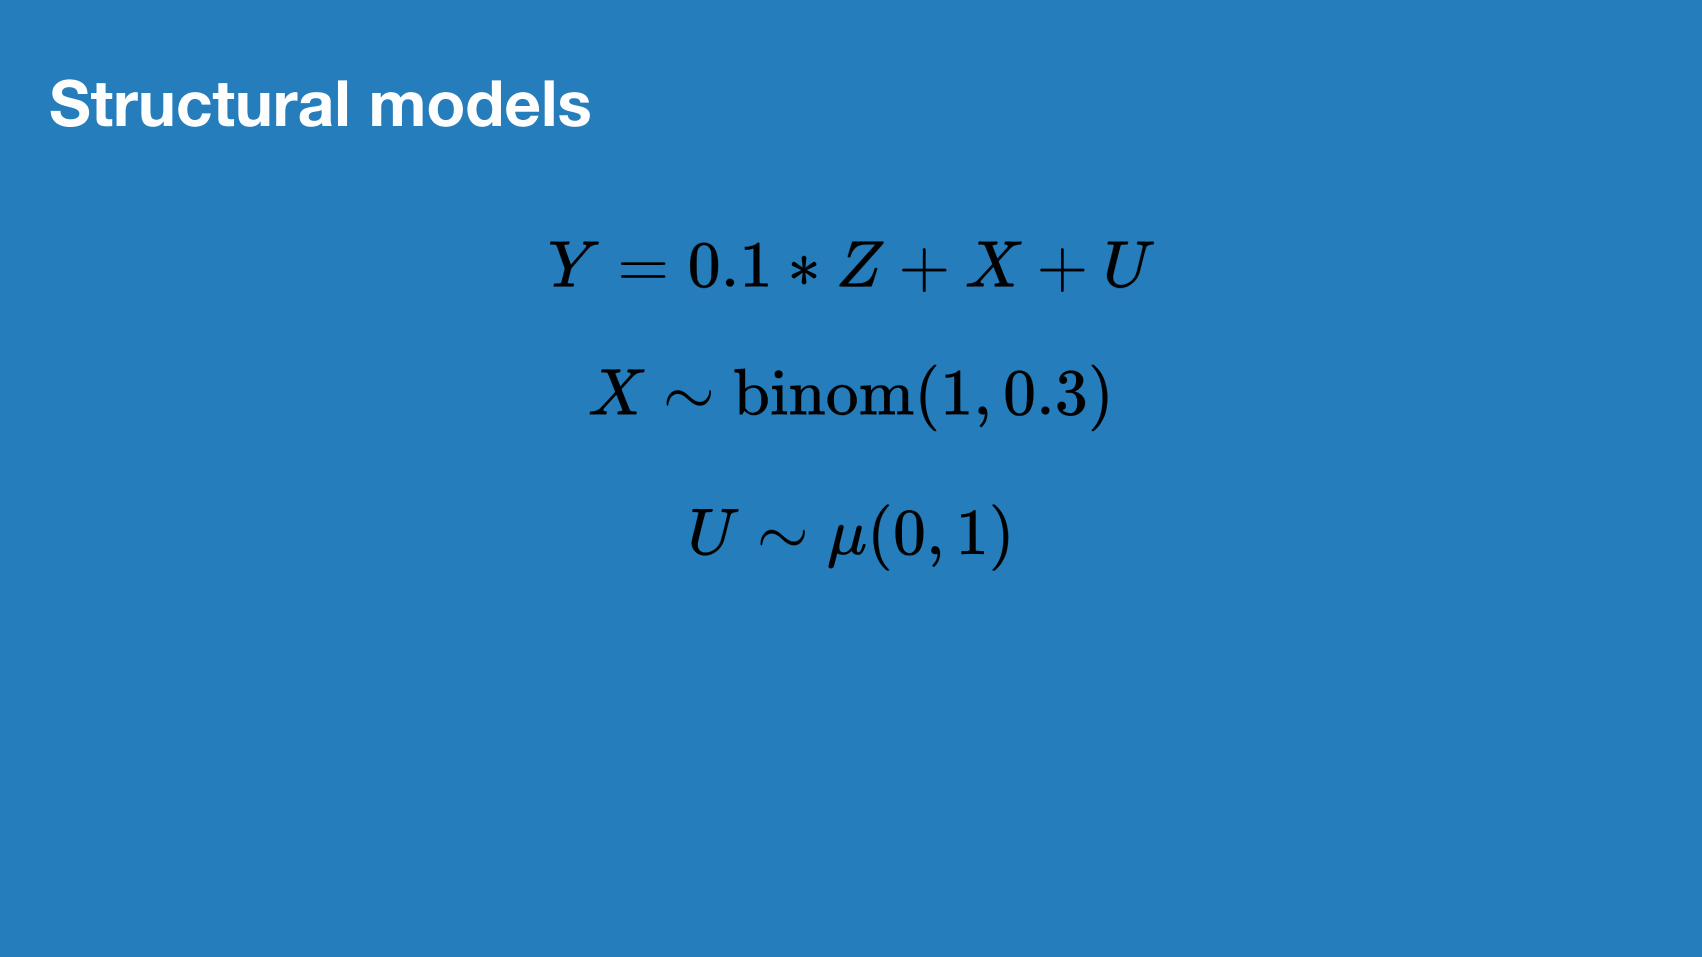
Structural models
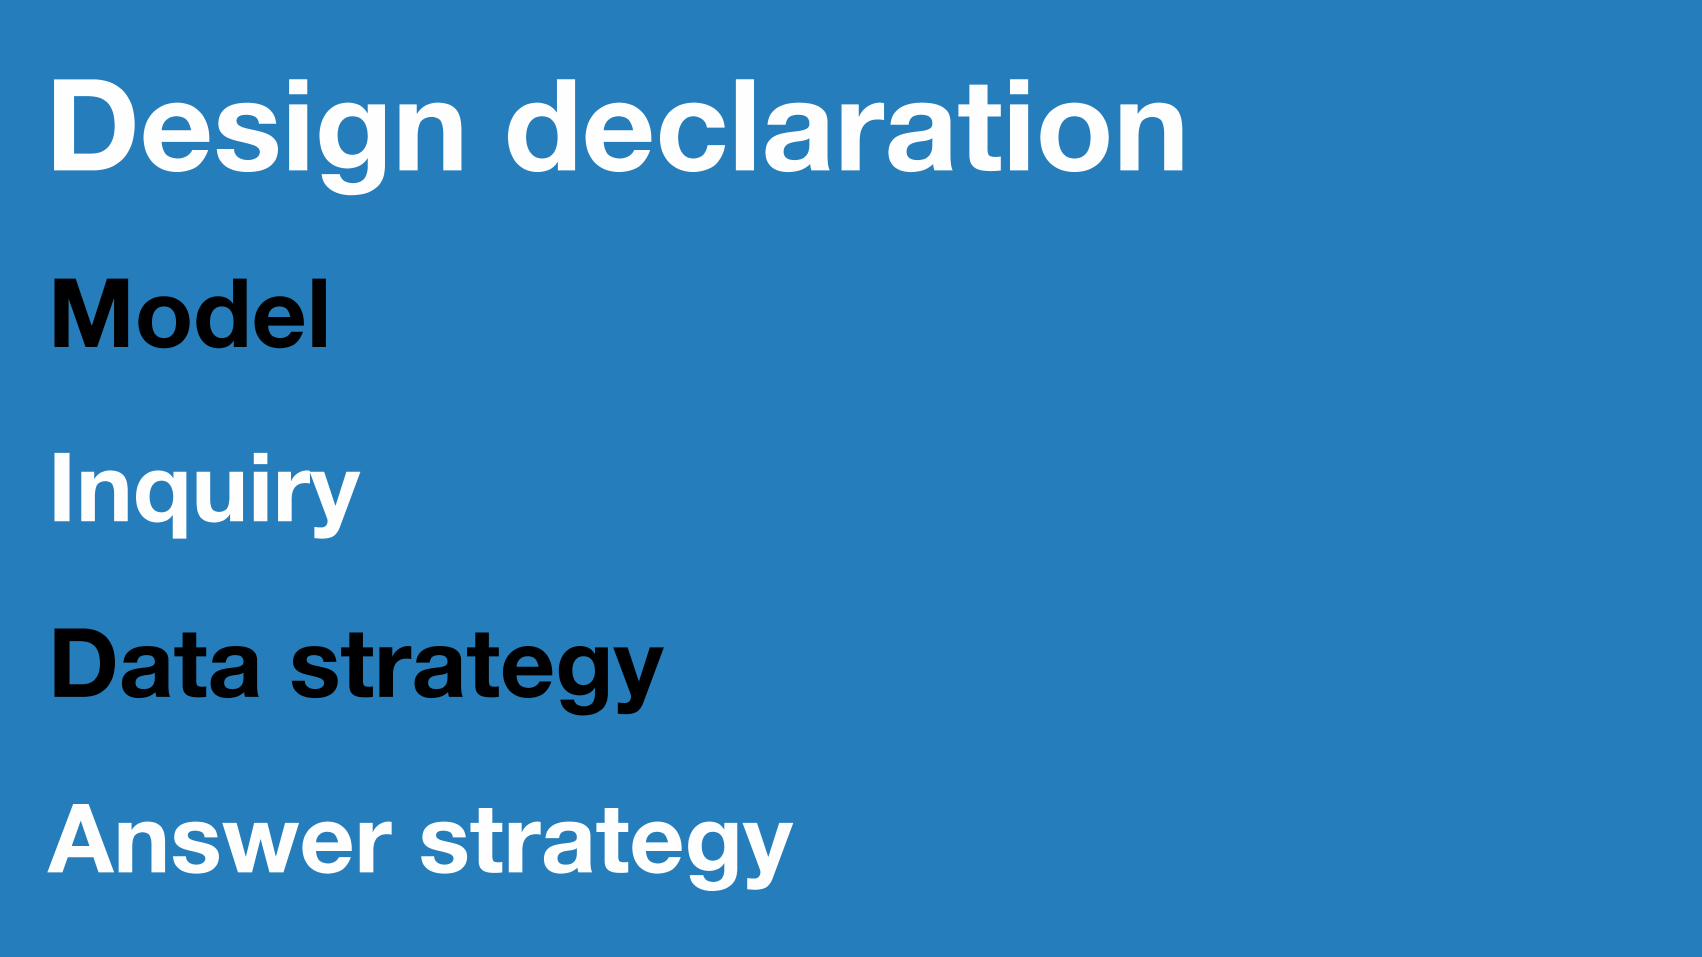
Design declarationModel
InquiryData strategyAnswer strategy

ModelTheory of the system under study
—What causes what — and how—How variables are distributed—Correlations between variables—Sequence of events
—Theory if we are right, and if we are wrong
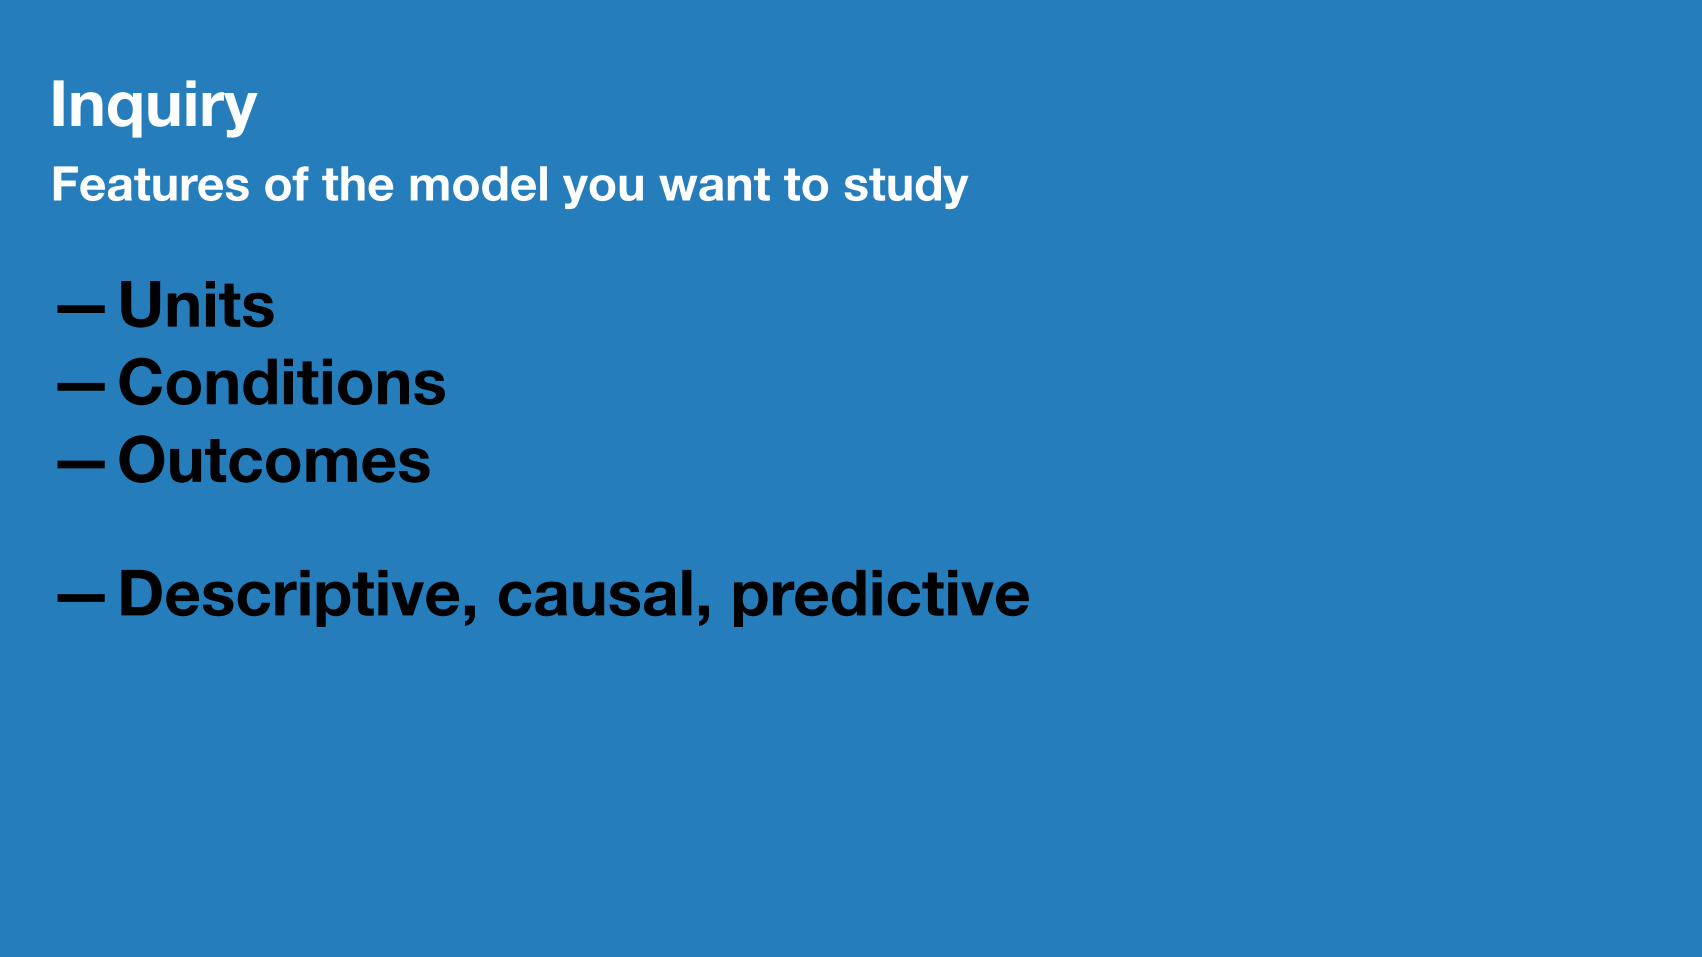
InquiryFeatures of the model you want to study
—Units—Conditions—Outcomes
—Descriptive, causal, predictive
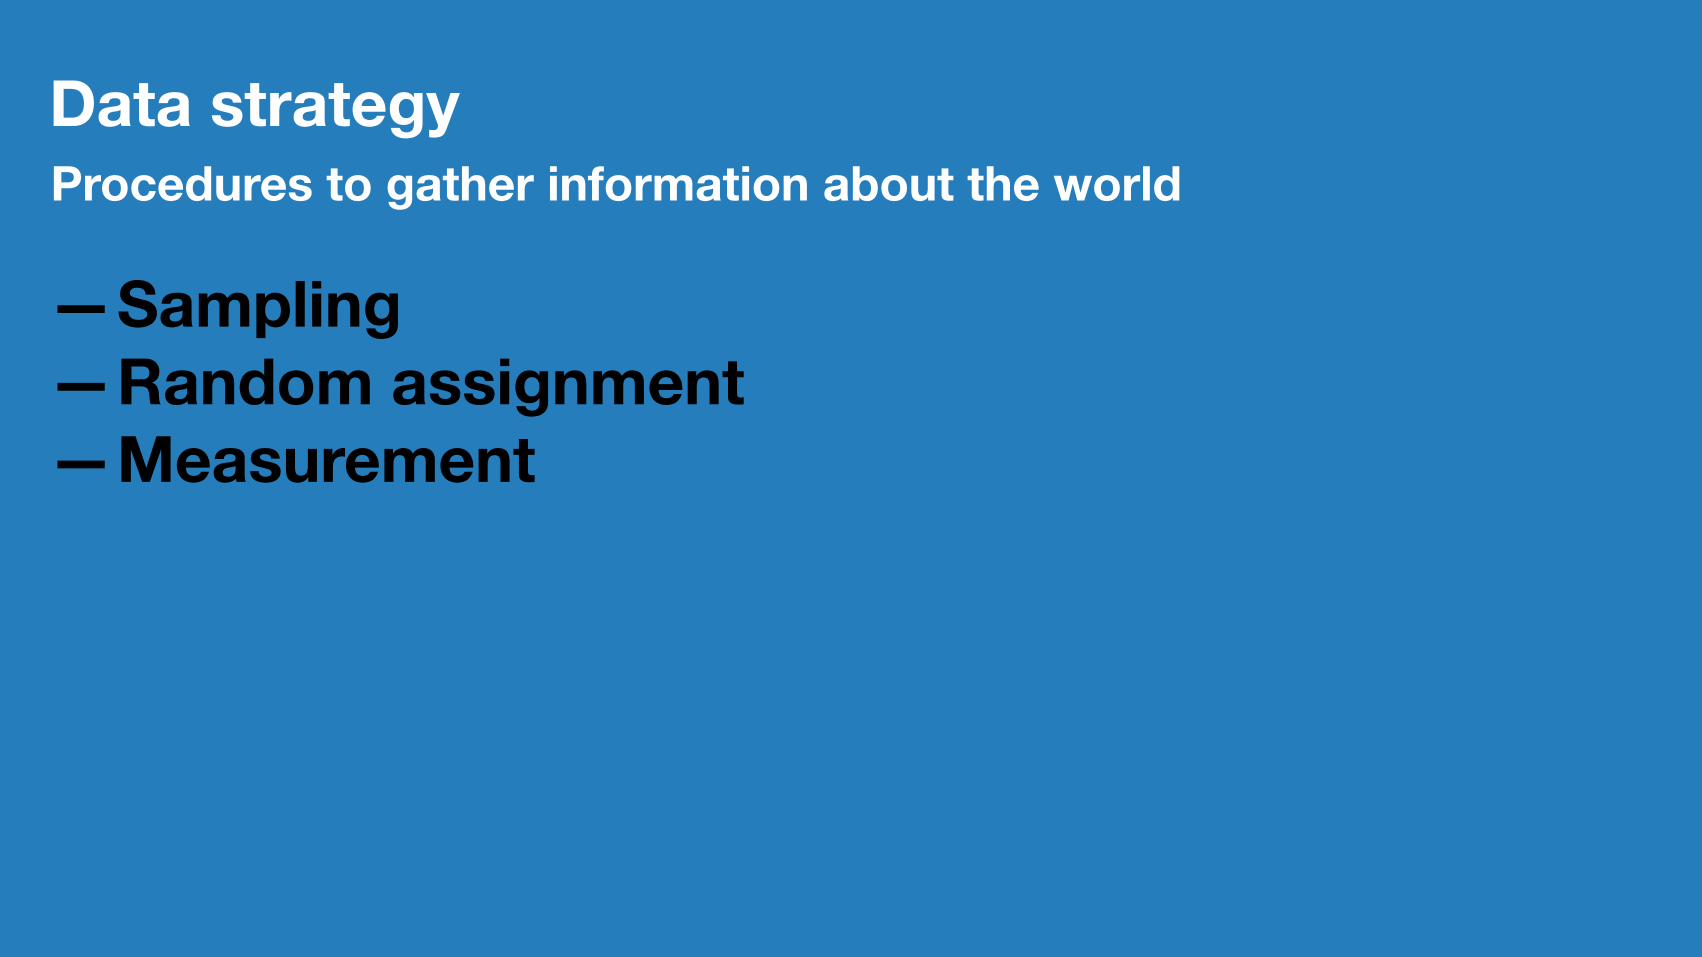
Data strategyProcedures to gather information about the world
—Sampling—Random assignment—Measurement

Answer strategyHow you summarize data from the data strategy
—Data cleaning—Data transformation—Estimation—Visualization—Interpretation

Answer strategyHow you summarize data from the data strategy
—Data cleaning—Data transformation—Estimation—Visualization—Interpretation
—Document selection—Coding procedures—Narrative
Declaring a design in practiceR package DeclareDesign
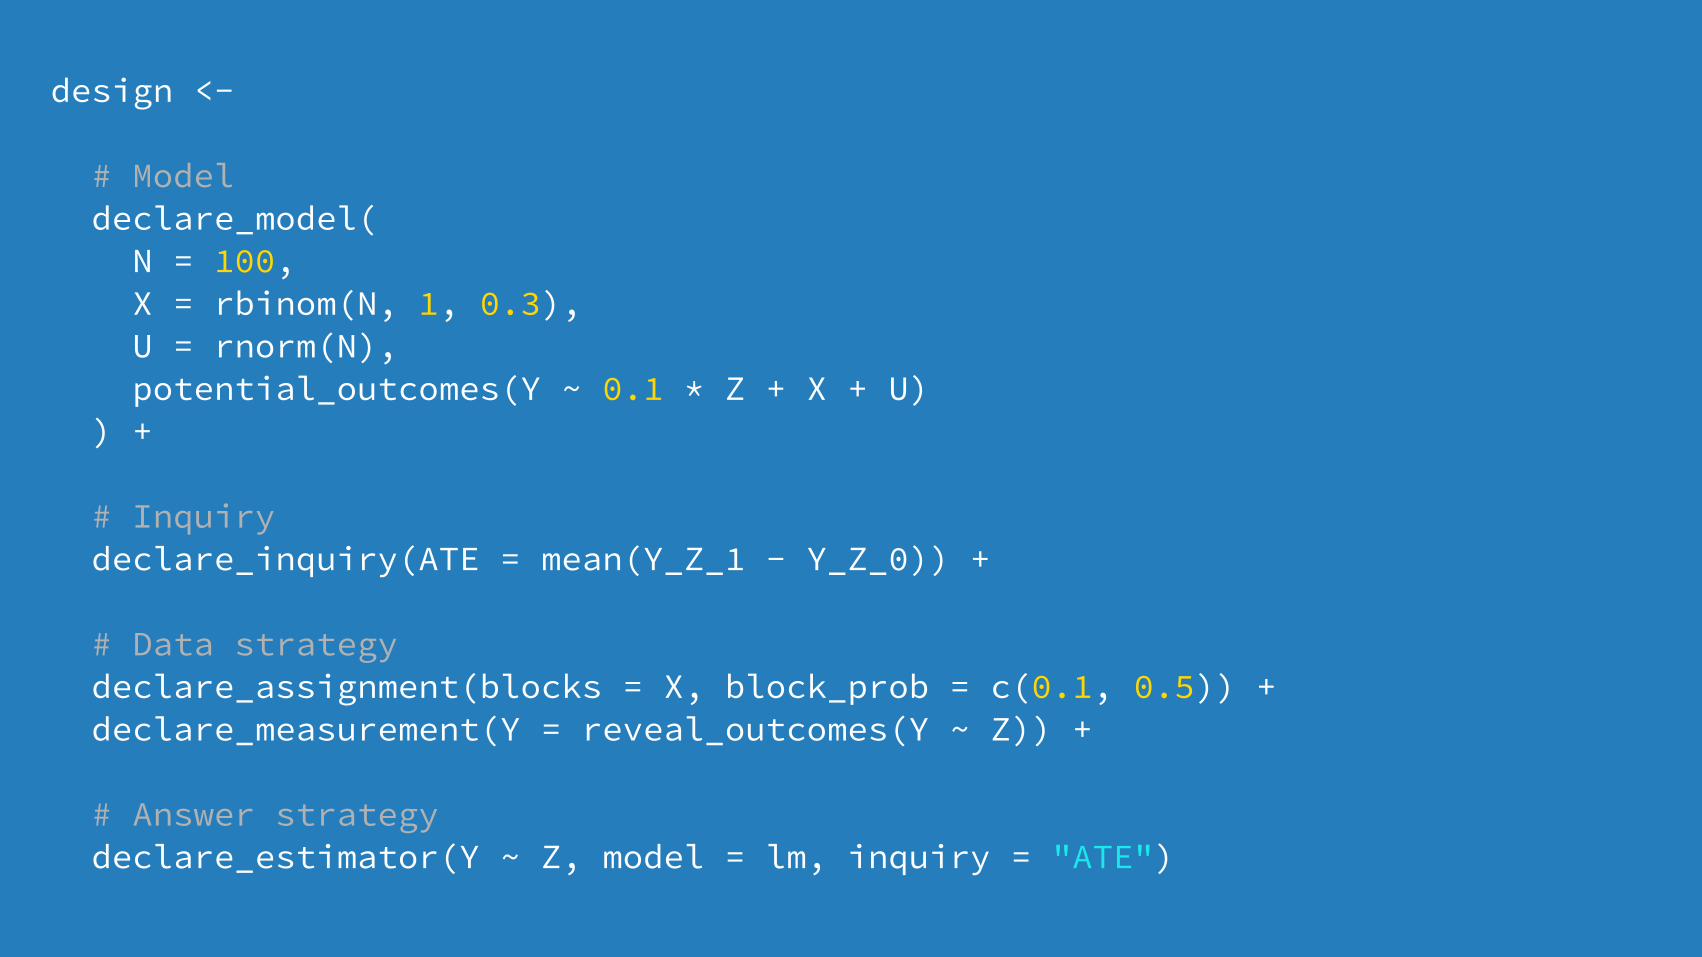
design <-
# Model declare_model( N = 100, X = rbinom(N, 1, 0.3), U = rnorm(N), potential_outcomes(Y ~ 0.1 * Z + X + U) ) +
# Inquiry declare_inquiry(ATE = mean(Y_Z_1 - Y_Z_0)) +
# Data strategy declare_assignment(blocks = X, block_prob = c(0.1, 0.5)) + declare_measurement(Y = reveal_outcomes(Y ~ Z)) +
# Answer strategy declare_estimator(Y ~ Z, model = lm, inquiry = "ATE")

Draw simulated data
draw_data(design)ID X U Y_Z_0 Y_Z_1 Z Z_prob Y
001 1 0.66 1.66 1.76 0 0.5 1.66
002 1 -1.69 -0.69 -0.59 1 0.5 -0.59
003 0 -1.03 -1.03 -0.93 0 0.9 -1.03
004 1 -0.62 0.38 0.48 0 0.5 0.38
005 0 0.03 0.03 0.13 0 0.9 0.03
006 1 0.34 1.34 1.44 0 0.5 1.34

Draw mock estimates
draw_estimates(design)
est std.err statistic p.value conf.lo conf.hi
0.64 0.29 2.22 0.03 0.07 1.22
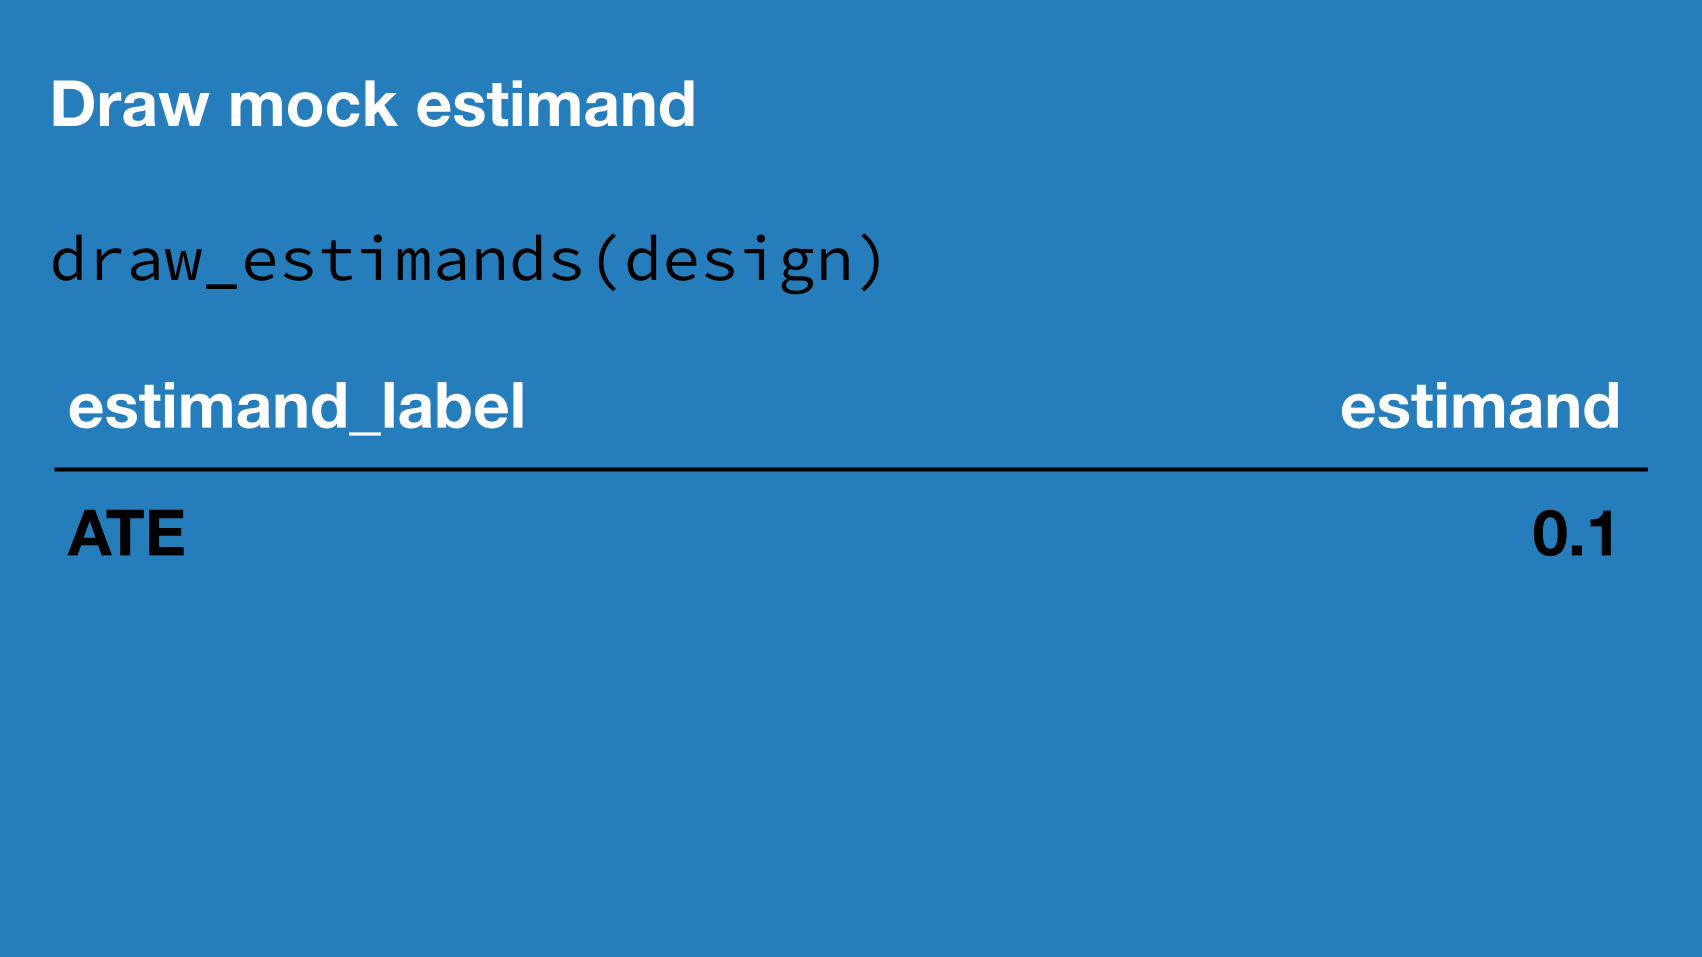
Draw mock estimand
draw_estimands(design)
estimand_label estimandATE 0.1
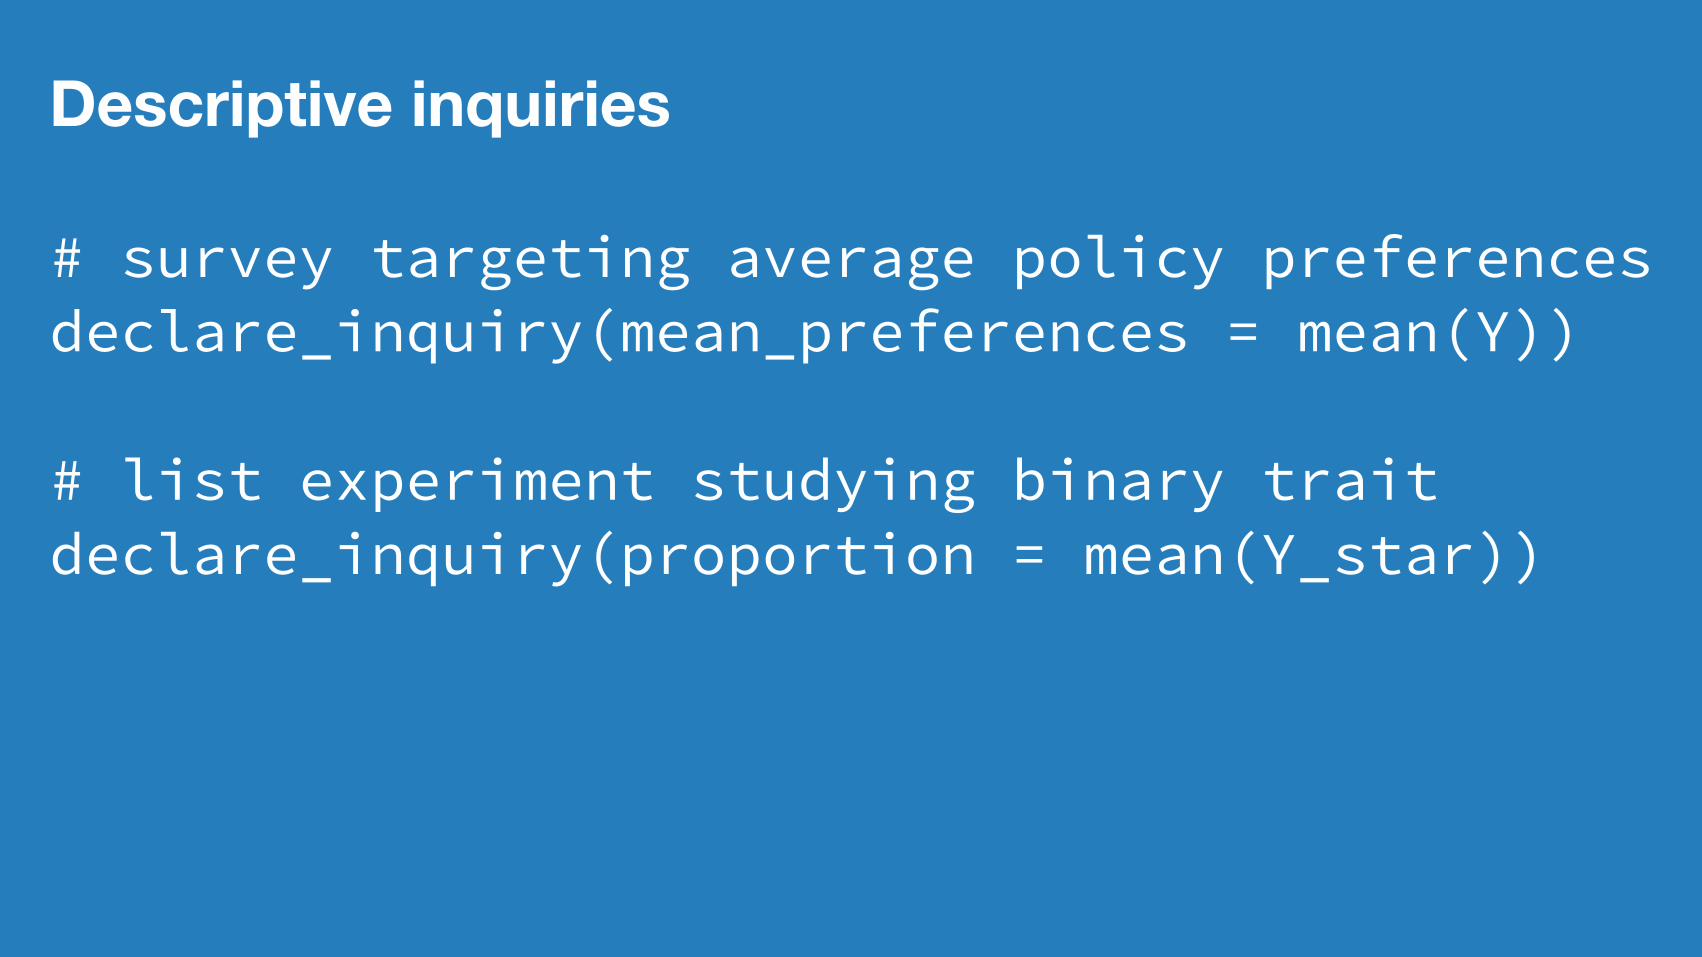
Descriptive inquiries
# survey targeting average policy preferencesdeclare_inquiry(mean_preferences = mean(Y))
# list experiment studying binary traitdeclare_inquiry(proportion = mean(Y_star))

Observational research designs
# regression discontinuitycutoff <- 0.5control <- function(X) { as.vector(poly(X, 4, raw = TRUE) %*% c(.7, -.8, .5, 1))}treatment <- function(X) { as.vector(poly(X, 4, raw = TRUE) %*% c(0, -1.5, .5, .8)) + .15}
declare_model( N = 1000, U = rnorm(N, 0, 0.1), X = runif(N, 0, 1) + U - cutoff, potential_outcomes(Y ~ Z * treatment(Z) + (1 - Z) * control(X) + U), Z = 1 * (X > 0) ) + declare_measurement(Y = reveal_outcomes(Y ~ Z))

Declare
Diagnose
Redesign
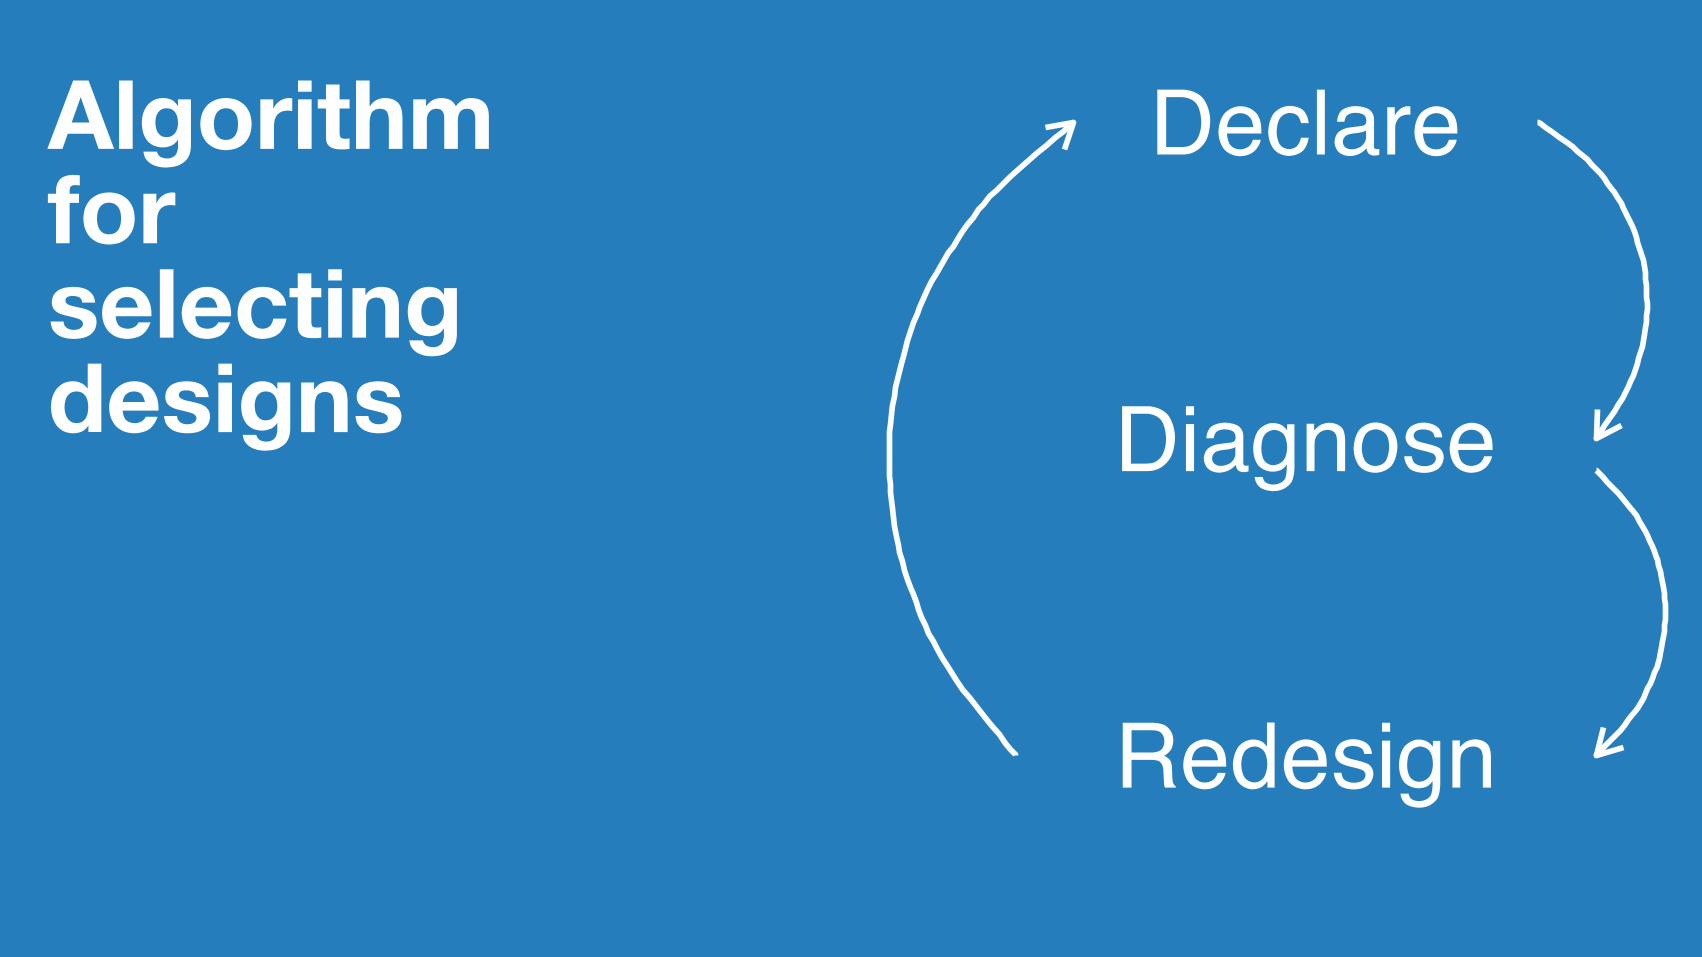
Algorithmforselectingdesigns

Declare
Diagnose
Redesign
Algorithmforselectingdesigns

Diagnosing a designWhat are the properties of a research design?
1. Through analytical expressions
2. Through simulation
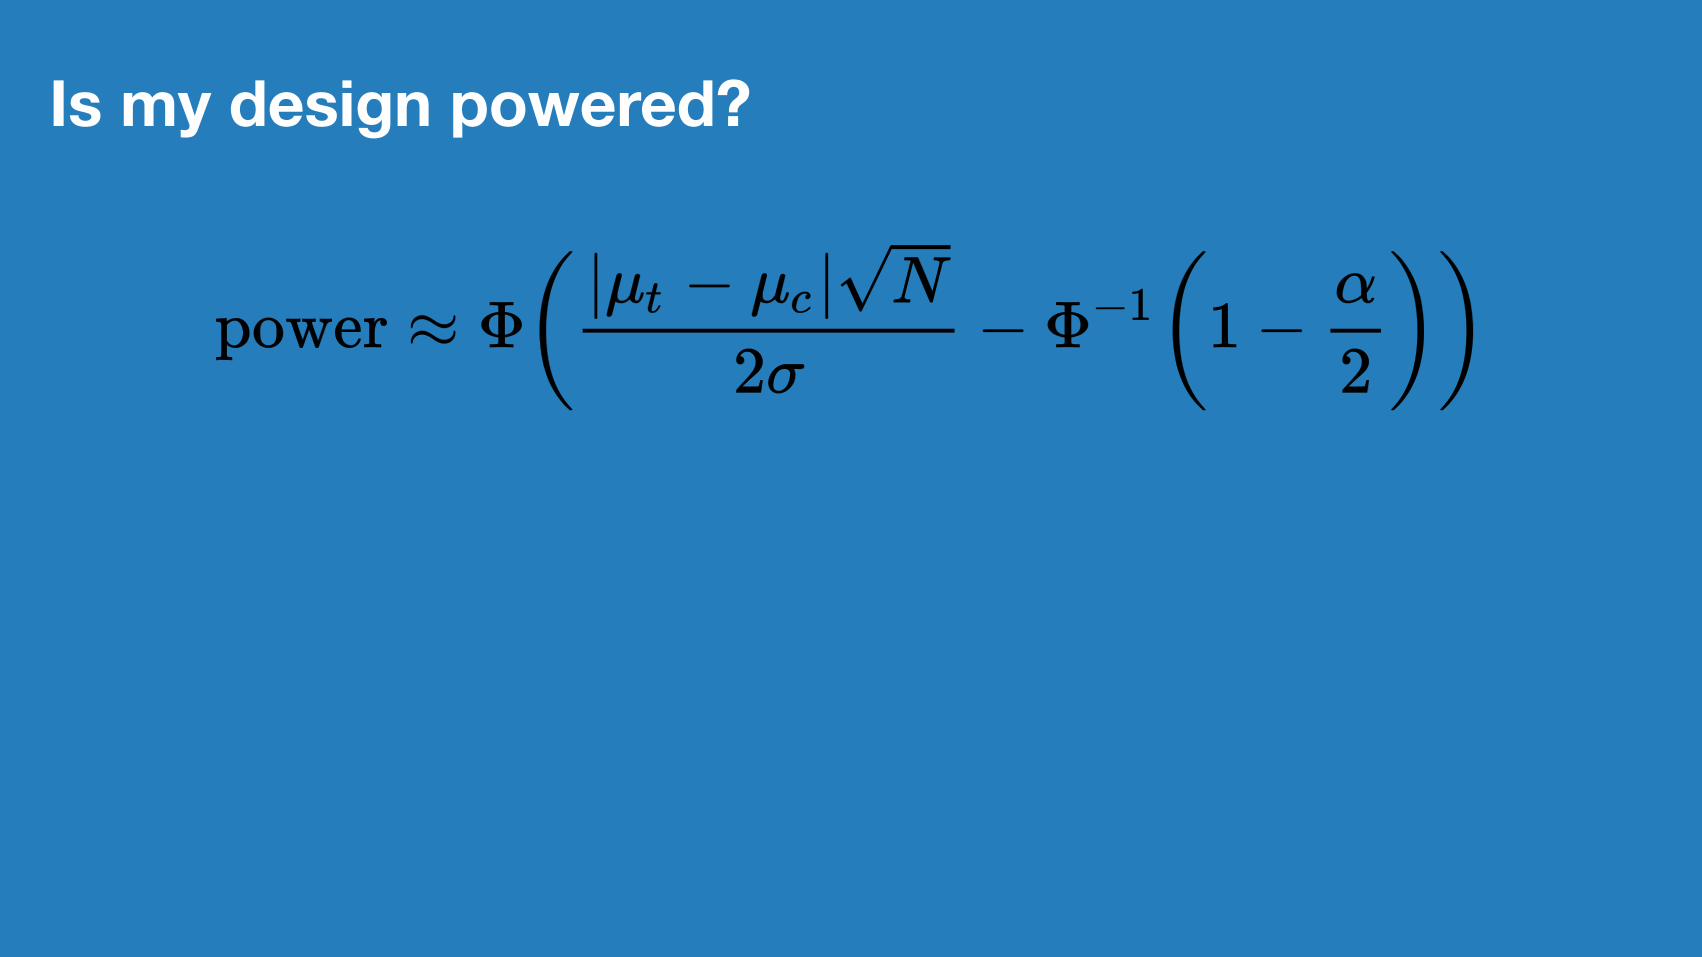
Is my design powered?
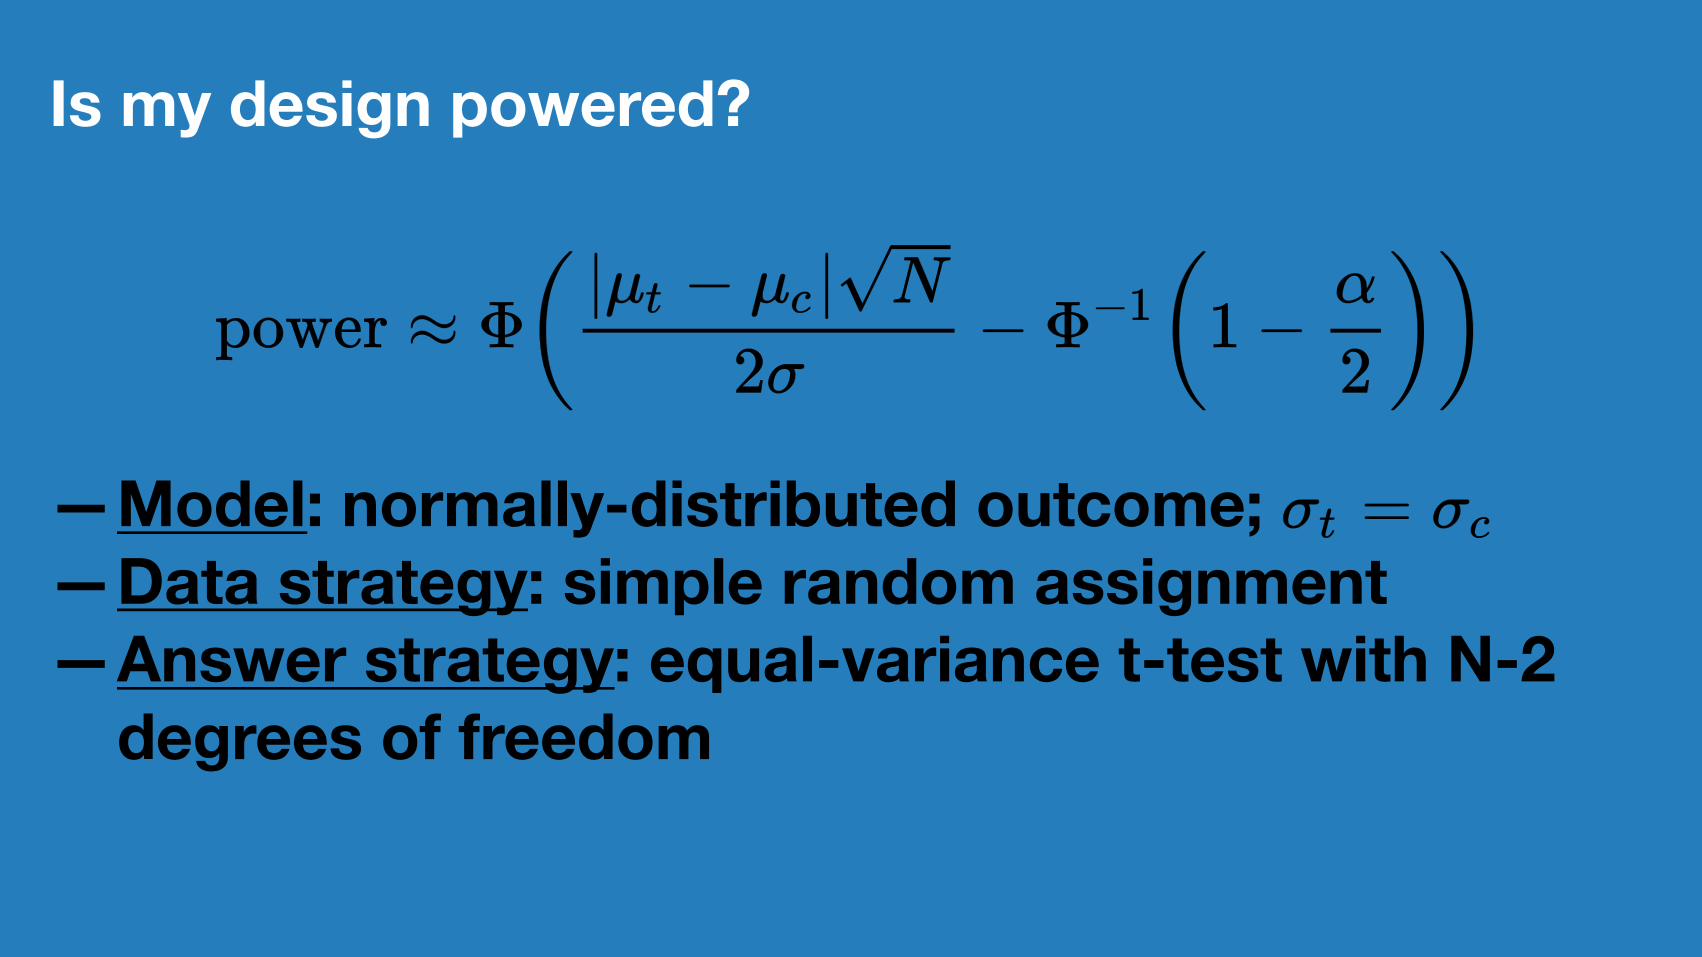
Is my design powered?
—Model: normally-distributed outcome; —Data strategy: simple random assignment—Answer strategy: equal-variance t-test with N-2
degrees of freedom
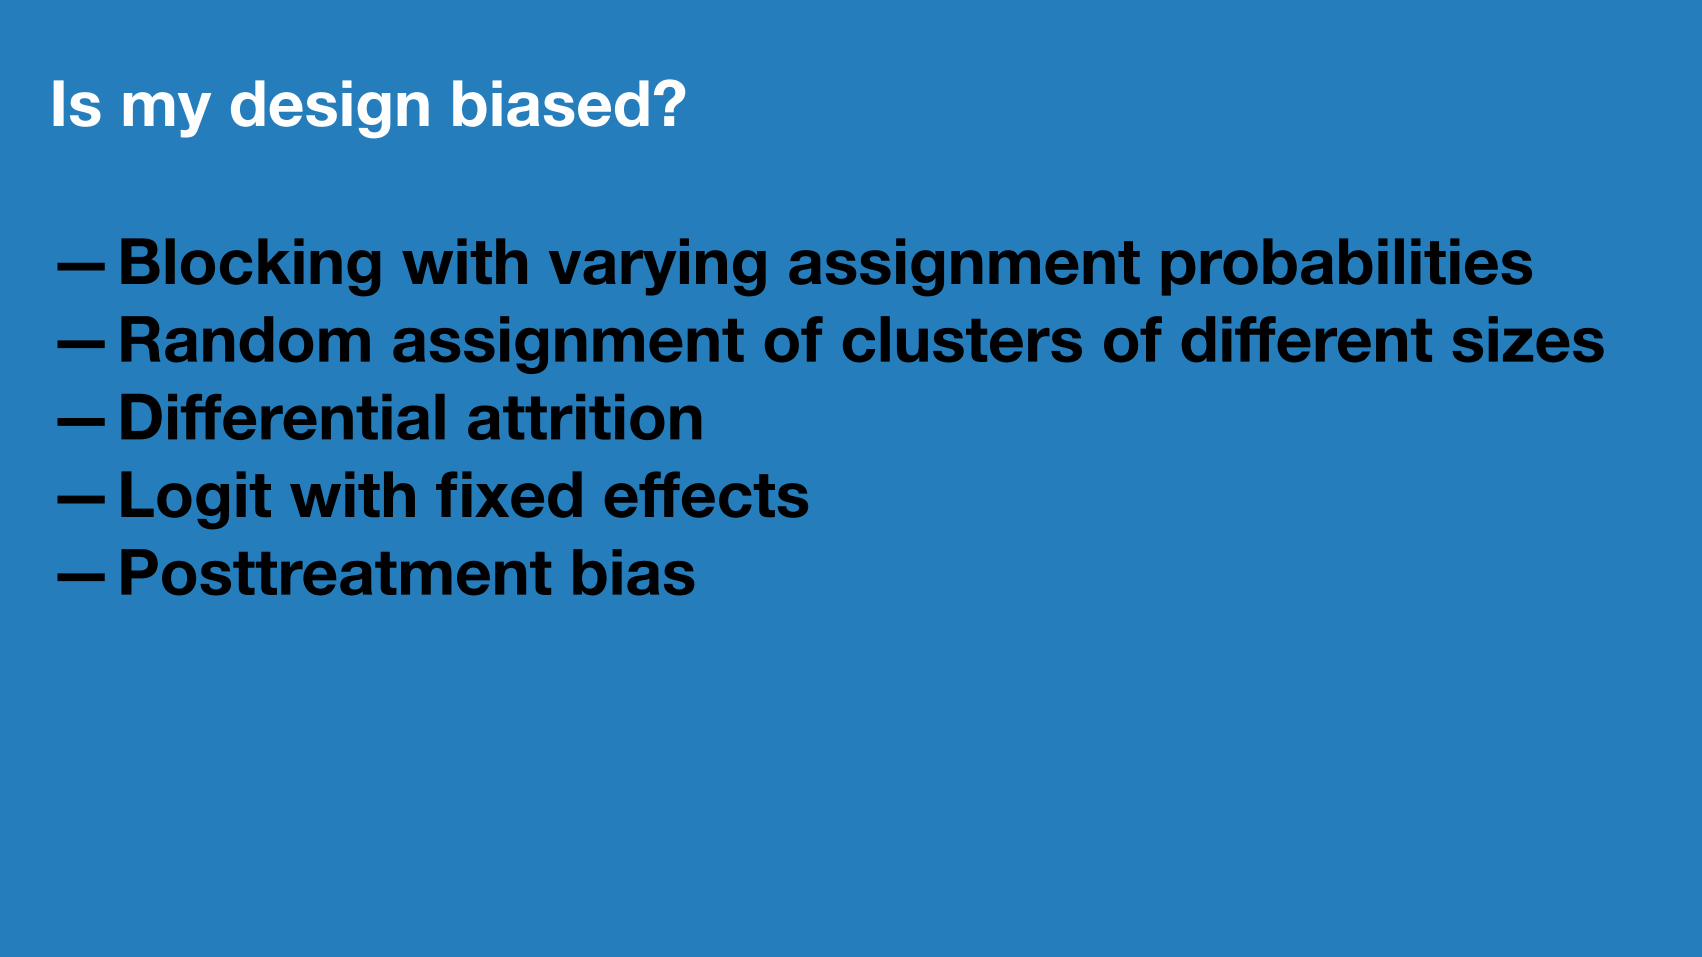
Is my design biased?
—Blocking with varying assignment probabilities—Random assignment of clusters of different sizes—Differential attrition—Logit with fixed effects—Posttreatment bias
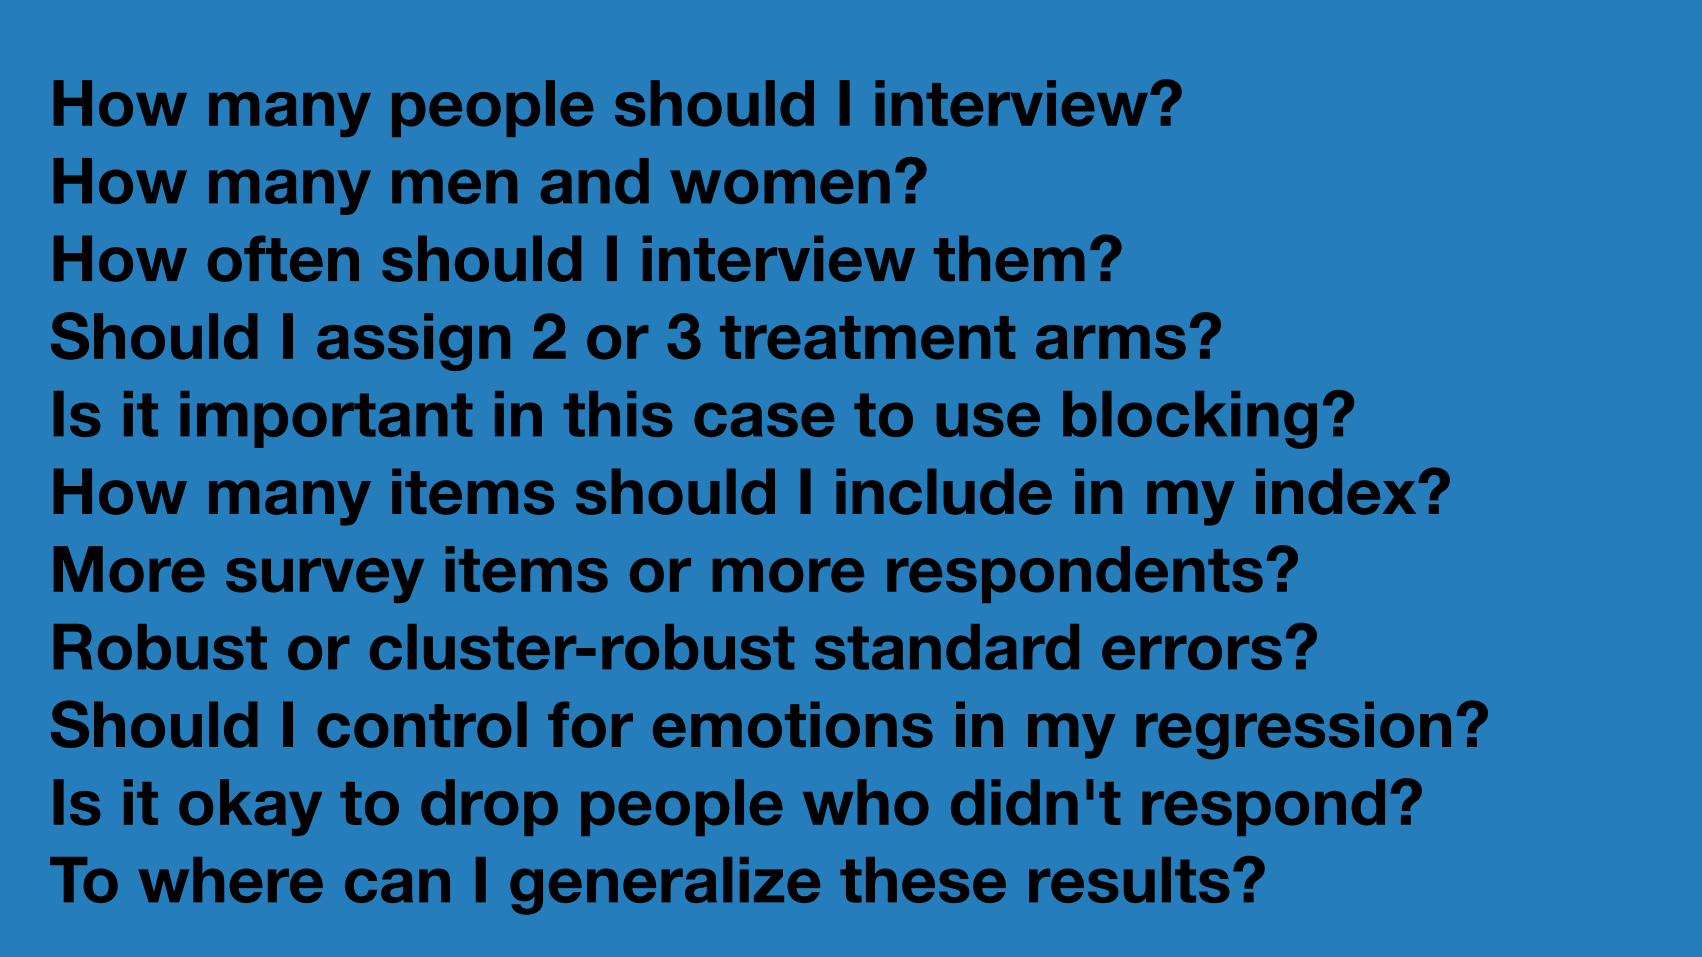
How many people should I interview?How many men and women?How often should I interview them?Should I assign 2 or 3 treatment arms?Is it important in this case to use blocking?How many items should I include in my index?More survey items or more respondents?Robust or cluster-robust standard errors?Should I control for emotions in my regression?Is it okay to drop people who didn't respond?To where can I generalize these results?
Diagnosing a design through simulation
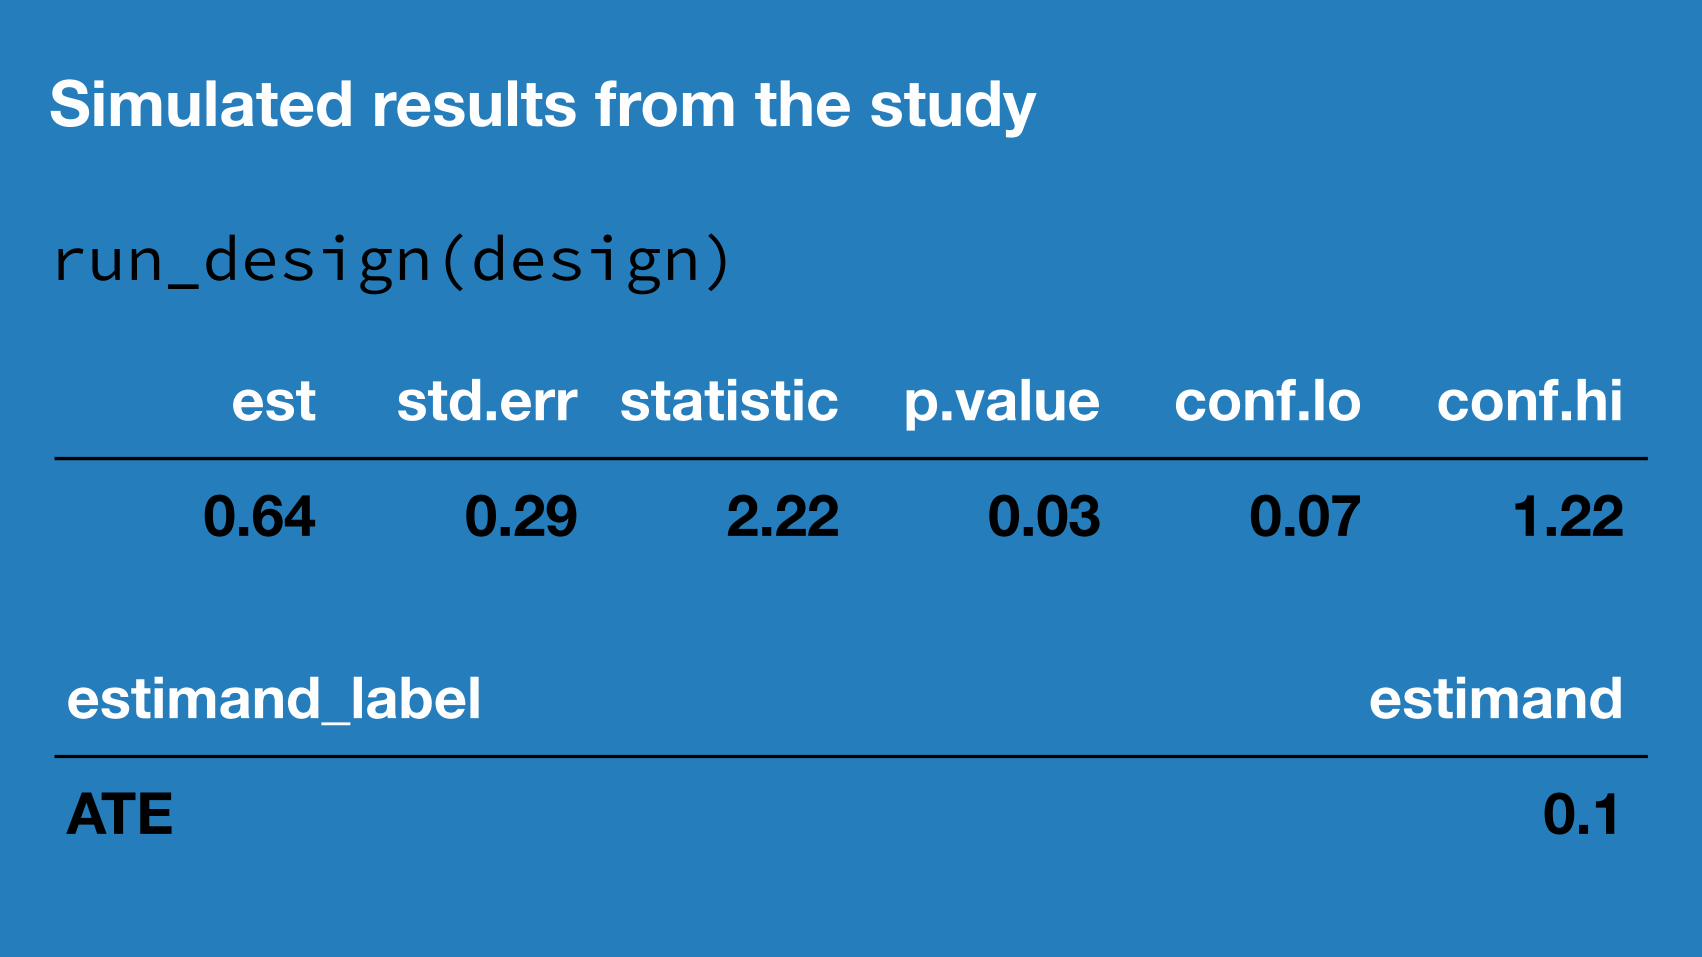
Simulated results from the study
run_design(design)
est std.err statistic p.value conf.lo conf.hi
0.64 0.29 2.22 0.03 0.07 1.22
estimand_label estimandATE 0.1

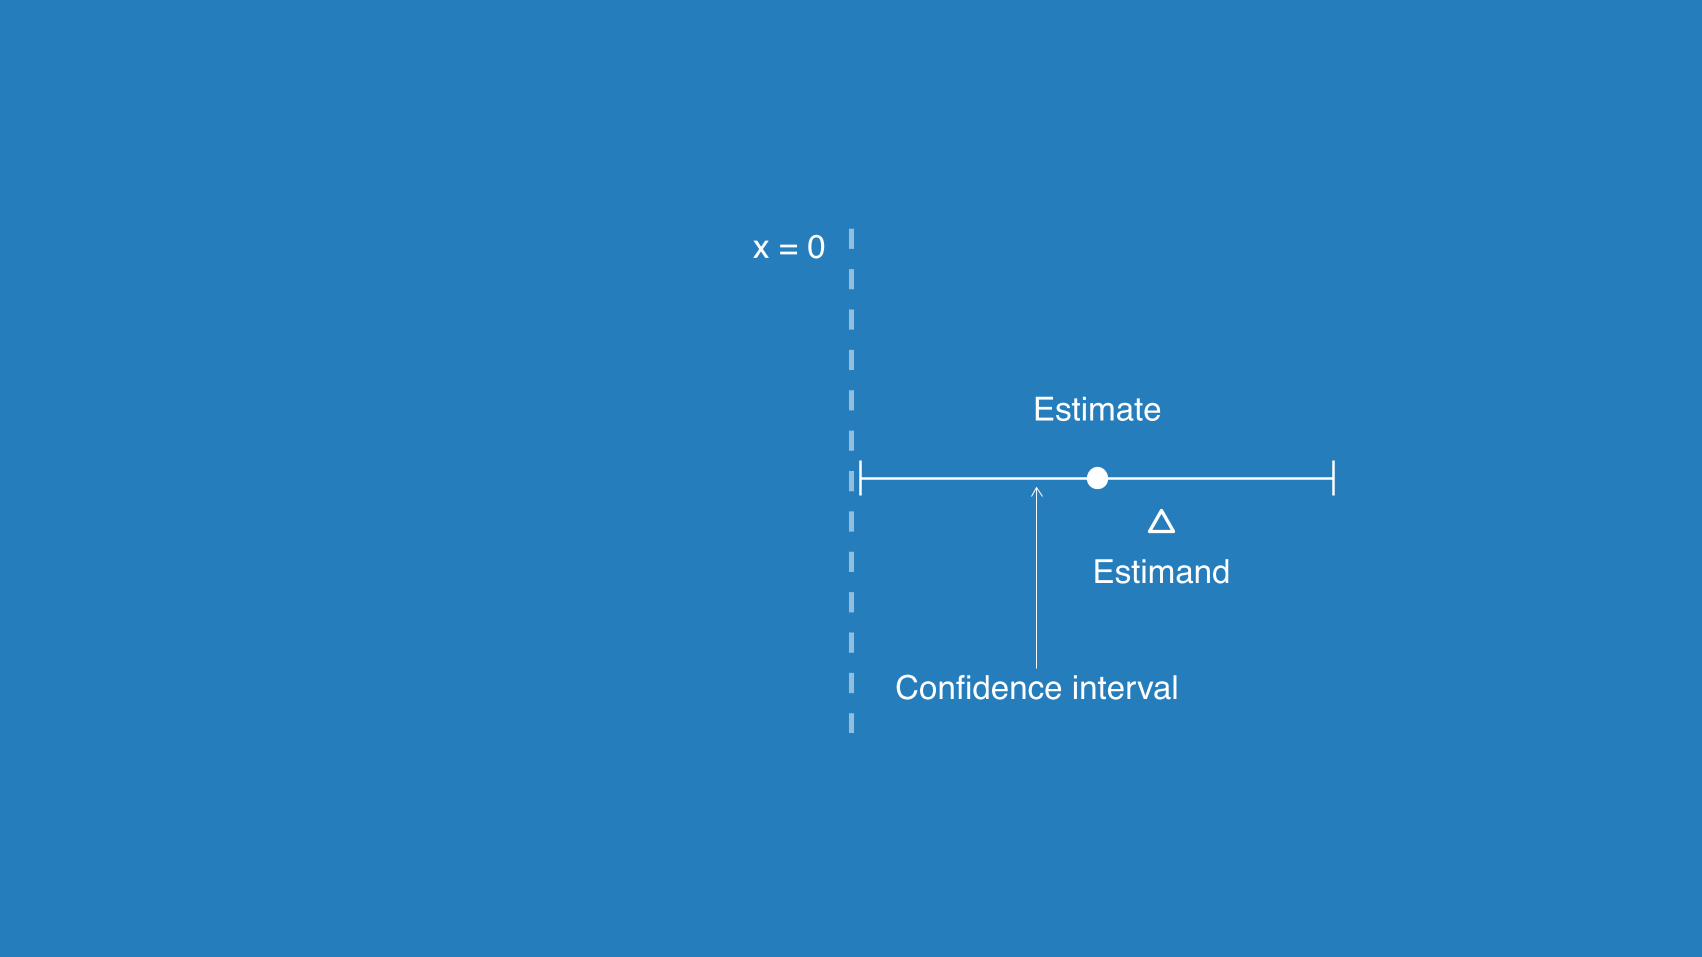
Estimand
Estimate
x = 0
Confidence interval

{Error
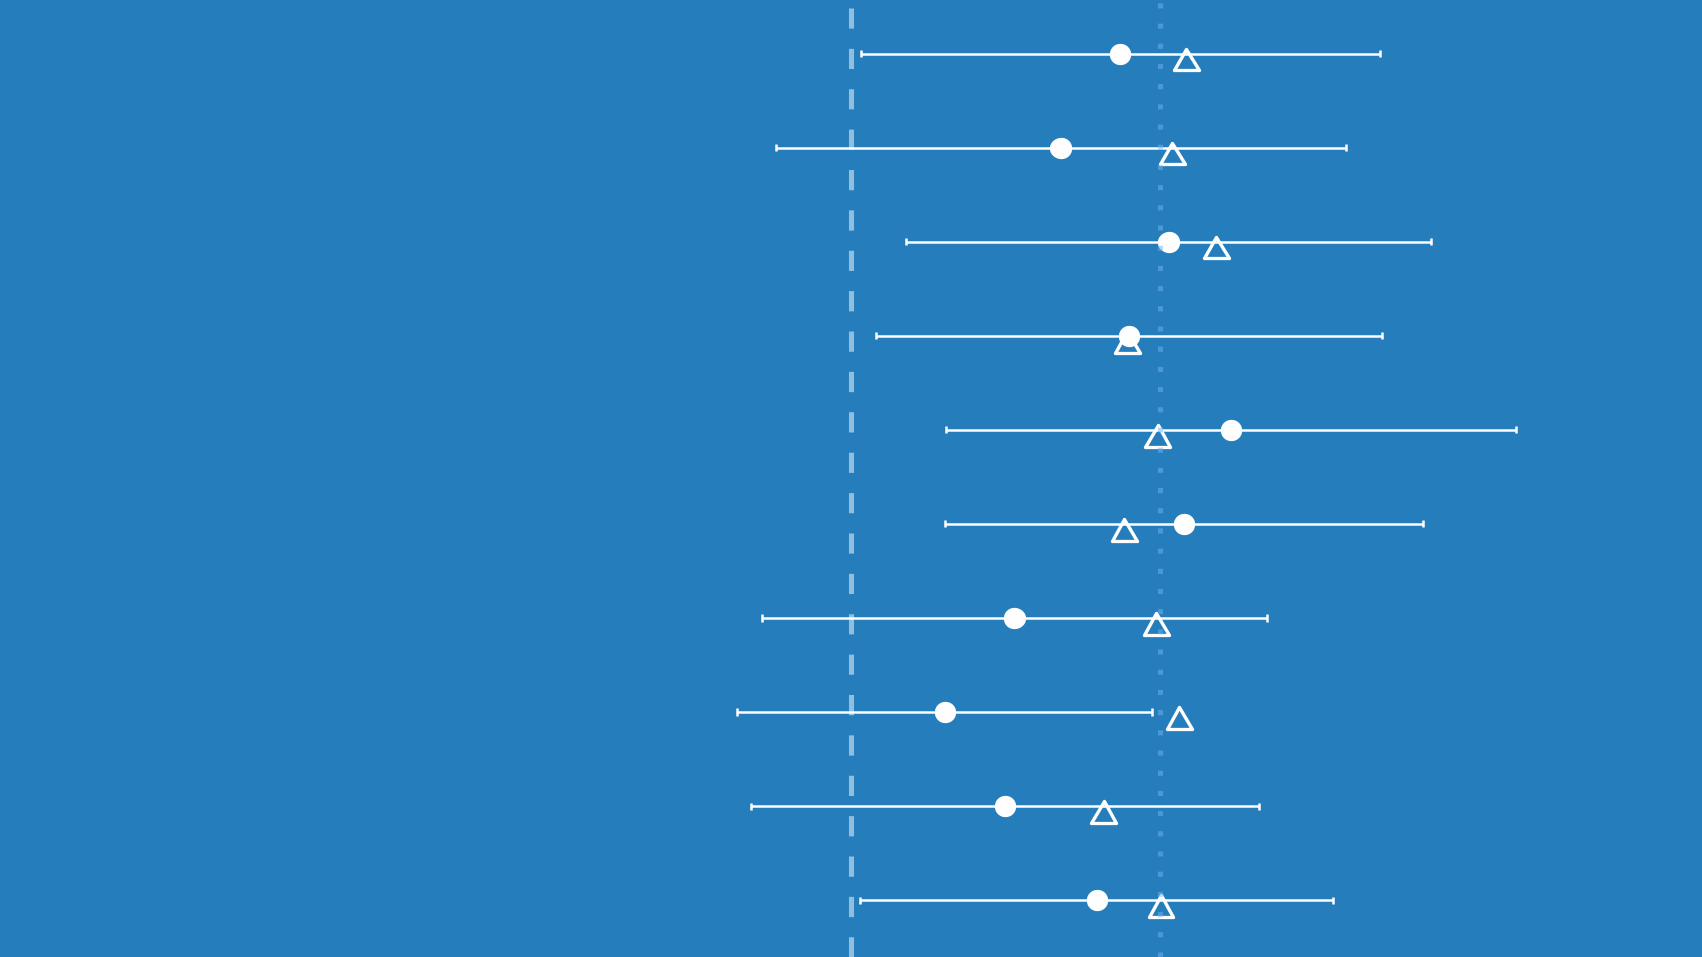
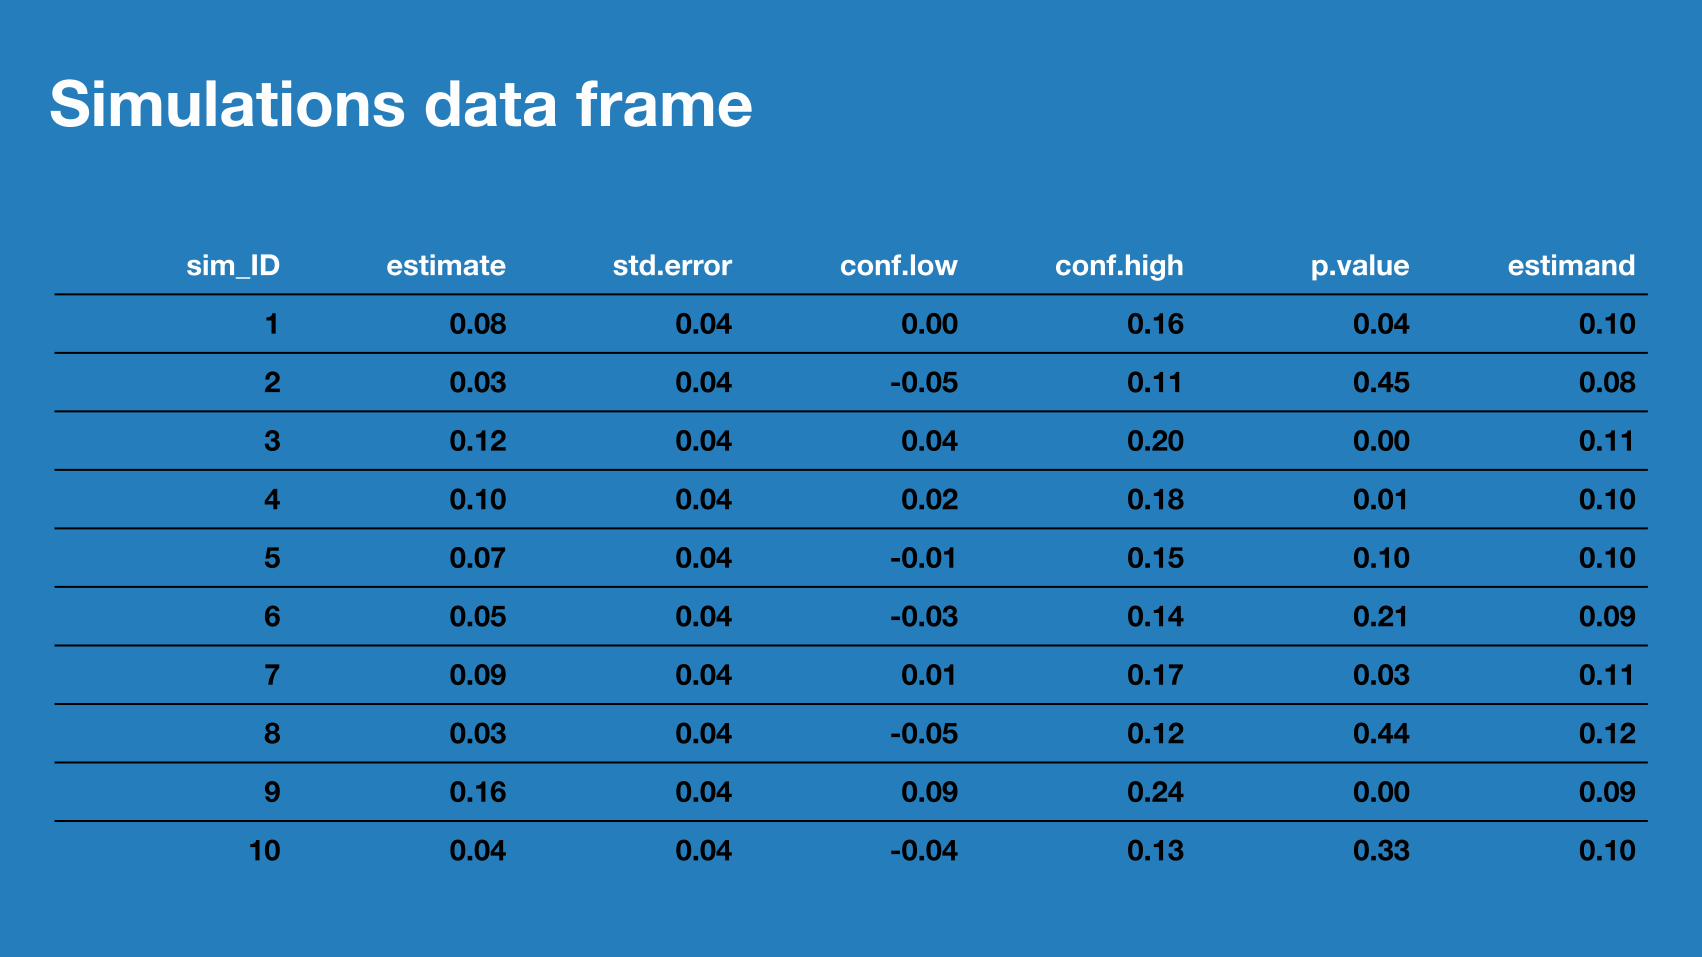
Simulations data frame
sim_ID estimate std.error conf.low conf.high p.value estimand
1 0.08 0.04 0.00 0.16 0.04 0.10
2 0.03 0.04 -0.05 0.11 0.45 0.08
3 0.12 0.04 0.04 0.20 0.00 0.11
4 0.10 0.04 0.02 0.18 0.01 0.10
5 0.07 0.04 -0.01 0.15 0.10 0.10
6 0.05 0.04 -0.03 0.14 0.21 0.09
7 0.09 0.04 0.01 0.17 0.03 0.11
8 0.03 0.04 -0.05 0.12 0.44 0.12
9 0.16 0.04 0.09 0.24 0.00 0.09
10 0.04 0.04 -0.04 0.13 0.33 0.10
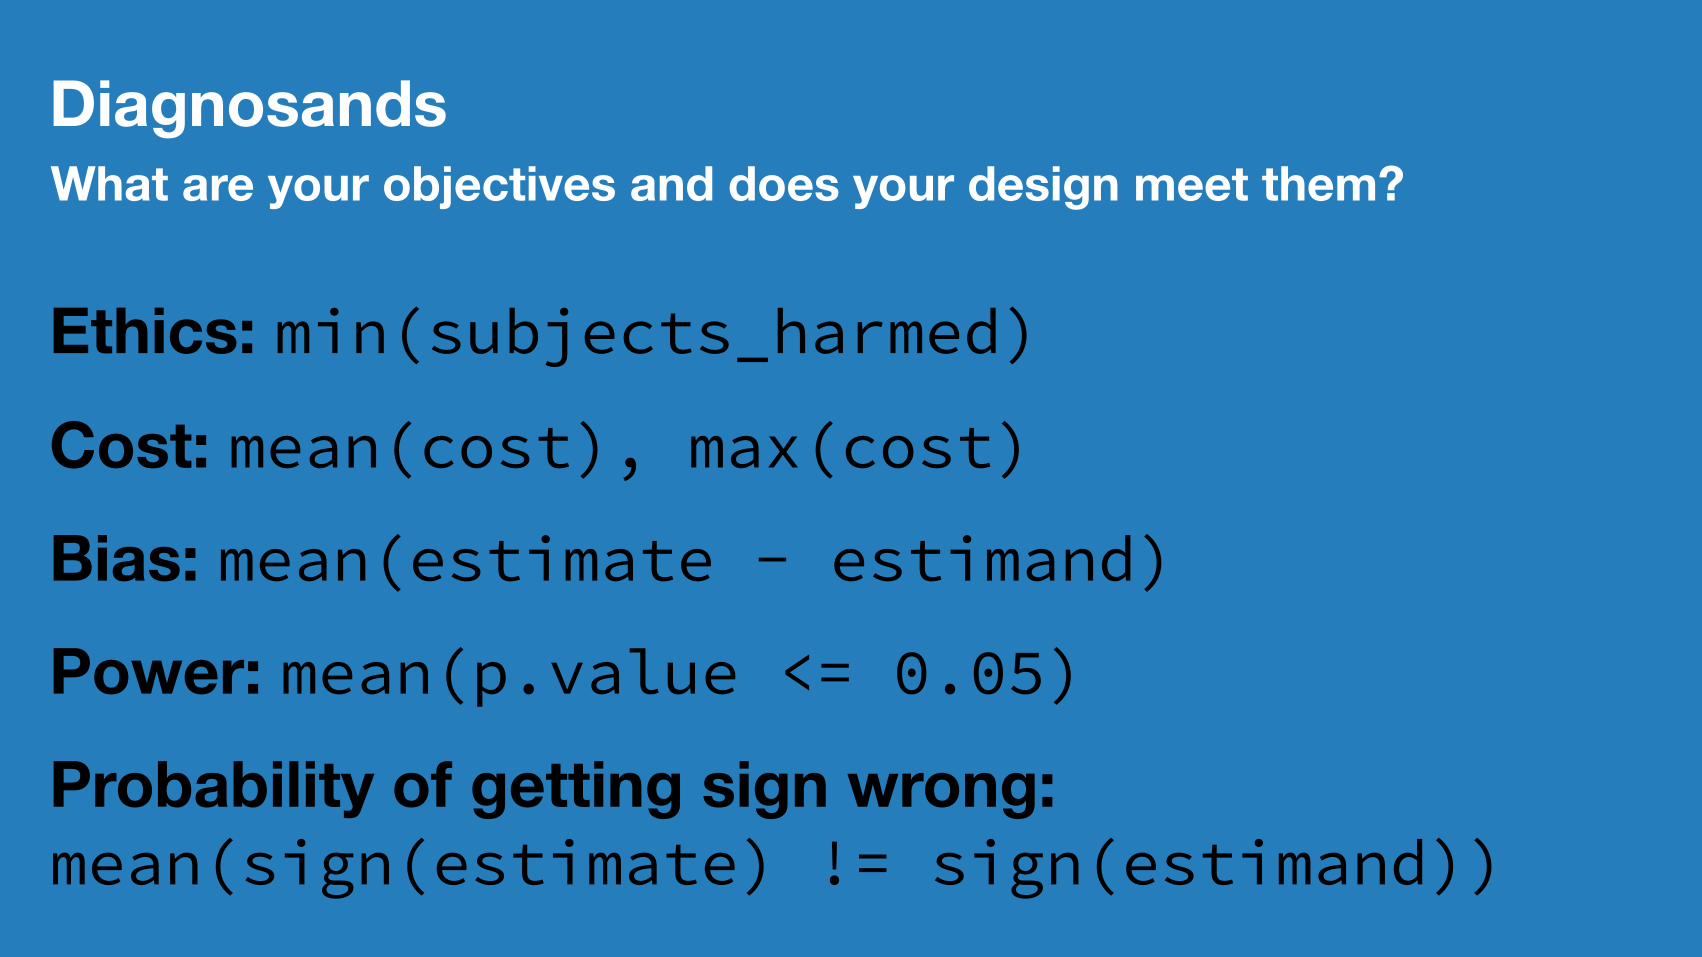
DiagnosandsWhat are your objectives and does your design meet them?
Ethics: min(subjects_harmed)Cost: mean(cost), max(cost)Bias: mean(estimate - estimand)Power: mean(p.value <= 0.05)Probability of getting sign wrong: mean(sign(estimate) != sign(estimand))
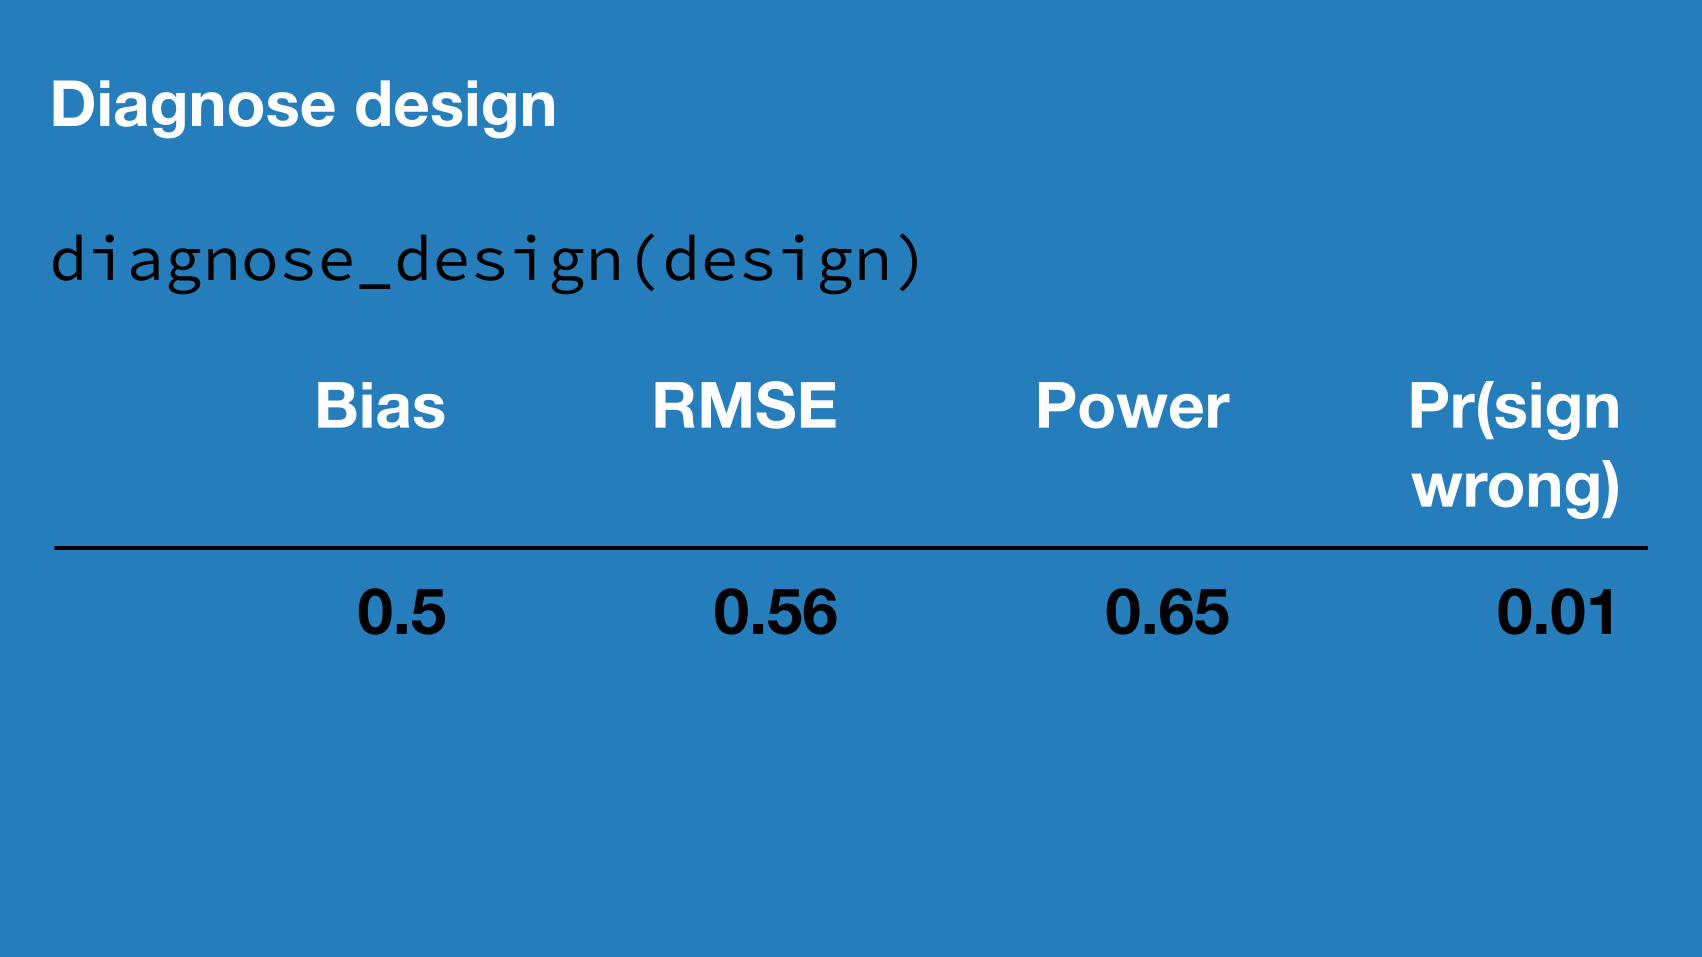
Diagnose design
diagnose_design(design)
Bias RMSE Power Pr(sign wrong)
0.5 0.56 0.65 0.01
Declare
Diagnose
Redesign
Algorithmforselectingdesigns
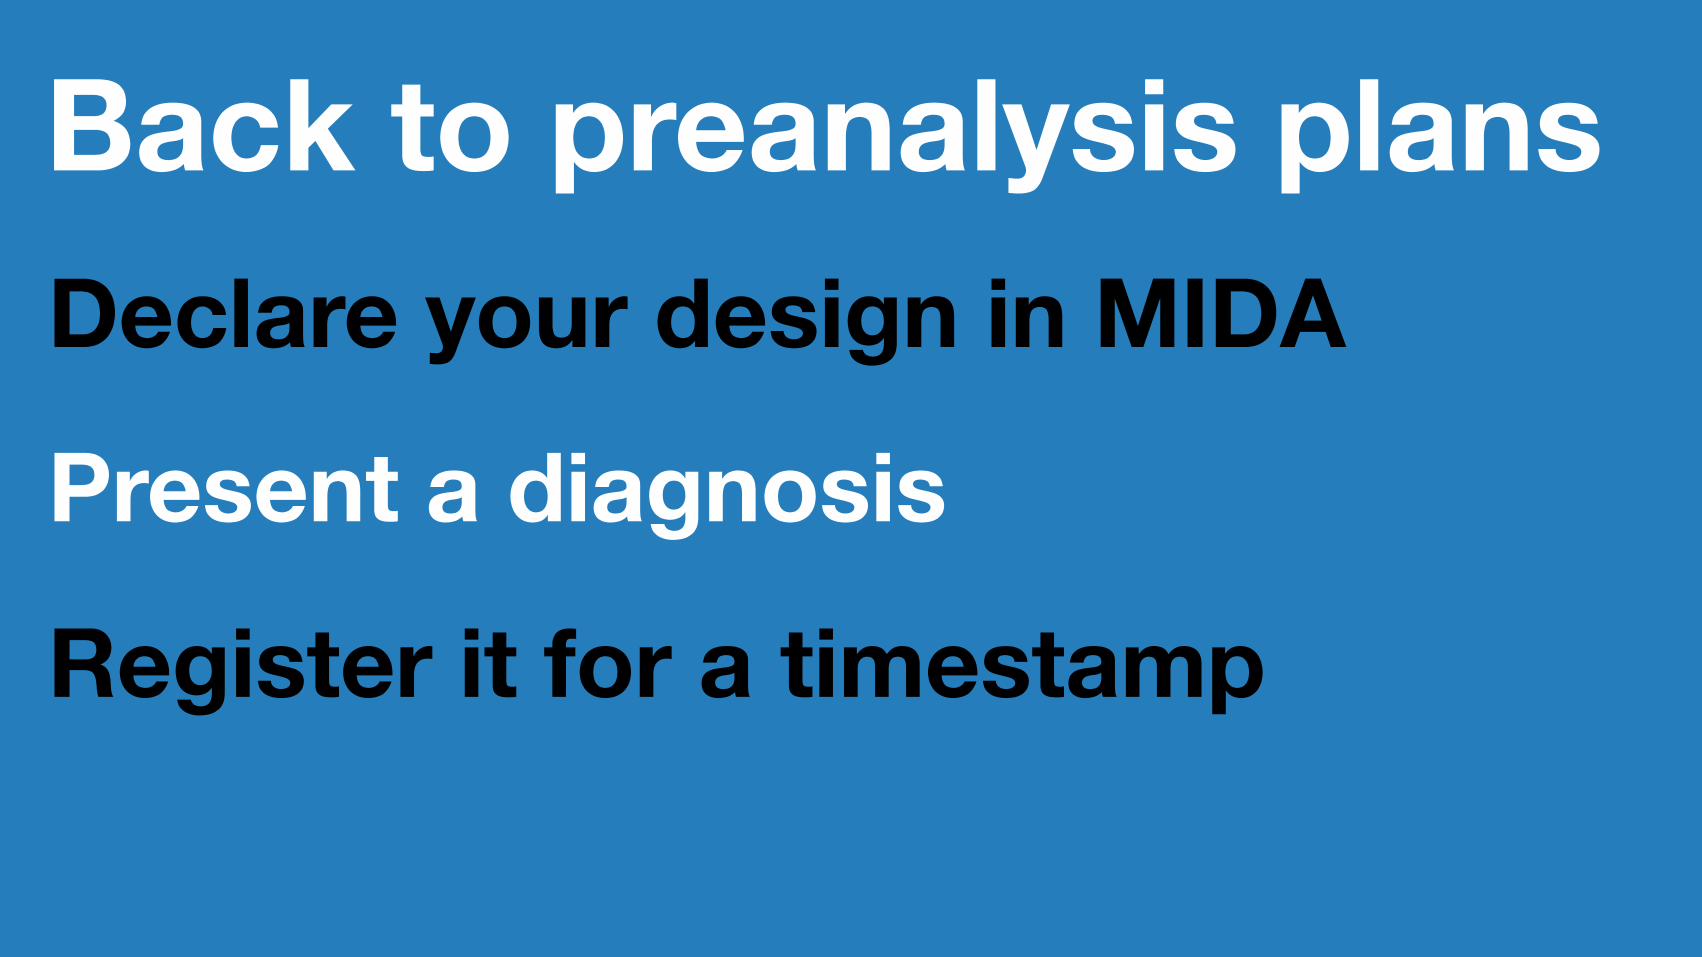
Back to preanalysis plansDeclare your design in MIDA
Present a diagnosis
Register it for a timestamp

Research lifecycleBrainstorming
PlanningRealization
Integration
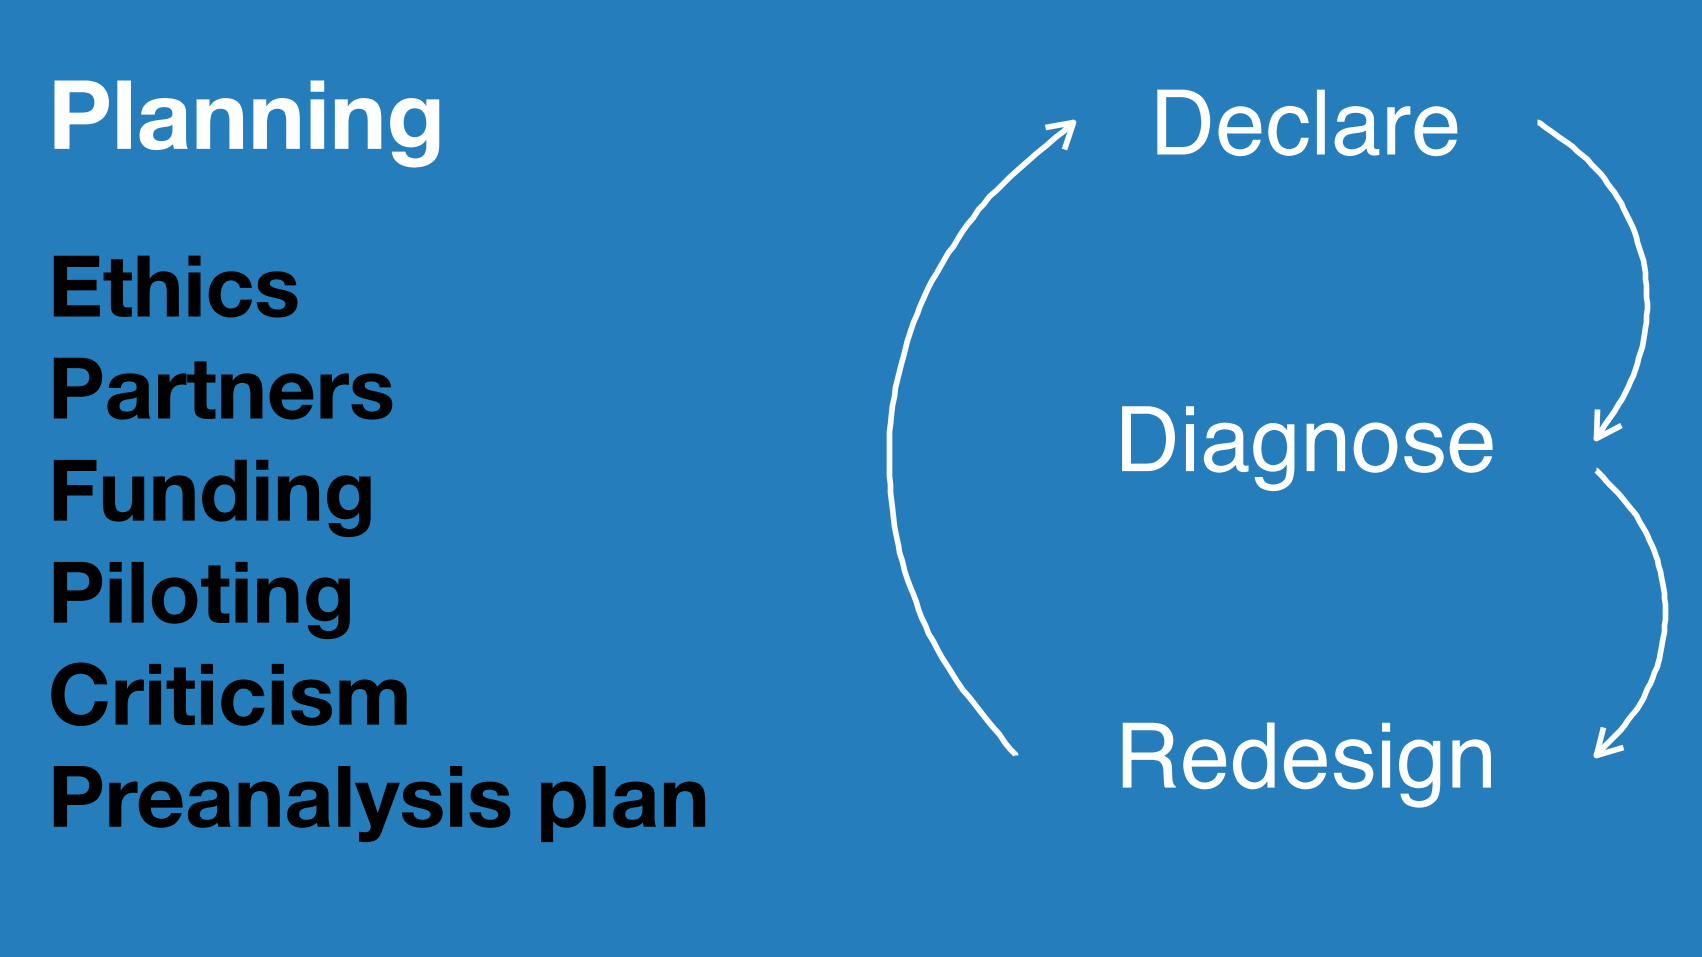
Declare
Diagnose
Redesign
PlanningEthicsPartnersFundingPilotingCriticismPreanalysis plan
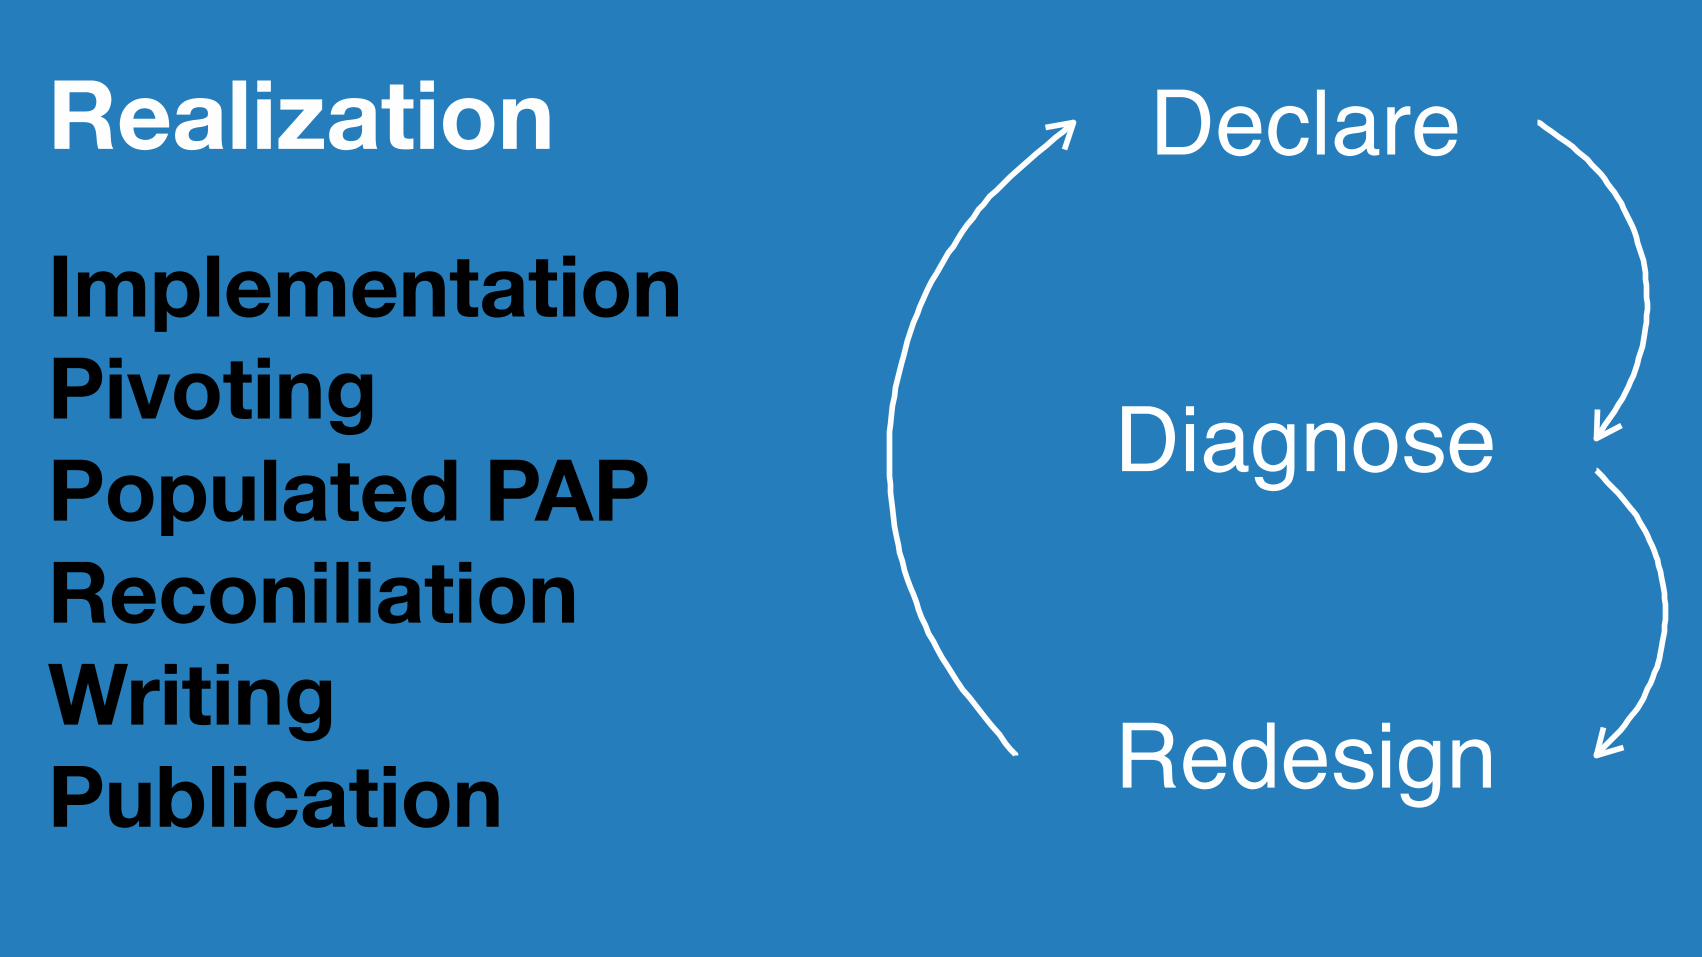
Declare
Diagnose
Redesign
Realization
ImplementationPivotingPopulated PAPReconiliationWritingPublication
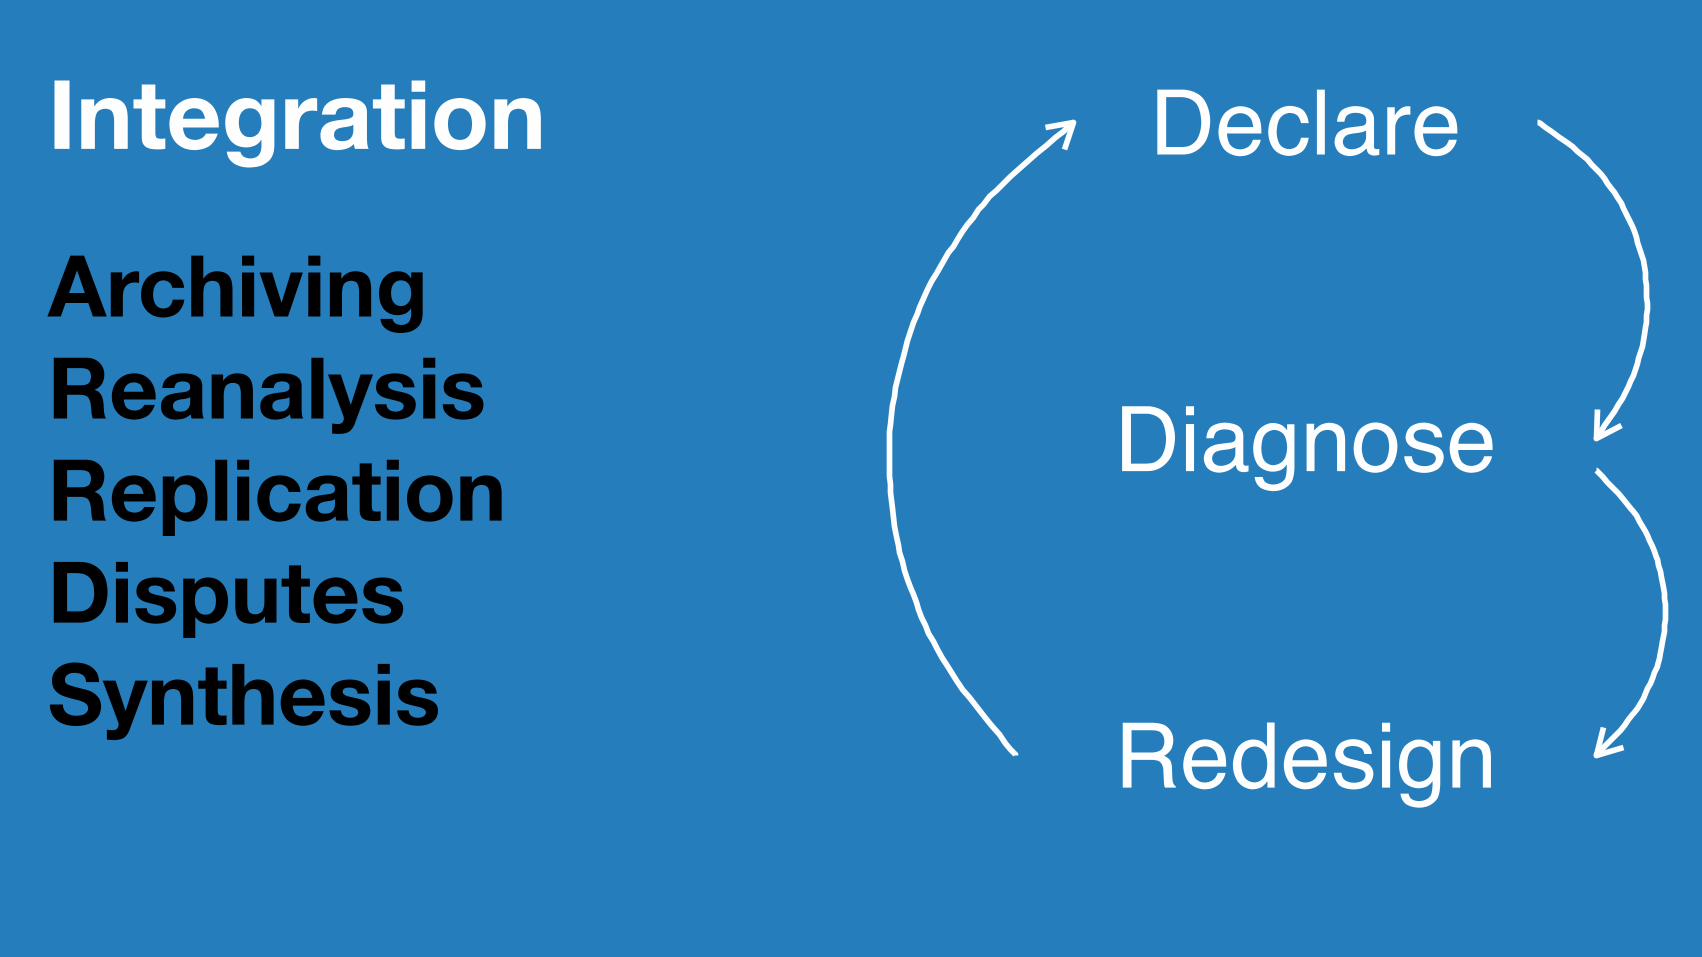
Declare
Diagnose
Redesign
Integration
ArchivingReanalysisReplicationDisputesSynthesis

Declare
Diagnose
Redesign
We're caught between higher research standards and lack of ideas for how to assess and communicate about designs
Take awaysMinimum:Write a plan to change your plan
Medium: Register your plan
Maximum:Declare in code, diagnose

Thank youMore at declaredesign.org
Big team effort: Clara Bicalho, Jasper Cooper, Neal Fultz, Sisi Huang, Markus Konrad, Lily Medina, Aaron Rudkin, Luke Sonnet, and John Ternovski
Supported by EGAP and the Arnold Foundation