between promise and performance: science and technology
TRANSCRIPT

1
Between Promise and Performance: Science and Technology Policy
Implementation through Governance Networks
Travis A. Whetsell 1, Michael J. Leiblein 2, Caroline S. Wagner 3
1 Department of Public Policy & Administration, Florida International University, Miami, Florida, [email protected] 2 Fisher College of Business, Ohio State University, Columbus, Ohio 3 John Glenn College of Public Affairs, Ohio State University, Columbus, Ohio
Abstract: This research analyzes the effects of U.S. science and technology policy on a global strategic
alliance network for research and development. During the mid-1980s the U.S. high-technology sector
appeared to be collapsing. Industry leaders and policymakers moved to support and protect U.S. firms by
creating a program called Sematech. While many scholars regard Sematech as a success, how the
program succeeded remains unclear. This study examines the role of an intermediate network mechanism
residing between policy and performance. The general proposition is that governments might act to
enhance inter-organizational cooperation and firm performance for public ends. This study combines
network analysis and longitudinal regression techniques to test the effects of policy on firm network
position and technological performance in an unbalanced panel of semiconductor firms between 1986 and
2001. This research suggests governments might achieve policy through inter-organizational innovations
aimed at the development and administration of robust governance networks.
Keywords: science and technology policy; public policy; public administration; social network;
governance network; inter-organizational network; social capital; strategic alliance; transaction cost
economics; resource-based view; semiconductor industry; SEMATECH
Acknowledgements: We are thankful for comments from Trevor Brown, Anand Desai, Noshir
Contractor, Michael Siciliano, Allan Rosenbaum, and Philip Russo. Data for this article were originally
collected with support by the National Science Foundation under Grant #1133043.

2
1. Introduction
Government programs for science and technology (S&T) operate under conditions of uncertainty
and complexity different from other kinds of governance frameworks (Hall and Lerner, 2010).
Many studies on S&T policy rely on theory developed from research programs in economics
(Malerba, 2002; Nelson and Winter, 1982), business and organizational studies (Teece, Pisano,
and Shuen, 1997), and patenting activities (Hall and Ziedonis, 2001). Work in this area often
lacks an emphasis from public policy and administration. Bringing this perspective to the fore,
this article synthesizes disparate literatures, combining elements from governance and policy
networks (e.g. Klijn and Koopenjan 2015; Ansell and Gash 2007; Provan and Kenis, 2008) with
elements from organization theory and strategic management (e.g. Eisenhardt and Schoonhoven,
1996; Stuart 2000). Insights from these literatures are leveraged to analyze an exemplar case of
government intervention in the high-technology sector.
This study analyzes the implementation of U.S. technology policy during the early
evolution of a cooperative research and development (R&D) network in the semiconductor
industry between 1986 and 2001. The focus is on a U.S. Department of Defense (DOD)
sponsored consortium, called Sematech, its hypothesized effects on an emerging R&D alliance
network, and hypothesized effects on technological performance. The Sematech consortium was
formed to provide support for the U.S. based semiconductor industry during the mid-1980s
(Macher, Mowery, and Hodges 1998; Browning and Shetler 2000). Many scholars suggest the
policy experiment was a success, as the downward trend for U.S. semiconductor market share
was reversed and the industry remains among the top five U.S. exports with sales valued at
roughly $165 billion, capturing 50% of the global market in 2015 (SIA Databook, 2016).

3
However, the case presents an interesting theoretical puzzle. A view from public
administration might suggest that public support for the consortium lowered R&D costs for
private firms, overlooking the relevance of synergies created through an evolving network of
relationships. Conversely, a business view might suggest that strategic alliances enhance access
to resources for competitive advantage, downplaying government support, protection from
foreign participants, and ignoring a major political crisis with national security overtones. Putting
the puzzle together requires a pluralistic integration of disparate disciplines and theories
(Whetsell 2013). The research question of this article is, how did Sematech achieve its success
given a range of potential theoretical explanations? An overlooked element is the intermediate
network mechanism residing between S&T policy and outcomes. An empirical analysis of this
mechanism, as well as its linkages to policy and performance, provides insights into the specific
case but also has more general implications for government investment in science and
technology.
The theoretical argument of this article is that cooperative governance structures may be
useful for addressing market failures on volatile technological landscapes. The more specific
theoretical logic suggest that the Sematech consortium represents a mode of network governance
(e.g. Klijn and Koopenjan 2015), structured as a network administrative organization (e.g.
Provan and Kenis 2008), which decreased the costs of cooperation (e.g. Oxley, 1997), improved
access to complementary resources for innovation (e.g. Barney 1991; Eisenhardt and
Schoonhoven, 1996), and enhanced the social capital and cooperative capacities of participating
organizations for competitive advantage (e.g. Ahuja 2000; Stuart 2000; Zaheer and Bell 2005).
The empirical approach of this study is to test hypothesized effects of Sematech membership on
the network position of member firms, as well as test hypothesized effects of enhanced network

4
position on firm level technological innovation. The basic model is that the performance effects
of Sematech flow through network position. In addition, this research also tests for spillover
effects on strategic allies and potential effects of DOD exit from the consortium.
The following section briefly describes the historical context of the case necessary to
establish a timeline of events. Section three synthesizes a set of theories from the public and
private sectors to suggest hypotheses. Section four presents the data collection and analysis
methods. Section five shows the results of the analysis. Section six discusses the implications of
the results. Finally, we close with some concluding remarks about the subject and the study.
2. Historical Context & Case Details
Government investment in science and technology (S&T) has been a central national
priority for public policy makers and administrators in the United States since at least World War
II (Bush, 1945). In economic terms, S&T are curious sorts of goods. In contrast to basic goods
and services, the uncertain and risky nature of S&T activities, as well as the difficulty of
appropriating returns on R&D, means they tend to suffer from underinvestment in private
markets, despite the more general contribution to economic growth (Arrow, 1962; Partha and
David, 1994; Stephan, 1996). Science is often defined as a public good, where other actors
cannot be excluded from appropriating its value, and many actors can make productive use of
scientific knowledge simultaneously (Samuelson, 1954; Stiglitz, 1999). These insights suggest
that pure markets do not provide the necessary resources for the conduct of basic science
(Nelson, 1959). In contrast to science, technology has characteristics that make it excludable in
many cases (Rosenberg, 1982). Technological processes and products may be patented and sold
as private goods. Thus, private returns of technology investment may be appropriated by the
5
investor. Nevertheless, pure markets for technology also tend to suffer poor incentives, high
uncertainty, and weaker appropriability of value than basic consumer goods (Arrow, 1962;
Stephan, 1996). The economic logic of S&T market failure has been a part of the rationale for
government action since early 20th century. After World War II a mission-based logic emerged
emphasizing the role of S&T in national defense and other policy or agency specific objectives.
Toward the end of the 20th century a cooperative boundary spanning logic emerged which
supported industrial policy and regional economic development (Bozeman 2000; Salter and
Martin, 2001).
In the 1980s, the pace of technological change began to challenge older models,
undermining the neoclassical distinction between public and private sectors (Smith, 1990), as
well as the assumption that technology is exogenous to the production function (Romer, 1990).
Exponential increases in technological performance and manufacturing costs accompanying the
emergence of the microprocessor led to major changes in the competitive behavior of firms in
tech-based sectors. The challenge of maintaining innovation produced significant increases in
inter-firm cooperation. Strategic alliances emerged in the 1980s across several sectors. Research
documenting increases in R&D-based alliances during this period suggest that private firms were
increasingly collaborating to reduce risk and to share costs (Hagedoorn, 2002). Further,
alterations in federal anti-trust policy, e.g. the 1984 National Cooperative Research Act, provided
a more permissive atmosphere for R&D collaboration between private sector firms (Mowery
1998).
In 1985 Japanese firms took the majority global market share of semiconductor sales.
This shocking development was an achievement of the Japanese organizational conglomerate
system, known as the keiretsu, which resembled a networked form of organization, designed to

6
coordinate increasingly costly R&D activities and facilitate quicker development of strategic
technologies. Japanese firms also received strong support from major government R&D
programs (Ham, Linden, and Appleyard,1998; Sakakibara, 1993). This development suggested
that the Japanese organizational form may have been more resilient and better adapted to
absorbing the risks associated with the new global environment for technological growth.
In response, American leaders in the semiconductor industry and Congress crafted an
innovative policy approach to address the imminent failure of the U.S. based industry. An
alignment between economic and defense interests facilitated consensus on the policy response.
The economic interests emphasized preservation of a top U.S. export, supporting high-quality
jobs, and feeding into numerous other products, i.e. a “platform technology”. The defense
interests characterized semiconductors and integrated circuits as a critical resource necessary to
maintain the cutting edge in high-technology weapon systems (Mowery 1983; Mowery and
Langlois 1996; Mowery 2009).1 Rather than relying on subsidizing firms directly or imposing
tariffs and trade barriers, industry leaders and policy makers crafted an organizationally-based
policy solution.
The result was the non-profit public-private consortium, Semiconductor Manufacturing
Technology, referred to here as “Sematech”, created in 1987 with support from the Department
of Defense (DOD) and the Defense Advanced Research Projects Agency (DARPA). The
Sematech consortium can be characterized as a type of strategic partnership or alliance (Siegel
and Zervos 2002). The consortium began as a multilateral agreement between DOD/DARPA and
fourteen U.S. semiconductor manufacturing firms, constituting roughly 85% of U.S.
manufacturing capacity. The consortium received roughly $100 million per year for two five-
1 The interplay of economic and defense interests can be observed in a 1989 Senate Armed Services Subcommittee on Defense Industry and
Technology hearing on The Future of The Semiconductor Industry -- https://www.c-span.org/video/?10092-1/future-semiconductor-industry

7
year periods from DOD/DARPA. Sematech members contributed a minimum of one-million
dollars, or one percent of sales, with a fifteen-million-dollar cap. Members were also required to
contribute personnel to joint R&D activities at the Fab One facility in Austin, TX. The
consortium excluded foreign firms from participating from 1987-1995. DOD sponsorship and the
prohibition on foreign participation ended in 1996, but Sematech continued until the present as a
non-profit consortium. Figure 1 shows a timeline of events, which is demarcated into an
implementation period, a maturity period, and a post-DOD period based on insights from the
extant qualitative literature on Sematech (Grindley, Mowery, and Silverman, 1994; Browning
and Shetler, 2000; Carayannis and Alexander 2004; Bonvillian 2013). This timeline is important
to the subsequent analysis.
Figure 1 – Timeline of Significant Events
Figure Notes – The figure shows the timeline of significant events, which is divided roughly three periods,
implementation/DOD, maturity/DOD, and post-DOD period. Two economic recessions occurred during the study
period. The maturity phase occurs after a major shift from a focus on horizontal to vertical relationships in the
consortium.
3. Literature Review
Government & Networks. The literatures on governance networks, collaborative
governance, and policy networks provide useful concepts for thinking about the processes and
outcomes of cross-sector policy implementation regarding inter-organizational networks (Klijn
and Koopenjan 2015; Ansell & Gash 2009; Ansell 2011; Provan and Milward, 1995; Provan and

8
Kenis, 2008). However, scholars have not sufficiently applied these policy frameworks to
science and technology policy. Klijn and Koopenjan (2015:11) define governance networks as
“stable patterns of social relations between mutually dependent actors, which cluster around a
policy problem, a policy programme, and/or a set of resources and which emerge, are sustained,
and are changed through a series of interactions”. In this study, the imminent collapse of a U.S.
industry is the policy problem, the policy program is the Sematech consortium, and the general
spread of cooperative partnerships in the industry represents an emerging pattern of social
relations, which depends on the combination of heterogeneously distributed resources.
Ansell and Gash (2009:544) define collaborative governance as “A governing
arrangement where one or more public agencies directly engage non-state stakeholders in a
collective decision-making process that is formal, consensus-oriented, and deliberative and that
aims to make or implement public policy or manage public programs or assets.” Here the
Department of Defense (DOD) enticed U.S. private sector firms to engage in cooperative
decision-making to prevent the failure of the U.S. based semiconductor market. The consortium
engaged in a highly collocated, face-to-face effort to conduct “pre-competitive” R&D on
manufacturing process technology. The combination of heterogeneously distributed resources of
member firms suggests the potential for joint advantage. Further, the benefits of the resulting
pre-competitive R&D were to be shared among the members and applied for competitive
advantage relative to foreign firms, primarily in Japan. DOD played a hands-off role, allowing
the firms to establish routines of self-governance and leadership (Beyer & Browning 1999).
There were also no restrictions on alliance formation with foreign firms outside of the Sematech
consortium (Browning & Shetler 2000).

9
The concept of a policy network further adds to the study. Many different streams of
research fall under the broad framework of policy networks in public affairs, and many different
competing definitions have been offered (Borzel 1998). Rhodes (2006) provides a definition that
is both useful for the case at hand and broad enough to encompass many other cases. Rhodes
(2006: 426) defines policy networks as “sets of formal institutional and informal linkages
between governmental and other actors structured around shared if endlessly negotiated beliefs
and interests in public policy making and implementation”. From this broad definition flows a
more specific conceptual device, called a network administrative organization (NAO). Provan
and Kenis (2008:236) define NAOs as separate administrative entities, usually government
organizations or non-profits, which serve as governance mechanisms that coordinate and sustain
the network of interactions between organizations, whether public, private, or non-profit.
The governance and policy networks concepts have been applied to S&T studies in a few
cases. Kash and Rycroft (1998) suggested that network governance is necessary to create shared
vision and establish self-organizing governance strategies and structures that coordinate
increasingly complex interactions for technological innovation in the micro-electronics industry.
Lyall (2007) applies the policy network concept to analyze participatory decision making in
Scottish biotechnology sector, suggesting that domination by public sector organizations can
suppress requisite self-organization in policy networks. Wardenaar, de Jong, and Hessels (2014)
apply network governance concepts to suggest how institutional environment and internal
organization lead to different governance forms and coordination approaches among Dutch
research consortia.
However, the governance and policy networks literatures have several limitations. The
application of these frameworks to S&T policy is somewhat limited. As Laranja (2012)

10
suggested, network governance lacks a comprehensive theoretical application to S&T
innovation. More generally, Berry et al. (2004) suggested there is a lack of attention to policy
network evolution. Similarly, Provan, Fish, and Sydrow (2007) suggested that more attention
needs to be paid to the dynamics of policy networks over time and the effect of networks on
outcomes. There are also limitations regarding the conceptualization of government intervention
in private sector networks. In the public administration literature, the focus is often on directive
relationships between principals and agents (Provan and Milward, 1995), resource-dependencies
(Rethemeyer and Hatmaker, 2008), and power dynamics (Saz-Carranza, Iborra, Albareda 2016).
This approach can be limiting in a private sector context, since conceptualizing network
relationships in terms of power-based dependencies fails to explain the strategic decision-making
processes of private firms. Rather, it may be more useful define the role of government as a
potential catalyst for cooperation between competitors on scientific and technological landscapes
(Kash and Rycroft 1998). Finally, while the governance and policy networks literatures provide
important descriptive concepts (cf. Provan & Lemaire 2012), they do not necessarily motivate
specific hypotheses about the effect of government on network dynamics or organizational
performance in the S&T context. The following section integrates these frameworks with
theories necessary for articulating more localized hypotheses about how the governance network
approach might be used to enhance cooperation and innovation in the high-technology sector.
Transaction Costs, The Resource-Based View, and Social Capital. The application of
transaction cost economics (TCE) provides a robust explanatory framework for strategic alliance
behavior in the semiconductor industry (e.g. Oxley, 1997; Yasuda, 2005; Leiblein and Macher,
2009). With the rapidly rising costs of R&D essential to semiconductor manufacturing, vertically
integrated but isolated firms in pure competition could no longer maintain the miniaturization

11
trajectory of Moore’s Law (Epicoco, 2013). Strategic alliances emerged to facilitate the kind of
close cooperation necessary for continual innovation. However, cooperation is not frictionless.
As Williamson (1981;1985;1991) argued, the transaction costs of cooperation emanate primarily
from the uncertainty and opportunism associated with human nature. These factors are
particularly salient when cooperative transactions are uncertain, recur frequently over time, and
assets are transaction specific, all of which characterize cooperative R&D for high-technology.
To reduce transaction costs, cooperative alliances in the semiconductor industry are often
governed by a mix of bilateral and multilateral cross-licensing, co-development, and joint
venture contracts.
Applying the logic of transaction costs, Oxley (1997) reasoned that transaction costs
increase with each additional R&D alliance partner, showing that alliance scope is associated
with increasingly hierarchical forms of governance. Multi-firm alliances are common in the
semiconductor industry because innovation often requires the application of resources by
multiple firms, and greater efficiency may be achieved through a single multilateral governance
structure rather than through a series of bilateral agreements. Multilateral alliances may also
propagate effects on the broader network of relationships (Persidis and Persidis, 1996; Medcof,
1997; Hwang and Burgers, 1997). In terms of network theory, multi-firm alliances could be
treated as cliques, where all possible pathways between partners are realized. This suggests a
greater capacity for sharing and combination of resources and especially knowledge (Hage,
Jordan, & Mote 2007). Such configurations may also facilitate the emergence of network
safeguarding mechanisms (e.g. Jones, Hesterly, Borgatti 1997). However, large multi-firm
alliances come with even greater costs (Li et al., 2012; Gudmundsson, Lechner, and Van
Kranenburg, 2013).

12
At a certain point the costs of additional alliance partners may overwhelm the benefits.
When the objectives of such alliances are public in nature or when governments view them as
necessary to fulfill public objectives, publicly supported governance regimes, such as network
administrative organizations (NAOs), might provide a supportive structure. TCE interfaces with
the governance and policy networks literature, suggesting that NAOs might reduce the costs of
large-scale cooperation. Williamson (1999) makes a very similar argument about the necessity of
government to maintain transaction costs between nations embodied in the U.S. Department of
State. Synthesizing these insights from the governance networks and transaction cost literatures,
we hypothesize that Sematech enhanced the network centrality of member firms by lowering the
costs associated with cooperation on pre-competitive research and development.
H1: Sematech enhances the network centrality of member firms relative to other firms
within an emerging strategic alliance network
The resource-based view (RBV) suggests that firms gain an advantage by applying
resources in a competitive environment (Wernerfelt, 1984). Barney (1991:101) defines resources
as “all assets, capabilities, organizational processes, firm attributes, information, knowledge, etc.
controlled by a firm that enable the firm to conceive of and implement strategies that improve its
efficiency and effectiveness”. The RBV highlights the importance of difficult or impossible to
trade (often intangible) resources in explaining performance heterogeneity and persistence (e.g.,
Barney, 1991; Dierickx and Cool, 1989). The RBV also calls attention to information and
knowledge as a resource feeding into organizational performance (Grant and Baden-Fuller,

13
2004). In the high-technology sector, information, knowledge, and intellectual property are
among the most critical resources for competitive advantage.
Extensions of the RBV through social capital theory suggests that social relationships
provide access to heterogeneously distributed resources (Eisenhardt and Schoonhoven, 1996;
Tsai and Ghoshal, 1998; Nahapiet and Ghoshal, 1998). Social capital theory focuses attention on
the ways in which firms seek to leverage their relationships for competitive gain (Burt, 1992,
1997; Lin 1999). Provan & Lemaire (2012) suggest that organizations gain the advantages of
social capital when they form network ties. As Walker, Kogut, and Shan (1997) suggest, the
resource view of social capital is concerned with the advantages of relationships for individual
firms, rather than emphasizing group level processes, such as influence, status, and prestige (e.g.
Putnam, 1995; Podolney, Stuart, Hannan 1996). For the purposes of this article, we use Burt’s
(1992) conceptualization to suggest why the technological innovation of the firm depends to
some extent on strategic alliances.
Previous research has examined the effects of alliance formation on performance and
innovation in the semiconductor industry (Eisenhardt and Schoonhoven, 1996; Stuart 2000; Hill,
Jones, and Schilling, 2014; Schilling 2015), as well as the effects of firm positioning within
alliance networks on performance (Ahuja 2000). Studies have examined the effects of network
centrality on organizational performance (Zaheer & Bell 2005; Koka & Prescott 2008). Social
capital extensions of the resource-based view suggest that network centrality measures a firm’s
access to heterogenous and immobile resources in the network (Walker, Kogut, & Shan 1997).
Leveraging these insights, we advance the following hypothesis.
14
H2: Network centrality enhances the technological performance of firms in the
strategic alliance network.
Connecting the logic of H1 and H2 entails that Sematech membership enhances the
technological performance of member firms through enhancements in network position. This
logic suggests a mediation model (e.g. Baron & Kenny 1986; Aguinis et al. 2017). Thus, we
hypothesize that the direct performance effects of Sematech membership flow through its effects
on the network position of member firms.
H3: Network centrality mediates the effects of Sematech membership on technological
performance relative to other firms in the strategic alliance network.
Since network processes are relational we suspect that strategic allies of Sematech
members will experience similar enhancements in network position and technological
performance relative to firms not directly connected to Sematech members. This is similar to the
logic of policy diffusion (e.g. Shipan & Volden 2012), but the focus here is on the policy effects
on technological diffusion through network spillovers. The spillover hypothesis was advanced by
previous studies (Irwin and Klenow, 1994) but has never been directly applied to this case
through network analysis. Here, Sematech is thought to have secondary social capital effects, or
spillovers, on allies of Sematech members.
H4: The network and performance effects of Sematech membership spillover onto
strategic allies of Sematech members relative to other firms in the alliance network.

15
Finally, the timeline of events displayed in Figure 1 suggests that the development of
Sematech within the strategic alliance network moved through three periods during the study
period: implementation, maturity, and post-DOD. Since technological performance data are not
available for the implementation period, the maturity period is compared to the post-DOD
period. Quasi-experimentally, this amounts to a removed treatment effect of DOD exit. Thus, the
final hypothesis is stated as follows.
H5: Sematech and network effects are stronger during the maturity period than in the
post-DOD period.
4. Methods
Data. To construct a panel for the study period (1986-2001), alliance data were gathered
from two sources. First, from 1986-1989 alliance data were gathered from public announcements
compiled through press releases and other public news announcements. Second, alliance data
from 1990-2001 were extracted from the ICE/IC Insights Strategic Profiles Reports on the global
semiconductor industry. The first data source reports only announcements, while the second also
reports ongoing alliances. The early data between 1986 and 1989 likely undercounts alliances.
Data on firm sales and technological performance were also gathered from these sources.
Missing data was gathered from COMPUSTAT/CRSP via WRDS, Bloomberg, S&P Capital IQ,
and PrivCo. Sematech membership data were acquired from a contact with Sematech. Since data
on technological performance is only available starting in 1990, the sample frame for models
using technological performance was reduced to 1990-2001.

16
The network data were constructed in the following manner. All alliances listed in the
ICE/IC Insights profiles were aggregated yearly and constructed as symmetrical adjacency
matrices, a common method for analyzing whole-networks over time (Wasserman and Faust,
1994). Each year-matrix is one-mode and undirected, with binary values that represent the
presence or absence of an alliance edge between firm nodes. Isolates were not included. The
edge weights for each year were set to one to handle cross-listing of alliances in the IC Insights
profiles. After constructing the yearly adjacency matrices, they were analyzed, and node level
network statistics were calculated using the network analysis program Gephi. Node level
measures from each whole-network year were then extracted and merged with firm level panel
data. Figure 2 shows the development of these networks across the time-period. In these
visualizations. A conservative approach is taken in the networks, where ties between Sematech
members are not included unless they are alliances external to the consortium.

17
Figure 2 – Yearly Strategic Alliance Network 1986-2001
Figure notes –The networks are constructed as one mode, undirected adjacency matrices, where edges are alliances
and nodes are firms. Red nodes are Sematech members, and red edges are connections with Sematech members. Red
nodes in 1986 show the future Sematech members. Nodes are sized by degree centrality. Alliances from 1986-1989
are likely undercounted due to different method of collection.

18
Sample. Sematech members include large and medium sized integrated circuit
manufacturers. The original members included AMD, AT&T, Digital, Harris, HP, IBM, Intel,
LSI Logic, Micron, Motorola, NCR Corp, National, Rockwell, and TI. Few changes in
consortium membership occurred in the implementation phase; it lost members during the
maturity phase; and the consortium increased in size as foreign firms joined in 1996. Despite
being prominent firms, the collective performance crisis for U.S. firms (Hof 2011) may temper
bias from initial selection into Sematech and subsequent performance. The larger sample of
semiconductor firms included in the broader alliance network captured through the IC Insights
Profiles. These include a heterogenous group of large, medium, and small firms, as well as
manufacturers, suppliers, and pure-play IP foundries. The goals of the consortium partners were
different, and their heterogeneity suggest potential gains from trade. A small number of
Sematech members were not included in the analysis if they also did not appear in the alliance
data from IC Insights. Since firms with no recorded alliances are not included, the analysis is
limited only to those firms with alliances.
Measures. Eigenvector centrality (E.Centrality) was chosen as the network position
variable characterizing organizational network position. Eigenvector centrality (also called
Bonacich centrality) measures how well-connected a firm is to other well-connected firms in the
network (Borgatti, Jones, and Everett 1998; Zaheer, Gözübüyük, and Milanov, 2010). This
variable captures both direct and indirect effects and is among network measures known to
impact firm performance (Uzzi, 1996; Zaheer and Bell, 2005). The variable is suitable to the
hypothesis which suggests that being connected to other well-connected firms will enhance
access to complementary resources necessary for innovation at the cutting edge.

19
The variable for technological performance (Tech-Performance) is the minimum
integrated circuit feature size that a firm can produce, given yearly data available on
manufacturing facilities. This is a unique measure specific to the semiconductor industry, where
the minimum integrated circuit feature size is an objective measure of technological
sophistication. This variable has been used previously in studies on the semiconductor industry
(Eisenhardt and Schoonhoven 1996; Leiblein, Reuer, and Dalsace 2002). Since the measure is
defined in terms of a continuously decreasing minimum, this variable is reverse coded to be
consistent with performance.
The policy variables include Sematech and S.Partners. Sematech is a nominal variable,
taking the value of 1 if the firm is a Sematech member at time t, and 0 otherwise. S.Partners is
also a nominal variable taking the value of 1 if a firm has a strategic alliance with a Sematech
member at time t, and 0 otherwise. The control variables include Org.Size and US. We
operationalize firm size in terms of annual revenue or sales in millions. Measures such as
employee count are likely to be contaminated by the decision to vertically integrate into
production or assembly. More specifically, organizational size is operationalized as a three-year
moving average of total sales. A moving average was used given the cyclical and volatile nature
of sales in the semiconductor industry. Finally, US captures the nationality of the headquarters of
the firm; the variable takes a value of 1 for US firms, and 0 otherwise.
Methods. The primary method of analysis employed is the mixed-effects model, which
combines elements from fixed and random effects models. The mixed effects model is a
generalization of the standard linear model, which allows for modeling the means and the
variance/covariance of the data (Littell et al., 2006). Mixed models were chosen to account for
correlation within repeat observations on firms without loss of meaning regarding fixed firm

20
characteristics (see Allison, 2005), such as firm nationality, Sematech membership which only
occasionally changes for some firms, and for technological performance which often remains
identical for multi-year stretches of time. Since the modeling strategy is to compare models in
two separate four-year periods (Table 3), there isn’t enough variability to produce useful
estimates in fixed effects models. However, robustness checks were conducted using firm and
year fixed effects on the full time period (Table 4). In the mixed effects model, the unique firm
identifier is the covariance parameter, which is modeled as a random effect for repeat
observations over time. The variance components of the random parameter (firm id) include a
covariance estimate and a residual. These two pieces of information are used to calculate the
intraclass correlation (ICC), which estimates the amount of variability in the outcome accounted
for by the firm identifier and the residual (Allison, 2005).
5. Results
Table 1 presents the descriptive statistics and bivariate correlations between all the
variables used in the subsequent models. The bivariate correlations show significant relationships
between Sematech members (Sematech), network position (E.Centrality), and technological
performance (Tech-Performance), and a similar but weaker pattern is observed for allies of
Sematech members (S.Partners). Additionally, E.Centrality has a significant positive association
with Tech-Performance. The existence of these intercorrelations conform with expectations and
suggest the need for multivariate analysis.
21
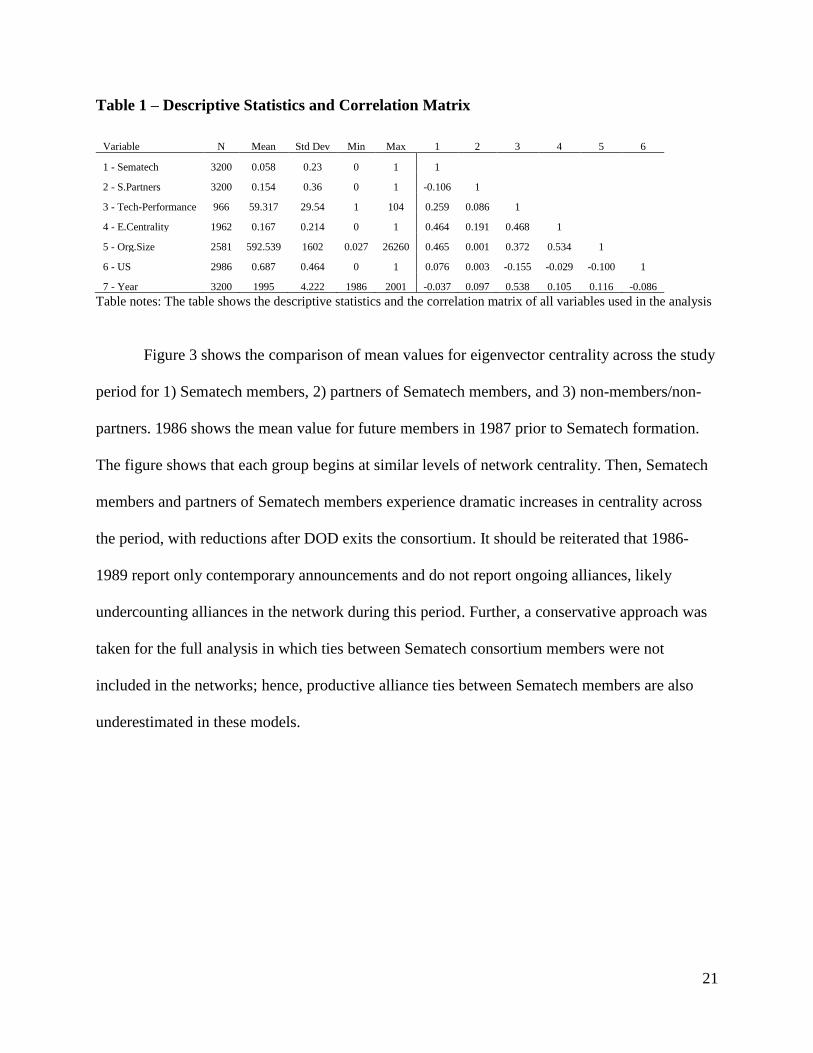
Table 1 – Descriptive Statistics and Correlation Matrix
Variable N Mean Std Dev Min Max 1 2 3 4 5 6
1 - Sematech 3200 0.058 0.23 0 1 1
2 - S.Partners 3200 0.154 0.36 0 1 -0.106 1
3 - Tech-Performance 966 59.317 29.54 1 104 0.259 0.086 1
4 - E.Centrality 1962 0.167 0.214 0 1 0.464 0.191 0.468 1
5 - Org.Size 2581 592.539 1602 0.027 26260 0.465 0.001 0.372 0.534 1
6 - US 2986 0.687 0.464 0 1 0.076 0.003 -0.155 -0.029 -0.100 1
7 - Year 3200 1995 4.222 1986 2001 -0.037 0.097 0.538 0.105 0.116 -0.086
Table notes: The table shows the descriptive statistics and the correlation matrix of all variables used in the analysis
Figure 3 shows the comparison of mean values for eigenvector centrality across the study
period for 1) Sematech members, 2) partners of Sematech members, and 3) non-members/non-
partners. 1986 shows the mean value for future members in 1987 prior to Sematech formation.
The figure shows that each group begins at similar levels of network centrality. Then, Sematech
members and partners of Sematech members experience dramatic increases in centrality across
the period, with reductions after DOD exits the consortium. It should be reiterated that 1986-
1989 report only contemporary announcements and do not report ongoing alliances, likely
undercounting alliances in the network during this period. Further, a conservative approach was
taken for the full analysis in which ties between Sematech consortium members were not
included in the networks; hence, productive alliance ties between Sematech members are also
underestimated in these models.

22
Figure 3 – Sematech & Eigenvector Centrality
Figure notes - The figure shows the average eigenvector centrality for Sematech members (+), allies of Sematech
members (o), and non-member/non-allies (x), yearly across a sixteen-year period. Sematech was formed in 1987.
Thus, 1986 shows the centrality of future members in 1987. 1987-1991 is the implementation phase. 1992-1995 is
the maturity phase. 1996 is the beginning of the post-DOD phase.
Figure 4 shows the comparison of mean values for technological performance across the
study period for 1) Sematech members, 2) partners of Sematech members, and 3) non-
members/non-partners. A similar trend to Figure 3 is observed. However, the trend appears much
smoother. All firms experience an increase in technological performance across time; Sematech
members have lower performance in 1990; but Sematech members and their allies experience
greater gains.

23
Figure 4 – Sematech and Technological Performance
Figure notes - The figure shows the average technological performance for Sematech members (+), allies of
Sematech members (o), and non-member/non-allies (x), yearly across a twelve-year period. 1992-1995 is the
maturity phase. 1996 is the beginning of the post-DOD phase.
Hypothesis tests are presented in Table 2, which has eight mixed effects models,
separated by DOD period and post-DOD period. As is illustrated in Figure 1, 1992-1995
represents the maturity period of Sematech, where the consortium receives DOD support and
protection; after 1995 represents the post-DOD period, where support is removed, and foreign
firms are permitted entry. These four-year windows were chosen to avoid impacts of two major
economic recessions occurring around 1990 and 2000. Technological performance data was
unavailable during the implementation period, between 1987 to 1990.
Model 1 in table 2 shows that Sematech and S.Partners have much larger estimates on
E.Centrality than non-members, providing support for hypothesis one and hypothesis four.
Model 2 shows that Sematech members also have a larger estimate Tech-Performance, but
S.Partners do not. Model 3 shows that the E.Centrality is significantly associated with Tech-
Performance, providing support for hypothesis two. Model 4 shows that when including
24
E.Centrality in the same model with Sematech, the estimate on Sematech is reduced from 19.452
to 10.039 and the estimate is no longer statistically significant (p, 0.12), providing support for
mediation in hypothesis three. Following the mediation analysis procedure by Baron & Kenny
(1986), the results of models 1-4 suggest E.Centrality acts as a mediator through which the
performance benefits of Sematech flow. The Sobel Test also suggested the indirect effect of
Sematech (T-stat, 4.17; p,0.00003) on tech-performance via network centrality is significantly
different from zero (see Preacher & Leonardelli 2001).
Hypothesis four, regarding the spillover effects on partners of Sematech members, is
supported in some models but not others. Being an ally of Sematech had a significant estimate on
E.Centrality but not directly on Tech-Performance. However, the mediation hypothesis may
apply to allies of Sematech members since the estimate on the mediator is significant, and the
mediator estimate is significant on performance -- Aguinis, Edwards & Bradley (2017) suggest
that the direct effect on the outcome variable is actually not necessary to establish mediation.
Further, the Sobel Test suggested a significant mediation effect (T-Stat,2.95; p, 0.003).
Very similar patterns are observed in the post-DOD period from 1996 to 1999. However,
there are important differences. Model 5 shows that Sematech’s estimate on E.Centrality is larger
in the post-DOD period. Yet Model 6 shows a reduced estimate of Sematech on Tech-
Performance. Similarly Model 7 shows that E.Centrality has a lower estimate on Tech-
Performance. Model 8 shows that Sematech retains a larger estimate despite including
E.Centrality in the model, but with a p-value of only 0.063, indicating only a partial mediation
effect (e.g. Baron & Kenny 1986). The Sobel Tests for Sematech (T-stat, 2.81; p, 0.005) and
S.Partners (T-stat,2.77; p,0.006) showed the indirect effects are statistically different from zero.

25
These results provide support for hypothesis five, which specifies that estimates in hypothesis
one through four are larger during the DOD/Maturity period and smaller in the post-DOD period.
Table 2 – Mixed Effects Models: Mediation Analysis, DOD & Post-DOD Periods
DOD Period (1992-1995) Post-DOD Period (1996-1999)
E.Centrality Performance Performance Performance E.Centrality Performance Performance Performance
Intercept 0.151*** 50.49*** 41.552*** 43.06*** 0.116*** 76.256*** 71.88*** 72.744***
(0.02) (3.881) (3.803) (3.921) (0.023) (3.827) (3.995) (3.984)
Sematech 0.216*** 19.452** 10.039 0.263*** 16.618** 10.721
(0.041) (6.899) (6.43) (0.043) (5.826) (5.722)
S. Partners 0.036** 1.087 -0.099 0.068*** -2.811 -4.118
(0.011) (2.117) (2.061) (0.012) (2.236) (2.108)
E.Centrality 48.954*** 46.703*** 23.317*** 21.067**
(6.624) (6.825) (6.401) (6.64)
Org.Size 0.00005*** 0.004** 0.003* 0.002 0.00004*** 0.002 0.002 0.001
(0.00001) (0.001) (0.001) (0.001) (6.4E-06) (0.0009) (0.0008) (0.0008)
US -0.013 -3.346 -2.491 -4.364 0.006 -6.941 -9.217* -9.184*
(0.022) (4.455) (3.896) (4.071) (0.026) (4.441) (4.402) (4.381)
Year Fixed Fixed Fixed Fixed Fixed Fixed Fixed Fixed
AIC -767.5 2521.2 2345.1 2333.7 -668.9 2519.2 2331.8 2313.8
Firm Est. 0.012 403.79 302.09 301.89 0.025 450.15 414.08 410.99
Residual Est. 0.007 124.63 116.91 116.61 0.008 118.91 104 100.29
ICC 0.619 0.764 0.721 0.721 0.762 0.791 0.799 0.804
Num.Orgs 196 196 161 161 231 231 192 192
N 537 300 283 283 576 281 281 281
p<.05*,p<.01**,P<.001***; standard errors in parentheses
Table 3 shows the robustness checks for the process model using two-way fixed effects
models with year and organization fixed effects. The fixed effect model estimates the within
rather than between organization effect and controls for omitted fixed variables. Due to low
variability in Sematech membership and the outcome variable on separate four-year periods,
these models are used on the full time period. The models in table 3 show a similar patter with
the notable difference that Sematech remains significant in the final mediation model. This is

26
consistent with combining the DOD and post-DOD periods in one analysis, since membership
rapidly changed in 1996 due to entry of foreign firms in the consortium, only a partial mediation
effect is suggested by the post-DOD period analysis in table 2. The Sobel Test is not significant
(T-stat,1.82; p,0.067), failing to provide support for the mediation hypothesis.
Table 3 – Fixed Effects Models: Mediation Analysis, Full Period
Full Period (1992-1999)
E.Centrality Performance Performance Performance
Intercept 0.003 48.705*** 46.036*** 46.374***
(0.100) (5.563) (6.952) (6.885)
Sematech 0.085** 9.906** 9.660**
(0.029) (3.523) (3.449)
S. Partners 0.052*** -1.524 -1.732
(0.009) (1.535) (1.517)
E.Centrality 12.456* 11.974*
(5.106) (5.121)
Org.Size 0.000** -0.000 -0.000 -0.000
(0.000) (0.001) (0.001) (0.001)
Firm ID Fixed Fixed Fixed Fixed
Year Fixed Fixed Fixed Fixed
R2 0.835 0.864 0.865 0.868
N 1114 600 564 564
p<.05*,p<.01**,P<.001***; standard errors in parentheses
6. Discussion
This study casts light on policy implementation through cross-sector inter-organizational
networks. The empirical contribution is to reveal a previously invisible domain of cooperative
activity. The results suggest policy effects on technological performance outcomes may be
partially mediated through an organization’s network position. By examining the dynamics of
strategic cooperation in the formal R&D contract network of the semiconductor industry, this

27
study suggests that network governance can play a part in the recovery and prosperity of the
high-technology sector.
This study contributes to the governance and policy networks literatures by suggesting
how a technology policy program might be constructed as a device for facilitating cooperation
between private-sector firms for public ends (e.g. Ansell and Gash 2007; Provan and Kenis,
2008; Emerson and Nabatchi 2015). Studies of organizational performance often avoid analyzing
the relevance of government in explanations of strategic alliance behavior and firm performance,
relying only firm-based resources (e.g. Barney 1991) and horizontal social relations (e.g. Burt
1997). Conversely, studies of science and technology policy tend to feature business and
economics perspectives. Lambright (2008) examined the politicization of science, suggesting the
need for analysis of S&T from a public policy and administration perspective and the need for
strengthening relations between government and science. Scholars in public administration have
analyzed the downstream process of contracting for military technology, such as the A‐12
Avenger (Brown, Potoski, Van Slyke, 2018). But what are governments to do if U.S. markets for
these products fail, or if such vendors no longer have access to cutting edge platform technology,
especially given the prospect that weapon systems or components must then be purchased from
foreign nations and potential adversaries?
This study further extends the governance network, policy network, and network
administrative organization (Provan & Kenis 2008) concepts to the areas of science and
technology (e.g. Lyall 2007; Laranja 2012; Wardenaar, de Jong, and Hessels 2014). The results
suggest that a government sponsored consortium may be conceptualized as a network
administrative organization which might affect the network position of key firms in a public
policy relevant industry. One advantage of studying Sematech as a governance network (Klijn &

28
Koppenjan, 2015) and a network administrative organization (Provan & Kenis 2008) is that the
theoretical tools used to analyze the private sector have been brought into public focus.
Conversely, rather than conceptualizing the study only using theories common to the analysis of
policy networks, such as resource-dependency or principal agent theory, the combination of
policy frameworks with theory from business and economics broadens the perspective beyond
power asymmetries and dependencies between private firms and central public agencies. Thus,
the present study integrates the governance and policy networks frameworks with transaction
costs economics, the resource-based view of the firm, and social capital theory, to explain how
government action can both remedy market failures and catalyze innovation for increasing
returns on investment.
Limitations. First, selection bias remains an issue in studies that do not use randomized
selection for treatment and control groups. It may be possible that Sematech members self-
selected into Sematech because they were already well performing firms. While there is likely
some truth to this statement (in relative terms), it is important to bear in mind that Sematech was
created to save failing U.S. business from foreign competition. Further, studies that estimate the
effects of Sematech (Irwin and Klenow 1996; Link, Teece, and Finan 1996) show positive
impacts on performance, but these do not examine the intermediary network effects. Further, the
expectation is that Sematech is expected to have spillover effects on partners of Sematech
members and on non-members, which further contaminates distinct group effects. Second, the
chicken and egg problem between network position and performance persists, since firms that
perform well will experience greater popularity in a competence-based collaboration network,
i.e. preferential attachment in social networks (Wagner & Leydesdorff 2005). Third, it is unclear
how the findings might generalize to other industries. For example, the network administrative

29
organization model might not generalize effectively to industries with low levels of
collaboration, where collaboration accounts for only a small or no portion of performance (cf.
Provan & Lemaire 2012). Further, it is also unclear whether this approach would be appropriate
in areas where strong principal-agent assumptions are necessary to maintain accountability (e.g.
inherently government functions). Finally, the uneven data coverage across variables, the lack of
network and performance data on years prior to the creation of Sematech and performance data
during early implementation limits the analysis to mostly associational claims. Hence, while we
believe the analysis supports the hypothesis, we avoid causal claims regarding the analysis.
7. Conclusion
The conclusions of this study are 1) that science and technology (S&T) are properly viewed as
public or quasi-public goods, 2) markets for science and technology are prone to inefficient
resource allocation and market failures, and 3) governments might achieve enhanced outcomes
in these markets by supporting governance networks that might produce efficient resource
allocation and recombination. This study suggests that S&T policies can enhance performance
outcomes for firms engaged in strategic alliances by strengthening the institutional bridges that
span the boundaries between firms, markets, and sectors. Further, rather than utilizing blunt
policy instruments, such as direct subsidies or trade tariffs, the organizationally-based
consortium approach might catalyze local level cooperation, stimulate self-organization on
dynamic technological landscapes, and enable synergies for collective advantage.
The findings may be generalized beyond the semiconductor industry to other sectors of
interest to policymakers. For example, a comparison of the case of Sematech to emerging
competition between the U.S. and China on artificial intelligence (AI) is striking. Rather than
30
treating the issue as a “trade war” with trade tariffs and direct subsidies, implementation of
industrial policy on AI could benefit from the network governance approach. Observers have
suggested that Sematech is a model of industry-government cooperation (Hof, 2011), which
might be applied to other areas. However, this study also points to the limitations of network
governance because specific conditions appear to be critical for success. Cooperative policy
instruments, such as the public-private consortium model, may be impossible to implement in
sectors without a history of cooperative activity or in domains where inter-organizational
networks are sparse or non-existent. Further, these types of arrangements may be inappropriate
in sectors where strong principal-agent relations of hierarchical dependence are necessary to
ensure accountability for inherently governmental functions. Finally, as Kingdon (1984)
suggested, collective emergencies are often necessary to produce a cooperative atmosphere and a
sense of urgency where leaders at odds might find common ground to pass legislation through
windows of opportunity.
31
Bibliography
Aguinis, H., Edwards, J. R., & Bradley, K. J. 2017. “Improving our understanding of moderation
and mediation in strategic management research.” Organizational Research Methods,
20(4), 665-685.
Allison, P. D. 2005. Fixed effects regression methods for longitudinal data using SAS. SAS
Institute.
Ansell, C. 2011. Pragmatist Democracy: Evolutionary Learning as Public Philosophy. Oxford
University Press.
Ansell, C., and Gash, A. 2008. “Collaborative governance in theory and practice.” Journal of
public administration research and theory, 18(4), 543-571.
Ahuja, G. 2000. “Collaboration networks, structural holes, and innovation: A longitudinal
study.” Administrative Science Quarterly, 45: 425-455.
Arrow, K. J. 1962. “Economic welfare and the allocation of resources for invention.” in The Rate
and Direction of Inventive Activity: Economic and Social Factors, 609-626. National
Bureau of Economic Research, Inc.
Baron, R.M. and D.A. Kenny. 1986."The moderator–mediator variable distinction in social
psychological research: Conceptual, strategic, and statistical considerations." Journal of
Personality and Social Psychology, 51:1173.
Barney, J. 1991. “Firm resources and sustained competitive advantage.” Journal of management,
17(1), 99-120.
Berry, F. S., Brower, R. S., Choi, S. O., Goa, W. X., Jang, H., Kwon, M., & Word, J. 2004.
“Three traditions of network research: What the public management research agenda can
learn from other research communities”. Public administration review, 64(5), 539-552.
Beyer, J. M., & Browning, L. D. 1999. “Transforming an industry in crisis: Charisma,
routinization, and supportive cultural leadership”. The Leadership Quarterly, 10(3), 483-
520.
Bonvillian, W. B. 2013. The new model innovation agencies: An overview. Science and Public
Policy, 41(4), 425-437.
Borgatti, S. P., Jones, C., & Everett, M. G. 1998. Network measures of social capital.
Connections, 21(2), 27-36.
Borgatti, S.P., M.G., Everett and J.C. Johnson. 2013. Analyzing social networks. SAGE:
Thousand Oaks, CA.
Börzel, T.A. 1998. “Organizing Babylon‐On the different conceptions of policy networks.”
Public Administration, 76: 253-273.
Bozeman, B. 2000. “Technology transfer and public policy: a review of research and theory”.
Research policy, 29(4), 627-655.
Browne, M.W. and R. Cudeck. 1992. “Alternative ways of assessing model fit.” Sociological
Methods and Research, 21: 230-258.
Brown, T. L., Potoski, M., & Van Slyke, D. M. 2018. “Complex Contracting: Management
Challenges and Solutions.” Public Administration Review, 78(5), 739-747.
Browning, L.D. and J.C. Shetler. 2000. Sematech: Saving the US semiconductor industry. Texas
A & M University.

32
Browning, L.D., J.M. Beyer and J.C. Shetler. 1995. “Building cooperation in a competitive
industry: SEMATECH and the semiconductor industry.” Academy of Management
Journal, 38: 113-151.
Burt, R.S. 1997. “The contingent value of social capital”. Administrative Science Quarterly, 42:
339-365
Burt, R.S. 2009. Structural Holes: The Social Structure of Competition. Harvard University
Press.
Bush, V. 1945. Science: The endless frontier. Transactions of the Kansas Academy of Science.
Carayannis, E. G., and J. Alexander. 2004. “Strategy, structure, and performance issues of
precompetitive R&D consortia: insights and lessons learned from SEMATECH.”
Engineering Management, IEEE Transactions, 51: 226-232.
Eisenhardt, K. M., and C.B. Schoonhoven. 1996. “Resource-based view of strategic alliance
formation: Strategic and social effects in entrepreneurial firms.” Organization Science, 7:
136-150.
Emerson, K., & Nabatchi, T. 2015. Collaborative governance regimes. Georgetown University
Press.
Epicoco, M. 2013. “Knowledge patterns and sources of leadership: Mapping the semiconductor
miniaturization trajectory”. Research Policy, 42: 180-195.
Freeman, L.C. 1977. “A set of measures of centrality based on betweenness.” Sociometry, 40:
35-41.
Grant, R.M., and C. Baden‐Fuller. 2004. “A knowledge accessing theory of strategic alliances.”
Journal of Management Studies, 41: 61-84.
Grindley, P., D.C. Mowery and B. Silverman, 1994. “SEMATECH and collaborative research:
Lessons in the design of high‐technology consortia.” Journal of Policy Analysis and
Management, 13: 723-758.
Gudmundsson, S.V., C. Lechner and H. Kranenburg. 2013. “Multilevel Embeddedness in
Multilateral Alliances: A Conceptual Framework”, In, Das, T.K (ed.). Research in
Strategic Alliances Series: Interpartner Dynamics in Strategic Alliances: 131-147. USA.
Information Age Publishing. Available at SSRN: https://ssrn.com/abstract=1025283 or
http://dx.doi.org/10.2139/ssrn.1025283
Hagedoorn, J. 2002. “Inter-firm R&D partnerships: An overview of major trends and patterns
since 1960”. Research Policy, 31: 477-492.
Hage, J., Jordan, G., & Mote, J. 2007. A theory-based innovation systems framework for
evaluating diverse portfolios of research, part two: Macro indicators and policy
interventions. Science and Public Policy, 34(10), 731-741.
Hall, B. H., and J. Lerner. 2010. “The financing of R&D and innovation” in B. Hall and N.
Rosenberg, (eds.), Handbook of the Economics of Innovation, (vol. 1): 609-639. Oxford:
UK.
Hall, B. H., and R.H. Ziedonis. 2001. “The patent paradox revisited: an empirical study of
patenting in the US semiconductor industry, 1979-1995.” RAND Journal of Economics,
32: 101-128.
Ham, R.M., G. Linden and M.M. Appleyard. 1998. “The evolving role of semiconductor
consortia in the United States and Japan.” California Management Review, 41: 137-163.
Hill, C., G. Jones and M. Schilling. 2014. Strategic management: theory: an integrated
approach. Boston, MA: Cengage Learning
Hof, R. D. 2011. “Lessons from Sematech.” MIT Technology Review. Published by MIT.

33
Hwang, P., and W.P. Burgers. 1997. “The many faces of multi-firm alliances: Lessons for
managers.” California Management Review, 39: 101-117.
Irwin, D.A., and P.J. Klenow. 1994. “Learning-by-doing spillovers in the semiconductor
industry.” Journal of Political Economy, 102: 1200-1227.
Jones, C., W.S. Hesterly and S.P. Borgatti. 1997. “A general theory of network governance:
Exchange conditions and social mechanisms.” Academy of Management Review, 22: 911-
945.
Kash, D. E., & Rycroft, R. 1998. Technology policy in the 21st century: How will we adapt to
complexity?. Science and Public Policy, 25(2), 70-86.
Kingdon, J. W. 1984. Agendas, Alternatives, and Public Policies. Boston: Little, Brown.
Koka, B. R. and J. E. Prescott. 2008. “Designing alliance networks: the influence of network
position, environmental change, and strategy on firm performance.” Strategic
Management Journal, 29: 639-661.
Klijn, E. H. & Koppenjan, J. (2015). Governance networks in the public sector. Routledge.
Lambright, W. H. 2008. “Government and science: a troubled, critical relationship and what can
be done about it”. Public Administration Review, 68(1), 5-18.
Laranja, M. (2012). Network governance of innovation policies: The Technological Plan in
Portugal. Science and Public Policy, 39(5), 655-668.
Leiblein, M. J. and J. T. Macher. 2009. “The problem solving perspective: A strategic approach
to understanding environment and organization.” In J.A. Nickerson and B.S. Silverman,
Economic Institutions of Strategy, 97-120. Emerald Group Publishing Limited.
Leiblein, M. J., J.J. Reuer and F. Dalsace. 2002. “Do make or buy decisions matter? The
influence of organizational governance on technological performance.” Strategic
Management Journal, 23: 817-833.
Li, D., L. Eden, M.A. Hitt, R.D. Ireland and R.P. Garrett. 2012. “Governance in multilateral
R&D alliances.” Organization Science, 23: 1191-1210.
Lin, N. 1999. “Building a network theory of social capital.” Connections, 22(1), 28-51.
Link, A.N., D.J. Teece, and W.F. Finan. 1996. “Estimating the benefits from collaboration: The
case of SEMATECH.” Review of Industrial Organization,11: 737-751.
Littell, R.C., W.W. Stroup, G.A. Milliken, R.D. Wolfinger and O. Schabenberger. 2006. SAS for
Mixed Models. Cary, NC:SAS Institute.
Lyall, C. 2007. Changing boundaries: the role of policy networks in the multi-level governance
of science and innovation in Scotland. Science and Public Policy, 34(1), 3-14.
Macher, J.T., D.C. Mowery and D.A. Hodges. 1998. “Reversal of fortune? The recovery of the
US semiconductor industry.” California Management Review, 41: 107.
Malerba, F. 2002. “Sectoral systems of innovation and production.” Research policy, 31: 247-
264.
Maurer, I., and M. Ebers. 2006. “Dynamics of social capital and their performance implications:
Lessons from biotechnology start-ups.” Administrative Science Quarterly, 51: 262-292.
Medcof, J. W. 1997. “Why too many alliances end in divorce.” Long Range Planning, 30: 718-
732.
Monge, P.R. and N.S. Contractor. 2003. Theories of communication networks. Oxford University
Press.
Mowery, D. C. 1983. “Innovation, market structure, and government policy in the American
semiconductor electronics industry: A survey.” Research Policy, 12(4), 183-197.
34
Mowery, D. C. 1998. “Collaborative R&D: How effective is it?”. Issues in Science and
Technology, 15(1), 37-44.
Mowery, D. C. 2009. “National security and national innovation systems.” The Journal of
Technology Transfer, 34(5), 455.
Mowery, D. C., and Langlois, R. N. 1996. “Spinning off and spinning on (?): the federal
government role in the development of the US computer software industry.” Research
policy, 25(6), 947-966.
Nahapiet, J., and S. Ghoshal. 1998. “Social capital, intellectual capital, and the organizational
advantage.” Academy of Management Review, 23:242-266.
Nelson, R.R. 1959. “The simple economics of basic scientific research.” Journal of Political
Economy, 67: 297-306.
Nelson, R.R. and S.G. Winter, 1982. An evolutionary theory of economic change. Harvard
University Press.
Oxley, J.E. 1997. “Appropriability hazards and governance in strategic alliances: A transaction
cost approach.” Journal of Law, Economics, and Organization, 13: 387-409.
Partha, D. and P.A. David. 1994. “Toward a new economics of science.” Research policy, 23:
487-521.
Persidis, A. and A. Persidis. 1996. “Biotechnology consortia versus multifirm alliances:
Paradigm shift at work?.” Nature Biotechnology, 14: 1657-1660.
Podolny, J. M., Stuart, T. E., and Hannan, M. T. 1996. “Networks, knowledge, and niches:
Competition in the worldwide semiconductor industry, 1984-1991.” American journal of
sociology, 102(3), 659-689.
Preacher, K. J., & Leonardelli, G. J. 2001. Calculation for the Sobel test: An interactive
calculation tool for mediation tests. Accessed March 2019. URL -
http://quantpsy.org/sobel/sobel.htm
Provan, K.G. and P. Kenis. 2008. “Modes of network governance: Structure, management, and
effectiveness.” Journal of Public Administration Research and Theory, 18: 229-252.
Provan, K. G., & Lemaire, R. H. 2012. “Core concepts and key ideas for understanding public
sector organizational networks: Using research to inform scholarship and practice”.
Public Administration Review, 72(5), 638-648.
Provan, K.G. and H.B. Milward. 1995. “A preliminary theory of interorganizational network
effectiveness: A comparative study of four community mental health systems.”
Administrative science quarterly, 40: 1-33.
Provan, K.G., A. Fish and J. Sydow. 2007. “Interorganizational networks at the network level: A
review of the empirical literature on whole networks.” Journal of Management, 33: 479-
516.
Putnam, R. D. 1995. “Bowling Alone: America's Declining Social Capital.” Journal of
Democracy, 6(1), 65-78.
Rethemeyer, K.R. and D.M. Hatmaker. 2008. “Network management reconsidered: An inquiry
into management of network structures in public sector service provision.” Journal of
Public Administration Research and Theory, 18: 617-646.
Rhodes, R.A. 2006. Policy network analysis. The Oxford handbook of public policy, 423-445.
Romer, P. M. 1990. “Endogenous technological change.” Journal of Political Economy, 98(5,
Part 2), S71-S102.
Rosenberg, N. 1982. Inside the Black Box: Technology and Economics. Cambridge University
Press.

35
Sakakibara, K. 1993. “R&D cooperation among competitors: A case study of the VLSI
semiconductor research project in Japan.” Journal of Engineering and Technology
Management, 10: 393-407.
Salter, A. J. and B.R. Martin, 2001. “The economic benefits of publicly funded basic research: A
critical review.” Research policy, 30: 509-532.
Samuelson, P.A. 1954. “The pure theory of public expenditure.” The Review of Economics and
Statistics, 36: 387-389.
Saz‐Carranza, A., Salvador Iborra, S., & Albareda, A. 2016. “The power dynamics of mandated
network administrative organizations.” Public Administration Review, 76(3), 449-462.
Schilling, M.A. 2015. “Technology shocks, technological collaboration, and innovation
Outcomes.” Organization Science, 26:668-686.
Schilling, M.A. and C.C. Phelps. 2007. “Interfirm collaboration networks: The impact of large-
scale network structure on firm innovation.” Management Science, 53:1113-1126.
Shipan, C. R., & Volden, C. 2012. Policy diffusion: Seven lessons for scholars and practitioners.
Public Administration Review, 72(6), 788-796.
SIA Semiconductor Industry Association. 2016. 2016 Annual Databook Review of Global and
U.S. Semiconductor Competitive Trends 1995–2015.
Siegel, D. S., & Zervos, V. (2002). Strategic research partnerships and economic performance:
Empirical issues. Science and Public Policy, 29(5), 331-343.
Smith, B.L. 1990. American Science Policy Since World War II. Brookings Institution Press.
Stephan, P. E. 1996. “The economics of science.” Journal of Economic literature, 34: 1199-1235.
Stiglitz, Joseph E. 1999. "Knowledge as a global public good." In Global Public Goods. 1: 308-
326.
Stuart, T. E. 2000. “Interorganizational alliances and the performance of firms: A study of
growth and innovation rates in a high-technology industry.” Strategic Management
Journal, 21: 791-811.
Teece, D.J., G. Pisano and A.Shuen. 1997. “Dynamic capabilities and strategic management.”
Strategic management journal, 18: 509-533.
Tsai, W., and S. Ghoshal. 1998. “Social capital and value creation: The role of intrafirm
networks.” Academy of management Journal, 41: 464-476.
Uzzi, B. 1996. “The sources and consequences of embeddedness for the economic performance
of organizations: The network effect.” American Sociological Review, 61:674-698.
Wagner, C. S., & Leydesdorff, L. 2005. Network structure, self-organization, and the growth of
international collaboration in science. Research Policy, 34(10), 1608-1618.
Walker, G., Kogut, B., & Shan, W. 1997. “Social capital, structural holes and the formation of an
industry network.” Organization Science. 8(2), 109-125.
Wardenaar, T., de Jong, S. P., & Hessels, L. K. 2014. Varieties of research coordination: A
comparative analysis of two strategic research consortia. Science and public policy,
41(6), 780-792.
Wasserman, S. and K. Faust. 1994. Social network analysis: Methods and applications,Vol. 8.
Cambridge university press.
Wernerfelt, B. 1984. “A resource‐based view of the firm.” Strategic Management Journal, 5:171-
180
Whetsell, T. A. 2013. “Theory-pluralism in public administration: Epistemology, legitimacy, and
method”. The American Review of Public Administration, 43(5), 602-618.

36
Williamson, O. E. 1981. “The economics of organization: The transaction cost approach.”
American journal of sociology, 87(3), 548-577.
Williamson, O. E. 1985. The economic institutions of capitalism. Simon and Schuster.
Williamson, O. E. 1991. “Comparative economic organization: The analysis of discrete
structural alternatives.” Administrative Science Quarterly, 269-296.
Williamson, O. E. 1999. “Public and private bureaucracies: a transaction cost economics
perspectives”. The Journal of Law, Economics, and Organization, 15(1), 306-342.
Yasuda, H. 2005. “Formation of strategic alliances in high-technology industries: comparative
study of the resource-based theory and the transaction-cost theory.” Technovation, 25:
763-770.
Zaheer, A. and G.G. Bell. 2005. “Benefiting from network position: firm capabilities, structural
holes, and performance.” Strategic Management Journal, 26: 809-825
Zaheer, A., Gözübüyük, R., & Milanov, H. 2010. “It's the connections: The network perspective
in interorganizational research.” Academy of Management Perspectives, 24(1), 62-77.