beverage container management board (bcmb) · beverage container management system that is ... to...
TRANSCRIPT

BEVERAGE CONTAINER
(BCMB)
Benchmarking Evaluation of Alberta’s StewardshipProgram for Recycling Empty Beverage Containers
Final Report
Prepared For: Beverage Container Management Board
Prepared By: Meyers Norris Penny400, 10104
Edmonton AB T5J 0H8
MNP Contact: Rod Simpson
Date: Monday
ONTAINER MANAGEMENT BOARD
enchmarking Evaluation of Alberta’s StewardshipProgram for Recycling Empty Beverage Containers
Beverage Container Management Board
Meyers Norris Penny LLP
400, 10104 - 103 Avenue
Edmonton AB T5J 0H8
Rod Simpson
Monday, June 28, 2010
OARD

2
Benchmarking Evaluation of Alberta’s Stewardship Program forRecycling Empty Beverage Containers
AUTHORS
QUALITY ASSURANCE PARTNER
Rod Simpson
PROJECT MANAGER
Nicole Asselin
SUBJECT MATTER ADVISOR
Charlie Meredith

2
Benchmarking Evaluation of Alberta’s Stewardship Program forRecycling Empty Beverage Containers
TABLE OF CONTENTS
Executive Summary ..............................................................................................................................4
1. Introduction................................................................................................................................16
1.1. Project Objectives and Scope of Work ..........................................................................................................................161.2. Key Questions to be Addressed....................................................................................................................................161.3. Project Deliverables and Timelines ...............................................................................................................................17
2. Approach & Methodology.........................................................................................................18
2.1. Preliminary Research....................................................................................................................................................182.2. In Depth Benchmarking ................................................................................................................................................182.3. Assessment and Evaluation..........................................................................................................................................20
3. Program Attributes & Performance.........................................................................................21
3.1. Legislation ....................................................................................................................................................................213.2. Governing Structure......................................................................................................................................................233.3. Program Structure ........................................................................................................................................................253.4. Depot Infrastructure and Operations .............................................................................................................................263.5. Technology...................................................................................................................................................................293.6. Transportation ..............................................................................................................................................................323.7. Funding Mechanism......................................................................................................................................................333.8. Program Scope.............................................................................................................................................................363.9. Deposit Values..............................................................................................................................................................373.10. Beverage Container Sales ............................................................................................................................................393.11. Recoveries....................................................................................................................................................................423.12. Costs ............................................................................................................................................................................453.13. Marketing Initiatives ......................................................................................................................................................473.14. Research and Development..........................................................................................................................................493.15. Incineration for End Use ...............................................................................................................................................493.16. Comparisons ................................................................................................................................................................503.17. Learnings from Europe .................................................................................................................................................50
4. Opportunities for Consideration..............................................................................................52
4.1. Fundamentally Change the Funding Modelto Create Incentives for Brandowners to Enhance Container Design ..........524.2. Further Broaden Program Scope ..................................................................................................................................534.3. Develop and Support Regional Downstream Markets ...................................................................................................544.4. Support Research Projects to Enhance RE-Use and Recycling ....................................................................................544.5. Enhance Depot Role, Technology, Location and Operations ........................................................................................554.6. There are few Strategic and Operational Synergies with Other Recycling Programs.....................................................584.7. Local Marketing Initiatives Appear to Most Effectively Increase Recoveries ..................................................................59
5. Program Summaries .................................................................................................................61
5.1. Alberta ..........................................................................................................................................................................615.2. British Columbia............................................................................................................................................................655.3. Saskatchewan ..............................................................................................................................................................695.4. New Brunswick .............................................................................................................................................................715.5. California ......................................................................................................................................................................745.6. Connecticut...................................................................................................................................................................775.7. Michigan .......................................................................................................................................................................795.8. New York......................................................................................................................................................................805.9. Denmark.......................................................................................................................................................................815.10. Germany.......................................................................................................................................................................835.11. Norway .........................................................................................................................................................................855.12. Sweden ........................................................................................................................................................................885.13. South Australia .............................................................................................................................................................89
6. Appendices ................................................................................................................................91
6.1. Phase 1 – Interim Report ..............................................................................................................................................916.2. Data Questionnaire.....................................................................................................................................................1016.3. Interview Protocol .......................................................................................................................................................1056.4. Bibliography and References ......................................................................................................................................108
4
Benchmarking Evaluation of Alberta’s Stewardship Program forRecycling Empty Beverage Containers
EXECUTIVE SUMMARY
The Beverage Container Management Board’s (BCMB) mission is to establish and administer a leadingbeverage container management system that is innovative, accessible, and cost effective. The BCMB’sbroad mandate is to collect and recycle beverage containers throughout Alberta, and continually ensurestheir current approach to container recycling fulfils the requirements placed upon the organization.
Toward that end, BCMB has engaged Meyers Norris Penny (MNP) to conduct a benchmarking study ofAlberta’s beverage container stewardship program with a particular focus on program evaluation andassessing leading practices and innovations in comparable jurisdictions. This benchmarking study buildsupon a similar study completed in 2004. The 2004 benchmarking study prepared by BearingPointidentified five opportunities for the BCMB to consider that may enhance the program and improverecoveries. Significant initiatives have been implemented, addressing each of the five opportunities asfollows:
1. The program scope continues to be significantly broadened with other food and dairy products tocontinue to divert an increasing number of containers from the waste stream. Alberta is the firstjurisdiction to include a broad range of dairy containers.
2. Deposit levels were doubled in most cases based on other jurisdiction’s success increasing theirdeposit rates and experiencing a significant improvement in recoveries. Alberta’s recoveries havecontinued to increase since deposit rates were increased. The harmonization of the deposit ratefor aluminum containers to 10 cents also created significant operational efficiencies.
3. Portions of beer and non-beer processing streams are currently being consolidated reducingduplication and costs. This is a major cost reduction initiative. Unlike most North Americanjurisdictions, collection of beer and non beer containers was largely consolidated to a depotsystem years ago enhancing consumer convenience, standardizing the deposit redemption forbeer and reducing overall program costs (with the exception of 62 retail liquor stores collectingapproximately 1.5% of the recovered containers).
4. Handling commissions were reduced after a thorough cost analysis that reduced overall programcosts, given handling commission represent over 60% of net program costs. New high speedsorting and compaction technology is presently being evaluated that may further reduce overallcosts throughout the system.
5. Marketing initiatives were implemented to improve public awareness and increase recoveries,with many specific initiatives focused on specific communities and products. Increasingrecoveries can be partially attributed to these marketing initiatives.
A major challenge in the beverage container recycling industry is that there is not a clearinghouse forprogram information. Each jurisdiction, and in many cases the brandowners within each jurisdiction,collects and reports their own results with varying commonality, disclosure and audit requirements;making comparisons challenging. This study is based upon the best data available.
Research and benchmarking efforts were conducted to answer the six key questions presented in theRFP for this project.
1. How does the overall effectiveness of Alberta’s program compare, in terms of achievingmandated outcomes (e.g. material collection rates with programs targeting those samematerials in other jurisdictions and, scope of materials covered)?
Alberta deploys a very effective container recycling program. Alberta has the highest sales percapita creating a potentially larger environmental liability regarding containers than comparablejurisdictions.
Alberta has the broadest program scope, incorporating by far the highest number of uniquecontainers. Alberta also was the first jurisdiction to include a broad range of dairy containers (milkand cream) in its deposit program.

5
Benchmarking Evaluation of Alberta’s Stewardship Program forRecycling Empty Beverage Containers
Alberta’s program is mature and recoveries had plateaued over the past several years. Depositrates were recently increased and significant funds are being expended in a broad marketingcampaign, resulting in increased recoveries for comparable aluminum, plastic, glass and papercategories trending towards the recoveries of the jurisdictions with the highest recoveries in NorthAmerica and Europe. Overall recoveries increased from 77% to 83% in one year as ofDecember, 2009, compared to the world leaders with recoveries in the 87% range (and all withmuch narrower and easier to recover program scopes).
2. How does Alberta’s program compare with those in other jurisdictions in terms to thetypes of environmental performance indicators that are tracked and measured by theprogram’s managing organization (from the collection through final disposition of thecontainers)?
Virtually all jurisdictions track environmental performance indicators in a comparable way. TheBCMB effectively tracks environmental performance indicators throughout their process.
3. What are the financial costs attributable to achieving mandated outcomes of Alberta’sprogram and how does this compare with the program costs in other jurisdictions?
Alberta’s net cost per container is as low as any comparable jurisdiction in North America, despitea large geographic area with a relatively sparse population.
Most of the jurisdictions examined have legislated an extended producer responsibility or productstewardship model designed to encourage brandowners to fundamentally change designs,packaging, etc to reduce waste while increase the re-use and recycling of waste materials.Despite this, most program costs are borne by consumers and governments, with minimal directcost to industry.
Alberta’s program (with the exception of refillable beer where a brandowner fee is levied,representing 9% of the container volume), like all comparable programs except California’s andthose in Europe, is funded by unredeemed deposits, consumer fees and revenues fromprocessed collected containers. There is no direct funding by government or by brandowners forall other products.
Major program costs are handling fees (primarily collection depots), processing, transportation,communications and administration expenditures.
4. How does Alberta’s program compare with programs in other jurisdictions in terms of thedisposition of collected materials (i.e. the amount of material that is re-used, recycled,recovered and the amount of material that ends up as residual disposed of in landfill)?
All collected materials are recycled, at times at a loss, in a closed loop system as Alberta and allother North American jurisdictions generally do not incinerate or landfill collected containers.There is minimal incineration including incineration for energy capture and gasification in mostjurisdictions.
Collected containers are commodities with varying values. The only material that has maintaineda substantial value is aluminum, it tends to stay “cash positive”, although this market is now injeopardy given mergers in the aluminum manufacturing industry. Glass and the various types ofplastic and paper tend to have low to nil values. Recycling of these products is heavily subsidizedthrough consumer or brandowner fees.
California is the only North American jurisdiction identified that has embarked on developinglegislation that may prescribe a minimum recycled content in containers. California is alsopartnering with academic institutions to research alternative container product compositions toimprove environmental breakdown and create more sustainable packaging and recyclingcapability. It can be debated whether this is the role for government, industry or whether whodoes it matters.

6
Benchmarking Evaluation of Alberta’s Stewardship Program forRecycling Empty Beverage Containers
5. Are the most appropriate and efficient mechanisms being employed to achieve programobjectives in Alberta?
Alberta’s improving recoveries combined with low cost per container indicate that the Albertabeverage container recycling program is effective, thus mechanisms appear appropriate andefficient. This effectiveness is even greater when Alberta’s broad program scope, largegeographic area and relatively sparse population are considered.
Alberta’s program appears financially sound as escheatment practices, where excess depositfunds are re-allocated to provincial or state government general revenues as happens in manyUS jurisdictions as well as Saskatchewan, New Brunswick and Nova Scotia, does not occur in theprovince. California is an example of a jurisdiction where financial stress has been placed on theprogram because unredeemed deposits have been directed to general revenues.
Alberta’s program continues to add products to the program scope, and has the largest programscope in terms of number of unique items. The large majority of containers sold and collectedtraditionally have been aluminum, plastic and glass; but the recent introduction of dairy productcontainers to the program increases the volume of HDPE plastic and paper type products.
Two significant process changes have or are occurring. The first is the harmonization of depositrates for aluminum at 10 cents. As a result beer and non-beer aluminum streams need not besorted, creating tremendous process efficiency particularly given that aluminum is a large portionof the total volume of collected containers. The second change is been the ongoing consolidationof two collection agents. The official consolidation is targeted for January 2011. BrewersDistributor Limited (BDL) currently contracts Alberta Beverage Container Recycling Corporation(ABCRC) to collect all non-refillable beer. The goal is for beer and non-beer containers to becollected by one collection agent, receiving containers from 216 licensed collection depots inaddition to licensed liquor establishments that collect primarily refillable beer containers.
The number of container depots has not changed in many years and may require revision tomatch the change in Alberta’s population and demographics. While the number of depots has notchanged, the capacity of the depots in the system has increased drastically over that time.Depots have changed location, built bigger buildings or increased the number of service points.Several rural depots have closed and urban depots opened, thus the number has remainedstatic, the capacity has not.
On a broader basis, the North American container recycling industry has also been largely staticfor many years with most jurisdictions deploying similar physical operating models. The majorcost elements for all jurisdictions are labour, occupancy and transportation to sort, count andmove recovered containers to downstream processors, many outside of the jurisdiction.
To date sorting technology has yielded disappointing results, as reverse vending machines(RVMs) have generally proven to be slow, unreliable, and in the Alberta context, incapable ofhandling Alberta’s large program scope and climate. RVMs were intended to both increaseefficiency in depots as well as provide “mini-depots” throughout the community increasingrecoveries of difficult to recover containers consumed outside of consumer’s homes, schools andoffices – the first generation RVM technology has proven incapable of this second objective.
Newer technology that can automate sorting and counting in depots is being evaluated andappears promising. A new generation of RVMs designed as stand-alone kiosks to be located atgas stations, convenience stores et al as a joint venture between Pepsi and Waste Managementwill be tested in US jurisdictions in 2010 with the goal to recover the hereto unreachablecontainers.
Compaction has also been problematic, as audit and integrity requirements preventedcompaction at a depot level, resulting in double handling and counting driving significantly higherlabour, occupancy and transportation costs throughout the system. New sorting technologies maymake compaction at the depot level viable potentially driving process change and reducing costs.

7
Benchmarking Evaluation of Alberta’s Stewardship Program forRecycling Empty Beverage Containers
Some jurisdictions deploy a more rigorous franchise like contractual model for their collectiondepots, specifying signage, corporate dress, hours of operation, equipment, operating standardsand procedures, etc. Alberta’s collection depots operate with some independence within astructured set of standards. These jurisdictions view the commonality in their collection depotsincreases their ability to improve customer experience and potentially increase recoveries.
Alberta spends significantly more per capita on marketing than any other jurisdiction. Thiscommunications expenditure has increased in advance in preparation for the introduction of dairycontainers into the program and the increase in deposit levels.
6. What are the examples of best practices or innovative approaches to waste stewardship ofempty beverage containers that can be identified from this analysis that would beappropriate for consideration in Alberta?
The deposit program in Alberta is effective and cost efficient compared to others. The program isthe broadest, has the lowest cost per collected container, and recovery rates are rising andappear to be heading towards the 85% plus range matching the global leaders. To furtherincrease recoveries and reduce costs to match and potentially exceed where the leaders arenow, strategic initiatives regarding the financial model, container life cycle (design, materials,packaging and material end markets), recycling processes, and consumer engagement must bedeveloped and implemented. Seven strategic opportunities have been identified for Alberta toconsider based upon the review of other jurisdictions in North America, Australia and Europe thatmay provide incremental program benefit.
1. Consider Fundamental Changes to the Funding Model
Investigate moving from the current consumer/brandowner fee structure to cover financialshortfalls as recoveries increase to a California style brandowner fee based on brandownerproduct specific recovery facilitated by the implementation of next generation automatedcounting and sorting equipment.
Virtually all deposit programs are structured through legislation describing extended producerresponsibility or product stewardship; all programs are presently funded through unredeemeddeposits and revenue from processed containers, with consumer/brandowner fees applied tofund program. This is the Alberta model, whereby consumer fees (with brandowner fees forrefillable beer) increase as recoveries increase given the correlated unredeemed depositsdecrease. This is a closed loop system that will always remain viable, but total costs toconsumers (and refillable beer brandowners fees that may be partially or fully passed on toconsumers) also increase as recoveries increase, assuming static commodity prices forrecycled material.
California is unique where the State has legislated strictly brandowner fees on a materialstream basis. The major objective for brandowner fees in California is to create financialincentives that can fundamentally change the container life cycle (design, materials,packaging and end markets) to better facilitate recycling and improve environmentaloutcomes, and ultimately reduce brandowner net costs. Their view is that consumer fees maynot realize this same objective with consumers potentially viewing these fees as a tax,although it may be argued that consumers view products on a total cost basis, thus theincentive remains for brandowners to enhance the entire container life cycle to ultimatelyreduce overall costs.
To this end, California implemented a “processing fee offset” policy whereby the State pays ahigher portion of the processing cost shortfall as recoveries increased to preset benchmarks.This has resulted in brandowners paying as little as 15% up to a maximum of 65% of the netrecycling costs as recoveries have increased in conjunction with several simultaneousinitiatives. Given the state has escheated a significant portion of the unredeemed deposits,the processing fee offset has been cancelled and brandowners will pay a larger portion of thefinancial shortfall in 2010.

8
Benchmarking Evaluation of Alberta’s Stewardship Program forRecycling Empty Beverage Containers
The current funding structure in Alberta creates several considerations:
The current structure creates a natural tension between increasing recoveries (thatautomatically reduces unredeemed deposits), and the financial integrity of the programthat currently survives on these unredeemed deposits, revenue from recoveredcontainers and consumer/brandowner fees. Higher recoveries may mean higher productcosts to consumers and potentially lower sales for brandowners.
Most US jurisdictions and several provinces escheat unredeemed deposits. Escheatsinvariably result in higher consumer/brandowner fees again resulting in higher prices forconsumers and potentially lower sales for brandowners.
Collected containers are commodities with fluctuating values. Aluminum has traditionallybeen cash positive whereas other materials such as PET, HDPE, glass and others havehad low to minimal values. Decreases in the value of these commodities will invariablyresult in higher consumer/brandowner fees.
Increasing deposit rates generate short term cash surpluses due to the value ofunredeemed deposits increasing and appear to result in increased recoveries. In theshort term increases in unredeemed deposits due to the higher deposit rates may declineas recoveries increase, resulting in higher consumer/brandowner fees.
Regardless whether a fee is charged to consumers or brandowners, it appears indifferentto consumers as both result in higher prices and potentially lower sales for brandowners.Current processes and technology deployed does not allow jurisdictions to trackrecoveries by brandowner or by brandowner product, thus brandowner fees are appliedby material stream regardless of the greater or lesser efforts made by particularbrandowners to improve the recovery and ability to recycle their containers. However, asthere is currently no subsidization between material streams, manufacturers may benefitby choosing a container material stream that has low fees.
Brandowners maintain and closely guard two proprietary items - their product formulaand their sales. Moving to a brandowner fee based on actual recovery by product andbrandowner would require sales and return data by product and brandowner. Albertadoes not currently have access to return data by product and brandowner, althoughCollection System Agents (CSAs) perform the critical role of information clearinghouseensuring the protection and security of this sales information.
California implemented a brandowner fee across the board largely because theirjurisdiction is approximately the size of Canada thus a market large enough to effectivelynegotiate with brandowners. Alberta, one tenth the size of California, may be in a poorernegotiation position, and may have to partner with other jurisdictions to effectivelyimplement widespread brandowner fees.
A California style brandowner fee based on brandowner product specific recovery embodiesthe principal of extended producer responsibility. This may create the financial incentive forbrandowners to compete with each other to fundamentally change design, materials,packaging et al with the goal to optimize recoveries and improve overall environmentaloutcomes. This type of fundamental move would require the implementation of nextgeneration automated counting and sorting equipment allowing Alberta and many otherjurisdictions to provide the actual recovery by brandowner and product.
2. Further Broadening the Program Scope Involves Broadening the Program Mandate
Alberta presently has the largest beverage container recycling deposit program scope in theworld as well as the highest per capita consumption of in scope beverages - 25% greaterthan BC and 66% more than Saskatchewan. The vast majority of beverages sold in theprovince (including aluminum, plastic, glass and paper containers) are already in theprogram. Further expansion of the program would logically go in two directions -incorporating food and cleaning containers that are constructed of the same material types asbeverage containers already in the program; and/or incorporating non sealing beveragecontainers such as paper/plastic/styrofoam cups and containers.
9
Benchmarking Evaluation of Alberta’s Stewardship Program forRecycling Empty Beverage Containers
Both options would be a significant extension from the current program mandate, and wouldventure into an area no other jurisdiction has attempted to pursue. There are significantvolumes of containers in both areas thus diversion from landfills may be significant. Potentialissues include resistance from brandowners and retailers, contamination concerns and thedevelopment of end markets where few exist now.
3. Develop and Support Regional Downstream Markets
Downstream markets are critical to the financial viability of a recycling program. Aluminum isthe only material that consistently generates enough revenue to cover the associatedrecycling costs. Plastic, glass (except refillables) and especially paper have consistently hadweak downstream markets and commodity values. That said, the one advantage recyclingprograms have is that they can deliver a constant supply of product which at times is valuablein the commodity marketplace.
California has developed a local market for plastics through a subsidization program.Approximately $5 million in subsidies are paid to downstream processors annually. Californiahas the critical mass to invest in market development given its size ($1.2 billion in programgross revenue and 16.2 billion recovered containers).
Given geographic proximity, Alberta and brandowners may consider partnering withneighbouring jurisdictions to investigate opportunities to leverage their cumulative volume todevelop regional markets for materials where few viable markets currently exist.
4. Support Research Projects to Enhance Re-use and Recycling
Only one jurisdiction appears to be funding third party research regarding container designand materials. California has partnered with academic institutions to develop alternativecontainer designs and materials that are easier to recycle and breakdown faster in theoceans, rivers and landfills.
One major project is the development of “bio plastic”. The State of California is alsoresearching methane based plastics (PHA) and industry has developed corn basedcontainers (PLA) and seeks to improve processing and enhance awareness with the public.The challenge with introducing both PHA and PLA containers is that they look very much likePET containers which may cause contamination problems in the PET recycling stream.
A second major project is gasification. Gasification has become a viable option for recycling(including containers) in Europe. Gasification is a flexible, reliable, and clean energytechnology that can turn a variety of low-value feed stocks into high-value products, replacingtraditional oil and natural gas as an energy source, and can provide a clean alternativesource of base load electricity, fertilizers, fuels, and chemicals. It is a manufacturing processthat converts any material containing carbon—such as coal, petroleum coke (petcoke),biomass, or many types of beverage containers—into synthesis gas (syngas). The syngascan be burned to produce electricity or further processed to manufacture chemicals,fertilizers, liquid fuels, substitute natural gas (SNG), or hydrogen. Gasification has beenreliably used on a commercial scale worldwide for more than 50 years.
Alberta and all North American jurisdictions have long standing objections regardingtraditional incineration (whether for waste or low efficiency energy recovery) which isgenerally viewed as comparable to land filling. Gasification appears to be an incremental toexponential improvement upon traditional burning technologies, and a case can be made thatgasification may be a far better end use of some container streams for the environment thantraditional recycling processes. This is an area that may be worth further scrutiny; especiallygiven the City of Edmonton is building a gasification plant.
As a separate North American wide solely brandowner funded initiative, Coca-Colaintroduced the “PlantBottle” in the fall of 2009 that is made from a blend of petroleum-basedmaterials and up to 30 percent plant-based materials. The "PlantBottle" is currently made

10
Benchmarking Evaluation of Alberta’s Stewardship Program forRecycling Empty Beverage Containers
through a process that turns sugar cane and molasses, a by-product of sugar production, intoa key component for PET plastic. Manufacturing the new plastic bottle is reportedly moreenvironmentally efficient as well. Coca-Cola claims a life-cycle analysis indicates the"PlantBottle" with 30 percent plant-base material reduces carbon emissions by up to 25percent, compared with petroleum-based PET. A significant advantage to the "PlantBottle" isthat, unlike other plant-based plastics, it can be processed through existing manufacturingand recycling facilities without contaminating traditional PET. Another brandowner driveninitiative has been the significant reduction of plastic (PET) in containers over the past coupleof years, especially water bottles.
These initiatives are a conundrum, as the philosophy driving existing container recyclinglegislation is extended producer responsibility based on brandowners driving this effort tofundamentally redesign containers and packaging to facilitate re-use and recycling, andprotection of the environment, and not government organizations and their delegatedauthorities. Conversely, it may be indifferent to consumers how dollars are collected that fundresearch like this, whether it be through increased product costs, consumer fees,unredeemed deposits, or provincial/federal taxes; as the net total cost to the consumer maybe unchanged. In addition, initiatives such as gasification may require legislative support.
5. Enhance Depot Role, Technology, Location and Operations
a. Increase Depot Responsibility for Local Recovery RateThe Alberta depots presently are licensed to accept empty registered beveragecontainers, refunding customer deposits as per legislation, and receive compensationfrom the brandowner’s operational entities, ABCRC and ABCC. Depots are licensedindependently from the ABCRC and are under the jurisdiction of the BCMB. BCMB andthe brandowners are presently responsible for recoveries, not the depots, yet the depotsare the only organization that interacts with the public and in the local communities.Depots are currently a service provider with no direct responsibility for recoveriesalthough they are directly impacted by recoveries, as their revenue increases as theirvolume of redeemed containers increases which should relate to recoveries.
Most jurisdictions interviewed indicated that in their experience, the most effectivemarketing initiatives appear to be community based rather than broad jurisdiction wideinitiatives. If this philosophy is accepted and embraced, the depot appears bestpositioned to drive community based marketing programs to drive recoveries versusBCMB or the brandowners.
California deploys a program whereby depots are eligible for a bonus for increasing theirvolume to certain pre-established benchmarks. The intent is to entice depots to market“recycling” in their local area to increase their volumes thus increasing recoveries – thisprogram was implemented simultaneously with increased deposit rates resulting inincreased overall state recoveries. This initiative’s risk is that volumes are transferredfrom one depot to another with net recoveries unchanged.
There may be merit investigating the sharing of strategic responsibility for recoveries withthe depots. One option to consider is the California model, whereby financial incentivesare provided for increases in depot volume. A second option is revising the depotcompensation model whereby recoveries are managed by sales in the depot area, anddepots are compensated partially based on recoveries in their “area” – a much morecomplex approach. This may create significant additional financial incentives to optimizerecoveries on a local basis.
b. Add Capital Intensive Technology to Reduce Variable Labour CostsThe current manual sorting at the depot and the ABCRC levels is extremely expensive,susceptible to human error, and slow. Reverse vending machines (RVMs) have beentested in Alberta and are deployed in other jurisdictions with minimal success. They are
11
Benchmarking Evaluation of Alberta’s Stewardship Program forRecycling Empty Beverage Containers
slow, unreliable, and unable to process many of the containers that are within theAlberta’s program scope. RVMs have proven not to mitigate much of the labourcomponent and cost, and also don’t solve the current audit and compaction issues.
A new generation of automated counting and sorting technologies as well as compactiontechnologies at the depot level are currently being investigated by Alberta and otherjurisdictions. Several sorting, counting and compaction technologies employed by otherjurisdictions were documented during the benchmarking initiative. The leading technologyis from Denmark and marketed by Anker Anderson. This technology is capable of 32material type sorts and uses a bar code scanner with reported accuracy ratings of 98-99%. Given Alberta’s wide range of material types in its program and manually sortsreturned containers, the implementation of this type of technology presents potentiallysignificant process improvement opportunities.
The benefit would be reducing overall provincial processing costs (primarily labour) ascontainers can be counted, sorted, compacted and audited at the depot level- thus amove to single handling of containers. Depot capacities would also be greatly increasedwith minimal requirements for additional floor space. Consumers will have theircontainers counted and sorted extremely quickly and accurately. Given this equipmentsorts by bar code, contamination can mitigated if and when PLA containers areintroduced to the container stream.
The issue is the high capital cost, as the cost of each sorting unit ranges between$200,000 and $400,000. Compaction units are also capital intensive.
Consistent with the implementation of new and expensive technologies at the depot levelis the concept of ABCRC moving to a cross dock and brokerage operation rather asecondary sorting, compacting and audit operation, reducing overall system costs.
c. Locate More Depots in Retail Areas to Improve Customer AccessAlberta’s program, like most North American jurisdiction’s programs, began in the 1970sand 1980s based on a return to retail concept that beer retailers have successfullyoperated long before the advent of deposit systems for non beer containers in the 1970s.
The initial deposit systems for non beer containers were based primarily on a return toretail model similar to the beer. Beer retailers have continued to maintain return to retailoperations in Alberta and most other jurisdictions; while non beer container recyclingmigrated to stand alone depots that are now located primarily in industrial or commercialareas due to local zoning restrictions. Municipal ordinances restricting depot locations toindustrial and commercial areas is a common complaint by most North Americanjurisdictions as a barrier to improving recovery as customer access is potentially poor.
Alberta has largely merged the beer return to retail system with the non beer depots, asthere are now only 62 beer retailers collecting beer containers representingapproximately 1.5% of the total container stream. These 62 beer retailers remain out ofthe 145 beer retailers that were grandfathered into the system in 2001 when beer wasregulated in the Beverage Container Recycling Regulation. The BCMB has not acceptedany application from beer retailers for permits since these original retailers weregrandfathered. Other jurisdictions such as BC and Saskatchewan are merged to a lesserdegree.
One reason for this being beer retailers remit consumers their entire deposit whereassome depots remit only a portion of the consumer’s deposit. The result is that mostjurisdictions have beer retailers collecting beer containers in retail areas and depotscollecting all containers (including beer containers, but in many cases remitting onlypartial deposits) located in commercial or light industrial areas. Regardless of thereasons, consumers outside of Alberta with beer and non beer containers must sort and

12
Benchmarking Evaluation of Alberta’s Stewardship Program forRecycling Empty Beverage Containers
return their containers to different collection systems to redeem a discounted rate on theirpaid deposits.
California’s structure has merged the depot system with return to retail. Large grocerystores are legislated by the State as a “convenience zone” and in very simplistic termsmust provide a recycling depot within a half mile of their store (the legislation is muchmore complex than this, and allows for one depot to service several retailers in closeproximity). As a result, many large grocery stores have a depot located in their parking lotbeside or behind the store (the customers and containers don’t enter the store, and trafficand trucks are already present). The depot provides the customer a ticket voucher that isredeemed in the grocery store for cash or merchandise.
Pepsi and Waste Management have announced a program to place a new generation ofRVMs in public areas such as gas stations, convenience stores, stadiums, parks, etcoffering a personal reward system, allowing consumers to collect and redeem points foreach bottle or can they recycle in the RVM beginning in 2010. This may also be anopportunity to investigate to improve customer access if the technical issues that plaguedthe first generation of RVMs can be resolved (acceptance of complete program scope,mechanical reliability, climate compatibility, etc).
Alberta may want to investigate the California “convenience zone” structure as it may beviable in many communities as a way to improve visibility and consumer access. Thisprocess can facilitate better cash management, and is a marketing venture for thegrocery store without the issues historically related to return to retail as originallydesigned. This also provides a cross marketing opportunity for the retailer to market toconsumers redeeming their deposit through coupons, offers, etc.
d. Review and Update Depot Network and Geographic CoverageA thorough review of the existing depot network and the communities they serve shouldbe considered. The network of 216 Alberta depots has been in place for many yearswhile the communities they serve have grown, and in many cases the growth has beenimmense. While the numbers of depots has not substantially changed, the capacities andthroughput of the existing depots have increased substantially. Despite this capacityincrease, there may be incongruence’s between the network and the communities thatthey serve regarding access, service and capability.
Determining the optimal number of depots is difficult. Geography, populationdemographics, transportation networks, depot location dynamics (retail vs. commercialvs. Industrial) and depot size all impact the assessment, and make a “depots per capita”comparison of lesser value.
The potential deployment of new equipment estimated to cost hundreds of thousands ofdollars per depot may present the appropriate opportunity to review the depot networkincluding the number, size, geographic location, zoning location (retail vs. commercial vs.industrial locations), capability, service standards et al; and adjust the network based onthe current and forecast market requirements in conjunction to determining where andhow to deploy this expensive technology. There are obviously barriers in place in Albertaregarding adjusting the network, not the least of which are zoning challenges and overallresistance within communities to the location of depots in retail areas.
The significant cost of this technology may drive the depot network to move to a “hub andspoke” system used by numerous distribution, warehousing and transportationorganizations. The result of this type of network would result in small depots that don’thave the volume to justify expensive technologies transporting containers to largerregional depots for counting, sorting, audit and compaction rather than the present modelwhere all 216 depots collect containers and then transport the same containers to

13
Benchmarking Evaluation of Alberta’s Stewardship Program forRecycling Empty Beverage Containers
ABCRC processing centres in Calgary, Edmonton, Lethbridge and Red Deer forcounting, sorting, audit and compaction (once the ABCC consolidation is complete).
e. Enhance Commonality of Alberta’s DepotsAlberta’s depots, as with depots in most jurisdictions, operate with a degree ofindependence. Alberta depots adhere to a series of service standards, but generally donot have common signage, corporate dress, hours of service, or specific servicestandards in place—each depot is very different from the next. Saskatchewan depotsoperate on more of a “franchise” model basis with many more common elements such assignage, corporate dress, etc. Most jurisdictions interviewed would prefer that theirdepots operate with the premise that a standardized approach to depot operationsensures a standard for customer service and is a contributing factor to optimizingrecoveries. The reality is that most jurisdictions operate a legacy network of independentdepots making standardization a difficult process.
There may be opportunities to enhance the service at Alberta depots that may contributeto increased recoveries through the implementation of more provincial standards fordepot signage, appearance, location and service. This is in line with the vast majority ofsuccessful retail and service organizations that strive to standardize their operations froma customer perspective to optimize revenue and profit (and in the case of depots,recoveries and their profits).
6. Minimal Strategic and Operational Synergies with other Recycling Programs
Alberta, and most other North American jurisdictions, has separate recycling programs fortires, lubricating oil, oil containers, glycol containers oil filters, electronics, batteries, paint,hazardous household waste and dairy containers (outside of Alberta). Municipal blue boxprograms are also proliferating. Some depots in Alberta (approximately 50) andSaskatchewan collect used oil and electronics, with depots in other jurisdictions alsocollecting those and other recyclable products.
There appear to be few synergies with other programs at both the strategic and operationslevel due to different customer requirements for collection, risk and cost of crosscontamination (many of the other products contain toxins), the differing requirements ofprocessing and end markets, and the need to optimize labour and transportation efficiencies.A direct comparison between deposit programs and blue box programs was not explored, asthe focus of this report was to compare deposit programs.
7. Local Marketing Initiatives Appear to Most Effectively Increase Recoveries
The relationship between marketing (and specifically funds spent) and recovery rates isdebatable. Alberta spent $4.3 million on marketing in 2008 in anticipation of the increase indeposit rates and the addition of dairy containers to the program. Recoveries for non-beeraluminum, plastic and glass increased almost immediately as a result of the combinedincrease in deposit levels, a massive marketing effort and a downturn in the provincialeconomy. Separating the impact of each is difficult – most other jurisdictions view depositrates as the driver of recoveries versus marketing, but few have ever spent this magnitude offunds on marketing.
Virtually all other jurisdictions continue to spend relatively few dollars on marketing initiativesexcept BC. Marketing initiatives consist of traditional media advertising (TV, radio, print andinternet), joint ventures with partners that generally takes the form of fundraising for non-profitorganizations, community initiatives lead by local champions (community clean upcampaigns, etc) and small scale local initiatives.

14
Benchmarking Evaluation of Alberta’s Stewardship Program forRecycling Empty Beverage Containers
a. Traditional Advertising Quickly has Diminishing ReturnsMost jurisdictions do little advertising through media such as print, TV, radio and internet.Beverage container recycling programs tend to be mature and have been well brandedsince their introduction. The consensus of reviewed jurisdictions is that the messagerequires reinforcement, but there are quickly diminishing returns.

15
Benchmarking Evaluation of Alberta’s Stewardship Program forRecycling Empty Beverage Containers
b. Recycling Initiatives with Community Partners Appear PromisingAlberta and most jurisdictions have had success partnering with primarily non-profitorganizations to drive local recoveries while assisting the partner organization to raisefunds. The non-profit organization essentially collects containers in the local communityideally including containers that otherwise may not have been recycled.
c. Focus Marketing Locally in Each CommunitiesAlberta and most jurisdictions have found that the most effective marketing is in localcommunity and not jurisdiction wide advertising campaigns. Local marketing take theform of community clean ups, recycling drives in schools, etc, and usually are mosteffective when there is a local “champion”. There may be opportunities to leverage thedepot’s presence in their communities regarding local marketing.
d. Investigate Customer Rewards InitiativesCustomer loyalty programs have been extremely successful in numerous industries,ranging from earning “points” or “coupons” redeemable for merchandise, services, airtravel, etc.
In the recycling field, California has seen the beginning of industry developed loyaltyprograms. Los Angeles has recruited marketing partners whereby frequent users (basedon the volume of materials in the curb side boxes) receive coupons from participatingsponsors. The “Toll Roads”, a DAO like organization that manages the toll freeways insouthern California, has partnered with several retailers who in one case will pay $5 in acustomer’s Toll Road account for every $100 spent in the retailer’s store. A large highprofile grocery store will pay $0.10 per gallon of gas at a specific service station chain toa maximum amount for every $100 spent in their store (gas stations in Alberta havesimilar programs with air travel organizations).
There is also the Pepsi – Waste Management Dream Machine initiative referenced earlierthat is also based on a loyalty program.
There may be opportunities worth investigating in this area to drive additional recoveriesof containers through a “frequent beverage container recycler program” whereby aperson earns points, coupons or other types of perceptive value based on volumesrecycled.

16
Benchmarking Evaluation of Alberta’s Stewardship Program forRecycling Empty Beverage Containers
1. INTRODUCTION
1.1. PROJECT OBJECTIVES AND SCOPE OF WORK
The BCMB has been given ambitious targets for beverage container recycling in Alberta. Over the nextfew years, the BCMB is expected to achieve a minimum recovery rate of 85% and become a leader in thebeverage container recycling industry with a system that meets the Province’s expectations and that isinnovative, accessible and cost effective. The BCMB’s 2009 – 2011 Three Year Business plan identifiesfive priorities for beverage container recycling system:
Improved (and thus sustained) return rates. Reduced environmental impact for container use. Cost effective recycling system operations. Effective governance and management. Accountability and transparency.
Given the ambitious timeframes and the need to move quickly, Meyers Norris Penny (MNP) was engagedto identify opportunities that may contribute to increased return rates and to system cost effectiveness.Effectiveness was evaluated with respect to achieving mandated beverage container recycling outcomes,environmental performance, cost efficiencies, and the disposition and use of processed containers.Industry innovation and leading practice information was collected to provide a broad evaluation ofsystems in other jurisdictions and to consider opportunities for Alberta’s container recycling system.
1.2. KEY QUESTIONS TO BE ADDRESSED
As presented in the Request for Proposal for this engagement, the research and analysis needed toaddress the following six key questions
1:
1. How does the overall effectiveness of Alberta’s program compare, in terms of achievingmandated outcomes (e.g. material collection rates with programs targeting those same materialsin other jurisdictions and, scope of materials covered)?
2. How does Alberta’s program compare with those in other jurisdictions in terms to the types ofenvironmental performance indicators that are tracked and measured by the program’s managingorganization (from the collection through final disposition of the containers)?
3. What are the financial costs attributable to achieving mandated outcomes of Alberta’s programand how does this compare with the programs costs in other jurisdictions?
4. How does Alberta’s program compare with programs in other jurisdictions in terms of thedisposition of collected materials (i.e. the amount of material that is re-used, recycled, recoveredand the amount of material that ends up as residual disposed of in landfill)?
5. Are the most appropriate and efficient mechanisms being employed to achieve programobjectives in Alberta?
6. What are the examples of best practices or innovative approaches to waste stewardship of emptybeverage containers that can be identified form this analysis that would be appropriate forconsideration in Alberta?
1 Key Questions to be Addressed. Request for Proposal Benchmarking Evaluation of Alberta’s Stewardship Program for Recyclingof Empty Beverage Containers. Beverage Container Management Board. Issue date: September 28, 2009. Page 1.

17
Benchmarking Evaluation of Alberta’s Stewardship Program forRecycling Empty Beverage Containers
Building a response to these key questions required research effort in four main areas, these were theprimary focus of MNP’s work:
The achievements of the BCMB’s program compared with other jurisdictions. Focus is placed onkey mandated outcomes such as material collection rates on a container stream specific basis.
The environmental performance indicators that are tracked and measured by the BCMBcompared to other jurisdictions. These indicators relate to all aspects of the program fromcollection through to final disposition of containers.
The financial costs attributed to achieving the mandated outcomes. The disposition of collected materials in Alberta and other jurisdictions. This includes
comparisons of the amounts of material re-used, recycled and recovered versus land filled.
Additionally, leading practices and innovative approaches identified through the research and analysis ofother jurisdictions are to be highlighted for consideration by Alberta’s beverage container stewardshipprogram.
A major challenge in the beverage container recycling industry is that there is not a clearinghouse forprogram information. Each jurisdiction, and in many cases the brandowners within each jurisdiction,collects and reports their own results with varying commonality, disclosure and audit requirements;making comparisons challenging. This study is based upon the best data available.
1.3. PROJECT DELIVERABLES AND TIMELINES
Project deliverables and timelines were discussed during the project planning and initiation activities inPhase 1. The projected project end was initially March 12, 2010. Due to delays in engaging comparablejurisdictions, timelines for the project shifted. The final report, this document, was provided to BCMB onFriday, June 25.

18
Benchmarking Evaluation of Alberta’s Stewardship Program forRecycling Empty Beverage Containers
2. APPROACH & METHODOLOGY
2.1. PRELIMINARY RESEARCH
MNP conducted desktop research reviewing current beverage container deposit systems in jurisdictionsacross Canada, the United States (US) and Europe. A preliminary evaluation revealed a number ofpotential comparable jurisdictions that may be effectively benchmarked against Alberta’s approach andsystem for container recycling. The selection was based on the jurisdictions: 1) comparability to theAlberta model in the areas of governance structure, the types of containers collected and the source ofprogram funds, and 2) the overall strength of the collection program including the demonstration ofleading practices and innovative approaches.
The beverage container recycling programs chosen for comparison were organized into two tiers. Thefirst encompassed eight programs or jurisdictions that were considered relevant for effectivebenchmarking. Research to date revealed that these programs, spanning Canada, the US, Europe andAustralia, lead the field in terms of their organizational structure, overall effectiveness, or their innovativepractices.
BC Saskatchewan Oregon California Norway Denmark Germany South Australia
There is a second tier of programs that were considered to add value to the benchmarking despiteduplicating some of the systems examined in Tier 1 or possessing key characteristics that may limit directcomparisons to Alberta’s approach. These jurisdictions are particularly well-suited to an investigation ofleading practices, and further research can enhance the benchmarking analysis. The following fourprograms were chosen to be studied in greater depth and compared to Alberta:
New Brunswick Michigan New York Sweden
2.2. IN DEPTH BENCHMARKING
MNP conducted a review of leading practices within the industry during the in depth benchmarking studyof selected jurisdictions. The differing approaches to beverage container recycling deployed by certainNorth American and international jurisdictions provide a basis for a review of alternative approaches andleading practices that may be applied towards improvements in Alberta’s system. In addition to evaluatingprogram scope, deposit levels, sales, recoveries and costs, a review of leading practices was conductedin the following categories:
Legislation and regulation; Program structure including depot incentives and deposit rates; Depot infrastructure and operations including depot organization, depot locations and corporate
standards; Technology; Transportation; Marketing initiatives; Incineration for end use; and European initiatives.

19
Benchmarking Evaluation of Alberta’s Stewardship Program forRecycling Empty Beverage Containers
Data questionnaires were designed to collect information about a jurisdiction’s program, containersincluded in the program, recycling volumes, return rates, deposit rates, financial data (revenues andcosts), materials handling and disposition practices, environmental performance measures and leadingpractices. The complete data questionnaire is provided in Appendix B.
Data questionnaires were sent to representatives in jurisdictions that agreed to participate in the study. Insome cases, the data questionnaire was sent as part of the request for participation to facilitate identifyingthe appropriate contact in a jurisdiction. Interview protocols were developed to guide a telephoneinterview discussing additional program details, evaluating leading practices about technology, marketingbudget spending, environmental activities, and performance measures. The interview protocol sent tointerviewees is provided in Appendix C.
Given the amount and diversity of information being requested, in some cases answers and knowledgeabout a jurisdiction’s recycling program was spread across numerous people, departments and/orcompanies. In those cases, every reasonable effort was made to engage the right stakeholders whileensuring each key player was given the opportunity to participate. For example, in New Brunswick asystem regulated by the New Brunswick Environment (government) and implemented by two agents.MNP was successful in engaging the government and one agent, Alcool. Rayan Investments, the otheragent, declined to participate in our study. In this case, two data questionnaires were collected and twointerviews conducted to ensure MNP gathered as much information as possible to develop a strongunderstanding about all aspects of the jurisdiction’s practices.
The following table, Exhibit 2-1 depicts by jurisdiction the departments/companies contacted and whatinformation MNP was able to collect.
Exhibit 2-1Jurisdiction Participation Summary
Jurisdiction Agent/ Company/ Government Department Data Questionnaire Interview Notes
Encorp Pacific ● ●
Brewers Distributor Ltd ● ●
Saskatchewan SARCAN ● ●
New Brunswick Environment ● ●
Alcool ● ●
Rayan Investments - -
California
Department of Resources Recycling and
Recovery● ●
Oregon - - Declined to participate
Department of Environmental Protection ● ● Subsitution for Oregon
Department of Environmental Protection,
Recycling Division- -
Department of Environmental Protection,
Pollution Division- -
Department of Treasury ● -
Used Beverage Container Recovery (UBCR) - ●
New York Department of Environmental Conservation - -
Norway Norsk Resirk - -
Sweden Environmental Protection Agency - -
Denmark Retursystem - - Received notes from John Bachinski
Germany Pfandsystem GmbH - - Received marketing materials
Statewide Recycling Pty. Ltd ● ●
Marine Store Pty. Ltd - -
Environmental Protection Agency - -
● Information collected - Information not collected
British Columbia
New Brunswick
Connecticut
Michigan
South Australia

20
Benchmarking Evaluation of Alberta’s Stewardship Program forRecycling Empty Beverage Containers
In some cases, identifying an appropriate contact in particular jurisdictions willing to participate in thebenchmarking presented significant challenges. Mid-way through the project Oregon was substituted forConnecticut as they declined to participate. While other jurisdictions initially agreed to participate, theyeventually declined. Online information has been used to populate tables where possible.
Jurisdictions track and monitor program performance differently. Sales, recoveries and cost informationare inconsistently reported and often not directly comparable to other jurisdictions. Our approach was tonormalize all data where feasible to facilitate accurate comparisons. Additionally, private sectororganizations in many jurisdictions are responsible for beverage container recycling and view some of allof the information requested to be proprietary, thus little to no information in some jurisdictions could beaccessed, particularly in Europe. Despite the challenges, a critical mass of information was collected toeffectively benchmark the BCMB program and answer the six questions posed as the basis of theengagement.
2.3. ASSESSMENT AND EVALUATION
Information and data collected throughout the research and benchmarking activities was compiled andorganized to facilitate review. Using the evaluation framework developed in advance of the researchactivities, evaluation and analysis was undertaken to answer the questions posed as the basis of theengagement.
Quantitative and qualitative analysis was conducted to determine findings and draw conclusions about:
The BCMB’s achievement of its program mandate including its collection rates and the scope ofmaterials covered.
Environmental performance including the tracking and monitoring that occurs to monitorachievements from container collection through disposition.
Program costs based on calculations that normalize comparisons between jurisdictions wherepractical.
The disposition of collected materials and opportunities to improve the reuse, recovery andrecycling of containers through the identification of practices that reduce recyclables in landfills.
The effectiveness of different approaches used to meet recycling program objectives and theopportunities for improvement.
The relevant marketing, technology and partnership arrangements that other jurisdictions haveentered into.
Appropriate leading practice opportunities for Alberta to improve waste stewardship of emptybeverage containers and develop innovative approaches for future consideration.

21
Benchmarking Evaluation of Alberta’s Stewardship Program forRecycling Empty Beverage Containers
3. PROGRAM ATTRIBUTES & PERFORMANCE
Benchmarked programs operate similarly in that they each refund a deposit (or portion thereof) thatconsumers paid when they purchased a beverage container. Empty containers are collected, processedand recycled for the material to be used again thereby reducing waste and protecting the environment.Different funding strategies exist but most jurisdictions finance operations by using unredeemed deposits,an additional consumer fee (termed a Consumer Recycling Fee, or CRF, in Alberta), a brandowner feeand the sale of processed containers.
This chapter contains program information and performance data for reviewed jurisdictions whereinformation was available. Several jurisdictions selected for in-depth study declined to providebenchmarking data required to undertake analysis and draw conclusions. All Canadian jurisdictions not inthe scope of the in-depth benchmarking but whose data was readily accessible are included in theprogram performance evaluation to better compare Alberta to others in the beverage container recyclingindustry.
3.1. LEGISLATION
Beverage container stewardship exists in varying forms where regulation may define programparameters, governance model, materials scope, funding model, licensing and permitting depotoperations, and set deposit-refund amounts and recovery rate targets. Across jurisdictions, the objectiveof implementing stewardship programs is consistent; to maximize recovery of containers to reduce theenvironmental impact of beverage containers on the environment, to divert materials from landfills and tore-use or recycle beverage containers. In many cases, beverage container stewardship legislationoriginates in a government’s efforts to solve a common problem: litter.
As early as 1970, Canadian provinces began legislating beverage container recycling many to reduce theimpact of litter in communities. BC led legislating beverage container stewardship by introducing theirRecycling Regulation in 1970, followed closely by Alberta in 1972 with the Alberta Beverage ContainerRecycling Program. Several other Canadian provinces and US jurisdictions soon followed in the late1970s and 1980s. European countries began legislating beverage container recycling programs in the1980s and 1990s. South Australia introduced legislation in 1975 and while planning is underway, theycontinue to this day as the only Australian state with a beverage container stewardship program in place.
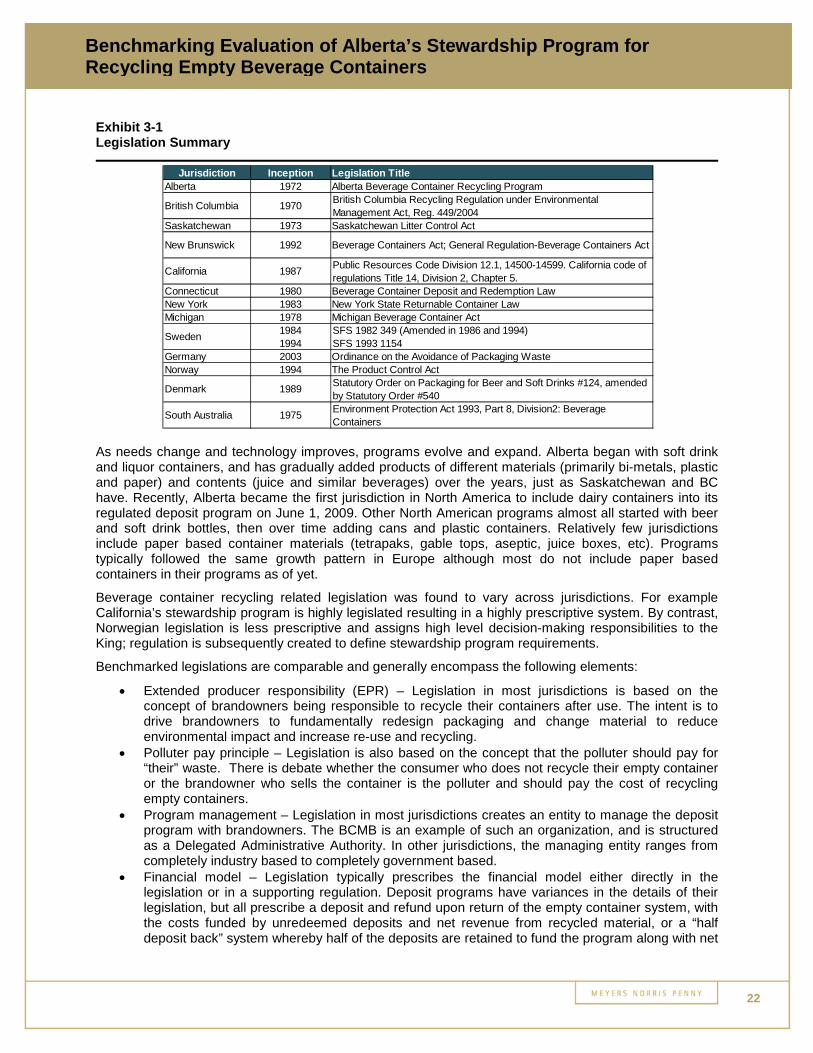
Exhibit 3-1 illustrates an overview of the dates stewardship programs were implemented in eachjurisdiction. It also states the legislation that led to the program's existence.
22
Benchmarking Evaluation of Alberta’s Stewardship Program forRecycling Empty Beverage Containers
Exhibit 3-1Legislation Summary
As needs change and technology improves, programs evolve and expand. Alberta began with soft drinkand liquor containers, and has gradually added products of different materials (primarily bi-metals, plasticand paper) and contents (juice and similar beverages) over the years, just as Saskatchewan and BChave. Recently, Alberta became the first jurisdiction in North America to include dairy containers into itsregulated deposit program on June 1, 2009. Other North American programs almost all started with beerand soft drink bottles, then over time adding cans and plastic containers. Relatively few jurisdictionsinclude paper based container materials (tetrapaks, gable tops, aseptic, juice boxes, etc). Programstypically followed the same growth pattern in Europe although most do not include paper basedcontainers in their programs as of yet.
Beverage container recycling related legislation was found to vary across jurisdictions. For exampleCalifornia’s stewardship program is highly legislated resulting in a highly prescriptive system. By contrast,Norwegian legislation is less prescriptive and assigns high level decision-making responsibilities to theKing; regulation is subsequently created to define stewardship program requirements.
Benchmarked legislations are comparable and generally encompass the following elements:
Extended producer responsibility (EPR) – Legislation in most jurisdictions is based on theconcept of brandowners being responsible to recycle their containers after use. The intent is todrive brandowners to fundamentally redesign packaging and change material to reduceenvironmental impact and increase re-use and recycling.
Polluter pay principle – Legislation is also based on the concept that the polluter should pay for“their” waste. There is debate whether the consumer who does not recycle their empty containeror the brandowner who sells the container is the polluter and should pay the cost of recyclingempty containers.
Program management – Legislation in most jurisdictions creates an entity to manage the depositprogram with brandowners. The BCMB is an example of such an organization, and is structuredas a Delegated Administrative Authority. In other jurisdictions, the managing entity ranges fromcompletely industry based to completely government based.
Financial model – Legislation typically prescribes the financial model either directly in thelegislation or in a supporting regulation. Deposit programs have variances in the details of theirlegislation, but all prescribe a deposit and refund upon return of the empty container system, withthe costs funded by unredeemed deposits and net revenue from recycled material, or a “halfdeposit back” system whereby half of the deposits are retained to fund the program along with net
Jurisdiction Inception Legislation Title
Alberta 1972 Alberta Beverage Container Recycling Program
British Columbia 1970British Columbia Recycling Regulation under Environmental
Management Act, Reg. 449/2004
Saskatchewan 1973 Saskatchewan Litter Control Act
New Brunswick 1992 Beverage Containers Act; General Regulation-Beverage Containers Act
California 1987Public Resources Code Division 12.1, 14500-14599. California code of
regulations Title 14, Division 2, Chapter 5.
Connecticut 1980 Beverage Container Deposit and Redemption Law
New York 1983 New York State Returnable Container Law
Michigan 1978 Michigan Beverage Container Act
Sweden1984
1994
SFS 1982 349 (Amended in 1986 and 1994)
SFS 1993 1154
Germany 2003 Ordinance on the Avoidance of Packaging Waste
Norway 1994 The Product Control Act
Denmark 1989Statutory Order on Packaging for Beer and Soft Drinks #124, amended
by Statutory Order #540
South Australia 1975Environment Protection Act 1993, Part 8, Division2: Beverage
Containers

23
Benchmarking Evaluation of Alberta’s Stewardship Program forRecycling Empty Beverage Containers
revenue from recycled material. Additional consumer fees are typically allowed within thelegislation or within policy where unredeemed deposits and recycled material revenues to not fullyfund the program.
Escheats – Legislation, typically in US jurisdictions, allow state governments to use unredeemeddeposits for other purposes. Escheating in California has recently contributed to funding instabilityof the State beverage container recycling program. Some Canadian programs that employ a half-back refund return rate are considered to escheat as does Saskatchewan where the provincialgovernment retains all deposits and grants their program operating funds.
End use – With the exception of California, all North American jurisdictions prohibit the burning ofrecycled beverage containers by legislation or by practice (with minimal exceptions in mostjurisdictions, primarily some paper products). Most European jurisdictions do allow burning forenergy recovery, as they consider this a re-use of the material.
3.1.1. Legislated Program Scope, Deposit-Refund Rates & Recovery Rates
Program scope and recovery are defined in all jurisdictions either by legislation or by regulation.Legislation in jurisdictions such as BC, New Brunswick and California specifically describe whichcontainers are included and excluded in program scope whereas other jurisdictions such as Alberta andSaskatchewan describe program scope in regulations and/or policies.
Deposit-refund rates are legislated in some jurisdictions such as Alberta, BC, New Brunswick, Californiaand Denmark. Jurisdictions such as Norway and Saskatchewan do not legislatively mandate deposit-refund rates but assign them in regulations and policy.
Four jurisdictions reviewed mandate recovery rate targets in legislation. BC requires 75% recovery,California mandated an 80% recovery and Denmark a 98%. Distributors in South Australia are required tosubmit stewardship plans to achieve a 75% return rate within two years of the commencement of theplan, and a recovery rate of 80% within five years. Each jurisdiction has relatively unique agreementsbetween the governing entity and brandowners that were not provided for purposes of this study by therespective jurisdictions.
3.2. GOVERNING STRUCTURE
Stewardship programs across North America and Europe are structured differently in order to efficientlyoperate within its jurisdiction’s unique economic and demographic environment. However, all jurisdictionsshare high level similarities in its governance structure; each program is overseen by the government, anarm’s length organization, or the beverage industry itself.
Extended Producer Responsibility Organization: Legislation is in place to impose recycling obligationson the beverage industry (brandowners). Under this model, government has no direct involvement in howindustry undertakes and performs recycling responsibilities. In these cases, industry may collaborate andstructure itself or outsource its responsibilities to a third party to ensure recycling requirements arecollectively fulfilled. Decision making is taken in the best of interest of the participant companies, who allhave strong motivation to meet their legislated duties.
Governmental Administrative Agency: Programs that are publicly administered and managed underthe Government’s Environmental Ministry or equivalent department follow this governance structure.Participation of industry stakeholders is limited to input and collaboration between relevant agents, butneither they nor the public, have direct influence or decision-making power within the program.
Delegated Administrative Organization (DAO): Stewardship programs may operate by an arm’s lengthorganization that is delegated government authority to impose requirements on recycling programstakeholders. DAO’s are unique as a range of stakeholders are encouraged to participate, such asindustry, government, and the public. These parties are primarily involved in program stewardshipthrough appointments to the Board of Directors.

24
Benchmarking Evaluation of Alberta’s Stewardship Program forRecycling Empty Beverage Containers
Exhibit 3-2 summarizes the governance structure for each jurisdiction reviewed.
Exhibit 3-2Governance Structure by Jurisdiction
Sources of revenue to fund program operations are in many cases defined by governance structure.Legislation mandating extended producer responsibility typically considers revenue generation throughunredeemed deposits, consumer fees, brandowner fees and revenue from the sale of processedcontainers. Where the intent is for brandowners to take financial responsibility, the critical programfunding decision is made when unredeemed deposits and revenue from collected material doesn’t coverthe total recycling cost. Alberta and most other North American jurisdictions impose a consumer fee(except for refillable beer in Alberta, 9% of the container volume), whereas in California and someEuropean jurisdictions, a brandowner fee is levied. Legislation in each jurisdiction is different, with thelegislation being very prescriptive regarding the funding sources, while others such as Alberta are silenton funding options beyond unredeemed deposits.
Jurisdiction Governance Structure
Alberta Delegated Administrative Organization
British Columbia Producer Responsibility Organization
Saskatchewan Delegated Administrative Organization
New Brunswick Governmental Administrative Agency
California Governmental Administrative Agency
Connecticut Governmental Administrative Agency
Michigan Producer Responsibility Organization
New York Governmental Administrative Agency
Denmark Delegated Administrative Organization
Germany Producer Responsibility Organization
Norway Producer Responsibility Organization
Sweden Producer Responsibility Organization
South Australia Producer Responsibility Organization

25
Benchmarking Evaluation of Alberta’s Stewardship Program forRecycling Empty Beverage Containers
3.3. PROGRAM STRUCTURE
Stewardship programs are fundamentally based on the same premise – to collect and recycle a maximumamount of empty beverage containers – each program comprises design features to meet the uniqueneeds of a jurisdiction. The following are two key variances in program structures.
3.3.1. Variances in the Deployment of the Extended Producer Responsibility Model
Beverage container stewardship programs are regulated and legislated in all jurisdictions under study.Several jurisdictions reviewed operate industry led programs, with the extended producer responsibilitymodel embedded in the legislation. Jurisdictions reviewed were found to have similar legislation withrespect to governance models with most ultimately placing the onus on brandowners to ensure theirproducts are recycled and satisfactory environmental outcomes are achieved.
BC legislation assigns full stewardship responsibilities to brandowners They are required tosubmit and have approved a Product Stewardship Plan that provides for collecting and paying thecosts of collecting and managing products in the system; provide consumers access to collectionfacilities; make consumers aware of the program; assess the program’s performance; offer adispute resolution process; and minimize environmental impacts of a product. Producers mayappoint an agency to carry out stewardship responsibilities. Encorp Pacific is assignedstewardship responsibilities for non-beer containers, including licensing depots in the provinceand Brewers Distributor Limited (BDL) is responsible for beer containers. For BDL, a 75%recovery rate in legislation is the only prescribed outcome. Comparable legislation exists forEncorp for the non-beer stream. Brandowner’s Product Stewardship Plans, that may detailadditional requirements, were not made available by the province or brandowners for thisbenchmarking initiative.
Saskatchewan does not mandate the recovery rates for the deposit beverage system. Theprovincial government has mandated a 75% return rate for the voluntary dairy container recyclingprogram which has not been met, and government has done nothing to enforce this expectation.SARCAN is funded through a grant process (given the organization’s mission to employedchallenged citizens in addition to help steward the environment) not directly connected toprogram performance.
New Brunswick follows an extended producer responsibility model where distributors submit astewardship plan for containers they produce that are approved for sale in the province.Distributors may assign stewardship responsibilities to an agent acceptable to the Minister.
While not a pure extended producer responsibility model in Denmark, the state has appointedDansk Retursystem A/S for collection and recycling management responsibilities as well assettling financial accounts and monitoring program compliance. Brandowners are required toregister containers with Dansk Retursystem A/S for inclusion in the deposit program. Feescharged to brandowners finance the program.
Norwegian legislation is very broad and assigns decision making powers to the King. It requiresthat any producer of beverages take reasonable steps to prevent or limit the environmentaleffects of materials they produce.
All containers sold in South Australia must have a waste management arrangement in place todeal with empty containers, in some cases a Super Collector (agent) must be selected forcollection and recycling duties. As with numerous other jurisdictions, South Australiabrandowners are required to apply and have their beverage containers approved by the Authorityfor them to be included in the deposit program.

26
Benchmarking Evaluation of Alberta’s Stewardship Program forRecycling Empty Beverage Containers
Alberta’s stewardship program is structured as a DAO, underneath the DAO it operates as anindustry led extended producer responsibility model. Alberta’s board functions as a regulatoryboard comprised of balanced representation from manufacturers, depots and the public.Brandowners are mandated to use common collection and recycling systems thus the formationof the ABCRC (non-beer) and the recycling division of BDL (beer). In contrast BC’s program isoperated by Encorp who are governed by an industry board. In Alberta the governing body, theBCMB, is responsible to license depots compared to BC where the industry body, Encorp,licenses provincial depots.
3.3.2. Deposit Rates
Varying deposit rates are a major factor in recoveries. Deposit rates are viewed to be the most influentialdriver of return rates by most jurisdictions reviewed. The higher the deposit rate, the higher the returnrate. Deposit rates generally increase by container size, container material and/or the type of beverage acontainer holds (i.e. alcoholic, non-alcoholic, dairy, etc.). Deposit rates reviewed range greatly andtypically start from $0.05 in Connecticut and New York and go up to $0.57 (CDN) for refillable plasticbottles in Denmark. Deposits are refunded when customers have met the recycling requirements.
Alberta does not require customers to sort containers. In many jurisdictions, consumers must sortcontainers to a greater or lesser extent (depending upon the jurisdiction and the type containers – inmany jurisdictions, beer containers have different processes than non beer containers) prior to depositrefund. In 2007, California raised their deposit rates the second time in two year resulting in an increasingoverall recovery rate of 85.2% in January to June, 2009. Alberta has recently raised their deposit ratesand recovery increased 5.7% resulting in an overall 82.4% recovery rate in December 2009 (please referto 3.11 for a further discussion regarding deposit rates and recovery).
Some jurisdictions, such as California, employ a variable deposit-refund rate that differs by containervolume. For example, sorted containers less than 24 ounces have a deposit-refund rate of $0.05, andsorted containers 24 ounces and greater have a deposit-refund rate of $0.10. Deposit-refund rates differwhen containers are returned unsorted. Unsorted container loads are given co-mingled return rate. Theco-mingled return rate is less than a full refund for a load of sorted material and is calculated as anaverage of return value of all materials. A co-mingled rate offers choice to the recycling public, andprovides an incentive for pre-sorting to take place, thus reducing program costs by limiting manual sortingin advance of deploying high speed sorting technology.
3.4. DEPOT INFRASTRUCTURE AND OPERATIONS
Depots represent the public face of beverage container recycling. Their location, infrastructure andorganization are generally thought to be an important mechanism to attract the recycling consumer.
3.4.1. Depot Organization
Currently in Alberta, as with most other deposit program jurisdictions reviewed, depots tend to beindependent businesses licensed by the governing body or the brandowner organization. Licensearrangements vary significantly, ranging from rigorous “franchise” type arrangements in BC,Saskatchewan and other jurisdictions where signage, corporate dress, hours, procedures, etc, areprescribed in detail; compared with much looser arrangements such as those in Alberta and Californiawith lesser prescription. As a result, most depots in BC look and operate very much alike, whereas depotsin Alberta and other jurisdictions may look and operate very differently from each other.

27
Benchmarking Evaluation of Alberta’s Stewardship Program forRecycling Empty Beverage Containers
3.4.2. Depot Funding
Depot revenue is typically generated solely by handling fees paid for collection efforts at recyclingstations. Some jurisdictions supplement the handling fee revenue stream and offer incentive basedfunding to depots for undertaking additional recycling processing tasks, such as sorting and densification.Additional funding for recycling centres creates opportunity to purchase and implement technology toimprove economies of scale and continue to increase production, thereby potentially increasing depotrevenue and overall program recovery rates. While depots are not assigned responsibility for maintainingor increasing recovery rates, they may benefit financially from actively participating in doing so byincreasing their volume.
BDL in BC is one such example; depots collect additional payments for sorted and compacted containers.Depots can earn additional revenue by coordinating the pick-up of empty containers from licensees suchas bars, restaurants and hotels, therefore reducing BDL transportation and storage costs. Californiaimplemented a program whereby depots were paid a bonus to increase their volume to pre-determinedbenchmarks, with the intent to increase overall state recoveries. Some California depots were also paid abonus for quality, referring to sending collected containers to processors free of contaminants, again withspecific pre-determined criteria.
Beer containers are an anomaly. Alberta is the only province under review that has regulated beercontainers for a deposit-refund rate. Saskatchewan mandates a refund amount of $0.05 for all containers,but deposit-refund amounts implemented generally exceed the minimum set by legislation. In BC andother jurisdictions, beer refunds to the consumer are at times discounted in order that the depot can coverits costs to handle the container. The result is that the deposit value returned to the customer may vary bydepot, and is generally lower and less than the full refund at a depot than a beer retailer.
3.4.3. Depot Locations
Generally, depots are geographically located to optimize accessibility and are typically based ondemographics and population distributions. Differing strategies are employed depending on the areaswhere depots are located, e.g. retail, commercial and/or industrial.
In North America, most depots are in commercial and industrial areas due to limitations imposed by localgovernments. Local governments tend to restrict depots to commercial or industrial areas as opposed toresidential developments due to perceptions associated with depots in that they attract undesirablecustomers, they can be unsightly, noisy, dirty, smelly, and attract significant increases in traffic, includingincreased truck traffic. Occupancy costs are a second driver for depots to be in industrial and commercialareas as this space tends to be less expensive than retail space.
California has overcome objections from local governments through state legislation establishing“convenience zones” requiring a recycling facility within a half mile of a major grocery retailer. The resultis that most California depots are located in retail areas optimizing convenience for consumers, andovercoming local government objections. Many depots actually operate in the parking lots of majorgrocery chains, mitigating the issues of additional traffic and specifically truck traffic. This also presents across marketing opportunity for the grocery retailer as the actual cash is redeemed inside the grocerystore while the containers are redeemed at the depot outside the store.
Return centres in European jurisdictions are typically found in retail locations as the return to retail modelis widely deployed across Europe.

28
Benchmarking Evaluation of Alberta’s Stewardship Program forRecycling Empty Beverage Containers
3.4.4. Return to Retail
Some jurisdictions legislate a return to retail requirement, a return approach that requires retailers thatsell beverage containers to accept the empty containers and refund deposits. Most jurisdictions otherthan Alberta and California mandate a return to retail mechanism for some or all products. Beer,especially refillable beer, has long had a return to retail structure in place typically before depositprograms were formalized and deposit networks were established. Given this legacy, many jurisdictionsincluding BC and Saskatchewan have separate recycling structures for beer and non beer products.
While legislation may not specifically require return to retail in European jurisdictions, this system isparticularly prevalent in areas of Europe. The return to retail concept in Europe appears to be culturallyaccepted. Shopping habits and household storage are different in European households than in NorthAmerican. People shop more frequently in Europe and recycling fewer containers more often making areturn to retail model attractive and feasible.
Return to retail for beer containers (especially refillable beer) is somewhat unique in North America andappears to be an anomaly for return to retail. Consumers have recycled beer containers long beforerecycling programs and deposit systems were implemented in the 1970s with the recycling of specificallythese containers at beer or liquor stores appears to have become a cultural norm. Refillable beercontainers almost always have the highest recovery rate in every jurisdiction followed closely aluminumand non refillable glass containers. Beer and liquor used to be sold exclusively in liquor stores acrossNorth America as it still is in Alberta, and most of these liquor stores also collected the empty containers.Beer and liquor is now widely available outside of liquor stores in most US jurisdictions while the liquorand/or beer store model generally prevails in Canada.
Canadian return to retail program structures for non beer products have proven problematic. Retailershistorically discouraged the program, did not set up for it to streamline the process, and this approachgenerally proved inconvenient for consumers. Consumers found hauling large volumes of containersthrough grocery stores and convenience stores to be undesirable and inconvenient. The result is thatstand alone depots have become commonplace and return to retail volume of non beer containers is low.Another reason for the low volumes at return to retail locations are the maximum limits on containerreturns that are impose, and BC and Saskatchewan are two such examples.
Beer retailers in Alberta, BC and other provinces continue to collect beer containers in large volumes;whereas return to retail collection systems for non beer containers at grocery and convenience stores,have historically collected small volumes while stand alone depots collect the majority of containers.There are currently 62 active beer retailers that accept returned beer containers, representingapproximately 1.5% of the total containers recovered in Alberta.
Return to retail structures in Canada for beer containers is also a marketing initiative for beerbrandowners. Encouraging the redemption of empty containers at beer retailers is an incentive to bringconsumers into these stores and a sales opportunity. As an additional incentive for consumers, fullrefunds are offered at return to retail beer stores whereas the refund is discounted at depots (except inAlberta, where consumers always receive full refunds on beer containers).
Return to retail appears more popular in the US for the wide spectrum on containers, where Michigan andnine of the other 10 deposit systems operate a variety of return to retail and depot systems. Californiadoes not operate a return to retail system, but given the State does have requirements about the locationof return centres nearby grocery stores, they seem to have partially achieved the best of both models.Numerous grocery stores have recycling facilities in their parking lots offering convenient returns to theircustomers. Many recycling facilities are equipped with RVMs for small numbers of returns, while offeringreturn by weight options for those returning larger quantities. While this system is not a pure return toretail system, it functions in a similar way. One grocery chain, Whole Foods, representing approximately1% of the grocery market deploys RVMs as a kiosk in front of their stores.
There are ongoing issues with both approaches – return to retail and depots.
Return to retail is very convenient for consumers redeeming small numbers of containers. It is also costeffective where the retail facilities are set-up for recycling such as the beer retailers are in most Canadian

29
Benchmarking Evaluation of Alberta’s Stewardship Program forRecycling Empty Beverage Containers
jurisdictions. They are inconvenient for consumers with large volumes of containers and those with morethan just beer containers as the non beer containers must be redeemed elsewhere. They are alsoinconvenient for consumers when there are two recovery mechanisms for beer and non beer containers,especially as the deposit redemption is discounted at a depot versus the beer retailer, thus the consumerneeds to make two trips to get their deposit fully refunded.
Grocer’s associations in Alberta and across North America generally support depot networks as analternative to return to retail, given their members stores are typically not set-up for container collectionand they view it as a detriment (perceptions of consumers with dripping bags of containers waiting in longlines, sanitary and contamination issues, logistical and space issues, labour costs, etc).
Stand alone depots are far more convenient for consumers returning larger volumes of containers and/ora mix of containers, and being located in non retail areas generally results in better vehicle access. Thelocation of depots is on ongoing issue. Municipalities tend to restrict depots to commercial or lightindustrial areas as discussed in 3.4.3, making their location less convenient for consumers. A benefit tobeing located in non-retail areas is that occupancy costs tend to be lower thus lowering overall collectionsystem costs. As previously mentioned, depots in many jurisdictions offer discounted depositredemptions for beer containers due to the lack of legislation that creates two separate collection streamsthat Alberta has largely harmonized, creating angst among consumers.
3.4.5. Depot Standardization
Each jurisdiction imposes varying degrees of standardization on their depots for signage, corporate dress,facilities and procedures. As part of the licensing process in most jurisdictions, depots must meetinspection requirements; but requirements and regulation significantly vary from one jurisdiction toanother. Beyond meeting minimum health and safety regulations and some operational standards, thedegree of involvement from a licensing body can vary quite drastically. Jurisdictions like Alberta,California and Connecticut impose no standard corporate dress requirements and depot operators areable to set up their facility as they choose as long as required criteria are met.
All jurisdictions, including Alberta attempt to impose some service standards in order to encourage apleasant customer experience. These may include signage, posted hours of operation and inspectionrequirements. Each jurisdiction reviewed has a varying set of depot standards, and most would prefer tomove towards standardizing corporate dress and facility appearance, including floors, counters, paint,lighting, staff uniforms and signage in an effort to improve the customer experience as a measure towardsimproving recoveries.
3.5. TECHNOLOGY
Consensus exists among virtually all jurisdictions that investment in high speed sorting and compactiontechnology may revolutionize the beverage container recycling industry. Technology is being deployed toaddress the following challenges:
High manual labour investment required by depots to sort and count containers as they arrive,and then sort, count and audit the same containers two or three times over throughout thedownstream process;
Co-mingling of materials that increase the incidence of contaminants in a recyclable materialstream reducing recycled material value in downstream markets;
Large volumes of returned containers require large warehouse space. Increasing recoveriesincrease depot volumes thus the need for a larger footprint driving higher occupancy costs.
High transportation costs and the impact of trucking on the environment. Recovered beveragecontainers have a very low weight to volume ratio unless very compacted, resulting in most truckstransporting recovered containers to process travelling significantly underweight;
Manual sorting results in inaccurate counts, sorts and auditing functions to improve productcleanliness and appropriate payments; and
Depots transact a large amount of cash, resulting in serious cash management risks. Cashmanagement solutions are a tremendous need for depots across North America. Smart cards and

30
Benchmarking Evaluation of Alberta’s Stewardship Program forRecycling Empty Beverage Containers
other electronic funds transferring mechanisms are being deployed to reduce the number of cashtransactions and reduce the overall exchange of cash. For example, California provides receiptsfor redemption in grocery stores.
The following are technologies currently being used or considered by jurisdictions reviewed.
3.5.1. Reverse Vending Machines (RVMs)
Several jurisdictions have implemented the use RVMs to facilitate the collection and sorting of emptycontainers. RVMs were designed to automate this process and replace systems where either customersor depot manually count and sort containers. In Alberta, depots count and sort containers for theconsumer, whereas in BC and other jurisdictions, the consumer is required to sort containers prior toredemption (except for some return to retail outlets). Regardless of who sorts the containers, the processis slow, labour intensive and inconvenient for consumers who either sort their own containers or watchsomeone else sort them.
RVMs were also seen as a mechanism to recover the hereto “unreachable” containers consumed outsideof consumer’s homes, schools and offices. RVMs have been reasonably successful in some jurisdictions,but have proven to be slow, mechanically unreliable and incapable of handling a diverse range ofcontainers, as well as cold weather climate. To offset their RVM’s slow speed, California has establisheda return by weight option for consumers returning larger quantities of containers. California has found thatcontamination issues are greater with payment by weight purchases (the opportunity for contaminantssuch as sand or water in containers has also created fraud issues).
RVMs are common in European jurisdictions; they are located in grocery stores and other retailers wherebeverages can be purchased. The European preference for the technology may stem from havingbecome accustomed to returning containers using RVMs and being limited in other deposit-refundoptions.
Benefits of RVMs include 24/7 beverage container recycling and support for customers with smallervolumes. RVMs are better suited for jurisdictions that have fewer materials included in their depositprogram like Connecticut and Michigan. While Connecticut has had mixed reviews about the technology,they are reported to be somewhat popular. RVMs have proven unsuccessful in Alberta due to their slowspeed, unreliability and inability to handle the diversity of materials included in Alberta’s program. Theinability to accept the range of containers in Alberta’s program scope is a major barrier, as the majority ofcontainers not accepted may find their way into landfills, defeating the overall program mission. Secondly,Alberta’s severe winter weather provides additional challenges to RVMs as the machines require heatedand dry locations for optimal operation.
Pepsi and Waste Management have announced the introduction of a new generation of RVMs brandedas a “Dream Machine” with a personal points rewards program, but no other information is available atthis time.
3.5.2. High Speed Sorting
Automated high speed sorters are beginning to replace slow, expensive and inaccurate manual sortingmethods in Europe. Manual counting creates significant work and cost, in addition it also introduceshuman error and potentially inaccurate payments to customers and/or depots, as well as inaccuracies inthe payments from processors to depots.
High-speed sorting technology is currently used in Denmark and Germany with reportedly excellentresults. The technology takes pictures of empty beverage containers to read the bar codes and perform asort. This technology is able to accommodate up to 32 material types and is well suited for recyclingprograms with wide material scope. Jurisdictions currently using the technology report a sorting accuracyof 98-99%. High speed sorting creates the opportunity to change the cash management structure for boththe depot and the customer. The optics are better for the customer (accurate sorts) and associatedtechnologies such as Smart Cards can be deployed. This technology, especially when combined withdensification technologies, may facilitate changes to the depot audit and payment processes. If the

31
Benchmarking Evaluation of Alberta’s Stewardship Program forRecycling Empty Beverage Containers
appropriate security systems are installed, the ability may exist to pay the depot based on containersthrough the counting equipment.
Alberta, BC and several other North American jurisdictions are investigating the potential implementationof this high speed sorting technology. It is capital intensive as each unit has an initial cost of $200,000 to$400,000 plus ongoing support costs. The capital cost of implementing this technology across ajurisdiction the size of Alberta will require other fundamental changes given that less than 40% of Albertadepots presently handle over 80% of the recovered containers.
An element to consider when evaluating high speed sorting technology is that this technology sorts basedon a bar code, not the shape or type of container. The customer is paid based on bar codes returned, andif the bar code is damaged, the technology can’t sort the container resulting in a potential manual sortstream. In Europe, it is accepted by consumers that a damage bar code makes the returned containerworthless.
In Connecticut, a simpler version of automated container sorting is deployed to separate the depositeligible containers from ineligible containers. This process uses a laser marking on the label that indicatesinclusion in the deposit program. This reduces cross-border returns of ineligible containers and preventsdeposit refunds on containers outside of the deposit program.
3.5.3. Compaction / Densification
Compaction of material improves recycling process efficiencies, reduces required depot footprint, andreduces shipping and transportation costs. Compaction can be performed at the depot level, upon returnof the container by the customer, or at the recycling processing centre. The earlier compaction isintroduced, the earlier process efficiencies can take place.
Upgrades to 15 depots in BC over the course of 2010 will introduce compaction units for PET plastic andaluminum cans. The EnviroPactor, a New Brunswick produced compaction technology, is also beingintroduced in BC. The EnviroPactor, a truck mounted unit, can compact virtually any aluminum or plasticcontainer at a 2:1 ratio. Encorp in New Brunswick also uses EnviroPactors and report truck containercapacity increases by 300%. Other benefits include a reduction in fuel costs.
Saskatchewan uses compaction technology. Small depots use ORWAK Barrel Compactors for plastics;Prodava systems are employed at medium sized depots, and Multi Material Flatteners are used in largedepots. Although these compactors make transportation more efficient, materials require additionalcompaction prior to being sent to a downstream processor. Additional compaction and bailing isundertaken at a central processing centre. Beer stores in BC and other provinces also use a variety ofcompaction processes.
Compaction is a mature and proven technology. Any reluctance to implementation is related to auditrequirements. Once containers are compacted on a 6 to 1 basis or more, it is extremely difficult to auditby recounting the crushed containers. Compaction technology on a program wide basis is only viablewhen coupled with automated sorting and counting equipment that lessens or eliminates the auditrequirement or where there is an agreement in place between the retailer and presser to use weight as aproxy for count.
3.5.4. Cash Management
Smart cards and other electronic funds transferring mechanisms are being considered as a method toreduce the number of cash transactions and reduce the overall exchange of cash. California minimizescash management in depots by providing receipts for redemption in nearby grocery stores.
The combination of sorting and compaction technologies improves accuracy, keeps material streams freefrom contaminants, reduces depot footprints (or provides opportunities to grow volume without addingspace) and transportation costs, reduces manual labour errors and costs, and streamlines the recyclingprocess. Densification following the count ensures containers cannot be removed from the stream andreturned for deposit redemption.

32
Benchmarking Evaluation of Alberta’s Stewardship Program forRecycling Empty Beverage Containers
Sorting and compaction technologies present the following challenges:
Auditing - Compaction complicates the auditing process as unit counts are not possible. Auditingby weight conversion provides alternatives, however for accurate weight measurement thematerial must be contaminant free. In virtually all jurisdictions depots are independent fromprocessors, thus rigorous audit procedures including secondary and tertiary counts are standardpractice. Saskatchewan uses a weight conversion verification approach at their processingplants. In a California where recycling centres and processing facilities are owned by the sameorganization, counting collected containers occurs once at the recycling centre unless signs offraud are identified.
Managing contaminants - Purchasers of recycled materials require a product free fromcontaminants. For example, no HDPE should be present in recycled aluminum. Purchasersimpose a threshold of acceptable contaminant levels, and resulting sorting technologies must beaccurate enough to ensure contamination levels fall within these thresholds to maintain thedownstream market price for the recovered container material.
Rejecting containers – Customers return empty containers in all formats. High speed sortingtechnology requires a legible bar code. Should the bar code be damaged or illegible, the sorterrejects the product. Containers that are too large or misshapen, such as tetrapaks and milk jugs,are difficult to read and may require manual sorting and counting.
Cost of technology - While very expensive, European jurisdictions where large volumes ofrecyclable container materials are processed have justified the investment through reducedlabour, occupancy and transportation costs, and an increase in quality and higher downstreamrevenue for less contaminated material.
3.5.5. New Material Types
Technology also comes in the form of innovative materials that may facilitate the manufacturing andrecycling of beverage containers. Research is underway to develop new container materials designed toimprove breakdown times and facilitate sustainable packaging. California is exploring container materialoptions and researching materials (through partnerships with academic institutions) that may have higherbreakdown rates in environments with particular characteristics, such as salt water (to combat pollution inthe ocean).
California also provides grants and has contracts with California universities to support research of bio-plastic development. It is thought bio-plastics would limit the effect bottles have on the environment if theyare not recycled. The main challenge with bio-plastic is managing public perception to prevent peoplefrom littering as they believe bio-plastic containers will simply disintegrate, thus feeling that recycling isnot necessary. Another key challenge relates to the contamination of the bio-plastic recycling stream withother plastics, especially PET.
California is also researching methane based plastics, PLA. The challenge with introducing PLAcontainers is that they require different processing temperatures than PET, making it a contaminate. PLAmixed with PET would dramatically increase the cost of recycling and reusing PET material.
3.6. TRANSPORTATION
Transportation challenges arise as recovered containers are extremely bulky yet lightweight, requiringsignificant densification to improve efficiency. Each jurisdiction reports that “trucks are cubed out, but farfrom grossed out.” Depots also tend to have a one way process flow, thus natural back haul opportunitiesare limited.
Potential process improvement and cost reduction solutions for these issues include densification ofcontainers to increase volume of recyclable material transported in a load, ensuring only full loads arepicked up, and beer distributors picking up refillable bottles at the time of delivery of new product toretailers.

33
Benchmarking Evaluation of Alberta’s Stewardship Program forRecycling Empty Beverage Containers
Most North American jurisdictions employ a transportation system that augments depot footprints thusreducing floor space requirements by using trailers or containers to store empty beverage containers.Trailers can augment depot floor space on a cost effective basis, and may improve overall depotefficiency. Transportation systems can accommodate other recycling program products in somejurisdictions such as recycled electronics, used oil products and paint.
SARCAN in particular transports other recycled material such as electronics, although this volume issmall and tends to be inefficient on a large scale. New Brunswick collaborates with the Product CareAssociation to transport used paint, and Encorp in BC collects and transports used electronics in workingwith Electronics Association of BC. Cross contamination of materials is always a risk, and transportingdiverse materials creates contamination risk and is generally discouraged.
All jurisdictions struggle with optimizing transportation efficiency. Increasing the weight of loadstransported from depots and optimizing backhauls is an ever present challenge in every jurisdiction.
3.7. FUNDING MECHANISM
Stewardship programs employ different mechanisms for collecting deposits and offsetting operatingcosts. Strategies such as Deposit Value are common in virtually all stewardship programs across NorthAmerica and Europe, whereas strategies such as Taxation are much less common. The use of multiplefunding mechanisms is common in virtually all jurisdictions, and they can be initiated or removeddepending on the rate of return that is observed in an operating year. Attributes of the various fundingmechanisms are illustrated in Exhibit 3-3.
Deposit Value: The program regime provides customers with compensation upon return ofbeverage containers in order to provide an incentive to participate in the program. The amount ofdeposits collected on unreturned containers are considered unredeemed deposits and they areoften used to cover the cost of recycling, or are remitted to the government for various uses suchas funding environmental programs, adding to the general revenue fund, or completely unrelatedprograms.
Recycling Levy or Consumer Fee: The purpose of this fee is to offset or subsidize the cost ofrecycling materials that are included in the relevant program. It is a non-refundable fee that isattached to beverage containers and is active at the time of consumer purchase.
Halfback System: Instead of refunding a full deposit value to customers for a container, thesesystems provide only a partial refund, usually 50%. The other portion may be used by thegoverning body to pay for the program or to fund other environmental/government programs. Halfback systems are useful when the governing body of the recycling program does not have theauthority to impose a recycling levy (because they are not part of the jurisdiction’s Government).
Sale of Processed Collected Containers: Recycling programs will incur a significant amount ofexpenses during collection, processing, and transportation operations. Selling processedcontainers (recyclable materials) to different markets often helps to recover a significant portion ofrelated expenses. Markets for processed containers are diverse and some materials, such asaluminum, command higher prices than others due in part to high demand levels.
Stewardship or Brandowner Fee: Puts the requirement on the beverage industry to contributefinancially to pay recycling costs of containers they introduced to the system. These costs aremay be passed down to the consumer via the purchase price. Stewardship fees may becalculated as a function of container weight using a collectively agreed upon fee schedule.
Taxation: This model is most often used in non-deposit jurisdiction where local municipalities andtownships are responsible for the collection and processing of used beverage containers. It isunique in that beverage container users or distributors are not directly responsible for funding theprogram. Instead, recycling costs are shared equally by tax payers in the jurisdiction.
Escheats: In these situations government collects any surplus that is accumulated throughunredeemed deposits or other aspects of the program’s operation. Instead of being used to offsetthe cost of the program (which is the most common use), these funds are used to supportgovernment programs, often environmental, outside of the recycling program.

34
Benchmarking Evaluation of Alberta’s Stewardship Program forRecycling Empty Beverage Containers
Exhibit 3-3Program Funding Mechanisms
California policy is silent on escheatment. Since 2002 the state government in California has divertedmore than $500 million to public funds to ease financial difficulties
2. California presents an example that
escheatment may have a negative impact on the financial integrity of the recycling program.Saskatchewan also escheats all unredeemed deposits, and grants SARCAN operating funds as aregistered charity. Half back programs in New Brunswick and Nova Scotia are also a form ofescheatment.
Another challenge with funding lies in the paradox that is created when unredeemed deposits fund astewardship program. The use of unredeemed deposits to fund recycling program follows the principal of“polluter pays” where in this case the polluter is defined as the wasteful consumer, meaning thatconsumers who do not recycle their containers forfeit their paid deposit to pay for the recycling of thecontainers that other consumers did return their container for remittance of their deposit. Given theobjective of a stewardship program is to achieve as high return rates as possible, declining unredeemeddeposits (as recoveries increase) reduce the revenue stream expected to pay for recycling activities. Thismay eventually create financial shortfalls.
When these shortfalls have occurred in Alberta and most North American jurisdictions, container recyclingfees are applied to containers and the cost is charged to all consumers (both wasteful and recyclingconsumers), or in some cases fees are assessed to brandowners. In programs based on the extendedproducer responsibility philosophy where brandowners are defined as the polluter, they are mandated theresponsibility to collect and recycle empty beverage container material, the use of fees applied to allconsumers appears to contradict this philosophy. Europe typically implements brandowner fees.
All jurisdictions under review use unredeemed deposits to fund their stewardship program along withrevenue from downstream markets for recycled material, thus higher costs will be incurred byconsumers/brandowners (through non refundable fees) if rising recoveries diminish the pool ofunredeemed deposits, revenue from downstream markets decline due to falling prices, and/orunredeemed deposits are escheated. Consumer or brandowner fees that cover shortfalls ensureperpetual program financial integrity barring escheatment.
2See Recycling Program to Get Needed Funds: Governor Plans to Repay Millions Borrowed by State. Sign-On San Diego.
Sourced: January 13, 2010. http://www.signonsandiego.com/news/2010/jan/13/recycling-program-get-needed-funds/
Jurisdiction Deposit
Recycling
Levy
Stewardship/
Environmental
Fee Taxation Escheats
Alberta ● ●
British Columbia ● ●
Saskatchewan ● ●
New Brunswick ● ●
California ● ● ●
Connecticut ● ●
New York ●
Michigan ●
Sweden ●
Germany ●
Norway ● ● ●
Denmark ● ●
South Australia ●

35
Benchmarking Evaluation of Alberta’s Stewardship Program forRecycling Empty Beverage Containers
Funding recycling programs though unredeemed deposits create a natural tension between risingrecoveries and overall product cost to the consumer. As recoveries increase, unredeemed depositsdecline, and assuming scrap value of recovered containers remains constant, consumer/brandowner feesmust eventually increase to keep the program solvent. All beverages all have a market price elasticity,increasing the overall price of a beverage through additional consumer/brandowner fees will negativelyimpact sales, thus a disincentive for brandowners to support increased recoveries.
Most deposit programs also deploy consumer fees. The consumer fee (container recycling fee, or CRF)approach sees all consumers, whether they do or do recycle their containers and redeem their deposit,paying for the cost shortfalls for recycling containers. The CRF is transparent given it is chargedseparately, creating public awareness of the cost of recycling containers. There is no direct cost tobrandowners, but as mentioned previously there is an indirect cost as the selling price to consumers oftheir products is higher when the deposit and CRF is added, potentially impacting sales based on theprice elasticity of the local consumer.
Alberta has implemented consumer fees across the board specific to each material stream to covershortfalls. It may be argued that the refillable beer stream in Alberta, representing 9% of the in scopecontainers sold in Alberta, operates as a brandowner fee as the deposit and the container recycling feeare applied to the price charged to the provincial wholesaler (Alberta Gaming and Liquor Commission, orAGLC), who then sell it to retailers and ultimately to consumers for an “all in” price inclusive of the depositand container recycling fee. All other beer and non beer products in Alberta are sold to the wholesaler,retailer and consumers with the deposit and container recycling fee as an additional fee at the point ofsale.
The brandowner fee approach is deployed in California, Europe and to portions of beer streams inselected other jurisdictions. The brandowner fee approach in California is structured on an inverse slidingscale basis correlated to recoveries. Each material stream has a separate scale, but a brandowner willpay a minimum of 15% and a maximum of 65% of the financial shortfall, depending upon the actualrecovery rate, thus there is a financial incentive for brandowners support recycling efforts through designand packaging changes, marketing initiatives, etc. Given the state has escheated a significant portion ofthe unredeemed deposits; brandowners will pay a much larger portion of the shortfall in 2010.
Given California is approximately the size of Canada, financial incentives for brandowners in Californiaare obviously significant. Given brandowner fees are based on material stream versus specificbrandowner, the result is similar to the consumer fee approach as all containers in the stream are subjectto the same brandowner fee regardless of design, recycling attributes, etc. Current sorting technology inCalifornia doesn’t permit calculating recovery by brandowner. Creating competition betweenbrandowners within each material stream, thus a real financial incentive to reduce costs through improvedrecoveries versus competitors, requires the next generation of counting and sorting technology.
The philosophies of “extender producer responsibility” and “polluter pays” have presently ended up withcurrent consumer and brandowner fees (other than the brandowner fee structure in California) appearingindifferent from a consumer perspective. Program financial shortfalls are either charged directly toconsumers as a flat fee by material stream, or charged to all brandowners as a flat fee by material streamand passed onto consumers in the product’s selling price. The one benefit to consumers of the currentbrandowner fee structure is that individual brandowners may or may not pass the entire recycling fee ontoconsumers within their product’s selling price.
All jurisdictions reviewed embrace the philosophy of disallowing cross-subsidization between containerstreams (e.g. aluminum revenues are not allowed to subsidize revenues for plastic, paper, etc.). Thisphilosophy is imbedded as part of the extended producer responsibility philosophy on which virtually alljurisdictions base their legislation. The notion is twofold. First, it is economically unfair to both consumersand brandowners. Second, it is an incentive for consumers and brandowners to move away fromcontainers with higher costs to more recyclable containers. The preference is that consumer andbrandowner fees are established by container stream based upon that stream’s financial shortfall. Feesare low or zero on aluminum (higher downstream value), and higher on material streams that have a lowor near zero downstream value.

36
Benchmarking Evaluation of Alberta’s Stewardship Program forRecycling Empty Beverage Containers
3.8. PROGRAM SCOPE
All benchmarked programs include aluminum, plastic (this includes PET and other plastic basedmaterials) and glass in their programs. Beyond this fundamental scope, programs vary a great deal. Fourother programs recycle dairy containers on a voluntary basis outside of the deposit program. Theinclusion of dairy containers, either voluntary or on a deposit basis expands a program’s scope althoughthe volume increase may be small.
Legislation in most jurisdictions begins with beer and non-beer glass followed by aluminum and plastic.These are the most common beverage containers, and tend to also have the highest recycled materialvalue. As programs mature, paper products such as tetrapaks (commonly known as juice boxes) andgable tops (cartons) are typically added, as are bi-metal, bag in a box and other low volume products.The low volume products often have minimal residual value and lower recovery rates.
Alberta is the first and only jurisdiction (June 1, 2009) to add dairy products (aside from very low volumeflavoured milk products already in several programs). This increases the volume of HDPE plastic andpaper products in the program but doesn’t dramatically change the economics.
Exhibit 3-4 illustrates a direct comparison of the material types that are included in each jurisdiction'sprogram. It also differentiates between materials that are included in the jurisdictions' legislation andmaterials that are recycled on a voluntary basis.
Exhibit 3-4Program Scope Summary
Alberta continues to have the widest program scope of jurisdictions studied. BC, Saskatchewan, NewBrunswick and South Australia have the next greatest diversity in their deposit programs largely due totheir acceptance of dairy containers on a voluntary basis. Several other jurisdictions reported consideringincluding dairy products in their deposit programs. The balance of the jurisdictions include mainly thetraditional beer and non-beer aluminum, plastic and glass in their programs, high volume products thatare the easiest and most cost effective to recycle due to higher value residual markets.
Jurisdiction
Aluminum
(incl. Bi-Metal) PET
Other Plastics
(e.g. HDPE) Glass PolyCoat* Dairy Other
Alberta ● ● ● ● ● ●
British Columbia ● ● ● ● ● v ● Pouches, Bag-In-A-Box
Saskatchewan ● ● ● ● ● v
Newfoundland ● ● ● ● ● ○
New Brunswick ● ● ● ● ● ○ ● Gable Top, Cartons
Nova Scotia ● ● ● ● ● v
California ● ● ● ● ○ ○
Connecticut ● ● ○ ● ○ ○
Michigan ● ● ● ● ○ v
New York ● ● ● ● - -
Denmark ● ● ● ● ● ○
Germany ● ● - ● - ○
Norway ● ● ○ ● ○ ○
Sweden ● ● - ● - -
South Australia ● ● ● ● ● v ○ Wine glass bottles, casks or sachets
* = includes aseptic containers
● = included in legislated deposit program
○ = not included in legislated deposit program
v = included in recycling program on a voluntary basis (i.e. no deposit)
"-" = unclear whether included in deposit program

37
Benchmarking Evaluation of Alberta’s Stewardship Program forRecycling Empty Beverage Containers
Program scope, aside from the types of materials included, may be assessed by evaluating the number ofunique containers accepted for deposit (termed stock keeping units, or SKUs). Alberta again leadsjurisdictions with the highest number of registered active and inactive SKUs, (over 87,500) followed by BC(over 35,000) and Saskatchewan (8,900). Alberta’s wide scope is partly attributed to the inclusion ofnumerous low volume liquor and beverage products in a wide variety of packaging. A large number ofSKUs may be misleading depending if a jurisdiction posts both active and inactive containers. The vastmajority of products sold in Alberta and all other North American jurisdiction are beer and non-beeraluminum, plastic and glass products with a relatively small number of SKUs. The majority of dairyproducts sold also account for a relatively small number of SKUs.
Exhibit 3-5 illustrates the number of unique registered containers (active and in-active) in jurisdictionsreviewed. All jurisdictions represented below include alcoholic and non-alcoholic beverage containers.South Australia excludes wine bottles and Denmark excludes wine and spirits containers as they are noteligible for deposit-refund in either program.
Exhibit 3-5Number of Unique Containers Accepted by Program (SKUs) in 2010
* Data unavailable
3.9. DEPOSIT VALUES
A deposit is an amount of money paid by consumers at the time of purchase of an in-scope beveragecontainer. When an empty container is returned to a depot, the customer may receive a full or partialreimbursement of the deposit amount. Generally, deposit rates are based on container volume and/ormaterial type. One jurisdiction, New Brunswick sets deposit levels based on the alcoholic or non-alcoholiccontent of the containers.
Deposit amounts vary across jurisdictions; they are summarized in Exhibit 3-6.
87,500
35,223
8,889
17,18110,500 10,300
0
10,000
20,000
30,000
40,000
50,000
60,000
70,000
80,000
90,000
# of SKUs included in Program

38
Benchmarking Evaluation of Alberta’s Stewardship Program forRecycling Empty Beverage Containers
Exhibit 3-6Beverage Container Deposit Levels in 2010
Alberta increased and harmonized minimum deposit levels on November 1, 2008 and now has rates ashigh as most other North American jurisdictions. Manufacturers in Alberta may opt to charge andreimburse higher than minimum deposit-refund amounts, this has been the experience with refillablecontainers such as large water bottles, beer kegs and glass milk bottles.
European deposit rates, when harmonized using a Purchasing Price Parity approach to convert Europeancurrencies to Canadian currencies, appear somewhat higher. Comparative price levels for January 2010applying Purchasing Price Parity (PPP) indicate a Canada: Denmark ratio of 100:68, 95 (Germany); 90(Sweden) and 69 (Norway) and 85 (Australia)
3. This is to say that European and international currencies
have even more buying power than Canadian dollars implying that container deposit rates in thosecountries are higher than the converted values shown in Exhibit 3-6.
3Purchasing Power Parities – Comparative Price Levels. Organization for Economic Co-operation and Development, Statistics
Directorate. www.oecd.org/dataoecd/48/18/18598721.pdf Sourced: April 10, 2010.
Jurisdiction Local Deposit Comments Jurisdiction Local Deposit Comments
Alberta10¢ <= 1L
25¢ >1L
Refillable Glass Bottles
1.00 DKK =<500ml
British Columbia
Non-Alcohol
5¢ <=1L
20¢ >1L
Alcohol
10¢ <=1L
20¢ >1L
3.00 DKK >500ml
Refillable Plastic Bottles
1.00 DKK <500ml
1.00 DKK 501ml - 999ml
1.50 DKK = 500ml
3.00 DKK >=1L
Type A [Cans, Plastic Bottles]
1.00 DKK <1L
Type B [Plastic Bottles]
1.50 DKK =500ml
Type C [Cans, Glass, Plastic Bottles]
3.00 DKK >=1L
Saskatchewan
Metal Cans & Plastic
10¢ <1L
20¢ >=1L
Non-Refillable Glass
10¢ <300ml
20¢, 300ml-1L
40¢ >=1L
Polycoat
5¢, all
Aseptic
5¢, all
Germany
One Way [all]
0.25 €
Refillable Glass
0.08€ <= 500 ml
0.15€ > 500 ml
Refillable PET
0.15€, all
0.08 € = $0.11 CDN
0.15 € = $0.20 CDN
0.25 € = $0.34 CDN
New Brunswick
Non-Alcohol
10¢ <5L
Alcohol [One-Way]
10¢ <500ml
20¢ >500ml
Alcohol [Refillable]
10¢ <5L
Half-back System Norway
PET and Aluminum [all]
1.00 NOK <=500ml
2.50 NOK >500ml
1.00 NOK = $0.17 CDN
2.50 NOK = $0.44 CDN
Metal Cans
California5¢ <0.71L
10¢ >=0.71L24 ounces = 0.709764L
1 SEK, all
PET Plastic
1 SEK < 500ml
2 SEK >=500ml
Connecticut 5¢, all South Australia 10¢, all 0.10 AUD = $0.094 CDN
New York 5¢, all
Michigan 10¢, all
Canada ($ CDN) International (local currency)
Denmark
1.00 DKK = $0.19 CDN
1.50 DKK = $0.28 CDN
3.00 DKK = $0.57 CDN
United States ($ USD)
Sweden 1.00 SEK = $0.14 CDN
2.00 SEK = $0.28 CDN

39
Benchmarking Evaluation of Alberta’s Stewardship Program forRecycling Empty Beverage Containers
3.10. BEVERAGE CONTAINER SALES
Alberta and California, due to their broad program scopes, attempt to divert the largest number ofcontainers sold per capita from the waste stream. Exhibit 3-7 illustrates sale of in-scope containers percapita by jurisdiction. All beverage types included in various programs are represented below makingprograms less comparable due to differing program scope. Second only to California internationally andfirst among Canadian provinces, Alberta leads in per capita beverage container sales.
Exhibit 3-7Total in Scope Beverage Container Sales Per Capita in 2008
* BC beer volumes were extrapolated from the Brewers Association of Canada, 2008 Annual Statistical Bulletin. Import beer cansand bottles were estimated using two methods and results varied only slightly.** Norwegian numbers include aluminum (beer and non-beer) and PET only. Glass materials are handled by other organizations forwhich data was unavailable.
Enabling program comparison, Exhibit 3-8 illustrates container sales per capita by material type.
578.7
462.5
385.3
432.6
509.9
384.2
597.3
297.6
92.7108.9
0.0
100.0
200.0
300.0
400.0
500.0
600.0
700.0
To
talC
on
tain
ers
So
ld

40
Benchmarking Evaluation of Alberta’s Stewardship Program forRecycling Empty Beverage Containers
Exhibit 3-8Aluminum, PET & Glass Containers Sales per Capita in 2008
In all jurisdictions, aluminum (beer and non-beer) containers have the highest sales per capita followed byPET then glass. Aluminum, plastic (largely PET) and glass (beer and non-beer) make up the majority ofAlberta’s containers and initiatives to improve overall program recoveries and efficiency must be focusedon these three material streams.
Refillable glass is an anomaly. The vast majority of refillable glass containers are beer containers. Thereare a very small number of other refillable containers of various materials in North America. In addition toglass, some plastic containers are refillable in Europe. Sales of refillable beer containers has beenforecast to decline for the past two decades given the relatively high cost of refilling them (handling,breakage, cleaning, etc.), but volumes have only declined marginally. It is assumed that refillable glasscontainers will remain an active category for the foreseeable future.
Alberta expanded deposit legislation on June 1, 2009 to include dairy containers in the program. Mostdairy containers produced in the province are made from HDPE plastic or poly-coat gable paper products.Exhibit 3-9 illustrates the effects of the legislation change on in program scope sales to include HDPE andpoly-coat gable dairy containers. It should be noted that HDPE and poly-coat gable materials werepreviously included in program, but going forward the many of the containers in these categories willoriginate from the dairy container stream.
0.0
50.0
100.0
150.0
200.0
250.0
300.0
Conta
iners
Sold
per
Capita
Aluminum PET Glass
Alb
ert
a
Bri
tish
Co
lum
bia
Saska
tch
ew
an
Ne
wfo
un
dla
nd
Ne
wB
run
sw
ick
No
va
Sco
tia
Ca
lifo
rnia
De
nm
ark
No
rway
Aluminum 268.5 214.0 171.3 Unavailable Unavailable Unavailable 259.5 62.4 78
PET 154.9 110.5 111.0 Unavailable Unavailable Unavailable 234.1 19.2 31
Glass 107.1 99.9 31.8 Unavailable Unavailable Unavailable 90.8 11.1 Unavailable
Total Sales
per Capita 530.5 424.4 314.1 Unavailable Unavailable Unavailable 584.4 92.7 > 109

41
Benchmarking Evaluation of Alberta’s Stewardship Program forRecycling Empty Beverage Containers
Exhibit 3-9Alberta In-Scope HDPE & Poly-Coat Gable Sales Before and After Introduction of Dairy Products
The inclusion of dairy containers in the deposit system nearly doubled the number of in-scope containerssold in the two primary dairy container types - HDPE and poly-coat gable. The table above providesactual sales volumes from June 2008 to February 2010. The largest sales volume increase following theintroduction of dairy into the deposit program was in poly-coat gable containers (less than 500 millilitres)where sales increased by over 2000%.
Following the introduction of dairy products in June 2009 to the end of February 2010 HDPE eligiblecontainers increased 856.4% and poly-coat gable containers increased 591.5% in the same period. Bythe end of February 2010, HDPE containers represented 6.8% of the Alberta program scope and gablecontainers 5.9%.
0
1,000,000
2,000,000
3,000,000
4,000,000
5,000,000
6,000,000
7,000,000
8,000,000
Nu
mb
er
of
Co
nta
ine
rs
HDPE 0 - 500 ml
HDPE Over 1 L
Poly-CoatGable 0-500 ML
Poly-CoatGable Over 1 L
Percentage Increase byCategory following June 1,2009 introduction of dairy
HDPE (0-500ml)610.78%
HDPE (over 1L)991.96%
Poly-Coat Gable (0-500ml)2174.13%
Poly-Coat Gable (over 1L)281.43%
HDPE
0-500 ml
HPDE
Over 1L
Poly-Coat Gable 0-
500 ml
Poly-Coat Gable
Over 1 L
Jun-08 351,124 493,450 373,249 1,395,253
Jul-08 458,774 648,342 392,494 1,764,178
Aug-08 283,935 438,483 254,279 1,134,804
Sep-08 327,491 446,379 341,395 1,318,624
Oct-08 472,268 483,988 266,748 1,473,156
Nov-08 268,445 401,853 190,007 1,144,505
Dec-08 475,313 337,705 297,199 1,107,205
Jan-09 558,361 473,856 166,461 1,339,062
Feb-09 319,613 420,702 258,174 1,293,063
Mar-09 310,494 404,677 277,524 1,389,939
Apr-09 1,823,366 412,392 275,487 1,229,048
May-09 638,032 478,314 266,663 1,143,211
Jun-09 3,896,962 4,744,687 5,797,596 3,217,284
Jul-09 4,005,109 5,518,256 5,326,318 3,836,875
Aug-09 3,434,321 5,033,946 5,275,391 3,392,381
Sep-09 5,364,114 5,327,464 5,696,798 2,988,171
Oct-09 5,039,024 6,464,002 7,199,653 4,177,871
Nov-09 4,825,023 6,695,162 7,334,189 4,136,988
Dec-09 2,784,571 4,979,289 5,293,470 3,812,136
Jan-10 4,090,214 5,574,136 5,637,167 2,948,849
Feb-10 4,279,888 5,281,005 5,282,114 3,057,820
Mar-10 5,091,955 5,447,243 5,354,823 3,343,404

42
Benchmarking Evaluation of Alberta’s Stewardship Program forRecycling Empty Beverage Containers
3.11. RECOVERIES
In recent years, Alberta has some improvement in beverage container recovery rates. Two significantprogram changes have recently occurred, the increase of deposit-refund rates and the expansion of thedeposit legislation to include dairy containers in Alberta’s stewardship program. In addition, there was aneconomic downturn during this period which historically has a positive impact on recoveries.
On November 1, 2008, deposit-refund rates increased from $0.05 to $0.10 for containers one litre or lessand from $0.20 to $0.25 for containers over one litre. Since that increase, recovery rates increased andbegan to plateau toward the end of 2009. Albertans had previously recycled dairy containers since 1999through community curb side and other voluntary recycling programs. The Dairy Council of Alberta’saward winning voluntary program successfully raised public awareness of the need to recycle dairycontainers and increased HDPE jug recovery rates by 22% and 28% for gabletop cartons in its first sevenyears of operation. Dairy containers were incorporated into the deposit program effective June 1, 2009.
Exhibit 3-10 illustrates overall recovery rates by jurisdiction. A major issue in their field is that there is nota clearinghouse for program information. Each jurisdiction collects and reports their own results withvarying commonality, making comparisons challenging. All efforts have been made to ensure faircomparisons are presented. Table A presents full program scope recovery rates for comparisons aredifficult due to the different program materials included. Michigan reports high return rates attributable tohaving the highest overall deposit rates ($0.10 USD for all containers) in the United States and one of thenarrower program scopes focusing their program on beer and non-beer aluminum, plastic and glass.Their geographic proximity to five non deposit jurisdictions thus potentially attracting out of statecontainers may contribute as well. Regardless, Michigan’s very high return rate of 96.9% may beconsidered an outlier given their recovery is so much higher than any other jurisdiction, including themature Scandinavian programs. By comparison, Alberta has the widest program scope and nowachieved overall recovery rates comparable to most other jurisdictions under study except Michigan.
Table B provides recovery rates for aluminum, PET and glass only, enabling a more consistentcomparison of jurisdictions. The ranking changes for the five jurisdictions listed. Aluminum, PET and glassaccounted for 91.6% of Alberta’s deposit program, 87.8% in BC, 81.5% in Saskatchewan, 97.8% inCalifornia and 100% in Denmark.
Exhibit 3-10Recovery Rates by Jurisdiction in 2008
Table A: Full Program Scope Table B: Limited Program Scope
* Recovery rates include non-beer containers only.
Entire Program Scope:
Overall Recovery Rate
Limited Program Scope:
Overall Recovery Rate
Michigan 96.9% Saskatchewan 87.8%
Denmark 86.9% Denmark 86.9%
Norway 86.8% British Columbia * 80.4%
South Australia ~ 85% Alberta 78.7%
New Brunswick * 80.0% California 73.8%
Saskatchewan 79.8% Connecticut Unavailable
Nova Scotia * 78.1% Germany Unavailable
British Columbia * 77.1% Michigan Unavailable
Alberta 76.8% New Brunswick Unavailable
California 73.7% Newfoundland Unavailable
Newfoundland * 68.0% New York Unavailable
New York 67.8% Norway Unavailable
Connecticut 64.0% Nova Scotia Unavailable
Germany 62.4% South Australia Unavailable
Sweden Unavailable Sweden Unavailable

43
Benchmarking Evaluation of Alberta’s Stewardship Program forRecycling Empty Beverage Containers
Table B rates are calculated using sales and return volumes to ensure a weighted average calculation.Both Alberta and BC, with similar program scope and number of unique containers included for deposit,have achieved recovery rates reflecting wide program scope. Jurisdictions where the sale of beveragecontainers per capita is highest and have the biggest opportunity to remove the most material from thewaste stream, California, Alberta and New Brunswick, have recovery rates between almost 74% and80%. As of April 2010, Alberta’s return rate has climbed to 83.4%.
By contrast, Denmark enjoys high recovery rates in a program that accepts only three material types.Germany’s recovery rates for aluminum, glass and plastics all exceed 100% as non-licensed, yetrecyclable, products are recovered that originate from other jurisdictions and the basis for calculating therecovery rate is the quantity of packaging marked eligible for deposit-refund. For consistency inevaluating recovery rates, the overall German rate of 62.4% returned eligible containers is quoted.
Exhibit 3-11 provides a direct comparison of the individual recovery rates for each jurisdiction in the mostrecent year that the data was available. In jurisdictions where multiple organizations collect and recyclecontainers, the individual recovery rates of each organization has been recorded and combined to formthe overall rate. Information for US jurisdictions was not available online and benchmarked organizationswere unable to provide it for comparison.
Exhibit 3-11Recovery Rates by Material Type in 2008
* BC and New Brunswick report non-beer only recovery rates.
Alberta’s dairy recovery rate is calculated using sales and return data for HDPE and poly-coat gablecontainers, as indicated previously other beverage types contribute containers to these material streamshowever they are considered less significant.
All benchmarked jurisdictions suggested deposit-refund rates are the most influential factor driving returnrates. Recovery rates on dairy containers in Alberta would have been expected to increase following theintroduction of that material type to the deposit program on June 1, 2009. The following exhibit providesan overview of historical dairy (HDPE and poly-coat gable) container return rates.
Alb
ert
a
British
Colu
mbia
*
Saska
tch
ew
an
New
fou
ndla
nd
New
Bru
nsw
ick
*
Nova
Scotia
Calif
orn
ia
Denm
ark
Germ
any
Norw
ay
Sw
ede
n
Sou
thA
ust
ralia
Aluminium 79.8% 81.5% 90.9% 69.0% Unavail. Unavail. 83.9% 84% 135.0% 91.0% 91.0% 80.0%
PET 69.6% 75.8% 84.1% 75.5% Unavail. Unavail. 61.9% 93% 121.0% 82.0% 40.0% 75.0%
Glass 89.3% 87.3% 84.8% 70.0% Unavail. Unavail. 75.6% 93% 101.0% Unavail. 45.0% 90.0%
Bi-Metal 64.7% 59.6% 90.9% - Unavail. Unavail. 13.6% - - - - -
Mixed Plastic - 41.3% 84.1% - Unavail. Unavail. 77.3% - 121.0% - - 85.0%
Polycoat 54.6% 53.2% 54.8% 48.0% Unavail. Unavail. - - - - - 85.0%
Dairy 46.0% - 31.2% - - Unavail. 6.8% - - - - -
Overall Recovery Rate 76.8% 77.1% 79.8% 68.0% 80.0% 78.1% 73.7% 86.9% 62.4% 86.8% Unavail. ~ 85%
Limited Scope Recovery Rate 78.7% 80.4% 87.8% Unavail. Unavail. Unavail. 73.8% 86.9% Unavail. Unavail. Unavail. Unavail.

44
Benchmarking Evaluation of Alberta’s Stewardship Program forRecycling Empty Beverage Containers
Exhibit 3-12Historic Diary Container Recovery Rates in Alberta
0.0%
20.0%
40.0%
60.0%
80.0%
100.0%
120.0%
Re
co
ve
ryR
ate
HDPE 0 - 500 ml
HDPE Over 1 L
Gable 0-500 ML
Gable Over 1 L
HDPE
0-500 ml
HPDE
Over 1L
Poly-Coat Gable
0-500 ml
Poly-Coat Gable Over
1 L
Jun-08 68.1% 72.5% 15.5% 60.7%
Jul-08 57.3% 60.3% 12.2% 51.0%
Aug-08 86.6% 73.7% 19.2% 65.0%
Sep-08 67.8% 73.6% 12.4% 57.0%
Oct-08 41.1% 60.7% 13.8% 45.9%
Nov-08 99.0% 70.1% 34.4% 59.2%
Dec-08 37.2% 65.4% 15.6% 51.7%
Jan-09 38.2% 61.9% 28.4% 57.0%
Feb-09 73.7% 71.7% 22.1% 56.4%
Mar-09 73.7% 79.3% 21.2% 59.4%
Apr-09 17.0% 106.5% 29.1% 87.6%
May-09 48.1% 87.6% 25.1% 89.0%
Jun-09 22.6% 21.7% 6.8% 37.8%
Jul-09 32.5% 49.4% 20.2% 47.6%
Aug-09 40.6% 65.2% 26.0% 56.1%
Sep-09 31.9% 73.2% 31.6% 73.9%
Oct-09 32.9% 57.6% 28.9% 49.3%
Nov-09 37.2% 62.0% 31.6% 54.7%
Dec-09 51.1% 64.7% 37.9% 47.2%
Jan-10 52.4% 81.5% 44.5% 87.2%
Feb-10 54.3% 74.6% 44.3% 69.6%
Mar-10 69.0% 103.9% 59.2% 87.0%

45
Benchmarking Evaluation of Alberta’s Stewardship Program forRecycling Empty Beverage Containers
Prior to the program’s expansion in June 2009, containers HDPE and poly-coat gable containers over 1litre were observing increasingly improved recovery rates. As expected, recovery rates overall for HDPEand poly-coat gable containers dropped in June 2009 following the introduction of dairy to Alberta’sdeposit program and the increase in container volumes eligible for sale. Following the inclusion of dairyand the immediate decline, recovery rates have trended positively and are expected to continue.
3.12. COSTS
Deposit program costs vary widely across benchmarked jurisdictions where influential factors may includethe scope, sales volumes, operational and program efficiencies, use of technology, geographic and socio-cultural elements of a jurisdiction.
Program costs are typically categorized as: collection, transport, processing, administration,communication, depreciation and other miscellaneous costs.
Collection costs mainly represent handling commissions at the depot level and are primarilycomprised of labour and occupancy expenses.
Transport costs include the expense of moving containers from depots to centralized processingfacilities and then to end markets.
Processing costs cover centralized sorting, counting, and palletizing expenses incurred prior totransporting collected containers to end markets.
Administration costs are the costs associated with managing the program. Communication costs are usually limited to marketing expenses (e.g. advertising, web
development). Miscellaneous costs include all minor expenses incurred managing and growing the program that
are not captured in administration and communication cost categories.
Activities related to the collection of empty beverage containers contribute the largest portion of totalprogram costs in Canadian provinces. Collection represents 70% of Alberta and Saskatchewan’sbudgets, and 61%, 62% and 63% for New Brunswick, BC and Nova Scotia respectively. The lowest isNewfoundland at 55%. Collection expenses are essentially handling commissions paid to collectiondepots, where the major cost components are labour and occupancy.
Transportation costs are driven by volume and geographic area. Alberta, BC and Saskatchewan have avery similar sized land bases, although Saskatchewan’s much lower population results in significantlylower total volumes and greater difficulty in finding efficiency. The other major driver of transportationcosts is the location of end markets for each material stream. Aluminum tends to be shipped to USlocations whereas PET is processed locally.
Administration costs tend to be fixed and insignificant. On an administration cost per container recoveredbasis, 2008 costs for Alberta, BC and Saskatchewan were $0.001592, $0.003264 and $0.004188respectively, thus Alberta’s administration costs are almost half of BC’s and about a third ofSaskatchewan’s, the most comparable jurisdictions and the only ones where comparable data exists. Inany event, Alberta’s administration costs are dwarfed by a deposit of $0.10 to $0.25 and a CRF rangingfrom nil to $0.08 per container sold in the province.
Communication costs are discretionary and independent of volume. One anomaly of note is that Albertabrandowners spent almost $5 million in 2009 on communications (marketing), whereas the BC spent $2.5million and Saskatchewan spent little over $200,000. The communications budget in Alberta increasedsignificantly in preparation to support the increase in deposits and the introduction of dairy containers tothe program. Exhibit 3-13 illustrates total program costs by category as reported by the jurisdictions wheredata is available.

46
Benchmarking Evaluation of Alberta’s Stewardship Program forRecycling Empty Beverage Containers
Exhibit 3-13Total Program Costs by Category in 2008
* Jurisdictions report non-beer costs only therefore non-beer volumes are reflected.
Connecticut, Michigan and New York costs were unavailable; those jurisdictions are therefore excludedfrom the cost analysis in the remainder of the chapter.
A more relevant comparison is the costs per container recovered as illustrated in Exhibit 3-14.
Exhibit 3-14Cost per Container Recovered in 2008
* Jurisdictions report non-beer costs only therefore non-beer volumes are reflected.
Alb
ert
a*
Britis
hC
olu
mb
ia*
Sask
atc
hew
an
Ne
wfo
und
land
*
Ne
wB
runsw
ick
*
No
vaS
cotia
*
Ca
liforn
ia
De
nm
ark
No
rwa
y
Collection $41,569,177 $45,731,185 $14,231,513 $5,250,121 $5,961,899 $11,106,529 $45,536,407 - $12,676,362
Transport $4,513,677 $12,705,170 $1,508,127 $1,686,125 $1,721,826 $3,123,094 - $8,682,755
Processing $5,742,452 $8,835,075 $2,705,141 $919,907 $1,442,790 $1,769,155 $1,020,341,497 -
Administration $2,568,909 $3,472,726 $1,272,083 $1,644,114 $683,591 $1,401,123 $44,436,538 $16,482,800
Communication $4,356,420 $2,508,386 $214,643 - - $98,512 $4,912,833 $926,000
Depreciation $508,684 $375,784 $604,693 $114,133 $31,200 $186,212 - -
Other - - - - - - $105,390,587 $555,600 $1,457,247
Total Cost $59,259,319 $73,628,326 $20,536,200 $9,614,400 $9,841,306 $17,684,625 $1,220,617,862 $36,484,400 $32,089,195
$18,520,000
$9,272,831
$0.00000
$0.01000
$0.02000
$0.03000
$0.04000
$0.05000
$0.06000
$0.07000
$0.08000
Other
Depreciation
Communication
Administration
Processing
Transport
Collection
Alb
ert
a*
Brit is
hC
olu
mb
ia*
Sask
atc
hew
an
Ne
wfo
und
land
*
Ne
wB
runsw
ick
*
No
vaS
cotia
*
Ca
liforn
ia
De
nm
ark
No
rwa
y
Collection $0.04114 $0.04298 $0.04357 $0.03507 $0.03634 $0.03792 $0.00293 - $0.02770
Transport $0.00447 $0.01194 $0.00462 $0.01126 $0.01049 $0.01066 - $0.01897
Processing $0.00568 $0.00830 $0.00828 $0.00615 $0.00879 $0.00604 $0.06566 -
Administration $0.00254 $0.00326 $0.00389 $0.01098 $0.00417 $0.00478 $0.00286 $0.03696
Communication $0.00431 $0.00236 $0.00066 - - $0.00034 $0.00032 $0.00208
Depreciation $0.00050 $0.00035 $0.00185 - $0.00019 $0.00064 - -
Other - - - - - $0.00678 $0.00125 $0.00318
Total Cost per Container Recovered $0.05865 $0.06920 $0.06287 $0.06346 $0.05998 $0.06038 $0.07855 $0.08180 $0.07011
$0.02026
$0.04152

47
Benchmarking Evaluation of Alberta’s Stewardship Program forRecycling Empty Beverage Containers
On a per unit sold basis, Alberta’s program costs are the lowest4
in each cost category with the exceptionof communication.
Collection costs are the highest cost component in every jurisdiction given the multiple sorts and handlingof containers. High collection costs observed in Saskatchewan reflect SARCAN’s commitment to leveragea labour force to undertake these activities in an effort to provide employment to disabled persons in theprovince.
Transportation costs, as mentioned, are driven by geographic area, population, volume and distance torecycled material processors. Numerous transportation strategies are deployed in North Americanjurisdictions to optimize truck loading, backhauls and minimize depot storage through the use ofcontainers or trailers as temporary storage at depots. The challenge is that collected containers tend tobe high volume, extremely low weight items. Given the current manual multiple sort processes and theaudit requirements, containers are not completely compacted at the depot level thus trucks are “cubedout long before they are grossed out”. Product movement is also virtually all one way, making backhaulschallenging for all jurisdictions.
As recovery rates improve and volume of returned containers become closer to the volume sold, costs inall categories may drop on a per container basis as economies of scale continue to be realized.
3.13. MARKETING INITIATIVES
Marketing is a category where the widest range of approaches was identified, as jurisdictions embracesignificantly different approaches to marketing and their associated budgets. There are large differencesbetween how marketing is defined, what is included, and how funds are spent. The common element isthat all initiatives where ultimately designed to improve recovery rates and improve environmentaloutcomes.
Marketing includes traditional media advertising reinforcing recycling awareness, attitudes andbehaviours, specific advertising targeted at specific jurisdiction or local initiatives, formal partnerships withtypically non-profit organizations, funding local community initiatives (representatives organizing shortterm events, mobile collectors, setting up and managing collection bins, presenters and presentationmaterials for school, church, community et al events, etc.), promotional items, etc. Advertisingpartnerships with private sector organizations is a relatively new initiative.
Marketing in some jurisdictions includes funding for broader environmental initiatives beyond the scope ofstrictly containers. New Brunswick and European jurisdictions all fund environmental projects that do notrelate to recycling beverage containers. California beverage container recycling legislation requires thatproject funding target improvements to beverage container recycling activities. All jurisdictions have anincreased website and web presence and some deploy call centres. There appears to be minimal jointmarketing with other recycling programs within jurisdictions.
3.13.1. Traditional Marketing and Promotion
Virtually all jurisdictions advertise their programs to reinforce consumer attitudes and behaviour. Virtuallyall jurisdictions consider their programs mature and well entrenched, and most view advertising as havinga diminishing return, thus most spend minimal money on traditional media like TV, radio and print.Advertising tends to be focused on support of program changes – increases in deposit rates, addition ofnew products into the program or other changes to public face of the programs.
4MNP is unable to evaluate cost data provided by California in this evaluation as costs were provided in aggregate making
comparisons unachievable.

48
Benchmarking Evaluation of Alberta’s Stewardship Program forRecycling Empty Beverage Containers
Few jurisdictions spend more than $200,000 on this type of advertising. Alberta spent almost $5 millionon advertising in 2008, a year when both deposit rates were increasing (virtually every deposit ratechanged, doubling in most categories) and dairy products were added (a wide variety of products in a nontraditional category, but with relatively low volume). The jurisdictions viewed marketing as ineffective atincreasing recovery rates, with funding for marketing activities better spent on improving systemeffectiveness and efficiencies. The consensus was marketing had a marginal impact at best on increasingrecovery rates, and that increasing deposit rates had a far higher correlation to recovery rates.
3.13.2. Marketing Partnerships
Alberta and most jurisdictions have found greater success in local marketing initiatives. These take theform of recycling drives, specific advertising targeted at specific jurisdiction or local initiatives,partnerships with local community organizations (schools, churches, sports teams, charities, etc.), fundinglocal community initiatives (representatives organizing short term events, mobile collectors, setting up andmanaging collection bins, presenters and presentation materials for school, church, community et alevents, etc.), promotional items, etc. These programs tend to be labour intensive, as they invariablerequire people for the short or long term organization and management of these initiatives. The benefit isthat local initiatives typically “touch” local residents directly whereas traditional media advertising tends tobe generic and has minimal local impact.
Partnerships with charitable and other non-profit organizations in Alberta and many other jurisdictionshave been successful in raising awareness about both the charity and beverage container recycling in theprovince. The non-profit organization benefits from funds generated through the partnership.
The two following examples come from BC. Programs that engage companies and the public have beenimplemented in BC. The “Return at Work” program sponsored by Encorp sends mobile collectors tooffices buildings where companies can donate their empty beverage containers with proceeds going tosupport the United Way.
Another BC program designed to support the Salvation Army installs recycling bins at public events. TheSalvation Army collects the containers and Encorp reimburses the deposit and pays them the handlingfee (which would normally be kept by the depot). In BC charities are allowed to retain the refund and thehandling fee, whereas in Alberta the depot will retain handling fees therefore requiring charities to returnempty containers to depots to collect deposit-refund amounts.
Partnerships also take the form of marketing media such as bins, posters, etc. Most jurisdictions providethis type of media throughout their jurisdiction.
California offers the Comprehensive Recycling Community program. This community based programselects four communities annually. Recycling staff work directly with each community to increaseawareness and participation in their local recycling programs. Communities are selected based on thelevel of media exposure and activity in environmental programs. Recycling staff collaborate with localauthorities; curb side programs, churches, schools, city council, etc. for an entire year.
A relatively new initiative in California sees advertising contracts with private sector firms. While it is not inthe beverage container recycling field, this is a very transferable example. The “Toll Roads”, a DAO likeagency that manages the toll highways throughout southern California, has a marketing arrangement withBristol Farms, a high end grocery retailer. The promotion is that for every $100 a customer spends atBristol Farms, Bristol Farms will then deposit $5 in their customer’s “Toll Roads” account(https://www.thetollroads.com/home/getfastrak_promotions.htm). This is similar to well established loyaltyprograms that have evolved from airline loyalty programs.

49
Benchmarking Evaluation of Alberta’s Stewardship Program forRecycling Empty Beverage Containers
3.14. RESEARCH AND DEVELOPMENT
Only one jurisdiction appears to be funding third party research regarding container design and materials.California has partnered with academic institutions to develop alternative container designs and materialsthat are easier to recycle and that breakdown faster in the oceans, rivers and landfills. One major projectis the development of “bio plastic” (PHA) and corn based containers (PLA). The challenge withintroducing bio-plastic containers is that they look very much like PET containers which may causecontamination problems in the PET recycling stream.
This initiative is a conundrum, as the philosophy driving existing container recycling legislation isextended producer responsibility based on brandowners driving this effort to fundamentally redesigncontainers and packaging to facilitate re-use and recycling, and protection of the environment, and notgovernment organizations and their delegated authorities. Conversely, it may be indifferent to consumershow dollars are collected that fund research like this, whether it be through increased product costs,consumer fees, unredeemed deposits, or provincial/federal taxes; as the net total cost to the consumermay be unchanged.
3.15. INCINERATION FOR END USE
Incineration of collected container materials for energy (or for gasification), whether formalized inlegislation or not, is primarily conducted in Europe. All North American jurisdictions will attempt to recyclevirtually all container products, even at a loss. Whether it is written into legislation or policy, or simply astated practice, the incineration of recyclable material, including beverage containers, is avoided if at allpossible in the North American jurisdiction reviewed. Many jurisdictions like Saskatchewan, BC, NewBrunswick and Connecticut do not permit the incineration of recyclable material, even if the if there is anegative net loss in recycling the containers. A few grandfathered containers along with a very smallnumber of containers where no end market exists are incinerated in Alberta and in other North Americanjurisdictions. California also allows the incineration of a very small number of recovered containers on anexception basis but it has not been used in years. Most European jurisdictions use incineration for energyrecovery as a viable means of re-use, especially where other reuse and recycling options are not feasible.
Gasification has become a viable option for recycling (including containers) in Europe. It is a flexible,reliable, and clean energy technology that can turn a variety of low-value feed stocks into high-valueproducts, replacing traditional oil and natural gas as an energy source, and can provide a cleanalternative source of base load electricity, fertilizers, fuels, and chemicals. It converts any materialcontaining carbon—such as coal, petroleum coke (petcoke), biomass, or many types of beveragecontainers—into synthesis gas (syngas) or methanol. The syngas or methanol can be upgraded orburned to produce electricity or further processed to manufacture chemicals, fertilizers, liquid fuels,substitute natural gas (SNG), or hydrogen. Gasification has been reliably used on a commercial scaleworldwide for more than 50 years in the refining, fertilizer, and chemical industries, and for more than 35years in the electric power industry. There are more than 140 gasification plants operating worldwideincluding nineteen located in the United States. Some sources predict worldwide gasification capacity togrow 70 percent by 2015, with up to 80 percent of the growth occurring in Asia.
North American jurisdictions have long standing objections regarding traditional incineration (whether forwaste or low efficiency energy recovery) which is generally viewed as comparable to land filling.Gasification appears to be an incremental to exponential improvement upon traditional burningtechnologies, and a case can be made that gasification may be a far better end use of some containerstreams for the environment than traditional recycling processes. This is an area that may be worthfurther scrutiny.

50
Benchmarking Evaluation of Alberta’s Stewardship Program forRecycling Empty Beverage Containers
3.16. COMPARISONS
With the exception of the introduction of sorting, counting and densification technology in European andsome North American jurisdictions, little has changed in beverage container industry over the past fiveyears. Alberta continues to compare favourably to other jurisdictions under study as it exists it’s the:
Largest program scope. With over 85,000 registered containers in the program (active andinactive), Alberta includes 59% more beverage containers than the next largest program (BC).
Highest in-scope sales per capita in Canada. Sales volumes in Alberta indicate the highestongoing need for diversion of beverage containers from the province’s landfills.
Comparable recovery rates. While other jurisdictions may have similar recovery rates, Alberta’sprogram includes a wider range of materials. Recovery rates for beer and non-beer aluminum,plastic and glass were 78.7% in 2008 and rising as the full impact of increased deposit rates andthe significant marketing campaign are still being realized, while the overall program recovery rateis 76.8%. By December 2009, the recovery rate has increased to 82.4%. In 2010, the return rateis expected to approach the provincial target of 85%.
Lowest total recycling cost per container. Alberta has the lowest recycling cost per containerin North America. Alberta benefits from economies of scale due to high sales per capita and largeprogram scope, but overcomes a challenging geography, an affluent economy, and minimum oflabour saving technology deployed.
Recent inclusion of dairy containers for deposit. Alberta is an industry leader with theinclusion of dairy products as no other jurisdiction reports the inclusion of dairy containers in thedeposit programs.
3.17. LEARNINGS FROM EUROPE
European beverage container programs share similar objectives as North American jurisdictions and arestructured and operate similarly. The flow of containers through the recycling system reflects closely theoperations of North American jurisdictions. Funding recycling programs in Europe is also structuredcomparably to Alberta and other North American jurisdictions, in their use of unredeemed deposits,consumer fees, manufacturer fees and the sale of processed containers. European programs tend todifferentiate themselves from North American programs in several ways:
3.17.1. Legislation
European legislation is quite different from North American legislation, but much of the difference isassociated with government structure and beyond the scope of this engagement. Legislation is based onthe extended producer responsibility model, whereby the brandowners are required to re-use or recycletheir containers sold through a variety of means in a deposit program model. Europe is a complexregulatory environment, especially regarding trade issues. Each country appears to have a slightlydifferent structure for assessing and collecting fees beyond consumer deposits. Organizations thatmanage each country’s beverage container recycling program collect and disburse monies and collectand process recovered containers tend to be separate from government. There are mixes of non-profitand for-profit entities.
3.17.2. Fees
Most programs are deposit programs supplemented by consumer fees and brandowner fees. Allprograms are funded through unredeemed deposits, consumer fees and brandowner fees. Norway,similar to California, has a downward sliding scale brandowner fee based on recoveries for non refillablecontainers, whereby the fee begins to decline at 25% recovery and becomes nil when recovery reaches95%. The complex European regulatory environment makes identifying the flow of monies a complextask.
51
Benchmarking Evaluation of Alberta’s Stewardship Program forRecycling Empty Beverage Containers
3.17.3. Program Scope
Program scope tends to be narrower, focusing on beer and non-beer aluminum, glass and plastic(primarily PET). Few programs include products such as tetrapaks, gable tops, bi-metals, dairy and othercontainers. The product mix varies from North America and is purported to include more refillablecontainers. Some categories of plastic containers are refilled in Europe.
3.17.4. Return to Retail
Collection tends to follow the return to retail model more so than North American jurisdictions. Thisreflects European consumer behaviour where food and beverages are purchased more frequently but insmall quantities. Consumer storage space also tends to be limited thus containers are recycled morefrequently but in smaller quantities. Given this, return to retail becomes more convenient for the consumerand generally an expectation in Europe. Grocery trucks that are empty after their deliveries can collectand bring containers to processors creating a natural backhaul opportunity that significantly improvesefficiency and reduces cost.
3.17.5. Technology
The widespread adoption and implementation of technology is a major difference between NorthAmerican and European jurisdictions. RVMs are deployed in large numbers in retail locations, facilitatingaccessible and convenient return of empty beverage containers. RVMs appear more effective in Europe,given the lower number of containers returned per visit and the small program scopes. Additionally,significant investments are being made in sorting and densification technology at retail locations. It isexpected to provide return on investment through improved processing efficiencies and further reductionsin transportation costs. Climate is a significant challenge for automated technologies as containers withfrozen contents introduce contaminants, process hazards and prohibit accepting product by weight.
Given the widespread use of technology for sorting, the European consumer has adopted the conceptthat the value of the container is the bar code and not the container itself. Deposits tend to be returnedbased strictly on the bar code, and if the bar code is destroyed, the container itself has no value. This ismuch like paper currency or a winning lottery ticket, as if the bill or ticket is damaged beyond recognition,the bill becomes worthless.
3.17.6. Incineration for End Use
European jurisdictions embrace burning of recycled material for energy. Containers with minimal endmarkets are incinerated, much like recycled lubricating oil, recycled tires, etc. There is actually a thrivingmarket for specific types of recycled containers given their unique incineration attributes.

52
Benchmarking Evaluation of Alberta’s Stewardship Program forRecycling Empty Beverage Containers
4. OPPORTUNITIES FOR CONSIDERATION
The deposit program in Alberta is effective and cost efficient. The program is the broadest, has thelowest cost per collected container, and recovery rates are rising and appear to be heading towards the85% plus range matching the global leaders. To further increase recoveries and reduce costs beyondwhere the global leaders are now, fundamental strategic initiatives regarding the financial model,container life cycle (design, materials, packaging and material end markets), recycling process, andconsumer engagement must be embraced and implemented. Seven strategic opportunities have beenidentified for Alberta to consider investigating based upon the review of other jurisdictions in NorthAmerica, Australia and Europe that may provide incremental program benefit.
4.1. FUNDAMENTALLY CHANGE THE FUNDING MODEL TO CREATEINCENTIVES FOR BRANDOWNERS TO ENHANCE CONTAINER DESIGN
Consider investigating moving from the current consumer/brandowner fee structure to cover financialshortfalls as recoveries increase to a California style brandowner fee based on brandowner specificrecovery facilitated by the implementation of next generation automated counting and sorting equipment.
Virtually all deposit programs are structured through legislation describing extended producerresponsibility or product stewardship based legislation, and all programs are presently funded throughunredeemed deposits and revenue from processed containers, with consumer/brandowner fees appliedto fund programs. This is the Alberta model, whereby consumer fees (with brandowner fees for refillablebeer) increase as recoveries increase given the correlated unredeemed deposits decrease. This is aclosed loop system that will always remain viable, but total costs to consumers (and refillable beerbrandowner fees that may be partially or fully passed on to consumers) also increase as recoveriesincrease.
In addition, a policy of no cross subsidization by product stream has been generally adopted across NorthAmerica and Europe meaning each product stream must “pay its own way”. For example, excessrevenues from a strong market for aluminum are not used to subsidize a weaker PET market, etc.
California is unique in North America where the State has legislated strictly brandowner fees on amaterial stream basis for all materials – all other states and provinces have largely implementedconsumer fees with brandowner fees on some beer products. The paradigm in Europe appears to be theopposite, where program financial shortfalls are funded by brandowner fees versus consumer fees.
The objective for brandowner fees in California is to create financial incentives for brandowners tofundamentally change the container life cycle (design, materials, packaging and end markets) to facilitaterecycling and improve environmental outcomes, and ultimately reduce brandowner net costs. Their viewis that consumer fees may not realize this same objective with consumers potentially viewing these feesas a tax, although it may be argued that consumers view products on a total cost basis, thus the incentiveremains for brandowners to enhance the entire container life cycle to ultimately reduce overall costs.
To this end, California implemented a “processing fee offset” policy whereby the State would pay a higherportion of the processing cost shortfall as recoveries increased to preset benchmarks. This has resultedin brandowners paying as little as 15% up to a maximum of 65% of the net recycling costs as recoverieshave increased in conjunction with several simultaneous initiatives. Given the state has escheated asignificant portion of the unredeemed deposits, the processing fee offset has been suspended thusbrandowners will pay a much larger portion of the financial shortfall in 2010.
The current Alberta funding structure creates several considerations:
The current structure creates a natural tension between increasing recoveries (that automaticallyreduces unredeemed deposits), and the financial integrity of the program that currently surviveson these unredeemed deposits, revenue from recovered containers and consumer/brandownerfees. Higher recoveries mean higher product costs to consumers and potentially lower sales forbrandowners.

53
Benchmarking Evaluation of Alberta’s Stewardship Program forRecycling Empty Beverage Containers
Most US jurisdictions allow state government to escheat unredeemed deposits, with the currentprogram in California facing fiscal issues due in part to the state allocating $99 million ofunredeemed deposits to general revenues in 2009 alone. Some Maritime Provinces escheat as aresult of “half-back programs” as does Saskatchewan where government holds all deposits andgrants funds back to SARCAN to operate as a charity. Alberta’s program does not practiceescheats. Escheats invariably result in higher consumer/brandowner fees again resulting inhigher prices for consumers and potentially lower sales for brandowners.
Collected containers are commodities with fluctuating values. Aluminum has traditionally beencash positive whereas other materials such as PET, HDPE, glass and others have had low tominimal values. Decreases in the value of these commodities will result in higherconsumer/brandowner fees.
Increasing deposit rates generate short term cash surpluses and appear to result in increasedrecoveries. California increased deposit rates in both 2005 and 2007, and saw a net increase inrecoveries of approximately 10%. On November 1, 2008 Alberta raised deposit rates and isseeing increased recoveries in aluminum, plastic and glass. The intent of Alberta’s deposit rateincrease is increased recovery rates. In the short term increases in unredeemed deposits due tothe higher deposit rates may decline as recoveries increase, resulting in higherconsumer/brandowner fees.
A consumer or brandowner fee as currently structured appears indifferent, as both result in higherprices for consumers and potentially lower sales for brandowners. Current processes andtechnologies deployed do not allow jurisdictions to track recoveries by brandowner, thusbrandowner fees are applied by material stream regardless of the greater or lesser efforts madeby particular brandowners to improve the recovery and ability to recycle their containers.
Brandowners maintain and closely guard two proprietary items - their product formula and theirsales. Moving to a brandowner fee based on actual recovery by product and brandowner wouldrequire sales and returns data by product and brandowner. An information clearinghouseensuring the protection and security of this information would be critical.
California implemented a brandowner fee across the board largely because their jurisdiction isapproximately the size of Canada thus a market large enough to effectively negotiate withbrandowners. Alberta, at one tenth the size of California, may be in a poorer negotiation position,and may have to partner with other jurisdictions to effectively implement widespread brandownerfees.
A California style brandowner fee based on brandowner product specific recovery embodies the principalof extended producer responsibility. This would create the financial incentive for brandowners to competewith each other to fundamentally change design, materials, packaging et al with the goal to optimizerecoveries and improve overall environmental outcomes. This type of fundamental move would have tobe facilitated by the implementation of next generation automated counting and sorting equipment thatAlberta and many other jurisdictions to provide the actual recovery by brandowner and product.
4.2. FURTHER BROADEN PROGRAM SCOPE
Alberta presently has the largest beverage container recycling deposit program scope in the world as wellas the highest per capita consumption of in scope beverages - 25% greater than BC and 66% greaterthan Saskatchewan. The vast majority of beverages sold in the province (including aluminum, plastic,glass and paper containers) are already in the program. Further expansion of the program would logicallygo in two directions - incorporating food and cleaning containers that are identical to beverage containermaterials already in the program; and/or incorporating non sealing beverage containers such aspaper/plastic/styrofoam cups and containers.

54
Benchmarking Evaluation of Alberta’s Stewardship Program forRecycling Empty Beverage Containers
Both options would be a significant extension from the current program mandate, and would venture intoan area no other jurisdiction has attempted to pursue. There are significant volumes of containers in bothareas thus diversion from landfills may be significant. Potential issues include resistance frombrandowners and retailers, contamination concerns and the development of end markets broadeningthose that exist now. The generation of greater volumes of certain materials may actually create a criticalmass to establish or broaden better end markets than those the currently exist.
4.3. DEVELOP AND SUPPORT REGIONAL DOWNSTREAM MARKETS
Downstream markets are critical to the financial viability of a recycling program. Aluminum is the onlymaterial that consistently generates enough revenue to cover the associated recycling costs. Plastic,glass (except refillables) and especially paper have consistently had weak downstream markets andcommodity values. That said, the one advantage recycling programs have is that they can deliver aconstant supply of product that does have value in the commodity marketplace.
California has developed a local market for plastics through a subsidization program. Approximately $5million in subsidies are paid to downstream processors and manufacturers annually. California has thecritical mass to invest in market development given its size ($1.2 billion in program gross revenue and16.2 billion recovered containers).
Given geographic proximity, Alberta and brandowners may consider partnering with neighbouringjurisdictions to investigate opportunities to leverage their cumulative volume to develop regional marketsfor materials where few viable markets currently exist.
4.4. SUPPORT RESEARCH PROJECTS TO ENHANCE RE-USE AND RECYCLING
Only one jurisdiction appears to be funding third party research regarding container design and materials.California has partnered with academic institutions to develop alternative container designs and materialsthat are easier to recycle and breakdown faster in the oceans, rivers and landfills.
One major project is the development of “bio plastic”. The State of California is also researching methanebased plastics (PHA) and industry has developed corn based containers (PLA) and seeks to improveprocessing and enhance awareness with the public. The challenge with introducing both PHA and PLAcontainers is that they look very much like PET containers which may cause contamination problems inthe PET recycling stream.
A second major project is gasification. Gasification has become a viable option for recycling (includingcontainers) in Europe. Gasification is a flexible, reliable, and clean energy technology that can turn avariety of low-value feed stocks into high-value products, replacing traditional oil and natural gas as anenergy source, and can provide a clean alternative source of base load electricity, fertilizers, fuels, andchemicals. It is a manufacturing process that converts any material containing carbon—such as coal,petroleum coke (petcoke), biomass, or many types of beverage containers—into synthesis gas (syngas).The syngas can be burned to produce electricity or further processed to manufacture chemicals,fertilizers, liquid fuels, substitute natural gas (SNG), or hydrogen. Gasification has been reliably used on acommercial scale worldwide for more than 50 years.
Alberta and all North American jurisdictions have long standing objections regarding traditionalincineration (whether for waste or low efficiency energy recovery) which is generally viewed ascomparable to land filling. Gasification appears to be an incremental to exponential improvement upontraditional burning technologies, and a case can be made that gasification may be a far better end use ofsome container streams for the environment than traditional recycling processes. This is an area that maybe worth further scrutiny; especially given the City of Edmonton is building a gasification plant
As a separate solely brandowner funded initiative, Coca-Cola introduced the “PlantBottle” in the fall of2009, that is made from a blend of petroleum-based materials and up to 30 percent plant-basedmaterials. The "PlantBottle" is currently made through a process that turns sugar cane and molasses, aby-product of sugar production, into a key component for PET plastic. Manufacturing the new plastic

55
Benchmarking Evaluation of Alberta’s Stewardship Program forRecycling Empty Beverage Containers
bottle is reportedly more environmentally efficient as well. Coca-Cola claims a life-cycle analysisindicates the "PlantBottle" with 30 percent plant-base material reduces carbon emissions by up to 25percent, compared with petroleum-based PET. A significant advantage to the "PlantBottle" is that, unlikeother plant-based plastics, it can be processed through existing manufacturing and recycling facilitieswithout contaminating traditional PET. Another recent brandowner initiative has been to significantlyreduce the plastic content (PET) in containers themselves, especially water bottles.
These initiatives are a conundrum, as the philosophy driving existing container recycling legislation isextended producer responsibility based on brandowners driving this effort to fundamentally redesigncontainers and packaging to facilitate re-use and recycling, and protection of the environment, and notgovernment organizations and their delegated authorities. Conversely, it may be indifferent to consumershow dollars are collected that fund research like this, whether it be through increased product costs,consumer fees, unredeemed deposits, or provincial/federal taxes; as the net total cost to the consumermay be unchanged. In addition, initiatives such as gasification may require legislative support.
4.5. ENHANCE DEPOT ROLE, TECHNOLOGY, LOCATION AND OPERATIONS
4.5.1. Increase Depot Responsibility for Local Recovery Rate
The Alberta depots presently are licensed to accept empty registered beverage containers, refundingcustomer deposits as per legislation, and receive compensation from the brandowner’s operationalentities, ABCRC and ABCC. Depots are licensed independently from the ABCRC and are under thejurisdiction of the BCMB. BCMB and the brandowners are presently responsible for recoveries, not thedepots, yet the depots are the only organization that interacts with the public and in the localcommunities. Depots are currently a service provider with no direct responsibility for recoveries althoughthey are directly impacted by recoveries, as their revenue increases as their volume of redeemedcontainers increases which should relate to recoveries.
Most jurisdictions interviewed indicated that in their experience, the most effective marketing initiativesappear to be community based rather than broad jurisdiction wide initiatives. If this philosophy is acceptedand embraced, the depot appears best positioned to drive community based marketing programs to driverecoveries versus BCMB or the brandowners.
California deploys a program whereby depots are eligible for a bonus for increasing their volume tocertain pre-established benchmarks. The intent is to entice depots to market “recycling” in their local areato increase their volumes thus increasing recoveries – this program was implemented simultaneously withincreased deposit rates resulting in increased overall state recoveries. This initiative’s risk is that volumesare transferred from one depot to another with net recoveries unchanged.
There may be merit investigating the sharing of strategic responsibility for recoveries with the depots. Oneoption to consider is the California model, whereby financial incentives are provided for increases in depotvolume. A second option is revising the depot compensation model whereby recoveries are managed bysales in the depot area, and depots are compensated partially based on recoveries in their “area” – amuch more complex approach. This may create significant additional financial incentives to optimizerecoveries on a local basis.
4.5.2. Add Capital Intensive Technology to Reduce Variable Labour Costs
The current manual sorting at depots and the ABCRC is expensive, susceptible to human error, and slow.Reverse vending machines (RVMs) have been tested in Alberta and are deployed in other jurisdictionswith minimal success. They are slow, unreliable, and unable to process much of Alberta’s program scope.RVMs have proven to not mitigate much of the labour component and cost, and also don’t solve thecurrent audit and compaction issues.

56
Benchmarking Evaluation of Alberta’s Stewardship Program forRecycling Empty Beverage Containers
A new generation of automated counting and sorting technologies as well as compaction technologies fordepots are currently being investigated by Alberta and other jurisdictions. The leading technology is fromDenmark and marketed by Anker Anderson. This technology is capable of 32 material type sorts. It usesa bar code scanner with reported accuracy ratings of 98-99%. This type of sorting technology enablescustomers to bring in co-mingled loads of containers to be easily sorted and counted. These technologiesare especially useful in jurisdictions or centres where recycling volumes are high, thus reducing labourcosts and cross-contamination of materials, and improving count accuracy. Given Alberta’s wide range ofmaterial types in its program and manually sorts returned containers, the implementation of this type oftechnology presents potentially significant process improvement opportunities.
Compacting technology would help depots by improving their use of space. More containers could bestored in the same space if they were compacted. Trucking and transportation costs of recyclablematerial would also be reduced as more containers would be transported with the same volume of truckcapacity.
The main challenge faced with compaction technology is within auditing. When compaction is partneredwith sorting technology and security processes (security cameras, DVRs, etc.) confidence in accuracy ishigh and audits take place infrequently. Spot audits could be undertaken at the depot/collection centreand large penalties given if violations occur. Compaction technology alone would require strict control andaudit processes to strengthen the system against fraud.
Technology can be used to reduce overall provincial processing costs. Containers can be counted,sorted, packaged and audited at the depot level - a move to single handling of containers. Depotcapacities would also be greatly increased. Consumers will see their containers counted and sortedextremely quickly and accurately. Given the equipment reads bar codes, potential contamination can bemitigated (especially if PLA containers are introduced).
The issue is the capital cost, as each sorting unit ranges between $200,000 and $400,000. Compactionunits are also capital intensive.
In parallel with implementation of new technologies at the depot, ABCRC may move to a cross dock andbrokerage operation rather than a secondary sorting, compacting and audit operation, significantlyreducing overall system costs.
4.5.3. Locate More Depots in Retail Areas to Improve Customer Access
Alberta’s program, like most North American programs, began in the 1970s and 1980s based on a returnto retail concept that beer retailers have successfully operated long before the advent of deposit systemsfor non beer containers in the 1970s. This was also the model for long defunct regional Alberta soft drinkbrandowners such as “The Pop Shoppe” and “Happy Pop”.
The initial deposit systems for non beer containers were based primarily on a return to retail model similarto the beer model; but this return to retail model proved unpopular with retailers as they were not set upfor it, didn’t have the space for it, and in addition it wasn’t popular with consumers (hauling large volumesof empty containers through grocery or convenience stores wasn’t feasible for most consumers).Communities also perceive beverage container recycling to be noisy, dirty, smelly, attracting undesirablecustomers, require significant parking, and attract too much traffic, especially truck traffic.
While beer retailers continue to maintain the return to retail operations in Alberta and most otherjurisdictions; non beer container recycling migrated to stand alone depots that are now located primarily inindustrial or commercial areas due to local zoning restrictions. Much like Alberta, communities acrossNorth America tend to restrict depots to these areas given the negative stigma some communitiesgenerally have regarding depots. Municipal ordinances restricting depot locations to industrial andcommercial areas is a common complaint by most North American jurisdictions as a barrier to improvingrecovery as customer access is potentially poor.

57
Benchmarking Evaluation of Alberta’s Stewardship Program forRecycling Empty Beverage Containers
Alberta has largely merged the beer return to retail system with the non beer depots, as there are nowonly 62 beer retailers collecting beer containers representing approximately 1.5% of the total containerstream. Other jurisdictions such as BC and Saskatchewan are merged to a lesser degree. One reasonfor this being beer retailers remit consumers their entire deposit whereas depots generally remit only aportion of the consumer’s deposit. The result is that most jurisdictions have beer retailers collecting beercontainers in retail areas and depots collecting all containers (including beer containers, but in manycases remitting only partial deposits) located in commercial or light industrial areas. Regardless of thereasons, consumers outside of Alberta with beer and non beer containers must sort and return theircontainers to three different collection systems (return to retail, beer/liquor stores and depots) to redeemtheir paid deposits in full.
California’s structure has merged the depot system with return to retail. Large grocery stores arelegislated by the State as a “convenience zone” and in very simplistic terms must provide a recyclingdepot within a half mile of their store (the legislation is much more complex than this, and allows for onedepot to service several retailers in close proximity). As a result, many large grocery stores have a depotlocated in their parking lot beside or behind the store (the customers and containers don’t enter the store,and traffic and trucks are already present). The depot provides the customer a ticket voucher that isredeemed in the grocery store for cash or merchandise.
Pepsi and Waste Management have recently announced a program to place a new generation of RVMsin public areas such as gas stations, convenience stores, stadiums, parks, etc offering a personal rewardsystem, allowing consumers to collect and redeem points for each bottle or can they recycle in the RVMbeginning in 2010. This may also be an opportunity to investigate to improve customer access if thetechnical issues that plagued the first generation of RVMs can be resolved (acceptance of completeprogram scope, mechanical reliability, climate compatibility, etc).
Alberta may want to investigate the California “convenience zone” structure as it may be viable in manycommunities as a way to improve visibility and consumer access. This process can facilitate better cashmanagement, and is a marketing venture for the grocery store without the issues historically related toreturn to retail as originally designed. This also provides a cross marketing opportunity for the retailer tomarket to consumers redeeming their deposit through coupons, offers, etc. There are approximately2,200 depots in California; with 1,400 located in convenience zones (the number of depots per capita inCalifornia is comparable to the ratio in Alberta). Depots located in convenience zones receive additionalcompensation termed a “handling fee” which is a payment averaging $22,000 annually per depot tocompensate for the higher cost of occupancy of being located in a retail area.
4.5.4. Review and Update Depot Network and Geographic Coverage
A thorough review of the existing depot network and the communities they serve should be considered.The network of 216 Alberta depots has been in place for many years while the communities they servehave grown, and in many cases the growth has been immense. While the numbers of depots has notsubstantially changed, the capacities and throughput of the existing depots have increased substantially.Despite this capacity increase, there may be incongruence’s between the network and the communitiesthat they serve regarding access, service and capability.
Determining the optimal number of depots is difficult. Geography, population demographics,transportation networks, depot location dynamics (retail vs. commercial vs. Industrial) and depot size allimpact the assessment, and make a “depots per capita” comparison of lesser value.
The potential deployment of new equipment estimated to cost hundreds of thousands of dollars per depotmay present the appropriate opportunity to review the depot network including the number, size,geographic location, zoning location (retail vs. commercial vs. industrial locations), capability, servicestandards et al; and adjust the network based on the current and forecast market requirements inconjunction to determining where and how to deploy this expensive technology. There are obviouslybarriers in place in Alberta regarding adjusting the network, not the least of which are zoning challengesand overall resistance within communities to the location of depots in retail areas.

58
Benchmarking Evaluation of Alberta’s Stewardship Program forRecycling Empty Beverage Containers
The significant cost of this technology may drive the depot network to move to a “hub and spoke” systemused by numerous distribution, warehousing to and transportation organizations. The result of this type ofnetwork would result in small depots that don’t have the volume to justify expensive technologiestransporting containers to larger regional depots for counting, sorting, audit and compaction rather thanthe present model where all 216 depots collect containers and then transport the same containers toABCRC processing centres in Calgary, Edmonton, Lethbridge and Red Deer for counting, sorting, auditand compaction (once the ABCC consolidation is complete).
4.5.5. Enhance Commonality of Alberta’s Depots
In Alberta as in most jurisdictions, depots operate with a degree of independence. They adhere to aseries of service standards, but generally do not have common signage, corporate dress, hours ofservice, or specific service standards in place—each depot is very different from the next. Saskatchewandepots operate on more of a “franchise” model basis with many more common elements such as signageor corporate dress. Most jurisdictions interviewed would prefer that their depots operate a standardizedapproach to provide a standard for customer service and contribute to recoveries. The reality is that mostjurisdictions operate a legacy network of independent depots making standardization a difficult process.
There may be opportunities to enhance the service at Alberta depots and contribute to increasedrecoveries through the implementation of provincial standards for depot signage, appearance, locationand service. This is in line with the vast majority of successful retail and service organizations that striveto standardize their operations from a customer perspective to optimize revenue and profit (and in thecase of depots, recoveries and their profits).
4.5.6. Returns by Weight Bring Significant Risk
Some jurisdictions such as California and South Australia, accept empty container returns by individualcount or by weight. In California, when a load of 50 or more empty containers is returned, the refund isbased on weight. This is necessary in California where RVMs are in widespread use and are extremelyslow. The Division of Recycling in California and South Australia’s Super Collectors are careful tocalculate and update weight to volume conversion rates to ensure fairness and transparency. Returns byweight may be an option for Alberta; at least until high speed sorting can occur at the depot level. Notethat Alberta’s winter weather may be problematic as empty containers could be filled and frozen, therebyskewing returnable weight and creating erosion deposit payments to customers. Both California andSouth Australia continue to experience contaminants at the processor level, creating additional processcosts.
4.6. THERE ARE FEW STRATEGIC AND OPERATIONAL SYNERGIES WITHOTHER RECYCLING PROGRAMS
Alberta, and most other North American jurisdictions, has separate recycling programs for tires,lubricating oil, oil containers, glycol containers oil filters, electronics, batteries, paint, hazardoushousehold waste and dairy containers (outside of Alberta). Municipal blue box programs are alsoproliferating. Some depots in Alberta (approximately 50) and Saskatchewan collect used oil andelectronics, with depots in other jurisdictions also collecting those and other recyclable products.
There appear to be few strategic or operational synergies with other programs due to different customerrequirements for collection; risk and the cost of cross contamination (many of the other products containtoxins); the differing requirements of processing and end markets; and, the need to optimize labour andtransportation efficiencies. A direct comparison between deposit programs and blue box programs wasnot explored, as the focus of this report was to compare deposit programs.

59
Benchmarking Evaluation of Alberta’s Stewardship Program forRecycling Empty Beverage Containers
4.7. LOCAL MARKETING INITIATIVES APPEAR TO MOST EFFECTIVELYINCREASE RECOVERIES
The relationship between marketing (and specifically funds spent) and recovery rates is debateable.Alberta spent $4.3 million on marketing in 2008 in anticipation of the increase in deposit rates and theaddition of dairy products to the program. Recoveries for non-beer aluminum, plastic and glass increasedalmost immediately as a result of the combined increase in deposit levels, the marketing effort and adownturn in the provincial economy. Separating the impact of each is difficult – however, mostjurisdictions view deposit rates as the driver of recoveries and not marketing, but few have ever spent thismagnitude of funds on marketing.
Virtually all other jurisdictions continue to spend relatively few dollars on marketing initiatives except BC.Marketing initiatives consist of traditional media advertising (TV, radio, print and internet), joint ventureswith partners that generally take the form of fundraising for non-profit organizations, community initiativeslead by local champions (e.g. community clean up campaigns) and small scale local initiatives.
4.7.1. Traditional Advertising Quickly has Diminishing Returns
Most jurisdictions do little advertising through media such as print, TV, radio and internet. Beveragecontainer recycling programs tend to be mature and have been well branded since their introduction. Theconsensus of reviewed jurisdictions is that the message requires reinforcement, but there are quicklydiminishing returns.
4.7.2. Recycling Initiatives with Community Partners Appear Promising
Alberta and most jurisdictions have had success partnering with primarily non-profit organizations to drivelocal recoveries while assisting the partner organization to raise funds. The non-profit organizationessentially collects containers in the community ideally gathering containers that otherwise may not havebeen recycled.
4.7.3. Focus Marketing Locally in Each Communities
Alberta and most jurisdictions have found that the most effective marketing is community focused notjurisdiction wide advertising campaigns. Local marketing can take the form of community clean ups orrecycling drives in schools. They are usually most effective when there is a local “champion”. There maybe opportunities to leverage the depot’s presence in marketing their communities.
4.7.4. Investigate Customer rewards initiatives
Customer loyalty programs have been extremely successful in numerous industries – for example earning“points” or “coupons” redeemable for merchandise or services.
In the recycling field, California has seen the beginnings of industry loyalty programs that are notoperated by or affiliated with the State. Los Angeles has recruited marketing partners whereby frequentusers (based on the volume of materials in the curb side boxes) receive coupons from participatingsponsors. The “Toll Roads”, a DAO like organization that manages the toll freeways in southernCalifornia, has partnered with several retailers who in one case will pay $5 in a customer’s Toll Roadaccount for every $100 spent in the retailer’s store. A large high profile grocery store will pay $0.10 pergallon of gas at a specific service station chain to a maximum amount for every $100 spent in their store.
One option for Alberta would be a rewards program where customers create an account and are providedwith a branded smart card. The smart card is scanned at point-of-sale (POS) where reward points arecollected and points accrue. In this scenario, the more containers recycled, the more reward points areaccrued. Rewards points would be able to be exchanged for goods services or coupons valid atparticipating retailers.

60
Benchmarking Evaluation of Alberta’s Stewardship Program forRecycling Empty Beverage Containers
At the outset a financial investment in marketing would be required to build awareness and establishrelationships with participating retailers. However as the program evolves, retailers may want to promoteand advertise their participation in the program reducing the need for support from BCMB. In support ofthe environmental aspect of the beverage stewardship container program, reward points could bedonated to charitable organizations or environmental causes.
A Recycling Rewards Program would require supporting technology such as customer information andrewards tracking databases, POS technology and retail partnerships where points can be redeemed. ThePepsi-Waste Management Dream Machine initiative is very much along these lines, whereby a consumerreturning containers can collect points in addition/instead of receiving their deposit back using a log inscreen and a PIN and password.

61
Benchmarking Evaluation of Alberta’s Stewardship Program forRecycling Empty Beverage Containers
5. PROGRAM SUMMARIES
5.1. ALBERTA
5.1.1. Program Overview
The Alberta program is guided by the province’s Environmental Protection and Enhancement Act,Beverage Container Recycling Regulation 101/97. The Alberta stewardship program operates on aDelegated Administrative Organization model where the Beverage Container Management Board isgranted the regulatory authority and exclusive right to operate the program by the Government of Alberta.Overseen by the BCMB, stewardship program activities are managed by a consortium of 216independently owned and operated depots, the beverage industry, and two industry-appointed collectionagents: the Alberta Beverage Container Recycling Corporation (ABCRC) and the Alberta Beer ContainerCorporation (ABCC). The BCMB is supported by the Beverage Container Management BoardAdministrative By-Law and the Beverage Container Management Board Fee By-Law.
The program is entirely self-funded and does not receive government financing. The program is funded through recycled materials sales, unredeemed deposits, revenue from
recycled material and consumer fees (termed Container Recycling Fee or CRF) - a levy imposedon certain container types that operate at a loss due to low raw material values.
The refillable beer stream, representing approximately 9% of the total program volume), is fundedin a comparable manner, except that deposits and CRFs are paid by the brandowner versus theconsumer, thus refillable beer products are sold to the provincial liquor wholesale entity (AGLC)for an “all in price”.
5.1.2. Legislation
The Litter Control Act created the Alberta deposit program in 1972. It originally included traditionalbeverage containers such as soft drink and liquor containers, but the legislation was expanded to includebottled water and juice containers in 1989. TetraPaks and gable top containers were added in 1997, andbeer containers became eligible due to a regulatory change in 2001. In June 2009, the program scopewas expanded to include dairy containers and Alberta is now the only jurisdiction in North America toinclude them in a legislated deposit program.
5.1.3. Stakeholders
Depot operators, the beverage industry, the Alberta Beverage Council (ABC), ABCRC and the ABCC arekey stakeholders in Alberta’s stewardship program and their operations are overseen by the BCMB.Beverage producers and brand owners are required by provincial regulations to register their products,collect, transport, and recycle used containers.
Alberta’s beverage container registration system is managed by the BCMB. Brand owners of non-alcoholic products must register containers with the BCMB directly. The Alberta Gaming andLiquor Commission (AGLC) registers warehoused alcoholic product containers with the BCMB.
ABC represents beverage manufacturers and beverage distributors in Alberta through itsrepresentation on the ABCRC and the BCMB board of directors.
The ABCRC operates as the stewardship agent for all non-beer producers/brand owners inAlberta as well as for one refillable beer company. In addition to collection and processingactivities, the ABCRC manages handling fee disbursement to bottle depots upon containercollection from depot locations.
Through the use of subcontractors, the ABCC undertakes stewardship activities on behalf of beerproducers and brand owners in Alberta. The ABCRC is subcontracted to collect non-refillablebeer containers from depots, and the Brewer’s Distributors Limited (BDL) is subcontracted tocollect and process all refillable beer containers.

62
Benchmarking Evaluation of Alberta’s Stewardship Program forRecycling Empty Beverage Containers
Depots in Alberta are independently owned and operated businesses, represented by the AlbertaBottle Depot Association (ABDA), and are separate from brandowners, and apply for theiroperating permit from the BCMB. Their revenue is earned by exchanging collected containers forhandling fees paid by the collection agent.
5.1.4. Program Structure
The BCMB, as created by Government of Alberta legislation, governs the Alberta program. The BCMBrequires operating plans from either Collection System Agents (CSA) (or stewards, ABCRC and ABCC)and oversees the program as per legislation. The BCMB’s role in the stewardship program involvesapproving operating agreements between CSAs and the ABDA, depot licensing and inspection functions,collecting depot financial data and setting handling commissions. The BCMB operates quality controlmechanism including depot and CSA audits and is ultimately responsible for the 85% return rate. Neitherthe government nor the BCMB have direct involvement in stewardship program collection and recyclingactivities. The funding container collection responsibilities are managed by the ABCRC and ABCC. Theseagents also actively market and sell processed containers to generate revenue and sustain thestewardship program. The beverage industry, its retailers, and depots offset program costs with revenuefrom recycled material sales, unredeemed deposits and the CRF. The diagram below outlines thebeverage container lifecycle and the dollar lifecycle in Alberta:

63
Benchmarking Evaluation of Alberta’s Stewardship Program forRecycling Empty Beverage Containers
Purchase
HandlingCommissionand Deposit
Deposit
Purchase
BulkShipment
Return forRefund
Purchase Recycled Material i.e. Aluminum
Litter
Consumer
Manufacturer orDistributor
Common CollectionAgent
Depot
Retailer
Recycle Market
Other Uses
Garbage
Landfill
Blue Box or Other Recycling Project
BCMB
Beverage ContainerLifecycle
Dollar Lifecycle
Purchase
Manufactured into manydifferent End Products
Deposit &CRF
Deposit &CRF
CRF
Refillable BeerContainers
(Whereapplicable)
(Whereapplicable)

64
Benchmarking Evaluation of Alberta’s Stewardship Program forRecycling Empty Beverage Containers
The flow of non beer containers and deposits begins with the brand owners(manufacturer/distributor) that deliver beverage products to retailers. Upon delivery, retailers paya $0.10 or $0.25 deposit per container along with an appropriate CRF to the brand owner. Brandowners remit these collected deposits and CRF to their appointed collection agent, the ABCRC orABCC as appropriate.
All liquor products are sold initially to the provincial regulator and wholesaler (AGLC). Thedeposit and CRF is applied to the price of refillable beer products sold to AGLC and subsequentlysold to retailers for an “all in” price including the $0.10 or $0.25 deposit and CRF. All other liquorproducts have the $0.10 or $0.25 deposit and CRF added separately from the product priceinvoiced to retailers.
The retailer includes the deposit value and any applicable CRF into the price of the product(except refillable beer) and recovers their deposit payment when customers purchase thebeverage.
Customers recover their deposits by returning empty containers to a bottle depot. Empty container collection occurs at bottle depots and registered beer retail stores where owners
are required to refund consumers for their deposit. Agents collect and transport containers fromdepots/registered retailers and reimburse deposits paid to customers. A per container handlingcommission (depot revenue) is also paid by collection agents at the time of depositreimbursement.
Waste management operators that collect via blue box return empty containers to depots togenerate revenue, since it’s inclusion in the deposit program the return of dairy containers hasbeen lucrative for these operators as well as beneficial for the return rate of the material.
Collection agents transport empty containers to a facility for processing and sell processedcontainers in open markets. Materials may be recycled into new containers, articles of clothing,construction materials or other uses as appropriate.
Revenue generated from the sale of processed containers, combined with unredeemed depositsand Container Recycling Fees are used to fund Alberta’s beverage container stewardshipprogram.
5.1.5. Program Scope
At time of writing Alberta’s deposit program is the most inclusive in reviewed jurisdictions and accepts thefollowing containers: plastic containers (PET, HDPE), aluminum, bi-metal, polycoat, glass, bag-in-a-box,juice pouches, and dairy containers.
Deposits in Alberta are based on container capacity, $0.10 is collected for one litre or less, and $0.25 formore than one litre.
5.1.6. Program Performance
Between 2004 and 2009, the total number of containers returned to depots increased by 42% from 1.03to 1.78 billion. This increase is attributed to Alberta’s strong interest in the program; 85% of Albertansreport that they actively contribute to and support the program.
Performance is also measured by reducing the impact of beverage containers on the environment. TheBCMB is unique in that it calculates and publicly reports measures such as barrels of oils saved (351,512in 2008), greenhouse gas emissions avoided (128,530 metric tonnes in 2008) and cubic meters of landfillspace saved (344,620 in 2008), each measure increasing over the previous year.

65
Benchmarking Evaluation of Alberta’s Stewardship Program forRecycling Empty Beverage Containers
5.2. BRITISH COLUMBIA
5.2.1. Legislation
The Beverage Container Stewardship Program Regulation governs BC’s bottle deposit program. Thelegislation requires all ready-to-serve beverages be sold in recyclable or refillable containers. All aresubject to a deposit with the exception of dairy and dairy substitutes. The following are significantcharacteristics of the program:
The program is based on an extended producer responsibility model, which states that brandowners must file a stewardship plan in order to sell or distribute product in the province. Thestewardship plan describes how the program will be operated and funded. Stewardship plansmust be approved by the Ministry of Environment.
Agents may be appointed by producers to carry out collection and recycling responsibilities. Allnon-alcoholic and most non-beer alcoholic brand owners have appointed Encorp Pacific as theiragent, where as beer manufacturers have appointed Brewers Distributor Limited (BDL).
BC’s Ministry of Environment is responsible for overseeing any modifications made to recyclinglegislation, such as introducing new materials, and thus controls the future direction of thestewardship program. The Ministry has no direct involvement in the operations of either Encorp orBDL.
5.2.2. Program Scope
Containers in BC’s program are all assigned a deposit based on original contents and volumetric size,and may be redeemed at all depots, retail locations, and Liquor Distribution Branch stores. The structureand range of accepted materials in BC’s program align very closely with Alberta’s program, albeit with adifference in the total number of container types accepted by each program. BC accepts approximately35,000 SKU’s; while Alberta’s accepts approximately 85,000.
BC’s legislation mandates the stewardship program accepts all non-alcoholic and alcoholic ready-to-drink beverage containers including soda, water bottles, juice, sports drinks, spirits, and wine.It also accepts beer bottles and one-way can formats.
Dairy and dairy substitute containers are not included in the legislation and are excluded from thedeposit program. As deposits are not charged on these containers they do not contribute to returnrate calculations although redemption centres accept dairy containers on a voluntary basis. At thetime of writing BC reports no intention of introducing dairy and dairy substitute containers intotheir deposit program.
Containers are assigned a deposit based on whether its contents are alcoholic or non-alcoholic,then further categorized by container volume. Non-alcoholic containers less than or equal to onelitre have a deposit of $0.05, and non-alcoholic containers greater than one litre have a $0.20deposit. Alcoholic beverages less than or equal to one litre have a deposit of $0.10, andcontainers greater than one litre have a $0.20 deposit.
5.2.3. Program Structure
BC is characterised by the exclusion of government in implementation and operation activities of thebeverage container recycling program. Empty container collection and recycling responsibilities aredelegated to industry that has assigned agents to undertake these activities on their behalf. Diagramsrepresenting the beverage container lifecycle and the dollar life cycle for both Encorp Pacific and for BDLfollow:

66
Benchmarking Evaluation of Alberta’s Stewardship Program forRecycling Empty Beverage Containers
Encorp Pacific
Encorp plays a central role in the lifecycle of most beverage containers and deposits within BC’sstewardship program, with beer containers being their only exception. Encorp’s process flow is describedas follows:
The flow of all non-alcoholic and most alcoholic beverage containers, along with correspondingdeposits, begins with the brand owner. The brand owner receives a deposit and applicableContainer Recycling Fee (CRF) from the retailer at the time of delivery and remits that amount totheir appointed agent, Encorp Pacific.
Retailers include the deposit and any applicable CRF into the price of beverage products andrecover their payment when the customer makes a purchase.
Customers are eligible to receive a deposit refund when empty beer and non-beer containers arereturned to any of the province’s approximately 170 depots or 250 retail locations, such asgrocery stores, convenience stores, and gas stations (very few containers are returned toretailers – the vast majority of containers are collected at depots). Beer containers can bereturned to an additional 1,200 plus locations.
Encorp collects containers from redemption centres. Depot owners are remunerated a handlingfee and a reimbursement for deposits they refunded customers upon exchange for the emptybeverage container.
Encorp transports empty containers to an interim processor, where they are recycled and thematerial shipped to an end buyer. As owners of the recycled material, Encorp is entitled to anyprofit and strive to maximize sales revenue and minimize recycling expenses.
Unredeemed deposits are held by Encorp and are used to sustain the stewardship program.Unredeemed deposits are used to pay depot owners a handling fee which represents the depot’ssole source of revenue. While Encorp provides pick-up services to grocery stores, they do notsupport such services for smaller retail locations such as convenience stores or gas stations.These retailers are required to have independent collection arrangements set up with depots orgrocery stores.
RecycleMarket
Encorp Pacific
Brand Owner
Retailer
Consumer
Depot/Retailer
Other Uses
Beverage Container Lifecycle
Dollar Lifecycle

67
Benchmarking Evaluation of Alberta’s Stewardship Program forRecycling Empty Beverage Containers
Brewers Distributor Limited
BDL, the beer brewers’ agent in BC, is responsible for the distribution, collection, recycling and reuse ofall beer containers sold in the province. BDL’s process flow is described as follows:
A licensed retailer (government and private liquor stores, restaurants, bars, etc.) place purchaseorders for beer with a brewer and BDL prepares the shipment. Upon delivery of the order, BDLcollects product sale revenue from the retailer, and charges the container deposit and anyapplicable CRF. BDL remits these to the Liquor Distribution Branch (LDB).
Within two weeks BDL receives the deposits and CRF collected from the LDB. These are used toreimburse retailers and redemption centres for refunds to customers, as well as to pay depotoperator handling fees. BDL only refunds deposits on beer cans; refunds for bottles are handledin a separate stream outside of BDL’s operations.
BDL collects beer cans directly from licensed retailers and contracted redemption centres, sortsand condenses containers that have not already been done at the depot level and ships thematerial to an end buyer.
Beer container refunds may be discounted depending on the receiving depot and whether that depot hasan agreement with BDL. Liquor store return centres are required to provide a full deposit refund. Depotssolely on contract with Encorp are not required to reimburse any amount to consumers for returned beercontainers as Encorp will not pay the depot for non-Encorp containers. Where depots have agreementswith both Encorp and BDL, or just with BDL, a full deposit refund must be reimbursed.
In cases where the depot is not required to accept or reimburse a beer deposit, depot operators may doso of their choosing to offer enhanced service their customers. The deposit refund amount is at thedepot’s discretion and may be equal to or less than the full deposit paid at point of purchase. Forexample, if a $0.10 deposit is paid on a beer can and the depot owner is not on contract with BDL andchooses to offer a $0.07 refund, the $0.03 difference is retained by the depot. This additional revenuemay be used to compensate depots for organizing delivery of beer containers to BDL.
Brewers Distributors Limited
LiquorDistribution Branch
Brewers
Licensed Retailer/Depot
Consumer
Depot/Retailer
RecycleMarket
OtherUses
Beverage Container Lifecycle
Dollar Lifecycle
Bottles
Cans
Both Deposits
Bottle Deposits
Can Deposits
Both
68
Benchmarking Evaluation of Alberta’s Stewardship Program forRecycling Empty Beverage Containers
Variance in the flow of beer cans and refillable beer bottles exists:
When an order is placed for beer bottles, BDL acts as the collection agent for deposits and remitsfunds to the LDB which then transfers deposits directly to brewers instead of BDL.
Brewers internalize program costs; no recycling agent such as Encorp or BDL handles the flow ofdeposits. They are responsible for reimbursing retailers and depots for deposits and issuehandling fees. However, BDL manages the collection and transportation of returned beer bottlesto a brewery for reuse.
5.2.4. Program Comparison
BC’s stewardship program is the most similar to Alberta’s program. The structure, scope, and processesare directly comparable and many features, such as use of CRF and third party collection agents, exist inboth jurisdictions. There are few operating differences that separate the programs, such as the slightlydifferent regulatory structure (BC does not have an equivalent of the BCMB, as brandowners outsourcemanagement of the program to Encorp Pacific), depots operate within a more standardized operatingmodel and there are lower deposit rates for some containers.

69
Benchmarking Evaluation of Alberta’s Stewardship Program forRecycling Empty Beverage Containers
5.3. SASKATCHEWAN
5.3.1. Legislation
The Saskatchewan Litter Control Act, enacted in 1973, governs the province’s stewardship program. In2009, the Act was merged into the larger Saskatchewan Environmental Management and Protection Act.
The program is administered by SARCAN, the recycling division of the SaskatchewanAssociation of Rehabilitation Centres (SARC).
SARCAN operates under an exclusive contract with the Government of Saskatchewan to operatethe province’s entire stewardship program.
There are 71 return depots in Saskatchewan; 28 are operated directly by SARCAN and 43 areoperated by SARCAN “franchise members”. These depots operate on a “franchise” model but areindependent businesses. They are contractually obligated to abide by all SARCAN policies andregulations, and they receive operational funding, promotional materials, float money, etc. inreturn.
5.3.2. Program Scope
The program operates on a Delegated Administrative Organization model in which SARCAN is grantedthe sole responsibility for operating the stewardship program. SARCAN’s primary objectives extendbeyond recycling as the program was designed to provide maximum employment opportunities fordisabled people. SARCAN’s efforts to employ disabled people have received favourable recognition fromthe public and government, and those resources have become a significant asset for them.
SARCAN accepts aluminum, bi-metal, PET, HDPE, polycoat, and glass in the deposit program.Refillable beer bottles are also accepted by SARCAN and they can be returned for a full refund atten Brewer’s Distributors Agent locations, or at any SARCAN depot or beer retailers for adiscounted refund.
Dairy containers are excluded from the legislation and are not included in SARCAN’s depositprogram. Dairy containers are accepted at SARCAN depots on a voluntary basis althoughcustomers do not receive a refund for any dairy container they return.
Containers are assigned a deposit based on the container material type, and are furthercategorized based on container volume. Classification categories include metal cans and plastic,non-refillable glass, polycoat containers, and aseptic containers. Deposits in Saskatchewan rangefrom a minimum of $0.05 for all polycoat and aseptic containers up to a maximum of $0.40 for anon-refillable glass container over 1 litre.
As there is no environmental handling charge paid at point of purchase on beer bottles, SARCANreimburses partial refunds to generate revenue to cover refillable beer bottle processing costs.Consumers are charged a $0.10 deposit and are refunded $0.04. Collection, handling andtransportation costs associated with these containers are paid for using the $0.06 difference indeposit paid and refund reimbursed amounts.

70
Benchmarking Evaluation of Alberta’s Stewardship Program forRecycling Empty Beverage Containers
5.3.3. Program Structure
SARCAN is the sole organization active in Saskatchewan’s stewardship program. It is a verticallyintegrated system and every aspect of the program’s operations is controlled by a direct SARCANemployee or a franchise member. SARCAN’s process flow is described as follows:
Brand owners (producer, distributor) are required to remit the deposit value and an EnvironmentalHandling Charge (EHC) to the Government of Saskatchewan for their product upon entry into theprovince. These funds are placed into the general revenue fund.
When purchasing product from brand owners, retailers include the deposit and the EHC in theirpurchase price; these are recovered by the retailer when customers make a purchase.
The customer is eligible to receive a full refund on their $0.05, $0.10, $0.20 or $0.40 depositwhen the container is returned to a SARCAN depot. However, the EHC is not refunded as thesefunds finance the program.
SARCAN collects returned containers from depots and invoices the Government ofSaskatchewan monthly. SARCAN is compensated within 10 days of the invoice for deposits paidto customers. Unredeemed deposits remain in the general revenue fund and are not remitted toSARCAN.
SARCAN processes returned containers and markets recycled material to buyers. Revenue fromthese sales accounts for approximately 25% of the annual operating budget, with the majority ofrevenue coming from aluminum and PET materials.
5.3.4. Program Comparison
The Saskatchewan and Alberta programs are very similar in legislation, governance and operations. Bothare administered by an exclusive entity and both use depots to collect the majority of empty containers.The two major differences are scale and fundamental objectives. Alberta’s program is significantly largerdue to having over three times the population in a comparably sized geographic area. Saskatchewan’sprogram is based on two driving philosophies – stewardship of the environment (like all comparableprograms), and providing employment opportunities for disabled people. Saskatchewan is the onlyjurisdiction with dual operating premise.

71
Benchmarking Evaluation of Alberta’s Stewardship Program forRecycling Empty Beverage Containers
5.4. NEW BRUNSWICK
5.4.1. Legislation
Enacted in 1992, the New Brunswick is the Beverage Containers Act governs the province’s stewardshipprogram. New Brunswick’s system was the original model for the “half-back” approach in Canada. Theprogram’s Governmental Administrative Agency governance structure and legislation require distributorsto register with the Department of Environment and submit a stewardship plan. The stewardship plan mayassign an agent to fulfill stewardship requirements on the distributor’s behalf.
The collective distributors of soft drink beverages have engaged Encorp Atlantic to fulfil collectionand recycling duties. Encorp manages approximately 50% of the containers that flow throughNew Brunswick’s system.
Distributors of alcoholic beverages have contracted Alcool New Brunswick Liquor Commission(Alcool) to perform collection and recycling duties on their behalf.
Alcool subcontracts Rayan Investments to undertake collection activities and recycling processesof non-refillable liquor containers, and leverage breweries to collect and reuse refillable beercontainers.
The Beverage Containers Act states that customers are eligible to receive 50% of their bottledeposit upon return of an empty container. The other 50% is split equally between agents of thebeverage industry to operate the program, and the Environmental Trust Fund which providesfunding for projects that promote the sustainability and beautification of New Brunswick’senvironment.
5.4.2. Program Scope
All beverage containers included in the Beverage Containers Act are subject to a deposit. The collection,recycling and reuse of all deposit containers in New Brunswick are performed by three entities: EncorpAtlantic, Rayan Investments and The Brewers Association of Canada.
All ready to consume beverage products excluding dairy, dairy substitutes, meal replacementsand unpasteurized apple cider, are included in the program and are subject to a deposit. NewBrunswick’s legislation includes and deems aluminum, bi-metal, PET, HDPE, glass and polycoateligible for a deposit and refund upon return.
All refillable beverage containers are deposit eligible however; consumers receive a full (100%)refund when the containers are redeemed. Consumers who recycle one-way containers receive ahalf-back deposit.
Containers are assigned a deposit based on the alcoholic or non-alcoholic content, and arefurther categorized based on container volume. Alcoholic beverages are classified once more intorefillable and non refillable groups, with refillable and one-way containers having separate depositlevels. Deposits charged in New Brunswick are either $0.10 or $0.20 depending on the containertype.

72
Benchmarking Evaluation of Alberta’s Stewardship Program forRecycling Empty Beverage Containers
5.4.3. Program Structure
Encorp Atlantic
Encorp Atlantic acts as the agent for all non-alcoholic beverage bottlers in New Brunswick. They managethe collection, transportation and recycling duties and reimburse depots for deposits paid to consumers.The Encorp process flow is diagrammed below:
Brandowners initiate the flow of containers and charge retailers the full deposit value upondelivery of an order.
Distributors remit the full deposit value collected from retailers to Encorp Atlantic. Retailers add the full deposit value to a product’s selling price and are reimbursed the deposit
when customers purchase a beverage. Customers are eligible to receive half their deposit upon return of empty containers to redemption
centres. Encorp collects empty containers from redemption centres and reimburses operators the deposit
paid to consumers. The remaining portion of the full deposit value is remitted to the NewBrunswick Government for redistribution to environmental programs.
Encorp transports and processes used containers to sell the materials to end markets.
ALCOOLAlcool, representing alcoholic brandowners, is the agent responsible for stewardship activities related toalcoholic beverage containers in New Brunswick. Rayan Investments is subcontracted to performcollection and recycling activities. The Alcool process flow is described as follows:
Rayan Investments Alcool (Distributor) Retailer
ConsumerRedemptionCenter
New BrunswickGovernment
RecycleMarket OtherUses
Beverage Container Lifecycle
Dollar Lifecycle
Portion of deposit
25%
25%
50%

73
Benchmarking Evaluation of Alberta’s Stewardship Program forRecycling Empty Beverage Containers
The distributor (Alcool) charges a full deposit for each beverage container delivered to retailers.Retailers pay the full deposit upon receiving the product. Alcool is required to remit the full depositto an agent that has been approved by the Minister of the Environment. This agent is RayanInvestments.
The full deposit is included in the beverage price and retailers are refunded the full depositremitted to Alcool when consumers purchase a ready-to-serve beverage.
Consumers return used containers to a redemption centre where they receive a refund of half thedeposit they paid when making the beverage purchase.
Like Encorp, Rayan remits half the deposit collected from Alcool to redemption depots ascompensation for refunds paid to customers. Rayan is required to remit a portion of the deposit tothe Environmental Trust Fund, pay for HST and operating costs. Any remaining amounts areRayan revenue.
Containers collected by depots are recycled. Revenues generated by the sale of processedcontainers, unredeemed deposits and non-refunded half-back deposit amounts are directed tofund the stewardship program.
5.4.4. Program Comparison
New Brunswick’s program is built on a different stewardship model compared to Alberta’s program.Similarities exist in legislation, structure and operations. The brandowners in each program outsource tothird party organizations, and independently owned depots are operated in a similar fashion. The majordifference is geography given New Brunswick is much smaller than Alberta. New Brunswick’s use of ahalf back model is an alternative method of funding the program, where half the deposit is used to fundeconomic shortfalls of the program versus adding a consumer fee (CRF) that Alberta deploys. The resultis a lower cost to the consumer, but less financial incentive to recycle their containers.
74
Benchmarking Evaluation of Alberta’s Stewardship Program forRecycling Empty Beverage Containers
5.5. CALIFORNIA
5.5.1. Legislation
The California Beverage Container Recycling and Litter Reduction Act govern the beverage containerstewardship program in California. The stated goal of the legislation is to reduce litter by ensuring that therecycling process for every container type is easy and accessible for all consumers.
The following are significant characteristics of the program:
A processing fee is charged to manufacturers to mitigate financial and operational costs. Theprocessing fee, similar to the Container Recycling Fee charged to consumers in BC and Alberta,is imposed to cover the difference between revenues from the sale of processed containers andcost of recycling those materials. No other state has a system that places this responsibility onthe manufacturer.
California has designated “Convenience Zones” which are half mile radius zones around retailgrocery stores where a recycling centre must be located. Zones are intended to make recyclingconvenient by providing customers with easily accessible locations for container returns. Thisessentially places depots in retail areas versus industrial or commercial areas.
5.5.2. Program Scope
California’s program is structured very much like Alberta’s program. The stewardship program is financedentirely through unredeemed deposits and brandowner’s fees; government funds do not subsidize theprogram.
California’s stewardship program accepts aluminum, all plastic, glass and bi-metal materials.Containers made of these materials hold drinks such as beer, soda, water juice, coffee and teadrinks, sport drinks, and wine coolers.
Vegetable juice containers under a certain size and refillable glass bottles are excluded from thedeposit program and have no deposit or refund value. Other vegetable juice containers areeligible for return on a voluntary basis with no deposit-refund.
Dairy containers are not included in California’s stewardship legislation and do not have anydeposit or refund value. Dairy containers can be returned on a voluntary basis only.
Deposit levels for containers in California are similar to those in BC. Containers are categorizedbased on container volume. Sorted containers less than 24 ounces have a deposit of $0.05 USD,and containers equal to or greater than 24 ounces have a $0.10 USD deposit.

75
Benchmarking Evaluation of Alberta’s Stewardship Program forRecycling Empty Beverage Containers
5.5.3. Program Structure
Oversight responsibilities and managing the collection and disbursement of deposits are the focus of TheCalifornia Division of Recycling (Division); it has no direct role in collection or processing activities. Thefollowing diagram depicts the container and dollar lifecycle in this system:
The overall flow is described as follows:
Brand owners (distributors) initiate the beverage container system and deposits. Upon entry intoCalifornia’s marketplace, brand owners pay a deposit (termed California Redemption Value orCRV) to the Division for each container they sell to retailers.
Brand owners deliver beverage products to retailers and recover their deposit by adding thatamount to the retailer’s invoice.
Deposits paid by retailers are reimbursed when customers purchase a beverage and are chargedthe deposit.
Customer return eligible containers to one of approximately 2,200 recycling centres locatedthroughout the state and receive a full deposit refund.
Recycling centres are reimbursed refunds disbursed to customers when collected containers aresold to materials processors.
Materials processors are responsible to recycle collected containers. The Division reimbursesprocessors for amounts paid to the recycler for the containers.
Brand OwnerCalifornia Divisionof Recycling
Retailer
Consumer
Recycler
Processor
OtherUses
Beverage Container Lifecycle
Dollar Lifecycle
Litter/Garbage

76
Benchmarking Evaluation of Alberta’s Stewardship Program forRecycling Empty Beverage Containers
5.5.4. Program Comparison
California’s program is also very similar to Alberta’s program in terms of legislation, structure andoperations. California is roughly the same geographic size as Alberta with approximately ten times thepopulation, allowing the state implement some creative initiatives. Significant strategic and operationaldifferences exist comparing the California and Alberta programs. The major difference from the Albertaprogram is that the State is allowed to escheat the fund of unredeemed deposits, and the currentescheatment of $99 million presently in conjunction with the economic downturn has created a fiscalstress on the program.
The brandowners in California pay a processing fee on a declining sliding scale based upon recoveriesdesigned to encourage brandowners to design containers easier to re-use or recycle whereas in Alberta,all additional fees are charged to the consumer. California deposit levels are lower despite beingincreased twice in the last five years. The California program subsidizes local processors and through thissubsidization is developing a local end market for plastic. California regulations allow incineration ofrecycled material if no end markets exist though this has not be done in years. California funds bothbroad environmental initiatives and academic research into recycling initiatives such as “bio bottles” andalternative materials for containers
California locates their collection depots mainly in retail areas close to grocery retailers, and deploysalmost a hybrid of a return to retail model. Collection depots, independent business very similar to theAlberta depot model, are paid a bonus for increasing their volumes (and hopefully increasing State-widerecoveries) and for increasing their quality (defined as reducing contaminants) optimizing end marketpotential. In Alberta, there is one processor serving 216 collection depots. In California, there are 173processors serving approximately 2,200 depots. Different from Alberta, RVMs are deployed at many ofthe collection sites, as is redemption by weight option. One of the key challenges in the redemption byweight approach in California continues to be contaminants (rocks, wood, sand, garbage, etc) in therecycling stream as well as elements of fraud.

77
Benchmarking Evaluation of Alberta’s Stewardship Program forRecycling Empty Beverage Containers
5.6. CONNECTICUT
5.6.1. Legislation
Connecticut’s Beverage Container Deposit and Redemption Law forms the bottle bill program that state.Originally intended to reduce litter and promote recycling within the state, the legislation was enacted in1978 and came into effect on January 1, 1980.
Between the months of November 2008 and February 2009, the Connecticut General Assemblypassed three laws to expand the scope of the bottle bill legislation and modify some of therequirements on members of the beverage industry.
o First, Public Act 08-01 requires the “deposit initiator” (the first entity to be paid a depositfor a beverage container sold in Connecticut) for every beverage included inConnecticut’s program to open a bank account to set aside deposits collected.
o Second, Public Act 09-01 states any unredeemed deposits remaining in an initiator’sbank account after the reporting period must be remitted to the Government ofConnecticut.
o Third, Public Act 09-02 expands the coverage of the program to include non-carbonatedbeverage containers such as water, enhanced water, flavoured water, and other relatedproducts.
Connecticut uses a range of collection methods including redemption centres, retailers, andReverse Vending Machines (RVM) that are located at large retail chains. Customers can use anymethod to return containers and receive a deposit refund.
Redemption centres in the state are privately owned and operated. The Department ofEnvironmental Protection does not require redemption centres to adhere to standard corporatedress (e.g. colours, signage, logos, etc.) but the redemption centres are expected to passinspection and ensure clean and honest operations. The Department will conduct a redemptioncentre audit when a complaint is received about its operations.
Dealers such as grocers or other retailers may enter contractual agreements with redemptioncentres to collect/deliver returned containers from dealers.
5.6.2. Program Scope
Connecticut’s program is supported by state funding, but the overall collection, transport, and recyclingoperations are managed directly by industry and is therefore considered a Governmental AdministrativeAgency model. Until recently government involvement in stewardship processes was negligible. Howeverlaws passed in 2008 entitled the state government to escheat, or collect unredeemed deposits fromdeposit initiators.
Connecticut’s program includes any individual, separate, sealed glass, metal or plastic bottle,can, jar or carton containing a beverage. As of 2008, non-carbonated water beverages are alsoaccepted. Thus, any soda, water, mineral water, certain juice, and beer container is accepted fora refund. The program exempts any container greater than 3L, HDPE containers, and containersfor juices, coffee, and iced teas.
Depots will only accept containers outlined in applicable bottle bill legislation. All containers areassigned a $0.05 USD deposit value in Connecticut.

78
Benchmarking Evaluation of Alberta’s Stewardship Program forRecycling Empty Beverage Containers
5.6.3. Program Structure
Connecticut does not have an independent entity to administer the stewardship program. The program isoperated by brandowners, referred to as deposit initiators. The process is described as follows:
Distributors deliver beverage products to retailers and charge a $0.05 USD deposit per containeras part of the invoice.
Retailer mark up the product selling price to include the deposit amount. Customers are chargedthe deposit at time of purchase thereby refunding the retailer.
Customers return eligible used containers to a redemption centre or retail location for a depositrefund.
Redemption centres/retailers return collected containers to product distributors. Distributorsreimburse redemption centres/retailers the deposits reimbursed to customers at the time ofcontainer returns.
The State is allowed by law to escheat. An amendment to the bottle bill recently introduceddirects distributors to remit any unredeemed deposits collected from retailers to the Governmentof Connecticut. These deposits are placed in the General Revenue Fund.
5.6.4. Program Comparison
Connecticut’s program is similar to Alberta’s program in design except for the provision for the Stategovernment to escheat unredeemed deposits. Alberta is significantly larger than Connecticut but hasapproximately the same population, significantly changing the program operational logistics anddynamics. Certain aspects of Connecticut’s program are directly comparable to Alberta’s program, suchas the similar structure and operations of redemption depots. The Connecticut program scope is muchnarrower than Alberta’s and their deposit levels are lower.
Distributor Retailer
RedemptionCenter/Retailer Customer
CONN Government
Beverage Container Lifecycle
Dollar Lifecycle
Unredeemed deposits
Recycler
Other Uses

79
Benchmarking Evaluation of Alberta’s Stewardship Program forRecycling Empty Beverage Containers
5.7. MICHIGAN
5.7.1. Legislation
Michigan’s Beverage Container Act, enacted on November 2, 1976 governs the bottle deposit program inthat state. The legislation was introduced to reduce roadside litter on public highways, clean up theenvironment, and conserve energy and natural resources. The program has enjoyed an overallredemption rate of well over 95% since inception.
Similar to other programs, brandowners in Michigan are assigned responsibility to undertakestewardship activities.
Beer and soft drink distributors have contracted their collection duties to the Used BeverageContainer Recovery (UBCR), a joint venture company between Tomra, an RVM company andSchupan Recycling, a recycling company.
5.7.2. Program Scope
Michigan’s stewardship program is organized as a Producer Responsibility Organization model that isfully funded by distributors and retailers. Distributors are required to compensate retailers for bottledeposit refunds they’ve paid to customers upon container returns. Distributor program costs areapproximately $0.02-0.03 per container. Retailers are responsible to acquire RVMs and finance theirpurchase, at $15,000 to $20,000 each RVMs represent a significant cost of the program. RVMs reducemanual sorting and counting labour.
Deposit eligible containers include any bottle for carbonated beverages (soft drinks, energydrinks, certain flavoured waters, beer, wine coolers, etc.) and exclude any dairy or non-carbonated beverages (bottled water, certain fruit juices, etc.).
All containers included in the stewardship program have a $0.10 USD deposit. Dairy containers are excluded from the deposit program, while they can be returned to retail
locations on a voluntary basis.
5.7.3. Program Structure
Michigan’s program is delegated to brandowners by legislation with no direct input from the stategovernment and program funding is also the responsibility of brandowners. Collection and transportationof used containers is outsourced to UBCR. UBCR serves more than 90% of distributors in Michigan andoffers accounting and reporting services for distributors. The process flow below depicts the beveragecontainer lifecycle and the dollar lifecycle in Michigan.

80
Benchmarking Evaluation of Alberta’s Stewardship Program forRecycling Empty Beverage Containers
Distributors initiate the flow of containers by delivering beverage product to retailers. Uponreceiving the product, retailers remit to the distributor a $0.10 USD deposit for each container.
Deposits are added to the retail price of containers and retailers recover their deposit whencustomers purchase a beverage.
Consumers return eligible empty container to retail locations, usually via RVMs. Retailers refunddeposits to consumers in exchange for the RVM receipt.
Not all retail locations are eligible for UBCR’s services. UBCR will only collect containers fromstores that meet the following requirements: 1) the retail location must be equipped with a RVM,2) the retail location must collect at least 750,000 bottles per year, and 3) the retail location mustbe within certain geographical boundaries. The pick-up programs are offered at no additionalcharge retailers saving warehouse space as well as hours of manual labour are reduced.
Retailers are refunded deposits paid to consumers by distributors when UBCR collects containersfrom eligible retail locations. Empty containers are transported to designated recycling areas forprocessing.
Collected containers are returned to distributors that have the choice to sell unprocessedrecyclable materials to Schupan Recycling, or undertake processing and recycling dutiesindependently. Revenues earned from the sale of processed containers are retained bydistributors.
5.7.4. Program Comparison
With the exception of legislated escheatment, Michigan’s program is similar to Alberta’s program indesign. Michigan is approximately half the size of Alberta’s with three times the population. Michigan’sprogram scope is much narrower than Alberta’s, focusing on beer and non-beer aluminum, plastic andglass. Aside from the narrower scope, the major differences are that return to retail approach to depots isdeployed, and the majority of depots operate with RVMs. Michigan’s recovery is reported at 96.9%. OnlyGermany with a return rate of over 100% for some container categories matches this result, with best ofall other jurisdictions achieving recoveries in the high 80 percent range. Michigan is bordered by Indiana,Ohio and Ontario, and relatively close to Wisconsin and Illinois – all non deposit jurisdictions. Thereappear to be containers from other jurisdictions being redeemed in Michigan but this factor alone likelywould not account for Michigan recoveries being so much higher than any other jurisdiction. Given this,Michigan may be considered an anomaly and an outlier.
5.8. NEW YORK
Officials with New York declined to participate.
Distributor
Retailer
Consumer
UBCR
RecycleMarkets
Distributor’s Processor
Other Uses
Beverage Container Lifecycle
Dollar Lifecycle

81
Benchmarking Evaluation of Alberta’s Stewardship Program forRecycling Empty Beverage Containers
5.9. DENMARK
5.9.1. Legislation
The Danish stewardship program is governed by the Statutory Order on Packaging for Beer and SoftDrinks #124 and a subsequent amendment by Statutory Order #540 introduced in 1989 and 1991respectively. The Ministry of the Environment has made several changes to the stewardship program withmost recent program scope expansion in 2002 to include metal cans.
Under Danish law, all beverages in one-way packaging must be marked with a deposit label thatserve to identify material type, relevant deposit level, and help prevent fraud by electronicscanning in the RVM.
The Danish Environmental Protection Agency has granted Dansk Retursystem A/S the exclusiveright to operate the Danish deposit and return system. Daily tasks and functions are regulatedunder the terms set in relevant Statutory Orders. Tasks include, nationwide recycling, settlingdeposits, paying handling fees, and developing technical and logistical solutions for programefficiency.
Dansk Retursystem A/S does not have any formal powers, and may only identify mistakes andomissions. On occasions where disputes with stores, importers or producers are unresolved, theycan forward cases to the Danish Environmental Protection Agency for adjudication.
Unredeemed deposits are used by Dansk Retursystem to pay for the processing and recycling ofproducts excluded in the country’s deposit program. Remaining unredeemed deposits fundimprovements to customer service, environmental community projects and educational initiatives.
5.9.2. Program Scope
Denmark has pioneered the handling of one-way packaging by unifying container collection processesand deposit refund processes. These are exclusively managed by Dansk Retursystem under a DelegatedAdministrative Organization Model.
Dansk Retursystem accepts a wide range of container materials: aluminum, bi-metal, one-wayand refillable PET, HDPE, glass, and polycoat. Refillable glass and plastic containers areclassified based on their size, with each size having a different deposit value. One-way containersare separated into three different categories: Type A, Type B, and Type C. The types are basedon the material of the container and the size.
Deposit rates vary according to the container’s material and volume with a range from 1.00 DKKto a maximum of 3.00 DKK ($0.19 to $0.57 CDN).
5.9.3. Program Structure
Denmark incorporates compaction and sorting technology at many stages in the recycling program’soperations. Consumers are educated to return containers in their original form to ensue barcodes arelegible and identifiable by collection machines.
By the end of 2008, Dansk Retursystem had installed 1,450 compactors in the country’s largestgrocery stores. These compactors flatten cans at a ratio of 1:6 and plastic bottles at a 1:3, whichincreases the capacity of transport vehicles and reduces the environmental impact of containertransportation.
Anker Andersen collection technology, currently being investigated by Alberta, used in Denmarkfeatures infrared technology which electronically scans special bar codes on labels to facilitatematerial sorting and enhance count accuracy.

82
Benchmarking Evaluation of Alberta’s Stewardship Program forRecycling Empty Beverage Containers
The diagram below depicts the beverage container lifecycle and the dollar lifecycle in Denmark’sstewardship program:
Beverage importers/producers initiate the process by collecting deposits upon delivery ofbeverage products to retailers.
Importer/Producers remit collected deposits to Dansk Retursystem. Retailers add the deposit amount to the selling price of the product and recover deposits paid to
the importer/producer when customers purchase a deposit eligible beverage. Customers collect their deposit refund when containers are returned to a retail location. Dansk Retursystem collects empty containers from retail locations and reimburses deposits paid
by retailers to customers. Dansk Retursystem transports containers to their processing facilities and sells processed
containers to end markets.
5.9.4. Program Comparison
The Denmark program is actually quite similar to Alberta’s program in design and structure. Thelegislation is difference, but the European regulatory environment is significantly different thuscomparison is difficult. The same difficulty applies to the financial model, although the program is fundedmuch like Alberta though unredeemed deposits and consumer fees. The structure of brandowner fees isunknown. Denmark’s program scope is narrower than Alberta’s and focuses on beer and non-beeraluminum, plastic and glass; and tend to have more refillable containers. The major structural differenceis that Denmark, like most European countries, deploys a return to retail model enhanced by thedeployment of high speed sorting and compaction technology. Incineration of recycled materials forenergy is viewed as an acceptable re-use, and the market for certain materials for incineration is quitestrong.
Importer/Producer
Retailer
Consumer
Dansk Retursystem
RecycleMarket
OtherUses
Beverage Container Lifecycle
Dollar Lifecycle

83
Benchmarking Evaluation of Alberta’s Stewardship Program forRecycling Empty Beverage Containers
5.10. GERMANY
5.10.1. Legislation
The Ordinance on the Avoidance of Packaging Waste, the “Dosenpfand-Regelung” legislation governsthe bottle deposit program in Germany. It was enacted in 1993, but deposits on beverage containers wereadded to the law in 2003. The legislation sets targets for recovery rates of recyclable and refillablecontainers, and places the responsibility on beverage manufacturers to collect and process the containersthey sell.
While one-way containers have a mandatory deposit imposed on them by the PackagingOrdinance, refillable containers have a voluntary deposit on them through the manufacturer. Thepurpose of the deposits on refillable containers is to encourage consumers to return thesecontainers along with recyclable containers.
5.10.2. Program Scope
In 2003, legislation was implemented to include deposits on the beverage containers sold in Germany.Cans, glass and plastic bottles were all imposed a deposit of 0.25 EUR, with a few exceptions. First,Refillable glass bottles up to and including 500ml have a deposit of 0.08 EUR, and refillable PET andglass bottles over 500ml have a deposit of 0.15 EUR.
5.10.3. Program Structure
Germany’s program differs from Scandinavian nations in that no single enterprise has the exclusive rightto collect and recycle used beverage containers. Brandowners have the option of delegating theircollection and deposit refunding responsibilities to nine third party stewardship organizations. Theseentities manage all deposit accounts and collection duties for beverage retailers/producers.
Duales System Deutschland GmBH is the most popular third party stewardship organization inGermany. They are registered with the Deutsche Pfandsystem GmBH (DPG), an organizationfinanced by member organization fees such as retail stores, collection centres and manufacturersof RVM’s. DPG’s purpose is to provide the legal and organizational framework for managing theflow of deposits through the German system.
Duales System operates the Green Dot (Der Grune Punkt) initiative. Beverage producers pay tolabel their products with a green dot to indicate their inclusion in the collection and recyclingactivities managed by Duals System.
Germany’s stewardship program is based on an extended producer responsibility model; also known as aProduct Stewardship Germany’s program is an internal cost recovery system. The costs of collecting andprocessing the used containers are built into the price of the product. The following diagram depicts theGerman beverage container lifecycle and the dollar lifecycle.

84
Benchmarking Evaluation of Alberta’s Stewardship Program forRecycling Empty Beverage Containers
5.10.4. Program Comparison
The German program is similar to Alberta’s program in design, but differs in structure given there aremultiple brandowner recyclers operating within the system. Again, legislation is different, but theEuropean regulatory environment is significantly different thus comparison is difficult. The same difficultyapplies to the financial model, although the program is funded much like Alberta though unredeemeddeposits and consumer fees. The actual structure of consumer and brandowner fees is unknown.Germany’s program scope is narrower than Alberta’s and focuses on beer and non-beer aluminum,plastic and glass; and tends to have more refillable containers.
The major structural difference is that Germany, like most European countries, deploys a return to retailmodel enhanced by the deployment of widely deployed high speed sorting and compaction technology.Germany’s major issue is that it borders on countries without deposit programs, thus a significant volumeof containers from these bordering jurisdictions are brought into the German program, inflating recoveriesover 100% and presenting a financial risk to the program. Incineration of recycled materials for energy isviewed as an acceptable re-use, and the market for certain materials for incineration is quite strong.
DPG
ConsumerCollection Centers
Supermarkets/ReverseVending
Machines
Retailers/Fillers
Garbage Litter
Landfill
BeverageContainerLifecycle
DollarLifecycle
Deposit Account ManagementService Provider
Claim ManagementService Provider

85
Benchmarking Evaluation of Alberta’s Stewardship Program forRecycling Empty Beverage Containers
5.11. NORWAY
5.11.1. Legislation
Originally enacted in 1974, The Product Control Act was designed to limit pollution and waste byencouraging the use of refillable containers. The act placed an excise tax (“product charge”) on allpackaging, including non-refillable beverage containers. In 1993 new regulations were adopted whereproducers could benefit from lower product charges if they produced higher rates of return in theirmaterials. The charges on materials would decrease as the return rates increased, and the charge wouldbe dropped altogether if the return rate reached 95% or greater. Thus, if return rates reached 92%, therewould be a 92% decrease in the product charge. In 1994 the act was again revised to include anadditional charge on non-refillable beverage containers which was not dependent on return rates.
All manufacturers and importers of non-refillable cans and bottles have the option of enrollingtheir products with Norsk Resirk. Norsk Resirk is a non-profit system founded in 1999 and co-owned by industry and trade organizations that collects and recycles non-refillable plasticcontainers in Norway. Those that enrol with Norsk Resirk benefit from a reduced product chargedue to Norsk Resirks’ consistently high rates of return. The official rules are stated as follows:
o If the return and recycling rate of the used beverage containers is below 25%, theproducer or importer will receive no reduction in the environmental fee.
o If the return and recycling rate is above 95%, the environmental fee is reduced to zero.o If the return and recycling rate is between 25% and 95%, the environmental fee is
reduced linearly.
5.11.2. Program Scope
Norway’s deposit program accepts all non-alcoholic and alcoholic one-way beverage containers, as wellas refillable containers. The beverages that are included are: beer, carbonated beverages, wine liquor,and non-carbonated beverages. Vegetable juice containers and water bottles are excluded from Norway’sdeposit program.
Containers are assigned a refundable deposit based on their volumetric size. Containers withvolume less then 500ml have a deposit value of 0.94 NOK, while containers over 500ml have avalue of 2.35 NOK.
Refillable glass containers are included in the deposit legislation but are not part of Norsk Resirk’sscope of operations. Glass containers are managed by Rentpack. Rentpack owns a range ofstandard refillable packaging which they rent to brewers and beverage producers. Collection andrecycling activities for these containers is the responsibility of Rentpack.

86
Benchmarking Evaluation of Alberta’s Stewardship Program forRecycling Empty Beverage Containers
5.11.3. Program Structure
The most prominent characteristic of Norway’s program is the product charge which is placed on non-refillable containers that decreases in proportion to increases in the material’s return rates; a higher rateof return results in a lower product charge for that particular material.
A levy of 1 NOK on recyclable containers (as opposed to refillable containers) has been at issue. The levywas deemed discriminatory and in breach of the European Area Agreement by the European SurveillanceAuthority in 2008. Industry claims the levy distorts the competitive landscape for producers who utilizerecyclable packaging. Norway’s claim that the levy is an environment tax is currently under review by theEuropean Free Trade Association (EFTA) court.
Norsk Resirk’s revenues derive from an administrative fee placed on each beverage containermanufacturers and importers sell, deposit surpluses (unredeemed deposits) and sales ofcollected packaging materials.
Products that are included in the deposit system display Norsk Resirk’s distinctive deposit symbolon their labels. The symbol assures the consumer that their deposit will be refunded upon returnof the empty packaging, and allows the container to be identified by Norsk Resirk staff or byRVMs.
Norsk Resirk is Norway’s most utilized stewardship organization. Producers enrol products with theorganization and benefit from Norsk’s ability to drive high return rates therefore lowering recycling levypayments. A diagram depicting the beverage container lifecycle and dollar lifecycle for Norsk Resirkfollows:
Norsk Resirk
Consumers
Collection Centers
Retailers
Garbage Litter
Landfill
BeverageContainerLifecycle
DollarLifecycle
Manufacturers / Importers

87
Benchmarking Evaluation of Alberta’s Stewardship Program forRecycling Empty Beverage Containers
Attributes of the Norwegian program include: All producers and beverage importers are eligible to register their products for inclusion in the
Norsk Resirk deposit scheme. Norsk Resirk imposes an administrative fee on each container theproducer/importer sells as part of the deposit program.
The flow begins when those organizations distribute their containers to the retailers.Producers/Importers charge retailers the deposit-refund upon delivery.
The retailer includes the deposit amount in the selling price of the product. Retailers arereimbursed deposit-refunds they paid to the producer when consumers purchase a beverage.
Consumers receive a refund on used containers when returning them to a retail location via RVM. Norsk Resirk reimburses retailers for deposits they’ve refunded to customers. Returned containers are collected and transported by the beverage wholesalers when delivering
new beverage containers to the retailers. Empty containers are returned to Norsk Resirk facilitiesor regional partners where they are counted, processed and prepared for recycling.
Processed material is transported to recyclers for conversion into new products.
5.11.4. Program Comparison
The Norwegian program is similar to Alberta’s program in design and structure. The legislation is different,but the European regulatory environment is significantly different thus comparison is difficult. The samedifficulty applies to the financial model, although the program is funded much like Alberta thoughunredeemed deposits, consumer fees and brandowner fees. Brandowner fees are based on an inversesliding scale based on recoveries, where fees start to reduce as a percentage when recoveries reach25% and reduce to nil when recoveries reach 95%.
Like all European programs, the scope is narrower than Alberta’s and focuses on beer and non-beeraluminum, plastic and glass; and tend to have more refillable containers. Again like most Europeancountries, Norway deploys a return to retail model enhanced by the deployment of high speed sorting andcompaction technology. Incineration of recycled materials for energy is viewed as an acceptable re-use,and the market for certain materials for incineration is quite strong.
88
Benchmarking Evaluation of Alberta’s Stewardship Program forRecycling Empty Beverage Containers
5.12. SWEDEN
5.12.1. Legislation
Sweden’s stewardship program is governed by the SFS 1993 1154 legislation. It was implemented in1994 and established an extended producer responsibility model for the country’s program. Beverageproducers and distributors were assigned responsibility to recycle glass and cardboard beveragepackaging.
The Swedish Parliament imposed the requirement to achieve mandatory recycling rates onmaterials on brandowners, with the rates were set as follows:
o 70% recycling rate for glass containers;o 65% recycling rate for metal containers; ando 30% recycling rate for plastic containers.
Established targets were achieved by 1996 and recovery rates have increased since. Today the recoveryrate for glass and metal containers is greater than 90%.
5.12.2. Program Scope
Sweden operates on an extended producer responsibility model. Legislation requires that brandownerscollect and recycle any container sold in the Swedish marketplace. Brandowners establish all depositrates and manage all collection and processing activities through an organization they have created andimplemented, Returpak.
Producers only set a refundable deposit on metal and plastic containers, which customers canreturn to RVM’s operated by Returpak or by specific retailers. Retailers that employ RVMs arepaid a handling fee by Returpak for every container they collect.
The refundable deposit rates are as follows:o Metal (any size) = 1 SEK
o PET (>500ml) = 1 SEKo PET (=<) 500ml) = 2 SEK
Other packaging materials (such as glass and paper) are not eligible for deposit-refunds.However the government requires that producers collect and recycle these containers as well.Therefore, producers/importers have assigned these containers a “recycling fee”, a non-refundable fee added to the purchase price of the container. Consumers are required by law toreturn these containers for recycling, but there is no enforcement of this policy.
Unredeemed deposits are kept by producers/importers and fund their program operations. Dairy and juice containers are excluded from the program due to hygienic concerns. They are not
issued a deposit and cannot be returned to collection sites. The Swedish program does not require returned containers to be sorted as most refillable bottles
in the market have a similar shape and size. This standardization initiative was led by theSwedish brewers and bottlers, and is similar to some of the refillable beer bottles used in Alberta.
5.12.3. Program Structure
Not enough information is available at this time.
5.12.4. Program Comparison
The Swedish program has a much narrower scope than Alberta’s program. The structure appearscomparable, but minimal information is available to validate this. Sweden appears to deploy a return toretail model supported with high speed sorting and compaction technology, similar to most otherEuropean programs. One unique feature with the Swedish program is that the deposit system ispredicated on the bar code and not the container. If the bar code is damaged, consumers are reimbursed

89
Benchmarking Evaluation of Alberta’s Stewardship Program forRecycling Empty Beverage Containers
the salvage value of their returned container rather than the full deposit. This is in stark contrast toAlberta’s program where consumers are paid a consistent refund regardless of the container’s condition.
5.13. SOUTH AUSTRALIA
5.13.1. Legislation
The Beverage Container Act of 1975 introduced deposit legislation and was integrated with theEnvironment Protection Act in 1993 which prohibited retailers from selling beverage containers withoutapproved refund markings. The law governing container recycling in South Australia is commonly referredto as the Container Deposit Legislation (CDL) and is intended to reduce beverage container litter, achievehigher recovery rates, and educate the community to recycle more actively.
South Australia is the only Australian state with an active bottle deposit program, and the stateaccounts for only 8% of the beverage containers sold in the country. Northern and WesternAustralia are considering implementing similar systems based on the success South Australiahas demonstrated.
5.13.2. Program Scope
South Australia’s program is an extended producer responsibility model where collection and recyclingresponsibilities are managed by two non-profit “Super Collector” entities. The Australian government hasno involvement in the operations of Super Collectors.
South Australia’s stewardship program accepts any container whose material is recyclable andsaleable to other markets. Deposit program materials include aluminum, bi-metal, PET, HDPE,glass, polycoat, and Liquid PaperBoard (LPB). Materials that cannot be recycled, such asaluminum containers with plastic tops are not accepted by the program.
All containers that are included in the stewardship program have a deposit value of $0.10 AUD($0.094 CDN).
Dairy containers are not part of the legislation and are excluded from the deposit program. Dairyproducts sold in HDPE containers can be returned on a voluntary basis. Flavoured milk productssold in LPB containers are part of the program and have a deposit and refund value at collectionyards.
5.13.3. Program Structure
Two active Super Collectors operate in South Australia, Statewide Recycling Ltd and Lion Nathan.Statewide is responsible for the collection, recycling and marketing of all non-beer beverage containers,while Lion Nathan uses its Marine Stores to manage the collection, recycling and reuse of beer containersexclusively. Containers are collected at collection yards that vary in size, equipment and structuredepending on location. For example, collection yards in small towns employ compacting machines andlocal trucks for transportation, while collection yards in large cities (where the volume of containersreturned is much greater) do not use similar technology because of a higher risk of fraud in theseoperations.

90
Benchmarking Evaluation of Alberta’s Stewardship Program forRecycling Empty Beverage Containers
Statewide RecyclingStatewide is the primary entity involved in the lifecycle of non-beer containers and deposits in SouthAustralia’s stewardship program. The government does not have an active role within Statewide’severyday operations. The process flow is described as follows:
Upon entry into the state, manufacturers deliver product to wholesalers and receive a deposit of$0.10 AUD per container. Manufacturers remit deposits to Statewide.
Wholesalers (distributors) add the $0.10 AUD deposit value onto delivered product to retailers.Retailers pay the deposits to wholesalers on the product shipment.
Retailers add deposits to the purchase price of each container. Retailers recover deposit costswhen customers purchase a beverage and pay the deposit.
Customers return used containers to collection yards and receive a full deposit refund. Collection yards sort and process collected materials and return them to Statewide. Statewide
reimburses collection yards for deposits refunded to customers and also pays a handling fee ascompensation. Unredeemed deposits are returned to brandowners.
Statewide sells processed containers to wide variety of end markets, mostly in Europe and theMiddle East. Statewide has a reputation for producing a clean and high quality recycled product.
5.13.4. Program Comparison
South Australia’s and Alberta’s programs are very similar in legislation and operations, with SouthAustralia’s program scope being quite broad. South Australia does not have a regulatory body equivalentto the BCMB that administers the program, and none of their operating budget is devoted to conventionaladvertising.
Wholesalers
Statewide Recycling Retailer
ConsumerCollection Yard (depot)
RecycleMarket
OtherUses
Beverage Container Lifecycle
Dollar Lifecycle

91
Benchmarking Evaluation of Alberta’s Stewardship Program forRecycling Empty Beverage Containers
6. APPENDICES
6.1. PHASE 1 – INTERIM REPORT

92
BENCHMARKING EVALUATION OF ALBERTA’SSTEWARDSHIP PROGRAM FOR RECYCLING EMPTY
BEVERAGE CONTAINERS
PHASE 1 REPORT: FINAL SELECTION AND
RATIONALE
Prepared For: John Bachinski, Managing DirectorBeverage Container Management Board1010, 10707 – 100 AvenueEdmonton, AB T5J 3M1
Prepared by: Meyers Norris Penny LLP
Suite 400, 10104 – 103 AvenueEdmonton, AB T5J 0H8
MNP Contact: Rod SimpsonPartner, Management ConsultingPhone: 780-429-5874Fax: 780-454-1908Email: [email protected]
Date: December 14, 2009

93
Benchmarking Evaluation of Alberta’s Stewardship Program for Recycling of Empty BeverageContainers
TABLE OF CONTENTS
1. Phase 1 Deliverable: preliminary Jurisdictional Selection……………………………………79
1.1 Division of Selected Jurisdictions into Two Tiers……………………………………………791.2 Tier 1 Selection…………………………………………………………………………………801.3 Tier 2 Selection………………………………………………………….……………………...821.4 Jurisdictions Eliminated from Comparison…………………………………………………...83
2. Leading Practice Research…………………………………………………………….……………86

94
Benchmarking Evaluation of Alberta’s Stewardship Program for Recycling of Empty BeverageContainers
1. PHASE 1 DELIVERABLE: PRELIMINARY JURISDICTIONAL SELECTION
MNP has undertaken research examining current beverage container deposit legislation and returnsystems in jurisdictions across Canada, the United States and Europe. A preliminary evaluation hasrevealed a number of potential comparator jurisdictions that can be effectively benchmarked againstAlberta’s approach and system for container recycling. The selection was based on the jurisdictions: 1)comparability to the Alberta model in the areas of governance structure, the types of containers collectedand the source of program funds, and 2) the overall strength of the collection program including thedemonstration of leading practices.
1.1 DIVISION OF SELECTED JURISDICTIONS INTO TWO TIERS
The beverage container recycling programs chosen for comparison have been organized into two tiers.The first encompasses eight programs or jurisdictions that are essential to effective benchmarking.Research to date has revealed that these programs, spanning Canada, the US, Europe and Australia,lead the field in terms of their organizational structure, overall effectiveness, or their unique practices.
BC Saskatchewan Oregon California Norway Denmark Germany South Australia
There is a second tier of programs that can add value to the benchmarking despite duplicating some ofthe systems examined in Tier 1 or possessing key characteristics that may limit direct comparisons toAlberta’s approach. These jurisdictions are particularly well-suited to an investigation of leading practices,and further research can enhance the benchmarking analysis. The following four programs were chosento be studied in greater depth and compared against Alberta:
New Brunswick Michigan New York Sweden
The following sections summarize the logic for the selection of the eight Tier 1 and four Tier 2 jurisdictionsthat will be examined and compared to Alberta’s system.

95
Benchmarking Evaluation of Alberta’s Stewardship Program for Recycling of Empty BeverageContainers
1.2 TIER 1 SELECTION
The following jurisdictions were selected for comparison in Tier 1:
BC Saskatchewan Oregon California Norway Denmark Germany South Australia
The container return programs in BC and Saskatchewan are administered by non-profit organizationswith delegated authority from the provincial government, consistent with the BCMB’s status as adelegated administrative organization. Like the BCMB, the core competency of these organizations isarranging the collection and recycling of used beverage containers. However, BC has an electronicsrecycling program as well. Encorp Pacific in BC is run by a board that consists of representatives of thebeverage and retail grocery industries and appears to be owned by various industry participants,providing an interesting contrast to Alberta’s government-delegated system. Containers are only acceptedat licensed depots in BC and Alberta, and not at retail locations. Encorp charges a handling fee, similar tothe container recycling fee in Alberta.
Saskatchewan’s program is overseen by the Saskatchewan Association of Rehabilitation Centres andbalances social, environmental and economic goals. Although the social aspect of the organization’smission is not shared by the BCMB, most aspects of the two programs are structured quite similarly. Forinstance, Saskatchewan operates on a licensed depot model and collects an Environmental HandlingCharge. Saskatchewan and BC are two of a very select number of jurisdictions that accept returned dairycontainers in a voluntary, non-deposit program, a key parallel to Alberta although its program doesinclude a deposit. Saskatchewan and BC are considered to be some of Alberta’s closest comparatorsstemming from similarities in governance structures, consistent product mixes, and close geographicproximity. Despite some slight differences, namely the social purpose of SARCAN and the industryorientation of the board at Encorp Pacific, most aspects of these programs are consistent with Alberta.
California is also considered to be a strong comparator, although there are some important distinctionsfrom Alberta’s program. First of all, California exempts refillable containers from the return systemaltogether. It includes grant funding as part of its core activities in contrast with the BCMB, which simplyadministers the return system and associated education and marketing activities. The existence of“Convenience Zones” offers another departure, requiring recycling centres to be located within a half mileradius of supermarkets in urban areas and within three miles in rural areas. The return centres can be assimple as stand-alone kiosks in a grocery store parking lot, contrasting the larger scale depots thatcomprise Alberta’s depot network. Additionally, producers in California do not design and manage thecollection system and only participate moderately in its funding. Consumers are charged a CaliforniaRefund Value (similar to a deposit), while manufacturers are required to pay processing fees to a statefund. Unlike Alberta, the state government oversees the program directly instead of delegatingresponsibilities to an arm’s length intermediary. However, despite the differences, California is judged tobe one of Alberta’s closest comparators among US states. It is unique among the other states and similarto Alberta in that containers are not returned to retailers, but are collected by a network of independentbottle depots throughout the state. It also typically refunds the full deposit paid on a particular container toconsumers instead of subscribing to the half-back model present elsewhere.
In Oregon, the non-profit Oregon Liquor Commission has been delegated the authority to organize thecollection and recycling of used beverage containers, mirroring Alberta’s system. The state is similar inthat it includes both beer and non-beer containers in the return stream, but differs from the BCMB’shistoric model in that this collection doesn’t appear to be segregated. The program is fundedindependently, and the Government of Oregon does not receive any income, taxes or fees for services

96
Benchmarking Evaluation of Alberta’s Stewardship Program for Recycling of Empty BeverageContainers
associated with container recycling. Overall, despite the absence of detailed program information,Oregon’s system appears to be a solid comparator to Alberta.
Norway emerged as a logical European comparator as a result of governance similarities and thedisclosure of useful benchmarking information. There is significant industry involvement in Norsk Resirk,the organization charged with collecting and recycling used beverage containers. The fact that industryparticipants are active partners in beverage container recycling is consistent with Alberta’s model. Theavailability of extensive financial and production data also facilitates a detailed comparison to the BCMB.Norsk Resirk is a non-profit system, but is co-owned by organizations in trade and industry as opposed tobeing a delegated administrative organization. Norway charges beverage manufacturers anenvironmental fee (excise tax) for their containers and the program allows for a corresponding decreasein this fee proportional to the increase in return rate. A similar framework does not exist in Alberta. Thefunding structure of Norsk Resirk, although it is independent of government contribution, appears to beslightly different as well, consisting of sign-up fees, per-container fees and collection/logistics fees. Likemost European jurisdictions, collection of bottles takes place in shops and supermarkets and ofteninvolves the use of reverse vending machines. The network of licensed depots present in Alberta doesnot exist in Norway. Interestingly, Norway is the only jurisdiction to mention the incineration of beveragecontainers in the absence of a more preferable method, a practice of interest to the BCMB. Despite thedifferences, the Norwegian model makes for a valuable comparison owing to the non-profit model, theavailability of information, and the overall strength of the program.
The value of examining Denmark in depth comes not from its similarities to Alberta, but from itsremarkable distinctions. It is the only European jurisdiction observed that has elected to internalize thecost of waste container management with no established system of producer responsibility. Metalcontainers were effectively banned until this practice was judged to be in contravention of EU law and asupporting deposit system was established. In spite of these structural differences, certain similarities linkthe two systems. Denmark and Alberta both require all ready-to-serve beverage containers sold in thejurisdiction be registered with a common collection system, the Dansk Retursystem in Denmark and theABCRC or ABCC in Alberta. The board of Dansk Retursystem is composed of owner representatives,members of the grocery trade and branch organizations. The board’s duty is to ensure that the companymaintains its overheads at a competitive level in order to offer all parties an efficient and cost-effectivedeposit and return system, closely resembling the mandate of the BCMB. Dansk Retursystem, like theBCMB, has been given the exclusive right to operate the deposit and return system by governmentlegislation.
Germany, like Alberta, has adopted an extended producer responsibility model, but has taken thisprocess a step further by encouraging design changes to beverage containers that proactively minimizethe impact on human health and the environment. The system is an internal cost recovery system as inAlberta. While German law obligates producers to take back packaging sold within the country, producersare given the opportunity to contract this function to third-party product stewardship organizations. A keydifference from Alberta is that several stewardship organizations compete to offer collection and recyclingservices for beverage containers. Container take back is organized by shopkeepers and via reversevending machines, not through licensed depots. Non-licensed packaging is also permitted in Germany(usually from small-scale producers below threshold production levels) and its collection often pushes thereturn rates beyond 100%. Returns from beverage containers sold out-of-country also contribute to thiselevated return rate. The system is funded by membership fees from stores, collection centres andmanufacturers, a contrast to the funding structure in Alberta consisting of deposits and recycling fees. Inspite of the differences, the similarities around producer responsibility and cost recovery, coupled with theintroduction of competition into the container collection system, create a valuable baseline for comparisonto Alberta.
Unlike the nationally-based programs in Europe, South Australia has a state (provincial) based programthat conforms more closely to the Albertan model. A series of four “super collectors” in South Australiaoperate in a similar fashion to the collection system agents in Alberta, coordinating the collection of emptycontainers from the depots and selling material to recyclers and processors. The program is run by theSouth Australian Environmental Protection Authority, an independent statutory authority that is governed
97
Benchmarking Evaluation of Alberta’s Stewardship Program for Recycling of Empty BeverageContainers
by a Board with members representing business, community, local and state government. This structurebears striking similarities to the governance of the BCMB. There does, however, appear to be more directgovernment involvement in South Australia, as board members are appointed directly by the Governor.South Australia is unique along with Alberta in that it has extended deposits to dairy containers, albeitonly flavoured milk in containers less than 1L. Although a producer responsibility scheme has beenimplemented, the South Australian government contributes administrative funding unlike the BCMB,which receives no government funding whatsoever.
1.3 TIER 2 SELECTIONS
The following jurisdictions were identified as potential comparators in Tier 2. Our objective is to select upto four of the following programs to be studied in greater depth and compared against Alberta:
New Brunswick Michigan New York Sweden
New Brunswick segments the recovery of beer and non-beer containers among two collection agents,Encorp Atlantic and the New Brunswick Liquor Commission. This approach is consistent with Alberta’shistoric model and may be useful for cost comparison purposes although Alberta is presently movingtowards a single collection agent. New Brunswick’s system was the original model in Canada for the half-back deposit approach where refillable containers are subject to a full refund and non-refillable containersonly receive half back. This feature represents a departure from Alberta’s full deposit system. There isalso no arm’s length oversight body like the BCMB in New Brunswick, and instead the two stewardshipagencies act on behalf of distributors to manage the recovery program. The responsibility for registeringredemption centres, undertaken by the BCMB in Alberta, falls directly under the Minister of theEnvironment. The two programs are consistent in their use of licensed redemption centres to collectbeverage containers. Key differences, including the use of the half-back deposit approach and the lack ofan arm’s length oversight body, make for an interesting comparison to Alberta. New Brunswick wasselected over other Maritime jurisdictions on account of the program’s larger scale and overall success.
New York and Michigan run very large scale operations that encompass the collection of both beer andnon-alcoholic containers. Michigan’s deposit level of $0.10 per container is the highest in the US, a factorthat has also led to the highest return rate among all of the bottle bill states. Michigan differs in that mostcontainers are labelled with a barcode that allows for collection by reverse vending machines, departingfrom the depot model in Alberta. In essence, retailers and distributors assume a similar role to Alberta’slicensed depots in container collection. 25% of Michigan’s unredeemed deposits are returned to retailersto fund their participation in beverage recycling while the remaining deposits are allocated to stateenvironmental programs. New York’s program appears to be in its infancy compared to other, morerobust collection regimes. It is, however, valuable to examine based on the sheer scale of containersprocessed. Its funding structure differs from Alberta, with 20% going to distributors while the remainderbecomes a part of the state General Fund. It is believed that New York’s program involves less state-widecoordination compared with other jurisdictions. A comparison to Alberta is valuable due to the large scalecollection and differences in funding structure.
Sweden has two collection agents with exclusive mandates to serve the beverage container market. Theorganizations are segmented according to material (glass versus non-glass) and not according to theiralcoholic content, as was historically the case in Alberta. The strength of Sweden’s comparison lies in thewide scope of its producer responsibility model and strong return rate results. In Alberta, industry isrequired to fund a system for the collection and recycling of used beverage containers through depositsand recycling fees. In Sweden, this responsibility is extended to include additional producer requirements,such as informing households regarding the collection and removal of used packaging and designingpackaging so that it can be recovered and waste is minimized. One notable way that brewers and bottlershave adapted to this model is by standardizing the size and shape of refillable containers so they do notneed to be sorted by brand. While Alberta’s government has established a guideline of 85% recovery for

98
Benchmarking Evaluation of Alberta’s Stewardship Program for Recycling of Empty BeverageContainers
all containers, Sweden’s targets are written into law, with a 70% target mandated for glass containers.The system has resulted in significant success, with some of the highest recycling rates in the world. Thisis especially true with aluminum cans where the return rate approaches 91%.
1.4 JURISDICTIONS ELIMINATED FROM COMPARISON
Several additional Canadian jurisdictions were researched as potential benchmarks, but eliminated fromcomparison due to structural and scale differences from Alberta’s system as well as duplication with otherselected jurisdictions:
Manitoba Ontario Québec Nova Scotia Prince Edward Island Newfoundland Yukon Northwest Territories
Manitoba’s model has seen the stewardship of many waste materials, including beverage containers,combined under the Manitoba Product Stewardship Corporation. The province’s unique approach offersbeverage producers the choice between establishing a container recycling program and paying a uniformlevy on containers. The majority of beverage producers have chosen the latter option, with the exceptionof beer producers. Therefore, only beer containers are included in Manitoba’s product stewardship plan,representing a fraction of the containers handled by Alberta’s system. Unredeemed deposits are alsoretained by the beer distributor and bottler instead of directly funding the recycling system. The systemhas resulted in an overall return rate of only 31%, well below its peer jurisdictions. The significantdifferences from Alberta’ program and the extensive role of blue box collection in particular diminishManitoba’s comparability to Alberta.
Ontario is the only province without a strong producer responsibility model. Similar to Manitoba, theprovince relies on a municipally-funded blue box collection program for most beverage containers while adeposit-based recycling system is only in place for beer containers. Unredeemed deposits are returned tothe beer distributors and bottlers instead of funding the recycling program.
Québec also employs a model that differs from Alberta in several important respects, limiting its potentialfor comparison. The province entrusts the stewardship of beverage containers to a Crown Corporation,Recyc-Québec, in lieu of a delegated administrative organization. It is one of the few Canadianjurisdictions to allow the return of beverage containers to retail locations. In fact, soft drink distributors areresponsible for picking up empty containers from retail stores in their area. Similar to Alberta, Recyc-Québec retains unredeemed deposits to manage the system, although bottlers are able to keep scraprevenues. Industry is also required to fund blue box pick up for those containers not included in anexisting deposit/return scheme.
The programs in Prince Edward Island, Newfoundland, the Northwest Territories and the Yukon havemore direct government involvement, administered and funded by a provincial department or crownorganization. These programs also have a reduced scale compared to Alberta, diminishing potential forcomparison.
It appears that PEI only allowed the sale of non-refillable beverage containers for the first time in 2008and established a deposit and return system in conjunction with this change. The PEI program in itsinfancy is not directly comparable to the well-established system in Alberta.
Newfoundland’s Multi-Materials Stewardship Board (MMSB), consisting of 9 members appointed by theMinister of the Department of Environment and Labour, resembles the BCMB in some respects althoughit is a crown agency and is responsible for other waste materials such as tires and hazardous waste.Newfoundland Beverage Recovery Inc., which is contracted by MMSB to run the daily operations of the

99
Benchmarking Evaluation of Alberta’s Stewardship Program for Recycling of Empty BeverageContainers
deposit return system, also bears resemblance to the ABCRC. The independently run Green Depotsthroughout the province are likened to Alberta’s depot network. However, the deposit system is similar tothe half-back models present in other Maritime jurisdictions. Potential duplication with New Brunswickalong with the scale issue removed Newfoundland from consideration.
Nova Scotia does collect beverage containers through a network of independently owned Enviro-Depotsthroughout the province, closely mirroring the depot network in Alberta. The Resource Recovery FundBoard Inc. (RRFB) is a non-profit corporation that oversees the container recycling system and in manyways fulfils the role of the BCMB and its collection agents. Unredeemed deposits are retained by theRRFB to offset recycling costs, as with the BCMB. However, the reduced scale of Nova Scotia’s programas well as the presence of the half-back model represent important distinctions from Alberta. Nova Scotiawas not chosen for comparison in order to eliminate duplication as its program is very similar to NewBrunswick.
The US and International jurisdictions examined but eliminated from potential comparison are as follows:
Connecticut Delaware Hawaii Iowa Maine Massachusetts Vermont Finland
Connecticut, Hawaii, Vermont and Maine collect beverage containers through retailers and reversevending machines in addition to a depot network. The differing collection methods, coupled with therelatively smaller scale of the programs, make a direct comparison to Alberta difficult.Iowa also uses a hybrid collection system consisting of both retailers and redemption centres, althoughretailers can refuse containers if an agreement exists with a licensed redemption centre. In addition to thedifferent collection method, it was felt that Iowa’s program was quite similar to some of the jurisdictionsalready selected for comparison.
Delaware exempts aluminum containers from its bottle bill, which comprise a significant proportion ofAlberta’s recovered containers. The lack of a depot network and limited disclosure of the program’soperations eliminated it from comparison.
In Massachusetts, the program is administered by the state government and containers are collected byretailers and distributors, not by licensed depots. These differences, as well as the lack of detailedprogram information, reduce the value of examining Massachusetts in further detail.
Finland’s distinction stems from its taxation of non-refillable beverage containers. It was feared that thepresence of this tax might skew recovery and cost figures, damaging the integrity of a direct comparisonto Alberta. The fact that aluminum cans make up less than 4% of beverage production in Finland, a starkcontrast to the high volume present in Alberta’s beverage industry, also played a role in its elimination. AsFinland’s system is reasonably similar to Sweden, the latter was selected for comparison instead.

100
Benchmarking Evaluation of Alberta’s Stewardship Program for Recycling of Empty BeverageContainers
2. LEADING PRACTICE RESEARCH
Supplementary to the in-depth benchmarking study of selected jurisdictions, MNP will also undertake apreliminary investigation of leading practices within the industry. The unique approaches to beveragecontainer recycling adopted by certain North American and international jurisdictions provide a wealth ofmaterial for leading practice research. An examination of innovations in container recycling may revealpractices that can be applied towards improvements in Alberta’s system. Specific areas that may bestudied in further detail include the following:
Container handling processes Container deposit fees The use of reverse vending machines Payment schemes for bottle returns Deposit and return systems where no single enterprise has the exclusive right to collect and
recycle used beverage containers Opportunities to standardize the size and shape of refillable containers, allowing for increased
system efficiency The use of material compacting and incineration The use of spare capacity on suppliers’ trucks to transport recyclables

101
Benchmarking Evaluation of Alberta’s Stewardship Program forRecycling Empty Beverage Containers
6.2. DATA QUESTIONNAIRE
Interview Responses
1) Program Overview
Could you please provide a brief overview of the beverage container recycling program in yourjurisdiction speaking to features such as the following?- Structure (deposit, voluntary, other)- Relevant legislation (references to acts, regulations - could you attach the appropriate references?)- Beverages included in the scope of the program (e.g. beer, soda or soft drinks, etc.)- Sources of program funding- Flow of recycled materials through the system (e.g. consumer --> return to retailer --> materialcollectionagent --> material recycler)
What are the options available to consumers that are seeking to return containers (i.e. what approachesare used to collect containers)
Which of the options are most effective?
Are dairy containers included in the scope of the program or planned for inclusion? Describe therationale for the decision and (if relevant) it's timing?
2) Container materials
What types of beverage container materials are included in the recycling program?
- Aluminum (including Bi-Metal)
- PET
- Other plastics (e.g. HDPE)
- Glass
- Polycoat Containers
- Other (please list)
3) Total Container Volumes Handled
What was the total quantity of all beverage containers sold in the jurisdiction in the most recent year forwhich data is available?

102
Benchmarking Evaluation of Alberta’s Stewardship Program forRecycling Empty Beverage Containers
What was the total quantity of all containers recycled in the jurisdiction in the most recent year for whichdata is available?
4) Return RatesWhat were the recycling rates (percentages) for the following containers in the most recent year forwhich data is available?
- Aluminum containers (including Bi Metal containers)
- PET containers
- Other plastic containers (e.g. HDPE)
- Glass containers
- Polycoat containers
- Combined return rate for all containers
How are the above recycling rates calculated (i.e. same period quantity redeemed divided by sameperiod quantity sold)?Is the jurisdiction able to report statistics on return rates by the type of beverage contained? If so, canyou report on return rates for the following beverage containers?
- Beer
- Wine and spirits
- Pop or soft drinks, water
- Dairy
- Other (please list)
5) Deposit RatesIf the jurisdiction has a deposit program, how are the rates structured (e.g. by beverage type, materialtype or both; is container size a factor?)?What level of deposit is placed on each type of container (please list or provide a schedule of containertype and the associated deposit)?
6) Revenue or Sources of CashDuring the past fiscal year, what was the total amount of revenue collected or earned in regard to eachof the following beverage container recycling program features?

103
Benchmarking Evaluation of Alberta’s Stewardship Program forRecycling Empty Beverage Containers
- Total beverage container deposits collected
- Revenue from the sale of recycled materials
- Other container recycling fees (please describe and list the amounts)
- Other revenue (please describe and list the amounts)
7) Total Costs and Refunds or Uses of CashDuring the past fiscal year, what were the total program costs or disbursements in regard to each of thefollowing beverage container recycling program features?
- Administration
- Total deposits refunded
- Processing and transportation
- Advertising and communications
- System development/improvement
- Handling Fees for Collectors
- All other Costs (please describe)During the past fiscal year, what was the average net system cost for recycling a beverage container(i.e. average cost of recycling one container net of all associated revenue such as material sales andunredeemed deposits)?
8) Handling and Disposition
Does the jurisdiction compact or shred containers for transport?How are the collected materials processed and disposed of (please describe and provide thepercentage represented by each)?
- Recycling
- Reuse
- Incineration
- Other (please list)
9) Environmental Performance MeasuresDoes the jurisdiction use formal performance measures other than recycling rates to assess itscontribution to reducing the environmental impact from beverage container manufacture, use and

104
Benchmarking Evaluation of Alberta’s Stewardship Program forRecycling Empty Beverage Containers
recycling?
If so please describe the measures.
10) Leading PracticesPlease describe beverage container recycling or handling practices that are uniquely innovative or"leading" in the industry?

105
Benchmarking Evaluation of Alberta’s Stewardship Program forRecycling Empty Beverage Containers
6.3. INTERVIEW PROTOCOL

Beverage Container Management Board (BCMB)Benchmarking Evaluation ProjectBCMB Consultation Interview Questionnaire
106
PURPOSE OF THIS DOCUMENT
The Beverage Container Management Board (BCMB) has retained MNP to assist with a benchmarking project to evaluatethe effectiveness and efficiency of Alberta’s Stewardship Program for empty beverage containers. The project will analyzeBCMB’s current practices and compare them to similar bottle deposit programs in other jurisdictions, with particular attentionon recovery rates, financial data, and leading practices and innovations.
The two main project themes are:1. Review the strategies and operating procedures of stewardship programs in comparable North American and European
jurisdictions.2. Determine how BCMB can refine their operations by analyzing leading practices of the selected stewardship programs
and develop efficiency improvement solutions.
Phase 2 Benchmarking Research and Evaluation involves a thorough evaluation of data that has been compiled in regardsto specific stewardship programs. Consultation with key members of these programs is critical to developing accuratebenchmarks and setting the foundation for a full analysis of BCMB’s current state.
The purpose of this document is to provide interviewees with the questions that will be discussed in the session so that youmay consider your experiences and thoughts beforehand.
INTRODUCTIONAt the outset of the interview it would be helpful for us to discuss your position and role in your program.
QUESTIONS
1. Please provide a brief overview of how used containers are collected, transported and recycled after they havebeen returned for a deposit in your system. It would be very beneficial to have details about major steps in theprocess and the significant parties involved at those stages.
2. Please describe how container deposits flow to and from distributors, retailers, and customers in your program.
3. What are some unique/tailored practices or innovations you consider fundamental to your program’s success?What practices would you consider to have been significant failures throughout your program’s operating history?
4. The following are a series of questions that centre on leading practices utilized in your program. Further detailsabout these practices would be very useful in our overall analysis.
a) Who bears the responsibility (or has the licensed right) to collect and recycle used beverage containers inyour program? Please provide details about any strategies these parties employ to create operationalefficiencies across different levels in your program. For example, if distributors are responsible for collectingused containers, do they provide pick-up services for retailers or collection centres? Or are aluminium canscrushed prior to transport so that trucks are able to hold more capacity?
b) Does your program employ a standard size/shape container for deposit eligibility? If not, how would youpredict the introduction of a standardized container would affect your operation’s efficiencies, in areas suchas collection costs or return rates?
c) Please describe the top three processes your program utilizes that contribute to advancing the overall healthof the environment? For example, is spare capacity on recycling trucks used to transport other reusablematerials?
5. How does your program market the recyclable materials to interested parties? How significant are the economicbenefits that arise from these sales, and are these benefits shared with any other environmental organizations?In the absence of an alternative purpose for recyclable materials, what is your program’s policy on incineration?
6. How does your recycling program collaborate with other environmental programs for the purposes of increasingenvironmentally-conscious activity in your jurisdiction?

Beverage Container Management Board (BCMB)Benchmarking Evaluation ProjectBCMB Consultation Interview Questionnaire
107
7. When new materials are introduced to be included in your beverage container recycling program, how long isrequired for return rates to achieve targets? For example, if dairy containers were recently added to yourprogram, how long would you expect it to take to achieve an 80% return rate?
8. What kinds of performance measures are utilized to determine the operating efficiency of your recyclingprogram? Are performance reports available to the public?
9. Have any studies been undertaken to measure how activities within your recycling program indirectly affect theoverall health of the environment? For example, do you monitor the CO2 emissions from trucks during thecollection and transport of containers, or the increased use of electricity required for converting reusablematerials?
10. Does your organization use marketing techniques to increase awareness about your program or other beveragecontainer recycling matters? If so, please describe. What communication and marketing approaches have youfound effective? Which were less effective?
11. May we contact you again for supplementary information if required?
108
Benchmarking Evaluation of Alberta’s Stewardship Program forRecycling Empty Beverage Containers
6.4. BIBLIOGRAPHY AND REFERENCES
All Canadian provinces: http://www.ec.gc.ca/epr/default.asp?lang=En&n=CAF18AE3-1 Brewers Association - http://www.brewers.ca/default_e.asp?id=27
Alberta Data Sources: BCMB provided data Financials: Calculated from ABCRC and ABCC Financial Statements Bootle Bill Resource Guide - www.bottlebill.org/legislation/canada/alberta.htm Presentation to Standing Committee on Resources & Environment. September 18, 2007. Alberta
Dairy Council Milk Container Recycling Program.http://www.milkcontainerrecycling.com/AB/_pdfs/PresentationToStandingCommittee.pdf
Alberta Dairy Council Milk Container Recycling Program. www.milkcontainerrecycling.com Anker Anderson: Overview provided by BCMB Demographics:
o http://en.wikipedia.org/wiki/Albertao http://www40.statcan.gc.ca/l01/cst01/econ15-eng.htmo http://www.zurich-base-line.com/cn_gdp_pc_nation_data.htmlo http://www40.statcan.gc.ca/l01/cst01/lfss02c-eng.htmo http://www.servicealberta.ca/pdf/vs/2000population.pdf
Legislation:o Beverage Container Management Board Three Year Business Plan 2010 - 2012.
p. 3-5 Operations:
o http://www.abcrc.com/cfm/index.cfm?It=907&Id=7o http://www.bcmb.ab.ca/what-happens-to-containers.htmlo Beverage Container Management Board Three Year Business Plan 2010 - 2012.
p. 20. Statistics/Financials:
o Spreadsheet provided by SARCAN Comparison of Provincial RecyclingPrograms - July 2009.xls) – compiled for the Canadian Recycling Affiliates
o Spreadsheet provided by BCMB (Return Data Rollup June 2009 MonthlyTotals.xls)
o ABCRC 2008 Annual Report, BCMB 2010-2012 Business Plan, Spreadsheetprovided by BCMB (Comparison of Provincial Recycling Programs - July2009.xls)
o ABCRC Annual Report 2008, ABCC Financial Statements March 31 2009 –March 31 2011
BC Data Sources: Data Questionnaire provided by: Elena Zevakhina, Encorp Pacific. Interview with: Elena Zevakhina, Encorp Pacific. Interview with: Greg D’Avignon, BDL Board Member, BCMB Board Member Recycling Council of BC Demographics:
o http://en.wikipedia.org/wiki/British_Columbiao http://www.bcstats.gov.bc.ca/data/bcfacts.asp,o http://www.bcstats.gov.bc.ca/DATA/bus_stat/bcea/tab1.aspo http://www.zurich-base-line.com/cn_gdp_pc_nation_data.htmlo http://www40.statcan.gc.ca/l01/cst01/lfss02a-eng.htm
Legislation:

109
Benchmarking Evaluation of Alberta’s Stewardship Program forRecycling Empty Beverage Containers
o http://www.bottlebill.org/legislation/canada/britishcolumbia.htmo http://www.encorp.ca/cfm/index.cfm?It=100&Id=8&Se=2
Operations:o http://www.encorp.ca/cfm/index.cfm?It=907&Id=3&Se=38o http://www.encorp.ca/cfm/index.cfm?It=907&Id=7&SearchID=8D79C899-FF1D-
12CC-F16A16C17892E68Co http://www.encorp.ca/cfm/index.cfm?It=940&Id=3&Se=39o http://www.encorp.ca/temp/2009111019084/BCDC_Release_Recycling_Announ
cement_Oct_20_06_Final.pdf Statistics/Financials:
http://www.encorp.ca/ar2008/_pdf/Encorp_AR_2008_page3.pdf http://www.encorp.ca/ar2008/
New Brunswick Data Sources: Data provided by: Derek Wilson, Best Metals (return depot company) Demographics:
o http://en.wikipedia.org/wiki/New_Brunswicko http://www.statcan.gc.ca/daily-quotidien/091106/t091106a3-eng.htm,o http://www.zurich-base-line.com/cn_gdp_pc_nation_data.htmlo http://www40.statcan.gc.ca/l01/cst01/lfss02a-eng.htmo http://www.gnb.ca/0160/Economics/LabourForce.htmo http://www.gnb.ca/0160/Economics/GDPatMarketPrices.html
Legislation:o http://www.gnb.ca/oag-bvg/2004v2/chap3e.txto http://www.bottlebill.org/legislation/canada/newbrunswick.htm
Operations:o http://www.ec.gc.ca/epr/default.asp?lang=En&n=5BF89F76-1o http://www.gnb.ca/0009/0372/0004/0005-e.asp
Statistics/Financials:o http://www.bottlebill.org/legislation/canada/newbrunswick.htm
Saskatchewan Data Sources: Data Questionnaire completed by Ken Homenick from SARCAN Interview with Ken Homenick from SARCAN Demographics:
o http://en.wikipedia.org/wiki/Sasko http://www.stats.gov.sk.ca/docs/factsheet09.pdfo http://www.zurich-base-line.com/cn_gdp_pc_nation_data.htmlo http://www40.statcan.gc.ca/l01/cst01/lfss02c-eng.htm
Legislation:o http://www.bottlebill.org/legislation/canada/saskatchewan.htmo http://www.sarcsarcan.ca/sarcan/index.phpo http://www.ec.gc.ca/epr/default.asp?lang=En&n=F7911B8D-1
Operations:o http://www.sarcsarcan.ca/sarcan/beverage/index.php
Statistics/Financials:o http://www.sarcsarcan.ca/sarcan/links/SARCAN_Did_You_Know_2007-2008.pdfo http://www.sarcsarcan.ca/links/Annual%20Report%2008-09.pdfo http://www.ec.gc.ca/epr/default.asp?lang=En&n=F7911B8D-1
California Data Sources: Data Questionnaire completed and interview conducted by Kent Harris, CalRecycle Demographics:

110
Benchmarking Evaluation of Alberta’s Stewardship Program forRecycling Empty Beverage Containers
o http://en.wikipedia.org/wiki/Californiao http://www.census.gov/compendia/statab/tables/09s0013.xls,
Legislation:o http://www.consrv.ca.gov/DOR/Pages/index.aspxo http://www.calpsc.org/products/docs/2009/CPSC%20Beverage%20Container%2
0White%20Paper.pdf Operations:
o http://www.bottlebill.org/legislation/usa/california.htm, Statistics/Financials:
o http://www.conservation.ca.gov/dor/gpi/Documents/FactSheet.pdfo http://www.allbusiness.com/food-beverage/beverage-industry-beverage-
manufacturing/5882524-1.html
Connecticut Data Sources: Interview with: Jackie Parnell, Department of Environmental Protection Demographics:
o http://en.wikipedia.org/wiki/Connecticuto http://www.census.gov/compendia/statab/tables/09s0013.xls
Legislation/Operations:o http://www.bottlebill.org/legislation/campaigns/connecticutc.htmo http://www.ct.gov/dep/cwp/view.asp?a=2714&q=324834&depNav_GID=1645o http://www.ct.gov/dep/cwp/view.asp?A=2714&Q=324838#General
Statistics/Financials:o http://www.ct.gov/dep/lib/dep/waste_management_and_disposal/solid_waste_ma
nagement_plan/april2009/090428_swac_bottle_bill_presentation.pdfo http://www.container-recycling.org/images/graphs/plastic/PETrec-bystate-07.pngo http://www.ct.gov/dep/lib/dep/waste_management_and_disposal/solid_waste_ma
nagement_plan/april2009/090428_swac_bottle_bill_presentation.pdfo http://search.cga.state.ct.us/dl2005/rpt/doc/2005-R-0836.doco www.environmentconnecicut.org/preservation/bottle-billo www.ct.gov.dep/cwp
Michigan Data Sources Interview with: Spencer Nevins, Michigan Beer and Wine Wholesalers Association and with Jeff
Schram from UBCR Data questionnaire completed by: Jeff Schram, UBCR Demographics:
o http://en.wikipedia.org/wiki/Michigano http://www.census.gov/compendia/statab/tables/09s0013.xls,
Legislation/Operations/Statistics/Financials:o http://www.deq.state.mi.us/documents/deq-wmd-swp-
mibottledepositlawFAQ1.pdfo http://www.bottlebill.org/legislation/usa/michigan.htm
New York Data Sources: Demographics:
o http://en.wikipedia.org/wiki/New_Yorko http://www.census.gov/compendia/statab/tables/09s0013.xls
Legislation/Operations:o http://www.bottlebill.org/legislation/usa/newyork.htmo http://www.dec.ny.gov/chemical/57687.html
Statistics/Financials:

111
Benchmarking Evaluation of Alberta’s Stewardship Program forRecycling Empty Beverage Containers
o http://www.dec.ny.gov/docs/materials_minerals_pdf/0506rcarpt.pdfo http://search.cga.state.ct.us/dl2005/rpt/doc/2005-R-0836.doco Beverage Container Deposit and Redemption Statistics for October 1, 2005-
September 30, 2006. New York State Department of EnvironmentalConservation. www.dec.ny.gov.docs/materials_minerals_pdf/0506rcarpt.pdf
Denmark Data Sources: Demographics:
o http://www.dst.dk/homeuk/statistics/key_indicators/population/soft drink.aspxo http://www.tradingeconomics.com/Economics/GDP.aspx?Symbol=DKKo http://siteresources.worldbank.org/DATASTATISTICS/Resources/GDP_PPP.pdfo http://www.tradingeconomics.com/Economics/Unemployment-
rate.aspx?symbol=DKK Legislation:
o http://www.bottlebill.org/legislation/world/denmark.htmo http://anker-andersen.com/deposit-laws/denmark.aspxo http://www.dansk-retursystem.dk/content/uso http://www.pro-e.org/Denmark
Operationso http://anker-andersen.com/deposit-laws/denmark.aspx
Statistics:o http://www.bottlebill.org/legislation/world/denmark.htm,o http://www.dansk-retursystem.dk/content/us
Financials:o http://www.iowabottlebillcoalition.com/aroundtheworld.htmlo http://www.bottlebill.org/legislation/world/denmark.htm
Germany Data Sources: Demographics
o http://datafinder.worldbank.org/ population-totalo http://www.tradingeconomics.com/Economics/GDP.aspx?Symbol=DEMo http://siteresources.worldbank.org/DATASTATISTICS/Resources/GDP_PPP.pdfo http://www.indexmundi.com/germany/unemployment_rate.html
Legislation:o http://www.calpsc.org/products/docs/2009/CPSC%20Beverage%20Container%2
0White%20Paper.pdf, Operations:
o http://anker-andersen.com/deposit-laws/germany.aspxo http://www.bottlebill.org/legislation/world/germany.htm
Statistics/Financials:o http://www.bottlebill.org/assets/pdfs/pubs/2009-BeverageSystemsCalifornia.pdf
Norway Data Sources: Demographics:
o http://datafinder.worldbank.org/population-totalo http://www.tradingeconomics.com/Economics/GDP.aspx?Symbol=NOKo http://siteresources.worldbank.org/DATASTATISTICS/Resources/GDP_PPP.pdfo http://www.tradingeconomics.com/Economics/Unemployment-
rate.aspx?Symbol=NOK Legislation:
o http://www.bottlebill.org/legislation/world/norway.htmo http://www.resirk.no/Frontpage-63.aspx
Operations:o http://anker-andersen.com/deposit-laws/norway.aspx
Statistics:

112
Benchmarking Evaluation of Alberta’s Stewardship Program forRecycling Empty Beverage Containers
o http://www.resirk.no/Ipaper-125.aspx?ShowIpaper=14 Financials:
o http://www.resirk.no/Frontpage-63.aspx
Sweden Data Sources: Demographics:
o http://datafinder.worldbank.org/population-totalo http://www.tradingeconomics.com/Economics/GDP.aspx?Symbol=SEKo http://siteresources.worldbank.org/DATASTATISTICS/Resources/GDP_PPP.pdf
Legislation/Operations:o http://www.bottlebill.org/legislation/world/sweden.htmo http://www.glasatervinning.se/in_english.phpo http://www.petrecycling.cz/swedish_epa_resp.htm
Statistics/Financials:o http://www.iowabottlebillcoalition.com/aroundtheworld.html,
South Australia Data Questionnaire completed and interview conducted by Edward Nixon, Statewide Recycling Demographics:
o http://www.bottlebill.org/legislation/world/australia.htmo http://www.abs.gov.au/AUSSTATS/[email protected]/Latestproducts/1345.4Main%20Fea
tures4Oct%202009?opendocument&tabname=Summary&prodno=1345.4&issue=Oct%202009&num=&view=
o http://www.adelaide.edu.au/saces/economy/production/o http://www.adelaide.edu.au/saces/economy/labour/
Legislation:o http://www.bottlebill.org/legislation/world/australia.htm,
http://www.hotkey.net.au/~gargoyle/CDL/AroundTheWorld/Australia/SA/index.html
o http://www.hotkey.net.au/~gargoyle/CDL/AroundTheWorld/Australia/SA/index.html
Operations:o http://www.hotkey.net.au/~gargoyle/CDL/AroundTheWorld/Australia/SA/index.ht
mlo http://www.aph.gov.au/senate/committee/eca_ctte/environment_protect_09/repor
t/c01.pdf,o http://www.boomerangalliance.org/000_files/26_CDL_in_South_Australia.pdfo http://www.aph.gov.au/senate/committee/eca_ctte/environment_protect_09/repor
t/c01.pdf Statistics:
o http://www.recyclesa.com.au/o http://www.mav.asn.au/CA256C320013CB4B/Lookup/Container_Deposits_Exten
ded_Producer_Responsiblity_Forum_8_Nov_2007_Tom_Whitworth/$file/Assoc%20RWMG%20-%20Container%20Deposits-Extended%20Producer%20Responsiblity%20Forum%20-%208%20Nov%202007%20-%20Tom%20Whitworkth.pdf
Financials:o http://www.bringitback.org.au/boomerang/node/43

113
Benchmarking Evaluation of Alberta’s Stewardship Program forRecycling Empty Beverage Containers
2008 UCAs – 2009 Phase I Report UCA Process Changes HC Policy Task Force Initiatives. December 2,2009. Prepared by: Desiderata Energy Consulting Inc.
Alberta Beer Container Corporation: 85 Years of Brewers Recycling. December 2009. Prepared by:ABCC
Alberta Regulation 101/97. Environmental Protection Act: Beverage Container Recycling Regulation.October 2008.
Antymis, Neil. BCMB Board Member. Telephone Interview. January 19, 2010.
An Analysis of the Costs and Benefits of Beverage Container Recovery in Canada. CM Consulting.January 2002.
Approval of Redemption Centers and Beverage Containers: Deposit-Redemption System. June 2007.State of Vermont.
Australian Senate Container Legislation. 2009.
Benchmarking Evaluation of DAO Stewardship Programs in Alberta: Final Report. February 28, 2006.Prepared by: Bearing Point.
Beverage Container Recycling: A Survey of Albertans. November 2009. Prepared by: The Praxis Group.
Biannual Report of Beverage Container Sales, Returns, Redemption, and Recycling Rates. May 8, 2009.Prepared by: California Department of Conservation.
Comparison of Provincial Recycling Programs. July 2009. Prepared by: Rod Simpson.
Evaluating End-of-Life Beverage Container Management Systems for California: Final Report. Division ofRecycling, California. May 15, 2009. Prepared by: R3 Consulting Group, Inc. and Clarissa Morawski.
Final UOMA Program Review Findings. June 21, 2005. Prepared by: Bearing Point.
IBM, Stanford University Unveil Research on Plastics. Recycling Today, March 10, 2010.http://www.recyclingtoday.com/Article.aspx?article_id=78833 (Sourced March 24
th)
Linton, Jeff. BCMB Board Member. Telephone Interview. January 19, 2010.
McQueen, Diana. Letter. Risvold, Ross. August 20, 2008.
McQueen, Diana. Letter. Risvold, Ross. November 6, 2008.Oregon Department of Environmental Quality Solid Waste Program - Organizational Chart. April 1, 2008.State of Oregon Department of Environmental Quality.
Organocatalysis: Opportunities and Challenges for Polymer Synthesis. Macromolecules, 2010, 43 (5), pg.2093-2107. February 16, 2010.
Performance Measurement and Reporting for Extended Producer Responsibility Programs. October2007. Prepared by: Stratos.Product Stewardship for Beverage Containers: A Comparison of Systems in California, BC and Germany.California Product Stewardship Council. Sourced: March 26, 2010.http://www.calpsc.org/products/docs/2009/CPSC%20Beverage%20Container%20White%20Paper.pdf

114
Benchmarking Evaluation of Alberta’s Stewardship Program forRecycling Empty Beverage Containers
Recycling of Beverage Packages.
Recommendations upon Review of Key Issues Pertaining to the Beverage Container RecyclingRegulation. November 2007. Standing Committee on Resources and Environment.
Reports on trips to AA / Denmark. February 11, 2010. Prepared by: John Bachinski.
Reports on Trips to AA / Iceland. Febraury 8, 2010. Prepared by: John Bachinski.
Reverse Vending Machine (RVM) PILOT STUDY. April-May 2007. Nicolas Coburn. Funding Provided By:ABCRC, ABDA, CBSI.
Risvold, Ross. Letter. McQueen, Diana. August 22, 2008
Risvold, Ross. Letter. McQueen, Diana. January 6, 2009.
Risvold, Ross. BCMB Chair. Telephone Interview. January 19, 2010.
The Dual System in Germany. Joachim Quoden.
The Expanded Bottle Bill. 2007. State of Oregon Department of Environmental Quality.
UOMA Program Review: Final Report. May 27, 2005. Prepared by: Bearing Point.
Vermont Bottle and Label Approval. State of Vermont.
Wanted Empty and Alive: The Best Recycling System in the World. Suomen Palautuspakkaus Oy
West, Guy. President. Alberta Beverage Container Recycling Corporation. Telephone Interview. January20, 2010.
What is Gasification? Gasification Technologies Council. Sourced: May 3, 2010.http://www.gasification.org/what_is_gasification/overview.aspx
Who Pays What: An Analysis of Beverage Container Recovery and Cost in Canada. Spring 2008.Prepared by: CM Consulting.