beyond accuracy: what data quality means to data...
TRANSCRIPT

Beyond Accuracy: What Data Quality Means to Data ConsumersAuthor(s): Richard Y. Wang and Diane M. StrongSource: Journal of Management Information Systems, Vol. 12, No. 4 (Spring, 1996), pp. 5-33Published by: M.E. Sharpe, Inc.Stable URL: http://www.jstor.org/stable/40398176 .
Accessed: 26/10/2013 17:54
Your use of the JSTOR archive indicates your acceptance of the Terms & Conditions of Use, available at .http://www.jstor.org/page/info/about/policies/terms.jsp
.JSTOR is a not-for-profit service that helps scholars, researchers, and students discover, use, and build upon a wide range ofcontent in a trusted digital archive. We use information technology and tools to increase productivity and facilitate new formsof scholarship. For more information about JSTOR, please contact [email protected].
.
M.E. Sharpe, Inc. is collaborating with JSTOR to digitize, preserve and extend access to Journal ofManagement Information Systems.
http://www.jstor.org
This content downloaded from 128.95.130.223 on Sat, 26 Oct 2013 17:54:36 PMAll use subject to JSTOR Terms and Conditions

Beyond Accuracy: What Data Quality Means to Data Consumers
RICHARD Y. WANG AND DIANE M. STRONG
Richard Y. Wang is Associate Professor of Information Technologies (IT) and Co-Director for Total Data Quality Management (TDQM) at the MIT Sloan School of Management, where he received a Ph.D. degree with an IT concentration. He is a major proponent of data quality research, with more than twenty papers written to develop a set of concepts, models, and methods for this field. Professor Wang received more than one million dollars of research grants from both the public and private sector. His work on data quality was applied, by the Navy, to the Naval Command, Control, Communication, Computers, and Intelligence (C4I) information architecture. He presented the state-of-the-art of data quality research and practice in the Chief Information Officer (CIO) conference in 1993, and spoke on "Data Quality in the Information Highways" at the Enterprise '93 conference. Dr. Wang organized the first Workshop on Information Technologies and Systems (WITS) in 1991. At WITS-94 he was elected chairman of the Executive Steering Committee. He also chaired or
participated in the data quality panel at WITS and at the International Conference on Information Systems. Dr. Wang is the editor of Information Technologies: Trends and
Perspectives.
Diane M. Strong is Assistant Professor of Management at Worcester Polytechnic Institute. She received her Ph.D. in information systems from Carnegie Mellon University, an M.S. in computer science from the New Jersey Institute of Technology, and a B.S. in computer science from the University of South Dakota. Dr. Strong's research centers on data and information quality and software quality. Her publications have appeared in A CM Transactions on Information Systems, MIS Quarterly, Decision
Support Systems, and other leading journals.
ABSTRACT: Poor data quality (DQ) can have substantial social and economic impacts. Although firms are improving data quality with practical approaches and tools, their improvement efforts tend to focus narrowly on accuracy. We believe that data consumers have a much broader data quality conceptualization than IS professionals realize. The purpose of this paper is to develop a framework that captures the aspects of data quality that are important to data consumers.
A two-stage survey and a two-phase sorting study were conducted to develop a hierarchical framework for organizing data quality dimensions. This framework
Acknowledgments'. Research conducted herein has been supported, in part, by MIT's Total Data Quality Management (TDQM) Research Program and MIT's International Financial Services Research Center (IFSRC). The authors wish to thank Lisa Guarascio for her field work and factor analysis, Professors Donald Bailou, Izak Benbasat, and Stuart Madnick for providing insightful comments and encouragement, Professors France LeClerc and Paul Berger for their input on the design and execution of this research, and Daphne Png for conducting the confirmatory experiment and summarizing its results.
Journal of Management Information Systems I Spring 1996, Vol. 12, No. 4, pp. 5-34
Copyright C 1996 M.E. Sharpe, Inc.
This content downloaded from 128.95.130.223 on Sat, 26 Oct 2013 17:54:36 PMAll use subject to JSTOR Terms and Conditions

6 RICHARD Y. WANG AND DIANE M. STRONG
captures dimensions of data quality that are important to data consumers. Intrinsic DQ denotes that data have quality in their own right. Contextual DQ highlights the requirement that data quality must be considered within the context of the task at hand. Representational DQ and accessibility DQ emphasize the importance of the role of systems. These findings are consistent with our understanding that high-quality data should be intrinsically good, contextually appropriate for the task, clearly represented, and accessible to the data consumer.
Our framework has been used effectively in industry and government. Using this framework, IS managers were able to better understand and meet their data consumers' data quality needs. The salient feature of this research study is that quality attributes of data are collected from data consumers instead of being defined theoretically or based on researchers' experience. Although exploratory, this research provides a basis for future studies that measure data quality along the dimensions of this framework.
Key words and phrases: data administration, data quality, database systems.
Introduction
Many databases are not error-free, and some contain a surprisingly large number of errors [3, 4, 5, 21, 28, 34, 38, 40]. A recent industry report, for example, notes that more than 60 percent of the surveyed firms (500 medium-size corporations with annual sales of more than $20 million) have problems with data quality.1 Data
quality problems, however, go beyond accuracy to include other aspects such as
completeness and accessibility. A big New York bank found that the data in its credit-risk management database were only 60 percent complete, necessitating dou-
ble-checking by anyone using it.2 A major manufacturing company found that it could not access all sales data for a single customer because many different customer numbers were assigned to represent the same customer. In short, poor data quality can have substantial social and economic impacts.
To improve data quality, we need to understand what data quality means to data consumers (those who use data). The purpose of this research, therefore, is to develop a framework that captures the aspects of data quality that are important to data consumers.
Related Research
The concept of "fitness for use" is now widely adopted in the quality literature. It
emphasizes the importance of taking a consumer viewpoint of quality because
ultimately it is the consumer who will judge whether or not a product is fit for use [13, 1 5, 22, 23]. In this research, we also take the consumer viewpoint of "fitness for use" in conceptualizing the underlying aspects of data quality. Following this general quality literature, we define "data quality" as data that are fit for use by data consumers. In addition, we define a "data quality dimension" as a set of data quality attributes that represent a single aspect or construct of data quality.
This content downloaded from 128.95.130.223 on Sat, 26 Oct 2013 17:54:36 PMAll use subject to JSTOR Terms and Conditions

BEYOND ACCURACY: DATA QUALITY 7
Three approaches are used in the literature to study data quality: (1) an intuitive, (2) a theoretical, and (3) an empirical approach. The intuitive approach is taken when the selection of data quality attributes for any particular study is based on the researchers'
experience or intuitive understanding about what attributes are "important." Most data
quality studies fall into this category. The cumulative effect of these studies is a small set of data quality attributes that are commonly selected. For example, many data
quality studies include accuracy as either the only or one of several key dimensions
[4, 28, 32]. In the accounting and auditing literature, reliability is a key attribute used in studying data quality [7, 1 1 , 2 1 , 24, 25, 49].
In the information systems literature, information quality and user satisfaction are two major dimensions for evaluating the success of information systems [12]. These two dimensions generally include some data quality attributes, such as accuracy, timeliness, precision, reliability, currency, completeness, and relevancy [2, 20, 27]. Other attributes such as accessibility and interpretability are also used in the data
quality literature [44, 45]. Most of these studies identify multiple dimensions of data quality. Furthermore,
although a hierarchical view of data quality is less common, it is reported in several studies [27, 34, 44]. None of these studies, however, empirically collects data quality attributes from data consumers.
A theoretical approach to data quality focuses on how data may become deficient
during the data manufacturing process. Although theoretical approaches are often
recommended, research offers few examples. One such study uses an ontological approach in which attributes of data quality are derived on the basis of data deficien-
cies, which are defined as the inconsistencies between the view of a real-world system that can be inferred from a representing information system and the view that can be obtained by directly observing the real- world system [42].
The advantage of using an intuitive approach is that each study can select the attributes most relevant to the particular goals ofthat study. The advantage of a theoretical approach is the potential to provide a comprehensive set of data quality attributes that are intrinsic to a data product. The problem with both of these
approaches is that they focus on the product in terms of development characteris- tics instead of use characteristics. They fail to capture the voice of the consumer. Evaluations of theoretical approaches to defining product attributes as a basis for
improving quality find that they are not an adequate basis for improving quality and are significantly worse than empirical approaches.
To capture the data quality attributes that are important to data consumers, we take an empirical approach. An empirical approach to data quality analyzes data collected from data consumers to determine the characteristics they use to assess whether data are fit for use in their tasks. Therefore, these characteristics cannot be
theoretically determined or intuitively selected by researchers. The advantage of an
empirical approach is that it captures the voice of customers. Furthermore, it may reveal characteristics that researchers have not considered as part of data quality. The
disadvantage is that the correctness or completeness of the results cannot be proven via fundamental principles.
This content downloaded from 128.95.130.223 on Sat, 26 Oct 2013 17:54:36 PMAll use subject to JSTOR Terms and Conditions

8 RICHARD Y. WANG AND DIANE M. STRONG
Research Approach
We follow the methods developed in marketing research for determining the quality characteristics of products. Our approach implicitly assumes that data can be treated
as a product. It is an appropriate approach because an information system can be viewed as a data manufacturing system acting on raw data input to produce output data or data products [1,6, 16, 19, 35, 43, 46]. While most data consumers are not
purchasing data, they are choosing to use or not to use data in a variety of tasks.
Approaches for assessing product quality attributes that are important to consumers
are well established in the marketing discipline [8, 26]. Three tasks are suggested in
identifying quality attributes of a product: (1) identifying consumer needs, (2) identi-
fying the hierarchical structure of consumer needs, and (3) measuring the importance of each consumer need [17, 18].
Following the marketing literature, this research identifies the attributes of data
quality that are important to data consumers. We first collect data quality attributes
from data consumers, and then collect importance ratings for these attributes and
structure them into a hierarchical representation of data consumers' data quality needs.
Our goal is to develop a comprehensive, hierarchical framework of data quality attributes that are important to data consumers.
Some researchers may doubt the validity of asking consumers about important
quality attributes because of the well-known difficulties with evaluating users' satis-
faction with information systems [30]. Importance ratings and user satisfaction,
however, are two different constructs. Griffin and Häuser [17], for example, demonstr- ate that determining attributes of importance to consumers, collecting importance ratings of these attributes, and measuring attribute values are valid characterizations of consumers' actions such as purchasing the product, but satisfaction ratings of these
attributes are uncorrelated with consumer actions.
Research Method
We first developed two surveys that were used to collect data from data consumers
(referred to as the two-stage survey later). The first survey produced a list of possible data quality attributes, attributes that came to mind when the data consumer thought about data quality. The second survey assessed the importance of these possible data
quality attributes to data consumers. The importance ratings from the second survey were used in an exploratory factor analysis to yield an intermediate set of data quality dimensions that were important to data consumers.
Because the detailed surveys produced a comprehensive set of data quality attributes for input to factor analysis, a broad spectrum of intermediate data quality dimensions were revealed. We conducted a follow-up empirical study to group these intermediate data quality dimensions for the following reasons. First, it is probably not critical for evaluation purposes to consider so many quality dimensions [27]. Second, although these dimensions can be ranked by the importance ratings, the highest ranking dimensions may not capture the essential aspects of data quality. Third, the interme-
This content downloaded from 128.95.130.223 on Sat, 26 Oct 2013 17:54:36 PMAll use subject to JSTOR Terms and Conditions

BEYOND ACCURACY: DATA QUALITY 9
diate dimensions seem to form several families of factors. Grouping these intermediate data quality dimensions into families of factors is consistent with research in the
marketing discipline. For example, Deshpande [14] grouped participation in decision
making and hierarchy of authority together as a family, named centralization factors,
andy'oè codification and job specificity as a family, namedformalization factors. In grouping these intermediate dimensions into families, we used a preliminary
conceptual framework developed from our experience with data consumers. This
conceptual framework consisted of four "ideal" or target categories. Our intent was to evaluate the extent to which the intermediate dimensions matched these categories. Thus, our follow-up study moved beyond the purely exploratory nature of the
two-stage survey to a more confirmatory study. This follow-up study consisted of two phases (referred to later as the two-phase
study). For the first phase, subjects were instructed to sort these dimensions into
categories, and then label the categories. For the second phase, a different set of
subjects was instructed to sort these dimensions into the categories revealed from the
first phase to confirm these findings. The key result of this research is a comprehensive framework of data quality from
data consumers' perspectives. Such a framework serves as a foundation for improving the data quality dimensions that are important to data consumers. Our analysis is
oriented toward the characteristics of the quality of data in use, in addition to the
characteristics of the quality of data in production and storage; therefore, it extends
the concept of data quality beyond the traditional development view. Our results have
been used effectively in industry and government. Several Fortune 1 00 companies and
the U.S. Navy [33] have used our framework to identify potential areas of data
deficiencies, operationalize the measurements of these data deficiencies, and improve data quality along these measures.
Preliminary Conceptual Framework
Based on the limited relevant literature, the concept of fitness for use from the quality
literature, and our experiences with data consumers, we propose a preliminary con-
ceptual framework for data quality that includes the following aspects:
• The data must be accessible to the data consumer. For example, the consumer
knows how to retrieve the data. • The consumer must be able to interpret the data. For example, the data are not
represented in a foreign language. • The data must be relevant to the consumer. For example, data are relevant and
timely for use by the data consumer in the decision-making process. • The consumer must find the data accurate. For example, the data are correct,
objective and come from reputable sources.
Although we hypothesize that any data quality framework that captures data
consumers' perspectives of data quality will include the above aspects, we do not bias
our initial data collection in the direction of our conceptualization. To be unbiased,
This content downloaded from 128.95.130.223 on Sat, 26 Oct 2013 17:54:36 PMAll use subject to JSTOR Terms and Conditions

10 RICHARD Y. WANG AND DIANE M. STRONG
we start with an exploratory approach that includes not only the attributes in our
preliminary framework, but also the attributes mentioned in the literature. For exam-
ple, our first questionnaire starts with some attributes (timeliness and availability) that are not part of this preliminary framework.
The Two-Stage Survey
The purpose of this two-stage survey is to identify data quality dimensions
perceived by data consumers. In the following, we summarize the method and key results of these surveys. The reader is referred to [47] for more detailed results.
Method
The method for the two-stage survey was as follows: For stage 1, we conducted a
survey to generate a list of data quality attributes that capture data consumers'
perspectives of data quality. For stage 2, we conducted a survey to collect data on the
importance of each of these attributes to data consumers, and then performed an
exploratory factor analysis on the importance data to develop an intermediate set of
data quality dimensions.3
The First Survey
The purpose of the first survey was to generate an extensive list of potential data quality attributes. Since the data quality dimensions resulting from factor analysis depend, to
a large extent, on the list of attributes generated from the first survey, we decided that
(1) the subjects should be data consumers who have used data to make decisions in
diverse contexts within organizations, and (2) we should be able to probe and question the subjects in order to fully understand their answers.
Subjects: Two pools of subjects were selected. The first consisted of 25 data consumers currently working in industry. The second was M.B.A. students at a large U.S. university. We selected 1 12 students who had work experience as data consum- ers. The average age of these students was over 30.
Survey Instrument: The survey instrument (see appendix A) included two sections for eliciting data quality attributes. The first section elicited respondents' first reaction to data quality by asking them to list those attributes that first came to mind when they thought of data quality (beyond the common attributes of timeliness, accuracy, availability, and interpretability). The second section provided further cues by listing 32 attributes beyond the four common ones to "spark" any additional attributes. These 32 attributes were obtained from data quality literature and discussions among data
quality researchers. Procedure: For the selected M.B.A. students, the survey was self-administered. For
the subjects working in industry, the administration of the survey was followed by a discussion of the meanings of the attributes the subjects generated.
Results: This process resulted in 179 attributes, as shown in figure 1 .
This content downloaded from 128.95.130.223 on Sat, 26 Oct 2013 17:54:36 PMAll use subject to JSTOR Terms and Conditions

BEYOND ACCURACY: DATA QUALITY 1 1
Ability to be Ability to Download Ability to Identify Ability to Upload Joined With Errors Acceptability Access by Accessibility Accuracy
Competition Adaptability Adequate Detail Adequate Volume Aestheticism Age Aggregatability Alterabi I ity Amount of Data Auditable Authority Availability Believability Breadth of Data Brevity Certified Data Clarity Clarity of Origin Clear Data Compactness Compatibility
Responsibility Competitive Edge Completeness Comprehensiveness Compressibility Concise Conciseness Confidentiality Conformity Consistency Content Context Continuity Convenience Correctness Corruption Cost Cost of Accuracy Cost of Collection Creativity Critical Current Customizability Data Hierarchy Data Improves
Efficiency Data Overload Definability Dependability Depth of Data Detail Detailed Source Dispersed Distinguishable
Updated Files Dynamic Ease of Access Ease of Comparison Ease of
Correlation Ease of Data Ease of Maintenance Ease of Retrieval Ease of Exchange Understanding Ease of Update Ease of Use Easy to Change Easy to Question Efficiency Endurance Enlightening Ergonomie Error-Free Expandability Expense Extendibility Extensibility Extent Finalization Flawlessness Flexibility Form of Presentation Format Integrity Friendliness Generality Habit Historical
Compatibility Importance Inconsistencies Integration Integrity Interactive Interesting Level of Abstraction Level of
Standardization Localized Logically Connected Manageability Manipulate Measurable Medium Meets Requirements Minimality Modularity Narrowly Defined No lost information Normality Novelty Objectivity Optimality Orderliness Origin Parsimony Partitionability Past Experience Pedigree Personalized Pertinent Portability Preciseness Precision Proprietary Nature Purpose Quantity Rationality Redundancy Regularity of Format Relevance Reliability Repetitive Reproducibility Reputation Resolution of Graphics Responsibility Retrievability Revealing Reviewability Rigidity Robustness Scope of Info Secrecy Security Self-Correcting Semantic Semantics Size Source Interpretation Specificity Speed Stability Storage Synchronization Time-independence Timeliness Traceable Translatable Transportability Unambiguity Unbiased Understandable Uniqueness Unorganized Up-to-Date Usable Usefulness User Friendly Valid Value Variability Variety Verifiable Volatility Well-Documented Well-Presented
Figure 1. Data Quality Attributes Generated from the First Survey
This content downloaded from 128.95.130.223 on Sat, 26 Oct 2013 17:54:36 PMAll use subject to JSTOR Terms and Conditions

12 RICHARD Y. WANG AND DIANE M. STRONG
The Second Survey
The purpose of the second survey was to collect data about the importance of quality attributes as perceived by data consumers. The results of the second survey were
ratings of the importance of the data quality attributes. These importance ratings were the input for an exploratory factor analysis to consolidate these attributes into a set of data quality dimensions.
Subjects: Since we needed a sample consisting of a wide range of data consumers with different perspectives, we selected the alumni of the M.B.A. program of a large university who reside in the United States. These alumni consisted of individuals in a
variety of industries, departments, and management levels who regularly used data to make decisions, thus satisfying the requirement for data consumers with diverse
perspectives. From over 3,200 alumni, we randomly selected 1,500 subjects. Survey Instrument: The list of attributes shown in figure 1 was used to develop the
second survey questionnaire (see appendix B). The questionnaire asked the respondent to rate the importance of each data quality attribute for their data on a scale from 1 to
9, where 1 was extremely important and 9 not important. The questionnaire was divided into four sections, depending on the appropriate wording of the attributes, for
example, as stand-alone adjectives or as complete sentences. Since we did not include definitions with the attributes, it is possible that data consumers responding to the
surveys could interpret the meanings of the attributes differently. Attributes that are not important or that are not consistently interpreted across data consumers will not show up as significant in the factor analysis.
A pretest of the questionnaire was administered to fifteen respondents: five industry executives, six professionals, two professors, and two M.B.A. students. Minor changes were made in the format of the survey as a result of the pretest. Based on the results from the pretest, the final second survey questionnaire included 118 data quality attributes (i.e., 1 1 8 items for factor analysis) to be rated for their importance, as shown in appendix B.
Procedure: This survey was mailed along with a cover letter explaining the nature of the study, the time to complete the survey (less than twenty minutes), and its criticality. Most of the alumni addresses were home addresses. To assure a successful
survey, we sent the survey questionnaires via first-class mail. We gave respondents a six- week cut-off period to respond to the survey.
Response Rate: Of the 1 ,500 surveys mailed, sixteen were returned as undeliverable. Of the remaining 1,484, 355 viable surveys (an effective response rate of 24 percent) were returned by the six-week deadline.4
Missing Responses: While none of the 1 18 attributes (items) had 355 responses, none had fewer than 329 responses. There did not appear to be any significant pattern to the missing responses.
Results: Descriptive statistics of the 1 1 8 items (attributes) are presented in appendix C. Most of the 118 items had a full range of values from 1 to 9, where 1 means extremely important and 9 not important. The exceptions were accuracy, reliability, level of detail, and easy identification of errors. Accuracy and reliability had the
This content downloaded from 128.95.130.223 on Sat, 26 Oct 2013 17:54:36 PMAll use subject to JSTOR Terms and Conditions

BEYOND ACCURACY: DATA QUALITY 13
smallest range, with values ranging from 1 to 7; level of detail and easy identification of errors ranged from 1 to 8. Ninety-nine of the 1 18 items (85 percent) had means less than or equal to 5; that is, most of the items surveyed were considered to be
important data quality attributes. Two items - accuracy and correct - had means less than 2 and thus were overall the most important data quality attributes, with means of 1 .77 1 and 1.816, respectively. An exploratory factor analysis of the importance ratings produced twenty dimensions, as shown in Table 1. As mentioned earlier, more detailed results can be found in [47].
Factor Interpretation: Factor analysis is appropriate for this study because its
primary application is to uncover an underlying data structure [10, 37]. An alternative method would be to ask subjects to group the attributes into common dimensions, as we did in the second phase of this research. Grouping tasks provide more assurance that the factors are interprétable. While both factor analysis and grouping tasks are used in the literature to uncover dimensions, grouping tasks become impractical when the number of items increases. Furthermore, factor analysis can uncover dimensions that are not obvious to researchers.
A potential disadvantage of factor analysis in this research is that attributes with
nothing in common could load on the same factor because they have the same
importance ratings. This would lead to problems in interpreting the factors. Importance ratings collected from a sample of 355 data consumers with diverse backgrounds, however, will be similar only if data consumers perceive these items consistently. If these items form different constructs, data consumers will rate their importance differently, resulting in different factors. Furthermore, the twenty dimensions show face validity because it was easy for us to name these factors.
Factor Stability. Since the number of survey responses relative to the number of attributes is lower than recommended, it is possible that the factor structure is not
sufficiently stable. To test factor stability, we reran the analysis using two different
approaches. First, in a series of factor analysis runs, we varied the number of factors to test whether the attributes loading on those factors changed as the number of factors changed. Second, we ran the factor analysis using as input only those attributes that actually loaded on the twenty dimensions to test whether the insignif- icant attributes affected the results.
In the first approach, our analysis of factor stability found that fourteen out of the
twenty dimensions were stable across the series of runs. That is, the same dimensions
consisting of the same attributes emerged (see Table 1). Two dimensions, 15 (ease of
operation) and 20 (flexibility), were stable in terms of the attributes loading on them, but were combined into a single dimension in runs fixed at fewer dimensions. Four
dimensions, 5, 9, 16, and 19, which are all single-attribute factors, have less than desirable stability. Specifically, in some runs, these dimensions either were not
significant or they were combined with another single-attribute dimension. In the second approach, the factor analysis used the 7 1 attributes shown in Table 1 , which
meets responses-to-attribute ratio recommendations. The second approach produced the same results as the first. Thus, we conclude that these dimensions are stable with the caveat that additional research is needed to verify most of the single-attribute dimensions.
This content downloaded from 128.95.130.223 on Sat, 26 Oct 2013 17:54:36 PMAll use subject to JSTOR Terms and Conditions

14 RICHARD Y. WANG AND DIANE M. STRONG
Table 1 . Description of the Dimensions
Dim. Name of dimension Mean S.D. C.I. Cronbacha (attribute list)
1 Believability (believable) 271 ÕÍÕ 2.51-2.91 N/Ã
2 Value-added (data give you 2.83 0.09 2.65-3.01 0.70 a competitive edge, data add value to your operations)
3 Relevancy (applicable, 2.95 0.06 2.82-3.08 0.69 relevant, interesting, usable)
4 Accuracy (data are certified 3.05 0.10 2.86-3.24 0.87 error-free, accurate, correct, flawless, reliable, errors can be easily identified, the integrity of the data, precise)
5 Interpretability (interprétable) 3.20 0.09 3.03-3.37 N/A
6 Ease of understanding 3.22 0.07 3.07-3.37 0.79 (easily understood, clear, readable)
7 Accessibility (accessible, 3.47 0.08 3.32-3.62 0.81 retrievable, speed of access, available, up-to- date)
8 Objectivity (unbiased, 3.58 0.09 3.40-3.76 0.73 objective)
9 Timeliness (age of data) 3.64 0.11 3.43-3.85 N/A
10 Completeness (breadth, 3.88 0.09 3.74-4.06 0.98 depth, and scope of information contained in the data)
11 Traceability(well- 3.97 0.09 3.7^^.14 0.79 documented, easily traced, verifiable)
12 Reputation (reputation of the 4.04 0.10 3.83-4.25 0.87 data source, reputation of the data)
13 Representational 4.22 0.09 4.04-4.39 0.84 consistency (data are continuously presented in same format, consistently represented, consistently formatted, data are compatible with previous data)
14 Cost-effectiveness (cost of 4.25 0.10 4.05-4.44 0.85 data accuracy, cost of data collection, cost-effective)
This content downloaded from 128.95.130.223 on Sat, 26 Oct 2013 17:54:36 PMAll use subject to JSTOR Terms and Conditions

BEYOND ACCURACY: DATA QUALITY 15
Table 1. Continued
Dim. Name of dimension Mean S.D. C.I. Cronbacha
(attribute list) 15 Ease of operation (easily 4.28 0.08 4.13-4.44 0.90
joined, easily changed, easily updated, easily downloaded/uploaded, data can be used for multiple purposes, manipulate, easily aggregated, easily reproduced, data can be easily integrated, easily customized)
16 Variety of data and data 4.71 0.12 4.48-4.95 N/A sources (you have a variety of data and data sources)
17 Concise (well-presented, 4.75 0.08 4.5^-4.92 0.92 concise, compactly represented, well-organized, aesthetically pleasing, form of presentation, well- formatted, format of the data)
18 Access security (data cannot 4.92 0.11 4.70-5.14 0.84 be accessed by competitors, data are of a proprietary nature, access to data can be restricted, secure)
19 Appropriate amount of data 5.01 0.11 4.79-5.23 N/A
(the amount of data)
20 Flexibility (adaptable, 5.34 0.09 5.17-5.51 0.88 flexible, extendable, expandable)
A dimension mean was computed as the average of the responses to all of the items with a loading of 0.5 or greater on the dimension. For example, the dimension ease of
understanding consisted of the three items: easily understood, readable, and clear. The mean importance for ease of understanding was the average of the importance ratings for easily understood, readable, and clear. (See Table 1 for the means, standard
deviations, and confidence intervals.) Cronbach's alpha, a measure of construct reliability, was computed for each dimen-
sion to assess the reliability of the set of items forming that dimension. As shown in the rightmost column of Table 1 , these alpha coefficients ranged from 0.69 to 0.98. As a rule, alphas of 0.70 or above represent satisfactory reliability of the set of items
measuring the construct (dimension). Thus, the items measuring our dimensions are
sufficiently reliable.
This content downloaded from 128.95.130.223 on Sat, 26 Oct 2013 17:54:36 PMAll use subject to JSTOR Terms and Conditions

16 RICHARD Y. WANG AND DIANE M. STRONG
Table 2. Four Target Categories for the 20 Dimensions
Target category Dimension Adjustment
Accuracy of data Believability None Accuracy None Objectivity None Completeness Moved to category 2 Traceability Eliminated Reputation None Variety of Data Sources Eliminated
Relevancy of data Value-added None Relevancy None Timeliness None Ease of operation Eliminated Appropriate amount of data None Flexibility Eliminated
Representation of data Interpretability None Ease of understanding None Representational consistency None Concise representation None
Accessibility of data Accessibility None Cost-effectiveness Eliminated Access security None
Note: A target category is a hypothesized category based on our preliminary conceptual framework.
The Two-Phase Sorting Study
Twenty dimensions were too many for practical evaluation purposes. In
addition, although these dimensions were ranked by the importance ratings, the
highest-ranking dimensions might not capture the essential aspects of data quality. Finally, a grouping of these dimensions was consistent with research in the marketing discipline, and substantiated a hierarchical structure of data quality dimensions.
Using our preliminary conceptual framework, we conducted a two-phase sorting study. The first phase of the study was to sort these intermediate dimensions into a small set of categories. The second phase was to confirm that these dimensions indeed
belonged to the categories in our preliminary conceptual framework.
Method
We first created four categories (see column 1 of Table 2) based on our preliminary conceptual framework, following Moore and Benbasat [31]. We then grouped the 20 intermediate dimensions into these four categories (see column 2 of Table 2). Our initial grouping was based on our understanding of these categories and dimensions. The sorting study provided the data to test this initial grouping and to make adjustments
This content downloaded from 128.95.130.223 on Sat, 26 Oct 2013 17:54:36 PMAll use subject to JSTOR Terms and Conditions

BEYOND ACCURACY: DATA QUALITY 17
in the assignment of dimensions to target categories (see column 3 of Table 2), which will be further discussed.
The Sorting Study: Phase 1
Subjects: Thirty subjects from industry were selected to participate in the overall
sorting procedure. These subjects were enrolled in an evening M.B. A. class in another
large university. Eighteen of these 30 subjects were randomly selected to participate in the first phase.
Design: Each of the 20 dimensions, along with a description, was printed on a
3x5-inch card, as shown in appendix Dl. These cards were used by each of the
subjects in the study to group the 20 dimensions into a small set of categories. In contrast to phase 2, the subjects for phase 1 were not given a prespecified set of
categories each with a name and description. The study was pretested by two
graduate-level MIS students to clarify any ambiguity in the design or instruction. Procedure: The study was run by a third party who was not aware of the goal of this
research, in order to avoid any bias by the authors. Before performing the actual sorting task, subjects performed a trial sort using dimensions other than these 20 dimensions to ensure that they understood the procedure. In the actual sorting task, subjects were
given instructions to group the 20 cards into three to five piles. The subjects were then asked to label each of their piles.
The Sorting Study: Phase 2
The original assignment of dimensions to categories was adjusted based on the results from the phase 1 study. For example, as shown in column 3 of Table 2, completeness is moved from the accuracy category to the relevancy category because only four
subjects assigned this dimension to the former category, whereas twelve assigned it to the latter. This was a reasonable adjustment because completeness could be
interpreted within the context of the data consumer's task instead of our initial
interpretation that completeness was part of the accuracy category. In addition, five dimensions were eliminated: traceability, variety of data sources,
ease of operation, flexibility, and cost-effectiveness. These dimensions were elimi- nated for both of the following two reasons: First, subjects did not consistently assign the dimension to any category. For example, seven subjects assigned cost-effective- ness to the relevancy category, three assigned it to the other three categories, and eight assigned it to a self-defined category. Second, the dimension was not ranked highly in terms of importance. For example, cost-effectiveness was ranked 14 out of 20.
The purpose of the second phase of the sorting study was to confirm that the dimensions indeed belonged to these adjusted categories.
Subjects: The remaining twelve subjects from our subject pool participated in this
phase of study. Design: For each category of dimensions revealed from phase 1, the authors
provided a label, as shown in appendix D2, based on the underlying dimensions.
This content downloaded from 128.95.130.223 on Sat, 26 Oct 2013 17:54:36 PMAll use subject to JSTOR Terms and Conditions

18 RICHARD Y. WANG AND DIANE M. STRONG
Descriptive phrases, rather than single words, were used as labels to avoid confound-
ing category labels with any of the dimension labels. Procedure: The third party that ran the phase 1 study also ran the phase 2 study. The
procedure for phase 2 was similar to that of phase 1 , with the exception that subjects were instructed to place each of the dimension cards into the category that best
represents that dimension.
Findings
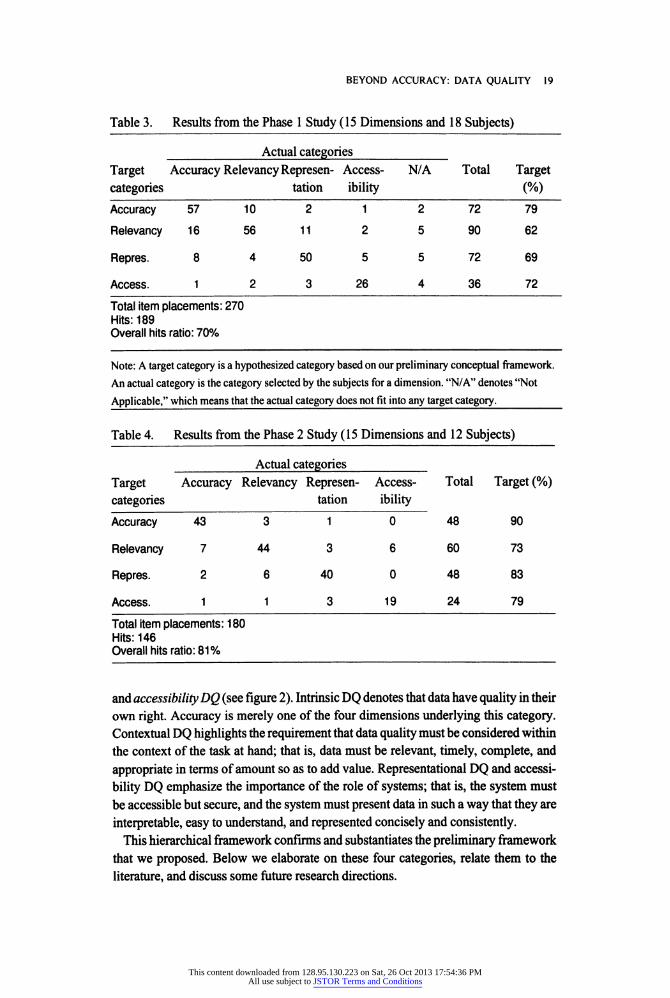
In this section, we present the results from the two-phase study. We using the adjusted target categories to tabulate the results from the phase 1 study. As shown in Table 3, the overall placement ratio of dimensions within target categories was 70 percent. This indicated that these 15 dimensions were generally being placed in the appropriate categories.
These results, together with the adjustment of dimensions within the target catego- ries, led us to refine the four target categories as follows:
1 . The extent to which data values are in conformance with the actual or true
values; 2. The extent to which data are applicable (pertinent) to the task of the data user; 3. The extent to which data are presented in an intelligible and clear manner;
and 4. The extent to which data are available or obtainable.
These four descriptions were used as the category labels for the phase 2 study. The results from the phase 2 study (Table 4) showed that the overall placement ratio of dimensions within target categories was 8 1 percent.
Toward a Hierarchical Framework of Data Quality In our sorting study, we labeled each category on the basis of our preliminary conceptual framework and our initial grouping of the dimensions. For example, we labeled as accuracy the category that includes accuracy, objectivity, believability, and
reputation. Similarly, we labeled the three other categories as relevancy, representa- tion, and accessibility. We used such a labeling so that we would not introduce any additional interpretations or biases into the sorting tasks.
However, such representative labels did not necessarily capture the essence of the
underlying dimensions as a group. For example, as a whole, the group of dimensions labeled accuracy was richer than that conveyed by the label accuracy. Thus, we reexamined the underlying dimensions confirmed for each of the four categories and picked a label that captured the essence of the entire category. For example, we relabeled accuracy as intrinsic DQ because the underlying dimensions captured the intrinsic aspect of data quality.
As a result of this reexamination, we relabeled two of the four categories. The resulting categories, therefore, are: intrinsic DQ, contextual DQ, representational DQ,
This content downloaded from 128.95.130.223 on Sat, 26 Oct 2013 17:54:36 PMAll use subject to JSTOR Terms and Conditions
BEYOND ACCURACY: DATA QUALITY 19
Table 3. Results from the Phase 1 Study (15 Dimensions and 18 Subjects)
Actual categories Target Accuracy Relevancy Represen- Access- N/A Total Target categories tation ibility (%)
Accuracy 57 10 2 1 2 72 79
Relevancy 16 56 11 2 5 90 62
Repres. 8 4 50 5 5 72 69
Access. 1 2 3 26 4 36 72
Total item placements: 270 Hits: 189 Overall hits ratio: 70%
Note: A target category is a hypothesized category based on our preliminary conceptual framework.
An actual category is the category selected by the subjects for a dimension. "N/A" denotes "Not
Applicable," which means that the actual category does not fit into any target category.
Table 4. Results from the Phase 2 Study (15 Dimensions and 12 Subjects)
Actual categories Target Accuracy Relevancy Represen- Access- Total Target (%) categories tation ibility
Accuracy 43 3 1 0 48 90
Relevancy 7 44 3 6 60 73
Repres. 2 6 40 0 48 83
Access. 1 1 3 19 24 79
Total item placements: 180 Hits: 146 Overall hits ratio: 81%
and accessibility DQ (see figure 2). Intrinsic DQ denotes that data have quality in their own right. Accuracy is merely one of the four dimensions underlying this category. Contextual DQ highlights the requirement that data quality must be considered within the context of the task at hand; that is, data must be relevant, timely, complete, and
appropriate in terms of amount so as to add value. Representational DQ and accessi- bility DQ emphasize the importance of the role of systems; that is, the system must be accessible but secure, and the system must present data in such a way that they are
interprétable, easy to understand, and represented concisely and consistently. This hierarchical framework confirms and substantiates the preliminary framework
that we proposed. Below we elaborate on these four categories, relate them to the literature, and discuss some future research directions.
This content downloaded from 128.95.130.223 on Sat, 26 Oct 2013 17:54:36 PMAll use subject to JSTOR Terms and Conditions

20 RICHARD Y. WANG AND DIANE M. STRONG
Data Quality I
I " ι ι ' I Intrinsic Contextual I Representational Accessibility
Data Quality Data Quality I Data Quality Data Quality
Believability(i) l^j
Data Quality
|| Value-added
^j Data Quality
(2)
I
j
|_g, I
Data Quality
Interpretability
Lgl (5)
Data Quality
I Believability(i) || Value-added (2) j I Interpretability (5) Accessibility (7) I Accuracy (4) Relevancy (3) Ease of understanding (6) Access security (18)1 Objectivity (8) Timeliness (9) Representational consistency (13) l^- - ^-J
Reputation (12) Completeness (10) Concise representation (ΐη LaMaaMj Appropriate amount of data (1 9) Î^^hmmmmJ
Figure 2. A Conceptual Framework of Data Quality
Intrinsic Data Quality
Intrinsic DQ includes not only accuracy and objectivity, which are evident to IS
professionals, but also believability and reputation. This suggests that, contrary to the traditional development view, data consumers also view believability and reputation as an integral part of intrinsic DQ; accuracy and objectivity alone are not sufficient for data to be considered of high quality. This is analogous to some aspects of product quality. In the product quality area, dimensions of quality emphasized by consumers are broader than those emphasized by product manufacturers. Similarly, intrinsic DQ encompasses more than the accuracy and objectivity dimensions that IS professionals strive to deliver. This finding implies that IS professionals should also ensure the
believability and reputation of data. Research on data source tagging [45, 48] is a step in this direction.
Contextual Data Quality
Some individual dimensions underlying contextual DQ were reported previously; for
example, completeness and timeliness [4]. However, contextual DQ was not explicitly recognized in the data quality literature. Our grouping of dimensions for contextual DQ revealed that data quality must be considered within the context of the task at hand. This was consistent with the literature on graphical data representation, which concluded that the quality of a graphical representation must be assessed within the context of the data consumer's task [41].
Since tasks and their contexts vary across time and data consumers, attaining high contextual data quality is a research challenge [29, 39]. One approach is to parame- terize contextual dimensions for each task so that a data consumer can specify what
type of task is being performed and the appropriate contextual parameters for that task. Below we illustrate such a research prototype.
This content downloaded from 128.95.130.223 on Sat, 26 Oct 2013 17:54:36 PMAll use subject to JSTOR Terms and Conditions

BEYOND ACCURACY: DATA QUALITY 21
During Desert Storm combat operations in the Persian Gulf, naval researchers
recognized the need to explicitly incorporate contextual DQ into information systems in order to deliver more timely and accurate information. As a result, a prototype is
being developed that will be deployed to the U.S. aircraft carriers as stand-alone image exploitation tools [33]. This prototype parameterizes contextual dimensions for each task so that a pilot or a strike planner can specify what type of task (e.g., strike plan or damage assessment) is being performed and the appropriate contextual parameters (relevant images in terms of location, currency, resolution, and target type) for that task.
Representational Data Quality
Representational DQ includes aspects related to the format of the data {concise and consistent representation) and meaning of data (interpretability and ease of under-
standing). These two aspects suggest that for data consumers to conclude that data are well represented, they must not only be concise and consistently represented, but also
interprétable and easy to understand. Issues related to meaning and format arise in database systems research in which
format is addressed as part of syntax, and meaning as part of semantic reconciliation. One focus of current research in that area is context interchange among heterogeneous database systems [36]. For example, currency figures in the context of a U.S. database are typically in dollars, whereas those in a Japanese database are likely to be in yen. This type of context belongs to the representational DQ, instead of contextual DQ, which deals with the data consumer's task.
Accessibility Data Quality
Information systems professionals understand accessibility DQ well. Our research
findings show that data consumers also recognize its importance. Our findings appear to differ from the literature that treats accessibility as distinct from information quality (see, e.g., [9]). A closer examination reveals that accessibility is presumed (i.e., perfect accessibility DQ) in earlier information quality literature because hard-copy reports were used instead of on-line data. In contrast, data consumers in our research access
computers for their information needs, and therefore, view accessibility DQ as an
important data quality aspect. However, there is little difference between treating accessibility DQ as a category of overall data quality, or separating it from other
categories of data quality. In either case, accessibility needs to be taken into account.
Summary and Conclusions
TO IMPROVE DATA QUALITY, WE NEED TO UNDERSTAND WHAT DATA QUALITY means
to data consumers (those who use data). This research develops a hierarchical framework that captures the aspects of data quality that are important to data consum- ers. Specifically, 118 data quality attributes collected from data consumers are
This content downloaded from 128.95.130.223 on Sat, 26 Oct 2013 17:54:36 PMAll use subject to JSTOR Terms and Conditions

22 RICHARD Y. WANG AND DIANE M. STRONG
consolidated into twenty dimensions, which in turn are grouped into four categories. Using this framework, information systems professionals will be able to better understand and meet their data consumers' data quality needs.
In developing this framework, we conducted a two-stage survey and a two-phase sorting study. The resulting framework has four data quality (DQ) categories: (1) intrinsic DQ consists of accuracy, objectivity, believability, and reputation; (2) con- textual DQ consists of value-added, relevancy, timeliness, completeness, and appro- priate amount of data; (3) representational DQ consists of interpretability, ease of
understanding, representational consistency, and concise representation; and (4) ac-
cessibility DQ consists of accessibility and access security. Intrinsic DQ denotes that data have quality in their own right. Contextual DQ
highlights the requirement that data quality must be considered within the context of the task at hand. Representational DQ and accessibility DQ emphasize the importance of the role of systems. These findings are consistent with our understanding that
high-quality data should be intrinsically good, contextually appropriate for the task, clearly represented, and accessible to the data consumer.
The salient feature of this research study is that quality attributes of data are collected from data consumers instead of being defined theoretically or based on researchers'
experience. Furthermore, this study provides additional evidence for a hierarchical structure of data quality dimensions. At a basic level, the justification for the frame- work is that a data quality framework does not exist and one is needed so that data
quality can be measured, analyzed, and improved in a valid way. Information systems researchers have chosen many different dependent variables for assessing information
systems in general, and data quality in particular, with little empirical or theoretical foundation for their choice. This framework provides a basis for deciding which aspects of data quality to use in any research study.
The framework is further justified by the use of well-established empirical methods in its development. Thus, we argue that the framework is methodologically sound, and that it is complete from the perspective of data consumers. Furthermore, this frame- work will be useful as a basis for measuring, analyzing, and improving data quality. While we have only anecdotal evidence to support this claim, that anecdotal evidence is strong and convincing.
This framework was used effectively in industry and government. For example, IS managers in one investment firm thought they had perfect data quality (in terms of accuracy) in their organizational databases. However, in their discussion with data consumers using this framework, they found several deficiencies: (1) additional information about data sources was needed so that data consumers could assess the reputation and believability of data; (2) data downloaded to servers from the main- frame were not sufficiently timely for some data consumers' tasks; and (3) the currency ($, £, or ¥) and unit (thousands or millions) of financial data from different servers were implicit so data consumers could not always interpret and understand these data correctly.
Based on this hierarchical framework, several research directions can be pursued. First, a questionnaire could be developed to measure perceived data quality. The data
This content downloaded from 128.95.130.223 on Sat, 26 Oct 2013 17:54:36 PMAll use subject to JSTOR Terms and Conditions

BEYOND ACCURACY: DATA QUALITY 23
quality categories and their underlying dimensions in this framework would provide the constructs to be measured. Second, methods for improving the quality of data as
perceived by data consumers could be developed. Such methods could include user
training to change the quality of data as perceived by data consumers. Third, the framework could be useful as a checklist during data requirements analysis. That is,
many of the data quality characteristics are actually system requirements or user
training requirements. Finally, since a single empirical study is never sufficient to
validate the completeness of a framework, further research is needed to apply this framework in specific work contexts.
NOTES
1 . Computerworld, September 28, 1992, p. 80-84. 2. The Wall Street Journal, May 26, 1992, p. B6. 3. We refer to the characteristics of data quality as data quality attributes or as measure-
ment items to distinguish them from data quality dimensions which result from the factor analysis throughout this section.
4. Surveys with significant missing values (nine surveys) or surveys returned by academics (fourteen surveys) were not considered viable and therefore were eliminated from our analysis.
REFERENCES
1. Arnold, S.E. Information manufacturing: the road to database quality. Database, 15, 5 (1992), 32.
2. Bailey, J.E., and Pearson, S.W. Development of a tool for measuring and analyzing computer user satisfaction. Management Science, 29, 5 (1 983), 530-545.
3. Bailou, D.P., and Pazer, H.L. Designing information systems to optimize the accuracy- timeliness tradeoff. Information Systems Research (ISR), 6, 1 (1995), 51-72.
4. Bailou, D.P., and Pazer, H.L. Modeling data and process quality in multi-input, multi- output information systems. Management Science, 31,2 (1985), 150-162.
5. Bailou, D.P., and Tayi, K.G. Methodology for allocating resources for data quality enhancement. Communications of the ACM, 32, 3 (1989), 320-329.
6. Bailou, D.P.; Wang, R.Y.; Pazer, H.; and Tayi, K.G. Modeling data manutactunng systems to determine data product quality. Total Data Quality Management (TDQM) Research Program, MIT Sloan School of Management, No. TDQM-93-O9, 1993.
7. Bodnar, G. Reliability modeling ot internal control systems. Accounting Keview, du, 4 (1975), 747-757.
8. Churchill, G.A. Marketing Research: Methodological Foundations, 5th ed. Chicago: Dryden Press, 1991.
9. Culnan, M. The dimensions of accessibility to online information: implications tor implementing office information systems. ACM Transactions on Office Information Systems, 2,2(1984), 141-150.
10. Cureton, E.E., and D'Agostino, R.B. Factor Analysis: An Applied Approach. Hillsdale, NJ: Lawrence Erlbaum, 1983.
1 1 . Cushing, B.E. A mathematical approach to the analysis and design of internal control systems. Accounting Review, 49, 1 (1974), 24-41.
12. Delone, W.H., and McLean, E.R. Information systems success: the quest for the depen- dent variable. Information Systems Research, 3, 1 (1992), 60-95.
13. Deming, E.W. Out of the Crisis. Cambridge, MA: Center for Advanced Engineering Study, MIT, 1986.
1 4. Deshpande, R. The organizational context of market research use. Journal of Marketing, 46, 4 (1992), 92-101.
This content downloaded from 128.95.130.223 on Sat, 26 Oct 2013 17:54:36 PMAll use subject to JSTOR Terms and Conditions

24 RICHARD Y. WANG AND DIANE M. STRONG
1 5. Dobyns, L., and Crawford-Mason, C. Quality or Else: The Revolution in World Business. Boston: Houehton Mifflin, 1991.
1 6. Emery, J.C. Organizational Planning and Control Systems: Theory and Technology. New York: Macmillan, 1969.
1 7. Griffin, Α., and Hauser, J.R. The voice of the customer. Marketing Science, 12, 1 (1 993), 1-27.
18. Hauser, J.R., and Clausing, D. The house of quality. Harvard Business Review, 66, 3 (1988), 63-73.
1 9. Huh, Y.U.; Keller, F.R.; Redman, T.C.; and Watkins, A.R. Data quality. Information and Software Technology, 32, 8 (1990), 559-565.
20. Ives, B.; Olson, M.H.; and Baroudi, J.J. The measurement of user information satisfac- tion. Communications of the ACM, 26, 10 (1983), 785-793.
21 . Johnson, J.R.; Leitch, R.A.; and Neter, J. Characteristics of errors in accounts receivable and inventory audits. Accounting Review, 56, 2 (1981), 270-293.
22. Juran, J.M. Juran on Leadership for Quality: An Executive Handbook. New York: The Free Press, 1989.
23. Juran, J.M., and Gryna, F.M. Quality Planning and Analysis, 2d ed. New York: McGraw- Hill, 1980.
24. Knechel, W.R. A simulation model for evaluating accounting systems reliability. Audit- ing: A Journal of Theory and Practice, 4, 2 (1985), 38-62.
25. Knechel, W.R. The use of quantitative models in the review and evaluation of internal control: a survey and review. Journal of Accounting Literature, 2 (1983), 205-219.
26. Kotier, P. Marketing Essentials. Englewood Cliffs, NJ: Prentice-Hall, 1984. 27. Kriebel, C.H. Evaluating the quality of information systems. In N. Szysperski and E.
Grochla (eds.), Design and implementation of Computer Based Information Systems. German- town, PA: Sijthtoff and Noordhoff, 1 979.
28. Laudon, K.C. Data quality and due process in large interorganizational record systems. Communications of the ACM, 29, 1 (1986), 4-11.
29. Madnick, S. Integrating information from global systems: dealing with the "on- and off-ramps" of the information superhighway. Journal of Organizational Computing, 5, 2 ( 1 995), 69-82.
30. Melone, Ν. A theoretical assessment of the user-satisfaction construct in information systems research. Management Science, 36, 1 (1990), 598-613.
3 1 . Moore, G.C., and Benbasat, I. Development of an instrument to measure the perceptions of adopting an information technology innovation. Information Systems Research, 2, 3 (1991), 192-222.
32. Morey, R.C. Estimating and improving the quality of information in the MIS. Commu- nications of the ACM, 25, 5 (1982), 337-342.
33. Page, W., and Kaomea, P. Using quality attributes to produce optimal tactical informa- tion. In Proceedings of the Fourth Annual Workshop on Information Technologies and Systems (WITS). Vancouver, British Columbia, Canada: 1994, pp. 145-154.
34. Redman, T.C. Data Quality: Management and Technology. New York: Bantam Books, 1 992. 35. Ronen, Β., and Spiegler, I. Information as inventory: a new conceptual view. Information
and Management, 21, (1991), 239-247. 36. Sciore, E.; Siegel, M.; and Rosenthal, A. Using semantic values to facilitate interoperabil-
ity among heterogeneous information systems. ACM Transactions on Database Systems, 19,2 (1994), 254-290.
37. Stevens, J. Applied multivariate statistics for the social science. Hillsdale, NJ: Lawrence Erlbaum, 1986.
38. Strong, D.M. Decision support for exception handling and quality control in office operations. Decision Support Systems, 8, 3 ( 1 992), 2 1 7-227.
39. Strong, D.M.; Lee, Y.W.; and Wang, R.Y. Data quality in context. Forthcoming, 1996. 40. Strong, D.M., and Miller, S.M. Exceptions and exception handling in computerized
information processes. ACM Transactions on Information Systems, 13, 2 (1995), 206-233. 41 . Tan, J.K., and Benbasat, I. Processing of graphical information: a decomposition taxon-
omy to match data extraction tasks and graphical representations. Information Systems Re- search, 1,4 (1990), 416^439.
This content downloaded from 128.95.130.223 on Sat, 26 Oct 2013 17:54:36 PMAll use subject to JSTOR Terms and Conditions

BEYOND ACCURACY: DATA QUALITY 25
42. Wand, Y., and Wang, R.Y. Anchoring data quality dimensions in ontological founda- tions. Communications of the ACM, forthcoming, 1 996.
43. Wang, R.Y., and Kon, H.B. Towards total data quality management (TDQM). In R.Y. Wang (ed.), Information Technology in Action: Trends and Perspectives. Englewood Cliffs, NJ: Prentice-Hall, 1993.
44. Wang, R.Y.; Kon, H.B.; and Madnick, S.E. Data quality requirements analysis and modeling. In Proceedings of the 9th International Conference on Data Engineering, Vienna, 1993, pp. 670-677. 45. Wang, R.Y.; Reddy, M.P.; and Kon, H.B. Toward quality data: an attribute-based
approach. Decision Support Systems (DSS), 13, 1995 (1995), 34^-372. 46. Wang, R.Y.; Storey, V.C.; and Firth, C.P. A framework for analysis of data quality
research. IEEE Transactions on Knowledge and Data Engineering, 7, 4 (1995), 623-640. 47. Wang, R.Y.; Strong, D.M.; and Guarascio, L.M. An empirical investigation of data
quality dimensions: a data consumer's perspective. Total Data Quality Management (TDQM) Research Program, MIT Sloan School of Management, no. TDQM-93-12, 1993.
48. Wang, Y.R., and Madnick, S.E. A polygen model for heterogeneous database systems: the source tagging perspective. In Proceedings of the 16th International Conference on Very Large Data Bases (VLDB), Brisbane, Australia, 1 990, pp. 5 1 9-538.
49. Yu, S., and Neter, J. A stochastic model of the internal control system. Journal of Accounting Research, 1, 3 (1973), 273-295.
Appendix A: First Data Quality Survey Questionnaire
Side One
Position Prior to Attending the University (circle one): Finance Marketing Operations Personnel IT Other
Industry you worked in the previous job:
When you think of data quality, what attributes other than timeliness, accuracy,
availability, and interpretability come to mind? Please list as many as possible!
PLEASE FILL OUT THIS SIDE BEFORE TURNING OVER. THANK YOU! !
Side Two
The following is a list of attributes developed for data quality:
Completeness Flexibility Adaptability Reliability Relevance Reputation Compatibility Ease of Use Ease of Update Ease of Maintenance Format Cost
Integrity Breadth Depth Correctness Well-documented Habit Variety Content
Dependability Manipulability Preciseness Redundancy Ease of Access Convenience Accessibility Data Exchange Understandable Credibility Importance Critical
After reviewing this list, do any other attributes come to mind?
THANK YOU!
This content downloaded from 128.95.130.223 on Sat, 26 Oct 2013 17:54:36 PMAll use subject to JSTOR Terms and Conditions

26 RICHARD Y. WANG AND DIANE M. STRONG
APPENDIX Β: Second Data Quality Survey Questionnaire
Thank you for participating in this study. All responses will be held in strictest confidence.
Industry: Job Title: Department: Finance Marketing/Sales Operations Human Resources Accounting
Information Systems Planning Other
The following is a list of adjectives and phrases which describes corporate data. When answering the questions, please think about the internal data such as sales, production, financial, and employee data that you work with or use to make decisions in your job.
We apologize for the tedious nature of the survey. Although the questions may seem
repetitive, your response to each question is critical to the success of the study. Please
give us the first response that comes to mind and try to use the FULL scale range available.
Section I: How important is it to you that your data are: Extremely important Important Not important at all
Accurate 1 23456789 Believable 123456789 Complete 123456789 Concise 123456789 Verifiable 123456789 Well-documented 123456789 Understandable 123456789 Well-presented 123456789 Up-to-date 123456789 Accessible 1 23456789 Adaptable 123456789 Aesthetically Pleasing 123456789 Compactly 123456789 Represented Important 123456789 Consistently Formatted 123456789 Dependable 123456789 Retrievable 123456789 Manipulable 123456789 Objective 123456789 Usable 123456789 Well-organized 123456789 Transportable/Portable 123456789 Unambiguous 1 23456789 Correct 123456789 Relevant 123456789 Flexible 123456789 Flawless 123456789 Comprehensive 1 23456789 Consistently 1 23456789 Represented Interesting 123456789
This content downloaded from 128.95.130.223 on Sat, 26 Oct 2013 17:54:36 PMAll use subject to JSTOR Terms and Conditions

BEYOND ACCURACY: DATA QUALITY 27
Unbiased 123456789 Familiar 123456789 Interprétable 123456789 Applicable 123456789 Robust 123456789 Available 123456789 Revealing 123456789 Reviewable 123456789 Expandable 123456789 Time Independent 123456789 Error-free 123456789 Efficient 123456789 User-friendly 123456789 Specific 123456789 Well-formatted 123456789 Reliable 123456789 Convenient 123456789 Extendable 123456789 Critical 123456789 Well-defined 123456789 Reusable 123456789 Clear 123456789 Cost-effective 123456789 Auditable 123456789 Precise 123456789 Readable 123456789
Section II: How important is it to you that your data can be: Extremely important Important Not important at all
Easily Aggregated 1 23456789 Easily Accessed 123456789 Easily Compared to 123456789 Past Data Easily Changed 123456789 Easily Questioned 123456789 Easily 123456789 Downloaded/Uploaded Easily Joined with 123456789 Other Data Easily Updated 123456789 Easily Understood 123456789 Easily Maintained 123456789 Easily Retrieved 123456789 Easily Customized 123456789 Easily Reproduced 123456789 Easily Traced 123456789 Easily Sorted 123456789
Section III: How important are the following to you? Extremely important Important Not important at all
Data are certified error- 1 23456789 free Data improve efficiency 1 23456789 Data give you a 123456789 competitive edge
This content downloaded from 128.95.130.223 on Sat, 26 Oct 2013 17:54:36 PMAll use subject to JSTOR Terms and Conditions

28 RICHARD Y. WANG AND DIANE M. STRONG
Data cannot be 1 23456789 accessed by competitors Data contain adequate 1 23456789 detail Data are in finalized 1 23456789 form Data contain no 1 23456789 redundancy Data are of proprietary 1 23456789 nature Data can be 1 23456789 personalized Data are not easily 123456789 corrupted Data meet all of your 123456789 requirements Data add value to your 1 23456789 operations Data are continuously 1 23456789 collected Data continuously 1 23456789 presented in same format Data are compatible 123456789 with previous data Data are not 123456789 overwhelming Data can be easily 123456789 integrated Data can be used for 123456789 multiple purposes Data are secure 1 23456789
Section IV: How important are the following to you? Extremely important Important Not important at all
The source of the data 1 23456789 is clear Errors can be easily 123456789 identified The cost of data 123456789 collection The cost of data 1 23456789 accuracy The form of 123456789 presentation The format of the data 1 23456789 The scope of 123456789 information contained in data The depth of 123456789 information contained in data The breadth of 1 23456789 information contained in data
This content downloaded from 128.95.130.223 on Sat, 26 Oct 2013 17:54:36 PMAll use subject to JSTOR Terms and Conditions

BEYOND ACCURACY: DATA QUALITY 29
Quality of resolution 123456789 The storage medium 1 23456789 The reputation of the 123456789 data source The reputation of the 123456789 data The age of the data 123456789 The amount of data 123456789 You have used the 123456789 data before Someone has clear 1 23456789 responsibility for data The data entry process 1 23456789 is self-correcting The speed of access to 1 23456789 data The speed of 123456789 operations performed on data The amount and type 123456789 of storage required You have little 123456789 extraneous data present You have a variety of 123456789 data and data sources You have optimal data 123456789 for your purpose The integrity of the datai 23456789 It is easy to tell if the 123456789 data are updated
APPENDIX C: Descriptive Statistics for Attributes Attribute No. of Mean S.D. Min Max
cases
Accurate 350 1771 1.135 i 7 Believable 348 2.707 1.927 1 9 Complete 349 3.229 1.814 1 9 Concise 348 3.994 2.016 1 9 Verifiable 348 3.224 1.854 1 9 Well-documented 349 4.123 2.087 1 9 Understandable 349 2.668 1.671 1 9 Well-presented 350 3.937 2.124 1 9 Up-to-date 350 2.963 1.732 1 9 Accessible 349 3.370 1.899 1 9 Adaptable 344 4.942 2.042 1 9 Aesthetically Pleasing 350 6.589 2.085 1 9 Compactly Represented 349 5.123 2.181 1 9 Important 335 3.824 2.138 1 9 Consistently Formatted 347 4.594 2.141 1 9 Dependable 349 2.648 1.615 1 9 Retrievable 350 3.660 1.999 1 9 Manipulable 349 4.327 2.162 1 9 Objective 345 3.551 1.963 1 9
This content downloaded from 128.95.130.223 on Sat, 26 Oct 2013 17:54:36 PMAll use subject to JSTOR Terms and Conditions

30 RICHARD Y. WANG AND DIANE M. STRONG
Data give you a 348 3.178 2.277 1 9
competitive edge Data cannot be accessed 347 4.450 2.760 1 9
by competitors Data contain adequate 348 3.057 1.378 1 8 detail Data are in finalized form 348 5.575 2.201 1 9 Data contain no 344 6.279 2.026 1 9
redundancy Data are of proprietary 346 5.867 2.612 1 9 nature Data can be personalized 345 5.759 2.390 1 9 Data are not easily 344 3.741 2.162 1 9
corrupted Data meet all of your 348 3.664 2.123 1 9
requirements Data add value to your 349 2.479 1.708 1 9
operations Data are continuously 347 4.608 2.443 1 9 collected Data continuously 346 4.627 2.232 1 9
presented in same format Data are compatible with 348 3.578 1.893 1 9
previous data Data are not overwhelming 347 4.037 2.306 1 9 Data can be easily 348 4.086 1.896 1 9
integrated Data can be used for 347 4.565 2.304 1 9
multiple purposes Data are secure 349 4.456 2.432 1 9 The source of the data is 350 3.291 1.836 1 9 clear Errors can be easily 347 3.089 1.584 1 8 identified The cost of data collection 349 4.304 2.180 1 9 The cost of data accuracy 348 4.261 2.169 1 9 The form of presentation 349 4.794 1.994 1 9 The format of the data 348 4.917 2.045 1 9 The scope of information 345 3.838 1.726 1 9 contained in data The depth of information 345 3.922 1.835 1 9 contained in data The breadth of information 344 3.872 1.796 1 9 contained in data Quality of resolution 329 5.024 1.995 1 9 The storage medium 348 6.534 2.148 1 9 The reputation of the data 348 4.144 2.172 1 9 source The reputation of the data 347 3.925 2.133 1 9 The age of the data 350 3.640 2.044 1 9 The amount of data 347 5.009 2.125 1 9 You have used the data 345 6.107 2.228 1 9 before Someone has clear 347 3.744 2.271 1 9 responsibility for data The data entry process is 344 4.695 2.362 1 9 self-correcting
This content downloaded from 128.95.130.223 on Sat, 26 Oct 2013 17:54:36 PMAll use subject to JSTOR Terms and Conditions

BEYOND ACCURACY: DATA QUALITY 31
The speed of access to 347 3.934 1.992 1 9 data The speed of operations 348 4.687 2.194 1 9 performed on data The amount and type of 349 6.209 2.030 1 9 storage required You have little extraneous 345 5.797 2.003 1 9 data present You have a variety of data 344 4.712 2.234 1 9 and data sources You have optimal data for 345 3.554 2.126 1 9 your purpose The integrity of the data 345 2.371 1.571 1 9 It is easy to tell if the data 348 3.609 1.926 1 9 are updated Easy to exchange data 346 4.945 2.311 1 9 with others Access to data can be 347 4.988 2.514 1 9 restricted
APPENDIX D: The Two-Phase Sorting Study
Dl : Instruction and Content for Phase 1
Instruction I
Group the 20 data quality dimensions into several categories (between 3 and 5) where the dimensions within each category in your opinion represent similar attributes of
high-quality data. (Note: A data quality dimension may also be isolated into its own
category if you see fit to do so.)
Example 3x5 Card
BELIEV ABILITY The extent to which data are accepted or regarded as true, real, and credible.
(1)
Content of the Remaining Nineteen 3x5 Dimension Cards
2. Value-added: The extent to which data are beneficial and provide advan-
tages from their use. 3. Relevancy: The extent to which data are applicable and helpful for the
task at hand. 4. Accuracy: The extent to which data are correct, reliable, and certified free
of error. 5. Interpretability: The extent to which data are in appropriate language
and units and the data definitions are clear.
This content downloaded from 128.95.130.223 on Sat, 26 Oct 2013 17:54:36 PMAll use subject to JSTOR Terms and Conditions

32 RICHARD Y. WANG AND DIANE M. STRONG
6. EASE OF UNDERSTANDING: The extent to which data are clear without
ambiguity and easily comprehended. 7. ACCESSIBILITY: The extent to which data are available or easily and quickly
retrievable. 8. Objectivity: The extent to which data are unbiased (unprejudiced) and
impartial. 9. TIMELINESS: The extent to which the age of the data is appropriate for the
task at hand. 10. Completeness: The extent to which data are of sufficient breadth, depth,
and scope for the task at hand. 1 1. TRACEABILITY: The extent to which data are well documented, verifiable,
and easily attributed to a source. 12. REPUTATION: The extent to which data are trusted or highly regarded in
terms of their source or content. 13. Representational consistency: The extent to which data are always
presented in the same format and are compatible with previous data. 14. Cost-effectiveness: The extent to which the cost of collecting appropri-
ate data is reasonable. 15. Ease of operation: The extent to which data are easily managed and
manipulated (i.e., updated, moved, aggregated, reproduced, customized). 16. Variety of data and data sources: The extent to which data are
available from several differing data sources. 1 7. Concise: The extent to which data are compactly represented without being
overwhelming (i.e., brief in presentation, yet complete and to the point). 1 8. Access security: The extent to which access to data can be restricted and
hence kept secure. 19. Appropriate amount of data: The extent to which the quantity or
volume of available data is appropriate. 20. Flexibility: The extent to which data are expandable, adaptable, and easily
applied to other needs.
Instruction 2
Label the categories that you have created with an overall définition (word or two/three-word phrase) that best describes/summarizes the data quality dimensions within each category.
D2: Instruction and Content for Phase 2
Instruction
Group each of the data quality dimensions into one of the following four categories. In case of conflict, choose the best- fitting category for the dimension. All dimensions must be categorized.
This content downloaded from 128.95.130.223 on Sat, 26 Oct 2013 17:54:36 PMAll use subject to JSTOR Terms and Conditions

BEYOND ACCURACY: DATA QUALITY 33
Content of the Four 3x5 Category Cards
Category J: The extent to which data values are in conformance with the actual or true values.
Category 2: The extent to which data are applicable to or pertain to the task of the data user.
Category 3: The extent to which data are presented in an intelligible and clear manner.
Category 4: The extent to which data are available or obtainable.
This content downloaded from 128.95.130.223 on Sat, 26 Oct 2013 17:54:36 PMAll use subject to JSTOR Terms and Conditions