beyond classification
TRANSCRIPT

8/8/2019 Beyond Classification
http://slidepdf.com/reader/full/beyond-classification 1/23
Beyond ClassificationBeyond ClassificationBeyond ClassificationBeyond ClassificationBeyond Classification
Rob Schapire
Princeton University[currently visiting Yahoo! Research]

8/8/2019 Beyond Classification
http://slidepdf.com/reader/full/beyond-classification 2/23
Classification and BeyondClassification and BeyondClassification and BeyondClassification and BeyondClassification and Beyond
• earlier, studied classification learning• goal: learn to classify examples into fixed set of categories• want to predict correct class as often as possible
• many applications
• however, often faced with learning problems that don’t fit thisparadigm:
• predicting real-valued quantities:
• how many times will some web page be visited?• how much will be bid on a particular advertisement?
• predicting probabilities:
• what is the probability user will click on some link?• how likely is it that some user is a spammer?

8/8/2019 Beyond Classification
http://slidepdf.com/reader/full/beyond-classification 3/23
This LectureThis LectureThis LectureThis LectureThis Lecture
• general techniques for:
•
predicting real-valued quantities — “regression”• predicting probabilities
• central, unifying idea: loss minimization
8/8/2019 Beyond Classification
http://slidepdf.com/reader/full/beyond-classification 4/23
RegressionRegressionRegressionRegressionRegression

8/8/2019 Beyond Classification
http://slidepdf.com/reader/full/beyond-classification 5/23
Example: Weather PredictionExample: Weather PredictionExample: Weather PredictionExample: Weather PredictionExample: Weather Prediction
• meteorologists A and B apply for job• to test which is better:
• ask each to predict how much it will rain• observe actual amount•
repeatpredictions actual
A B outcome
Monday 1.2 0.5 0.9
Tuesday 0.1 0.3 0.0
Wednesday 2.0 1.0 2.1
• how to judge who gave better predictions?

8/8/2019 Beyond Classification
http://slidepdf.com/reader/full/beyond-classification 6/23
Example (cont.)Example (cont.)Example (cont.)Example (cont.)Example (cont.)
• natural idea:•
measure discrepancy between predictions and outcomes• e.g., measure using absolute difference
• choose forecaster with closest predictions overall
predictions actual difference
A B outcome A B Monday 1.2 0.5 0.9 0.3 0.4
Tuesday 0.1 0.3 0.0 0.1 0.3
Wednesday 2.0 1.0 2.1 0.1 1.1
0.5 1.8
• could have measured discrepancy in other ways• e.g., difference squared
• which measure to use?
8/8/2019 Beyond Classification
http://slidepdf.com/reader/full/beyond-classification 7/23
LossLossLossLossLoss
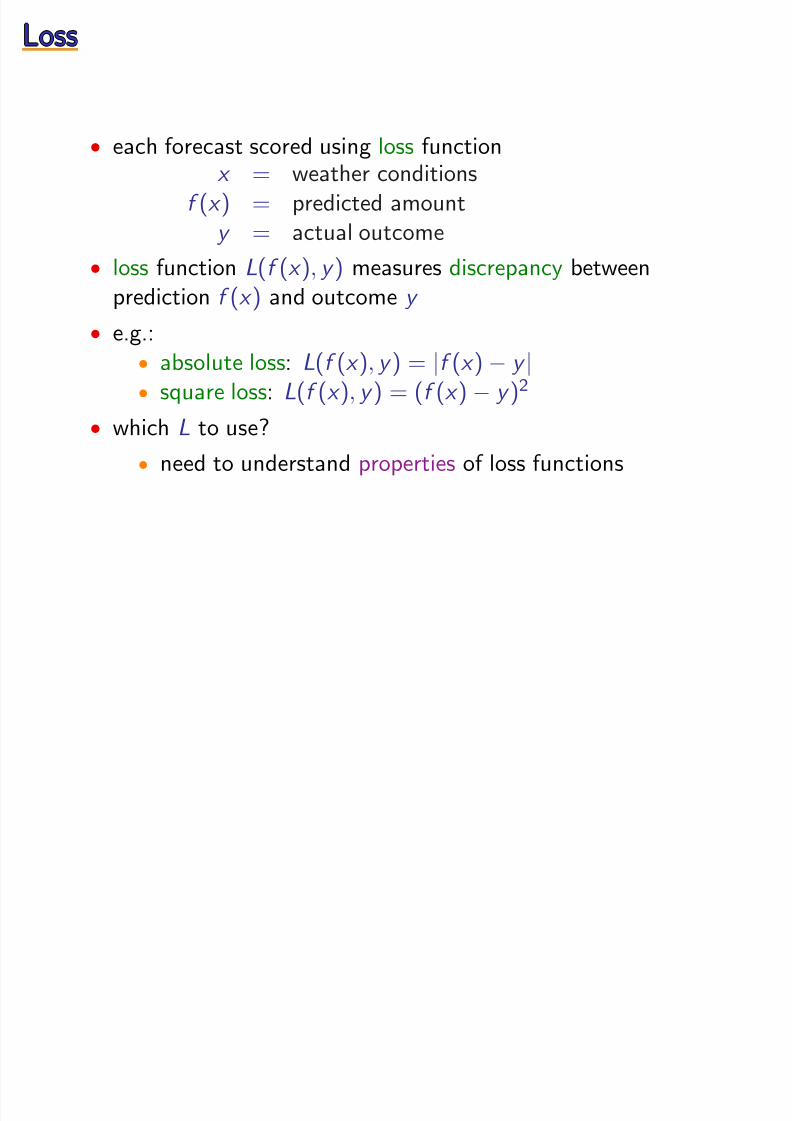
• each forecast scored using loss functionx = weather conditions
f (x ) = predicted amounty = actual outcome
• loss function L(f (x ), y ) measures discrepancy betweenprediction f (x ) and outcome y
• e.g.:• absolute loss: L(f (x ), y ) = |f (x ) − y |• square loss: L(f (x ), y ) = (f (x ) − y )2
• which L to use?
• need to understand properties of loss functions

8/8/2019 Beyond Classification
http://slidepdf.com/reader/full/beyond-classification 8/23
Square LossSquare LossSquare LossSquare LossSquare Loss
• square loss often sensible because encourages predictions closeto true expectation
• fix x
• say y random with µ = E [y ]
• predict f = f (x )
• can show:
E [L(f , y )] = E
(f − y )2
= (f − µ)2 + Var(y ) intrinsic randomness
• therefore:• minimized when f = µ• lower square loss ⇒ f closer to µ• forecaster with lowest square loss has predictions closest
to E [y |x ] on average

8/8/2019 Beyond Classification
http://slidepdf.com/reader/full/beyond-classification 9/23
Learning for RegressionLearning for RegressionLearning for RegressionLearning for RegressionLearning for Regression
• say examples (x , y ) generated at random
• expected square loss
E [Lf ] ≡ E
(f (x ) − y )2
minimized when f (x ) = E [y |x ] for all x
• how to minimize from training data (x 1, y 1), . . . , (x m, y m)?
• attempt to find f with minimum empirical loss:
E [Lf ] ≡1
m
mi =1
(f (x i ) − y i )2
• if ∀f : E [Lf ] ≈ E [Lf ] then f that minimizes E [Lf ] willapproximately minimize E [Lf ]
• to be possible, need to choose f of restricted form to avoid
overfitting

8/8/2019 Beyond Classification
http://slidepdf.com/reader/full/beyond-classification 10/23
Linear RegressionLinear RegressionLinear RegressionLinear RegressionLinear Regression
• e.g., if x ∈ Rn, could choose to use linear predictors of form
f (x) = w · x
• then need to find w to minimize
1m
mi =1
(w · xi − y i )2
• can solve in closed form
• can also minimize on-line (e.g. using gradient descent)
8/8/2019 Beyond Classification
http://slidepdf.com/reader/full/beyond-classification 11/23
RegularizationRegularizationRegularizationRegularizationRegularization
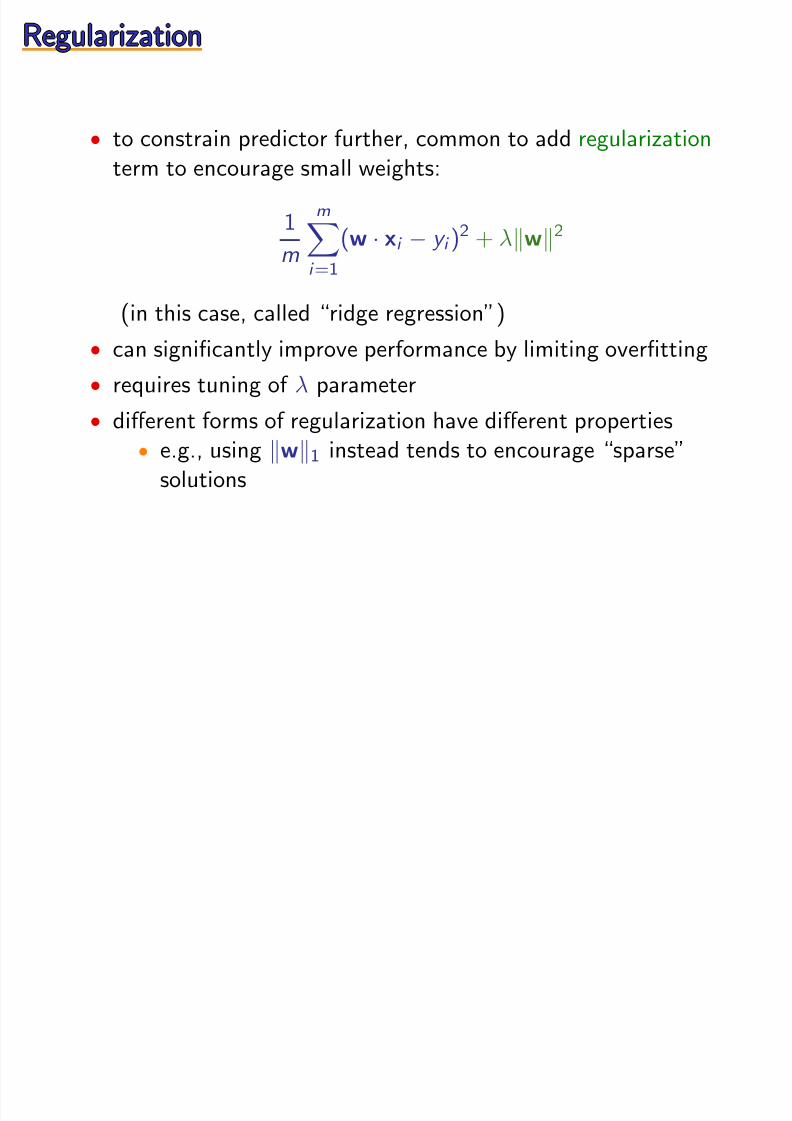
• to constrain predictor further, common to add regularizationterm to encourage small weights:
1
m
mi =1
(w · xi − y i )2 + λw2
(in this case, called “ridge regression”)
• can significantly improve performance by limiting overfitting
• requires tuning of λ parameter
• different forms of regularization have different properties• e.g., using w1 instead tends to encourage “sparse”
solutions
8/8/2019 Beyond Classification
http://slidepdf.com/reader/full/beyond-classification 12/23
Absolute LossAbsolute LossAbsolute LossAbsolute LossAbsolute Loss
• what if instead use L(f (x ), y ) = |f (x ) − y | ?
• can show E [|f (x ) − y |] minimized when
f (x ) = median of y ’s conditional distribution, given x
• potentially, quite different behavior from square loss
• not used so often

8/8/2019 Beyond Classification
http://slidepdf.com/reader/full/beyond-classification 13/23
Summary so farSummary so farSummary so farSummary so farSummary so far
• can handle prediction of real-valued outcomes by:
• choosing a loss function• computing a prediction rule with minimum loss on
training data
• different loss functions have different properties:• square loss estimates conditional mean• absolute loss estimates conditional median
• what if goal is to estimate entire conditional distribution of y
given x?

8/8/2019 Beyond Classification
http://slidepdf.com/reader/full/beyond-classification 14/23
Estimating ProbabilitiesEstimating ProbabilitiesEstimating ProbabilitiesEstimating ProbabilitiesEstimating Probabilities

8/8/2019 Beyond Classification
http://slidepdf.com/reader/full/beyond-classification 15/23

8/8/2019 Beyond Classification
http://slidepdf.com/reader/full/beyond-classification 16/23
Plausible ApproachesPlausible ApproachesPlausible ApproachesPlausible ApproachesPlausible Approaches
• similar to classification• but goal now is to predict probability of class
• could reduce to regression:
y = 1 if rain0 if no-rain
• minimize square loss to estimate
E [y |x ] = Pr[y = 1|x ] = Pr[rain|x ]
• reasonable, though somewhat awkward and unnatural(especially when more than two possible outcomes)

8/8/2019 Beyond Classification
http://slidepdf.com/reader/full/beyond-classification 17/23
Different Approach: Maximum LikelihoodDifferent Approach: Maximum LikelihoodDifferent Approach: Maximum LikelihoodDifferent Approach: Maximum LikelihoodDifferent Approach: Maximum Likelihood
• each forecaster predicting distribution over set of outcomes
y ∈ {rain, no-rain} for given x • can compute probability of observed outcomes according to
each forecaster — “likelihood”
predictions actual likelihood
A B outcome A B
Monday 60% 80% rain 0.6 0.8
Tuesday 20% 70% no-rain 0.8 0.3
Wednesday 90% 50% no-rain 0.1 0.5
likelihood(A) = .6 × .8 × .1likelihood(B ) = .8 × .3 × .5
• intuitively, higher likelihood ⇒ better fit of estimatedprobabilities to observations
• so: choose maximum-likelihood forecaster
L L
8/8/2019 Beyond Classification
http://slidepdf.com/reader/full/beyond-classification 18/23
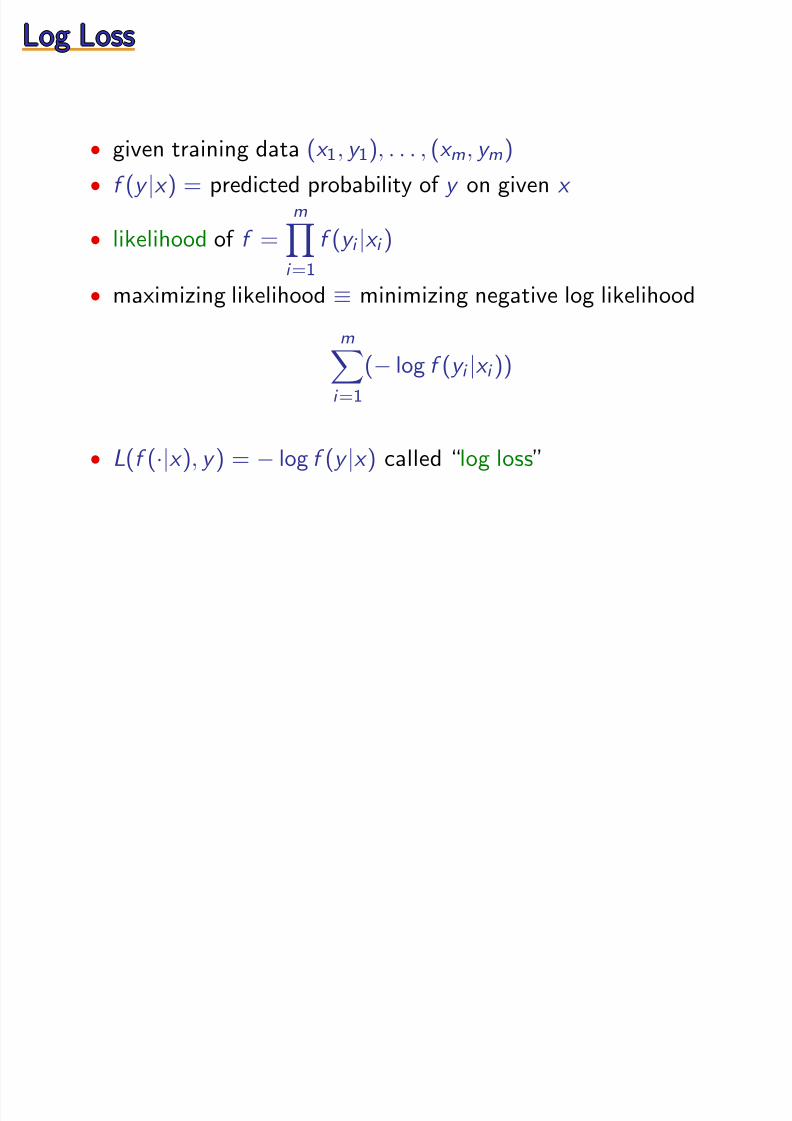
Log LossLog LossLog LossLog LossLog Loss
• given training data (x 1, y 1), . . . , (x m, y m)
• f (y |x ) = predicted probability of y on given x
• likelihood of f =m
i =1
f (y i |x i )
• maximizing likelihood ≡ minimizing negative log likelihood
mi =1
(− log f (y i |x i ))
• L(f (·|x ), y ) = − log f (y |x ) called “log loss”
E i i P b bili iE i i P b bili iE i i P b bili iE P b b lE i i P b bili i

8/8/2019 Beyond Classification
http://slidepdf.com/reader/full/beyond-classification 19/23
Estimating ProbabilitiesEstimating ProbabilitiesEstimating ProbabilitiesEstimating ProbabilitiesEstimating Probabilities
• Pr[y |x ] = true probability of y given x
• can prove: E [− log f (y |x )] minimized when f (y |x ) = Pr[y |x ]
• more generally,
E [− log f (y |x )] = (average distance between f (·|x ) and Pr[·|x ])+(intrinsic uncertainty of Pr[·|x ])
• so: minimizing log loss encourages choice of predictor close totrue conditional probabilities

8/8/2019 Beyond Classification
http://slidepdf.com/reader/full/beyond-classification 20/23
L L d S LL L d S LL L d S LL L d S LL L d S L

8/8/2019 Beyond Classification
http://slidepdf.com/reader/full/beyond-classification 21/23
Log Loss and Square LossLog Loss and Square LossLog Loss and Square LossLog Loss and Square LossLog Loss and Square Loss
• e.g.: if x ∈ Rn, y ∈ R, can take f (y |x ) to be gaussian with
mean w · x and fixed variance
• then minimizing log loss ≡ linear regression• general: square loss ≡ log loss with gaussian conditional
probability distributions (and fixed variance)
Cl ifi ti d L Mi i i tiCl ifi ti d L Mi i i tiCl ssifi ti d L ss Mi i i tiCl ifi ti d L Mi i i tiCl ifi ti d L Mi i i ti
8/8/2019 Beyond Classification
http://slidepdf.com/reader/full/beyond-classification 22/23
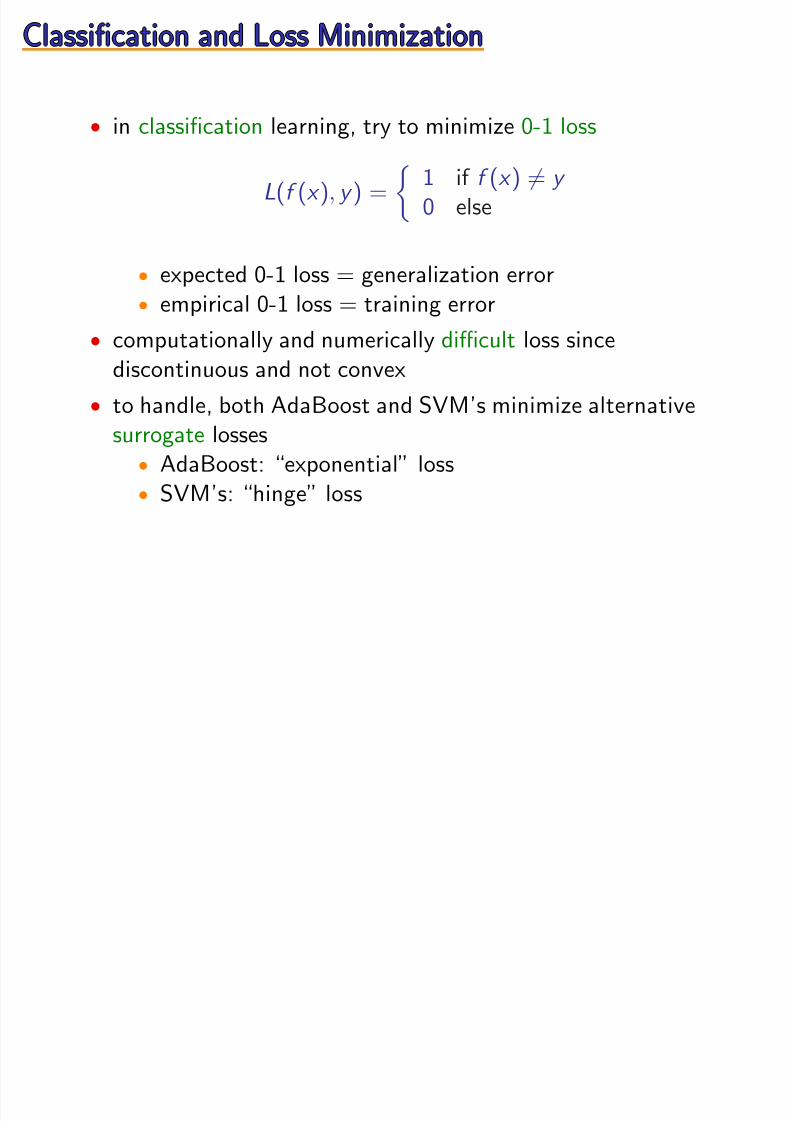
Classification and Loss MinimizationClassification and Loss MinimizationClassification and Loss MinimizationClassification and Loss MinimizationClassification and Loss Minimization
• in classification learning, try to minimize 0-1 loss
L(f (x ), y ) =
1 if f (x ) = y
0 else
•
expected 0-1 loss = generalization error• empirical 0-1 loss = training error
• computationally and numerically difficult loss sincediscontinuous and not convex
• to handle, both AdaBoost and SVM’s minimize alternativesurrogate losses
• AdaBoost: “exponential” loss• SVM’s: “hinge” loss
S aS aSummarySS a

8/8/2019 Beyond Classification
http://slidepdf.com/reader/full/beyond-classification 23/23
SummarySummarySummarySummarySummary
• much of learning can be viewed simply as loss minimization
• different losses have different properties and purposes
• regression (real-valued labels):
• use square loss to estimate conditional mean• use absolute loss to estimate conditional median
• estimating conditional probabilities:
• use log loss (≡ maximum likelihood)
• classification:
• use 0/1-loss (or surrogate)• provides unified and flexible means of algorithm design