beyond traditional asset...
TRANSCRIPT
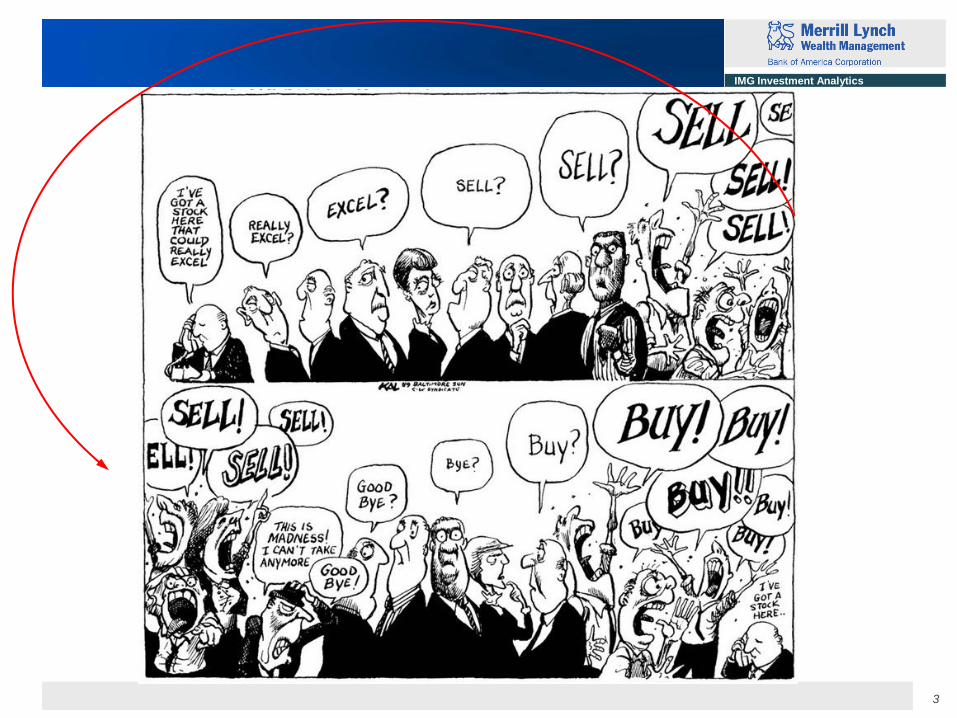
IMG Investment Analytics
Beyond Traditional Asset Allocation Himanshu Almadi Director, Investment Analytics Merrill Lynch Wealth Management April 30, 2012
This material is provided for information purposes only and does not constitute an offer to purchase any security
or investment or a solicitation of investment advice. An offer of interests in any particular investment can only be
made pursuant to the relevant offering documents which contain important information concerning risk factors,
performance and other material aspects of the investment and must be carefully read before any decision to invest
is made.
2
IMG Investment Analytics
This presentation is provided for information and educational purposes only. The opinions and views expressed do
not necessarily reflect the opinions and views of Bank of America or any of its affiliates. Any assumptions, opinions
and estimates are as of the date of this material and are subject to change without notice. Past performance does
not guarantee future results. The information contained in this material does not constitute advice on the tax
consequences of making any particular investment decision. This material does not take into account a client’s
particular investment objectives, financial situations or needs and is not intended as a recommendation, offer or
solicitation for the purchase or sale of any security, financial instrument or strategy. Before acting on any
recommendation, clients should consider whether it is suitable for their particular circumstances and, if necessary,
seek professional advice.
Alternative Investments are speculative and involve a high degree of risk. An investor could lose all or a substantial
amount of his or her investment. Interests in funds may be illiquid and subject to restrictions on transferring fund
investments. Funds may be leveraged and performance may be volatile. Funds are subject to substantial fees and
expenses which may offset any trading profits.
No part of this material may be (i) copied, photocopied, or duplicated in any form, by any means, or (ii) distributed to
any person that is not an employee, officer, director, or authorized agent of the recipient, without prior written
consent from Merrill Lynch Wealth Management.
Merrill Lynch Wealth Management makes available products and services offered by Merrill Lynch, Pierce, Fenner
& Smith Incorporated (MLPF&S) and other subsidiaries of Bank of America Corporation.
Investment products:
MLPF&S is a registered broker-dealer, a registered investment adviser and Member SIPC
© 2012 Bank of America Corporation. All Rights Reserved.
Are Not FDIC Insured Are Not Bank Guaranteed May Lose Value
3
IMG Investment Analytics
4
IMG Investment Analytics
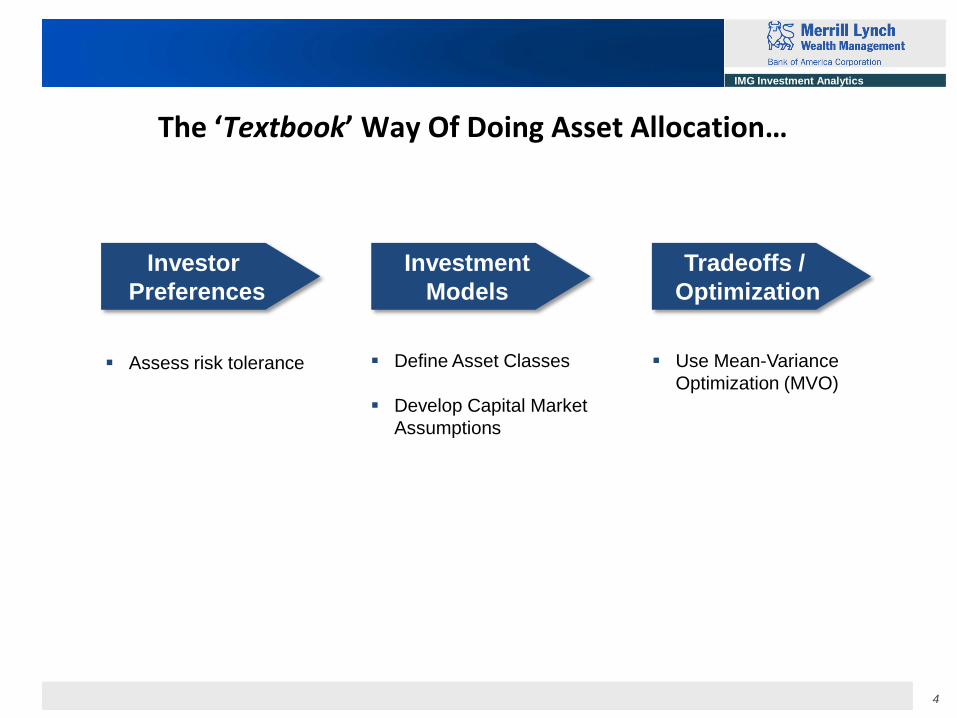
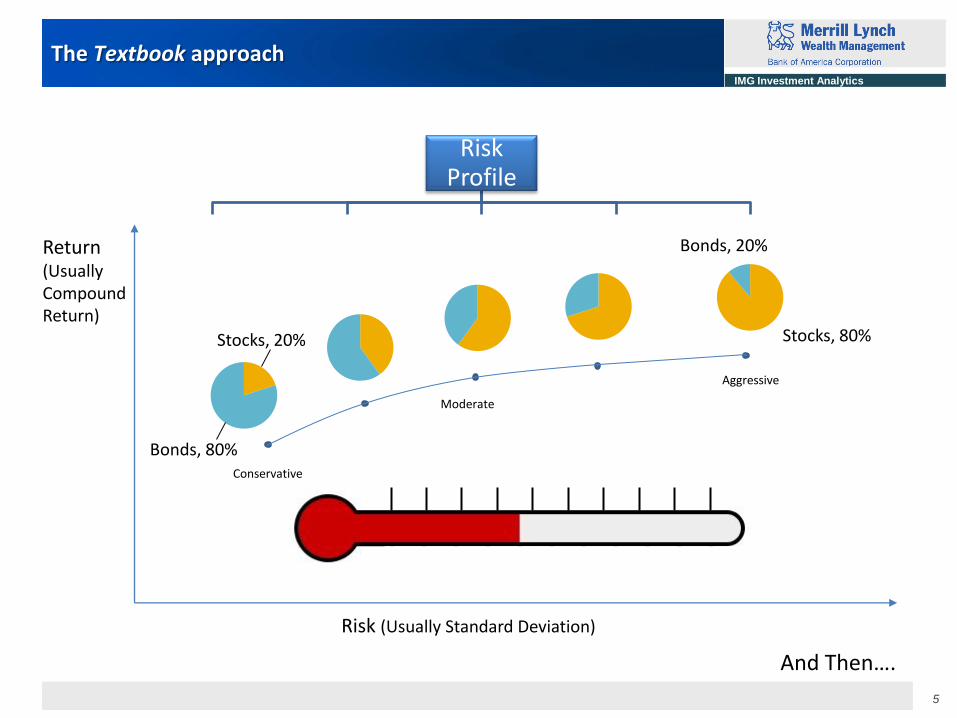
The ‘Textbook’ Way Of Doing Asset Allocation…
Assess risk tolerance
Define Asset Classes
Develop Capital Market
Assumptions
Use Mean-Variance
Optimization (MVO)
Investor
Preferences
Investment
Models
Tradeoffs /
Optimization
5
IMG Investment Analytics
The Textbook approach
Risk (Usually Standard Deviation)
Return (Usually Compound Return)
Stocks, 20%
Bonds, 80% Conservative
Moderate
Aggressive
Risk Profile
Stocks, 80%
Bonds, 20%
And Then….
6
IMG Investment Analytics
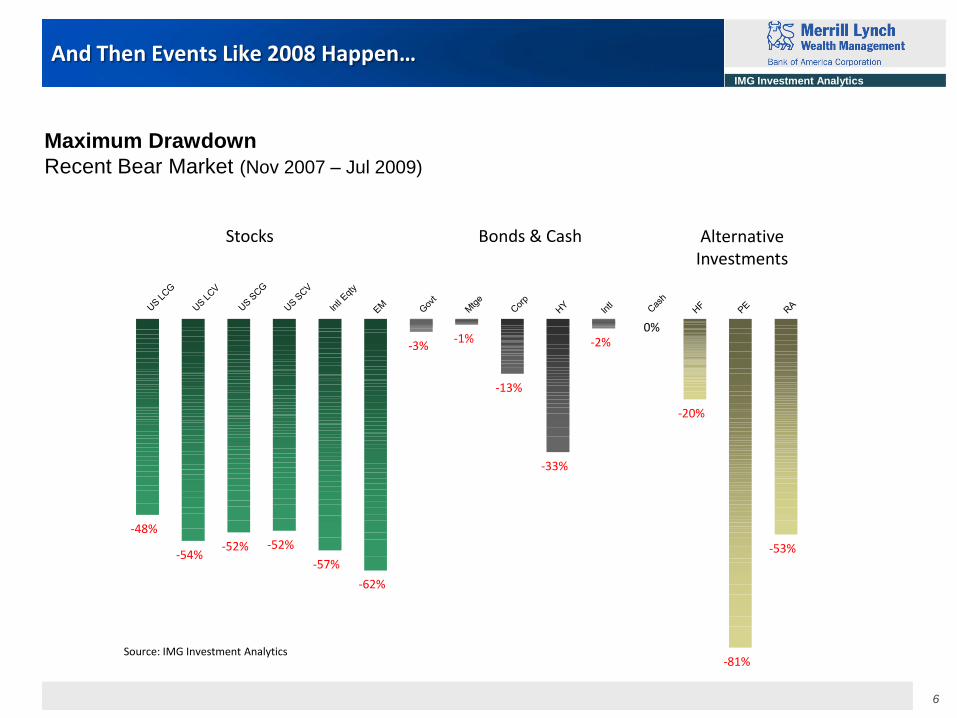
Stocks Bonds & Cash Alternative Investments
-48%
-54% -52% -52%
-57%
-62%
-3% -1%
-13%
-33%
-2%
-20%
-81%
-53%
0%
And Then Events Like 2008 Happen…
Maximum Drawdown
Recent Bear Market (Nov 2007 – Jul 2009)
Source: IMG Investment Analytics

7
IMG Investment Analytics
What Investors Really Want…
8
IMG Investment Analytics
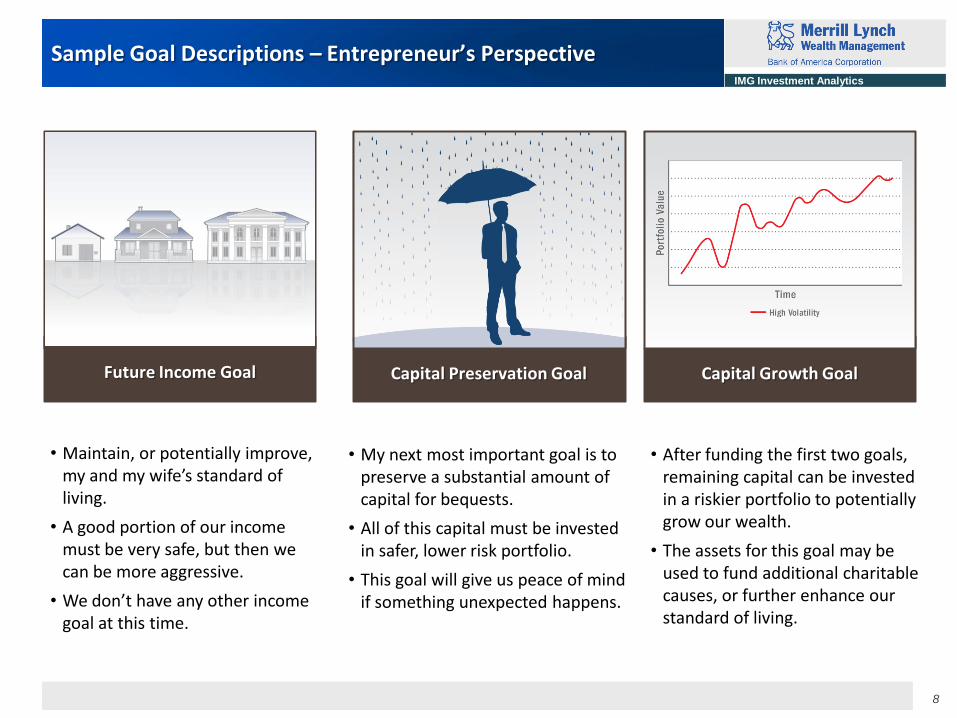
Sample Goal Descriptions – Entrepreneur’s Perspective
• Maintain, or potentially improve, my and my wife’s standard of living.
• A good portion of our income must be very safe, but then we can be more aggressive.
• We don’t have any other income goal at this time.
• My next most important goal is to preserve a substantial amount of capital for bequests.
• All of this capital must be invested in safer, lower risk portfolio.
• This goal will give us peace of mind if something unexpected happens.
• After funding the first two goals, remaining capital can be invested in a riskier portfolio to potentially grow our wealth.
• The assets for this goal may be used to fund additional charitable causes, or further enhance our standard of living.
Capital Preservation Goal Future Income Goal Capital Growth Goal Future Income Goal
9
IMG Investment Analytics
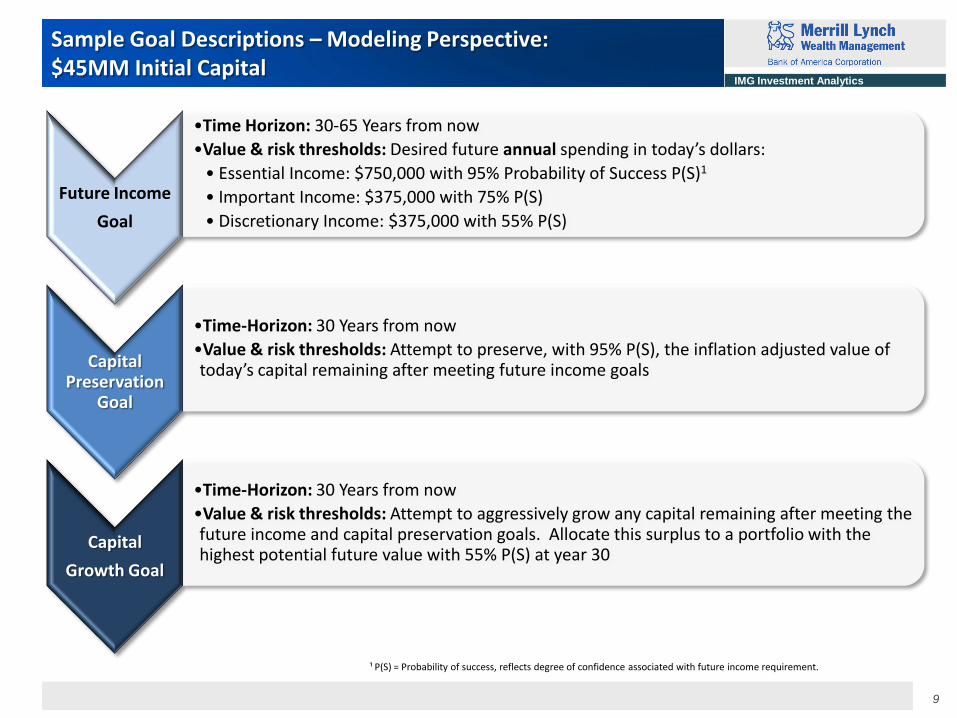
Sample Goal Descriptions – Modeling Perspective: $45MM Initial Capital
Future Income
Goal
•Time Horizon: 30-65 Years from now
•Value & risk thresholds: Desired future annual spending in today’s dollars:
• Essential Income: $750,000 with 95% Probability of Success P(S)1
• Important Income: $375,000 with 75% P(S)
• Discretionary Income: $375,000 with 55% P(S)
Capital Preservation
Goal
•Time-Horizon: 30 Years from now
•Value & risk thresholds: Attempt to preserve, with 95% P(S), the inflation adjusted value of today’s capital remaining after meeting future income goals
Capital
Growth Goal
•Time-Horizon: 30 Years from now
•Value & risk thresholds: Attempt to aggressively grow any capital remaining after meeting the future income and capital preservation goals. Allocate this surplus to a portfolio with the highest potential future value with 55% P(S) at year 30
¹ P(S) = Probability of success, reflects degree of confidence associated with future income requirement.
10
IMG Investment Analytics
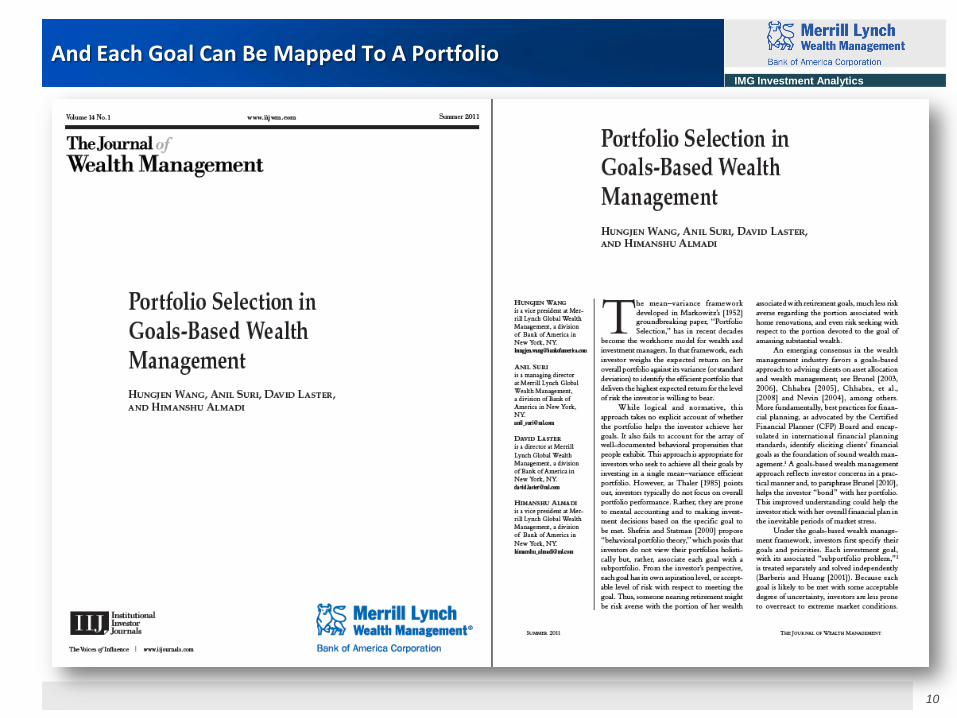
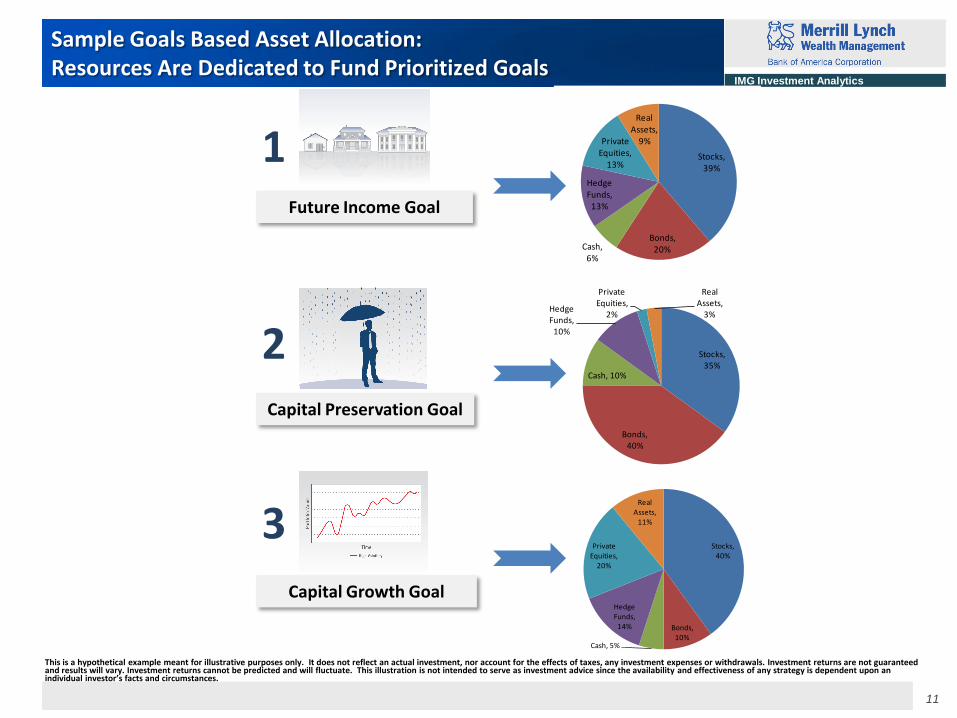
And Each Goal Can Be Mapped To A Portfolio
11
IMG Investment Analytics
Stocks, 40%
Bonds, 10%
Cash, 5%
Hedge Funds,
14%
Private Equities,
20%
Real Assets,
11%
Stocks, 35%
Bonds, 40%
Cash, 10%
Hedge Funds,
10%
Private Equities,
2%
Real Assets,
3%
Sample Goals Based Asset Allocation: Resources Are Dedicated to Fund Prioritized Goals
Future Income Goal
Capital Preservation Goal
Capital Growth Goal
Stocks, 39%
Bonds, 20%Cash,
6%
Hedge Funds,
13%
Private Equities,
13%
Real Assets,
9%1
2
3
This is a hypothetical example meant for illustrative purposes only. It does not reflect an actual investment, nor account for the effects of taxes, any investment expenses or withdrawals. Investment returns are not guaranteed and results will vary. Investment returns cannot be predicted and will fluctuate. This illustration is not intended to serve as investment advice since the availability and effectiveness of any strategy is dependent upon an individual investor’s facts and circumstances.
12
IMG Investment Analytics
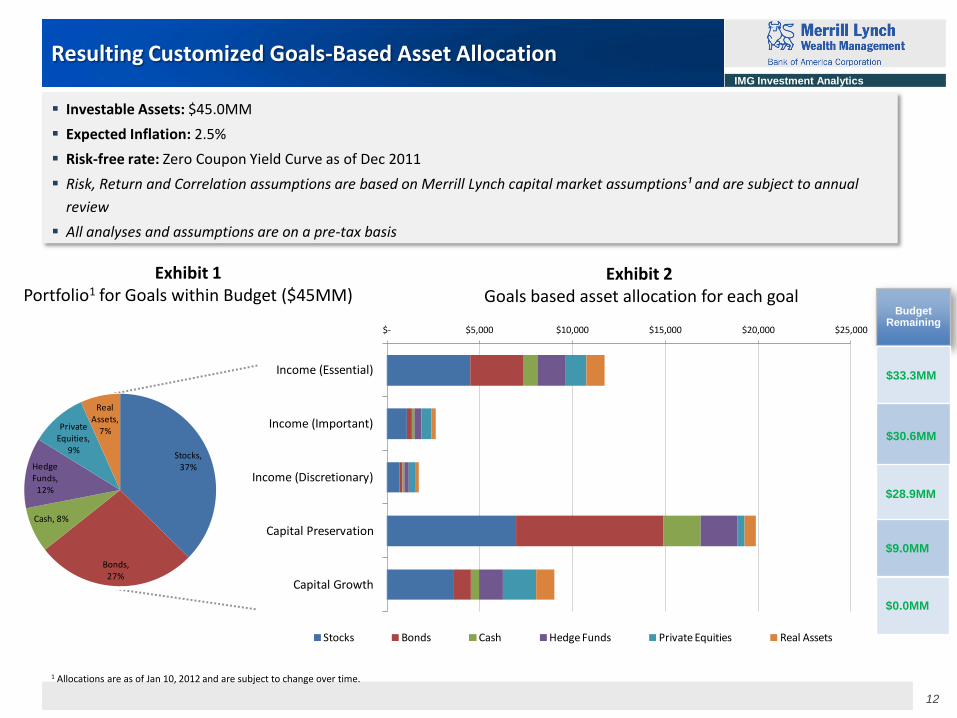
$- $5,000 $10,000 $15,000 $20,000 $25,000
Income (Essential)
Income (Important)
Income (Discretionary)
Capital Preservation
Capital Growth
Stocks Bonds Cash Hedge Funds Private Equities Real Assets
Resulting Customized Goals-Based Asset Allocation
1 Allocations are as of Jan 10, 2012 and are subject to change over time.
Exhibit 2 Goals based asset allocation for each goal
Exhibit 1 Portfolio1 for Goals within Budget ($45MM)
Budget Remaining
$33.3MM
$30.6MM
$28.9MM
$9.0MM
$0.0MM
Investable Assets: $45.0MM
Expected Inflation: 2.5%
Risk-free rate: Zero Coupon Yield Curve as of Dec 2011
Risk, Return and Correlation assumptions are based on Merrill Lynch capital market assumptions¹ and are subject to annual
review
All analyses and assumptions are on a pre-tax basis
Stocks, 37%
Bonds, 27%
Cash, 8%
Hedge Funds,
12%
Private Equities,
9%
Real Assets,
7%
13
IMG Investment Analytics
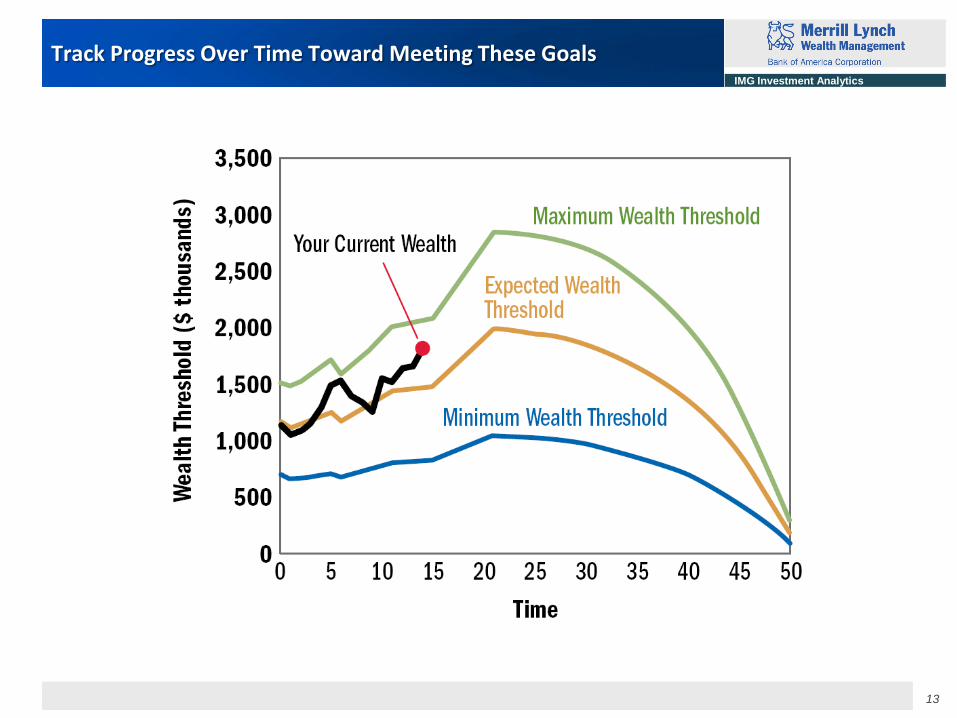
Track Progress Over Time Toward Meeting These Goals
14
IMG Investment Analytics
9
6 5
6
0
2
4
6
8
10
1995 2000 2005 2010
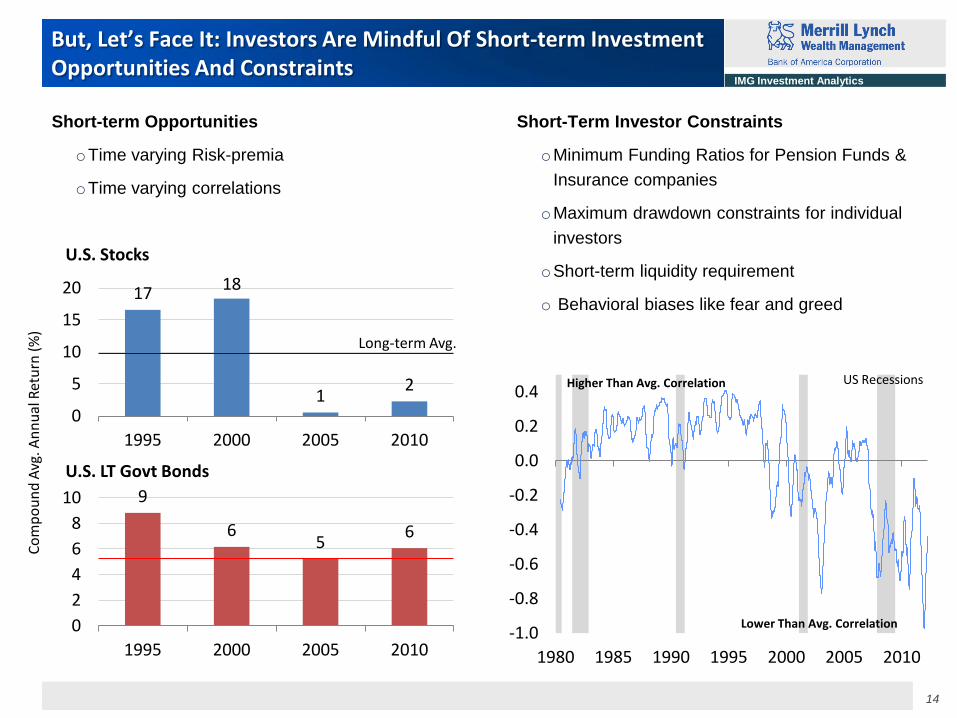
But, Let’s Face It: Investors Are Mindful Of Short-term Investment Opportunities And Constraints
Short-term Opportunities
oTime varying Risk-premia
oTime varying correlations
Short-Term Investor Constraints
oMinimum Funding Ratios for Pension Funds &
Insurance companies
oMaximum drawdown constraints for individual
investors
oShort-term liquidity requirement
o Behavioral biases like fear and greed
17 18
1 2
0
5
10
15
20
1995 2000 2005 2010
U.S. Stocks
Co
mp
ou
nd
Avg
. An
nu
al R
etu
rn (
%)
U.S. LT Govt Bonds
Long-term Avg.
US Recessions
-1.0
-0.8
-0.6
-0.4
-0.2
0.0
0.2
0.4
1980 1985 1990 1995 2000 2005 2010
Higher Than Avg. Correlation
Lower Than Avg. Correlation
15
IMG Investment Analytics
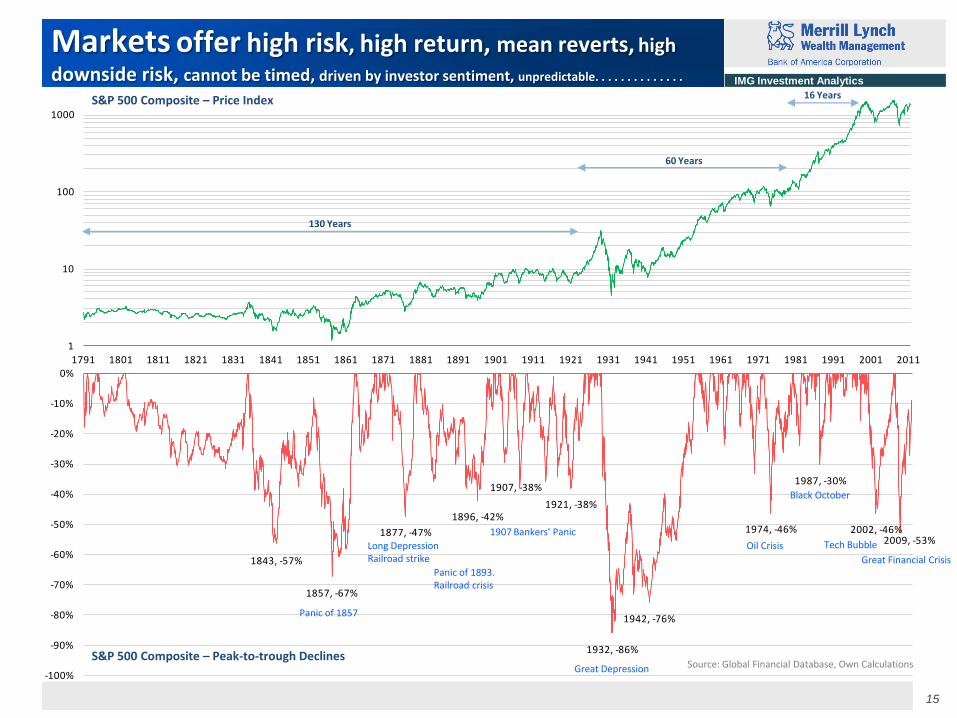
Markets offer high risk, high return, mean reverts, high
downside risk, cannot be timed, driven by investor sentiment, unpredictable. . . . . . . . . . . . . .
1
10
100
1000
10000
1791 1801 1811 1821 1831 1841 1851 1861 1871 1881 1891 1901 1911 1921 1931 1941 1951 1961 1971 1981 1991 2001 2011
1843, -57%
1857, -67%
1877, -47%
1896, -42%
1907, -38%
1921, -38%
1932, -86%
1942, -76%
1974, -46%
1987, -30%
2002, -46%2009, -53%
-100%
-90%
-80%
-70%
-60%
-50%
-40%
-30%
-20%
-10%
0%
1791 1801 1811 1821 1831 1841 1851 1861 1871 1881 1891 1901 1911 1921 1931 1941 1951 1961 1971 1981 1991 2001 2011
S&P 500 Composite – Price Index
S&P 500 Composite – Peak-to-trough Declines Source: Global Financial Database, Own Calculations
130 Years
60 Years
16 Years
Oil Crisis
Black October
Tech Bubble
Great Financial Crisis
Great Depression
1907 Bankers' Panic
Panic of 1857
Long Depression Railroad strike
Panic of 1893. Railroad crisis
16
IMG Investment Analytics
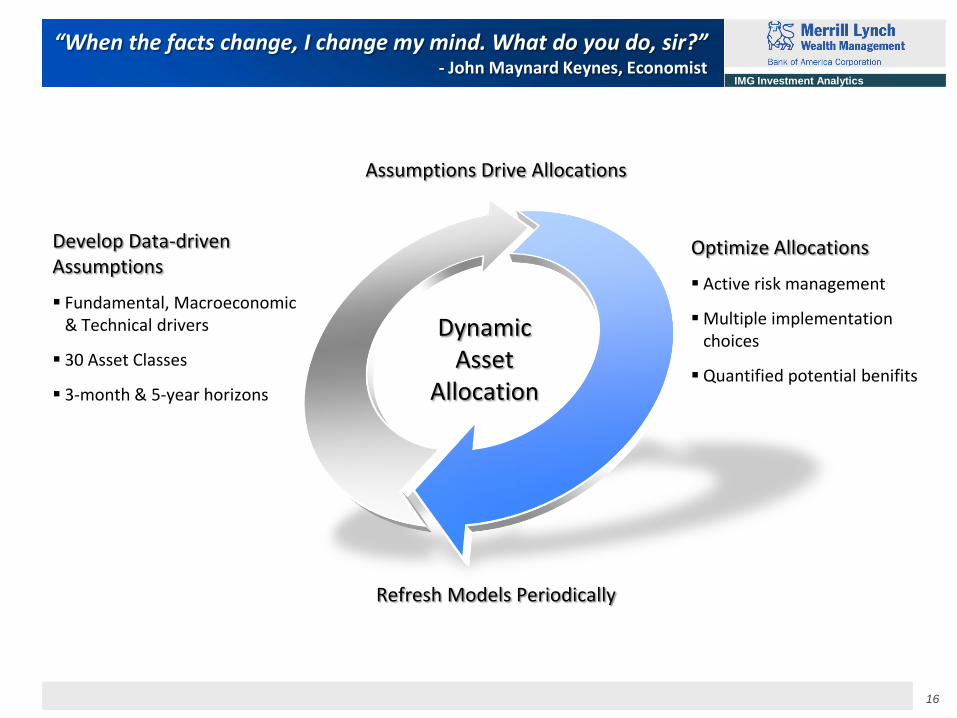
“When the facts change, I change my mind. What do you do, sir?” - John Maynard Keynes, Economist
Develop Data-driven Assumptions
Fundamental, Macroeconomic & Technical drivers
30 Asset Classes
3-month & 5-year horizons
Optimize Allocations
Active risk management
Multiple implementation choices
Quantified potential benifits
Refresh Models Periodically
Assumptions Drive Allocations
Dynamic Asset
Allocation
17
IMG Investment Analytics
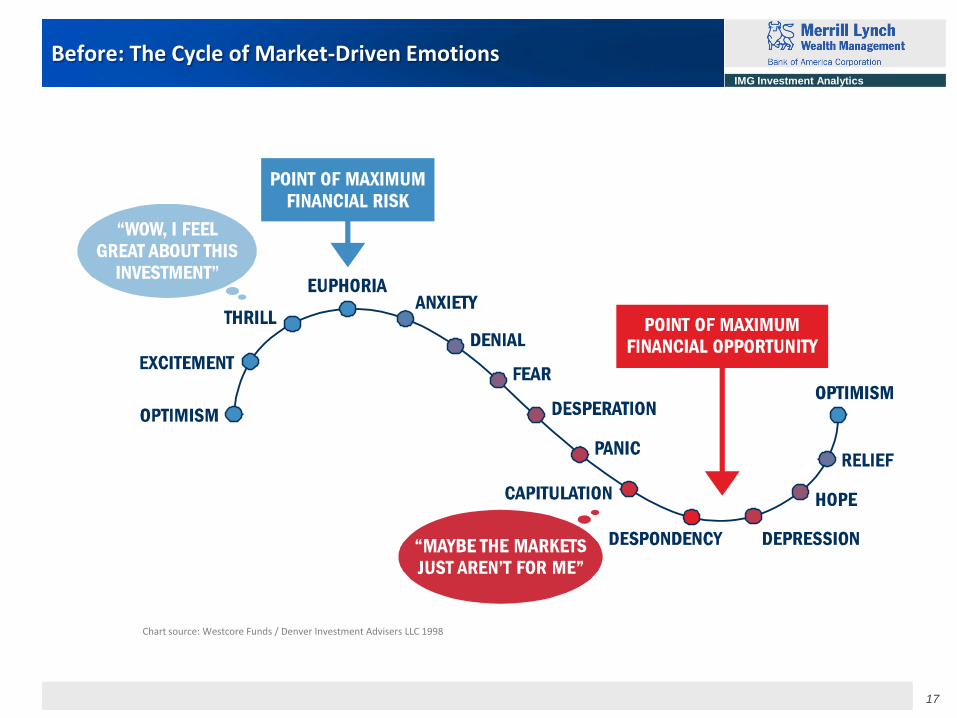
Before: The Cycle of Market-Driven Emotions
Chart source: Westcore Funds / Denver Investment Advisers LLC 1998
18
IMG Investment Analytics
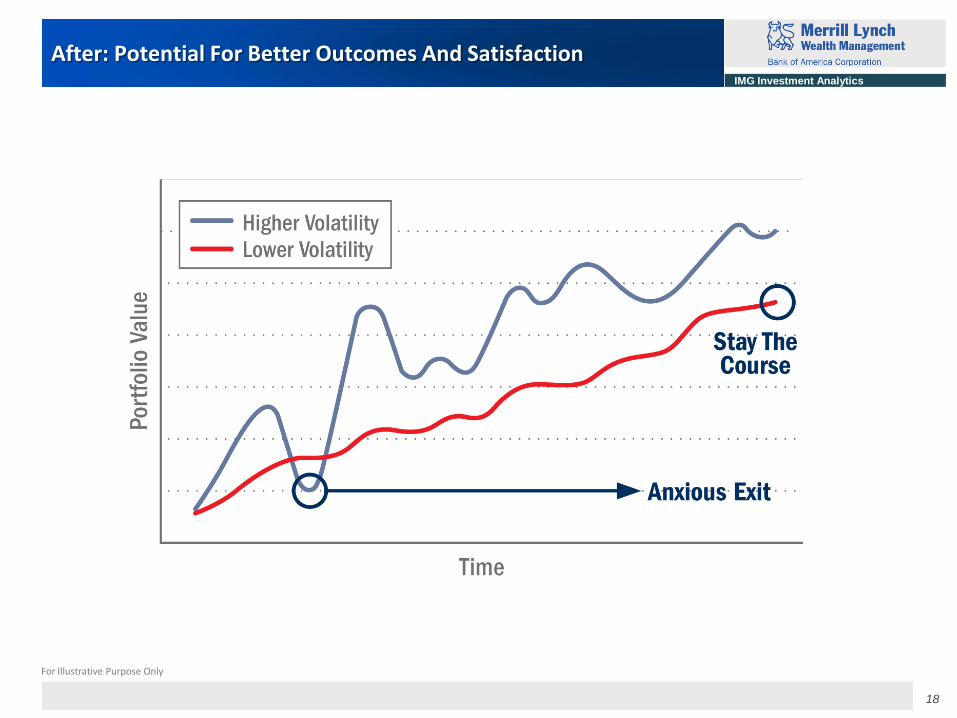
After: Potential For Better Outcomes And Satisfaction
For Illustrative Purpose Only
19
IMG Investment Analytics
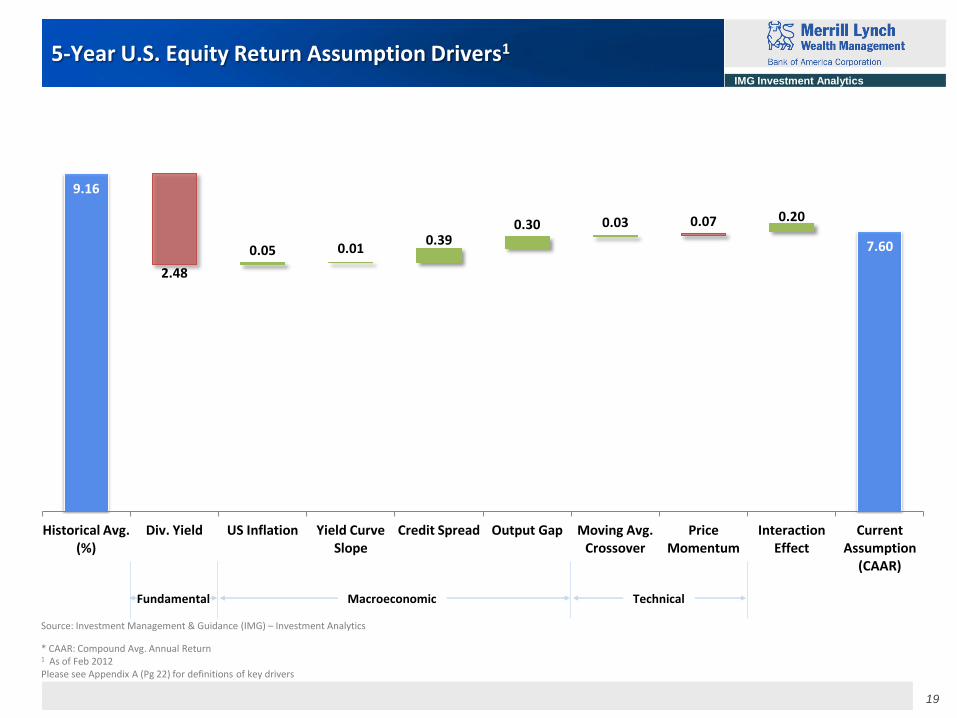
5-Year U.S. Equity Return Assumption Drivers1
9.16
7.60
2.48
0.07
0.05 0.01 0.39
0.30 0.03 0.20
Historical Avg. (%)
Div. Yield US Inflation Yield Curve Slope
Credit Spread Output Gap Moving Avg. Crossover
Price Momentum
Interaction Effect
Current Assumption
(CAAR)
Fundamental Macroeconomic Technical
* CAAR: Compound Avg. Annual Return
1 As of Feb 2012 Please see Appendix A (Pg 22) for definitions of key drivers
Source: Investment Management & Guidance (IMG) – Investment Analytics
20
IMG Investment Analytics
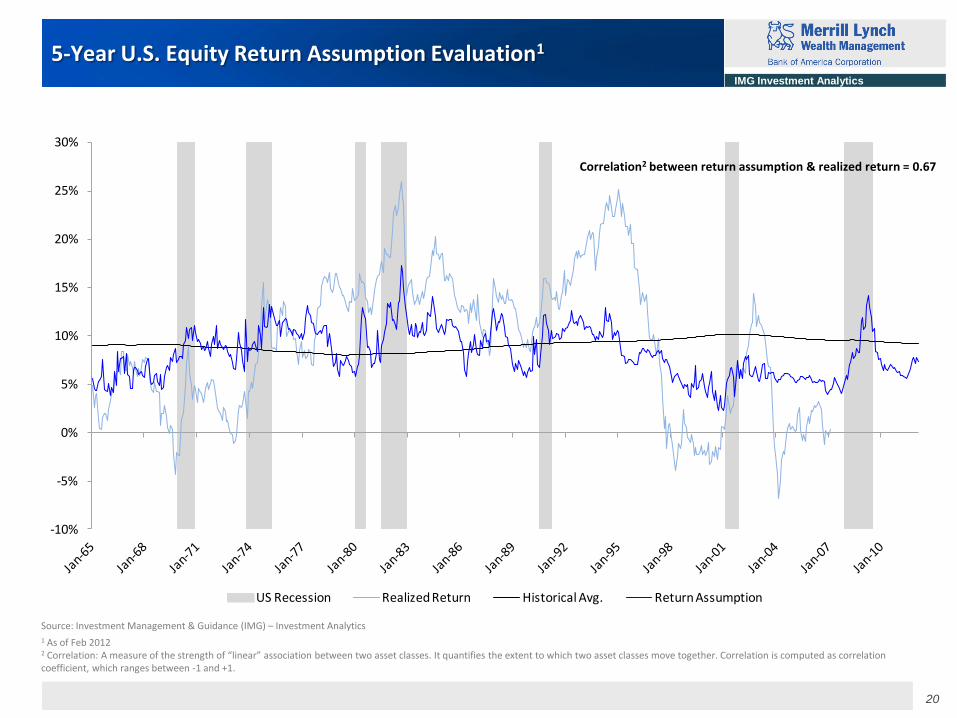
-10%
-5%
0%
5%
10%
15%
20%
25%
30%
US Recession Realized Return Historical Avg. Return Assumption
5-Year U.S. Equity Return Assumption Evaluation1
1 As of Feb 2012 2 Correlation: A measure of the strength of “linear” association between two asset classes. It quantifies the extent to which two asset classes move together. Correlation is computed as correlation coefficient, which ranges between -1 and +1.
Correlation2 between return assumption & realized return = 0.67
Source: Investment Management & Guidance (IMG) – Investment Analytics
21
IMG Investment Analytics
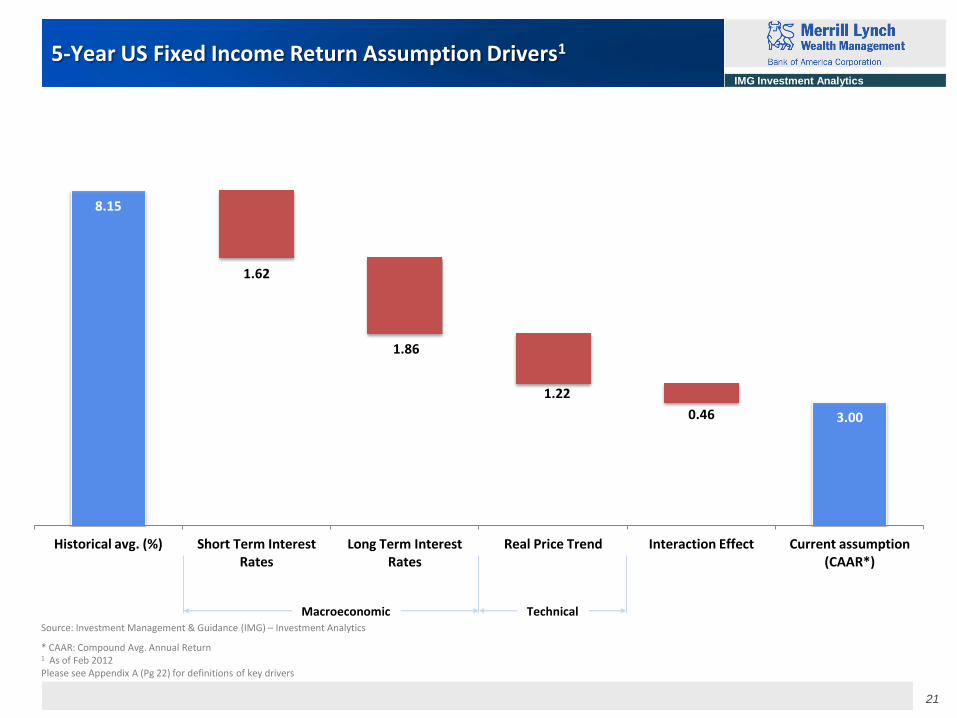
5-Year US Fixed Income Return Assumption Drivers1
Macroeconomic Technical
8.15
3.00
1.62
1.86
1.22
0.46
Historical avg. (%) Short Term Interest Rates
Long Term Interest Rates
Real Price Trend Interaction Effect Current assumption (CAAR*)
* CAAR: Compound Avg. Annual Return
1 As of Feb 2012 Please see Appendix A (Pg 22) for definitions of key drivers
Source: Investment Management & Guidance (IMG) – Investment Analytics
22
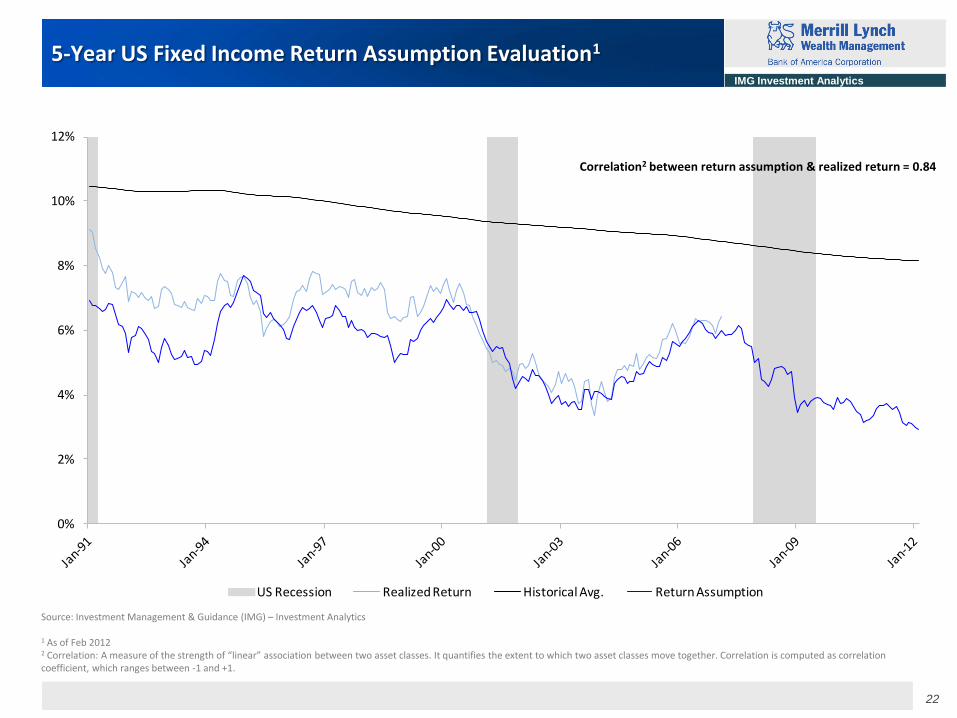
IMG Investment Analytics
0%
2%
4%
6%
8%
10%
12%
US Recession Realized Return Historical Avg. Return Assumption
5-Year US Fixed Income Return Assumption Evaluation1
Correlation2 between return assumption & realized return = 0.84
1 As of Feb 2012 2 Correlation: A measure of the strength of “linear” association between two asset classes. It quantifies the extent to which two asset classes move together. Correlation is computed as correlation coefficient, which ranges between -1 and +1.
Source: Investment Management & Guidance (IMG) – Investment Analytics
23
IMG Investment Analytics
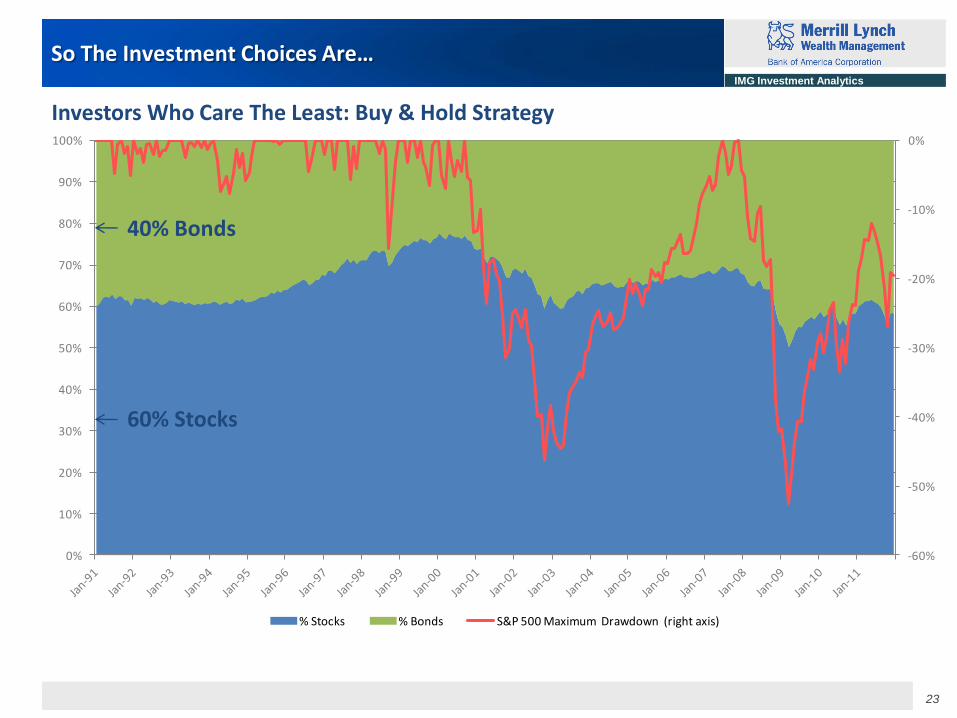
So The Investment Choices Are…
-60%
-50%
-40%
-30%
-20%
-10%
0%
0%
10%
20%
30%
40%
50%
60%
70%
80%
90%
100%
% Stocks % Bonds S&P 500 Maximum Drawdown (right axis)
60% Stocks
40% Bonds
Investors Who Care The Least: Buy & Hold Strategy
24
IMG Investment Analytics
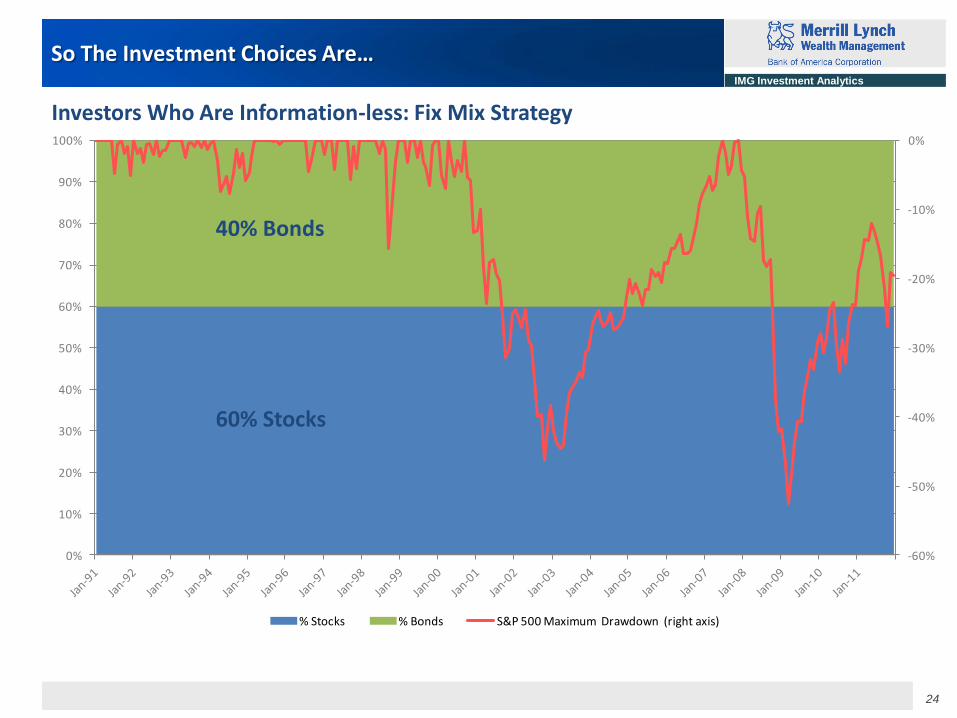
So The Investment Choices Are…
-60%
-50%
-40%
-30%
-20%
-10%
0%
0%
10%
20%
30%
40%
50%
60%
70%
80%
90%
100%
% Stocks % Bonds S&P 500 Maximum Drawdown (right axis)
60% Stocks
40% Bonds
Investors Who Are Information-less: Fix Mix Strategy
25
IMG Investment Analytics
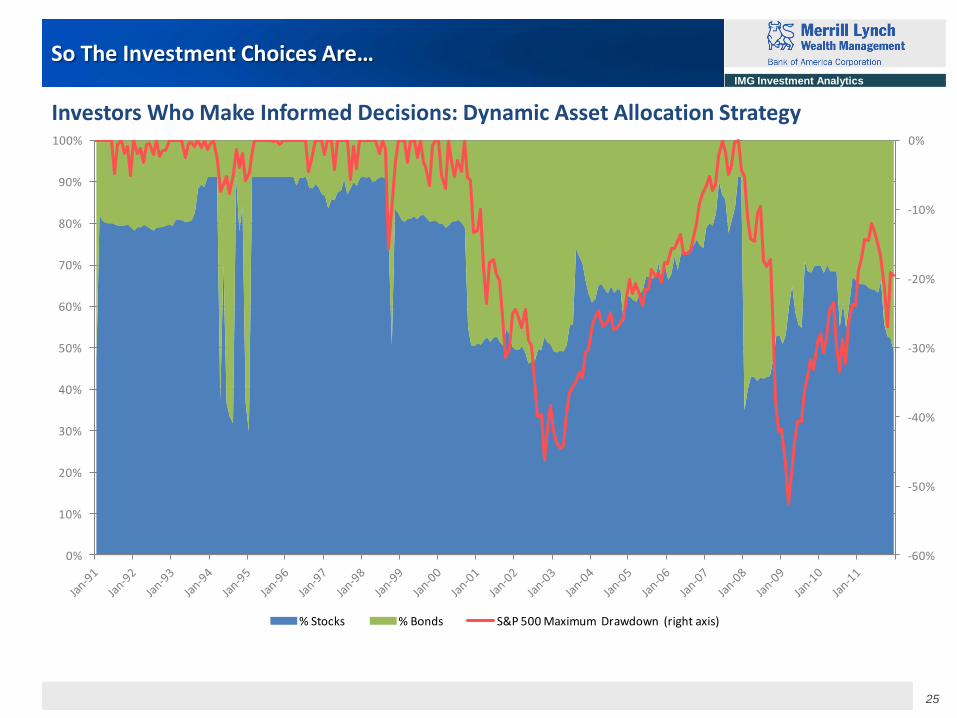
So The Investment Choices Are…
-60%
-50%
-40%
-30%
-20%
-10%
0%
0%
10%
20%
30%
40%
50%
60%
70%
80%
90%
100%
% Stocks % Bonds S&P 500 Maximum Drawdown (right axis)
Investors Who Make Informed Decisions: Dynamic Asset Allocation Strategy
26
IMG Investment Analytics
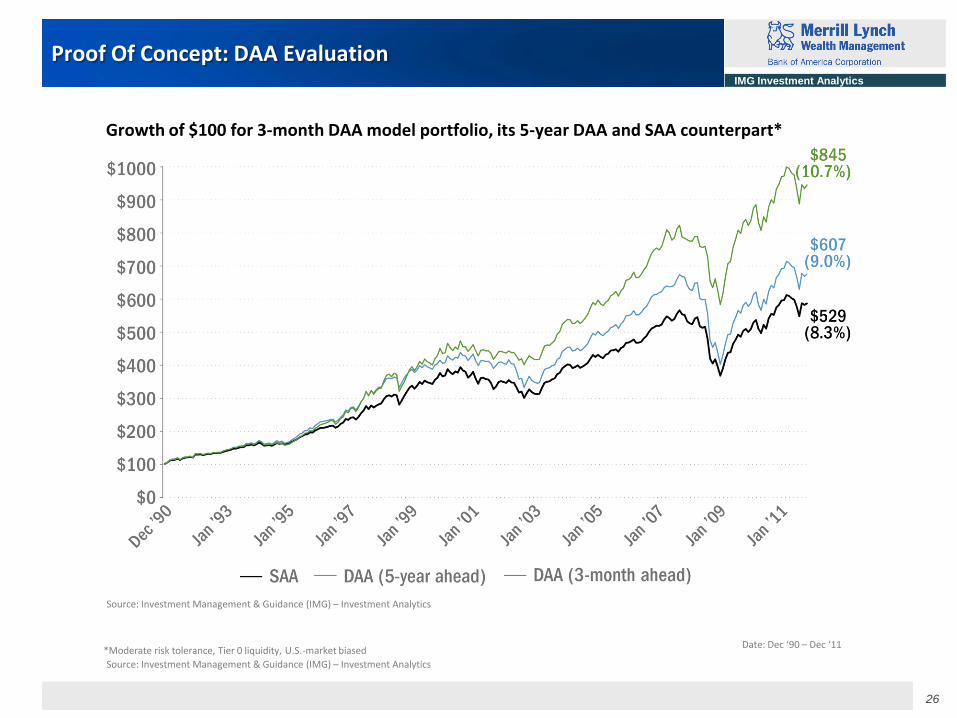
Proof Of Concept: DAA Evaluation
Growth of $100 for 3-month DAA model portfolio, its 5-year DAA and SAA counterpart*
*Moderate risk tolerance, Tier 0 liquidity, U.S.-market biased Date: Dec ‘90 – Dec ‘11
Source: Investment Management & Guidance (IMG) – Investment Analytics
Source: Investment Management & Guidance (IMG) – Investment Analytics
27
IMG Investment Analytics
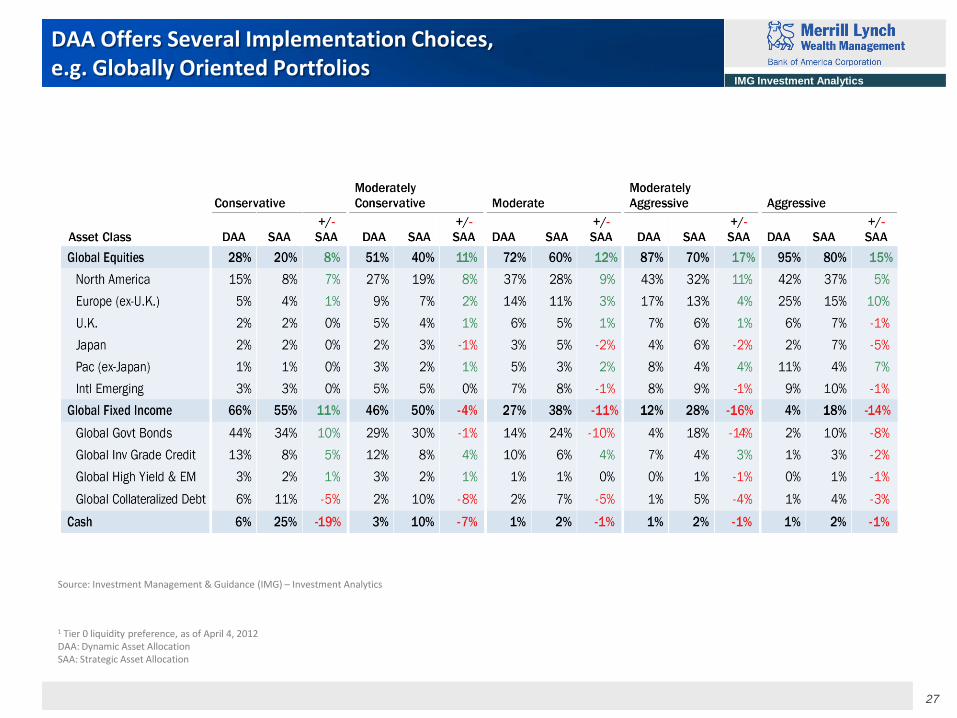
DAA Offers Several Implementation Choices, e.g. Globally Oriented Portfolios
Source: Investment Management & Guidance (IMG) – Investment Analytics
1 Tier 0 liquidity preference, as of April 4, 2012 DAA: Dynamic Asset Allocation SAA: Strategic Asset Allocation
28
IMG Investment Analytics
The following is important information for you to consider before investing in alternative investments: •Alternative investments are speculative and involve a high degree of risk. •Alternative investments may trade on a leveraged basis which increases the risk of loss. •Performance can be volatile. •An investor could lose all or a substantial amount of his or her investment. •The use of a single fund of funds manager applying one set of allocation procedures could mean lack of diversification and, consequently, higher risk. •There is no secondary market for investor’s interest in alternative investments and none is expected to develop. •There may be restrictions on transferring interests in the alternative investments. •High fees and expenses may offset the underlying manager’s trading profits. •A substantial portion of the trades executed by the underlying managers may take place on non-US exchanges. •Alternative investments may require tax reports on Schedule K-1 to be prepared. As a result, investors may be required to obtain extensions for filing federal, state, and local income tax returns each year. •In addition to the foregoing risks, each alternative investment fund is subject to its own strategy-specific or other risks. You must carefully review the offering memorandum for any particular fund and consider your ability to bear these risks before any decision to invest. Sharpe ratios and standard deviation of returns are commonly-used measures of the risk/reward profile of traditional portfolios and broad market indices. As applied to hedge funds, however, these statistics may materially understate the true RISK profile of a fund because hedge funds are subject to a “risk of ruin” which may not be reflected in THE standard deviation of returns, the only measure of risk used in calculating Sharpe ratios. The markets in which hedge funds trade, the liquidity characteristics of the traded securities, the risks of leverage, the use of derivative securities with non-linear risk sensitivities, the use of non-representative historical data for estimating standard deviation, manager error, bad judgment and/or misconduct create the possibility of sudden, dramatic and unexpected losses — LOSSES THAT may not be adequately reflected in Sharpe ratios or standard deviations. Prospective investors must recognize this risk of ruin, which is a material risk involved in investing in any program fund, and which may not be adequately reflected in such performance statistics as the Sharpe ratio.
Additional Disclosure