b:final report coversmasonry cement final rpt cover
TRANSCRIPT

CCRL CEMENT AND CONCRETEREFERENCE LABORATORY
CEMENT AND CONCRETE REFERENCE LABORATORY
PROFICIENCY SAMPLE PROGRAM
Final Report
Masonry Cement Proficiency Samples
Number 49 and Number 50
October 2002

100 Bureau Dr., Stop 8618Fax: 301-975-2243e-mail: [email protected]
CEMENT AND CONCRETE REFERENCE LABORATORYAT THE
NATIONAL INSTITUTE OF STANDARDS AND TECHNOLOGYGAITHERSBURG, MARYLAND 20899
(301) 975-6704
SPONSORED BYCOMMITTEE C-1 ON CEMENT
COMMITTEE C-9 ON CONCRETE ANDCONCRETE AGGREGATES
AMERICAN SOCIETY FOR TESTING AND MATERIALS
October 25, 2002
TO: Participants in the CCRL Masonry Cement Proficiency Sample Program
SUBJECT: Final Report on Masonry Cement Proficiency Samples No. 49 and No. 50
Enclosed is your copy of the final report on the test results for the pair of CCRL Masonry CementProficiency Samples which were distributed in August 2002.
This report consists of Table of Results for individual laboratory data, a statistical Summary of results, aset of general scatter diagrams, and associated detailed information.
The CCRL Proficiency Sample Programs are intended for internal use by the laboratory as a tool toidentify potential problems in laboratory procedures or test equipment and to initiate remedial actions. These programs are designed to complement the CCRL Laboratory Inspection Program as part of a totalquality system. Care should be taken when using this program for any other use.
It is presently anticipated that the next Masonry Cement Proficiency Samples will be distributed inAugust 2003.
Sincerely,
Robin K. HauptSupervisor, Proficiency Sample ProgramsCement and Concrete Reference Laboratory
Enclosure

1Youden, W.J., “Statistical Aspects of the Cement Testing Program”,Volume 59, Proceedings of the 62nd
Annual Meeting of the Society, June 25, 1959, American Society for Testing and Materials.
Continued on Reverse Side
TO: Participants in the CCRL Masonry Cement Proficiency Sample Program
FROM: Robin K. Haupt, Supervisor, PSP
SUBJECT: Explanation of Final Report on Results of Tests on Masonry Cement Proficiency Samples No. 49 and No. 50
This letter, and the material included with it, constitute the final report, and summary of results for thecurrent pair of Masonry Cement Proficiency Samples, which were distributed in August 2002. This materialincludes a Table of Results for Individual laboratory data, a statistical Summary of Results, and a set ofgeneral scatter diagrams. Your unique laboratory number is displayed at the top of the Individual Table ofResults.
An explanation of the program is contained in the paper: "Statistical Evaluation of Interlaboratory CementTests" by J. R. Crandall and R. L. Blaine, and "Statistical Aspects of the Cement Testing Program" by W.J.Youden, which can be found in Volume 59, Proceedings of the 62nd Annual Meeting of the Society, June 25,1959, American Society for Testing and Materials.
Each laboratory receives an individualized Table of Results. The Table of Results shows the test number,test title and the reporting unit in the first three columns. After that it lists in order, the laboratory's resultsfor the odd and even numbered samples, overall averages for the odd and even numbered samples, and thelaboratory's ratings for the odd and even samples. (See reverse for an explanation of the scatter diagrams.)
Laboratory ratings, shown in the Table of Results for the individual laboratory, were determined in themanner described by Crandall and Blaine using a rating scale of 1 to 5 instead of 0 to 4. The ratings haveno valid standing beyond showing the difference between the individual laboratory result and the averagefor a particular test.
The following table details the relationship between the ratings and the averages.
Ratings Range (Number of Number (Per 100)Standard Deviations) of Laboratories
achieving the rating 1
5 Less than 1 69
4 1 to 1.5 18
3 1.5 to 2 9
2 2 to 2.5 3
1 Greater than 2.5 1
The sign of the rating merely shows whether the result reported was greater or less than the average obtained.

In cases where some laboratories' results are eliminated, averages, standard deviations, coefficients ofvariation, and the ratings of the other laboratories' results, are recalculated using the data remaining after theelimination. Since the laboratory ratings given are the results from this one series of tests, you need notattach too much significance to a single low rating, or pair of ratings, from this one series. A continuingtendency to get low ratings on several pairs of samples should lead a laboratory to consider the types of error,systematic and random, contribute to ratings that are low. Systematic error, which is indicated by low ratingswith the same signs on each pair of samples, means a consistent error is occurring in equipment and/or testprocedures. One indication of random error is low ratings on both samples with different signs. Sincesystematic error occurs with more regularity, its cause is generally easier to find than the cause of randomerror.
Summary of Results - General
Usually, averages, standard deviations, and coefficients of variation are given with all results reported, andthen with one or more outlying results omitted. Sometimes, two or more recalculations with laboratoriesomitted, have been done for the same test. In these cases, all of the laboratories omitted in previousrecalculations are also omitted in subsequent ones. Results omitted are values that are more than threestandard deviations from the mean of one or both samples. Often, elimination of these outlying results haslittle effect on the average, but may have a more pronounced effect on the standard deviation and coefficientof variation.
Scatter Diagrams
General scatter diagrams are supplied with this report.
Crandall and Blaine describe the manner of preparing scatter diagrams, and their interpretation, in the paperpublished in the 1959 ASTM Proceedings. Each laboratory will receive a complete set of diagramsaccording to their subscription to the given program.
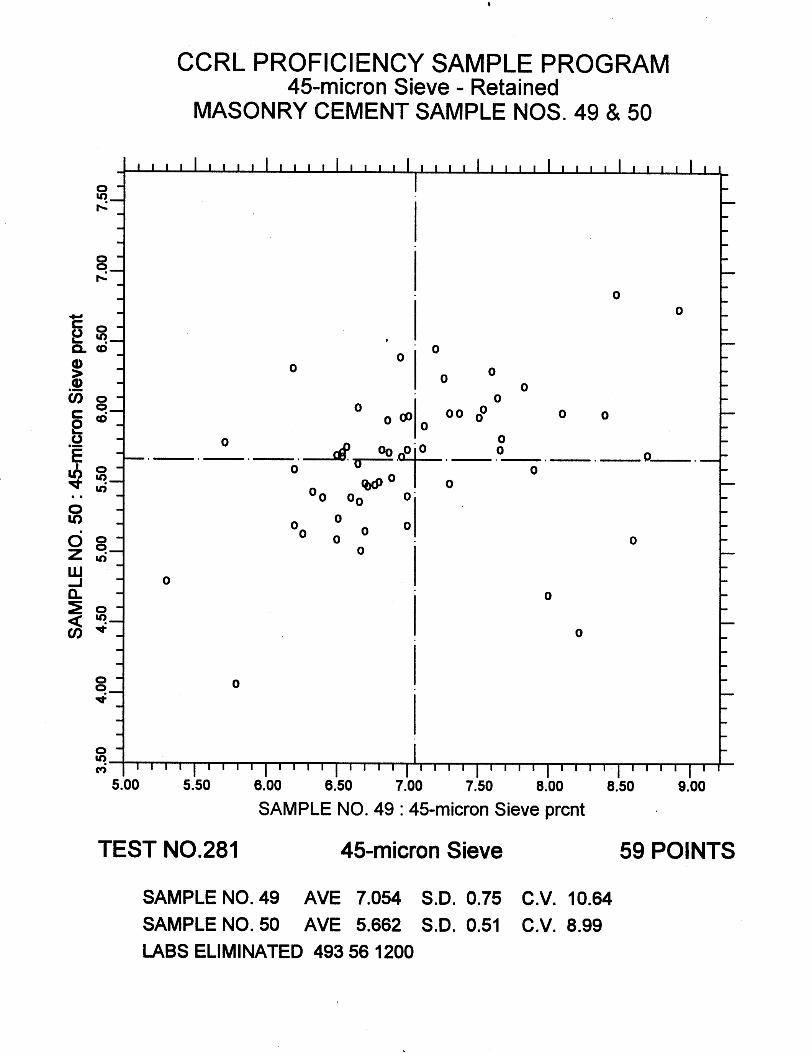
Using the results received from each laboratory, a scatter diagram is generated for each test method byplotting the value for the odd numbered samples on the X, or horizontal axis, against the value for the evennumbered samples on the Y, or vertical axis. To find your point, just plot as you would when plotting anyscatter diagram. Vertical and horizontal dashed lines, which divide the diagrams into four sections orquadrants, place the average values for the odd and even numbered samples, respectively. The first line ofprint under the diagram includes the test number, as given on the data sheet, the test title, and the number ofdata points on the diagrams. The number of plotted points may not agree with the total number of data pairsincluded in the analysis because a few points may be off the diagram, and some points may represent severaldata pairs, which are identical. Laboratories whose points are off the diagram will have a rating of + 1 forthat particular test.
As described in Crandall and Blaine, a tight circular pattern of points around the intersection of the medianlines is the ideal situation. Stretching out of the pattern into the first (upper right) and third (lower left)quadrants, suggests some kind of bias, or tendency for laboratories to get high or low results on both samples.Examination of the scatter diagrams indicates strong evidence of bias on many tests.
Summary of Results - page 1 of 2
CCRL PROFICIENCY SAMPLE PROGRAMMasonry Cement Proficiency Samples No. 49 and No. 50
Final Report - October 25, 2002
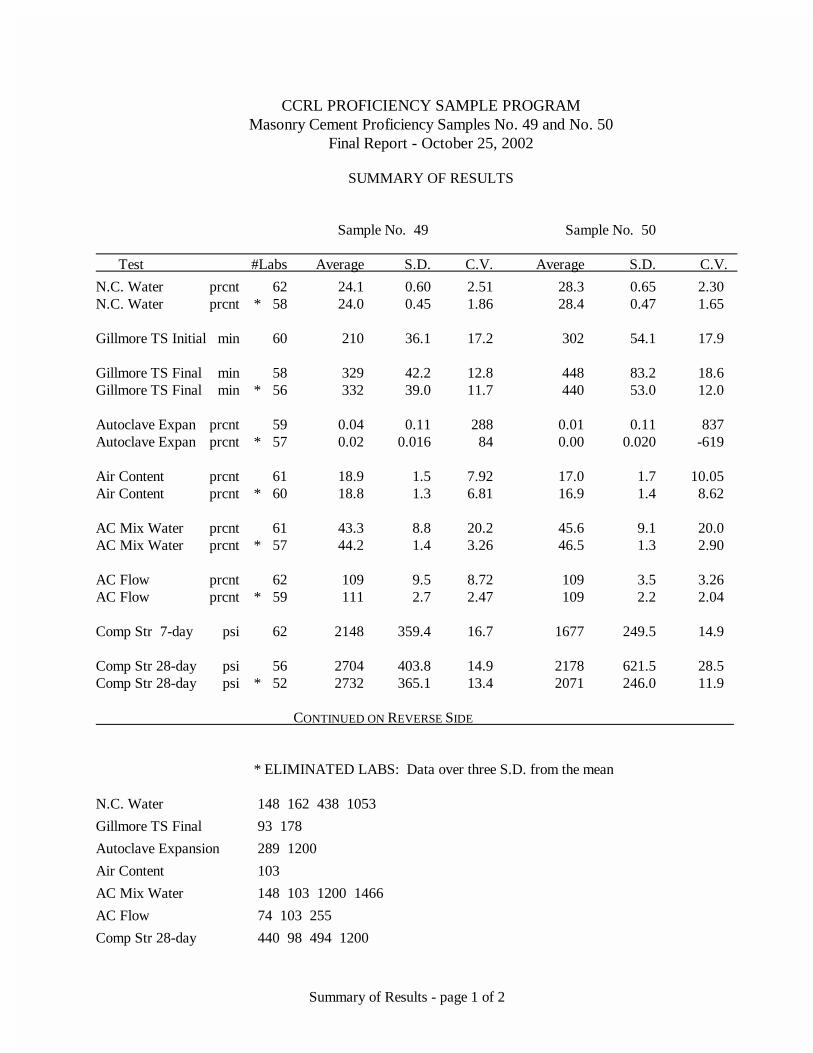
SUMMARY OF RESULTS
Sample No. 49 Sample No. 50
Test #Labs Average S.D. C.V. Average S.D. C.V.
N.C. Water prcnt 62 24.1 0.60 2.51 28.3 0.65 2.30 N.C. Water prcnt * 58 24.0 0.45 1.86 28.4 0.47 1.65
Gillmore TS Initial min 60 210 36.1 17.2 302 54.1 17.9
Gillmore TS Final min 58 329 42.2 12.8 448 83.2 18.6 Gillmore TS Final min * 56 332 39.0 11.7 440 53.0 12.0
Autoclave Expan prcnt 59 0.04 0.11 288 0.01 0.11 837 Autoclave Expan prcnt * 57 0.02 0.016 84 0.00 0.020 -619
Air Content prcnt 61 18.9 1.5 7.92 17.0 1.7 10.05 Air Content prcnt * 60 18.8 1.3 6.81 16.9 1.4 8.62
AC Mix Water prcnt 61 43.3 8.8 20.2 45.6 9.1 20.0 AC Mix Water prcnt * 57 44.2 1.4 3.26 46.5 1.3 2.90
AC Flow prcnt 62 109 9.5 8.72 109 3.5 3.26 AC Flow prcnt * 59 111 2.7 2.47 109 2.2 2.04
Comp Str 7-day psi 62 2148 359.4 16.7 1677 249.5 14.9
Comp Str 28-day psi 56 2704 403.8 14.9 2178 621.5 28.5 Comp Str 28-day psi * 52 2732 365.1 13.4 2071 246.0 11.9
CONTINUED ON REVERSE SIDE
* ELIMINATED LABS: Data over three S.D. from the mean
N.C. Water 148 162 438 1053
Gillmore TS Final 93 178
Autoclave Expansion 289 1200
Air Content 103
AC Mix Water 148 103 1200 1466
AC Flow 74 103 255
Comp Str 28-day 440 98 494 1200

Summary of Results - page 2 of 2
CCRL PROFICIENCY SAMPLE PROGRAMMasonry Cement Proficiency Samples No. 49 and No. 50
Final Report - October 25, 2002
SUMMARY OF RESULTS
Sample No. 49 Sample No. 50
Test #Labs Average S.D. C.V. Average S.D. C.V.
45�m sieve prcnt 62 7.07 1.00 14.1 5.64 0.87 15.4 45�m sieve prcnt * 59 7.05 0.75 10.64 5.66 0.51 8.99
Density g/cm3 49 2.96 0.089 3.02 2.88 0.070 2.42 Density g/cm3 * 46 2.96 0.045 1.52 2.86 0.045 1.57
Water Sol Alkali prcnt 9 0.08 0.061 78.4 0.08 0.048 62.2
WATER RETENTIONWR Mix Water prcnt 53 45.1 14.5 32.1 46.2 11.4 24.7 WR Mix Water prcnt * 48 44.2 1.5 3.40 46.7 1.3 2.85
WR Initial Flow prcnt 53 111 3.7 3.35 109 4.6 4.21 WR Initial Flow prcnt * 51 111 2.6 2.36 109 2.8 2.52
WR Final Flow prcnt 53 95 6.4 6.77 92 5.7 6.18
Water Retention prcnt 54 85 4.8 5.69 84 4.7 5.62 Water Retention prcnt * 53 85 4.1 4.80 84 4.7 5.62
* ELIMINATED LABS: Data over three S.D. from the mean
45�m sieve 493 56 1200
Density 159 96 244
WR Mix Water 56 148 440 1200 1466
WR Initial Flow 309 162
Water Retention 413