bhcs expansion september 30, 2014. executive summary bhcs proposes to improve competitiveness and...
TRANSCRIPT
BHCS EXPANSION
September 30, 2014

EXECUTIVE SUMMARY
• BHCS proposes to improve competitiveness and increase capacity:
– Plan expands med/surg beds, creates private bed Post Partum unit, relocates NICU to a consolidated “mother/baby unit”; total bed count expands from 196 to 250; upgrades energy plant.
• Estimated project cost: $55,972,000 (based on 2016/2017 construction cost)
• Payback period (using discounted cash flows) is 11.7 years
• Project NPV is $56.5M
• Growth in the service area, aging of the population requires that additional inpatient beds be added within the northwestern area of the county.
2

BHCS STRATEGIC INITIATIVES
• The BHCS expansion is focused on:1. Decompressing the adult med/surg occupancy issues/capacity issues2. Protecting and growing the delivery and neonatology volumes 3. Growing surgical shares
• Current capacity issues limit growth, physician recruitment, patient marketing and patient satisfaction
• BHCS has set a goal to grow Delivery share from within the service area from the current 25.7% share level to 28% in 2018 and 33% by 2022
– Neonatology share is a function of Delivery and is expected to grow from 21.3% currently to 27% by 2022
• Private post partum rooms are required to be competitive with area competitors in the maternity market. – The maternity is highly elective and physicians and mothers to be are highly selective in choosing
hospitals.– Northwest has all private rooms in its post partum unit.– West Boca has recently announced plans to further renovate its maternity unit and increase the
numbers of private rooms.
3

EXECUTIVE SUMMARY
• Demand for inpatient services within the BHCS service area will grow significantly from 2012 to 2040:– BHCS service area population will grow by 37% from 2012 to 2040.– Admissions will grow by 42% (net of increased population, aging of
population and decreased admissions rates).– Patient days will grow by 46% (net of increased admissions and
decreased LOS).
• Sum of population growth and demographics (age) drive demand for an incremental 50 beds within the service area every five years from now to 2030; thereafter, increased demand is over 100 beds per 5 years.
4

EXECUTIVE SUMMARY
5
Capital Item 2015 2016 2017 TotalSoft Costs including Architecture Design, Drawings, Permits, etc.($7,073,700) $0 $0 ($7,073,700)Energy Plant Upgrades - (2,500,000) - (2,500,000) Construction Costs of New Areas - (18,568,463) (18,568,463) (37,136,925) Refurbishment of Repurposed Existing Areas - (1,214,375) (1,214,375) (2,428,750) Equipment for New & Refurbished Areas - - (6,332,700) (6,332,700) Total Project Initial Costs ($7,073,700) ($22,282,838) ($26,115,538) ($55,472,075)

PROCESS

ANALYSIS GOALS
• Project analysis goals:– To determine demand for inpatient services within BHCS area– To assess competitive position today– Help BHCS management team pick strategic service lines to
maximize future volume and contributions – To develop tool to quantify BHCS share targets and resulting
contribution– To assess incremental contribution over current levels for use in ROI
pro forma model– To determine payback period on projects and project present value
7
ANALYSIS STEPS
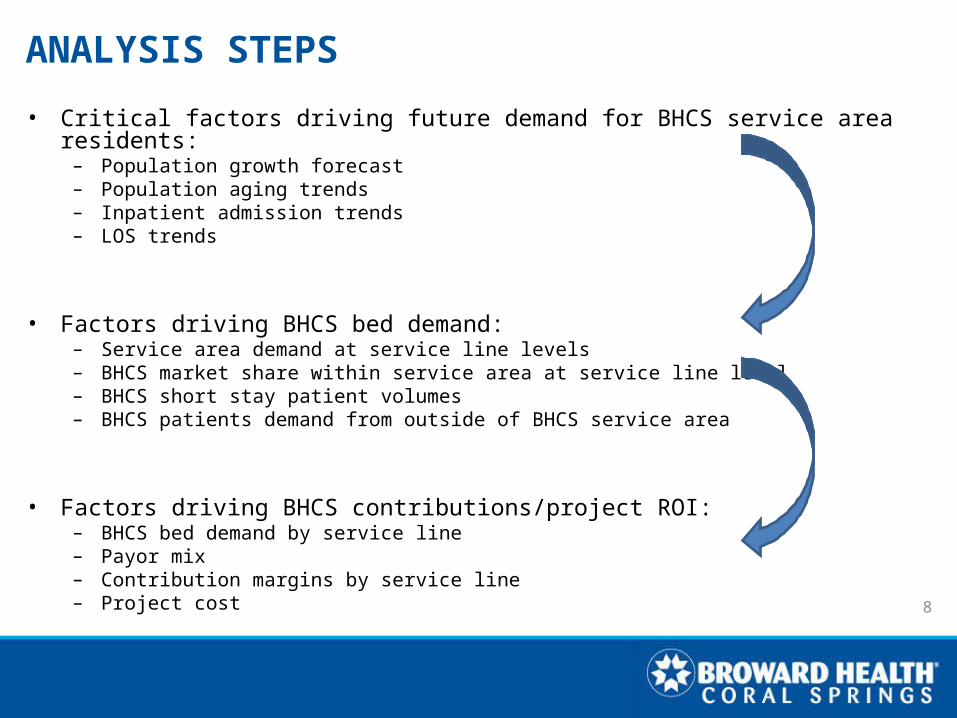
• Critical factors driving future demand for BHCS service area residents:– Population growth forecast– Population aging trends– Inpatient admission trends– LOS trends
• Factors driving BHCS bed demand:– Service area demand at service line levels– BHCS market share within service area at service line level – BHCS short stay patient volumes– BHCS patients demand from outside of BHCS service area
• Factors driving BHCS contributions/project ROI:– BHCS bed demand by service line– Payor mix– Contribution margins by service line– Project cost
8
FACILITY EXPANSION
9

EXPANSION PLAN• Expansion details:
– New Labor and Delivery rooms, including 2 Ors.– Labor test outpatient areas.– New delivery waiting room areas.– 28 new private Post Partum rooms with ample area for mother, father, baby
and family visitation.• Includes limited number of “Empress Suites.”
– Relocated NICU adjacent to Post Partum rooms for easy access by mothers.– New smaller pediatric med/surg area, 12 beds versus current 26.– Net addition of 65 private adult med/surg beds.
• 28 new private adult med/surg beds.• Current peds/PICU area refurbished for additional 28 adult med/surg
rooms. • Current Mother/Baby area converted to additional 9 adult med/surg
rooms.
• After construction, a total of 250 beds will be available. This includes 184 adult med/surg beds—an increase of 65 (+54%) more than today.
– A future 4th floor could be added in the future to provide for an additional 28 med/surg beds.10

EXPANSION DETAILS
11

BHCS BED CAPACITY BEFORE & AFTER
12
Bed Type Current After Chg
Adult Med/Surg
Private 69
119
134
184 +65Semi-private
50 50
Post Partum Private 1125
2828 +3Semi-
private14 0
Pediatric Med/Surg
Private 15
21
12
12 -9Semi-private
6 0
ICU 16 16 0
NICU 10 10 0
PICU 5 0 -5
Total 196 250 +54

COST DETAILS• Plan would cost approximately $49.3 million if constructed today.• Total estimate includes inflation factor of $6.2 million based on 6% per
year inflation (2.33 years) according to MGE Architects.
• Costs will be spread over a three year period:
13
Alternative 1 Base InflatedSite & Exterior 3,250,000 3,705,000 Total Construction 27,775,000 31,663,500 Equipment 5,555,000 6,332,700 Soft Costs 6,205,000 7,073,700 Contingency 1,551,250 1,768,425 Base Project Costs 44,336,250 50,543,325
Add-onsThird Floor Renonvation 2,428,750 2,428,750 Energy Plant Upgrade 2,500,000 2,500,000 Total Project Costs 49,265,000 55,472,075
By Year 2015 2016 2017Planning Costs (7,073,700) - - Energy Plant Costs - (2,500,000) - Construction Costs - (18,568,463) (18,568,463) Refurbishing of Repurposed Areas (1,214,375) (1,214,375) Equipment (Initial and Replacement) (6,332,700) Hardening - Other Facility (4th floor) - Total (7,073,700) (22,282,838) (26,115,538)

COST DETAILS• Proposed cost has increased from original presentation for 3 main
reasons: inflation, NICU relocation and renovations of 3N/3W.
14
Original Estimate $44,036,250Inflation Assumption 6,207,075 NICU Relocation 2,800,000 3W/3N Renovations to Adult M/S 2,928,750 Revised Estimate $55,972,075

FINANCIAL
15
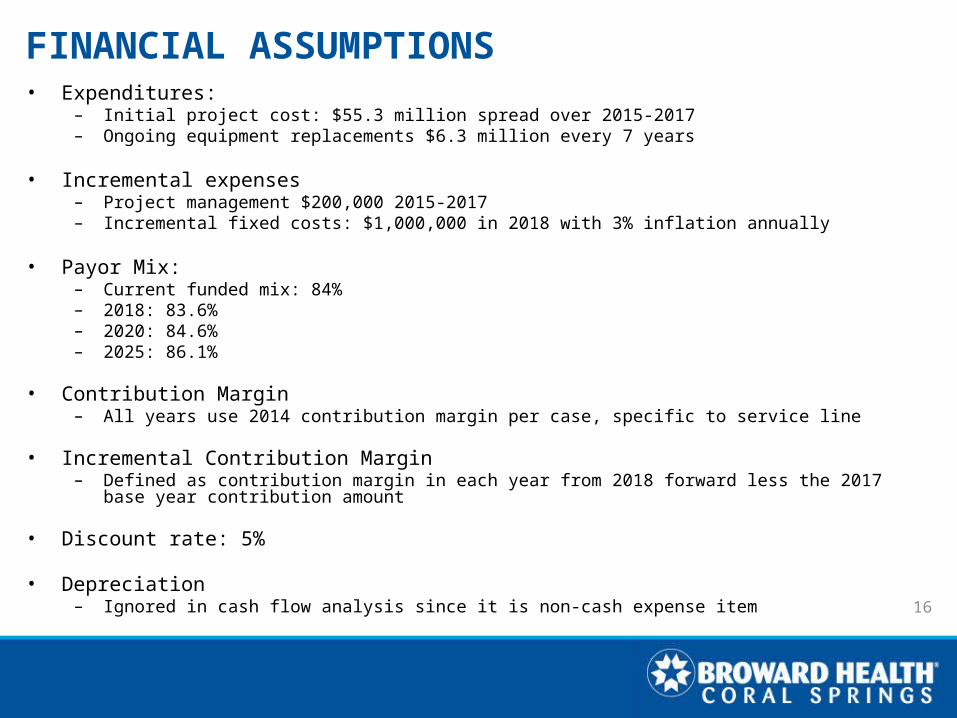
FINANCIAL ASSUMPTIONS• Expenditures:
– Initial project cost: $55.3 million spread over 2015-2017– Ongoing equipment replacements $6.3 million every 7 years
• Incremental expenses– Project management $200,000 2015-2017– Incremental fixed costs: $1,000,000 in 2018 with 3% inflation annually
• Payor Mix: – Current funded mix: 84%– 2018: 83.6%– 2020: 84.6%– 2025: 86.1%
• Contribution Margin– All years use 2014 contribution margin per case, specific to service line
• Incremental Contribution Margin – Defined as contribution margin in each year from 2018 forward less the 2017 base year contribution amount
• Discount rate: 5%
• Depreciation– Ignored in cash flow analysis since it is non-cash expense item
16

FINANCIAL RESULTS• Pay back period, using discounted cash flows is 11.7 years
• Project present value is $56.3 million
17

18
BHCS ExpansionSummary of Cash Flows
Cash Flow Items 2015 2016 2017 2018 2019 2020 2021 2022 2023Capital Expenditures (7,073,700) (22,282,838) (26,115,538) - - - - - - Incremental Contribution Margin - - - 1,672,884 3,511,674 5,134,263 6,736,740 8,383,659 9,991,313 Incremental Fixed Costs (200,000) (200,000) (200,000) (1,000,000) (1,030,000) (1,060,900) (1,092,727) (1,125,509) (1,159,274) Savings - - - - - - - - - Net Cash Flow (7,273,700) (22,482,838) (26,315,538) 672,884 2,481,674 4,073,363 5,644,013 7,258,151 8,832,039 Cumulative Cash Flows to Date (7,273,700) (29,756,538) (56,072,075) (55,399,191) (52,917,517) (48,844,154) (43,200,141) (35,941,990) (27,109,951)
2024 2025 2026 2027 2028 2029 2030 2031 2032Capital Expenditures - (6,332,700) - - - - - - (6,332,700) Incremental Contribution Margin 10,993,228 11,867,227 11,746,618 12,199,301 12,570,489 12,923,651 14,484,264 14,047,196 14,437,083 Incremental Fixed Costs (1,194,052) (1,229,874) (1,266,770) (1,304,773) (1,343,916) (1,384,234) (1,425,761) (1,468,534) (1,512,590) Savings - - - - - - - - - Net Cash Flow 9,799,176 4,304,653 10,479,848 10,894,528 11,226,572 11,539,417 13,058,503 12,578,662 6,591,793 Cumulative Cash Flows to Date (17,310,776) (13,006,122) (2,526,274) 8,368,254 19,594,826 31,134,244 44,192,747 56,771,408 63,363,202
2033 2034 2035 2036 2037 2038 2039 2040Capital Expenditures - - - - - - (6,332,700) - Incremental Contribution Margin 14,838,416 15,251,345 17,417,645 16,986,400 17,442,492 17,910,978 18,391,840 20,110,416 Incremental Fixed Costs (1,557,967) (1,604,706) (1,652,848) (1,702,433) (1,753,506) (1,806,111) (1,860,295) (1,916,103) Savings - - - - - - - - Net Cash Flow 13,280,448 13,646,638 15,764,798 15,283,967 15,688,986 16,104,867 10,198,845 18,194,313 Cumulative Cash Flows to Date 76,643,650 90,290,288 106,055,086 121,339,053 137,028,038 153,132,905 163,331,750 181,526,063
CASH FLOWS: 2015-2040

19
Present Value of Cash Flows2015 2016 2017 2018 2019 2020 2021 2022 2023
Discount Rate 5.00%Discount Period 0.5 1.5 2.5 3.5 4.5 5.5 6.5 7.5 8.5Present Values of Annual Cash Flows (7,098,404) (20,896,193) (23,293,728) 567,254 1,992,475 3,114,670 4,110,149 5,033,919 5,833,805 Cumulative Present Value to Date (7,098,404) (27,994,597) (51,288,325) (50,721,071) (48,728,596) (45,613,927) (41,503,778) (36,469,858) (30,636,053) Total Project Present Value* 56,553,706 Project Payback Period-DCF (years) 11.7
2024Discount RateDiscount Period 9.5 10.5 11.5 12.5 13.5 14.5 15.5 16.5 17.5Present Values of Annual Cash Flows 6,164,406 2,578,995 5,979,682 5,920,279 5,810,207 5,687,731 6,129,983 5,623,556 2,806,667 Cumulative Present Value to Date (24,471,648) (21,892,652) (15,912,971) (9,992,692) (4,182,484) 1,505,247 7,635,229 13,258,785 16,065,452 Total Project Present Value*Project Payback Period-DCF (years)
2033 2034 2035 2036 2037 2038 2039 2040Discount RateDiscount Period 18.5 19.5 20.5 21.5 22.5 23.5 24.5 25.5Present Values of Annual Cash Flows 5,385,310 5,270,288 5,798,395 5,353,849 5,234,023 5,116,920 3,086,123 5,243,346 Cumulative Present Value to Date 21,450,762 26,721,050 32,519,445 37,873,294 43,107,317 48,224,237 51,310,359 56,553,706 Total Project Present Value*Project Payback Period-DCF (years)*Project Present Value excludes present value of cash flows beyond 2040
PRESENT VALUE OF CASH FLOWS
RECAP• BHCS at/above capacity currently for past several years.• BHCS at competitive disadvantage in post partum and med/surg private
rooms compared to service area competition.– Even loyal physicians do not refer all potential volumes due to capacity and private
room limitations.
• BHCS service area is and will continue to be the fastest growing area within Broward County.
• Population is aging which drives more inpatient admissions.• Bed demand will continue to increase…if BHCS fails to expand, a
competitor will fill the need.• BHCS can recover the investment in less than 12 years.
20