bhel project
TRANSCRIPT

FINANCIAL RATIO
ANALYSIS OF B.H.E.L Project submitted on completion of Summer
Internship
7/11/2009
BHARAT HEAVY ELECTRICALS LIMITED, BHOPAL
Bhanupriya Vishwakarma
MBA (Financial Adminnistration)
Institute of Management Studies,
DAVV, Indore
TABLE OF CONTENTS
Certificate
Acknowledgements
Declaration
BHEL- at a glance -Introduction -Product Profile
Ratio Analysis - What is Ratio analysis? - Role of Ratio analysis - Limitations of Ratio analysis
Financial Statements and Ratio Analysis -Financial statements as sources of financial data - Balance sheet Ratio Analysis - Income statement Ratio Analysis
Graphical and Data Analysis -Financial Data -Liquidity Ratios -Profitability Ratios - Leverage Ratios - Activity Ratios
Inferences Drawn from Ratio Analysis of BHEL
Conclusion
Appendix
Bibliography

ACKNOWLEDGEMENTS
I wish to express my heartfelt gratitude and immense respect to Shri K.S Mathur,
D.G.M Finance, my Guide and Mentor in BHEL for granting me the opportunity to
learn at BHEL’s Finance Department.
I would also like to thank the staff members for explaining even the minutest
details of all segments of finance department in BHEL.
Last but not the least; I would also like to thank BHEL for providing the necessary
infrastructure and information which made my work easier.
Bhanupriya Vishwakarma
MBA (Financial Administration)
Institute of Management Studies
Devi Ahilya Vishwavidyalaya
Indore
CERTIFICATE
This is to certify that Ms Bhanupriya Vishwakarma, pursuing Masters of Business Administration from Institute of Management Studies, Devi Ahilya Vishwavidyalaya,Indore has successfully completed her summer internship from Bharat Heavy Electricals Limited, Bhopal under my guidance from June 1st,2009 to July 11th,2009.
Shri K .S. Mathur
D.G.M, Finance
Bharat Heavy Electricals Limited
July 11th,2009 Bhopal

DECLARATION
I, Bhanupriya Vishwakarma, student of Institute of Management Studies, DAVV , Indore, hereby declare that the work done by me in “ Financial Ratio Analysis of BHEL” is genuine and done by me solely.
Bhanupriya Vishwakarma
MBA (Financial Administration)
Institute of Management Studies
Devi Ahilya Vishwavidyalaya
Indore

BHEL- AT A GLANCE
BHEL is the largest engineering and manufacturing enterprise in India in the energy-related/infrastructure sector, today. BHEL was established more than 40 years ago, ushering in the indigenous Heavy Electrical Equipment industry in India - a dream that has been more than realized with a well-recognized track record of performance. The company has been earning profits continuously since 1971-72 and paying dividends since 1976-77.
BHEL manufactures over 180 products under 30 major product groups and caters to core sectors of the Indian Economy viz., Power Generation & Transmission, Industry, Transportation, Telecommunication, Renewable Energy, etc. The wide network of BHEL's 14 manufacturing divisions, four Power Sector regional centres, over 100 project sites, eight service centres and 18 regional offices, enables the Company to promptly serve its customers and provide them with suitable products, systems and services -- efficiently and at competitive prices. The high level of quality & reliability of its products is due to the emphasis on design, engineering and manufacturing to international standards by acquiring and adapting some of the best technologies from leading companies in the world, together with technologies developed in its own R&D centres.
BHEL has acquired certifications to Quality Management Systems (ISO 9001), Environmental Management Systems (ISO 14001) and Occupational Health & Safety Management Systems (OHSAS 18001) and is also well on its journey towards Total Quality Management.
BHEL has
Installed equipment for over 90,000 MW of power generation -- for Utilities, Captive and Industrial users.
Supplied over 2,25,000 MVA transformer capacity and other equipment operating in Transmission & Distribution network up to 400 kV (AC & DC).
Supplied over 25,000 Motors with Drive Control System to Power projects, Petrochemicals, Refineries, Steel, Aluminum, Fertilizer, Cement plants, etc.
Supplied Traction electrics and AC/DC locos to power over 12,000 kms Railway network.
Supplied over one million Valves to Power Plants and other Industries.
BHEL's operations are organised around three business sectors, namely Power, Industry - including Transmission, Transportation, Telecommunication & Renewable Energy - and Overseas Business. This enables BHEL to have a strong customer orientation, to be sensitive to his needs and respond quickly to the changes in the market.
BHEL's vision is to become a world-class engineering enterprise, committed to enhancing stakeholder value. The company is striving to give shape to its aspirations and fulfill the expectations of the country to become a global player.

Product Profile
THERMAL POWER PLANTS
Steam turbines, boilers and generators of up to 800 MW capacity for utility and
combined-cycle applications; capability to manufacture boilers and steam
turbines with supercritical steam cycle parameters and matching generators of
up to 1000 MW unit size.
Steam turbines, boilers and generators for CPP applications; capability to
manufacture condensing, extraction, back pressure, injection or any
combination of these types of steam turbines.
NUCLEAR POWER PLANTS
Steam generator & Turbine generator up to 700 MW capacity.
GAS-BASED POWER PLANTS
Gas turbines of up to 280 MW (ISO) advance class rating.
Gas turbine-based co-generation and combined cycle systems for industry and
utility applications.
HYDRO POWER PLANT
Custom-built conventional hydro turbines of Kaplan, Francis and Pelton types
with matching generators, pump turbines with matching motor-generators.
Mini/micro hydro sets.
Spherical, butterfly and rotary valves and auxiliaries for hydro stations.
DG POWER PLANTS
HSD, LDO, FO, LSHS, natural gas/biogas-based diesel generator power plants,
unit rating of up to 200 MW and voltage up to 11 kV, for emergency, peaking as
well as base load operations on turnkey basis.
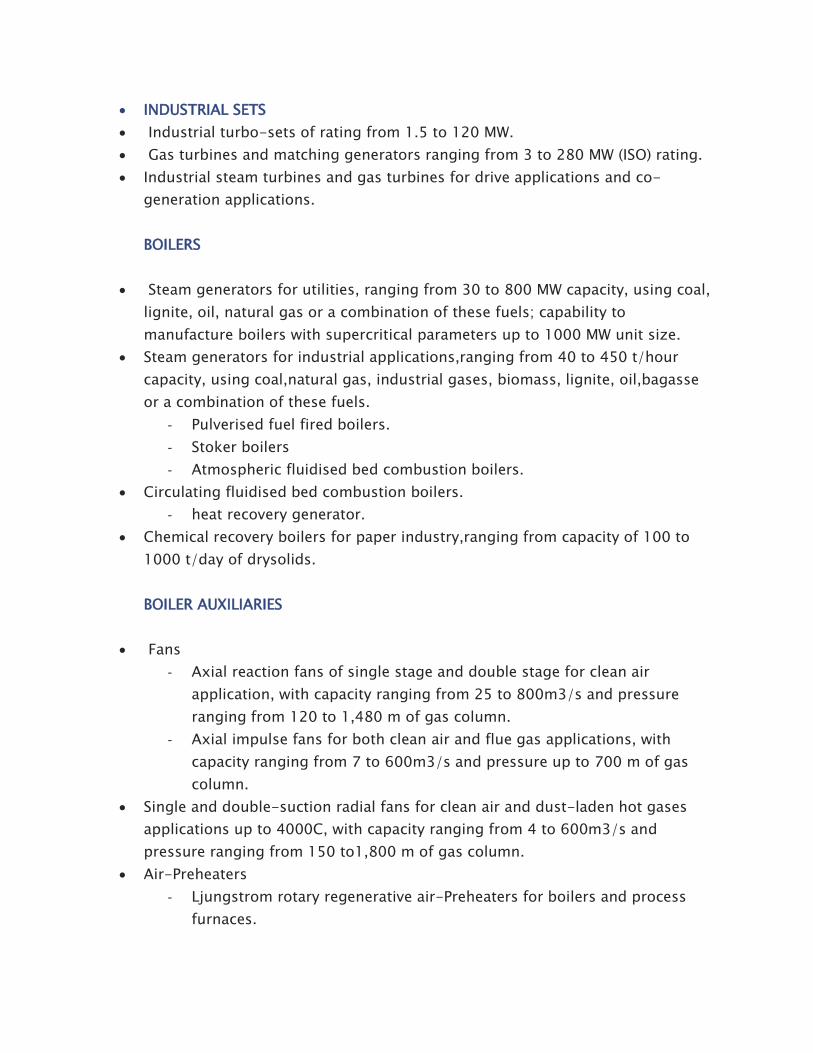
INDUSTRIAL SETS
Industrial turbo-sets of rating from 1.5 to 120 MW.
Gas turbines and matching generators ranging from 3 to 280 MW (ISO) rating.
Industrial steam turbines and gas turbines for drive applications and co-
generation applications.
BOILERS
Steam generators for utilities, ranging from 30 to 800 MW capacity, using coal,
lignite, oil, natural gas or a combination of these fuels; capability to
manufacture boilers with supercritical parameters up to 1000 MW unit size.
Steam generators for industrial applications,ranging from 40 to 450 t/hour
capacity, using coal,natural gas, industrial gases, biomass, lignite, oil,bagasse
or a combination of these fuels.
- Pulverised fuel fired boilers.
- Stoker boilers
- Atmospheric fluidised bed combustion boilers.
Circulating fluidised bed combustion boilers.
- heat recovery generator.
Chemical recovery boilers for paper industry,ranging from capacity of 100 to
1000 t/day of drysolids.
BOILER AUXILIARIES
Fans
- Axial reaction fans of single stage and double stage for clean air
application, with capacity ranging from 25 to 800m3/s and pressure
ranging from 120 to 1,480 m of gas column.
- Axial impulse fans for both clean air and flue gas applications, with
capacity ranging from 7 to 600m3/s and pressure up to 700 m of gas
column.
Single and double-suction radial fans for clean air and dust-laden hot gases
applications up to 4000C, with capacity ranging from 4 to 600m3/s and
pressure ranging from 150 to1,800 m of gas column.
Air-Preheaters
- Ljungstrom rotary regenerative air-Preheaters for boilers and process
furnaces.
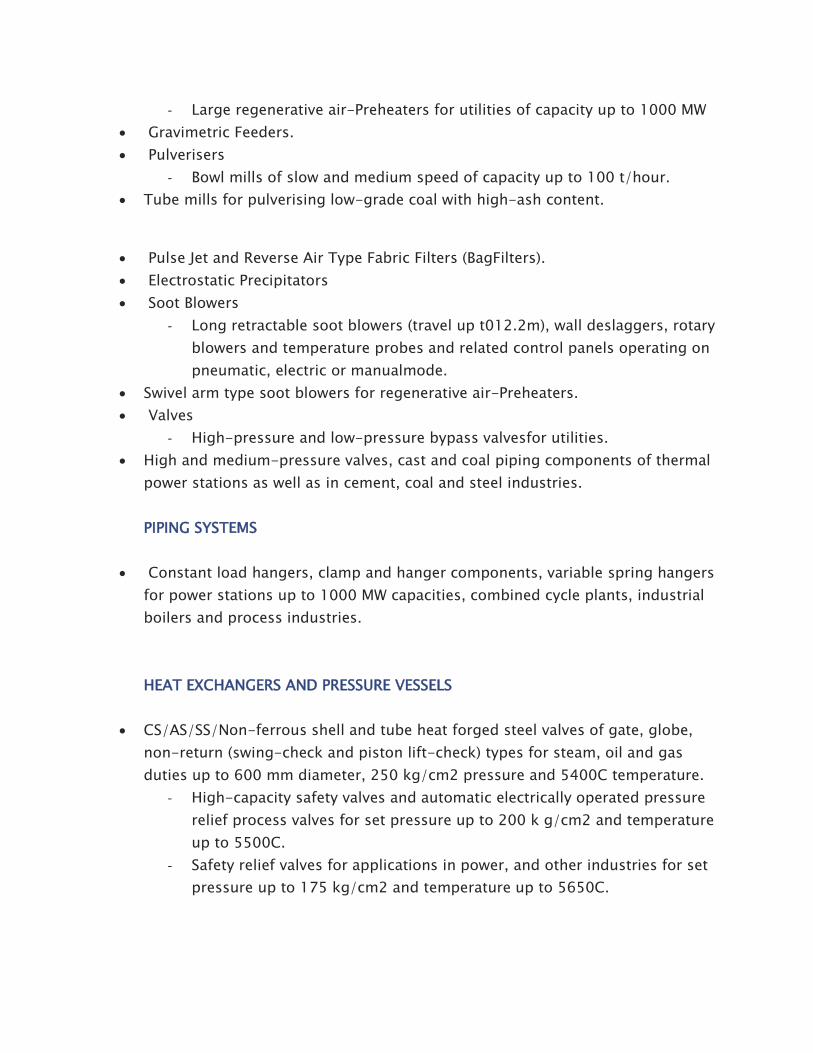
- Large regenerative air-Preheaters for utilities of capacity up to 1000 MW
Gravimetric Feeders.
Pulverisers
- Bowl mills of slow and medium speed of capacity up to 100 t/hour.
Tube mills for pulverising low-grade coal with high-ash content.
Pulse Jet and Reverse Air Type Fabric Filters (BagFilters).
Electrostatic Precipitators
Soot Blowers
- Long retractable soot blowers (travel up t012.2m), wall deslaggers, rotary
blowers and temperature probes and related control panels operating on
pneumatic, electric or manualmode.
Swivel arm type soot blowers for regenerative air-Preheaters.
Valves
- High-pressure and low-pressure bypass valvesfor utilities.
High and medium-pressure valves, cast and coal piping components of thermal
power stations as well as in cement, coal and steel industries.
PIPING SYSTEMS
Constant load hangers, clamp and hanger components, variable spring hangers
for power stations up to 1000 MW capacities, combined cycle plants, industrial
boilers and process industries.
HEAT EXCHANGERS AND PRESSURE VESSELS
CS/AS/SS/Non-ferrous shell and tube heat forged steel valves of gate, globe,
non-return (swing-check and piston lift-check) types for steam, oil and gas
duties up to 600 mm diameter, 250 kg/cm2 pressure and 5400C temperature.
- High-capacity safety valves and automatic electrically operated pressure
relief process valves for set pressure up to 200 k g/cm2 and temperature
up to 5500C.
- Safety relief valves for applications in power, and other industries for set
pressure up to 175 kg/cm2 and temperature up to 5650C.

Ceramic wear-resistant lining material for application in pulverised and
exchangers and pressure vessels.
Air-cooled heat exchangers.
Surface condensers
Steam jet air ejectors.
Columns.
Reactors, drums.
LPG/propane storage bullets.
LPG/propane mounded storage vessels.
Feed water heaters.
PUMPS
Pumps for various applications to suit utilities up to a capacity of 1000 MW.
Boiler feed pumps (motor or steam turbine driven).
Boiler feed booster pumps.
Condensate pumps.
Circulating water pumps.
Emergency oil pumps.
Lubricating oil pumps.
Standby oil pumps.
POWER STATION CONTROL EQUIPMENT
Microprocessor-based distributed digital control Data acquisition systems.
Man-machine interface.
Sub-station controls with SCADA.
Static excitation equipment/automatic voltage regulator.
Electro-hydraulic governor control.
Turbine supervisory system and control.
Burner Management system.
Controls for electrostatic precipitators.
Controls for HP/LP bypass valves.
Soot blower control.
Auxiliary pressure reduction and de-superheating system.
Balance of Plant station controls.
Gas control system.

SWITCHGEAR
Switchgear of various types for indoor and outdoor applications and voltage
ratings up to 400 kV.
Minimum oil circuit breakers (66kV - 132kV).
SF6 circuit breakers (132 kV - 400 kV).
Vacuum circuit breakers (3.3 kV - 33 kV).
Gas insulated switchgears (145 kV).
BUS DUCTS
Bus-ducts with associated equipment to suit generator power output of utilities
of up to 800 MW capacity.
TRANSFOMERS
Power transformers for voltage up to 765 kV.
HVDC transformers and reactors up to ± 500 kV rating.
Series and shunt reactors of up to 400 kV rating and 765 kV is under
development.
Instrument transformers :
- Current transformers up to 400 to kV144.
- Electro-magnetic voltage transformers up to220 kV.
Capacitor voltage transformers up to 400 kV.
Cast resin dry type transformers up to 10 MVA 33 kV.
Special transformers for: earthing; furnace; rectifier ;electrostatic
precipitator;freight loco, AC EMU and\ traction.
INSULATORS
High-tension ceramic insulators.
- Disc/suspension insulators for AC/DC applications, ranging from 45 to
400 kN electromechanical strength, for clean and polluted atmospheres.
- Pin insulators up to 33 kV including radio free design.
- Post insulators suitable for applications up to220 kV stacks.
- Hollow porcelains up to 400 kV for Transformers, SF6 circuit breakers.
- Solid core porcelain insulators for 25 kV Railway Traction.
- Solid core insulators up to 400 kV for Bus Post & Isolators for substation
applications.
- Composite Insulators for 25 kV Railway Traction and up to 400 kV
transmission lines.
Disc insulators for 800 kV AC and ± 500 kV HVDC transmission lines (BHEL is
the first Indian manufacturer to supply such insulators).
INDUSTRIAL AND SPECIAL CERAMICS
High-performance ceramics for special applications like: alumina, substrates,
crucibles, pebbles, metal ceramic jointing components, etc.
Cordierite Honeycomb 80 to 400 cpsi in different contours and lengths for
various applications including petrol and diesel vehicles.
CAPACITORS
Power capacitors for industrial and power systemsof up to 250 kVA rating for
application up to 400 kV.
Coupling/CVT capacitors for voltages up to 400 kV.
CAPSWITCH – solid state switch for on/off control of capacitor banks – for LT
applications.
ELECTRICAL MACHINES
AC squirrel cage, slipring, synchronous motors, industrial alternators and DC
machines are manufactured as per range summarised below. Specialpurpose
machines are manufactured on request.
AC Machines for Safe Area Application
- Induction Motors Squirrel cage 150 to 35000 kW Slipring 150 to 15000
kW.
- Synchronous motors 1000 to 17500 kW.
- Variable-Speed drives Synchronous motors 1000 to 17500 kW Induction
motors 200 to 35000 kW
AC Machines for Hazardous Area Application.

- Flame-proof motors (Ex.’D’) 150 to 1600 kW.
- Pressurised (Ex. ‘P’) 150 kW and above.
- Non-sparking (Ex. ‘N’)Variable speed.
- Increased safety (Ex. ‘E’) Synchronous and Squirrel Cage.
DC Machines
- Mill Duty 3.5 to 186 kW
- Medium/Large 75 to 12000 kW.
Industrial Alternators steam turbine, gas turbine and diesel engine driven .2000
kVA to 60,000 kVA
Voltage & Enclosure
- Voltage AC-415 V to 13800 V DC - up to 1200 V.
Enclosure SPDP, CACW, CACA, TETV.
COMPRESSORS
Centrifugal compressors of varying sizes, driven by steam turbine/gas
turbine/motor, for industrial applications handling almost all types of
gases;range covers pressure up to 800 kg/cm2 and capacity upto 350,000
Nm3/hour.
CONTROL GEAR
Industrial Control gear.
- Control panels and cubicles for applications insteel, aluminium, cement,
paper, rubber,mining, sugar and petrochemical industries.
- Liquid rotor starters for slipring induction motorsof up to 2500 hp rating.
Liquid regulators for variable-speed motors.
Contractors
- LT air break type AC for voltages up to 660 V.
- LT air break type DC contactors for voltages up to 600 V.
HT vacuum type AC for voltages up to 11kV.

Traction Control gear
Control gear equipment for railways and other traction applications.
Control and Relay Panels
- Control Panels for voltages up to 400 kV and control desks for generating
stations and EHV substations.
- Control and relay boards
- Turbine gauge boards for thermal, gas, hydroand nuclear sets.
- Turbine electrical control cubicles.
- Outdoor-type control panels and marshalling kiosks, swinging type
synchronising panel and mobile synchronising trolley.
Transformer tap-changer panels.
SILICON RECTIFIERS
Silicon power rectifiers with matching transformers for industrial applications
like aluminium/copper/ zinc smelting, for electrolysis in chemical industry and
AC/DC traction application.
THYRISTOR GTO/IGBT EQUIPMENT
Thyristor converter/inverter equipment for DCdrives and synchronous motors.
Thyristor high current/high voltage power supplies.
Static AC variable-speed drive systems using GTO/IGBT.
Thyristor valves and controls for HVDCtransmission.
High frequency induction heating equipment.
Thyristor valves and controls for reactive power management.
POWER DEVICES
High-power capacity silicon diodes, thyristor devices and solar photovoltaic
cells.
TRANSPORTATION EQUIPMENT
AC electric locomotives.
AC-DC dual voltage electric locomotives.
Diesel-electric locomotives
Diesel hydraulic locomotives.
OHE recording-cum-test car.
Electric traction equipment (for conventional DC drive well as 3-phase AC
drives, diesel/electric locos, electric multiple units, diesel multiple units and
urban transportation systems).
Traction motors.
Transformers smoothing reactors.
Traction generators/alternators.
Rectifiers.
Bogies.
Vacuum circuit breakers.
Auxiliary machines.
Microprocessor-based electronic control equipment.
Power converter/inverter.
Static inverter for auxiliary supply.
Locomotive control resistances i.e. field diverters, dynamic braking resistors
and inductive shunts.
Dynamic track stabilizers.
Ballast cleaning machines.
Traction control gear.
Vessel Traffic Management system.
Ceramic catalytic converter for pollution control.
OIL FIELD EQUIPMENT
Oil Rigs –A variety of on-shore rigs, work-over rigs, mobile rigs, helirigs, desert
rigs for drilling up to depths of 9,000 m, complete with matching draw-works
and hoisting equipment including:

- Mast and substructure.
- Rotating equipment.
- Mud System including pumps.
- Power packs and rig electrics
- Rig instrumentation.
Rig utilities and accessories 146.
Well Heads and Christmas Trees/sub-sea equipment:
- Well Heads and X-Mas Trees for working pressures up to 10,000 psi.
- Choke and kill manifolds
- Mud valves.
- Full bore valves.
- Block valves.
- Mudline suspension system.
- Casing support system.
Sub-sea Well Heads.
CASTINGS AND FORGINGS
Sophisticated heavy castings and forgings of creep resistant alloy
steels,stainless steel and other grades of alloy steels meeting stringent
international specifications.
SEAMLESS STEEL TUBES
Hot-finished and cold-drawn seamless steel tubes with a range varying from
outer diameter of 19 to 133 mm and wall thickness of 2 to 12.5 mm, in carbon
steel and low-alloy steels to suit ASTM/API and other international
specifications.
Studded tubes
Extended surface tubes for high-performance heat transfer applications.
Spiral finned tubes
High-frequency resistance welded finned tubes for heat recovery steam
generators, economisers and heat furnaces.
DISTRIBUTED POWER GENERATION AND SMALL HYDRO PLANTS

Wind electric generator of up to 250 kW rating.
Solar PV systems and power plants.
Solar pumps.
Solar water heating system.
Solar lanterns, home lighting and street lighting
Small hydro power plants up to 25 MW station capacity.
SYSTEMS AND SERVICES
Power Generation Systems.
- Turnkey power stations.
- Combined-cycle power plants.
- Cogeneration systems.
Modernization and Rehabilitation of power stations.
Transmission systems
- Sub-stations/switchyards.
- HVDC transmission systems.
- Shunt and Series compensation systems.
- Power system analysis and controls.
FACTS & CSR.
Distribution systems
- Substations
- Automation
Remote metering
Transportation system
- Traction systems.
Urban transportation systems.
Industrial systems
Industrial drives and control systems.
Erection, commissioning, operation and maintenance services, spares
management and consultancy services for all the above systems.

RATIO ANALYSIS
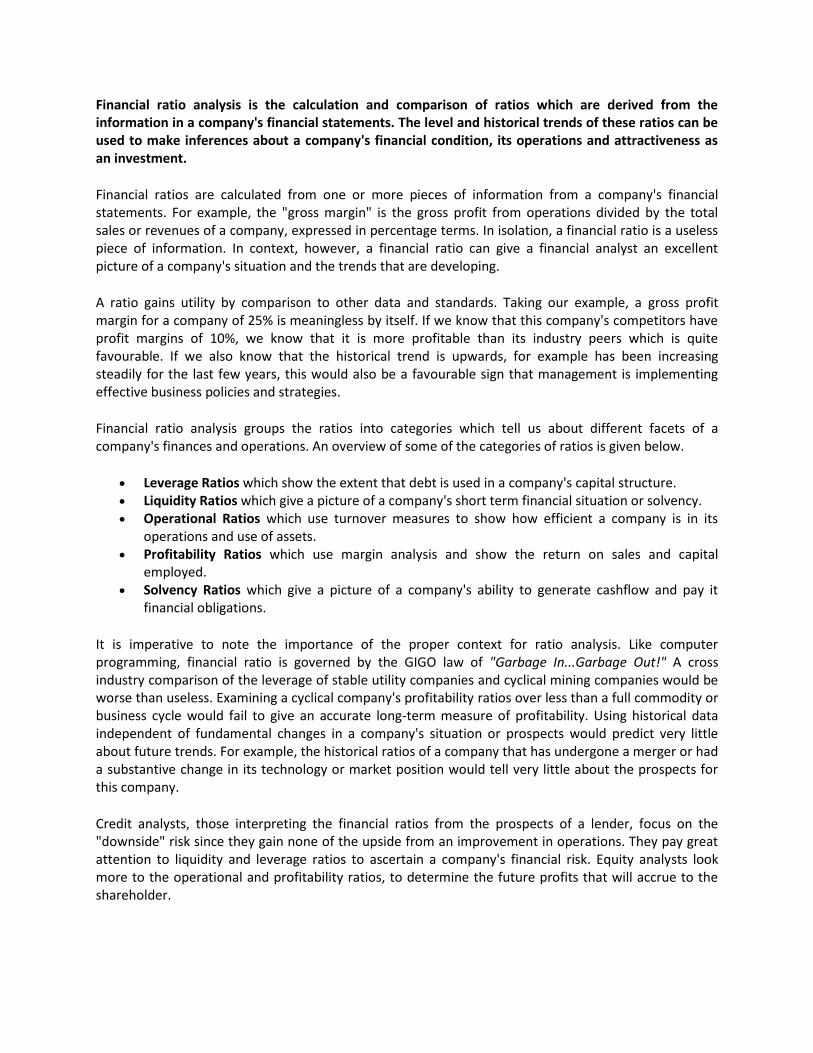
Financial ratio analysis is the calculation and comparison of ratios which are derived from the information in a company's financial statements. The level and historical trends of these ratios can be used to make inferences about a company's financial condition, its operations and attractiveness as an investment.
Financial ratios are calculated from one or more pieces of information from a company's financial statements. For example, the "gross margin" is the gross profit from operations divided by the total sales or revenues of a company, expressed in percentage terms. In isolation, a financial ratio is a useless piece of information. In context, however, a financial ratio can give a financial analyst an excellent picture of a company's situation and the trends that are developing.
A ratio gains utility by comparison to other data and standards. Taking our example, a gross profit margin for a company of 25% is meaningless by itself. If we know that this company's competitors have profit margins of 10%, we know that it is more profitable than its industry peers which is quite favourable. If we also know that the historical trend is upwards, for example has been increasing steadily for the last few years, this would also be a favourable sign that management is implementing effective business policies and strategies.
Financial ratio analysis groups the ratios into categories which tell us about different facets of a company's finances and operations. An overview of some of the categories of ratios is given below.
Leverage Ratios which show the extent that debt is used in a company's capital structure. Liquidity Ratios which give a picture of a company's short term financial situation or solvency. Operational Ratios which use turnover measures to show how efficient a company is in its
operations and use of assets. Profitability Ratios which use margin analysis and show the return on sales and capital
employed. Solvency Ratios which give a picture of a company's ability to generate cashflow and pay it
financial obligations.
It is imperative to note the importance of the proper context for ratio analysis. Like computer programming, financial ratio is governed by the GIGO law of "Garbage In...Garbage Out!" A cross industry comparison of the leverage of stable utility companies and cyclical mining companies would be worse than useless. Examining a cyclical company's profitability ratios over less than a full commodity or business cycle would fail to give an accurate long-term measure of profitability. Using historical data independent of fundamental changes in a company's situation or prospects would predict very little about future trends. For example, the historical ratios of a company that has undergone a merger or had a substantive change in its technology or market position would tell very little about the prospects for this company.
Credit analysts, those interpreting the financial ratios from the prospects of a lender, focus on the "downside" risk since they gain none of the upside from an improvement in operations. They pay great attention to liquidity and leverage ratios to ascertain a company's financial risk. Equity analysts look more to the operational and profitability ratios, to determine the future profits that will accrue to the shareholder.

Although financial ratio analysis is well-developed and the actual ratios are well-known, practicing financial analysts often develop their own measures for particular industries and even individual companies. Analysts will often differ drastically in their conclusions from the same ratio analysis.
The Balance Sheet and the Statement of Income are essential, but they are only the starting point for successful financial management. Apply Ratio Analysis to Financial Statements to analyze the success, failure, and progress of your business.
Ratio Analysis enables the business owner/manager to spot trends in a business and to compare its performance and condition with the average performance of similar businesses in the same industry. To do this compare your ratios with the average of businesses similar to yours and compare your own ratios for several successive years, watching especially for any unfavorable trends that may be starting. Ratio analysis may provide the all-important early warning indications that allow you to solve your business problems before your business is destroyed by them.
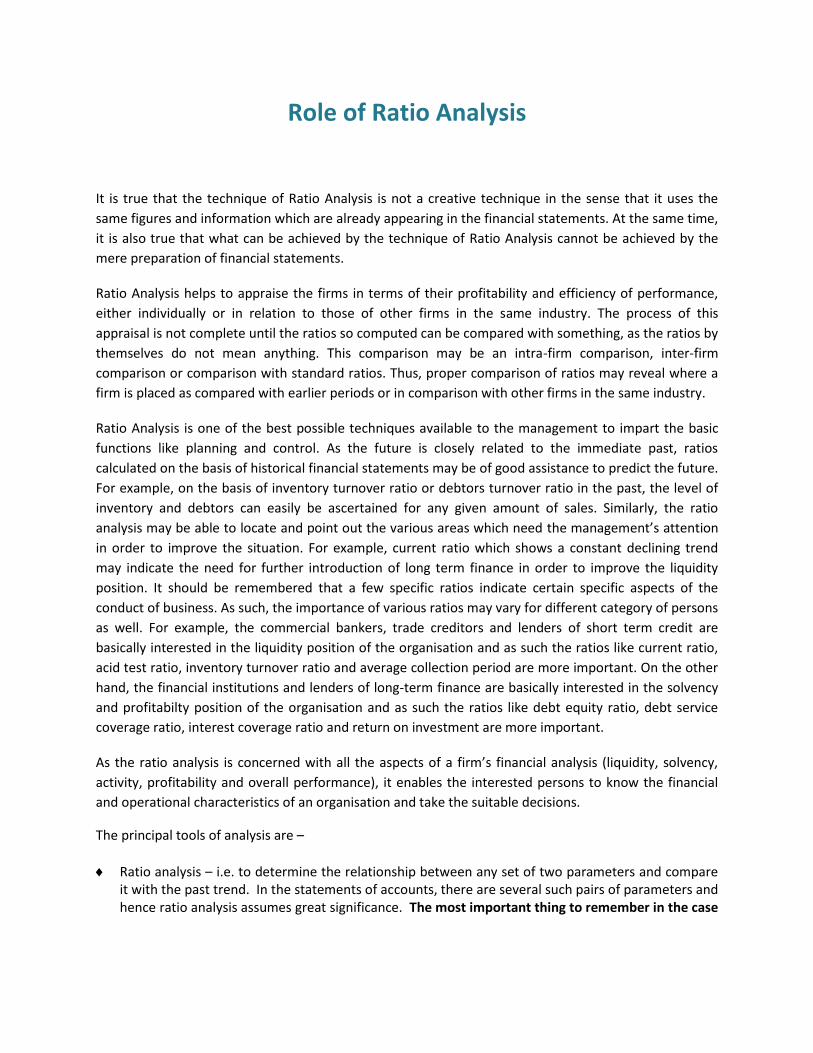
Role of Ratio Analysis
It is true that the technique of Ratio Analysis is not a creative technique in the sense that it uses the
same figures and information which are already appearing in the financial statements. At the same time,
it is also true that what can be achieved by the technique of Ratio Analysis cannot be achieved by the
mere preparation of financial statements.
Ratio Analysis helps to appraise the firms in terms of their profitability and efficiency of performance,
either individually or in relation to those of other firms in the same industry. The process of this
appraisal is not complete until the ratios so computed can be compared with something, as the ratios by
themselves do not mean anything. This comparison may be an intra-firm comparison, inter-firm
comparison or comparison with standard ratios. Thus, proper comparison of ratios may reveal where a
firm is placed as compared with earlier periods or in comparison with other firms in the same industry.
Ratio Analysis is one of the best possible techniques available to the management to impart the basic
functions like planning and control. As the future is closely related to the immediate past, ratios
calculated on the basis of historical financial statements may be of good assistance to predict the future.
For example, on the basis of inventory turnover ratio or debtors turnover ratio in the past, the level of
inventory and debtors can easily be ascertained for any given amount of sales. Similarly, the ratio
analysis may be able to locate and point out the various areas which need the management’s attention
in order to improve the situation. For example, current ratio which shows a constant declining trend
may indicate the need for further introduction of long term finance in order to improve the liquidity
position. It should be remembered that a few specific ratios indicate certain specific aspects of the
conduct of business. As such, the importance of various ratios may vary for different category of persons
as well. For example, the commercial bankers, trade creditors and lenders of short term credit are
basically interested in the liquidity position of the organisation and as such the ratios like current ratio,
acid test ratio, inventory turnover ratio and average collection period are more important. On the other
hand, the financial institutions and lenders of long-term finance are basically interested in the solvency
and profitabilty position of the organisation and as such the ratios like debt equity ratio, debt service
coverage ratio, interest coverage ratio and return on investment are more important.
As the ratio analysis is concerned with all the aspects of a firm’s financial analysis (liquidity, solvency,
activity, profitability and overall performance), it enables the interested persons to know the financial
and operational characteristics of an organisation and take the suitable decisions.
The principal tools of analysis are –
Ratio analysis – i.e. to determine the relationship between any set of two parameters and compare it with the past trend. In the statements of accounts, there are several such pairs of parameters and hence ratio analysis assumes great significance. The most important thing to remember in the case
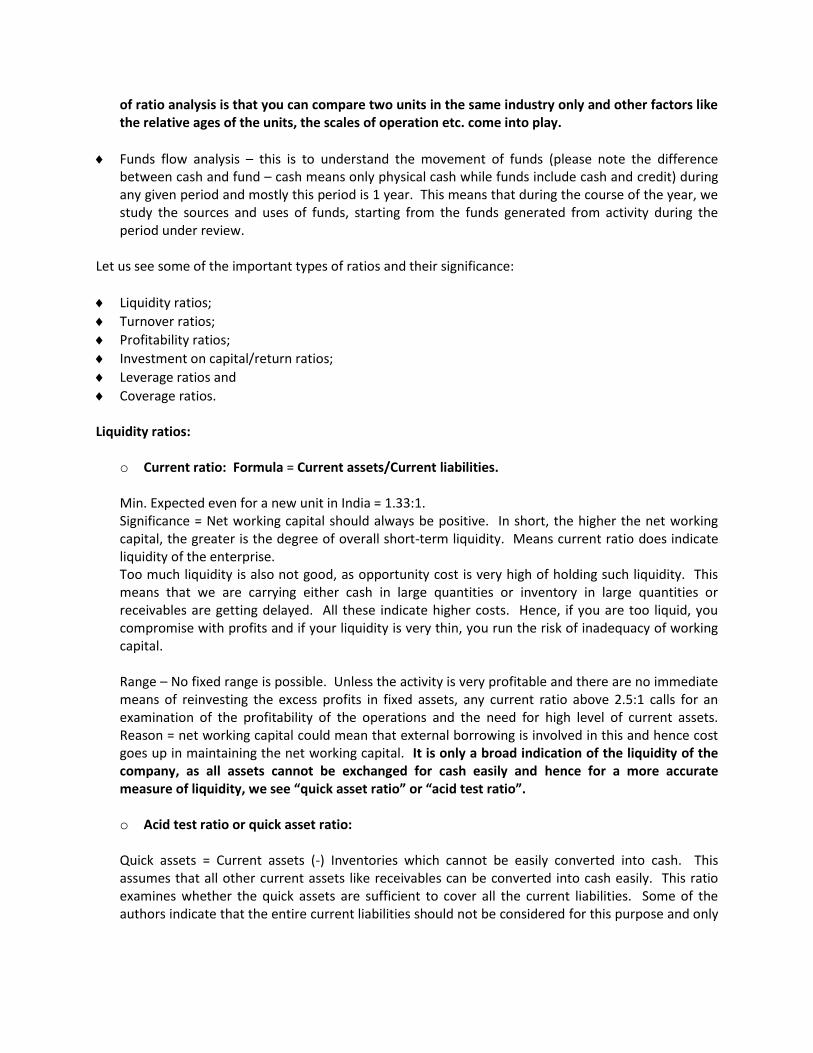
of ratio analysis is that you can compare two units in the same industry only and other factors like the relative ages of the units, the scales of operation etc. come into play.
Funds flow analysis – this is to understand the movement of funds (please note the difference between cash and fund – cash means only physical cash while funds include cash and credit) during any given period and mostly this period is 1 year. This means that during the course of the year, we study the sources and uses of funds, starting from the funds generated from activity during the period under review.
Let us see some of the important types of ratios and their significance:
Liquidity ratios;
Turnover ratios;
Profitability ratios;
Investment on capital/return ratios;
Leverage ratios and
Coverage ratios. Liquidity ratios:
o Current ratio: Formula = Current assets/Current liabilities. Min. Expected even for a new unit in India = 1.33:1. Significance = Net working capital should always be positive. In short, the higher the net working capital, the greater is the degree of overall short-term liquidity. Means current ratio does indicate liquidity of the enterprise. Too much liquidity is also not good, as opportunity cost is very high of holding such liquidity. This means that we are carrying either cash in large quantities or inventory in large quantities or receivables are getting delayed. All these indicate higher costs. Hence, if you are too liquid, you compromise with profits and if your liquidity is very thin, you run the risk of inadequacy of working capital. Range – No fixed range is possible. Unless the activity is very profitable and there are no immediate means of reinvesting the excess profits in fixed assets, any current ratio above 2.5:1 calls for an examination of the profitability of the operations and the need for high level of current assets. Reason = net working capital could mean that external borrowing is involved in this and hence cost goes up in maintaining the net working capital. It is only a broad indication of the liquidity of the company, as all assets cannot be exchanged for cash easily and hence for a more accurate measure of liquidity, we see “quick asset ratio” or “acid test ratio”. o Acid test ratio or quick asset ratio:
Quick assets = Current assets (-) Inventories which cannot be easily converted into cash. This assumes that all other current assets like receivables can be converted into cash easily. This ratio examines whether the quick assets are sufficient to cover all the current liabilities. Some of the authors indicate that the entire current liabilities should not be considered for this purpose and only
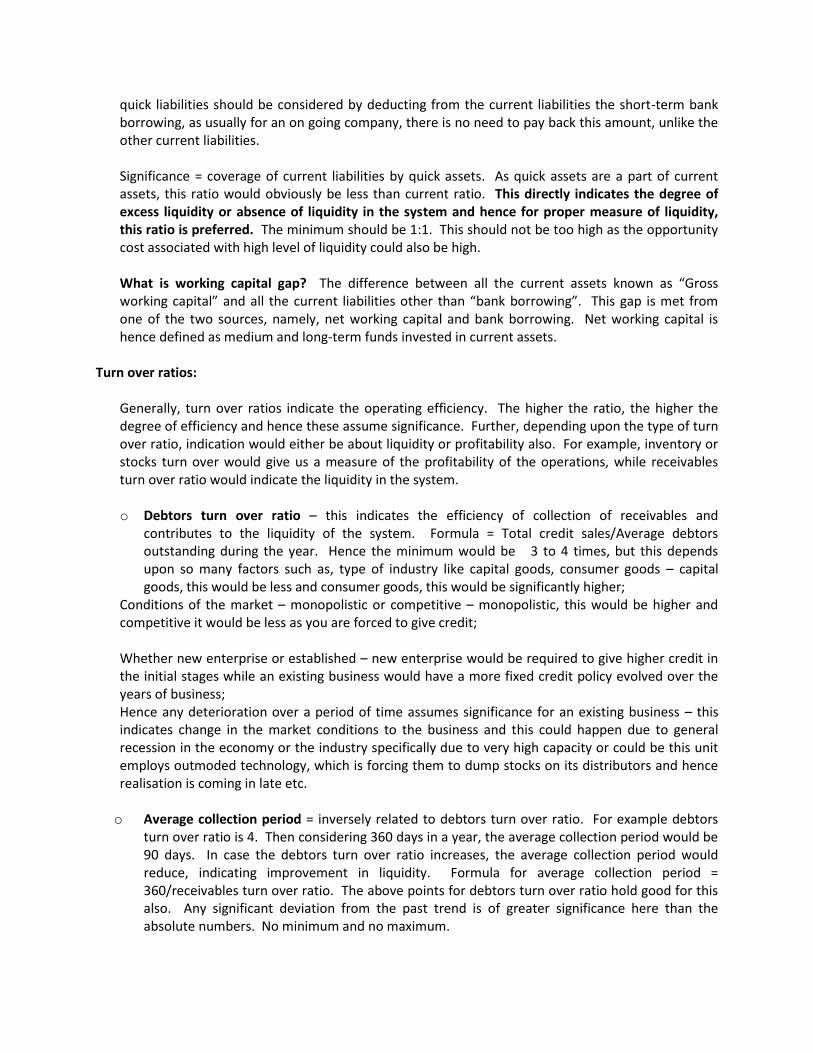
quick liabilities should be considered by deducting from the current liabilities the short-term bank borrowing, as usually for an on going company, there is no need to pay back this amount, unlike the other current liabilities. Significance = coverage of current liabilities by quick assets. As quick assets are a part of current assets, this ratio would obviously be less than current ratio. This directly indicates the degree of excess liquidity or absence of liquidity in the system and hence for proper measure of liquidity, this ratio is preferred. The minimum should be 1:1. This should not be too high as the opportunity cost associated with high level of liquidity could also be high.
What is working capital gap? The difference between all the current assets known as “Gross working capital” and all the current liabilities other than “bank borrowing”. This gap is met from one of the two sources, namely, net working capital and bank borrowing. Net working capital is hence defined as medium and long-term funds invested in current assets.
Turn over ratios:
Generally, turn over ratios indicate the operating efficiency. The higher the ratio, the higher the degree of efficiency and hence these assume significance. Further, depending upon the type of turn over ratio, indication would either be about liquidity or profitability also. For example, inventory or stocks turn over would give us a measure of the profitability of the operations, while receivables turn over ratio would indicate the liquidity in the system. o Debtors turn over ratio – this indicates the efficiency of collection of receivables and
contributes to the liquidity of the system. Formula = Total credit sales/Average debtors outstanding during the year. Hence the minimum would be 3 to 4 times, but this depends upon so many factors such as, type of industry like capital goods, consumer goods – capital goods, this would be less and consumer goods, this would be significantly higher;
Conditions of the market – monopolistic or competitive – monopolistic, this would be higher and competitive it would be less as you are forced to give credit; Whether new enterprise or established – new enterprise would be required to give higher credit in the initial stages while an existing business would have a more fixed credit policy evolved over the years of business; Hence any deterioration over a period of time assumes significance for an existing business – this indicates change in the market conditions to the business and this could happen due to general recession in the economy or the industry specifically due to very high capacity or could be this unit employs outmoded technology, which is forcing them to dump stocks on its distributors and hence realisation is coming in late etc. o Average collection period = inversely related to debtors turn over ratio. For example debtors
turn over ratio is 4. Then considering 360 days in a year, the average collection period would be 90 days. In case the debtors turn over ratio increases, the average collection period would reduce, indicating improvement in liquidity. Formula for average collection period = 360/receivables turn over ratio. The above points for debtors turn over ratio hold good for this also. Any significant deviation from the past trend is of greater significance here than the absolute numbers. No minimum and no maximum.

o Inventory turn over ratio – as said earlier, this directly contributes to the profitability of the
organisation. Formula = Cost of goods sold/Average inventory held during the year. The inventory should turn over at least 4 times in a year, even for a capital goods industry. But there are capital goods industries with a very long production cycle and in such cases, the ratio would be low. While receivables turn over contributes to liquidity, this contributes to profitability due to higher turn over. The production cycle and the corporate policy of keeping high stocks affect this ratio. The less the production cycle, the better the ratio and vice-versa. The higher the level of stocks, the lower would be the ratio and vice-versa. Cost of goods sold = Sales – profit – Interest charges.
o Current assets turn over ratio – not much of significance as the entire current assets are
involved. However, this could indicate deterioration or improvement over a period of time. Indicates operating efficiency. Formula = Cost of goods sold/Average current assets held in business during the year. There is no min. Or maximum. Again this depends upon the type of industry, market conditions, management’s policy towards working capital etc.
o Fixed assets turn over ratio
Not much of significance as fixed assets cannot contribute directly either to liquidity or profitability. This is used as a very broad parameter to compare two units in the same industry and especially when the scales of operations are quite significant. Formula = Cost of goods sold/Average value of fixed assets in the period (book value).
Profitability ratios -Profit in relation to sales and profit in relation to assets:
o Profit in relation to sales – this indicates the margin available on sales;
o Profit in relation to assets – this indicates the degree of return on the capital employed in
business that means the earning efficiency. Please appreciate that these two are totally different.

Sources of Financial Data
Financial statements (or financial reports) are formal records of the financial activities
of a business, person, or other entity. In British English, including United Kingdom
company law, financial statements are often referred to as accounts, although the term
financial statements is also used, particularly by accountants.
Financial statements provide an overview of a business or person's financial condition
in both short and long term. All the relevant financial information of a business
enterprise, presented in a structured manner and in a form easy to understand, are
called the financial statements. There are four basic financial statements:[1]
1. Balance sheet: also referred to as statement of financial position or condition,
reports on a company's assets, liabilities, and net equity as of a given point in
time.
2. Income statement: also referred to as Profit and Loss statement (or a "P&L"),
reports on a company's income, expenses, and profits over a period of time.
Profit & Loss account provide information on the operation of the enterprise.
These include sale and the various expenses incurred during the processing
state.
3. Statement of retained earnings: explains the changes in a company's retained
earnings over the reporting period.
4. Statement of cash flows: reports on a company's cash flow activities, particularly
its operating, investing and financing activities.
For large corporations, these statements are often complex and may include an
extensive set of notes to the financial statements and management discussion and
analysis. The notes typically describe each item on the balance sheet, income
statement and cash flow statement in further detail. Notes to financial statements are
considered an integral part of the financial statements.
The data has been collected from various financial statements :
Balance Sheet Profit and loss account Cash flow statement Annual report

FINANCIAL STATEMENTS
AND
RATIO ANALYSIS
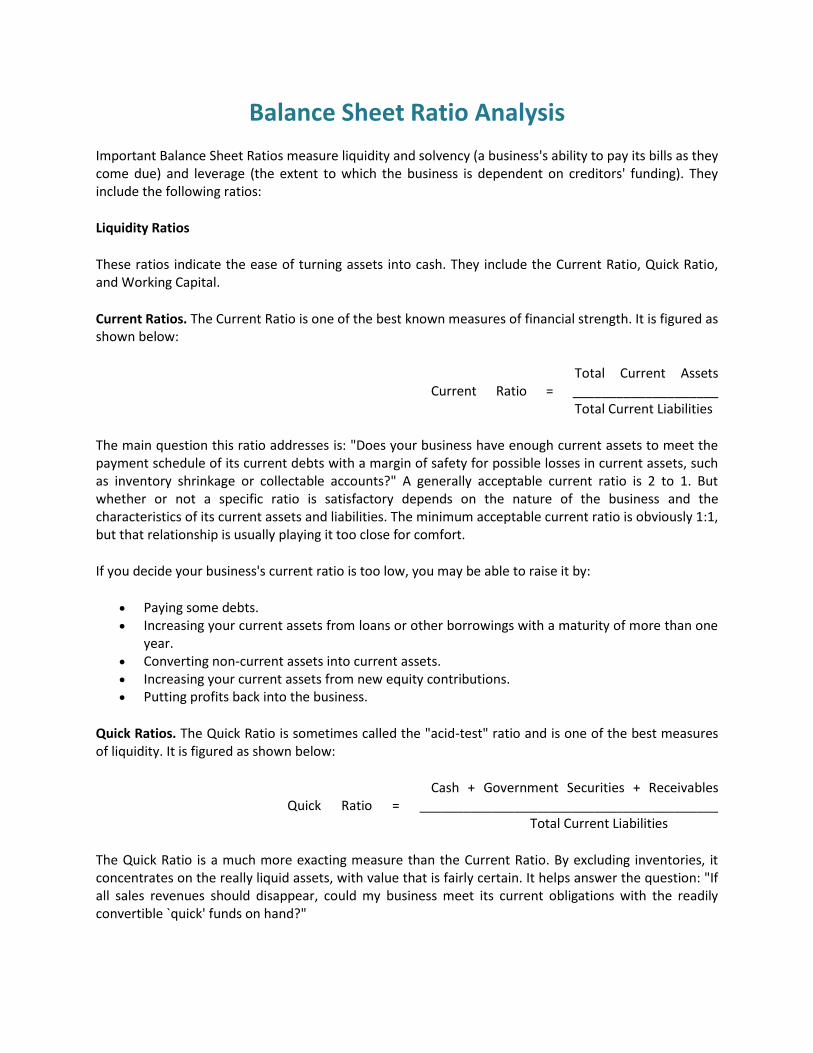
Balance Sheet Ratio Analysis
Important Balance Sheet Ratios measure liquidity and solvency (a business's ability to pay its bills as they come due) and leverage (the extent to which the business is dependent on creditors' funding). They include the following ratios:
Liquidity Ratios
These ratios indicate the ease of turning assets into cash. They include the Current Ratio, Quick Ratio, and Working Capital.
Current Ratios. The Current Ratio is one of the best known measures of financial strength. It is figured as shown below:
Total Current Assets Current Ratio = ____________________ Total Current Liabilities
The main question this ratio addresses is: "Does your business have enough current assets to meet the payment schedule of its current debts with a margin of safety for possible losses in current assets, such as inventory shrinkage or collectable accounts?" A generally acceptable current ratio is 2 to 1. But whether or not a specific ratio is satisfactory depends on the nature of the business and the characteristics of its current assets and liabilities. The minimum acceptable current ratio is obviously 1:1, but that relationship is usually playing it too close for comfort.
If you decide your business's current ratio is too low, you may be able to raise it by:
Paying some debts. Increasing your current assets from loans or other borrowings with a maturity of more than one
year. Converting non-current assets into current assets. Increasing your current assets from new equity contributions. Putting profits back into the business.
Quick Ratios. The Quick Ratio is sometimes called the "acid-test" ratio and is one of the best measures of liquidity. It is figured as shown below:
Cash + Government Securities + Receivables Quick Ratio = _________________________________________ Total Current Liabilities
The Quick Ratio is a much more exacting measure than the Current Ratio. By excluding inventories, it concentrates on the really liquid assets, with value that is fairly certain. It helps answer the question: "If all sales revenues should disappear, could my business meet its current obligations with the readily convertible `quick' funds on hand?"
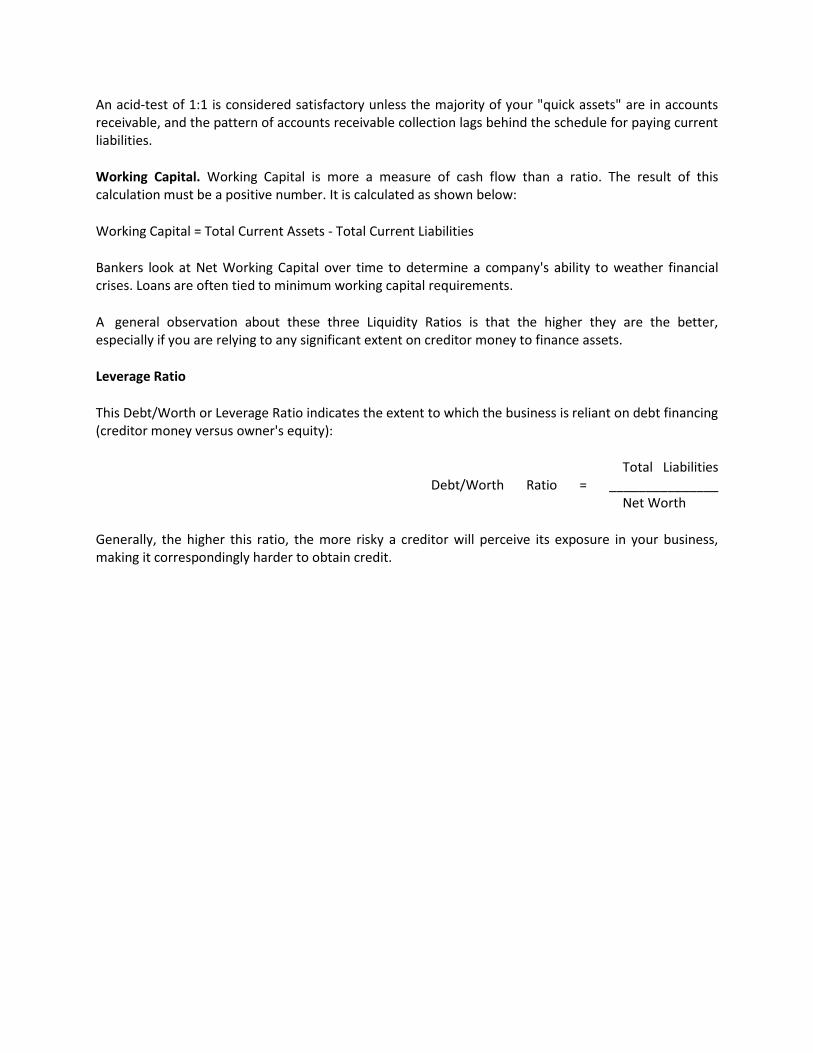
An acid-test of 1:1 is considered satisfactory unless the majority of your "quick assets" are in accounts receivable, and the pattern of accounts receivable collection lags behind the schedule for paying current liabilities.
Working Capital. Working Capital is more a measure of cash flow than a ratio. The result of this calculation must be a positive number. It is calculated as shown below:
Working Capital = Total Current Assets - Total Current Liabilities
Bankers look at Net Working Capital over time to determine a company's ability to weather financial crises. Loans are often tied to minimum working capital requirements.
A general observation about these three Liquidity Ratios is that the higher they are the better, especially if you are relying to any significant extent on creditor money to finance assets.
Leverage Ratio
This Debt/Worth or Leverage Ratio indicates the extent to which the business is reliant on debt financing (creditor money versus owner's equity):
Total Liabilities Debt/Worth Ratio = _______________ Net Worth
Generally, the higher this ratio, the more risky a creditor will perceive its exposure in your business, making it correspondingly harder to obtain credit.
Income Statement Ratio Analysis
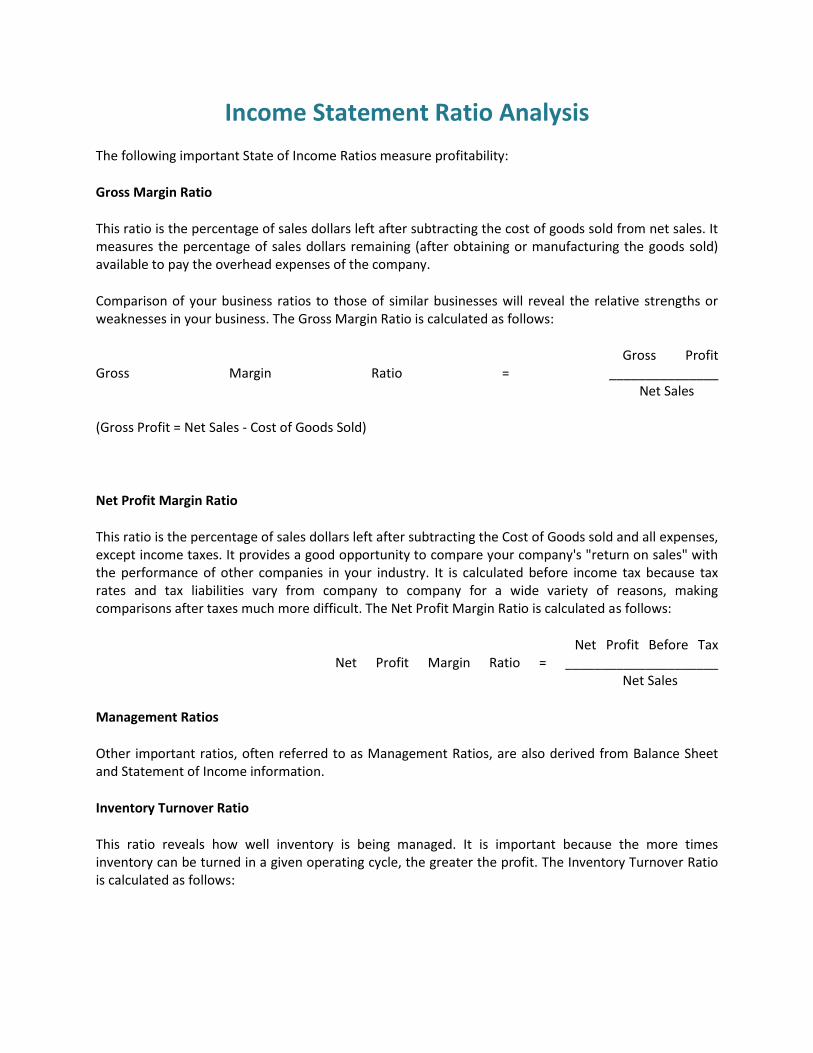
The following important State of Income Ratios measure profitability:
Gross Margin Ratio
This ratio is the percentage of sales dollars left after subtracting the cost of goods sold from net sales. It measures the percentage of sales dollars remaining (after obtaining or manufacturing the goods sold) available to pay the overhead expenses of the company.
Comparison of your business ratios to those of similar businesses will reveal the relative strengths or weaknesses in your business. The Gross Margin Ratio is calculated as follows:
Gross Profit Gross Margin Ratio = _______________ Net Sales
(Gross Profit = Net Sales - Cost of Goods Sold)
Net Profit Margin Ratio
This ratio is the percentage of sales dollars left after subtracting the Cost of Goods sold and all expenses, except income taxes. It provides a good opportunity to compare your company's "return on sales" with the performance of other companies in your industry. It is calculated before income tax because tax rates and tax liabilities vary from company to company for a wide variety of reasons, making comparisons after taxes much more difficult. The Net Profit Margin Ratio is calculated as follows:
Net Profit Before Tax Net Profit Margin Ratio = _____________________ Net Sales
Management Ratios
Other important ratios, often referred to as Management Ratios, are also derived from Balance Sheet and Statement of Income information.
Inventory Turnover Ratio
This ratio reveals how well inventory is being managed. It is important because the more times inventory can be turned in a given operating cycle, the greater the profit. The Inventory Turnover Ratio is calculated as follows:
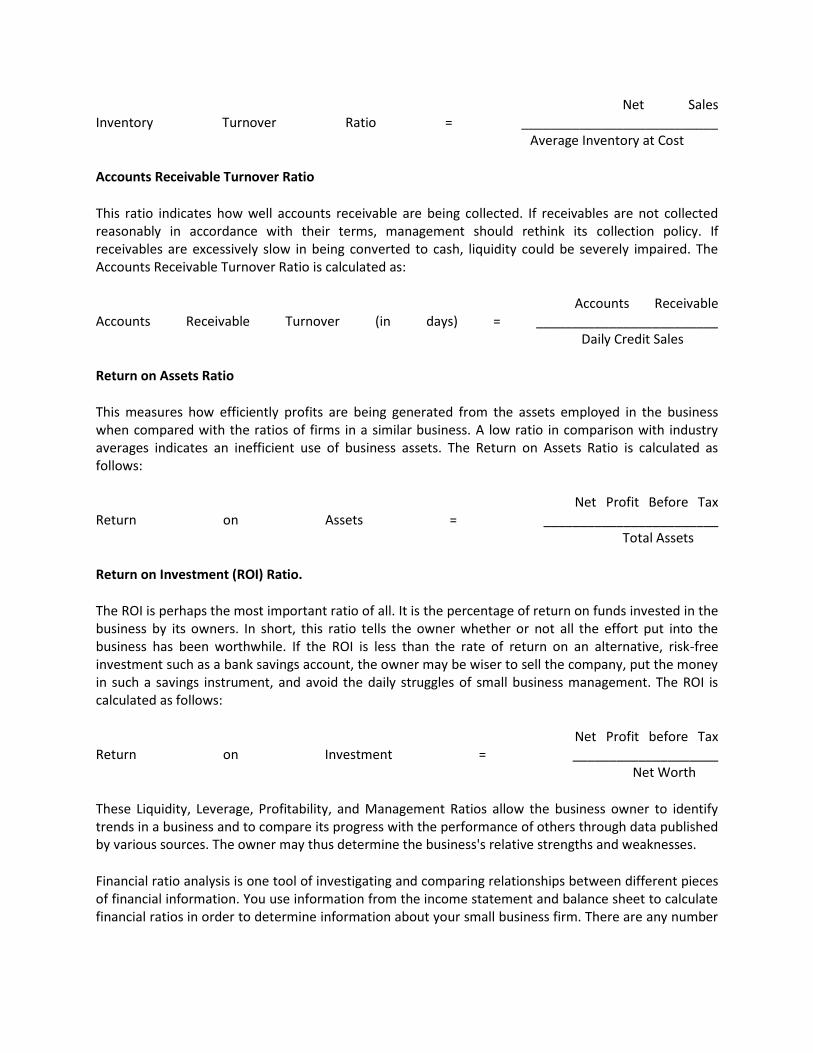
Net Sales Inventory Turnover Ratio = ___________________________ Average Inventory at Cost
Accounts Receivable Turnover Ratio
This ratio indicates how well accounts receivable are being collected. If receivables are not collected reasonably in accordance with their terms, management should rethink its collection policy. If receivables are excessively slow in being converted to cash, liquidity could be severely impaired. The Accounts Receivable Turnover Ratio is calculated as:
Accounts Receivable Accounts Receivable Turnover (in days) = _________________________ Daily Credit Sales
Return on Assets Ratio
This measures how efficiently profits are being generated from the assets employed in the business when compared with the ratios of firms in a similar business. A low ratio in comparison with industry averages indicates an inefficient use of business assets. The Return on Assets Ratio is calculated as follows:
Net Profit Before Tax Return on Assets = ________________________ Total Assets
Return on Investment (ROI) Ratio.
The ROI is perhaps the most important ratio of all. It is the percentage of return on funds invested in the business by its owners. In short, this ratio tells the owner whether or not all the effort put into the business has been worthwhile. If the ROI is less than the rate of return on an alternative, risk-free investment such as a bank savings account, the owner may be wiser to sell the company, put the money in such a savings instrument, and avoid the daily struggles of small business management. The ROI is calculated as follows:
Net Profit before Tax Return on Investment = ____________________ Net Worth
These Liquidity, Leverage, Profitability, and Management Ratios allow the business owner to identify trends in a business and to compare its progress with the performance of others through data published by various sources. The owner may thus determine the business's relative strengths and weaknesses.
Financial ratio analysis is one tool of investigating and comparing relationships between different pieces of financial information. You use information from the income statement and balance sheet to calculate financial ratios in order to determine information about your small business firm. There are any number

of ratios you could calculate. To solve that problem, there are some standard ratios that most business firms use.
The problem with ratios is that they are useless unless they are compared to something. For example, if you calculate your firm’s debt ratio for one time period (let’s say a year) and it’s 50%. What does that really mean? All you can take from that is that, since the debt ratio is Total Liabilities/Total Assets, 50% of your firm’s assets are financed by debt. You don’t know if that is good or bad unless you have something to compare that 50% to.
Trend and Industry Analysis
That’s where trend (time-series) and industry (cross-sectional) analysis come in. You can compare your firm’s ratios to trend data, which is data from other time periods for your firm, to see how your firm is doing over a series of time periods.
You can also compare your firm’s ratios to industry data. You can gather data from similar firms in the same industry, calculate their financial ratios, and see how your firm is doing compared to the industry at large. Ideally, to get a good picture of the financial picture of your firm, you should do both.
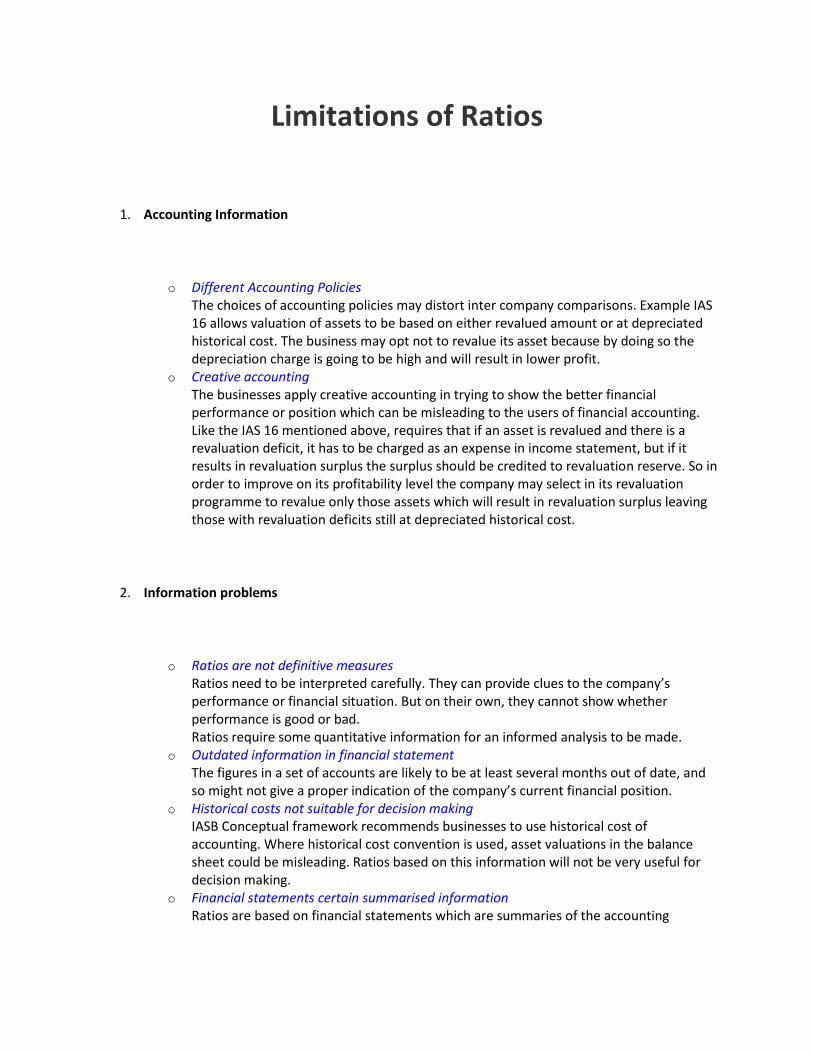
Limitations of Ratios
1. Accounting Information
o Different Accounting Policies The choices of accounting policies may distort inter company comparisons. Example IAS 16 allows valuation of assets to be based on either revalued amount or at depreciated historical cost. The business may opt not to revalue its asset because by doing so the depreciation charge is going to be high and will result in lower profit.
o Creative accounting The businesses apply creative accounting in trying to show the better financial performance or position which can be misleading to the users of financial accounting. Like the IAS 16 mentioned above, requires that if an asset is revalued and there is a revaluation deficit, it has to be charged as an expense in income statement, but if it results in revaluation surplus the surplus should be credited to revaluation reserve. So in order to improve on its profitability level the company may select in its revaluation programme to revalue only those assets which will result in revaluation surplus leaving those with revaluation deficits still at depreciated historical cost.
2. Information problems
o Ratios are not definitive measures Ratios need to be interpreted carefully. They can provide clues to the company’s performance or financial situation. But on their own, they cannot show whether performance is good or bad. Ratios require some quantitative information for an informed analysis to be made.
o Outdated information in financial statement The figures in a set of accounts are likely to be at least several months out of date, and so might not give a proper indication of the company’s current financial position.
o Historical costs not suitable for decision making IASB Conceptual framework recommends businesses to use historical cost of accounting. Where historical cost convention is used, asset valuations in the balance sheet could be misleading. Ratios based on this information will not be very useful for decision making.
o Financial statements certain summarised information Ratios are based on financial statements which are summaries of the accounting

records. Through the summarisation some important information may be left out which could have been of relevance to the users of accounts. The ratios are based on the summarised year end information which may not be a true reflection of the overall year’s results.
o Interpretation of the ratio It is difficult to generalise about whether a particular ratio is ‘good’ or ‘bad’. For example a high current ratio may indicate a strong liquidity position, which is good or excessive cash which is bad. Similarly Non current assets turnover ratio may denote either a firm that uses its assets efficiently or one that is under capitalised and cannot afford to buy enough assets.
3. Comparison of performance over time o Price changes
Inflation renders comparisons of results over time misleading as financial figures will not be within the same levels of purchasing power. Changes in results over time may show as if the enterprise has improved its performance and position when in fact after adjusting for inflationary changes it will show the different picture.
o Technology changes When comparing performance over time, there is need to consider the changes in technology. The movement in performance should be in line with the changes in technology. For ratios to be more meaningful the enterprise should compare its results with another of the same level of technology as this will be a good basis measurement of efficiency.
o Changes in Accounting policy Changes in accounting policy may affect the comparison of results between different accounting years as misleading. The problem with this situation is that the directors may be able to manipulate the results through the changes in accounting policy. This would be done to avoid the effects of an old accounting policy or gain the effects of a new one. It is likely to be done in a sensitive period, perhaps when the business’s profits are low.
o Changes in Accounting standard Accounting standards offers standard ways of recognising, measuring and presenting financial transactions. Any change in standards will affect the reporting of an enterprise and its comparison of results over a number of years.
o Impact of seasons on trading As stated above, the financial statements are based on year end results which may not be true reflection of results year round. Businesses which are affected by seasons can choose the best time to produce financial statements so as to show better results. For example, a tobacco growing company will be able to show good results if accounts are produced in the selling season. This time the business will have good inventory levels, receivables and bank balances will be at its highest. While as in planting seasons the company will have a lot of liabilities through the purchase of farm inputs, low cash balances and even nil receivables.

4. Inter-firm comparison o Different financial and business risk profile
No two companies are the same, even when they are competitors in the same industry or market. Using ratios to compare one company with another could provide misleading information. Businesses may be within the same industry but having different financial and business risk. One company may be able to obtain bank loans at reduced rates and may show high gearing levels while as another may not be successful in obtaining cheap rates and it may show that it is operating at low gearing level. To un informed analyst he may feel like company two is better when in fact its low gearing level is because it can not be able to secure further funding.
o Different capital structures and size Companies may have different capital structures and to make comparison of performance when one is all equity financed and another is a geared company it may not be a good analysis.
o Impact of Government influence Selective application of government incentives to various companies may also distort intercompany comparison. One company may be given a tax holiday while the other within the same line of business not, comparing the performance of these two enterprises may be misleading.
o Window dressing These are techniques applied by an entity in order to show a strong financial position. For example, MZ Trucking can borrow on a two year basis, K10 Million on 28th December 2003, holding the proceeds as cash, then pay off the loan ahead of time on 3rd January 2004. This can improve the current and quick ratios and make the 2003 balance sheet look good. However the improvement was strictly window dressing as a week later the balance sheet is at its old position.
Ratio analysis is useful, but analysts should be aware of these problems and make adjustments as necessary. Ratios analysis conducted in a mechanical, unthinking manner is dangerous, but if used intelligently and with good judgement, it can provide useful insights into the firm’s operations.

GRAPHICAL
AND
DATA ANALYSIS
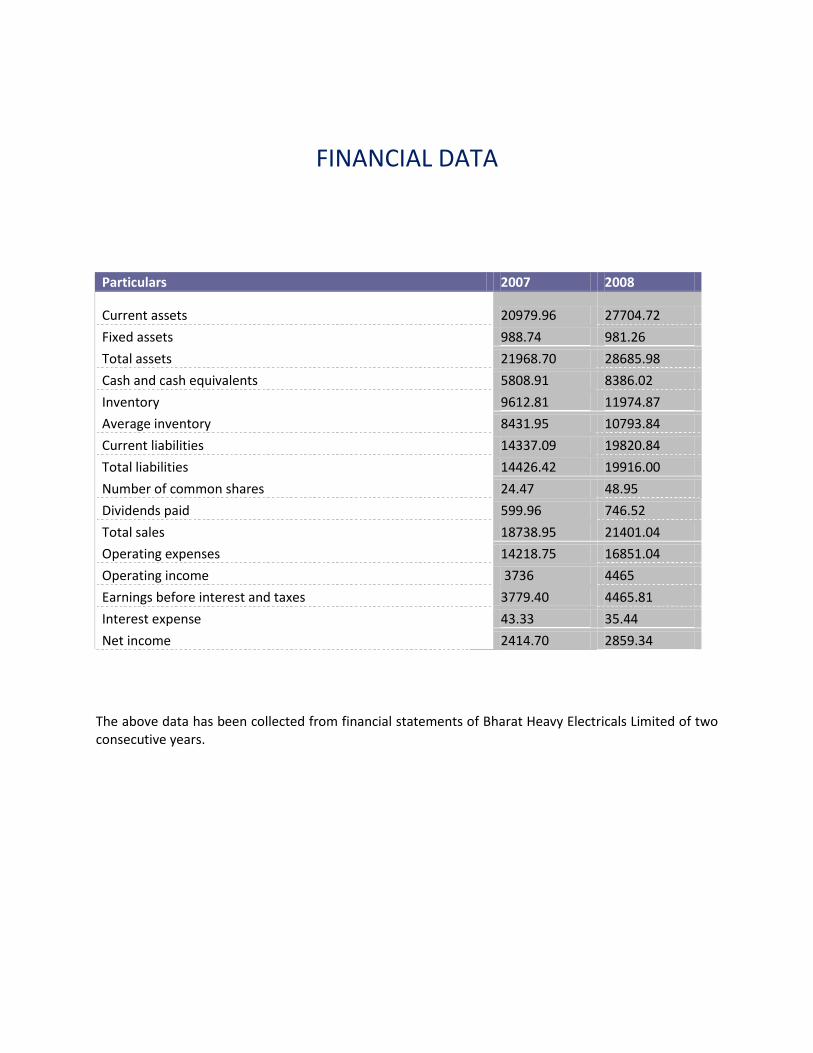
FINANCIAL DATA
The above data has been collected from financial statements of Bharat Heavy Electricals Limited of two consecutive years.
Particulars 2007 2008
Current assets 20979.96 27704.72
Fixed assets 988.74 981.26
Total assets 21968.70 28685.98
Cash and cash equivalents 5808.91 8386.02
Inventory 9612.81 11974.87
Average inventory 8431.95 10793.84
Current liabilities 14337.09 19820.84
Total liabilities 14426.42 19916.00
Number of common shares 24.47 48.95
Dividends paid 599.96 746.52
Total sales 18738.95 21401.04
Operating expenses 14218.75 16851.04
Operating income 3736 4465
Earnings before interest and taxes 3779.40 4465.81
Interest expense 43.33 35.44
Net income 2414.70 2859.34
RATIO ANALYSIS OF B.H.E.L
Various Financial Ratio Analysis are used to analyse the financial performance of BHEL for the year 2007-08.
LIQUIDITY RATIOS Liquidity ratios help in determining the ability of a firm to meet its short term obligations.
CURRENT RATIO
Current Ratio = Current Asset / Current Liability
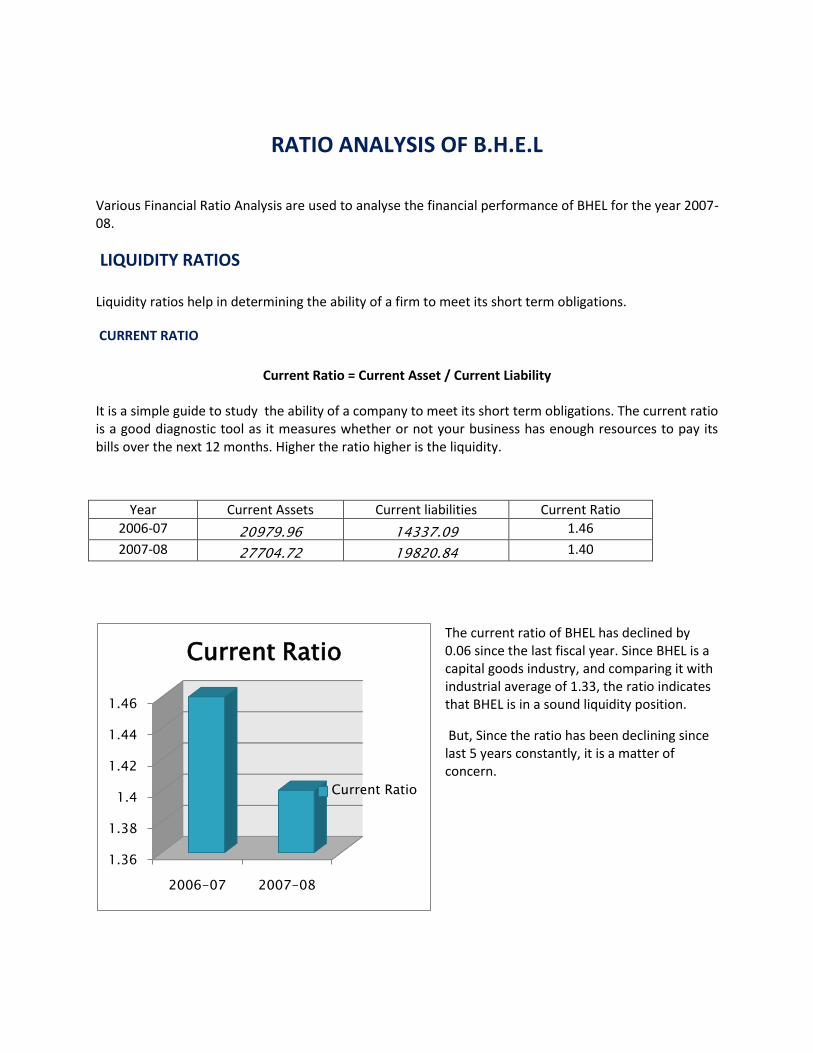
It is a simple guide to study the ability of a company to meet its short term obligations. The current ratio is a good diagnostic tool as it measures whether or not your business has enough resources to pay its bills over the next 12 months. Higher the ratio higher is the liquidity.
Year Current Assets Current liabilities Current Ratio
2006-07 20979.96 14337.09 1.46
2007-08 27704.72 19820.84 1.40
The current ratio of BHEL has declined by 0.06 since the last fiscal year. Since BHEL is a capital goods industry, and comparing it with industrial average of 1.33, the ratio indicates that BHEL is in a sound liquidity position.
But, Since the ratio has been declining since last 5 years constantly, it is a matter of concern.
1.36
1.38
1.4
1.42
1.44
1.46
2006-07 2007-08
Current Ratio
Current Ratio
LIQUID RATIO
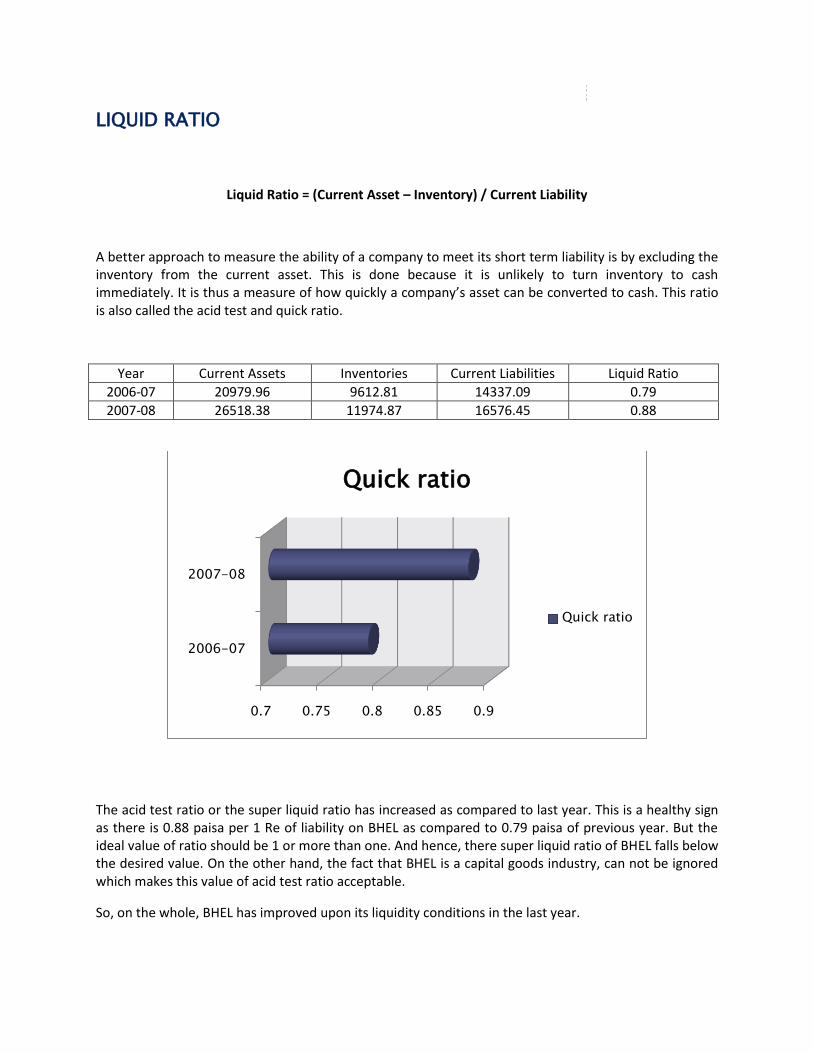
Liquid Ratio = (Current Asset – Inventory) / Current Liability
A better approach to measure the ability of a company to meet its short term liability is by excluding the inventory from the current asset. This is done because it is unlikely to turn inventory to cash immediately. It is thus a measure of how quickly a company’s asset can be converted to cash. This ratio is also called the acid test and quick ratio.
Year Current Assets Inventories Current Liabilities Liquid Ratio
2006-07 20979.96 9612.81 14337.09 0.79
2007-08 26518.38 11974.87 16576.45 0.88
The acid test ratio or the super liquid ratio has increased as compared to last year. This is a healthy sign as there is 0.88 paisa per 1 Re of liability on BHEL as compared to 0.79 paisa of previous year. But the ideal value of ratio should be 1 or more than one. And hence, there super liquid ratio of BHEL falls below the desired value. On the other hand, the fact that BHEL is a capital goods industry, can not be ignored which makes this value of acid test ratio acceptable.
So, on the whole, BHEL has improved upon its liquidity conditions in the last year.
0.7 0.75 0.8 0.85 0.9
2006-07
2007-08
Quick ratio
Quick ratio
NET WORKING CAPITAL RATIO
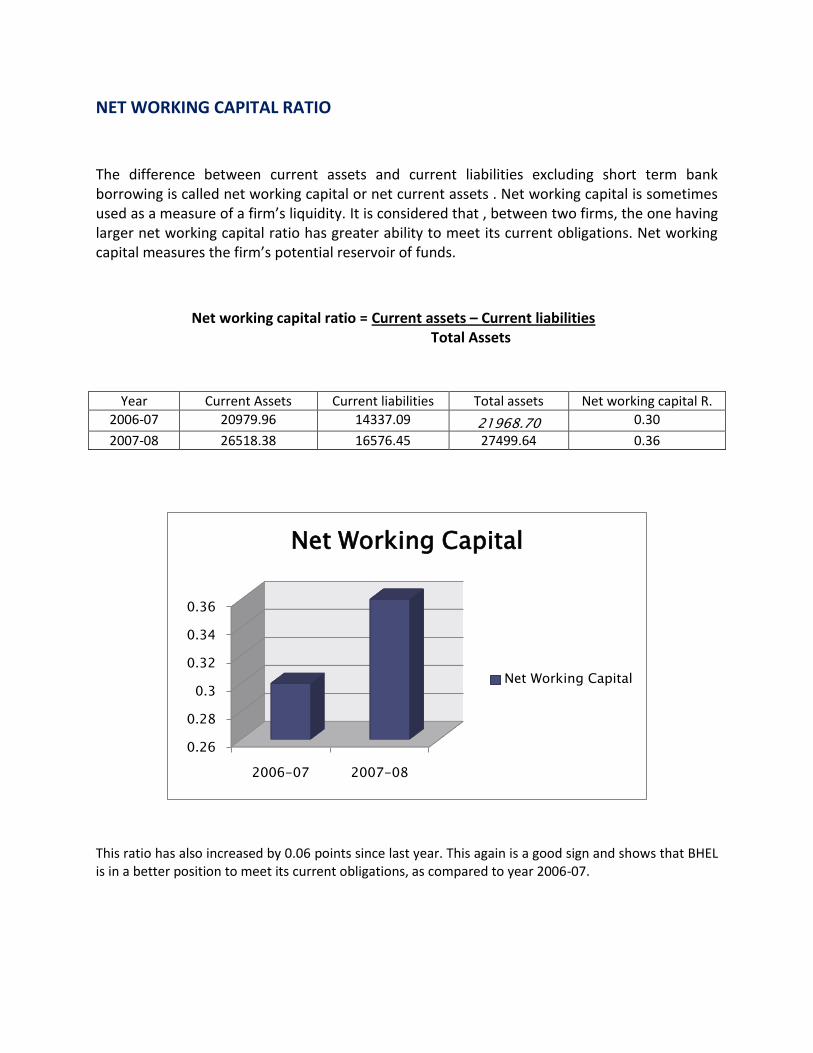
The difference between current assets and current liabilities excluding short term bank borrowing is called net working capital or net current assets . Net working capital is sometimes used as a measure of a firm’s liquidity. It is considered that , between two firms, the one having larger net working capital ratio has greater ability to meet its current obligations. Net working capital measures the firm’s potential reservoir of funds.
Net working capital ratio = Current assets – Current liabilities Total Assets
Year Current Assets Current liabilities Total assets Net working capital R.
2006-07 20979.96 14337.09 21968.70 0.30
2007-08 26518.38 16576.45 27499.64 0.36
This ratio has also increased by 0.06 points since last year. This again is a good sign and shows that BHEL is in a better position to meet its current obligations, as compared to year 2006-07.
0.26
0.28
0.3
0.32
0.34
0.36
2006-07 2007-08
Net Working Capital
Net Working Capital
CASH RATIO
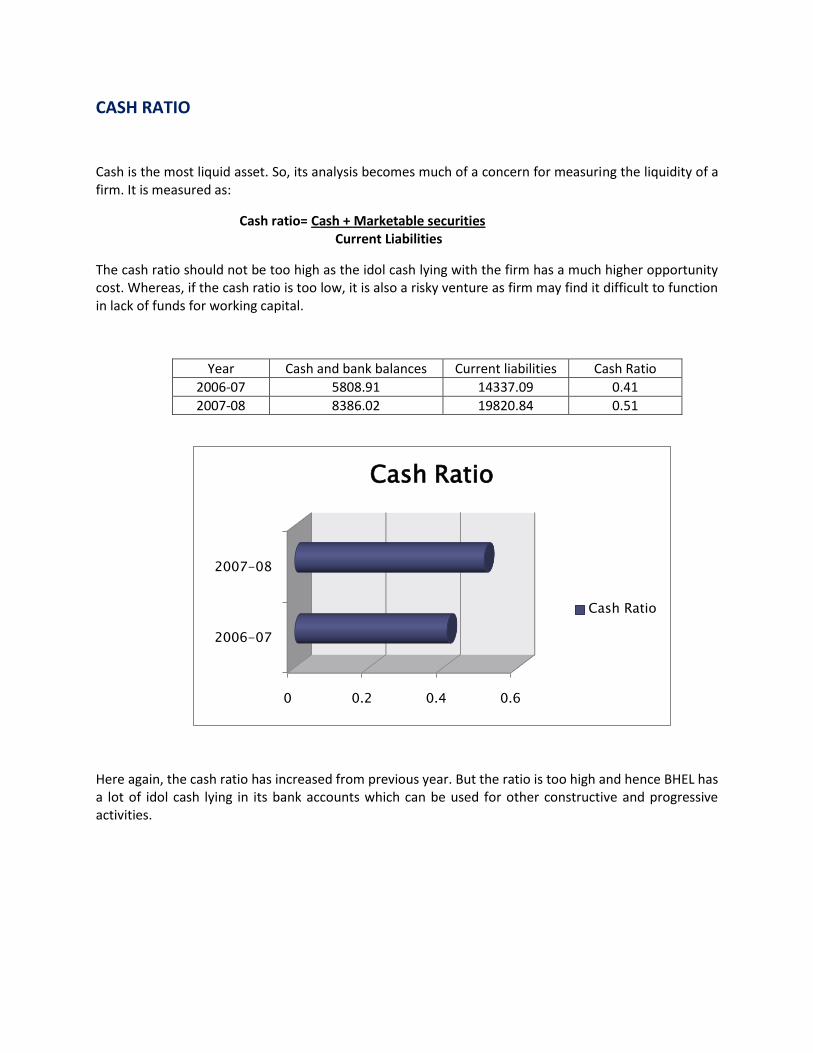
Cash is the most liquid asset. So, its analysis becomes much of a concern for measuring the liquidity of a firm. It is measured as:
Cash ratio= Cash + Marketable securities Current Liabilities
The cash ratio should not be too high as the idol cash lying with the firm has a much higher opportunity cost. Whereas, if the cash ratio is too low, it is also a risky venture as firm may find it difficult to function in lack of funds for working capital.
Year Cash and bank balances Current liabilities Cash Ratio
2006-07 5808.91 14337.09 0.41
2007-08 8386.02 19820.84 0.51
Here again, the cash ratio has increased from previous year. But the ratio is too high and hence BHEL has a lot of idol cash lying in its bank accounts which can be used for other constructive and progressive activities.
0 0.2 0.4 0.6
2006-07
2007-08
Cash Ratio
Cash Ratio
LIQUIDITY RATIOS OF BHEL
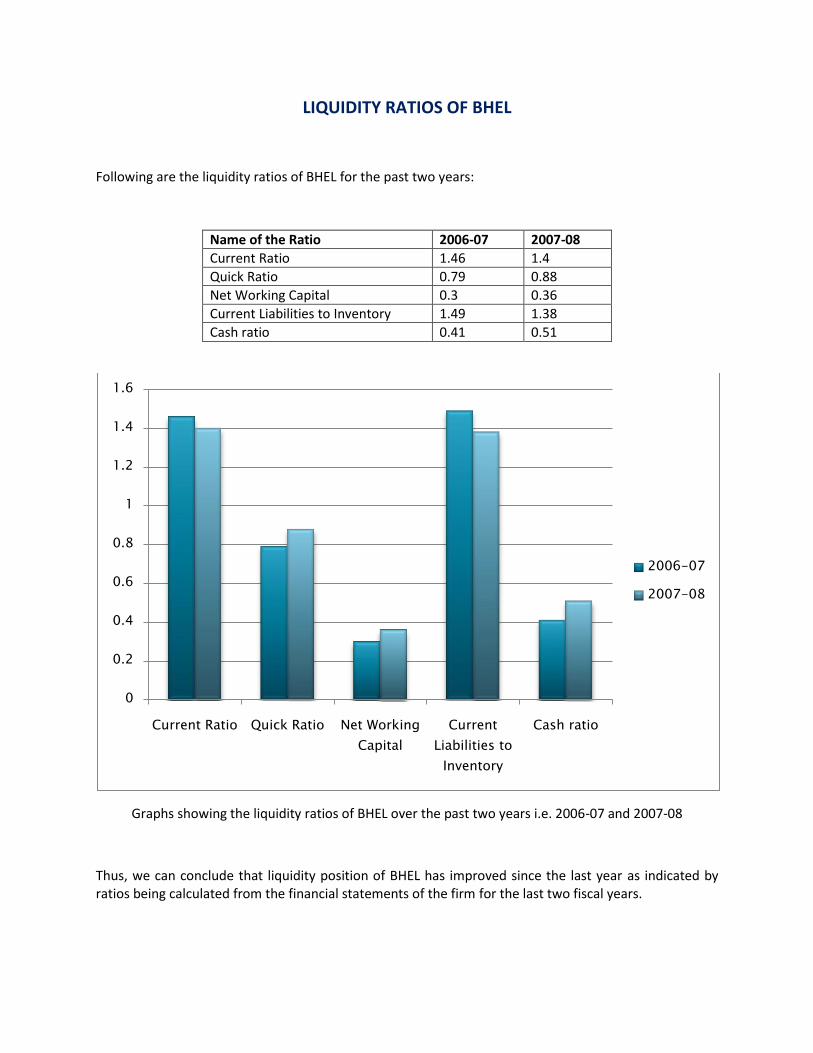
Following are the liquidity ratios of BHEL for the past two years:
Name of the Ratio 2006-07 2007-08
Current Ratio 1.46 1.4
Quick Ratio 0.79 0.88
Net Working Capital 0.3 0.36
Current Liabilities to Inventory 1.49 1.38
Cash ratio 0.41 0.51
Graphs showing the liquidity ratios of BHEL over the past two years i.e. 2006-07 and 2007-08
Thus, we can conclude that liquidity position of BHEL has improved since the last year as indicated by ratios being calculated from the financial statements of the firm for the last two fiscal years.
0
0.2
0.4
0.6
0.8
1
1.2
1.4
1.6
Current Ratio Quick Ratio Net Working
Capital
Current
Liabilities to
Inventory
Cash ratio
2006-07
2007-08
LEVERAGE RATIOS
Short term creditors, like bakers and suppliers of raw material, are more concerned with the firm’s current debt-paying ability. On the other hand, long term creditors, like debenture holders, financial institutions etc are concerned with the firm’s long term financial strength. In fact, a firm should have a strong short as well as long term financial position. To judge the long term financial position of the firm, financial leverage or capital structure ratios are calculated. This indicates mix of funds provided by owners and lenders. As a general rule there should be an appropriate mix of debt and owners’ equity in financing the firm’s assets.
The major leverage ratios are as follows:
i. Debt ratio ii. Debt- equity ratio iii. Capital employed to net worth ratio
In case of BHEL, all the above mentioned leverage ratios have been calculated.

DEBT RATIO
Several debt ratios may be used to analyse the long term solvency of the firm. The firm may be interested in knowing the proportion of the interest-bearing debt ( also called funded debt) in the capital structure. It may, therefore, compute debt ratio by dividing total debt by capital employed.
Debt Ratio= Total Debt capital employed
Year Debt Capital Employed Debt ratio
2006-07 89.33 5571 0.016
2007-08 95.18 7362 0.012
This ratio indicates that the firm has lenders have financed only 1.2% of net assets of BHEL. This ratio has been considerably reduced from 0.016 of year 2006-07. It means that owners have financed about 88% of the net assets of BHEL. The firm is, hence, less leveraged and is a good indication.
0 0.01 0.02
2006-07
2007-08
Debt Ratio
Debt Ratio
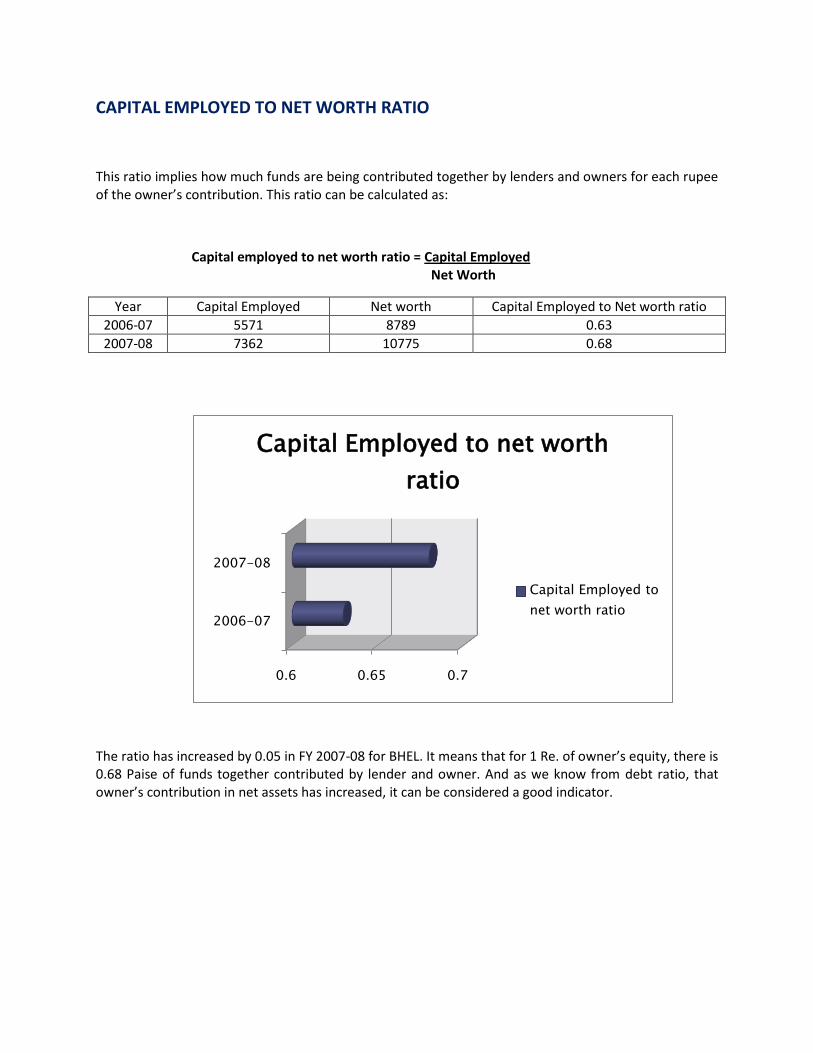
CAPITAL EMPLOYED TO NET WORTH RATIO
This ratio implies how much funds are being contributed together by lenders and owners for each rupee of the owner’s contribution. This ratio can be calculated as:
Capital employed to net worth ratio = Capital Employed Net Worth
Year Capital Employed Net worth Capital Employed to Net worth ratio
2006-07 5571 8789 0.63
2007-08 7362 10775 0.68
The ratio has increased by 0.05 in FY 2007-08 for BHEL. It means that for 1 Re. of owner’s equity, there is 0.68 Paise of funds together contributed by lender and owner. And as we know from debt ratio, that owner’s contribution in net assets has increased, it can be considered a good indicator.
0.6 0.65 0.7
2006-07
2007-08
Capital Employed to net worth
ratio
Capital Employed to
net worth ratio
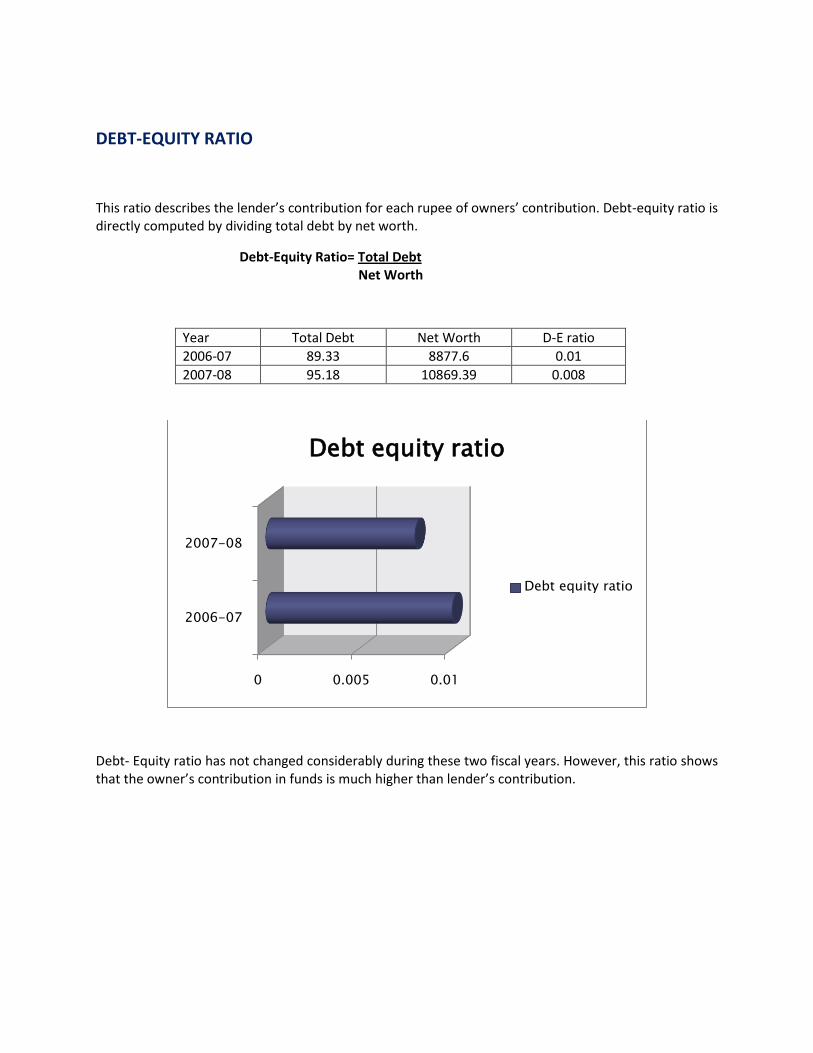
DEBT-EQUITY RATIO
This ratio describes the lender’s contribution for each rupee of owners’ contribution. Debt-equity ratio is directly computed by dividing total debt by net worth.
Debt-Equity Ratio= Total Debt Net Worth
Year Total Debt Net Worth D-E ratio
2006-07 89.33 8877.6 0.01
2007-08 95.18 10869.39 0.008
Debt- Equity ratio has not changed considerably during these two fiscal years. However, this ratio shows that the owner’s contribution in funds is much higher than lender’s contribution.
0 0.005 0.01
2006-07
2007-08
Debt equity ratio
Debt equity ratio
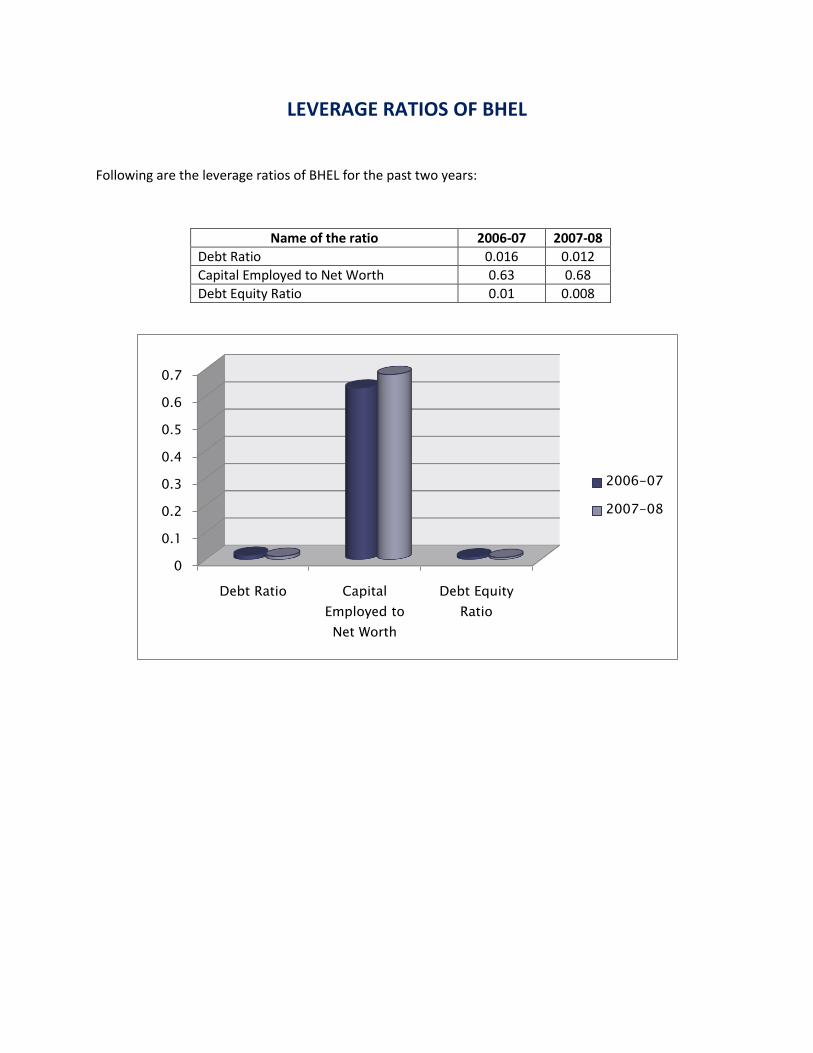
LEVERAGE RATIOS OF BHEL
Following are the leverage ratios of BHEL for the past two years:
0
0.1
0.2
0.3
0.4
0.5
0.6
0.7
Debt Ratio Capital
Employed to
Net Worth
Debt Equity
Ratio
2006-07
2007-08
Name of the ratio 2006-07 2007-08
Debt Ratio 0.016 0.012
Capital Employed to Net Worth 0.63 0.68
Debt Equity Ratio 0.01 0.008
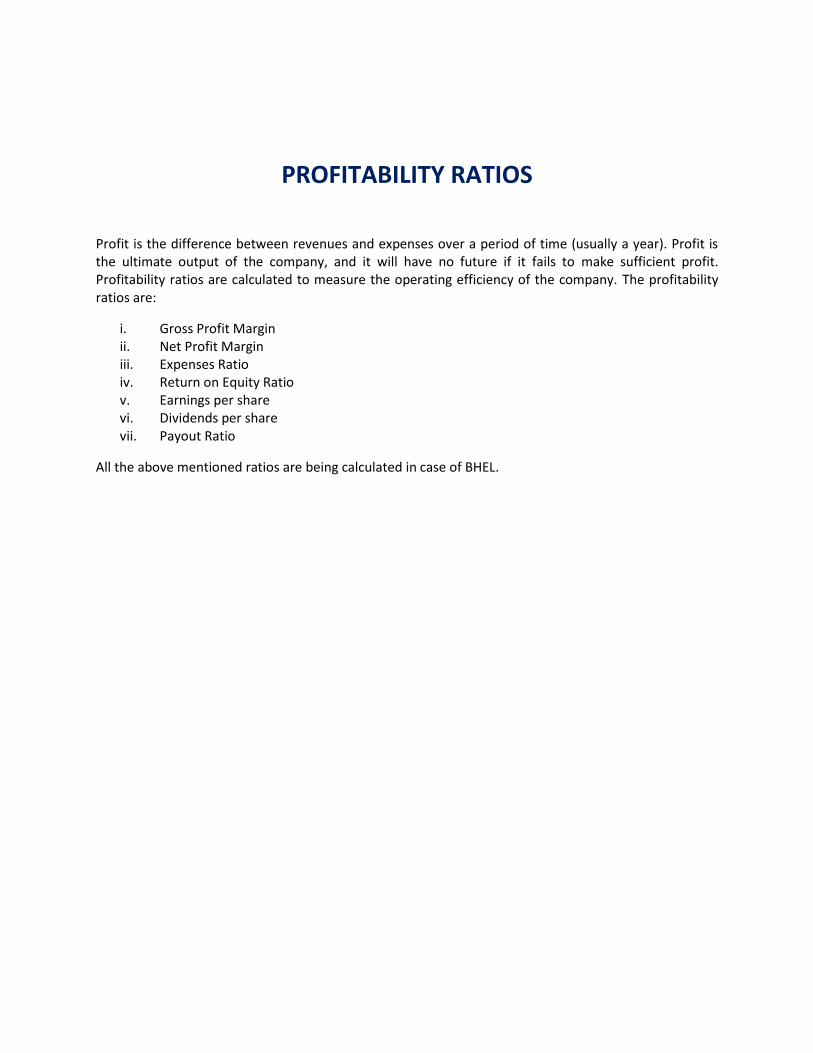
PROFITABILITY RATIOS
Profit is the difference between revenues and expenses over a period of time (usually a year). Profit is the ultimate output of the company, and it will have no future if it fails to make sufficient profit. Profitability ratios are calculated to measure the operating efficiency of the company. The profitability ratios are:
i. Gross Profit Margin ii. Net Profit Margin iii. Expenses Ratio iv. Return on Equity Ratio v. Earnings per share vi. Dividends per share vii. Payout Ratio
All the above mentioned ratios are being calculated in case of BHEL.
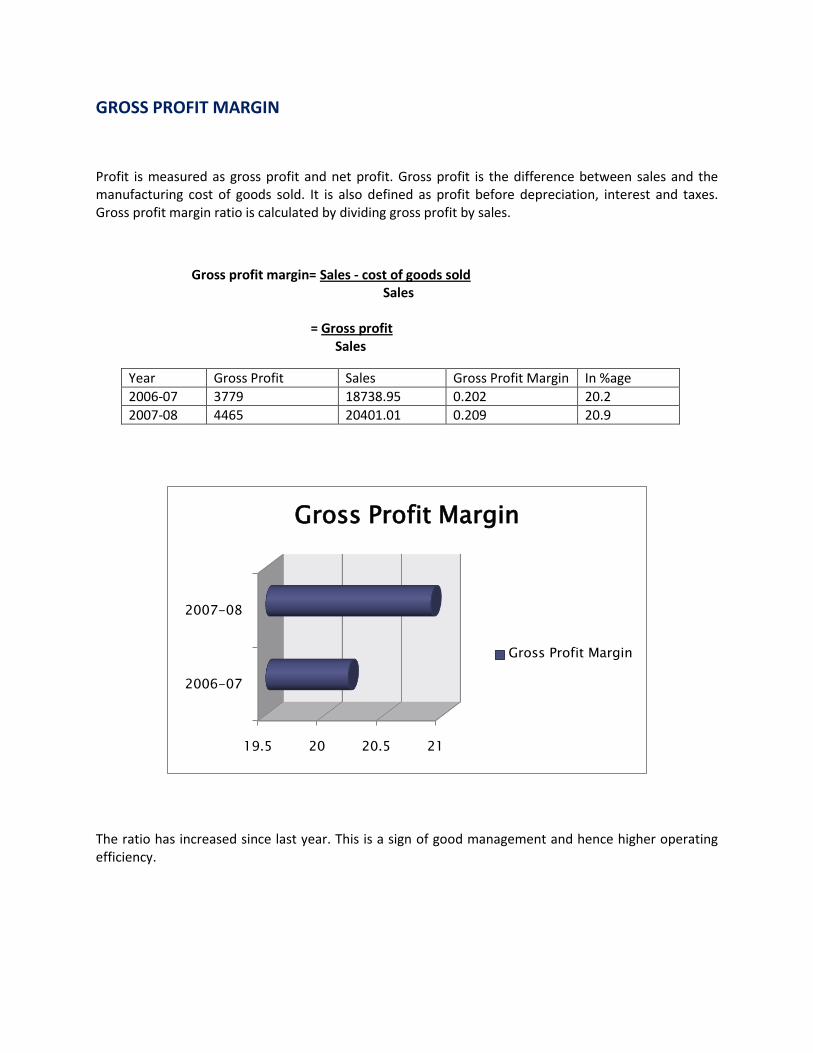
GROSS PROFIT MARGIN
Profit is measured as gross profit and net profit. Gross profit is the difference between sales and the manufacturing cost of goods sold. It is also defined as profit before depreciation, interest and taxes. Gross profit margin ratio is calculated by dividing gross profit by sales.
Gross profit margin= Sales - cost of goods sold Sales = Gross profit Sales
Year Gross Profit Sales Gross Profit Margin In %age
2006-07 3779 18738.95 0.202 20.2
2007-08 4465 20401.01 0.209 20.9
The ratio has increased since last year. This is a sign of good management and hence higher operating efficiency.
19.5 20 20.5 21
2006-07
2007-08
Gross Profit Margin
Gross Profit Margin
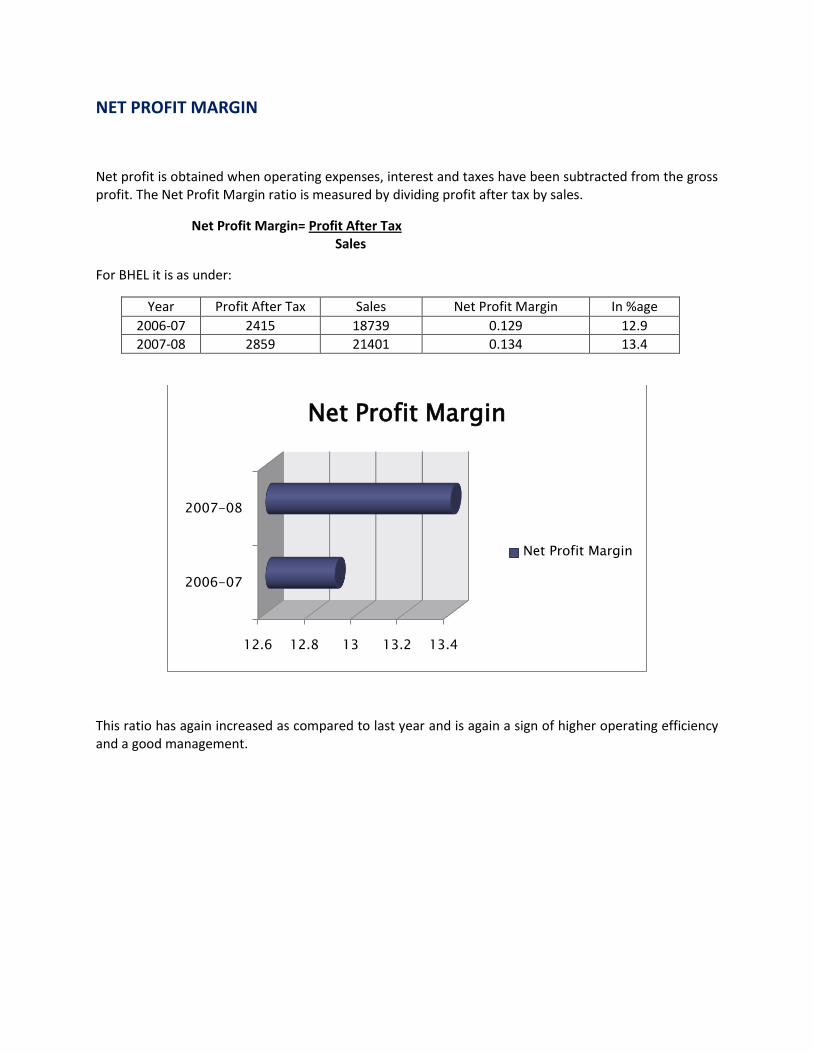
NET PROFIT MARGIN
Net profit is obtained when operating expenses, interest and taxes have been subtracted from the gross profit. The Net Profit Margin ratio is measured by dividing profit after tax by sales.
Net Profit Margin= Profit After Tax Sales
For BHEL it is as under:
Year Profit After Tax Sales Net Profit Margin In %age
2006-07 2415 18739 0.129 12.9
2007-08 2859 21401 0.134 13.4
This ratio has again increased as compared to last year and is again a sign of higher operating efficiency and a good management.
12.6 12.8 13 13.2 13.4
2006-07
2007-08
Net Profit Margin
Net Profit Margin
OPERATING EXPENSES RATIO
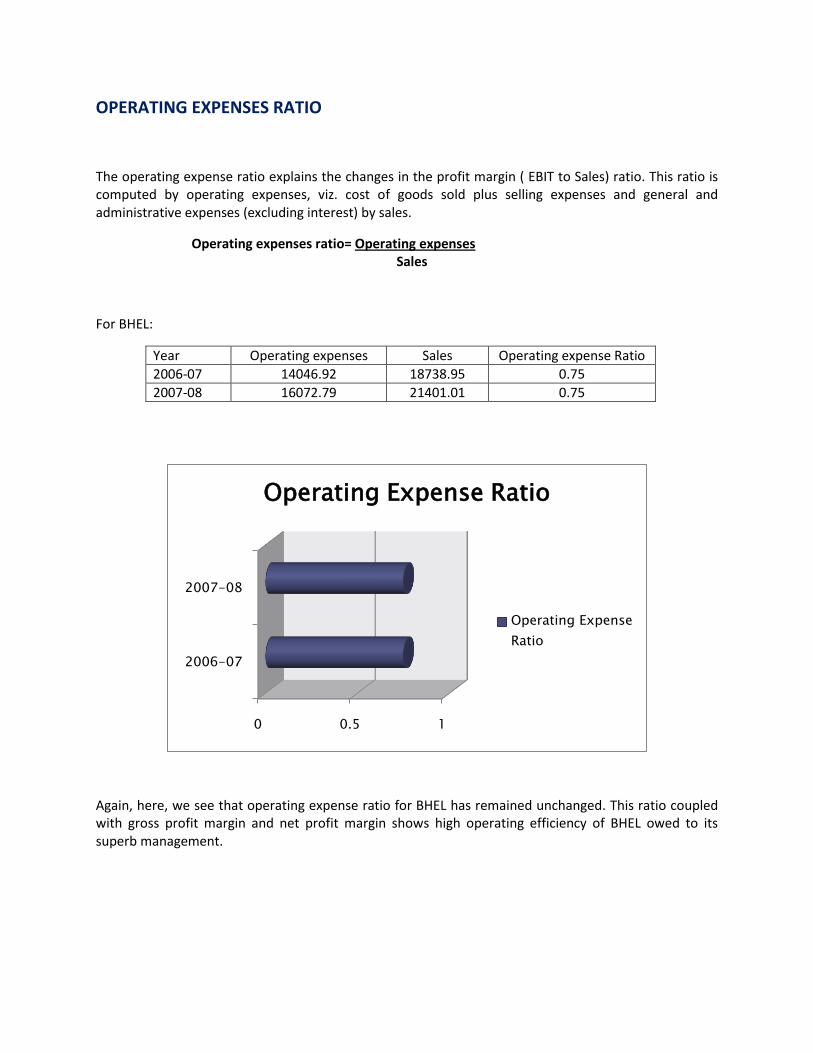
The operating expense ratio explains the changes in the profit margin ( EBIT to Sales) ratio. This ratio is computed by operating expenses, viz. cost of goods sold plus selling expenses and general and administrative expenses (excluding interest) by sales.
Operating expenses ratio= Operating expenses Sales
For BHEL:
Year Operating expenses Sales Operating expense Ratio
2006-07 14046.92 18738.95 0.75
2007-08 16072.79 21401.01 0.75
Again, here, we see that operating expense ratio for BHEL has remained unchanged. This ratio coupled with gross profit margin and net profit margin shows high operating efficiency of BHEL owed to its superb management.
0 0.5 1
2006-07
2007-08
Operating Expense Ratio
Operating Expense
Ratio
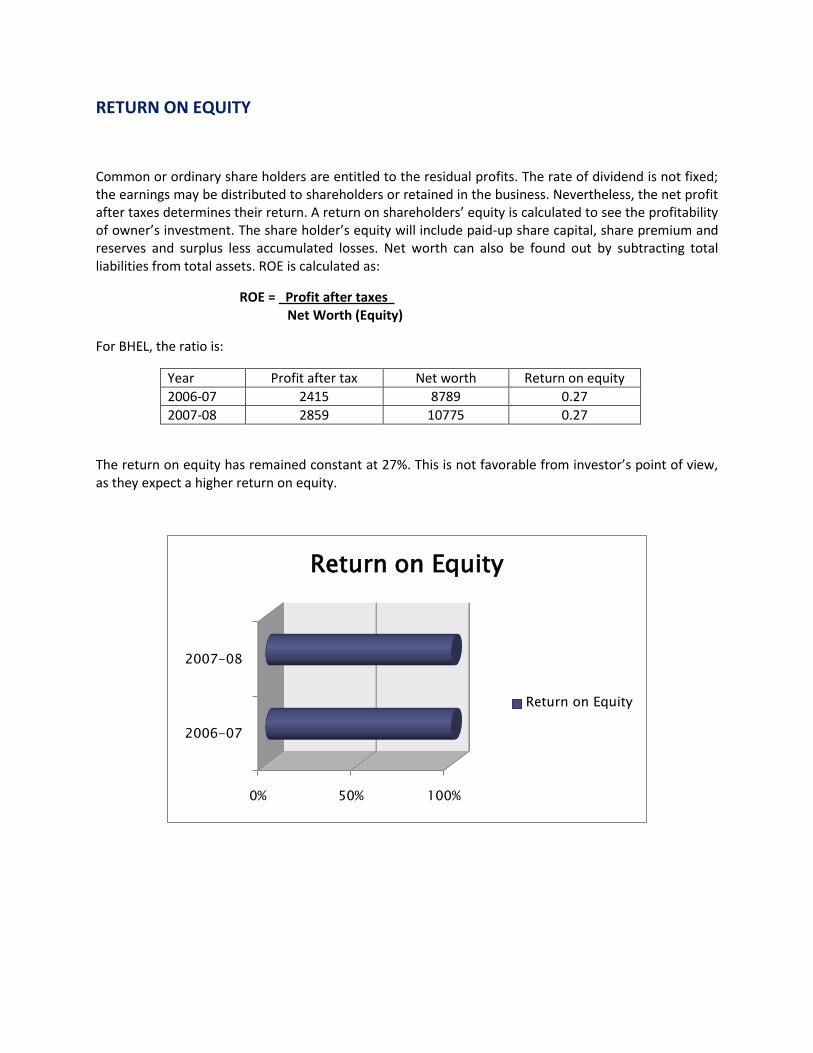
RETURN ON EQUITY
Common or ordinary share holders are entitled to the residual profits. The rate of dividend is not fixed; the earnings may be distributed to shareholders or retained in the business. Nevertheless, the net profit after taxes determines their return. A return on shareholders’ equity is calculated to see the profitability of owner’s investment. The share holder’s equity will include paid-up share capital, share premium and reserves and surplus less accumulated losses. Net worth can also be found out by subtracting total liabilities from total assets. ROE is calculated as:
ROE = Profit after taxes Net Worth (Equity)
For BHEL, the ratio is:
Year Profit after tax Net worth Return on equity
2006-07 2415 8789 0.27
2007-08 2859 10775 0.27
The return on equity has remained constant at 27%. This is not favorable from investor’s point of view, as they expect a higher return on equity.
0% 50% 100%
2006-07
2007-08
Return on Equity
Return on Equity
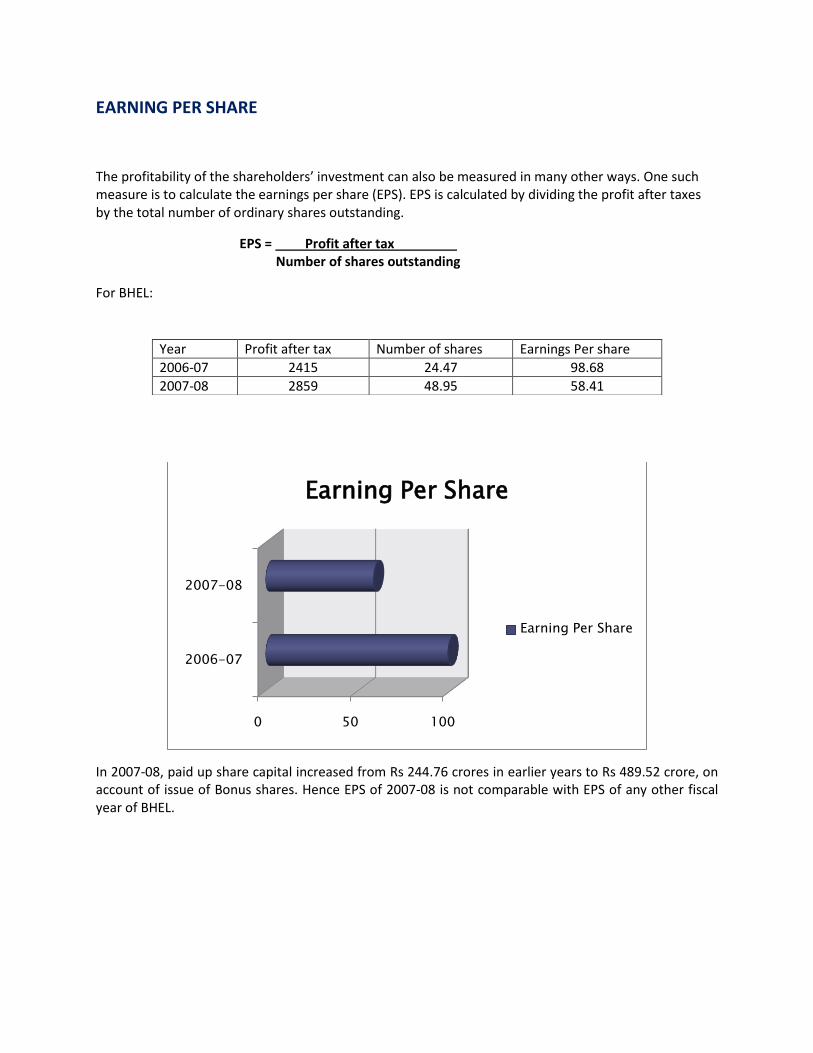
EARNING PER SHARE
The profitability of the shareholders’ investment can also be measured in many other ways. One such measure is to calculate the earnings per share (EPS). EPS is calculated by dividing the profit after taxes by the total number of ordinary shares outstanding.
EPS = Profit after tax Number of shares outstanding
For BHEL:
In 2007-08, paid up share capital increased from Rs 244.76 crores in earlier years to Rs 489.52 crore, on account of issue of Bonus shares. Hence EPS of 2007-08 is not comparable with EPS of any other fiscal year of BHEL.
0 50 100
2006-07
2007-08
Earning Per Share
Earning Per Share
Year Profit after tax Number of shares Earnings Per share
2006-07 2415 24.47 98.68
2007-08 2859 48.95 58.41
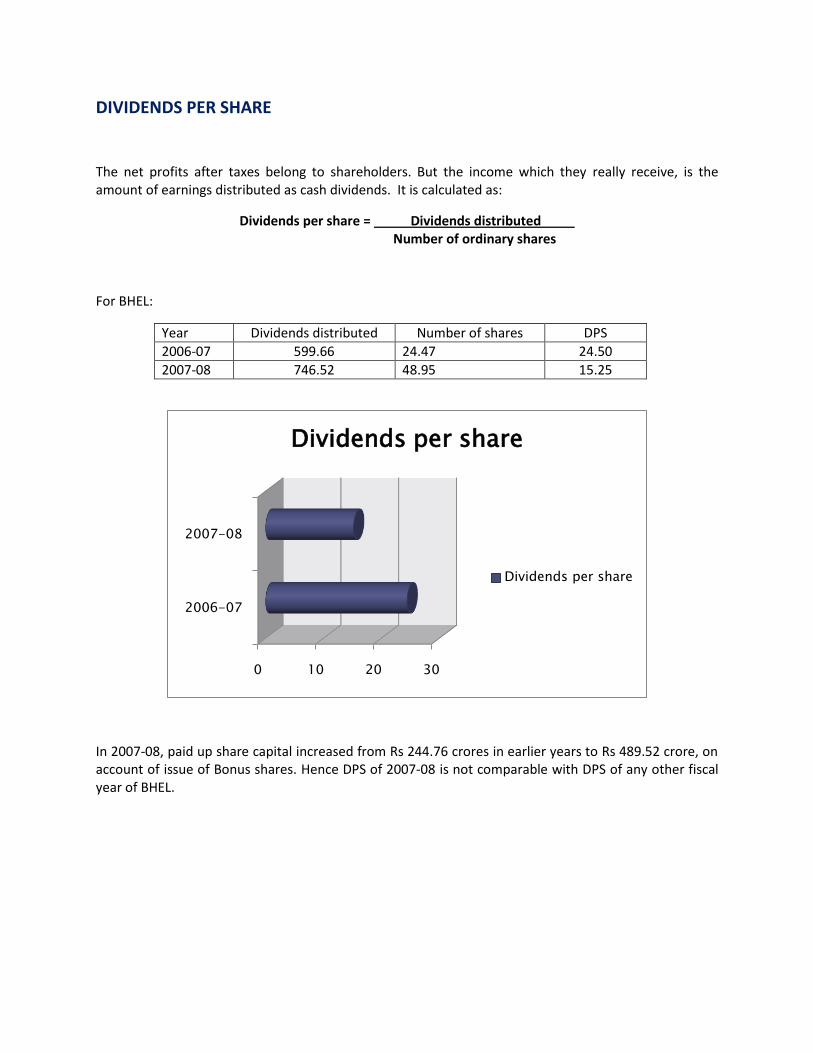
DIVIDENDS PER SHARE
The net profits after taxes belong to shareholders. But the income which they really receive, is the amount of earnings distributed as cash dividends. It is calculated as:
Dividends per share = Dividends distributed Number of ordinary shares
For BHEL:
Year Dividends distributed Number of shares DPS
2006-07 599.66 24.47 24.50
2007-08 746.52 48.95 15.25
In 2007-08, paid up share capital increased from Rs 244.76 crores in earlier years to Rs 489.52 crore, on account of issue of Bonus shares. Hence DPS of 2007-08 is not comparable with DPS of any other fiscal year of BHEL.
0 10 20 30
2006-07
2007-08
Dividends per share
Dividends per share
PAYOUT RATIO
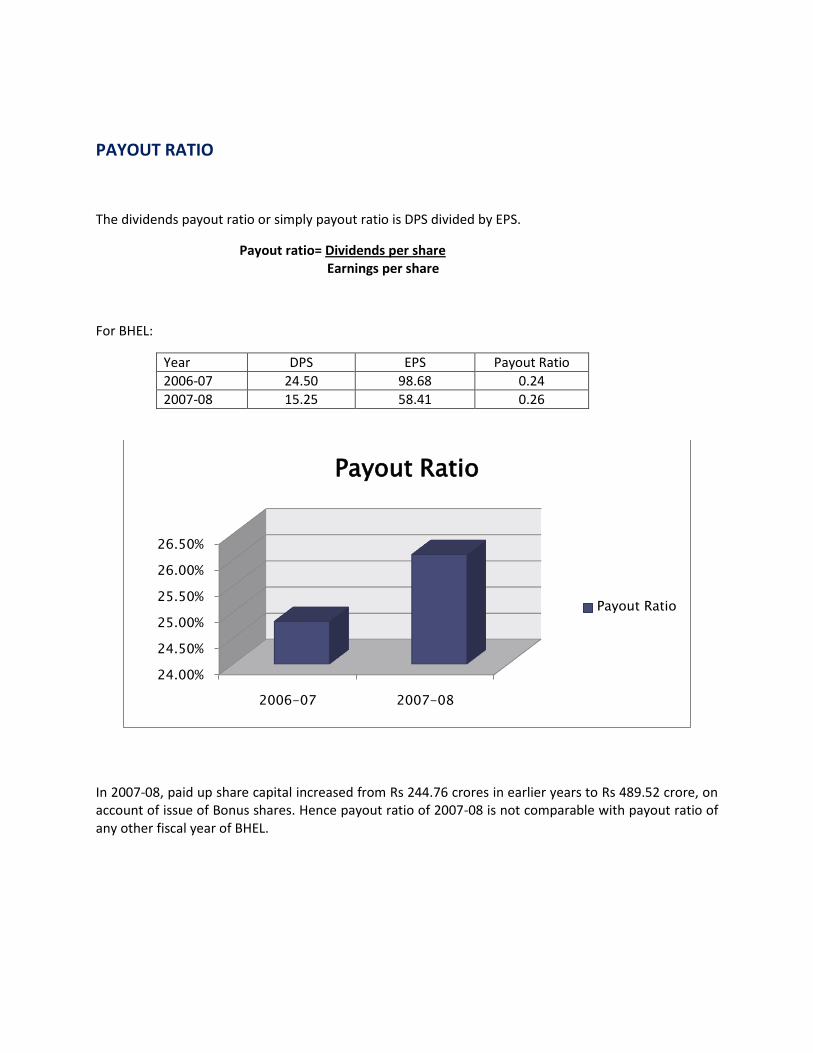
The dividends payout ratio or simply payout ratio is DPS divided by EPS.
Payout ratio= Dividends per share Earnings per share
For BHEL:
Year DPS EPS Payout Ratio
2006-07 24.50 98.68 0.24
2007-08 15.25 58.41 0.26
In 2007-08, paid up share capital increased from Rs 244.76 crores in earlier years to Rs 489.52 crore, on account of issue of Bonus shares. Hence payout ratio of 2007-08 is not comparable with payout ratio of any other fiscal year of BHEL.
24.00%
24.50%
25.00%
25.50%
26.00%
26.50%
2006-07 2007-08
Payout Ratio
Payout Ratio
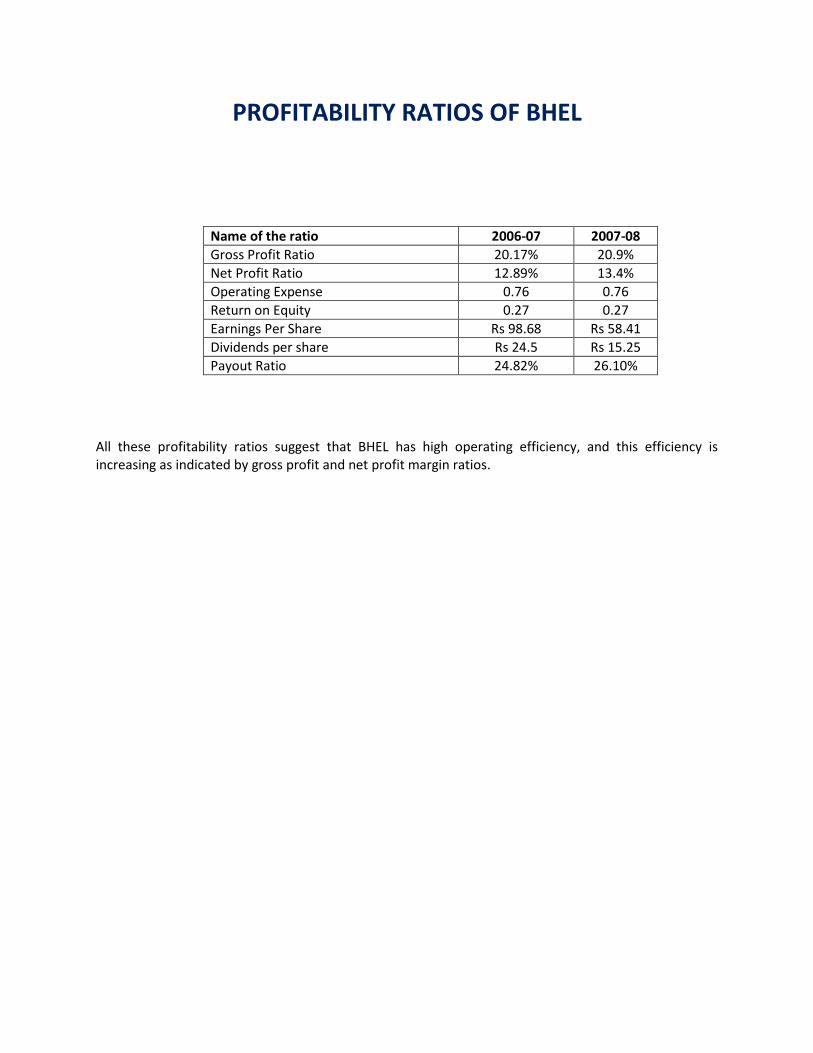
PROFITABILITY RATIOS OF BHEL
Name of the ratio 2006-07 2007-08
Gross Profit Ratio 20.17% 20.9%
Net Profit Ratio 12.89% 13.4%
Operating Expense 0.76 0.76
Return on Equity 0.27 0.27
Earnings Per Share Rs 98.68 Rs 58.41
Dividends per share Rs 24.5 Rs 15.25
Payout Ratio 24.82% 26.10%
All these profitability ratios suggest that BHEL has high operating efficiency, and this efficiency is increasing as indicated by gross profit and net profit margin ratios.
ACTVITY RATIOS
Funds of creditors and owners are invested in various assets to generate sales and profits. The better the management of assets, the larger is the amount of sales. Activity ratios are employed to evaluate the efficiency with which the firm manages and utilizes its assets. These ratios are also called turnover ratios because they indicate the speed with which assets are being converted or turned over to sales. These activity ratios are as follows:
i. Inventory turnover ii. Days of inventory holding iii. Collection period iv. Debtors turnover ratio
All the above ratios have been calculated for BHEL
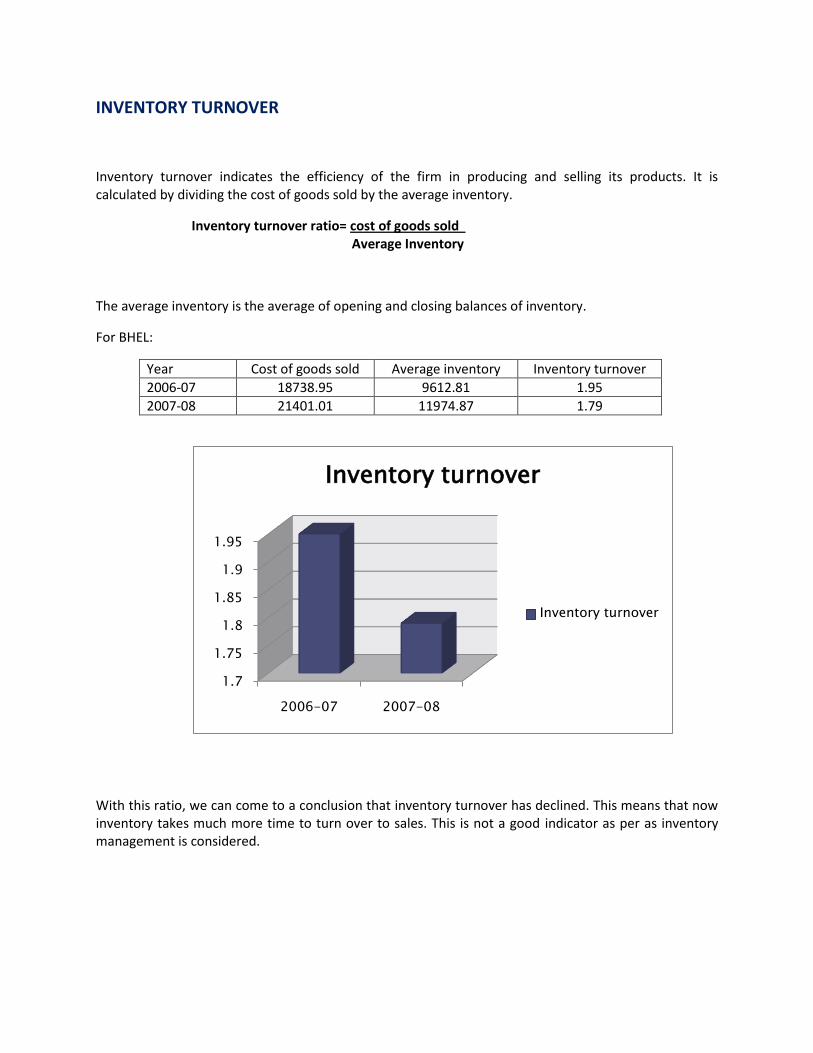
INVENTORY TURNOVER
Inventory turnover indicates the efficiency of the firm in producing and selling its products. It is calculated by dividing the cost of goods sold by the average inventory.
Inventory turnover ratio= cost of goods sold Average Inventory
The average inventory is the average of opening and closing balances of inventory.
For BHEL:
Year Cost of goods sold Average inventory Inventory turnover
2006-07 18738.95 9612.81 1.95
2007-08 21401.01 11974.87 1.79
With this ratio, we can come to a conclusion that inventory turnover has declined. This means that now inventory takes much more time to turn over to sales. This is not a good indicator as per as inventory management is considered.
1.7
1.75
1.8
1.85
1.9
1.95
2006-07 2007-08
Inventory turnover
Inventory turnover
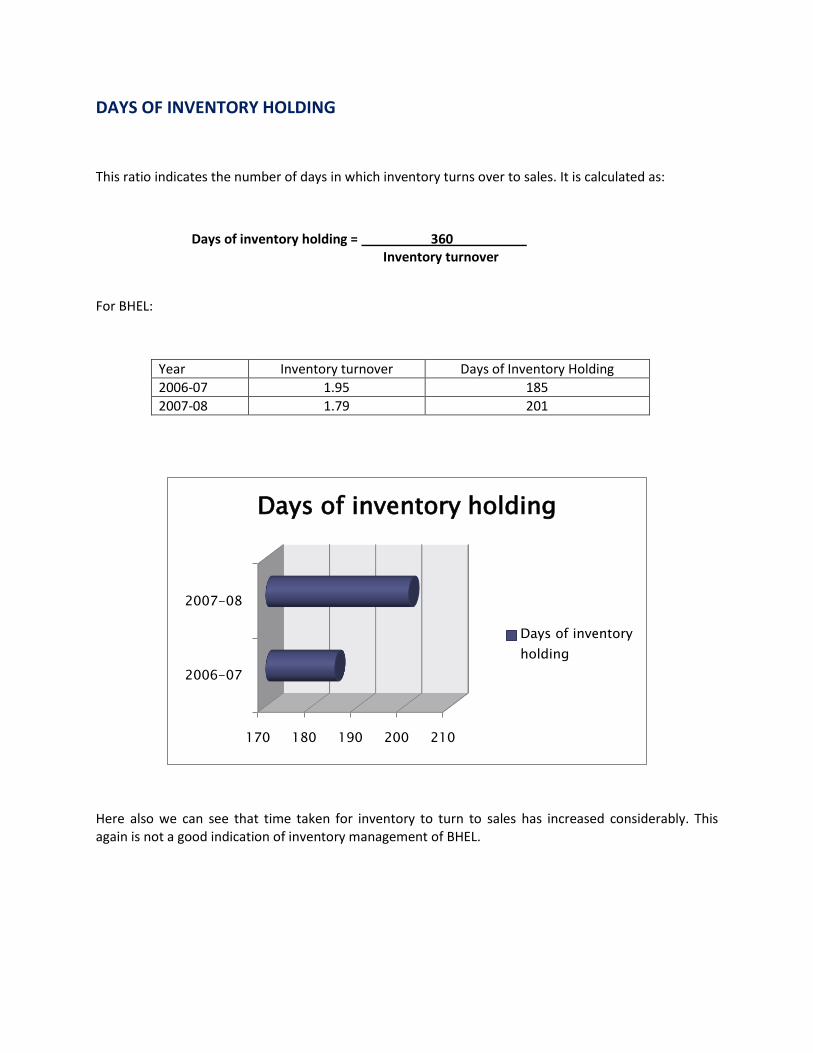
DAYS OF INVENTORY HOLDING
This ratio indicates the number of days in which inventory turns over to sales. It is calculated as:
Days of inventory holding = 360 Inventory turnover
For BHEL:
Year Inventory turnover Days of Inventory Holding
2006-07 1.95 185
2007-08 1.79 201
Here also we can see that time taken for inventory to turn to sales has increased considerably. This again is not a good indication of inventory management of BHEL.
170 180 190 200 210
2006-07
2007-08
Days of inventory holding
Days of inventory
holding
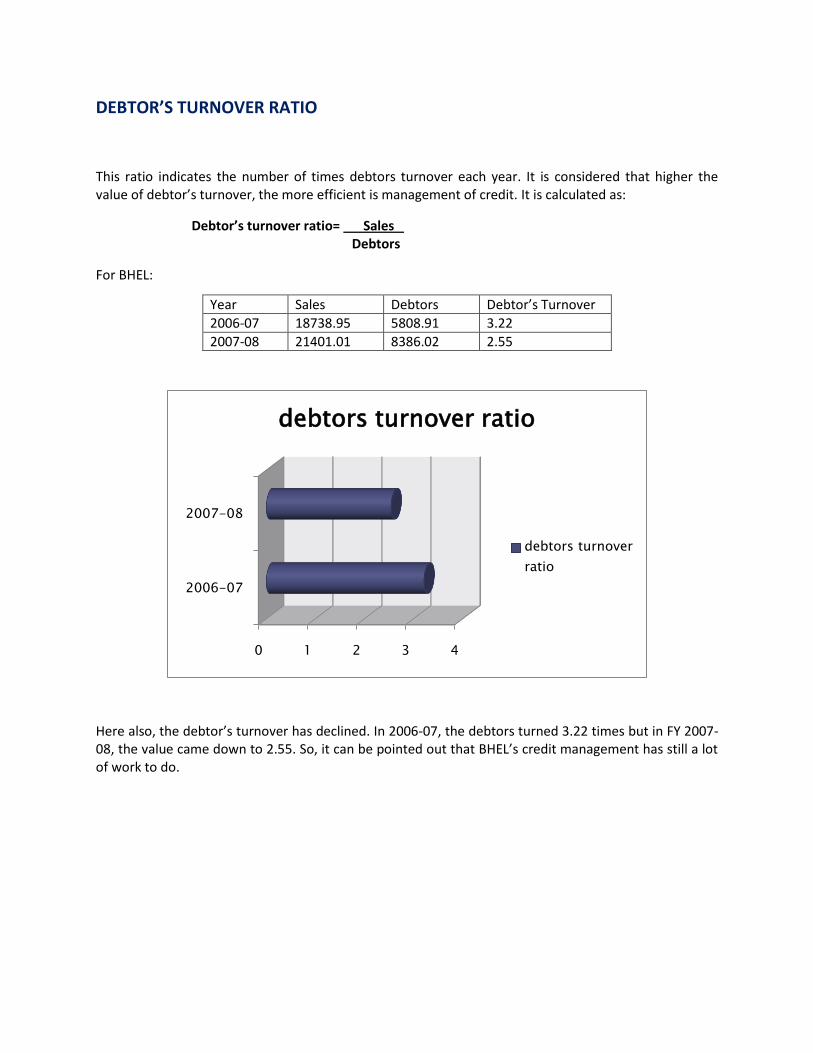
DEBTOR’S TURNOVER RATIO
This ratio indicates the number of times debtors turnover each year. It is considered that higher the value of debtor’s turnover, the more efficient is management of credit. It is calculated as:
Debtor’s turnover ratio= Sales Debtors
For BHEL:
Here also, the debtor’s turnover has declined. In 2006-07, the debtors turned 3.22 times but in FY 2007-08, the value came down to 2.55. So, it can be pointed out that BHEL’s credit management has still a lot of work to do.
0 1 2 3 4
2006-07
2007-08
debtors turnover ratio
debtors turnover
ratio
Year Sales Debtors Debtor’s Turnover
2006-07 18738.95 5808.91 3.22
2007-08 21401.01 8386.02 2.55
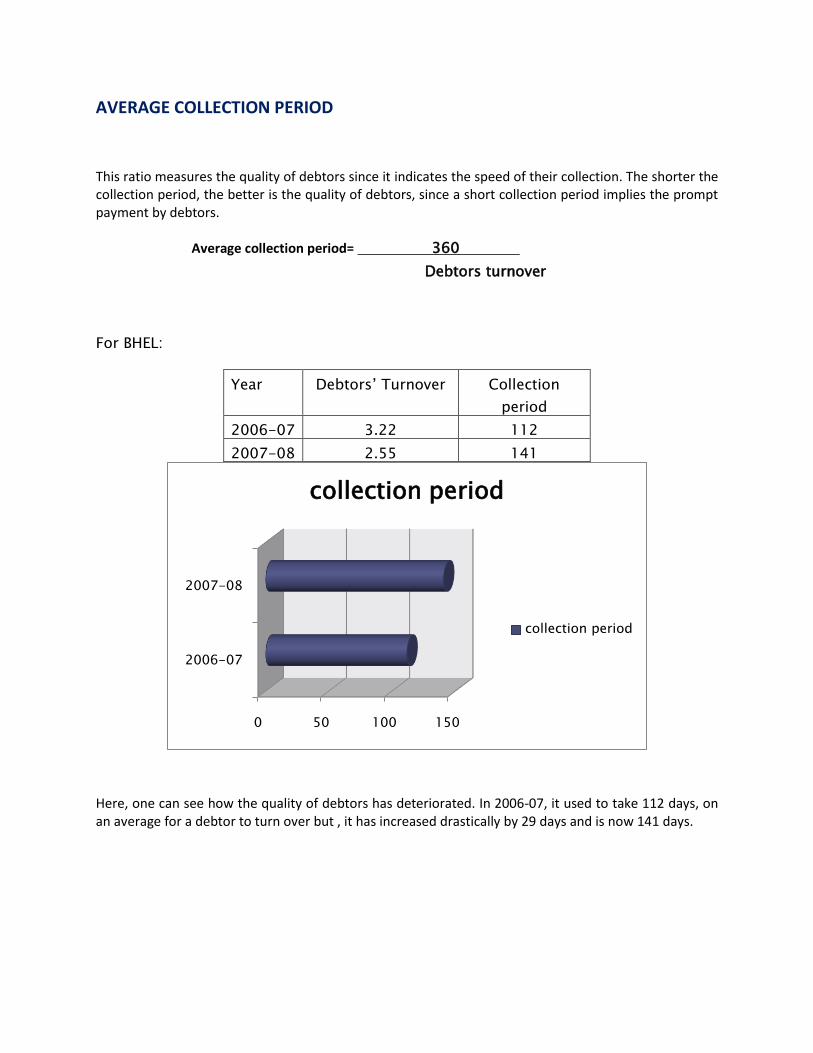
AVERAGE COLLECTION PERIOD
This ratio measures the quality of debtors since it indicates the speed of their collection. The shorter the collection period, the better is the quality of debtors, since a short collection period implies the prompt payment by debtors.
Average collection period= 360
Debtors turnover
For BHEL:
Here, one can see how the quality of debtors has deteriorated. In 2006-07, it used to take 112 days, on an average for a debtor to turn over but , it has increased drastically by 29 days and is now 141 days.
0 50 100 150
2006-07
2007-08
collection period
collection period
Year Debtors’ Turnover Collection
period
2006-07 3.22 112
2007-08 2.55 141
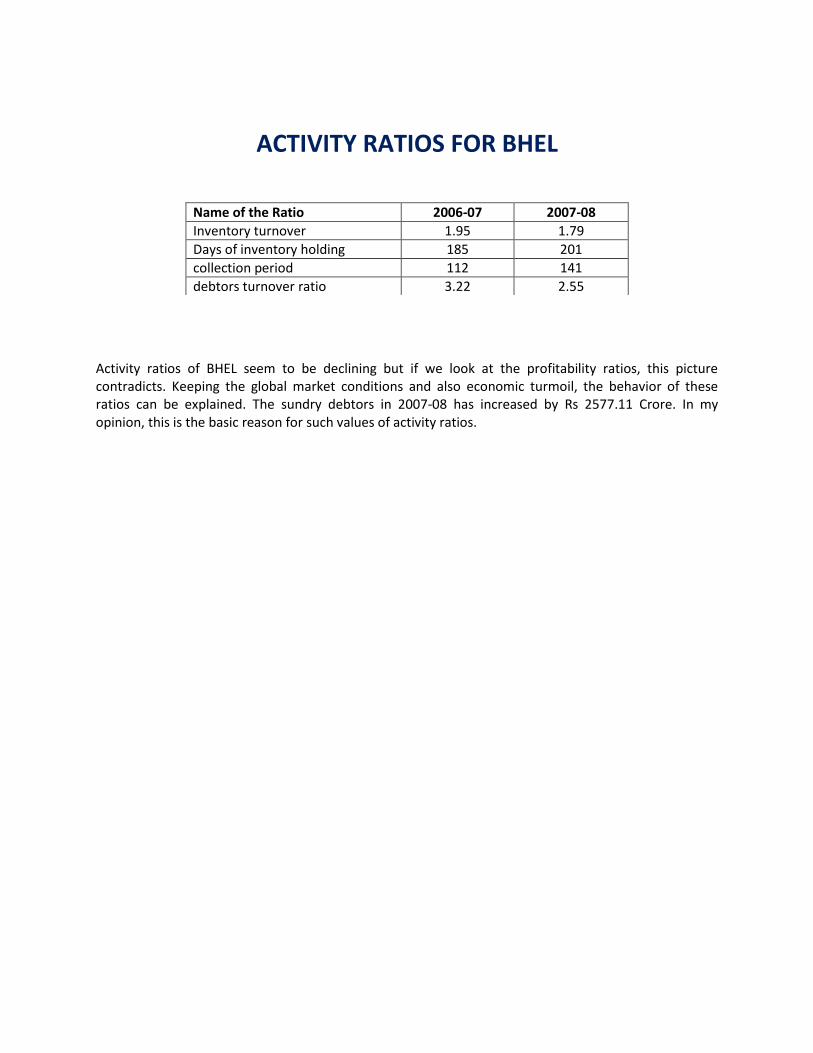
ACTIVITY RATIOS FOR BHEL
Activity ratios of BHEL seem to be declining but if we look at the profitability ratios, this picture contradicts. Keeping the global market conditions and also economic turmoil, the behavior of these ratios can be explained. The sundry debtors in 2007-08 has increased by Rs 2577.11 Crore. In my opinion, this is the basic reason for such values of activity ratios.
Name of the Ratio 2006-07 2007-08
Inventory turnover 1.95 1.79
Days of inventory holding 185 201
collection period 112 141
debtors turnover ratio 3.22 2.55
INFERENCES DRAWN FROM RATIO ANALYSIS OF BHEL
By the method of Ratio analysis of financial statements of BHEL and in the light of ratios so obtained, following inferences can be drawn:
i. In spite of the global economic recession and financial turmoil, BHEL has continued generating tremendous profits. Profitability ratios indicate the firm has high operating efficiency backed by a strong management.
ii. BHEL is a capital goods manufacturing industry. In general, the industrial average of capital goods manufacturing industry for liquidity ratios is quite low. But BHEL has a sound liquid position as suggested by various liquidity ratios of BHEL.
iii. The firm is low on leverage. The owners’ contribution in funds is maximum. The leverage
ratios indicate the firm is low on financial leverage. The firm has idol cash and bank balances which can be used for constructive purposes.
iv. The economic slowdown has some affected BHEL. This has been concluded from activity
turnover ratio. The quality of debtors has deteriorated and as a result debtors’ turnover ratio has declined. And as a consequence to it, the collection period has increased. The current assets like debtors and inventory, in 2007-08, took a longer time to convert into sales.

CONCLUSION
BHEL touched the highest turnover of Rs 21401.01 Crore, registering a growth of 14% over 2006-07. The firm has kept up its winning streak even in this period of global economic recession by grabbing orders worth Rs 50,270 Crore. This company has continued producing profits for its shareholders and owners as evident by various ratios so calculated. By looking at financial ratios of BHEL, one can easily come to a conclusion that it is financially sound and is backed by a strong management and fundamentals of hard work and dedication towards their motto for electricity for everyone.

BIBLIOGRAPHY
Annual Report 2006-07
Annual Report 2007-08
Financial Management - I. M. Pandey - Khan & Jain - Dr Gupta

APPENDIX
TO
THE REPORT
