bi-monthly • march -april. 2015 issn: 0976-2108 bare · bi-monthly • march -april. 2015 bare...
TRANSCRIPT
Bi- monthly • March - April. 2015
BARe NEWSLETTER
•
•
•
ISSN: 0976-2108
IN THIS ISSUE
Engineering Abiotic Stress Tolerance in Transgenic Banana Plants by Overexpressing Effector/ Transcription Factor Genes
Development of Thermal Neutron Detector based on lithium TetraBorate (LTB) Single Crystal
Installation and commissioning of an Automatic Solar Radiation Monitoring System (ASRMS)
• New Hot Cell Facility for Post Irradiation Examination
• Microbial Bioremediation of Uranium- An Overview

BARC NEWSLETTER
At ms in the Service of the NationCelebrating its diamond jubilee year, the Department of Atomic Energy (DAE) portrays in its tableau, its expertise in harnessing the tremendous potential of the atom for the benefit of the society. The tableau is led by a white dove atop an atomic orbital symbolizing the conviction of the nation in spreading the message ‘Atoms for Peace’. It also pays homage to the visionary Dr. Homi Jehangir Bhabha, founding father of the Indian Nuclear Programme. The trailer portion of the tableau is conceptually divided into three parts depicting peace, progress and prosperity, vis-a-vis the service deliverables of the Department. The first part symbolizes progress in the field of medical technology depicting the indigenously developed ‘Bhabhatron’ machine, used in radiotherapy and delivering affordable health care. The colourful flora, following it, showcases prosperity in food and agriculture through mutation breeding technology to provide disease-resistant and high yielding seeds and food irradiation techniques that increase the shelf life of the produce. Lastly, standing tall, the indigenous Nuclear Reactor highlights the advantage of nuclear energy to provide an unlimited supply of clean and green energy for the sustained progress of the nation.
Department of Atomic Energy
BARC NEWSLETTER
March-April 2015 | i
C O N T E N T S Editorial Note ii
Brief Communications l Thiourea Application Boosts Crop Productivity and helps in Understanding of 1
Redox Regulatory Mechanism in Plants Bio-Science Group
l 177Lu-DOTA-TATE, a Radiotherapeutic Agent for Treatment of Neuroendocrine Cancers 3 Radiochemistry & Isotope Group
Research Articles l Engineering Abiotic Stress Tolerance in Transgenic Banana plants by Overexpressing 5
Effector/Transcription Factor Genes U.K.S. Shekhawat and T.R. Ganapathi
Nuclear Agriculture and Biotechnology Division
l Development of Thermal Neutron Detector based on Lithium Tetraborate (LTB) Single Crystal 9 G.D. Patra, A.K. Singh, B. Tiwari, S.G. Singh, D.G. Desai, M. Tyagi, S. Sen, S.C. Gadkari and S.K. Gupta
Technical Physics Division
Technology Development Articles l Installation and Commissioning of an Automatic Solar Radiation Monitoring System (ASRMS) 14 Ananta Joshi and R.J. Patel Refuelling Technology Division
l New Hot Cell Facility for Post Irradiation Examination 19 Anil Bhandekar, K.M. Pandit, M.P. Dhotre, P. Nagaraju, B.N. Rath, Prerna Mishra, Sunil Kumar, J.S. Dubey, G.K. Mallik and J.L. Singh
Post Irradiation Examination Division
Feature Articles l Microbial Bioremediation of Uranium- An Overview 27 Celin Acharya Molecular Biology Division
l Meteorological Analysis of Very Severe Cyclonic Storm Hudhud in and around 31 BARC Visakhapatnam in October 2014 A. Vinod Kumar, R. Jana, N. S. Krishna and T. Sambamurty Radiation Safety Systems Division
News & Events l Third National Symposium on Advances in Control and Instrumentation 36
(SACI- 2014): a Report l 29th Training Course on “Basic Radiological Safety and Regulatory Measures for 37
Nuclear Facilities”: a Report l National Safety Day Celebration at BARC 38
BARC Scientists Honoured 39
BARC NEWSLETTER
ii | March-April 2015
Editorial Committee
ChairmanDr. S.M. Sharma,
Associate Director, Physics Group
Co-ChairmanDr. G.K. Dey,
Associate Director, Materials Group
EditorDr. G. Ravi Kumar
Head, SIRD
Associate Editors for this issueDr. S.K. Sandur, RB&HSD
Dr. K.G. Bhushan, TPD
MembersDr. G. Rami Reddy, RSD
Dr. A.K. Tyagi, Chemistry Divn.
Dr. S.M. Yusuf, SSPD
Dr. S. Kannan, FCD
Dr. C.P. Kaushik, WMD
Dr. S. Mukhopadhyay, Seismology Divn.
Dr. A.K. Bhattacharjee, RCnD
Dr. B.K. Sapra, RP&AD
Dr. J.B. Singh, MMD
Dr. K.G. Bhushan, TPD
Dr. S. Mukhopadhyay, ChED
Dr. S.K. Sandur, RB&HSD
Dr. Smt. S.C. Deokattey, SIRD
From the Editor’s Desk
Welcome to the second issue of the BARC Newsletter
for 2015. Five articles and two Brief Communications have been
featured in this issue.
One of the communications highlights a radiotherapeutic
agent developed in BARC for the treatment of neuroendocrine
cancers, which has benefited more than one thousand patients
so far. One of the articles projects Ag doped Lithium tetraborate
crystals as an alternative to the 3He based neutron detectors.
Reliable performance of nuclear fuels and critical core
components is essential for efficient life management of nuclear
facilities. A new hot cell was commissioned and activated recently in
BARC for post irradiation examination of nuclear fuels and structural
components. The salient features of this facility have been detailed
in one of the technology development articles.
Dr. G. Ravi Kumar
On behalf of the Editorial Committee
BARC NEWSLETTERBrief Communication
March-April 2015 | 1
In the face of challenges of food security and climate
change, sustainable agriculture has emerged as
key principle to nurture healthy ecosystems and
support good management of land, water and
natural resources. Under a collaborative program
with Rajasthan Agriculture University (Bikaner, India),
we have developed the application of thiourea as
an easy and cost-effective technology for boosting
crop productivity under farmer’s field conditions.
Thiourea is an organo-sulfur compound with formula
SC(NH2)2. It is structurally similar to urea except
that oxygen atom is replaced by a sulfur atom.
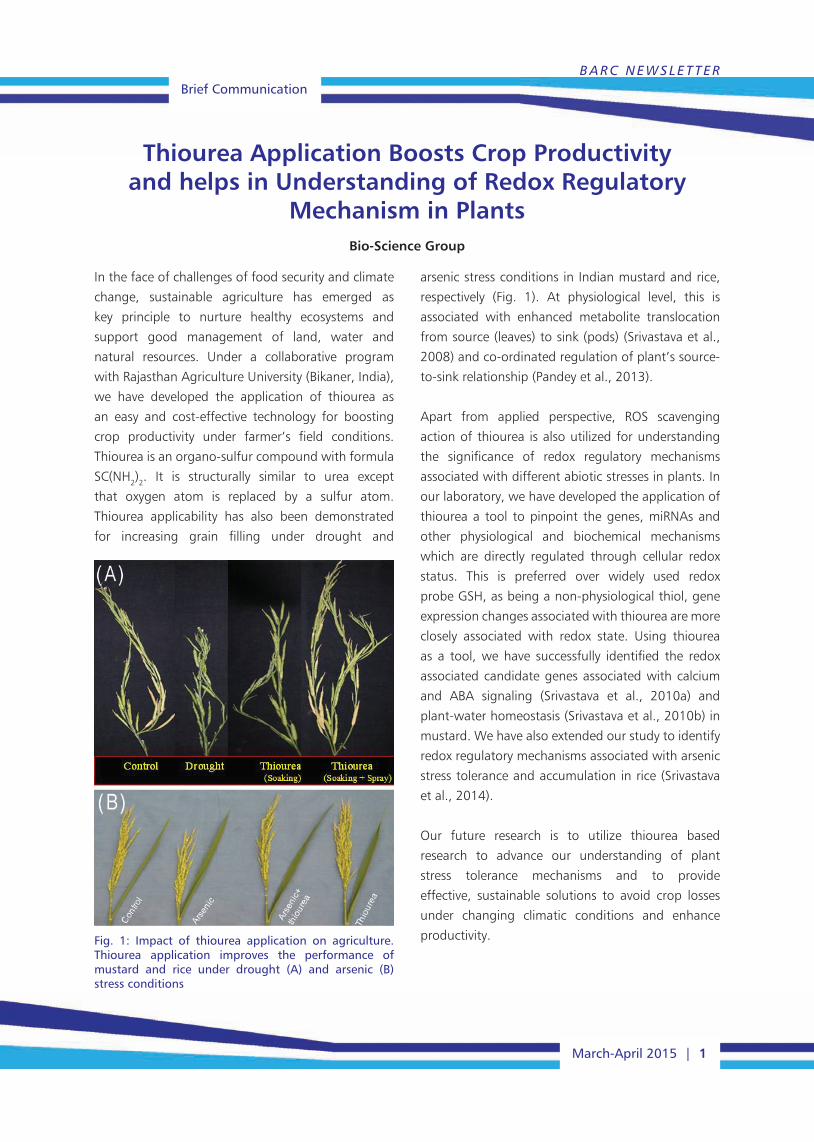
Thiourea applicability has also been demonstrated
for increasing grain filling under drought and
arsenic stress conditions in Indian mustard and rice,
respectively (Fig. 1). At physiological level, this is
associated with enhanced metabolite translocation
from source (leaves) to sink (pods) (Srivastava et al.,
2008) and co-ordinated regulation of plant’s source-
to-sink relationship (Pandey et al., 2013).
Apart from applied perspective, ROS scavenging
action of thiourea is also utilized for understanding
the significance of redox regulatory mechanisms
associated with different abiotic stresses in plants. In
our laboratory, we have developed the application of
thiourea a tool to pinpoint the genes, miRNAs and
other physiological and biochemical mechanisms
which are directly regulated through cellular redox
status. This is preferred over widely used redox
probe GSH, as being a non-physiological thiol, gene
expression changes associated with thiourea are more
closely associated with redox state. Using thiourea
as a tool, we have successfully identified the redox
associated candidate genes associated with calcium
and ABA signaling (Srivastava et al., 2010a) and
plant-water homeostasis (Srivastava et al., 2010b) in
mustard. We have also extended our study to identify
redox regulatory mechanisms associated with arsenic
stress tolerance and accumulation in rice (Srivastava
et al., 2014).
Our future research is to utilize thiourea based
research to advance our understanding of plant
stress tolerance mechanisms and to provide
effective, sustainable solutions to avoid crop losses
under changing climatic conditions and enhance
productivity.
Thiourea Application Boosts Crop Productivity and helps in Understanding of Redox Regulatory
Mechanism in PlantsBio-Science Group
Fig. 1: Impact of thiourea application on agriculture. Thiourea application improves the performance of mustard and rice under drought (A) and arsenic (B) stress conditions

Brief CommunicationBARC NEWSLETTER
2 | March-April 2015
References:
1. Srivastava AK, Nathawat NS, Ramaswamy NK,
Sahu MP, Singh G, Nair JS, Radha Krishna P,
D’Souza SF (2008) Evidence for the thiol induced
enhanced in situ translocation of 14C-Sucrose from
source to sink in Brassica juncea. Environmental
and Experimental Botany 64, 250–255.
2. Pandey M, Srivastava AK, D’Souza SF and
Suprasanna P (2013) Thiourea, a ROS scavenger,
regulates source-to-sink relationship for enhanced
crop yield and oil content in Brassica juncea (L.).
PloS One 8(9): e73921.
3. Srivastava AK, Ramaswamy NK, Suprasanna
P and D’Souza SF (2010a) Genome-wide
analysis of thiourea modulated salinity-stress
responsive transcripts in seeds of Brassica
juncea L: Identification of signaling and effector
components of stress tolerance. Annals Of Botany
106, 663-674.
4. Srivastava AK, Suprasanna P, Srivastava S, D’Souza
SF (2010b) Thiourea mediated regulation in the
expression profile of aquaporins and its impact on
water homeostasis under salinity stress in Brassica
juncea roots. Plant Science 178, 517-522.
5. Srivastava AK, Srivastava S, Mishra S, Suprasanna
P, D’Souza SF (2014) Identification of redox-
regulated components of arsenate (AsV)
tolerance through thiourea supplementation in
rice. Metallomics 6, 1718-1730.
BARC NEWSLETTERBrief Communication
March-April 2015 | 3
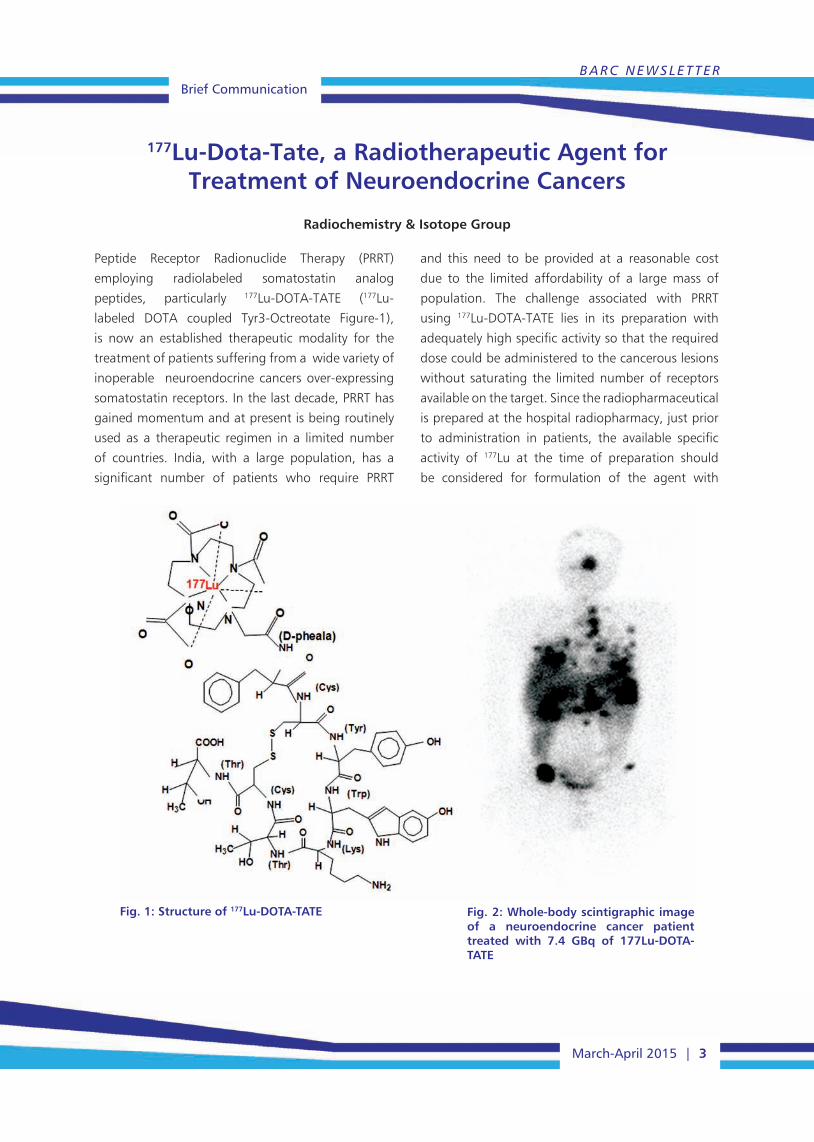
Peptide Receptor Radionuclide Therapy (PRRT)
employing radiolabeled somatostatin analog
peptides, particularly 177Lu-DOTA-TATE (177Lu-
labeled DOTA coupled Tyr3-Octreotate Figure-1),
is now an established therapeutic modality for the
treatment of patients suffering from a wide variety of
inoperable neuroendocrine cancers over-expressing
somatostatin receptors. In the last decade, PRRT has
gained momentum and at present is being routinely
used as a therapeutic regimen in a limited number
of countries. India, with a large population, has a
significant number of patients who require PRRT
and this need to be provided at a reasonable cost
due to the limited affordability of a large mass of
population. The challenge associated with PRRT
using 177Lu-DOTA-TATE lies in its preparation with
adequately high specific activity so that the required
dose could be administered to the cancerous lesions
without saturating the limited number of receptors
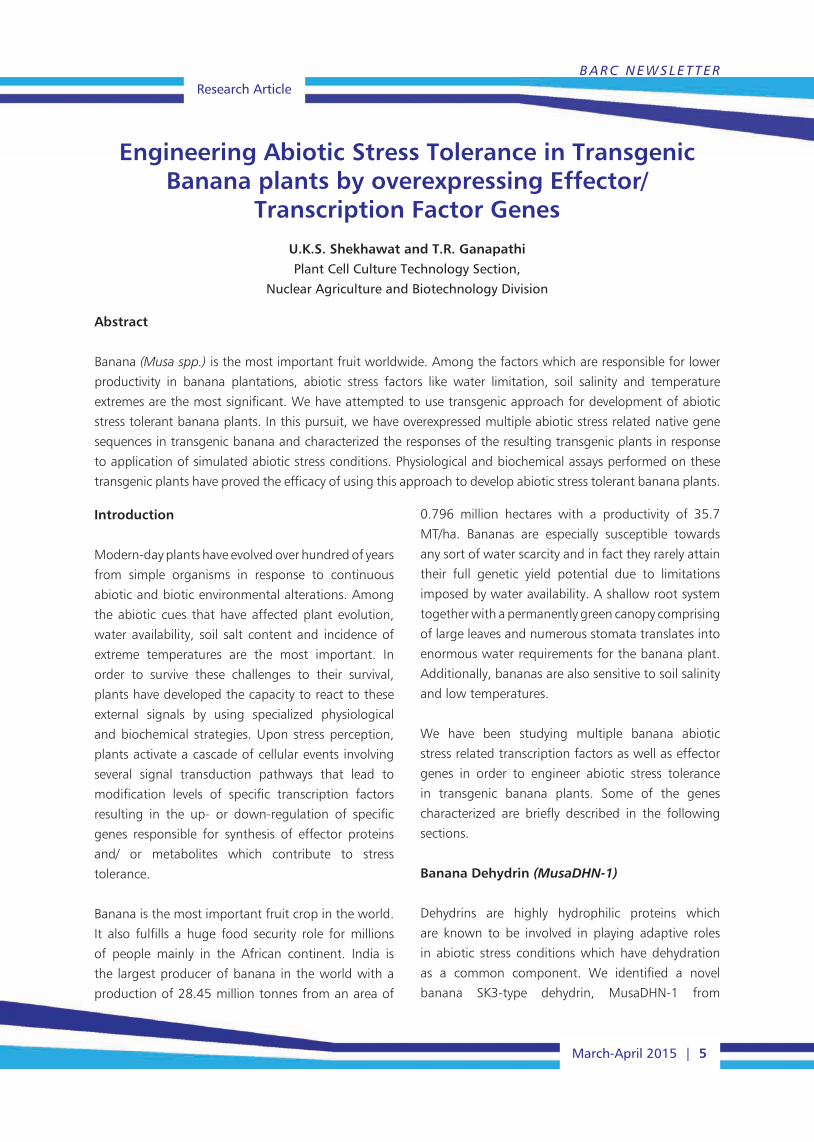
available on the target. Since the radiopharmaceutical
is prepared at the hospital radiopharmacy, just prior
to administration in patients, the available specific
activity of 177Lu at the time of preparation should
be considered for formulation of the agent with
177Lu-Dota-Tate, a Radiotherapeutic Agent for Treatment of Neuroendocrine Cancers
Radiochemistry & Isotope Group
Fig. 1: Structure of 177Lu-DOTA-TATE Fig. 2: Whole-body scintigraphic image of a neuroendocrine cancer patient treated with 7.4 GBq of 177Lu-DOTA-TATE

Brief CommunicationBARC NEWSLETTER
4 | March-April 2015
highest specific activity and thus ensuring maximum
therapeutic efficacy. Accordingly, a suitable method
for the ‘in-situ’ preparation of patient dose of 177Lu-
DOTA-TATE was developed in 2007 in our laboratory
using the 177Lu produced in BARC. This therapeutic
modality was introduced for the first time in India
in 2008 for the treatment of cancer patients in
collaboration with Department of Nuclear Medicine,
All India Institute of Medical Sciences (AIIMS),
New Delhi. Subsequently, to cater to the need of
increasing number of cancer patients, PRRT has been
started in nine other nuclear medicine centres across
our country and more than 1000 patients (on an
average 3-4 doses per patient) have benefitted from
this therapeutic modality till date. To simplify the
protocol for preparation of this radiopharmaceutical
at the user end, we have developed a freeze-dried
kit of DOTA-TATE in 2012, for the preparation of up
to 7.4 GBq patient dose of 177Lu-DOTA-TATE. This
single-vial kit, which enables a convenient and
single-step preparation of the agent using 177Lu
having specific activity ≥740 MBq/µg, has been
successfully used for the treatment of patients in a
couple of nuclear medicine centres in India. Further
clinical evaluation of the freeze-dried DOTA-TATE kit
is presently being pursued in collaboration with our
clinical partners. Awareness of the effectiveness of
PRRT and consequently the interest for use of 177Lu-
DOTA-TATE is increasing in India.
BARC NEWSLETTERResearch Article
March-April 2015 | 5
Introduction
Modern-day plants have evolved over hundred of years
from simple organisms in response to continuous
abiotic and biotic environmental alterations. Among
the abiotic cues that have affected plant evolution,
water availability, soil salt content and incidence of
extreme temperatures are the most important. In
order to survive these challenges to their survival,
plants have developed the capacity to react to these
external signals by using specialized physiological
and biochemical strategies. Upon stress perception,
plants activate a cascade of cellular events involving
several signal transduction pathways that lead to
modification levels of specific transcription factors
resulting in the up- or down-regulation of specific
genes responsible for synthesis of effector proteins
and/ or metabolites which contribute to stress
tolerance.
Banana is the most important fruit crop in the world.
It also fulfills a huge food security role for millions
of people mainly in the African continent. India is
the largest producer of banana in the world with a
production of 28.45 million tonnes from an area of
0.796 million hectares with a productivity of 35.7
MT/ha. Bananas are especially susceptible towards
any sort of water scarcity and in fact they rarely attain
their full genetic yield potential due to limitations
imposed by water availability. A shallow root system
together with a permanently green canopy comprising
of large leaves and numerous stomata translates into
enormous water requirements for the banana plant.
Additionally, bananas are also sensitive to soil salinity
and low temperatures.
We have been studying multiple banana abiotic
stress related transcription factors as well as effector
genes in order to engineer abiotic stress tolerance
in transgenic banana plants. Some of the genes
characterized are briefly described in the following
sections.
Banana Dehydrin (MusaDHN-1)
Dehydrins are highly hydrophilic proteins which
are known to be involved in playing adaptive roles
in abiotic stress conditions which have dehydration
as a common component. We identified a novel
banana SK3-type dehydrin, MusaDHN-1 from
Engineering Abiotic Stress Tolerance in Transgenic Banana plants by overexpressing Effector/
Transcription Factor GenesU.K.S. Shekhawat and T.R. GanapathiPlant Cell Culture Technology Section,
Nuclear Agriculture and Biotechnology Division
Abstract
Banana (Musa spp.) is the most important fruit worldwide. Among the factors which are responsible for lower
productivity in banana plantations, abiotic stress factors like water limitation, soil salinity and temperature
extremes are the most significant. We have attempted to use transgenic approach for development of abiotic
stress tolerant banana plants. In this pursuit, we have overexpressed multiple abiotic stress related native gene
sequences in transgenic banana and characterized the responses of the resulting transgenic plants in response
to application of simulated abiotic stress conditions. Physiological and biochemical assays performed on these
transgenic plants have proved the efficacy of using this approach to develop abiotic stress tolerant banana plants.
Research ArticleBARC NEWSLETTER
6 | March-April 2015
banana EST database maintained at NCBI and later
characterized this dehydrin by overexpressing it in
transgenic banana plants (Shekhawat et al. 2011).
In native untransformed banana plants MusaDHN-1
was found to be induced in leaves and roots by
drought, salinity, cold, oxidative and heavy metal
stress and by treatment with abscisic acid, ethylene
and methyl jasmonate. This inducible expression in
abiotic stress conditions indicated its involvement
in stress tolerance in banana plants. MusaDHN-1
promoter was isolated from banana genomic
DNA by employing TAIL-PCR technique. Promoter
analysis performed by constructing a MusaDHN-1
promoter: β-glucuronidase fusion construct and
its transformation in tobacco leaf discs confirmed
the abiotic stress inducibility of MusaDHN-1.
Transgenic banana plants which were conformed to
overexpress MusaDHN-1 constitutively were found
to be phenotypically normal in their growth and
development. When these plants were subjected
to drought and salt-stress treatments in in vitro
and ex vitro assays, they performed better than the
equivalent controls. Biochemical analysis of these
transgenic plants showed enhanced accumulation of
proline and reduced malondialdehyde levels in stress
conditions.
Banana Stress Associated Protein (MusaSAP1)
A20/AN1 zinc finger domain containing Stress
Associated Proteins (SAP) are known to be involved
in different stress response pathways in higher
plants. We have identified a novel banana SAP
gene, MusaSAP1, in banana EST database and this
gene was subsequently characterized by carrying
out its overexpression in transgenic banana plants
(Sreedharan et al. 2012). Expression profiling of
MusaSAP1 performed in native untransformed plants
indicated that it was up-regulated by drought, salt,
cold, heat and oxidative stress and by treatment with
abscisic acid. To confirm the cellular localization of
this protein a Musa-SAP1::GFP fusion protein was
designed and transformed into onion peel cells using
Agrobacterium mediated genetic transformation.
The fluorescence analysis indicated that MusaSAP1
is incompletely translocated to nucleus. Gene copy
number analysis of MusaSAP1 performed by real time
PCR and Southern blotting showed that MusaSAP1
gene occurs as a single copy per 11 chromosome
set in banana nucleus. Transgenic banana plants
which constitutively overexpressed MusaSAP1
were phenotypically indistinguishable from the
untransformed controls and also displayed better
stress tolerance features as compared to equivalent
controls in both in vitro and ex vivo assays. Further,
strong up-regulation of a polyphenol oxidase (PPO)
coding transcript seen in MusaSAP1 overexpressing
plants along with induction of MusaSAP1 by wounding
and methyl jasmonate treatment pointed towards
probable involvement of MusaSAP1 in banana biotic
stress responses where PPOs are expected to perform
major functions in multiple defense pathways.
Banana bZIP transcription factor (MusabZIP53)
bZIP transcription factors have been shown to be
involved in diverse cellular processes in plants. We
identified a bZIP gene, MusabZIP53, from banana EST
database and later characterized it by overexpressing
in transgenic banana plants of cultivar Rasthali
(Shekhawat et al. 2014). This gene was found to
be upregulated in native untransformed banana
plants in response to cold and drought stress and
also by ABA treatment in both leaf and root tissues.
Transgenic banana plants which constitutively
overexpressed MusabZIP53 showed prominent
growth retardation from very early stages of banana
transformation/regeneration procedure and later
the mature greenhouse hardened transgenic plants
were found to display a distinct dwarf phenotype.
These transgenic plants showed differential
regulation of genes belonging to several families
known to be involved in abiotic stress perception
and mitigation. These included genes responsible
for dehydration response element binding proteins,
late embryogenesis abundant proteins, anti-oxidant

BARC NEWSLETTERResearch Article
March-April 2015 | 7
enzymes, aquaporins, polyphenol oxidases, Aux/
IAA proteins and some of the proteins involved in
amino acid metabolism. We detected a strong up-
regulation of four polyphenol oxidase coding genes in
MusabZIP53 overexpressing plants together with high
induction of these transcripts in native banana leaves
by cold stress and ABA treatments which pointed
towards potential involvement of MusabZIP53 in
the master control of polyphenol oxidase activity in
banana plants.
Banana Plasma Membrane Intrinsic Protein (MusaPIP2;6)
High soil salinity is considered to be a major abiotic
stress for plants and it is an important limiting factor
in nurturing of crop plants worldwide. We identified
an aquaporin gene, MusaPIP2;6 and characterized
it by overexpressing in transgenic banana plants
(Sreedharan et al. 2015). MusaPIP2;6 was initially
identified using a comparative study of stressed and
Fig. 1: Schematic representation of development of abiotic stress tolerant transgenic banana plants using four native banana genes.
Research ArticleBARC NEWSLETTER
8 | March-April 2015
non-stressed banana tissues derived EST databases.
Its overexpression in transgenic banana plants was
undertaken to study its probable functions in banana.
It was found that overexpression of MusaPIP2;6 in
transgenic banana plants by employing a constitutive
or an inducible promoter (pMusaDHN-1) lead to
higher salt tolerance in comparison with equivalent
untransformed control plants. To confirm the exact
cellular localization of MusaPIP2;6 protein we
used transiently transformed onion peel cells and
found that MusaPIP2;6 protein tagged with GFP
was translocated to the cellular plasma membrane.
MusaPIP2;6-overexpressing transgenic banana
plants displayed comparatively better photosynthetic
efficiency (Fv/Fm ratios) and lower membrane damage
(MDA equivalents) under salt stressed conditions.
Conclusion
The characterization studies performed on four genes
in our laboratory over the last couple of years prove
the efficacy of using native genes for development
of abiotic stress tolerant transgenic banana plants
(Figure 1). Apart from abiotic stress tolerance banana
plants, we have also developed disease resistance
establishing the versatility of our approach. We plan
to demonstrate the efficacy of transgenic banana
lines developed in our laboratory through limited
field trials in near future.
References
1. Shekhawat UKS, Ganapathi TR, Srinivas L (2011)
MusaDHN-1, a novel multiple stress-inducible
SK3-type dehydrin gene, contributes affirmatively
to drought- and salt-stress tolerance in banana.
Planta 234:915–932.
2. Sreedharan S, Shekhawat UKS, Ganapathi TR
(2012) MusaSAP1, a A20/AN1 zinc finger gene
from banana functions as a positive regulator in
different stress responses. Plant Mol Biol 80:503–
517.
3. Shekhawat UKS, Ganapathi TR (2014) Transgenic
banana plants overexpressing MusabZIP53
display severe growth retardation with enhanced
sucrose and polyphenol oxidase activity. Plant
Cell Tiss Org Cult 116:387–402.
4. Sreedharan S, Shekhawat UKS, Ganapathi
TR (2015) Constitutive and stress-inducible
overexpression of a native aquaporin gene
(MusaPIP2;6) in transgenic banana plants signals
its pivotal role in salt tolerance. Plant Mol Biol (In
press) DOI: 10.1007/s11103-015-0305-2.

BARC NEWSLETTERResearch Article
March-April 2015 | 9
Introduction
Neutron detectors are essential tools used in various
fields like nuclear power, nuclear medicine, particle
physics, magnetism, etc. Currently, thermal neutron
detection relies on gas-filled high pressure tube based
detectors containing either Helium-3 (3He) or Boron
Trifluoride (BF3) gases [1]. These gas-filled detectors
require high bias voltages and use either toxic BF3 or
rare 3He gases. Though 3He is ideal for high pressure
gas-based neutron sensors owing to its high capture
cross-section for thermal neutrons, yet this state-of-
the-art detector is bulky and difficult to configure.
Further, 3He isotope has extremely low natural
abundance and mostly produced as a byproduct
of nuclear device manufacturing. The production
of nuclear weapons has been drastically reduced
over the past few decades leading to a shortage in 3He supply [2]. Therefore the demand for alternate
thermal neutron detectors is continuously increasing
due to the above challenges.
In search for an alternative to the 3He gas-filled neutron
detections, certain points need to be considered: a
neutron is an electrically neutral particle that interacts
only with a nucleus, so the material for its detection
must contain an element with a high neutron capture
cross-section. In order to be detected, this interaction
must produce charged particles. There are few isotopes
that meet these criteria: 6Li (n,a) (s= 938b), 10B (n,a)
(s = 3845 b), and natGd (n,b) (s = 49153 b). natCd also
has a high neutron capture cross-section (2520 b), but
does not produce any charged particle, therefore is not
useful for detector applications. Elements with lower
atomic numbers are preferable in order to reduce
gamma ray absorption. The solid state detectors
are more advantageous due to their higher atomic
density (compact size and much higher efficiency
compared to gas-filled detectors) and stability for a
prolonged useful life. An intensive search for a 3He
gas-based neutron detector replacement yielded new
technologies like organic liquid scintillators containing
Li, B, or Gd, thin film neutron absorber coatings for
semiconductor devices and for gas discharge counting
tubes. Research on a few materials like 6Li-glass:Ce, 6LiF/
ZnS:Ag, LiBaF3:Ce,K, LiBaF3:Ce,Rb, 6LiI:Eu, Cs6LiYCl6:Ce, 6LidepGd(11BO3)3:Ce, 6LidepGd(11BO3)3:Ce, etc. is currently
at the fore front to develop alternative materials that
could replace 3He gas-filled neutron [3,4].
Lithium tetraborate [Li2B4O7(LTB)] is a promising
material for the detection of thermal neutrons due to
Development of Thermal Neutron Detector based on Lithium Tetraborate (LTB) Single CrystalG.D. Patra, A.K. Singh, B. Tiwari, S.G. Singh, D.G. Desai, M. Tyagi, S. Sen,
S.C. Gadkari and S.K. GuptaTechnical Physics Division
Abstract
High quality single crystals of Ag doped lithium tetraborate (Li2B4O7:Ag) have been grown using the Czochralski
technique. The presence of naturally abundant 6Li and 10B in the crystal has been gainfully utilized to fabricate
compact devices to measure thermal neutron fluxes from various sources. To achieve a high signal-to-noise ratio,
a thermally stimulated luminescence (TSL) measurement set-up has been developed using a solar-blind PMT that
has a matching response with the emission from Ag+ ions. The measurements were carried out ex-situ as well as
in real-time.
Research ArticleBARC NEWSLETTER
10 | March-April 2015
the presence of 6Li and 10B (with a possibility to further
improve the performance using enriched materials).
In addition, the lower atomic number also imparts
some gamma transparency to the material. LTB is a
well known dosimetric material and a lot of literature
is available for its TSL response to different doses of γ and b radiations [5]. For neutron detection, LTB in the
form of single crystals has advantages compared to
other forms as it has high density, broad transmission
range, better mechanical hardness, better energy
proportionality and higher resolution. 6Li and 10B in
the LTB interact with neutrons to produce energetic
charged particles. Subsequently these charged
particles deposit their energies resulting in the
generation of electron and holes that are trapped in
trap centers present in the material. The absorbed
dose information may be retrieved by heating the
samples in a thermally stimulated luminescence (TSL)
read out set-up. Thus, the neutron flux could be
measured both in passive mode (neutron dosimetry
[6],[7]) by ex-situ heating of the sample after the
neutron exposure and in real-time by collecting
the signal with a continuous heating of the sample
during the neutron exposure.
In this article we describe the growth of LTB:Ag single
crystals and development of a TSL set-up to measure
thermal neutron flux ex-situ as well as in real-time.
Single Crystal Growth
Single crystals of LTB:Ag were grown by the Czochralski
method. An automatic diameter controlled crystal
puller (Oxypuller, Cyberstar) was used for the growth of
crystals [8]. Commercially available LTB polycrystalline
powder material (99.998% pure, Aldrich make) was
used as a starting charge. Activator Ag ions were
mixed with the LTB starting charge in the form of
high purity Ag2O. To optimize the Ag concentration,
LTB crystals with different amounts of Ag2O in the
range from 0.1 to 1.1 wt.% were grown. Li and B
were taken in their natural abundance without
further enrichment of 6Li and 10B. A platinum crucible
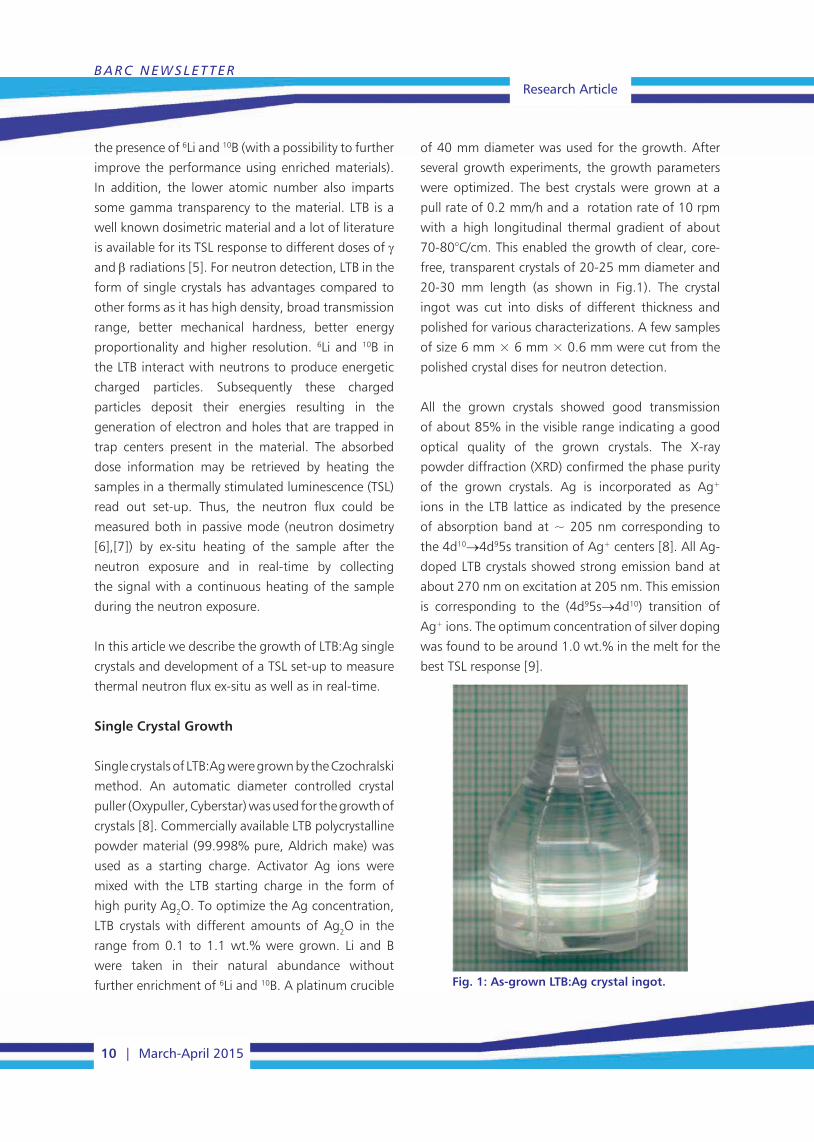
of 40 mm diameter was used for the growth. After
several growth experiments, the growth parameters
were optimized. The best crystals were grown at a
pull rate of 0.2 mm/h and a rotation rate of 10 rpm
with a high longitudinal thermal gradient of about
70-80°C/cm. This enabled the growth of clear, core-
free, transparent crystals of 20-25 mm diameter and
20-30 mm length (as shown in Fig.1). The crystal
ingot was cut into disks of different thickness and
polished for various characterizations. A few samples
of size 6 mm × 6 mm × 0.6 mm were cut from the
polished crystal dises for neutron detection.
All the grown crystals showed good transmission
of about 85% in the visible range indicating a good
optical quality of the grown crystals. The X-ray
powder diffraction (XRD) confirmed the phase purity
of the grown crystals. Ag is incorporated as Ag+
ions in the LTB lattice as indicated by the presence
of absorption band at ~ 205 nm corresponding to
the 4d10→4d95s transition of Ag+ centers [8]. All Ag-
doped LTB crystals showed strong emission band at
about 270 nm on excitation at 205 nm. This emission
is corresponding to the (4d95s→4d10) transition of
Ag+ ions. The optimum concentration of silver doping
was found to be around 1.0 wt.% in the melt for the
best TSL response [9].
Fig. 1: As-grown LTB:Ag crystal ingot.
BARC NEWSLETTERResearch Article
March-April 2015 | 11
TSL Read Out Set-Up for Neutron Dosimetry
It is always desirable to get higher sensitivity for
a dosimeter material. To accomplish this, the
luminescence must be well matched with the spectral
response of the photo-detector in a TSL readout
system. We had earlier found that the emission band
of LTB:Ag at 270 nm [9] does not match well with the
spectral response of conventional photo-multiplier
tubes (PMT). Therefore, an ET make 9422B solar
blind PMT having a spectral response in the range
from 110 to 360 nm was employed as the photo-
detector in an in-house developed TSL detection set-
up. This read-out set-up was used for recording the
TSL glow curve of the LTB:Ag crystal samples exposed
to various radiations like gamma-rays and neutrons.
Recently, we have shown that this modified TSL
readout set-up could measure a gamma dose as low
as 3 μGy with a minimum detectable dose in the sub-
micro Gy range [9]. Using this read out system we
have recently found that LTB:Ag is a very promising
dosimeter material for γ and b rays. The same set-up
was used for thermal neutron detection.
Neutron Dosimetry
For neutron dosimetry first LTB:Ag crystals were
irradiated with thermal neutrons and the TSL glow curve
of irradiated samples was recorded using the TSL set-
up. For neutrons exposure, few samples of size 6 mm ×
6 mm × 0.6 mm were irradiated with thermal
neutrons (l: 5Å) of about 106 n/s/cm2 flux through a
2 mm slit (neutron beamline at the Dhruva reactor,
BARC). Exposure for different time periods was given
to get different fluences. Thereafter, TSL glow curves
were recorded at a constant heating rate of 1oC/s. The
TSL curve for all the neutron irradiated samples showed
a peak at about 160oC, similar to gamma irradiation
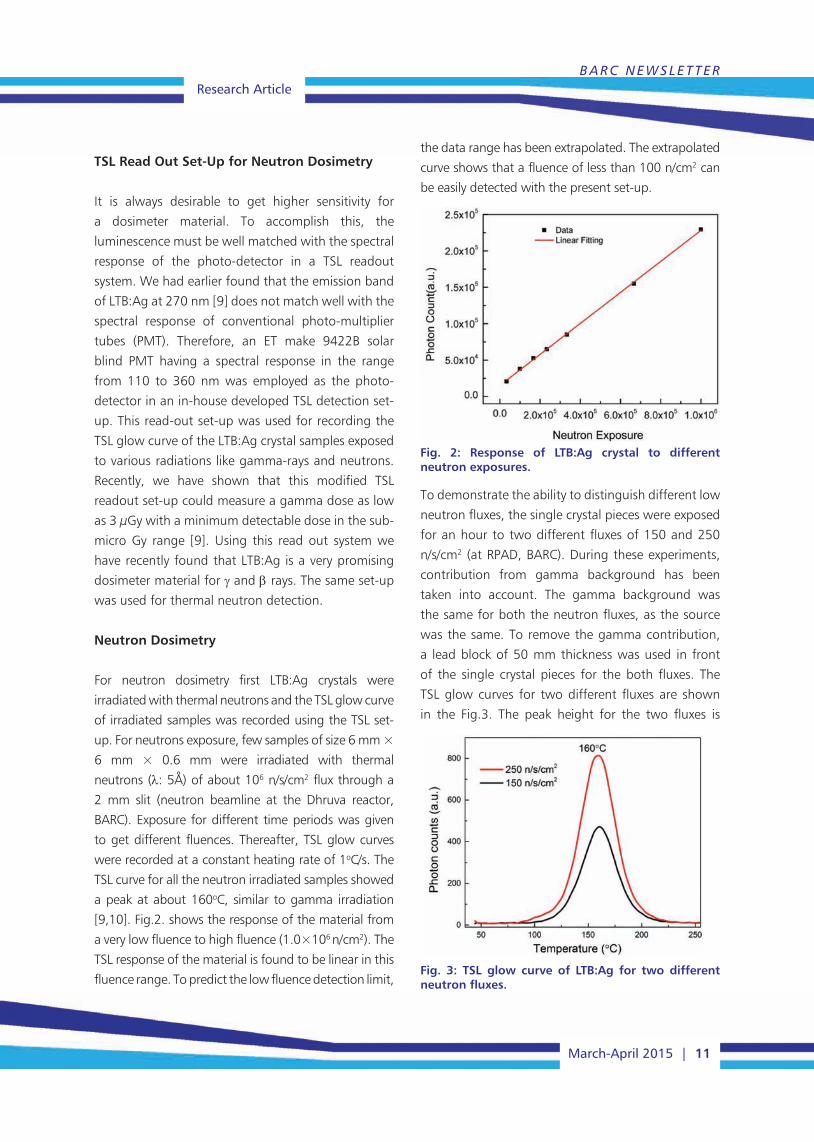
[9,10]. Fig.2. shows the response of the material from
a very low fluence to high fluence (1.0×10⁶ n/cm2). The
TSL response of the material is found to be linear in this
fluence range. To predict the low fluence detection limit,
the data range has been extrapolated. The extrapolated
curve shows that a fluence of less than 100 n/cm2 can
be easily detected with the present set-up.
Fig. 2: Response of LTB:Ag crystal to different neutron exposures.
To demonstrate the ability to distinguish different low
neutron fluxes, the single crystal pieces were exposed
for an hour to two different fluxes of 150 and 250
n/s/cm2 (at RPAD, BARC). During these experiments,
contribution from gamma background has been
taken into account. The gamma background was
the same for both the neutron fluxes, as the source
was the same. To remove the gamma contribution,
a lead block of 50 mm thickness was used in front
of the single crystal pieces for the both fluxes. The
TSL glow curves for two different fluxes are shown
in the Fig.3. The peak height for the two fluxes is
Fig. 3: TSL glow curve of LTB:Ag for two different neutron fluxes.
Research ArticleBARC NEWSLETTER
12 | March-April 2015
different and the ratio of the integrated area of the
two peaks is measured as 1.6 which is very close to
the calculated ratio of 1.67. Here the calculated ratio
means the ratio of two different neutron fluxs of 250
and 150 n/s/cm2 (i.e. 250/150=1.67). Thus the crystal
can easily distinguish between two different low level
neutron fluxes.
In-Situ Real Time Thermal Neutron Detection
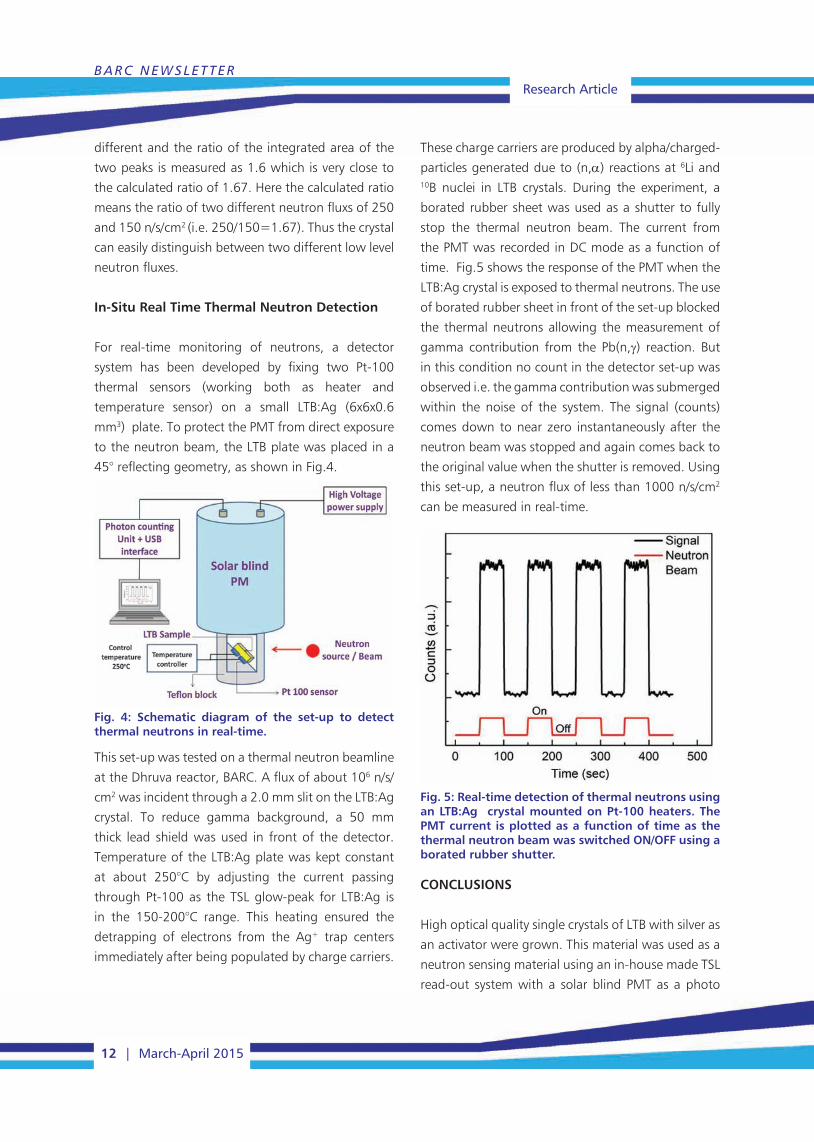
For real-time monitoring of neutrons, a detector
system has been developed by fixing two Pt-100
thermal sensors (working both as heater and
temperature sensor) on a small LTB:Ag (6x6x0.6
mm3) plate. To protect the PMT from direct exposure
to the neutron beam, the LTB plate was placed in a
45° reflecting geometry, as shown in Fig.4.
These charge carriers are produced by alpha/charged-
particles generated due to (n,a) reactions at 6Li and 10B nuclei in LTB crystals. During the experiment, a
borated rubber sheet was used as a shutter to fully
stop the thermal neutron beam. The current from
the PMT was recorded in DC mode as a function of
time. Fig.5 shows the response of the PMT when the
LTB:Ag crystal is exposed to thermal neutrons. The use
of borated rubber sheet in front of the set-up blocked
the thermal neutrons allowing the measurement of
gamma contribution from the Pb(n,γ) reaction. But
in this condition no count in the detector set-up was
observed i.e. the gamma contribution was submerged
within the noise of the system. The signal (counts)
comes down to near zero instantaneously after the
neutron beam was stopped and again comes back to
the original value when the shutter is removed. Using
this set-up, a neutron flux of less than 1000 n/s/cm2
can be measured in real-time.
Fig. 4: Schematic diagram of the set-up to detect thermal neutrons in real-time.
This set-up was tested on a thermal neutron beamline
at the Dhruva reactor, BARC. A flux of about 106 n/s/
cm2 was incident through a 2.0 mm slit on the LTB:Ag
crystal. To reduce gamma background, a 50 mm
thick lead shield was used in front of the detector.
Temperature of the LTB:Ag plate was kept constant
at about 250°C by adjusting the current passing
through Pt-100 as the TSL glow-peak for LTB:Ag is
in the 150-200°C range. This heating ensured the
detrapping of electrons from the Ag+ trap centers
immediately after being populated by charge carriers.
Fig. 5: Real-time detection of thermal neutrons using an LTB:Ag crystal mounted on Pt-100 heaters. The PMT current is plotted as a function of time as the thermal neutron beam was switched ON/OFF using a borated rubber shutter.
CONCLUSIONS
High optical quality single crystals of LTB with silver as
an activator were grown. This material was used as a
neutron sensing material using an in-house made TSL
read-out system with a solar blind PMT as a photo

BARC NEWSLETTERResearch Article
March-April 2015 | 13
detector. The samples were tested with sources
of neutrons and small variation in the neutron flux
was easily measured using the TSL glow curve. The
detection of neutrons was also demonstrated in
real-time using the LTB:Ag crystal heated at about
250°C. The sensitivity of this material can be further
enhanced by using LTB material enriched in 6Li and 10B.
Acknowledgement
Authors are grateful to Head, RPAD and Head, SSPD
for allowing to conduct experiments using various
neutron sources.
References
1. R. T. Kouzes, J. R. Ely, A. T. Lintereur, and D. L.
Stephens, PNNL-18903,” PNNL Report, 2009.
2. R.T Kouzes, Report PNNL-18388, Dept. of Energy
(2009)
3. C.W.E. van Eijk, Nucl. Instr. and Meth. A 460
(2001) 1.
4. C.W.E. van Eijk, A. Bessiere, P. Dorenbos Nucl.
Instr. and Meth. A 529 (2004) 260.
5. Babita Tiwari, N. S. Rawat, D. G. Desai, S. G.
Singh, M. Tyagi, P. Ratna, S. C. Gadkari, and M.
S. Kulkarni, J. Lumin. 130 (2010) 2076.
6. H Ing, Radiation Measurements. 33 (2001) 275.
7. Francesco D’Errico, Ravinder Nath,
Giovanni Silvano, Luigi Tana, International Journal of
Radiation Oncology*Biology*Physics 41, (1998)
1185.
8. G.D. Patra, Mohit Tyagi, D.G. Desai, Babita
Tiwari, Shashwati Sen, S.C. Gadkari. J. Lumin.
132 (2012) 1101.
9. G.D. Patra, S.G. Singh, A.K. Singh, M. Tyagi, D.G.
Desai, B. Tiwari, S. Sen, S.C. Gadkari, J. Lumin.
157 (2015) 333.
10. A. T. Brant, B. E. Kananan, M. K. Murari, J. W.
McClory, J. C. Petrosky, V. T. Adamiv, Ya. V.
Burak, P. A. Dowben, and L. E. Halliburton, J.
Appl. Phys. 110 (2011) 093719.

Technology Development ArticleBARC NEWSLETTER
14 | March-April 2015
Good quality, reliable solar radiation data is extremely
important for all research activities in solar energy
applications. Photovoltaic (PV) and Concentrating
Solar Power (CSP) systems need accurate solar
radiation information for the performance evaluation
both in short term and long term. In different
solar technology research, improvements in the
performance of technologies (e.g. PV/CSP) are often
small and incremental, but the total and cumulative
gain can be large. Different technological solutions
may show different efficiencies under ideal laboratory
simulation. However, this needs to be verified in
real time under varying weather and sky conditions
compared to ‘reference’ quality solar radiation
measurements.
Hence, for any solar technology development or
product quality control, it is extremely important to
measure the solar radiation accurately. In order to
maximise operating efficiency of a plant or system,
solar radiation monitoring instruments at the plant
provide the irradiance data to assess the efficiency of
the energy generation chain. Using high quality solar
radiation measurements at the plant, a database of
performance can be built up, allowing more accurate
forecasting of the future energy yield.
The Ministry of New and Renewable Energy (MNRE)
has undertaken the programme of implementing
the objectives of the Jawaharlal Nehru National
Solar Mission launched by the Govt. of India. It
is observed that in the last two decades, there has
been significant reduction in solar Direct Normal
Irradiance (DNI) in most of the regions in India as per
the research work published by scientists [1, 2, and
3]. This phenomenon is termed as Solar Dimming. It
was suggested that any informed decision on Solar
Installation and Commissioning of an Automatic Solar Radiation Monitoring System (ASRMS)
Ananta Joshi and R.J. PatelRefuelling Technology Division
thermal or Concentrated Photovoltaic technologies
cannot be taken without inputs on future DNI at
sight with a good degree of confidence.
The task of exploring this issue further was taken up
by the Refueling Technology Division (RTD) of BARC.
Subsequently, a detailed survey was carried out in this
regard. The above mentioned research findings were
traced to the papers published in the year 2009-10
in the Journal of Geophysics, wherein, scientists had
published the analysis and results of their research
work from the data collected from the Indian
Meteorology Department (IMD) stations on the Solar
Dimming phenomenon [1, 3]. However, due to lack
of enough solar irradiance data in all parts of India,
all the regions could not be covered for the analysis.
The Ministry of New and Renewable Energy (MNRE),
Government of India has launched a nation-wide
network of Solar Radiation Resource Assessment
(SRRA) stations in phases. This project is being
implemented by the National Institute of Wind Energy
(NIWE), Chennai, an autonomous R & D institution
under the Ministry, because of its rich experience
in Wind Resource Assessment and development of
Wind Atlas for the nation. Under this project, over
100 SRRA stations have been commissioned during
2012-13 and these are uniformly located to cover
the entire country for proper assessment of solar
resources.
An Automatic Solar Radiation Monitoring System
(ASRMS), manufactured by GEONICA, Spain, was
integrated and installed by RTD at Engineering
Hall-7 roof top, BARC, for XII plan project on
“Technology development for solar tower power
plant”. The purpose of this system is to continuously

BARC NEWSLETTERTechnology Development Article
March-April 2015 | 15
monitor, collect and communicate the solar radiation
parameters to a Central Receiving Station (CRS) located
at control room of Hall-7, BARC for solar radiation
resource assessment. The measured radiation data in
real time will be utilized to evaluate the efficiency of
prototype solar test facility installed at Hall-7 roof top.
This system will also be used for evaluation of efficiency
of other test facilities planned to be installed at Gamma
Garden, BARC. For present application, this system has
a Field Station at the roof top with full communication
and data receiving, archiving and analysis facility at a
Receiving Station at Hall-7 control room.
The field station will continuously measure Global
Horizontal Irradiance (GHI), Diffuse Horizontal Irradiance
(DHI) and Direct Normal Irradiance (DNI). Referring to
the Fig. 1, DNI is the solar irradiance that passes through
directly to the earth’s surface falling on a surface normal
to the sun beam, DHI is the solar irradiance that is
scattered out of the direct sun beam and falling on a
horizontal surface and GHI is the Direct and the Diffuse
component of sunlight falling together on a horizontal
surface. The measurement of DNI is important for
evaluation of Concentrating Solar Power (CSP) and
Concentrating Photovoltaic (CPV) systems whereas GHI/
DHI measurements help evaluate PV systems. Following
Fig. 1 describes these terms pictorially.
This system has the following Instruments;
a) Pyranometer for GHI measurement
b) Shaded Pyranometer for DHI measurement
c) Pyrheliometer for DNI measurement.
All the three instruments are calibrated with the
instruments traceable to World Radiometric Reference
(WRR) of World Radiation Center (WRC), Davos of
WMO.
The system has a two-axis chronological Sun
Tracker with its control system mounted with
Pyranometers, shading disc and Pyrheliometer.
The sun tracker continuously tracks the sun
guided by an algorithm that calculates the sun’s
position, based on geographical location and
the date and time and aligns itself with the sun
for these measurements. The sun tracker control
system along with its data acquisition system
uses the values of Longitude, Latitude, Altitude
and Solar time to calculate the position of sun for
activating tracker motors for alignment with the
sun in real time. Global Positioning System (GPS)
Receiver is installed with this system to acquire
the values of Longitude, Latitude, Altitude and
Solar time of the location. The data logger in this
system samples the data every second for all the
parameters averaging every minute.
It has a clock circuit that can be
automatically synchronized by the
GPS receiver, internally integrated
with the unit’s own electronic
circuit and connected to an external
antenna that receives time and
position signals from a constellation
of satellites (GLONASS and GPS).
This time is used to calibrate the
position of the Sun Tracker pointing
arm vis-a-vis GPS solar timings. This
permits clock precision of the order
of nanoseconds, which is required
for precisely synchronizing the
pace of the clock. The Data logger Fig. 1: GHI, DHI and DNI
Global Horizontal Irradiance (GHI) Diffuse Horizontal Irradiance (DHI)

Technology Development ArticleBARC NEWSLETTER
16 | March-April 2015
collects the data from the Instruments at the roof
top and transfers to Receiving Station at Hall-7
control room. PV panels are used for power supply.
Pictures of the installed system (Figs. 2 and 3) and
sample data (Figs. 4a thru 4d) of Solar irradiance
measured hourly on specific days is shown.
Fig. 2: Automatic Solar Radiation Monitoring System (ASRMS)
Fig. 2: Sensors for measuring GHI, DHI and DNI

BARC NEWSLETTERTechnology Development Article
March-April 2015 | 17
Fig. 4a: Sample data of Solar irradiance measured on specific day
Fig. 4b: Sample data of Solar irradiance measured on specific day
Fig. 4c: Sample data of Solar irradiance measured on specific month

Technology Development ArticleBARC NEWSLETTER
18 | March-April 2015
The measurement of solar irradiance data by ASRMS
in real time will help in performance evaluation of
different solar technologies being developed in BARC
and also in long term data acquisition for studies on
effect of Solar Dimming.
References
1. Seminal role of clouds on solar dimming over the
Indian monsoon region B. Padma Kumari and
B.N. Goswami, Geophysics Research Letter, 37,
L06703, 2010.
2. Solar dimming over the tropical urban region of
Hyderabad, India: Effect of increased cloudiness
and increased anthropogenic aerosols K.V.S.
Badarinath, A.R. Sharma, D.G. Kaskaoutis, S.K.
Kharol, and H.D. Kambezidis J. Geophysics. Res.,
115, D21208, 2010.
3. Observational evidence of solar dimming:
Offsetting surface warming over India B. Padma
Kumari, A.L. Londhe, S. Daniel, and D.B. Jadhav,
Geophysics. Research Letter, 34, L21810, 2007.
Fig. 4d: Sample data of Solar irradiance measured on specific month
BARC NEWSLETTERTechnology Development Article
March-April 2015 | 19
Abstract
The New Hot-Cells Facility (NHF) of Post Irradiation Examination Division (PIED) at RLG, BARC is designed for
the Post Irradiation Examination (PIE) of irradiated nuclear fuels and structural components from research and
power reactors. The NHF consists of two hot cells made of heavy density concrete and a number of lead cells.
The hot cells are designed to handle b-g radioactivity. The lead cells in the facility are equipped with testing
machines for evaluation of mechanical properties of irradiated materials. In addition, the facility will be also
used for failure analysis of nuclear reactor components. This article describes the salient features of the hot cells
and the PIE capabilities of the NHF.
New Hot Cell Facility for Post Irradiation ExaminationAnil Bhandekar, K.M. Pandit, M.P. Dhotre, P. Nagaraju*, B.N. Rath, Prerna Mishra,
Sunil Kumar, J.S. Dubey, G.K. Mallik, J.L. SinghPost Irradiation Examination Division
*Hot Lab Utilities & Egineering Services Section
Introduction
Reliable performance of nuclear fuels and critical
core components have a large bearing on the
economics of nuclear power and radiation safety
of the plant operating personnel. In view of
this, PIE is periodically carried out on fuels and
components to generate feedback information
which is used by the designers, fabricators and
the reactor operators to bring about suitable
changes for improved performance of the fuel and
components. Examination
of the fuel bundles has
to be carried out inside
hot cells due to the high
radioactivity associated
with them. In the last four
decades, post irradiation
examination of different
types of experimental as
well as power reactor
fuels and structural
components used in the
core of the reactor has
been carried out in the old
hot cells facility of the Post
Irradiation Examination
Division of BARC. The new
hot cell facility (NHF) has been designed, built
and commissioned with additional features and
capabilities, as an add-on facility to the old hot cells.
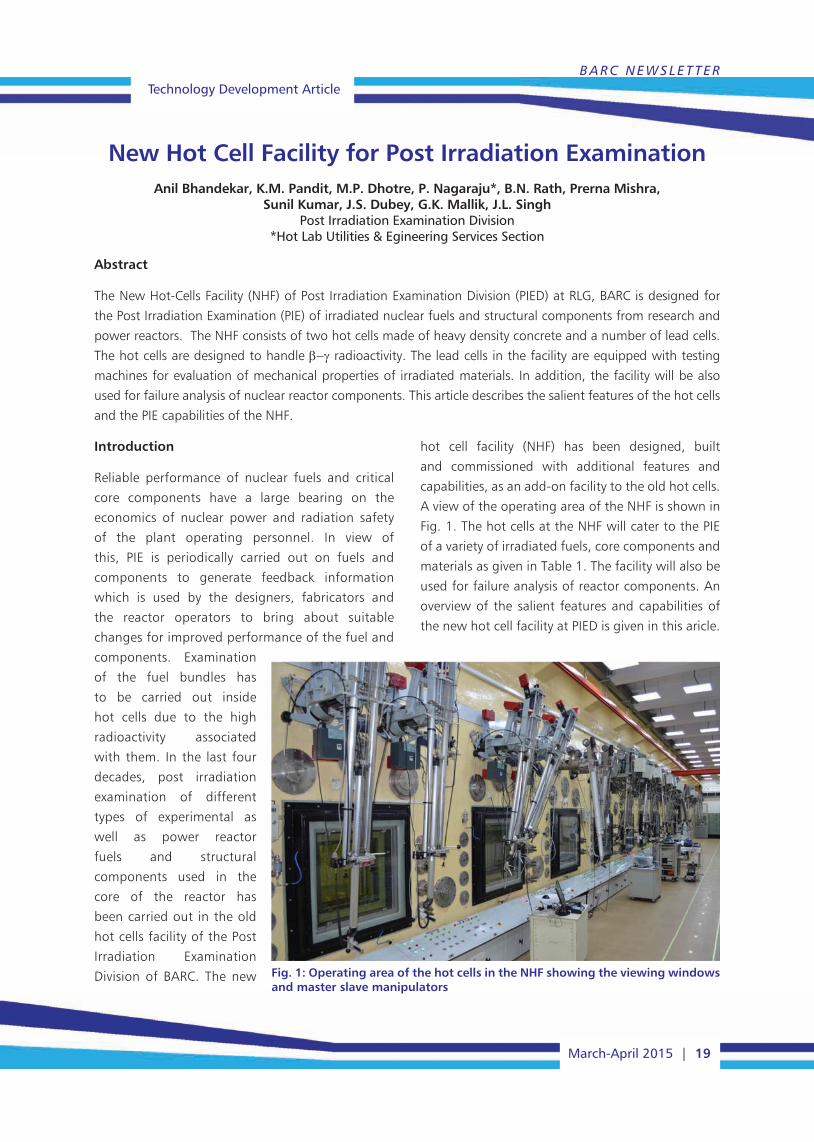
A view of the operating area of the NHF is shown in
Fig. 1. The hot cells at the NHF will cater to the PIE
of a variety of irradiated fuels, core components and
materials as given in Table 1. The facility will also be
used for failure analysis of reactor components. An
overview of the salient features and capabilities of
the new hot cell facility at PIED is given in this aricle.
Fig. 1: Operating area of the hot cells in the NHF showing the viewing windows and master slave manipulators
Technology Development ArticleBARC NEWSLETTER
20 | March-April 2015
New Hot Cell Facility (NHF)
The new hot cell facility has two areas for handling
radioactive materials. They are:
• Hotcellsforhandlinghighlyradioactiveirradiated
fuels and structural materials
a. NU fuel bundles and MOX fuel bundles from
the PHWRs
b. MOX fuel bundles and LEU bundles from the
BWRs
c. Experimental MOX fuels irradiated in research
reactors
d. MOX/LEU fuel bundles from future PWRs
e. Fuels of research reactors & future reactors
such as AHWR, CHTR, etc.
f. Pressure tubes, Calandria tubes and End
fittings of the PHWRs
g. Control blades of BWRs and Control elements
of the PHWRs
h. Shut off rods of the PHWRs
i. Other core internals which are to be assessed
j. Surveillance specimens from BWRs
k. Material irradiated for materials development
programme
Table 1: List of fuels and components which can be examined in NHF
• Leadcellsandlowactivelaboratoriesforhandling
of specimens with a lower radiation field.
Comparison of New and Old Hot Cells
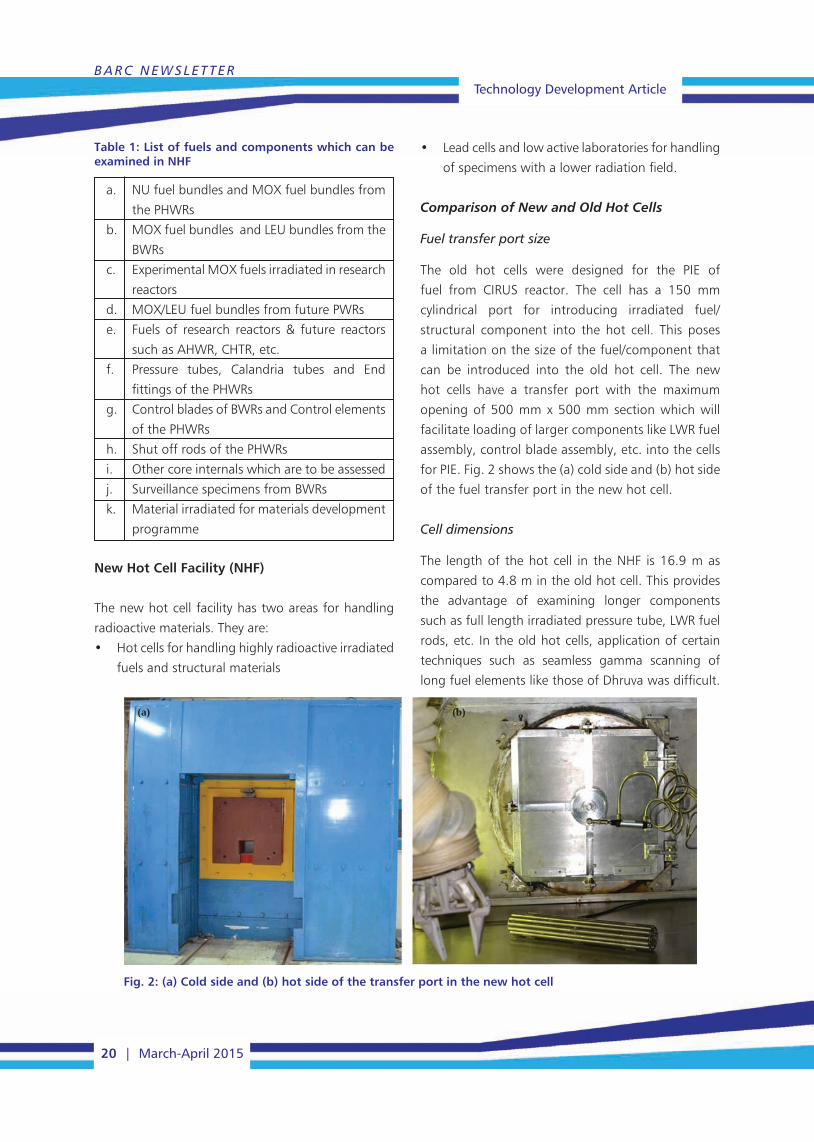
Fuel transfer port size
The old hot cells were designed for the PIE of
fuel from CIRUS reactor. The cell has a 150 mm
cylindrical port for introducing irradiated fuel/
structural component into the hot cell. This poses
a limitation on the size of the fuel/component that
can be introduced into the old hot cell. The new
hot cells have a transfer port with the maximum
opening of 500 mm x 500 mm section which will
facilitate loading of larger components like LWR fuel
assembly, control blade assembly, etc. into the cells
for PIE. Fig. 2 shows the (a) cold side and (b) hot side
of the fuel transfer port in the new hot cell.
Cell dimensions
The length of the hot cell in the NHF is 16.9 m as
compared to 4.8 m in the old hot cell. This provides
the advantage of examining longer components
such as full length irradiated pressure tube, LWR fuel
rods, etc. In the old hot cells, application of certain
techniques such as seamless gamma scanning of
long fuel elements like those of Dhruva was difficult.
Fig. 2: (a) Cold side and (b) hot side of the transfer port in the new hot cell
(a) (b)
BARC NEWSLETTERTechnology Development Article
March-April 2015 | 21
The NHF provides the facility of continuous scanning
of longer fuel elements.
Shielding Capacity
The shielding capacity of the old hot cells is up to 105
Ci of Co60. The hot cells at the NHF are capable of
handling higher activities up to 2.5 x10⁵ Ci of Co60 or
2.6x 10⁶ Ci of fission products.
Features of the New Hot Cells
The NHF consists of two hot cells, namely Cell-1
& Cell-2 and is designed to handle b-g radiation.
The front, rear and side walls of the cells are 1.5
m thick and are made of heavy density concrete
(density=3.4 g/cc). The bigger cell (Cell–1) is 16.9
m long, 2.1 m wide and 4.7 m high and the smaller
cell (Cell–2) is 5 m long, 2.1 m wide and 4.7 m
high. All regions of Cell–1 and Cell–2 are provided
with lead glass viewing windows, master slave
manipulators (MSMs), ports for in-cell camera and
service plugs, which are essential for carrying out
PIE. Cell-1 is fitted with seven radiation shielding
windows and seven pairs of rugged duty master
slave manipulators. Cell-2 is fitted with two radiation
shielding windows and two pairs of rugged duty
master slave manipulators.
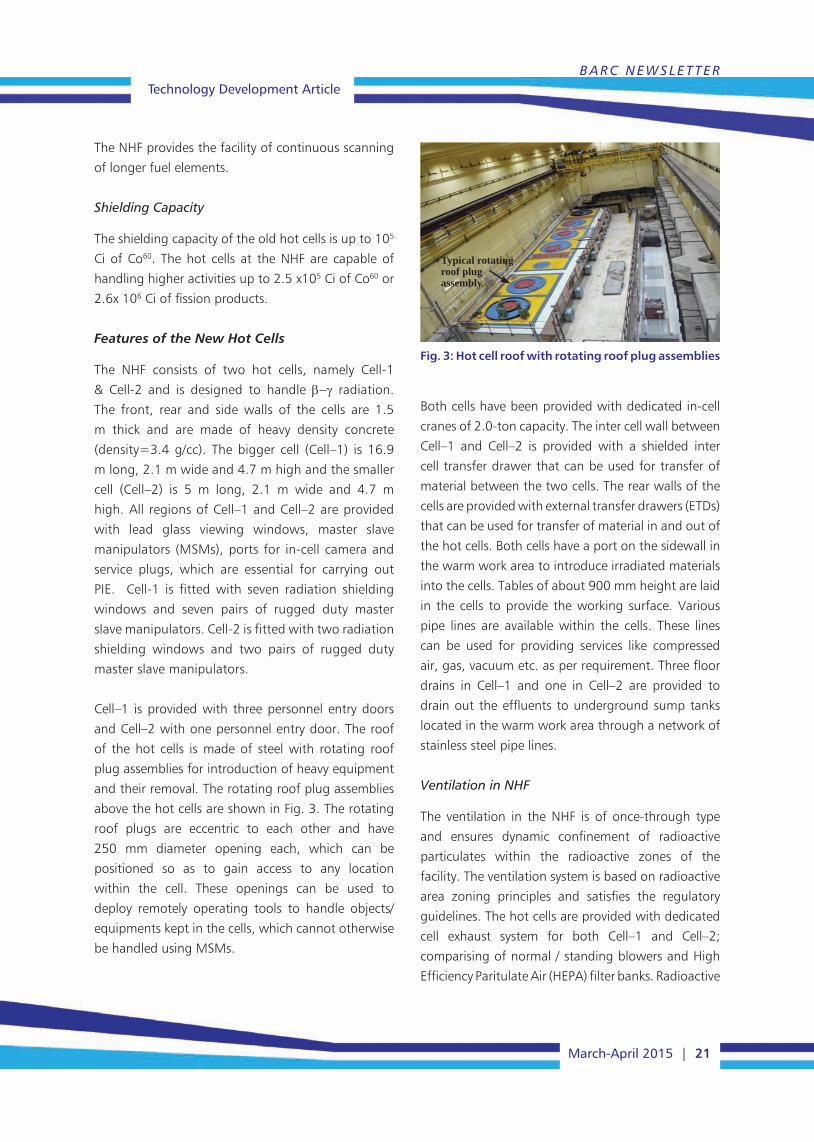
Cell–1 is provided with three personnel entry doors
and Cell–2 with one personnel entry door. The roof
of the hot cells is made of steel with rotating roof
plug assemblies for introduction of heavy equipment
and their removal. The rotating roof plug assemblies
above the hot cells are shown in Fig. 3. The rotating
roof plugs are eccentric to each other and have
250 mm diameter opening each, which can be
positioned so as to gain access to any location
within the cell. These openings can be used to
deploy remotely operating tools to handle objects/
equipments kept in the cells, which cannot otherwise
be handled using MSMs.
Fig. 3: Hot cell roof with rotating roof plug assemblies
Typical rotating roof plug assembly
Both cells have been provided with dedicated in-cell
cranes of 2.0-ton capacity. The inter cell wall between
Cell–1 and Cell–2 is provided with a shielded inter
cell transfer drawer that can be used for transfer of
material between the two cells. The rear walls of the
cells are provided with external transfer drawers (ETDs)
that can be used for transfer of material in and out of
the hot cells. Both cells have a port on the sidewall in
the warm work area to introduce irradiated materials
into the cells. Tables of about 900 mm height are laid
in the cells to provide the working surface. Various
pipe lines are available within the cells. These lines
can be used for providing services like compressed
air, gas, vacuum etc. as per requirement. Three floor
drains in Cell–1 and one in Cell–2 are provided to
drain out the effluents to underground sump tanks
located in the warm work area through a network of
stainless steel pipe lines.
Ventilation in NHF
The ventilation in the NHF is of once-through type
and ensures dynamic confinement of radioactive
particulates within the radioactive zones of the
facility. The ventilation system is based on radioactive
area zoning principles and satisfies the regulatory
guidelines. The hot cells are provided with dedicated
cell exhaust system for both Cell–1 and Cell–2;
comparising of normal / standing blowers and High
Efficiency Paritulate Air (HEPA) filter banks. Radioactive
Technology Development ArticleBARC NEWSLETTER
22 | March-April 2015
areas are also provided with separate lab exhaust and
air supply system. Dust free cooled air is supplied in
all radioactive area except hot cells. The hot cell is
maintained at a negative pressure of 25 mm of water
column (WC) with respect to operating area. There are
20 air changes per hour in the hot cells. The elaborate
safety interlocks provided in the ventilation system
ensure radiological safety of the plant personnel and
public. Contaminated air passes through multiple
HEPA filter banks before being released through the
stack after monitoring, to ensure that the release
of radioactivity in the environment is within the
approved regulatory limits. The ventilation system
is provided with data acquisition and monitoring
system. Real time data of safety related parameters of
ventilation such as negative pressure in hot cells, air
changes per hour, pressure drop across HEPA filters
etc. is monitored and logged in the central console
located at operating area.
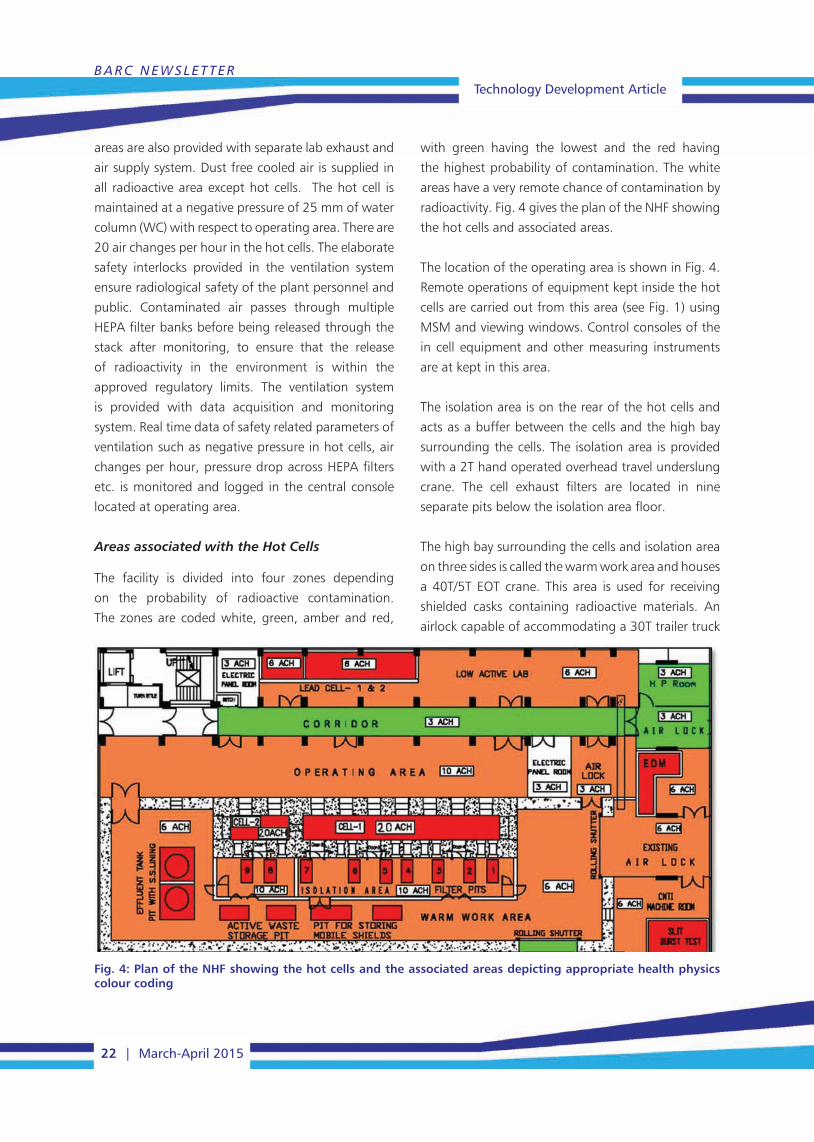
Areas associated with the Hot Cells
The facility is divided into four zones depending
on the probability of radioactive contamination.
The zones are coded white, green, amber and red,
with green having the lowest and the red having
the highest probability of contamination. The white
areas have a very remote chance of contamination by
radioactivity. Fig. 4 gives the plan of the NHF showing
the hot cells and associated areas.
The location of the operating area is shown in Fig. 4.
Remote operations of equipment kept inside the hot
cells are carried out from this area (see Fig. 1) using
MSM and viewing windows. Control consoles of the
in cell equipment and other measuring instruments
are at kept in this area.
The isolation area is on the rear of the hot cells and
acts as a buffer between the cells and the high bay
surrounding the cells. The isolation area is provided
with a 2T hand operated overhead travel underslung
crane. The cell exhaust filters are located in nine
separate pits below the isolation area floor.
The high bay surrounding the cells and isolation area
on three sides is called the warm work area and houses
a 40T/5T EOT crane. This area is used for receiving
shielded casks containing radioactive materials. An
airlock capable of accommodating a 30T trailer truck
Fig. 4: Plan of the NHF showing the hot cells and the associated areas depicting appropriate health physics colour coding
BARC NEWSLETTERTechnology Development Article
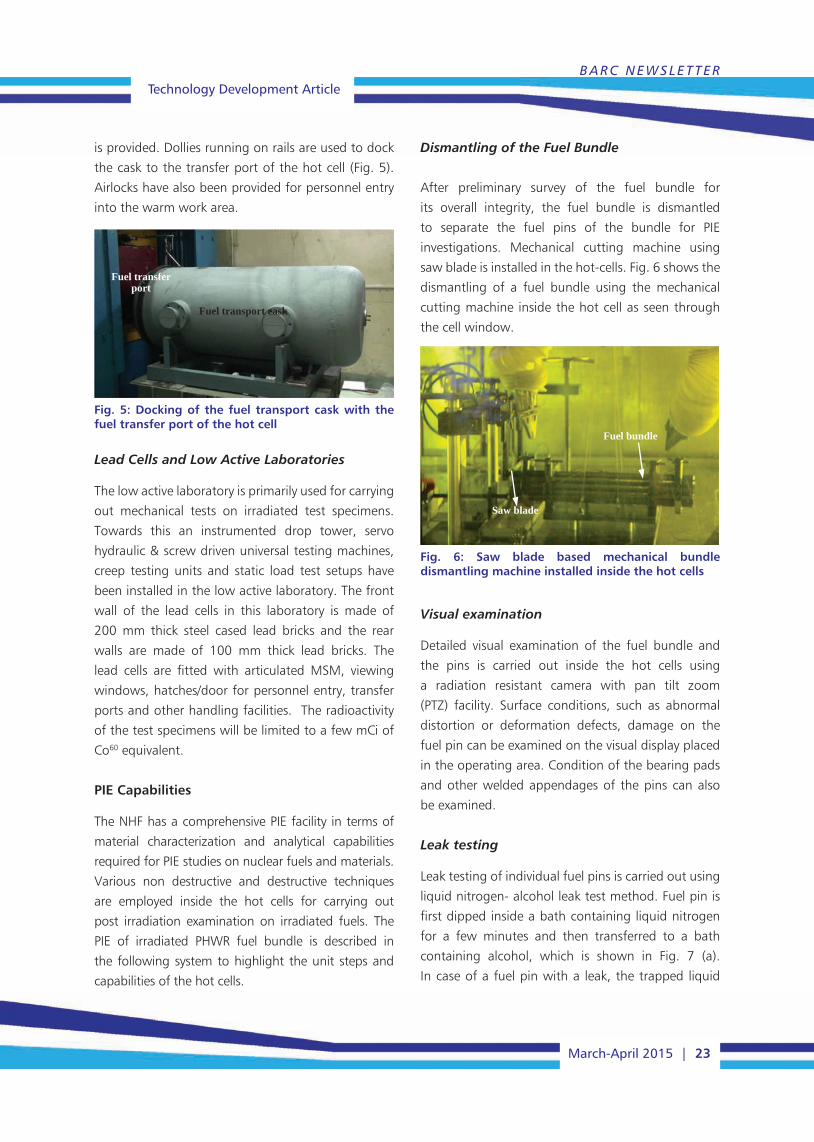
March-April 2015 | 23
is provided. Dollies running on rails are used to dock
the cask to the transfer port of the hot cell (Fig. 5).
Airlocks have also been provided for personnel entry
into the warm work area.
Dismantling of the Fuel Bundle
After preliminary survey of the fuel bundle for
its overall integrity, the fuel bundle is dismantled
to separate the fuel pins of the bundle for PIE
investigations. Mechanical cutting machine using
saw blade is installed in the hot-cells. Fig. 6 shows the
dismantling of a fuel bundle using the mechanical
cutting machine inside the hot cell as seen through
the cell window.
Fuel transport cask
Fuel transfer port
Fig. 5: Docking of the fuel transport cask with the fuel transfer port of the hot cell
Lead Cells and Low Active Laboratories
The low active laboratory is primarily used for carrying
out mechanical tests on irradiated test specimens.
Towards this an instrumented drop tower, servo
hydraulic & screw driven universal testing machines,
creep testing units and static load test setups have
been installed in the low active laboratory. The front
wall of the lead cells in this laboratory is made of
200 mm thick steel cased lead bricks and the rear
walls are made of 100 mm thick lead bricks. The
lead cells are fitted with articulated MSM, viewing
windows, hatches/door for personnel entry, transfer
ports and other handling facilities. The radioactivity
of the test specimens will be limited to a few mCi of
Co60 equivalent.
PIE Capabilities
The NHF has a comprehensive PIE facility in terms of
material characterization and analytical capabilities
required for PIE studies on nuclear fuels and materials.
Various non destructive and destructive techniques
are employed inside the hot cells for carrying out
post irradiation examination on irradiated fuels. The
PIE of irradiated PHWR fuel bundle is described in
the following system to highlight the unit steps and
capabilities of the hot cells.
Fig. 6: Saw blade based mechanical bundle dismantling machine installed inside the hot cells
Saw blade
Fuel bundle
Visual examination
Detailed visual examination of the fuel bundle and
the pins is carried out inside the hot cells using
a radiation resistant camera with pan tilt zoom
(PTZ) facility. Surface conditions, such as abnormal
distortion or deformation defects, damage on the
fuel pin can be examined on the visual display placed
in the operating area. Condition of the bearing pads
and other welded appendages of the pins can also
be examined.
Leak testing
Leak testing of individual fuel pins is carried out using
liquid nitrogen- alcohol leak test method. Fuel pin is
first dipped inside a bath containing liquid nitrogen
for a few minutes and then transferred to a bath
containing alcohol, which is shown in Fig. 7 (a).
In case of a fuel pin with a leak, the trapped liquid

Technology Development ArticleBARC NEWSLETTER
24 | March-April 2015
nitrogen will bubble out, indicating the location of
leak. Fig. 7 (b) shows bubbles emanating from a leak
in one of the fuel pins.
Alchohol tray
(a)
(b)
Fig. 7: (a) Liquid nitrogen- alcohol leak testing set-up inside the hot cell and (b) Bubbles emanating from the failure location in the fuel pin
Profilometry
A laser micrometer and a LVDT transducer based
profilometer are used to determine the variation of
the fuel pin diameter along its axis. Fig. 8 shows
diametral profile measurement of a fuel pin using
laser profilometer. The scanning stage used for
movement of the fuel pin during LVDT transducer
based profilometry is shown in Fig. 10.
Fig. 8: Laser profilometer inside the hot cell
Ultrasonic Testing
Ultrasonic testing of fuel pins immersed in water in
horizontal tank is carried out to detect the presence
of incipient flaws in its cladding. The end plug welds
are also inspected to detect deterioration of the
weld and the heat affected zone. Fig. 9 shows the
ultrasonic scanner fitted with probes for detection of
axial and circumferential defects in the cladding.
Fig. 9: Ultrasonic testing set up installed in the hot cells
Fuel pin
Gamma Spectroscopy and Scanning
Gamma spectroscopy and gamma scanning using
high resolution HPGe detector and multi channel
analyser (MCA) are carried out on the irradiated fuel
pins inside the hot cell. Co60 and Cs137 sources are
used for energy calibration. The fuel pin is fixed on the
scanning stage and gamma counting at various axial
locations is carried out, with the detector placed in
front of the collimator in the operating area. Relative
burnup distribution in the fuel pin is measured by
Fig. 10: Scanning stage for profilometry and gamma scanning inside the hot cells
Fuel pin
Fuel pin

BARC NEWSLETTERTechnology Development Article
March-April 2015 | 25
gamma scanning which uses Cs137 as the monitoring
isotope for gamma counting. Fig. 10 shows the fuel
pin loaded on the scanning stage inside the hot cells
for gamma scanning.
Fission Gas Release measurement
The released fission gas analysis set up is used for
estimation of the quantity and composition of
released fission gases inside the fuel pins. The setup
essentially consists of a puncture chamber fixed
inside the hot cell (Fig. 11), which is connected to
the gas collection and measuring part located in the
operating area, by means of stainless steel tubes. The
estimation of parameters such as void volume of the
fuel pin and the pressure and volume of the released
gases is carried out by connecting calibration flasks to
the system and by applying standard gas laws.
Chemical composition of the released gases is
determined using a dual column gas chromatograph,
with argon as the carrier gas. Thermal conductivity
detector is used for the detection of the individual
gases. A quadrupole mass spectrometer is used for
measuring the isotopic ratios of Xe and Kr isotopes.
Fuel pin
Preparation of Samples for Microstructural studies
The changes in fuel microstructure during irradiation
are studied by performing ceramography of the
fuel sections. Cutting of fuel pins to get samples for
metallography/ceramography may lead to falling off
of fuel pieces due to the cracks developed during
irradiation. Hence, the cut lengths of the fuel pins
are impregnated with liquid Araldite using vacuum
impregnation technique to keep the further fuel
sections intact. Fig. 12 (a) shows the slow speed cut off
machine placed inside the hot cell used for sectioning
of the impregnated fuel pin. The slices cut from the
impregnated piece of the fuel pin are mounted in
SS rings. The mounted samples are then sequentially
ground and polished on a grinder-polisher placed
inside the hot cell, as shown in Fig. 12 (b).
Fig. 11: Puncturing set up in the hot cell for measurement of the fission gas release
Fig. 12: (a) Slow speed cut off machine for cutting of metallographic samples (b) Grinder polisher inside the hot cell
(a)
(b)
Polishing head
Cutting wheel
Impregnated piece of fuel pin

Technology Development ArticleBARC NEWSLETTER
26 | March-April 2015
Waste Management in NHF
The solid and liquid radioactive wastes generated
from the PIE activities in the facility are collected
and sent to the Waste Management Division for
necessary treatment and disposal. The gaseous
waste is discharged after two stages of filtration
to the atmosphere through the 75m high stack of
Radiological Laboratories (RLG). The irradiated fuels
and cut portions of fuel after completion of PIE will
be packed in cans and sent for reprocessing.
Summary
The new hot cell facility with the necessary equipments
has been commissioned and activated for Post
Irradiation Examination of irradiated nuclear fuels
and structural components from research and power
reactors. The results of PIE will provide valuable data
on fuel performance such the dimensional changes,
fission gas release in the fuel pins, the burnup profile,
fuel centre temperature etc. Evaluation of irradiated
structural components and allied materials will provide
the essential data for efficient life management of
nuclear facilities.
Acknowledgement
The valuable contributions made by Shri S.
Anantharaman, Shri N.K. Mondal, Shri D.N. Sah and
Shri K.C. Sahoo during different stages of the design,
construction and commissioning of this facility is
gratefully acknowledged. We also thank Shri Arun
Kumar for the support and guidance given during
the crucial stages of commissioning of this facility.
We are thankful to all the staff members of PIED for
carrying out various activities during the project and
commissioning stage.
BARC NEWSLETTERFeature Article
March-April 2015 | 27
Introduction
Metal contamination cannot be destroyed but can
only be concentrated and contained in solid form
for final disposal. Bioremediation is an option that
offers the possibility to destroy or render the various
contaminants harmless using natural biological
activity. Microorganisms harbor the potential to
restore the metal contaminated environments
inexpensively and effectively by employing a number
of mechanisms including complexation, binding,
reduction, precipitation and accumulation.
Uranium is the heaviest, naturally occurring element
found in the earth’s crust. It is an alpha emitter
and a weakly radioactive element which shows
both radiotoxicity and chemotoxicity. However, the
chemical toxicity of dissolved uranium is of greatest
environmental significance and poses a major
concern for public health and safety. Ingestion of
high concentrations of soluble uranium compounds
manifest in chemotoxic effects on renal tissue
leading to kidney failure [1]. Uranium is released in
to the environment through its mining, disposal of
tailings, nuclear power or weapon production and
nuclear accidents. The mobility of uranium in the
environment is dependent on its speciation and its
redox state as well. It occurs as U(VI) under oxidizing
conditions in the form of a) UO22+ below pH 2.5, b)
or hydroxyl complexes below pH 6.5 or c) as uranyl
carbonate at pH> 7 [2]. In the reducing conditions,
it exists as insoluble and immobile U(VI) as mineral
uraninite. Uranium speciation in contaminated waters
is critical for the selection of the treatment process
and its successful application. The interactions
between microbes and uranium play a very important
role in controlling the latter’s mobility in natural
environment. These interactions can be stimulated
to immobilize aqueous uranium thereby remediating
the uranium contamination. In microbial systems, no
specific mechanism has been attributed to uranium
toxicity.
We came across some interesting mechanisms
displayed by the microbes to resist uranium toxicity
while investigating the microbial interactions with
uranium in our laboratory. These mechanisms,
harboured by microbes for detoxification of uranium,
form the basis of utilization of these organisms for
various bioremediation approaches and are discussed
below.
Microbial Bioremediation of Uranium: an OverviewCelin Acharya
Molecular Biology Division
Abstract
Uranium contamination is a worldwide problem. Preventing uranium contamination in the environment is quite
challenging and requires a thorough understanding of the microbiological, ecological and biogeochemical
features of the contaminated sites. Bioremediation of uranium is largely dependent on reducing its bioavailability
in the environment. In situ bioremediation of uranium by microbial processes has been shown to be effective
for immobilizing uranium in contaminated sites. Such microbial processes are important components of
biogeochemical cycles and regulate the mobility and fate of uranium in the environment. It is therefore vital to
advance our understanding of the uranium–microbe interactions to develop suitable bioremediation strategies
for uranium contaminated sites.This article focuses on the fundamental mechanisms adopted by various
microbes to mitigate uranium toxicity which could be utilised for developing various approaches for uranium
bioremediation.
Feature ArticleBARC NEWSLETTER
28 | March-April 2015
Adsorption of uranium complexes onto the surface of a unicellular, marine cyanobacterium, Synechococcus elongatus
Microbial cells are able to interact with uranium in
multiple ways due to diversity in their metabolism
and cell surface structures. The latter provide a highly
efficient matrix for metal complexation. The metal
binding with surfaces of microbial cells is even more
efficient than that with inorganic soil components
like minerals. The high metal complexation ability
of microbial cells is primarily based on two facts:
the high surface-to-volume ratio and the usually
large number of metal binding ligands, which are
presented by the organic cell surface polymers, e.g.
peptidoglycan, lipopolysaccharides, proteins and
glycolipids. These ligands include functional groups,
such as phosphate, carboxyl, hydroxyl, amino and
sulfhydryl groups. The adsorption of aqueous metal
cations onto these functional groups, the so called
biosorption process is rapid, reversible and does not
depend on the cell metabolism.
Most of bacterial surface uranyl adsorption studies
have focused on low pH conditions where UO22+ is
the predominant aqueous uranium species. Above pH
5, neutral and negatively charged uranyl carbonate
predominates the aqueous uranium speciation
in the marine environment. We investigated the
uranium-binding abilities in a marine unicellular
cyanobacterium, Synechococcus elongatus BDU
75042 from micromolar concentrations of uranyl
carbonate at pH 7.8. These cells when exposed to
23.8 mg L-1 U (or 100 µM) at pH 7.8 bound 68-72 %
U in less than 10 min resulting in a loading of 53.5
mg U g-1 dry weight [3]. Treatment of U-loaded cells
with 0.1 N HCl showed 80 % of U desorption. Most
of the bound uraniumwas found to be associated
with the extracellular polysaccharides (EPS) of the
cells. The amide groups and the deprotonated
carboxyl groups harboured within EPS were likely
to be involved in uranyl complexation as suggested
by Fourier-transform infrared (FT-IR) spectroscopy.
The X-ray diffraction (XRD) analyses revealed the
identity of the uranium deposits associated with
the cell biomass as uranyl carbonate hydrate. The
uranyl-binding efficiency of the heat killed or the
non-viable Synechococcus cells was similar to that of
live cells, corroborating the metabolism independent
bioadsorption of U in these cells [3].
Uranium concentration in surface associated polyphosphates in a filamentous, marine cyanobacterium, Anabaena torulosa
Uranium has no known biological function and is
transported into microbial cells only due to increased
membrane permeability (e.g. resulting from uranium
toxicity) [4]. There is a lack of direct evidence for the
presence of uranium transporters in microorganisms
[4]. Therefore, intracellular accumulation of
uranium is considered as metabolism-independent
process. Bacterial cells have demonstrated several
mechanisms to immobilize uranium once it is
accumulated intracellularly. One of the known
phenomena is uranium chelation by polyphosphate
bodies. Inorganic polyphosphates (poly P), are linear
polymers of inorganic phosphate (Pi) residues linked
by phosphoanhydride bonds. There is a strong
evidence for the incorporation of heavymetals
into the polyphosphate granules/bodies in several
microorganisms.
Our recent studies on the interactions of uranium with
a filamentous, heterocystous, nitrogen-fixing marine
cyanobacterium, Anabaena torulosa, revealed that
this strain could sequester uranium in acid soluble
polyphosphates, which could be extracted from the
cells upon acidification with 1 N HCl at 100oC [5].
Polyphosphate bodies are generally known to be
localized intracellularly in cyanobacterial cells. In the
present study, observations using light, fluorescence
and electron microscopy-based imaging, coupled
with Energy Dispersive X-ray (EDX) spectroscopy and
spectrophotometric analyses, have revealed (a) the
presence of novel surface associated polyphosphate
BARC NEWSLETTERFeature Article
March-April 2015 | 29
bodies (SAPBs) in the filamentous cyanobacterium
A. torulosa and (b) the interaction of such SAPBs
with uranium [5]. When challenged with 23.8
mg L-1 or 100µM UO2(CO3)22- for 24 h at pH 7.8,
under phosphate limited conditions, A. torulosa
cells bound 65% (15.47 mg L-1) of the inputU
(23.8 mg L-1) resulting in a loading of 77.35 mg U
g-1 dry wt. [6]. Backscattered electron SEM image
of the uranium loaded cells revealing high contrast
spots and the co-occurrence of U and P in the EDX
spectra exhibiting such discrete spots suggested the
concentration of uranium in such polyphosphate
bodies [5]. The co-localization of uranium with the
polyphosphate bodies and detachment or extraction
of such bodies resulting in large craters on the cell
surface accompanied by loss of U and Pi upon HCl
based desorption without causing cell lysis, further
substantiates their surface association and acid
solubility. Uranium immobilization by suchsurface
associated polyphosphate bodies (SAPBs), reported in
cyanobacteria for the first time, demonstrated a novel
uranium sequestration phenomenon [5].
Uranium bioprecipitation by chemo-heterotrophic bacteria isolated from uranium rich deposits
An alternative strategy for bioremediation under
oxygenated conditions is the immobilization of
uranium due to the precipitation of hardly soluble
inorganic uranium compounds. A well-known
mechanism for bioprecipitation of uranium is based
on the activity of non-specific phosphatases, in
particular, acid and alkaline phosphomonoesterases,
which are commonly generated by active soil
microorganisms. These enzymes were expressed
by a large variety of aerobic and anaerobic bacteria
and release inorganic orthophosphate from organic
phosphate compounds[7]. As a consequence of this,
the released orthophosphate interacts with uranium
and causes the precipitation of inorganic uranyl
phosphate phases, directly at the cell surface or in
the surrounding aqueous system. Beazley and co-
workers [7] demonstrated that the hydrolyzation of
organophosphate by aerobic heterotrophic bacteria
could play an important role in bioremediation of
uranium-contaminated sites.
Domiasiat located in the west Khasi hill district of
Meghalaya in Northeast India is one of the largest
sandstone-type uranium (U) ore deposits in India
containing 9.22 million tonnes of ore reserves withan
average ore grade of around 0.1 % U3O8[8]. This
geographically distinct U deposit of Domiasiat is un-
mined and harbours diverse group of bacteria surviving
the stressful environmental conditions prevalent in the
ore deposit. Various adaptive features exhibited by the
indigenous bacteria from such contaminated sites for
their survival under conditions of toxic concentrations
of radionuclide and heavy metals have been studied.
Representative bacteria (130 isolates- 76 Gram-
positive and 54 Gram-negative) were isolated from
sub surface soils of such uranium rich deposit and
analysed by 16S rRNA gene sequencing [9]. They were
affiliated to Firmicutes (51%), Gammaproteobacteria
(26%), Actinobacteria (11%), Bacteroidetes (10%)
and Betaproteobacteria (2%). Overall, 76% of the
characterized isolates revealed phosphatase positive
phenotype (phosphatase activity was checked on
phenolphthalein diphosphate (PDP) and methyl
green agar) and 53% had PIB-type ATPase genes
(that detoxify the cytoplasm by effluxing heavy metal
ions) [9]. The cultivable bacteria have been reported
to tolerate substantial concentrations of U (4 mM)
and other metals (Cu, Cd, Pb) and showed potent
capacity for binding of U[9,10]. Representative
strains removed more than 90% and 53% of U
from 100 µM and 2 mM uranyl nitrate solutions,
respectively, at pH 3.5 within 10 min of exposure[9].
Two of the representative strains (from the phylum
Proteobacteria), Serratia marcescens belonging to
Gamma proteobacteria and Burkholderia arbores
belonging to Betaproteobacteria, displayed
phosphatase activity. In vitro zymogram assay was
attempted for both the strains using cell free extracts
under acidic and alkaline conditions separately. Under
Feature ArticleBARC NEWSLETTER
30 | March-April 2015
acidic conditions, active bands at ~80kDa were
observed for both the strains whereas under alkaline
conditions, active bands at ~58kDa and ~29kDa
were seen for Serratia marcescens and Burkholderia
arbores respectively (unpublished results). Assays
performed with Serratia marcescens(OD600~2)
with 2mM uranyl nitrate at pH 3.5 in 2mM
acetate buffer and 2mM uranyl carbonate at pH
8 in 2mM bicarbonate buffer showed 94% and
80% precipitation of uranium respectively within
72h. Whereas Burkholderia arbores under similar
conditions precipitated 95% and 89% of U under
acidic and alkaline conditions respectively in 72h
(unpublished results). Enzymatic precipitation of
uranium demonstrated by these naturally occurring,
sub surface bacterial isolates from uranium rich
deposits reveal the detoxification phenomenon
adopted by these isolates to limit uranium toxicity in
U and metal contaminated soils.
Conclusion
Our studies have identified different mechanisms
employed by a variety of microorganisms for alleviating
uranium toxicity. A fundamental understanding of
these mechanisms will prove useful for utilization of
these organisms for developing various approaches
to uranium bioremediation.
References
1. Gavrilescu M, Vasile L, Cretescu I. “Characterization
and remediation of soils contaminated with
uranium”. J Hazard Mater 163 (2009):475-510.
2. Choppin G, Liljenzin JO, Rydberg J. Behavior of
radionuclides in the environment Radiochemistry
Nuclear Chemistry (Third edition),Butterworth-
Heinemann, London (2002), pp. 653–685.
3. Acharya C., Joseph D., Apte S.K. “Uranium
sequestration by a marine cyanobacterium,
Synechococcus elongatus strain BDU/75042”.
Bioresour Technol 100 (2009):2176-2181.
4. Suzuki Y, Banfield JF.“Geomicrobiology of
uranium”. Rev Mineral Geochem 38 (1999):
393–432.
5. Acharya C., Apte S.K. “Novel surface associated
polyphosphate bodies sequester uranium in the
filamentous, marine cyanobacterium, Anabaena
torulosa”. Metallomics 5 (2013):1595-1598.
6. Acharya C., Chandwadkar P., Apte S.K.
“Interaction of uranium with a filamentous,
heterocystous, nitrogen-fixing cyanobacterium,
Anabaena torulosa”. Bioresour Technol 116
(2012):290-294.
7. Beazley M.J., Martinez R.J., Sobecky P.A., Webb
SM, Taillefert M. “Uranium biomineralization as
a result of bacterial phosphatase activity: insights
from bacterial isolates from a contaminated
subsurface”. Environ Sci Technol 41 (2007):5701–
5707.
8. Sen D.B., Sachan A.S., Padhi A.K., Mathur S.K.
“Uranium exploration in the Cretaceous Mahadek
sediments of the Meghalaya Plateau”. Expl Res
Atom Minerals 14 (2002):29–58.
9. Kumar R., Nongkhlaw M., Acharya C., Joshi
S.R.“Uranium (U)-tolerant bacterial diversity from
U ore deposit of Domiasiat in North-East India
and its prospective utilisation in bioremediation”.
Microbes and Environ 28 (2013):33-41.
10. Kumar R., Nongkhlaw M., Acharya C., Joshi
S.R. “Bacterial Community Structure from the
Perspective of the Uranium Ore Deposits of
Domiasiat in India”. Proc Natl Acad Sci India Sect
B Biol Sci 83 (2013):485–497.
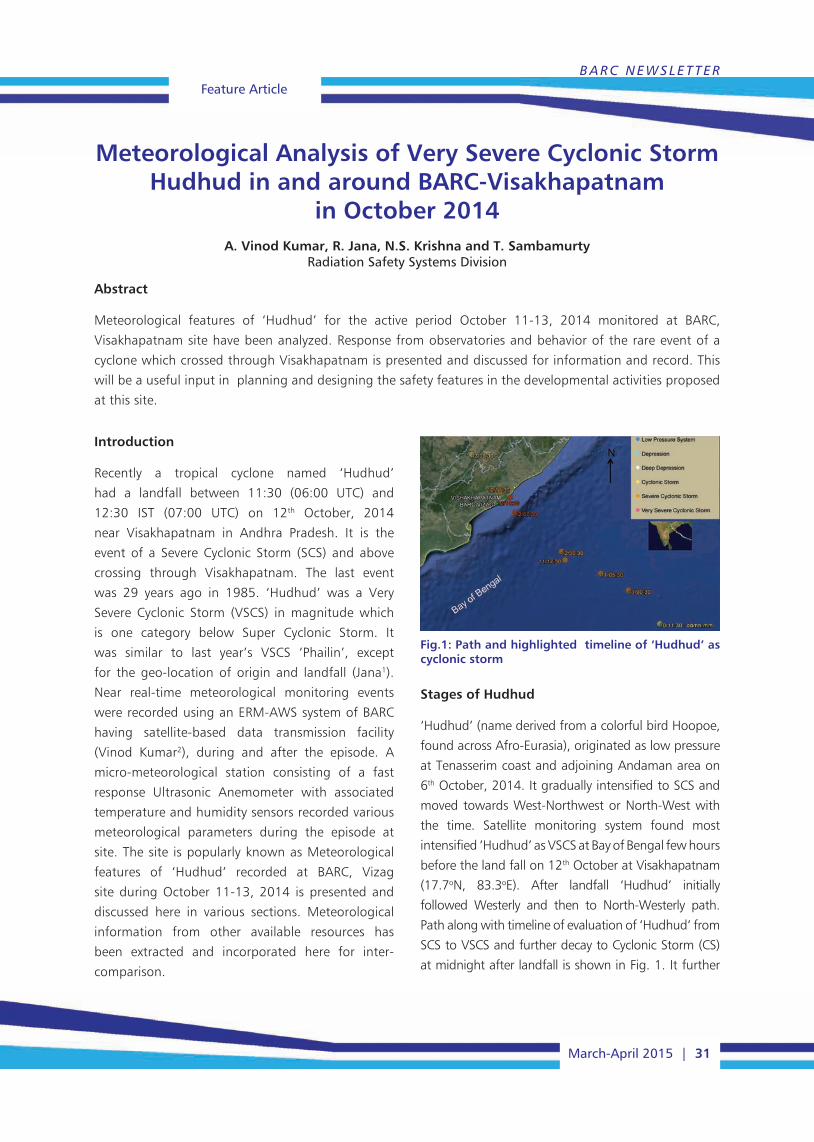
BARC NEWSLETTERFeature Article
March-April 2015 | 31
Introduction
Recently a tropical cyclone named ‘Hudhud’
had a landfall between 11:30 (06:00 UTC) and
12:30 IST (07:00 UTC) on 12th October, 2014
near Visakhapatnam in Andhra Pradesh. It is the
event of a Severe Cyclonic Storm (SCS) and above
crossing through Visakhapatnam. The last event
was 29 years ago in 1985. ‘Hudhud’ was a Very
Severe Cyclonic Storm (VSCS) in magnitude which
is one category below Super Cyclonic Storm. It
was similar to last year’s VSCS ‘Phailin’, except
for the geo-location of origin and landfall (Jana1).
Near real-time meteorological monitoring events
were recorded using an ERM-AWS system of BARC
having satellite-based data transmission facility
(Vinod Kumar2), during and after the episode. A
micro-meteorological station consisting of a fast
response Ultrasonic Anemometer with associated
temperature and humidity sensors recorded various
meteorological parameters during the episode at
site. The site is popularly known as Meteorological
features of ‘Hudhud’ recorded at BARC, Vizag
site during October 11-13, 2014 is presented and
discussed here in various sections. Meteorological
information from other available resources has
been extracted and incorporated here for inter-
comparison.
Stages of Hudhud
‘Hudhud’ (name derived from a colorful bird Hoopoe,
found across Afro-Eurasia), originated as low pressure
at Tenasserim coast and adjoining Andaman area on
6th October, 2014. It gradually intensified to SCS and
moved towards West-Northwest or North-West with
the time. Satellite monitoring system found most
intensified ‘Hudhud’ as VSCS at Bay of Bengal few hours
before the land fall on 12th October at Visakhapatnam
(17.7oN, 83.3oE). After landfall ‘Hudhud’ initially
followed Westerly and then to North-Westerly path.
Path along with timeline of evaluation of ‘Hudhud’ from
SCS to VSCS and further decay to Cyclonic Storm (CS)
at midnight after landfall is shown in Fig. 1. It further
Meteorological Analysis of Very Severe Cyclonic Storm Hudhud in and around BARC-Visakhapatnam
in October 2014A. Vinod Kumar, R. Jana, N.S. Krishna and T. Sambamurty
Radiation Safety Systems Division
Abstract
Meteorological features of ‘Hudhud’ for the active period October 11-13, 2014 monitored at BARC,
Visakhapatnam site have been analyzed. Response from observatories and behavior of the rare event of a
cyclone which crossed through Visakhapatnam is presented and discussed for information and record. This
will be a useful input in planning and designing the safety features in the developmental activities proposed
at this site.
Fig.1: Path and highlighted timeline of ‘Hudhud’ as cyclonic storm
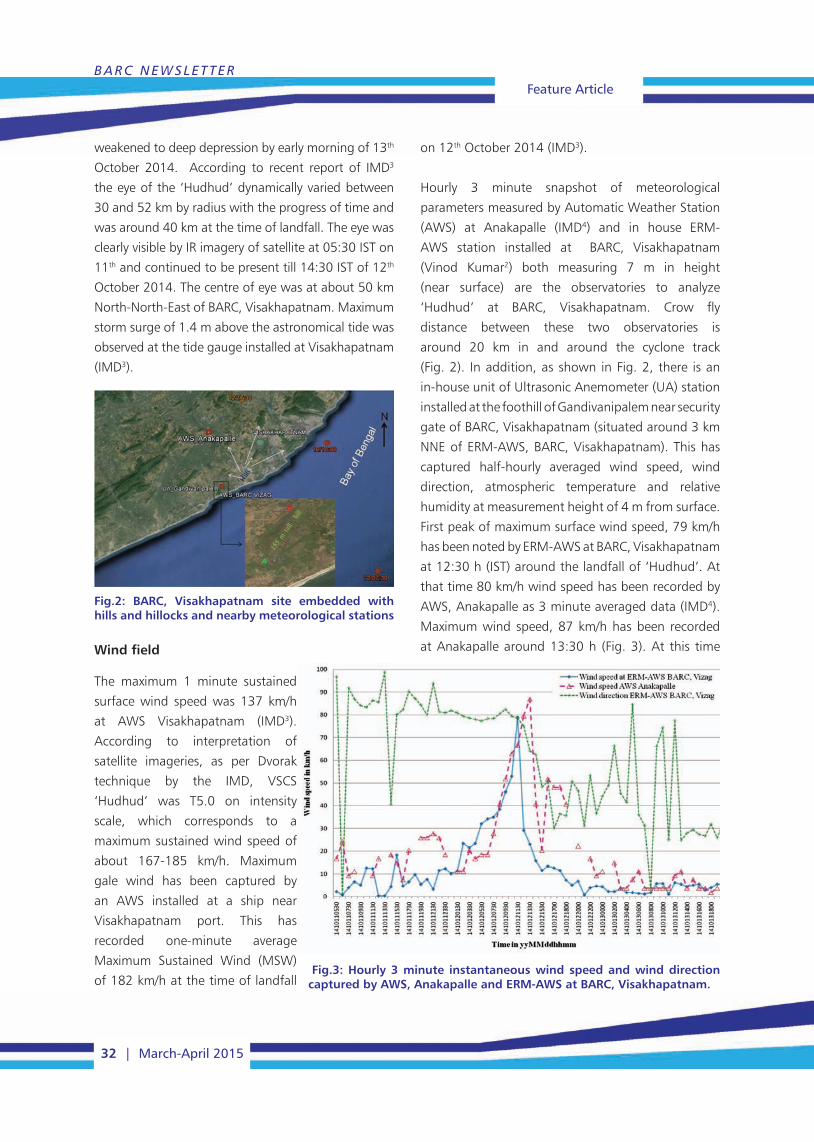
Feature ArticleBARC NEWSLETTER
32 | March-April 2015
weakened to deep depression by early morning of 13th
October 2014. According to recent report of IMD3
the eye of the ‘Hudhud’ dynamically varied between
30 and 52 km by radius with the progress of time and
was around 40 km at the time of landfall. The eye was
clearly visible by IR imagery of satellite at 05:30 IST on
11th and continued to be present till 14:30 IST of 12th
October 2014. The centre of eye was at about 50 km
North-North-East of BARC, Visakhapatnam. Maximum
storm surge of 1.4 m above the astronomical tide was
observed at the tide gauge installed at Visakhapatnam
(IMD3).
on 12th October 2014 (IMD3).
Hourly 3 minute snapshot of meteorological
parameters measured by Automatic Weather Station
(AWS) at Anakapalle (IMD4) and in house ERM-
AWS station installed at BARC, Visakhapatnam
(Vinod Kumar2) both measuring 7 m in height
(near surface) are the observatories to analyze
‘Hudhud’ at BARC, Visakhapatnam. Crow fly
distance between these two observatories is
around 20 km in and around the cyclone track
(Fig. 2). In addition, as shown in Fig. 2, there is an
in-house unit of Ultrasonic Anemometer (UA) station
installed at the foothill of Gandivanipalem near security
gate of BARC, Visakhapatnam (situated around 3 km
NNE of ERM-AWS, BARC, Visakhapatnam). This has
captured half-hourly averaged wind speed, wind
direction, atmospheric temperature and relative
humidity at measurement height of 4 m from surface.
First peak of maximum surface wind speed, 79 km/h
has been noted by ERM-AWS at BARC, Visakhapatnam
at 12:30 h (IST) around the landfall of ‘Hudhud’. At
that time 80 km/h wind speed has been recorded by
AWS, Anakapalle as 3 minute averaged data (IMD4).
Maximum wind speed, 87 km/h has been recorded
at Anakapalle around 13:30 h (Fig. 3). At this time
Fig.2: BARC, Visakhapatnam site embedded with hills and hillocks and nearby meteorological stations
Fig.3: Hourly 3 minute instantaneous wind speed and wind direction captured by AWS, Anakapalle and ERM-AWS at BARC, Visakhapatnam.
Wind field
The maximum 1 minute sustained
surface wind speed was 137 km/h
at AWS Visakhapatnam (IMD3).
According to interpretation of
satellite imageries, as per Dvorak
technique by the IMD, VSCS
‘Hudhud’ was T5.0 on intensity
scale, which corresponds to a
maximum sustained wind speed of
about 167-185 km/h. Maximum
gale wind has been captured by
an AWS installed at a ship near
Visakhapatnam port. This has
recorded one-minute average
Maximum Sustained Wind (MSW)
of 182 km/h at the time of landfall
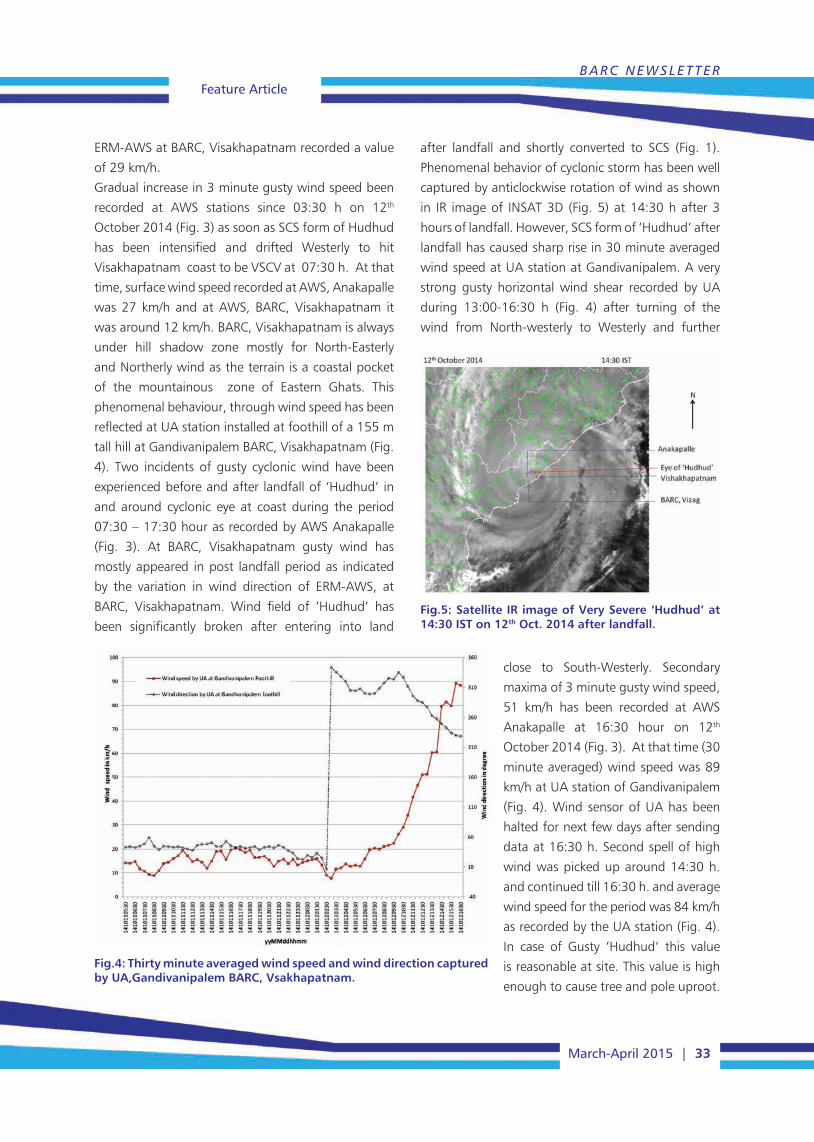
BARC NEWSLETTERFeature Article
March-April 2015 | 33
ERM-AWS at BARC, Visakhapatnam recorded a value
of 29 km/h.
Gradual increase in 3 minute gusty wind speed been
recorded at AWS stations since 03:30 h on 12th
October 2014 (Fig. 3) as soon as SCS form of Hudhud
has been intensified and drifted Westerly to hit
Visakhapatnam coast to be VSCV at 07:30 h. At that
time, surface wind speed recorded at AWS, Anakapalle
was 27 km/h and at AWS, BARC, Visakhapatnam it
was around 12 km/h. BARC, Visakhapatnam is always
under hill shadow zone mostly for North-Easterly
and Northerly wind as the terrain is a coastal pocket
of the mountainous zone of Eastern Ghats. This
phenomenal behaviour, through wind speed has been
reflected at UA station installed at foothill of a 155 m
tall hill at Gandivanipalem BARC, Visakhapatnam (Fig.
4). Two incidents of gusty cyclonic wind have been
experienced before and after landfall of ‘Hudhud’ in
and around cyclonic eye at coast during the period
07:30 – 17:30 hour as recorded by AWS Anakapalle
(Fig. 3). At BARC, Visakhapatnam gusty wind has
mostly appeared in post landfall period as indicated
by the variation in wind direction of ERM-AWS, at
BARC, Visakhapatnam. Wind field of ‘Hudhud’ has
been significantly broken after entering into land
after landfall and shortly converted to SCS (Fig. 1).
Phenomenal behavior of cyclonic storm has been well
captured by anticlockwise rotation of wind as shown
in IR image of INSAT 3D (Fig. 5) at 14:30 h after 3
hours of landfall. However, SCS form of ‘Hudhud’ after
landfall has caused sharp rise in 30 minute averaged
wind speed at UA station at Gandivanipalem. A very
strong gusty horizontal wind shear recorded by UA
during 13:00-16:30 h (Fig. 4) after turning of the
wind from North-westerly to Westerly and further
Fig.4: Thirty minute averaged wind speed and wind direction captured by UA,Gandivanipalem BARC, Vsakhapatnam.
Fig.5: Satellite IR image of Very Severe ‘Hudhud’ at 14:30 IST on 12th Oct. 2014 after landfall.
close to South-Westerly. Secondary
maxima of 3 minute gusty wind speed,
51 km/h has been recorded at AWS
Anakapalle at 16:30 hour on 12th
October 2014 (Fig. 3). At that time (30
minute averaged) wind speed was 89
km/h at UA station of Gandivanipalem
(Fig. 4). Wind sensor of UA has been
halted for next few days after sending
data at 16:30 h. Second spell of high
wind was picked up around 14:30 h.
and continued till 16:30 h. and average
wind speed for the period was 84 km/h
as recorded by the UA station (Fig. 4).
In case of Gusty ‘Hudhud’ this value
is reasonable at site. This value is high
enough to cause tree and pole uproot.

Feature ArticleBARC NEWSLETTER
34 | March-April 2015
Atmospheric Pressure
Lowest atmospheric pressure has been recorded
at 12:30 h by ERM-AWS, at BARC, Visakhapatnam
just after land fall of ‘Hudhud’ with recorded lowest
atmospheric pressure, 957 hPa (Fig. 6). Pressure
fall was around 44 hPa below normal. Lowest
atmospheric pressure has been recorded at 14:30
h by AWS, Anakapalle after 3 hours of land fall of
‘Hudhud’ with recorded lowest atmospheric pressure,
954 hPa (IMD4). West-North-Westerly movement of
‘Hudhud’ was closest to Anakapalle around 14:30
h of the day (Fig. 5 and 6). As registered by IMD3,
minimum atmospheric pressure of ‘Hudhud’ was
950.3 hPa at the coast of Visakhapatnam at the time
of landfall.
damage by wind shear at eye-wall of Hudhud due to
near Westerly movement of the eye of VSCS form of
Hudhud.
Ambient Temperature
Range of ambient temperature during this period was
23.1-30.2 oC. The highest temperature was recorded
at 12:00 h on 11th October. The lowest temperature
was recorded at 13:30 h by ERM-AWS, at BARC,
Visakhapatnam just after land fall of Hudhud on 12th
October. Temperature (30 minute average) was below
24oC at UA station, Gandivanipalem during 14:00-
16:00 h on same day (Fig. 7). Lowest temperature,
23.4oC was recorded by AWS, Anakapalle at 11:30
h around the landfall (IMD4). The site was under
cold core zone of southern part of
‘Hudhud’.
Relative Humidity and Rainfall
Measured relative humidity was
above 90% during 08:30 - 21:00
h on 12th Oct.2014. 32.4 cm
rainfall was recorded at BARC,
Visakhapatnam site during the
period 11th October 2014: 21:30 h
to 12th October 2014 : 20:30 h. It is
about 23% of annual total rainfall
of Visakhapatnam district. 7.6 cm
rainfall has been received at BARC,
Visakhapatnam before the landfall
of ‘Hudhud’. 22.5 cm rainfall has
been received during 12:30 -16:30
h on 12th October 2014 as recorded by raingauge
at BARC, Visakhapatnam (Fig. 7). During this period
relative humidity (recorded at Gandivanipalem)
was above 95%. Reported rainfall at Anakapalle
raingauge was 18 cm during 12th , 8:30 IST to 13th,
8:30 IST October 2014. In the recent report of IMD3
it is stated that rain-bearing cloud band encircled the
complete southern part by 10:00 IST of 12th October
2014. Satellite imagery has shown the same (Fig. 5).
Fig.6: Hourly atmospheric pressure observed by AWS, Anakapalle and ERM-AWS, BARC, Visakhapatnam.
Net Radiation due to Solar Insolation
Daytime net radiation range on 12th October was
between (-)170 W/m2 and (+)3 W/m2 indicating
overcast condition throughout the day. With this
observation, it is concluded that BARC, Visakhapatnam
did not witness bright sunshine which is a phenomena
of geo-location of eye of the cyclone, i.e., eye of
Hudhud did not reach BARC, Visakhapatnam. This
was witnessed in Visakhapatnam causing maximum
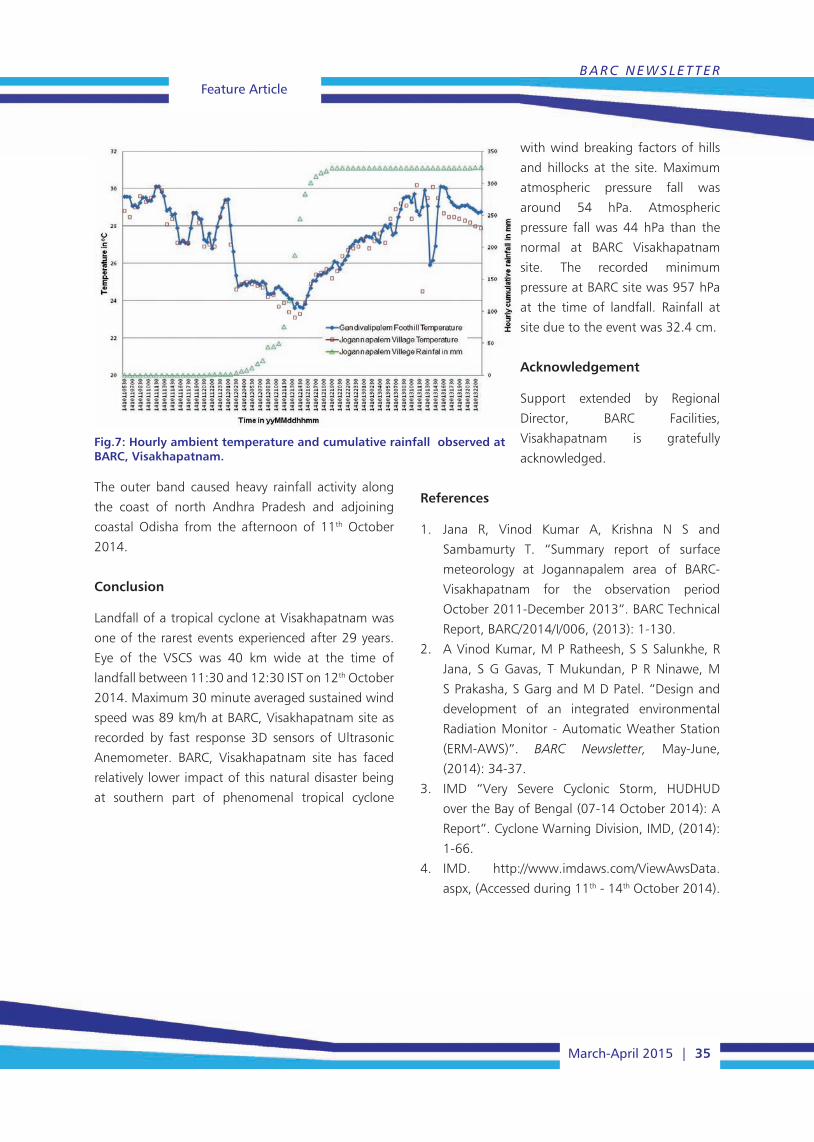
BARC NEWSLETTERFeature Article
March-April 2015 | 35
Fig.7: Hourly ambient temperature and cumulative rainfall observed at BARC, Visakhapatnam.
The outer band caused heavy rainfall activity along
the coast of north Andhra Pradesh and adjoining
coastal Odisha from the afternoon of 11th October
2014.
Conclusion
Landfall of a tropical cyclone at Visakhapatnam was
one of the rarest events experienced after 29 years.
Eye of the VSCS was 40 km wide at the time of
landfall between 11:30 and 12:30 IST on 12th October
2014. Maximum 30 minute averaged sustained wind
speed was 89 km/h at BARC, Visakhapatnam site as
recorded by fast response 3D sensors of Ultrasonic
Anemometer. BARC, Visakhapatnam site has faced
relatively lower impact of this natural disaster being
at southern part of phenomenal tropical cyclone
with wind breaking factors of hills
and hillocks at the site. Maximum
atmospheric pressure fall was
around 54 hPa. Atmospheric
pressure fall was 44 hPa than the
normal at BARC Visakhapatnam
site. The recorded minimum
pressure at BARC site was 957 hPa
at the time of landfall. Rainfall at
site due to the event was 32.4 cm.
Acknowledgement
Support extended by Regional
Director, BARC Facilities,
Visakhapatnam is gratefully
acknowledged.
References
1. Jana R, Vinod Kumar A, Krishna N S and
Sambamurty T. “Summary report of surface
meteorology at Jogannapalem area of BARC-
Visakhapatnam for the observation period
October 2011-December 2013”. BARC Technical
Report, BARC/2014/I/006, (2013): 1-130.
2. A Vinod Kumar, M P Ratheesh, S S Salunkhe, R
Jana, S G Gavas, T Mukundan, P R Ninawe, M
S Prakasha, S Garg and M D Patel. “Design and
development of an integrated environmental
Radiation Monitor - Automatic Weather Station
(ERM-AWS)”. BARC Newsletter, May-June,
(2014): 34-37.
3. IMD “Very Severe Cyclonic Storm, HUDHUD
over the Bay of Bengal (07-14 October 2014): A
Report”. Cyclone Warning Division, IMD, (2014):
1-66.
4. IMD. http://www.imdaws.com/ViewAwsData.
aspx, (Accessed during 11th - 14th October 2014).
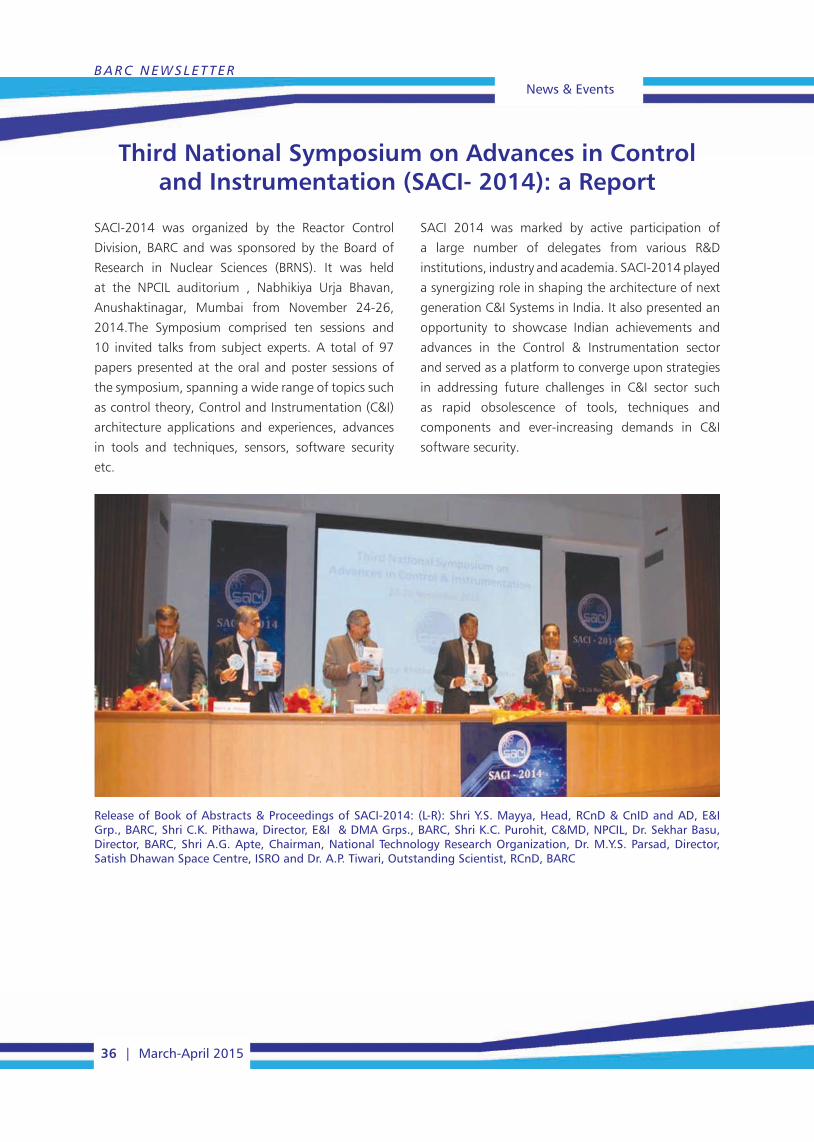
News & EventsBARC NEWSLETTER
36 | March-April 2015
SACI-2014 was organized by the Reactor Control
Division, BARC and was sponsored by the Board of
Research in Nuclear Sciences (BRNS). It was held
at the NPCIL auditorium , Nabhikiya Urja Bhavan,
Anushaktinagar, Mumbai from November 24-26,
2014.The Symposium comprised ten sessions and
10 invited talks from subject experts. A total of 97
papers presented at the oral and poster sessions of
the symposium, spanning a wide range of topics such
as control theory, Control and Instrumentation (C&I)
architecture applications and experiences, advances
in tools and techniques, sensors, software security
etc.
SACI 2014 was marked by active participation of
a large number of delegates from various R&D
institutions, industry and academia. SACI-2014 played
a synergizing role in shaping the architecture of next
generation C&I Systems in India. It also presented an
opportunity to showcase Indian achievements and
advances in the Control & Instrumentation sector
and served as a platform to converge upon strategies
in addressing future challenges in C&I sector such
as rapid obsolescence of tools, techniques and
components and ever-increasing demands in C&I
software security.
Third National Symposium on Advances in Control and Instrumentation (SACI- 2014): a Report
Release of Book of Abstracts & Proceedings of SACI-2014: (L-R): Shri Y.S. Mayya, Head, RCnD & CnID and AD, E&I Grp., BARC, Shri C.K. Pithawa, Director, E&I & DMA Grps., BARC, Shri K.C. Purohit, C&MD, NPCIL, Dr. Sekhar Basu, Director, BARC, Shri A.G. Apte, Chairman, National Technology Research Organization, Dr. M.Y.S. Parsad, Director, Satish Dhawan Space Centre, ISRO and Dr. A.P. Tiwari, Outstanding Scientist, RCnD, BARC
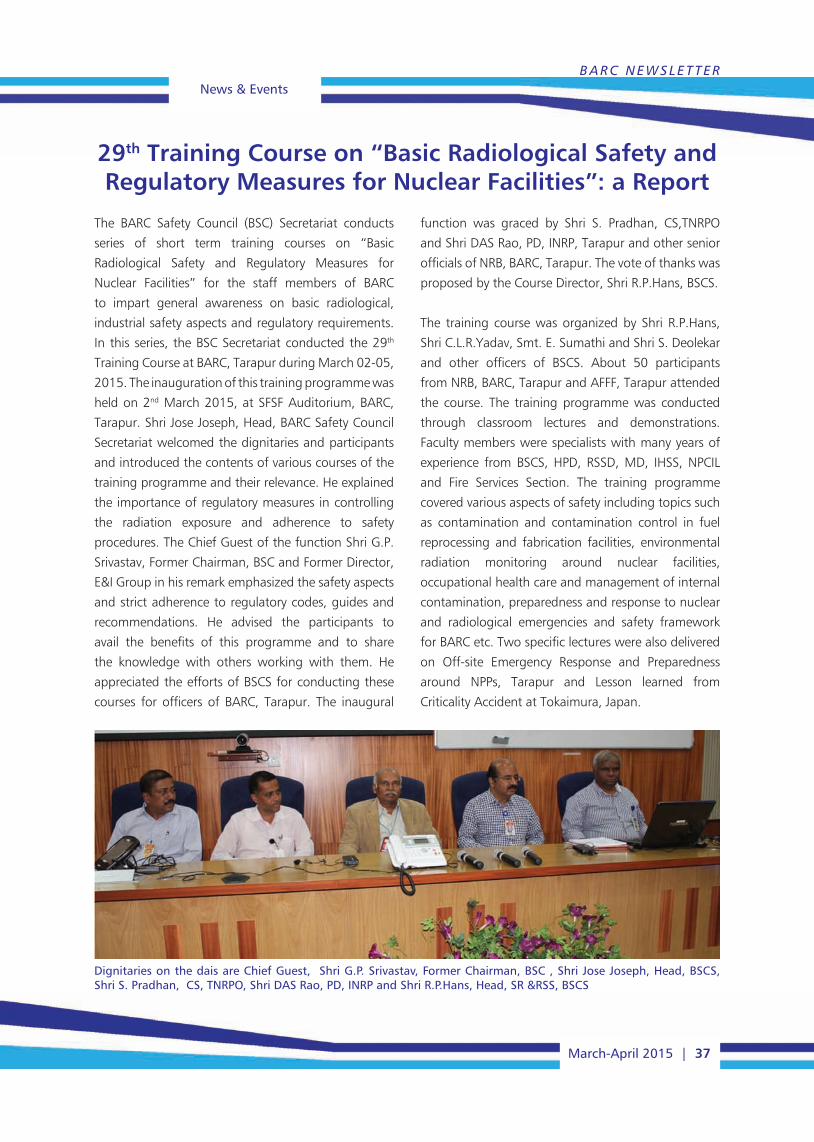
BARC NEWSLETTERNews & Events
March-April 2015 | 37
The BARC Safety Council (BSC) Secretariat conducts
series of short term training courses on “Basic
Radiological Safety and Regulatory Measures for
Nuclear Facilities” for the staff members of BARC
to impart general awareness on basic radiological,
industrial safety aspects and regulatory requirements.
In this series, the BSC Secretariat conducted the 29th
Training Course at BARC, Tarapur during March 02-05,
2015. The inauguration of this training programme was
held on 2nd March 2015, at SFSF Auditorium, BARC,
Tarapur. Shri Jose Joseph, Head, BARC Safety Council
Secretariat welcomed the dignitaries and participants
and introduced the contents of various courses of the
training programme and their relevance. He explained
the importance of regulatory measures in controlling
the radiation exposure and adherence to safety
procedures. The Chief Guest of the function Shri G.P.
Srivastav, Former Chairman, BSC and Former Director,
E&I Group in his remark emphasized the safety aspects
and strict adherence to regulatory codes, guides and
recommendations. He advised the participants to
avail the benefits of this programme and to share
the knowledge with others working with them. He
appreciated the efforts of BSCS for conducting these
courses for officers of BARC, Tarapur. The inaugural
29th Training Course on “Basic Radiological Safety and Regulatory Measures for Nuclear Facilities”: a Report
Dignitaries on the dais are Chief Guest, Shri G.P. Srivastav, Former Chairman, BSC , Shri Jose Joseph, Head, BSCS, Shri S. Pradhan, CS, TNRPO, Shri DAS Rao, PD, INRP and Shri R.P.Hans, Head, SR &RSS, BSCS
function was graced by Shri S. Pradhan, CS,TNRPO
and Shri DAS Rao, PD, INRP, Tarapur and other senior
officials of NRB, BARC, Tarapur. The vote of thanks was
proposed by the Course Director, Shri R.P.Hans, BSCS.
The training course was organized by Shri R.P.Hans,
Shri C.L.R.Yadav, Smt. E. Sumathi and Shri S. Deolekar
and other officers of BSCS. About 50 participants
from NRB, BARC, Tarapur and AFFF, Tarapur attended
the course. The training programme was conducted
through classroom lectures and demonstrations.
Faculty members were specialists with many years of
experience from BSCS, HPD, RSSD, MD, IHSS, NPCIL
and Fire Services Section. The training programme
covered various aspects of safety including topics such
as contamination and contamination control in fuel
reprocessing and fabrication facilities, environmental
radiation monitoring around nuclear facilities,
occupational health care and management of internal
contamination, preparedness and response to nuclear
and radiological emergencies and safety framework
for BARC etc. Two specific lectures were also delivered
on Off-site Emergency Response and Preparedness
around NPPs, Tarapur and Lesson learned from
Criticality Accident at Tokaimura, Japan.
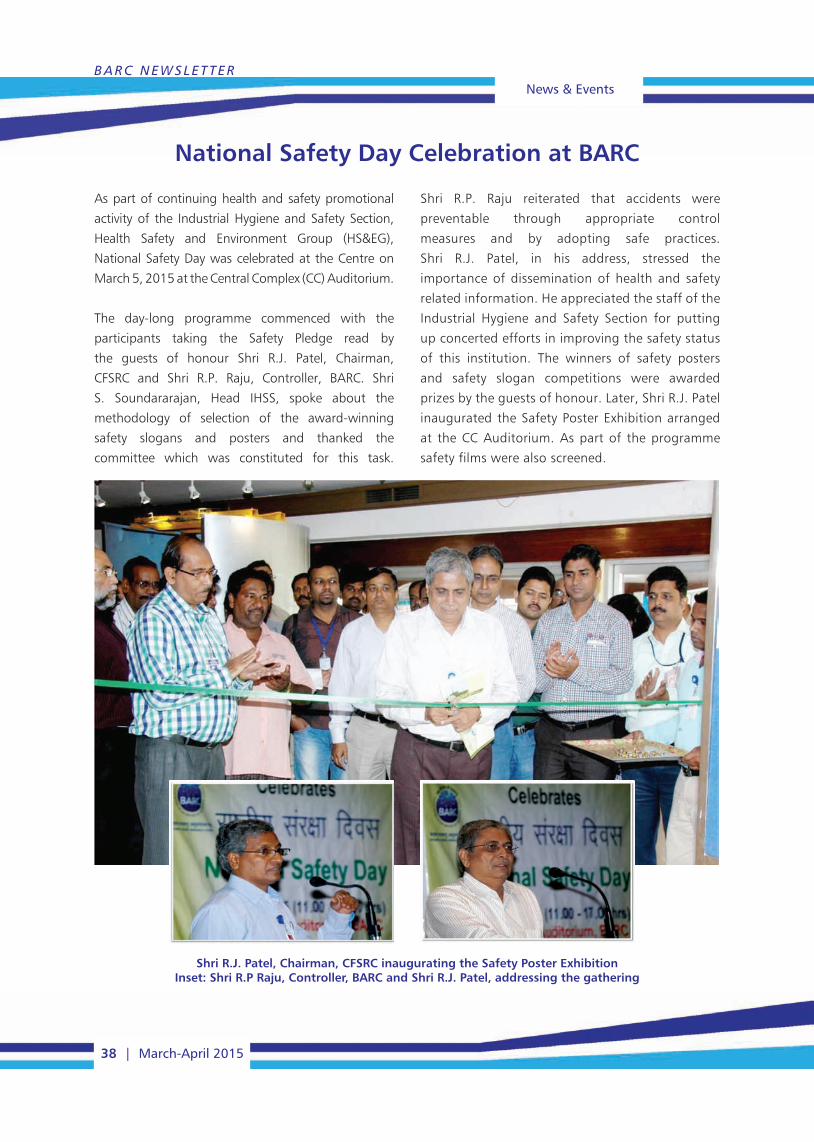
News & EventsBARC NEWSLETTER
38 | March-April 2015
As part of continuing health and safety promotional
activity of the Industrial Hygiene and Safety Section,
Health Safety and Environment Group (HS&EG),
National Safety Day was celebrated at the Centre on
March 5, 2015 at the Central Complex (CC) Auditorium.
The day-long programme commenced with the
participants taking the Safety Pledge read by
the guests of honour Shri R.J. Patel, Chairman,
CFSRC and Shri R.P. Raju, Controller, BARC. Shri
S. Soundararajan, Head IHSS, spoke about the
methodology of selection of the award-winning
safety slogans and posters and thanked the
committee which was constituted for this task.
National Safety Day Celebration at BARC
Shri R.J. Patel, Chairman, CFSRC inaugurating the Safety Poster ExhibitionInset: Shri R.P Raju, Controller, BARC and Shri R.J. Patel, addressing the gathering
Shri R.P. Raju reiterated that accidents were
preventable through appropriate control
measures and by adopting safe practices.
Shri R.J. Patel, in his address, stressed the
importance of dissemination of health and safety
related information. He appreciated the staff of the
Industrial Hygiene and Safety Section for putting
up concerted efforts in improving the safety status
of this institution. The winners of safety posters
and safety slogan competitions were awarded
prizes by the guests of honour. Later, Shri R.J. Patel
inaugurated the Safety Poster Exhibition arranged
at the CC Auditorium. As part of the programme
safety films were also screened.

BARC NEWSLETTERBARC Scientists Honoured
March-April 2015 | 39
Name of the Scientists : Pramod Bhatt and S. M. Yusuf
Affiliation : Solid State Physics Division, BARC
Name of the Award : Best Poster Award
Title of the Paper : Neutron Diffraction Study of the Chain Molecular Magnet [{CoII(Δ)CoII( )}
(ox)2(phen)2]n
Presented at : 5th Conference on Neutron Scattering (CNS-2015), held at Homi Bhabha Centre
for Science Education, Mumbai, during 2-4 February, 2015.
Name of the Scientist : Jhimli Paul Guin
Affiliation : Radiation Technology Development Division, BARC
Name of the Award : Best Poster Award (2nd Prize)
Title of the Paper : Radiation Crosslinked Graphene/Polymer Nanocomposites for Controlled
Orotransmucosal Delivery of Doxycycline
Presented at : DAE-BRNS 5th Interdisciplinary Symposium on Materials Chemistry (ISMC-2014),
Mumbai, December 9 -13, 2014.
BARC Scientists Honoured
V

Edited & Published by:Scientific Information Resource Division
Bhabha Atomic Research Centre, Trombay, Mumbai 400 085, IndiaBARC Newsletter is also available at URL:http://www.barc.gov.in
Modular Lab at BARC