bi-weekly influenza surveillance...
TRANSCRIPT
Erratum. The following correction was made on 14 September 2011: Page 7, first paragraph: ‘In weeks 32–33/2010, 16 countries reported virological data’ was changed to read: ‘In weeks 32–33/2011, 16 countries reported virological data.’
Main surveillance developments in weeks 32–33/2011 (08–21 August 2011)
This first page contains the main developments during these weeks and can be printed separately or together with the more detailed information following.
Sentinel surveillance of influenza-like illness (ILI)/ acute respiratory infection (ARI): During weeks 32–33/2011, all 17 reporting countries experienced low intensity of influenza activity. For more information, click here.
Virological surveillance: Of 41 sentinel specimens, none yielded influenza detections while six type A and seven type B influenzas were detected in non-sentinel specimens. For more information, click here
Hospital surveillance of severe acute respiratory infection (SARI): Two cases of SARI were reported during weeks 32–33/2011. For more information,
.
click here.
• During weeks 32–33/2011, all 17 reporting countries experienced low intensity of influenza activity.
• Sentinel specimens yielded no influenza virus detections while six type A and seven type B influenza viruses were detected in non-sentinel specimens. Four of the type A viruses were subtyped, three as A(H1)2009 and one as A(H3).
• During weeks 32–33/2011, two cases of SARI were reported.
SURVEILLANCE REPORT
Bi-weekly influenza surveillance overview 26 August 2011 (erratum 14 September 2011)

ECDC SURVEILLANCE REPORT Influenza overview weeks 32-33 /2011
2
Sentinel surveillance (ILI/ARI) Weekly analysis – epidemiology During weeks 32–33/2011, all 17 reporting countries experienced low intensity of influenza activity (Table 1, Map 1).
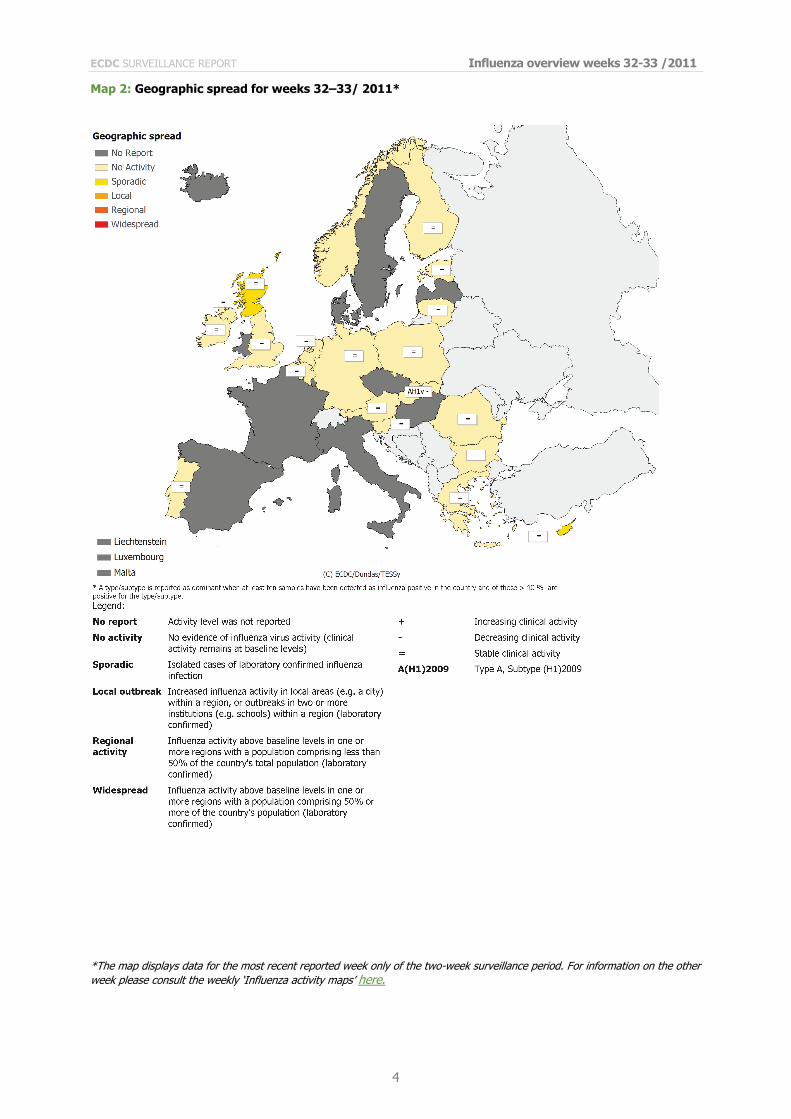
In terms of geographic spread, sporadic activity was reported by Cyprus and the UK (Scotland). No activity was reported by the remaining 16 countries and the UK (England and Northern Ireland).
Stable or decreasing trends were reported by all 17 countries (Table 1, Map 2).

ECDC SURVEILLANCE REPORT Influenza overview weeks 32-33 /2011
3
Map 1: Intensity for weeks 32–33/ 2011*
*The map displays data for the most recent reported week only of the two-week surveillance period. For information on the other week please consult the weekly ‘Influenza activity maps’ here.
ECDC SURVEILLANCE REPORT Influenza overview weeks 32-33 /2011
4
Map 2: Geographic spread for weeks 32–33/ 2011*
*The map displays data for the most recent reported week only of the two-week surveillance period. For information on the other week please consult the weekly ‘Influenza activity maps’
here.

ECDC SURVEILLANCE REPORT Influenza overview weeks 32-33 /2011
5
Table 1: Epidemiological and virological overview by country, weeks 32–33/ 2011*
Country Intensity Geographic
spread Trend No. of
sentinel swabs
Dominant type
Percentage positive*
ILI per 100 000
ARI per 100 000
Epidemiological overview
Virological overview
Austria Low No activity Stable 0 None 0.0 - - Graphs Graphs
Belgium Low No activity Stable - - 0.0 21.9 662.4 Graphs Graphs
Bulgaria Low No activity Decreasing 0 None 0.0 - 228.2 Graphs Graphs
Cyprus Low Sporadic Stable - - 0.0 -* -* Graphs Graphs
Czech Republic
- - 0.0 - -
Denmark
1 None 0.0 - - Graphs Graphs
Estonia Low No activity Stable 1 None 0.0 1.3 64.7 Graphs Graphs
Finland Low No activity Stable 20 None 0.0 - - Graphs Graphs
France
- - 0.0 - -
Germany Low No activity Stable 1 None 0.0 - 362.3 Graphs Graphs
Greece Low No activity Stable - - 0.0 14.9 - Graphs Graphs
Hungary
- - 0.0 - -
Iceland
0 - 0.0 - - Graphs Graphs
Ireland Low No activity Stable 0 None 0.0 0.6 - Graphs Graphs
Italy
- - 0.0 - -
Latvia
- - 0.0 - -
Lithuania Low No activity Stable 0 None 0.0 0.0 79.8 Graphs Graphs
Luxembourg
- - 0.0 - -
Malta
- - 0.0 - -
Netherlands Low No activity Stable 2 None 0.0 10.1 - Graphs Graphs
Norway - No activity - 0 None 0.0 - - Graphs Graphs
Poland Low No activity Stable 0 None 0.0 4.3 - Graphs Graphs
Portugal Low No activity Stable - - 0.0 0.0 - Graphs Graphs
Romania Low No activity Stable 0 None 0.0 0.0 435.1 Graphs Graphs
Slovakia Low No activity Decreasing 0 A(H1)2009 0.0 32.4 471.0 Graphs Graphs
Slovenia Low No activity Stable 1 None 0.0 0.0 302.8 Graphs Graphs
Spain
0 None 0.0 - - Graphs Graphs
Sweden
0 None 0.0 - - Graphs Graphs
UK - England Low No activity Stable 14 None 0.0 2.5 204.4 Graphs Graphs
UK - Northern Ireland Low No activity Stable 1 - 0.0 5.3 196.3 Graphs Graphs
UK - Scotland Low Sporadic Stable 0 None 0.0 3.7 96.4 Graphs Graphs
UK - Wales
- - 0.0 - -
Europe
41
0.0
Graphs
*Incidence per 100 000 is not calculated for these countries as no population denominator is provided. Liechtenstein is not reporting to the European Influenza Surveillance Network. For intensity, geographic spread and trend, the table only displays data for the most recently reported week of the two-week surveillance period.

ECDC SURVEILLANCE REPORT Influenza overview weeks 32-33 /2011
6
Description of the system Surveillance is based on nationally organised sentinel networks of physicians, mostly general practitioners (GPs), covering at least 1 to 5% of the population in their countries. All EU/EEA Member States (except Liechtenstein) participate. Depending on their country’s choice, each sentinel physician reports the weekly number of patients seen with influenza-like illness (ILI), acute respiratory infection (ARI), or both to a national focal point. From the national level, both numerator and denominator data are then reported to the European Surveillance System (TESSy) database. Additional semi-quantitative indicators of intensity, geographic spread, and trend of influenza activity at the national level are also reported.

ECDC SURVEILLANCE REPORT Influenza overview weeks 32-33 /2011
7
Virological surveillance
Weekly analysis – virology
In weeks 32–33/2010, 16 countries reported virological data. None of the 41 sentinel specimens tested were positive for influenza virus. Of the non-sentinel source specimens, e.g. specimens collected for diagnostic purposes in hospitals, 13 were positive for influenza virus, six were type A and seven were type B. Four type A influenza viruses were subtyped, three as A(H1)2009 and one as A(H3).
Of the 58 929 influenza viruses detected since week 40/2010 in sentinel and non-sentinel specimens, 38 966 (66.1%) were influenza A and 19 963 (33.9%) were influenza B viruses. Of 28 016 influenza A viruses subtyped, 27 236 (97.2%) were A(H1)2009 and 780 (2.8%) were A(H3) viruses (Table 2).
Since week 40/2010, 4 707 influenza viruses from sentinel and non-sentinel specimens have been characterised antigenically (Figure 1): 2 350 as A/California/7/2009 (H1N1)-like; 2 010 as B/Brisbane/60/2008-like (Victoria lineage), 185 as B/Florida/4/2006-like (Yamagata lineage), 149 as A/Perth/16/2009 (H3N2)-like and 13 as B/Bangladesh/3333/2007-like (Yamagata lineage).
More details on circulating viruses can be found in the July report prepared by the Community Network of Reference Laboratories (CNRL) coordination team. The viruses circulating this season remain well-matched with the 2010/11 seasonal vaccine viruses.
Based on centrally generated antiviral testing results now submitted to TESSy, some data for an expanded number of countries has become available. Overall, in terms of testing for oseltamivir resistance, 2562 A(H1)2009, 100 A(H3) and 508 influenza B viruses have been screened. Of these, 117 A(H1)2009 viruses were resistant with the bulk being detected in the UK (58), Denmark (27) and France (12). All viruses tested remained sensitive to zanamivir. In terms of adamantane sensitivity, all A(H1)2009 and A(H3) viruses (261 and 53 screened, respectively) were resistant.
Table 2: Weekly and cumulative influenza virus detections by type, subtype and surveillance system, weeks 40/2010–33/2011
Note: A(H1)2009, A(H3) and A(H1) includes both N-subtyped and non-N-subtyped viruses
Virus type/subtype Sentinel Non-sentinel Sentinel Non-sentinel Influenza A 0 6 8445 30521
A (H1) 2009 0 3 7591 19645 A (subtyping not performed) 0 2 593 10357 A (not subtypable) 0 0 0 0 A (H3) 0 1 261 519 A (H1) 0 0 0 0
Influenza B 0 7 5741 14222 Total Influenza 0 13 14186 44743
Current Period Season

ECDC SURVEILLANCE REPORT Influenza overview weeks 32-33 /2011
8
Figure 1: Results of antigenic characterisations of sentinel and non-sentinel influenza virus isolates, weeks 40/2010–33/2011
Description of the system According to the nationally defined sampling strategy, sentinel physicians take nasal or pharyngeal swabs from patients with influenza-like illness (ILI), acute respiratory infection (ARI) or both and send the specimens to influenza-specific reference laboratories for virus detection, (sub-)typing, antigenic or genetic characterisation and antiviral susceptibility testing.
For details on the current virus strains recommended by WHO for vaccine preparation click here.
2350
14913
2010
185
A(H1) A/California/7/2009 (H1N1)-like
A(H3) A/Perth/16/2009 (H3N2)-like
B/Bangladesh/3333/2007-like (B/Yamagata/16/88 lineage)
B/Brisbane/60/2008-like (B/Victoria/2/87-lineage)
B/Florida/4/2006/-like (Yamagata lineage)
ECDC SURVEILLANCE REPORT Influenza overview weeks 32-33 /2011
9
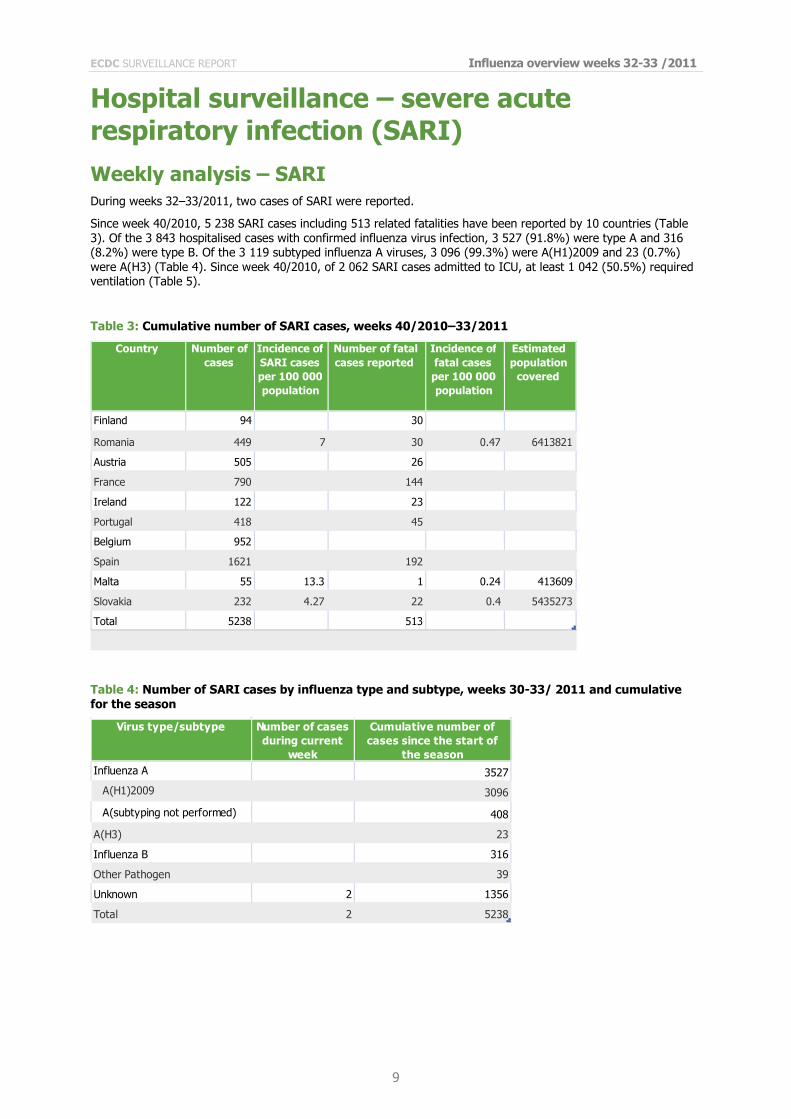
Hospital surveillance – severe acute respiratory infection (SARI) Weekly analysis – SARI During weeks 32–33/2011, two cases of SARI were reported.
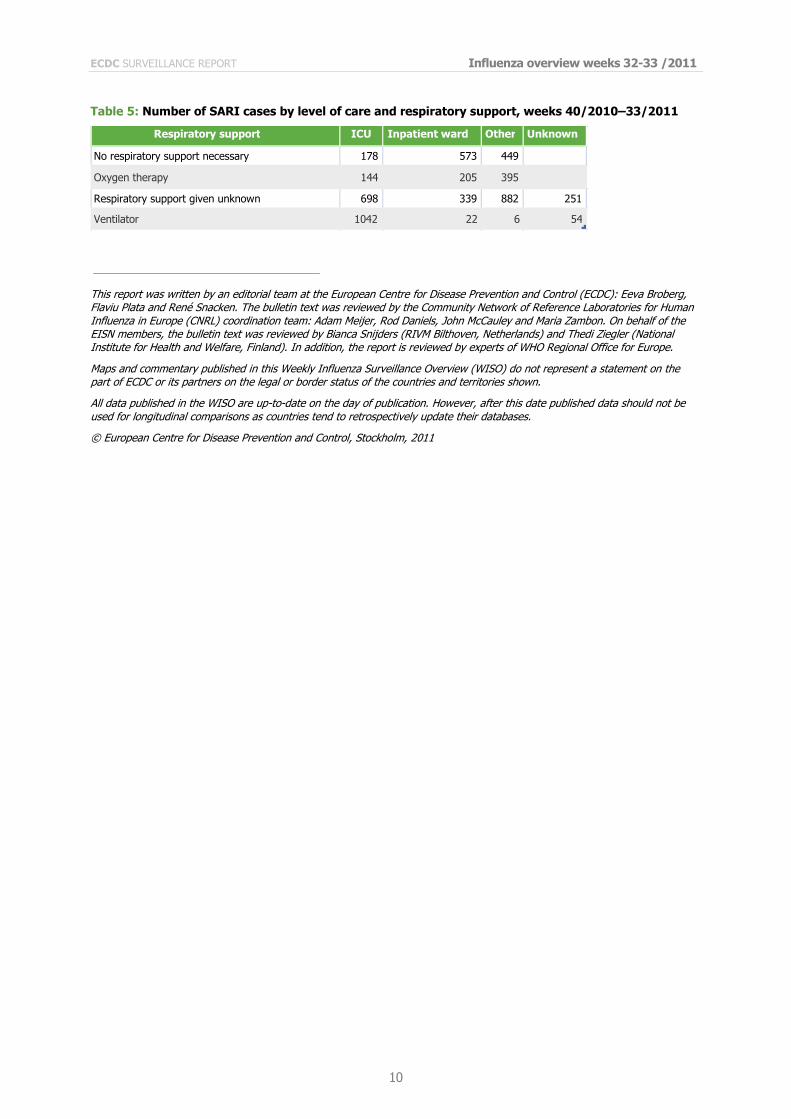
Since week 40/2010, 5 238 SARI cases including 513 related fatalities have been reported by 10 countries (Table 3). Of the 3 843 hospitalised cases with confirmed influenza virus infection, 3 527 (91.8%) were type A and 316 (8.2%) were type B. Of the 3 119 subtyped influenza A viruses, 3 096 (99.3%) were A(H1)2009 and 23 (0.7%) were A(H3) (Table 4). Since week 40/2010, of 2 062 SARI cases admitted to ICU, at least 1 042 (50.5%) required ventilation (Table 5).
Table 3: Cumulative number of SARI cases, weeks 40/2010–33/2011
Table 4: Number of SARI cases by influenza type and subtype, weeks 30-33/ 2011 and cumulative for the season
Virus type/subtype Number of cases during current
week
Cumulative number of cases since the start of
the seasonInfluenza A 3527
A(H1)2009 3096
A(subtyping not performed) 408
A(H3) 23
Influenza B 316
Other Pathogen 39
Unknown 2 1356
Total 2 5238
Country Number of cases
Incidence of SARI cases per 100 000 population
Number of fatal cases reported
Incidence of fatal cases per 100 000 population
Estimated population
covered
Finland 94 30
Romania 449 7 30 0.47 6413821
Austria 505 26
France 790 144
Ireland 122 23
Portugal 418 45
Belgium 952
Spain 1621 192
Malta 55 13.3 1 0.24 413609
Slovakia 232 4.27 22 0.4 5435273
Total 5238 513
ECDC SURVEILLANCE REPORT Influenza overview weeks 32-33 /2011
10
Table 5: Number of SARI cases by level of care and respiratory support, weeks 40/2010–33/2011
This report was written by an editorial team at the European Centre for Disease Prevention and Control (ECDC): Eeva Broberg, Flaviu Plata and René Snacken. The bulletin text was reviewed by the Community Network of Reference Laboratories for Human Influenza in Europe (CNRL) coordination team: Adam Meijer, Rod Daniels, John McCauley and Maria Zambon. On behalf of the EISN members, the bulletin text was reviewed by Bianca Snijders (RIVM Bilthoven, Netherlands) and Thedi Ziegler (National Institute for Health and Welfare, Finland). In addition, the report is reviewed by experts of WHO Regional Office for Europe.
Maps and commentary published in this Weekly Influenza Surveillance Overview (WISO) do not represent a statement on the part of ECDC or its partners on the legal or border status of the countries and territories shown.
All data published in the WISO are up-to-date on the day of publication. However, after this date published data should not be used for longitudinal comparisons as countries tend to retrospectively update their databases.
© European Centre for Disease Prevention and Control, Stockholm, 2011
Respiratory support ICU Inpatient ward Other Unknown
No respiratory support necessary 178 573 449
Oxygen therapy 144 205 395
Respiratory support given unknown 698 339 882 251
Ventilator 1042 22 6 54