bias betw een mni and t alairach coor dinates analyz ed … · · 2011-08-31bias betw een mni and...
TRANSCRIPT

Bias Between MNI and Talairach CoordinatesAnalyzed Using the ICBM-152 Brain Template
Jack L. Lancaster,1,2* Diana Tordesillas-Gutierrez,1 Michael Martinez,1
Felipe Salinas,1 Alan Evans,2,3 Karl Zilles,2,4 John C. Mazziotta,2,5
and Peter T. Fox1,2
1Research Imaging Center, University of Texas Health Science Center, San Antonio, Texas2International Consortium for Brain Mapping, UCLA, Los Angeles, California
3McConnell Brain Imaging Center, Montreal Neurological Institute4Institute of Medicine and Brain Imaging Center West (BICW), Julich, Germany
5Department of Neurology, Brain Mapping Center, David Geffen School of Medicine,UCLA, Los Angeles, California
Abstract: MNI coordinates determined using SPM2 and FSL/FLIRT with the ICBM-152 template werecompared to Talairach coordinates determined using a landmark-based Talairach registration method(TAL). Analysis revealed a clear-cut bias in reference frames (origin, orientation) and scaling (brainsize). Accordingly, ICBM-152 fitted brains were consistently larger, oriented more nose down, andtranslated slightly down relative to TAL fitted brains. Whole brain analysis of MNI/Talairach coordi-nate disparity revealed an ellipsoidal pattern with disparity ranging from zero at a point deep withinthe left hemisphere to greater than 1-cm for some anterior brain areas. MNI/Talairach coordinate dis-parity was generally less for brains fitted using FSL. The mni2tal transform generally reduced MNI/Talairach coordinate disparity for inferior brain areas but increased disparity for anterior, posterior,and superior areas. Coordinate disparity patterns differed for brain templates (MNI-305, ICBM-152)using the same fitting method (FSL/FLIRT) and for different fitting methods (SPM2, FSL/FLIRT) usingthe same template (ICBM-152). An MNI-to-Talairach (MTT) transform to correct for bias between MNIand Talairach coordinates was formulated using a best-fit analysis in one hundred high-resolution 3-DMR brain images. MTT transforms optimized for SPM2 and FSL were shown to reduced group meanMNI/Talairach coordinate disparity from a 5-13 mm to 1-2 mm for both deep and superficial brainsites. MTT transforms provide a validated means to convert MNI coordinates to Talairach compatiblecoordinates for studies using either SPM2 or FSL/FLIRT with the ICBM-152 template. Hum Brain Mapp28:1194–1205, 2007. VVC 2007 Wiley-Liss, Inc.
Key words: spatial normalization; Talairach coordinates; MNI coordinates; reference frame bias;ICBM-152 template; MNI-305 template
INTRODUCTION
Spatial normalization is an important preprocessingstep used to reduce intersubject anatomical variability inhuman brain mapping studies [Fox et al., 1995]. The mostbasic form of spatial normalization uses landmarks and a9-parameter affine transform to adjust position, orientation,and size of an individual brain to match a reference brain[Lancaster and Fox, 2000]. For many years, the 1988 Talair-ach Atlas brain [Talairach and Tournoux, 1988] served asthe ad hoc standard for reporting locations of activation
Contract grant sponsor: National Institute of Mental Health;Contract grant sponsor: National Institute on Drug Abuse; Con-tract grant number: P20 MH/DA52176; Contract grant sponsor:National Institute of Mental Health; Contract grant number: 5 T32MH65728-03.
*Correspondence to: Fax: 210-567-8152, E-mail: [email protected]
Received for publication 1 March 2006; Revised 4 June 2006;Accepted 22 August 2006
DOI: 10.1002/hbm.20345Published online 31 January 2007 in Wiley InterScience (www.interscience.wiley.com).
VVC 2007 Wiley-Liss, Inc.
r Human Brain Mapping 28:1194–1205 (2007) r
foci in functional brain mapping studies in part due to itsdetailed anatomical labeling.Automated spatial normalization using an average 3-D
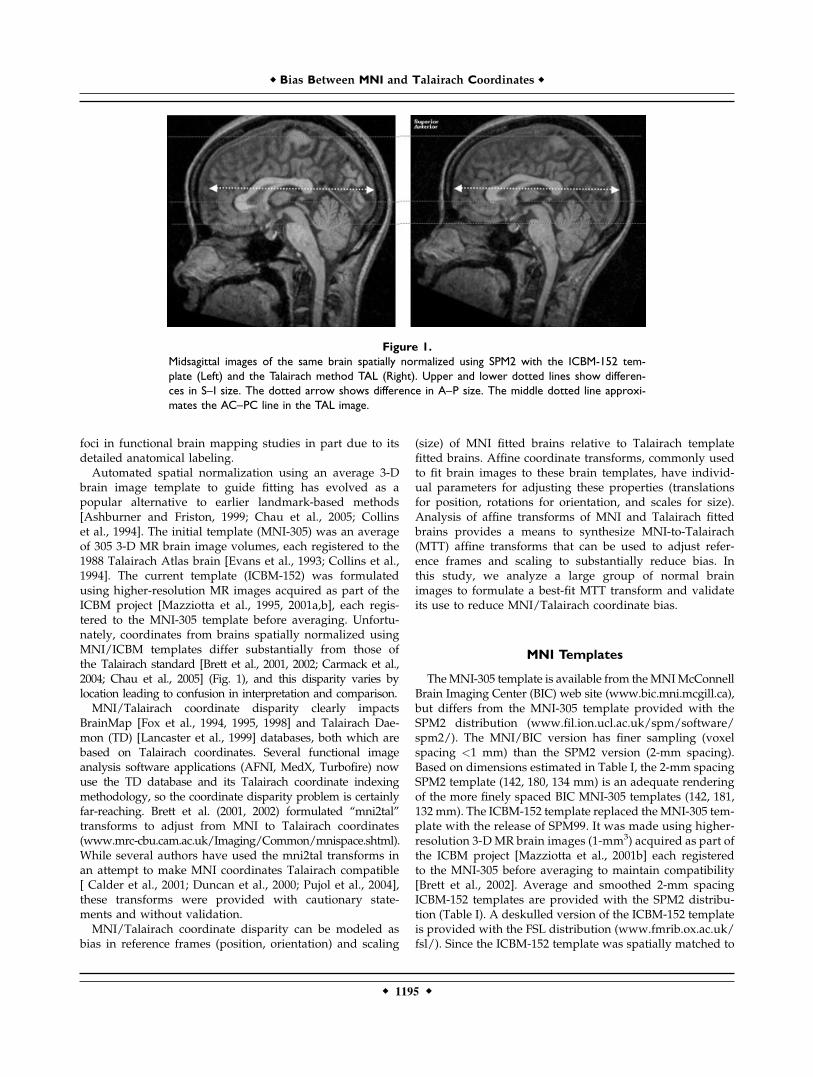
brain image template to guide fitting has evolved as apopular alternative to earlier landmark-based methods[Ashburner and Friston, 1999; Chau et al., 2005; Collinset al., 1994]. The initial template (MNI-305) was an averageof 305 3-D MR brain image volumes, each registered to the1988 Talairach Atlas brain [Evans et al., 1993; Collins et al.,1994]. The current template (ICBM-152) was formulatedusing higher-resolution MR images acquired as part of theICBM project [Mazziotta et al., 1995, 2001a,b], each regis-tered to the MNI-305 template before averaging. Unfortu-nately, coordinates from brains spatially normalized usingMNI/ICBM templates differ substantially from those ofthe Talairach standard [Brett et al., 2001, 2002; Carmack et al.,2004; Chau et al., 2005] (Fig. 1), and this disparity varies bylocation leading to confusion in interpretation and comparison.MNI/Talairach coordinate disparity clearly impacts
BrainMap [Fox et al., 1994, 1995, 1998] and Talairach Dae-mon (TD) [Lancaster et al., 1999] databases, both which arebased on Talairach coordinates. Several functional imageanalysis software applications (AFNI, MedX, Turbofire) nowuse the TD database and its Talairach coordinate indexingmethodology, so the coordinate disparity problem is certainlyfar-reaching. Brett et al. (2001, 2002) formulated ‘‘mni2tal’’transforms to adjust from MNI to Talairach coordinates(www.mrc-cbu.cam.ac.uk/Imaging/Common/mnispace.shtml).While several authors have used the mni2tal transforms inan attempt to make MNI coordinates Talairach compatible[ Calder et al., 2001; Duncan et al., 2000; Pujol et al., 2004],these transforms were provided with cautionary state-ments and without validation.MNI/Talairach coordinate disparity can be modeled as
bias in reference frames (position, orientation) and scaling
(size) of MNI fitted brains relative to Talairach templatefitted brains. Affine coordinate transforms, commonly usedto fit brain images to these brain templates, have individ-ual parameters for adjusting these properties (translationsfor position, rotations for orientation, and scales for size).Analysis of affine transforms of MNI and Talairach fittedbrains provides a means to synthesize MNI-to-Talairach(MTT) affine transforms that can be used to adjust refer-ence frames and scaling to substantially reduce bias. Inthis study, we analyze a large group of normal brainimages to formulate a best-fit MTT transform and validateits use to reduce MNI/Talairach coordinate bias.
MNI Templates
TheMNI-305 template is available from theMNIMcConnellBrain Imaging Center (BIC) web site (www.bic.mni.mcgill.ca),but differs from the MNI-305 template provided with theSPM2 distribution (www.fil.ion.ucl.ac.uk/spm/software/spm2/). The MNI/BIC version has finer sampling (voxelspacing <1 mm) than the SPM2 version (2-mm spacing).Based on dimensions estimated in Table I, the 2-mm spacingSPM2 template (142, 180, 134 mm) is an adequate renderingof the more finely spaced BIC MNI-305 templates (142, 181,132 mm). The ICBM-152 template replaced theMNI-305 tem-plate with the release of SPM99. It was made using higher-resolution 3-DMR brain images (1-mm3) acquired as part ofthe ICBM project [Mazziotta et al., 2001b] each registeredto the MNI-305 before averaging to maintain compatibility[Brett et al., 2002]. Average and smoothed 2-mm spacingICBM-152 templates are provided with the SPM2 distribu-tion (Table I). A deskulled version of the ICBM-152 templateis provided with the FSL distribution (www.fmrib.ox.ac.uk/fsl/). Since the ICBM-152 template was spatially matched to
Figure 1.Midsagittal images of the same brain spatially normalized using SPM2 with the ICBM-152 tem-plate (Left) and the Talairach method TAL (Right). Upper and lower dotted lines show differen-ces in S–I size. The dotted arrow shows difference in A–P size. The middle dotted line approxi-mates the AC–PC line in the TAL image.
r Bias Between MNI and Talairach Coordinates r
r 1195 r

the MNI-305 template, coordinates produced using eithertemplate will be calledMNI coordinates.Templates for T1 weighted, T2 weighted, and proton
density weighted images are available with the SPM2 dis-tribution. The T1 weighted ICBM-152 template was usedto develop and validate MTT coordinate transforms. Sincetransformed brains might also differ due to fitting method,we investigated two popular automated spatial normaliza-tion software applications: (1) SPM2 and (2) the intermo-dality registration software FLIRT provided with FSL.
METHODS
Disparity in MNI and Talairach coordinates arises fromvarious sources including differences in image types (aver-age MRI vs. book atlas), differences in fitting methods(automated brain fitting using the MNI template vs. Talair-ach landmark-based template fitting), and differences incoordinate reference frames (orientation and origin). Apseudotemplate image derived from the Talairach atlasand aligned with the MNI template might seem like aproper approach for developing a ‘‘mni2tal’’ transform[Brett et al., 2001, 2002]; however, there is no guaranteethat MR brain images will fit the MNI template in thesame manner as a pseudo-Talairach template. Conversely,MNI and Talairach coordinates include all sources of dis-parity and served as the basis to determine best-fit MTTtransforms for this study.
Average Brain Template Cerebral Dimensions
Direct comparison between the cerebral dimensions thatdefine the Talairach brain size (Table I) and correspondingdimensions for MNI templates is confounded by the lackof detail in the average brain templates. A 3-D edgeenhancement filter was used to improve clarity of brainborders for MNI template brains. Filtering was done usingthe 3 ! 3 ! 3 Sobel filter provided within MEDx (SensorSystems, Sterling, Virginia). Sobel filtering produces highpixel values at brain borders where the grey-scale 3-D
image gradient is maximal. Two-dimensional local maximafilters were used to highlight x-, y-, and z-directed maximaalong brain borders. Filtered template images wereinspected to determine cerebral bounding box dimensions.Processing was repeated to verify that dimensional esti-mates were reproducible for each template.
Brain Images
High-resolution 3-D T1-weighted brain images from 100normal subjects, each enrolled under the ICBM researchprotocol [Mazziotta et al., 2001b], were retrieved from alocal ICBM image archive. All images were acquired withinformed consent approved by the UTHSCSA institutionalreview board. The 100 MR images served as a test databaseof normal brains in the age range of 20–40 years (mean "27.8 years; SD " 5.1 years). There were 52 males and 48females, with approximately 1/7th being left handed (87right/13 left). The group consisted of 70 Caucasian, 26 His-panic, and 4 Afro-American volunteers. Images wereacquired on a 1.9 Tesla GE/Elscint Prestige MR imagerusing a 3-D T1-weighted spoiled gradient-echo sequence(TR/TE " 24/6 ms, flip angle " 258, NEX " 1, with flowcomp). Slice direction was sagittal (190 mm) with a rectan-gular field of view 256 ! 256 mm2 in the AP and SI direc-tions. The 1-mm isotropic spacing brain images were cen-tered within a standard 2563 16-bit integer array using apadding technique to simplify subsequent processing.
Talairach Registration
The Talairach registration method (TAL) has been usedat the Research Imaging Center for over 10 years with 3-DMR images and leads to coordinates with good correspon-dence to labels from the Talairach atlas [Lancaster et al.,1995, 1999, 2000]. Talairach registration uses standards andrules for consistent determination of reference frames (ori-gin, orientation) and scale (brain size). The Talairach speci-fied origin is a single anatomical landmark, at the intersec-tion of posterior and superior margins of the anterior com-missure (AC) on the midhemispheric plane. However, weused the center of the AC as the coordinate origin, since itcan be more consistently determined in MR images and isless affected by differences in spatial resolution. The orien-tation is determined from unit vectors directed along #xand #y brain axes. The #y unit vector is parallel to theAC–PC line, arises from the AC, and directed anteriorly.The #x unit vector is perpendicular to the interhemi-spheric plane and directed to the right side of the brain. Athird #z unit vector is formed as the vector cross productof the x- and y-unit vectors and is directed superiorly. Col-lectively, these 3 unit vectors define the right-handedTalairach reference frame. We use four landmarks withinthe midsagittal plane to determine the y-axis since thisapproach is less affected by errors in AC/PC assignmentor their anatomical variability and leads to a y-axis that isconsistently AC–PC oriented [Lancaster et al., 1995, 1999].
TABLE I. Cerebral dimensions of brain templates
Template Source Sampling
Braindimensions
(mm)VolumeratioL–R A–P S–I
Talairach 1988 Atlas Variable 136 172 118 1.000ICBM-152 T1average
FSL 2 mm 144 180 132 1.240
ICBM-152 T1average
SPM2 2 mm 144 180 132 1.240
ICBM-152 T1smooth
SPM2 2 mm 140 176 130 1.160
MNI-305 MNI-BIC <1 mm 142 181 132 1.229MNI-305average
SPM2 2 mm 142 180 134 1.241
r Lancaster et al. r
r 1196 r

As in the Talairach atlas bounding cerebral dimensions ofthe aligned brain determine brain size. With high-resolutionMR images all landmarks needed for Talairach registrationcan be reproducibly determined. One person (DT-G) per-formed all TAL registrations after training to ensure accu-rate and reproducible registration. Intraoperator reproduci-bility was good with standard deviations for landmarksconsistently under 2 mm. The TAL method produced a9-parameter, 4 ! 4 affine transform matrix.
Automated Template Fitting
The smoothed average T1-weighted ICBM-152 templatewas used with SPM2 as recommended, and the unsmootheddeskulled average T1-weighted ICBM-152 template wasused with FSL’s FLIRT [Jenkinson et al., 2002]. Followingsuggested guidelines additional smoothing (FWHM " 8 mm)was applied to brain images when fitting using SPM2. FSLfitting used the default FLIRT (correlation-ratio) cost function[Roche et al., 1998]. Twelve-parameter affine transformswere used for both SPM2 and FSL methods. While thesetransforms include skew parameters, which are not neededfor reference frame matching, skew parameters wereincluded since many users of SPM2 and FSL also use them.The nonlinear transform feature of SPM2 [Friston et al.,1995] was not used, since it does not support direct affinemapping needed to formulate individual MTT coordinatetransforms (Fig. 2). FSL preprocessing included deskullingthe brain for each MR image using FSL’s brain extractiontool (BET). Similar to TAL registration one person (DT-G)performed template fitting after training to ensure properuse of the software. Both SPM2 and FSL produced 12-pa-rameter, 4 ! 4 affine transform matrices.
MTT Transforms
Individual 4 ! 4 affine transform matrices were deter-mined for each of 100 brain image volumes using SPM2,FSL, and TAL template registration methods. Raw trans-forms were taken from ‘‘_sn.mat’’ files for SPM2, user-saved transform matrix files for FSL, and ‘‘.aln’’ files forTAL, all in text format. These raw transforms were cor-
rected for differences in coordinate sense and origins tosupport comparisons. We verified that our transform-derived coordinates, calculated from the centroid of eightspherical landmarks, matched those reported using each ofthe three spatial normalization methods. Individual trans-forms from image-to-MNI coordinates (MNI) and fromimage-to-Talairach coordinates (TAL) were used to formu-late individual MTT coordinate-to-coordinate transformsas MTT " TAL $ MNI%1 for each of the 100 brains (Fig. 2).Translation, orientation, and scale parameters wereextracted from the MNI and TAL matrices (Appendix) toanalyze reference frame and scaling bias.A single MTT transform was needed to support MTT
coordinate conversion for more broad usage. This need ledto the development of a MTT transform that would best fita set of fixed landmarks by minimizing mean square erroracross 100 brains (see Fig. 3). We analyzed eight pointlandmarks for this procedure, one centered in each octantof the standard 2563 image matrix. These landmark posi-tions were selected to avoid positional bias that mightoccur with brain-based landmarks. MNI and Talairachcoordinates of each of the eight landmarks were calculatedfor each subject using individual MNI and TAL coordinatetransforms. A Moore–Penrose pseudoinverse least-squareerror method [Penrose, 1955] was used to determine the4 ! 4 affine transform that best fit the full set of MNI coor-dinates to the corresponding set of TAL coordinates. Usingmore landmarks was tested but did not significantlyimprove precision of results.
Site-Specific Testing
Deep and superficial landmark sites were selected todirectly measure coordinate disparity for the three fittingmethods. Ten brain volumes were randomly selected forthis testing. Image coordinates were recorded in trans-formed images for each of three spatial normalizationmethods at the AC, the PC, and at six cerebral extremities(anterior, posterior, left, right, superior, and inferior). Sitesfor each landmark were determined by visual inspectionof the high-resolution 3-D MR brain images using SN soft-ware [Lancaster et al., 1995] by one individual (DT-G).These landmarks were determined separately from thoseused for TAL spatial normalization.
Full-Brain Testing
A full-brain evaluation of differences between MNI andTalairach coordinates was done to investigate the spatialdistribution of coordinate disparity. The Talairach Daemon(TD) served as the basis for visual comparison since eachlocation within its 3-D volume has an assigned Talairachcoordinate. A binary 3-D image of the TD was made, zerooutside the brain and unity inside. MNI coordinates wereestimated for each Talairach coordinate within this binar-ized image using an inverse best-fit MTT transform matrixMTT%1. Disparity between estimated MNI coordinates and
Figure 2.Individual MNI-to-Talairach (MTT) coordinate transforms. Eachbrain-image volume (Braini) is transformed using SPM2, FSL, andTalairach (TAL) spatial normalization methods. Resulting 4 ! 4image-to-coordinate transforms [MNI]i and [TAL]i can be usedto formulate exact individual 4 ! 4 MNI-to-Talairach coordinatetransforms [MTT]i.
r Bias Between MNI and Talairach Coordinates r
r 1197 r

TAL coordinates was calculated as distance in millimeterfor each TD coordinate. A mathematical model of coordi-nate disparity was formulated to predict key features ofcoordinate disparity (Appendix).
RESULTS
Template Brain Dimensions
Cerebral dimensions of template brains from MNI-305and ICBM-152 templates were all larger than those for the1988 Talairach atlas brain (Table I). The most strikingdifference was for the superior–inferior (S–I) dimensionwhere MNI/ICBM template dimensions were &12% larger.Volume ratios, based on the product of dimensions, indi-cate that the ICBM-152 template volume is &24% largerthan the Talairach template volume. The smoothed aver-age ICBM-152 template was smaller than the unsmoothedaverage ICBM-152. The MNI-305 template volume ratiowas similar to that for the ICBM-152 average template. Noattempt was made to correct for mismatched orientationsbetween templates, so bounding volume ratios are approx-imations since dimensions of the Talairach atlas aredefined in a standard orientation.
Individual Transform Analysis (N 5 100 brains)
The largest difference between SPM2/FSL and TALtransform parameters was in z-scale factors and rotationabout the x-axis (Table II), somewhat consistent withobservations reported by others [Brett et al., 2001; Chauet al., 2005]. Differences in the mean orientation aboutthe x-axis of %3.58 for FSL and %5.38 for SPM2 are con-sistent with the more nose-down orientation for SPM2/FSL fitted brain images (Fig. 1). As anticipated fromhead positioning variability, orientation variability aboutthe x-axis was largest; 3–4 times that for the y-axis. Aninteresting finding is that net volume scaling for theTAL method was nearest to unity (1.055!). In fact, forthe TAL method, mean scale factors for x and y werewithin 1% of unity, with the largest scale difference(#4%) for the z-direction. Conversely, net volume scalefactors for FSL and SPM2 using the ICBM-152 templatewere larger, 1.294 and 1.349. Mean scale factors for bothSPM2 and FSL were 5% above unity for x- and y-direc-tions and more than 10% above unity for the z-direction.The FSL-to-TAL volume ratio of 1.227 was similar to the1.240 value predicted from template dimensions alone(Table I), while that from SPM2 (1.279) was larger than
Figure 3.Best-fit MNI-to-Talairach (MTT) coordinate transform. Image coordinates (i, j, k) for eight pointlandmarks (grey spheres) are transformed to Talairach (x@, y@, z@) and MNI (x0, y0, z0) coordinatesusing individual 4 ! 4 [TAL]i and [MNI]i transforms. The MTT transform that best fits MNI topaired TAL coordinates for all 100 subjects is determined using the Moore–Penrose pseudoinversemethod. Subscripts m,n are sphere number, brain number.
r Lancaster et al. r
r 1198 r

the 1.160 value predicted from the smoothed template.The standard error of the mean for all scale factors wassmall (0.4–0.5%). All average scale parameters for theTAL method were near unity indicating that averagebrain dimensions for the 100 subjects were close to thedimensions of the Talairach atlas brain.Correlations between TAL, SPM2, and FSL rotation and
scale parameters were measured, and all correlation coeffi-cients were significant and positive (rA,B > 0.256; P <0.01). Rotations about x-, y-, and z-axes included negativeand positive angles for all methods with the largest rangeof rotation about the x-axis (%14 to #218 TAL; %16 to #158FSL; %16 to #138 SPM2). Accordingly, rotations aboutthe x-axis had the highest correlations (rFSL,TAL " 0.95;rSPM2,TAL " 0.94). Linear regression for x-axis rotationsgave a slope of 0.89 for FSL vs. TAL nearer to unity slopethan the 0.79 for SPM2 vs. TAL. Volume scaling for FSLcorrelated better with TAL (rFSL,TAL " 0.95) than didSPM2 (rSPM2,TAL " 0.78). The higher correlations for FSLrotation and scale parameters suggest that a best-fit MTTtransform might be more effective in reducing coordinatebias for FSL.
MTT Transform Analysis (N 5 100)
Separate best-fit MTT transforms were determined forSPM2 and FSL [Eqs. (1) and (2)]. The MTT transforms weredecomposed into 12 parameters (Table III) to better assessreference frame and scale biases. This decomposition leadsto a volume ratio estimate of 1.232 for FSL/TAL, similar tothat predicted from template dimensions (1.240, Table I).The volume ratio of 1.288 for SPM2/TAL was larger thanpredicted from template dimensions (1.160) suggesting apotential template fitting bias for SPM2. Most of the scaledifference between MNI and Talairach coordinates was due
to z-scale factors. All skew parameters were less than 1%indicating effective axis orthogonality for the MNI referenceframe, an inherent property of the TAL reference frame.Similar to individual transform parameter analyses, a nose-down rotation about the x-axis of approximately 4–68 wasindicated for the MNI reference frame relative to the Talair-ach reference frame. Other rotational differences were onedegree or less.
MTTSPM "
0:9254 0:0024 %0:0118 %1:0207%0:0048 0:9316 %0:0871 %1:76670:0152 0:0883 0:8924 4:09260 0 0 1
666664
777775 '1(
MTTFSL "
0:9464 0:0034 %0:0026 %1:0680%0:0083 0:9479 %0:0580 %1:02390:0053 0:0617 0:9010 3:18830 0 0 1
666664
777775 '2(
Key findings for scale, x-axis rotation, and z-axis trans-lation parameters in MTTFSL were similar to those esti-mated from data in Chau et al. [2005], who used a tem-plate-matching approach and SPM99 with an in-houseformulated Talairach average brain template. A best-fitMTT transform was also formulated pooling SPM2 andFSL data [Eq. (3)].
MTTpooled "
0:9357 0:0029 %0:0072 %1:0423%0:0065 0:9396 %0:0726 %1:39400:0103 0:0752 0:8967 3:64750 0 0 1
666664
777775 '3(
This transform can be used to substantially reducecoordinate bias for either SPM2 or FSL fitting methods.
TABLE III. 12-Parameter decompositon of MTT transform matrices
Transform
Translation (mm) Rotation (8) Scale Skew
x y z x y z x y z Kxy Kxz Kyz
MTTSPM2 %1.02 %1.77 4.09 5.65 %0.97 %0.30 0.925 0.936 0.897 %0.0013 0.0047 0.0055MTTFSL %1.07 %1.02 3.18 3.92 %0.34 %0.50 0.946 0.950 0.903 %0.0047 %0.0035 0.0076
Translations and scales are along and positive rotations are CCW about x, y, and z axes. Skew for Kxy increases x as y increases. Volumeratios are 1.232 for FSL/TAL and 1.288 for SPM/TAL.
TABLE II. Transform parameter analysis for spatial normalization by the manual Talairach (TAL) method,and by FSL and SPM2 methods using the ICBM-152 template
Method
Rotation (8) Scale
Net scalex y z x y z
TAL 2.58 6 6.63 %0.10 6 1.67 0.28 6 2.90 1.012 6 0.044 1.000 6 0.042 1.040 6 0.043 1.055 6 0.102FSL %0.98 6 6.20 %0.40 6 1.72 %0.21 6 2.65 1.068 6 0.045 1.052 6 0.045 1.149 6 0.040 1.294 6 0.118SPM2 %2.71 6 5.63 %0.96 6 1.80 0.05 6 2.86 1.091 6 0.046 1.067 6 0.043 1.156 6 0.045 1.349 6 0.130
Volume ratios are 1.227 for FSL/TAL and 1.279 for SPM2/TAL.Data are mean 6 SD (N " 100).
r Bias Between MNI and Talairach Coordinates r
r 1199 r
Disparity in mni2tal/MTT Transforms
When formulating the mni2tal transforms Brett et al.(2001, 2002) assumed that the MNI coordinate system ori-gin matched that of the Talairach system, so no translationterms were provided. However, best-fit MTT transformsshow that the origin in the Talairach reference frame isnearly one-half centimeter from the origin in the MNI ref-erence frame casting doubt on the validity of that assump-tion. Brett et al. (2001, 2002) also assumed that the onlydifference in orientation was due to rotation about thex-axis. Our study suggests that this was a reasonableassumption (Table III). Unfortunately, the x-axis rotation inthe mni2tal transforms is directed opposite to that of thebest-fit MTT transforms, producing a nose down ratherthan a nose up correction. A nose-up rotation correctionsimilar to that for the MTT transforms was also seen in thecoordinate data from Chau et al. [2005]. Large differencesin shape between the single Talairach atlas brain and theICBM-152 average brain template combined with restrictedtransform control made accurate alignment of referenceframes virtually impossible, consistent with our findings.The disparity for mni2tal adjusted MNI coordinates variesthroughout the brain, being worse than uncorrected MNIcoordinates in some brain areas (anterior and superior)and better in inferior areas, i.e. the temporal lobe (Fig. 4).
MNI-305/ICBM-152 Comparison
To investigate differences between the MNI-305 and theICBM-152 template, we fitted a small number of brains toeach template (N " 4). Preliminary analysis using the TALfitting method showed a variety of brain sizes (oneincreased volume by 1%, one decreased 1%, and othersincreased by 14% and 32%) and orientations (x-axis rotationsranged from %28 to #158). The analysis was done using FSLwith both non-deskulled and deskulled templates. An x-axisrotational difference (consistently more nose-down) wasseen for the MNI-305 template in each of the four brains,(%4.4 6 0.78)8. Volume-scale factors were (13.8 6 0.02)%smaller for the MNI-305 template, mostly due to a smallerz-scale (9.0 6 0.01% smaller). Similar findings but of lessermagnitude (%38 rotation and 9% volume-scale differences)were seen when fitting a deskulled MNI-305 template to thedeskulled ICBM-152 and back. Brains fitted using the ICBM-152 template were less nose-down, but larger than those fit-ted using the MNI-305 template. These data suggest thatx-axis rotation and z-scale are inherently problematic whenformulating average brain templates.
Site Specific Testing (N = 10)
As expected, the mean x-y-z coordinate in millimetersfor the AC was closest to the theoretical value of (0, 0, 0)
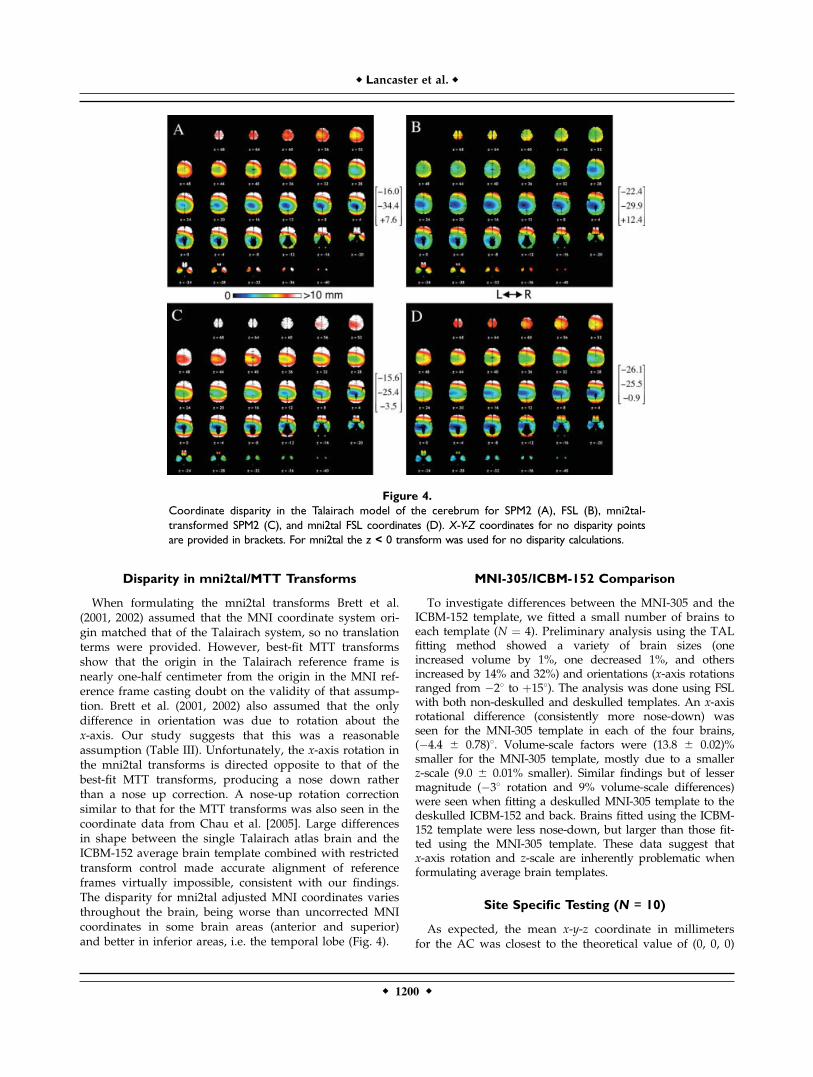
Figure 4.Coordinate disparity in the Talairach model of the cerebrum for SPM2 (A), FSL (B), mni2tal-transformed SPM2 (C), and mni2tal FSL coordinates (D). X-Y-Z coordinates for no disparity pointsare provided in brackets. For mni2tal the z < 0 transform was used for no disparity calculations.
r Lancaster et al. r
r 1200 r
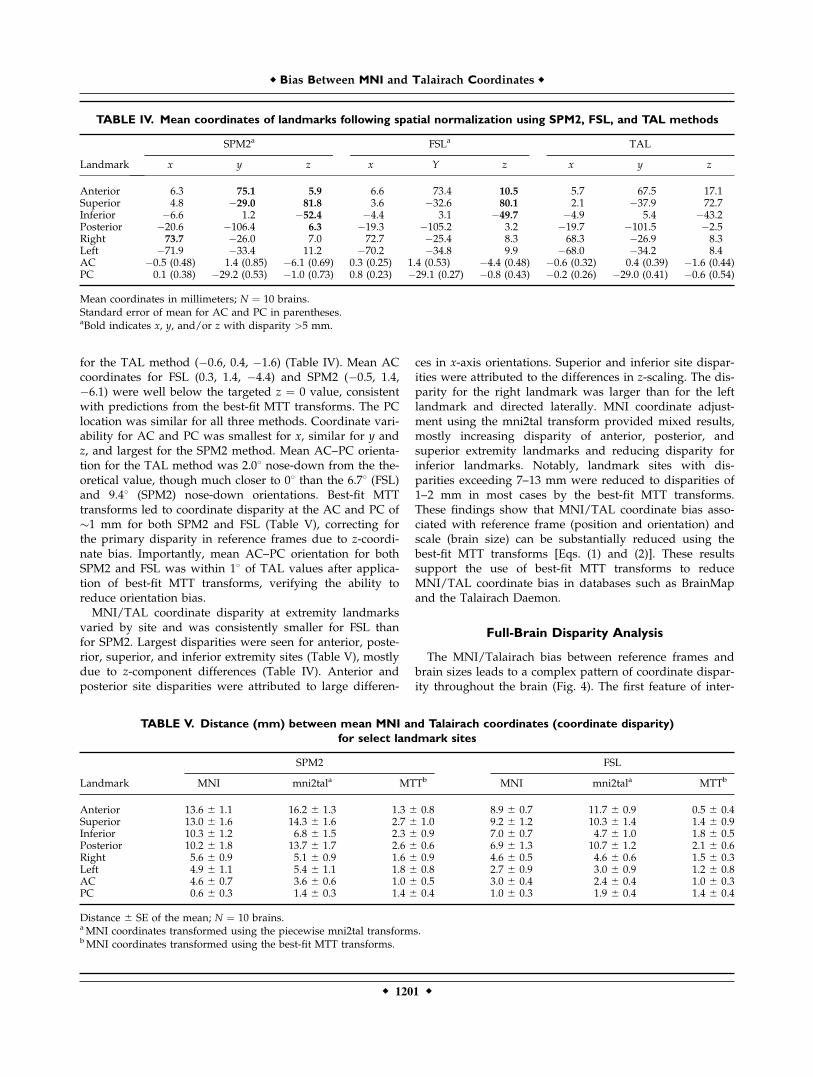
for the TAL method (%0.6, 0.4, %1.6) (Table IV). Mean ACcoordinates for FSL (0.3, 1.4, %4.4) and SPM2 (%0.5, 1.4,%6.1) were well below the targeted z " 0 value, consistentwith predictions from the best-fit MTT transforms. The PClocation was similar for all three methods. Coordinate vari-ability for AC and PC was smallest for x, similar for y andz, and largest for the SPM2 method. Mean AC–PC orienta-tion for the TAL method was 2.08 nose-down from the the-oretical value, though much closer to 08 than the 6.78 (FSL)and 9.48 (SPM2) nose-down orientations. Best-fit MTTtransforms led to coordinate disparity at the AC and PC of&1 mm for both SPM2 and FSL (Table V), correcting forthe primary disparity in reference frames due to z-coordi-nate bias. Importantly, mean AC–PC orientation for bothSPM2 and FSL was within 18 of TAL values after applica-tion of best-fit MTT transforms, verifying the ability toreduce orientation bias.MNI/TAL coordinate disparity at extremity landmarks
varied by site and was consistently smaller for FSL thanfor SPM2. Largest disparities were seen for anterior, poste-rior, superior, and inferior extremity sites (Table V), mostlydue to z-component differences (Table IV). Anterior andposterior site disparities were attributed to large differen-
ces in x-axis orientations. Superior and inferior site dispar-ities were attributed to the differences in z-scaling. The dis-parity for the right landmark was larger than for the leftlandmark and directed laterally. MNI coordinate adjust-ment using the mni2tal transform provided mixed results,mostly increasing disparity of anterior, posterior, andsuperior extremity landmarks and reducing disparity forinferior landmarks. Notably, landmark sites with dis-parities exceeding 7–13 mm were reduced to disparities of1–2 mm in most cases by the best-fit MTT transforms.These findings show that MNI/TAL coordinate bias asso-ciated with reference frame (position and orientation) andscale (brain size) can be substantially reduced using thebest-fit MTT transforms [Eqs. (1) and (2)]. These resultssupport the use of best-fit MTT transforms to reduceMNI/TAL coordinate bias in databases such as BrainMapand the Talairach Daemon.
Full-Brain Disparity Analysis
The MNI/Talairach bias between reference frames andbrain sizes leads to a complex pattern of coordinate dispar-ity throughout the brain (Fig. 4). The first feature of inter-
TABLE V. Distance (mm) between mean MNI and Talairach coordinates (coordinate disparity)for select landmark sites
Landmark
SPM2 FSL
MNI mni2tala MTTb MNI mni2tala MTTb
Anterior 13.6 6 1.1 16.2 6 1.3 1.3 6 0.8 8.9 6 0.7 11.7 6 0.9 0.5 6 0.4Superior 13.0 6 1.6 14.3 6 1.6 2.7 6 1.0 9.2 6 1.2 10.3 6 1.4 1.4 6 0.9Inferior 10.3 6 1.2 6.8 6 1.5 2.3 6 0.9 7.0 6 0.7 4.7 6 1.0 1.8 6 0.5Posterior 10.2 6 1.8 13.7 6 1.7 2.6 6 0.6 6.9 6 1.3 10.7 6 1.2 2.1 6 0.6Right 5.6 6 0.9 5.1 6 0.9 1.6 6 0.9 4.6 6 0.5 4.6 6 0.6 1.5 6 0.3Left 4.9 6 1.1 5.4 6 1.1 1.8 6 0.8 2.7 6 0.9 3.0 6 0.9 1.2 6 0.8AC 4.6 6 0.7 3.6 6 0.6 1.0 6 0.5 3.0 6 0.4 2.4 6 0.4 1.0 6 0.3PC 0.6 6 0.3 1.4 6 0.3 1.4 6 0.4 1.0 6 0.3 1.9 6 0.4 1.4 6 0.4
Distance 6 SE of the mean; N " 10 brains.aMNI coordinates transformed using the piecewise mni2tal transforms.bMNI coordinates transformed using the best-fit MTT transforms.
TABLE IV. Mean coordinates of landmarks following spatial normalization using SPM2, FSL, and TAL methods
Landmark
SPM2a FSLa TAL
x y z x Y z x y z
Anterior 6.3 75.1 5.9 6.6 73.4 10.5 5.7 67.5 17.1Superior 4.8 %29.0 81.8 3.6 %32.6 80.1 2.1 %37.9 72.7Inferior %6.6 1.2 %52.4 %4.4 3.1 %49.7 %4.9 5.4 %43.2Posterior %20.6 %106.4 6.3 %19.3 %105.2 3.2 %19.7 %101.5 %2.5Right 73.7 %26.0 7.0 72.7 %25.4 8.3 68.3 %26.9 8.3Left %71.9 %33.4 11.2 %70.2 %34.8 9.9 %68.0 %34.2 8.4AC %0.5 (0.48) 1.4 (0.85) %6.1 (0.69) 0.3 (0.25) 1.4 (0.53) %4.4 (0.48) %0.6 (0.32) 0.4 (0.39) %1.6 (0.44)PC 0.1 (0.38) %29.2 (0.53) %1.0 (0.73) 0.8 (0.23) %29.1 (0.27) %0.8 (0.43) %0.2 (0.26) %29.0 (0.41) %0.6 (0.54)
Mean coordinates in millimeters; N " 10 brains.Standard error of mean for AC and PC in parentheses.aBold indicates x, y, and/or z with disparity >5 mm.
r Bias Between MNI and Talairach Coordinates r
r 1201 r

est is the no-disparity site (centered in blue region), calcu-lated using Eq. (A3). This is the location where variouscomponents of the MTT transform cancel, i.e. where MNIand TAL coordinates are equal. MNI and TAL coordinatesare most consistent (disparity <2 mm) in the darker blueregions of Figure 4. The no-disparity site for FSL wasapproximately one-half centimeter superior, left, and ante-rior to that for SPM2. The mni2tal transform moved theno-disparity site to a more inferior location for both SPM2and FSL leading to increased disparity superiorly anddecreased disparity inferiorly.The second feature of interest in Figure 4 is the ellipsoidal
shape of the disparity pattern, which has increasing dispar-ity away from the no-disparity site. The semimajor axisdimensions of the disparity ellipsoids in Table AI are thedistances from the no-disparity site where disparity hasreached 1-mm. The volume of brain within this )1-mm dis-parity range was largest for FSL approximately twice thatfor SPM2. All disparity ellipsoids had smaller A–P and S–Idimensions indicating a more rapid change in coordinatedisparity in these directions. As expected from site-specificanalyses (Table V) disparity was generally highest for ante-rior regions, lower on the left side, and less with FSL thanSPM2. The mni2tal transform generally led to worse coordi-nate disparity for anterior, posterior, and superior regionsand better disparity for inferior regions.
DISCUSSION
MNI/Talairach Coordinate Disparity
Disparity between MNI and Talairach coordinates canlead to a displacement in the mean coordinate and increasedspatial variability when analyzing data sets containingboth MNI and Talairach coordinates. Formal studies of therelationship between MNI and Talairach coordinates havebeen hampered by the inability to make direct compari-sons between MNI templates and the individual braintemplate of the 1988 Talairach atlas. Brett et al. (2001)attempted to evaluate template differences using a 3-DTalairach brain model made from the Talairach Daemon,but the resulting mni2tal transform was not validated.Chau et al.(2005) recently studied MNI and Talairach coor-dinate differences increasing our understanding of MNI/Talairach coordinate disparity. However, their studymixed global affine with regional template registrationmethods, and regional methods can alter coordinates in amanner that cannot be accurately compared using globalaffine transforms. The present study uses only global affinetransforms (Figures 2 and 3), which support direct estima-tion of the bias between MNI and Talairach coordinatesdue to differences in reference frames and brain sizes.These transforms lead to consistent mean coordinate calcu-lations for groups containing both MNI and Talairachcoordinates and can reduce spatial variability. MNI/Talair-ach coordinate corrections are especially important whenperforming analyses using an assortment of MNI and
Talairach coordinates from databases such as BrainMapand the Talairach Daemon.
Average Brain Templates
A possible cause of MNI/Talairach coordinate disparityis incorrect Talairach registration during average braintemplate development. The initial step in the MNI-305template development registered 305 MR images into whatwas referred to as ‘‘stereotaxic space.’’ Although the MNImethod targeted Talairach space, it used a fitting methodwith many landmarks rather than just those used to definethe reference frame and brain size in the Talairach atlas.The difference in fitting methods possibly led to theobserved disparity in orientation and size [Carmack et al.,2004]. Another possible cause of MNI/TAL coordinate dis-parity is that averaging brains following linear registrationmight lead to a template with features incongruent withthose of individual brains (i.e. individual-average brain orI–A disparity). For example, rotation and scale variability(errors) can lead to large absolute positional differences,which increase with increasing distance from the origin[58 error (9 mm displacement at 100 mm); 5% scale error(5 mm displacement at 100 mm)]. Combined with transla-tional errors, the net result could be an average brain ofunusual size and shape. The I–A disparity theory is sup-ported by results of the template dimension study whereall average brain templates were larger than the Talairachbrain (Table I). I–A shape disparity might also explainwhy brains fit more nose-down. However, I–A disparitydoes not explain why the ICBM-152 template was lessnose-down than the MNI-305 template. Causality of MNI/Talairach coordinate disparity remains a question.The large differences in MNI/TAL coordinate disparity
for SPM2 and FSL were major disappointment in thisstudy (Table IV, Fig. 4). We suspect that these differenceswere mostly due to differences in brains and templatesused in fitting (deskulled brain and template by FSL vs.full-head image and template by SPM2). Differences incost functions, additional smoothing of individual brains,and SPM2’s use of a priori constraints are also possiblecontributors to the observed global spatial differences.Another disappointment was that the MNI-305 and ICBM-152 template brains also differed in orientation and scale.These findings raise concern about the robustness of coor-dinates determined using average brain templates, whichcan vary by both template and fitting software.An affine transform could be used to adjust the ICBM-
152 template to match the reference frame and brain sizefeatures of the Talairach brain. The smoothness of averagebrain templates would be conserved ensuring continuedtemplate support for automated spatial normalizationmethods. Additionally, a Talairach standardized ICBM-152template would be closer in size to the average humanbrain, perhaps improving fit quality. While best-fit MTTcoordinate transforms provide a good starting point for
r Lancaster et al. r
r 1202 r

developing a Talairach standardized ICBM-152 template,transforms to optimally achieve this are different whenapplied before vs. after fitting and in dealing with image vs.coordinate transformation. Additionally, differences betweenSPM2 and FSL fitting algorithms need further clarification inorder to reduce methodological biases. A pooled analysissuch as was done to develop the pooled MTT in Eq. (3)might be appropriate to deal with this issue.
Coordinate Standardization
Since affine transforms can directly correct for differen-ces in reference frames and scaling, it would be prudent toadopt a single template’s standards for these features. Weprefer the 1988 Talairach atlas standard, since standar-dized images can be readily verified, and it has beenwidely used by the human brain mapping community formany years. This approach to coordinate standardizationsupports existing as well as to-be-developed brain tem-plates. Additionally, coordinate standardization can beused as a preprocessing step in the application of highdegree-of-freedom transforms.
New 3-D Brain Template
While affine transforms can manage differences in globalanatomical features between an individual brain and atemplate brain, they cannot account for differences in fineranatomical detail (i.e. regional differences). This latter chal-lenge is for high degree-of-freedom regional transforms.Unfortunately, neither the ICBM-152 nor Talairach tem-plate is adequate for use with such regional transforms:the average ICBM-152 template fails due to its excessiveanatomical smoothness and the Talairach template failsdue to its poor spatial sampling. A solution would be todevelop a suitable 3-D brain template using high-detail 3-D MR brain images. Analysis of a large number of MRIbrain images could guide in the determination of a repre-sentative or median anatomical template. For such a tem-plate to be attractive, it should be provided with extensivemetadata, such as accurately determined anatomical, func-tional, and cytoarchitectonic labels [Mazziotta et al., 2001a,b].This is the challenge we now face.
CONCLUSIONS
MNI/Talairach coordinate disparity can be modeled asdifferences in reference frames and brain sizes. Large dif-ferences in coordinates were seen for brains transformedusing different software packages (FSL and SPM2) withthe same brain template (ICBM-152) as well as differenttemplates (MNI-305 vs. ICBM-152) with the same softwarepackage. The popular mni2tal transform provided de-creased disparity inferiorly, but increased disparity in an-terior, posterior, and superior regions. Best-fit MTT coordi-nate transforms were formulated that substantially reduce
disparity between MNI and Talairach coordinates through-out the brain.
ACKNOWLEDGMENTS
Thanks to Pablo Garcıa-Fernandez, Ph.D., for his helpwith the analysis of disparity ellipsoids.
REFERENCES
Ashburner J, Friston KJ (1999): Spatial normalization. In: TogaAW, editor. Brain Warping. San Diego: Academic Press. pp27–44.
Brett M, Christoff K, Cusack R, Lancaster J (2001): Using theTalairach atlas with the MNI template. NeuroImage 13:S85.
Brett M, Johnsrude IS, Owen AM (2002): The problem of func-tional localization in the human brain. Nat Rev Neorosci 3:243–249.
Calder AJ, LAwerence AD, Young AW (2001): Neuropsychologyof fear and loathing. Nat Rev Neurosci 2:353–363.
Carmack PS, Spense J, Gunst RF, Schucany WR, Woodward WA,Haley RW (2004): Improved agreement between Talairach andMNI coordinate spaces in deep brain regions. NeuroImage 22:367–371.
Chau W, McIntosh AR (2005): The Talariach coordinate of apoint in the MNI space: How to interpret it. NeuroImage 25:408–416.
Collins DL, Neelin P, Peters TM, Evans AE (1994): Automatic 3Dintersubject registration of MR columetric data in standardizedTalairach space. J Comput Assist Tomogr 18:192–205.
Duncan J, Seitz RJ, Kolodny J, Bor D, Herzog H, Ahmed A, New-ell FN, Emslie H (2000): A neural basis for general intelligence.Science 289:457–460.
Evans AC, Collins DL, MIlls SR, Brown ED, Kelly RL, Peters TM(1993). 3D statistical neuroanatomical models from 305 MRIvolumes. In: Proceedings of IEEE-Nuclear Science Symposiumand Medical Imaging Conference. pp 1813–1817.
Fox PT (1995): Spatial normalization: Origins, objectives, applica-tions and alternatives. Hum Brain Mapp 3:161–164.
Fox PT, Mikiten S, Davis G, Lancaster JL (1994): BrainMap: A data-base of human functional brain mapping. In: Thatcher RW, Zef-firo T, Huerta M, editors. Advances in Functional Neuroimaging:Technical Foundations. Orlando: Academic Press. pp 98–106.
Fox PT, Lancaster JL (1995): Neuroscience on the net. Science 266:994–995.
Fox PT, Lancaster JL (1998): BrainMap: Electronic integration ofmind and brain. In: Gulyas B, Muller-Gartnes HW, editors.Positron Emission Tomography: A Critical Assessment of RecentTrends. Netherlands: Kluwer Academic.
Friston KJ, Ashburner J, Frith CD, Poline J-B, Heather JD, Fracko-wiak RSJ (1995): Spatial registration and normalization ofimages. Hum Brain Mapp 2:165–189.
Jenkinson M, Bannister PR, Brady JM, Smith SM (2002):Improved optimisation for the robust and accurate linearregistration and motion correction of brain images. Neuro-Image 17:825–841.
Lancaster JL, Glass TG, Lankipalli BR, Downs H, Mayberg H, FoxPT (1995): A modality-independent approach to spatial normal-ization. Hum Brain Mapp 3:209–223.
Lancaster JL, Fox PT, Downs H, Nickerson D, Hander T, El Mal-lah M, Zamarripa F (1999): Global spatial normalization of thehuman brain using convex hulls. J Nucl Med 40:942–955.
r Bias Between MNI and Talairach Coordinates r
r 1203 r

Lancaster JL, Woldorff MG, Parsons LM, Liotti M, Freitas CS,Rainey L, Kochunov PV, Nickerson D, Mikiten SA, Fox PT(2000): Automated Talairach atlas labels for functional brainmapping. Hum Brain Mapp 10:120–131.
Lancaster JL, Fox PT (2000): Talairach space as a tool for intersub-ject standardization in the brain. In: Bankman IN, editor.Handbook of Medical Imaging Processing and Analysis. SanDiego: Academic Press. pp 555–567.
Mazziotta JC, Toga AW, Evans A, Lancaster JL, Fox PT (1995): Aprobabilistic atlas of the human brain: Theory and rational forits development. NeuroImage 2:89–101.
Mazziotta J, Toga A, Evans A, Fox P, Lancaster J, Zilles K, Simp-son G, Woods R, Paus T, Pike B, Holmes C, Collins L, Thomp-son P, MacDonald D, Schormann T, Amunts K, Palomero-Gal-lagher N, Parsons L, Narr K, Kabani N, LeGoualher G,Boomsma D, Cannon T, Kawashima R, Mazoyer B (2001b): Aprobabilistic atlas and reference system for the human brain.Philos Trans R Soc Lond B Biol Sci 356:1293–1322.
Mazziotta J, Toga A, Evans A, Fox P, Lancaster J, Zilles K, Simp-son G, Woods R, Paus T, Pike B, Holmes C, Collins L, Thomp-son P, MacDonald D, Schormann T, Amunts K, Palomero-Gallagher N, Parsons L, Narr K, Kabani N, LeGoualher G,Boomsma D, Cannon T, Kawashima R, Mazoyer B. (2001a): Afour-dimensional atlas of the human brain. J Am Med InformAssoc 8:401–430.
Penrose R (1955): A generalized inverse for matrices. Proc CambPhil Soc 51:406–413.
Pujol J, Soriano-Mas C, Alonso P, Cardoner N, Menchon JM, DeusJ, Vallejo J (2004): Mapping structural brain alterations inobsessive-compulsive disorder. Arch Gen Psychiatry 61:720–730.
Roche A, Malandain G, Pennec X, Ayache N (1998): The correlationratio as a new similarity measure for multimodal image registra-tion. In: Proceedings MICCAI ’98. Lectures Notes in ComputerScience, Vol. 1496. Berlin: Springer Verlag. pp 1115–1124.
Talairach J, Tournoux P (1988): Co-planar stereotaxic atlas of thehuman brain: 3-Dimensional proportional system—An approachto cerebral imaging. New York: Thieme.
APPENDIX
Analysis of 4 !!!! 4 Affine Transform Matrices
Decomposition of 4 ! 4 affine transform matrices (M)into 12 parameters was based on the following modelequation:
where Tx, Ty, and Tz are translation parameters, Kxy, Kxz,and Kyz skew parameters, Sx, Sy, and Sz scale parameters,and a, b, and u are counter-clockwise rotations about thepositive x, y, and z axes in a right-handed coordinate sys-tem. M was expanded to determine expressions for eachterm and these expressions solved analytically to extracttransform parameters. Nine-parameter decomposition wasdone without the skew matrix. Transformed coordinates(r0) are calculated from raw coordinates (r) as r0 " M$rusing the following equation:
x0
y0
z0
1
6666664
7777775 "
M1:1 M1:2 M1:3 M1:4
M2:1 M2:2 M2:3 M2:4
M3:1 M3:2 M3:3 M3:4
0 0 0 1
6666664
7777775
x
y
z
1
6666664
7777775
An equivalent equation for calculating r0 separates the 3! 3 rotate-scale-skew terms from the 3 ! 1 translationterms
x0
y0
z0
2
64
3
75 "M1:1 M1:2 M1:3
M2:1 M2:2 M2:3
M3:1 M3:2 M3:3
2
64
3
75x
y
z
2
64
3
75#M1:4
M2:4
M3:4
2
64
3
75
Analysis of Disparity
The component-wise disparity (Dr) between estimatedMNI (r0) and TAL (r) coordinates is calculated as follows:
!r " r0 % r "MTT%1 r% I r " 'MTT%1 % I( r "MI r 'A1(
where MTT%1$r is the estimated MNI coordinate, I theidentity matrix, and MI the matrix used to calculate Drfrom r. It is helpful to express the Dr vector using theequivalent form
!r "M p# t 'A2(
where the x-y-z coordinate label p is used for clarity. Inthe case of no disparity Dr will be all zeros, and solving
M1:1 M1:2 M1:3 M1:4
M2:1 M2:2 M2:3 M2:4
M3:1 M3:2 M3:3 M3:4
0 0 0 1
6666664
7777775 "
1 0 0 Tx
0 1 0 Ty
0 0 1 Tz
0 0 0 1
6666664
7777775
1 Kxy Kxz 0
0 1 Kyz 0
0 0 1 0
0 0 0 1
6666664
7777775
Sx 0 0 0
0 Sy 0 0
0 0 Sz 0
0 0 0 1
6666664
7777775
cos'u( % sin'u( 0 0
sin'u( cos'u( 0 0
0 0 1 0
0 0 0 1
6666664
7777775
cos'b( 0 sin'b( 0
0 0 0 0
% sin'b( 0 cos'b( 0
0 0 0 1
6666664
7777775
1 0 0 0
0 cos'a( % sin'a( 0
0 sin'a( cos'a( 0
0 0 0 1
6666664
7777775
r Lancaster et al. r
r 1204 r

Eq. (A2) for p leads to the position (p0) where TAL andMNI coordinates are the same.
p0 " %M%1 t 'A3(
Equation (A3) was used to calculate coordinates of theno disparity sites illustrated in Figure 4.Analysis of the square of displacement (i.e. square of
distance) is helpful to model its spatial distribution asillustrated in Figure 4. The square of distance is calculatedas follows:
!2 " !pT!p " 'M p# t(T 'M p# t( 'A4a(
" f'M p(T # tTg f'M p( # tg 'A4b(
"'M p(T 'M p( # 2'M p(T t# tTt
since 'M p(T t " 'M p( tT 'A4c(
" pT 'MTM( p# 2'M p(T t# tTt 'A4d(
" !21 #!2
2 #!23 'A4e(
Each of the three terms in Eq. (A4e) provides a specificcomponent of distance squared (D2). The first term(D1
2), which is second order in p, leads to the ellipsoi-dal distribution of D2 in Figure 4. The second term (D2
2)
is linear in p, while the third term is constant. Furtherexamination of D1
2 helps to understand the ellipsoidalnature of the disparity seen in Figure 4. Since MTM inD21 is a symmetric square matrix it can be decomposed
using an orthogonal matrix V of Eigenvectors and a di-agonal matrix D with three Eigenvalues Di,i. The decom-position is as follows:
MTM " VDV%1 'A5(
so that
!21 " pT 'VDV%1( p 'A6a(
!21 " 'VT p(T D 'V%1 p( 'A6b(
!21 " 'V%1 p(T D 'V%1 p(
since V is an orthogonal matrix 'A6c(
!21 " p0T D p0 'A6d(
where p0 " V1 p are coordinates expressed within therotated ellipsoid’s frame, i.e. with coordinate axesaligned with the ellipsoid axes. V and D were calcu-lated using the Eigenvalue and Eigenvector proceduresprovided in Mathcad Plus 6 for MacIntosh (MathSoft,Cambridge, MA). Expanding Eq. (A6d) reveals a stand-ard-form ellipsoid equation with distance D1 calculatedas follows:
!1 " *'x0=a1;1(2+ # 'y0=a2;2(2 # 'z0=a3;3(2+1=2 'A7(
The semimajor axes of the ellipsoid are given by
ai;i " '1=Di;i(1=2 'A8(
and Di,i are the three Eigenvalues taken from the diago-nals of D.
TABLE AI. Semimajor axis dimensions (mm) of disparityellipsoids arranged by size
Transform Large Medium Small
SPM2 mni2tal ! SPM2 12.5 8.7 6.214.5 10.4 5.1
FSL mni2tal ! FSL 17.8 12.7 7.622.0 14.1 6.2
mni2tal calculations for z < 0 since null point was for z < 0.
r Bias Between MNI and Talairach Coordinates r
r 1205 r