bifacial pv system performance · bifacial pv system performance: separating fact from fiction...
TRANSCRIPT

Bifacial PV System Performance: Separating Fact from Fiction
Chris Deline, Silvana Ayala Peláez, Bill Marion, Bill Sekulic, Michael Woodhouse, and Josh Stein (Sandia National Labs)
PVSC-46, Chicago, IL 2019
NREL/PR-5K00-74090

NREL | 2NREL | 2
Bifacial PV in the news

NREL | 3NREL | 3
Status of Bifacial Installations 2019
R. Kopecek, Photonics North 2019, May 22nd Quebec

NREL | 4NREL | 4ITRPV 2018, PV Celltech Conference March 10-11th 2019 Penang Malaysia
Historic & projected PV market
Al-BSF
PERCSHJ
Different cell technology Bifacial cell in world market

NNRRELEL | | 5 Thorsten Dullweber et al. PERC+: industrial PERC solar cells with rear Al grid enabling bifaciality and reduced Al paste consumption, Prog. Photovolt: Res. Appl. (2015)
PERC cell technology – easily bifacial
Module bifaciality 𝜙𝜙 = 𝑃𝑃𝑅𝑅𝑅𝑅𝑅𝑅𝑅𝑅𝑃𝑃𝐹𝐹𝑅𝑅𝐹𝐹𝐹𝐹𝐹𝐹
= 0.65-0.80 (p-PERC)
0.75-0.90 (n-PERT)
0.85 – 0.95 (Si Heterojunction)
Reduced screen-print metallization

NREL | 6NREL | 6
PERC PERC+ n-PERT SHJ
Additional details given in: (1) M Woodhouse, B Smith, A Ramdas, and R Margolis “Economic Factors of Production Affecting Current and Future Crystalline Silicon Photovoltaic Module Manufacturing Costs and Sustainable Pricing”, In preparation. (2) A Faes, C Ballif, M Despeisse, et al, “Metallization and interconnection for high efficiency bifacial silicon heterojunction solar cells and modules”, Photovoltaics International, 3, 1—12 (2018) (3) A Louwen, W van Sark, R Schropp, and A Faaij, “A Cost Roadmap for silicon heterojunction solar cells”, Solar Energy Materials and Solar Cells, 147, 295—314 (2016)
Monofacial vs Bifacial module manuf. cost
Calculated Minimum Sustainable Price
R&D, Sales, Administrative
Module Assembly
BOM Materials
Stringing and tabbing consumables
Other Cell direct costs
Cell Metallization
April 2019 Wafer pricing
BifacialMonofacial

Bifacial PerformanceModeling
Photo credit: Prism Solar

NREL | 8
𝑮𝑮𝑻𝑻𝑻𝑻𝑻𝑻𝑻𝑻𝑻𝑻 = 𝑮𝑮𝑭𝑭𝑭𝑭𝑻𝑻𝑭𝑭𝑻𝑻 + 𝑮𝑮𝑹𝑹𝑹𝑹𝑻𝑻𝑭𝑭) × (𝒃𝒃𝒃𝒃𝒃𝒃𝑻𝑻𝒃𝒃𝒃𝒃𝑻𝑻𝑻𝑻𝒃𝒃𝑻𝑻𝒃𝒃) × (𝟏𝟏 − η𝑳𝑳𝑻𝑻𝑳𝑳𝑳𝑳
Bifacial total irradiance
Gfront
Grear * φ_𝐵𝐵𝐵𝐵𝐵𝐵𝐵𝐵
Module bifaciality φ_𝑩𝑩𝒃𝒃𝒃𝒃𝒃𝒃 =𝑃𝑃𝑃𝑃𝑝𝑝0 𝑟𝑟𝑟𝑟𝑟𝑟𝑟𝑟𝑃𝑃𝑃𝑃𝑝𝑝0 𝐵𝐵𝑟𝑟𝑓𝑓𝑓𝑓𝑓𝑓

NREL | 9
Modeling Rear Irradiance
Grear = Gdiffuse,r + Greflected,r + Gbeam,r

NREL | 10
Modeling Rear Irradiance
Grear = Gdiffuse,r + Greflected,r + Gbeam,r
NREL | 11
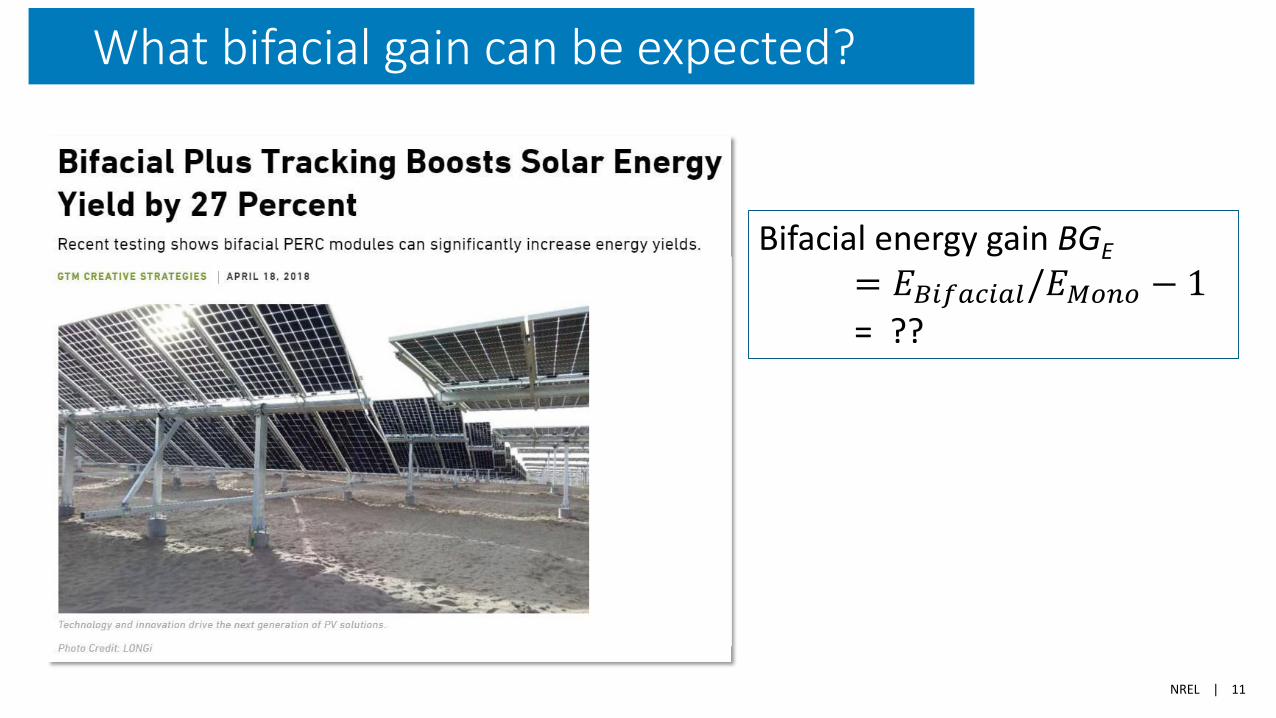
Bifacial energy gain BGE= 𝐸𝐸𝐵𝐵𝐵𝐵𝐵𝐵𝐵𝐵𝐵𝐵𝐵𝐵𝐵𝐵𝐵𝐵/𝐸𝐸𝑀𝑀𝑀𝑀𝑀𝑀𝑀𝑀 − 1= ??
What bifacial gain can be expected?

NREL | 12NREL | 12
0
100
200
300
400
500
0 0.2 0.4 0.6 0.8 1
Gre
arW
m-2
Ground reflectance (R)
Asphalt
Soil Concrete
Built-up roof
White EPDM
NASA Earth Observations, https://neo.sci.gsfc.nasa.gov/view.php?datasetId=MCD43C3_M_BSAR. Kopecek and J. Libal, Bifacial Photovoltaics: Technology, applications and economics, IET publishing, 2019
Rear irradiance, single module at STC (1kWm-2 frontside)
Surface Albedo has a big effect

NREL | 13NREL | 13
0
30
60
90
120
150
0 5 10 15 20
Gre
ar(W
m-2
)
Modules per row
Single row
Front row
Interior row
System GRear experiences self-shading
C. Deline et al., Assessment of Bifacial Photovoltaic Module Power Rating Methodologies – Inside and Out, J. Photovoltaics 7, 2017
Grear: -50%

Bifacial PerformanceModels
Photo credit: C.Deline

NREL | 15NREL | 15
Complicated geometries possible, including racking and terrain.Radiance uses backward ray-trace to evaluate the irradiance (W/m2) at the modules
Open-source software freely available at http://www.github.com/NREL/bifacial_radiance
Bifacial_Radiance Model for Rear Irradiance

S. Ayala Pelaez, C. Deline, S. MacAlpine, B. Marion, J. Stein, R. Kostuk, "Comparison of bifacial solar irradiance model predictions with field validation" IEEE Journal of Photovoltaics, 2019, vol 9 no. 1, pp. 82-88.
Field validation shows good agreement with close-mount rooftop mockup
Open-source software freely available at http://www.github.com/NREL/bifacial_radiance
0
50
100
150
200
250
300
50 150 250 350 450 550
Gre
ar[W
m-2
]
Back Sensor Position (mm)
MeasuredView FactorRadiance
h = 0.6
h = 0.15
Bifacial_Radiance Model for Rear Irradiance

NREL | 17
View Factor Model for Rear Irradiance
basicgeometry
Simple
computationallyinexpensive
Fast
BehindSAM, Pvsyst, and others
Common
PVSyst v6.75

NREL | 18
View Factor Model for Rear Irradiance
Grear is summed over 180° field-of-view:
Grear = 𝐺𝐺𝐷𝐷𝐷𝐷𝐷𝐷,𝑟𝑟𝑟𝑟𝐵𝐵𝑟𝑟 + �𝐵𝐵=1°
180°
𝑉𝑉𝑉𝑉𝐵𝐵 � 𝑉𝑉𝐵𝐵 � 𝐺𝐺𝐵𝐵 ;
B. Marion et al., A Practical Irradiance Model for Bifacial PV Modules, 2017B. Marion, Numerical method for angle-of-incidence correction factors for diffuse radiation incident photovoltaic modules, 2017
𝑉𝑉𝑉𝑉𝐵𝐵 = 12� cos 𝐵𝐵 − 1 − cos 𝐵𝐵 ;
𝑉𝑉𝐵𝐵 = 𝐼𝐼𝑓𝑓𝐼𝐼𝐵𝐵𝐼𝐼𝑟𝑟𝑓𝑓𝐼𝐼𝑟𝑟 𝑟𝑟𝑓𝑓𝑎𝑎𝑎𝑎𝑟𝑟 𝑃𝑃𝑓𝑓𝐼𝐼𝐵𝐵𝐵𝐵𝐵𝐵𝑟𝑟𝑟𝑟(ϴ)
𝐺𝐺𝐵𝐵 = 𝐼𝐼𝑟𝑟𝑟𝑟𝑟𝑟𝐼𝐼𝐵𝐵𝑟𝑟𝑓𝑓𝐼𝐼𝑟𝑟 𝐺𝐺𝑠𝑠𝑠𝑠𝑠𝑠,𝐺𝐺ℎ𝑀𝑀𝑟𝑟 , ρ·𝐺𝐺𝑔𝑔𝑟𝑟𝑀𝑀𝑔𝑔𝑀𝑀𝑔𝑔 ;
Irradiance sources: sky, ground (shaded or unshaded)

NREL | 19
N. DiOrio, C. Deline, “Bifacial simulation in SAM”, presented at 5th BifiPV in Denver, CO 2018.S. Ayala Pelaez, C. Deline, S. MacAlpine, B. Marion, J. Stein, R. Kostuk, "Comparison of bifacial solar irradiance model predictions with field validation" IEEE Journal of Photovoltaics, 2019, vol 9 no. 1, pp. 82-88.
NREL SAM Model
8
9
10
11
12
13
14
0.3 0.35 0.4 0.45 0.5
GRe
ar\
GFr
ont
[%]
Ground Coverage Ratio
1-axis tracking model comparison
PVSyst 6.75
Bifacial_Radiance
SAM0.3 albedo
SAM v2018.11

Bifacial trackers, 75 kW5 bifacial technologies

NREL | 21
20 modules (7.5 kW) / row
4 PERC, 1 SHJ Bifacial strings
3 PERC monofacial strings
Module electronics / monitoring
String kWhDC monitoring
Front, rear POA irradiance
Bifacial system configuration

NREL | 22
20 modules (7.5 kW) / row
4 PERC, 1 SHJ Bifacial strings
3 PERC monofacial strings
Module electronics / monitoring
String kWhDC monitoring
Front, rear POA irradiance
Bifacial system configuration

NREL | 23
20 modules (7.5 kW) / row
4 PERC, 1 SHJ Bifacial strings
3 PERC monofacial strings
Module electronics / monitoring
String kWhDC monitoring
Front, rear POA irradiance
Bifacial system configuration

NREL | 24
20 modules (7.5 kW) / row
4 PERC, 1 SHJ Bifacial strings
3 PERC monofacial strings
Module electronics / monitoring
String kWhDC monitoring
Front, rear POA irradiance
Bifacial system configuration

NREL | 25
20 modules (7.5 kW) / row
4 PERC, 1 SHJ Bifacial strings
3 PERC monofacial strings
Module electronics / monitoring
String kWhDC monitoring
Front, rear POA irradiance
Bifacial system configuration

NREL | 26
20 modules (7.5 kW) / row
4 PERC, 1 SHJ Bifacial strings
3 PERC monofacial strings
Module electronics / monitoring
String kWhDC monitoring
Front, rear POA irradiance
Bifacial system configuration
= Front POA
= Rear POA

NREL | 27NREL | 27
Initial field results – bifacial trackers
Bifacial gain: 5%
Bifacial gain: 15%
BGE = 𝐸𝐸𝑏𝑏𝑏𝑏𝑏𝑏𝑅𝑅𝑏𝑏𝑏𝑏𝑅𝑅𝑏𝑏𝐸𝐸𝑚𝑚𝐹𝐹𝐹𝐹𝐹𝐹
− 1

NREL | 28NREL | 28
Initial field results – bifacial trackers
Bifacial gain: 5%
Bifacial gain: 15%
BGE = 𝐸𝐸𝑏𝑏𝑏𝑏𝑏𝑏𝑅𝑅𝑏𝑏𝑏𝑏𝑅𝑅𝑏𝑏𝐸𝐸𝑚𝑚𝐹𝐹𝐹𝐹𝐹𝐹
− 1
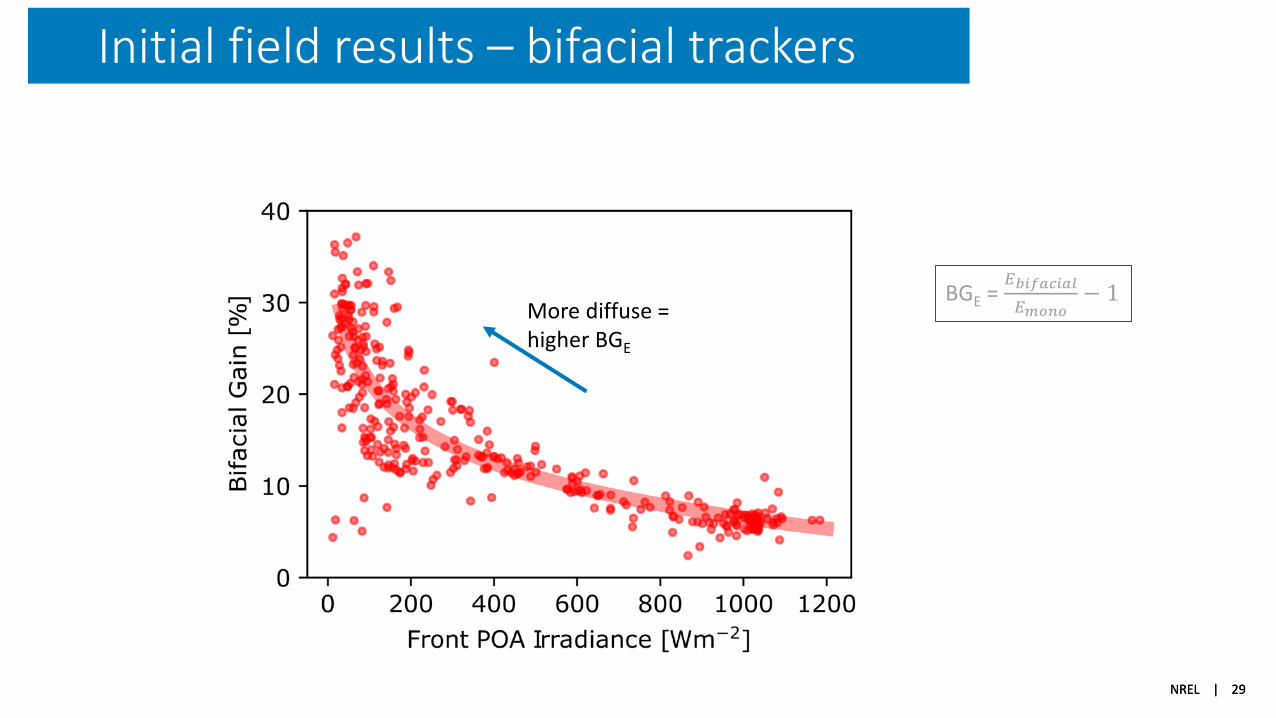
NREL | 29NREL | 29
More diffuse = higher BGE
BGE = 𝐸𝐸𝑏𝑏𝑏𝑏𝑏𝑏𝑅𝑅𝑏𝑏𝑏𝑏𝑅𝑅𝑏𝑏𝐸𝐸𝑚𝑚𝐹𝐹𝐹𝐹𝐹𝐹
− 1
Initial field results – bifacial trackers

NREL | 30NREL | 30
BGE = 𝐸𝐸𝑏𝑏𝑏𝑏𝑏𝑏𝑅𝑅𝑏𝑏𝑏𝑏𝑅𝑅𝑏𝑏𝐸𝐸𝑚𝑚𝐹𝐹𝐹𝐹𝐹𝐹
− 1
Initial field results – bifacial trackers
Annual power histogram
50% energy production

NREL | 31NREL | 31
Modeled vs Measured kWDC Power
BifacialMonofacial
*SAM v2018.11 using 15-minute measured DNI, DHI, albedo from SRRL BMS. Andreas, A.; Stoffel, T.; (1981). NREL Solar Radiation Research Laboratory (SRRL): BaselineMeasurement System (BMS); Golden, Colorado (Data); NREL Report No. DA-5500-56488. Bifacial systems assume 5% shading loss, 5% mismatch loss, 0% transmission factor

NREL | 32NREL | 32
Bifacial modeling sensitivity
6%
9%
PERC bifacial gain 4-8%
Si-HJT bifacial gain 6.5-11%
8%
4%
6.5%
11%
Field testresults to date
BGE = 𝐸𝐸𝑏𝑏𝑏𝑏𝑏𝑏𝑅𝑅𝑏𝑏𝑏𝑏𝑅𝑅𝑏𝑏𝐸𝐸𝑚𝑚𝐹𝐹𝐹𝐹𝐹𝐹
− 1
3 sensitivity cases:
Ground albedo
PERC φBifi
Si-HJT φBifi
High case 0.30 0.75 0.95Average case 0.20 0.7 0.90Low case 0.15 0.65 0.85
*SAM v2018.11 using 15-minute measured DNI, DHI, albedo from SRRL BMS. Andreas, A.; Stoffel, T.; (1981). NREL Solar Radiation Research Laboratory (SRRL): BaselineMeasurement System (BMS); Golden, Colorado (Data); NREL Report No. DA-5500-56488. Bifacial systems assume 5% shading loss, 5% mismatch loss, 0% transmission factor

Market Analysis

NREL | 34
$25
$30
$35
$40
$45
1,200 1,450 1,700 1,950 2,200 2,450
LCO
E (2
019
USD
/MW
h)
Site kWh/kW annual
Bifacial vs Monofacial LCOE at various US sites6% Nominal Discount Rate. Single Owner and Unlevered Pro Forma with 30% ITC
Monofacial LCOE Bifacial LCOESeattle, WA
Kansas City, MO
Miami, FL
Daggett, CA
$1.05/W $1.10/W
Pre-Tariff situation illustration based on R. Fu, D. Feldman, R. Margolis, M. Woodhouse, K. Ardani, “U.S. Solar Photovoltaic System Cost Benchmark: Q1 2017” NREL/TP-6A20-68925, 2017 And Solar Energy Industries Association. US Solar Market Insight: 2018 Year in Review. Washington, DC March. 2019. Assumptions: 100MW system, 1.2 DC-AC ratio, 0.35 GCR
LCOE Analysis for Monofacial and Bifacial PV Systems

NREL | 35
$25
$30
$35
$40
$45
1,200 1,450 1,700 1,950 2,200 2,450
LCO
E (2
019
USD
/MW
h)
Site kWh/kW annual
Bifacial vs Monofacial LCOE at various US sites6% Nominal Discount Rate. Single Owner and Unlevered Pro Forma with 30% ITC
Monofacial LCOE Bifacial LCOESeattle, WA
Kansas City, MO
Miami, FL
Daggett, CA
$1.05/W $1.10/W
Pre-Tariff situation illustration based on R. Fu, D. Feldman, R. Margolis, M. Woodhouse, K. Ardani, “U.S. Solar Photovoltaic System Cost Benchmark: Q1 2017” NREL/TP-6A20-68925, 2017 And Solar Energy Industries Association. US Solar Market Insight: 2018 Year in Review. Washington, DC March. 2019. Assumptions: 100MW system, 1.2 DC-AC ratio, 0.35 GCR
$30.0
$30.5
$31.0
$31.5
$32.0
$32.5
$33.0
2,180 2,200 2,220 2,240 2,260 2,280
LCO
E (2
019
USD
/MW
h)
Site kWh/kW annual
PRE-TARIFF Situation LCOE - Miami, FL
High case+8% BGE
Avg. case+6% BGE
Low case+4% BGE
+1¢/w
-1¢/wMonofacial reference$1.05/W
Bifacial PERC$1.10/W
Bifacial
LCOE Analysis for Monofacial and Bifacial PV Systems

NREL | 36
$25
$30
$35
$40
$45
1,200 1,450 1,700 1,950 2,200 2,450
LCO
E (2
019
USD
/MW
h)
Site kWh/kW annual (monofacial)
POST-TARIFF Bifacial vs Monofacial LCOE at various US sites6% Nominal Discount Rate. Single Owner and Unlevered Pro Forma with 30% ITC
Monofacial LCOE PERC Bifacial SHJ Bifacial
Seattle, WA
Kansas City, MO
Miami, FL
Daggett, CA
$1.05/W $1.05/W $1.09/W
Post-Tariff illustration: -5¢/W bifacial based on R. Fu, D. Feldman, R. Margolis, M. Woodhouse, K. Ardani, “U.S. Solar Photovoltaic System Cost Benchmark: Q1 2017” NREL/TP-6A20-68925, 2017 And Solar Energy Industries Association. US Solar Market Insight: 2018 Year in Review. Washington, DC March. 2019. Assumptions: 100MW system, 1.2 DC-AC ratio, 0.35 GCR
LCOE Analysis for Monofacial and Bifacial PV Systems
$29.5
$30.5
$31.5
$32.5
2,210 2,220 2,230 2,240 2,250 2,260 2,270 2,280 2,290
LCO
E (2
019
USD
/MW
h)
Site kWh/kW annual
POST-TARIFF LCOE - Miami, FL
Monofacial reference$1.05/W
Bifacial PERC$1.05/W
Bifacial SHJ$1.09/W

Conclusions:
• Bifacial PV is becoming mainstream with GW’s of installed projects
• Energy gain depends on the site configuration and surface albedo. Models like SAM, PVSyst and Bifacial_Radiance can assist with system design and power estimation.
• 1-axis tracker validation is underway at NREL, showing good initial match with model, and energy gain of 6% and 9% annually for PERC and Si-HJT.
• LCOE of bifacial systems is competitive with monofacial systems now, even with initial cost adder of 5-6 ¢/W. Post-tariff, bifacial is a clear winner.

June20
Sept12-17
June19
WEDNESDAY, 10:30A: (Sheraton 4-5)• B. Lee, J. Wu: Bifacial PERC cells. 11A & 11:30A
THURSDAY, 8:30A: (Chicago 8)• A. Asgharzadeh: Benchmarking models. 8:30A• M. Waters: Bifacial Capacity Testing. 8:45A• K. McIntosh: Bifacial mismatch loss 9:00ATHURSDAY 10:30A: (Sheraton 1)• M. Patel, R. Bailey: Albedo. 10:30 & 10:45A• S. Ayala: Shading effects on bifacial trackers. 11A
36th EU PVSEC (Marseille)6th Bifi PV Workshop (Amsterdam)• S. Ayala: Electrical mismatch and shading• B. Marion: Ground albedo measurements• J. Stein: HPC Optimization of Bifacial Systems
Look for more
Acknowledg-ments
This work was supported by the U.S. Department of Energy under Contract No. DE-AC36-08-GO28308 with the National Renewable Energy Laboratory (NREL). Funding provided by the U.S. Department of Energy’s Office of Energy Efficiency and Renewable Energy (EERE) under Solar Energy Technologies Office (SETO) Agreement Number 34910. The views expressed in the article do not necessarily represent the views of the DOE or the U.S. Government.

Backup Slides

NREL | 40NREL | 40
Clearance
Tilt
Albedo
Others:Spacing between cells#rows, #panelsMounting Structure Other scene elements
Irradiance ModelLocation WeatherSky Diffuse Model
Image: http://opsun.com/mounting-solutions/flat-roof/bifacial-pv-racking/
Modeling Rear Irradiance

NREL | 41
$25
$30
$35
$40
$45
1,200 1,450 1,700 1,950 2,200 2,450
Real
LCO
E (U
SD/M
Wh)
Site kWh/kW annual
Bifacial vs Monofacial LCOE at various US sites6% Nominal Discount Rate. Single Owner and Unlevered Pro Forma with 30% ITC
Monofacial LCOE Bifacial LCOESeattle, WA
Kansas City, MO
Miami, FL
Daggett, CA
$1.05/W $1.10/W
LCOE Analysis for Monofacial and Bifacial PV Systems
Illustrative example based on R. Fu, D. Feldman, R. Margolis, M. Woodhouse, K. Ardani, “U.S. Solar Photovoltaic System Cost Benchmark: Q1 2017” NREL/TP-6A20-68925, 2017And Solar Energy Industries Association. US Solar Market Insight: 2018 Year in Review. Washington, DC March. 2019. Assumptions: 100MW system, 1.2 DC-AC ratio, 0.35 GCR
$44.0
$44.5
$45.0
$45.5
$46.0
$46.5
$47.0
1,465 1,467 1,469 1,471 1,473 1,475
Nom
inal
LCO
E (U
SD/M
Wh)
Site kWh/kW annual
LCOE detail - Seattle, WA
High case+8% BGE
BifacialAvg. case+6% BGE
Low case+4% BGE
Bifacial PERC$1.10/W
Monofacialreference$1.05/W

NREL | 42
$25
$30
$35
$40
$45
1,200 1,450 1,700 1,950 2,200 2,450
LCO
E (2
019
USD
/MW
h)
Site kWh/kW annual (monofacial)
POST-TARIFF Bifacial vs Monofacial LCOE at various US sites6% Nominal Discount Rate. Single Owner and Unlevered Pro Forma with 30% ITC
Monofacial LCOE PERC Bifacial SHJ BifacialSeattle, WA
Kansas City, MO
Miami, FL
Daggett, CA
$1.05/W $1.02/W $1.06/W
Post-Tariff illustration: -8¢/W bifacial based on R. Fu, D. Feldman, R. Margolis, M. Woodhouse, K. Ardani, “U.S. Solar Photovoltaic System Cost Benchmark: Q1 2017” NREL/TP-6A20-68925, 2017 And Solar Energy Industries Association. US Solar Market Insight: 2018 Year in Review. Washington, DC March. 2019. Assumptions: 100MW system, 1.2 DC-AC ratio, 0.35 GCR
$28.0
$29.0
$30.0
$31.0
$32.0
$33.0
2,210 2,220 2,230 2,240 2,250 2,260 2,270 2,280 2,290
LCO
E (2
019
USD
/MW
h)
Site kWh/kW annual
POST-TARIFF LCOE - Miami, FL
Monofacialreference$1.05/W
Bifacial PERC$1.02/W
Bifacial SHJ$1.06/W
LCOE Analysis for Monofacial and Bifacial PV Systems