big data & analytics - innovating at the speed of light
TRANSCRIPT

© 2017, Amazon Web Services, Inc. or its Affiliates. All rights reserved.
Américo de Paula
Solutions Architecture Manager - LATAM
Big Data and Analytics:Innovating at the Speed of Light

https://www.promptcloud.com
https://john-popelaars.blogspot.comhttps://ww.signiant.com
https://www.linkedin.com/pulse/world-today-data-rich-information-poor-guru-p-mohapatra-pmp/

The Diminishing Value of Data
Recent data is highly valuable If you act on it in time
Perishable Insights (M. Gualtieri, Forrester)
Old + Recent data is more valuable If you have the means to combine them

Traditional Data Warehousing
Wikipedia: In computing, a data warehouse (DW or DWH), also known as an enterprise data warehouse (EDW), is a system used for reporting and data analysis, and is considered a core component of business intelligence.[1] DWs are central repositories of integrated data from one or more disparate sources. They store current and historical data and are used for creating analytical reports for knowledge workers throughout the enterprise. Examples of reports could range from annual and quarterly comparisons and trends to detailed daily sales analysis.

Velocity Volume
Variety
Change in nature of data

© 2017, Amazon Web Services, Inc. or its Affiliates. All rights reserved.

Big Data
When your data sets become so large and complex
you have to start innovating around how to
collect, store, process, analyze, and share them.
Analytics and Big Data
Technologies and techniques for
working productively with massive
amounts of data at any scale in
either batch or real-time.
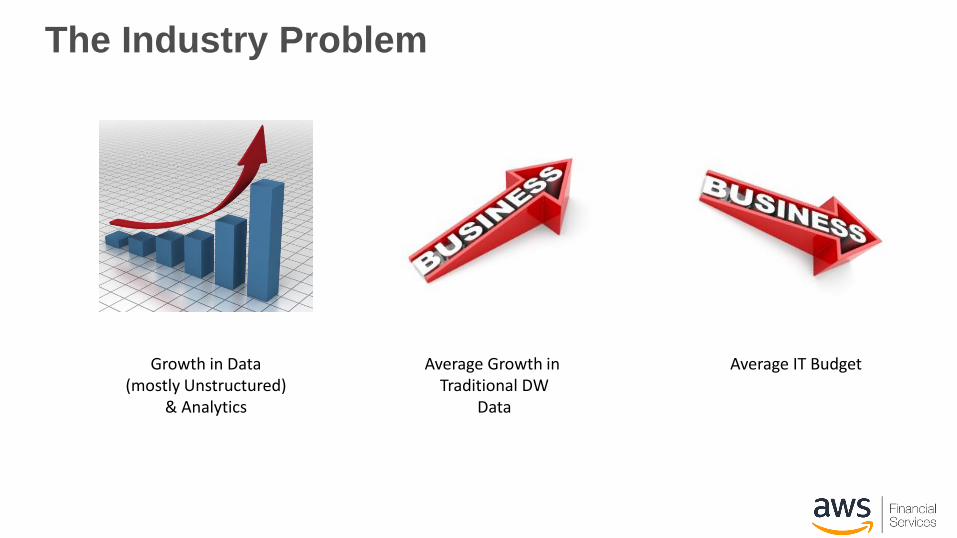
The Industry Problem
Growth in Data (mostly Unstructured)
& Analytics
Average Growth in Traditional DW
Data
Average IT Budget

The Battle
VS.
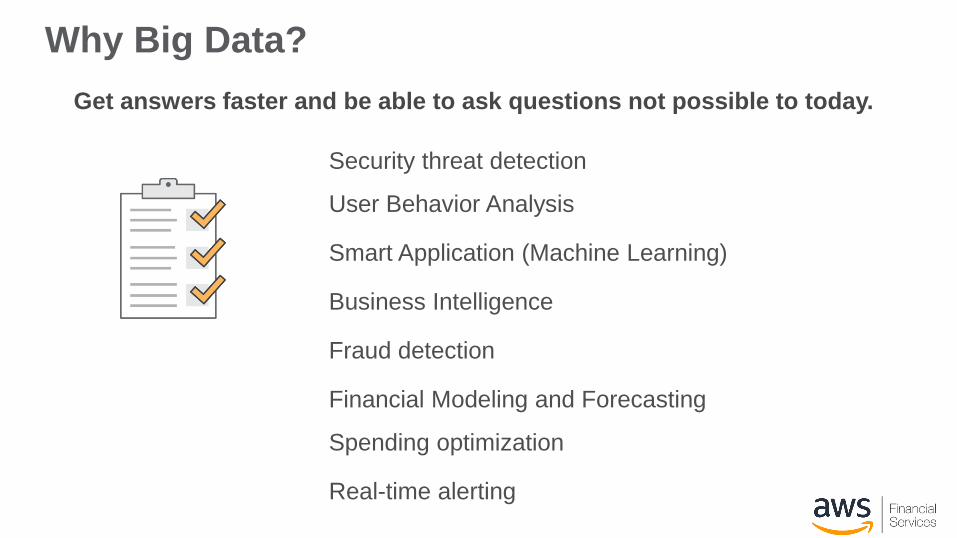
Why Big Data?
Security threat detection
User Behavior Analysis
Smart Application (Machine Learning)
Business Intelligence
Fraud detection
Financial Modeling and Forecasting
Spending optimization
Real-time alerting
Get answers faster and be able to ask questions not possible to today.

The Cloud Was Built for Big Data

Big Data was Meant for the Cloud
Big Data Cloud Computing
Variety, volume, and velocity requiring new tools Variety of compute, storage, and networking options
Potentially massive datasets
Massive, virtually unlimited capacity
Iterative, experimental style of data
manipulation and analysis
Iterative, experimental style of IT infrastructure
deployment and usage
At its most efficient with highly variable
workloads
Frequently non-steady-state workloads
with peaks and valleys
Absolute performance not as critical as “time to
results”; shared resources are a bottleneck
Parallel compute projects allow each workgroup to
have more autonomy and get faster results

Elastic and highly scalable
No upfront capital expense
Only pay for what you use+
+
Available on-demand+
= the Cloud removes constraints

The AWS Approach
• Flexible - Use the best tool for the job
• Data structure, latency, throughput, access patterns
• Low Cost - Big data ≠ big cost
• Scalable – Data should be immutable (append-only)
• Batch/speed/serving layer
• Minimize Admin Overhead - Leverage AWS managed services
• No or very low admin
• Be Agile – Fail fast, test more, optimize Big Data at a lower cost

Starting small is powerful,
when you can scale up fast
Scaling up your analytics systems With AWS Traditional IT *
Get a new BI server 20 minutes Weeks to Months
Upgrade your analytics server to the newest
Intel processors and add 16GB memory
15 minutes Weeks
Add 500TB of storage Instant Weeks to Months
Grow a DWH cluster from 8GB to 1PB 1 hour Several Months
Build a 1024-node Hadoop cluster 30 minutes Unlikely
Roll out multi-region production environment Hours Months
* actual provisioning times in a well-organized IT division

AWS Big Data Platform
EMR EC2
Glacier
S3
Import Export
Kinesis
Direct Connect
Machine LearningRedshift
DynamoDB
AWS Database
Migration Service
Collect Orchestrate Store Analyze
AWS Lambda
AWS IoT
AWS Data Pipeline
Amazon Kinesis
Analytics
Amazon
SNS
AWS Snowball
Amazon
SWF
Amazon Athena
Amazon
QuickSight
Amazon AuroraAWS Glue

Optimal Combinations of Interoperable Services
Amazon Redshift Amazon Elastic
MapReduce
Data Warehouse Semi-structured
Amazon
Glacier
Amazon Simple
Storage Service
Data Storage Archive
Amazon
DynamoDB
Amazon
Machine
Learning
Amazon Kinesis
NoSQL Predictive Models Other AppsStreaming

Sample Reference Architecture: Data Lake
Kinesis FirehoseAthena
Query Service
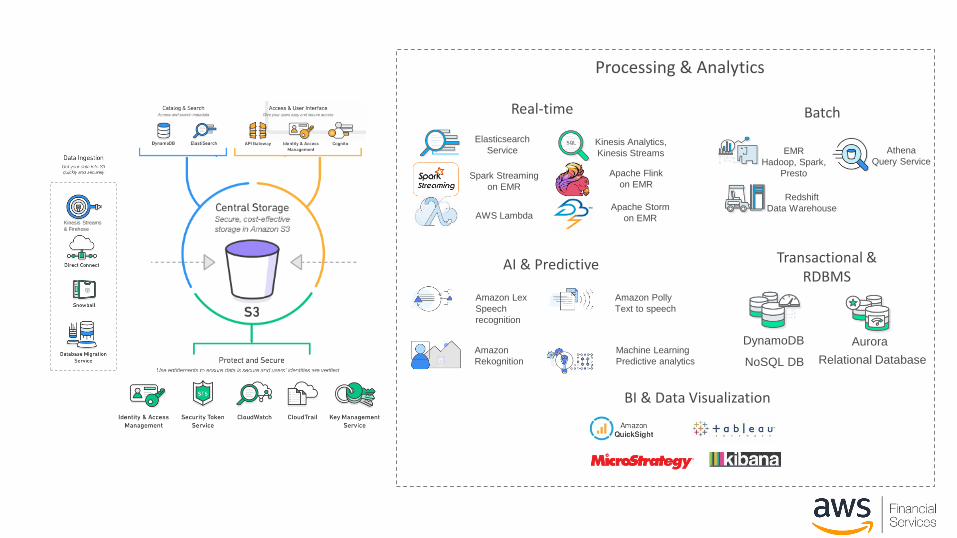
Processing & Analytics
Real-time Batch
AI & Predictive
BI & Data Visualization
Transactional & RDBMS
AWS LambdaApache Storm
on EMR
Apache Flink
on EMRSpark Streaming
on EMR
Elasticsearch
ServiceKinesis Analytics,
Kinesis Streams
DynamoDB
NoSQL DB Relational Database
Aurora
EMR
Hadoop, Spark,
Presto
Redshift
Data Warehouse
Athena
Query Service
Amazon Lex
Speech
recognition
Amazon
Rekognition
Amazon Polly
Text to speech
Machine Learning
Predictive analytics
Kinesis Streams
& Firehose

Data Lakes wi th new tools
Relational and non-relational data
TBs-EBs scale
Schema defined during analysis
Diverse analytical engines to gain insights
Designed for low-cost storage and analytics
OLTP ERP CRM LOB
Data Warehouse
Business
Intelligence
Data Lake
100110000100101011100
101010111001010100001
011111011010
0011110010110010110
0100011000010
Devices Web Sensor
s
Social
Catalog
Machine
Learning
DW
Queries
Big data
processingInteractive Real-time

Who consumes Analytics
Business Users
For making strategic decisions
e.g. reports like YoY growth of
sales
Data Scientists
To identify models for futuristic
analytics of data
e.g. typically long running ad-
hoc queries on data
Developers
To clean and process application
data using Big Data Jobs
e.g. Processing incoming click
stream data
ConsumersReal time actions and
intelligence on
consumption. Ex. Spend
patterns in banks or
telecom
New

1.2TB/Day logs
30TB /Day data
250 Hadoop Jobs75Billion transactions/Day
5 Petabytes of Data
A few AWS customer on Big Data / Data Lakes
25 PB Data Warehouse
on Amazon S3
> 1PB read each day

Netflix Uses S3 to Back its Various Clusters
S3

Why Amazon S3 for Big Data?
• Scalable
• Virtually Unlimited number of objects
• Very high bandwidth – no aggregate throughput limit
• Cost-Effective:
• No need to run compute clusters for storage (unlike HDFS)
• Can run transient Hadoop clusters & Amazon EC2 Spot Instances
• Tiered storage(Standard, IA, Amazon Glacier) via life-cycle policy
•Flexible Access
• Direct access by big data frameworks (Spark, Hive, Presto)
• Shared access: Multiple (Spark, Hive, Presto) clusters can use the same data

NASDAQ LISTS3 , 6 0 0 G L O B A L C O M P A N I E S
IN MARKET CAP REPRESENTING
WORTH $9.6TRILLION
DIVERSE INDUSTRIES AND
MANY OF THE WORLD’SMOST WELL-KNOWN AND
INNOVATIVE BRANDSMORE THAN U.S.1 TRILLIONNATIONAL VALUE IS TIEDTO OUR LIBRARY OF MORE THAN
41,000 GLOBAL INDEXES
N A S D A Q T E C H N O L O G Y
IS USED TO POWER MORE THAN
IN 50 COUNTRIES100 MARKETPLACES
OUR GLOBAL PLATFORM
C A N HA N D L E M O R E T HA N
1 MILLIONMESSAGES/SECONDAT SUB-40 MICROSECONDS
A V E R A G E S P E E D S
1 C L E A R I N G H O U S E
WE OWN AND OPERATE
26 MARKETS
5 CENTRAL SECURITIES
DEPOSITORIES
INCLUDING
A C R O S S A S S E T C L A S S E S
& GEOGRAPHIES

• Nasdaq implements an S3 data lake + Redshift data warehouse
architecture
• Most recent two years of data is kept in the Redshift data warehouse
and snapshotted into S3 for disaster recovery
• Data between two and five years old is kept in S3
• Presto on EMR is used to ad-hoc query data in S3
• Transitioned from an on-premises data warehouse to Amazon Redshift &
S3 data lake architecture
• Over 1,000 tables migrated
• Average daily ingest of over 7B rows
• Migrated off legacy DW to AWS (start to finish) in 7 man-months
• AWS costs were 43% of legacy budget for the same data set (~1100
tables)

Our vision is to be earth’s most customer-centric company; to build a place where people can come to find and discover anything they might want to buy online.
Amazon

© 2017, Amazon Web Services, Inc. or its Affiliates. All rights reserved.

© 2017, Amazon Web Services, Inc. or its Affiliates. All rights reserved.

Amazon Data Warehouse

© 2017, Amazon Web Services, Inc. or its Affiliates. All rights reserved.
Helps to Run the Amazon Business
• Most Comprehensive Set of Cleansed and Curated Business Data
• Feeds Many Downstream Systems and Processes
• Batch Processing, Reporting and Ad Hoc
• 500k+ Data Loads/Transformations Each Day
• 200k+ Queries/Extracts Each Day
• 20k+ Active Tables
• 10B++ Rows Loaded Daily
Our Data is Big!
• Core Data Set: 5+PB of Compressed Data (primarily limited by Legacy Technology)
• Total Storage (Multiple Systems): 35+ PB compressed
• Quote from Executive at Legacy DW Vendor:
• ~1000x Larger than any other DW Customer (from that Vendor)
Significant and Increasing Use of Redshift and EMR
• 1000’s of Redshift and EMR Systems, Range in size from:
• Individual Contributor - Project Based, to
• Running Multi-Billion Dollar Business inside Amazon
The Amazon Enterprise Data Warehouse
The Good!

© 2017, Amazon Web Services, Inc. or its Affiliates. All rights reserved.
• Who are we?
• Analytics on the “Marketplace”
• Analytics Spokes: Pricing, B2B, Seller Support, Lending …
• Business Scale:• 235MM monthly CPU Minutes on Legacy ODW • 2K upstream tables• Users:
• Supports 170 teams• 1000 users with 9527 profiles (Parameterized Queries)• 20K unique job runs per month• 2800 (800 TB) datasets• BI Tool Users:
• 3000+ Users, 650 non-tech• 600+ ”Dashboards”• 100k’s of queries each month
Example of an Amazon DW “Customer” Team

© 2017, Amazon Web Services, Inc. or its Affiliates. All rights reserved.“Swiss Army” by by Jim Pennucci. No alterations other than cropping. https://www.flickr.com/photos/pennuja/5363518281/Image used with permissions under Creative Commons license 2.0, Attribution Generic License
(https://creativecommons.org/licenses/by/2.0/)

© 2017, Amazon Web Services, Inc. or its Affiliates. All rights reserved.
To Provide an analytic ecosystem that Scales with the Amazon Business
To Leverage AWS Technologies and to help Improve these technologies for all Amazon Customers
To Provide Choice and Options in New Analytic Technologies
• Provide an SQL based solution
• Increasingly Focus on Enabling new analytic approaches including Machine Learning and Programmatic Data Analysis
• Enable both “Bring Your Own Cluster” and “Bring your Own Query” Approaches
What is the Goal?

© 2017, Amazon Web Services, Inc. or its Affiliates. All rights reserved.“Tools #2” by Juan Pablo Olmo. No alterations other than cropping. https://www.flickr.com/photos/juanpol/1562101472/
Image used with permissions under Creative Commons license 2.0, Attribution Generic License (https://creativecommons.org/licenses/by/2.0/)

© 2017, Amazon Web Services, Inc. or its Affiliates. All rights reserved.
Amazon EMR
(running Hive, Pig,
Spark, Presto, etc…)
Amazon DynamoDBAmazon
Machine LearningAmazon QuickSight
Amazon RDS
Amazon Elasticsearch
Service
Amazon Redshift Amazon Athena
Amazon SQS
Amazon Kinesis
Analytics
Amazon Kinesis
Firehose
Amazon S3
Amazon Kinesis
Open-source tools
(e.g. for ML, data science)
Commercial tools

Moving Forward - AWS
Amazon
Redshift
S3 / EDX - Separate
Storage from Compute by
leveraging a parallel file
system as a global data
exchange
• Redshift - Preferred
platform SQL based
Analysis and traditional
Data Warehouse Data
• Focus is “Business Users”
• EMR – Scalable “Do
Everything” Platform - Enable
Teams who have chosen EMR
by providing Curated Data
• Focus is “Programattic Access”

© 2017, Amazon Web Services, Inc. or its Affiliates. All rights reserved.
The Amazon “Data Lake” – Project Name “Andes”
The Goal: ”THE” Place for Data at Amazon• Source teams (Data Producers) put their Public Data there to give access to Analytic
teams (Data Consumers) and to share private data within their team• EMR Can Directly Access the Data in Parallel from Andes• Redshift can load the data in Parallel from Andes, or it Can Directly Access the Data in
Parallel with Spectrum

© 2017, Amazon Web Services, Inc. or its Affiliates. All rights reserved.
“Datamarts”
Number of Teams using the DW: ~2300
Number of Tables Used per Team:• Max: 598
• Min 1
• Average: 49
Ad-Hoc (any data any time) can be achieved via
EMR can access the Data in Andes Directly
Redshift can load data into the Redshift file system, or it can use the Spectrum Feature to directly access the Data in Andes
An Architecture that Scales with the Business
Amazon Internal Team (132 Tables)

© 2017, Amazon Web Services, Inc. or its Affiliates. All rights reserved.
Putting The Pieces Together
The Analytic Architecture of the Future
Source Systems
The Data Lake“Andes”
Big Data SystemsData Warehouses
“Bring Your Own Cluster” and “Bring Your Own Query”
Services and Users
Postgre SQL
instance
Amazon
Redshift
Amazon
Redshift
Amazon
Redshift
Amazon
Kinesis
AWS GlueAmazon
QuickSight
Amazon
Athena
Amazon Machine
Learning

© 2017, Amazon Web Services, Inc. or its Affiliates. All rights reserved.
The Battle for the Future
The Data Lake becomes the
common source for all data:
The DW becomes the
compute engine for
traditional structured data
(Redshift)
EMR becomes the compute
engine for programmatic
access, like machine
learning and many emerging
use cases
Both become a form of a
Dependent data mart with
the data coming from the
Data Lake
Vs. AND

© 2017, Amazon Web Services, Inc. or its Affiliates. All rights reserved. 44

© 2017, Amazon Web Services, Inc. or its Affiliates. All rights reserved.
Purchase Contract
seller buyer
45

© 2017, Amazon Web Services, Inc. or its Affiliates. All rights reserved.
TableSubscriptions- TheVision

© 2017, Amazon Web Services, Inc. or its Affiliates. All rights reserved.
Subscription
“Big Data Technologies” Team
producer consumer
47

© 2017, Amazon Web Services, Inc. or its Affiliates. All rights reserved. 48

© 2017, Amazon Web Services, Inc. or its Affiliates. All rights reserved.
Andes – Current State
• We have the data!
• 20k+ Tables maintained in Andes – All Active Tables have
been Sourced from the Enterprise Data Warehouse
• Many teams are adding new data sets!
• Have Onboarded 900+ Redshift and EMR systems to Subscriptions
• 20,000+ tables being synchronized
• Usage off the Legacy DW
• Three years (2014-2016) to grow from 0 to 100k Jobs each
Day
• In 2017, has grown from 100k to 300k Jobs each Day Amazon.com
Big Data
Technologies

FINRA’s Managed Data Lake

“For our market
surveillance systems, we
are looking at about 40%
[savings with AWS], but
the real benefits are the
business benefits: We
can do things that we
physically weren’t able to
do before, and that is
priceless.”
- Steve Randich, CIO
Case Study: Re-architecting Compliance
What FINRA needed
• Infrastructure for its market surveillance platform
• Support of analysis and storage of approximately 75
billion market events every day
Why they chose AWS
• Fulfillment of FINRA’s security requirements
• Ability to create a flexible platform using dynamic
clusters (Hadoop, Hive, and HBase), Amazon EMR,
and Amazon S3
Benefits realized
• Increased agility, speed, and cost savings
• Estimated savings of $10-20m annually by using AWS

Fraud Detection
FINRA uses Amazon EMR and Amazon S3 to process up to 75 billion trading events per day and securely store over 5 petabytes of data, attaining savings of $10-20mm per year.


Validation
Prepare for Analytics
(ETL)
Run Automated Detection
Models
Interactive Analytics
RegulatoryAnalyst
ExploreInvestigate
RegulatoryFollow-up
BDs Exchanges Reference
Data Providers
Trade Execution RecordsMarket Reference Data
DataScientist
Develop Models
M a r k e t R e g u l a t i o n — A n a l y t i c s P i p e l i n e

Keeping track of 40M+ tables can be a challenge…
What data do we have?
Where is the data used?
What is the source of this data?
How many versions of this data exist?
What is the retention policy?

Data availability and analytics is complex
Business
Analysts
Data
Scientists Data
Analysts
Data
Engineers
What data do we have?
What format is it in?
Where to I get it?
Get this data for them…
Not on disk—pull from tape
Prepare & Format
Oops, I need more data … Repeat!
I need data in different format …
Repeat!
etc…, etc…

Infrastructure can be limiting & costly
Does not scale well as volumes and workloads
increase
Duplication of effort in data management (data
lifecycle, retention, versioning)
Data sync issues—manual effort to keep data in
sync
Challenges to run analytics across fragmented
data
Costly system maintenance and upgrades

K e y p r i n c i p l e s o f o u r b i g d a t a a r c h i t e c t u r e
• Separate storage and compute
• Register and track all data in our data catalog
• Keep all versions of each data set
• Protect the data—encrypt at rest and in transit
• Partition data for extra performance
• Backup to another region for business continuity
• Optimize storage and processing costs

Catalog for centralized data management
finraos.github.io/herd
Unified catalog
• Schemas
• Versions
• Encryption type
• Storage policies
Lineage and Usage
• Track publishers and consumers
• Easily identify jobs and derived data sets
Shared Metastore
• Common definition of tables and partitions
• Use with Spark, Presto, Hive, and so on
• Faster instantiation of clusters

FINRA’s AWS Architecture
3
INTAKE MANAGEMENT ANALYTICS
Validation
Normalization
Linkage
Amazon GlacierAmazon S3
Machine Learning
Amazon EMR
Amazon Redshift
text text
API API
Structured &
Unstructured Data
Millions of documents
25K data checks daily
Normalization
33,000 Servers Daily
Centralized Data
Normalized Data
Integrated Data
Discoverable
Direct Data Query
ML/AI Platforms
Applications/ Visualizations
Exchange Data 12 Equities Markets 4 Options Markets
SIP Data SIP trades SIP NBBO OPRA
Broker Dealer data 4000 plus firms
Third Party Data Bloomberg Thomson Reuters DTCC OCC
Machine Learning
Amazon EMR
Amazon Redshift
Amazon GlacierAmazon S3
KMS
IAM
RDS

Leverage the Data: Apps, Query, Machine Learning
Data Lake
Audit TrailMarket
SurveillanceAd-Hoc
Lifecycle
Viewer
App: Powerful UI;
billions of rows of
market tx data
Pattern detection
models and
execution
Investigation
and data profiling
through SQL
Retrieve market
events to render
order lifecycle
Data Science
Best of breed
tools, machine
learning

Enabling Data Science
Data
Scientist
Ad-hoc
Logical ‘Database’
EMR Cluster
Still one copy
of data!
Spark Cluster
DS-in-a-box
AuthN
Data
ScientistNotebook
Data
Scientist
Catalog
IDE

Universal Data Science Platform (UDSP)
• Environment (EC2) for each
Data Scientist
• Simple provisioning interface
• Right instance (memory or
GPU) for job
• Access to all the data in
Data Lake
• Shut off when not using for
savings
• Secure (LDAP AuthN/Z +
Encryption)
Data
Scientist

UDSP – Inventory – not just R
• R 3.2.5, Python (2.7.12 and 3.4.3)
• Packages
• R: 300+ Python: 100+
• Tools for Building Packages
• gcc, gfortran, make, java, maven, ant…
• IDEs
• Jupyter, RStudio Server
• Deep Learning
• CUDA, CuDNN (if GPU present)
• Theano, Caffe, Torch
• TensorFlow
16

F I N R A U s a g e S t a t i s t i c s o n AW S
33k+ Amazon EC2 nodes
per day
93%+ of EC2 usage is EMR
based (mostly SPOT)
20Pb+ storage (Amazon
S3, Amazon Glacier)
13
0
5000
10000
15000
20000
25000
30000
35000
40000
45000
40289 4177040512
3658933275
16023
8710
2145 23232542
2363
2363
1686
1590
231 231 2…
231
231
231
231
Hadoop/Spark Web, App & RDS Redshift
Node Distribution for May 6-12 (~33k/day)

Achieve Dynamic processing
0.0
0.5
1.0
1.5
2.0
2.5
3.0
3.5
4.0
4.5
5.0
11/1 11/8 11/15 11/22 11/29
Daily Order Volume (Billions)
0
2000
4000
6000
8000
10000
12000
Co
mp
ute
No
des
Hour of Day
AWS EMR compute on EC2
EMR
20k – 25k EC2 nodes per day 93% of EC2 is on EMR
Avg EC2 node: 3 cores
Avg EC2 uptime: 3 hours
96% of EC2 nodes live < 24 hrsOver 50k nodes on peak day

Query Table size
(rows)
Output
size (rows)
ORC TXT/BZ2
select count(*) from TABLE_1where trade_date = cast(‘2016-08-09’ as date)
2469171608 1 4s 1m56s
select col1, count(*) from TABLE_1 where col2 = cast('2016-08-09' as date) group by col1 order by col1
2469171608 12 3s 1m51s
select col1, count(*) from TABLE_1 where col2 = cast('2016-08-09' as date) group by col1 order by col1
2469171608 8364 5s 2m5s
select * from TABLE_1 where col2 = cast('2016-08-10' as
date) and col3='I' and col4='CR' and col5 between 100000.0 and 103000.0
2469171608 760 10s 2m3s
Test Config:
Presto 0.167.0.6t (Teradata) On EMR
Data on S3 (external tables)
Cluster size: 60 worker node x r4.4xlarge
Key points:
Use ORC (Or Parquet) for performant query
© 2017, Amazon Web Services, Inc. or its Affiliates. All rights reserved.
A c h i e v i n g I n t e r a c t i v e Q u e r y S p e e d

Benefits We’ve Seen
Analysts can now interactively
analyze 1000x more market
events (billons vs million
rows)
Querying order route detail
went from 10s of minutes to
seconds
Quicker turnaround to provide
data for
Machine Learning model
development is easier
Analytics ResiliencyAgility
Easily reprocess data …
used to take weeks to find
capacity now can be done in
day/days
Cloud makes it very easy to
share (even large) data sets
with third parties in Cloud
Can perform model (pattern)
reruns in days not weeks
Market volume changes no
longer disruptive events
Improved system uptime vs
in-house
At TCO 30% less expensive than with our data center

Analytics
Analytics On 450k
Subscribers Using Amazon
Redshift
Ad Campaign Effectiveness
Analysis Platform
Financial Simulations
Platform
Trading History
Clickstream Data
From 300 Websites
DNA Sequencing

Américo de PaulaSolutions Architecture Manager
Worldwide | N. America | LATAM | UK/IR | EMEA | APAC | Japan | China