big data in the big apple -...
TRANSCRIPT

BIG DATA IN THE BIG APPLEThe lessons London can learn from New York’s data-driven approach to smart cities
Eddie Copeland
Foreword by Mike Flowers

Acknowledgements
The author would like to thank Unit Partner, Fujitsu, for their support and advice on this piece of research.
Particular thanks are due to Mike Flowers, Chief Analytics Officer for Enigma Technologies (http://enigma.io/about/) and founding director of the New York City Mayor’s Office of Data Analytics, for the support, ideas, materials and insight he provided for this report. The remarkable model described in the following pages is his. Special acknowledgement is also due to Chris Corcoran, former Deputy Analytics Officer with MODA, whose materials underpin much of the detail in this study.
The author is also grateful to the following people (and those who prefer to remain anonymous) who kindly gave up their time to answer questions and share their perspectives:
Clark Vasey – Fujitsu; Andrew Collinge, Paul Hodgson, Sara Kelly and Jamie Ratcliffe – Greater London Authority; Nicholas O’Brien – New York City Mayor’s Office of Data Analytics; Dick Sorabji – London Councils; William Barker – Department for Communities and Local Government; Ben Hawes – Department for Business, Innovation and Skills; Chris Yiu – Scottish Council for Voluntary Organisations; Dr Andrew Hudson-Smith, Centre for Advanced Spatial Analytics UCL; Simon Reed – Transport for London; Christopher Gray – Accenture; Geoff Marshall – Londonist; Cameron Scott – Policy Exchange; Jamie Turner.
The conclusions of this report, along with any errors and omissions, remain the author’s alone.
About the author
Eddie Copeland (@EddieACopeland) – Head of Technology PolicyEddie is responsible for leading research and creating policy recommendations on how technology can deliver an innovative digital economy, a smarter public sector and a more connected society. Previously he has worked as Parliamentary Researcher to Sir Alan Haselhurst, MP; Congressional intern to Congressman Tom Petri and the Office of the Parliamentarians; Project Manager of global IT infrastructure projects at Accenture and Shell; Development Director of The Perse School, Cambridge; and founder of web start-up, Orier Digital. He blogs regularly about technology policy issues at: policybytes.org.uk.

1Contents
Contents
Foreword 2
Introduction: The data-driven city 4
1 A lesson from Iraq 7
2 The Mayor’s Office of Data Analytics 11
3 The New York method 18
4 New York’s lessons for London 26
5 Why London needs a Mayor’s Office of Data Analytics 29
6 How to create a London Mayor’s Office of Data Analytics 41
Final thoughts 46
Appendix 47
Endnotes 49

2 Big data in the big apple
Foreword
Do what you can, With what you have, Where you areTeddy Roosevelt
In 2009 I was given a straightforward mission by New York City Mayor Michael Bloomberg: use data to improve government services to the 8.5 million New Yorkers. His follow up guidance was to do it inexpensively, with minimal staff, and make it impactful and sustainable. The caption at the top, scribbled on a post-it note on my government-issue computer monitor on my first day – pretty much sums up the direction I was given, and it was enough.
Cities are flooded with data, but data by itself is of little value (a spreadsheet of traffic data does nothing to tackle congestion). To have impact it needs to be joined up. It requires people with the time, skills and resources to interpret and seek insights from it. Above all, data must drive action on outcomes that really matter to citizens. That is why being data-driven is not primarily a challenge of technology; it is a challenge of direction and organizational leadership.
New York City found such leadership in Mayor Bloomberg. With the Mayor’s backing we used data to improve critical services, empower front line workers, and save not just money but lives. That work culminated in the creation of the Mayor’s Office of Data Analytics (MODA) – the subject of this report. Almost six years on, and under a new mayor with a very different set of priorities, MODA – and data driven government in New York – is still going strong. It has become a central part of City Hall’s approach to government: enhancing areas as diverse as service delivery, emergency response times, economic development, tax enforcement and education. In fact, it can be applied to help meet whatever challenges matter most to a city.
The only city that rivals my affection for New York is London. Indeed, my wife and I are so fond of it that we named our first born after the Tate Museum! I know the British capital shares many of the same strengths and challenges of New York City. I know that it too wrestles with the same imperative to deliver more with less and to coordinate services across boroughs, departments and agencies. While I believe every city would benefit from putting its data to work, I believe London is a natural place for its own Mayor’s Office of Data Analytics.
I have shared the many lessons we learned in New York City to help inform this report. Eddie Copeland and the Capital City Foundation have provided a deep dive into exactly how the MODA model works and – most importantly – how it could be adapted for the specific context of London.
This is not just an idea for civic technologists or CIOs. It provides a playbook for how great cities like New York and London can – indeed must – be run in order to thrive and grow. Its success critically depends on the commitment

3Foreword
of city leaders to data-driven principles – starting with the Mayor, but extending to every public official, civil servant and resident.
People have the right to expect and demand effective, transparent government. We’ve shown that, using data, it is doable. The next step is for leadership to decide to do it, and then just do it.
Mike Flowers Chief Analytics Officer, Enigma Technologies Founding Director, New York City Mayor’s Office of Data Analytics
June 2015
Big data in the big apple4 Big data in the big apple
Introduction The data-driven city
‘If you can’t measure it, you can’t manage it’Michael Bloomberg
The age of the building. The origin of the complaint. The value and size of the property. Whether the building has a history of unpaid tax or mortgage liens. Whether the Department of Buildings has received prior complaints about the property.
Taken together – with some clever maths applied – these are the predictive indicators for identifying some of the most dangerous buildings in New York City.
Having made his fortune providing data-driven analytics for the financial sector, as the 108th Mayor of New York (2002–2014), Michael Bloomberg wanted to prove that the same techniques could benefit cities, too. One of his most significant measures to that end was to create the Mayor’s Office of Data Analytics (MODA). MODA is a small team of analysts, based in City Hall, who can combine and interrogate data from numerous different sources to increase the efficiency and effectiveness of government operations and services.*
MODA’s work on illegal conversions is illustrative of the impact it has had. New York City’s Department of Buildings (DOB) responds to more than 18,000 complaints of unlawful apartment conversions every year.1 These are buildings that have been illegally subdivided by rogue landlords. They are over-crowded. They are health hazards and fire hazards. People get ill in them. Sometimes they even die in them. In 2011, two such buildings were the scenes of devastating fires in which five people, including young children, were killed.2
It used to be that suspected cases of illegal conversions were investigated in the same order as complaints came in via 311, the hotline number, website and app that New Yorkers use to find information and report problems.3 Out of all the complaints received, approximately 8% (1,400 per year) accurately identify an illegal apartment where conditions are so dangerous that the Department of Buildings has to issue a vacate order.** DOB asked MODA to create a model that could analyse the complaints received via 311 and flag those most likely to identify these highest risk properties, so they could be inspected within 48 hours.4 By analysing different datasets, MODA managed to identify predictive indictors of the most dangerous
* See Appendix for the Executive Order that established the Mayor’s Office of Data Analytics
** The reason for the seemingly low accuracy of complaints is that neighbours tend to report suspected dangerous buildings based on external evidence, such as seeing large amounts of rubbish or builders working without any obvious permit. This comes in contrast to complaints about a broken streetlight, which tend to be very accurate as it is clear to see whether or not a light is working

5Introduction
buildings (listed at the start of this chapter). They were then able to create a risk-pre-diction model that enables DOB inspectors to find over 70% of the worst buildings by targeting just 30% of them.5 A 233% improvement that saves not just money but lives.
Lessons for London?The example of the Mayor’s Office of Data Analytics has been highlighted in several reports and articles by Policy Exchange.6 However, these have outlined the model only in very high-level terms. The purpose of the present report is to provide a deep-dive into New York’s pioneering data methods and to put forward the case that a similar approach could benefit London, too.
The two cities do, after all, have much in common. They have comparable populations with around eight and a half million residents apiece. Both are leading financial centres and home to the headquarters of many of the world’s largest enterprises. Both draw millions of visitors from around the world to experience their cultural, artistic and theatrical delights. Both are test beds for new political thinking and pioneering urban initiatives (think of New York City’s ‘broken windows’ approach to policing or London’s Oyster Cards and Congestion Charge).7, 8, 9 They appear to be the very embodiment of Harvard Professor Edward Glaeser’s Triumph of The City.10
In spite – or perhaps rather because – of their success, London and New York also face a number of similar policy challenges. With their expanding populations comes greater pressure on housing, transport infrastructure and public services. And while their respective economies have boomed, the two metropolises have seen significant reductions in the budgets available to their city authorities.11 The result on both sides of the Atlantic has been a pressing need to do much more with much less.
Yet for all their similarities, applying the MODA model to the British capital will not be a simple case of copy and paste. In very significant ways, London is not New York. The mayoralty of the Big Apple is one of the most powerful such positions in the world, with control over hiring and firing the heads of the city’s key agencies (such as police and schools), while also setting an annual budget in excess of £45 billion. In comparison, London’s mayor has relatively few executive powers and a budget of £14 billion.12 London has 33 boroughs to New York City’s five, and the former are more autonomous. Fewer direct personal and business taxes are collected and retained locally in the UK (London raises just 26% of what it spends compared with 69% in New York).13 Different rules and regulations on data sharing and data protection apply. The list goes on.
Therefore, rather than trying to import the model wholesale, this report aims to distil the core elements of New York’s data success and outline a means for them to be adapted for the specific context of London. It describes the measures that would need to be taken by central government, the Mayor of London, London Borough Councils and the wider London public sector to make this possible.
The report also highlights how many of the lessons New York offers London run counter to common wisdom about how to reform public services or create a ‘smart city’. As Chapter 4 explains, the New York MODA model:• Does not require extensive (and expensive) new technology or placing sensors
on every street, but on making better use of data that is already collected.• Does not involve fundamentally changing the nature of activities conducted
by front-line staff, but intelligently prioritising their work.

6 Big data in the big apple
• Does not insist on data purity and open standards (common formats and schemas for recording data), but on data completeness.*
• Does not entail gambling on a radical new ‘smart city’ business model, but on testing and scaling ideas that each provide a proven return on investment (ROI).
• Depends less on technological expertise and far more on strong political leadership from the most senior figures in city and local government.
• Is not about preparing for some distant vision of future urban intelligence, but instead taking simple but concrete steps that could start tomorrow.
Overall, this report makes just one – albeit far-reaching – recommendation: that London should establish its own Mayor’s Office of Data Analytics in City Hall to support the Mayor, the Greater London Authority (GLA), London boroughs and the wider London public sector in harnessing data to: deliver better public services; reduce the cost of local government; and accelerate business growth in the capital. The following chapters explain what this would entail, why London should attempt it, and – most importantly – exactly how it could be done.
* ‘Data completeness’ means having the full set of data collected about a particular issue, rather than just a sample. The importance for big data analysis of having the complete dataset (some-times referred to as ‘n=all’) has been explored by Viktor Mayer-Schönberger and Kenneth Cukier in Big Data: A Revolution That Will Transform How We Live, Work, and Think, John Murray, 2013
7A lesson from Iraq
A lesson from Iraq
‘People have a right to expect their government to be as well-managed as the most modern organizations in the world.’Mike Flowers quoting Mayor Michael Bloomberg’s philosophy of governance.14
Starting bit by bitIt was in 2009 – the start of Mayor Michael Bloomberg’s third term in office – that the story of the Mayor’s Office of Data Analytics begins. It was in that year that a 40-year-old lawyer called Mike Flowers joined City Hall. Appointed by John Feinbatt, New York City’s then Criminal Justice Co-ordinator, Flowers’ initial brief was to head up the city’s financial crimes taskforce in the wake of the 2008 economic meltdown.15 He had previously spent two years investigating financial crimes for the US Senate Permanent Subcommittee on Investigations. Prior to that, he had been part of the legal team that handled the trial of Saddam Hussein.
It was Flowers’ experience in Iraq that persuaded him that using data could make a difference to his work for City Hall. He had, report Stephen Goldsmith and Susan Crawford in their book, The Responsive City, been ‘inspired by the young econometricians employed by the army’s Joint Improvised Explosive Device Defeat Organisation ( JIEDDO) who crunched data on past encounters with IEDs (Improvised Explosive Devices) in order to find the safest possible route through Baghdad on any given day.’16 If data could help save lives in hostile territory, he thought, what else could it be used for?
Financial crimes and misdemeanoursWith no existing job description or method to work from, Flowers began his tenure at City Hall simply trying to understand who did what, and who had what information. After several months he had walls covered in notes detailing all the information the city held that might be relevant to financial crime. By 2010 – and having used Craigslist to hire a young graduate called Ben Dean as his first data analyst – he realised one aspect of financial crime they could address with data was how to better target mortgage fraud investigations. The revelation came from examining past cases.
‘[Ben] Dean looked at the data on about 150 mortgage frauds… with one ques-tion in mind: “what did the city know in its property and building records at the time this fraud happened that could tell us that this transaction needs scrutiny?”’17
Their research found that it was indeed possible to identify pieces of information about financial transactions which, when brought together, could predict those
01
8 Big data in the big apple
with the greatest likelihood of being fraudulent. However, the work did not proceed much further. It turned out that banks were unwilling to prosecute failed debtors due to fears over its potential to undermine confidence in mortgage-backed securities at a time when confidence was already in short supply.18 Yet the efforts of Flowers and Dean in developing their prediction model were not wasted. Though the initial focus on financial crime may have come to an end, the MODA method-ology of using data analytics to address the city’s problems was firmly established.
And its next application really would save lives.
Fighting fires before they startTo understand how a city really works, just ask front-line staff, says Flowers. He and his team spent months shadowing front-line workers to see how they did their jobs, observing the challenges they faced and identifying the elements of knowledge that informed their work. Their time with inspectors in New York City’s Fire Department (FDNY) provides a good example. In Flowers’ own words:
‘Veteran fire fighters know what dangerous buildings look like. They know how important it is for a building to have an operable sprinkler system, the impact that the improved building and fire codes have had over centuries of construction, and what type of business activity is most frequently corre-lated with dangerous fires. If you ask a veteran of the fire department, their gut can give you a list of criteria for dangerous buildings nearly as effectively as a statistical regression.’19
Flowers’ challenge was to decipher what those criteria were and to see if data could complement and strengthen fire fighters’ natural intuition in identifying dangerous buildings. Could accessing datasets held by organisations outside the Fire Department be useful to their work? Could the factors underpinning fire fighters’ gut instincts (the age of the building, the type of business, etc.) be quantified more precisely with better data? Where previous versions of the city’s fire risk model had weighted the criteria based on focus group discussions with fire fighters, MODA tested them against data from actual fires to calculate their relative importance.
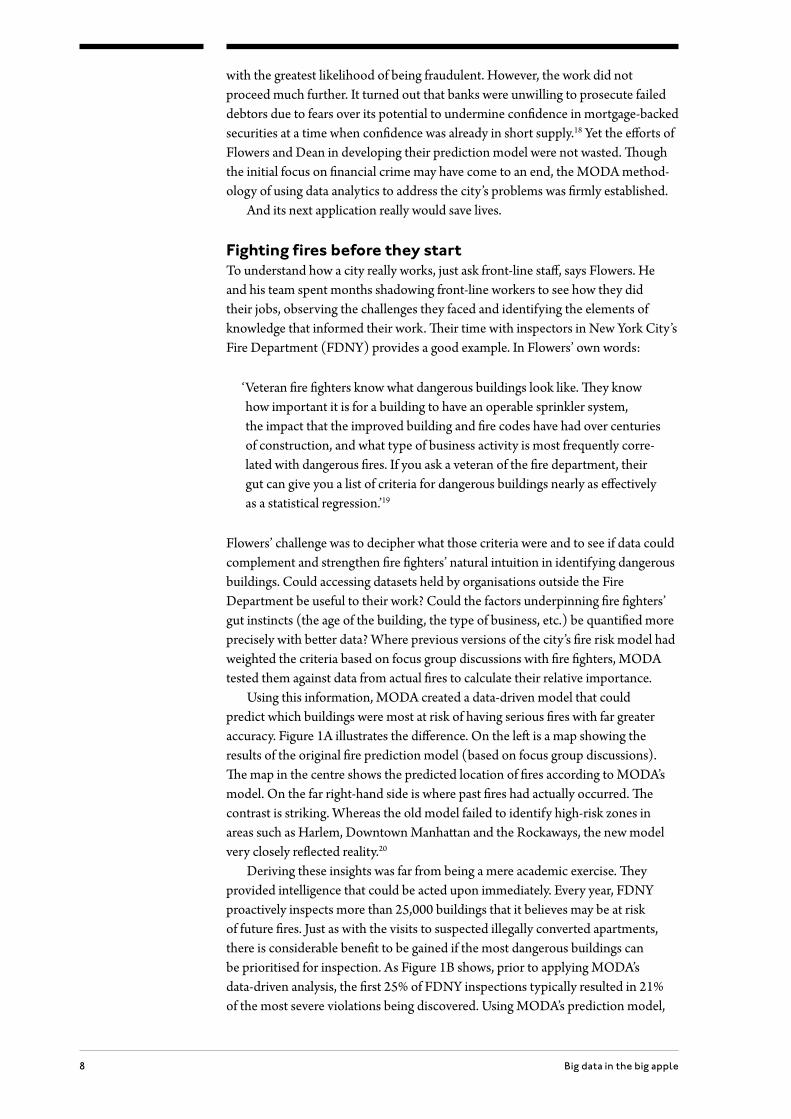
Using this information, MODA created a data-driven model that could predict which buildings were most at risk of having serious fires with far greater accuracy. Figure 1A illustrates the difference. On the left is a map showing the results of the original fire prediction model (based on focus group discussions). The map in the centre shows the predicted location of fires according to MODA’s model. On the far right-hand side is where past fires had actually occurred. The contrast is striking. Whereas the old model failed to identify high-risk zones in areas such as Harlem, Downtown Manhattan and the Rockaways, the new model very closely reflected reality.20
Deriving these insights was far from being a mere academic exercise. They provided intelligence that could be acted upon immediately. Every year, FDNY proactively inspects more than 25,000 buildings that it believes may be at risk of future fires. Just as with the visits to suspected illegally converted apartments, there is considerable benefit to be gained if the most dangerous buildings can be prioritised for inspection. As Figure 1B shows, prior to applying MODA’s data-driven analysis, the first 25% of FDNY inspections typically resulted in 21% of the most severe violations being discovered. Using MODA’s prediction model,

9A lesson from Iraq
the first 25% of inspections now result in more than 70% being discovered. Though the total number of inspections remains the same (FDNY is obliged to investigate every complaint it receives), by going to the most dangerous buildings first, the department is able to take early action to reduce the number of days that New Yorkers are at serious risk.
Figure 1A: Location of fires as predicted before and after the use
of MODA’s model
Original model
Original model over-predicted fires in Downtown Brooklyn, Park Slope and Bay Ridge
Updated model accurately reflects risks in West Bronx, Downtown, and Far Rockaways
Observed fire frequency, 2011 to present
Updated model Actual fires
Source: NYC – Mayor’s Office of Data Analytics, ‘Annual Report 2013’, December 2013, p.14
Figure 1B: Percentage of dangerous buildings identified in first 25%
of inspections
100
0 100755025 0 100755025
75
50
25
0
% o
f sev
ere
viol
atio
ns fo
und
ROC curve pre-analysis
First 25% of inspec-tions yield 21% of severe violations
First 25% of inspec-tions yield 71% of severe violations
ROC curve post-analysis
100
75
50
25
0
% o
f sev
ere
viol
atio
ns fo
und
% of fire inspections conducted % of fire inspections conducted
Source: NYC – Mayor’s Office of Data Analytics, ‘Annual Report 2013’, December 2013, p.15
Crucial to the success of this initiative, the improvements in allocating inspectors’ time was achieved without changing the work of front-line staff. Having proved their fire risk prediction model worked, MODA was able to use technology to automate the process of reviewing and prioritising 311 complaints. Each morning, fire department building inspectors would still receive a list of properties to investigate that day. The only difference was that now that list was pre-prioritised

10 Big data in the big apple
to focus on the most dangerous buildings first. As a result, the work of MODA won the support of the Fire Department as it led to maximum improvement in their service with almost no disruption to day-to-day business. The front-line staff liked it because it helped them do their jobs even better than before. The City and New Yorkers liked it because it saved lives and made them feel safer.
The MODA model was proven – next it had to be formalised.

11The Mayor’s Office of Data Analytics
The Mayor’s Office of Data Analytics
‘We believe this represents a paradigmatic shift in how government works – one that is guided not only by data, but also the expertise, experience, people and history behind the data.’Mike Flowers21
Executive Order 306The work of Flowers and his team became official in April 2013 when Mayor Michael Bloomberg signed Executive Order 306 (see Appendix) formally establishing the Mayor’s Office of Data Analytics (MODA). Mike Flowers became City Hall’s first Chief Analytics Officer (CAO), a senior role reporting directly to the Mayor. Along with the City’s Chief Information and Innovation Officer (CIO) and the Chief Digital Officer (CDO), the Chief Analytics Officer serves on the Mayor’s technology council, bringing data-driven analytical rigour into all aspects of the city’s operations.22
Figure 2A: NYC City Hall Technology Organisation
Mayor
ChiefInformation
Officer
ChiefAnalytics
Officer
ChiefDigitalOfficer
Source: NYC – Mayor’s Office of Data Analytics, ‘Annual Report 2013’, December 2013, p.7
02

12 Big data in the big apple
The teamThe MODA team itself is modest in size with just nine people, including analysts and technical and administrative support staff. The analysts have a mixture of statis-tical, economic, and computer science backgrounds.23 In 2013 the roles included: Chief Analytics Officer and Chief Open Platform Officer; Deputy Director; Chief of Staff; Chief Analyst; Chief Programmer; Analyst; Special Advisor to the CAO; Technology Advisor to the CAO; and Senior Advisor to the CAO.24 Far from creating a significant additional layer of bureaucracy, the New York MODA model is lean and highly efficient.
What MODA does todayMODA’s remit has expanded over time. Since 2013, the team’s work can broadly be divided into seven overlapping areas:25
1 Helping New York City agencies improve the delivery of servicesMODA analyses data to spot previously unknown patterns and relationships that lead to better decisions and help allocate the city’s scarce resources more effectively.26 After piloting and testing their data models to confirm that they can improve the delivery of a particular service, MODA uses technology (see next section) to automate the process so that services can be enhanced on a permanent basis.
In addition to its work on illegally converted apartments and assessing buildings’ fire risk, a further example of this function is how MODA helped the New York City Department of Environmental Protection (DEP), which is responsible for maintaining the city’s 6,000 miles of sewers.27 DEP wanted to crack down on restaurants that were illegally pouring cooking oil into sewers, which is thought to be responsible for more than half of New York’s clogged drains. MODA used data from the Business Integrity Commission, a city agency that certifies that all local restaurants have paid for a service to legally dispose of their grease. By comparing restaurants that had not paid for such a service with geo-spatial data on the sewers, MODA was able to hand DEP inspectors a list of statistically likely suspects. The result was a 95% success rate in tracking down the offending restaurants.28
2 Sharing data with NYC agencies and encouraging best practice in data analysisThe data that MODA collects and uses is also made available to staff working in 40 other city agencies, enabling them to combine it with their own department’s data to improve their decision making.* Such data sharing works on a strict principle of reciprocity: external agencies can access data collected by MODA on condition that they first share their own data.
MODA additionally provides training to help NYC agencies develop their own data analytics capability. In the case of the fire risk based inspection system (RBIS) outlined in the previous chapter, MODA helped the Fire Department set up and train its own data analytics team. That team has since taken on responsibility for developing the RBIS model. The result is that, rather than keeping data skills concentrated in one central team, MODA is instead a catalyst for promoting and extending the use of data analytics throughout the city’s institutions.
* Those staff may include: Business analysts – reporting on the day-to-day operations of agencies; GIS (Geographic Information Systems) ana-lysts – focusing on visualising the operations of the City; Researchers – conducting studies on city issues and performance; and Computer science experts – maintaining the City’s IT infrastructure. Source: NYC – Mayor’s Office of Data Analytics, ‘Annual Report 2013’, December 2013, p.8–10
13The Mayor’s Office of Data Analytics
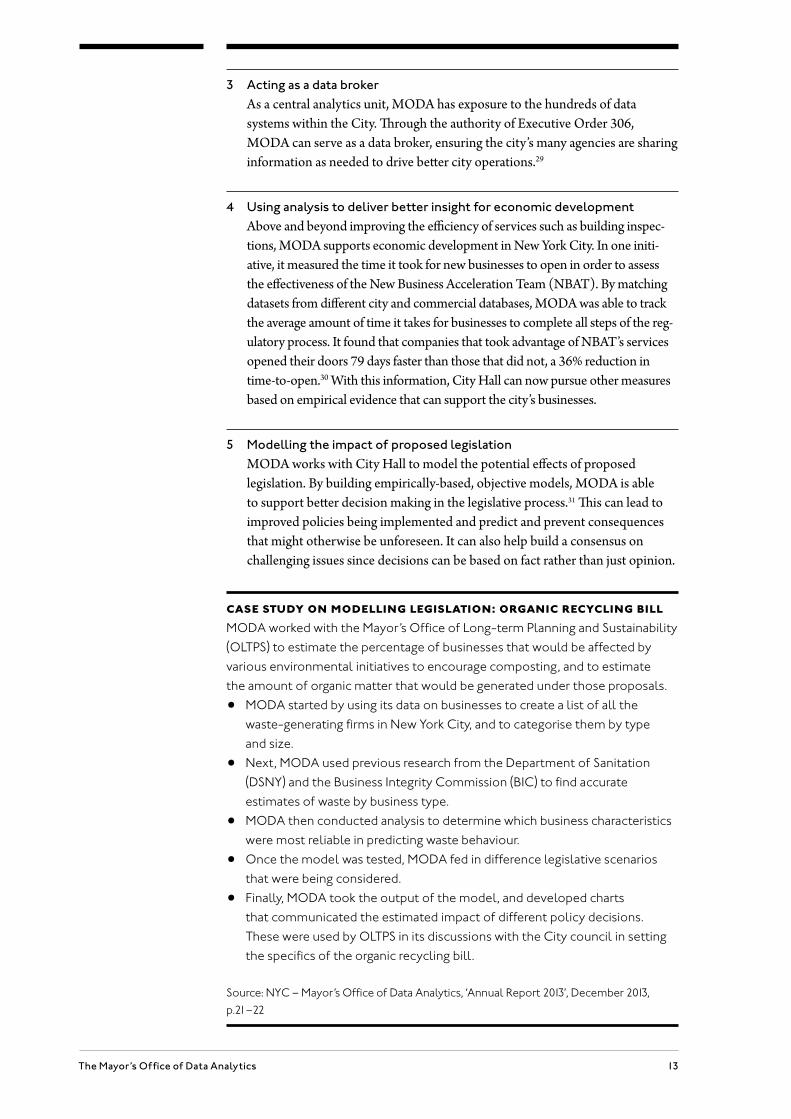
3 Acting as a data brokerAs a central analytics unit, MODA has exposure to the hundreds of data systems within the City. Through the authority of Executive Order 306, MODA can serve as a data broker, ensuring the city’s many agencies are sharing information as needed to drive better city operations.29
4 Using analysis to deliver better insight for economic developmentAbove and beyond improving the efficiency of services such as building inspec-tions, MODA supports economic development in New York City. In one initi-ative, it measured the time it took for new businesses to open in order to assess the effectiveness of the New Business Acceleration Team (NBAT). By matching datasets from different city and commercial databases, MODA was able to track the average amount of time it takes for businesses to complete all steps of the reg-ulatory process. It found that companies that took advantage of NBAT’s services opened their doors 79 days faster than those that did not, a 36% reduction in time-to-open.30 With this information, City Hall can now pursue other measures based on empirical evidence that can support the city’s businesses.
5 Modelling the impact of proposed legislationMODA works with City Hall to model the potential effects of proposed legislation. By building empirically-based, objective models, MODA is able to support better decision making in the legislative process.31 This can lead to improved policies being implemented and predict and prevent consequences that might otherwise be unforeseen. It can also help build a consensus on challenging issues since decisions can be based on fact rather than just opinion.
case study on modelling legislation: organic recycling billMODA worked with the Mayor’s Office of Long-term Planning and Sustainability (OLTPS) to estimate the percentage of businesses that would be affected by various environmental initiatives to encourage composting, and to estimate the amount of organic matter that would be generated under those proposals. • MODA started by using its data on businesses to create a list of all the
waste-generating firms in New York City, and to categorise them by type and size.
• Next, MODA used previous research from the Department of Sanitation (DSNY) and the Business Integrity Commission (BIC) to find accurate estimates of waste by business type.
• MODA then conducted analysis to determine which business characteristics were most reliable in predicting waste behaviour.
• Once the model was tested, MODA fed in difference legislative scenarios that were being considered.
• Finally, MODA took the output of the model, and developed charts that communicated the estimated impact of different policy decisions. These were used by OLTPS in its discussions with the City council in setting the specifics of the organic recycling bill.
Source: NYC – Mayor’s Office of Data Analytics, ‘Annual Report 2013’, December 2013, p.21–22
14 Big data in the big apple
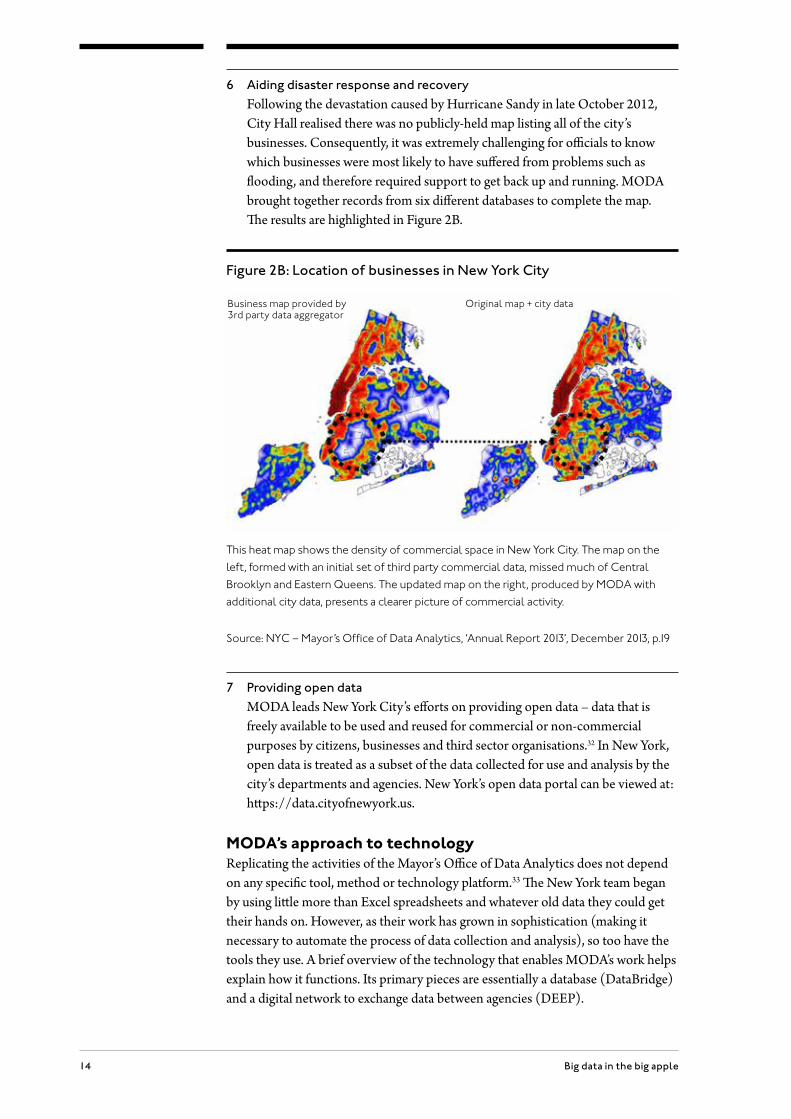
6 Aiding disaster response and recoveryFollowing the devastation caused by Hurricane Sandy in late October 2012, City Hall realised there was no publicly-held map listing all of the city’s businesses. Consequently, it was extremely challenging for officials to know which businesses were most likely to have suffered from problems such as flooding, and therefore required support to get back up and running. MODA brought together records from six different databases to complete the map. The results are highlighted in Figure 2B.
Figure 2B: Location of businesses in New York City
Business map provided by 3rd party data aggregator
Original map + city data
This heat map shows the density of commercial space in New York City. The map on the left, formed with an initial set of third party commercial data, missed much of Central Brooklyn and Eastern Queens. The updated map on the right, produced by MODA with additional city data, presents a clearer picture of commercial activity.
Source: NYC – Mayor’s Office of Data Analytics, ‘Annual Report 2013’, December 2013, p.19
7 Providing open dataMODA leads New York City’s efforts on providing open data – data that is freely available to be used and reused for commercial or non-commercial purposes by citizens, businesses and third sector organisations.32 In New York, open data is treated as a subset of the data collected for use and analysis by the city’s departments and agencies. New York’s open data portal can be viewed at: https://data.cityofnewyork.us.
MODA’s approach to technology Replicating the activities of the Mayor’s Office of Data Analytics does not depend on any specific tool, method or technology platform.33 The New York team began by using little more than Excel spreadsheets and whatever old data they could get their hands on. However, as their work has grown in sophistication (making it necessary to automate the process of data collection and analysis), so too have the tools they use. A brief overview of the technology that enables MODA’s work helps explain how it functions. Its primary pieces are essentially a database (DataBridge) and a digital network to exchange data between agencies (DEEP).
15The Mayor’s Office of Data Analytics
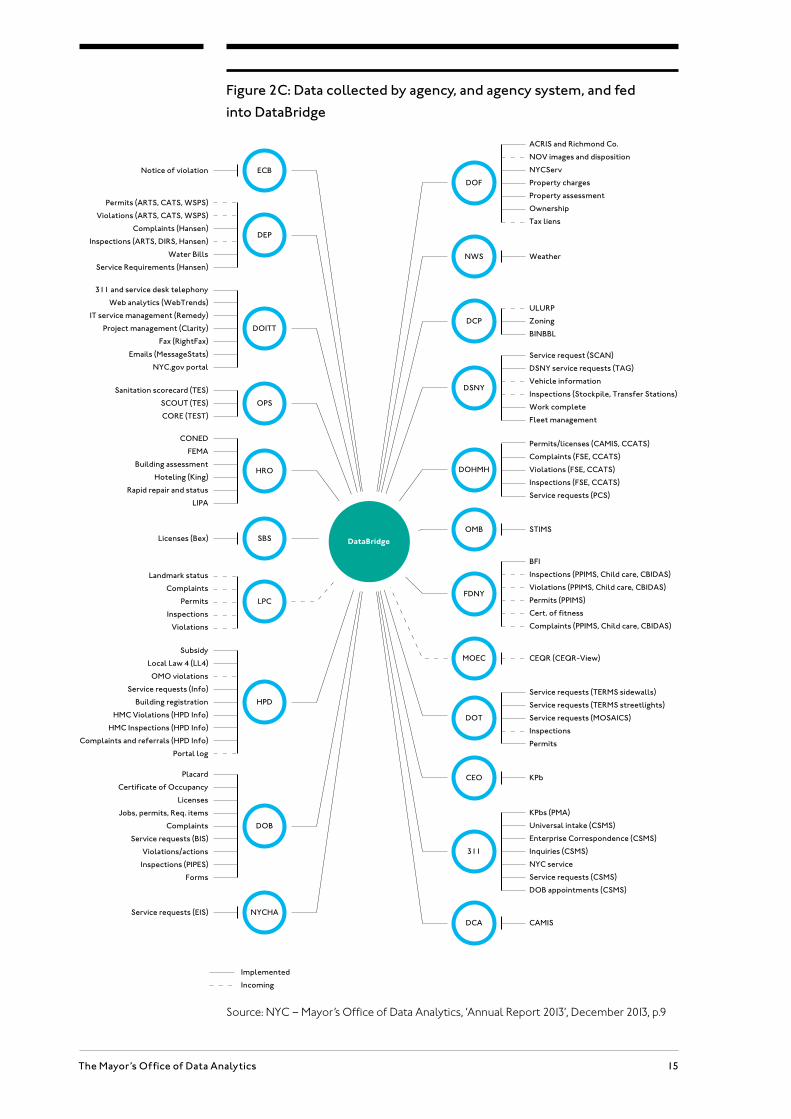
Figure 2C: Data collected by agency, and agency system, and fed
into DataBridge
Source: NYC – Mayor’s Office of Data Analytics, ‘Annual Report 2013’, December 2013, p.9
MOEC
CEO
DOHMH
DSNY
NWS
DOF
DCP
OMB
FDNY
DOT
311
DCA
ACRIS and Richmond Co.
NOV images and disposition
NYCServ
Property charges
Property assessment
Ownership
Tax liens
Service request (SCAN)
DSNY service requests (TAG)
Vehicle information
Inspections (Stockpile, Transfer Stations)
Work complete
Fleet management
Permits/licenses (CAMIS, CCATS)
Complaints (FSE, CCATS)
Violations (FSE, CCATS)
Inspections (FSE, CCATS)
Service requests (PCS)
BFI
Inspections (PPIMS, Child care, CBIDAS)
Violations (PPIMS, Child care, CBIDAS)
Permits (PPIMS)
Cert. of fitness
Complaints (PPIMS, Child care, CBIDAS)
Implemented
Incoming
Service requests (TERMS sidewalls)
Service requests (TERMS streetlights)
Service requests (MOSAICS)
Inspections
Permits
KPbs (PMA)
Universal intake (CSMS)
Enterprise Correspondence (CSMS)
Inquiries (CSMS)
NYC service
Service requests (CSMS)
DOB appointments (CSMS)
KPb
CEQR (CEQR-View)
STIMS
ULURP
Zoning
BINBBL
Weather
CAMIS
Notice of violation
DOB
SBS
DOITT
ECB
OPS
HRO
LPC
NYCHA
HPD
DEP
Permits (ARTS, CATS, WSPS)
Violations (ARTS, CATS, WSPS)
Complaints (Hansen)
Inspections (ARTS, DIRS, Hansen)
Water Bills
Service Requirements (Hansen)
311 and service desk telephony
Web analytics (WebTrends)
IT service management (Remedy)
Project management (Clarity)
Fax (RightFax)
Emails (MessageStats)
NYC.gov portal
CONED
FEMA
Building assessment
Hoteling (King)
Rapid repair and status
LIPA
Landmark status
Complaints
Permits
Inspections
Violations
Subsidy
Local Law 4 (LL4)
OMO violations
Service requests (Info)
Building registration
HMC Violations (HPD Info)
HMC Inspections (HPD Info)
Complaints and referrals (HPD Info)
Portal log
Placard
Certificate of Occupancy
Licenses
Jobs, permits, Req. items
Complaints
Service requests (BIS)
Violations/actions
Inspections (PIPES)
Forms
Service requests (EIS)
Licenses (Bex)
Sanitation scorecard (TES)
SCOUT (TES)
CORE (TEST)
DataBridge

16 Big data in the big apple
DataBridgeAs in London, data in New York City is held by dozens of different organisations, using hundreds of different IT systems of varying types and ages. In order to be able to run its data models and share its insights, MODA needs to be able to bring together data from around 40 different city agencies into a single database in a manner that complies with data privacy and legal obligations.
To automatically collect data from those different agencies via secure APIs (Application Programming Interfaces), MODA used DataShare – an existing data transfer system created to track prisoners through the criminal justice system. The team then harnessed the spare capacity in 311’s database (Citywide Performance Reporting), to construct a powerful but agile system called DataBridge.34 MODA describes DataBridge as:
‘a combination of technologies, including database management and statistical analysis tools. The foundation is an analytics data warehouse/repository with a suite of analytic and data fusion tools, making the data available not just to MODA but to analysts across the City’.35
Figure 2C shows how data from 40 different agencies and their various systems is brought together in DataBridge.36
DEEP If DataBridge resembles a ‘hub and spoke’ system with different agencies all con-necting to a central data warehouse, the Data Element Exchange Program (DEEP) is more like a spider’s web: connecting each department to each other. Instigated by MODA, DEEP enables city agencies to exchange information securely. It replaces outdated methods of transferring data, such as email or fax, which are both time consuming and inefficient. NYC agencies using DEEP are able to send and receive information in a consistent format, on a regular, scheduled basis. One of the most important features that DEEP allows is real-time exchange of information. To date, DEEP has implemented more than 200 automated exchanges between 30 city agencies, external vendors and other government departments.37
MODA’s approach to data Geo-tagging (Geo-coding)A fundamental requirement of MODA’s approach to data is that information sourced from different city organisations can be overlaid and plotted on the same maps. This is made challenging by the fact that agencies in New York City use several different ways to geo-tag their records (i.e. specify their location). For example, some may record a piece of information against a street address, while others may use the block, grid reference or ZIP code. MODA developed a system that can link together records using different geo-tags, so that the information held in DataBridge is connected to a common location identifier. This allows data from multiple agencies to be easily merged and used together in analysis.38
17The Mayor’s Office of Data Analytics
Benefits of MODABeyond its activities in optimising services, MODA’s work has delivered three additional core benefits:
1 Financial savings through data sharingUsing DEEP to automate the flow of information between 30 city agencies has resulted in tangible improvements in city operations and cost savings. For example, after each inspection by New York’s Fire Department, information about specific violations has to be sent to the Environmental Control Board (ECB).* Prior to the implementation of DEEP this was a manual process that took up to a month and was prone to include errors. Today, the process has been automated, speeding it up to just 1–2 days, eliminating errors and resulting in increased revenue collection of $1.2 million per year.
2 Increased joined up working across departments and agenciesIn the past, when agencies tried to address their departmental challenges and design services, they were often restricted to using the information held within their organisation. This made it hard to know what was going on in the rest of the city that could potentially help solve a problem. With access to DataBridge, analysts in each agency can now use data from across the city to create a much more accurate picture of what is going on. Better information leads to better analysis, which in turn leads to better decision making by agency leaders.39
3 Spreading skills in data-driven management of public servicesMODA has recognised that it cannot exist as an island of data expertise in an otherwise data-ignorant city. To that end, MODA collaborated with the Centre for Urban Science and Progress (NYC CUSP – http://cusp.nyu.edu) to estab-lish a series of training workshops for city analysts – effectively initiating a course in ‘Citywide Analytics 101’. This teaches officials to use data to improve their day-to-day responsibilities and strategic decision-making. For example, the Department of Finance (DOF) has used DataBridge to better understand tax fraud. Similarly, the Sheriff ’s Office has used DataBridge to track illegal cigarette importation rings, developing their own in-house data team.40
* The Environmental Control Board (ECB) is a type of court called an administrative tribunal. It is like a court, but is not part of the state court system. At the Office of Administrative Trials and Hearings’ Environmental Control Board, Hearing Officers hear cases on potential violations of the laws that protect the City’s quality of life. Common ECB violations include: dirty sidewalks, unleashed dogs, loitering, noise, public indecency, rollerblading or motorcycling in a forbidden area, sidewalk obstruction and rodent and pest control
18 Big data in the big apple
The New York method
‘A focus on outcomes is often lost in the discussion of big data because it is so frequently an afterthought. We have a huge fire hose of information, but even a fire hose is only valuable when it’s pointed at a fire.’Mike Flowers41
Having laid out the details of the organisation, responsibilities, technology and data methods of New York’s Mayor’s Office of Data Analytics, the next important step is to understand how they go about applying data to address a specific challenge. The following two chapters distil the key methods (Chapter 3) and prin-ciples (Chapter 4) that underlie MODA’s work so that a new model can be created for London (Chapters 5 and 6).
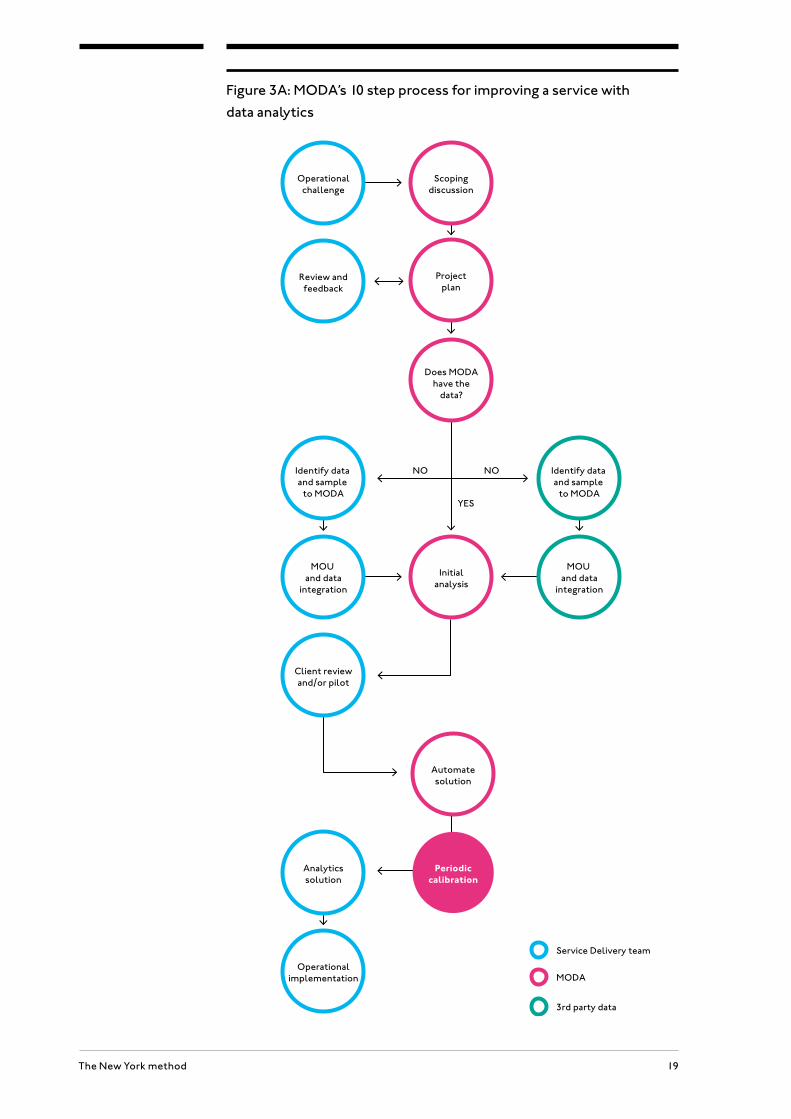
MODA’s 10 step modelArguably the most impactful aspect of MODA’s work has been the way it has supported service delivery teams (SDT), such as fire fighters, building inspectors and environmental protection officers, to bring data-driven analysis to improve or prioritise their activities. The process they use when approaching any new problem – and which should form the framework for a London MODA team – can be summarised in the following 10 steps (which are explored through a detailed case study on page 21):42
1 Understand how day-to-day operations workThe MODA team spends time shadowing front-line SDT staff to understand: a) the nature of the service they provide; b) how resources are allocated, scheduled and delivered; c) the factors that go into the prioritisation of delivery of the service; and d) how data is recorded in the SDT’s IT system(s). When he first arrived at City Hall, Mike Flowers spent six months with front-line staff (which are explored through a detailed case study on page 8) to experience their activities for himself and to understand the data they used and recorded.
2 Identify areas where data could helpMODA examines the data that is used and recorded during the process of deliv-ering a service. The team then considers how the service could be improved (for example, by being better able to allocate a scarce resource, such as inspectors’ time) and tries to identify what information it would take to achieve that aim.
03
19The New York method
Figure 3A: MODA’s 10 step process for improving a service with
data analytics
Operationalchallenge
Scopingdiscussion
Projectplan
Does MODAhave the
data?
Review andfeedback
Identify data and sample
to MODA
Identify data and sample
to MODA
NONO
YES
MOU and data
integration
Client reviewand/or pilot
Service Delivery team
MODA
3rd party data
Analyticssolution
Operationalimplementation
Automatesolution
Initialanalysis
MOU and data
integration
Periodiccalibration

20 Big data in the big apple
3 Form a project planA project plan is put in place so that the SDT team and MODA can agree: a) an approach that works for each party; b) the data that will be used; and c) the timeline for the project.
4 Understand data contextTo understand the value of the data that is used and collected during the course of providing a particular service, MODA analysts need to understand how it is created and what it means in its original context.
5 Create a Memorandum of Understanding (MOU)Much like writing a contract, MODA establishes a formal written agreement with the SDT’s organisation (e.g. the Fire Department). The MOU details the purpose of data sharing and the privacy and data protections that will be applied by MODA and the SDT. It also ensures that there is transparency and commitment about what is required from each side.
6 Integrate dataMODA sets up the technical connection to take the SDT’s data so it can be stored and analysed in DataBridge (see page 16). To combine records with other datasets, MODA insists that all records are geo-tagged – in other words, given a location such as a street address, ZIP code or grid reference. It is this that allows different datasets to be mapped together so that new correlations can be identified.
7 Test hypothesesWorking with the SDT, MODA creates several hypotheses regarding which pieces of information will be useful in improving the service outcome. For example, when investigating what information could help predict illegal build-ing conversions, MODA discovered that the most likely sources of violations are single family homes that are less than the average home value and smaller than 3,000 square feet. The homes within that subset that have histories of tax delinquency, mortgage liens and especially a history of building violations are the ones that are most likely to contain illegal conversions. (See full details in case study on page 21.)
8 Service delivery team reviewOnce MODA has run its pilot data model, the SDT team needs to check the analysis to make sure that MODA has interpreted the information correctly. If needed, MODA updates the model to correct any misunderstandings.
9 Automate the processTo deliver sustainable savings and improvements in performance, the processes designed by MODA must not depend on human analysts (who act as single points of failure when they are late for work, sick or on holiday), but should be automated and integrated into SDT systems so that they become part of the normal workflow.

21The New York method
10 Implement solutionThe final step is for MODA to roll out their solution so that it becomes a permanent fixture of the service.
11 Delegate responsibility for the data modelAn eleventh step could be added: the model can be passed onto, and managed by, the department itself, as per the example of the FDNY which took over the development of its own fire risk based inspection model.
detailed case study: illegal building conversions in new yorkThe following table outlines in detail the 10 step process used by MODA to apply data analytics to improve a service, including the key questions the team asks at each stage. In the third column, each step is explained using the specific example of how MODA helped the Department of Buildings (DOB) prioritise the inspection of illegally converted apartments. (The table is adapted from ‘Memorandum on MODA Project Process Flow’ by Mike Flowers.)
Steps Key questions asked by MODA
Case study: NYC illegal conversions
Step One Spend time in the field with front-line staff to understand how their day-to-day operations work.
What is the service being provided?
The Department of Buildings (DOB) inspects illegal conversion complaints to ensure that NYC residents are living in safe conditions. When conditions are not safe, orders (known as ‘violations’) are issued to property owners to remedy the apartment. In extreme conditions DOB will vacate the living space.
How is the service allocated, scheduled and delivered?
In each of NYC’s five boroughs, DOB has a Borough Command office with a team of inspectors. When a new illegal conversion complaint comes in (via 311), it is printed at the relevant Borough Command office. Typically, complaints are investigated in the same order they are received. DOB has a goal of inspecting every non-prioritised complaint within 40 days.
What factors go into the prioritisation of delivery?
Complaints are inspected in the order they are received. However, priority is given to those that include phrases such as ‘no exit’ and ‘exposed boiler’, which suggest higher risk.
How is the deliv-ery recorded in the organisation’s IT system(s)?
DOB tracks the complaint number through the final disposition in the Building Information System (BIS).
The Environmental Control Board records and adjudicates DOB violations.

22 Big data in the big apple
Steps Key questions asked by MODA
Case study: NYC illegal conversions
Step Two Identify what part(s) of the service can be improved through data analysis.
Check assump-tions with the team(s) delivering the service.
What type of problem is this?
The main challenge is identifying which complaints to prioritise given the limited number of inspectors.
What data exists around the operation?
The wording and details of the complaint in 311.
BIS holds the inspection history of each property.
ECB holds the violation history of each property.
What other data would be helpful (hypotheses)?
Potentially:
Department of Finance property records;
Tax liens and lis pendens;
The age of building.
What is the desired end goal of the data use?
A priority flag that can added against the highest risk complaints on the list printed out each morning at each DOB Borough Command office.
What’s the commitment from the agency and MODA?
That DOB will provide expert guidance on how their service is delivered; review and pilot MODA’s data-driven prioritisation model; and then work with MODA to automate the process.
MODA will test and create a risk filter.
Step Three Form a project plan for the delivery team and MODA to agree an approach that works for each party.
What data will be used, and what new data is needed?
No new data required.
What is the timeline for the project?
Three months: one month for analysis; two months for the pilot; one month for automating the IT processes (concurrent with the second month of the pilot).
What are the check points during the project?
Two check points during development of the risk filter: one after two weeks and the second after one month. End of month checks on pilot results. Weekly checks on IT development once launched.
Step Four Understand data context.
To appreciate the value of the data, MODA analysts have to understand how it is created, and what it means in its original context.
What are the datasets and what are they measuring?
Records of inspections and violations;
Records of every visit to a property;
Records of when access is granted and the inspection is completed;
Records of violation notices, by type, which are found in inspections.
How is the data generated? What road bumps should MODA anticipate?
Data is generated by inspectors or Borough Command staff who manually enter records.
In the case of DOB complaints and inspections, MODA learned that any new complaint on an existing scheduled inspection is ‘administratively closed’. This was important to understand why some complaints showed fast resolution but no history.
How is the data interpreted?
The results of an inspection are recorded. Often the most serious violation is the violation that is written.
How is the data set stored?
Inspections are stored in BIS. Violations are adjudicated through the Environmental Control Board (ECB).
23The New York method
Steps Key questions asked by MODA
Case study: NYC illegal conversions
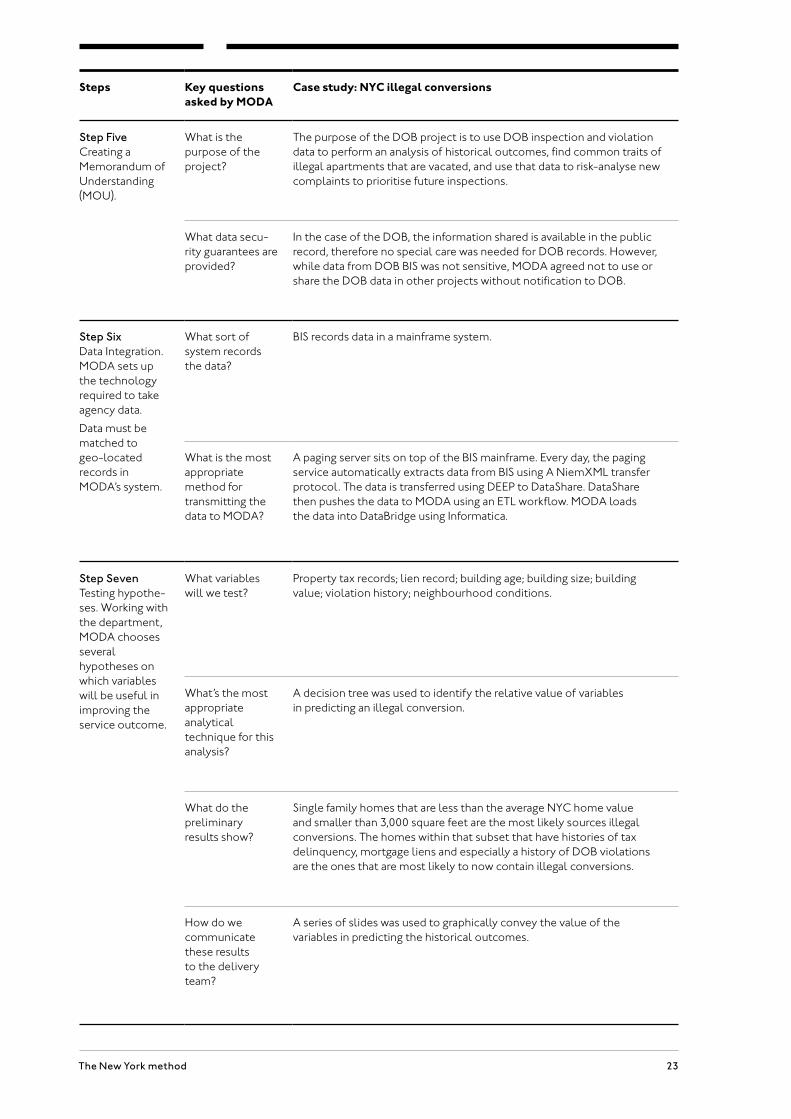
Step Five Creating a Memorandum of Understanding (MOU).
What is the purpose of the project?
The purpose of the DOB project is to use DOB inspection and violation data to perform an analysis of historical outcomes, find common traits of illegal apartments that are vacated, and use that data to risk-analyse new complaints to prioritise future inspections.
What data secu-rity guarantees are provided?
In the case of the DOB, the information shared is available in the public record, therefore no special care was needed for DOB records. However, while data from DOB BIS was not sensitive, MODA agreed not to use or share the DOB data in other projects without notification to DOB.
Step Six Data Integration. MODA sets up the technology required to take agency data.
Data must be matched to geo-located records in MODA’s system.
What sort of system records the data?
BIS records data in a mainframe system.
What is the most appropriate method for transmitting the data to MODA?
A paging server sits on top of the BIS mainframe. Every day, the paging service automatically extracts data from BIS using A NiemXML transfer protocol. The data is transferred using DEEP to DataShare. DataShare then pushes the data to MODA using an ETL workflow. MODA loads the data into DataBridge using Informatica.
Step Seven Testing hypothe-ses. Working with the department, MODA chooses several hypotheses on which variables will be useful in improving the service outcome.
What variables will we test?
Property tax records; lien record; building age; building size; building value; violation history; neighbourhood conditions.
What’s the most appropriate analytical technique for this analysis?
A decision tree was used to identify the relative value of variables in predicting an illegal conversion.
What do the preliminary results show?
Single family homes that are less than the average NYC home value and smaller than 3,000 square feet are the most likely sources illegal conversions. The homes within that subset that have histories of tax delinquency, mortgage liens and especially a history of DOB violations are the ones that are most likely to now contain illegal conversions.
How do we communicate these results to the delivery team?
A series of slides was used to graphically convey the value of the variables in predicting the historical outcomes.
24 Big data in the big apple
Steps Key questions asked by MODA
Case study: NYC illegal conversions
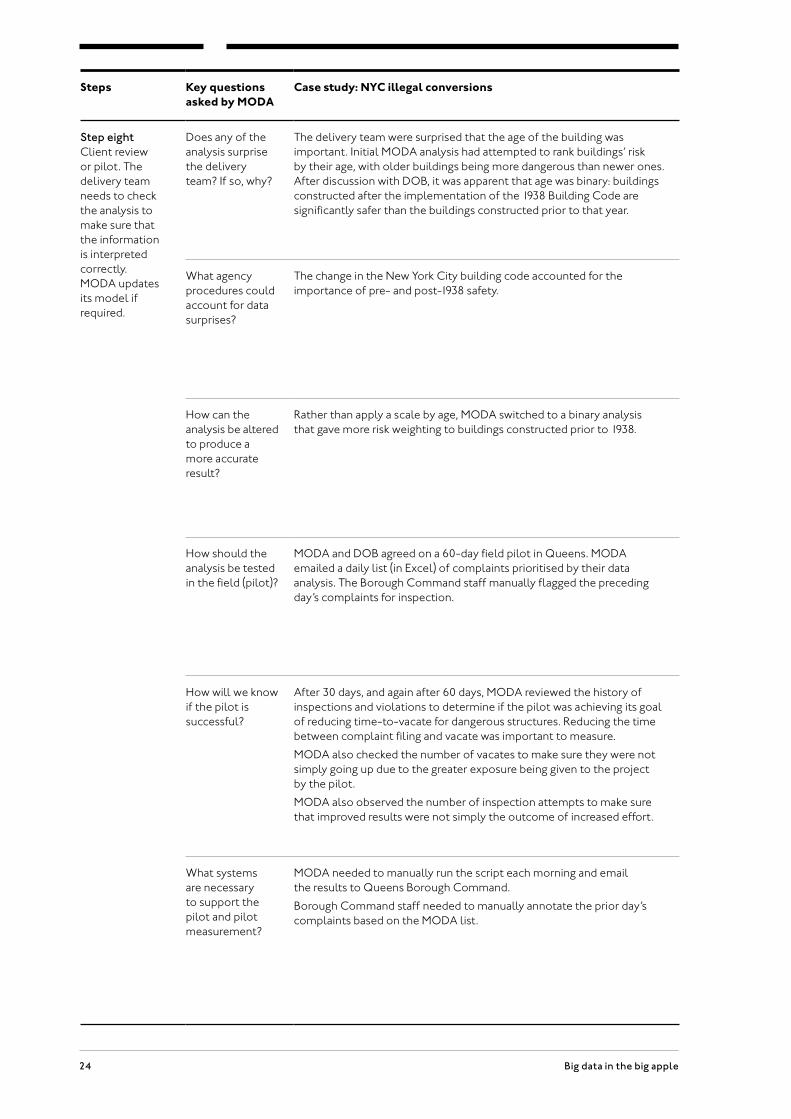
Step eight Client review or pilot. The delivery team needs to check the analysis to make sure that the information is interpreted correctly. MODA updates its model if required.
Does any of the analysis surprise the delivery team? If so, why?
The delivery team were surprised that the age of the building was important. Initial MODA analysis had attempted to rank buildings’ risk by their age, with older buildings being more dangerous than newer ones. After discussion with DOB, it was apparent that age was binary: buildings constructed after the implementation of the 1938 Building Code are significantly safer than the buildings constructed prior to that year.
What agency procedures could account for data surprises?
The change in the New York City building code accounted for the importance of pre- and post-1938 safety.
How can the analysis be altered to produce a more accurate result?
Rather than apply a scale by age, MODA switched to a binary analysis that gave more risk weighting to buildings constructed prior to 1938.
How should the analysis be tested in the field (pilot)?
MODA and DOB agreed on a 60-day field pilot in Queens. MODA emailed a daily list (in Excel) of complaints prioritised by their data analysis. The Borough Command staff manually flagged the preceding day’s complaints for inspection.
How will we know if the pilot is successful?
After 30 days, and again after 60 days, MODA reviewed the history of inspections and violations to determine if the pilot was achieving its goal of reducing time-to-vacate for dangerous structures. Reducing the time between complaint filing and vacate was important to measure.
MODA also checked the number of vacates to make sure they were not simply going up due to the greater exposure being given to the project by the pilot.
MODA also observed the number of inspection attempts to make sure that improved results were not simply the outcome of increased effort.
What systems are necessary to support the pilot and pilot measurement?
MODA needed to manually run the script each morning and email the results to Queens Borough Command.
Borough Command staff needed to manually annotate the prior day’s complaints based on the MODA list.

25The New York method
Steps Key questions asked by MODA
Case study: NYC illegal conversions
Step nine Automating the process.
The process should be reviewed at least twice a year to ensure that the data model cre-ated by MODA takes account of changes in the field.
What system needs to be changed and how?
The DOB mainframe system could not use the MODA logic. Instead, MODA’s tech team developed a web-based service that caught the complaint upstream, between 311 and the delivery of the complaint to DOB.
The web service would analyse the complaint (and the relevant information about the property in DataBridge) to determine whether the complaint met MODA’s risk priority. The web service provided a priority flag (high or normal) and forwarded the information to DOB BIS.
BIS was updated to include a new field for the flag.
The DOB Borough Command prints lists of complaints with the priority flag included. Stop-gaps were built into the system to ensure that any significant downtime in the data model would not delay or disrupt the delivery of 311 complaints to DOB Borough Commands.
How often will the solution be reviewed and calibrated?
Twice a year. In the case of the DOB filter, a community board inquiry led to an earlier review of the filter, however, detailed review revealed no need to change the logic.
Are we confident that this is not disruptive to the field?
DOB confirmed that no change in field operations was required.
How do we maintain the solution on an ongoing basis?
MODA’s tech team established a notification process with DOB to make sure that the system in place for the MODA filter is updated along with any underlying change to the DOB BIS technology.
Step ten Operational Implementation. The new auto-mated system is launched.
What education needs to be provided to staff in the field?
MODA and DOB needed to explain the significance of the flag on the complaint to Borough Commanders and building inspectors.
How will success be measured over time?
The MMR was changed to include a ‘time-to-vacate’ measurement to ensure that the filter is leading to the desired policy outcome of reducing the number of days that a dangerous apartment remains at risk.
26 Big data in the big apple
New York’s lessons for London
‘Being a data-driven city is really about more efficiently and effectively delivering the core services of the city: smarter, risk-based resource allocation, better sharing of information agency-to-agency to facilitate smart decision-making, and using the data in a way that integrates in the established day-to-day patterns of city agency front line workers.’Mike Flowers43
This chapter details ten key lessons that can be derived from the New York experience and which should form the founding principles of a London Mayor’s Office of Data Analytics.
1 Strong executive support is essentialModern technology makes it much easier to access and analyse city data, but it will only make a difference if there is the political will to use it. As a result, the most important lesson from New York is that the success of delivering a data-driven city depends on having the complete support of the most senior leadership figures, starting with the Mayor. As Stephen Goldsmith and Susan Crawford have written:
‘In New York City, Michael Bloomberg took office as a mayor after long years of experience in the use of data, and he created a metrics-drive mayoralty. Agencies agreed to cooperate to set up his proposed data analytics center and other interagency data initiatives. Yet almost all of them soon asserted legal, technical, and operational obstacles to full participation. Budget experts also pushed back, worried about costs. Lawyers citied vast numbers of rules (most from the federal government) that prohibited sharing of data. Within each city agency, its chief information officer would explain why only he or she could manage the complex legacy databases of that unit. Despite his mandate, his commitment to data and a raft of first-rate appointees, Bloomberg would not have succeeded in making New York City a leader in data-driven govern-ment had he not pushed hard from the top for change.’44
As a January 2015 report by Policy Exchange (‘Small Pieces Loosely Joined’) explained, similar cultural, political and (perceived) legal barriers exist between different public sector bodies in the UK and would need to be overcome with strong political leadership.45
04
27New York’s lessons for London
2 Data models must be shaped by front-line experience and expertiseData is meaningless without context. Creating the statistical models that successfully predict illegal building conversions, fire hazards and unlawful grease disposal by restaurants required spending time with front-line staff to understand the factors important for delivering their particular service.
3 Focus on outcomes that provide a proven return on investmentWhile many reports on smart city initiatives celebrate the process, technology and techniques of using data to improve cities, MODA is clear that what matter are outcomes. According to its model, data initiatives do not proceed beyond a trial stage (step 8) unless there is clear evidence that they deliver tangible benefits and improvements in service. The New York approach thereby avoids gambling on a ‘build it and they will come’ approach, where taxpayer money runs a real risk of being wasted on unproven technology-led initiatives. Instead, MODA’s philosophy is that each and every initiative must have a clear return on investment. In Mike Flowers’ words: ‘There can be no dead wood.’46
4 Start small and with measures everyone can supportImplementing a MODA model can require a dramatic shift in ways of working that is likely to meet with resistance from city officials, department heads, lawyers and city leaders (see quote from Stephen Goldsmith and Susan Crawford in point 1). Taxpayers may likewise wonder whether investing in a MODA team represents value for money. Mike Flowers was conscious of the need to win people over in New York. He therefore started by using his data-driven methods on issues that could receive universal political and public support, such as preventing fires or stopping rat infestations. As he puts it: ‘Fires and rats have no political supporters.’47
5 Do not try to change the work of front-line staffIn almost any organisation, the success of implementing a new way of working critically depends on those affected by the change embracing the new model positively. One of the reasons the New York MODA team was so successful is that they collaborated with front-line staff to make their work even more effective, increasing employees’ job satisfaction. As Flowers’ has put it:
‘Immediately, we [MODA] discount any intervention that changes the way that the front line works. New training and processes are non-starters because of the immense organizational difficulty in effectively turning battleships and reorienting them around new processes. Even new forms are frowned upon, as they get in the way, or at least change the way, the fieldwork is done. Our concept is simple – a light footprint means that the solution must be delivered upstream of the front line.’48
6 Using data does not require vast numbers of specialised personnel or new layers of bureaucracyThe NYC MODA team was led by a former lawyer who recruited a small team of data analysts via Craigslist. Today MODA is made up of just nine people. Between 2011–2012 Flowers’ team proved that they could save the city money
28 Big data in the big apple
and enhance the effectiveness of services before MODA became part of the official structure of government in 2013 (as described in Chapter 2).
7 Using data does not require procuring high-end technologyMODA’s approach to technology is a long way removed from common notions of the ‘smart city’ that depend on complex new IT systems, digital networks and the proliferation of urban sensors. New York made use of the city’s existing data, databases and networks wherever possible. The team began with nothing more than old spreadsheets and analysis conducted in Microsoft Excel.
Additionally, DataBridge and DEEP were created to allow agencies to keep using their own systems rather than having to install expensive new IT systems to comply. The detailed case study in Chapter 3 highlighted that when the Department of Buildings’ own IT system proved too old to handle the risk-assessment logic created by MODA, the team created a web-based tool that could work with DOB’s existing legacy system. There is therefore no major technical change required from organisations wishing to benefit from MODA’s techniques. This ‘just build something that works’ approach reduces the technical obstacles that could prevent getting things done. In cases where modest IT changes are required by an organisation to connect to MODA, a further principle of the New York model is that those changes are paid for from a central budget. This removes the financial barriers to data sharing.
8 Any organisation that wants to access MODA’s data must first share their ownTo create the right incentive for organisations to open up their data (and combat the cultural resistance to doing so), access to MODA’s expertise and the data it holds must be conditional on organisations first sharing their own data. MODA also insists that while the data provided by an organisation does not have to be perfect, it must be the entire set.49
9 All data must be geo-tagged (geo-coded)Some of the most powerful data analytics processes depend on plotting data from different sources on one map. There is therefore a minimum requirement that the records from each organisation are geo-tagged. While adopting open standards (i.e. common ways of recording information) can make this process more straightforward, it is not a necessary condition for the MODA model to work. Organisations in New York City use several different methods for geo-coding and MODA does the hard work of matching them.*
10 No part of the data extraction or analytics process should require human actionFor data-driven analytics to reliably improve a service, the processes created by the MODA team must eventually be automated. Requiring a person to complete a step in the chain before it reaches front-line staff creates single points of failure. As well as making simple errors, employees sometimes need sick days, holidays or simply need to prioritise other work. By automating its models, MODA is able to make data analytics a reliable and integral – rather than a peripheral – part of delivering services.
* For discussion on the role of open standards for data in the context of UK local government, see: Policy Exchange, ‘Small Pieces Loosely Joined: How smarter use of technology and data can deliver real reform of local government’, January 2015, p.29–30

29Why London needs a Mayor’s Office of Data Analytics
Why London needs a Mayor’s Office of Data Analytics
‘Analytics is not magic, and it’s not necessarily complicated. Analytics really means intelligence, and intelligence is better information that helps us make better decisions.’Mike Flowers50
At some point during the first three months of 2015, London achieved a significant milestone: the population finally caught up to and surpassed its 1939 peak of 8.6 million people.51 This achievement is indicative of London’s successful revival. When once there were fears that the capital was set for a long-term decline following an exodus of residents in the 1970s and 80s, the dominant narrative is now firmly one of London as a magnet for people, investment, jobs and ideas.52
Figure 5A: Total population of Greater London – GLA 2012
round projections
2001 2006 2011 2016 2021 2026 2031 2036 2041
11.0
10.5
10.0
9.5
9.0
8.5
8.0
7.5
7.0
6.5
6.0
GLA 2012 round SHLAA
Tota
l pop
ulat
ion
(mill
ions
)
Year
GLA 2012 round Trend
Source: GLA Intelligence, ‘GLA 2012 Round Population Projections, Intelligence Update 05–2013’, February 2013, p.3
05

30 Big data in the big apple
Yet while London can fairly be described as Britain’s economic engine (it was responsible for 22.8% of GVA in 2012), the influx of new residents has not been matched with a commensurate rise in money available to city coffers.53 The period of austerity that has followed the financial crash of 2008 has inevitably placed considerable pressure on local authority budgets. This has coincided with the grow-ing population placing unprecedented demand on London’s ageing infrastructure and public services.54
The experience from New York City suggests that establishing a Mayor’s Office of Data Analytics in City Hall could help London respond to these financial pressures and deliver services that are not just more efficient, but fundamentally better. Through the examples given in this report, it has been shown that a MODA team can help target a city’s scarce resources more efficiently, increase the efficiency of communications between different public sector organisations, pre-empt and address problems before they become serious and expensive to resolve, and boost local economic growth through providing better information to citizens.
What kinds of issues might a London MODA team be able to address?
Potential applications of a London MODA teamThe very nature of the MODA model means that it is impossible to specify from theory alone which initiatives would definitely work for London. As Chapter 3 made clear, the first step for a MODA team is to spend time with front-line staff to observe first-hand the challenges they face so that data models can be built from the ground up. However, to give an indication of what might be possible for the British capital, below six hypothetical scenarios are outlined.*
Scenario 1: Intelligently designing shared services London local authorities increasingly use their own data to create digital maps showing the location of things like parks, buildings and parking spaces. They can map the addresses of individuals or families with particular needs, from education to welfare. But – as was the case for many New York City agencies before the creation of MODA – they often have little or no data on those same things beyond their boundaries.** The resultant tendency can be for London boroughs to act as islands, a point noted by The Economist, which observed the density of new building developments and the provision of services in the centre of boroughs compared with their fringes.55 This makes little sense given that communities, areas of deprivation, crime, littering and school catchment areas can (and frequently do) cut across local authority borders.
For London boroughs that wish to achieve cost savings through sharing more front-line services, this is a serious problem.*** Without shared data, it is extremely hard for a council to know if a particular problem they are tackling, or service need they are meeting, represents the tip of the iceberg or the mass below sea level. How far does the area of urban deprivation on the eastern boundary continue into the neighbouring borough? What is the demand for library services in the community that falls at the intersection of three councils’ areas? Lacking data from other boroughs also limits councils’ ability to learn best practice from, and work with, ‘statistical neighbours’ – non-neighbouring local authorities that have similar types of area or challenges.†
If each London borough shared its own data with a MODA team based in City Hall, their numerous different datasets could be combined and plotted on maps
* The six examples outlined are purely illustrative. They are not intended to imply that there is any deficiency in the current services directed at each area.
** A notable exception would be the Tri-Borough of Westminster City Council, Hammersmith and Fulham Borough Council, and Kensington and Chelsea Borough Council
*** Shared services have a strong track record of saving money. According to the LGA, at least 337 councils are already engaged in shared service arrangements, leading to savings of £165 million in 2012, £278 million in 2013 and £357 million in 2014. Source: LGA, ‘Shared Services: costs spared?’, October 2014, p.5
† An example of where this approach is already being used by the police can be found at: www.london.gov.uk/webmaps/neighbour-hoodconfidencetool/
31Why London needs a Mayor’s Office of Data Analytics
so that London boroughs could see the real size and shape of problems beyond their jurisdictions. Maps could be created that spanned the whole capital, creating a complete picture for any given issue, rather than the individual jigsaw pieces London boroughs currently hold. With that kind of real-time information, it would be easier for councils to make informed decisions about whether they should join with a neighbouring borough to run or jointly fund a service.
It could be argued that London boroughs could organise this kind of data sharing between themselves (as some, such as the Tri-borough of Westminster City Council, Hammersmith and Fulham Borough Council, and Kensington and Chelsea Borough Council already do). However, a London Mayor’s Office of Data Analytics would have at least three distinct advantages:
• Translating between different data standardsFirst, MODA would handle the significant difficulties around combining data-sets that are recorded in different styles (i.e. using different file formats, standards and conventions). As in New York City, London boroughs use a variety of different methods for recording location (postcode, street address, grid reference, and so on) and the many other types of information they manage. Merging those records to build a complete map can therefore be the digital equivalent of matching apples and oranges. A London MODA team would have the time, expertise and technical resources to translate each local authority’s records so they could be joined together.* Without that capability, councils would struggle to make sense of their disparate datasets until they agreed upon and implemented common data standards – a process that could take many years.**
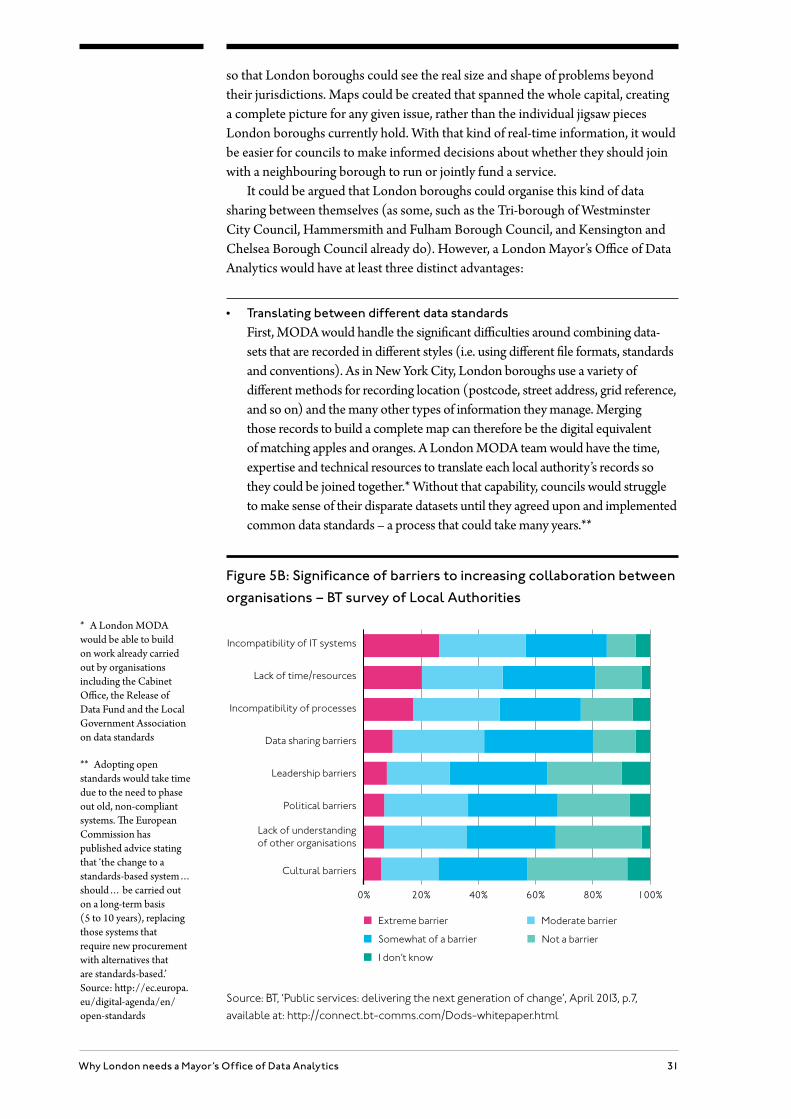
Figure 5B: Significance of barriers to increasing collaboration between
organisations – BT survey of Local Authorities
Incompatibility of IT systems
Lack of time/resources
Incompatibility of processes
Data sharing barriers
Leadership barriers
Political barriers
Cultural barriers
Lack of understandingof other organisations
Extreme barrier
0% 20% 40% 60% 80% 100%
Moderate barrier
Somewhat of a barrier
I don’t know
Not a barrier
Source: BT, ‘Public services: delivering the next generation of change’, April 2013, p.7, available at: http://connect.bt-comms.com/Dods-whitepaper.html
* A London MODA would be able to build on work already carried out by organisations including the Cabinet Office, the Release of Data Fund and the Local Government Association on data standards
** Adopting open standards would take time due to the need to phase out old, non-compliant systems. The European Commission has published advice stating that ‘the change to a standards-based system… should… be carried out on a long-term basis (5 to 10 years), replacing those systems that require new procurement with alternatives that are standards-based.’ Source: http://ec.europa.eu/digital-agenda/en/open-standards
32 Big data in the big apple
The difficulty of joining up records held in different databases was highlighted in a comprehensive survey of local authorities conducted by BT in 2014. According to the survey, the single greatest barrier to increasing collabo-ration between different organisations was cited as being ‘Incompatibility of IT systems’, with 84% agreeing. In the same survey, 80% of respondents felt that ‘Data sharing barriers created obstacles to collaboration’.56
• Speeding up implementation of data sharing Second, if each London borough tried to negotiate individually with the 32 other councils to share their data, it would require setting up 528 one-to-one connections. By contrast, MODA could set up a single data exchange with each council (33 in total) to bring their data together in one secure location (the equivalent of New York’s DataBridge). This would save a huge amount of time, money and effort. Added to this, MODA could combine local authority data with datasets from sources such as the Metropolitan Police, the London Fire Brigade and other London public sector organisations to provide additional insights in a way that would not be possible to achieve on a borough-by-borough basis.
• Providing new insights for City HallThird, bringing London’s data together in one place would be of huge benefit to the Greater London Authority and the Mayor’s Office. Remarkably, City Hall currently does not systematically collect any data from London boroughs, other than that required for statutory purposes, such as population and school place statistics.57 The information used to shape decisions affecting the capital is therefore largely based on data collected by central government departments such as the Department for Work and Pensions (DWP). As London seeks to address its most serious challenges at a London scale, it will need data insights that cover the whole capital.
Scenario 2: Combating illegal conversions New York is not the only city to suffer from dangerous buildings. Parts of London are blighted by ‘beds in sheds’ (a common term for rental accommodation provided in illegal outhouses, normally built without planning permission behind conventional houses), costing taxpayers millions and making life a misery for affected communities.58 London is disproportionately affected by the problem: eight of the city’s boroughs are in the top nine worst affected local authorities in the UK.59 This might be attributed to the capital’s high cost of housing, the shortage of supply, the heavy reliance on the private rented sector among low-income households, and the fact that London is often the starting destination for new migrants. It is typically new illegal migrants that are housed by rogue landlords in sheds and garages in conditions that are unsafe, unsanitary, and in which people are frequently exploited.
Addressing the problem is expensive. In 2012 the government awarded an extra £2.3 million to the worst affected London boroughs to help them combat the issue (see table below).60 There are also additional indirect costs. Illegal dwellings have been connected with increases in local crime and anti-social behaviour. They put additional pressure on utilities, such as waste and sewage disposal. They also increase illegal working practices and benefit fraud, where migrant workers are particularly targeted.
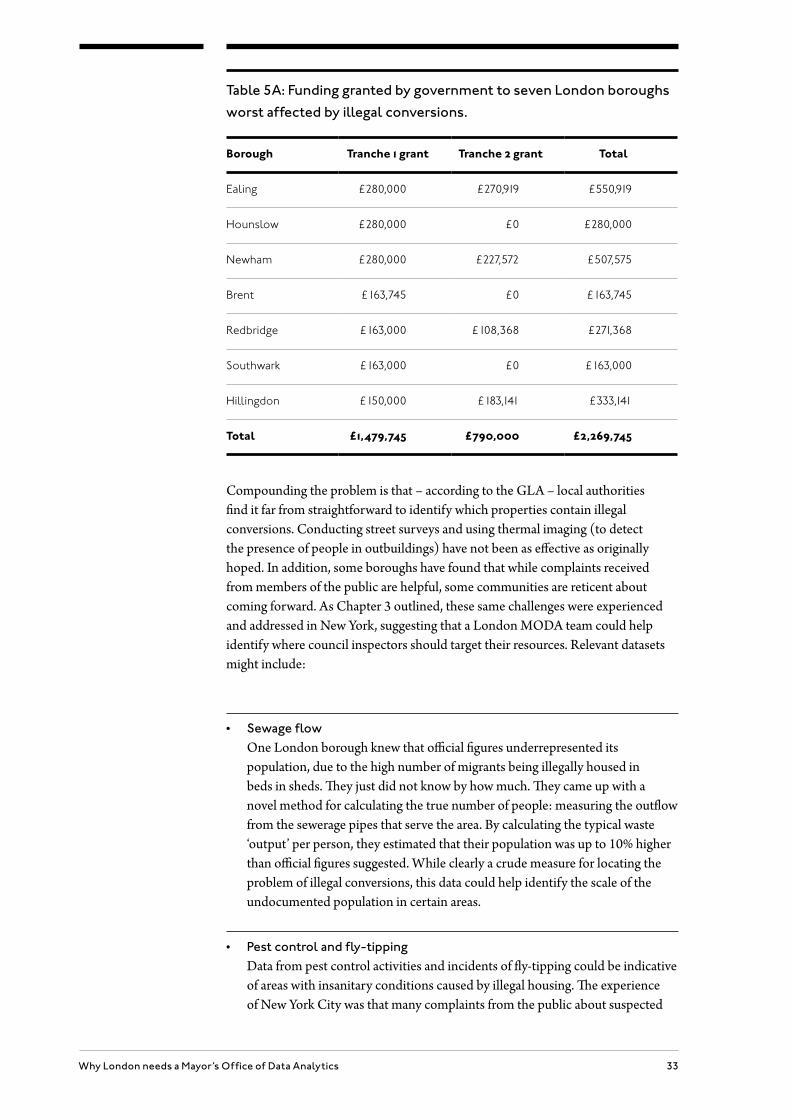
33Why London needs a Mayor’s Office of Data Analytics
Table 5A: Funding granted by government to seven London boroughs
worst affected by illegal conversions.
Borough Tranche 1 grant Tranche 2 grant Total
Ealing £280,000 £270,919 £550,919
Hounslow £280,000 £0 £280,000
Newham £280,000 £227,572 £507,575
Brent £163,745 £0 £163,745
Redbridge £163,000 £108,368 £271,368
Southwark £163,000 £0 £163,000
Hillingdon £150,000 £183,141 £333,141
Total £1,479,745 £790,000 £2,269,745
Compounding the problem is that – according to the GLA – local authorities find it far from straightforward to identify which properties contain illegal conversions. Conducting street surveys and using thermal imaging (to detect the presence of people in outbuildings) have not been as effective as originally hoped. In addition, some boroughs have found that while complaints received from members of the public are helpful, some communities are reticent about coming forward. As Chapter 3 outlined, these same challenges were experienced and addressed in New York, suggesting that a London MODA team could help identify where council inspectors should target their resources. Relevant datasets might include:
• Sewage flowOne London borough knew that official figures underrepresented its population, due to the high number of migrants being illegally housed in beds in sheds. They just did not know by how much. They came up with a novel method for calculating the true number of people: measuring the outflow from the sewerage pipes that serve the area. By calculating the typical waste ‘output’ per person, they estimated that their population was up to 10% higher than official figures suggested. While clearly a crude measure for locating the problem of illegal conversions, this data could help identify the scale of the undocumented population in certain areas.
• Pest control and fly-tippingData from pest control activities and incidents of fly-tipping could be indicative of areas with insanitary conditions caused by illegal housing. The experience of New York City was that many complaints from the public about suspected
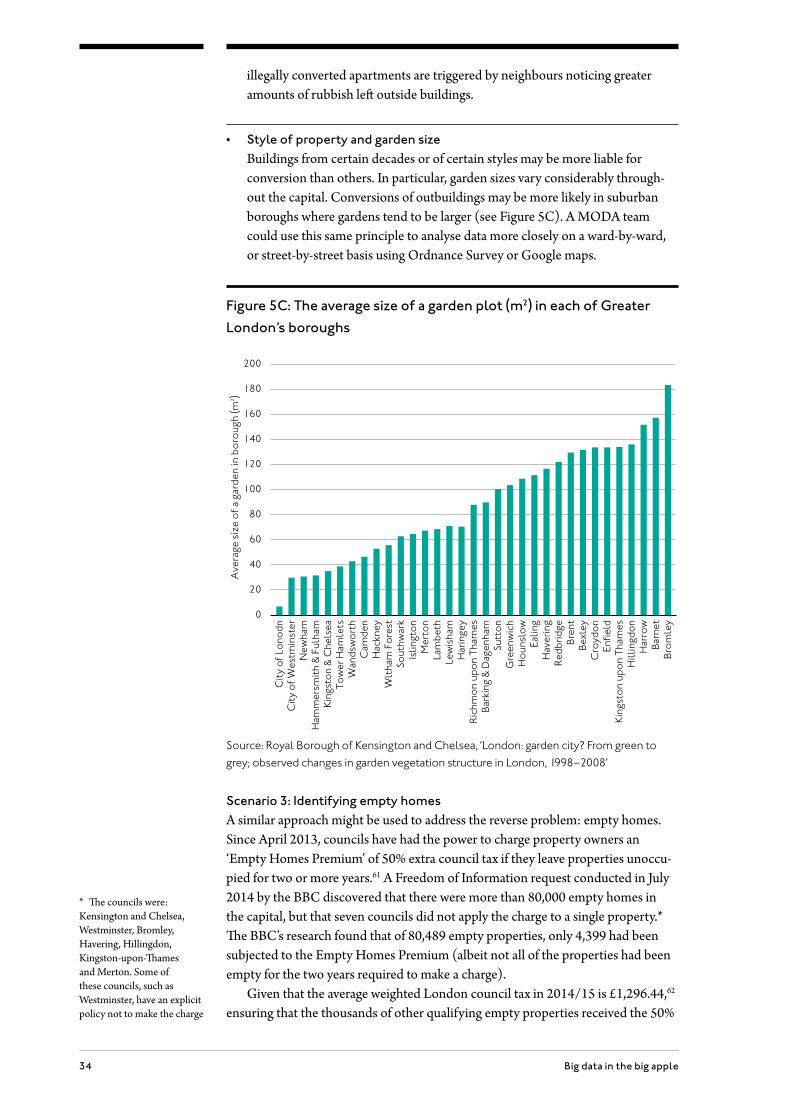
34 Big data in the big apple
illegally converted apartments are triggered by neighbours noticing greater amounts of rubbish left outside buildings.
• Style of property and garden sizeBuildings from certain decades or of certain styles may be more liable for conversion than others. In particular, garden sizes vary considerably through-out the capital. Conversions of outbuildings may be more likely in suburban boroughs where gardens tend to be larger (see Figure 5C). A MODA team could use this same principle to analyse data more closely on a ward-by-ward, or street-by-street basis using Ordnance Survey or Google maps.
Figure 5C: The average size of a garden plot (m2) in each of Greater
London’s boroughs
City
of L
onod
nC
ity o
f Wes
tmin
ster
New
ham
Ham
mer
smith
& F
ulha
mKi
ngst
on &
Che
lsea
Tow
er H
amle
tsW
ands
wor
thC
amde
nH
ackn
eyW
ltha
m F
ores
tSo
uthw
ark
Islin
gton
Mer
ton
Lam
beth
Lew
isha
mH
arin
gey
Ric
hmon
upo
n Th
ames
Bark
ing
& D
agen
ham
Sutt
onG
reen
wic
hH
ouns
low
Ealin
gH
aver
ing
Red
brid
geBr
ent
Bexl
eyC
royd
onEn
field
King
ston
upo
n Th
ames
Hill
ingd
onH
arro
wBa
rnet
Brom
ley
200
180
160
140
120
100
80
60
40
20
0
Ave
rage
siz
e of
a g
arde
n in
bor
ough
(m2 )
Source: Royal Borough of Kensington and Chelsea, ‘London: garden city? From green to grey; observed changes in garden vegetation structure in London, 1998–2008’
Scenario 3: Identifying empty homes A similar approach might be used to address the reverse problem: empty homes. Since April 2013, councils have had the power to charge property owners an ‘Empty Homes Premium’ of 50% extra council tax if they leave properties unoccu-pied for two or more years.61 A Freedom of Information request conducted in July 2014 by the BBC discovered that there were more than 80,000 empty homes in the capital, but that seven councils did not apply the charge to a single property.* The BBC’s research found that of 80,489 empty properties, only 4,399 had been subjected to the Empty Homes Premium (albeit not all of the properties had been empty for the two years required to make a charge).
Given that the average weighted London council tax in 2014/15 is £1,296.44,62 ensuring that the thousands of other qualifying empty properties received the 50%
* The councils were: Kensington and Chelsea, Westminster, Bromley, Havering, Hillingdon, Kingston-upon-Thames and Merton. Some of these councils, such as Westminster, have an explicit policy not to make the charge

35Why London needs a Mayor’s Office of Data Analytics
surcharge could result in substantial additional revenue for London boroughs. (If all remaining 76,090 empty properties were left for two years and charged the premium, it would provide £49 million). Though it is unrealistic to think that 100% of empty properties could be identified, with the right data and the expertise of a MODA team, it may be possible to target more than is currently the case.
Scenario 4: Fighting tax and benefits fraudEach year, housing tenancy, benefit and Council Tax fraud (such as false entitle-ment, illegal sub-letting, lease sell-on and unauthorised succession) cost the UK’s local authorities in excess of £1.3 billion. By bringing together and analysing data from past cases and combining with third-party data sources (e.g. the Electoral Roll, the Post Office and credit scoring agencies), it is possible to predict where future violations are most likely to occur and direct investigative teams to respond to them first.
A trial using exactly these methods conducted by Gravesham Borough Council, working in conjunction with Fujitsu, identified 75 properties where the council made a range of interventions, including: eight cases in which council property needed to be repossessed; four properties that were under-occupied; and twelve where there were illegal tenancy successions. £108,000 of tenancy fraud was discovered.63 Building on the work started in Gravesham, a London MODA team could help extend this data-driven process to tackle fraud across the rest of the capital.
Scenario 5: Targeting food safety inspectionsThe average London borough has its own team of around 6 full-time-equivalent food safety inspectors to conduct food safety inspections and provide hygiene ratings.64 The typical borough has 1,838 premises to inspect (including restaurants, pubs, cafés, takeaways, hotels, supermarkets and other food shops).65 The frequency with which businesses are inspected is based on their risk category. The highest risk establishments (Category A) will be inspected every six months. Other establishments will be far lower risk (down to Category E) and only inspected every three years.66 New businesses are typically inspected within their first 28 days. Additional inspections and interventions can be arranged based on complaints received by members of the public sent directly to their local authority’s food standards teams. MODA could potentially use data to help prioritise inspections with even greater accuracy than is currently possible so that teams could address the worst cases first. The following datasets might apply:
• Data on past casesIn the same way that MODA designed a Risk Based Inspection System for the New York Fire Department (see Chapter 1), a London team could analyse data from the 60,000+ inspections that take place across London each year and see how accurately the Food Standards Agency risk categories predict the worst cases.67 Rather than use broad categories (A-E) that apply to hundreds of businesses, MODA could use statistical analysis to weight different risk criteria with greater granularity.* This information could then be used to re-prioritise scheduled inspections, as well as determining which complaints received from the public are likely to represent the most serious and urgent threats to public health.
* For a full list of criteria that go into the current risk category model, see: Food Standards Agency, ‘Food Law Code of Practice: A5.6 Food standards scoring system’, available at: www.food.gov.uk/enforcement/enforcework/food-law/annex5-food-es-tablish-intervention/a56-food-standards-scoring

36 Big data in the big apple
• TripAdvisor and social MediaMODA could look at additional sources of public data, such as reviews on TripAdvisor, or posts on Twitter, to provide more nuanced criteria for inspect-ing premises. In the absence of an official complaint being made by a member of the public, MODA could conduct sentiment analysis on public reviews to spot keywords that correlate to poor hygiene conditions. This may be especially useful given that milder cases of food poisoning often go unreported.*, 68
Scenario 6: Boosting new business growthWhere is the best place to start a business in London? In 2013, 136,939 people asked that exact question as they registered their new businesses in the capital with Companies House.69 For those businesses that rely on footfall (attracting passersby into their shop or office), coming up with an answer can be tough. It is easy to tell that Oxford Street has thousands of people walking past its shop fronts every day. But if a business owner cannot afford the rents charged by the city’s busiest high streets, how can they find out which other places provide a sufficient flow of potential customers? While large retailers can afford to pay for market research to discern this information, it is SMEs that lose out by having to rely on intuition rather than solid data. With a focus on supporting the provision of London’s open data, MODA might be able to provide the following:
• Mobile dataMobile phone operators and technology companies such as Google and Apple collect a considerable amount of data about the location of mobile phone users. (For example, if they have their location settings enabled, Android users can view a map showing exactly where they have been with their phone via their Google Dashboard at: https://maps.google.com/locationhistory). That kind of data could be aggregated to show how many people have walked down a particular street during the course of each month. It could even show average flows of people at different times of day, or days of the week, to help businesses optimise their opening hours.
Such maps would not show any individual’s end-to-end journey, and streets where fewer than, say, 100 people had walked would appear blank so that no individual could be identified. A MODA team, backed by the Mayor, could work with mobile and technology companies to make this aggregated data available. A similar technique has already been trialled in Boston where the taxi app company, Uber, has released anonymised data on journey routes and times to city authorities.70
• Companies House business closure statisticsWhen starting a business, it would be helpful to know where similar businesses have succeeded or failed in the city. For instance, a person wishing to start a bike shop may find it useful to know that three previous bike shops all closed down on a particular street. This information is collected by Companies House but is currently not available for a city-level search. MODA could work to make some of this data available for new business owners.
* In 2013, a team from the Food Standards Agency (FSA) began comparing data from Twitter with confirmed lab reports of norovirus in the winter of 2012-13. Researchers found that not only did certain keywords – such as ‘winter bug’ or ‘sickness bug’ – correspond to a spike in cases, but other key terms – such as ‘retch’ and ‘upset stomach’ – could be used to predict spikes. In some cases a spike in keywords occurred up to four weeks before confirmed lab reports of the virus were available. Source: SAS UK & Civil Service World, ‘Using Big Data to Support a New Government Research: survey report’, 2015, available at: http://www.sas.com/content/dam/SAS/en_gb/doc/whitepaper1/PublicSector/CSW-SAS-research- paper.pdf

37Why London needs a Mayor’s Office of Data Analytics
• TfL Oyster Card and contactless dataIf a business wanted to appeal to customers from certain parts of London, data from Transport for London (Tf L) shows exactly where people touch in and touch out of the transport network. Maps can thereby be created showing where people move from and to. This could be helpful to know which tube or bus stops to place a business near.
Creating an online tool to make these kinds of datasets available would build on ideas started in New York City. There, MODA established the NYC Business Atlas (http://maps.nyc.gov/businessatlas), which allows users to layer different types of information over a map of the city to determine the best location to establish their company. This data would not just be helpful for the public; it could also be useful for City Hall. For example, policymakers could use the data to better plan the location and development of businesses enterprise zones. Figure 5D provides a screenshot of the NYC Business Atlas.
Figure 5D: Screenshot of NYC Business Atlas showing location of
new restaurants
Source: NYC Business Atlas, http://maps.nyc.gov/businessatlas, accessed on 24 February 2015
Other benefitsBeyond the hypothetical examples outlined above, a London MODA team would be likely to bring three further benefits:
1 Boosting the quality and sustainability of London’s open dataThe UK’s approach to open data has largely worked on the principle that it is best to publish public sector data without worrying too much about its age, format or quality. The idea has been that citizens and businesses will scrutinise
38 Big data in the big apple
the data, suggest improvements, and use it to create new and innovative products and services.
There are serious downsides to this approach. The quality of the data can be poor and the lack of context can make it hard for outsiders to interpret, limiting the extent to which it can be used. It also risks being financially unsustainable. Releasing open data is not cost-free. It can require investment in new or updated software, (potentially) the creation and maintenance of a web portal, and the development of APIs. Most importantly, to be of much use, it requires the resource time to annotate the data and provide sufficient support for those who wish to use it. The fact that the Treasury will eventually receive extra tax revenues from data-fuelled businesses does not help the public sector organisations who have to provide the data in the first place. There is therefore a real risk that the provision of open data could be cut in future if public sector organisations see it as being nothing more than a cost on their balance sheet.
The MODA model works differently. Its starts with the principle that the primary consumer of public sector data is the public sector itself. With MODA’s expertise and ability to coordinate and roll out data initiatives, London boroughs and public sector bodies would be able to generate real value and cost savings from their own (and others’) data. As a result, it would be worth their while to invest in ensuring the accuracy, timeliness and usability of their own information. A subset of that data would then be released as open data. This model would thereby be more financially sustainable, and help to improve the quality, formatting and timeliness of the data available to the public.*
2 Upskilling data analytics teams in other departmentsIt is widely acknowledged that across the UK public sector there is a shortage of people with deep data skills.** Yet it is also understood to be a vitally impor-tant competency. An April 2014 survey of local authorities conducted by BT showed that 83% of local government respondents felt data analysis skills were important in the delivery of public services. However, only 7% strongly agreed that such skills existed at sufficient levels within their organisation.71 As was proven in New York, a London MODA team could provide a means to spread data analytics skills throughout the wider public sector, both through training and by helping organisations set up their own data analytics capability.
* This is not to deny that the current London DataStore has had notable successes. The portal receives 41,000 visitors every month from the public, private and voluntary sectors. The Greater London Authority is now working to broaden the range of organisations that contribute data to include the London boroughs, health sector, private companies and the third sector. This process would be accelerated with additional resources through MODA
** In a 2013 survey of public sector staff, 72% of respondents agreed that it is becoming increasingly important for civil servants to know how to access, share and use data. In the same sample, the majority of people said they did not know how to access or interpret data sets, and could not cite specific data initiatives or their benefits. Source: Guardian, ‘Public sector staff know open data matters but fail to get government plan’, February 2013

39Why London needs a Mayor’s Office of Data Analytics
Figure 5E: Importance and presence of data analysis skills in
Local Authorities
Customer service skills
Shared services
Data analysis skills
Social media skills
Information technologyliteracy for all staff
Culture of innovation
Customer service skills
Strongly agree Agree
Shared services
Data analysis skills
Social media skills
Information technologyliteracy for all staff
Culture of innovation
0% 20% 40% 60% 80% 100%
How important do you think the following skills are for improving the delivery of public services?
To what extent do you agree that these skills exist at sufficient levels within your organisation at present?
0% 20% 40% 60% 80% 100%
Don’t know
Disagree Strongly disagree
Very important Important
Low importance I don’t know
Neutral Slightly important
Source: BT, ‘Public services: delivering the next generation of change’, April 2013, p.4&6, http://connect.bt-comms.com/Dods-whitepaper.html
3 Reducing barriers to trying new data initiativesWhile there are already initiatives within London-based public sector bodies to use data in some of the ways described in this report (for example, the London Fire Brigade uses predictive analytics to target fire-prevention initiatives),* they tend to be isolated by geography or sector. There are high barriers to starting new initiatives as doing so requires setting up data-analytics capacity to address each new problem. With a London Mayor’s Office of Data Analytics, the capital would have a team with the knowledge and ability to mobilise resources at low cost to pilot new data initiatives. By spreading data skills throughout the public sector, those organisations would also be better able to leverage the skills of companies offering specialist data services.
* The London Fire Brigade (LFB) serves a population of 7.5 million people in 3.2 million households across 1,537 square kilometres. LFB worked with the technology company SAS to predict which households in London are at the greatest risk of fires so that they can conduct safety checks, give advice and fit smoke alarms to prevent fires before they happen. More than 60 different data elements feed into the SAS model, including census data and population demographics, broken down into 649 geographical areas (ward level), plus type of land use, data on deprivation, Mosaic lifestyle data, historic incidents and past prevention activity. The ability to prioritise inspections is vital. LFB already conducts 65,000 home safety visits a year, but at that rate visiting all London properties would take more than 50 years. Results, provided as user-friendly maps showing predicted incident levels, are mainly used at fire station level. Borough Commanders and local firefighters use these insights to plan and target home visits in areas of highest risk. View the full case study at: www.sas.com/en_gb/customers/london-fire-brigade.html

40 Big data in the big apple
4 Preparing the ground for smart city initiativesFinally, the establishment of a London MODA team would prepare the way for the development of London as a smart city. Cities will not be ‘smart’ until they start intelligently using the data they already have. Putting in place mechanisms for sharing and analysing data across local authorities and the wider public sector will be vital to manage the exponentially greater amounts of data that will arrive with smart city sensors.
41How to create a London Mayor’s Office of Data Analytics
How to create a London Mayor’s Office of Data Analytics
‘Being data-driven is not primarily a challenge of technology; it is a challenge of direction and organizational leadership.’Mike Flowers72
Having highlighted some of the potential areas where a Mayor’s Office of Data Analytics could make a difference in London, what steps would it take to establish a MODA team in City Hall?
Data leadership
1 The Mayor of London must be a data-driven mayorThe most fundamental lesson from New York City is that the success of the MODA model depends on having the full backing of the most senior leader-ship figures in a city, starting with the Mayor. Just as the commitment of former Minister for the Cabinet Office, Francis Maude, was seen as vital to the success of the Government Digital Service and the UK’s progress on open data, it is necessary to have senior figures in City Hall driving the work of a MODA team. This is necessary to overcome the political and cultural resistance from organisations to sharing their data and working more collaboratively to address problems. The Mayor should also ensure that data analytics are considered an integral part of City Hall’s work in each policy area.
As part of their campaigns, the candidates hoping to win the London mayoralty in 2016 should make a clear case for how they will champion data-driven decision making in City Hall. They should outline a vision for how better sharing and analysis of information will play a role in their public sector reform plans and their vision to make London a smart city.
Establishing MODA
2 City Hall should appoint London’s first Chief Analytics OfficerQuite simply, London needs a Mike Flowers. The Chief Analytics Officer (CAO) would be responsible for initiating and leading the work of a London MODA team. As in New York, the first post holder should be given a period of six months to spend time with front-line workers to identify areas where data
06
42 Big data in the big apple
could help increase the efficiency of public services. The CAO should be a very senior role, reporting directly to the Mayor of London. (Though the GLA does have its own Intelligence team, it is clear from the current organisational structure that the reporting lines between it and City Hall’s leadership are far less direct than is the case in New York.) The CAO would also be responsible for working with the CEOs of London boroughs and senior figures within public sector bodies, such as the Metropolitan Police and the London Fire Brigade, to agree data sharing arrangements with a MODA team.
3 London’s Chief Analytics Officer should recruit a MODA teamThe London Mayor’s Office of Data Analytics would not necessarily have to start from scratch. Instead, it could be formed out of the GLA’s existing Intelligence team. The Intelligence team has established a strong record of statistical analysis, creating high quality supporting information for datasets. MODA would build on this capacity and allow the team to make fuller use of recent advances in techniques and tools from the data science world. This may well entail recruiting some new personnel with data science backgrounds. Candidates could be sought from some of the university programmes dedicated to training students in urban analytics, such as the Centre for Advanced Spatial Analytics (CASA) at University College London.73
Proving the model
4 The MODA team should start by using existing data sources to run pilot projectsAs in New York, the London Mayor’s Office of Data Analytics could begin its operations using the technology and data that are currently available. London already has a comprehensive open data portal, the London DataStore (data.london.gov.uk), which, if combined with datasets from data.gov.uk and willing local partners, could provide sufficient information for testing ideas. The MODA team should start by addressing an area where they can provide a clear return on investment. Helping prioritise inspections of beds in sheds or food outlets (see Chapter 5) would be a close approximation to how the New York MODA team proved its value. The London MODA should closely follow the 10 step methodology developed by Mike Flowers, outlined in Chapter 3, and the principles outlined in Chapter 4.
5 The Mayor of London should strongly encourage London boroughs and other public sector organisations to consider how their own challenges could be addressed through smarter use of dataThe greatest challenge for implementing the MODA model in London will be securing cooperation from the London boroughs, which are considerably more autonomous than their New York City counterparts. The Mayor has a role to play in making the case for collaboration with MODA and should encourage boroughs to proactively raise their own ideas for using data. Some of the New York MODA team’s greatest achievements came about when they were approached by organisations, such as the Department of Buildings, with a clear problem to solve.
43How to create a London Mayor’s Office of Data Analytics
Technology and data
6 IT Systems should be put in place to automate data analysisTo move beyond mere pilots, the London MODA team would need a database and analytics toolkit to match the capability provided by DataBridge in New York City. This could make use of City Hall’s existing systems, adopt open source examples, or use an off-the-shelf solution such as Socrata, which has proven highly effective in many US cities.74 This would be the system used to securely store data from different boroughs and public sector bodies, analyse information and make it viewable by all organisations that share their data with the London MODA. Rather than having to find storage space on servers based at City Hall, London’s version should build on the GLA’s existing approach of hosting data in a secure cloud environment.
7 Data connections should be established between MODA, London Boroughs and public sector organisationsSecure, automated connections would need to be set up to source data from London boroughs and public sector organisations such as the Metropolitan Police, Transport for London and the London Fire Brigade. Data sharing must be done strictly on the principle of reciprocity: organisations should only be able to access the combined pool of data of other organisations if they first share their own with MODA. In terms of the technology required to establish these data connections, several options are available. The London MODA could extend the use of C-KAN, an open source system currently used to auto-matically pull data from London boroughs to populate the London DataStore.75 Alternatively, connections could be created using the Public Services Network (PSN), or via direct uploads to a cloud version of DataBridge.
8 MODA should seek to add datasets from private sector partnersThe Chief Analytics Officer should negotiate with companies to make their data available for use by the London MODA. As per the example given in scenario 6 in Chapter 5 – boosting new business growth – organisations such as mobile phone operators and technology companies have data that could help improve decision making for both City Hall and London’s busi-nesses and citizens. To provide the right incentives, MODA could offer private companies some (non-sensitive, non-personal) city data on condition that they first share their own.
9 MODA should take on responsibility for the London DataStoreTo increase the quality, accuracy and sustainability of London’s open data, MODA should replicate the New York model of providing open data as a subset of the data that is used by public sector organisations for themselves (see page 37–40).
44 Big data in the big apple
Skills and Training
10 The London MODA should collaborate with one or more university departments to set up a data analytics training course to educate public sector partners about how to use dataThe underlying philosophy of the New York MODA team was that it should be a catalyst for better use of data across the whole city, and not just an isolated team of experts. As Chapter 2 described, considerable efforts were made in conjunction with NYC CUSP to provide data training so that other city depart-ments and agencies could set up their own analytics teams. To have impact on a London-wide scale, The London MODA team should take on a similar responsibility to deliver training to the capital’s public sector organisations. In educating other organisations about how to use their own and MODA’s information in their day-to-day and strategic responsibilities, MODA can help stimulate demand for data, ensuring the model grows in scale and effectiveness.
Organisation and budget
11 Central government should accelerate the roll out of Community Budgets for London boroughs that share their data with MODAThere will be little benefit in establishing a London MODA team if the insights it delivers cannot be used to deliver real efficiencies. As was shown in New York City, a key way MODA can help increase efficiency is by predicting where instances of particular problems may occur in future so that they can be addressed before they escalate in cost and severity. This marries up with the LGA’s view of how to improve public services. As one report has described it, for local authorities to be able to work in a way ‘that’s financially and socially sustainable means tackling failure before it happens and so driving down demand for services before it’s created.’76
London boroughs will only be able to use data insights from MODA to save money in this way if they have the budget flexibility to reassign their resources to focus on preventative action, and can do so in conjunction with the many other public sector organisations with which they have to work. This has traditionally not been possible due to ring-fenced budget allocations. But a new model has recently been trialled that offers to change that.
Since 2012, pilots of Community Budgets have taken place in Essex, Greater Manchester, the Tri-borough and West Cheshire.77 The idea is that public sector organisations based in each area work together, redesigning services from the ground up and sharing budgets to tackle problems jointly. Currently, many public sector bodies are not incentivised to invest in preventa-tive action as the savings that would result from doing so would be felt only by other organisations. (For example, a council could invest in more youth centres, which over the long term may save money in local police budgets.) By sharing budgets, there is an incentive for all participating bodies to work in the most joined up and efficient manner, designing local solutions for local people. Community Budgets should be accelerated for London boroughs that agree to share their data with MODA.

45How to create a London Mayor’s Office of Data Analytics
Funding
12 Central Government should provide matched funding to establish the London MODACentral government departments such as the Cabinet Office, the Department for Communities and Local Government (DCLG), and the Department for Business Innovation and Skills (BIS) have a major interest in the success of the MODA model. The Cabinet office would benefit from MODA’s valuable insights on data sharing and analytics – an area currently being explored by the Government Innovation Group. DCLG would benefit from MODA’s work on encouraging greater collaboration between local public sector partners, and using data-driven insights to make Community Budgets a success. BIS would benefit from using London as a pilot for the development of data-driven smart city policies. As a result, they should offer to match City Hall’s funding to establish a London MODA team.
46 Big data in the big apple
Final thoughts
This report has provided an in-depth account of how New York has used its Mayor’s Office of Data Analytics to address some of the city’s greatest challenges. Given London’s similarities to the Big Apple, the report has argued that the city could benefit from setting up a London MODA in City Hall. By using the 10 step method outlined in Chapter 3, the principles described in Chapter 4 and the recommendations in Chapter 6, London should aim to have its own data analytics capability at the start of the next mayoral term.
Beyond its obvious benefits in improving specific services, MODA could provide a mechanism to remove some of the complexity of London government and make collaboration between separate organisations simpler and more effective. By acting as a trusted data broker, it would have the ability to overcome some of the cultural and political resistance to data sharing. It would have the time and expertise to ensure that all data analytics projects were done in a wholly ethical and legal way – vital for building public trust. In future, it could also be a natural partner to other important city projects: supporting the work of the Smart London Board; helping design and spread open standards across the capital to improve interoperability between IT systems in different public sector bodies; and making the policy making process more transparent to citizens.
Developing the capital’s expertise in data analytics may also benefit other UK cities and the wider public sector. London could prove to the rest of the country that smarter use of data provides a powerful way to deliver meaningful reform. As the Conservative, Labour and Liberal Democrat parties all back the idea of giving more powers and fiscal responsibilities to the UK’s major cities, the government may even wish to consider whether establishing a MODA team should be a pre-requisite for any region wishing to benefit from greater devolution. After all, it provides a potent mechanism for encouraging collaboration at a city level and helps ensure services are operated in a targeted, efficient and coordinated fashion. This will be essential if cities are to take on more responsibility for their own affairs.
Yet the impact of the MODA model goes far beyond the policy making community and city leaders. On this note, the last word should be given to MODA’s creator, Mike Flowers. As he puts it: “You need to remember at all times that the point of all this effort is to help your city and its people thrive. Keep all this in mind. Just dive in and do it. You may be amazed at what you find.” 78

47Appendix
Appendix
Executive Order #306
ESTABLISHING THE MAYOR’S OFFICE OF DATA ANALYTICS (MODA) April 17, 2013WHEREAS, the City of New York has become a national model for collecting data to measure government operations; and
WHEREAS, City agencies routinely collect various types of data on the buildings, streets, infrastructure, businesses and other entities within the City, including but not limited to tax records, building permits, crime-related data, noise and other 311 complaints; and
WHEREAS, much of the data collected by the City is stored within each collecting agency, impeding the ability to aggregate, analyze and synthesize it to better allocate public resources; and
WHEREAS, the establishment of an Office Of Data Analytics and a centralized data sharing and analysis capacity will enable the City to aggregate and analyze data from across City agencies and other sources to more effectively address crime, public safety, and quality-of-life issues by prioritizing risk more strategically, delivering services more efficiently, and enforcing laws more effectively; and
WHEREAS, under Local Law 11 Of 2012 (the “Open Data Law”), The City Of New York must make relevant city data publicly available online, giving priority to data sets that can be used to increase agency accountability and responsiveness, improve public knowledge of the agency and its operations, further the mission of City agencies, create economic opportunity, or respond to a need or demand identified by public consultation; and
WHEREAS, the establishment of a centralized data sharing and analysis capacity will assist in the achievement of the objectives of the Open Data Law;
NOW, THEREFORE, by the power vested in me as Mayor of the City of New York, it is hereby ordered that:
Section 1. There is established in the Office of the Mayor The Mayor’s Office Of Data Analytics (the “Office”).
§ 2.The Office will be headed by a Chief Analytics Officer. The Chief Analytics Officer shall report to the Mayor’s Chief Advisor for Policy and Strategic Planning and shall consult regularly with the Deputy Mayor For Operations, the Deputy Mayor For Economic Development, and the Commissioner Of the Department Of Information Technology And Telecommunications (DoITT).
§ 3. The Office shall develop and work with agencies to implement data-driven solutions to City service delivery issues. The Office’s responsibilities shall include but not be limited to the following:a. Collaborative, Data-Driven Solutions. The Office shall work with City agencies to
identify how data held by those agencies can be analyzed and combined with other
48 Big data in the big apple
agencies’ data to best fulfill their respective missions, shall develop strategies based on such data, and shall assist agencies in implementing those strategies
b. Citywide Data Platform. The Office shall develop and implement a citywide data platform that aggregates and updates data from City and other governmental agencies and other sources and that connects and synthesizes data regarding a single address, business, or individual that was previously isolated within individual agencies. In collaboration with DoITT, The Office shall: 1. Work with city agencies to ensure that they have proper technology to provide and
retrieve data from the citywide data platform;2. Train agency staff to use the citywide data platform; and3. Develop practices for performing ongoing and new data analytics with each agency.
c. Oversight of Data Projects. The Office shall, as appropriate, oversee agency data projects to ensure that agencies use best practices and such projects are appropriately prioritized by need, impact and feasibility.
d. Data Liaison duties. The Office shall serve as the designated point of contact for outside partners contributing to or using City data.
e. Implementation of the Open Data Law. The Office shall work with DoITT to ensure compliance by City agencies with the Open Data Law. The Chief Analytics Officer will also serve as the City’s Chief Open Platform Officer (COPO) as defined in DoITT’s Open Data Policy and Technical Standards Manual.
§ 4.The Deputy Mayor for Operations shall convene and chair an Analytics Steering Committee Consisting of representatives of the Office Of Data Analytics, The Commissioner of DoITT, and any other Mayor’s Office Representative designated by the Deputy Mayor for Operations. The Steering Committee shall first meet within 30 Days of the effective date of this Order and shall develop a citywide analytics strategy.
§ 5.City Agencies shall cooperate with the Chief Analytics Officer to ensure appropriate implementation of this Order. Such cooperation shall include but not be limited to the sharing of relevant data in a timely fashion, and agencies shall facilitate and encourage real-time data exchanges whenever possible.
§ 6. Strategies, processes, and solutions developed by the Mayor’s Office of Data Analytics, including the Citywide Data Platform, shall be aligned with the Citywide Information Technology Strategy, as well as the security requirements and enterprise architecture standards as set forth by DoITT.
§ 7. This Order shall take effect immediately.

49Endnotes
Endnotes
1. NYC – Mayor’s Office of Data Analytics, ‘Annual Report 2013’, December 2013, p.15
2. Stephen Goldsmith & Susan Crawford, The Responsive City, Jossey-Bass, San Francisco,
2014, p.129
3. See: www1.nyc.gov/311
4. NYC Resources – News from The Blue Room, ‘Mayor Bloomberg And Speaker Quinn Announce
New Approach To Target Most Dangerous Illegally Converted Apartments’, 7 June 2011
5. NYC – Mayor’s Office of Data Analytics, ‘Annual Report 2013’, December 2013, p.16
6. See, for example: Policy Exchange, ‘Small Pieces Loosely Joined: How smarter use of technology
and data can help deliver real reform of local government’, January 2015; and ‘Technology
Manifesto’, June 2014
7. James Q. Wilson and George l. Kelling, ‘Broken Windows’, Manhattan Institute, available at:
www.manhattan-institute.org/pdf/_atlantic_monthly-broken_windows.pdf
8. See: www.tfl.gov.uk/oyster
9. See: www.tfl.gov.uk/modes/driving/congestion-charge
10. Professor Edward Glaeser, Triumph of the City, How Our Greatest Invention Makes Us Richer,
Smarter, Greener, Healthier, and Happier, Penguin Books 2011
11. By 2018–19, London local government is facing a reduction in core funding of 60 per cent in real
terms compared with 2010–11. Source: London Councils, ‘Autumn Statement 2014: London
Councils’ submission to HM Treasury’, 17 October 2014
12. BBC News, ‘Is the New York mayor the most powerful in the world?’, 14 August 2013,
available at: www.bbc.co.uk/news/magazine-23626980
13. The Economist, ‘Decentralising Healthcare: Control Yourself ’, 28 February 2015 , available at:
www.economist.com/news/britain/21645237-manchester-gets-new-dollop-autonomy-
control-yourself
14. NYC – Mayor’s Office of Data Analytics, ‘Annual Report 2013’, December 2013, p.3
15. Stephen Goldsmith & Susan Crawford, The Responsive City, Jossey-Bass, San Francisco,
2014, p.122
16. Ibid, p.121
17. Ibid, p.126
18. Ibid, p.127
19. NYC – Mayor’s Office of Data Analytics, ‘Annual Report 2013’, December 2013, p.14
20. Ibid, p.14
21. Ibid, p.3
22. Ibid, p.7
23. Ibid, p.7
24. Ibid, p.2
25. Ibid, p.6
26. Ibid, p.8
27. NYC Environmental Protection, ‘Preventing Grease Discharges Into Sewers’, available at:
www.nyc.gov/html/dep/html/businesses/busgrease_wide.shtml
28. New York Times, ‘The Mayor’s Geek Squad’, 23 March 2013, available at: www.nytimes.
com/2013/03/24/nyregion/mayor-bloombergs-geek-squad.html

50 Big data in the big apple
29. NYC – Mayor’s Office of Data Analytics, ‘Annual Report 2013’, December 2013, p.9
30. Ibid, p.19
31. Ibid, p.6–7
32. Ibid, p.7
33. Ibid, p.7
34. Ibid, p.8
35. Ibid, p.8
36. Ibid, p.9
37. Ibid, p.9
38. Ibid, p.8
39. NYC – Mayor’s Office of Data Analytics, ‘Annual Report 2013’, December 2013, p.10
40. Ibid, p.11
41. Mike Flowers, ‘Beyond Open Data: The Data-Driven City’, Chapter 15 of Beyond Transparency:
Open Data and the Future of Civic Innovation, edited by Brett Goldstein with Lauren Dyson, availa-
ble at: http://beyondtransparency.org/chapters/part-4/beyond-open-data-the-data-driven-city/
42. All the process details in this chapter are taken from: Mike Flowers, ‘Memorandum on MODA
Project Process Flow’, September 2013
43. Mike Flowers, ‘Beyond Open Data: The Data-Driven City’, Chapter 15 of Beyond Transparency:
Open Data and the Future of Civic Innovation, edited by Brett Goldstein with Lauren Dyson, availa-
ble at: http://beyondtransparency.org/chapters/part-4/beyond-open-data-the-data-driven-city/
44. Stephen Goldsmith & Susan Crawford, The Responsive City, Jossey-Bass, San Francisco,
2014, p.15
45. Policy Exchange, ‘Small Pieces Loosely Joined: How smarter use of technology and data
can deliver real reform of local government’, January 2015
46. Policy Exchange interview with Mike Flowers, December 2014
47. Ibid
48. Mike Flowers, ‘Beyond Open Data: The Data-Driven City’, Chapter 15 of Beyond Transparency:
Open Data and the Future of Civic Innovation, edited by Brett Goldstein with Lauren Dyson, availa-
ble at: http://beyondtransparency.org/chapters/part-4/beyond-open-data-the-data-driven-city/
49. The importance for big data analysis of having the complete dataset (sometimes referred to
as ‘n=all’) has been explored by Viktor Mayer-Schönberger and Kenneth Cukier in Big Data:
A Revolution That Will Transform How We Live, Work, and Think, John Murray, 2013
50. Mike Flowers, ‘Beyond Open Data: The Data-Driven City’, Chapter 15 of Beyond Transparency:
Open Data and the Future of Civic Innovation, edited by Brett Goldstein with Lauren Dyson, availa-
ble at: http://beyondtransparency.org/chapters/part-4/beyond-open-data-the-data-driven-city/
51. BBC News, ‘London’s population high: Top metropolis facts’, 2 February 2015, available at:
www.bbc.co.uk/news/uk-england-london-31056626. See confirmation of population statistics
in London DataStore data: http://data.london.gov.uk/dataset/population-change-1939-2015/
resource/6fb637cf-d3c1-4456-a561-85cd995c020f
52. Evening Standard, ‘Two great cities – but London has the edge now over New York’, 16 February
2015, available at: www.standard.co.uk/comment/comment/edward-glaeser-two-great-cities--
but-london-has-the-edge-now-over-new-york-10049097.html
53. London GVA reported at: Office of National Statistics, ‘Regional Economic Indicators’, July
2014, available at: www.ons.gov.uk/ons/rel/regional-trends/regional-economic-indicators/
july-2014/rep-regional-economic-indicators.html
54. By 2018–19, London local government is facing a reduction in core funding of 60 per cent in real
terms compared with 2010–11. Combined with a rapidly increasing demand for local services,
London’s local authorities face a funding pressure of up to £3.4 billion by the end of the decade.
Source: London Councils, ‘Autumn Statement 2014: London Councils’ submission to HM
Treasury’, 17 October 2014

51Endnotes
55. The Economist, ‘Building on the boundaries’, 21 February 2015, available at: www.economist.
com/news/britain/21644193-there-pattern-londons-big-developments-building-boundaries
56. BT, ‘Public services: delivering the next generation of change’, April 2013, p.7, available at:
http://connect.bt-comms.com/Dods-whitepaper.html
57. Confirmed in interviews with London City Hall Intelligence team, January 2015
58. Telegraph, ‘Blighted by an epidemic of ‘beds in sheds’’, 26 June 2013
59. DCLG, ‘£1.8 million to tackle scandal of ‘beds in sheds’, 11 May 2012, available at:
www.gov.uk/government/news/1-8-million-to-tackle-scandal-of-beds-in-sheds. The other
area in the top nine is Peterborough
60. Ibid
61. DCLG, ‘Council Tax: empty homes premium’, 7 May 2013, available at:
www.gov.uk/government/publications/council-tax-empty-homes-premium
62. London Councils, ‘2014/15 Council tax monitor’, available at: www.londoncouncils.gov.uk/
policylobbying/localgovernmentfinance/taxation/ctax/
63. View the full case study at: Fujitsu, ‘Case Study: Gravesham Borough Council’, November 2013,
available at: www.fujitsu.com/fts/about/resources/case-studies/CS-Gravesham-Borough-
Council-171013.html
64. Average number of professional Food Hygiene and Food Standards FTE (Full time equivalent)
posts reported in LAEMS 2013/14 for 33 London boroughs (including City of London),
as listed at: www.food.gov.uk/enforcement/monitoring/laems/mondatabyyear/ocd201314
as on 4 March 2015
65. Number based on average of all London boroughs from data accessed at: http://data.gov.uk/
dataset/uk-food-hygiene-rating-data on 24 February 2015.
66. Food Standards Agency, ‘Food Law Code of Practice: A5.4 Food hygiene minimum inter-
vention frequencies’, available at: www.food.gov.uk/enforcement/enforcework/food-law/
annex5-food-establish-intervention/a54-food-hygiene-minimum
67. Number based on total number of inspections for all London boroughs from data accessed at:
http://data.gov.uk/dataset/uk-food-hygiene-rating-data as on 24 February 2015
68. NHS Choices, Food Poisoning, available at: www.nhs.uk/conditions/food-poisoning/
Pages/Introduction.aspx
69. Start-up Britain, ‘New Figures Reveal Regional Entrepreneurial Hotspots’,
23 January 2014, available at: www.startupbritain.co/news/2014-01-26/
new-figures-reveal-regional-entrepreneurial-hotspots
70. Wall Street Journal, ‘Uber Offers Trip Data to Cities, Starting With Boston’,
13 January 2015, available at: http://blogs.wsj.com/digits/2015/01/13/
uber-offers-trip-data-to-cities-starting-in-boston/
71. Source: BT, ‘Public services: delivering the next generation of change’, April 2013, p.4&6,
http://connect.bt-comms.com/Dods-whitepaper.html
72. Mike Flowers, ‘Beyond Open Data: The Data-Driven City’, Chapter 15 of Beyond Transparency:
Open Data and the Future of Civic Innovation, edited by Brett Goldstein with Lauren Dyson, availa-
ble at: http://beyondtransparency.org/chapters/part-4/beyond-open-data-the-data-driven-city/
73. See: www.bartlett.ucl.ac.uk/casa
74. See: www.socrata.com
75. See: http://ckan.org
76. HM Government / LGA, ‘Local Public Service Transformation A Guide to Whole Place
Community Budgets’, March 2013, p.5
77. See http://communitybudgets.org.uk/ for details about the scheme
78. Mike Flowers, ‘Beyond Open Data: The Data-Driven City’, Chapter 15 of Beyond Transparency:
Open Data and the Future of Civic Innovation, edited by Brett Goldstein with Lauren Dyson, availa-
ble at: http://beyondtransparency.org/chapters/part-4/beyond-open-data-the-data-driven-city/

Tucked away in City Hall, a small team of data analyts has been unleashing a data revolution in New York City. Established under Mayor Michael Bloomberg, the Mayor’s Office of Data Analytics (MODA) combines and interrogates data from numerous different city sources to increase the efficiency and effectiveness of government operations and services.
Big Data in the Big Apple provides a detailed account of the MODA model, its methods and achievements. It explains how MODA has helped to target the city’s resources at areas of greatest need, encourage collaboration between different departments and agencies, predict and prevent problems from occurring, and support economic development.
The report argues that London should establish its own Mayor’s Office of Data Analytics to bring the same benefits to the British capital. Identifying the core principles and lessons from the experience of New York City, it outlines how the MODA model could be adapted to address the specific challenges facing London. Overall, Big Data in the Big Apple highlights how the methods established in New York represent one of the most powerful and effective models devised to date for harnessing data to improve city living.