big data intro - introduction to data science
TRANSCRIPT
Introduction to Data Science
Frank Kienle Big Data Overview
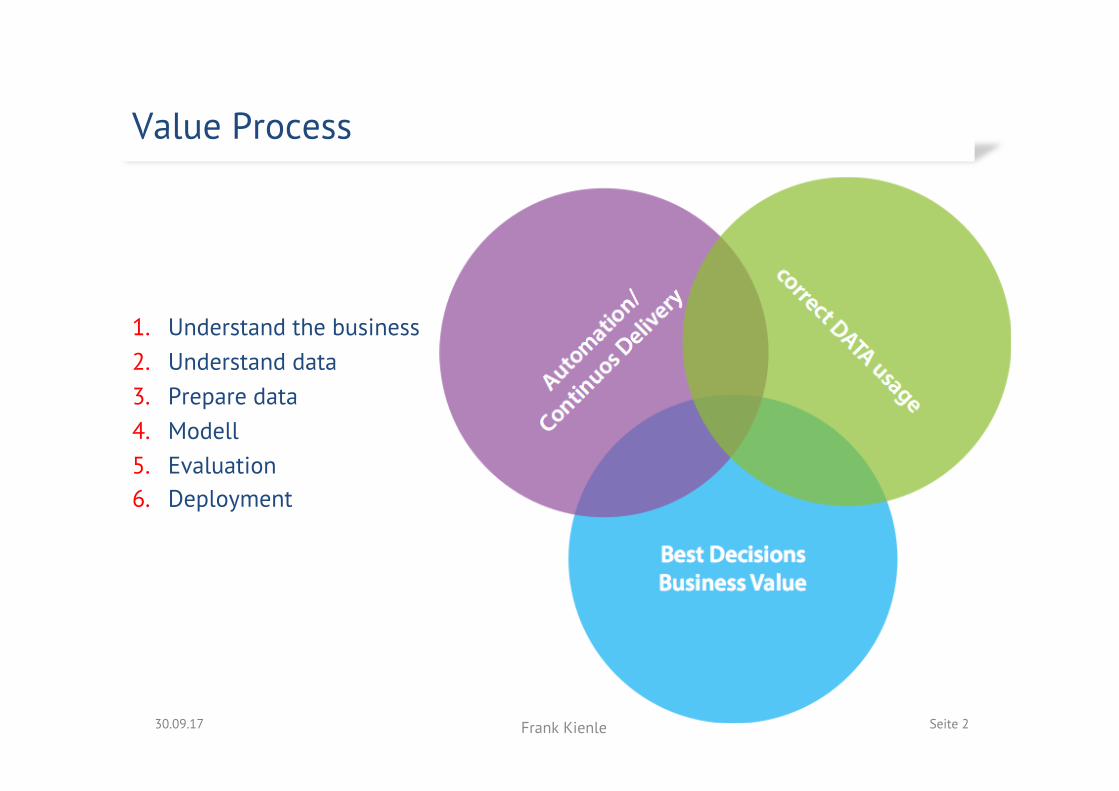
1. Understand the business 2. Understand data 3. Prepare data 4. Modell 5. Evaluation 6. Deployment
Value Process
30.09.17 Frank Kienle Seite 2

Data is a set of values of
qualitative or quantitative variables; restated, pieces of data are individual pieces of information
We store more and more data:
à Big Data ß
Data to Big Data
30.09.17 Frank Kienle p. 3

Erik Larson, Harper’s magazine: ‘The keepers of big data say they do it for the consumer’s benefit. But data have a
way of being used for purposes other than originally intended.’ (Reality today: private data is becoming commoditized)
Big Data definitions 1989
30.09.17 Frank Kienle 4
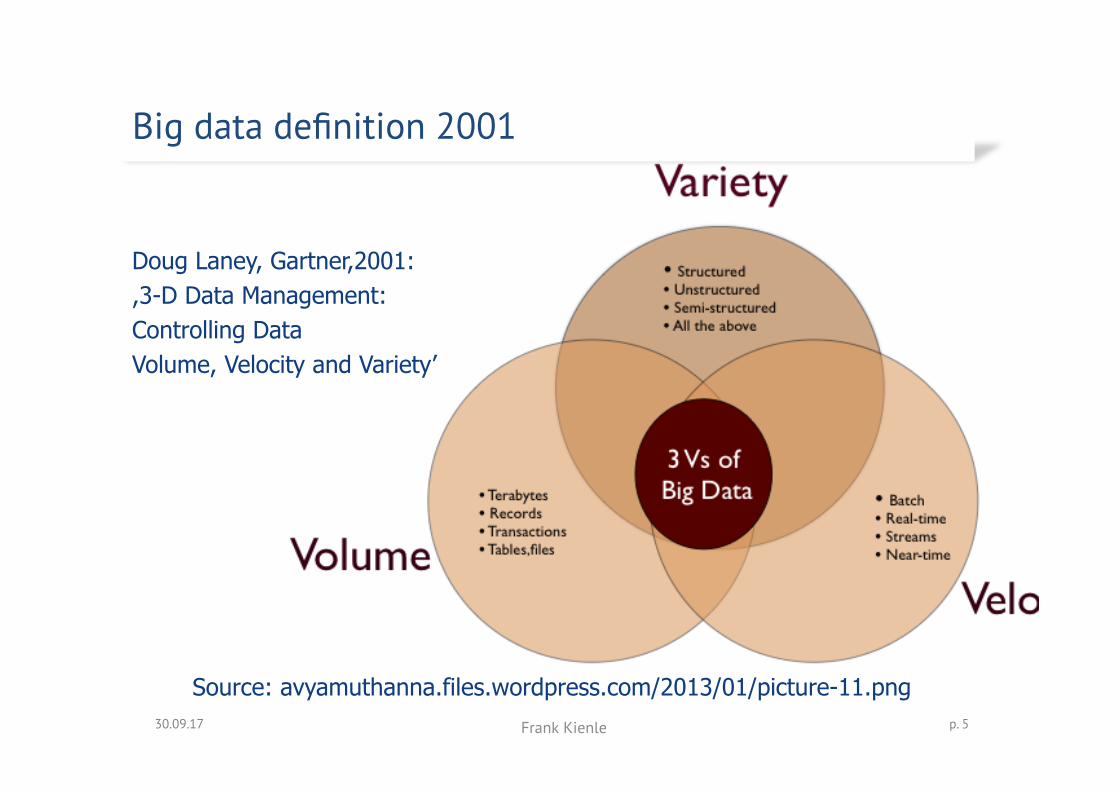
Big data definition 2001
30.09.17 Frank Kienle p. 5
Source: avyamuthanna.files.wordpress.com/2013/01/picture-11.png
Doug Laney, Gartner,2001: ,3-D Data Management: Controlling Data Volume, Velocity and Variety’

Big Data is any data that is expensive to manage and hard to extract value from
(Souce: Michael Franklin, Dirctor of the Algorithms, Machines and Computer Science, Unverisity of Berkeley)
Extracting value out of big data is all about predicting the futures based on observation of the past
Big Data today: it’s all about value
30.09.17 Frank Kienle 6
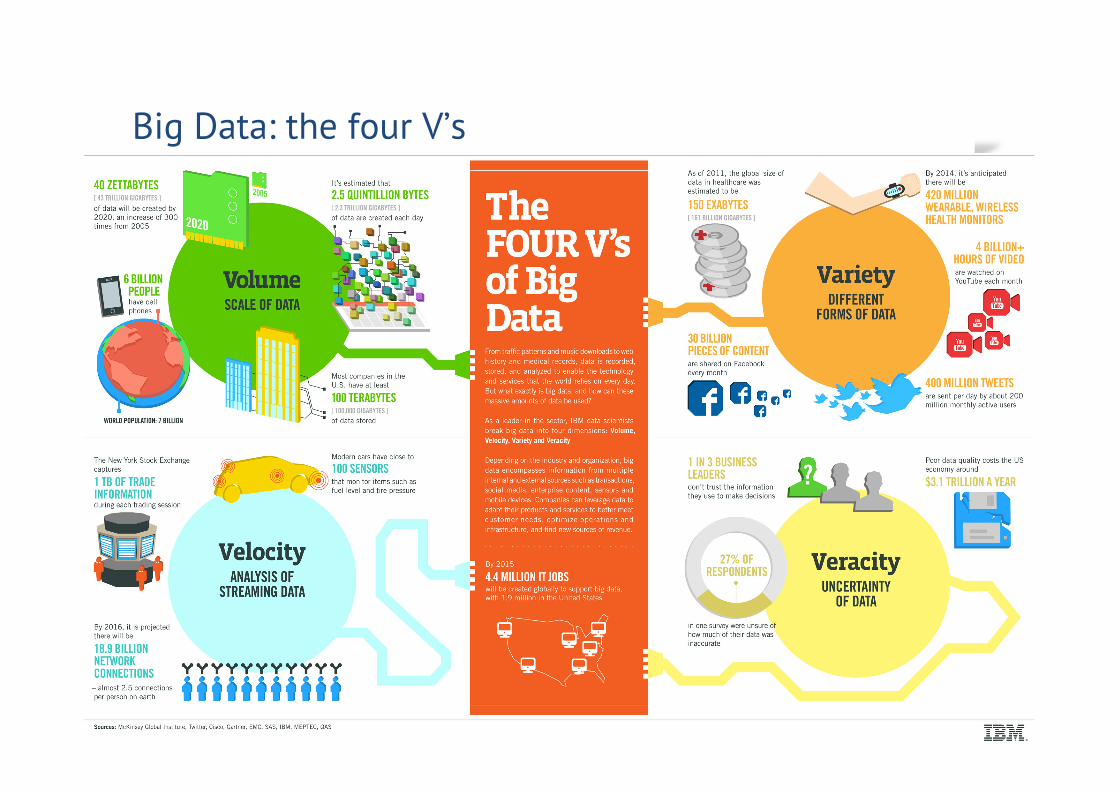
Big Data: the four V’s
30.09.17 Frank Kienle p. 7
handling (big) data is an art - not a value
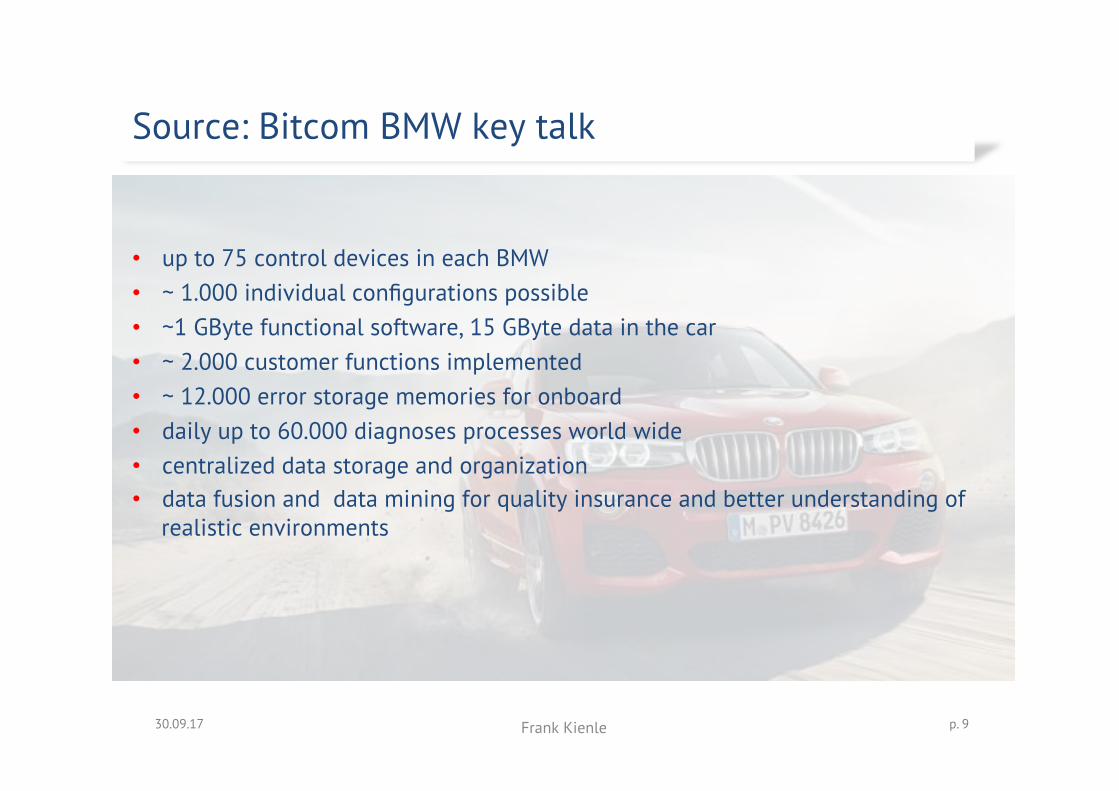
• up to 75 control devices in each BMW • ~ 1.000 individual configurations possible • ~1 GByte functional software, 15 GByte data in the car • ~ 2.000 customer functions implemented • ~ 12.000 error storage memories for onboard • daily up to 60.000 diagnoses processes world wide • centralized data storage and organization • data fusion and data mining for quality insurance and better understanding of
realistic environments
Source: Bitcom BMW key talk
30.09.17 Frank Kienle p. 9
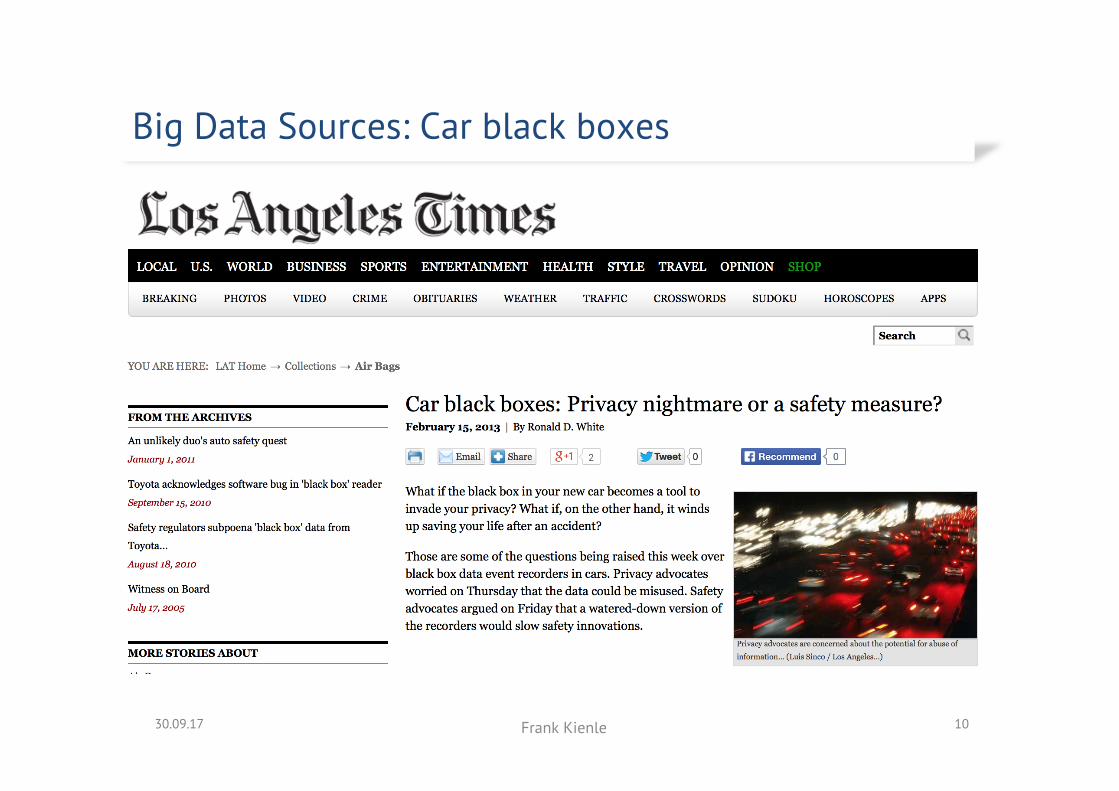
Big Data Sources: Car black boxes
30.09.17 Frank Kienle 10
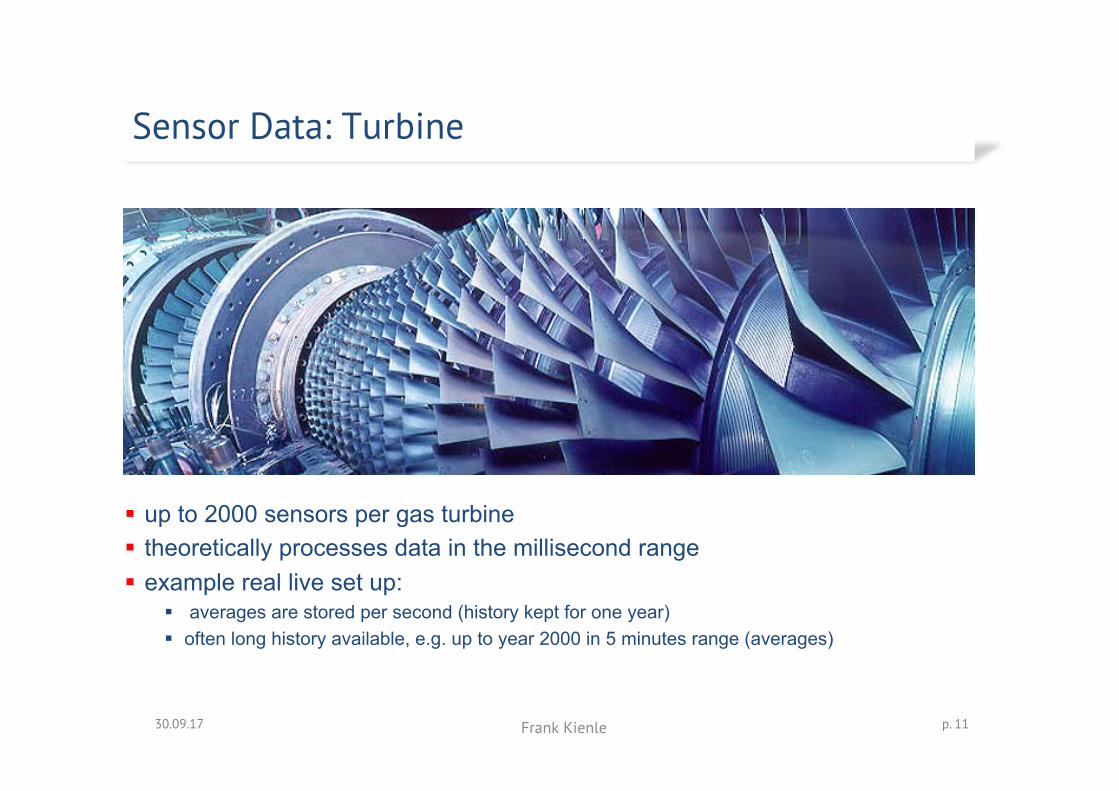
Sensor Data: Turbine
30.09.17 Frank Kienle p. 11
§ up to 2000 sensors per gas turbine § theoretically processes data in the millisecond range § example real live set up:
§ averages are stored per second (history kept for one year) § often long history available, e.g. up to year 2000 in 5 minutes range (averages)
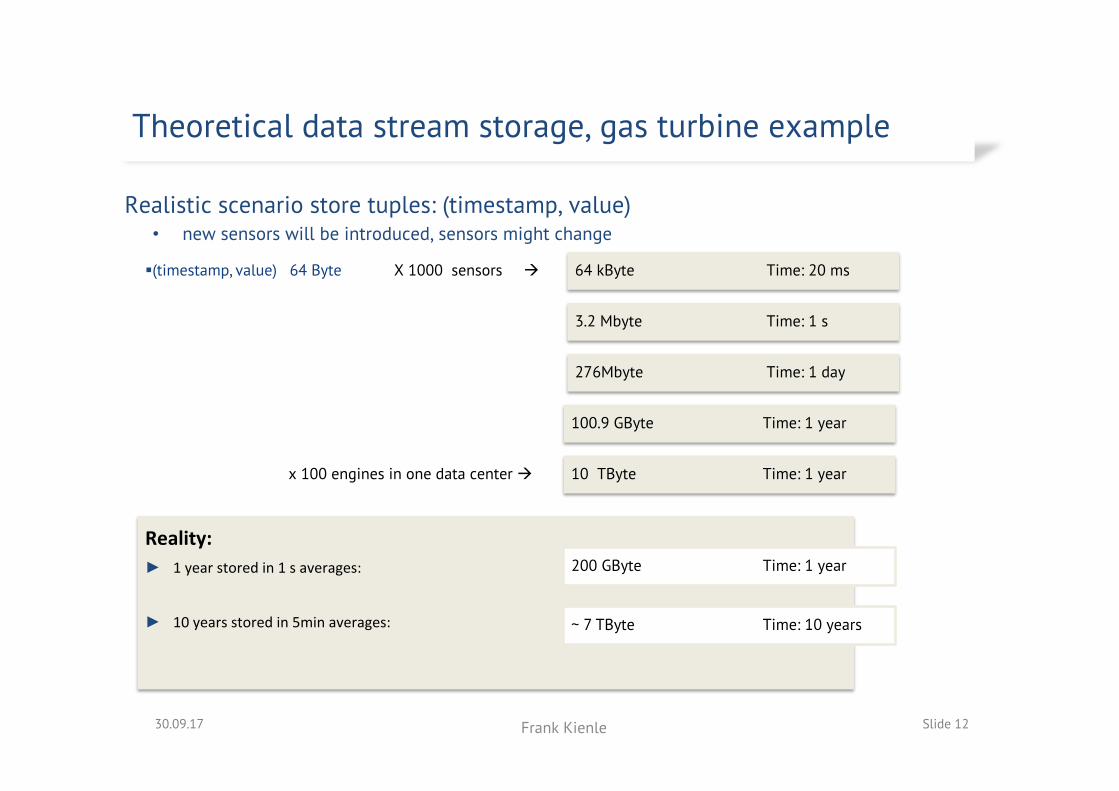
Realistic scenario store tuples: (timestamp, value) • new sensors will be introduced, sensors might change
Theoretical data stream storage, gas turbine example
30.09.17 Frank Kienle Slide 12
§ (timestamp, value) 64 Byte X 1000 sensors à
Reality:► 1yearstoredin1saverages:
► 10yearsstoredin5minaverages:
3.2 Mbyte Time: 1 s
276Mbyte Time: 1 day
100.9 GByte Time: 1 year
64 kByte Time: 20 ms
x 100 engines in one data center à
10 TByte Time: 1 year
200 GByte Time: 1 year
~ 7 TByte Time: 10 years
Big Data Landscape components to derive/extract value
30.09.17 Frank Kienle, p. 13

• Infrastructure und Hardware for Big
Data
• Big Data Distributions (e.g.. Hadoop)
• Components for data management (distributed data systems, in memory data bases,…)
• Tool boxes und Libraries (z.B. Qlickview, R, Matlab, SPSS, SAS,
Python)
• Services by extracting value (e.g. Blue Yonder, …)
Different fields for Big Data
30.09.17 Frank Kienle p. 14
Managing Big Data
Extracting value
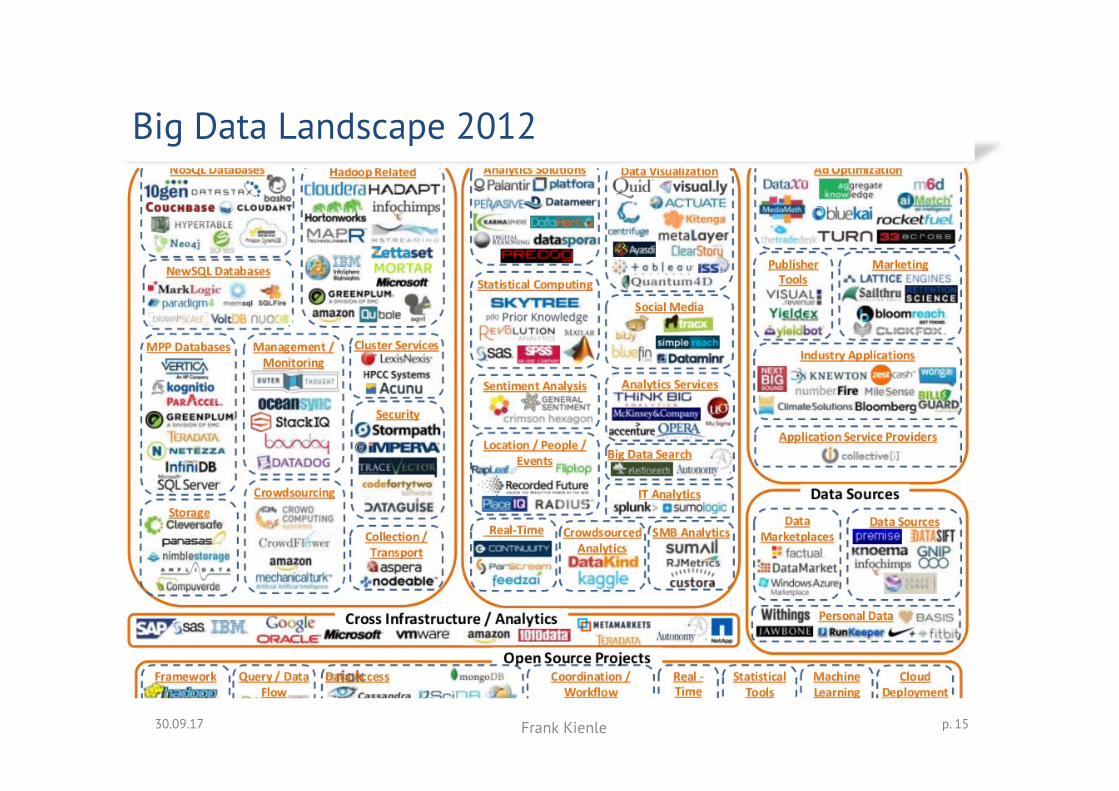
Big Data Landscape 2012
30.09.17 Frank Kienle p. 15
30.09.17 Frank Kienle p. 16
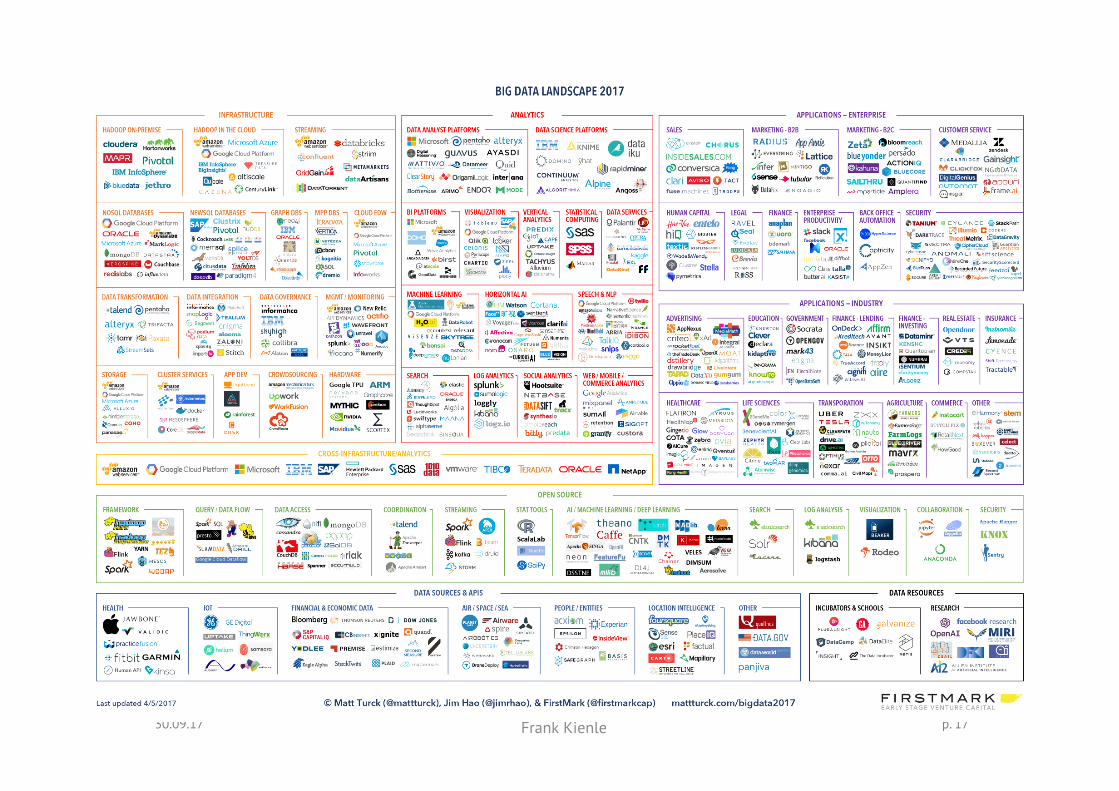
30.09.17 Frank Kienle p. 17
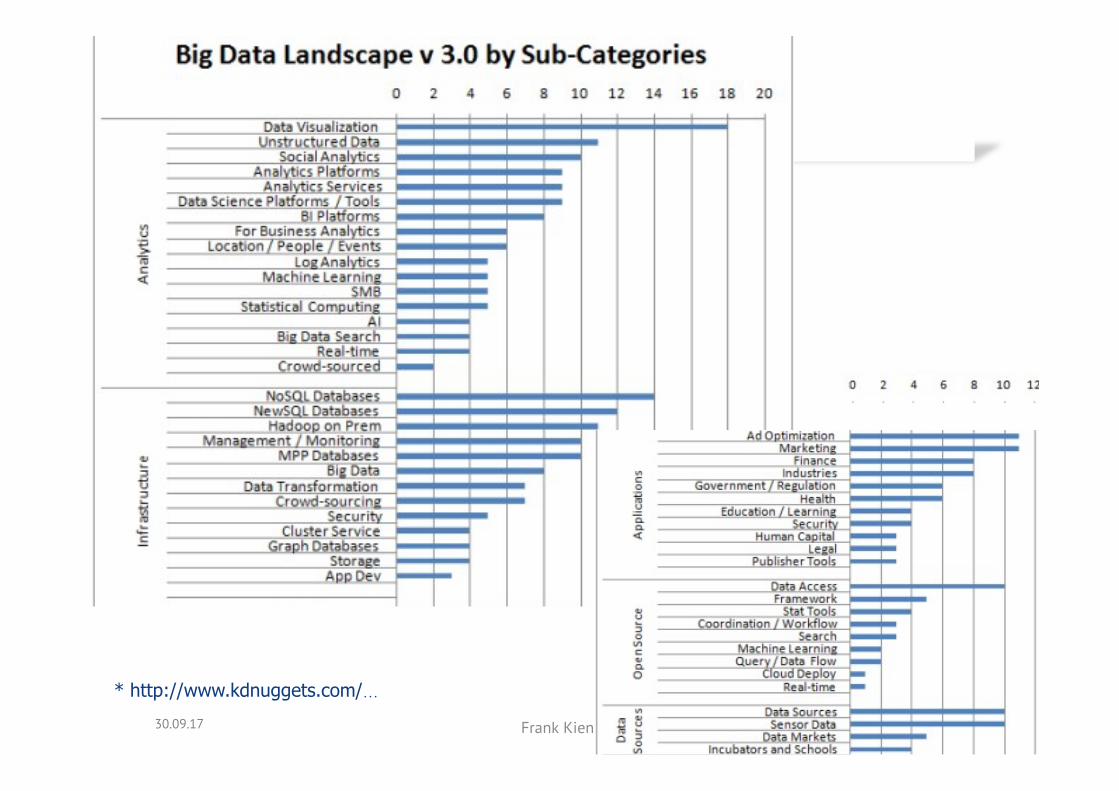
30.09.17 Frank Kienle p. 18
* http://www.kdnuggets.com/…

Data bases overview (further information separate lecture)
30.09.17 Frank Kienle 19

Visualization Tools (some practical tools/libraries, the purpose defines the tool)
30.09.17 Frank Kienle 20
PyhtonMatplotlibPythonBokeh
R
D3.js(VEGA)DygraphsGephi
TableauQlickview
ExcelMatlab
Open source programming language, active participation
Focus on, interactive data visualizations in web browsers
Often used for visualization due to its mighty capabilities and penetration
Professional tools to visualize and explore data
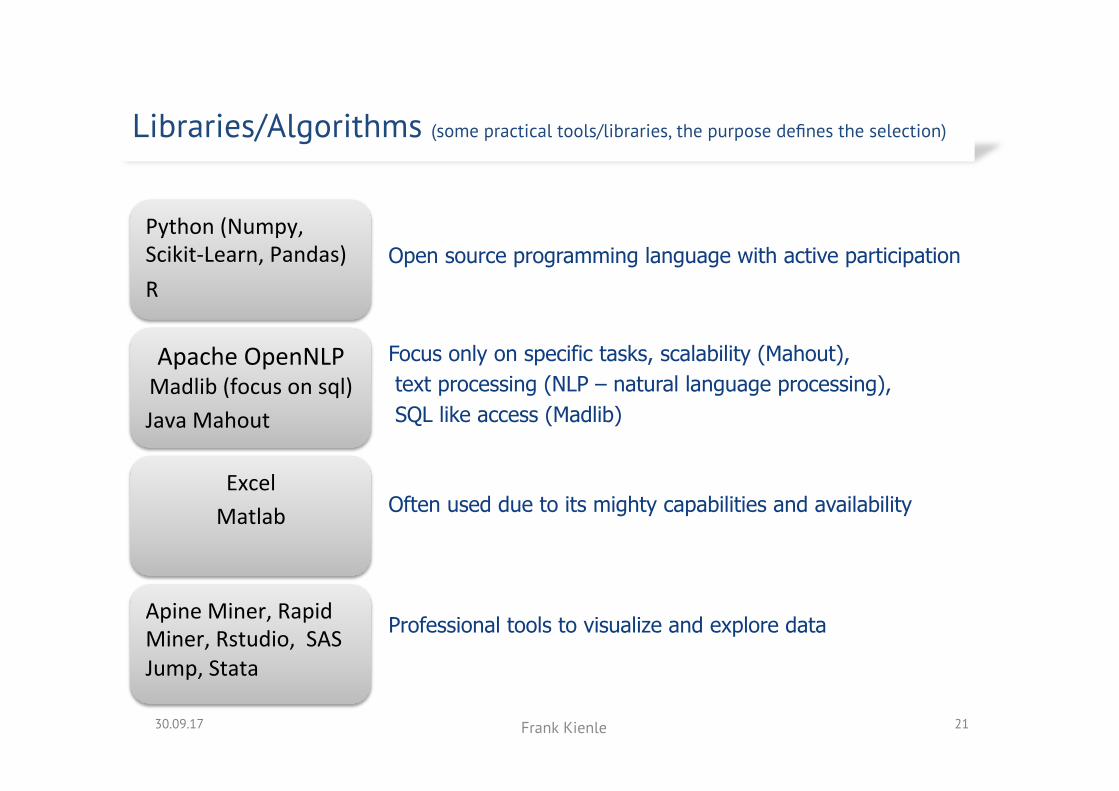
Libraries/Algorithms (some practical tools/libraries, the purpose defines the selection)
30.09.17 Frank Kienle 21
Python(Numpy,Scikit-Learn,Pandas)R
ApacheOpenNLPMadlib(focusonsql)JavaMahout
ApineMiner,RapidMiner,Rstudio,SASJump,Stata
ExcelMatlab
Open source programming language with active participation
Focus only on specific tasks, scalability (Mahout), text processing (NLP – natural language processing), SQL like access (Madlib)
Often used due to its mighty capabilities and availability
Professional tools to visualize and explore data
Introduction to Data Science
Frank Kienle Frameworks for Data Science
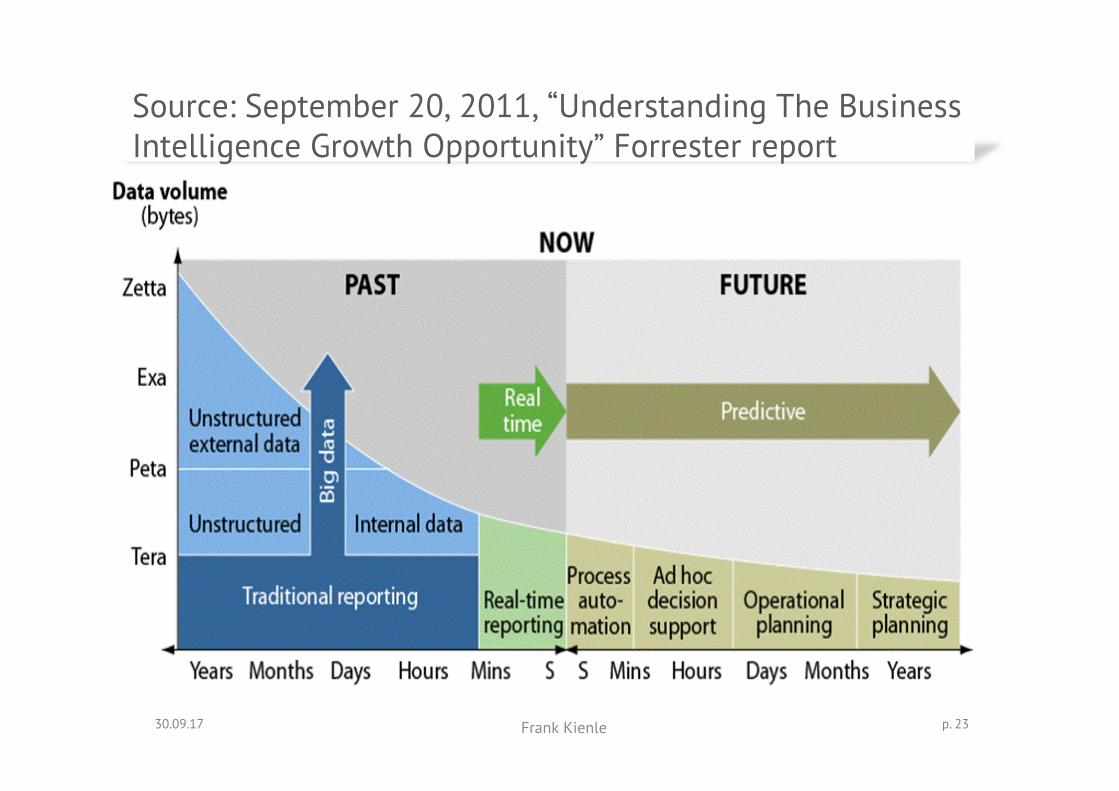
Source: September 20, 2011, “Understanding The Business Intelligence Growth Opportunity” Forrester report
30.09.17 Frank Kienle p. 23
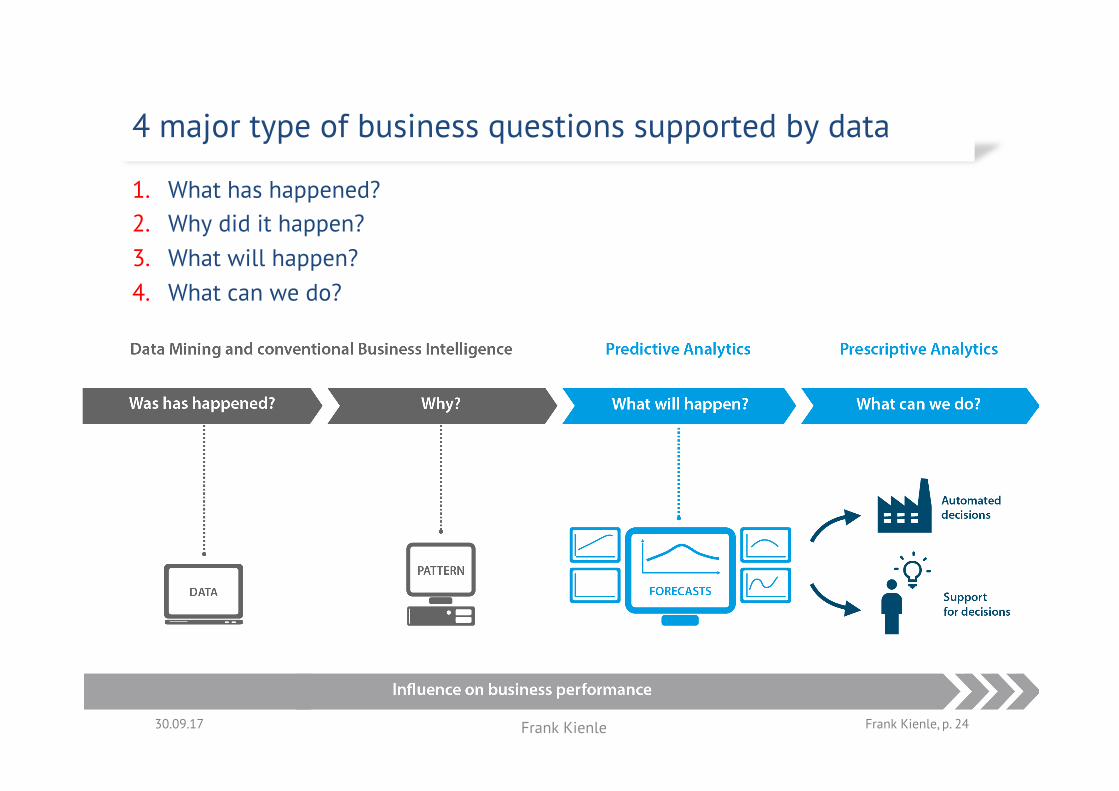
1. What has happened? 2. Why did it happen? 3. What will happen? 4. What can we do?
4 major type of business questions supported by data
30.09.17 Frank Kienle, p. 24 Frank Kienle
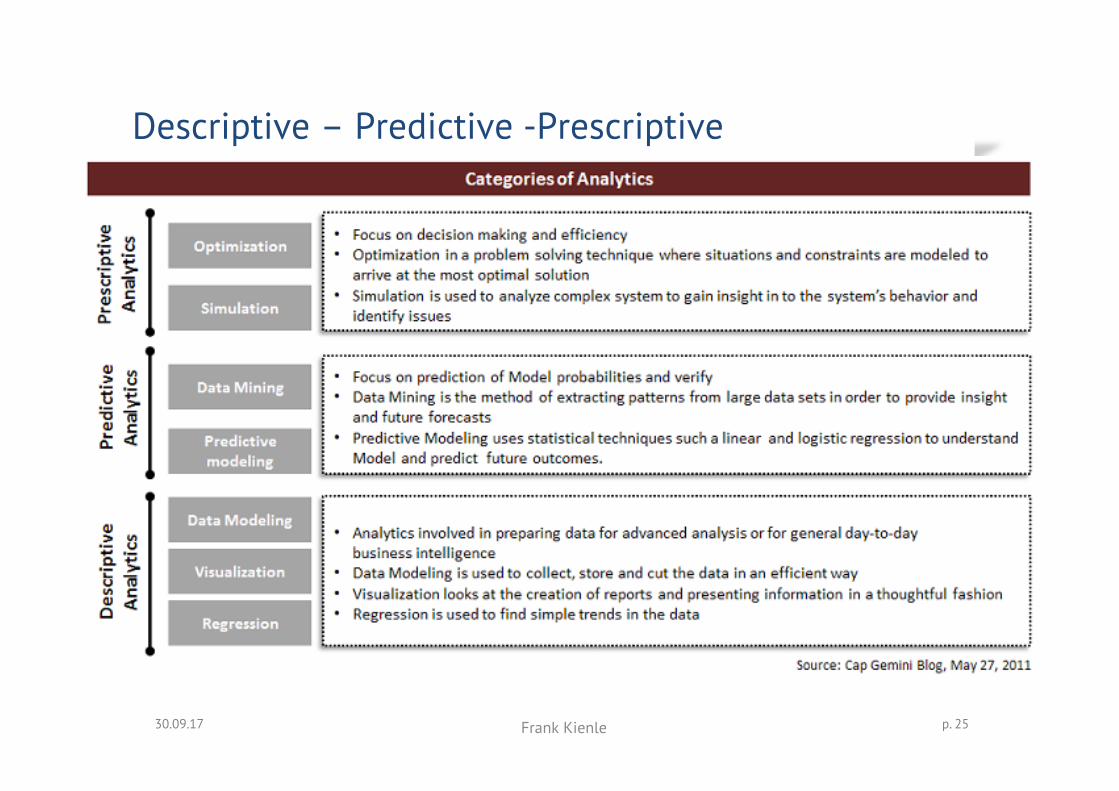
Descriptive – Predictive -Prescriptive
30.09.17 Frank Kienle p. 25
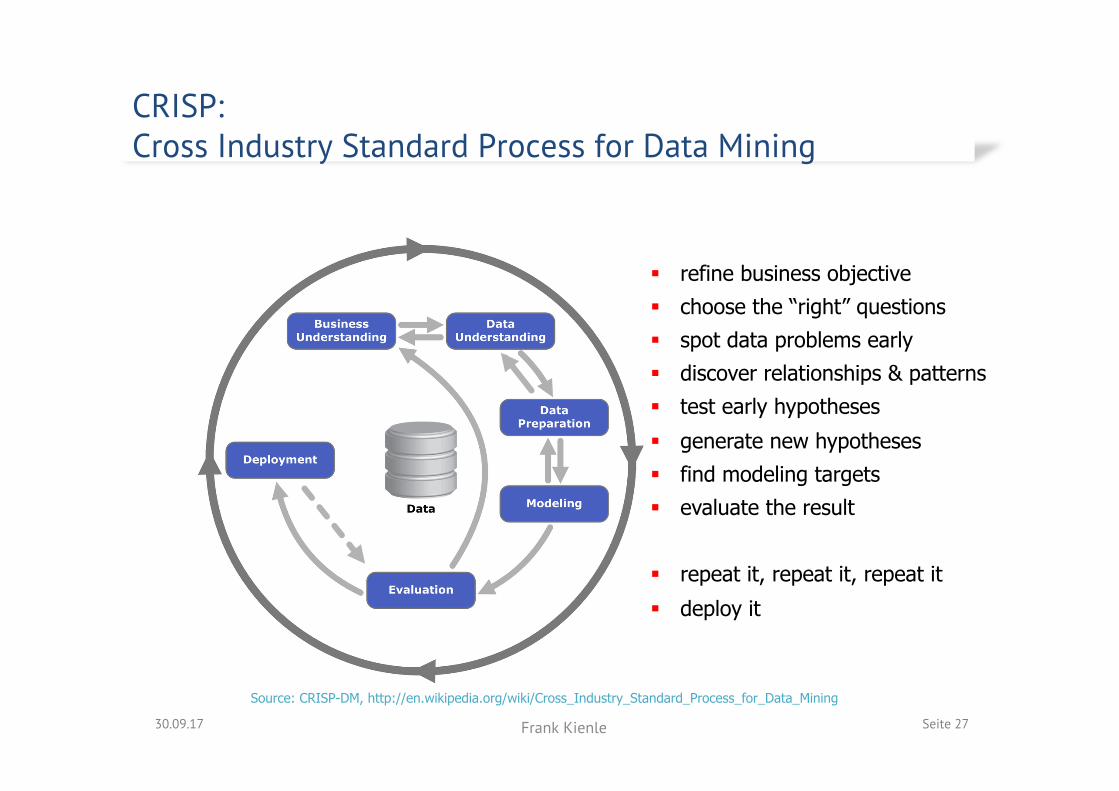
CRISP: Cross Industry Standard Process for Data Mining
30.09.17 Seite 27
Source: CRISP-DM, http://en.wikipedia.org/wiki/Cross_Industry_Standard_Process_for_Data_Mining
§ refine business objective § choose the “right” questions § spot data problems early § discover relationships & patterns § test early hypotheses
§ generate new hypotheses § find modeling targets § evaluate the result
§ repeat it, repeat it, repeat it
§ deploy it
Frank Kienle
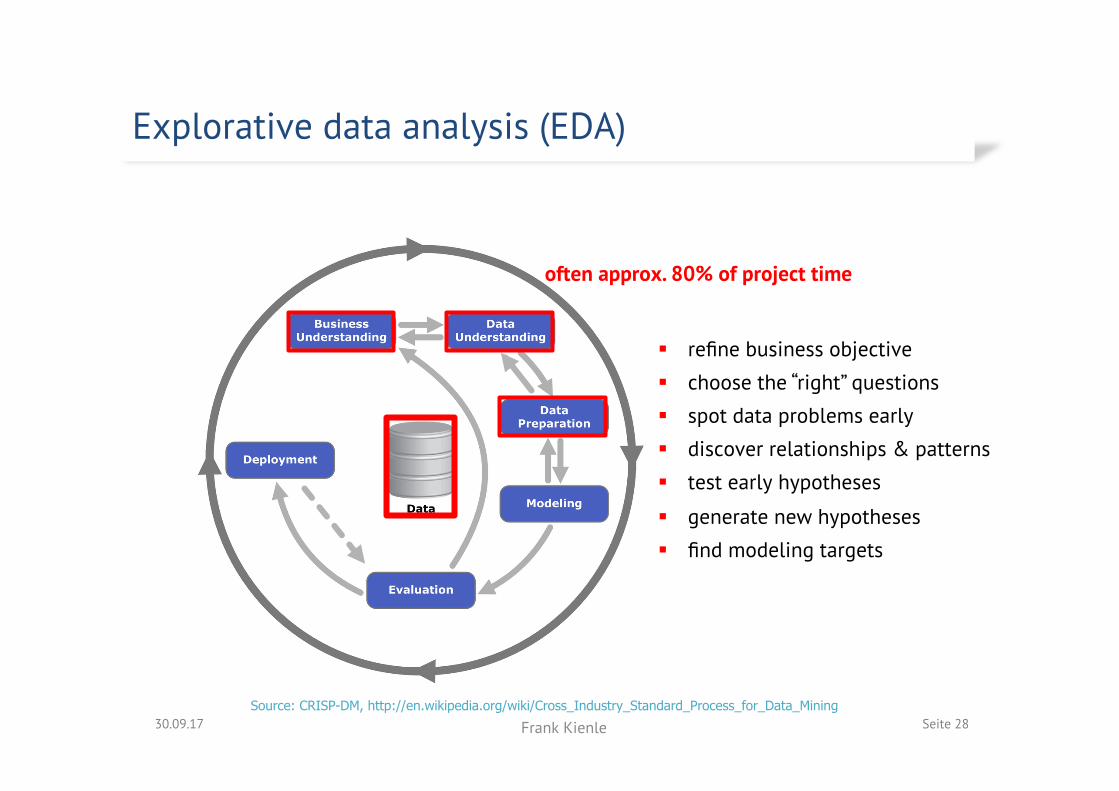
Explorative data analysis (EDA)
30.09.17 Seite 28 Source: CRISP-DM, http://en.wikipedia.org/wiki/Cross_Industry_Standard_Process_for_Data_Mining
§ refine business objective
§ choose the “right” questions
§ spot data problems early
§ discover relationships & patterns
§ test early hypotheses
§ generate new hypotheses
§ find modeling targets
often approx. 80% of project time
Frank Kienle
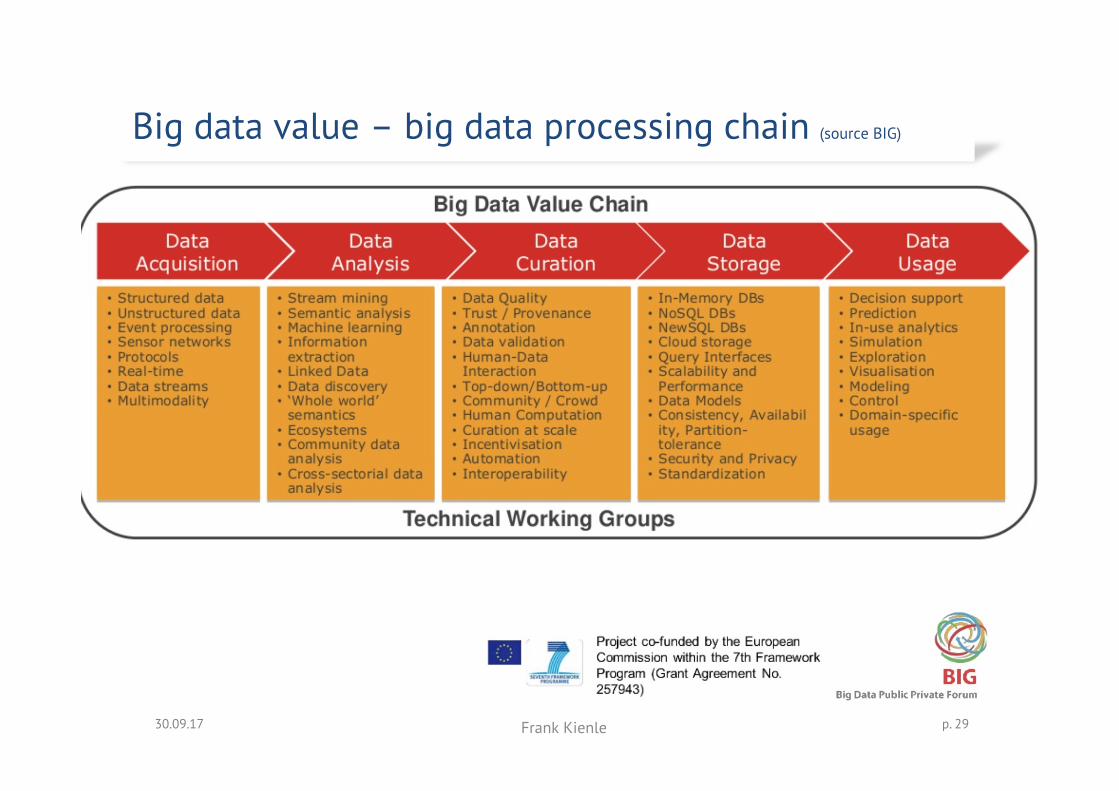
Big data value – big data processing chain (source BIG)
30.09.17 Frank Kienle p. 29
30.09.17 Frank Kienle p. 30