big data, small data, clean data, messy data - the...
TRANSCRIPT

Analytics-CRM Community Webinar
Big Data, Small Data, Clean Data, Messy Data Importance of Analytics and Data Refinement
Stephen Yu, President & Chief Consultant Willow Data Strategy, LLC
We will be starting at the top of the hour. Please stay on mute -- not hold. You will not hear anything until we start.

» Monthly Calls » Analytics Journal » Analytics Challenge
2015 – details soon
» DMA Advance – be a guest blogger
» Awareness – advertise or sponsor
» Self-Regulation – be compliant
Analytics-CRM Community » Industry Visibility –
be a speaker or discussion facilitator
» Thought Leader – assist in DMA content planning
» Members access all at http://thedma.org/acc

Upcoming Events
Register at www.thedma.org
May 13 Town Hall 2015 Analytic Journal Release
Jun 10 Big Data Enabled Analytics for Actionable Customer Insight
Amit Deshpande, Epsilon
July 8 Town Hall
Aug 12 Practical Text Analytics Steven Struhl, Converge Analytic

Analytics-CRM Community Webinar
Big Data, Small Data, Clean Data, Messy Data Importance of Analytics and Data Refinement
Stephen Yu, President & Chief Consultant Willow Data Strategy, LLC
Please stay on mute -- not hold. Use the chat function or Raise Hand feature to ask questions or share comments.

What we will cover • About the “Big Data” • Insights via Analytics • The Art of Targeting • “Analytics-Ready” Environment • Types of Data • Data Summarization & Categorization • Delivering the Answers • Closing the Loop
5

The Age of Ubiquitous Data In the word where even a refrigerator can order grocery items for the owner… » Data is everywhere, like in the Matrix » Every breath you take, every move you make…
Are you harnessing the power of data? Or are you just creating mounds of data?
6

Big Data, Small Data, Clean Data, Messy Data
How is the "Big Data” working out for you? 2.5 quintillion bytes collected per “day” 1 quintillion (exabytes) = 1 billion gigabytes
» Did all this data improve your decision making process? » Do you have the results to show for? » Information Overload? You bet!
Harness insights, drop the noise
7
Database Marketing Landscape
8
• No guessing game – You MUST know your target
• Vast amount of online & offline data collected But are they being used properly?
• Analytics play a huge roles in prospecting & CRM
• Short paced marketing cycle getting shorter • Huge difference between advanced marketers
and those who are falling behind
Winners are the ones who know how to wield the power of all available data faster.

Big Data Must Get Smaller Bragging about the “Size” is missing the point
• The popular definition of “Big Data” is off the mark
» 3V’s: Volume, Velocity, Variety So what? » Calling all data-based activities “Big Data”?
“Why count the grains of rice on the planet in front of a hungry man…”
• Data must provide “Insights” » Answers to questions
• Reduce the data into small answers » Yes/No, Probability, Scores
9

Smart Data, not Big Data Even the name is not right… “Big Data” must be “Smart Data” Not just about Volume, Velocity, Variety
Big Data must be about: 1. Cutting down the Noise 2. Providing the Answers
“Humanize the Data”
10

Big Data is No Magic Wand “Big Data this, Big Data that”
All hypes lead to overinvestments All overinvestments lead to disappointments All disappointments lead to blames
“Why Data”? – Define the Purpose 1. Formulate Business Questions 2. Obtain Answers via Analytics 3. Supporting databases must be Optimized for
Analytics
Big Data is about businesses, not IT or data
11
It is about the Users, too
For Decision makers: » Take the data seriously, not just your gut feelings » Define the goals first, then control the flow of data » Be logical, as there are no toolsets that read minds » Set specific goals for small successes
For Data Scientists: » Don’t be a “Data Plumber”, but a businessman » Don’t be technology oriented, but solution oriented » Don’t do things just because you can
12

It is NOT about Channels or Technologies
“The Future of Online is Offline” – Stephen H. Yu, 2002 » There is no such thing as an “online person”
• It is almost offensive • Outbound & Inbound channels are separate • Channel-centric view confuses buyers • New channels and technologies in the future – What then?
» This data business should be about “People” • Nobody is one-dimensional • “Buyer-centric” point of view
» Should NOT be channel, product, division or company centric – But most are » All those are just attributes or (“descriptors”) of individuals » Buyer-centric database structure leading to proper
“Personalization” • Never about the technology, but about the people who are
looking at the new device (or even thin air)
13

Insights, not Raw Data
14
Data players must excel in:
• Must provide “marketing answers” via advanced analytics, not just bits and pieces of data
• Insight does not come from data, it is derived from data But, too many players miss out the middle part
Collection
Size & speed matters
Refinement
Get to answers, not just ingredients
Delivery
For consumption by end-users

Build the Data Roadmap
A database is not just sum of all data sources
1. Business Goals 2. Answers via Analytics/Modeling 3. Databases Optimized for Analytics
Not the other way around!
15

Step-by-Step Approach
16
FORMULATING QUESTIONS
DATA INVENTORY & AUDIT
APPLYING THE KNOWLEDGE
RESULTS ANALYSIS
ANALYTICAL SPECS & DEVELOPMENT
DATA TRANSFORMATION & AUDIT
Formulating Questions
Results Analysis & Sharing
Campaign Management
Data Inventory & Audit
Applying the Knowledge
Data Transformation & Audit
Analytical Spec & Development
Business goals realized at the end of the cycle

Different Goals & Data for Different Industries
17
Banking, Finance & Credit Card
Travel, Hospitality & Entertainment
Retail – Online & Offline
Publications Telecommunications & Utilities
Non-Profit Catalog

Refined Answers
18
Raw Data • Demographic / Firmographic • RFM • Products & Services Used • Promotion / Response
History • Lifestyle / Survey Responses • Delinquent history • Call / Communication Log • Movement Data • Sentiments
Marketing Answers • Likely to buy a luxury car • Likely to take a foreign vacation • Likely to donate for a specific cause • Likely to response to free shipping
offer • Likely to be a high value customer • Likely to be qualified for credit • Likely to upgrade • Likely to leave • Likely to come back
Formulate the answers via advanced analytics

Different Types of Analytics
19
“Analytics” means different things…
» BI (Business Intelligence) Reporting: Display of success metrics, dashboard reporting
» Descriptive Analytics: Profiling, segmentation, clustering
» Predictive Modeling: Response models, cloning models, value models, revenue models, etc.
» Optimization: Channel optimization, marketing spending analysis, econometrics models
Predictive Modeling for 1-to-1 Marketing

Why Model?
20
• Increase Targeting Accuracy
• Reduce costs by contacting less/smart
• Stay relevant
• Consistent results
• Reveal hidden patterns in data
• Repeatable – key for automation
• Expandable
• “Supposedly” save time and effort
Models summarize complex data into simple-to-use “scores”
Why NOT Model?
21
» Universe is too small » Predictable data not available » 1-to-1 marketing channels not in
plan » Tight budget » Lack of resources
Really? Database Marketing is about:1. Knowing whom to engage 2. Knowing what to offer if you decided to engage someone Models provide answers for both

Models for Every Stage of Marketing Lifecycle
22

What is a Model?
“Model is a mathematical expression of differences between two dichotomous groups”
Target vs. Non-Target, such as » Buyer vs. Non-Buyer » Responder vs. Non-Responder » Loyal vs. Attrition » High Value vs. Low Value
Defining target and non-target is equally critical
23
The Art of Targeting “Some targets are not what they seem…”
Start by hanging the target in the right place
Remember T, C, M 1. Target 2. Comparison Universe 3. Methodology
» Defining the proper target is most critical - even more than the methodology
» Get involved in Target Definition! • State your goals and usages clearly • Don’t be a bad patient demanding specific prescriptions
24
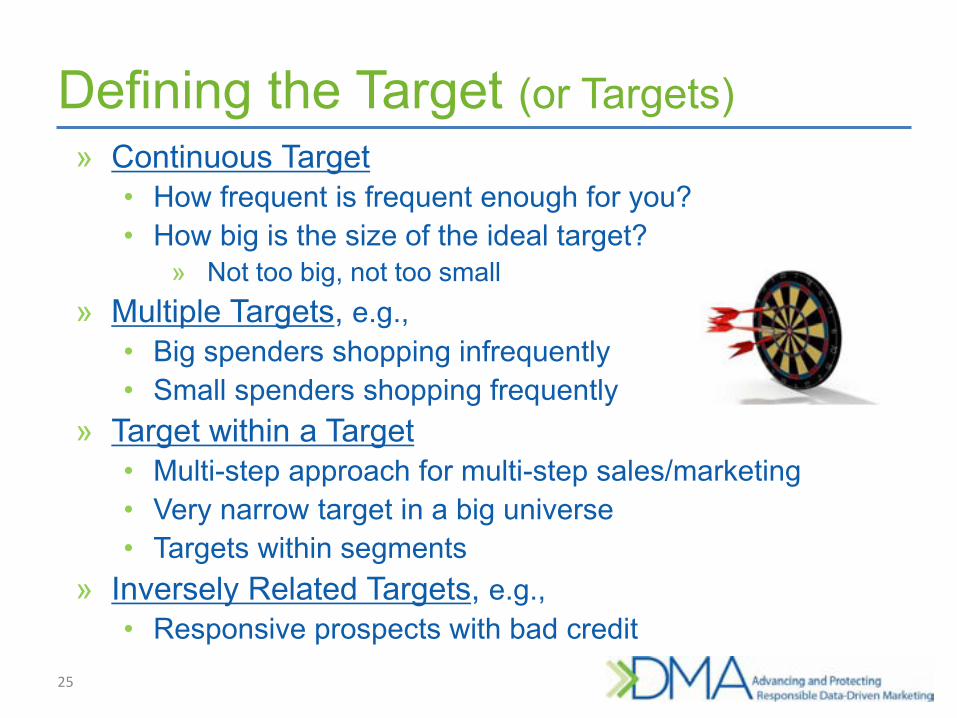
Defining the Target (or Targets) » Continuous Target
• How frequent is frequent enough for you? • How big is the size of the ideal target?
» Not too big, not too small » Multiple Targets, e.g.,
• Big spenders shopping infrequently • Small spenders shopping frequently
» Target within a Target • Multi-step approach for multi-step sales/marketing • Very narrow target in a big universe • Targets within segments
» Inversely Related Targets, e.g., • Responsive prospects with bad credit
25

Any Pain Implementing Models?
26
» Not easy to find “Best” customers » Modelers are fixing data all the
time » Rely on a few popular variables » Always need more variables » Takes too long to build models and
score » Inconsistencies shown when
scored » Disappointing results!

What Does Your Database Support?
27
If you have a database… • Order Fulfillment • Contact Management • Standard Reports • Ad hoc Reports and Queries • Name Selections • Response Analysis • Trend Analysis But does it support predictive modeling and scoring?

Define the Analytical Goals
28
» Rank & select prospect names » Cross-sell/up-sell » Segment the universe for messaging
strategy » Project customer value » Pinpoint attrition point » Optimize media/channel spending » Create product packages » Detect fraud
For Analytics, Clean the Data First
29
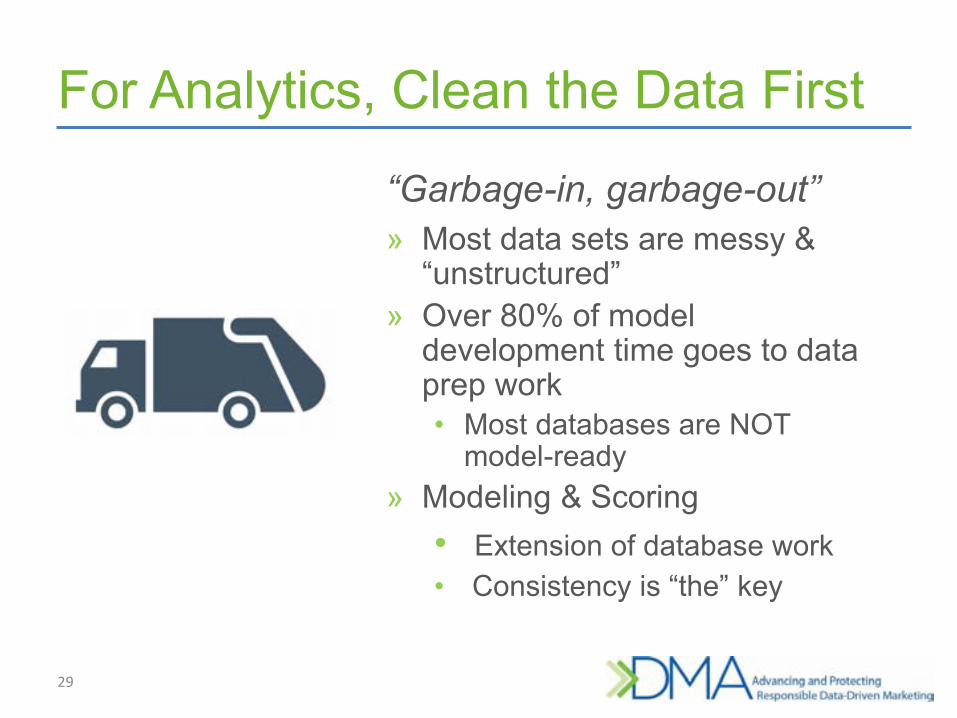
“Garbage-in, garbage-out”
» Most data sets are messy & “unstructured”
» Over 80% of model development time goes to data prep work • Most databases are NOT
model-ready» Modeling & Scoring
• Extension of database work • Consistency is “the” key

Predictive Modeling is All About “Ranking”
30
Determine the level of data accordingly • Relational or unstructured
databases won’t cut it • Must create “Descriptors” that
fit the level that needs to be ranked
1 2 3
Ultimately, Models must properly “Rank”
• Households • Individuals • Companies • Email Addresses • Products

Unstructured to Structured
31
» Most modern databases optimized for massive storage and rapid retrieval, not necessarily for predictive analytics o Relational databases
o NoSQL databases
» Need “Model-Ready” Environment, even temporarily o Structured & de-normalized
o Variables as descriptors of model targets
o Common analytical language (SAS, R, SPSS)
o Must support “in-database” scoring

Marketing Database Supporting Analytics » Database Optimized for Analytics
• Analytics supporting efficient targeting/personalization • “Buyer-Centric” Portrait
» Transform Brand/Product/Channel/Division-Centric data to “Descriptors” of the Target
» Proof of Concept • “Analytical Sandbox”
» Test the concept without overhauling existing DB structure
» End-to-end run – from data collection/enhancement to campaign execution/backend analysis
• Groundwork » Categorization/Binning » Meta-data Tables » Variable Creation
32

Analytical Sandbox – “Model-Ready” Environment
33
From Data Collection to Decisions. Then Repeat.
Why Front-end Data Hygiene Important?
34
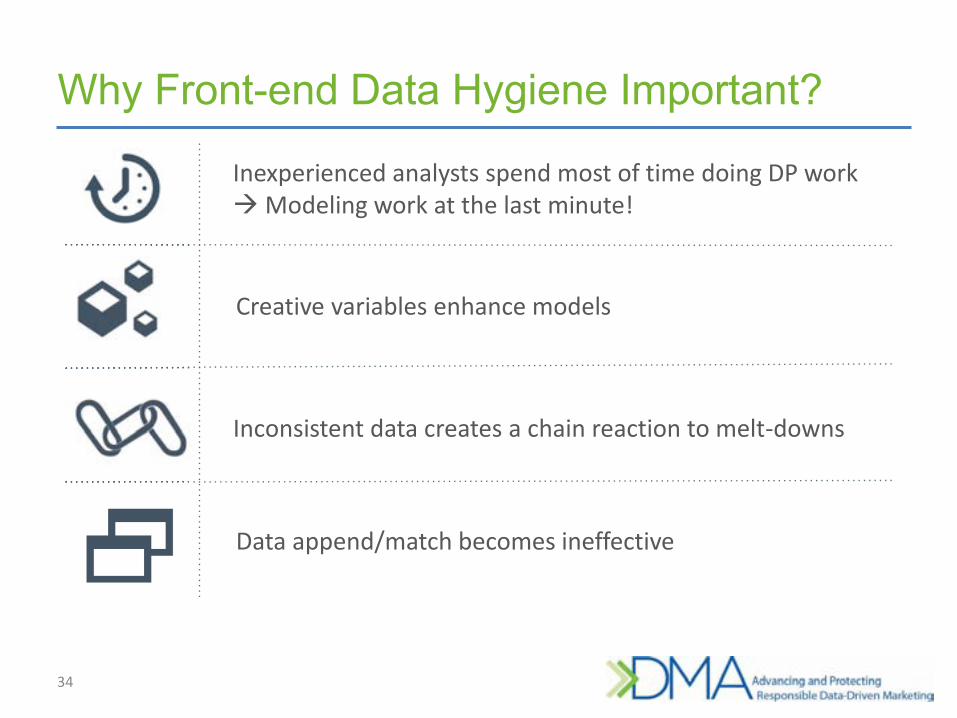
Data append/match becomes ineffective
Inconsistent data creates a chain reaction to melt-downs
Creative variables enhance models
Inexperienced analysts spend most of time doing DP work Modeling work at the last minute!
3 Major Types of Data for Marketing
35
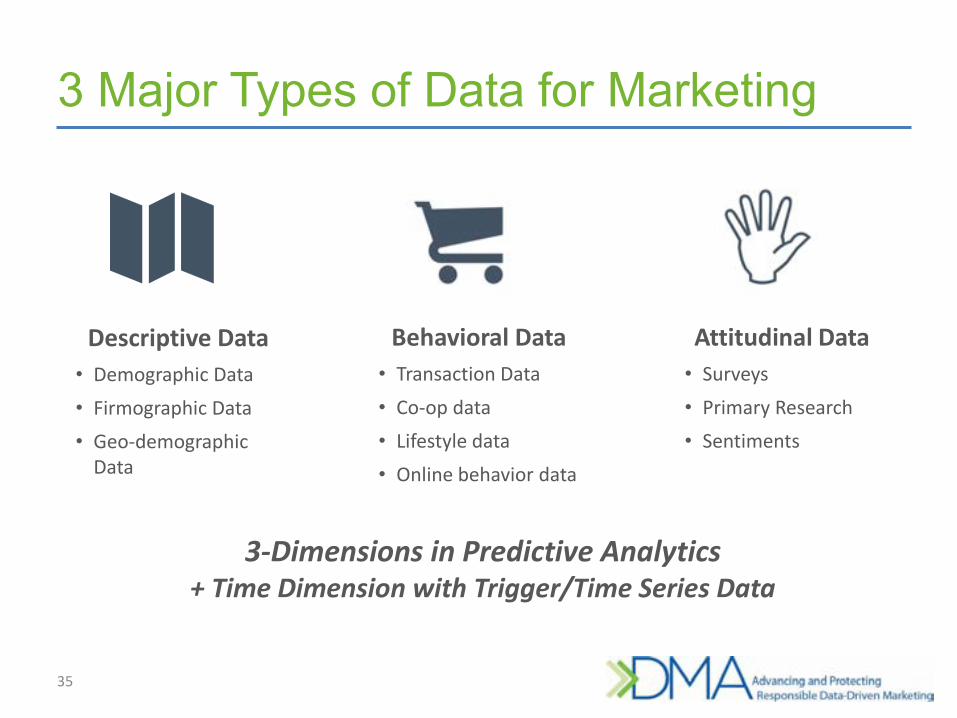
Behavioral Data • Transaction Data • Co-op data • Lifestyle data • Online behavior data
Descriptive Data • Demographic Data • Firmographic Data • Geo-demographic
Data
3-Dimensions in Predictive Analytics + Time Dimension with Trigger/Time Series Data
Attitudinal Data • Surveys • Primary Research • Sentiments

Data Source Evaluation Criteria 1. Depth: Content & uniqueness of data 2. Width: Data coverage 3. Accuracy: Free of errors or false positives 4. Recency: Fresh data / minimal data atrophy 5. Consistency: Matters more than sheer accuracy 6. Connectivity: To other data sources/systems 7. Delivery Mechanism: Query, drilldown, visualization 8. User-friendliness: Intuitive &meaningful data values 9. Cost: Development & maintenance costs
Not all data sources are create equal
36

Data Inventory
37
“Modeling is making the best of what is available” » Beyond obvious RFM data » Get Deeper
o Product/Service Level Data
o Historical Data
o Channel Data – Inbound & Outbound
o Online activities, sentiments, unstructured data
» External Data
Create Data Menu
38
• Base it on Companywide Need-Analysis
• Ask the Marketers & Analysts first:
What type of models are in the plan?
o Affinity/Look-alike Models
o Promotion/Response Models
o Time-series Models
o Attrition Models
• Consider non-analytical departments
• Maintain the ones that fit the objective
Don’t be afraid to throw out “noises”
Data Menu (continued)
39
Check the ingredients • What do you have today? • What can be bought? • What can be created?
Cost - Can you afford to maintain it? • Storage/Platform – Consider the
scoring part, too • Programming/Processing Time • Software • Update • External Data
Data Menu (continued)

Check the Data Inventory
40
You may have more than you thought: • Name & Address: Key to Geo/Demographic Data • Order Transaction Data: “RFM”, Payment Methods • Item/SKU Level Data: Products, Price, Units • Promotion/Response History: Source, Channel, Offer • Life-to-Date/Past “x” Months Summary Data • Customer Level Status Flags: Active, Dormant, Delinquent • Surveys/Product Registration Forms : Attitudinal/Lifestyle • Customer Communication History Data: Call-center, Web • Social Media, Click-through, Page-views :
Sentiment/Intentions
Need Conversion, Categorization, & Summarization

Maximize the Power of Transaction Data
41
Most databases describe shopping baskets Start describing your targets
• RFM Data must be Summarized (or De-normalized)
• Turn RFM data into individual / household level “Descriptors”
• Combine with essential categorical variables (e.g., product, offer, channel, etc.)

Data Summarization – Matching the Level Of Data
42
Cust ID Order # Order Date $ Amount
000123 100011 2011-05-06 $199.99
000123 100128 2012-08-30 $50.49
000123 103082 2013-12-21 $128.60
003859 100036 2012-06-06 $43.99
003859 101658 2013-01-20 $43.99
003859 102189 2013-04-15 $119.45
003859 106458 2014-02-18 $43.99
004593 104535 2014-07-30 $354.72
016899 107296 2013-07-14 $199.99
019872 102982 2012-09-07 $128.60
019872 103826 2013-04-30 $499.99
019872 109056 2014-03-12 $59.99
Cust ID # Orders $ Total First Order
Date Last Order
Date
000123 3 $379.08 2011-05-06 2013-12-21
003859 4 $251.42 2012-06-06 2014-02-18
004593 1 $354.72 2014-07-30 2014-07-30
016899 1 $199.99 2013-07-14 2013-07-14
019872 3 $688.58 2014-09-07 2014-03-12
Order Table Order Summary Table

Sample Variables after Summarization
43
Before After Summarization
Recency
• Weeks since last online purchase • Years since member sign up • Days since last delinquent date • Months since last response date
Frequency
• Orders by offer type • Orders by product/service type • Payments by pay method • Average days between transactions
Monetary
• Total $ past 24 months • Life-to-date spending • Average dollars by channel • Average dollars by product type

RFM Data Summary - Timeline
44
Life-to-date Summary provides the historical view
May create bias towards tenured customers
Put time limit on variables (e.g. 12-month, 24-month, etc.)
May require higher number of variables and complicate the process
For Lifetime Value & Time Series Models
Must create historical arrays (daily, weekly, monthly counts of events)

Who Does the Summary Work?
45
Answer: Not the analyst or statistician!
Key Takeaway
The data variables must be consistent everywhere in the “Analytical Sandbox” • Main analytical database
• Model development sample
• Pool of records to be scored
Pre-built summary variables

Data Categorization & Tagging
46
Freeform data comes to life through categorization Don’t Give Up!
• Hidden data in: o Product, Service, Offer, Channel, Source, Status, Titles, Surveys,
etc.
• Have categorization guideline?
• Who will do it? o Consider text mining techniques
• What to throw out? o Keep data that matter in predictive modeling

Categorical Data
47
Offer Code
Example: • Flat Dollar Discount • % Discount • Buy 1, Get 1 Free • Free Shipping • No Payment Until… • Free Gift • etc…
Create uniform code
Categorize as much as possible at the data collection stage
Any Non-numeric Data • Product • Service • Offer • Channel • Source • Market • Region • Business Title • Member Status • Payment Status • etc…

Categorization Guideline
48
» Define the categories first » Categorize during data
collection » Categorize buyers, not
products » More specific the better » Cut out the noise » Consistency over accuracy » Automate as much as possible

Categorization Guidelines (continued)
49
Create Rules and DON’T Deviate from them
Create “Code” Structure Training & Automation
Be consistent throughout
Surveys, Data Entry, Product Taxonomy, Database, Analytics
Don’t allow too many variations (over 20) in one category
Break into multiple variables if necessary
Don’t forget the end goals and don’t over-do it
Must be “relevant”
Data Hygiene & Data Append
50
Do you know how many customers you have in your database?
• Data conversion o Create consistency o Standardization o Edit o Purge
• Cover all bases – PII & RFM Data
• Create rules and be consistent

Scoring Quality Control
51
Most troubles happen after the models are built…
Check: » Model Group Distributions » Variable distributions (values and indices) » Missing Values » Match rate for appended data » Scoring codes, including score breaks » Compare to previous runs – Check Deterioration
Set parameters for acceptable differences
and Enforce them
Check Deterioration
Error
Share the Model Scores
52
Model scores are packing large and complex data in a compact form!
• Sync model scores with other databases and data-marts
• Plan ahead: o Reserve spaces o Educate the users & Evangelize
• Store raw scores, not just model groups
• Match the Levels of Scores o Household o Individual o Company o Email o Product

Where to Begin with Analytical Sandbox
53
Spec it out: • Project Goals
• Data Source List (as detailed as possible)
• Final Variable List (for the analysts)
• Project Flow: o Data Collection
o Conversion & Edit
o Categorization
o Consolidation / Summarization
o Variable Creation
o Data Append
o Sampling
o Modeling
o Scoring
o Storage
o Selection / Campaign
o Backend Analysis

Who Will Build the Sandbox?
54
» In-house vs. Outsourcing – Consider: o Platform
o Software
o Programming
o Staffing
» Cost it out o Don’t forget the Update &
Maintenance Cost
» Involve Analysts for Variable List Review
» Don’t be shy and ask for help from specialists/consultants

Scope It Out
55
» Know what you need, but don’t over do it “Analytics is making the best
of what’s available”
» Take a phased approach o If budget is tight, start with low
hanging fruits o Phased approach: Proof of concept
to full commitment in steps o Maintain consistency o Keep the Historical Data

Key Takeaways 1. Big Data movement should be about making the data
smaller, providing insights to decision makers 2. Business first; it is not about data or technology 3. Invest in analytics – models can pack large amount data
into simple answers to questions 4. Databases must be optimized for analytics & modeling –
maintaining consistency is the key 5. Start small with a proof of concept – “Analytical Sandbox” 6. Stay involved, trust the data and be logical 7. Check every data source, but don’t wait for a perfect
dataset 8. Ask for help
56
Your turn
Use the chat function or Raise Hand feature to ask questions or share comments.
To contact Stephen directly:
Stephen H. Yu President & Chief Consultant Willow Data Strategy, LLC [email protected]
Check his website for complete list of articles, presentations, and interviews: www.willowdatastrategy.com

Analytics-CRM Community Updates 2015 Analytics Journal to be released soon! More resources at: www.thedma.org/acc
Continue the conversation: Linked In: Official DMA + the Analytics Community Group Twitter: @DMA_USA #dmacommunities Suggest topics: [email protected] Participate in the planning of projects Connect with more Communities: www.thedma.org
THANK YOU FOR ATTENDING