big data strategy and visualization · 2020-04-29 · big data strategy and visualization academic...
TRANSCRIPT
International Summer
Class Schedule
JUNE · 15-19 · COURSE 2020
Social media analytics, web-tracking, device sensors, wearable
computing and other technologies enable organizations to acquire,
manage and analyze massive amounts of data to better understand
their customers, products, competition, and markets. Armed with
the insights gleaned from big data, companies can improve
customer experience and products, optimize key business
processes and uncover new monetization opportunities. The
course will focus on teaching how combining existing and new
sources of data with advanced analytics can power new business
opportunities. Students will learn techniques, with a how-to guide
that shows them how to leverage big data to drive business value.
Full of practical techniques, real-world examples, and hands-on
exercises, this course will explore the technologies involved, as well
as how to find areas within the organization that can take full
advantage of big data.
June 15- June 19 | 6:00 pm - 09:30 pm
OFFICE HOURS: Monday - Friday 5:30 pm - 6:00 pm
Dr. Mouwafac Sidaoui
Big Data Strategy and Visualization

Big Data Strategy and Visualization
Learning outcomes
The learning goals of this course are focused on the key aspects of
basic and advanced analytical work performed by business school
graduates and include the following abilities:
· Decomposes current business strategies in order to link big data
initiatives to the organization's value creation processes
· Explores different value creation processes and models by using
software tools tocreate various data visualizations
· Teaches envisioning and facilitation techniques for ensuring
organizational alignment around a big data initiative
· Discusses different architectural approaches that take advantage
of new big data technology innovationsExplains issues
surrounding operationalizing big data, including organizational
structures, education challenges, and new big data-related roles
· Explains issues surrounding operationalizing big data, including
organizational structures, education challenges, and new big
data-related roles
· Understand the principles of creating effective mockups and its
effect on operationalizing analytics-driven decision making
· Provides methodology worksheets and exercises so readers can
apply techniques
· Includesreal-world examples from a variety of organizations
leveraging big data
Materials Required: · Go to www.tableau.com/academic/studentsyou can either
download the software for Windows or MAC
· Articles & Business Cases: Emailed to students and may be
available in the Faculty DropBox
www.dropbox.com/sh/7cp7o68id9wl5pv/AAAerxMyWc258Yb_jWy
aWqdDa?dl=0
· Online ClipsSuperstorehttp://www.tableau.com/learn/starter-kit
· Online Clips General Training
https://www.tableau.com/learn/training
Recommended
· Blog: https://infocus.emc.com/author/william_schmarzo/
Big Data Strategy and Visualization
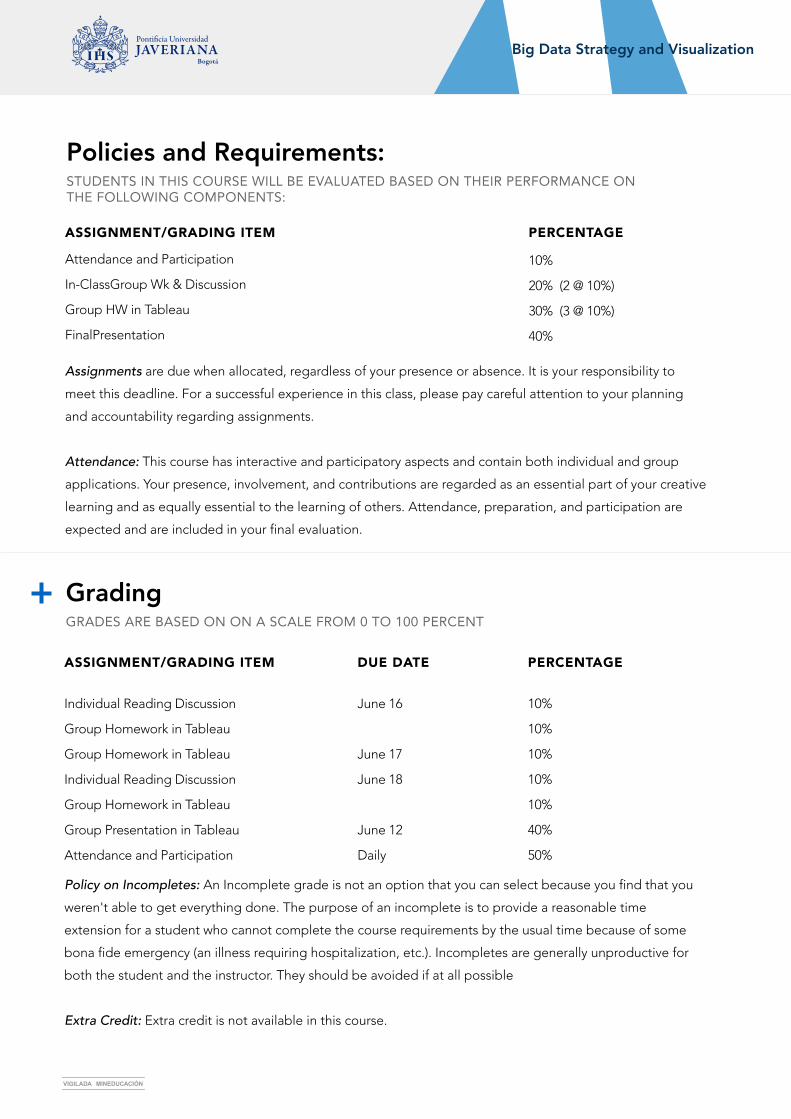
STUDENTS IN THIS COURSE WILL BE EVALUATED BASED ON THEIR PERFORMANCE ON THE FOLLOWING COMPONENTS:
ASSIGNMENT/GRADING ITEM PERCENTAGE
Policies and Requirements:
Attendance and Participation
In-ClassGroup Wk & Discussion
Group HW in Tableau
FinalPresentation
10%
20% (2 @ 10%)
30% (3 @ 10%)
40%
Assignments are due when allocated, regardless of your presence or absence. It is your responsibility to
meet this deadline. For a successful experience in this class, please pay careful attention to your planning
and accountability regarding assignments.
Attendance: This course has interactive and participatory aspects and contain both individual and group
applications. Your presence, involvement, and contributions are regarded as an essential part of your creative
learning and as equally essential to the learning of others. Attendance, preparation, and participation are
expected and are included in your final evaluation.
GRADES ARE BASED ON ON A SCALE FROM 0 TO 100 PERCENT
ASSIGNMENT/GRADING ITEM DUE DATE PERCENTAGE
Grading
Individual Reading Discussion
Group Homework in Tableau
Group Homework in Tableau
Individual Reading Discussion
Group Homework in Tableau
Group Presentation in Tableau
Attendance and Participation
June 16
June 17
June 18
June 12
Daily
10%
10%
10%
10%
10%
40%
50%
Policy on Incompletes: An Incomplete grade is not an option that you can select because you find that you
weren't able to get everything done. The purpose of an incomplete is to provide a reasonable time
extension for a student who cannot complete the course requirements by the usual time because of some
bona fide emergency (an illness requiring hospitalization, etc.). Incompletes are generally unproductive for
both the student and the instructor. They should be avoided if at all possible
Extra Credit: Extra credit is not available in this course.
Big Data Strategy and Visualization
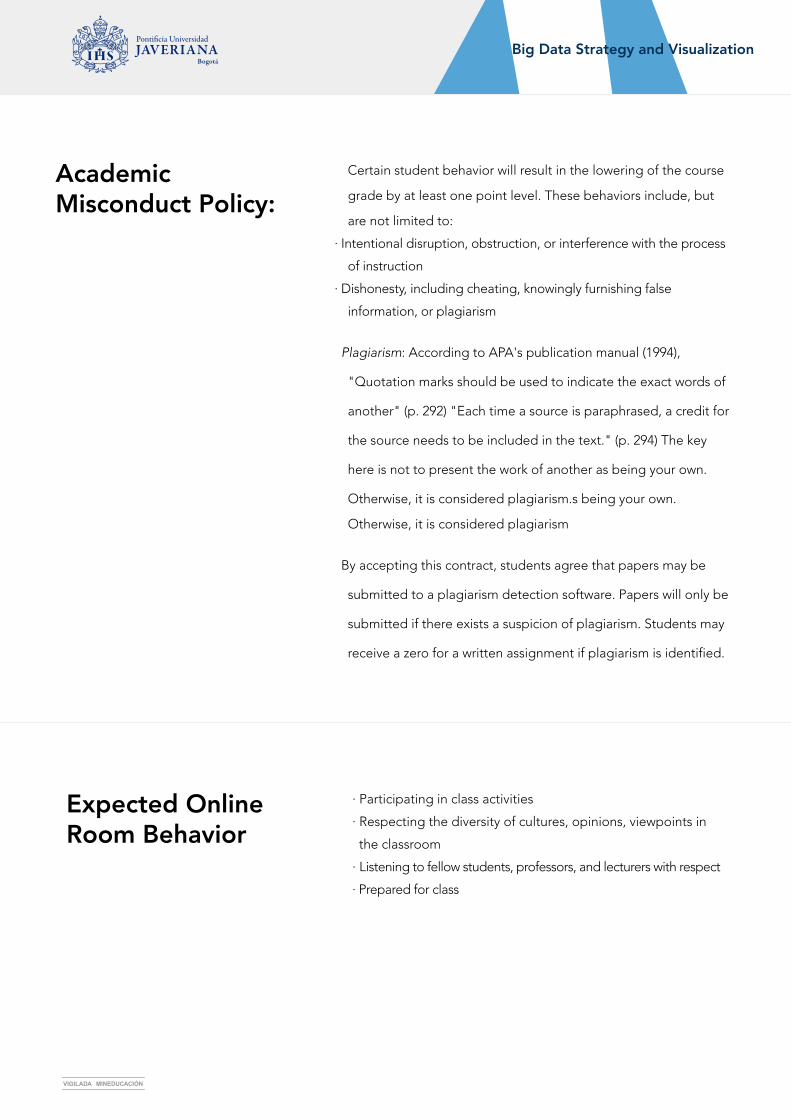
Academic Misconduct Policy:
Certain student behavior will result in the lowering of the course
grade by at least one point level. These behaviors include, but
are not limited to:
∙ Intentional disruption, obstruction, or interference with the process
of instruction
∙ Dishonesty, including cheating, knowingly furnishing false
information, or plagiarism
Plagiarism: According to APA's publication manual (1994),
"Quotation marks should be used to indicate the exact words of
another" (p. 292) "Each time a source is paraphrased, a credit for
the source needs to be included in the text." (p. 294) The key
here is not to present the work of another as being your own.
Otherwise, it is considered plagiarism.s being your own.
Otherwise, it is considered plagiarism
By accepting this contract, students agree that papers may be
submitted to a plagiarism detection software. Papers will only be
submitted if there exists a suspicion of plagiarism. Students may
receive a zero for a written assignment if plagiarism is identified.
Expected Online Room Behavior
· Participating in class activities
· Respecting the diversity of cultures, opinions, viewpoints in
the classroom
· Listening to fellow students, professors, and lecturers with respect
· Prepared for class
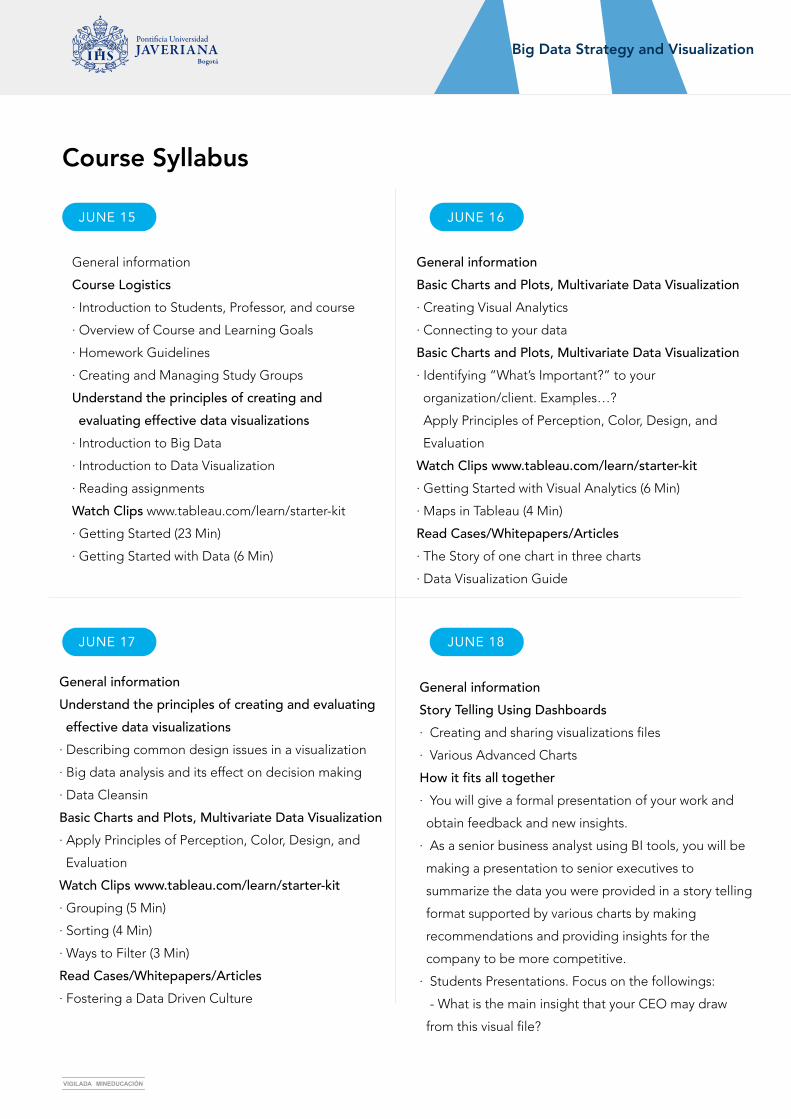
Course Syllabus
Big Data Strategy and Visualization
JUNE 15 JUNE 16
JUNE 17 JUNE 18
General information
Course Logistics· Introduction to Students, Professor, and course
· Overview of Course and Learning Goals
· Homework Guidelines
· Creating and Managing Study Groups
Understand the principles of creating and evaluating effective data visualizations
· Introduction to Big Data
· Introduction to Data Visualization
· Reading assignments
Watch Clips www.tableau.com/learn/starter-kit
· Getting Started (23 Min)
· Getting Started with Data (6 Min)
General informationBasic Charts and Plots, Multivariate Data Visualization· Creating Visual Analytics
· Connecting to your data
Basic Charts and Plots, Multivariate Data Visualization· Identifying “What’s Important?” to your
organization/client. Examples…?
Apply Principles of Perception, Color, Design, and
Evaluation
Watch Clips www.tableau.com/learn/starter-kit· Getting Started with Visual Analytics (6 Min)
· Maps in Tableau (4 Min)
Read Cases/Whitepapers/Articles· The Story of one chart in three charts
· Data Visualization Guide
General informationUnderstand the principles of creating and evaluating effective data visualizations
· Describing common design issues in a visualization
· Big data analysis and its effect on decision making
· Data Cleansin
Basic Charts and Plots, Multivariate Data Visualization· Apply Principles of Perception, Color, Design, and
Evaluation
Watch Clips www.tableau.com/learn/starter-kit· Grouping (5 Min)
· Sorting (4 Min)
· Ways to Filter (3 Min)
Read Cases/Whitepapers/Articles· Fostering a Data Driven Culture
General informationStory Telling Using Dashboards· Creating and sharing visualizations files
· Various Advanced Charts
How it fits all together· You will give a formal presentation of your work and
obtain feedback and new insights.
· As a senior business analyst using BI tools, you will be
making a presentation to senior executives to
summarize the data you were provided in a story telling
format supported by various charts by making
recommendations and providing insights for the
company to be more competitive.
· Students Presentations. Focus on the followings:
- What is the main insight that your CEO may draw
from this visual file?

Course Syllabus
Big Data Strategy and Visualization
JUNE 18
- What additional charts / visualization are needed to draw a sound conclusion?
Watch Clips www.tableau.com/learn/starter-kit· Getting Started with Calculations (4 min)
· Intro to Table Calculations (6 min)
· Adding Actions to Dashboards (10 min)
Read Cases/Whitepapers/Articles· DataVisualization-5 Most Influential Data Visualizations
JUNE 19
General informationStudents Team Personation: Grading Rubric for this Assignment
Component Needs Improvement Pass High Pass
Organization and Clarity
Issue Analysis
Action Recommendations
Use of Course Concepts
Overall
The main analyses are getting lost as a result of the lack of understanding
of the data set and inconsistency with the
analysis.
Generate insight from using various sensitivity analysis techniques for
managerial decision making.An end-to-end example getting you
from various business cases.
Data Visualization demonstrate concise and consistent analyses. Functions, formulas, design of
models and charts are handled well.Use of built functions, formulas and
charts that are appropriate and written conclusions are free
The level of analysis could use better framing and more depth. Data and
functions for the analysis are omitted.
Presents an adequate analysis of most of the major issues in the exam but lacks insights in some areas. Some conclusions may lack analytical and
statistical support.
Presents an insightful and thorough analysis of the major issues in the exam. Business conclusions are insightful well justified by factual
and analytical and statistical support.
Recommendations may be simplistic and/or over general. Ideas could use more connections to the
identified issues.
Recommendations are appropriate to address major issues and are linked to
the analysis. Some anticipated consequences and alternatives are
included.
Recommendations are detailed and impactful and together compose a thoughtful plan to address major
challenges.
Makes few, if any, connections between identified issues and
concepts from course readings, Quant clips, and
class lectures & discussions.
Demonstrates sufficient command of analytical tools and statistical concepts
from the course. Makes some improvements in undersetting and
applying the concepts studied in the course.
Demonstrates complete command of analytical tools and statistical
concepts from the course. Makes appropriate and powerful in
undersetting and applying the concepts studied in the course and
in-class discussions.
Outcome of the analyses do not demonstrate
sufficient comprehensiveness, depth,
and/or analytic rigor.
Good overall use of the concepts of the exam, displaying competent professional business insights.
High level treatment of the concepts of the exam, displaying
depth, insight, and originality.